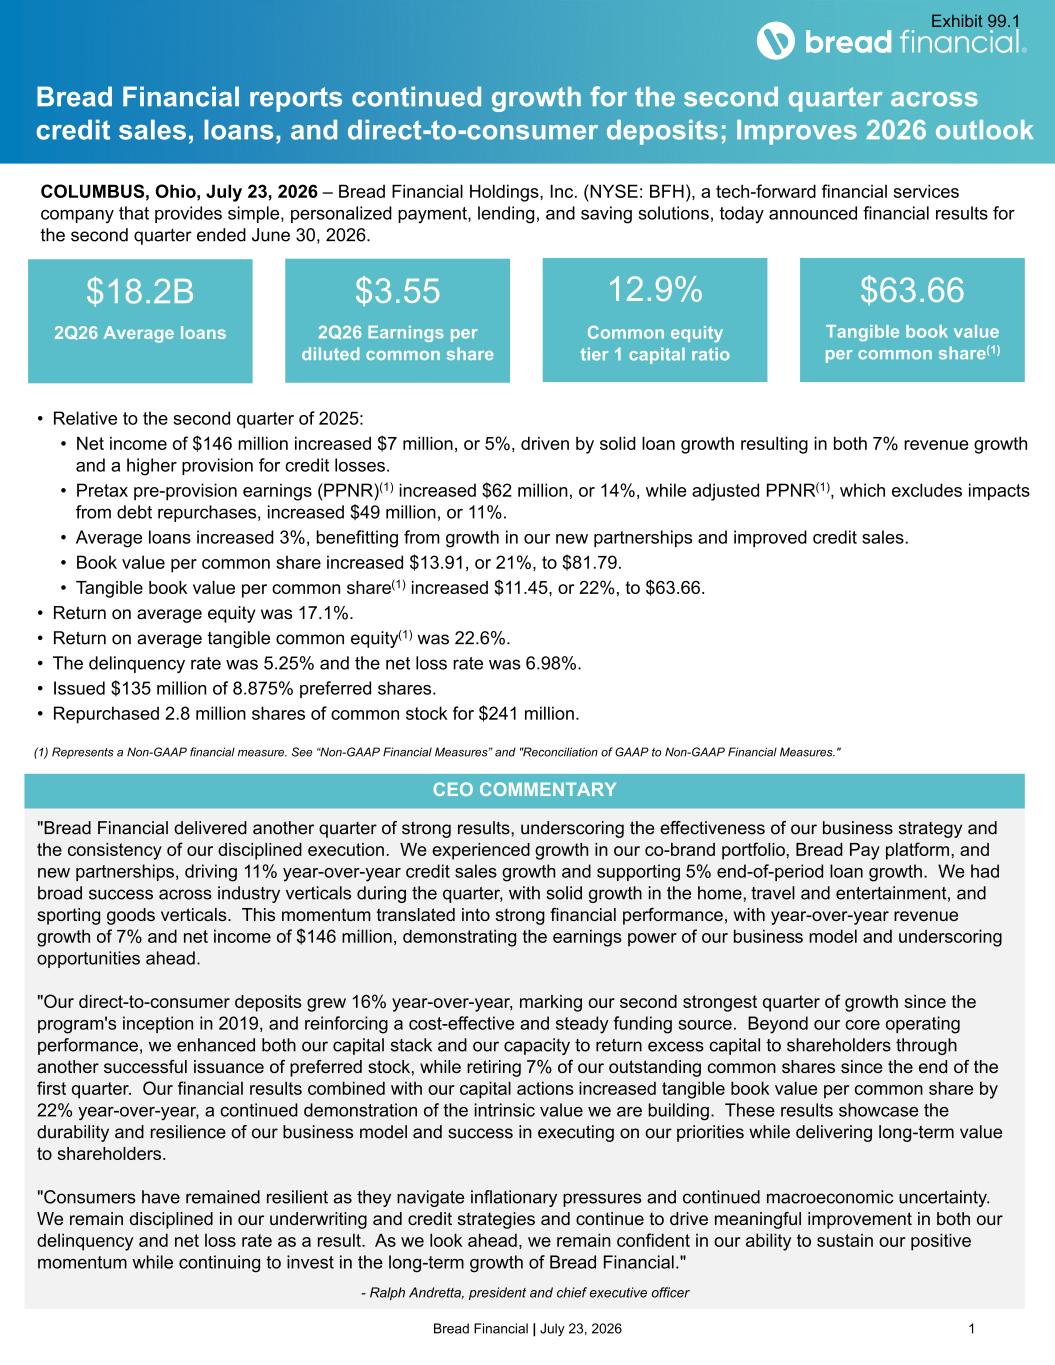
Bread Financial | July 23, 2026 1 "Bread Financial delivered another quarter of strong results, underscoring the effectiveness of our business strategy and the consistency of our disciplined execution. We experienced growth in our co-brand portfolio, Bread Pay platform, and new partnerships, driving 11% year-over-year credit sales growth and supporting 5% end-of-period loan growth. We had broad success across industry verticals during the quarter, with solid growth in the home, travel and entertainment, and sporting goods verticals. This momentum translated into strong financial performance, with year-over-year revenue growth of 7% and net income of $146 million, demonstrating the earnings power of our business model and underscoring opportunities ahead. "Our direct-to-consumer deposits grew 16% year-over-year, marking our second strongest quarter of growth since the program's inception in 2019, and reinforcing a cost-effective and steady funding source. Beyond our core operating performance, we enhanced both our capital stack and our capacity to return excess capital to shareholders through another successful issuance of preferred stock, while retiring 7% of our outstanding common shares since the end of the first quarter. Our financial results combined with our capital actions increased tangible book value per common share by 22% year-over-year, a continued demonstration of the intrinsic value we are building. These results showcase the durability and resilience of our business model and success in executing on our priorities while delivering long-term value to shareholders. "Consumers have remained resilient as they navigate inflationary pressures and continued macroeconomic uncertainty. We remain disciplined in our underwriting and credit strategies and continue to drive meaningful improvement in both our delinquency and net loss rate as a result. As we look ahead, we remain confident in our ability to sustain our positive momentum while continuing to invest in the long-term growth of Bread Financial." - Ralph Andretta, president and chief executive officer Bread Financial reports continued growth for the second quarter across credit sales, loans, and direct-to-consumer deposits; Improves 2026 outlook (1) Represents a Non-GAAP financial measure. See “Non-GAAP Financial Measures” and "Reconciliation of GAAP to Non-GAAP Financial Measures." $18.2B 2Q26 Average loans $3.55 2Q26 Earnings per diluted common share 12.9% Common equity tier 1 capital ratio $63.66 Tangible book value per common share(1) • Relative to the second quarter of 2025: • Net income of $146 million increased $7 million, or 5%, driven by solid loan growth resulting in both 7% revenue growth and a higher provision for credit losses. • Pretax pre-provision earnings (PPNR)(1) increased $62 million, or 14%, while adjusted PPNR(1), which excludes impacts from debt repurchases, increased $49 million, or 11%. • Average loans increased 3%, benefitting from growth in our new partnerships and improved credit sales. • Book value per common share increased $13.91, or 21%, to $81.79. • Tangible book value per common share(1) increased $11.45, or 22%, to $63.66. • Return on average equity was 17.1%. • Return on average tangible common equity(1) was 22.6%. • The delinquency rate was 5.25% and the net loss rate was 6.98%. • Issued $135 million of 8.875% preferred shares. • Repurchased 2.8 million shares of common stock for $241 million. CEO COMMENTARY COLUMBUS, Ohio, July 23, 2026 – Bread Financial Holdings, Inc. (NYSE: BFH), a tech-forward financial services company that provides simple, personalized payment, lending, and saving solutions, today announced financial results for the second quarter ended June 30, 2026.
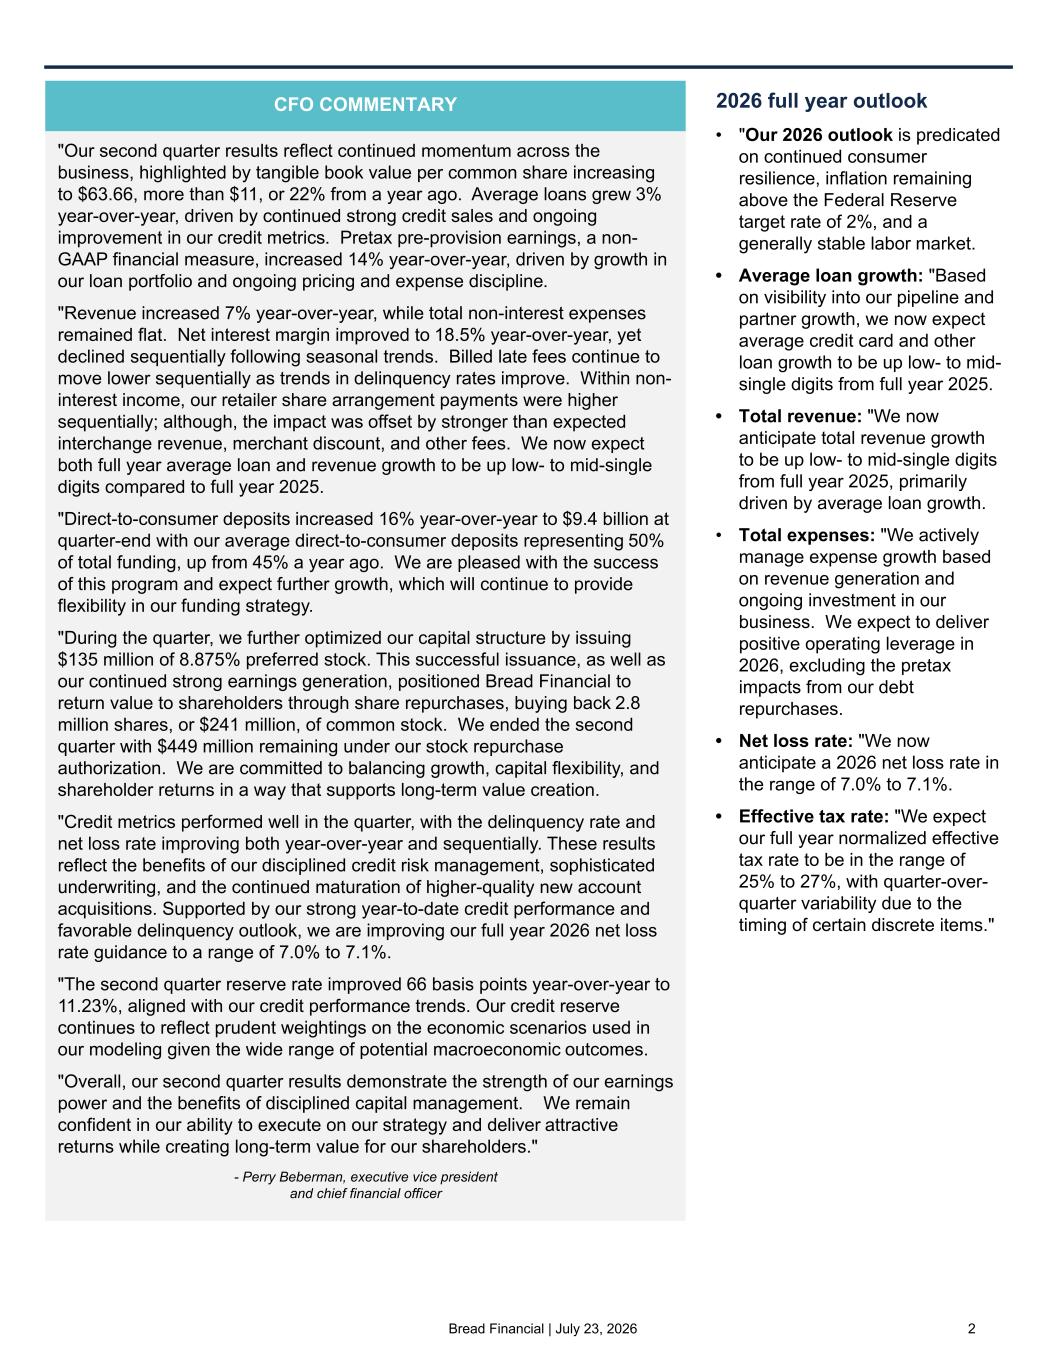
Bread Financial | July 23, 2026 2 2026 full year outlook • "Our 2026 outlook is predicated on continued consumer resilience, inflation remaining above the Federal Reserve target rate of 2%, and a generally stable labor market. • Average loan growth: "Based on visibility into our pipeline and partner growth, we now expect average credit card and other loan growth to be up low- to mid- single digits from full year 2025. • Total revenue: "We now anticipate total revenue growth to be up low- to mid-single digits from full year 2025, primarily driven by average loan growth. • Total expenses: "We actively manage expense growth based on revenue generation and ongoing investment in our business. We expect to deliver positive operating leverage in 2026, excluding the pretax impacts from our debt repurchases. • Net loss rate: "We now anticipate a 2026 net loss rate in the range of 7.0% to 7.1%. • Effective tax rate: "We expect our full year normalized effective tax rate to be in the range of 25% to 27%, with quarter-over- quarter variability due to the timing of certain discrete items." "Our second quarter results reflect continued momentum across the business, highlighted by tangible book value per common share increasing to $63.66, more than $11, or 22% from a year ago. Average loans grew 3% year-over-year, driven by continued strong credit sales and ongoing improvement in our credit metrics. Pretax pre-provision earnings, a non- GAAP financial measure, increased 14% year-over-year, driven by growth in our loan portfolio and ongoing pricing and expense discipline. "Revenue increased 7% year-over-year, while total non-interest expenses remained flat. Net interest margin improved to 18.5% year-over-year, yet declined sequentially following seasonal trends. Billed late fees continue to move lower sequentially as trends in delinquency rates improve. Within non- interest income, our retailer share arrangement payments were higher sequentially; although, the impact was offset by stronger than expected interchange revenue, merchant discount, and other fees. We now expect both full year average loan and revenue growth to be up low- to mid-single digits compared to full year 2025. "Direct-to-consumer deposits increased 16% year-over-year to $9.4 billion at quarter-end with our average direct-to-consumer deposits representing 50% of total funding, up from 45% a year ago. We are pleased with the success of this program and expect further growth, which will continue to provide flexibility in our funding strategy. "During the quarter, we further optimized our capital structure by issuing $135 million of 8.875% preferred stock. This successful issuance, as well as our continued strong earnings generation, positioned Bread Financial to return value to shareholders through share repurchases, buying back 2.8 million shares, or $241 million, of common stock. We ended the second quarter with $449 million remaining under our stock repurchase authorization. We are committed to balancing growth, capital flexibility, and shareholder returns in a way that supports long-term value creation. "Credit metrics performed well in the quarter, with the delinquency rate and net loss rate improving both year-over-year and sequentially. These results reflect the benefits of our disciplined credit risk management, sophisticated underwriting, and the continued maturation of higher-quality new account acquisitions. Supported by our strong year-to-date credit performance and favorable delinquency outlook, we are improving our full year 2026 net loss rate guidance to a range of 7.0% to 7.1%. "The second quarter reserve rate improved 66 basis points year-over-year to 11.23%, aligned with our credit performance trends. Our credit reserve continues to reflect prudent weightings on the economic scenarios used in our modeling given the wide range of potential macroeconomic outcomes. "Overall, our second quarter results demonstrate the strength of our earnings power and the benefits of disciplined capital management. We remain confident in our ability to execute on our strategy and deliver attractive returns while creating long-term value for our shareholders." - Perry Beberman, executive vice president and chief financial officer CFO COMMENTARY
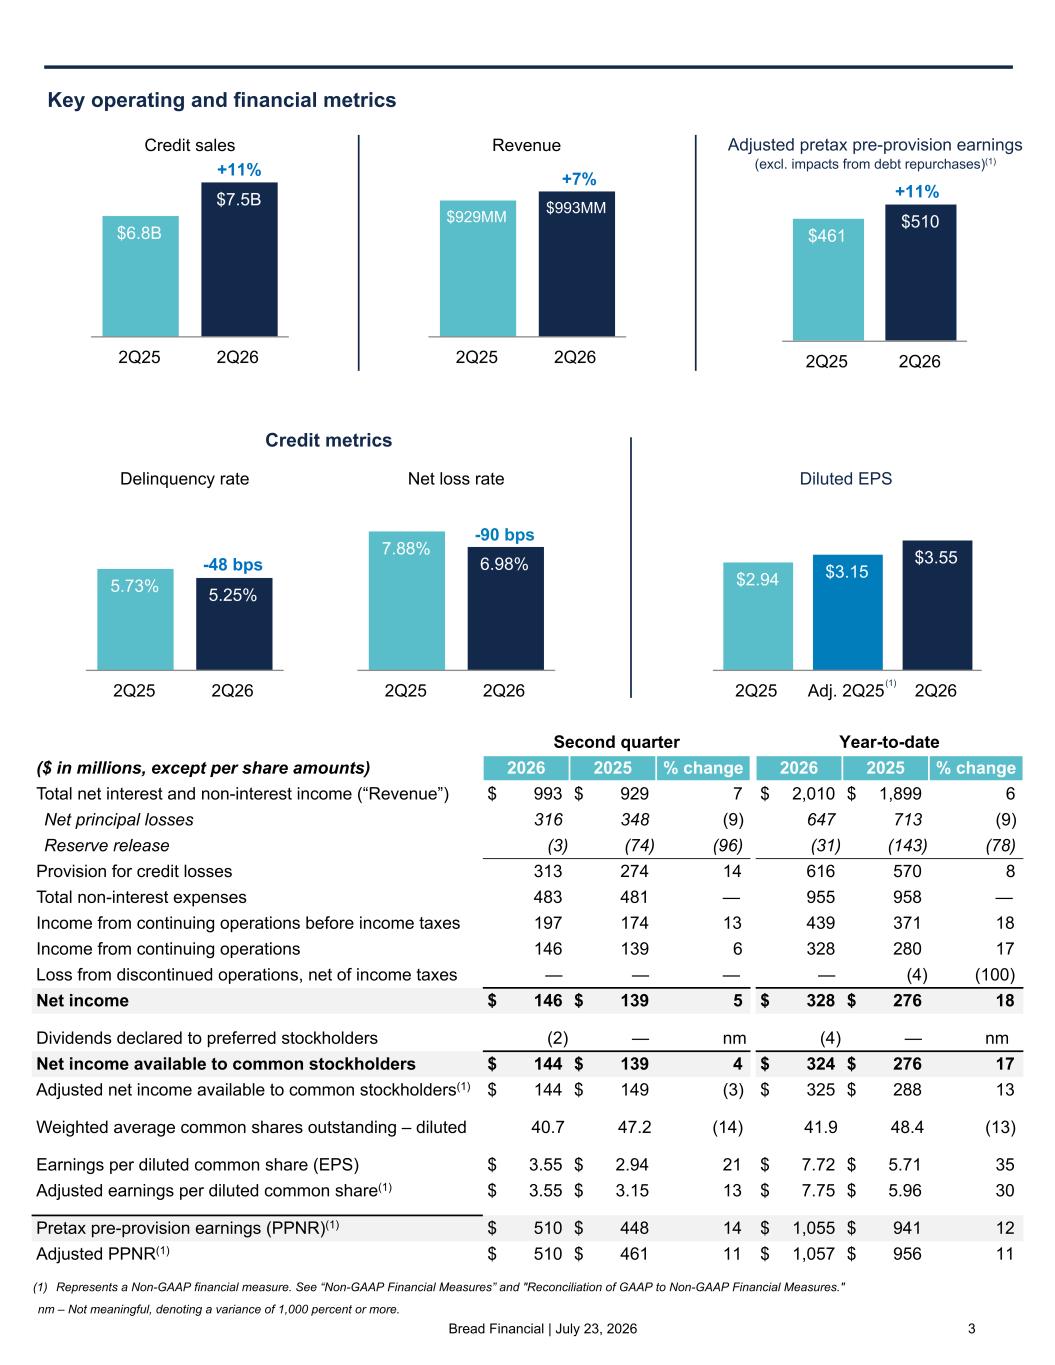
Bread Financial | July 23, 2026 3 PPNR $461 $510 2Q25 2Q26 Second quarter Year-to-date ($ in millions, except per share amounts) 2026 2025 % change 2026 2025 % change Total net interest and non-interest income (“Revenue”) $ 993 $ 929 7 $ 2,010 $ 1,899 6 Net principal losses 316 348 (9) 647 713 (9) Reserve release (3) (74) (96) (31) (143) (78) Provision for credit losses 313 274 14 616 570 8 Total non-interest expenses 483 481 — 955 958 — Income from continuing operations before income taxes 197 174 13 439 371 18 Income from continuing operations 146 139 6 328 280 17 Loss from discontinued operations, net of income taxes — — — — (4) (100) Net income $ 146 $ 139 5 $ 328 $ 276 18 Dividends declared to preferred stockholders (2) — nm (4) — nm Net income available to common stockholders $ 144 $ 139 4 $ 324 $ 276 17 Adjusted net income available to common stockholders(1) $ 144 $ 149 (3) $ 325 $ 288 13 Weighted average common shares outstanding – diluted 40.7 47.2 (14) 41.9 48.4 (13) Earnings per diluted common share (EPS) $ 3.55 $ 2.94 21 $ 7.72 $ 5.71 35 Adjusted earnings per diluted common share(1) $ 3.55 $ 3.15 13 $ 7.75 $ 5.96 30 Pretax pre-provision earnings (PPNR)(1) $ 510 $ 448 14 $ 1,055 $ 941 12 Adjusted PPNR(1) $ 510 $ 461 11 $ 1,057 $ 956 11 Revenue $929MM $993MM 2Q25 2Q26 +7% Key operating and financial metrics Credit metrics (1) Represents a Non-GAAP financial measure. See “Non-GAAP Financial Measures” and "Reconciliation of GAAP to Non-GAAP Financial Measures." Credit sales $6.8B $7.5B 2Q25 2Q26 +11% Net loss rate 7.88% 6.98% 2Q25 2Q26 Delinquency rate 5.73% 5.25% 2Q25 2Q26 Diluted EPS $2.94 $3.15 $3.55 2Q25 Adj. 2Q25 2Q26 -48 bps -90 bps +11% Adjusted pretax pre-provision earnings (excl. impacts from debt repurchases)(1) nm – Not meaningful, denoting a variance of 1,000 percent or more. (1)
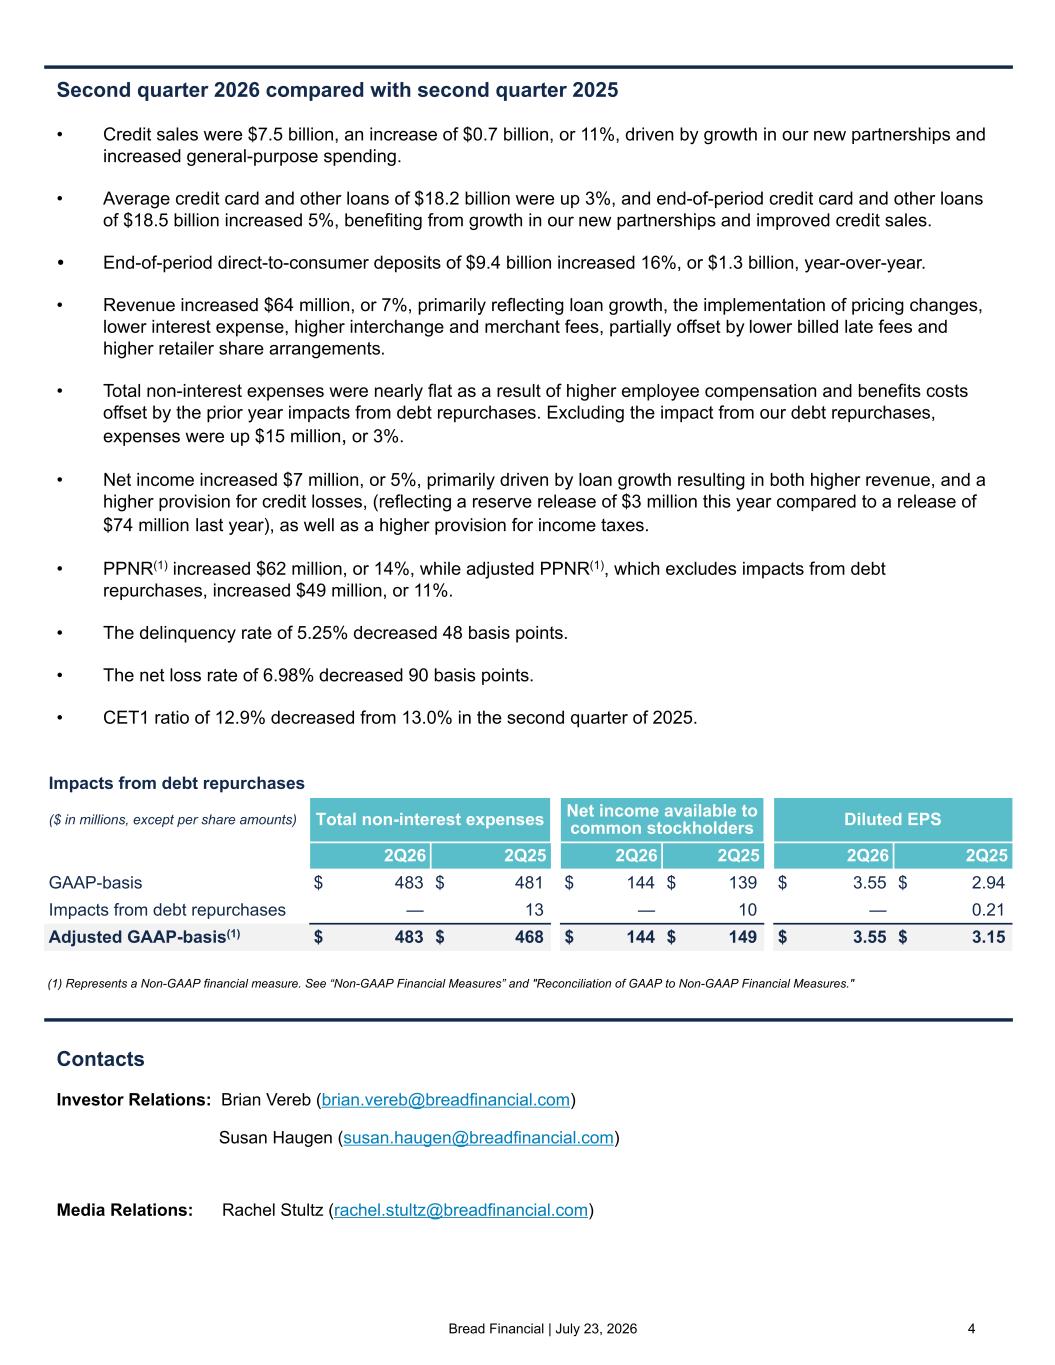
Bread Financial | July 23, 2026 4 Second quarter 2026 compared with second quarter 2025 • Credit sales were $7.5 billion, an increase of $0.7 billion, or 11%, driven by growth in our new partnerships and increased general-purpose spending. • Average credit card and other loans of $18.2 billion were up 3%, and end-of-period credit card and other loans of $18.5 billion increased 5%, benefiting from growth in our new partnerships and improved credit sales. • End-of-period direct-to-consumer deposits of $9.4 billion increased 16%, or $1.3 billion, year-over-year. • Revenue increased $64 million, or 7%, primarily reflecting loan growth, the implementation of pricing changes, lower interest expense, higher interchange and merchant fees, partially offset by lower billed late fees and higher retailer share arrangements. • Total non-interest expenses were nearly flat as a result of higher employee compensation and benefits costs offset by the prior year impacts from debt repurchases. Excluding the impact from our debt repurchases, expenses were up $15 million, or 3%. • Net income increased $7 million, or 5%, primarily driven by loan growth resulting in both higher revenue, and a higher provision for credit losses, (reflecting a reserve release of $3 million this year compared to a release of $74 million last year), as well as a higher provision for income taxes. • PPNR(1) increased $62 million, or 14%, while adjusted PPNR(1), which excludes impacts from debt repurchases, increased $49 million, or 11%. • The delinquency rate of 5.25% decreased 48 basis points. • The net loss rate of 6.98% decreased 90 basis points. • CET1 ratio of 12.9% decreased from 13.0% in the second quarter of 2025. Contacts Investor Relations: Brian Vereb (brian.vereb@breadfinancial.com) Susan Haugen (susan.haugen@breadfinancial.com) Media Relations: Rachel Stultz (rachel.stultz@breadfinancial.com) (1) Represents a Non-GAAP financial measure. See “Non-GAAP Financial Measures” and "Reconciliation of GAAP to Non-GAAP Financial Measures." Impacts from debt repurchases ($ in millions, except per share amounts) Total non-interest expenses Net income available to common stockholders Diluted EPS 2Q26 2Q25 2Q26 2Q25 2Q26 2Q25 GAAP-basis $ 483 $ 481 $ 144 $ 139 $ 3.55 $ 2.94 Impacts from debt repurchases — 13 — 10 — 0.21 Adjusted GAAP-basis(1) $ 483 $ 468 $ 144 $ 149 $ 3.55 $ 3.15
Bread Financial | July 23, 2026 5 Forward-looking statements This release contains forward-looking statements within the meaning of Section 27A of the Securities Act of 1933 and Section 21E of the Securities Exchange Act of 1934. Forward-looking statements give our expectations or forecasts of future events and can generally be identified by the use of words such as “believe,” “expect,” “anticipate,” “estimate,” “intend,” “project,” “plan,” “likely,” “may,” “should” or other words or phrases of similar import. Similarly, statements that describe our business strategy, outlook, objectives, plans, intentions or goals also are forward-looking statements. Examples of forward-looking statements include, but are not limited to, statements we make regarding, and the guidance we give with respect to, our anticipated operating or financial results, future financial performance and outlook, future dividend declarations, and future economic conditions. We believe that our expectations are based on reasonable assumptions. Forward-looking statements, however, are subject to a number of risks and uncertainties that are difficult to predict and, in many cases, beyond our control. Accordingly, our actual results could differ materially from the projections, anticipated results or other expectations expressed in this release, and no assurances can be given that our expectations will prove to have been correct. Factors that could cause the outcomes to differ materially include, but are not limited to, the following: macroeconomic conditions, including inflation, interest rates, labor market conditions, financial and capital market conditions, recessionary pressures or concerns over a prolonged economic slowdown, and the related impact on consumer spending behavior, payments, debt levels, savings rates and other behaviors; global political events and conditions, including significant shifts in trade policy, such as changes to, or the imposition of, tariffs and/or trade barriers and consequently any economic impacts, volatility, uncertainty and geopolitical instability resulting therefrom, as well as ongoing wars and military conflicts, and international tensions or hostilities; local or global public health issues, climate-related events, impacts to the power grid, and natural disasters; future credit performance, including the level of future delinquency and charge-off rates; loss of, or reduction in demand for services and/or products from, significant brand partners or customers in the highly competitive markets in which we operate, including competition from new and non-traditional competitors, such as financial technology companies, and with respect to new products, services and technologies, such as the emergence or increase in popularity of agentic commerce, digital payment platforms and currencies and other alternative payment and deposit solutions; the concentration of our business in U.S. consumer credit; inaccuracies in the models and estimates on which we rely, including our credit risk management models and the amount of our Allowance for credit losses; the inability to realize the intended benefits of acquisitions, dispositions and other strategic initiatives; our level of indebtedness and ability to access financial or capital markets; pending and future federal and state legislation, executive action, regulation, supervisory guidance, and regulatory and legal actions, including, but not limited to, those related to financial regulatory reform and consumer financial services practices, as well as any such actions that would place limits on credit card interest rates or late fees, interchange fees or other charges; failures or breaches in our operational or security systems, including as a result of cyberattacks, unanticipated impacts from technology modernization projects or otherwise; and any liability or other adverse impacts arising out of or related to the spinoff of our former LoyaltyOne segment or the bankruptcy filings of Loyalty Ventures Inc. (LVI) and certain of its subsidiaries, including the pending litigation against us in connection with the spinoff. The foregoing factors, along with other risks and uncertainties that could cause actual results to differ materially from those expressed or implied in forward-looking statements, are described in greater detail under the headings “Risk Factors” and “Management’s Discussion and Analysis of Financial Condition and Results of Operations” in our Annual Report on Form 10-K for the most recently ended fiscal year, which may be updated in Item 1A of, or elsewhere in, our Quarterly Reports on Form 10-Q filed for periods subsequent to such Form 10-K. Our forward- looking statements speak only as of the date made, and we undertake no obligation, other than as required by applicable law, to update or revise any forward-looking statements, whether as a result of new information, subsequent events, anticipated or unanticipated circumstances or otherwise.
Bread Financial | July 23, 2026 6 Non-GAAP financial measures We prepare our Consolidated Financial Statements in accordance with accounting principles generally accepted in the United States of America (GAAP). However, certain information included herein constitutes Non-GAAP Financial Measures. Our calculations of Non-GAAP Financial Measures may differ from the calculations of similarly titled measures by other companies. In particular: • We have previously repurchased and may, from time to time, in the future continue to repurchase debt, including any outstanding senior unsecured notes, subordinated notes or convertible notes. In such transactions, we may pay a premium to induce these repurchases, or in certain cases repurchase at a discount, which, from a GAAP perspective, would result in an impact to Total non-interest expenses, with a corresponding impact also reflected in Net income available to common stockholders and consequently our Earnings per diluted common share. For our prior debt repurchases, we show adjustments to these three financial statement line items to exclude the impacts from our debt repurchases. We use Adjusted total non-interest expenses, Adjusted net income available to common stockholders, and Adjusted earnings per diluted common share to evaluate the ongoing operations of the Company excluding the volatility that can occur from the impacts of our debt repurchases. • Pretax pre-provision earnings (PPNR) represents Income from continuing operations before income taxes and the Provision for credit losses. PPNR excluding impacts from debt repurchases then excludes from PPNR the loss or gain on any debt repurchases in the period. We use PPNR and PPNR excluding impacts from debt repurchases as metrics to evaluate our results of operations before income taxes, excluding the movements that can occur within Provision for credit losses and the one-time nature of the impacts from debt repurchases. • Return on average tangible common equity (ROTCE) represents annualized Income from continuing operations less Dividends to preferred stockholders, divided by average Tangible common equity. Tangible common equity (TCE) represents Total stockholders’ equity reduced by Preferred stock and Goodwill and intangible assets, net. We use ROTCE as a metric to evaluate the Company’s performance. • Tangible book value per common share represents TCE divided by common shares outstanding. We use Tangible book value per common share, a metric used across the industry, to assess capital and performance, in conjunction with ROTCE. We believe the use of these Non-GAAP financial measures provide additional clarity in understanding our results of operations and trends. For a reconciliation of these Non-GAAP financial measures to the most directly comparable GAAP measures, please see the “Reconciliation of GAAP to Non-GAAP Financial Measures.”
Bread Financial | July 23, 2026 7 Financial supplement This earnings release should be read in conjunction with the Financial Supplement for the second quarter of 2026, available at investor.breadfinancial.com and in a Form 8-K furnished today with the Securities and Exchange Commission. Conference call/webcast information Bread Financial will host a conference call on Thursday, July 23, 2026, at 8:30 a.m. (Eastern Time) to discuss the company’s second quarter results. The conference call will be available via the internet at investor.breadfinancial.com. There will be several slides accompanying the webcast. Please go to the website at least 15 minutes prior to the call to register, download and install any necessary software. The recorded webcast will also be available on the company’s website. About Bread Financial® Bread Financial® (NYSE: BFH) is a tech-forward financial services company that provides simple, personalized payment, lending and saving solutions to millions of U.S. consumers. Our payment solutions deliver growth for some of the most recognized brands in travel & entertainment, health & beauty, technology, electronics, jewelry, home and specialty apparel through our co-brand and private label credit cards and pay-over-time products providing choice and value to our shared customers. Additionally, we offer Bread Financial general purpose credit cards and saving products that empower our customers and their passions for a better life. Bread Financial proudly marks 30 years of success in 2026. To learn more about our global associates, our performance and our sustainability progress, visit breadfinancial.com or follow us on Instagram and LinkedIn.
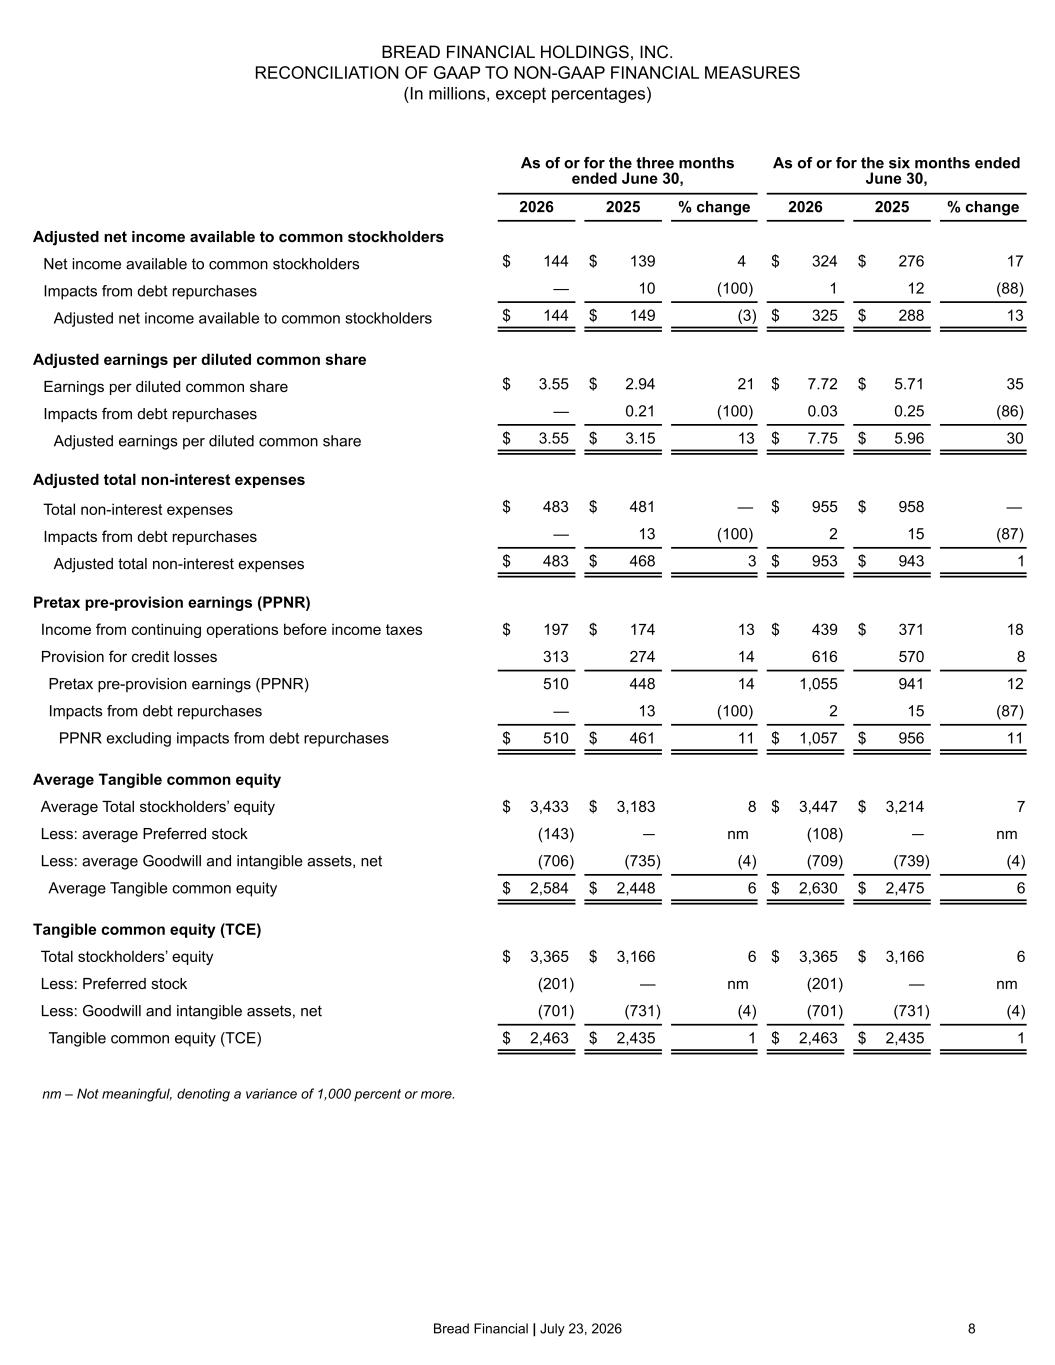
Bread Financial | July 23, 2026 8 BREAD FINANCIAL HOLDINGS, INC. RECONCILIATION OF GAAP TO NON-GAAP FINANCIAL MEASURES (In millions, except percentages) As of or for the three months ended June 30, As of or for the six months ended June 30, 2026 2025 % change 2026 2025 % change Adjusted net income available to common stockholders Net income available to common stockholders $ 144 $ 139 4 $ 324 $ 276 17 Impacts from debt repurchases — 10 (100) 1 12 (88) Adjusted net income available to common stockholders $ 144 $ 149 (3) $ 325 $ 288 13 Adjusted earnings per diluted common share Earnings per diluted common share $ 3.55 $ 2.94 21 $ 7.72 $ 5.71 35 Impacts from debt repurchases — 0.21 (100) 0.03 0.25 (86) Adjusted earnings per diluted common share $ 3.55 $ 3.15 13 $ 7.75 $ 5.96 30 Adjusted total non-interest expenses Total non-interest expenses $ 483 $ 481 — $ 955 $ 958 — Impacts from debt repurchases — 13 (100) 2 15 (87) Adjusted total non-interest expenses $ 483 $ 468 3 $ 953 $ 943 1 Pretax pre-provision earnings (PPNR) Income from continuing operations before income taxes $ 197 $ 174 13 $ 439 $ 371 18 Provision for credit losses 313 274 14 616 570 8 Pretax pre-provision earnings (PPNR) 510 448 14 1,055 941 12 Impacts from debt repurchases — 13 (100) 2 15 (87) PPNR excluding impacts from debt repurchases $ 510 $ 461 11 $ 1,057 $ 956 11 Average Tangible common equity Average Total stockholders’ equity $ 3,433 $ 3,183 8 $ 3,447 $ 3,214 7 Less: average Preferred stock (143) — nm (108) — nm Less: average Goodwill and intangible assets, net (706) (735) (4) (709) (739) (4) Average Tangible common equity $ 2,584 $ 2,448 6 $ 2,630 $ 2,475 6 Tangible common equity (TCE) Total stockholders’ equity $ 3,365 $ 3,166 6 $ 3,365 $ 3,166 6 Less: Preferred stock (201) — nm (201) — nm Less: Goodwill and intangible assets, net (701) (731) (4) (701) (731) (4) Tangible common equity (TCE) $ 2,463 $ 2,435 1 $ 2,463 $ 2,435 1 nm – Not meaningful, denoting a variance of 1,000 percent or more.