
.2
4Q 2025 Financial Results 1 January 29, 2026
Forward Looking Statements 2 Certain statements contained in this presentation that are not historical facts may constitute forward - looking statements within the meaning of Section 27 A of the Securities Act of 1933 , as amended, and Section 21 E of the Securities Exchange Act of 1934 , as amended, and are intended to be covered by the safe harbor provisions of the Private Securities Litigation Reform Act of 1995 . We may also make forward - looking statements in other documents we file with the Securities and Exchange Commission ("SEC"), in our annual reports to shareholders, in press releases and other written materials, and in oral statements made by our officers, directors or employees . You can identify forward looking statements by the use of the words “believe,” “expect,” “anticipate,” “intend,” “estimate,” “assume,” “outlook,” “will,” “should,” and other expressions that predict or indicate future events and trends and which do not relate to historical matters, including statements regarding the Company’s business, credit quality, financial condition, liquidity and results of operations . Forward - looking statements may differ, possibly materially, from what is included in this press release due to factors and future developments that are uncertain and beyond the scope of the Company’s control . These include, but are not limited to, changes in interest rates ; general economic conditions (including inflation and concerns about liquidity) on a national basis or in the local markets in which the Company operates ; turbulence in the capital and debt markets ; competitive pressures from other financial institutions ; changes in consumer behavior due to changing political, business and economic conditions, or legislative or regulatory initiatives ; changes in the value of securities and other assets in the Company’s investment portfolio ; increases in loan and lease default and charge - off rates ; the adequacy of allowances for loan and lease losses ; decreases in deposit levels that necessitate increases in borrowing to fund loans and investments ; operational risks including, but not limited to, cybersecurity incidents, fraud, natural disasters, and future pandemics ; changes in regulation ; the possibility that future credit losses may be higher than currently expected due to changes in economic assumptions and adverse economic developments ; the risk that goodwill and intangibles recorded in the Company’s financial statements will become impaired ; and changes in assumptions used in making such forward - looking statements . Forward - looking statements involve risks and uncertainties which are difficult to predict . The Company’s actual results could differ materially from those projected in the forward - looking statements as a result of, among others, the risks outlined in the Company’s Annual Report on Form 10 - K, as updated by its Quarterly Reports on Form 10 - Q and other filings submitted to the SEC . The Company does not undertake any obligation to update any forward - looking statement to reflect circumstances or events that occur after the date the forward - looking statements are made . Non - GAAP In addition to financial measures presented in accordance with U . S . generally accepted accounting principles (“GAAP”), this presentation contains certain non - GAAP financial measures, including, without limitation, operating earnings, and the ratios of tangible common equity to tangible assets . The presentation of non - GAAP financial information is not intended to be considered in isolation or as a substitute for any measure prepared in accordance with GAAP . Please see the Earnings Release for certain Non - GAAP reconciliations .
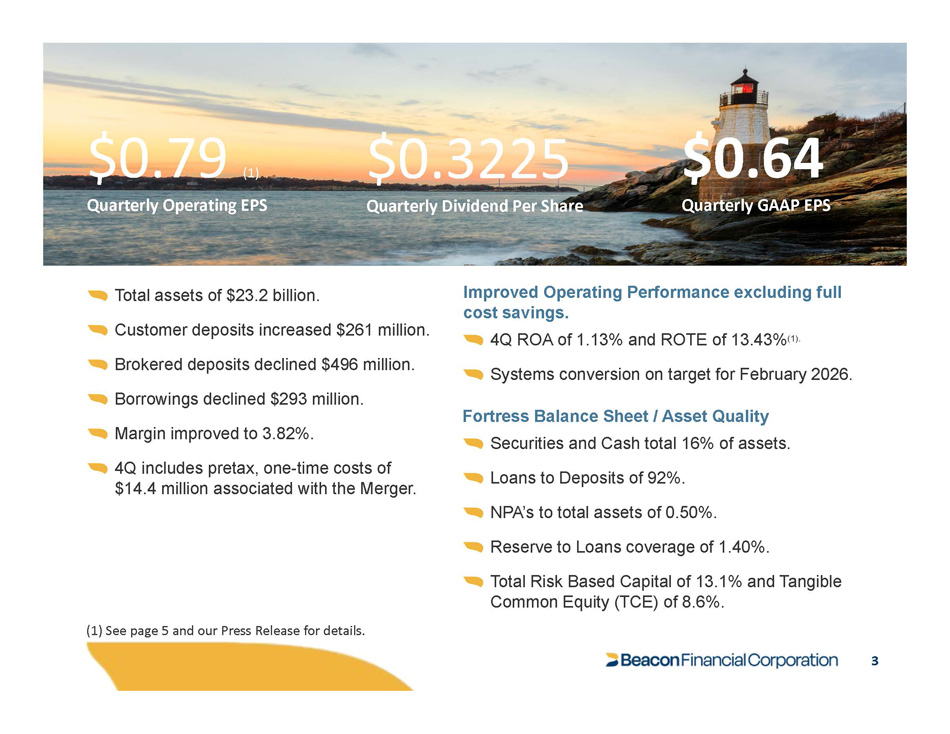
$0.64 Quarterly GAAP EPS $0.79 (1) Quarterly Operating EPS $0.3225 Quarterly Dividend Per Share Total assets of $23.2 billion. Customer deposits increased $261 million. Brokered deposits declined $496 million. Borrowings declined $293 million. Margin improved to 3.82%. 4Q includes pretax, one - time costs of $14.4 million associated with the Merger. Improved Operating Performance excluding full cost savings. 4Q ROA of 1.13% and ROTE of 13.43% (1). Systems conversion on target for February 2026. Fortress Balance Sheet / Asset Quality Securities and Cash total 16% of assets. Loans to Deposits of 92%. NPA’s to total assets of 0.50%. Reserve to Loans coverage of 1.40%. Total Risk Based Capital of 13.1% and Tangible Common Equity (TCE) of 8.6%. (1) See page 5 and our Press Release for details. 3
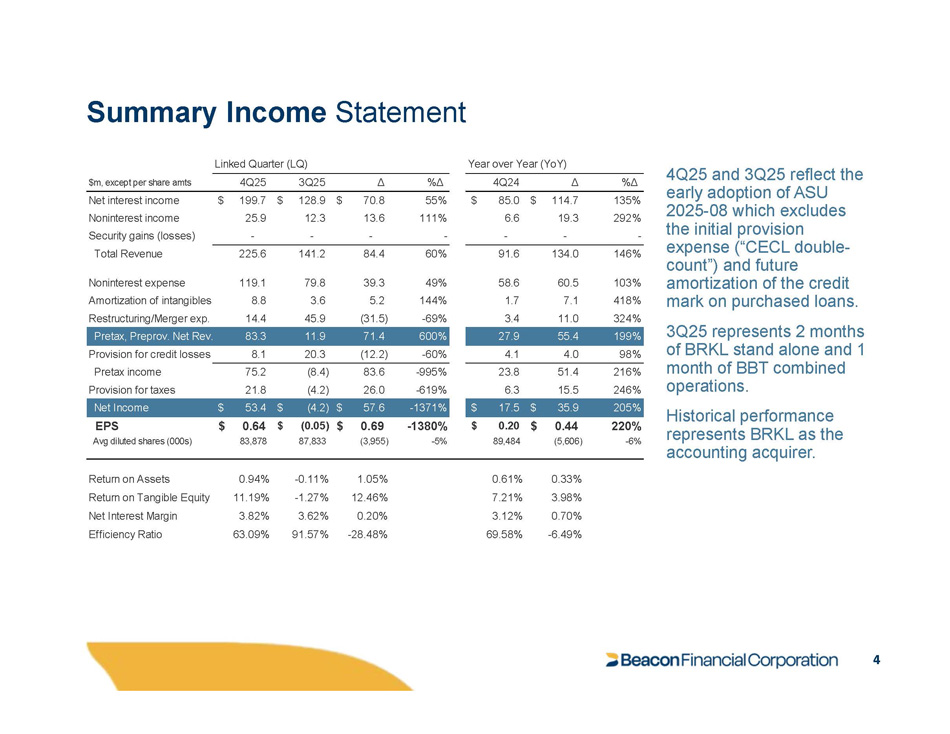
Summary Income Statement 4Q25 and 3Q25 reflect the early adoption of ASU 2025 - 08 which excludes the initial provision expense (“CECL double - count”) and future amortization of the credit mark on purchased loans. 3Q25 represents 2 months of BRKL stand alone and 1 Historical performance represents BRKL as the accounting acquirer. . month of BBT combined 216% 51.4 23.8 - 995% 83.6 (8.4) 75.2 Pretax income operations. 246% 15.5 6.3 - 619% 26.0 (4.2) 21.8 Provision for taxes 205% $ 35.9 $ 17.5 - 1371% $ 57.6 $ (4.2) $ 53.4 Net Income 220% $ 0.44 $ 0.20 - 1380% $ 0.69 $ (0.05) $ 0.64 EPS - 6% (5,606) 89,484 - 5% (3,955) 87,833 83,878 Avg diluted shares (000s) Year over Year (YoY) Linked Quarter (LQ) %Δ 4Q24 Δ %Δ Δ 4Q25 3Q25 $m, except per share amts 135% $ 85.0 $ 114.7 55% $ 70.8 $ 199.7 $ 128.9 Net interest income 292% 6.6 19.3 111% 13.6 25.9 12.3 Noninterest income - - - - - - Security gains (losses) - 146% 134.0 91.6 60% 84.4 141.2 Total Revenue 225.6 103% 60.5 58.6 49% 39.3 79.8 Noninterest expense 119.1 418% 7.1 1.7 144% 5.2 3.6 8.8 Amortization of intangibles 324% 11.0 3.4 - 69% (31.5) 45.9 14.4 Restructuring/Merger exp. 199% 55.4 27.9 600% 71.4 11.9 83.3 Pretax, Preprov. Net Rev 98% 4.0 4.1 - 60% (12.2) 20.3 8.1 Provision for credit losses 0.33% 0.61% 1.05% - 0.11% 0.94% Return on Assets 3.98% 7.21% 12.46% - 1.27% 11.19% Return on Tangible Equity 0.70% 3.12% 0.20% 3.62% 3.82% Net Interest Margin - 6.49% 69.58% - 28.48% 91.57% 63.09% Efficiency Ratio 4
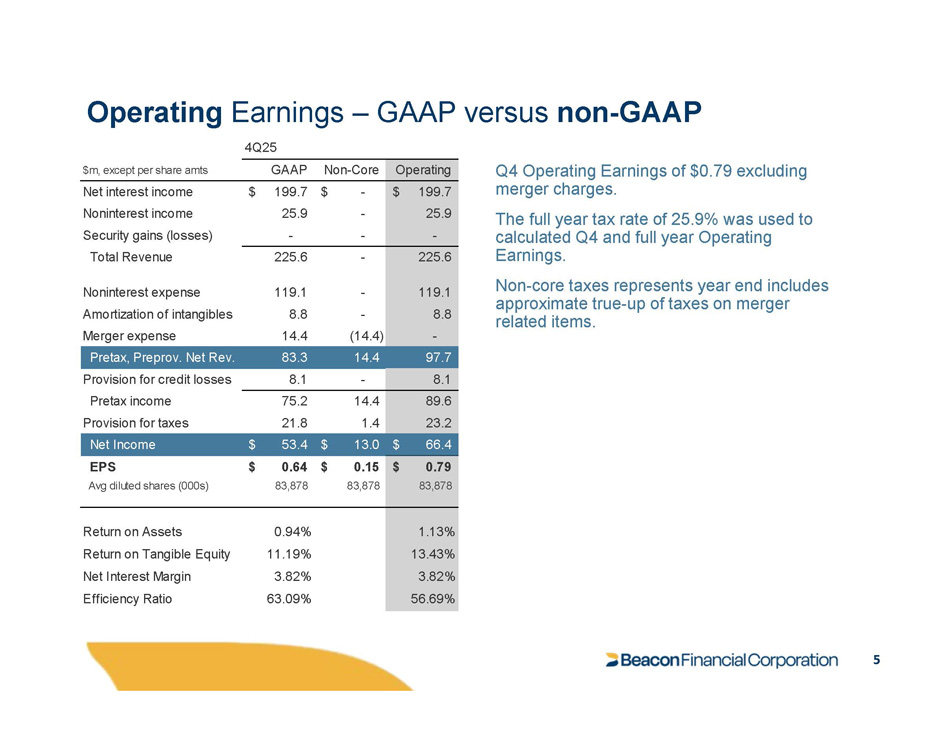
Operating Earnings – GAAP versus non - GAAP 5 Q4 Operating Earnings of $0.79 excluding merger charges. The full year tax rate of 25.9% was used to calculated Q4 and full year Operating Earnings. Non - core taxes represents year end includes approximate true - up of taxes on merger related items. Operating Non - Core GAAP $m, except per share amts $ 199.7 $ 199.7 $ - Net interest income 25.9 25.9 - Noninterest income - - - Security gains (losses) 225.6 225.6 - Total Revenue 119.1 119.1 - Noninterest expense 8.8 8.8 - Amortization of intangibles - 14.4 (14.4) Merger expense 97.7 14.4 83.3 Pretax, Preprov. Net Rev. 8.1 8.1 - Provision for credit losses 89.6 14.4 75.2 Pretax income 23.2 1.4 21.8 Provision for taxes $ 66.4 $ 13.0 $ 53.4 Net Income $ 0.79 EPS $ 0.64 $ 0.15 83,878 Avg diluted shares (000s) 83,878 83,878 1.13% 0.94% Return on Assets 13.43% 11.19% Return on Tangible Equity 3.82% 3.82% Net Interest Margin 56.69% 63.09% Efficiency Ratio 4Q25
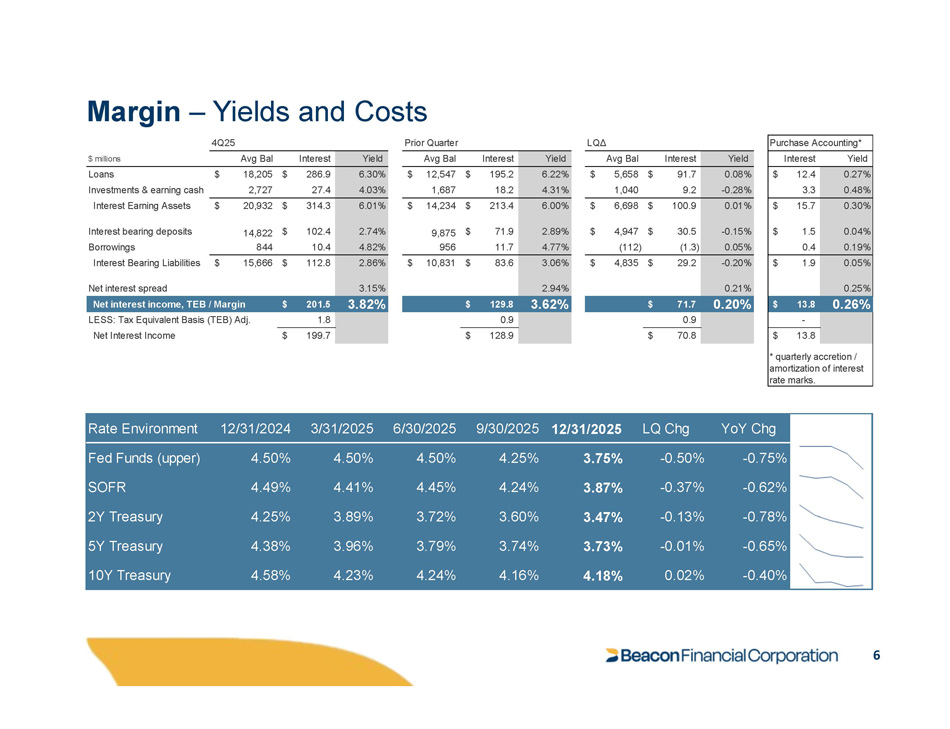
Margin – Yields and Costs Yield Interest Avg Bal $ millions 6.30% $ 286.9 $ 18,205 Loans 4.03% 27.4 2,727 Investments & earning cash 6.01% $ 314.3 $ 20,932 Interest Earning Assets 2.74% $ 102.4 14,822 Interest bearing deposits 4.82% 10.4 844 Borrowings 2.86% $ 112.8 $ 15,666 Interest Bearing Liabilities 3.15% Net interest spread Yield Interest Avg Bal 6.22% $ 195.2 $ 12,547 4.31% 18.2 1,687 6.00% $ 213.4 $ 14,234 2.89% $ 71.9 9,875 4.77% 11.7 956 3.06% 2.94% $ 83.6 $ 10,831 Yield Interest Avg Bal 0.08% $ 91.7 $ 5,658 - 0.28% 9.2 1,040 0.01% $ 100.9 $ 6,698 - 0.15% $ 30.5 $ 4,947 0.05% (1.3) (112) - 0.20% 0.21% $ 29.2 $ 4,835 Purchase Accounting* Yield Interest 0.27% $ 12.4 0.48% 3.3 0.30% $ 15.7 0.04% $ 1.5 0.19% 0.4 0.05% 0.25% $ 1.9 0.26% $ 13.8 - $ 13.8 * quarterly accretion / amortization of interest rate marks. 4Q25 Prior Quarter LQΔ Net interest income, TEB / Margin $ 201.5 3.82% $ 129.8 3.62% $ 71.7 0.20% LESS: Tax Equivalent Basis (TEB) Adj. 1.8 Net Interest Income $ 199.7 0.9 0.9 128.9 $ 70.8 $ YoY Chg LQ Chg 12/31/2025 9/30/2025 6/30/2025 3/31/2025 12/31/2024 Rate Environment - 0.75% - 0.50% 3.75% 4.25% 4.50% 4.50% 4.50% Fed Funds (upper) - 0.62% - 0.37% 3.87% 4.24% 4.45% 4.41% 4.49% SOFR - 0.78% - 0.13% 3.47% 3.60% 3.72% 3.89% 4.25% 2Y Treasury - 0.65% - 0.01% 3.73% 3.74% 3.79% 3.96% 4.38% 5Y Treasury - 0.40% 0.02% 4.18% 4.16% 4.24% 4.23% 4.58% 10Y Treasury 6
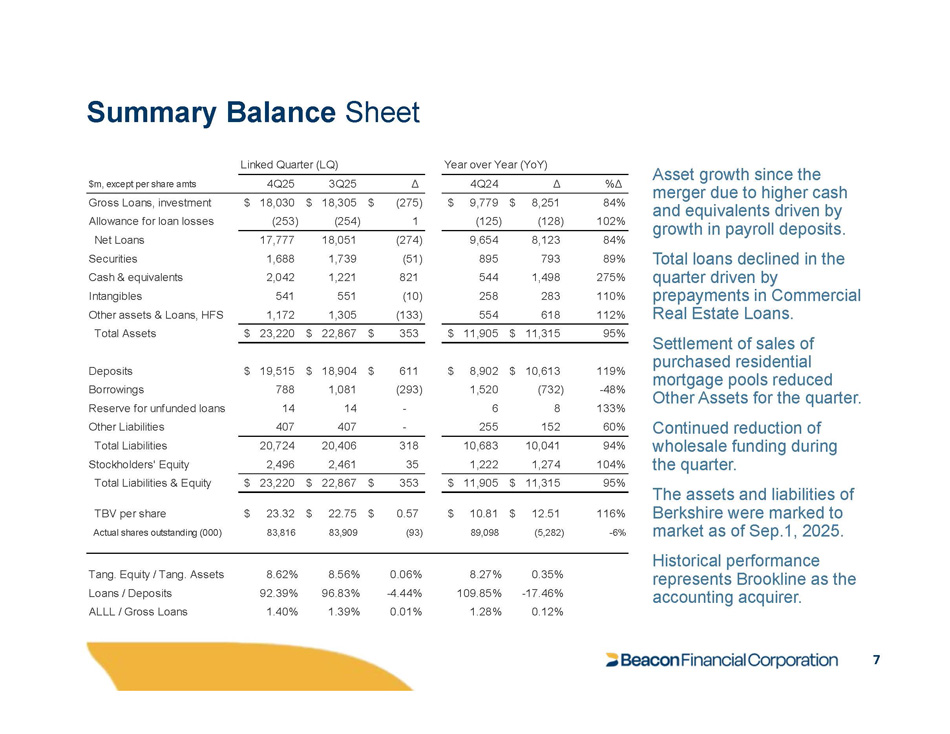
Summary Balance Sheet Asset growth since the merger due to higher cash and equivalents driven by growth in payroll deposits. purchased residential mortgage pools reduced Total loans declined in the 89% 793 895 (51) 1,739 1,688 Securities quarter driven by 275% 1,498 544 821 1,221 2,042 Cash & equivalents prepayments in Commercial 110% 283 258 (10) 551 541 Intangibles Real Estate Loans. Settlement of sales of 112% 95% 618 11,315 (133) 554 353 $ 11,905 $ 1,305 22,867 $ 1,172 $ 23,220 $ Other assets & Loans, HFS Total Assets of market as of Sep.1, 2025. Historical performance represents Brookline as the accounting acquirer. %Δ Δ 4Q24 Δ 3Q25 4Q25 $m, except per share amts 84% $ 8,251 $ 9,779 $ (275) $ 18,305 $ 18,030 Gross Loans, investment 102% (128) (125) 1 (254) (253) Allowance for loan losses 84% 8,123 9,654 (274) 18,051 17,777 Net Loans 119% $ 10,613 $ 8,902 $ 611 $ 18,904 $ 19,515 Deposits - 48% (732) 1,520 (293) 1,081 788 Borrowings Other Assets for the quarter. 133% 8 6 - 14 14 Reserve for unfunded loans Continued reduction of 60% 152 255 - 407 407 Other Liabilities Total Liabilities Stockholders' Equity wholesale funding during 94% 10,041 10,683 318 20,406 20,724 the quarter. 104% 1,274 1,222 35 2,461 2,496 95% $ 11,315 $ 11,905 $ 353 $ 22,867 $ 23,220 The assets and liabilities Berkshire were marked to 116% $ 12.51 $ 10.81 $ 0.57 $ 22.75 $ 23.32 Total Liabilities & Equity TBV per share - 6% (5,282) 89,098 (93) 83,909 83,816 Actual shares outstanding (000) 0.35% 8.27% 0.06% 8.56% 8.62% Tang. Equity / Tang. Assets - 17.46% 109.85% - 4.44% 96.83% 92.39% Loans / Deposits 0.12% 1.28% 0.01% 1.39% 1.40% ALLL / Gross Loans Linked Quarter (LQ) Year over Year (YoY) 7
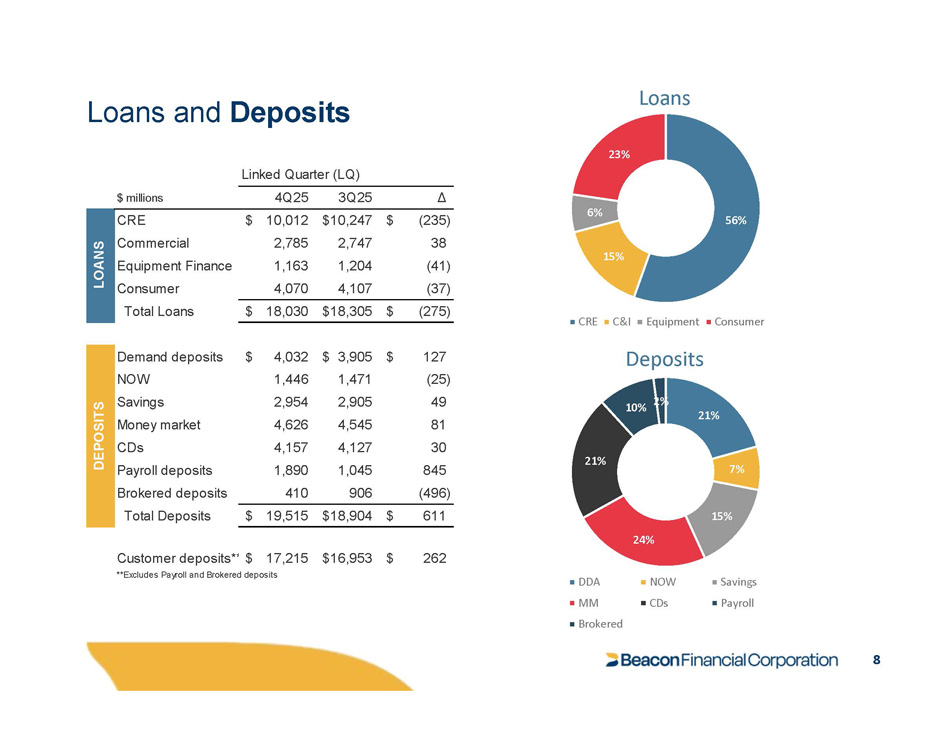
Loans and Deposits 56% 15% 6% 23% Loans CRE C&I Equipment Deposits Consumer 21% 7% 15% 24% 21% 10% 2% NOW CDs Savings Payroll DDA MM Brokered Δ 3Q25 4Q25 $ millions $ (235) $10,247 $ 10,012 CRE 38 2,747 2,785 Commercial NS (41) 1,204 1,163 Equipment Finance O A (37) 4,107 4,070 Consumer L $ (275) $18,305 $ 18,030 Total Loans $ 127 $ 3,905 $ 4,032 Demand deposits (25) 1,471 1,446 NOW 49 2,905 2,954 Savings 81 4,545 4,626 Money market 30 4,127 4,157 CDs 845 1,045 1,890 Payroll deposits (496) 906 410 Brokered deposits Total Deposits $ 19,515 $18,904 $ 611 Customer deposits* $ 17,215 $16,953 $ **Excludes Payroll and Brokered deposits 262 Linked Quarter (LQ) DEPOSITS 8
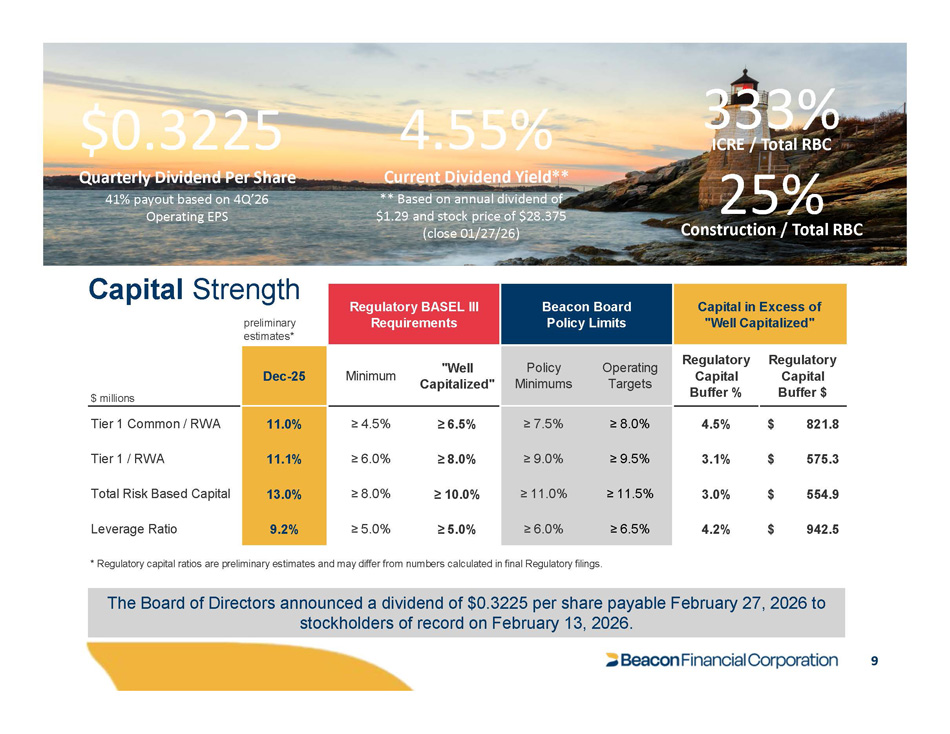
Capital Strength 9 preliminary estimates* Capital in Excess of "Well Capitalized" Beacon Board Policy Limits Regulatory BASEL III Requirements Regulatory Capital Buffer $ Regulatory Capital Buffer % Operating Targets Policy Minimums "Well Capitalized" Minimum Dec - 25 $ millions $ 821.8 4.5% ≥ 8.0% ≥ 7.5% ≥ 6.5% ≥ 4.5% 11.0% Tier 1 Common / RWA $ 575.3 3.1% ≥ 9.5% ≥ 9.0% ≥ 8.0% ≥ 6.0% 11.1% Tier 1 / RWA $ 554.9 3.0% ≥ 11.5% ≥ 11.0% ≥ 10.0% ≥ 8.0% 13.0% Total Risk Based Capital $ 942.5 4.2% ≥ 6.5% ≥ 6.0% ≥ 5.0% ≥ 5.0% 9.2% Leverage Ratio * Regulatory capital ratios are preliminary estimates and may differ from numbers calculated in final Regulatory filings. $0.3225 Quarterly Dividend Per Share 41% payout based on 4Q’26 Operating EPS 4.55% Current Dividend Yield** ** Based on annual dividend of $1.29 and stock price of $28.375 (close 01/27/26) 333% ICRE / Total RBC The Board of Directors announced a dividend of $0.3225 per share payable February 27, 2026 to stockholders of record on February 13, 2026. 25% Construction / Total RBC
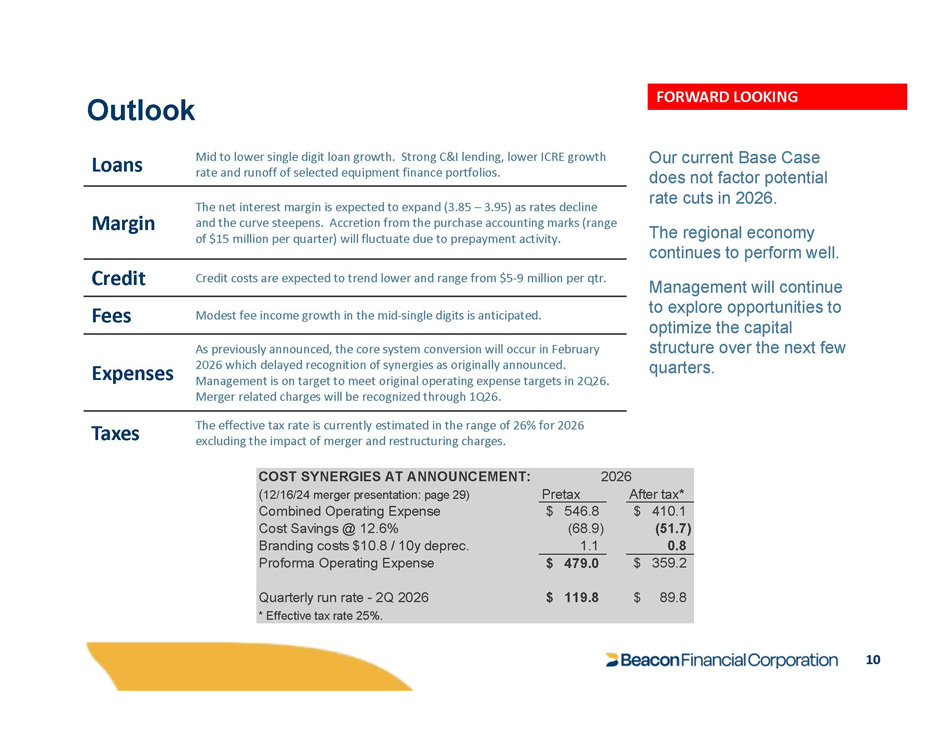
Outlook 10 Our current Base Case does not factor potential rate cuts in 2026. The regional economy continues to perform well. Management will continue to explore opportunities to optimize the capital structure over the next few quarters. FORWARD LOOKING Mid to lower single digit loan growth. Strong C&I lending, lower ICRE growth rate and runoff of selected equipment finance portfolios. Loans The net interest margin is expected to expand (3.85 – 3.95) as rates decline and the curve steepens. Accretion from the purchase accounting marks (range of $15 million per quarter) will fluctuate due to prepayment activity. Margin Credit costs are expected to trend lower and range from $5 - 9 million per qtr. Credit Modest fee income growth in the mid - single digits is anticipated. Fees As previously announced, the core system conversion will occur in February 2026 which delayed recognition of synergies as originally announced. Management is on target to meet original operating expense targets in 2Q26. Merger related charges will be recognized through 1Q26. Expenses The effective tax rate is currently estimated in the range of 26% for 2026 excluding the impact of merger and restructuring charges. Taxes 6 After tax* COST SYNERGIES AT ANNOUNCEMENT: 202 ( 12/16/24 merger presentation: page 29) Pretax $ 410.1 $ 546.8 Combined Operating Expense (51.7) (68.9) Cost Savings @ 12.6% 0.8 1.1 Branding costs $10.8 / 10y deprec. $ 359.2 $ 479.0 Proforma Operating Expense $ 89.8 $ 119.8 Quarterly run rate - 2Q 2026 * Effective tax rate 25%.
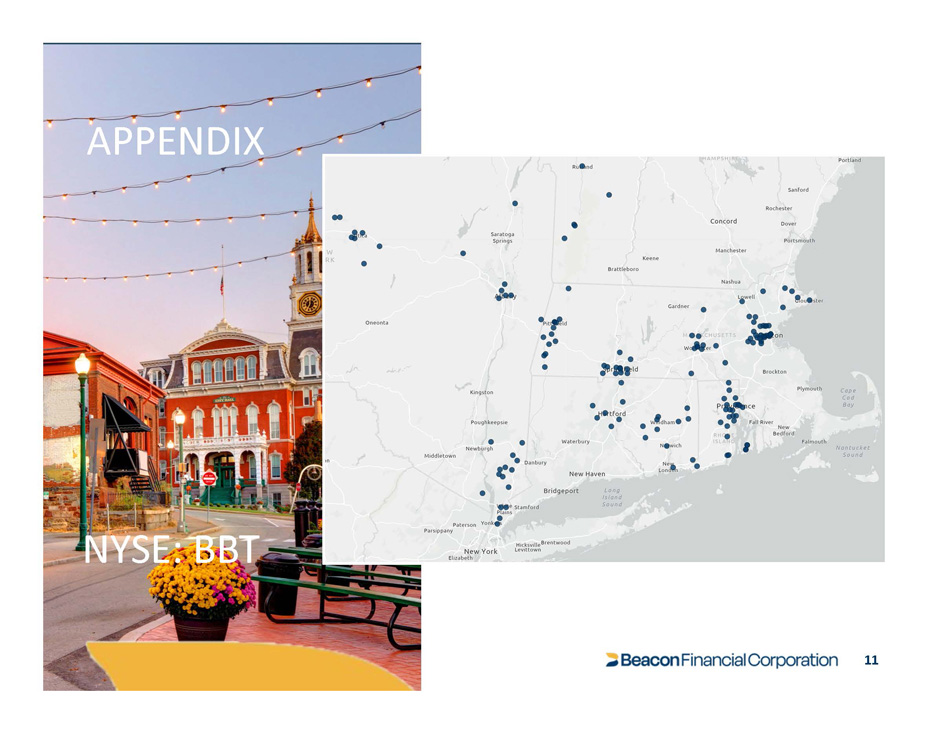
APPENDIX NYSE: BBT 11
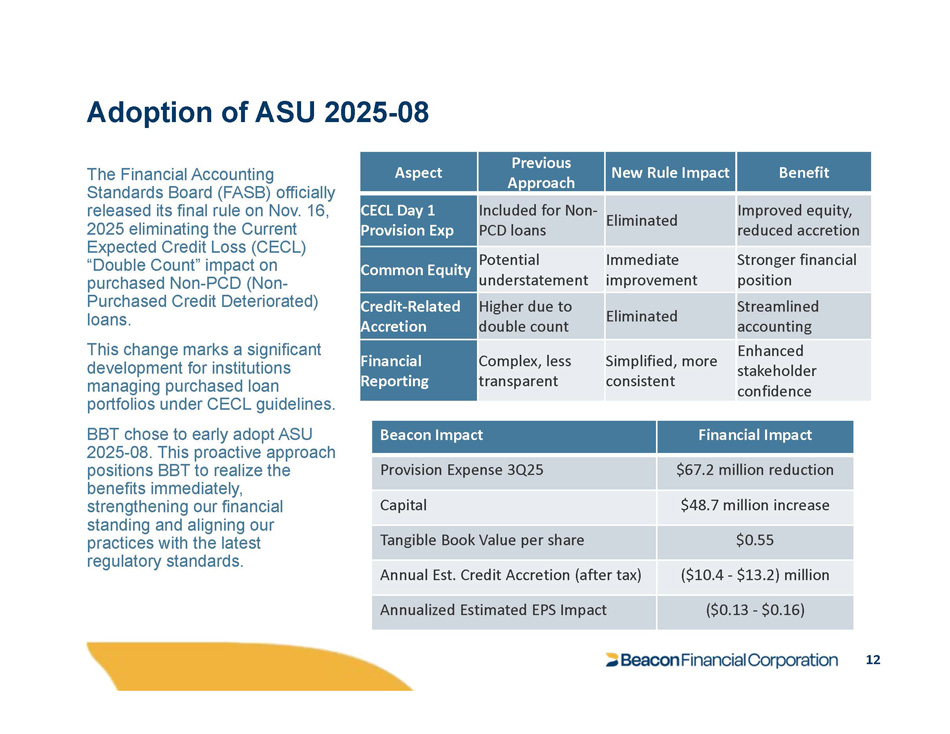
Adoption of ASU 2025 - 08 12 The Financial Accounting Standards Board (FASB) officially released its final rule on Nov. 16, 2025 eliminating the Current Expected Credit Loss (CECL) “Double Count” impact on purchased Non - PCD (Non - Purchased Credit Deteriorated) loans. This change marks a significant development for institutions managing purchased loan portfolios under CECL guidelines. BBT chose to early adopt ASU 2025 - 08. This proactive approach positions BBT to realize the benefits immediately, strengthening our financial standing and aligning our practices with the latest regulatory standards. Benefit New Rule Impact Previous Approach Aspect Improved equity, reduced accretion Eliminated Included for Non - PCD loans CECL Day 1 Provision Exp Stronger financial position Immediate improvement Potential understatement Common Equity Streamlined accounting Eliminated Higher due to double count Credit - Related Accretion Enhanced stakeholder confidence Simplified, more consistent Complex, less transparent Financial Reporting Financial Impact Beacon Impact $67.2 million reduction Provision Expense 3Q25 $48.7 million increase Capital $0.55 Tangible Book Value per share ($10.4 - $13.2) million Annual Est. Credit Accretion (after tax) ($0.13 - $0.16) Annualized Estimated EPS Impact
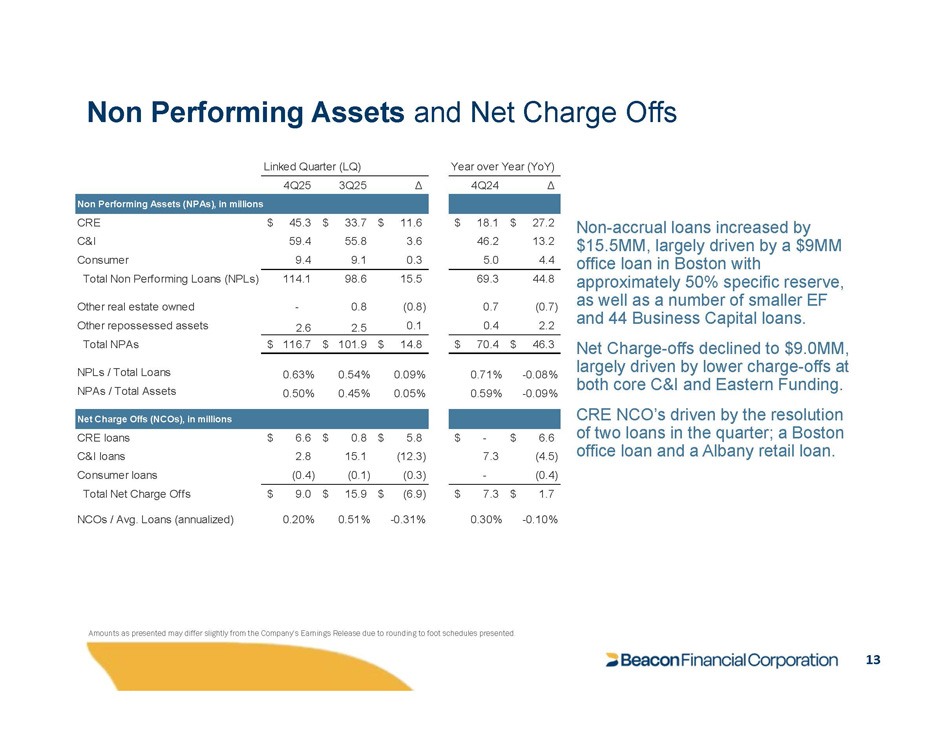
Non Performing Assets and Net Charge Offs 13 Non - accrual loans increased by $15.5MM, largely driven by a $9MM office loan in Boston with approximately 50% specific reserve, as well as a number of smaller EF and 44 Business Capital loans. Net Charge - offs declined to $ 9 . 0 MM, largely driven by lower charge - offs at both core C&I and Eastern Funding . CRE NCO’s driven by the resolution of two loans in the quarter ; a Boston office loan and a Albany retail loan . Δ 4Q24 Δ 3Q25 4Q25 Non Performing Assets (NPAs), in millions $ 27.2 $ 18.1 $ 11.6 $ 33.7 $ 45.3 CRE 13.2 46.2 3.6 55.8 59.4 C&I 4.4 5.0 0.3 9.1 9.4 Consumer 44.8 69.3 15.5 98.6 114.1 Total Non Performing Loans (NPLs) (0.7) 0.7 - 0.8 (0.8) Other real estate owned 2.2 0.4 2.6 2.5 0.1 Other repossessed assets $ 46.3 $ 70.4 $ 14.8 $ 101.9 $ 116.7 Total NPAs - 0.08% 0.71% 0.09% 0.54% 0.63% NPLs / Total Loans - 0.09% 0.59% 0.05% 0.45% 0.50% NPAs / Total Assets Net Charge Offs (NCOs), in millions $ 6.6 $ - $ 5.8 $ 0.8 $ 6.6 CRE loans (4.5) 7.3 (12.3) 15.1 2.8 C&I loans (0.4) - (0.3) (0.1) (0.4) Consumer loans $ 1.7 $ 7.3 $ (6.9) $ 15.9 $ 9.0 Total Net Charge Offs - 0.10% 0.30% - 0.31% 0.51% 0.20% NCOs / Avg. Loans (annualized) Linked Quarter (LQ) Year over Year (YoY) Amounts as presented may differ slightly from the Company’s Earnings Release due to rounding to foot schedules presented.
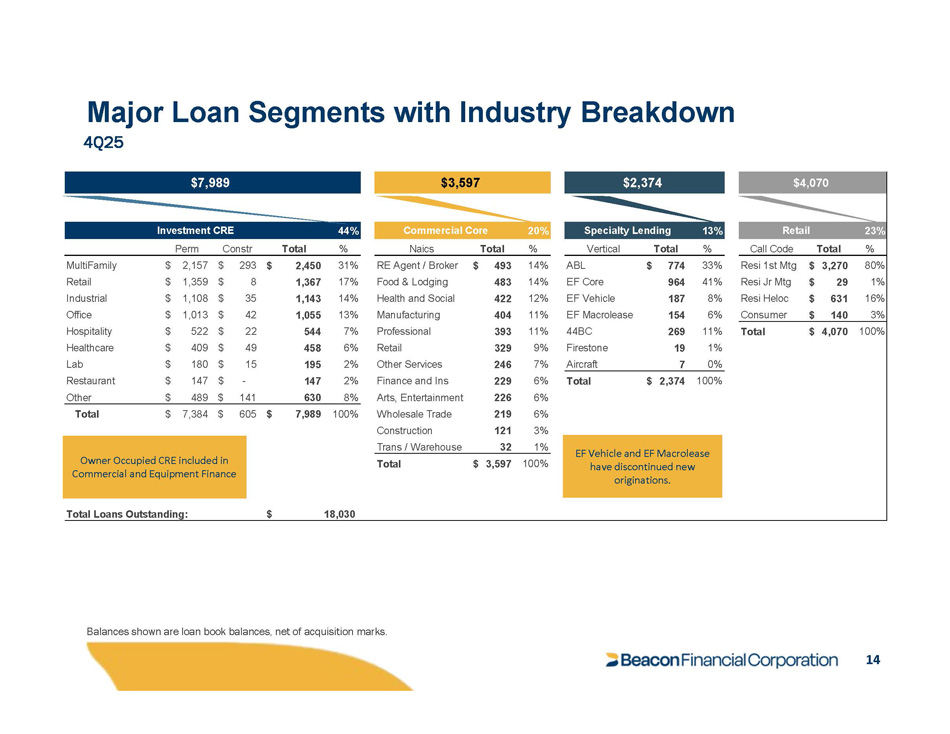
Balances shown are loan book balances, net of acquisition marks. $4,070 $2,374 $3,597 $7,989 23% Retail 13% Specialty Lending 20% Commercial Core 44% Investment CRE Call Code Total % Vertical Total % Naics Total % Total % Constr Perm Resi 1st Mtg $ 3,270 80% ABL $ 774 33% 14% RE Agent / Broker $ 493 31% $ 2,450 $ 293 $ 2,157 MultiFamily Resi Jr Mtg $ 29 1% EF Core 964 41% 14% Food & Lodging 483 17% 1,367 $ 8 $ 1,359 Retail Resi Heloc $ 631 16% EF Vehicle 187 8% 12% Health and Social 422 14% 1,143 $ 35 $ 1,108 Industrial Consumer $ 140 3% EF Macrolease 154 6% 11% Manufacturing 404 13% 1,055 $ 42 $ 1,013 Office Total $ 4,070 100% 44BC 269 11% 11% Professional 393 7% 544 $ 22 $ 522 Hospitality Firestone 19 1% 9% Retail 329 6% 458 $ 49 $ 409 Healthcare Aircraft 7 0% 7% Other Services 246 2% 195 $ 15 $ 180 Lab Total $ 2,374 100% 6% Finance and Ins 229 2% 147 $ - $ 147 Restaurant 6% Arts, Entertainment 226 8% 630 $ 141 $ 489 Other Wholesale Trade 219 6% $ 7,989 100% Total $ 7,384 $ 605 Owner Occupied CRE included in Commercial and Equipment Finance Total Loans Outstanding: Construction 121 3% EF Vehicle and EF Macrolease have discontinued new Trans / Warehouse 32 1% Total $ 3,597 100% originations. $ 18,030 Major Loan Segments with Industry Breakdown 4Q25 14
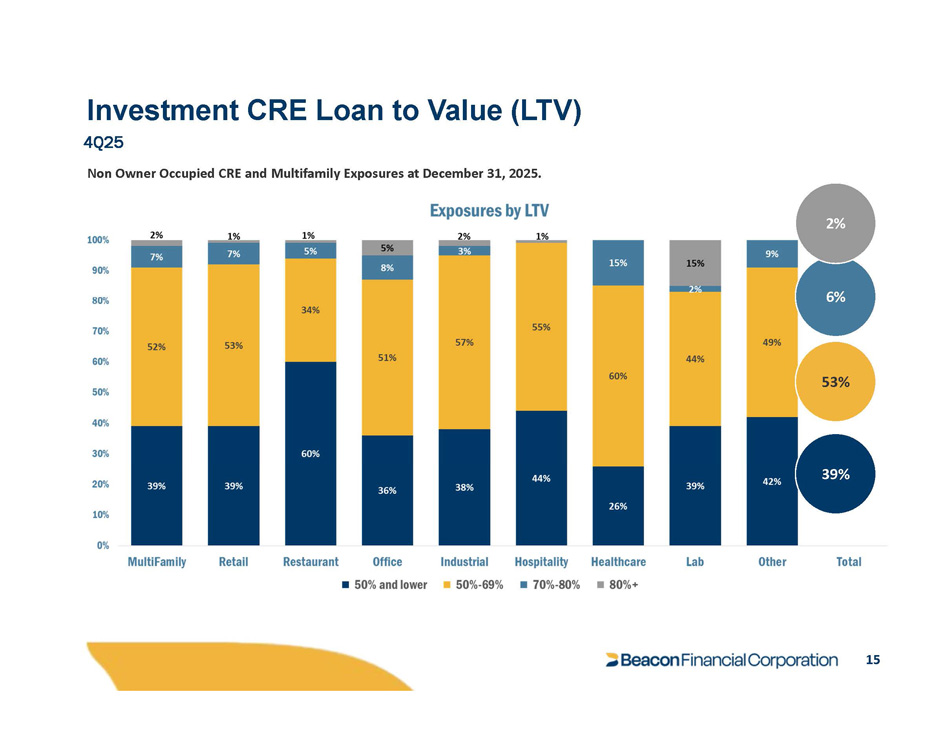
4Q25 Non Owner Occupied CRE and Multifamily Exposures at December 31, 2025. 39% 53% 6% 15 2% Investment CRE Loan to Value (LTV)
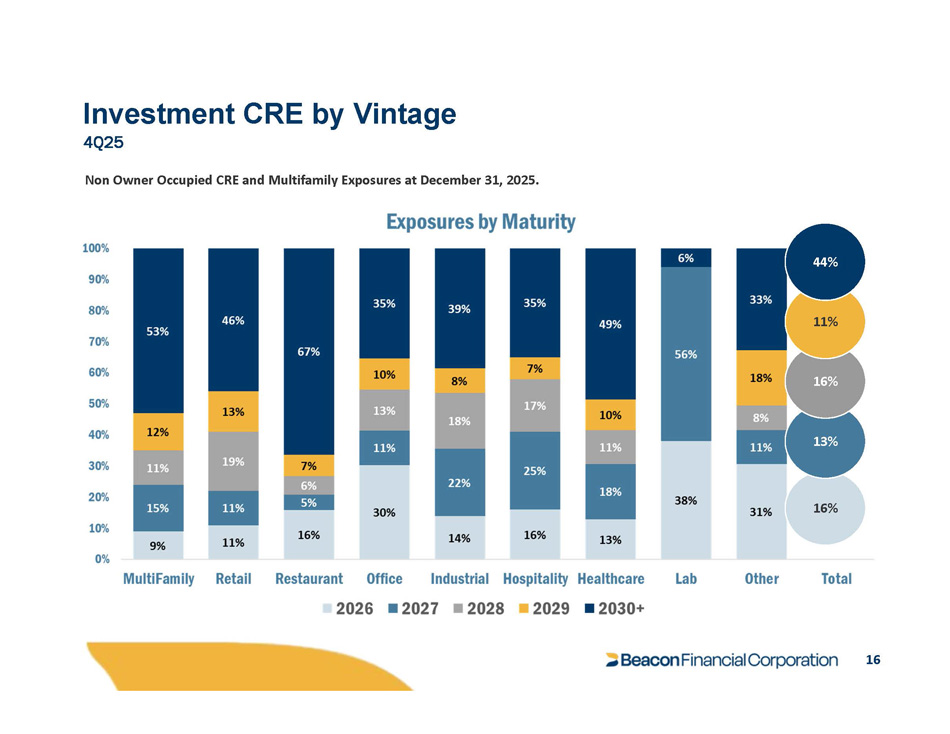
16% 16 16% 13% Investment CRE by Vintage 4Q25 Non Owner Occupied CRE and Multifamily Exposures at December 31, 2025. 11% 44%
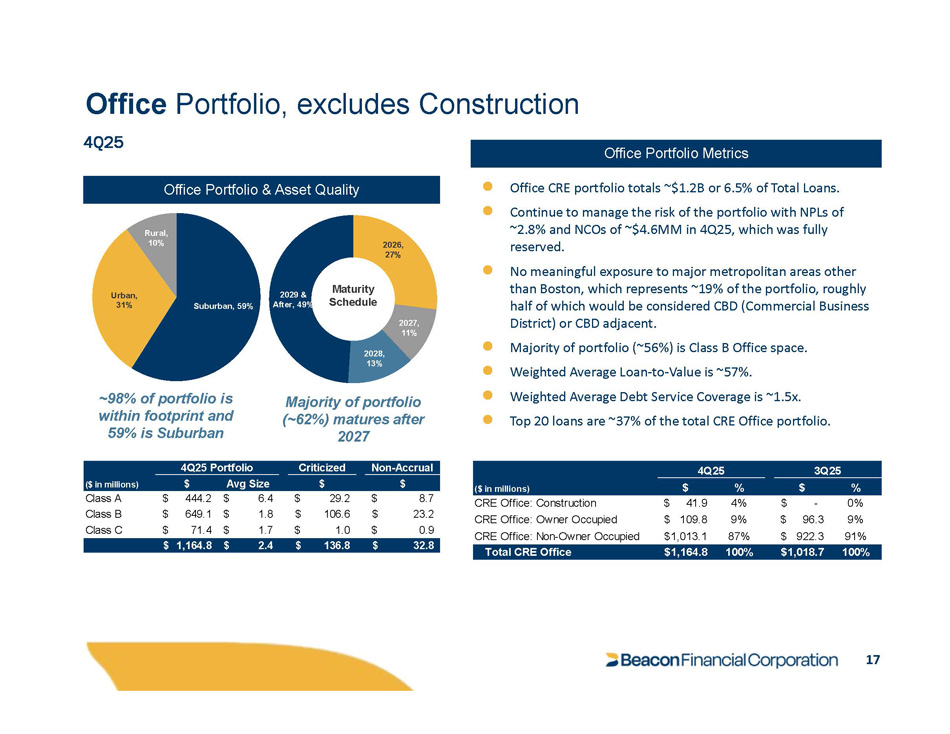
Office Portfolio, excludes Construction ● Office CRE portfolio totals ~$1.2B or 6.5% of Total Loans. ● Continue to manage the risk of the portfolio with NPLs of ~2.8% and NCOs of ~$4.6MM in 4Q25, which was fully reserved. ● No meaningful exposure to major metropolitan areas other than Boston, which represents ~19% of the portfolio, roughly half of which would be considered CBD (Commercial Business District) or CBD adjacent. ● Majority of portfolio (~56%) is Class B Office space. ● Weighted Average Loan - to - Value is ~57%. ● Weighted Average Debt Service Coverage is ~1.5x. ● Top 20 loans are ~37% of the total CRE Office portfolio. Office Portfolio & Asset Quality Office Portfolio Metrics Suburban, 59% Urban, 31% Rural, 10% 2026, 27% 2027, 11% 2028, 13% 2029 & After, 49% Maturity Schedule ~98% of portfolio is within footprint and 59% is Suburban Majority of portfolio (~62%) matures after 2027 Non - Accrual $ Criticized $ ortfolio Avg Size 4Q25 P $ ($ in millions) $ 8.7 $ 29.2 $ 6.4 $ 444.2 Class A $ 23.2 $ 106.6 $ 1.8 $ 649.1 Class B $ 0.9 $ 1.0 $ 1.7 $ 71.4 Class C $ 32.8 $ 136.8 $ 2.4 $ 1,164.8 4Q25 3Q25 $ % $ % ($ in millions) 0% $ - 4% $ 41.9 CRE Office: Construction 9% $ 96.3 9% $ 109.8 CRE Office: Owner Occupied 91% 922.3 $ 87% $1,013.1 CRE Office: Non - Owner Occupied Total CRE Office $1,164.8 100% $1,018.7 100% 17 4Q25
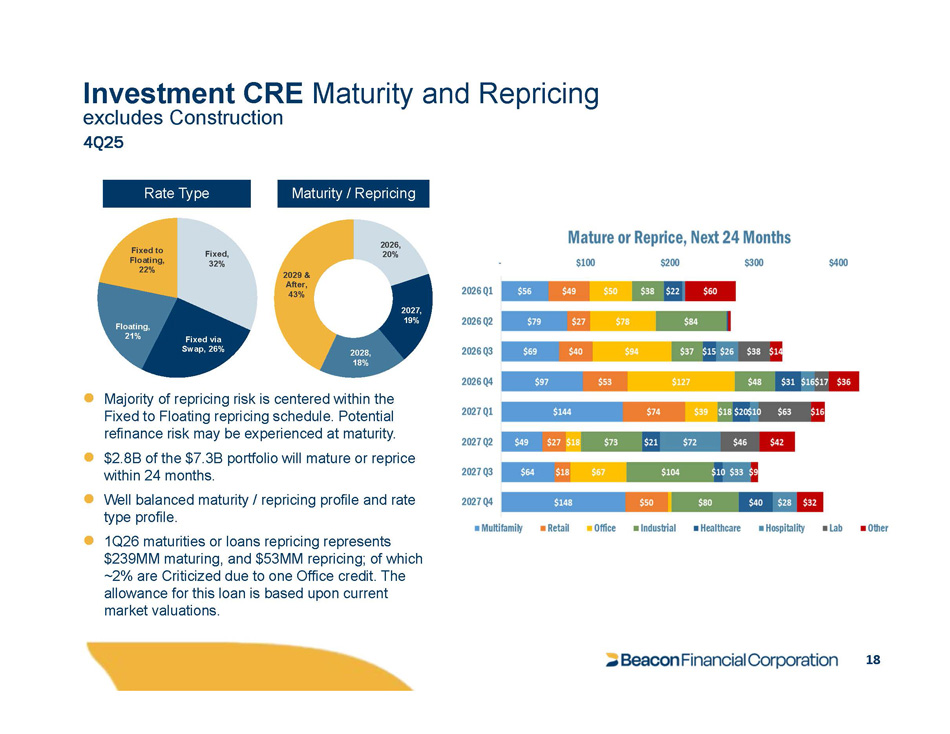
● Majority of repricing risk is centered within the Fixed to Floating repricing schedule . Potential refinance risk may be experienced at maturity . ● $2.8B of the $7.3B portfolio will mature or reprice within 24 months. ● Well balanced maturity / repricing profile and rate type profile. ● 1Q26 maturities or loans repricing represents $239MM maturing, and $53MM repricing; of which ~2% are Criticized due to one Office credit. The allowance for this loan is based upon current market valuations. Rate Type Fixed, 32% Fixed via Swap, 26% Floating, 21% Fixed to Floating, 22% 2026, 20% 2027, 19% 2028, 18% 2029 & After, 43% Maturity / Repricing Investment CRE Maturity and Repricing excludes Construction 4Q25 18
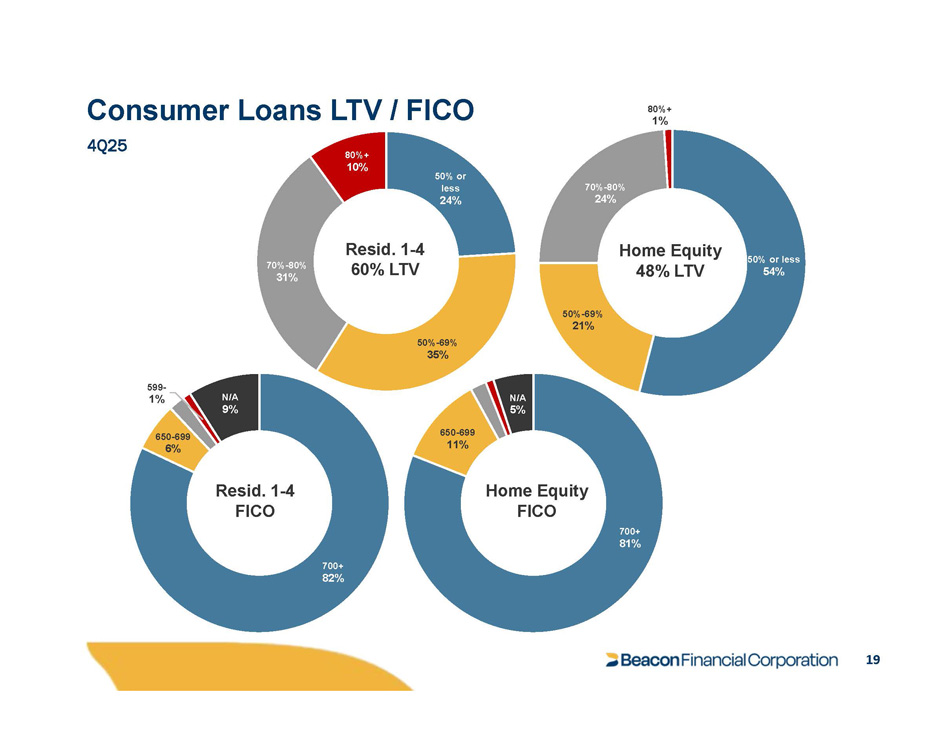
Consumer Loans LTV / FICO 700+ 82% 19 650 - 699 6% 599 - 1% N/A 9% 50% or less 24% 50% - 69% 35% 70% - 80% 31% 80%+ 10% 700+ 81% 650 - 699 11% N/A 5% 50% or less 54% 50% - 69% 21% 70% - 80% 24% 80%+ 1% Resid. 1 - 4 60% LTV Resid. 1 - 4 FICO Home Equity FICO Home Equity 48% LTV 4Q25
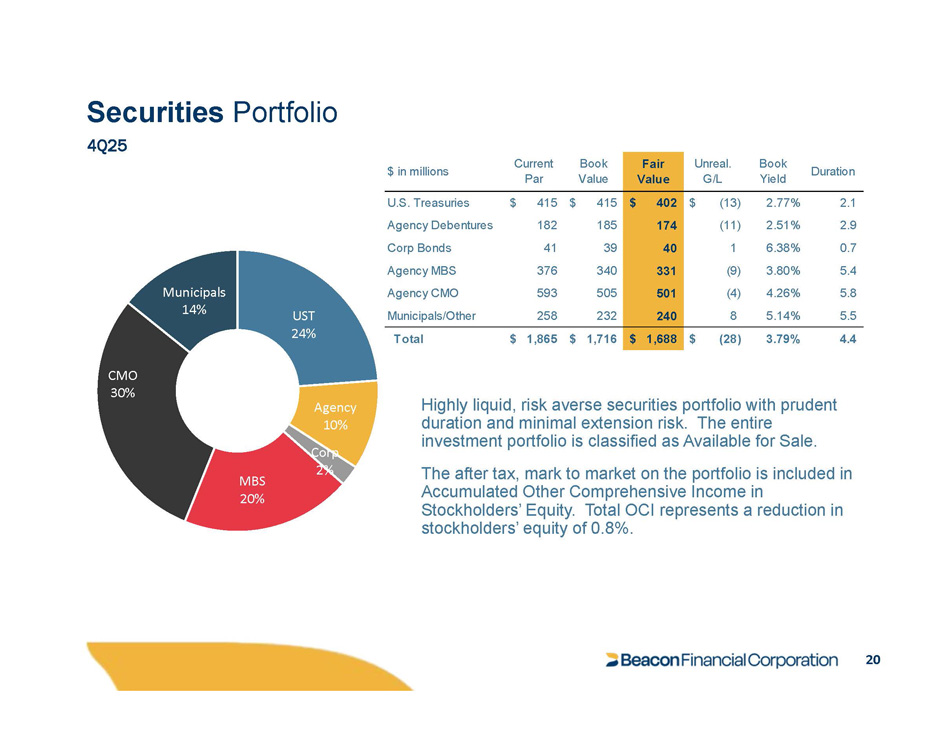
Securities Portfolio 4Q25 UST 24% 20 Agency 10% Corp 2% MBS 20% CMO 30% Municipals 14% Duration Book Yield Unreal. G/L Fair Value Book Value Current Par $ in millions 2.1 2.77% $ (13) $ 402 $ 415 $ 415 U.S. Treasuries 2.9 2.51% (11) 174 185 182 Agency Debentures 0.7 6.38% 1 40 39 41 Corp Bonds 5.4 3.80% (9) 331 340 376 Agency MBS 5.8 4.26% (4) 501 505 593 Agency CMO 5.5 5.14% 8 240 232 258 Municipals/Other 4.4 3.79% $ (28) $ 1,688 $ 1,716 $ 1,865 Total Highly liquid, risk averse securities portfolio with prudent duration and minimal extension risk. The entire investment portfolio is classified as Available for Sale. The after tax, mark to market on the portfolio is included in Accumulated Other Comprehensive Income in Stockholders’ Equity. Total OCI represents a reduction in stockholders’ equity of 0.8%.
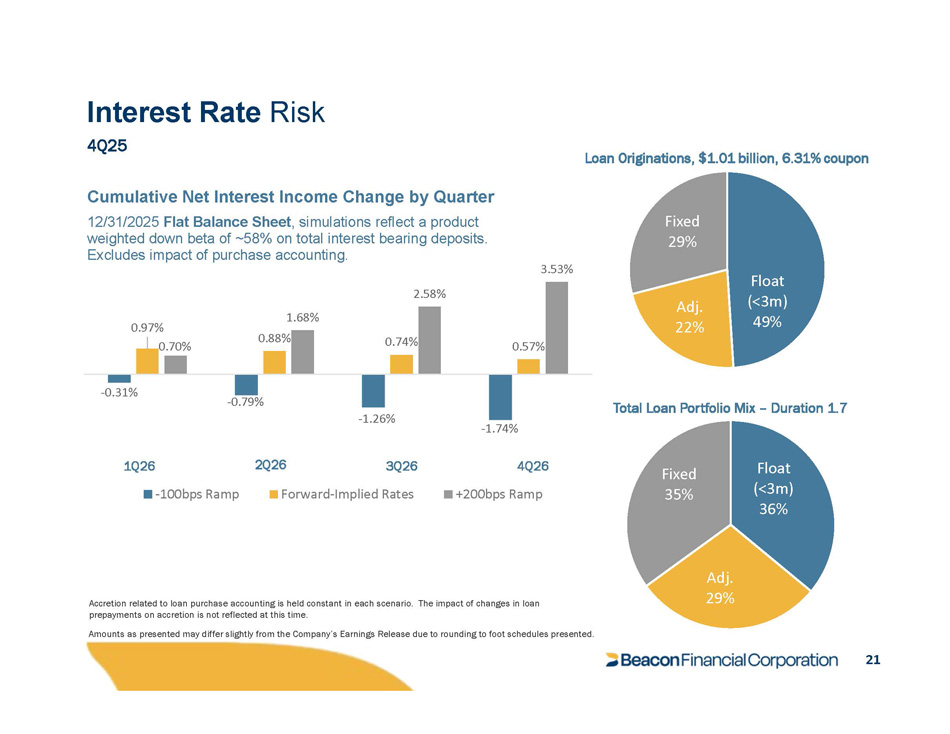
Interest Rate Risk 4Q25 Float (< 3 m) 49 % Adj. 22% Fixed 29% Loan Originations, $1.01 billion, 6.31% coupon Total Loan Portfolio Mix – Duration 1.7 - 0.31% - 0.79% - 1.26% - 1.74% 0.97% 0.88% 0.74% 0.57% 0.70% 1.68% 2.58% 3.53% Cumulative Net Interest Income Change by Quarter 12/31/2025 Flat Balance Sheet , simulations reflect a product weighted down beta of ~58% on total interest bearing deposits. Excludes impact of purchase accounting. - 100bps Ramp Forward - Implied Rates +200bps Ramp Float (< 3 m) 36 % 21 Adj. 29% Fixed 35% 2Q26 3Q26 4Q26 1Q26 Accretion related to loan purchase accounting is held constant in each scenario. The impact of changes in loan prepayments on accretion is not reflected at this time. Amounts as presented may differ slightly from the Company’s Earnings Release due to rounding to foot schedules presented.

NYSE: BBT 22