UNITED STATES
SECURITIES AND EXCHANGE COMMISSION
Washington, D.C. 20549
FORM 6-K
Report of Foreign Private
Issuer
Pursuant to Rule 13a-16 or 15d-16 of the
Securities Exchange Act of 1934
For the month of April, 2026
Commission File Number 1-15106
PETRÓLEO BRASILEIRO S.A. – PETROBRAS
(Exact name of registrant as specified in its charter)
Brazilian Petroleum Corporation – PETROBRAS
(Translation of Registrant's name into English)
Avenida Henrique Valadares, 28 – 9th floor
20231-030 – Rio de Janeiro, RJ
Federative Republic of Brazil
(Address of principal executive office)
Indicate by check mark whether the registrant files or will file annual reports under cover Form 20-F or Form 40-F.
Form 20-F ___X___ Form 40-F _______
Indicate by check mark whether the registrant by furnishing the information contained in this Form is also thereby furnishing the information to the Commission pursuant to Rule 12g3-2(b) under the Securities Exchange Act of 1934.
Yes _______ No___X____
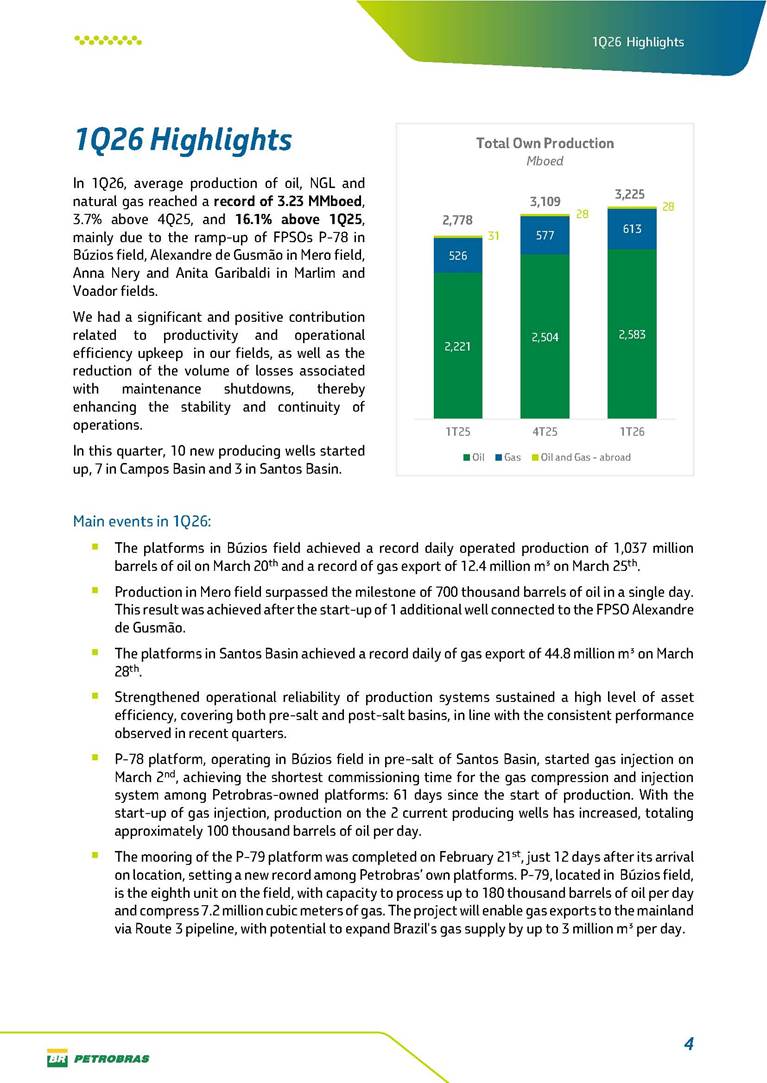
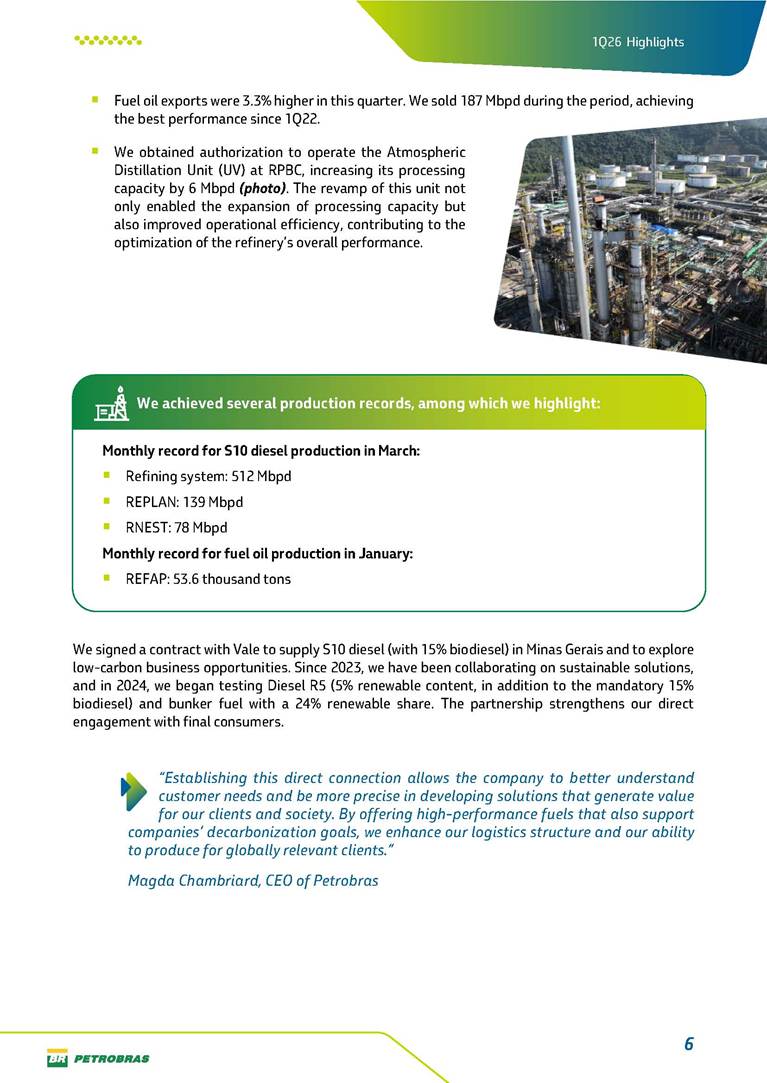
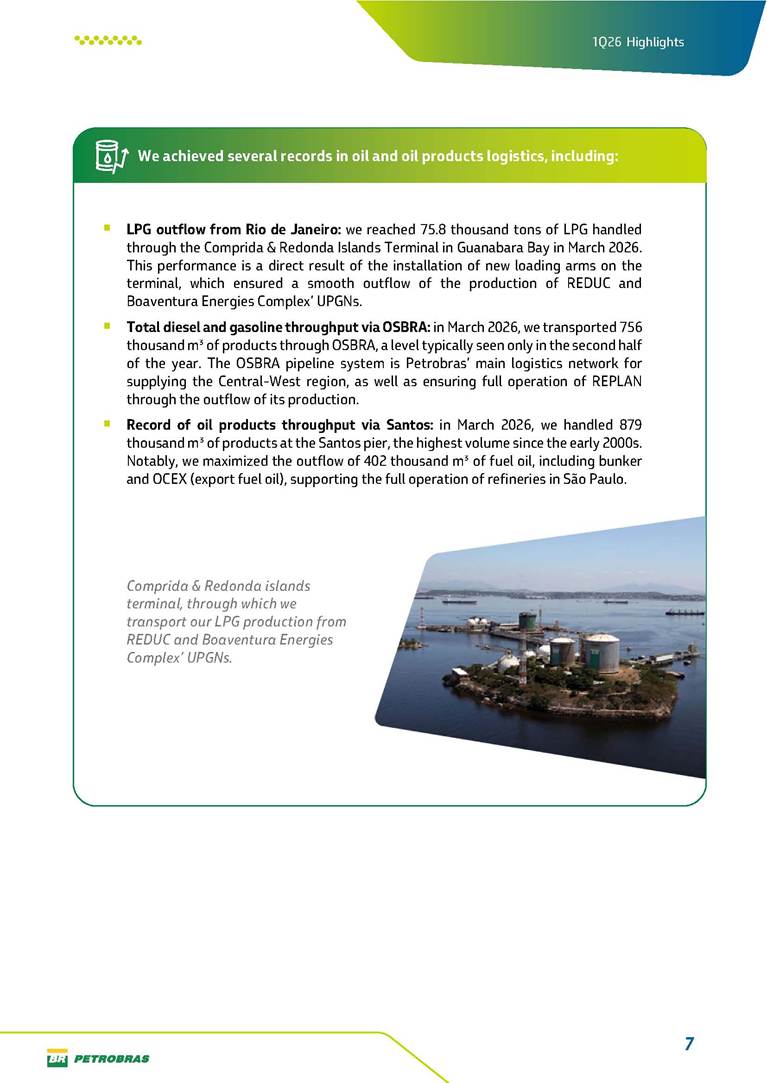
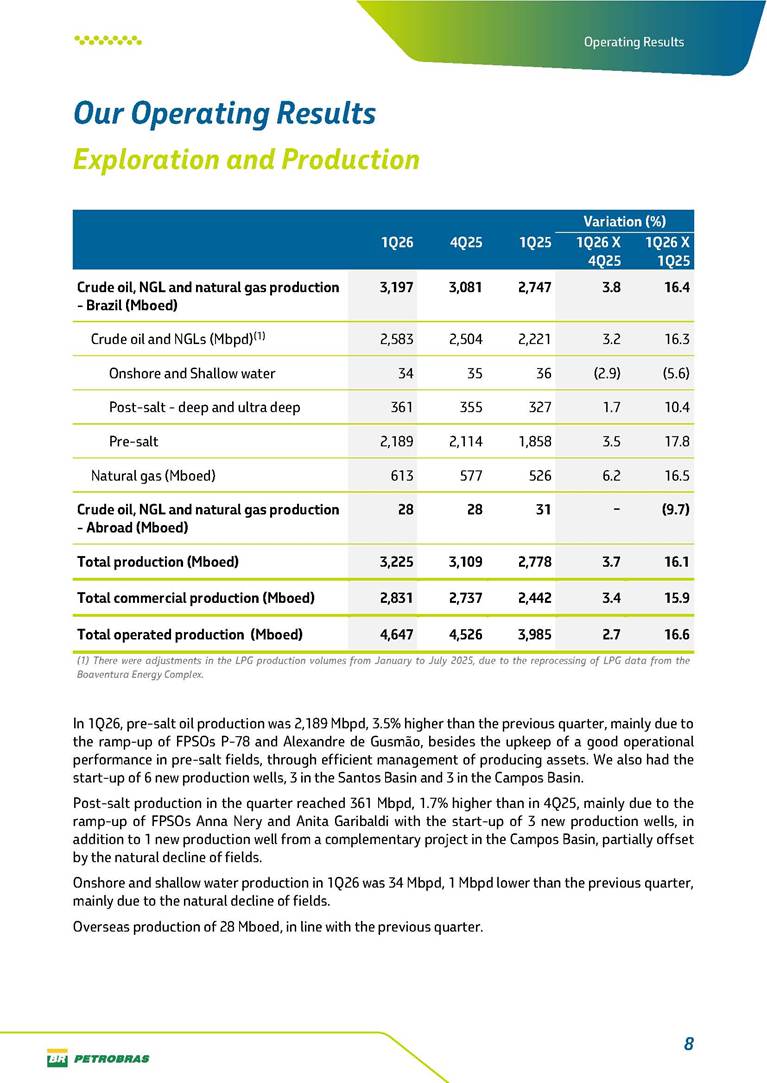
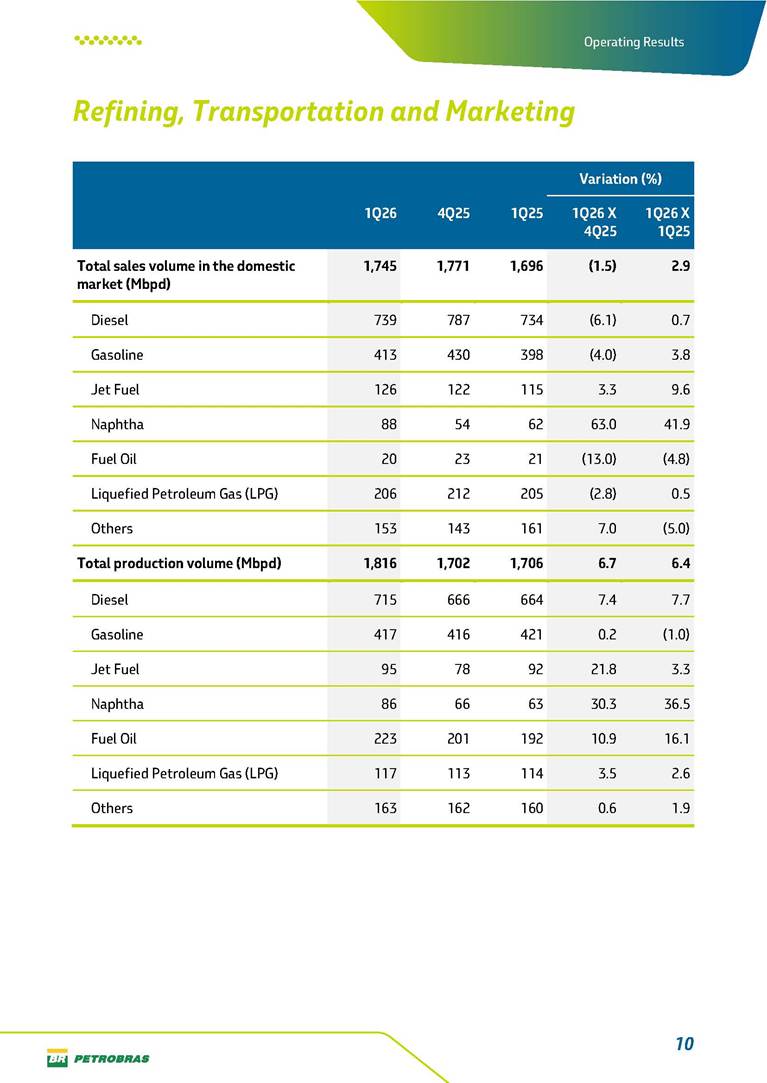
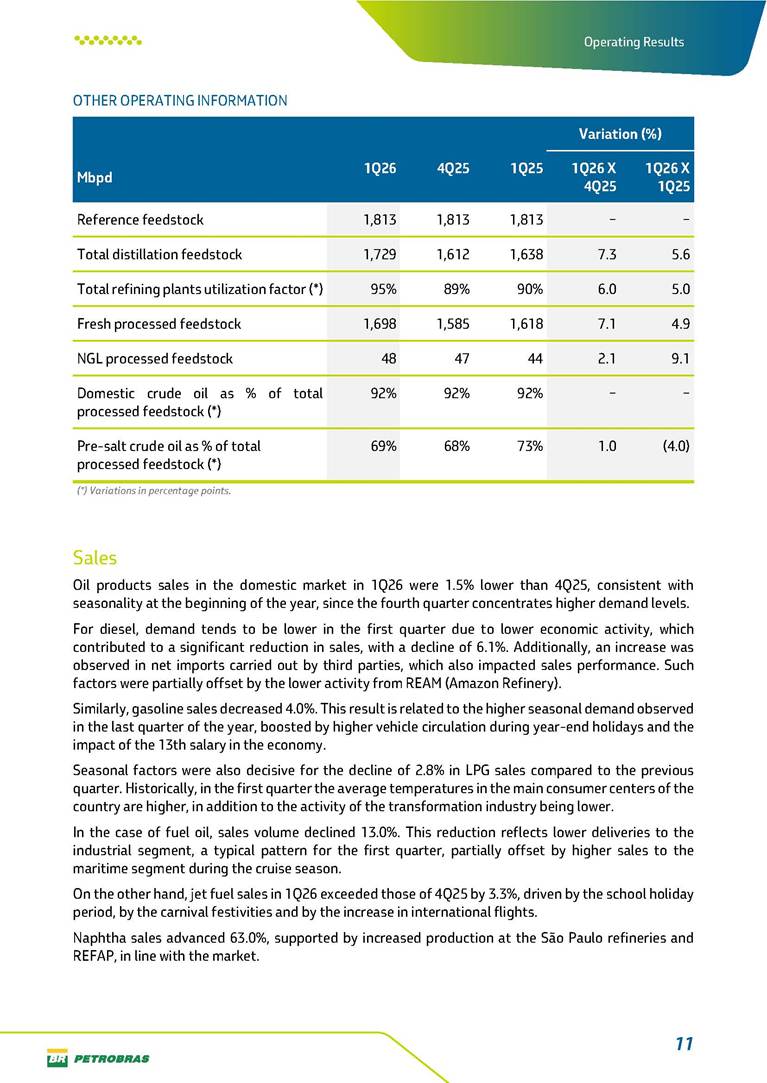
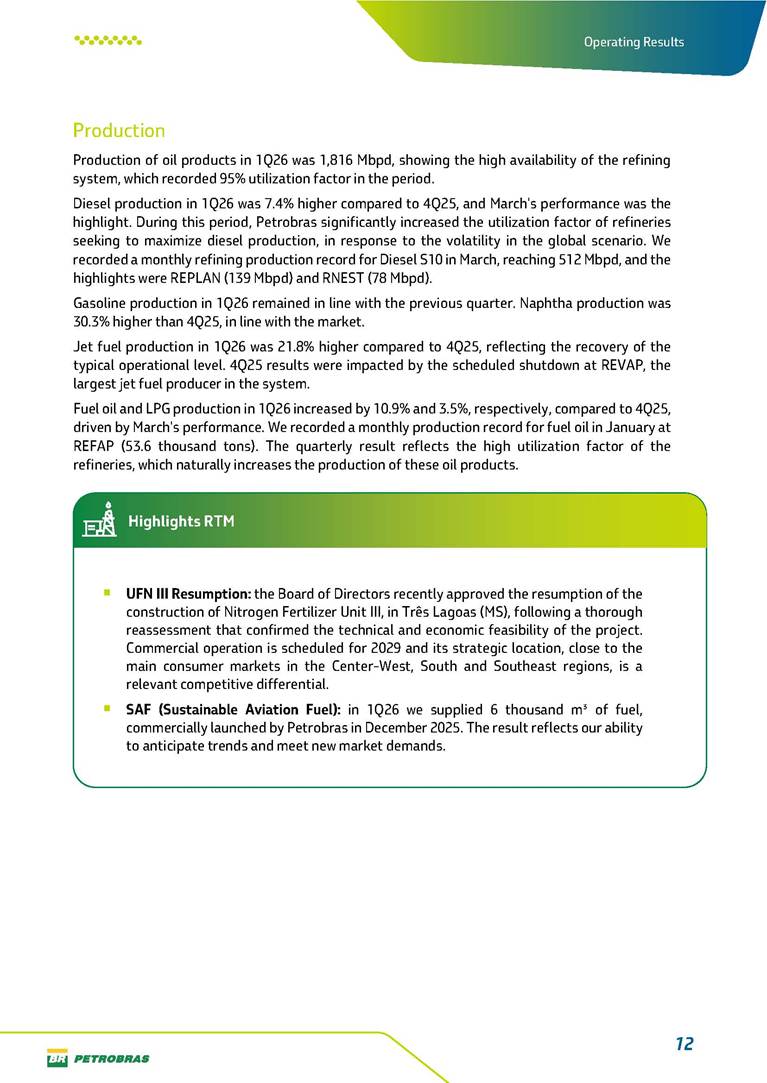
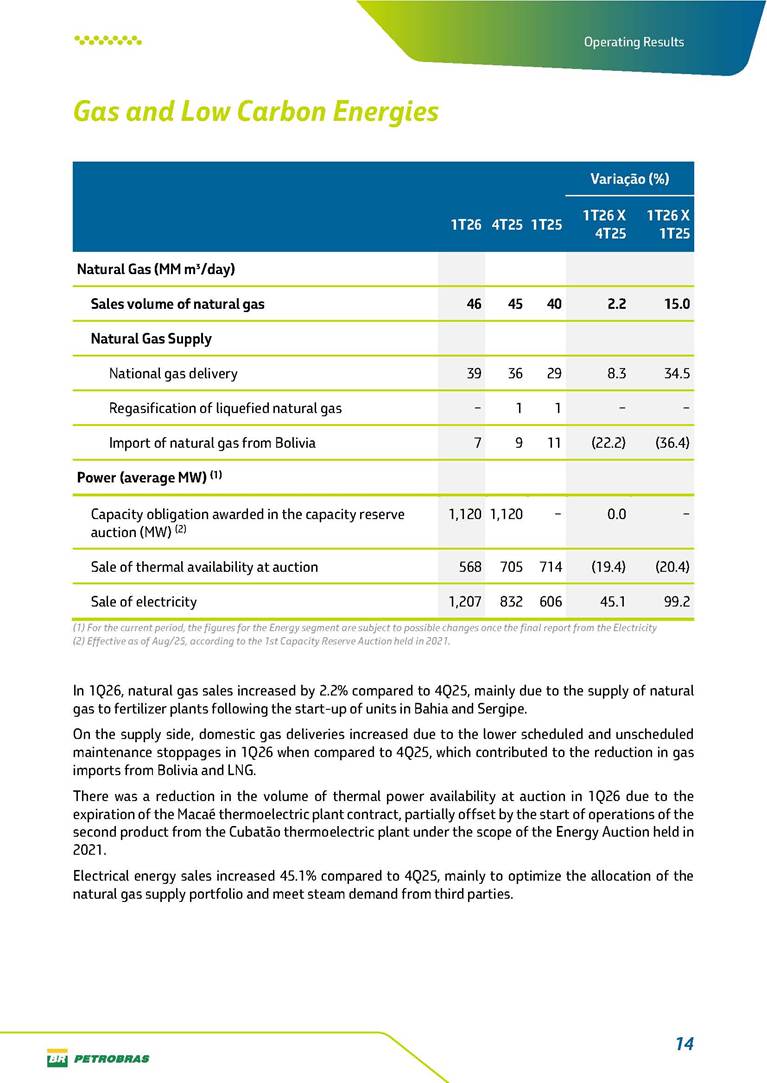
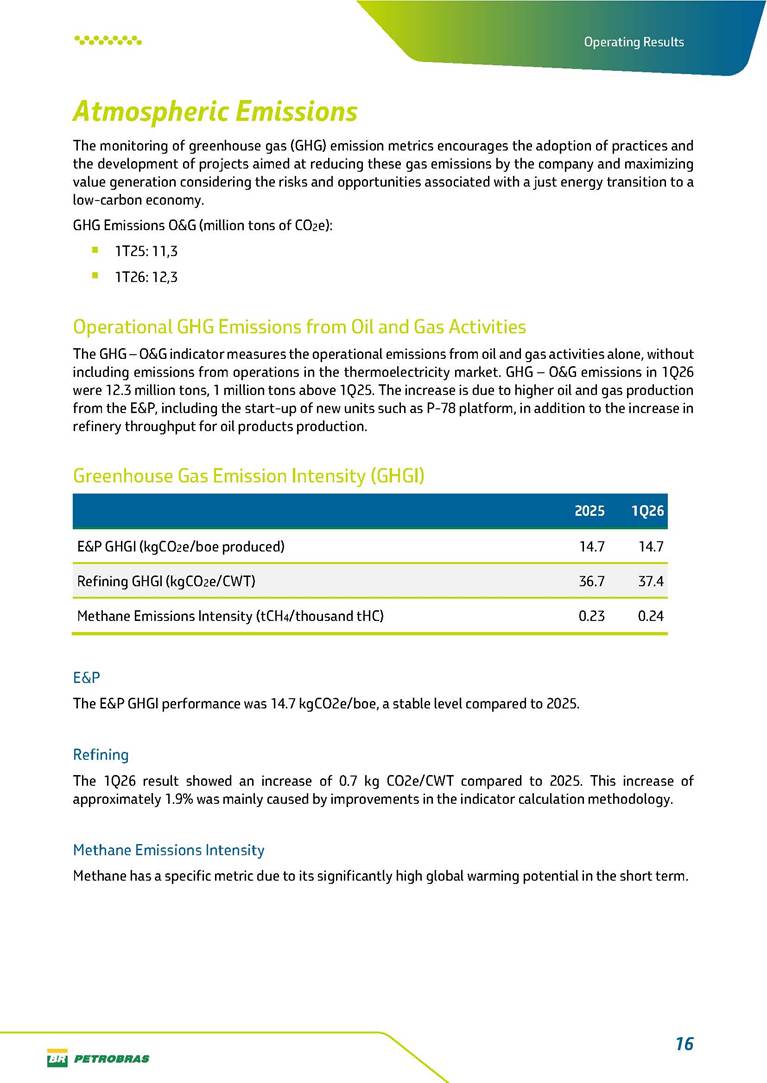
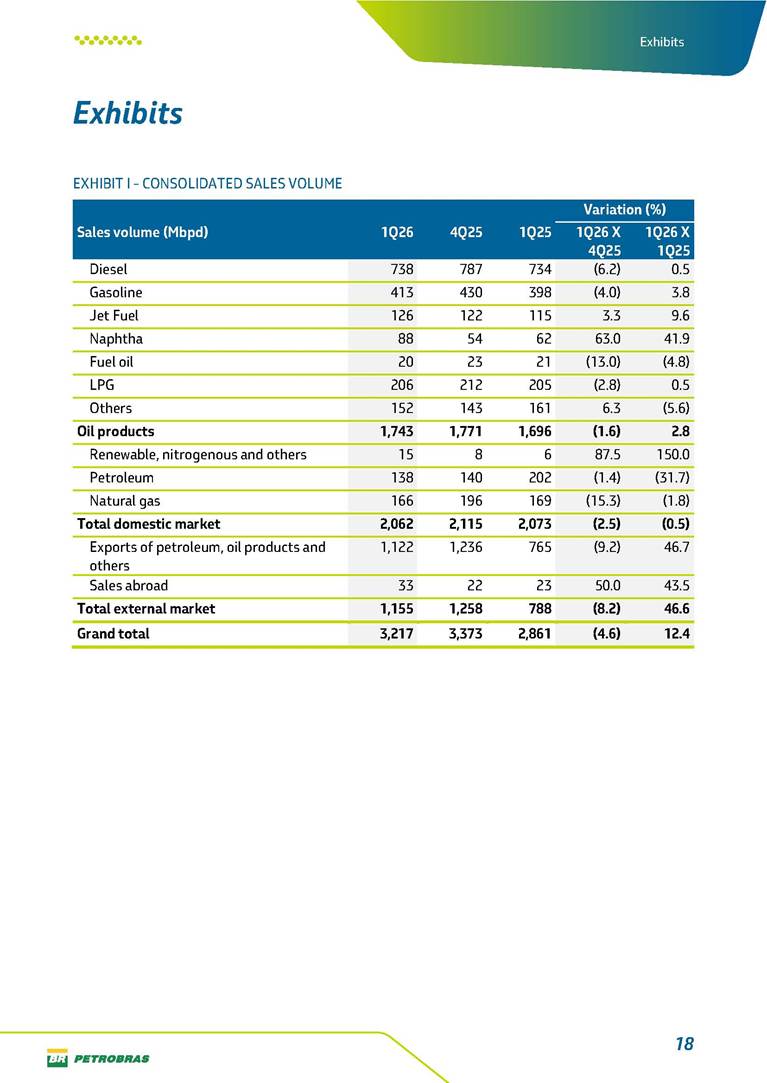
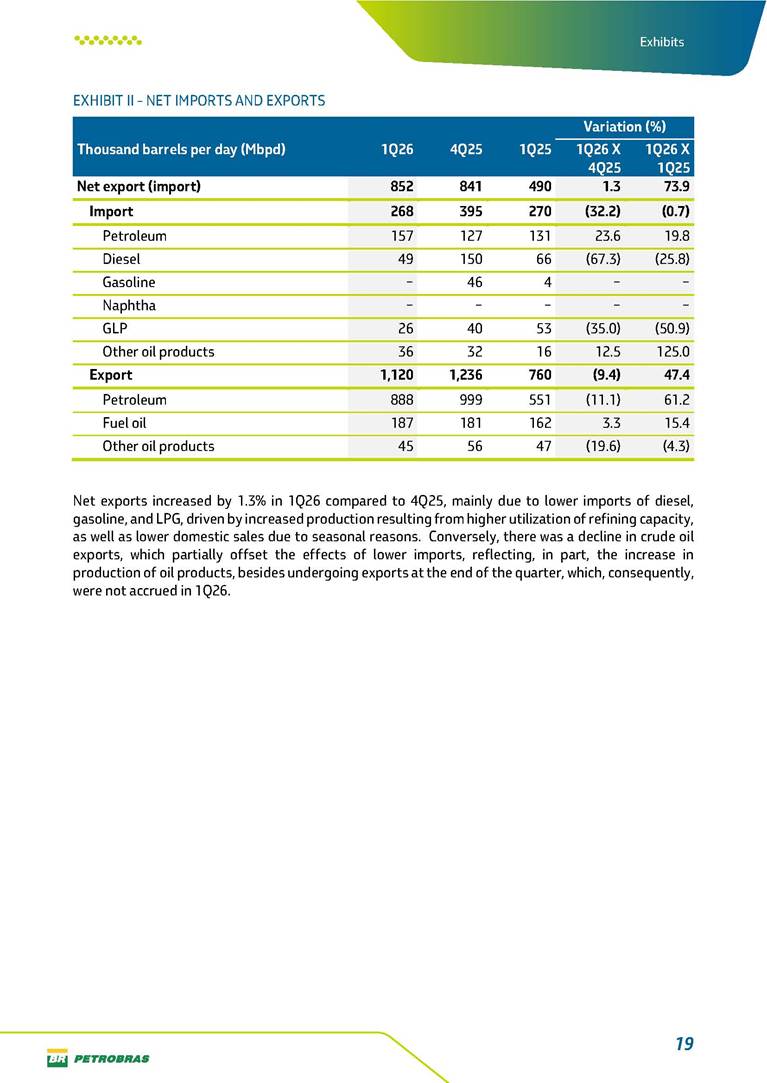
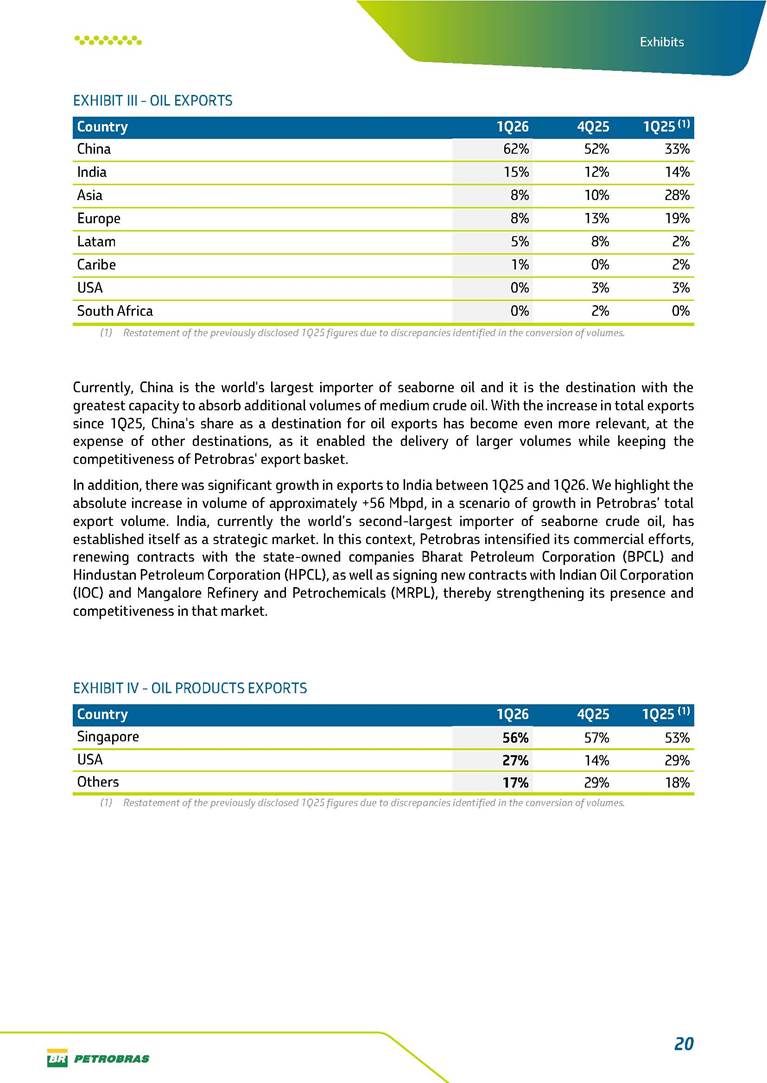
PRODUCTION & SALES — 1Q26 Nova Piratininga thermoelectric plant One of 9 Petrobras plants contracted at LRCAP 2026 Summary Table of contents 1Q26 Highlights .................................................................................................... 4 Our Operating Results ........................................................................................ 8 Exploration and Production .................................................................................................................... 8 Refining, Transportation and Marketing ........................................................................................ 10 Gas and Low Carbon Energies .............................................................................................................. 14 Atmospheric Emissions ............................................................................................................................ 16 Exhibits..................................................................................................................18 Exhibit I - Consolidated Sales Volume .............................................................................................. 18 Exhibit II - Net Imports and Exports ................................................................................................... 19 Exhibit III - Oil Exports .............................................................................................................................. 20 Exhibit IV - Oil Products Exports .......................................................................................................... 20 Glossary .................................................................................................................21 3 Disclaimer Disclaimer This report may contain forward-looking statements about future events. Such forecasts reflect only the expectations of the company's management about future economic conditions, as well as the company's industry, performance and financial results, among others. The terms "anticipates", "believes", "expects", "predicts", "intends", "plans", "projects", "aims", "should", as well as other similar terms, are intended to identify such forecasts, which, of course, involve risks and uncertainties foreseen or not foreseen by the company and, consequently, are not guarantees of the company's future results. Therefore, future results of the company's operations may differ from current expectations, and the reader should not rely solely on the information contained herein. The company undertakes no obligation to update the presentations and forecasts in the light of new information or future developments. The figures reported for 2Q26 onwards are estimates or targets. The operating data contained in this report has not been audited by the independent auditor. 4 1Q26 Highlights 2,221 2,504 2,583 526 577 613 31 28 28 1T25 4T25 1T26 Total Own ProductionMboed Oil Gas Oil and Gas - abroad 2,778 3,225 3,109 1Q26 Highlights In 1Q26, average production of oil, NGL and natural gas reached a record of 3.23 MMboed, 3.7% above 4Q25, and 16.1% above 1Q25, mainly due to the ramp-up of FPSOs P-78 in Búzios field, Alexandre de Gusmão in Mero field, Anna Nery and Anita Garibaldi in Marlim and Voador fields. We had a significant and positive contribution related to productivity and operational efficiency upkeep in our fields, as well as the reduction of the volume of losses associated with maintenance shutdowns, thereby enhancing the stability and continuity of operations. In this quarter, 10 new producing wells started up, 7 in Campos Basin and 3 in Santos Basin. Main events in 1Q26: The platforms in Búzios field achieved a record daily operated production of 1,037 million barrels of oil on March 20th and a record of gas export of 12.4 million m³ on March 25th. Production in Mero field surpassed the milestone of 700 thousand barrels of oil in a single day. This result was achieved after the start-up of 1 additional well connected to the FPSO Alexandre de Gusmão. The platforms in Santos Basin achieved a record daily of gas export of 44.8 million m³ on March 28th. Strengthened operational reliability of production systems sustained a high level of asset efficiency, covering both pre-salt and post-salt basins, in line with the consistent performance observed in recent quarters. P-78 platform, operating in Búzios field in pre-salt of Santos Basin, started gas injection on March 2nd, achieving the shortest commissioning time for the gas compression and injection system among Petrobras-owned platforms: 61 days since the start of production. With the start-up of gas injection, production on the 2 current producing wells has increased, totaling approximately 100 thousand barrels of oil per day. The mooring of the P-79 platform was completed on February 21st, just 12 days after its arrival on location, setting a new record among Petrobras’ own platforms. P-79, located in Búzios field, is the eighth unit on the field, with capacity to process up to 180 thousand barrels of oil per day and compress 7.2 million cubic meters of gas. The project will enable gas exports to the mainland via Route 3 pipeline, with potential to expand Brazil's gas supply by up to 3 million m³ per day. 5 1Q26 Highlights Highlights of the Refining, Transportation and Marketing segment: Production recorded a 6.7% increase in total output of oil products compared to 4Q25, reaching 1,816 Mbpd. Notably, middle destillates (diesel and jet fuel) and gasoline accounted for 68% of total oil products in 1Q26. It is also worth highlighting that higher production allowed higher sales of locally-produced oil products, reducing imports. In 1Q26, we had the lowest volume of LPG imports (26 Mbpd). This achievement is due to production at the Boaventura Energies Complex, which, together with higher utilization of the refining system, has increased total supply of the product and contributed to reducing import needs. Below are the main events of the quarter: Total utilization factor (FUT) of the refining system reached 95%, 6 p.p. above 4Q25, demonstrating the high operational efficiency of our refineries. Additionally, in March, we recorded a FUT of 97.4%, the highest since December 2014. We set a record production of S10 diesel in March, at 512 Mbpd. Diesel with a maximum sulfur content of 10 ppm is a strategic product for both the company and the country, as it is less polluting and has a lower environmental impact. The share of pre-salt oil in the processed feedstock was 69%, reflecting our greater flexibility in using these streams to maximize the production of higher value-added products. Domestic sales of oil products showed consistent growth in 1Q26, increasing 2.9% when compared to 1Q25. This result reflects the company’s improved competitiveness in strategic markets and its operational efficiency amid a recovering economic environment. Jet fuel: with sales of 126 Mbpd, it increased by 3.3% and 9.6% compared to 4Q25 and 1Q25, respectively. Total operated production in 1Q26: 4.65 million boed (previous record of 4.54 million boed in 3Q25) Total own production in 1Q26: 3.23 million boed (previous record of 3.14 million boed in 3Q25). Total operated production in pre-sal in 1Q26: 4.01 million boed (previous record of 3.90 million boed in 4Q25). Total own production in pre-sal in 1Q26: 2.66 million boed (previous record of 2.56 million boed in 3Q25). In this quarter, we achieved several production records, among which we highlight: 6 1Q26 Highlights Fuel oil exports were 3.3% higher in this quarter. We sold 187 Mbpd during the period, achieving the best performance since 1Q22. We obtained authorization to operate the Atmospheric Distillation Unit (UV) at RPBC, increasing its processing capacity by 6 Mbpd (photo). The revamp of this unit not only enabled the expansion of processing capacity but also improved operational efficiency, contributing to the optimization of the refinery’s overall performance. We signed a contract with Vale to supply S10 diesel (with 15% biodiesel) in Minas Gerais and to explore low-carbon business opportunities. Since 2023, we have been collaborating on sustainable solutions, and in 2024, we began testing Diesel R5 (5% renewable content, in addition to the mandatory 15% biodiesel) and bunker fuel with a 24% renewable share. The partnership strengthens our direct engagement with final consumers. “Establishing this direct connection allows the company to better understand customer needs and be more precise in developing solutions that generate value for our clients and society. By offering high-performance fuels that also support companies’ decarbonization goals, we enhance our logistics structure and our ability to produce for globally relevant clients.” Magda Chambriard, CEO of Petrobras Monthly record for S10 diesel production in March: Refining system: 512 Mbpd REPLAN: 139 Mbpd RNEST: 78 Mbpd Monthly record for fuel oil production in January: REFAP: 53.6 thousand tons We achieved several production records, among which we highlight: 7 1Q26 Highlights LPG outflow from Rio de Janeiro: we reached 75.8 thousand tons of LPG handled through the Comprida & Redonda Islands Terminal in Guanabara Bay in March 2026. This performance is a direct result of the installation of new loading arms on the terminal, which ensured a smooth outflow of the production of REDUC and Boaventura Energies Complex’ UPGNs. Total diesel and gasoline throughput via OSBRA: in March 2026, we transported 756 thousand m³ of products through OSBRA, a level typically seen only in the second half of the year. The OSBRA pipeline system is Petrobras’ main logistics network for supplying the Central-West region, as well as ensuring full operation of REPLAN through the outflow of its production. Record of oil products throughput via Santos: in March 2026, we handled 879 thousand m³ of products at the Santos pier, the highest volume since the early 2000s. Notably, we maximized the outflow of 402 thousand m³ of fuel oil, including bunker and OCEX (export fuel oil), supporting the full operation of refineries in São Paulo. Comprida & Redonda islands terminal, through which we transport our LPG production from REDUC and Boaventura Energies Complex’ UPGNs. We achieved several records in oil and oil products logistics, including: 8 Operating Results Our Operating Results Exploration and Production Variation (%) 1Q26 4Q25 1Q25 1Q26 X 4Q25 1Q26 X 1Q25 Crude oil, NGL and natural gas production - Brazil (Mboed) 3,197 3,081 2,747 3.8 16.4 Crude oil and NGLs (Mbpd)(1) 2,583 2,504 2,221 3.2 16.3 Onshore and Shallow water 34 35 36 (2.9) (5.6) Post-salt - deep and ultra deep 361 355 327 1.7 10.4 Pre-salt 2,189 2,114 1,858 3.5 17.8 Natural gas (Mboed) 613 577 526 6.2 16.5 Crude oil, NGL and natural gas production - Abroad (Mboed) 28 28 31 − (9.7) Total production (Mboed) 3,225 3,109 2,778 3.7 16.1 Total commercial production (Mboed) 2,831 2,737 2,442 3.4 15.9 Total operated production (Mboed) 4,647 4,526 3,985 2.7 16.6 (1) There were adjustments in the LPG production volumes from January to July 2025, due to the reprocessing of LPG data from the Boaventura Energy Complex. In 1Q26, pre-salt oil production was 2,189 Mbpd, 3.5% higher than the previous quarter, mainly due to the ramp-up of FPSOs P-78 and Alexandre de Gusmão, besides the upkeep of a good operational performance in pre-salt fields, through efficient management of producing assets. We also had the start-up of 6 new production wells, 3 in the Santos Basin and 3 in the Campos Basin. Post-salt production in the quarter reached 361 Mbpd, 1.7% higher than in 4Q25, mainly due to the ramp-up of FPSOs Anna Nery and Anita Garibaldi with the start-up of 3 new production wells, in addition to 1 new production well from a complementary project in the Campos Basin, partially offset by the natural decline of fields. Onshore and shallow water production in 1Q26 was 34 Mbpd, 1 Mbpd lower than the previous quarter, mainly due to the natural decline of fields. Overseas production of 28 Mboed, in line with the previous quarter. 9 Operating Results “P-78 reached the 100 thousand barrels of oil per day mark with only two production wells, contributing to the milestone of 1 million barrels of oil per day on Búzios field. Just 61 days after first oil, we started gas injection on the platform , a record that surpasses by a good margin the previous mark for owned systems. This is the result of successful planning and execution, with the new early commissioning strategy at the shipyard, manned navigation from the shipyard to the final location, integration of teams and technological innovation, directly impacting the ramp-up of the unit." Renata Baruzzi, Chief of Engineering, Technology and Innovation Officer 10 Operating Results Refining, Transportation and Marketing Variation (%) 1Q26 4Q25 1Q25 1Q26 X 4Q25 1Q26 X 1Q25 Total sales volume in the domestic market (Mbpd) 1,745 1,771 1,696 (1.5) 2.9 Diesel 739 787 734 (6.1) 0.7 Gasoline 413 430 398 (4.0) 3.8 Jet Fuel 126 122 115 3.3 9.6 Naphtha 88 54 62 63.0 41.9 Fuel Oil 20 23 21 (13.0) (4.8) Liquefied Petroleum Gas (LPG) 206 212 205 (2.8) 0.5 Others 153 143 161 7.0 (5.0) Total production volume (Mbpd) 1,816 1,702 1,706 6.7 6.4 Diesel 715 666 664 7.4 7.7 Gasoline 417 416 421 0.2 (1.0) Jet Fuel 95 78 92 21.8 3.3 Naphtha 86 66 63 30.3 36.5 Fuel Oil 223 201 192 10.9 16.1 Liquefied Petroleum Gas (LPG) 117 113 114 3.5 2.6 Others 163 162 160 0.6 1.9 11 Operating Results OTHER OPERATING INFORMATION Variation (%) Mbpd 1Q26 4Q25 1Q25 1Q26 X 4Q25 1Q26 X 1Q25 Reference feedstock 1,813 1,813 1,813 − − Total distillation feedstock 1,729 1,612 1,638 7.3 5.6 Total refining plants utilization factor (*) 95% 89% 90% 6.0 5.0 Fresh processed feedstock 1,698 1,585 1,618 7.1 4.9 NGL processed feedstock 48 47 44 2.1 9.1 Domestic crude oil as % of total processed feedstock (*) 92% 92% 92% − − Pre-salt crude oil as % of total processed feedstock (*) 69% 68% 73% 1.0 (4.0) (*) Variations in percentage points. Sales Oil products sales in the domestic market in 1Q26 were 1.5% lower than 4Q25, consistent with seasonality at the beginning of the year, since the fourth quarter concentrates higher demand levels. For diesel, demand tends to be lower in the first quarter due to lower economic activity, which contributed to a significant reduction in sales, with a decline of 6.1%. Additionally, an increase was observed in net imports carried out by third parties, which also impacted sales performance. Such factors were partially offset by the lower activity from REAM (Amazon Refinery). Similarly, gasoline sales decreased 4.0%. This result is related to the higher seasonal demand observed in the last quarter of the year, boosted by higher vehicle circulation during year-end holidays and the impact of the 13th salary in the economy. Seasonal factors were also decisive for the decline of 2.8% in LPG sales compared to the previous quarter. Historically, in the first quarter the average temperatures in the main consumer centers of the country are higher, in addition to the activity of the transformation industry being lower. In the case of fuel oil, sales volume declined 13.0%. This reduction reflects lower deliveries to the industrial segment, a typical pattern for the first quarter, partially offset by higher sales to the maritime segment during the cruise season. On the other hand, jet fuel sales in 1Q26 exceeded those of 4Q25 by 3.3%, driven by the school holiday period, by the carnival festivities and by the increase in international flights. Naphtha sales advanced 63.0%, supported by increased production at the São Paulo refineries and REFAP, in line with the market. 12 Operating Results Production Production of oil products in 1Q26 was 1,816 Mbpd, showing the high availability of the refining system, which recorded 95% utilization factor in the period. Diesel production in 1Q26 was 7.4% higher compared to 4Q25, and March's performance was the highlight. During this period, Petrobras significantly increased the utilization factor of refineries seeking to maximize diesel production, in response to the volatility in the global scenario. We recorded a monthly refining production record for Diesel S10 in March, reaching 512 Mbpd, and the highlights were REPLAN (139 Mbpd) and RNEST (78 Mbpd). Gasoline production in 1Q26 remained in line with the previous quarter. Naphtha production was 30.3% higher than 4Q25, in line with the market. Jet fuel production in 1Q26 was 21.8% higher compared to 4Q25, reflecting the recovery of the typical operational level. 4Q25 results were impacted by the scheduled shutdown at REVAP, the largest jet fuel producer in the system. Fuel oil and LPG production in 1Q26 increased by 10.9% and 3.5%, respectively, compared to 4Q25, driven by March's performance. We recorded a monthly production record for fuel oil in January at REFAP (53.6 thousand tons). The quarterly result reflects the high utilization factor of the refineries, which naturally increases the production of these oil products. UFN III Resumption: the Board of Directors recently approved the resumption of the construction of Nitrogen Fertilizer Unit III, in Três Lagoas (MS), following a thorough reassessment that confirmed the technical and economic feasibility of the project. Commercial operation is scheduled for 2029 and its strategic location, close to the main consumer markets in the Center-West, South and Southeast regions, is a relevant competitive differential. SAF (Sustainable Aviation Fuel): in 1Q26 we supplied 6 thousand m³ of fuel, commercially launched by Petrobras in December 2025. The result reflects our ability to anticipate trends and meet new market demands. Highlights RTM 13 Operating Results Produção A produção de gasolina no 1T26 ficou alinhada com a produção do trimestre anterior. Já a produção de nafta foi 30,3% maior que a do 4T25, acompanhando o desempenho de mercado. A produção de QAV no 1T26 foi 21,8% maior em comparação ao 4T25, refletindo a retomada do patamar operacional típico. O resultado do 4T25 foi impactado pela parada programada da REVAP, a maior produtora de QAV do sistema. As produções de óleo combustível e GLP no 1T26 cresceram 10,9% e 3,5%, respectivamente, em relação ao 4T25, impulsionadas pelo desempenho de março. Registramos recorde mensal de produção de óleo combustível em janeiro na REFAP (53,6 mil ton). O resultado trimestral reflete o alto fator de utilização das refinarias, o que naturalmente amplia a produção desses derivados. In 1Q26, we recorded significant results in our logistics structure, which showcases our commitment to efficiency, reliability and operational integration. We have reached the milestone of 1,500 ship-to-ship (STS) operations at the Angra dos Reis Terminal, the first terminal in Brazil to use this type of operation. São Paulo also stood out with the largest volume of pipeline throughput of heavier oil products (fuel oil and bunker), totaling 970 thousand m³ in Jan/26, which represented an increase of 4.5% compared to the previous record of 929 thousand m³/month in Aug 25. Another key milestone was setting new production and throughput records for fuel oil at REFAP, which produced 53.6 thousand tons in Jan/26, as a result of processing heavier crude oil. In the same period, the road transportation of fuel oil via the REFAP/BANOAS route reached 51.5 thousand tons, showing the logistics alignment to optimize operational results. Logistics initiatives to reduce restrictions and increase the fuel oil outflow capacity of REFAP have been enabling increased processing of domestic crude oil, replacing light imported crude oils. REGAP also set a new record in road transportation of fuel oil to Santos, with 22.9 thousand tons in Jan/26, contributing to adequate level of inventory, full regional market coverage and optimal refinery utilization factor. Other relevant logistics projects also made significant progress in the period. An example is the signing of the contract for the construction of new pipelines OCERJ 20" and 26", which will be essential for the integration of the Boaventura Energies Complex with REDUC, increasing the efficiency of flow between units. Additionally, an unprecedented operation was carried out for the export of natural gasoline (C5+) from the Barra do Riacho Terminal, marking the beginning of a new logistics route and optimizing the supply chain for the international market. In the maritime segment, we did the first offloading of P-78 and the inaugural Cargo Transfer Vessel (CTV) offloading at FPSO Marechal Duque de Caxias. Another important advancement was the record road transport of VLSFO (Very Low Sulfur Fuel Oil) from REPAR to serve the Paranaguá market. These achievements are the result of coordinated actions to eliminate logistics bottlenecks, improving infrastructure and integrating processes, which increase value for the company and ensures efficient supply to the market. Logistics 14 Operating Results Gas and Low Carbon Energies Variação (%) 1T26 4T25 1T25 1T26 X 4T25 1T26 X 1T25 Natural Gas (MM m³/day) Sales volume of natural gas 46 45 40 2.2 15.0 Natural Gas Supply National gas delivery 39 36 29 8.3 34.5 Regasification of liquefied natural gas − 1 1 − − Import of natural gas from Bolivia 7 9 11 (22.2) (36.4) Power (average MW) (1) Capacity obligation awarded in the capacity reserve auction (MW) (2) 1,120 1,120 − 0.0 − Sale of thermal availability at auction 568 705 714 (19.4) (20.4) Sale of electricity 1,207 832 606 45.1 99.2 (1) For the current period, the figures for the Energy segment are subject to possible changes once the final report from the Electricity (2) Effective as of Aug/25, according to the 1st Capacity Reserve Auction held in 2021. In 1Q26, natural gas sales increased by 2.2% compared to 4Q25, mainly due to the supply of natural gas to fertilizer plants following the start-up of units in Bahia and Sergipe. On the supply side, domestic gas deliveries increased due to the lower scheduled and unscheduled maintenance stoppages in 1Q26 when compared to 4Q25, which contributed to the reduction in gas imports from Bolivia and LNG. There was a reduction in the volume of thermal power availability at auction in 1Q26 due to the expiration of the Macaé thermoelectric plant contract, partially offset by the start of operations of the second product from the Cubatão thermoelectric plant under the scope of the Energy Auction held in 2021. Electrical energy sales increased 45.1% compared to 4Q25, mainly to optimize the allocation of the natural gas supply portfolio and meet steam demand from third parties. 15 Operating Results "The positive result of the company's participation in the 2026 LRCAP demonstrates the competitiveness of Petrobras' assets and reinforces its commitment to the country's energy security, the just energy transition and value generation for its shareholders, while the company continues to evaluate its participation strategies in future auctions.” Willian França, Chief Industrial Processes and Products Officer and Interim Chief Energy Transition and Sustainability Officer Petrobras contracted nine plants from its thermoelectric facilities in the Capacity Reserve Auction – LRCAP of 2026, totaling approximately 2.6 GW of firm power for the National Interconnected System (SIN), starting in the period from 2026 to 2031. The auction result reflects the technical and operational competitiveness of our thermoelectric plants, as well as their ability to guarantee availability to the SIN, reinforcing the company's commitment to supply electrical demand, in service to the population. G&LCE Highlight 16 Operating Results Atmospheric Emissions The monitoring of greenhouse gas (GHG) emission metrics encourages the adoption of practices and the development of projects aimed at reducing these gas emissions by the company and maximizing value generation considering the risks and opportunities associated with a just energy transition to a low-carbon economy. GHG Emissions O&G (million tons of CO2e): 1T25: 11,3 1T26: 12,3 Operational GHG Emissions from Oil and Gas Activities The GHG – O&G indicator measures the operational emissions from oil and gas activities alone, without including emissions from operations in the thermoelectricity market. GHG – O&G emissions in 1Q26 were 12.3 million tons, 1 million tons above 1Q25. The increase is due to higher oil and gas production from the E&P, including the start-up of new units such as P-78 platform, in addition to the increase in refinery throughput for oil products production. Greenhouse Gas Emission Intensity (GHGI) 2025 1Q26 E&P GHGI (kgCO2e/boe produced) 14.7 14.7 Refining GHGI (kgCO2e/CWT) 36.7 37.4 Methane Emissions Intensity (tCH4/thousand tHC) 0.23 0.24 E&P The E&P GHGI performance was 14.7 kgCO2e/boe, a stable level compared to 2025. Refining The 1Q26 result showed an increase of 0.7 kg CO2e/CWT compared to 2025. This increase of approximately 1.9% was mainly caused by improvements in the indicator calculation methodology. Methane Emissions Intensity Methane has a specific metric due to its significantly high global warming potential in the short term. 17 Operating Results In 1Q26, the indicator showed a slight increase of 0.01 tCH₄/thousand tHC compared to 2025, caused by the commissioning of P-78 unit in Búzios field. The project was carried out using resources from Petrobras' Decarbonization Fund and, with its operation, the refinery will avoid the emission of approximately 8,000 tons of CO₂e annually. Approximately 20,000 photovoltaic panels were installed to generate 13.3 thousand kW of renewable energy in order to replace part of the electricity generated from fossil fuels consumed by the refinery. REGAP started-up the first photovoltaic plant in the refining system 18 Exhibits Exhibits EXHIBIT I - CONSOLIDATED SALES VOLUME Variation (%) Sales volume (Mbpd) 1Q26 4Q25 1Q25 1Q26 X 4Q25 1Q26 X 1Q25 Diesel 738 787 734 (6.2) 0.5 Gasoline 413 430 398 (4.0) 3.8 Jet Fuel 126 122 115 3.3 9.6 Naphtha 88 54 62 63.0 41.9 Fuel oil 20 23 21 (13.0) (4.8) LPG 206 212 205 (2.8) 0.5 Others 152 143 161 6.3 (5.6) Oil products 1,743 1,771 1,696 (1.6) 2.8 Renewable, nitrogenous and others 15 8 6 87.5 150.0 Petroleum 138 140 202 (1.4) (31.7) Natural gas 166 196 169 (15.3) (1.8) Total domestic market 2,062 2,115 2,073 (2.5) (0.5) Exports of petroleum, oil products and others 1,122 1,236 765 (9.2) 46.7 Sales abroad 33 22 23 50.0 43.5 Total external market 1,155 1,258 788 (8.2) 46.6 Grand total 3,217 3,373 2,861 (4.6) 12.4 19 Exhibits EXHIBIT II - NET IMPORTS AND EXPORTS Variation (%) Thousand barrels per day (Mbpd) 1Q26 4Q25 1Q25 1Q26 X 4Q25 1Q26 X 1Q25 Net export (import) 852 841 490 1.3 73.9 Import 268 395 270 (32.2) (0.7) Petroleum 157 127 131 23.6 19.8 Diesel 49 150 66 (67.3) (25.8) Gasoline − 46 4 − − Naphtha − − − − − GLP 26 40 53 (35.0) (50.9) Other oil products 36 32 16 12.5 125.0 Export 1,120 1,236 760 (9.4) 47.4 Petroleum 888 999 551 (11.1) 61.2 Fuel oil 187 181 162 3.3 15.4 Other oil products 45 56 47 (19.6) (4.3) Net exports increased by 1.3% in 1Q26 compared to 4Q25, mainly due to lower imports of diesel, gasoline, and LPG, driven by increased production resulting from higher utilization of refining capacity, as well as lower domestic sales due to seasonal reasons. Conversely, there was a decline in crude oil exports, which partially offset the effects of lower imports, reflecting, in part, the increase in production of oil products, besides undergoing exports at the end of the quarter, which, consequently, were not accrued in 1Q26. 20 Exhibits EXHIBIT III - OIL EXPORTS Country 1Q26 4Q25 1Q25 (1) China 62% 52% 33% India 15% 12% 14% Asia 8% 10% 28% Europe 8% 13% 19% Latam 5% 8% 2% Caribe 1% 0% 2% USA 0% 3% 3% South Africa 0% 2% 0% (1) Restatement of the previously disclosed 1Q25 figures due to discrepancies identified in the conversion of volumes. Currently, China is the world's largest importer of seaborne oil and it is the destination with the greatest capacity to absorb additional volumes of medium crude oil. With the increase in total exports since 1Q25, China's share as a destination for oil exports has become even more relevant, at the expense of other destinations, as it enabled the delivery of larger volumes while keeping the competitiveness of Petrobras' export basket. In addition, there was significant growth in exports to India between 1Q25 and 1Q26. We highlight the absolute increase in volume of approximately +56 Mbpd, in a scenario of growth in Petrobras’ total export volume. India, currently the world’s second-largest importer of seaborne crude oil, has established itself as a strategic market. In this context, Petrobras intensified its commercial efforts, renewing contracts with the state-owned companies Bharat Petroleum Corporation (BPCL) and Hindustan Petroleum Corporation (HPCL), as well as signing new contracts with Indian Oil Corporation (IOC) and Mangalore Refinery and Petrochemicals (MRPL), thereby strengthening its presence and competitiveness in that market. EXHIBIT IV - OIL PRODUCTS EXPORTS Country 1Q26 4Q25 1Q25 (1) Singapore 56% 57% 53% USA 27% 14% 29% Others 17% 29% 18% (1) Restatement of the previously disclosed 1Q25 figures due to discrepancies identified in the conversion of volumes. Glossary Glossary A ANEEL: The Agência Nacional de Energia Elétrica (Brazilian Electricity Regulatory Agency). Associated Gas Utilization Index (IUGA): percentage of the volume of associated gas used in relation to the total volume of associated gas produced. C Capacity Obligation Awarded in the Capacity Reserve Auction (MW): power availability that the generating agent undertakes to maintain available for the electrical system, with flexibility, ensuring the reliability of supply at times of peak demand. In Capacity Reserve Contracts in the form of power, the generating agent receives a fixed portion, associated with the contracted power availability, and a variable portion associated with the dispatch by the National System Operator (ONS). The energy associated with the generation will be the agent's resource and freely traded. CCS: Carbon capture and storage CCUS: Carbon capture, utilization and storage D Diesel-R: is an S-10 diesel with renewable content, an advanced biofuel. Diesel-R is produced from coprocessing of conventional diesel and vegetable oils using our proprietary HBIO™ technology. The renewable part of the resulting fuel (Hydrotreated Vegetable Oil or “HVO”) has the same structure as conventional diesel oil and reduces greenhouse gas emissions when compared to mineral diesel oil. Diesel S-10: is a medium oil product with a low sulphur content (10 ppm) used as fuel in vehicles with compression-ignites internal combustion engines (diesel cycle engines). E Exploration & Production (E&P): The segment covers the exploration, development and production of crude oil, NGL and natural gas in Brazil and overseas, mainly aiming to supply our domestic refineries. This segment also operates through joint ventures with other companies, including interests in foreign companies. F Fresh processed feedstock: the volume of oil processed in the distillation units, consisting of oil and C5+. FGRU: Flare Gas Recovery Unit (FGRU). It allows this gas to be returned for processing in the unit, avoiding its burning and the consequent emission of greenhouse gases. Glossary G Gas & Low Carbon Energy (G&LCE): The segment covers the logistics and commercialization of natural gas and electricity, the transportation and commercialization of LNG, the generation of electricity through thermoelectric plants, as well as the processing of natural gas. It also includes renewable energy businesses, low carbon services (carbon capture, utilization and storage) and the production of biodiesel and its products. GHG Emissions Intensity in E&P: GHG emissions, in terms of CO₂e, from E&P activities in relation to the total operated oil and gas production (wellhead) recorded in the same period. Scope 1 and 2 GHG emissions are considered. This indicator represents the rate of greenhouse gas emissions per unit of barrel of oil equivalent produced and is used to analyze the carbon performance of the assets in our current and future portfolio. GHG Emissions Intensity in Refining: GHG emissions, in terms of CO₂e, from Refining activities in relation to the unit of activity called CWT (Complexity Weighted Tonne). The CWT represents a measure of activity, which takes into account both the effect of the load processed and the complexity of each refinery, allowing the potential for GHG emissions to be compared between refineries with different profiles and sizes. This indicator makes up the analysis of the carbon performance of the assets in our current and future portfolio. L LNG regasification: operational volume of LNG that has been regasified and made available by Petrobras to the market at the exit of the LNG terminals, converted to the reference PCS of 9400 kcal/m³. Volumes that have been transferred from methane ships to regasification ships but have not yet been regasified are not included in this measure. M Mboed: Thousand barrels of oil equivalent per day Mbpd: Thousand barrels per day Methane Emissions Intensity: The indicator uses the IOGP metric, which represents the ratio between methane emissions and total operated hydrocarbon production. N National gas delivery: operational volume of processed natural gas (dry), of national origin (onshore or offshore), made available by Petrobras to the market at the exit of the natural gas processing units, converted to the reference PCS of 9400 kcal/m³. It includes both gas from Petrobras' own production and gas purchased from partners. It does not include the volumes of gas belonging to agents who directly contract the processing service at the units. NGL: Natural Gas Liquids, the liquid resulting from the processing of natural gas and containing the heaviest gaseous hydrocarbons. NGL processed feedstock: the volume of NGL processed in refining units. Glossary R Reference feedstock: maximum sustainable feedstock of oil reached in the distillation units at the end of the period, respecting the design limits of the equipment and the requirements of safety, the environment and product quality. It is less than the capacity authorized by the ANP (including temporary authorizations) and environmental agencies. Refining, Transportation and Marketing (RTM): The segment covers refining, logistics, transportation, acquisition and export of crude oil, as well as trading in oil products in Brazil and abroad. This segment also includes petrochemical operations (involving interests in petrochemical companies in Brazil) and fertilizer production. S Sale of Capacity Reserve at Auction (MWavg): amount of power the generating agent undertakes to keep available to the electrical system, ensuring the reliability of supply at times of peak demand or supply restrictions. In Capacity Reserve Contracts of power, the agent receives a fixed portion, associated with the availability of the contracted power, and a variable remuneration, linked to the plant's energy generation costs when dispatched by the National System Operator (ONS). T Total commercial production: Production of oil, NGL and commercial natural gas (excluding the volume of natural gas reinjected and not marketed). Total distillation feedstock: the feedstock of distillation units, consisting of oil, C5+, residues and reprocessing, including terminals. Total operated production: Production from a gas or oil field, including Petrobras' interest and the interest of partners. Total production: Production of oil, NGL and natural gas (takes into account the volume of natural gas reinjected and not sold). Total utilization factor of the refining park: percentage utilization of the refining park in relation to its reference feedstock. It takes into account all the cargo in the distillation units, consisting of oil, C5+, residues, reprocessing, including terminals. Tupi Asset: includes the area of the Tupi Shared Reservoir and the Iracema Area. V VLSFO: Very Low Sulfur Fuel Oil. Glossary
SIGNATURES
Pursuant to the requirements of the Securities Exchange Act of 1934, the registrant has duly caused this report to be signed on its behalf by the undersigned, thereunto duly authorized.
Date: April 30, 2026
PETRÓLEO BRASILEIRO S.A–PETROBRAS
By: /s/ Fernando Sabbi Melgarejo
______________________________
Fernando Sabbi Melgarejo
Chief Financial Officer and Investor Relations Officer