UNITED STATES
SECURITIES AND EXCHANGE COMMISSION
Washington, D.C. 20549
FORM 6-K
Report of Foreign Private
Issuer
Pursuant to Rule 13a-16 or 15d-16 of the
Securities Exchange Act of 1934
For the month of May, 2026
Commission File Number 1-15106
PETRÓLEO BRASILEIRO S.A. – PETROBRAS
(Exact name of registrant as specified in its charter)
Brazilian Petroleum Corporation – PETROBRAS
(Translation of Registrant's name into English)
Avenida Henrique Valadares, 28 – 9th floor
20231-030 – Rio de Janeiro, RJ
Federative Republic of Brazil
(Address of principal executive office)
Indicate by check mark whether the registrant files or will file annual reports under cover Form 20-F or Form 40-F.
Form 20-F ___X___ Form 40-F _______
Indicate by check mark whether the registrant by furnishing the information contained in this Form is also thereby furnishing the information to the Commission pursuant to Rule 12g3-2(b) under the Securities Exchange Act of 1934.
Yes _______ No___X____
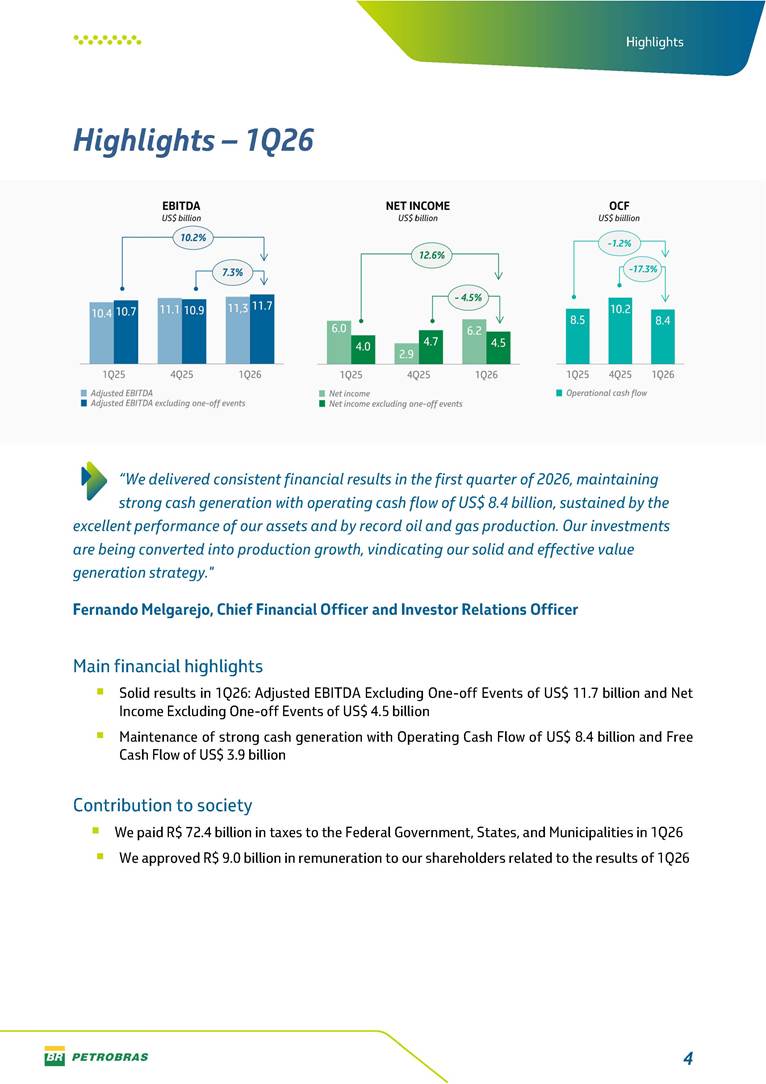
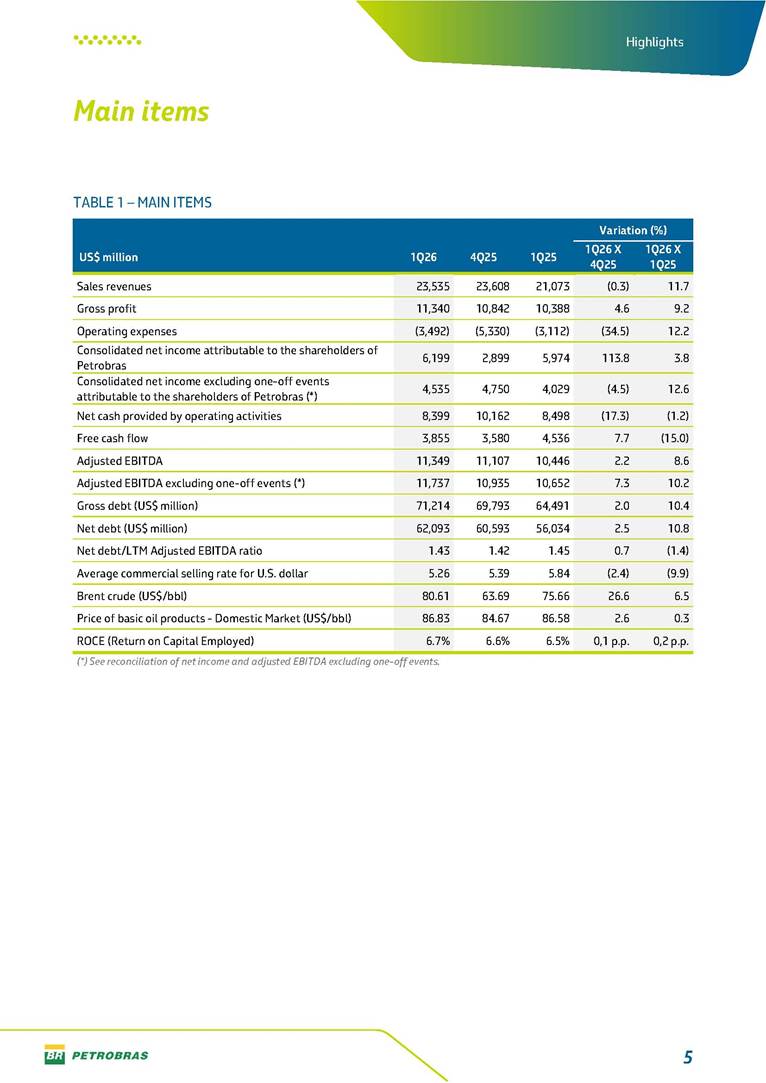
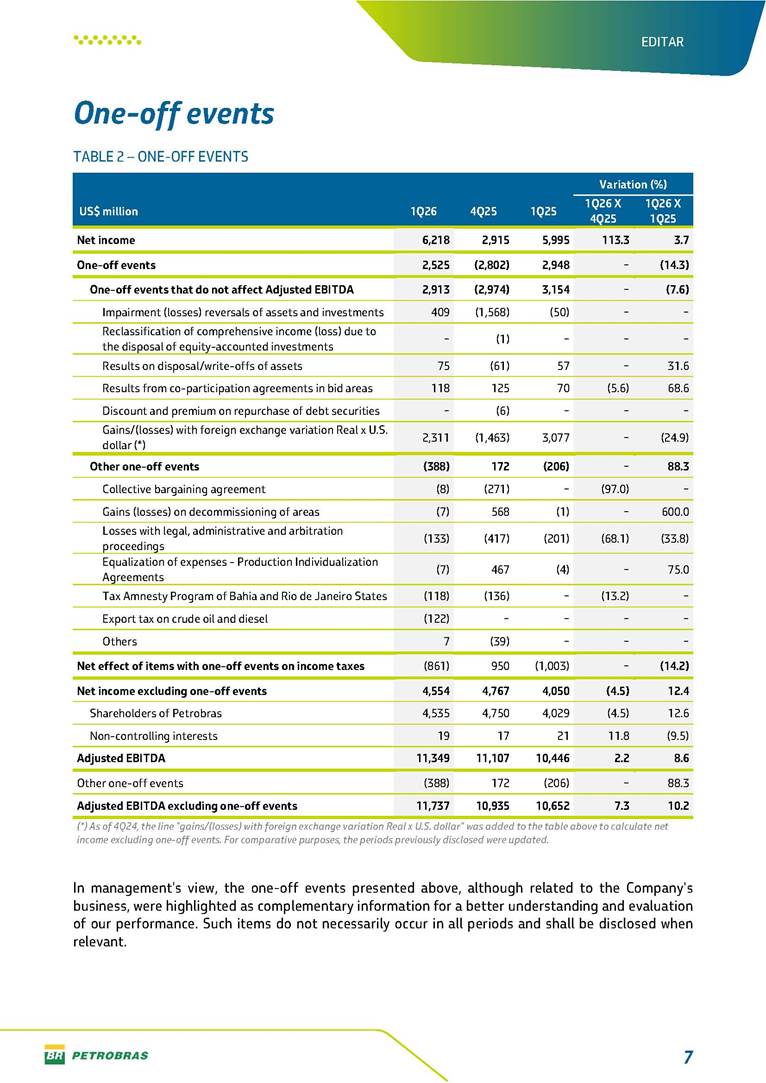
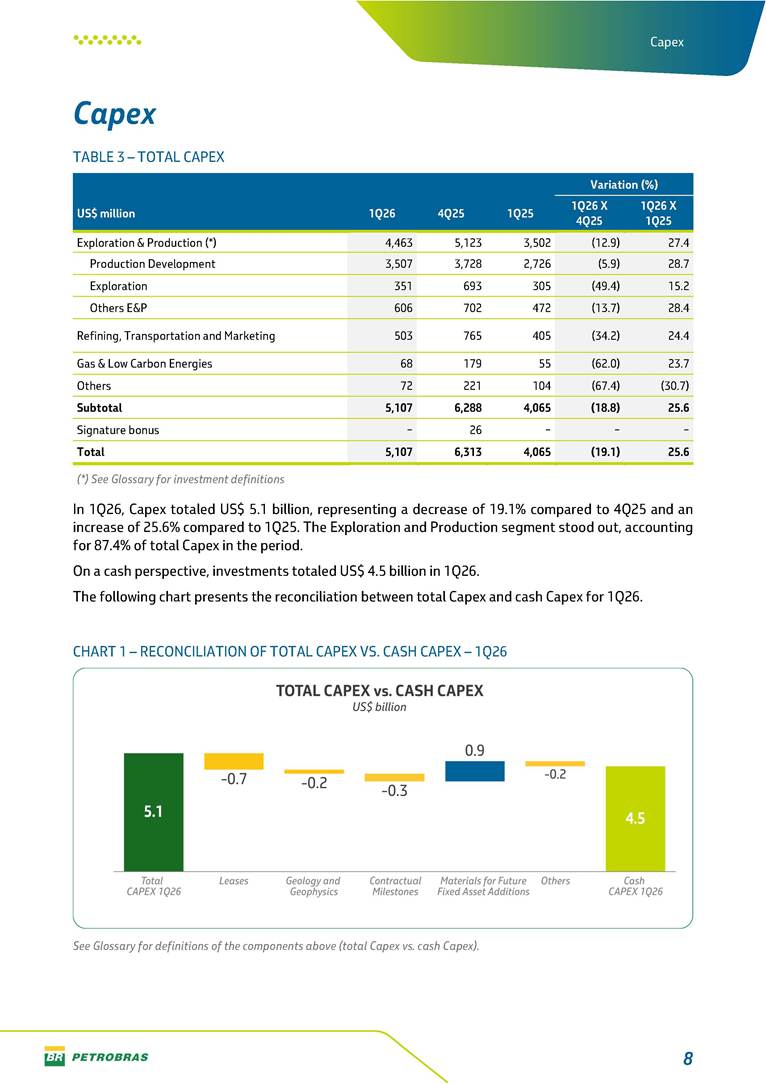
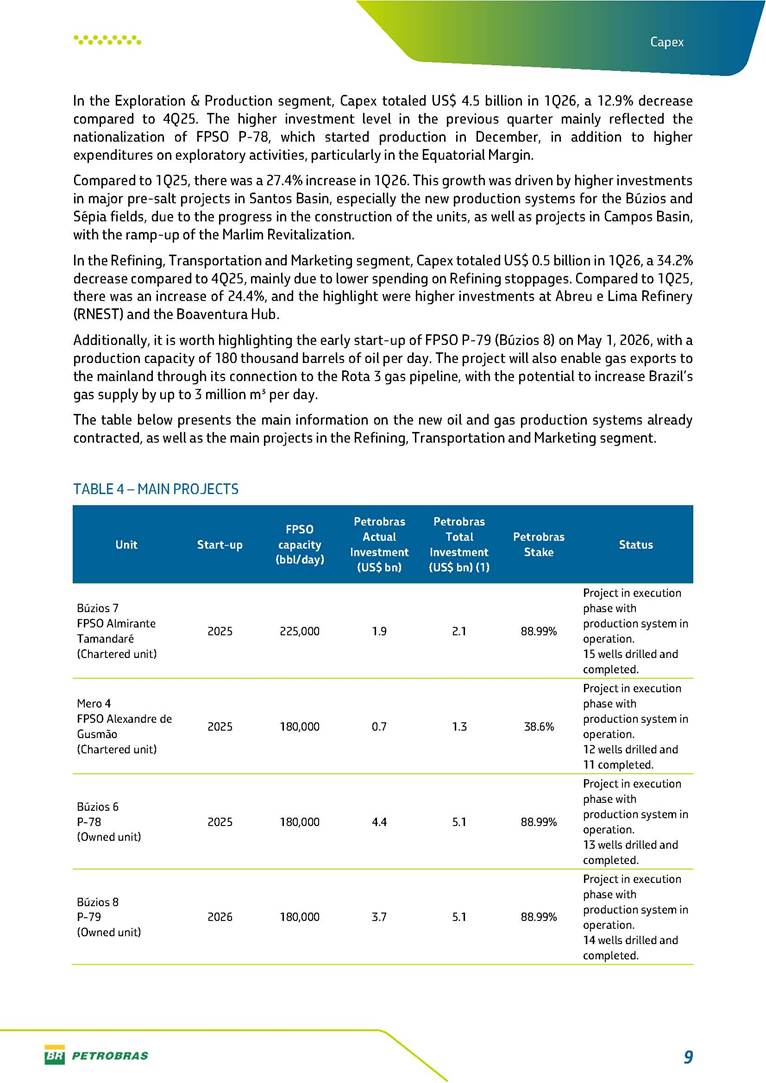
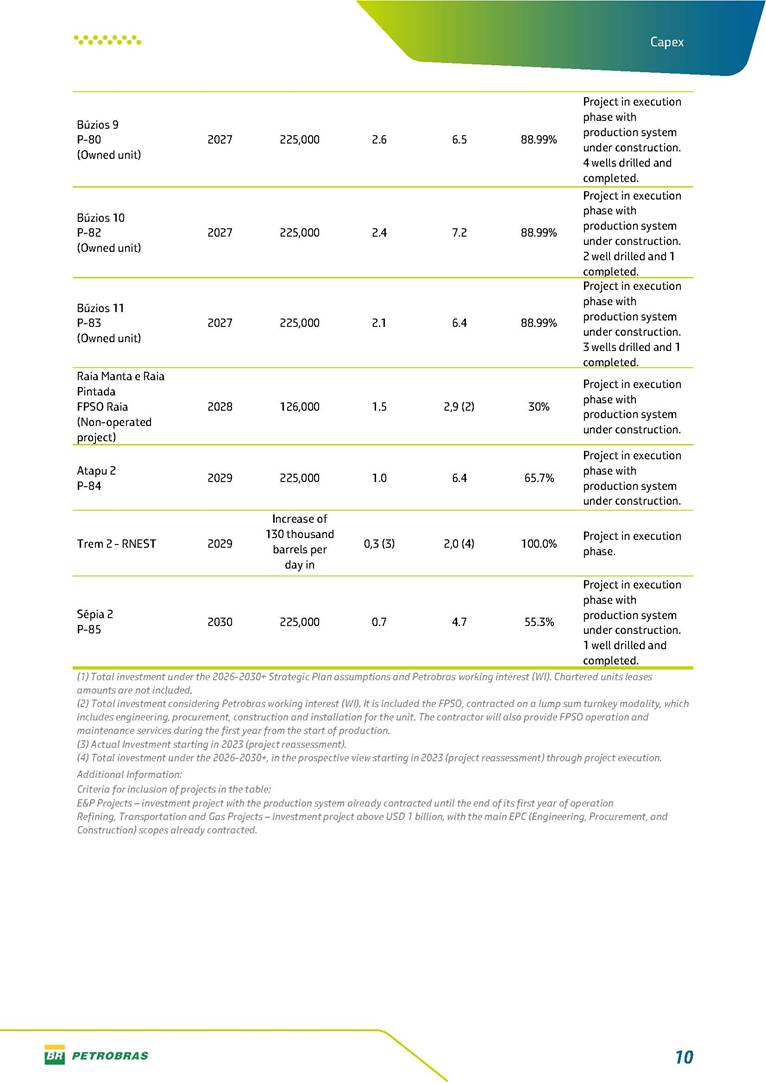
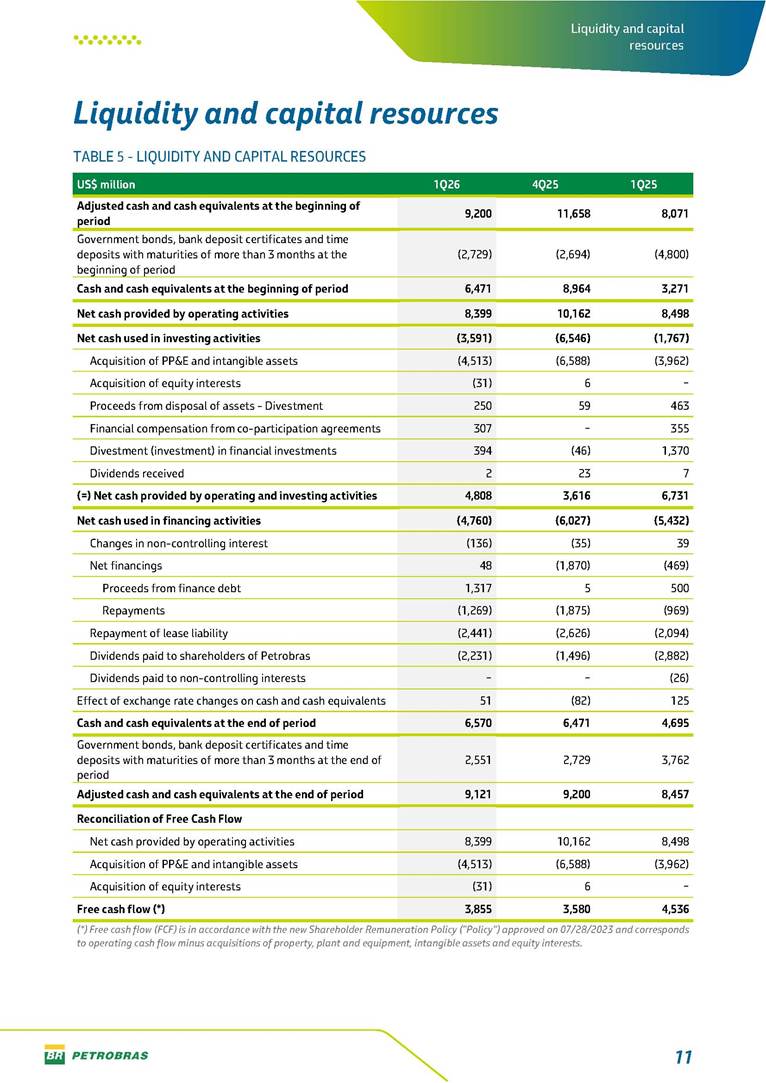
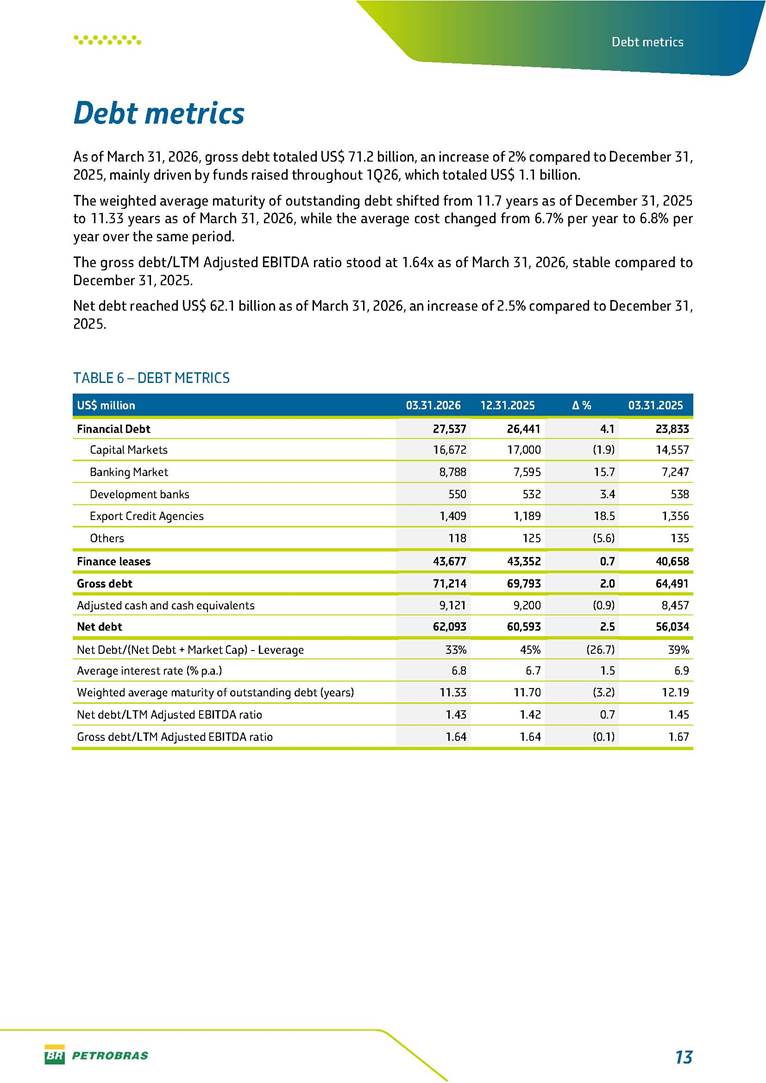
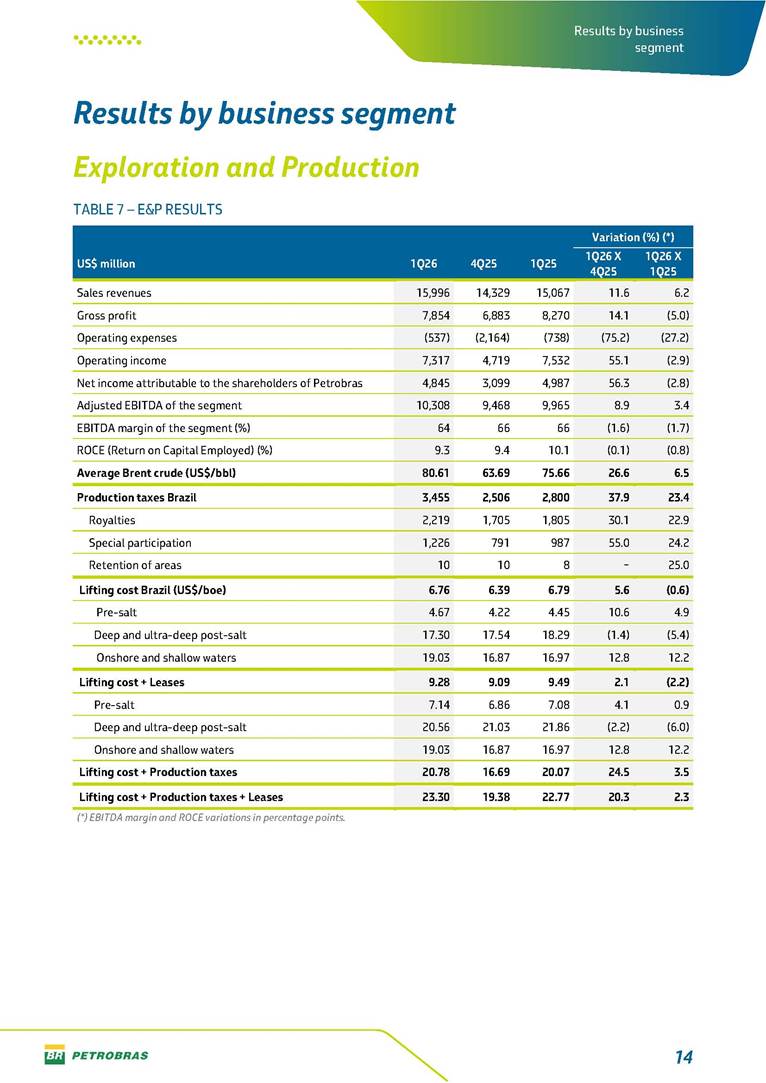
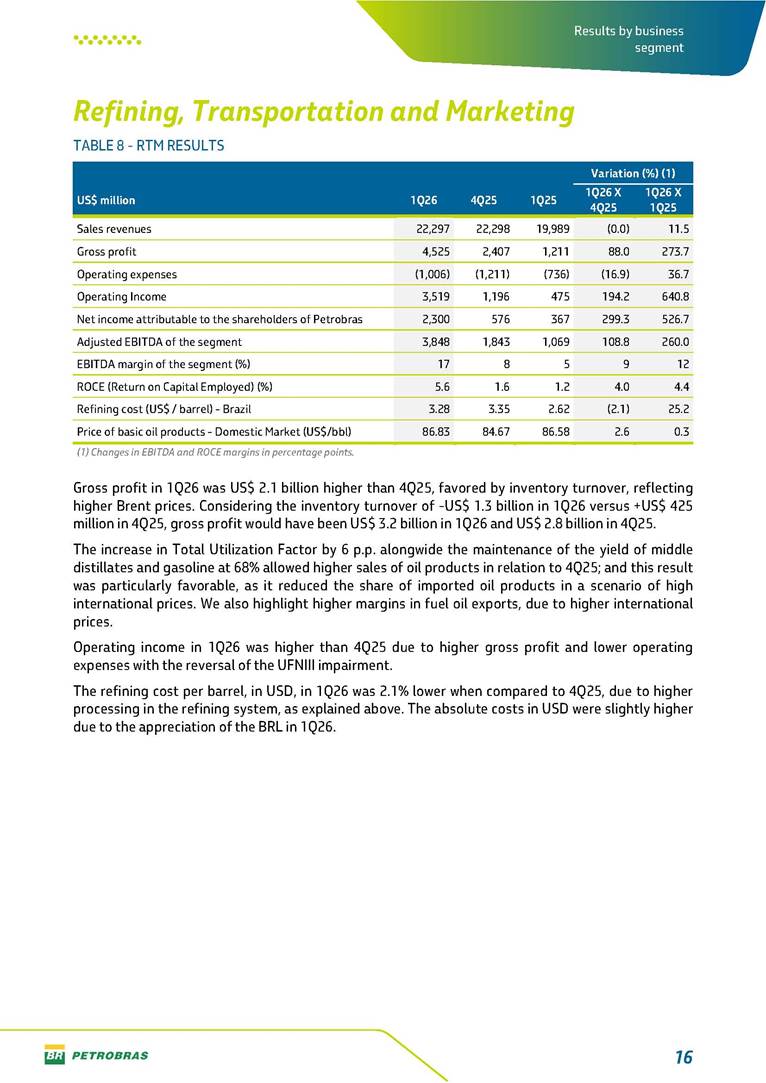
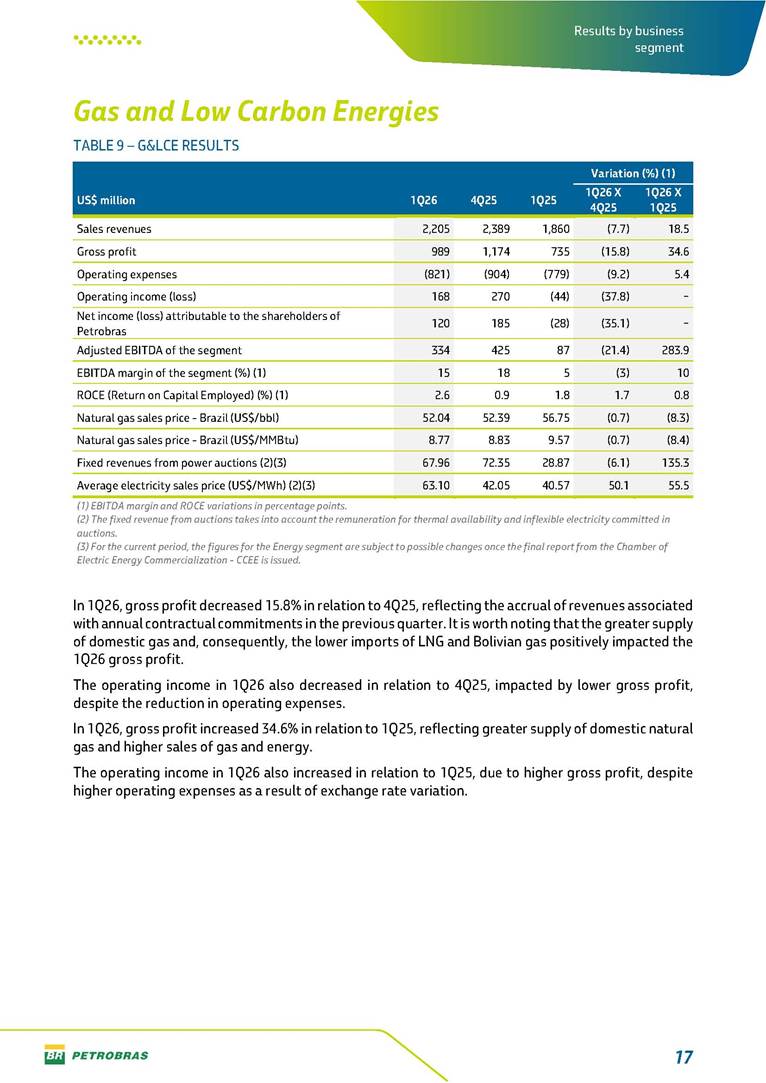
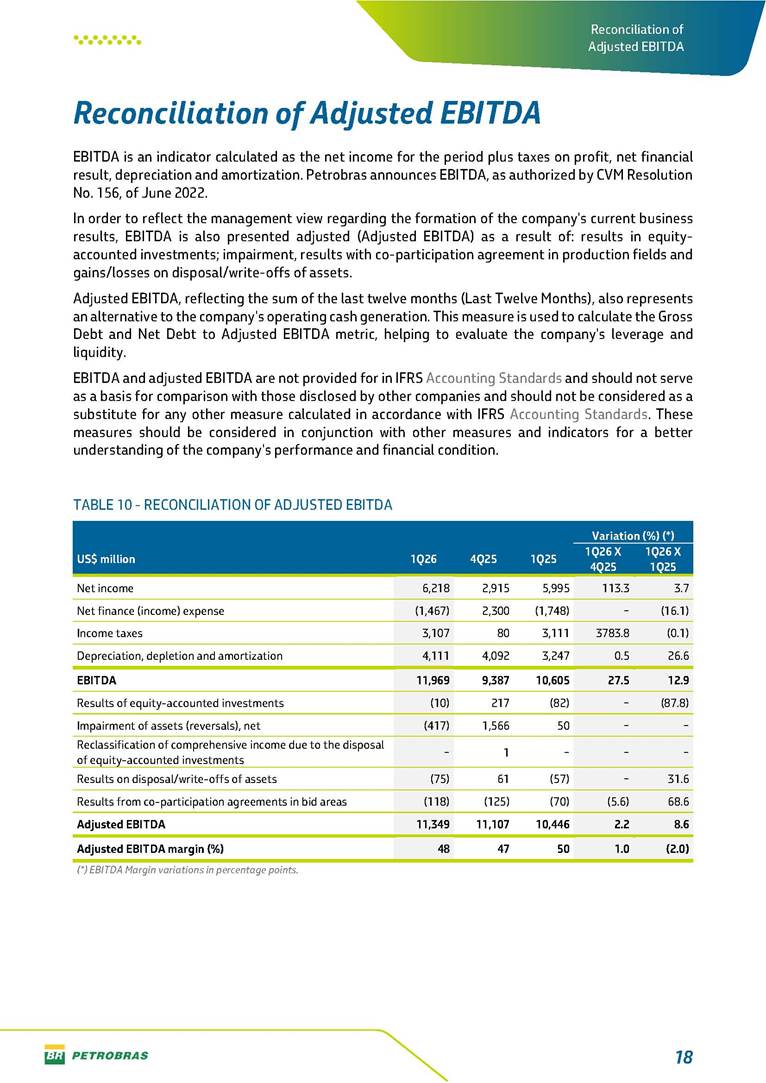
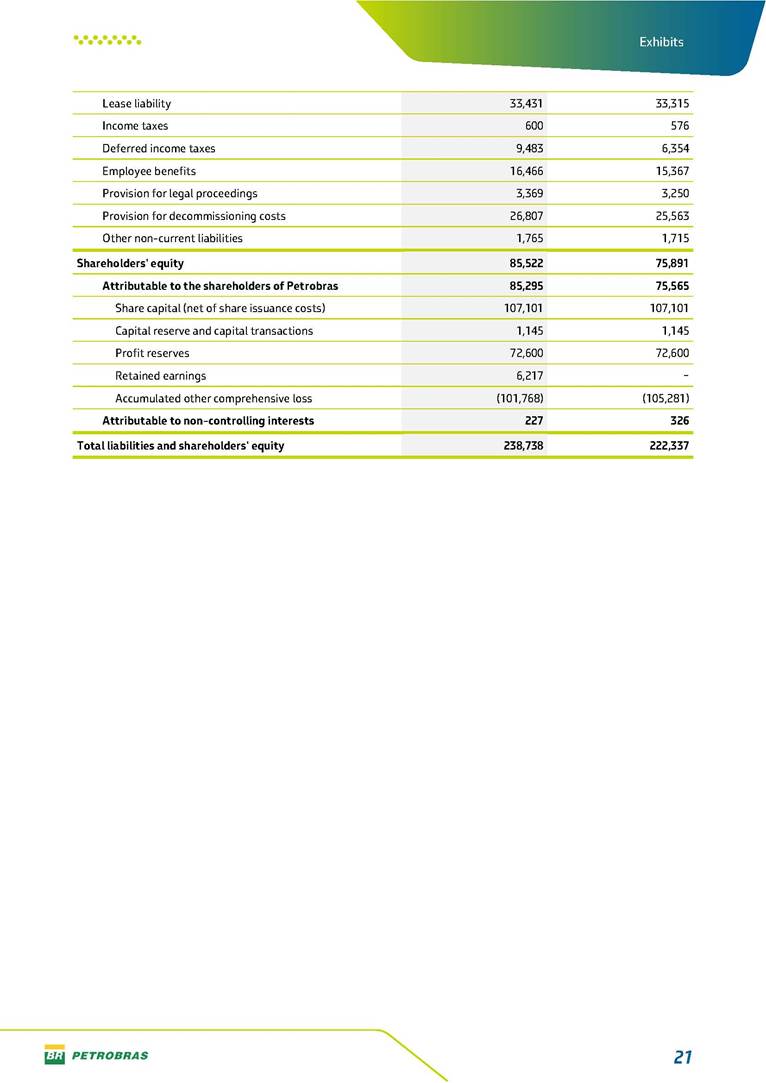
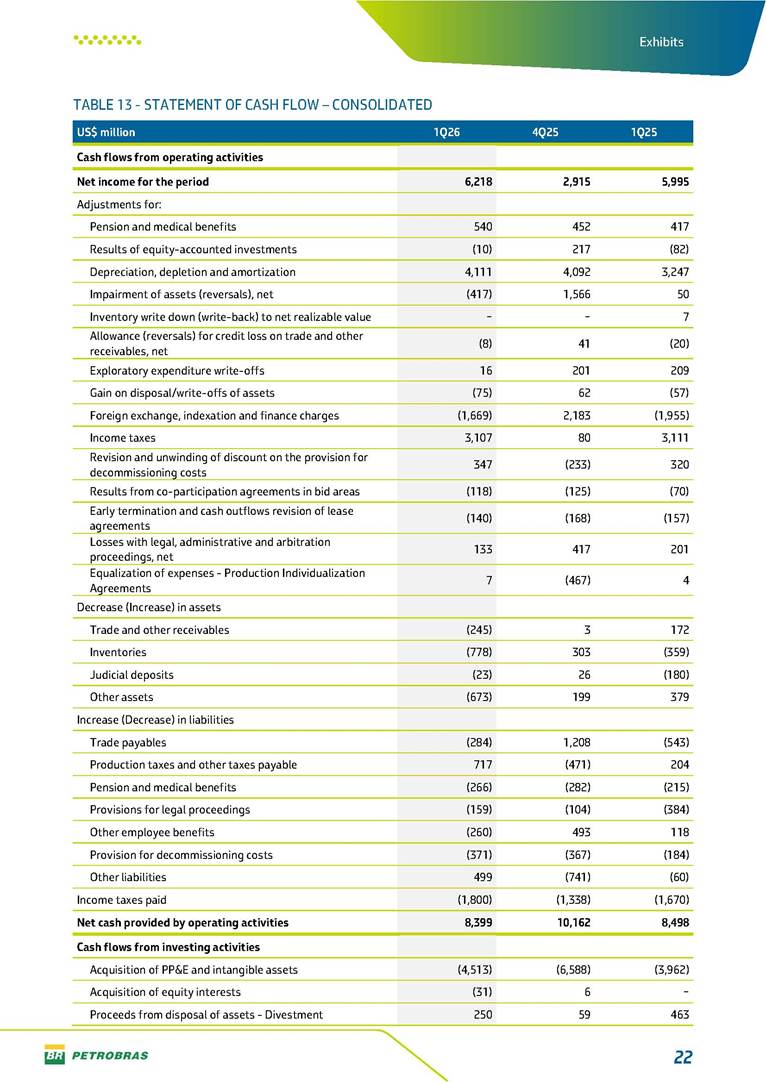
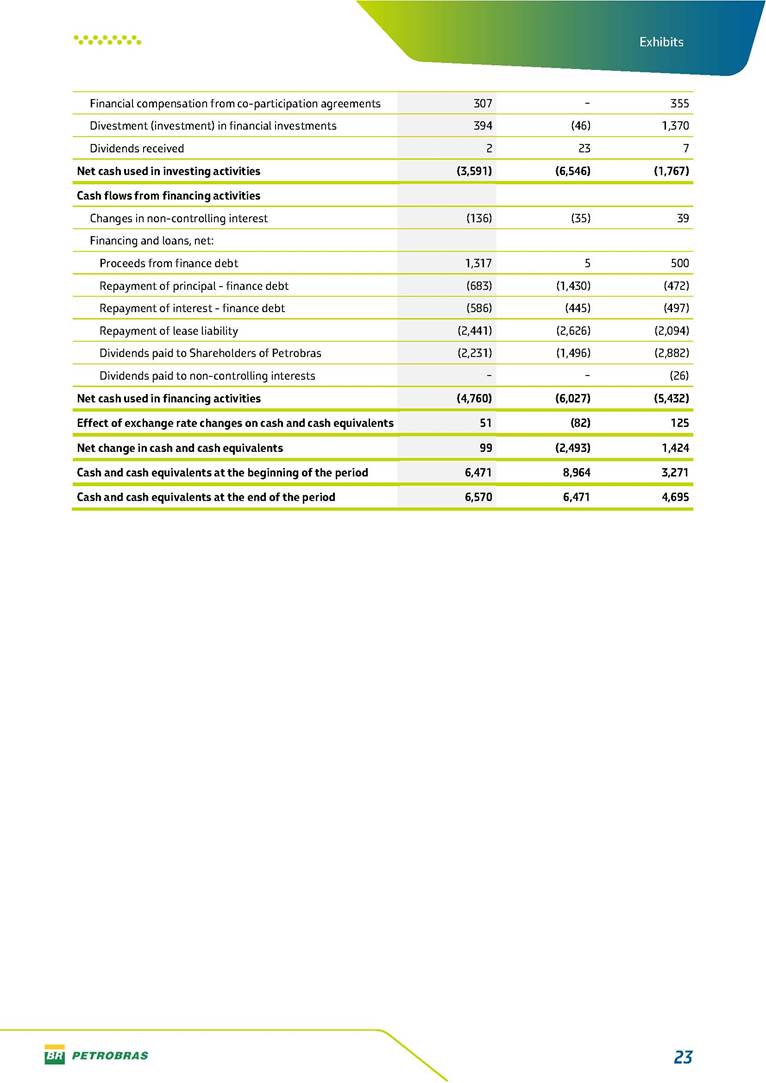
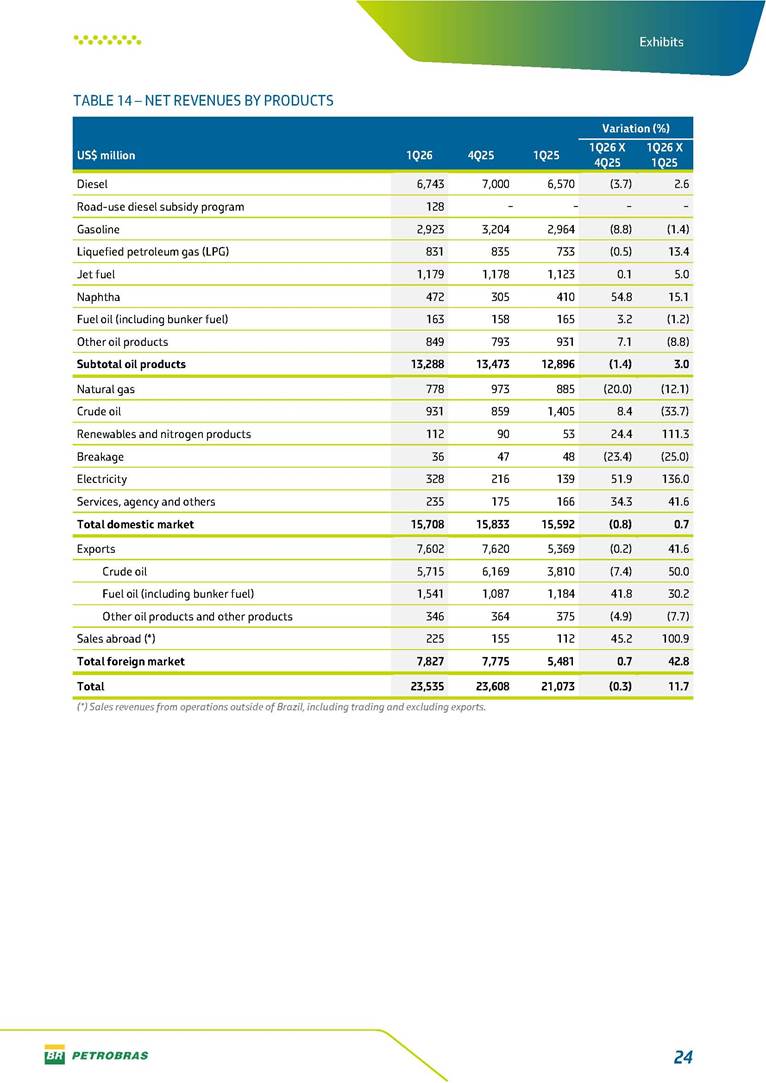
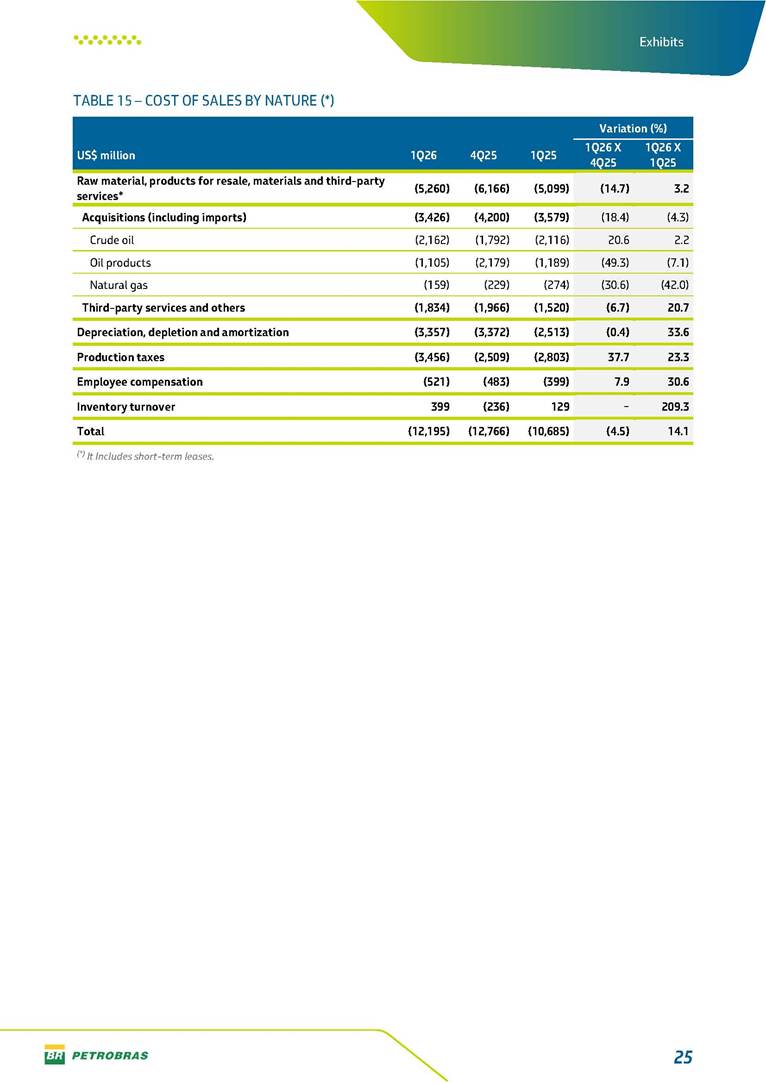
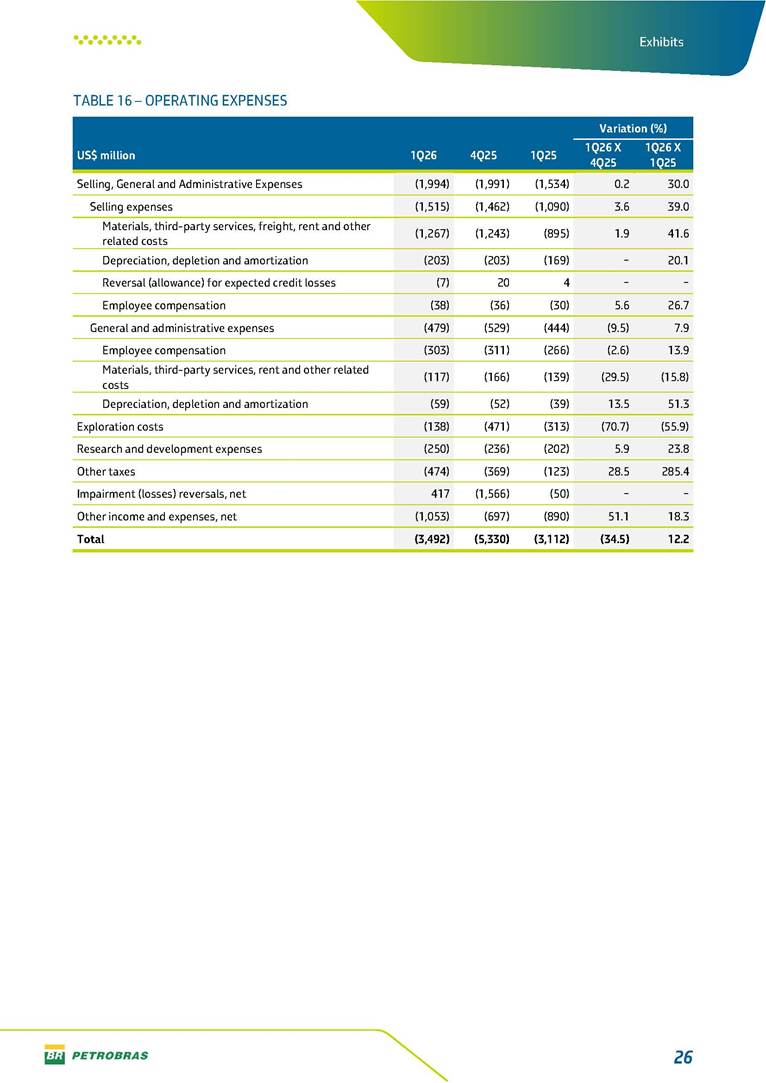
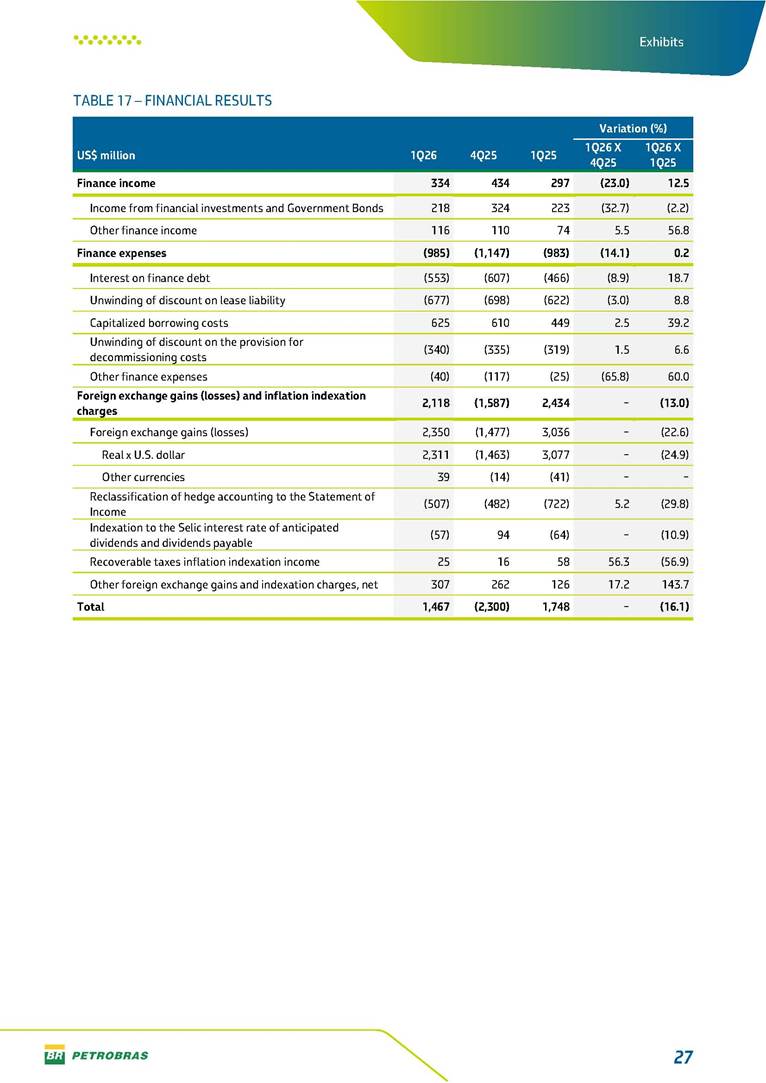
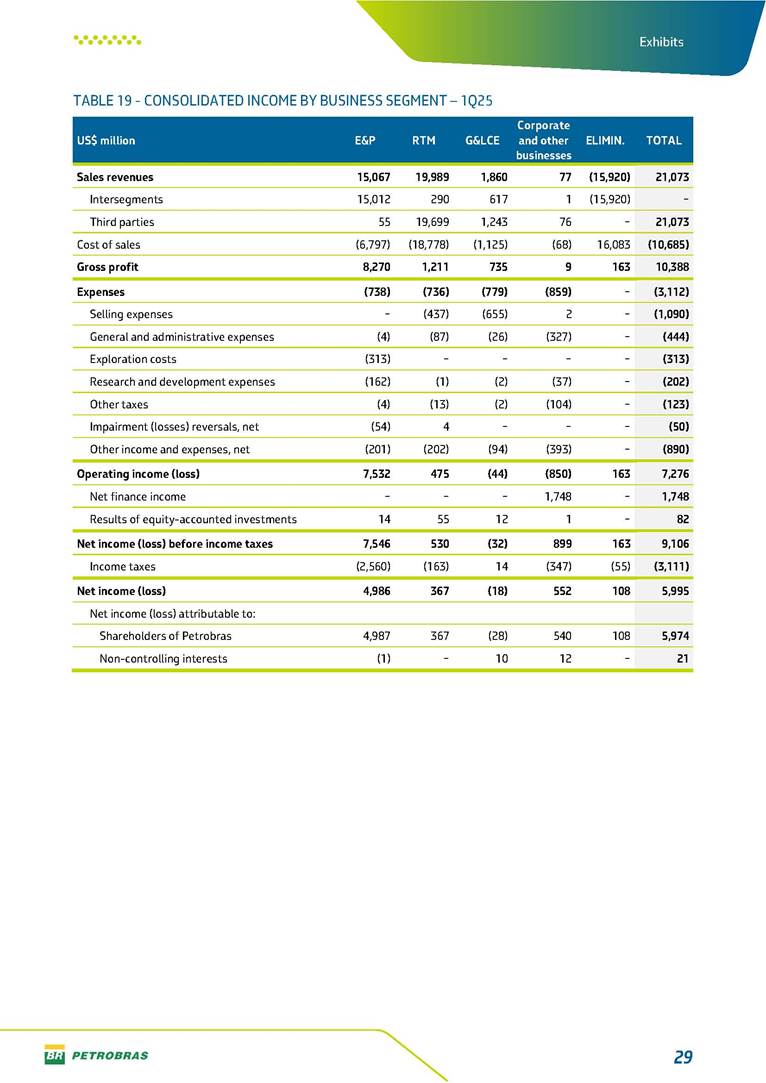
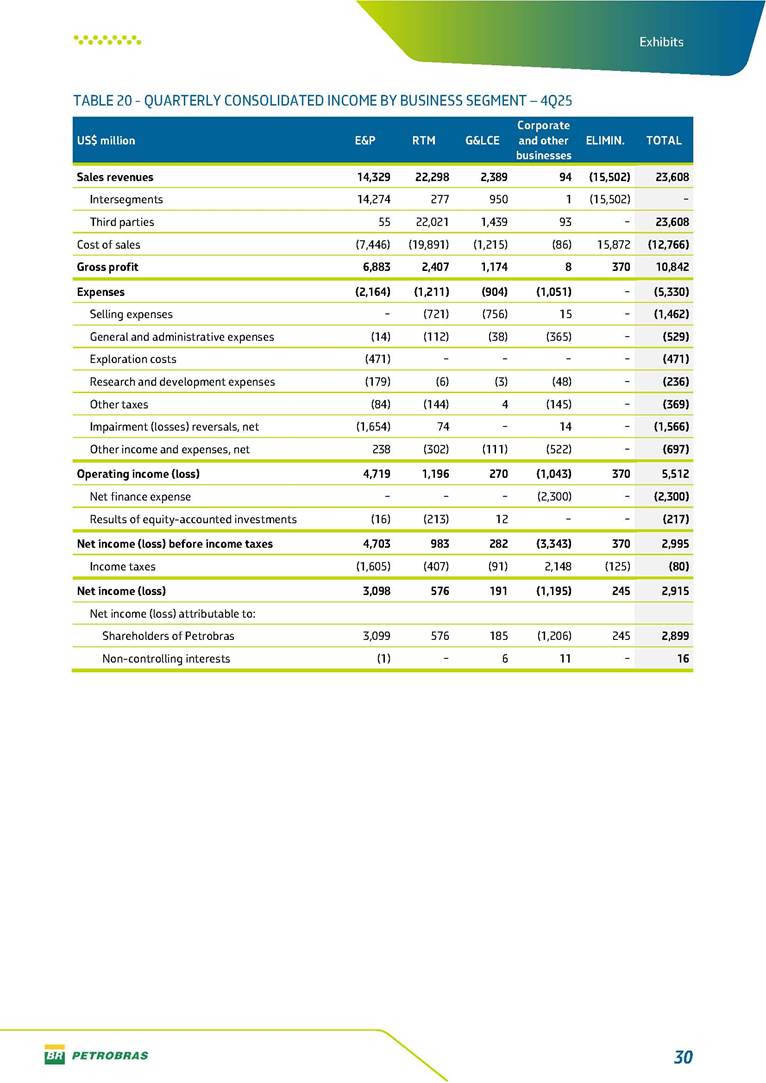
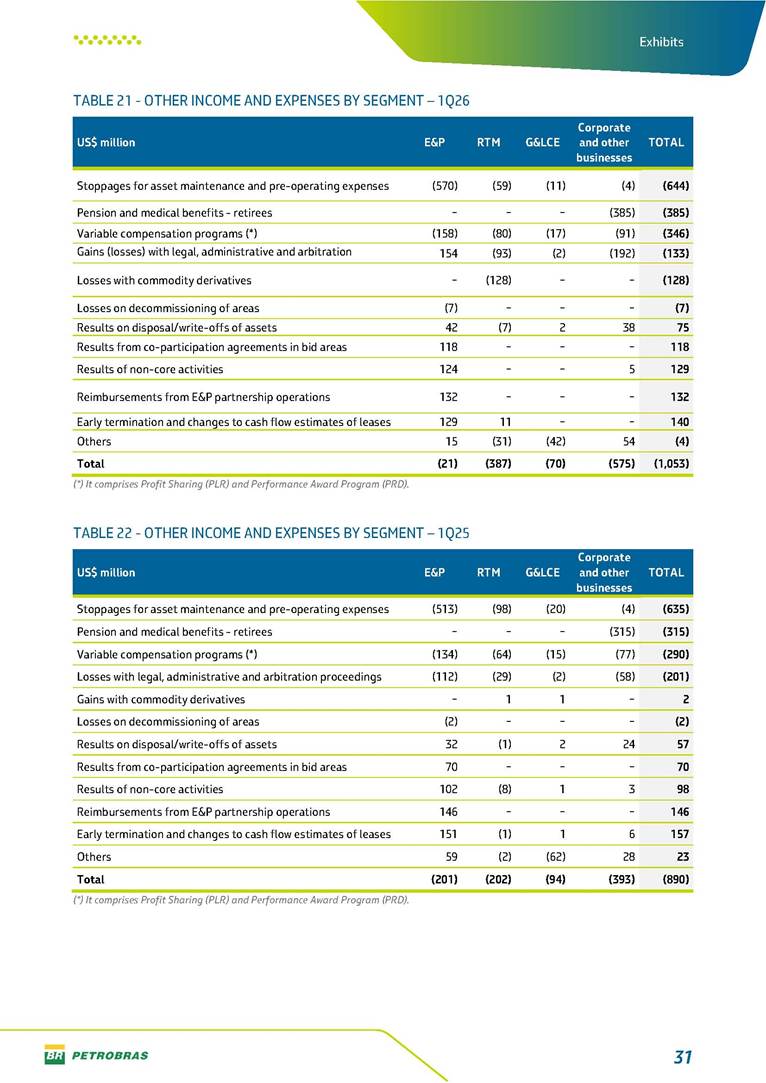
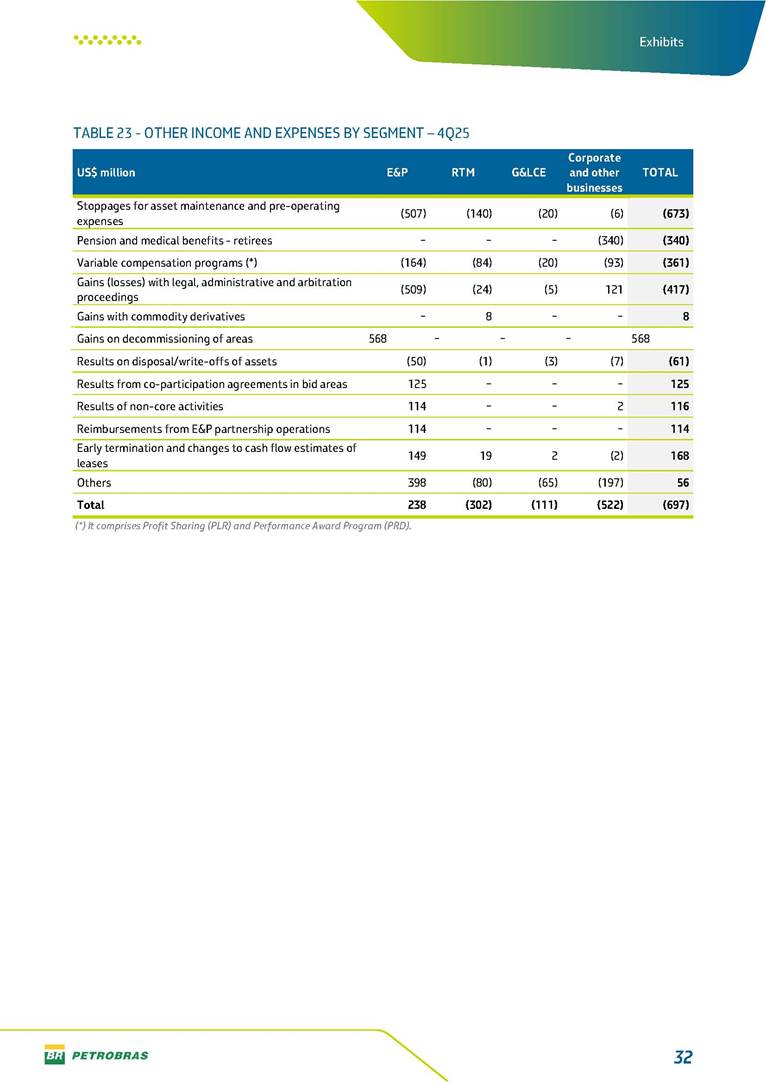
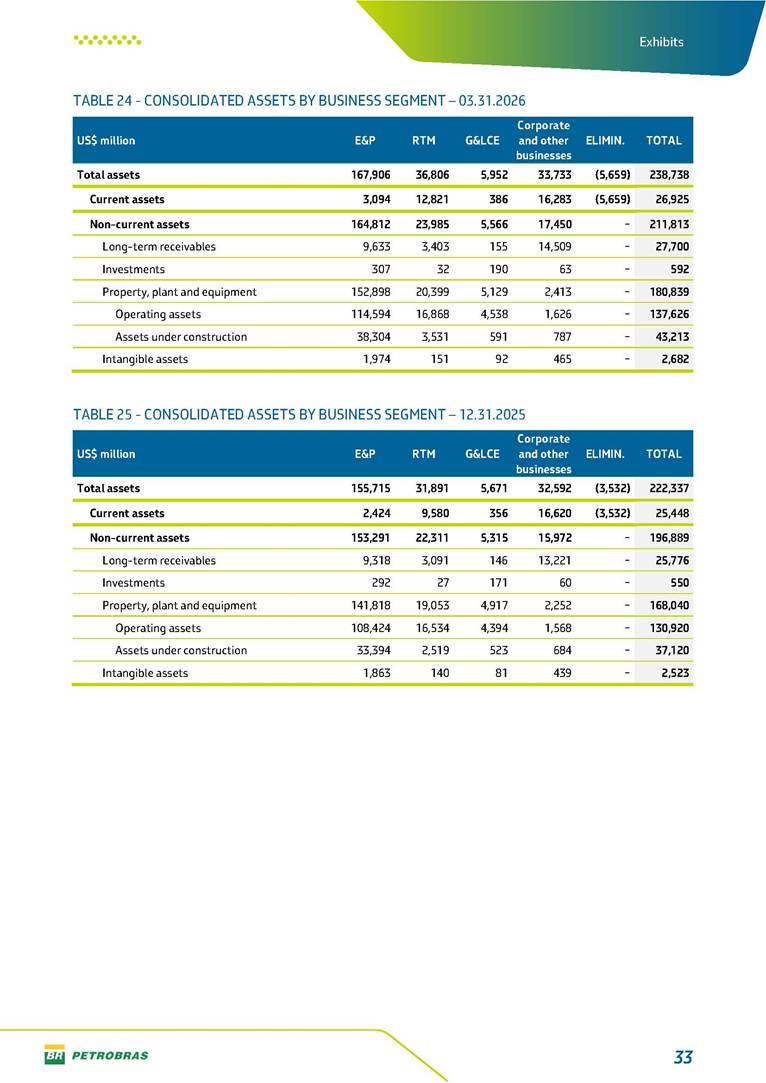
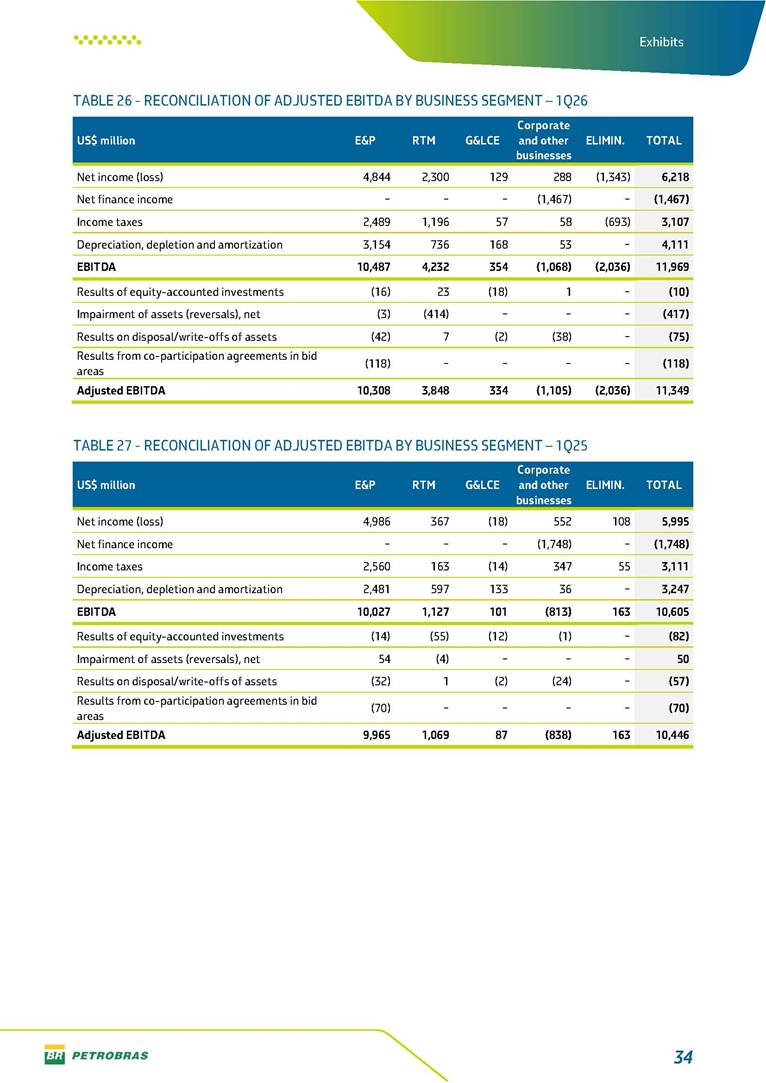
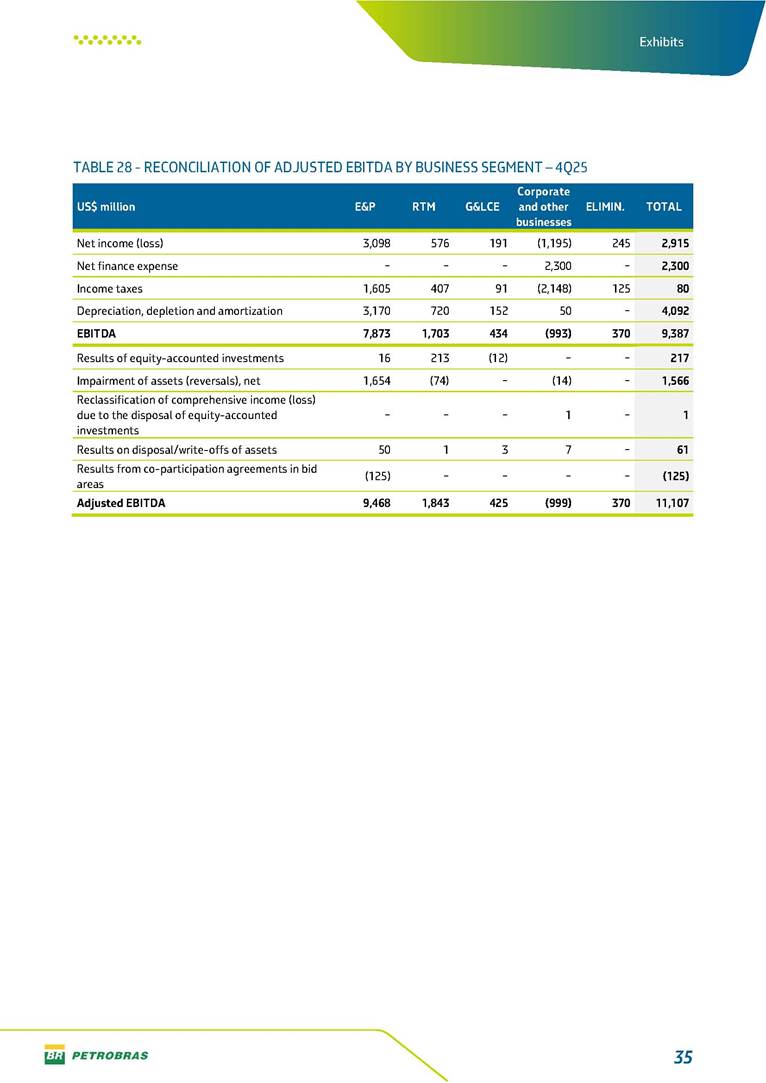
PERFORMANCE REPORT — 1Q26 Nova Piratininga thermoelectric plant One of 9 Petrobras plants contracted at LRCAP 2026 2 Disclaimer Table of contents Disclaimer....................................................................................................................... 3 Highlights – 1Q26 ......................................................................................................... 4 Main items ....................................................................................................................................................................... 5 Consolidated results .................................................................................................... 6 One-off events ............................................................................................................... 7 Capex ................................................................................................................................ 8 Liquidity and capital resources ........................................................................... 11 Debt metrics ................................................................................................................. 13 Results by business segment ................................................................................. 14 Exploration and Production ................................................................................................................................. 14 Refining, Transportation and Marketing ........................................................................................................ 16 Gas and Low Carbon Energies ............................................................................................................................... 17 Reconciliation of Adjusted EBITDA ..................................................................... 18 Exhibits .......................................................................................................................... 19 Financial statements ............................................................................................................................................... 19 Financial information by business segment ................................................................................................... 28 Glossary ......................................................................................................................... 36 3 Disclaimer Disclaimer This report may contain forward-looking statements about future events. Such forecasts reflect only the expectations of the company's management about future economic conditions, as well as the company's industry, performance and financial results, among others. The terms "anticipates", "believes", "expects", "predicts", "intends", "plans", "projects", "aims", "should", as well as other similar terms, are intended to identify such forecasts, which, of course, involve risks and uncertainties foreseen or not foreseen by the company and, consequently, are not guarantees of the company's future results. Therefore, future results of the company's operations may differ from current expectations, and the reader should not rely solely on the information contained herein. The Company undertakes no obligation to update the presentations and forecasts in the light of new information or future developments. The figures reported for 2Q26 onwards are estimates or targets. Additionally, this presentation contains some financial indicators that are not recognized under IFRS Accounting Standards. These indicators do not have standardized meanings and may not be comparable to indicators with a similar description used by other companies. We provide these indicators because we use them as measures of the company's performance; they should not be considered in isolation or as a substitute for other financial metrics that have been disclosed in accordance with IFRS Accounting Standards. See definitions of Free Cash Flow, Adjusted EBITDA and Net Debt in the Glossary and respective reconciliations in the Liquidity and Capital Resources, Reconciliation of Adjusted EBITDA and Net Debt sections. Interim Financial Information has been prepared in accordance with IFRS Accounting Standards and revised by independent auditors. 4 Highlights Highlights – 1Q26 “We delivered consistent financial results in the first quarter of 2026, maintaining strong cash generation with operating cash flow of US$ 8.4 billion, sustained by the excellent performance of our assets and by record oil and gas production. Our investments are being converted into production growth, vindicating our solid and effective value generation strategy." Fernando Melgarejo, Chief Financial Officer and Investor Relations Officer Main financial highlights Solid results in 1Q26: Adjusted EBITDA Excluding One-off Events of US$ 11.7 billion and Net Income Excluding One-off Events of US$ 4.5 billion Maintenance of strong cash generation with Operating Cash Flow of US$ 8.4 billion and Free Cash Flow of US$ 3.9 billion Contribution to society We paid R$ 72.4 billion in taxes to the Federal Government, States, and Municipalities in 1Q26 We approved R$ 9.0 billion in remuneration to our shareholders related to the results of 1Q26 5 Highlights Main items TABLE 1 – MAIN ITEMS Variation (%) US$ million 1Q26 4Q25 1Q25 1Q26 X 4Q25 1Q26 X 1Q25 Sales revenues 23,535 23,608 21,073 (0.3) 11.7 Gross profit 11,340 10,842 10,388 4.6 9.2 Operating expenses (3,492) (5,330) (3,112) (34.5) 12.2 Consolidated net income attributable to the shareholders of Petrobras 6,199 2,899 5,974 113.8 3.8 Consolidated net income excluding one-off events attributable to the shareholders of Petrobras (*) 4,535 4,750 4,029 (4.5) 12.6 Net cash provided by operating activities 8,399 10,162 8,498 (17.3) (1.2) Free cash flow 3,855 3,580 4,536 7.7 (15.0) Adjusted EBITDA 11,349 11,107 10,446 2.2 8.6 Adjusted EBITDA excluding one-off events (*) 11,737 10,935 10,652 7.3 10.2 Gross debt (US$ million) 71,214 69,793 64,491 2.0 10.4 Net debt (US$ million) 62,093 60,593 56,034 2.5 10.8 Net debt/LTM Adjusted EBITDA ratio 1.43 1.42 1.45 0.7 (1.4) Average commercial selling rate for U.S. dollar 5.26 5.39 5.84 (2.4) (9.9) Brent crude (US$/bbl) 80.61 63.69 75.66 26.6 6.5 Price of basic oil products - Domestic Market (US$/bbl) 86.83 84.67 86.58 2.6 0.3 ROCE (Return on Capital Employed) 6.7% 6.6% 6.5% 0,1 p.p. 0,2 p.p. (*) See reconciliation of net income and adjusted EBITDA excluding one-off events. 6 Consolidated results Consolidated results In 1Q26, we recorded solid financial results, supported by excellent operational performance, with yet another quarter of strong oil and gas production, which increased 3.7% compared to 4Q25. Furthermore, the appreciation of the real against the dollar also contributed positively to our figures. As a result, we delivered an adjusted EBITDA of US$ 11.7 billion and Net Income of US$ 4.5 billion, both excluding one-off events. Adjusted EBITDA, excluding one-off events in 1Q26, was 7.3% higher than 4Q25, driven by increased sales of locally-produced oil products and lower operating expenses, particularly due to reduced exploration costs. Despite higher production, lower oil exports during the period partially offset results. It is worth noting that we had an ongoing export balance of 81 Mbpd, which is expected to be settled in 2Q26. Net income in 1Q26, excluding one-off events, was US$ 4.5 billion, a reduction of 4.5% compared to 4Q25. Including one-off events, net income was US$ 6.2 billion, influenced by the gains with FX variation, reflecting the appreciation of the real against the dollar, and impairment reversal. It is worth noting that the recent increase in oil prices and record production have hardly been reflected in first-quarter revenues. Regarding volume, there is a natural lag between shipment and revenue recognition, which occurs at the time of cargo title transfer, when vessels arrive at destination ports. As for the recent increase in prices, the effects have not yet been perceived due to the export pricing logic. The definition of the price index and the pricing period may vary by negotiation and customer. For example, in the Asian market, destination of most of our exports, pricing is usually based on quotations from the month prior to cargo arrival. Therefore, the increase in oil prices following the start of the conflict in the Middle East will be reflected in 2Q26 exports. 7 EDITAR One-off events TABLE 2 – ONE-OFF EVENTS Variation (%) US$ million 1Q26 4Q25 1Q25 1Q26 X 4Q25 1Q26 X 1Q25 Net income 6,218 2,915 5,995 113.3 3.7 One-off events 2,525 (2,802) 2,948 − (14.3) One-off events that do not affect Adjusted EBITDA 2,913 (2,974) 3,154 − (7.6) Impairment (losses) reversals of assets and investments 409 (1,568) (50) − − Reclassification of comprehensive income (loss) due to the disposal of equity-accounted investments − (1) − − − Results on disposal/write-offs of assets 75 (61) 57 − 31.6 Results from co-participation agreements in bid areas 118 125 70 (5.6) 68.6 Discount and premium on repurchase of debt securities − (6) − − − Gains/(losses) with foreign exchange variation Real x U.S. dollar (*) 2,311 (1,463) 3,077 − (24.9) Other one-off events (388) 172 (206) − 88.3 Collective bargaining agreement (8) (271) − (97.0) − Gains (losses) on decommissioning of areas (7) 568 (1) − 600.0 Losses with legal, administrative and arbitration proceedings (133) (417) (201) (68.1) (33.8) Equalization of expenses - Production Individualization Agreements (7) 467 (4) − 75.0 Tax Amnesty Program of Bahia and Rio de Janeiro States (118) (136) − (13.2) − Export tax on crude oil and diesel (122) − − − − Others 7 (39) − − − Net effect of items with one-off events on income taxes (861) 950 (1,003) − (14.2) Net income excluding one-off events 4,554 4,767 4,050 (4.5) 12.4 Shareholders of Petrobras 4,535 4,750 4,029 (4.5) 12.6 Non-controlling interests 19 17 21 11.8 (9.5) Adjusted EBITDA 11,349 11,107 10,446 2.2 8.6 Other one-off events (388) 172 (206) − 88.3 Adjusted EBITDA excluding one-off events 11,737 10,935 10,652 7.3 10.2 (*) As of 4Q24, the line "gains/(losses) with foreign exchange variation Real x U.S. dollar" was added to the table above to calculate net income excluding one-off events. For comparative purposes, the periods previously disclosed were updated. In management's view, the one-off events presented above, although related to the Company's business, were highlighted as complementary information for a better understanding and evaluation of our performance. Such items do not necessarily occur in all periods and shall be disclosed when relevant. 8 Capex Capex TABLE 3 – TOTAL CAPEX Variation (%) US$ million 1Q26 4Q25 1Q25 1Q26 X 4Q25 1Q26 X 1Q25 Exploration & Production (*) 4,463 5,123 3,502 (12.9) 27.4 Production Development 3,507 3,728 2,726 (5.9) 28.7 Exploration 351 693 305 (49.4) 15.2 Others E&P 606 702 472 (13.7) 28.4 Refining, Transportation and Marketing 503 765 405 (34.2) 24.4 Gas & Low Carbon Energies 68 179 55 (62.0) 23.7 Others 72 221 104 (67.4) (30.7) Subtotal 5,107 6,288 4,065 (18.8) 25.6 Signature bonus − 26 − − − Total 5,107 6,313 4,065 (19.1) 25.6 (*) See Glossary for investment definitions In 1Q26, Capex totaled US$ 5.1 billion, representing a decrease of 19.1% compared to 4Q25 and an increase of 25.6% compared to 1Q25. The Exploration and Production segment stood out, accounting for 87.4% of total Capex in the period. On a cash perspective, investments totaled US$ 4.5 billion in 1Q26. The following chart presents the reconciliation between total Capex and cash Capex for 1Q26. CHART 1 – RECONCILIATION OF TOTAL CAPEX VS. CASH CAPEX – 1Q26 See Glossary for definitions of the components above (total Capex vs. cash Capex). 9 Capex In the Exploration & Production segment, Capex totaled US$ 4.5 billion in 1Q26, a 12.9% decrease compared to 4Q25. The higher investment level in the previous quarter mainly reflected the nationalization of FPSO P-78, which started production in December, in addition to higher expenditures on exploratory activities, particularly in the Equatorial Margin. Compared to 1Q25, there was a 27.4% increase in 1Q26. This growth was driven by higher investments in major pre-salt projects in Santos Basin, especially the new production systems for the Búzios and Sépia fields, due to the progress in the construction of the units, as well as projects in Campos Basin, with the ramp-up of the Marlim Revitalization. In the Refining, Transportation and Marketing segment, Capex totaled US$ 0.5 billion in 1Q26, a 34.2% decrease compared to 4Q25, mainly due to lower spending on Refining stoppages. Compared to 1Q25, there was an increase of 24.4%, and the highlight were higher investments at Abreu e Lima Refinery (RNEST) and the Boaventura Hub. Additionally, it is worth highlighting the early start-up of FPSO P-79 (Búzios 8) on May 1, 2026, with a production capacity of 180 thousand barrels of oil per day. The project will also enable gas exports to the mainland through its connection to the Rota 3 gas pipeline, with the potential to increase Brazil’s gas supply by up to 3 million m³ per day. The table below presents the main information on the new oil and gas production systems already contracted, as well as the main projects in the Refining, Transportation and Marketing segment. TABLE 4 – MAIN PROJECTS Unit Start-up FPSO capacity (bbl/day) Petrobras Actual Investment (US$ bn) Petrobras Total Investment (US$ bn) (1) Petrobras Stake Status Búzios 7 FPSO Almirante Tamandaré (Chartered unit) 2025 225,000 1.9 2.1 88.99% Project in execution phase with production system in operation. 15 wells drilled and completed. Mero 4 FPSO Alexandre de Gusmão (Chartered unit) 2025 180,000 0.7 1.3 38.6% Project in execution phase with production system in operation. 12 wells drilled and 11 completed. Búzios 6 P-78 (Owned unit) 2025 180,000 4.4 5.1 88.99% Project in execution phase with production system in operation. 13 wells drilled and completed. Búzios 8 P-79 (Owned unit) 2026 180,000 3.7 5.1 88.99% Project in execution phase with production system in operation. 14 wells drilled and completed. 10 Capex Búzios 9 P-80 (Owned unit) 2027 225,000 2.6 6.5 88.99% Project in execution phase with production system under construction. 4 wells drilled and completed. Búzios 10 P-82 (Owned unit) 2027 225,000 2.4 7.2 88.99% Project in execution phase with production system under construction. 2 well drilled and 1 completed. Búzios 11 P-83 (Owned unit) 2027 225,000 2.1 6.4 88.99% Project in execution phase with production system under construction. 3 wells drilled and 1 completed. Raia Manta e Raia Pintada FPSO Raia (Non-operated project) 2028 126,000 1.5 2,9 (2) 30% Project in execution phase with production system under construction. Atapu 2 P-84 2029 225,000 1.0 6.4 65.7% Project in execution phase with production system under construction. Trem 2 - RNEST 2029 Increase of 130 thousand barrels per day in i 0,3 (3) 2,0 (4) 100.0% Project in execution phase. Sépia 2 P-85 2030 225,000 0.7 4.7 55.3% Project in execution phase with production system under construction. 1 well drilled and completed. (1) Total investment under the 2026-2030+ Strategic Plan assumptions and Petrobras working interest (WI). Chartered units leases amounts are not included. (2) Total investment considering Petrobras working interest (WI). It is included the FPSO, contracted on a lump sum turnkey modality, which includes engineering, procurement, construction and installation for the unit. The contractor will also provide FPSO operation and maintenance services during the first year from the start of production. (3) Actual Investment starting in 2023 (project reassessment). (4) Total investment under the 2026-2030+, in the prospective view starting in 2023 (project reassessment) through project execution. Additional Information: Criteria for inclusion of projects in the table: E&P Projects – investment project with the production system already contracted until the end of its first year of operation Refining, Transportation and Gas Projects – investment project above USD 1 billion, with the main EPC (Engineering, Procurement, and Construction) scopes already contracted. 11 Liquidity and capital resources Liquidity and capital resources TABLE 5 - LIQUIDITY AND CAPITAL RESOURCES US$ million 1Q26 4Q25 1Q25 Adjusted cash and cash equivalents at the beginning of period 9,200 11,658 8,071 Government bonds, bank deposit certificates and time deposits with maturities of more than 3 months at the beginning of period (2,729) (2,694) (4,800) Cash and cash equivalents at the beginning of period 6,471 8,964 3,271 Net cash provided by operating activities 8,399 10,162 8,498 Net cash used in investing activities (3,591) (6,546) (1,767) Acquisition of PP&E and intangible assets (4,513) (6,588) (3,962) Acquisition of equity interests (31) 6 − Proceeds from disposal of assets - Divestment 250 59 463 Financial compensation from co-participation agreements 307 − 355 Divestment (investment) in financial investments 394 (46) 1,370 Dividends received 2 23 7 (=) Net cash provided by operating and investing activities 4,808 3,616 6,731 Net cash used in financing activities (4,760) (6,027) (5,432) Changes in non-controlling interest (136) (35) 39 Net financings 48 (1,870) (469) Proceeds from finance debt 1,317 5 500 Repayments (1,269) (1,875) (969) Repayment of lease liability (2,441) (2,626) (2,094) Dividends paid to shareholders of Petrobras (2,231) (1,496) (2,882) Dividends paid to non-controlling interests − − (26) Effect of exchange rate changes on cash and cash equivalents 51 (82) 125 Cash and cash equivalents at the end of period 6,570 6,471 4,695 Government bonds, bank deposit certificates and time deposits with maturities of more than 3 months at the end of period 2,551 2,729 3,762 Adjusted cash and cash equivalents at the end of period 9,121 9,200 8,457 Reconciliation of Free Cash Flow Net cash provided by operating activities 8,399 10,162 8,498 Acquisition of PP&E and intangible assets (4,513) (6,588) (3,962) Acquisition of equity interests (31) 6 − Free cash flow (*) 3,855 3,580 4,536 (*) Free cash flow (FCF) is in accordance with the new Shareholder Remuneration Policy (“Policy”) approved on 07/28/2023 and corresponds to operating cash flow minus acquisitions of property, plant and equipment, intangible assets and equity interests. 12 Liquidity and capital resources As of March 31, 2026, cash and cash equivalents totaled US$ 6.6 billion, and adjusted cash and cash equivalents amounted to US$ 9.1 billion. In 1Q26, cash generated from operating activities reached US$ 8.4 billion, and free cash flow totaled US$ 3.9 billion. This level of cash generation, along with funds raised throughout 1Q26, was primarily used to: (a) carry out investments (US$ 4.5 billion); (b) amortize lease liabilities (US$ 2.4 billion); (c) remunerate shareholders (US$ 2.2 billion), and (d) amortize principal and interest due during the period (US$ 1.3 billion). In 1Q26, the company settled several loans and financings totaling US$ 1.3 billion and raised funds in the same amount, especially US$ 0.9 billion in the domestic banking market. It is worth noting that, in 1Q26, operating cash flow (OCF) was negatively impacted by working capital effects amounting to US$ 1.3 billion, mainly inventories, primarily due to ongoing oil exports, and suppliers, which shifted from a positive effect of US$ 1.2 billion in 4Q25 to a negative effect of US$ 0.3 billion in 1Q26. It should also be highlighted that accounts receivable had a negative effect of US$ 0.3 billion in 1Q26, including receivables from the Federal Government related to the diesel subsidy (US$ 142 million). 13 Debt metrics Debt metrics As of March 31, 2026, gross debt totaled US$ 71.2 billion, an increase of 2% compared to December 31, 2025, mainly driven by funds raised throughout 1Q26, which totaled US$ 1.1 billion. The weighted average maturity of outstanding debt shifted from 11.7 years as of December 31, 2025 to 11.33 years as of March 31, 2026, while the average cost changed from 6.7% per year to 6.8% per year over the same period. The gross debt/LTM Adjusted EBITDA ratio stood at 1.64x as of March 31, 2026, stable compared to December 31, 2025. Net debt reached US$ 62.1 billion as of March 31, 2026, an increase of 2.5% compared to December 31, 2025. TABLE 6 – DEBT METRICS US$ million 03.31.2026 12.31.2025 Δ % 03.31.2025 Financial Debt 27,537 26,441 4.1 23,833 Capital Markets 16,672 17,000 (1.9) 14,557 Banking Market 8,788 7,595 15.7 7,247 Development banks 550 532 3.4 538 Export Credit Agencies 1,409 1,189 18.5 1,356 Others 118 125 (5.6) 135 Finance leases 43,677 43,352 0.7 40,658 Gross debt 71,214 69,793 2.0 64,491 Adjusted cash and cash equivalents 9,121 9,200 (0.9) 8,457 Net debt 62,093 60,593 2.5 56,034 Net Debt/(Net Debt + Market Cap) - Leverage 33% 45% (26.7) 39% Average interest rate (% p.a.) 6.8 6.7 1.5 6.9 Weighted average maturity of outstanding debt (years) 11.33 11.70 (3.2) 12.19 Net debt/LTM Adjusted EBITDA ratio 1.43 1.42 0.7 1.45 Gross debt/LTM Adjusted EBITDA ratio 1.64 1.64 (0.1) 1.67 14 Results by business segment Results by business segment Exploration and Production TABLE 7 – E&P RESULTS Variation (%) (*) US$ million 1Q26 4Q25 1Q25 1Q26 X 4Q25 1Q26 X 1Q25 Sales revenues 15,996 14,329 15,067 11.6 6.2 Gross profit 7,854 6,883 8,270 14.1 (5.0) Operating expenses (537) (2,164) (738) (75.2) (27.2) Operating income 7,317 4,719 7,532 55.1 (2.9) Net income attributable to the shareholders of Petrobras 4,845 3,099 4,987 56.3 (2.8) Adjusted EBITDA of the segment 10,308 9,468 9,965 8.9 3.4 EBITDA margin of the segment (%) 64 66 66 (1.6) (1.7) ROCE (Return on Capital Employed) (%) 9.3 9.4 10.1 (0.1) (0.8) Average Brent crude (US$/bbl) 80.61 63.69 75.66 26.6 6.5 Production taxes Brazil 3,455 2,506 2,800 37.9 23.4 Royalties 2,219 1,705 1,805 30.1 22.9 Special participation 1,226 791 987 55.0 24.2 Retention of areas 10 10 8 − 25.0 Lifting cost Brazil (US$/boe) 6.76 6.39 6.79 5.6 (0.6) Pre-salt 4.67 4.22 4.45 10.6 4.9 Deep and ultra-deep post-salt 17.30 17.54 18.29 (1.4) (5.4) Onshore and shallow waters 19.03 16.87 16.97 12.8 12.2 Lifting cost + Leases 9.28 9.09 9.49 2.1 (2.2) Pre-salt 7.14 6.86 7.08 4.1 0.9 Deep and ultra-deep post-salt 20.56 21.03 21.86 (2.2) (6.0) Onshore and shallow waters 19.03 16.87 16.97 12.8 12.2 Lifting cost + Production taxes 20.78 16.69 20.07 24.5 3.5 Lifting cost + Production taxes + Leases 23.30 19.38 22.77 20.3 2.3 (*) EBITDA margin and ROCE variations in percentage points. 15 Results by business segment In 1Q26, E&P gross profit was US$ 7.9 billion, an increase of 14.1% when compared to 4Q25, whose result was US$ 6.9 billion. This growth was mainly driven by higher production and higher Brent prices. Operating income in 1Q26 was US$ 7.3 billion, 55.1% higher than in 4Q25. In this quarter, unlike in 4Q25, there were no significant impacts related to impairment losses and field decommissioning expenses. On the other hand, in 1Q26, there was an increase in tax expenses due to an agreement between Petrobras and the State of Rio de Janeiro, under the REFIS program, which settled litigation regarding the ICMS tax on the maritime diesel consumption. Lifting costs in 1Q26, without government take and without leases, was US$ 6.76/boe, representing an increase of 6% compared to the last quarter, mainly driven by 3% appreciation of the real against the dollar and costs associated with the increase in production in Pre-salt. In Pre-salt, the 11% increase in lifting costs is due to FX fluctuations and to the increase in production, notably: the payment of performance bonus on Almirante Barroso and Almirante Tamandaré platforms, due to capacity increase; and P-78 start-up in late December 2025, which is still ramping up. Finally, spendings related to integrity also contributed to the lifting costs increase. In Post-salt, lifting cost decreased by 1% due to optimizations in expenses related to wells in Marlim Sul field, in addition to other cost efficiency actions in Campos Basin, partially offset by increased costs resulting from the appreciation of the real against the dollar. In onshore and shallow waters, lifting costs increased by 13%, explained by the exchange rate and by the natural decline of mature wells. 16 Results by business segment Refining, Transportation and Marketing TABLE 8 - RTM RESULTS Variation (%) (1) US$ million 1Q26 4Q25 1Q25 1Q26 X 4Q25 1Q26 X 1Q25 Sales revenues 22,297 22,298 19,989 (0.0) 11.5 Gross profit 4,525 2,407 1,211 88.0 273.7 Operating expenses (1,006) (1,211) (736) (16.9) 36.7 Operating Income 3,519 1,196 475 194.2 640.8 Net income attributable to the shareholders of Petrobras 2,300 576 367 299.3 526.7 Adjusted EBITDA of the segment 3,848 1,843 1,069 108.8 260.0 EBITDA margin of the segment (%) 17 8 5 9 12 ROCE (Return on Capital Employed) (%) 5.6 1.6 1.2 4.0 4.4 Refining cost (US$ / barrel) - Brazil 3.28 3.35 2.62 (2.1) 25.2 Price of basic oil products - Domestic Market (US$/bbl) 86.83 84.67 86.58 2.6 0.3 (1) Changes in EBITDA and ROCE margins in percentage points. Gross profit in 1Q26 was US$ 2.1 billion higher than 4Q25, favored by inventory turnover, reflecting higher Brent prices. Considering the inventory turnover of -US$ 1.3 billion in 1Q26 versus +US$ 425 million in 4Q25, gross profit would have been US$ 3.2 billion in 1Q26 and US$ 2.8 billion in 4Q25. The increase in Total Utilization Factor by 6 p.p. alongwide the maintenance of the yield of middle distillates and gasoline at 68% allowed higher sales of oil products in relation to 4Q25; and this result was particularly favorable, as it reduced the share of imported oil products in a scenario of high international prices. We also highlight higher margins in fuel oil exports, due to higher international prices. Operating income in 1Q26 was higher than 4Q25 due to higher gross profit and lower operating expenses with the reversal of the UFNIII impairment. The refining cost per barrel, in USD, in 1Q26 was 2.1% lower when compared to 4Q25, due to higher processing in the refining system, as explained above. The absolute costs in USD were slightly higher due to the appreciation of the BRL in 1Q26. 17 Results by business segment Gas and Low Carbon Energies TABLE 9 – G&LCE RESULTS Variation (%) (1) US$ million 1Q26 4Q25 1Q25 1Q26 X 4Q25 1Q26 X 1Q25 Sales revenues 2,205 2,389 1,860 (7.7) 18.5 Gross profit 989 1,174 735 (15.8) 34.6 Operating expenses (821) (904) (779) (9.2) 5.4 Operating income (loss) 168 270 (44) (37.8) − Net income (loss) attributable to the shareholders of Petrobras 120 185 (28) (35.1) − Adjusted EBITDA of the segment 334 425 87 (21.4) 283.9 EBITDA margin of the segment (%) (1) 15 18 5 (3) 10 ROCE (Return on Capital Employed) (%) (1) 2.6 0.9 1.8 1.7 0.8 Natural gas sales price - Brazil (US$/bbl) 52.04 52.39 56.75 (0.7) (8.3) Natural gas sales price - Brazil (US$/MMBtu) 8.77 8.83 9.57 (0.7) (8.4) Fixed revenues from power auctions (2)(3) 67.96 72.35 28.87 (6.1) 135.3 Average electricity sales price (US$/MWh) (2)(3) 63.10 42.05 40.57 50.1 55.5 (1) EBITDA margin and ROCE variations in percentage points. (2) The fixed revenue from auctions takes into account the remuneration for thermal availability and inflexible electricity committed in auctions. (3) For the current period, the figures for the Energy segment are subject to possible changes once the final report from the Chamber of Electric Energy Commercialization - CCEE is issued. In 1Q26, gross profit decreased 15.8% in relation to 4Q25, reflecting the accrual of revenues associated with annual contractual commitments in the previous quarter. It is worth noting that the greater supply of domestic gas and, consequently, the lower imports of LNG and Bolivian gas positively impacted the 1Q26 gross profit. The operating income in 1Q26 also decreased in relation to 4Q25, impacted by lower gross profit, despite the reduction in operating expenses. In 1Q26, gross profit increased 34.6% in relation to 1Q25, reflecting greater supply of domestic natural gas and higher sales of gas and energy. The operating income in 1Q26 also increased in relation to 1Q25, due to higher gross profit, despite higher operating expenses as a result of exchange rate variation. 18 Reconciliation of Adjusted EBITDA Reconciliation of Adjusted EBITDA EBITDA is an indicator calculated as the net income for the period plus taxes on profit, net financial result, depreciation and amortization. Petrobras announces EBITDA, as authorized by CVM Resolution No. 156, of June 2022. In order to reflect the management view regarding the formation of the company's current business results, EBITDA is also presented adjusted (Adjusted EBITDA) as a result of: results in equityaccounted investments; impairment, results with co-participation agreement in production fields and gains/losses on disposal/write-offs of assets. Adjusted EBITDA, reflecting the sum of the last twelve months (Last Twelve Months), also represents an alternative to the company's operating cash generation. This measure is used to calculate the Gross Debt and Net Debt to Adjusted EBITDA metric, helping to evaluate the company's leverage and liquidity. EBITDA and adjusted EBITDA are not provided for in IFRS Accounting Standards and should not serve as a basis for comparison with those disclosed by other companies and should not be considered as a substitute for any other measure calculated in accordance with IFRS Accounting Standards. These measures should be considered in conjunction with other measures and indicators for a better understanding of the company's performance and financial condition. TABLE 10 - RECONCILIATION OF ADJUSTED EBITDA Variation (%) (*) US$ million 1Q26 4Q25 1Q25 1Q26 X 4Q25 1Q26 X 1Q25 Net income 6,218 2,915 5,995 113.3 3.7 Net finance (income) expense (1,467) 2,300 (1,748) − (16.1) Income taxes 3,107 80 3,111 3783.8 (0.1) Depreciation, depletion and amortization 4,111 4,092 3,247 0.5 26.6 EBITDA 11,969 9,387 10,605 27.5 12.9 Results of equity-accounted investments (10) 217 (82) − (87.8) Impairment of assets (reversals), net (417) 1,566 50 − − Reclassification of comprehensive income due to the disposal of equity-accounted investments − 1 − − − Results on disposal/write-offs of assets (75) 61 (57) − 31.6 Results from co-participation agreements in bid areas (118) (125) (70) (5.6) 68.6 Adjusted EBITDA 11,349 11,107 10,446 2.2 8.6 Adjusted EBITDA margin (%) 48 47 50 1.0 (2.0) (*) EBITDA Margin variations in percentage points. 19 Exhibits Exhibits Financial statements TABLE 11 - INCOME STATEMENT - CONSOLIDATED US$ million 1Q26 4Q25 1Q25 Sales revenues 23,535 23,608 21,073 Cost of sales (12,195) (12,766) (10,685) Gross profit 11,340 10,842 10,388 Selling expenses (1,515) (1,462) (1,090) General and administrative expenses (479) (529) (444) Exploration costs (138) (471) (313) Research and development expenses (250) (236) (202) Other taxes (474) (369) (123) Impairment (losses) reversals, net 417 (1,566) (50) Other income and expenses, net (1,053) (697) (890) (3,492) (5,330) (3,112) Operating income 7,848 5,512 7,276 Finance income 334 434 297 Finance expenses (985) (1,147) (983) Foreign exchange gains (losses) and inflation indexation charges 2,118 (1,587) 2,434 Net finance income (expense) 1,467 (2,300) 1,748 Results of equity-accounted investments 10 (217) 82 Net income before income taxes 9,325 2,995 9,106 Income taxes (3,107) (80) (3,111) Net Income 6,218 2,915 5,995 Net income attributable to: Shareholders of Petrobras 6,199 2,899 5,974 Non-controlling interests 19 16 21 20 Exhibits TABLE 12 - STATEMENT OF FINANCIAL POSITION – CONSOLIDATED ASSETS - US$ million 03.31.2026 12.31.2025 Current assets 26,925 25,448 Cash and cash equivalents 6,570 6,471 Financial investments 2,549 2,726 Trade and other receivables, net 4,261 4,627 Inventories 9,303 8,210 Income taxes 704 658 Other taxes recoverable 1,358 1,368 Prepayments 609 468 Assets classified as held for sale 26 25 Other current assets 1,545 895 Non-current assets 211,813 196,889 Long-term receivables 27,700 25,776 Trade and other receivables, net 647 851 Judicial deposits 15,967 14,814 Income taxes 382 365 Deferred income taxes 1,594 1,015 Other taxes recoverable 4,574 4,177 Prepayments 4,152 4,238 Other non-current assets 384 316 Investments 592 550 Property, plant and equipment 180,839 168,040 Intangible assets 2,682 2,523 Total assets 238,738 222,337 LIABILITIES - US$ million 03.31.2026 12.31.2025 Current liabilities 36,243 36,051 Trade payables 7,489 7,442 Finance debt 2,485 2,186 Lease liability 10,246 10,037 Income taxes 1,678 1,292 Production taxes and other taxes payable 4,915 3,810 Dividends payable 22 2,095 Provision for decommissioning costs 2,961 2,950 Employee benefits 3,755 3,805 Liabilities related to assets classified as held for sale 110 103 Other current liabilities 2,582 2,331 Non-current liabilities 116,973 110,395 Finance debt 25,052 24,255 21 Exhibits Lease liability 33,431 33,315 Income taxes 600 576 Deferred income taxes 9,483 6,354 Employee benefits 16,466 15,367 Provision for legal proceedings 3,369 3,250 Provision for decommissioning costs 26,807 25,563 Other non-current liabilities 1,765 1,715 Shareholders' equity 85,522 75,891 Attributable to the shareholders of Petrobras 85,295 75,565 Share capital (net of share issuance costs) 107,101 107,101 Capital reserve and capital transactions 1,145 1,145 Profit reserves 72,600 72,600 Retained earnings 6,217 − Accumulated other comprehensive loss (101,768) (105,281) Attributable to non-controlling interests 227 326 Total liabilities and shareholders' equity 238,738 222,337 22 Exhibits TABLE 13 - STATEMENT OF CASH FLOW – CONSOLIDATED US$ million 1Q26 4Q25 1Q25 Cash flows from operating activities Net income for the period 6,218 2,915 5,995 Adjustments for: Pension and medical benefits 540 452 417 Results of equity-accounted investments (10) 217 (82) Depreciation, depletion and amortization 4,111 4,092 3,247 Impairment of assets (reversals), net (417) 1,566 50 Inventory write down (write-back) to net realizable value − − 7 Allowance (reversals) for credit loss on trade and other receivables, net (8) 41 (20) Exploratory expenditure write-offs 16 201 209 Gain on disposal/write-offs of assets (75) 62 (57) Foreign exchange, indexation and finance charges (1,669) 2,183 (1,955) Income taxes 3,107 80 3,111 Revision and unwinding of discount on the provision for decommissioning costs 347 (233) 320 Results from co-participation agreements in bid areas (118) (125) (70) Early termination and cash outflows revision of lease agreements (140) (168) (157) Losses with legal, administrative and arbitration proceedings, net 133 417 201 Equalization of expenses - Production Individualization Agreements 7 (467) 4 Decrease (Increase) in assets Trade and other receivables (245) 3 172 Inventories (778) 303 (359) Judicial deposits (23) 26 (180) Other assets (673) 199 379 Increase (Decrease) in liabilities Trade payables (284) 1,208 (543) Production taxes and other taxes payable 717 (471) 204 Pension and medical benefits (266) (282) (215) Provisions for legal proceedings (159) (104) (384) Other employee benefits (260) 493 118 Provision for decommissioning costs (371) (367) (184) Other liabilities 499 (741) (60) Income taxes paid (1,800) (1,338) (1,670) Net cash provided by operating activities 8,399 10,162 8,498 Cash flows from investing activities Acquisition of PP&E and intangible assets (4,513) (6,588) (3,962) Acquisition of equity interests (31) 6 − Proceeds from disposal of assets - Divestment 250 59 463 23 Exhibits Financial compensation from co-participation agreements 307 − 355 Divestment (investment) in financial investments 394 (46) 1,370 Dividends received 2 23 7 Net cash used in investing activities (3,591) (6,546) (1,767) Cash flows from financing activities Changes in non-controlling interest (136) (35) 39 Financing and loans, net: Proceeds from finance debt 1,317 5 500 Repayment of principal - finance debt (683) (1,430) (472) Repayment of interest - finance debt (586) (445) (497) Repayment of lease liability (2,441) (2,626) (2,094) Dividends paid to Shareholders of Petrobras (2,231) (1,496) (2,882) Dividends paid to non-controlling interests − − (26) Net cash used in financing activities (4,760) (6,027) (5,432) Effect of exchange rate changes on cash and cash equivalents 51 (82) 125 Net change in cash and cash equivalents 99 (2,493) 1,424 Cash and cash equivalents at the beginning of the period 6,471 8,964 3,271 Cash and cash equivalents at the end of the period 6,570 6,471 4,695 24 Exhibits TABLE 14 – NET REVENUES BY PRODUCTS Variation (%) US$ million 1Q26 4Q25 1Q25 1Q26 X 4Q25 1Q26 X 1Q25 Diesel 6,743 7,000 6,570 (3.7) 2.6 Road-use diesel subsidy program 128 − − − − Gasoline 2,923 3,204 2,964 (8.8) (1.4) Liquefied petroleum gas (LPG) 831 835 733 (0.5) 13.4 Jet fuel 1,179 1,178 1,123 0.1 5.0 Naphtha 472 305 410 54.8 15.1 Fuel oil (including bunker fuel) 163 158 165 3.2 (1.2) Other oil products 849 793 931 7.1 (8.8) Subtotal oil products 13,288 13,473 12,896 (1.4) 3.0 Natural gas 778 973 885 (20.0) (12.1) Crude oil 931 859 1,405 8.4 (33.7) Renewables and nitrogen products 112 90 53 24.4 111.3 Breakage 36 47 48 (23.4) (25.0) Electricity 328 216 139 51.9 136.0 Services, agency and others 235 175 166 34.3 41.6 Total domestic market 15,708 15,833 15,592 (0.8) 0.7 Exports 7,602 7,620 5,369 (0.2) 41.6 Crude oil 5,715 6,169 3,810 (7.4) 50.0 Fuel oil (including bunker fuel) 1,541 1,087 1,184 41.8 30.2 Other oil products and other products 346 364 375 (4.9) (7.7) Sales abroad (*) 225 155 112 45.2 100.9 Total foreign market 7,827 7,775 5,481 0.7 42.8 Total 23,535 23,608 21,073 (0.3) 11.7 (*) Sales revenues from operations outside of Brazil, including trading and excluding exports. 25 Exhibits TABLE 15 – COST OF SALES BY NATURE (*) Variation (%) US$ million 1Q26 4Q25 1Q25 1Q26 X 4Q25 1Q26 X 1Q25 Raw material, products for resale, materials and third-party services* (5,260) (6,166) (5,099) (14.7) 3.2 Acquisitions (including imports) (3,426) (4,200) (3,579) (18.4) (4.3) Crude oil (2,162) (1,792) (2,116) 20.6 2.2 Oil products (1,105) (2,179) (1,189) (49.3) (7.1) Natural gas (159) (229) (274) (30.6) (42.0) Third-party services and others (1,834) (1,966) (1,520) (6.7) 20.7 Depreciation, depletion and amortization (3,357) (3,372) (2,513) (0.4) 33.6 Production taxes (3,456) (2,509) (2,803) 37.7 23.3 Employee compensation (521) (483) (399) 7.9 30.6 Inventory turnover 399 (236) 129 − 209.3 Total (12,195) (12,766) (10,685) (4.5) 14.1 (*) It Includes short-term leases. 26 Exhibits TABLE 16 – OPERATING EXPENSES Variation (%) US$ million 1Q26 4Q25 1Q25 1Q26 X 4Q25 1Q26 X 1Q25 Selling, General and Administrative Expenses (1,994) (1,991) (1,534) 0.2 30.0 Selling expenses (1,515) (1,462) (1,090) 3.6 39.0 Materials, third-party services, freight, rent and other related costs (1,267) (1,243) (895) 1.9 41.6 Depreciation, depletion and amortization (203) (203) (169) − 20.1 Reversal (allowance) for expected credit losses (7) 20 4 − − Employee compensation (38) (36) (30) 5.6 26.7 General and administrative expenses (479) (529) (444) (9.5) 7.9 Employee compensation (303) (311) (266) (2.6) 13.9 Materials, third-party services, rent and other related costs (117) (166) (139) (29.5) (15.8) Depreciation, depletion and amortization (59) (52) (39) 13.5 51.3 Exploration costs (138) (471) (313) (70.7) (55.9) Research and development expenses (250) (236) (202) 5.9 23.8 Other taxes (474) (369) (123) 28.5 285.4 Impairment (losses) reversals, net 417 (1,566) (50) − − Other income and expenses, net (1,053) (697) (890) 51.1 18.3 Total (3,492) (5,330) (3,112) (34.5) 12.2 27 Exhibits TABLE 17 – FINANCIAL RESULTS Variation (%) US$ million 1Q26 4Q25 1Q25 1Q26 X 4Q25 1Q26 X 1Q25 Finance income 334 434 297 (23.0) 12.5 Income from financial investments and Government Bonds 218 324 223 (32.7) (2.2) Other finance income 116 110 74 5.5 56.8 Finance expenses (985) (1,147) (983) (14.1) 0.2 Interest on finance debt (553) (607) (466) (8.9) 18.7 Unwinding of discount on lease liability (677) (698) (622) (3.0) 8.8 Capitalized borrowing costs 625 610 449 2.5 39.2 Unwinding of discount on the provision for decommissioning costs (340) (335) (319) 1.5 6.6 Other finance expenses (40) (117) (25) (65.8) 60.0 Foreign exchange gains (losses) and inflation indexation charges 2,118 (1,587) 2,434 − (13.0) Foreign exchange gains (losses) 2,350 (1,477) 3,036 − (22.6) Real x U.S. dollar 2,311 (1,463) 3,077 − (24.9) Other currencies 39 (14) (41) − − Reclassification of hedge accounting to the Statement of Income (507) (482) (722) 5.2 (29.8) Indexation to the Selic interest rate of anticipated dividends and dividends payable (57) 94 (64) − (10.9) Recoverable taxes inflation indexation income 25 16 58 56.3 (56.9) Other foreign exchange gains and indexation charges, net 307 262 126 17.2 143.7 Total 1,467 (2,300) 1,748 − (16.1) 28 Exhibits Financial information by business segment TABLE 18 - CONSOLIDATED INCOME BY BUSINESS SEGMENT – 1Q26 US$ million E&P RTM G&LCE Corporate and other businesses ELIMIN. TOTAL Sales revenues 15,996 22,297 2,205 89 (17,052) 23,535 Intersegments 15,937 308 804 3 (17,052) − Third parties 59 21,989 1,401 86 − 23,535 Cost of sales (8,142) (17,772) (1,216) (81) 15,016 (12,195) Gross profit 7,854 4,525 989 8 (2,036) 11,340 Expenses (537) (1,006) (821) (1,128) − (3,492) Selling expenses − (794) (710) (11) − (1,515) General and administrative expenses (14) (102) (35) (328) − (479) Exploration costs (138) − − − − (138) Research and development expenses (198) (1) (3) (48) − (250) Other taxes (169) (136) (3) (166) − (474) Impairment reversals, net 3 414 − − − 417 Other income and expenses, net (21) (387) (70) (575) − (1,053) Operating income (loss) 7,317 3,519 168 (1,120) (2,036) 7,848 Net finance income − − − 1,467 − 1,467 Results of equity-accounted investments 16 (23) 18 (1) − 10 Net income (loss) before income taxes 7,333 3,496 186 346 (2,036) 9,325 Income taxes (2,489) (1,196) (57) (58) 693 (3,107) Net income (loss) 4,844 2,300 129 288 (1,343) 6,218 Net income (loss) attributable to: Shareholders of Petrobras 4,845 2,300 120 277 (1,343) 6,199 Non-controlling interests (1) − 9 11 − 19 29 Exhibits TABLE 19 - CONSOLIDATED INCOME BY BUSINESS SEGMENT – 1Q25 US$ million E&P RTM G&LCE Corporate and other businesses ELIMIN. TOTAL Sales revenues 15,067 19,989 1,860 77 (15,920) 21,073 Intersegments 15,012 290 617 1 (15,920) − Third parties 55 19,699 1,243 76 − 21,073 Cost of sales (6,797) (18,778) (1,125) (68) 16,083 (10,685) Gross profit 8,270 1,211 735 9 163 10,388 Expenses (738) (736) (779) (859) − (3,112) Selling expenses − (437) (655) 2 − (1,090) General and administrative expenses (4) (87) (26) (327) − (444) Exploration costs (313) − − − − (313) Research and development expenses (162) (1) (2) (37) − (202) Other taxes (4) (13) (2) (104) − (123) Impairment (losses) reversals, net (54) 4 − − − (50) Other income and expenses, net (201) (202) (94) (393) − (890) Operating income (loss) 7,532 475 (44) (850) 163 7,276 Net finance income − − − 1,748 − 1,748 Results of equity-accounted investments 14 55 12 1 − 82 Net income (loss) before income taxes 7,546 530 (32) 899 163 9,106 Income taxes (2,560) (163) 14 (347) (55) (3,111) Net income (loss) 4,986 367 (18) 552 108 5,995 Net income (loss) attributable to: Shareholders of Petrobras 4,987 367 (28) 540 108 5,974 Non-controlling interests (1) − 10 12 − 21 30 Exhibits TABLE 20 - QUARTERLY CONSOLIDATED INCOME BY BUSINESS SEGMENT – 4Q25 US$ million E&P RTM G&LCE Corporate and other businesses ELIMIN. TOTAL Sales revenues 14,329 22,298 2,389 94 (15,502) 23,608 Intersegments 14,274 277 950 1 (15,502) − Third parties 55 22,021 1,439 93 − 23,608 Cost of sales (7,446) (19,891) (1,215) (86) 15,872 (12,766) Gross profit 6,883 2,407 1,174 8 370 10,842 Expenses (2,164) (1,211) (904) (1,051) − (5,330) Selling expenses − (721) (756) 15 − (1,462) General and administrative expenses (14) (112) (38) (365) − (529) Exploration costs (471) − − − − (471) Research and development expenses (179) (6) (3) (48) − (236) Other taxes (84) (144) 4 (145) − (369) Impairment (losses) reversals, net (1,654) 74 − 14 − (1,566) Other income and expenses, net 238 (302) (111) (522) − (697) Operating income (loss) 4,719 1,196 270 (1,043) 370 5,512 Net finance expense − − − (2,300) − (2,300) Results of equity-accounted investments (16) (213) 12 − − (217) Net income (loss) before income taxes 4,703 983 282 (3,343) 370 2,995 Income taxes (1,605) (407) (91) 2,148 (125) (80) Net income (loss) 3,098 576 191 (1,195) 245 2,915 Net income (loss) attributable to: Shareholders of Petrobras 3,099 576 185 (1,206) 245 2,899 Non-controlling interests (1) − 6 11 − 16 31 Exhibits TABLE 21 - OTHER INCOME AND EXPENSES BY SEGMENT – 1Q26 US$ million E&P RTM G&LCE Corporate and other businesses TOTAL Stoppages for asset maintenance and pre-operating expenses (570) (59) (11) (4) (644) Pension and medical benefits - retirees − − − (385) (385) Variable compensation programs (*) (158) (80) (17) (91) (346) Gains (losses) with legal, administrative and arbitration di 154 (93) (2) (192) (133) Losses with commodity derivatives − (128) − − (128) Losses on decommissioning of areas (7) − − − (7) Results on disposal/write-offs of assets 42 (7) 2 38 75 Results from co-participation agreements in bid areas 118 − − − 118 Results of non-core activities 124 − − 5 129 Reimbursements from E&P partnership operations 132 − − − 132 Early termination and changes to cash flow estimates of leases 129 11 − − 140 Others 15 (31) (42) 54 (4) Total (21) (387) (70) (575) (1,053) (*) It comprises Profit Sharing (PLR) and Performance Award Program (PRD). TABLE 22 - OTHER INCOME AND EXPENSES BY SEGMENT – 1Q25 US$ million E&P RTM G&LCE Corporate and other businesses TOTAL Stoppages for asset maintenance and pre-operating expenses (513) (98) (20) (4) (635) Pension and medical benefits - retirees − − − (315) (315) Variable compensation programs (*) (134) (64) (15) (77) (290) Losses with legal, administrative and arbitration proceedings (112) (29) (2) (58) (201) Gains with commodity derivatives − 1 1 − 2 Losses on decommissioning of areas (2) − − − (2) Results on disposal/write-offs of assets 32 (1) 2 24 57 Results from co-participation agreements in bid areas 70 − − − 70 Results of non-core activities 102 (8) 1 3 98 Reimbursements from E&P partnership operations 146 − − − 146 Early termination and changes to cash flow estimates of leases 151 (1) 1 6 157 Others 59 (2) (62) 28 23 Total (201) (202) (94) (393) (890) (*) It comprises Profit Sharing (PLR) and Performance Award Program (PRD). 32 Exhibits TABLE 23 - OTHER INCOME AND EXPENSES BY SEGMENT – 4Q25 US$ million E&P RTM G&LCE Corporate and other businesses TOTAL Stoppages for asset maintenance and pre-operating expenses (507) (140) (20) (6) (673) Pension and medical benefits - retirees − − − (340) (340) Variable compensation programs (*) (164) (84) (20) (93) (361) Gains (losses) with legal, administrative and arbitration proceedings (509) (24) (5) 121 (417) Gains with commodity derivatives − 8 − − 8 Gains on decommissioning of areas 568 − − − 568 Results on disposal/write-offs of assets (50) (1) (3) (7) (61) Results from co-participation agreements in bid areas 125 − − − 125 Results of non-core activities 114 − − 2 116 Reimbursements from E&P partnership operations 114 − − − 114 Early termination and changes to cash flow estimates of leases 149 19 2 (2) 168 Others 398 (80) (65) (197) 56 Total 238 (302) (111) (522) (697) (*) It comprises Profit Sharing (PLR) and Performance Award Program (PRD). 33 Exhibits TABLE 24 - CONSOLIDATED ASSETS BY BUSINESS SEGMENT – 03.31.2026 US$ million E&P RTM G&LCE Corporate and other businesses ELIMIN. TOTAL Total assets 167,906 36,806 5,952 33,733 (5,659) 238,738 Current assets 3,094 12,821 386 16,283 (5,659) 26,925 Non-current assets 164,812 23,985 5,566 17,450 − 211,813 Long-term receivables 9,633 3,403 155 14,509 − 27,700 Investments 307 32 190 63 − 592 Property, plant and equipment 152,898 20,399 5,129 2,413 − 180,839 Operating assets 114,594 16,868 4,538 1,626 − 137,626 Assets under construction 38,304 3,531 591 787 − 43,213 Intangible assets 1,974 151 92 465 − 2,682 TABLE 25 - CONSOLIDATED ASSETS BY BUSINESS SEGMENT – 12.31.2025 US$ million E&P RTM G&LCE Corporate and other businesses ELIMIN. TOTAL Total assets 155,715 31,891 5,671 32,592 (3,532) 222,337 Current assets 2,424 9,580 356 16,620 (3,532) 25,448 Non-current assets 153,291 22,311 5,315 15,972 − 196,889 Long-term receivables 9,318 3,091 146 13,221 − 25,776 Investments 292 27 171 60 − 550 Property, plant and equipment 141,818 19,053 4,917 2,252 − 168,040 Operating assets 108,424 16,534 4,394 1,568 − 130,920 Assets under construction 33,394 2,519 523 684 − 37,120 Intangible assets 1,863 140 81 439 − 2,523 34 Exhibits TABLE 26 - RECONCILIATION OF ADJUSTED EBITDA BY BUSINESS SEGMENT – 1Q26 US$ million E&P RTM G&LCE Corporate and other businesses ELIMIN. TOTAL Net income (loss) 4,844 2,300 129 288 (1,343) 6,218 Net finance income − − − (1,467) − (1,467) Income taxes 2,489 1,196 57 58 (693) 3,107 Depreciation, depletion and amortization 3,154 736 168 53 − 4,111 EBITDA 10,487 4,232 354 (1,068) (2,036) 11,969 Results of equity-accounted investments (16) 23 (18) 1 − (10) Impairment of assets (reversals), net (3) (414) − − − (417) Results on disposal/write-offs of assets (42) 7 (2) (38) − (75) Results from co-participation agreements in bid areas (118) − − − − (118) Adjusted EBITDA 10,308 3,848 334 (1,105) (2,036) 11,349 TABLE 27 - RECONCILIATION OF ADJUSTED EBITDA BY BUSINESS SEGMENT – 1Q25 US$ million E&P RTM G&LCE Corporate and other businesses ELIMIN. TOTAL Net income (loss) 4,986 367 (18) 552 108 5,995 Net finance income − − − (1,748) − (1,748) Income taxes 2,560 163 (14) 347 55 3,111 Depreciation, depletion and amortization 2,481 597 133 36 − 3,247 EBITDA 10,027 1,127 101 (813) 163 10,605 Results of equity-accounted investments (14) (55) (12) (1) − (82) Impairment of assets (reversals), net 54 (4) − − − 50 Results on disposal/write-offs of assets (32) 1 (2) (24) − (57) Results from co-participation agreements in bid areas (70) − − − − (70) Adjusted EBITDA 9,965 1,069 87 (838) 163 10,446 35 Exhibits TABLE 28 - RECONCILIATION OF ADJUSTED EBITDA BY BUSINESS SEGMENT – 4Q25 US$ million E&P RTM G&LCE Corporate and other businesses ELIMIN. TOTAL Net income (loss) 3,098 576 191 (1,195) 245 2,915 Net finance expense − − − 2,300 − 2,300 Income taxes 1,605 407 91 (2,148) 125 80 Depreciation, depletion and amortization 3,170 720 152 50 − 4,092 EBITDA 7,873 1,703 434 (993) 370 9,387 Results of equity-accounted investments 16 213 (12) − − 217 Impairment of assets (reversals), net 1,654 (74) − (14) − 1,566 Reclassification of comprehensive income (loss) due to the disposal of equity-accounted investments − − − 1 − 1 Results on disposal/write-offs of assets 50 1 3 7 − 61 Results from co-participation agreements in bid areas (125) − − − − (125) Adjusted EBITDA 9,468 1,843 425 (999) 370 11,107 36 Glossary Glossary A Adjusted cash and cash equivalents: Sum of cash and cash equivalents and financial investments in securities in domestic and international markets that have high liquidity, i.e., convertible into cash within 3 months, even if maturity is longer than 12 months, held for the purpose of complying with cash commitments. This measure is not defined under the IFRS Accounting Standards and should not be considered in isolation or as a substitute for cash and cash equivalents computed in accordance with IFRS Accounting Standards. It may not be comparable to adjusted cash and cash equivalents of other companies, however management believes that it is an appropriate supplemental measure to assess our liquidity and supports leverage management. Adjusted EBITDA: Adjusted EBITDA (a non-GAAP measure defined as net income plus net finance income (expense); income taxes; depreciation, depletion and amortization; results in equity-accounted investments; impairment of assets (reversals); results on disposal/write-offs of assets, remeasurement of investment retained with loss of control and reclassification of CTA; and results from co-participation agreements in bid areas). Adjusted EBITDA margin: Adjusted EBITDA divided by sales revenues. Average capital employed: quarterly average considering inventories, intangibles and fixed assets at historical exchange rates. C CAPEX – Capital Expenditure: investments that encompasses acquisition of property, plant, and equipment, including costs with leasing, intangible assets, investments in subsidiaries and affiliates, costs with geology and geophysics and pre-operating costs. CAPEX vs. cash Capex: a) Contractual milestones: include payments related to mobilization for the start of asset construction. b) Geology and Geophysics: acquisition and interpretation of seismic data. c) Leases: payments related to leased assets used in projects (e.g., drilling rigs and PLSVs), excluding production units (FPSOs). d) Materials for future fixed asset additions: corresponds to the acquisition of materials for future use in projects. e) Others: adjustment of payment flows for platform construction milestones, considering the mismatch between accrual-based and cash-based and expenses related to projects but not capitalized, such as pre-FID expenditures. f) Signature bonuses: Represents an initial disbursement associated with acquiring the right to explore for and produce oil and natural gas in a given contracted area. 37 Glossary E Exploration & Production (E&P): The segment covers the exploration, development and production of crude oil, NGL and natural gas in Brazil and abroad, with the main aim of supplying our domestic refineries. This segment also operates through partnerships with other companies, including interests in foreign companies in this segment. F Free cash flow: Corresponds to operating cash flow minus acquisitions of property, plant and equipment, intangible assets and equity interests. Free cash flow is not defined under the IFRS Accounting Standards and should not be considered in isolation or as a substitute for cash and cash equivalents calculated in accordance with IFRS Accounting Standards. It may not be comparable to free cash flow of other companies, however management believes that it is an appropriate supplemental measure to assess our liquidity and supports leverage management. G Gas & Low Carbon Energy (G&LCE): The segment covers the logistics and commercialization of natural gas and electricity, the transportation and commercialization of LNG, the generation of electricity through thermoelectric plants, as well as the processing of natural gas. It also includes renewable energy businesses, low carbon services (carbon capture, utilization and storage) and the production of biodiesel and its products. I Investments: Capital expenditures based on the cost assumptions and financial methodology adopted in our Strategic Plan, which include acquisition of PP&E, including expenses with leasing, intangibles assets, investment in investees and other items that do not necessarily qualify as cash flows used in investing activities, primarily geological and geophysical expenses, pre-operating charges, purchase of property, plant and equipment on credit and borrowing costs directly attributable to works in progress. Investments in E&P: In the E&P segment, investment projects are classified as: a) production development; b) exploration and c) others. See the details: a) Production Development (PD) Projects aimed at enabling the production activities of new oil or gas fields, or the revitalization of fields already in production through new production systems and/or onshore facilities. This includes complementary development projects intended to increase the recovery factor in fields with declining production, without the installation of new production systems. Other projects in the Production Development include: asset acquisition projects linked to new production systems; quantitative risk analysis wells in development areas; and investments in the production development of non-operated fields. b) Exploration (EXP) Exploration projects aim to incorporate oil and gas reserves in a resilient way, from an economical and carbon emission perspective, generating value in the long-term. c) They are classified into types such as: Geological Interpretation Regional Studies, Block, Discovery Appraisal, Ring Fence (RF), Reservoir Data Acquisition (RDA) and Extended Well Tests (EWT).Others 38 Glossary Projects required to implement essential infrastructure needed to enable other investment projects, as well as operations. Examples include upgrades to operational infrastructure, scheduled shutdowns, acquisition of capital goods, IT and communications improvements, inspections and pipeline replacements due to SCC-CO₂, new platforms pre-operational costs, among others. L Leverage: Ratio between the Net Debt and the sum of Net Debt and Shareholders’ Equity. Leverage is not a measure defined in the IFRS Accounting Standards and it is possible that it may not be comparable to similar measures reported by other companies, however management believes that it is an appropriate supplemental measure to assess our liquidity. Lifting Cost: An indicator that represents the lifting cost per barrel of oil equivalent, considering the ratio between production and costs. It includes expenses for the execution and maintenance of production. Costs related to the leasing of third-party platforms, production taxes, and depreciation, depletion, and amortization are not considered in this indicator. Lifting Cost + Leases: An indicator that includes costs related to the leasing of third-party platforms in the calculation of Lifting Cost. Costs related to production taxes and depreciation, depletion, and amortization are not considered. Lifting Cost + Production Taxes: An indicator that includes costs related to production taxes in the calculation of Lifting Cost. Costs related to the leasing of third-party platforms and depreciation, depletion, and amortization are not considered. Lifting Cost + Production Taxes + Leases: An indicator that includes costs related to the leasing of third-party platforms and production taxes in the calculation of Lifting Cost. Costs related to depreciation, depletion, and amortization are not considered. LTM Adjusted EBITDA: Sum of the last 12 months (Last Twelve Months) of Adjusted EBITDA. This metric is not foreseen in the international accounting standards - IFRS Accounting Standards and it is possible that it is not comparable with similar indexes reported by other companies, however Management believes that it is supplementary information to assess liquidity and helps manage leverage. Adjusted EBITDA should be considered in conjunction with other metrics to better understand the Company's liquidity. N Net Debt: Gross debt less adjusted cash and cash equivalents. Net debt is not a measure defined in the IFRS Accounting Standards and should not be considered in isolation or as a substitute for total longterm debt calculated in accordance with IFRS Accounting Standards. Our calculation of net debt may not be comparable to the calculation of net debt by other companies, however our management believes that net debt is an appropriate supplemental measure that helps investors assess our liquidity and supports leverage management. 39 Glossary Net Income by Business Segment: The information by the company's business segment is prepared based on available financial information that is directly attributable to the segment or that can be allocated on a reasonable basis, being presented by business activities used by the Executive Board to make resource allocation decisions. and performance evaluation. When calculating segmented results, transactions with third parties, including jointly controlled and associated companies, and transfers between business segments are considered. Transactions between business segments are valued at internal transfer prices calculated based on methodologies that take into account market parameters, and these transactions are eliminated, outside the business segments, for the purpose of reconciling the segmented information with the consolidated financial statements of the company. company. O Operating profit after taxes: Adjusted EBITDA, minus DD&A of assets booked at historical exchange rates and 34% income tax rate. R Refining, Transportation and Marketing (RTM): The segment covers refining, logistics, transportation, acquisition and export of crude oil, as well as trading in oil products in Brazil and abroad. This segment also includes petrochemical operations (involving interests in petrochemical companies in Brazil) and fertilizer production. ROCE: Operating profit after taxes / average capital employed, both measured in US$ on a LTM basis

SIGNATURES
Pursuant to the requirements of the Securities Exchange Act of 1934, the registrant has duly caused this report to be signed on its behalf by the undersigned, thereunto duly authorized.
Date: May 11, 2026
PETRÓLEO BRASILEIRO S.A–PETROBRAS
By: /s/ Fernando Sabbi Melgarejo
______________________________
Fernando Sabbi Melgarejo
Chief Financial Officer and Investor Relations Officer