1. ORGANIZATION AND NATURE OF OPERATIONS
Nasdaq is a global technology company serving corporate clients, investment managers, banks, brokers, and exchange operators as they navigate and interact with the global capital markets and the broader financial system. We aspire to deliver world-leading platforms that improve the liquidity, transparency, and integrity of the global economy. Our diverse offering of data, analytics, software, exchange capabilities, and client-centric services enables clients to optimize and execute their business vision with confidence.
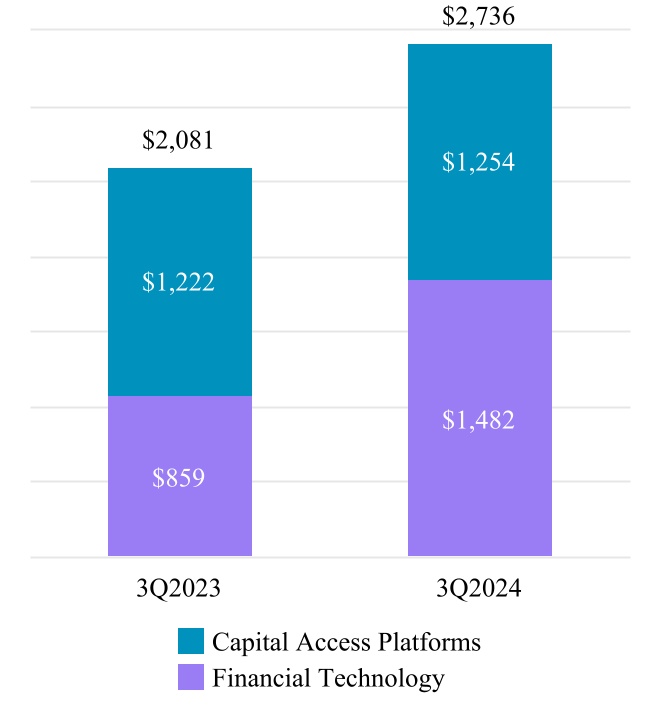
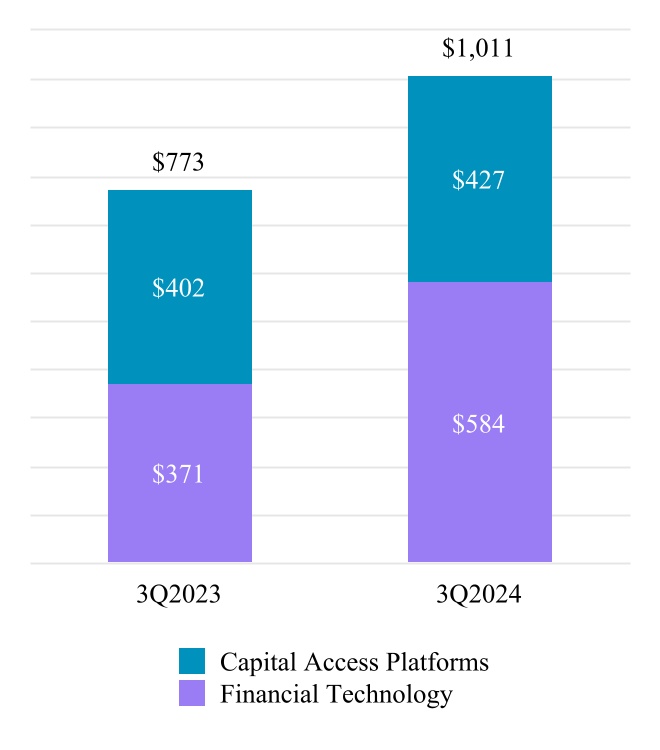
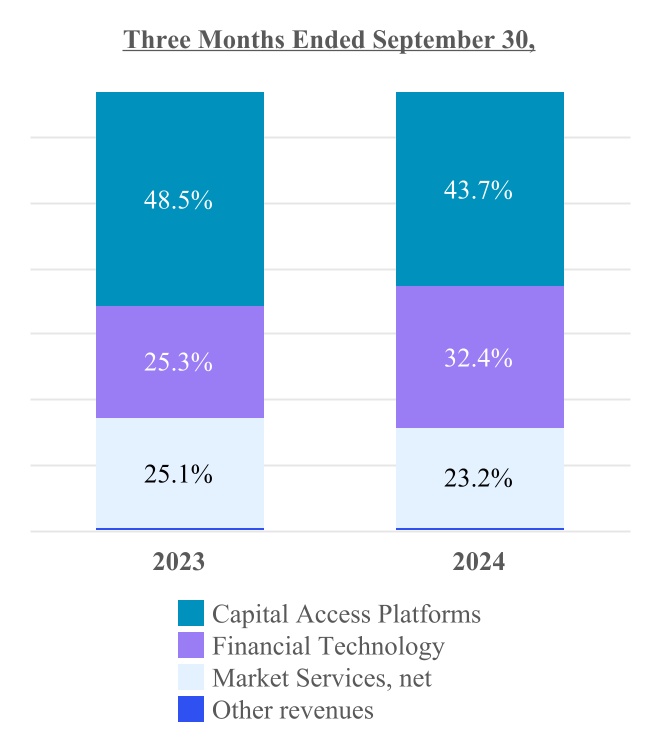
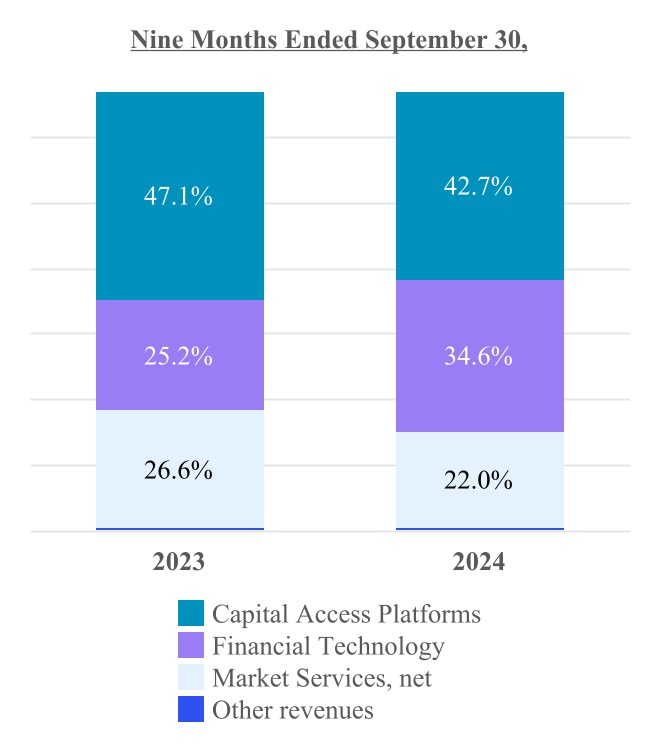
In the fourth quarter of 2023, following the completion of the Adenza acquisition, including its two flagship solutions, AxiomSL and Calypso, we aligned our business more closely with the foundational shifts that are driving the evolution of the global financial system. We now manage, operate and provide our products and services in three business segments: Capital Access Platforms, Financial Technology and Market Services. The divisional structure, which was implemented during the fourth quarter of 2023, is as follows:

Capital Access Platforms
Our Capital Access Platforms segment comprises Data & Listing Services, Index and Workflow & Insights.
Our Data business distributes historical and real-time market data to sell-side customers, the institutional investing community, retail online brokers, proprietary trading firms and other venues, as well as internet portals and data distributors. Our data products can enhance the transparency of market activity within our exchanges and provide critical information to professional and non-professional investors globally.
Our Listing Services business operates listing platforms in the U.S. and Europe to provide multiple global capital raising solutions for public companies. Our main listing markets are The Nasdaq Stock Market and the Nasdaq Nordic and Nasdaq Baltic exchanges. Through Nasdaq First North, our Nordic and Baltic operations also offer alternative marketplaces for smaller companies and growth companies.
As of September 30, 2024, a total of 5,225 companies listed securities on our U.S., Nasdaq Nordic, Nasdaq Baltic and Nasdaq First North exchanges. As of September 30, 2024, there were 4,039 total listings on The Nasdaq Stock Market, including 712 ETPs. The combined market capitalization in the U.S. was approximately $32.7 trillion. In Europe, the Nasdaq Nordic and Nasdaq Baltic exchanges, together with Nasdaq First North, were home to 1,186 listed companies with a combined market capitalization of approximately $2.3 trillion.
Our Index business develops and licenses Nasdaq-branded indices and financial products. We also license cash-settled futures, options and options on futures on our indices. As of September 30, 2024, 388 ETPs listed on 27 exchanges in over 20 countries tracked a Nasdaq index and accounted for $600 billion in AUM.
Workflow & Insights includes our analytics and corporate solutions businesses. Our analytics business provides asset managers, investment consultants and institutional asset owners with information and analytics to make data-driven investment decisions, deploy their resources more productively, and provide liquidity solutions for private funds. Through our eVestment and Solovis solutions, we provide a suite of cloud-based solutions that help institutional investors and consultants conduct pre-investment due diligence, and monitor their portfolios post-investment. The eVestment platform also enables asset managers to efficiently distribute information about their firms and funds to asset owners and consultants worldwide.
Through our Solovis platform, endowments, foundations, pensions and family offices transform how they collect and aggregate investment data, analyze portfolio performance, model and predict future outcomes, and share meaningful portfolio insights with key stakeholders. The Nasdaq Fund Network and Nasdaq Data Link are additional platforms in our suite of investment data analytics offerings and data management tools.