Q3 2026: double-digit growth in sales and business EPS FY 2026: guidance upgraded
October 30, 2026
Q3 sales growth of 14.3% at CER1 and business earnings per share (EPS)2 of €3.55
•Pharma launches sales increased by 31.4%, reaching €1.4 billion, driven by ALTUVIIIO, Ayvakit, and Rezurock
•Dupixent sales increased by 34.8% to €5.7 billion, above €5 billion per quarter for the second time
•Vaccines sales decreased by 6.6% to €3.2 billion, impacted by the anticipated phasing in respiratory prevention
•Research and Development expenses reached €1.8 billion, broadly stable
•Selling and general expenses reached €2.3 billion, down by 0.9%, reflecting cost discipline
•Business EPS was €3.55, up by 19.6% at CER; 22.0% at actual exchange rates; IFRS EPS €2.52
Pipeline update
•Two regulatory approvals; in rare diseases and vaccines
•One regulatory submission acceptance and two regulatory designations (priority review and PRIME)
Guidance upgraded
•2026 guidance is upgraded: sales are expected to grow by a low-teens percentage at CER. Business EPS at CER is expected to grow by a mid-teens percentage.3
Belén Garijo, Chief Executive Officer: “Sanofi achieved another strong quarter with double-digit sales growth of 14.3%, mainly driven by our new medicines and Dupixent. Business EPS increased by 19.6%, driven by cost discipline. The pipeline milestones included two regulatory approvals, one regulatory submission, and two additional regulatory designations. Our strong commercial and financial momentum to date leads us to raise our 2026 guidance: sales growth is now expected at a low-teens percentage and business EPS growth at a mid-teens percentage, underscoring our sustainable, profitable growth.
In the third quarter, we accelerated Sanofi’s transformation by expanding our long-standing alliance with Regeneron, which opens up further opportunities in immunology. We also continued to simplify our portfolio through a partnership with Cheplapharm covering a number of legacy medicines4.
We are confident about our ability to pursue our strong commercial and financial performance in the short and medium term. The whole organisation is focused on managing Sanofi’s post-Dupixent trajectory over the next decade. Our priority is to protect earnings through Dupixent’s loss of exclusivity. We have already begun taking action to improve R&D productivity. Business development and M&A will be critical to complement this transformation. We remain committed to our long-term capital allocation policy, including our progressive dividend.”
Q3 2026
Change
Change at CER
YTD 2026
Change
Change at CER
Net sales
€14,444
m
+16.2
%
+14.3
%
€36,550
m
+13.1
%
+15.2
%
IFRS net income
€3,021m
+7.8
%
—
€4,979
m
-42.2
%
—
IFRS EPS
€2.52
+9.6
%
—
€4.15
-41.1
%
—
Free cash flow5
€3,269
m
+9.2
%
—
€6,993
m
+28.3
%
—
Business operating income
€5,430
m
+22.2
%
+19.7
%
€11,688
m
+19.2
%
+21.1
%
Business net income
€4,255
m
+20.0
%
+17.6
%
€9,020
m
+17.2
%
+19.1
%
Business EPS
€3.55
+22.0
%
+19.6
%
€7.52
+19.4
%
+21.3
%
1 Changes in net sales are at constant exchange rates (CER) unless otherwise stated (see definition in Appendix 8).
2 To facilitate an understanding of operational performance, Sanofi comments on business operating income, business net income, and business EPS
(bEPS), which are non-IFRS financial measures (see definitions in Appendix 8). The IFRS consolidated income statement is in Appendix 3, and a
reconciliation of IFRS net income to business net income is in Appendix 4.
3 Applying October 2026 average currency exchange rates, currency impacts are estimated at c.-1% on sales and at c.-1% on business EPS.
4 Subject to information and consultation procedures with employee representatives, regulatory approvals, and customary closing conditions.
5 Free cash flow is a non-IFRS financial measure (see definition in Appendix 8).
SANOFI PRESS RELEASE Q3 2026
1
Q3 and YTD 2026 summary
A conference call and webcast for investors and analysts will begin at 13:30 CET with details on sanofi.com, including the slides.
The performance shown in this press release covers the three-month period to September 30, 2026 (Q3 2026) and the nine-month period to September 30, 2026 (the year-to-date (YTD) 2026) compared to the three-month period to September 30, 2025 (Q3 2025) and the nine-month period to September 30, 2025 (YTD 2025) respectively. All percentage changes in sales in this press release are at CER, unless otherwise stated.
In Q3 2026, sales were €14,444 million and increased by 14.3%. Exchange rate movements had a positive effect of 1.9 percentage points (pp); therefore, at actual exchange rates, sales increased by 16.2%. The divestments of medicines/portfolio streamlining had a negative impact of 0.4pp on sales growth. In YTD 2026, sales were €36,550 million and increased by 15.2%. Exchange rate movements had a negative effect of 2.1pp; therefore, at actual exchange rates, sales increased by 13.1%. The divestments of medicines/portfolio streamlining had a negative impact of 0.4pp on sales growth.
Sales by geography
Net sales
(€ million)
Q3 2026
Change at CER
YTD 2026
Change at CER
United States (US)
8,603
+23.9
%
20,236
+27.4
%
Europe
2,579
-0.9
%
6,883
+1.9
%
Rest of World
3,262
+5.7
%
9,431
+3.1
%
of which China
762
+2.6
%
2,087
-1.5
%
US sales were €8,603 million and increased by 23.9%. The growth was driven by Immunology (Dupixent and Kevzara), pharma launches, and insulins with vaccines decreasing by 6.8% from lower influenza and Beyfortus sales partly offset by newly acquired Heplisav-B.
Europe sales were €2,579 million and decreased by 0.9%. The slight decrease was driven by influenza vaccines and legacy medicines, only partly offset by Dupixent and pharma launches.
Rest of World sales were €3,262 million and increased by 5.7%. The growth was driven by Dupixent and launches, including Beyfortus. A decrease in legacy medicines offset growth in insulins. Vaccines overall was relatively stable with Beyfortus offsetting a decrease in influenza vaccines. China sales were €762 million and increased by 2.6% in a market growing at about the same rate. Sales growth was driven by Sarclisa, Dupixent, and insulins with vaccines decreasing, mainly the polio/pertussis/hib primary vaccines due to the decline in childbirths.
Business operating income
In Q3 2026, business operating income (BOI) was €5,430 million and increased by 19.7% (22.2% at actual exchange rates) from €4,445 million in Q3 2025. The ratio of BOI to net sales was 37.4% and increased by 1.7pp (37.6% at actual exchange rates, up by 1.9pp). The increase was mainly driven by growth in business gross profit and operating leverage partly offset by the increase in other operating expenses from higher profit sharing to Sanofi’s collaboration partner Regeneron. In YTD 2026, BOI was €11,688 million and increased by 21.1% (19.2% at actual exchange rates) from €9,808 million in YTD 2025. The ratio of BOI to net sales was 31.9% and increased by 1.6pp (32.0% at actual exchange rates, up by 1.7pp).
Business development
In September, Sanofi and Cheplapharm announced the intention to create a new strategic partnership in mature medicines under which Cheplapharm would take over from Sanofi a selection of 20 mature medicines and three manufacturing sites worldwide. In return, Sanofi will receive a 26.4% equity stake in Cheplapharm, building on a collaboration that started in 2014. The commercial transfer of the medicine portfolio is planned to begin in the first quarter of 2027, followed by the transfer of the sites, subject to information and consultation procedures with employee representatives, regulatory approvals and customary closing conditions. The transaction is expected to be fully completed by the third quarter of 2027. The medicines being divested from Sanofi include Lovenox/Clexane (enoxaparin), excluding in the US. Lovenox/Clexane had 2025 sales of €822 million. Additional financial details are expected to be provided at a later stage.
In early October, Sanofi and Sanofi’s collaboration partner Regeneron Pharmaceuticals, Inc. announced an expansion of their longstanding antibody collaboration, adding multiple next-generation, long-acting antibodies to the alliance. Under the expanded license and collaboration agreement, the companies intend to co-develop and co-market four new long-acting, Regeneron-invented antibodies targeting interleukin-13 (IL13), interleukin-4 (IL4), interleukin-4 receptor alpha (IL4Rα), and an IL4xIL13 bispecific. The IL13 antibody REGN20423 is currently in a phase 1 clinical study for atopic dermatitis, and the other three molecules are expected to enter clinical studies in 2027. Regeneron will also have the option to include in the collaboration Sanofi’s lunsekimig, exercisable upon completion of its phase 3 studies for chronic obstructive pulmonary disease. Regeneron will receive an upfront payment of $1 billion from Sanofi, with the potential for development, regulatory and commercial milestone payments of up to an additional $7 billion. The companies will share development and commercial costs for the new programmes and will split future profits from these potential new medicines 50:50 on a global basis. Regeneron will lead research and development activities, and Sanofi will lead global commercial efforts. The existing profit-sharing agreement on Dupixent and Kevzara will not change.
SANOFI PRESS RELEASE Q3 2026
2
Financial calendar
Q4 2026 results
Thursday, January 28, 2027
Q1 2027 results
Friday, April 23, 2027
Q2 2027 results
Thursday, July 29, 2027
Q3 2027 results
Thursday, 28 October 2027
Biopharma segment
Pharma
Comments on sales performance are provided for all launch medicines and established medicines with sales of minimum €100 million per quarter.
Launches
Recent pharma launches include the medicines ALTUVIIIO, Nexviazyme/Nexviadyme, Ayvakit, Sarclisa, Rezurock, Cablivi, Xenpozyme, Tzield/Teizeild, Wayrilz, Qfitlia, Myqorzo, Anxu, and Redemplo. Individual sales comments are provided in the respective disease area sections while the combined performance of launches is set out in the table below:
Net sales
(€ million)
Q3 2026
Change at CER
YTD 2026
Change at CER
Total
1,390
+31.4
%
3,866
+42.3
%
Immunology
Net sales
(€ million)
Q3 2026
Change at CER
YTD 2026
Change at CER
Dupixent
5,687
+34.8
%
15,011
+34.5
%
Kevzara
222
+67.9
%
523
+42.3
%
Dupixent (atopic dermatitis (AD), asthma, chronic rhinosinusitis with nasal polyposis (CRSwNP), eosinophilic esophagitis, prurigo nodularis, chronic spontaneous urticaria (CSU), chronic obstructive pulmonary disease (COPD), bullous pemphigoid, and allergic fungal rhinosinusitis (AFRS)) sales were €5,687 million and increased by 34.8%. Global sales continued to be driven by strong demand growth in each of the up to nine approved indications, mainly from greater use of advanced medicines in each disease. US sales were €4,376 million and increased by 40.2%, primarily driven by strong demand, and by an extended benefit from operational improvements which resulted in favourable gross-to-net price adjustments. In Europe, sales were €588 million and increased by 16.1%, reflecting growth across reimbursed indications and continued growth in the larger markets, including Germany, France, and the UK. In Rest of World, sales were €723 million and increased by 22.6%, mainly driven by Japan, Canada, Brazil, and China.
Kevzara (rheumatoid arthritis, other rheumatological indications) sales were €222 million and increased by 67.9%, mainly driven by increased use in rheumatoid arthritis and polymyalgia rheumatica. US remained the biggest market (€167 million, +87.4%).
Rare diseases
Net sales
(€ million)
Q3 2026
Change at CER
YTD 2026
Change at CER
ALTUVIIIO
408
+37.8
%
1,082
+34.2
%
Fabrazyme
260
+6.2
%
783
+4.7
%
Nexviazyme/Nexviadyme
211
+4.0
%
637
+10.9
%
Ayvakit
203
+46.0
%
570
+329.2
%
Cerezyme
173
+6.2
%
525
+0.8
%
Alprolix
172
+13.4
%
454
+3.3
%
Myozyme/Lumizyme
105
-15.6
%
325
-17.4
%
Cablivi
70
+6.1
%
223
+12.9
%
Xenpozyme
63
+8.8
%
190
+15.0
%
Wayrilz
19
+1800.0
%
46
+4600.0
%
Qfitlia
8
+75.0
%
20
+300.0
%
Myqorzo
3
—
%
6
—
%
Anxu
1
—
%
1
—
%
Redemplo
1
—
%
1
—
%
ALTUVIIIO (coagulation disorder, factor VIII) sales were €408 million of which 85% was in the US. Growth continued to be driven by patients switching from legacy, shorter half-life factor medicines, and some patients from non-factor medicines. Rest of World sales were €63 million and increased by 40.4% as supply sales adjusted to Sanofi’s collaboration partner Sobi. The factor
SANOFI PRESS RELEASE Q3 2026
3
VIII medicine franchise (ALTUVIIIO and Eloctate) sales were €453 million and increased by 21.3%. Eloctate contributed €45 million and decreased by 41.6%, driven by the absence of supplies to Sanofi’s collaboration partner Sobi.
Fabrazyme (Fabry disease) sales were €260 million and increased by 6.2%, driven by the US (+8.9%) from more patients and higher price, partly offset by slower growth in Europe (+1.6%, to €63 million).
Nexviazyme/Nexviadyme (Pompe disease) sales were €211 million and increased by 4.0%, driven by the US (+14.3%) and Rest of World (+10.7%), partly offset by Europe (-12.2%). Across all geographies, patients are switching from Myozyme/Lumizyme. The Pompe disease franchise (Nexviazyme/Nexviadyme and Myozyme/Lumizyme) sales were €316 million (-3.4%). In general, supply constraints reduce growth.
Ayvakit (systemic mastocytosis) sales were €203 million. Sales were mainly split between the US (€178 million) and Europe (€23 million) with continued growth in the number of patients treated and their duration of treatment. Higher government rebates because of the originator Blueprint becoming part of Sanofi continued to impact US sales. On a market pro-forma basis, sales reached $234 million, an increase of 14.4% from $204 million in Q3 2025. Royalty on sales by CStone Pharmaceuticals in China is recorded in other revenues.
Cerezyme (Gaucher disease) sales were €173 million and increased by 6.2%, driven by Rest of World (+21.3%), partly offset by the US (-2.3%) and Europe (-3.6%). The Gaucher disease franchise (Cerezyme and Cerdelga) sales were €268 million and increased by 6.9%.
Alprolix (coagulation disorder, factor IX) sales were €172 million and increased by 13.4%, driven by Rest of World (+27.9%, to €55 million) mainly due to increased supplies to Sanofi’s collaboration partner Sobi. Growth in the US (+7.5%) partly benefited from gross-to-net price adjustments.
Myozyme/Lumizyme (Pompe disease) sales were €105 million and decreased by 15.6% driven by patients switching to Nexviazyme/Nexviadyme and supply constraints.
Cablivi (acquired thrombotic thrombocytopenic purpura) sales were €70 million and increased by 6.1%, driven by the US (+8.6%), mainly from increased patient use. Sales in Europe were €26 million (+4.0%) and in Rest of World €5 million (unchanged).
Xenpozyme (acid sphingomyelinase deficiency) sales were €63 million and increased by 8.8%, driven by the US (+17.4%).
Wayrilz (immune thrombocytopenia) sales were €19 million, all in the US, following approval in August 2025.
Qfitlia (hemophilia A/B) sales were €8 million, of which €7 million in the US, following approval in March 2025.
Myqorzo (obstructive hypertrophic cardiomyopathy) sales were €3 million after launch in China during the first quarter.
Anxu (myelofibrosis) sales were €1 million after launch in China during the second quarter.
Redemplo (familial chylomicronemia syndrome) sales were €1 million after launch in China during the third quarter.
Other main medicines
Net sales
(€ million)
Q3 2026
Change at CER
YTD 2026
Change at CER
Lantus
530
+18.5
%
1,343
+3.7
%
Toujeo
430
+31.2
%
1,159
+15.0
%
Plavix
206
-10.8
%
646
-6.5
%
Sarclisa
196
+25.8
%
550
+30.4
%
Lovenox
174
-12.8
%
538
-17.3
%
Rezurock
165
+43.0
%
461
+25.7
%
Praluent
156
+20.5
%
473
+19.0
%
Thymoglobulin
134
+10.2
%
391
+9.0
%
Aprovel
103
-1.0
%
321
+2.6
%
Tzield/Teizeild
42
+127.8
%
79
+70.2
%
Lantus (diabetes) sales were €530 million and increased by 18.5%. US sales were €293 million and increased by 35.0% primarily driven by favourable gross-to-net price adjustments and supported by market share gains. Sales also continued to benefit from temporary demand from competitor supply disruptions, an effect expected to moderate over time. Combined sales in Europe and Rest of World increased by 2.7%.
Toujeo (diabetes) sales were €430 million and increased by 31.2%, driven mainly by the US (+121.8%) from favourable gross-to-net price adjustments and market share gains. Sales in Rest of World (+19.0%) and Europe (+4.8%) also grew from an increase in market share.
Plavix (antiplatelet, cardiovascular disease) sales were €206 million and decreased by 10.8%, driven by lower Rest of World sales (majority of sales, €185 million, -11.0%).
Sarclisa (multiple myeloma) sales were €196 million and increased by 25.8%, driven by high growth in Rest of World (+33.3%, to €64 million) and Europe (+28.3%, to €59 million). Sales in the US were €73 million (+18.0%). Globally, growth was supported by increased use in earlier lines of treatment, including front-line transplant-ineligible patients in combination with standard-of-care chemotherapy combinations. The ongoing launch of the new subcutaneous formulation also contributed to growth.
Lovenox (anticoagulant, cardiovascular disease) sales were €174 million and decreased by 12.8%, from lower sales in Europe (-17.8%, to €89 million) and Rest of World (-9.1%, to €82 million), driven by the impact of biosimilar competitors.
SANOFI PRESS RELEASE Q3 2026
4
Rezurock (chronic graft‑versus‑host disease) sales were €165 million and increased by 43.0% from strong growth in Rest of World (+40.0%, to €21 million). Sales in Europe were €19 million and in the US €125 million (+24.0%), supported by price.
Praluent (primary hypercholesterolemia, mixed dyslipidemia) sales were €156 million and increased by 20.5% from higher sales in Europe (+24.5%, to €133 million).
Thymoglobulin (rejection prevention in kidney transplantation) sales were €134 million and increased by 10.2%, mainly driven by Rest of World (+13.5%, to €46 million).
Aprovel (antihypertension, cardiovascular disease) sales were €103 million and decreased by 1.0%, with sales coming mainly from Rest of World (€84 million, -1.2%).
Tzield/Teizeild (diabetes) sales were €42 million and increased by 127.8%. Sales in the US were €39 million and €3 million in Europe where launch is underway in Germany. A total of almost 1,100 patients have now received treatment with Tzield/Teizeild.
Vaccines
Net sales
(€ million)
Q3 2026
Change at CER
YTD 2026
Change at CER
Influenza, COVID-19
1,256
-18.8
%
1,377
-21.7
%
Polio/pertussis/hib primary and boosters, incl. Heplisav-B
823
+24.9
%
2,187
+9.9
%
Beyfortus
631
-15.4
%
1,023
-6.1
%
Meningitis, travel, and endemic
476
+4.2
%
1,041
-0.5
%
Total
3,185
-6.6
%
5,628
-4.3
%
Vaccines sales were €3,185 million and decreased by 6.6%, mainly driven by phasing of influenza and lower Beyfortus US sales.
Influenza, COVID-19 vaccines sales were €1,256 million and decreased by 18.8%, mainly due to phasing of seasonal deliveries in the Northern Hemisphere with a higher proportion in the fourth quarter compared to 2025.
Polio/pertussis/hib primary and booster vaccines, including Heplisav-B sales were €823 million and increased by 24.9%. Sales in the US (€353 million, +69.8%) continued to benefit from newly acquired Heplisav-B while sales in Rest of World (€347 million, +0.3%) were impacted by fewer childbirths, primarily in China.
Beyfortus sales were €631 million and decreased by 15.4%, driven by the US (€240 million, -39.3%), including a lower central order from the Centers for Disease Control and Prevention. This was partly offset by Europe (€266 million, +1.9%) and Rest of World (€125 million, +38.2%) benefiting from the expanded geographical availability as Beyfortus is now protecting babies in more than 50 countries.
Meningitis, travel, and endemic vaccines sales were €476 million and increased by 4.2% from higher sales in all geographies.
Pipeline update
Sanofi has 61 projects in a pipeline across three main areas (Immunology, Rare diseases, and Vaccines) and selectively in the disease areas of Neurology and Oncology, including 36 potential new medicines and vaccines. The following section highlights significant developments in the late- and mid-stage pipeline since the prior results press release.
Highlights
Abbreviations used in the table below are explained in the body text:
Beyfortus – RSV, 2nd season – priority review (CN) SP0289 – influenza H5 pandemic – PRIME (EU)
The list of all pipeline changes is available from the Q3 2026 results investor presentation, pipeline appendix.
Immunology
Tzield/Teizeild (teplizumab)
The European Medicines Agency (EMA) accepted Teizeild for regulatory review to delay the onset of stage 3 type 1 diabetes (T1D) in patients aged one to seven years diagnosed with stage 2 T1D. Teizeild is already approved for this indication in adults and children aged eight years and older.
lunsekimig (IL13xTSLP Nanobody® VHH)
At the European Respiratory Society Congress 2026 in Barcelona, Spain, positive phase 2 data from two separate studies showed that lunsekimig, targeting thymic stromal lymphopoietin (TSLP) and interleukin-13 (IL13), led to clinically meaningful improvements in patients with asthma and CRSwNP.
•The AIRCULES phase 2b dose-ranging study (clinical study identifier: NCT06102005) evaluated the efficacy, safety, and tolerability of lunsekimig in addition to standard of care therapy over 48 weeks in adult patients with moderate-to-severe asthma who had one or more exacerbations in the preceding year, compared with placebo. Lunsekimig 300 mg every four weeks (Q4W) achieved a statistically significant and clinically meaningful reduction in the annual asthma exacerbation rate
SANOFI PRESS RELEASE Q3 2026
5
over 48 weeks compared to placebo, regardless of biomarker status, meeting the study’s primary objective. The study also met the key secondary endpoint, demonstrating statistically significant and clinically meaningful improvements in lung function at week 48, as measured by pre-bronchodilator forced expiratory volume in 1 second compared to placebo, which was observed as early as week 4 and sustained through week 48. In addition, patients reported improvements in scores for the asthma control questionnaire.
•The DUET phase 2a proof-of-concept study (clinical study identifier: NCT06454240) evaluated the efficacy, safety, and tolerability of lunsekimig 300 mg Q4W in addition to standard-of-care therapy, in adult patients with CRSwNP compared with placebo at week 24. Lunsekimig demonstrated statistically significant and clinically meaningful improvements across all primary and key secondary endpoints.
In both studies, lunsekimig was well-tolerated.
Rare diseases
Ayvakit (avapritinib)
The US FDA approved a label update for Ayvakit including a 50 mg daily dose option in adults with indolent systemic mastocytosis (ISM), for use as clinically indicated after at least six months of treatment at 25 mg daily, which remains the recommended starting dose. ISM is defined by a broad spectrum of disease activity that varies by patient, highlighting the importance of providing flexibility to healthcare providers to address these diverse medical needs. This label update was based on observed data for Ayvakit 50 mg from the long-term, open-label extension portion of the PIONEER clinical trial (clinical study identifier: NCT03731260).
Vaccines
MenQuadfi (meningococcal disease)
The EU approved an extension of the indication for MenQuadfi (Meningococcal Group A, C, W and Y conjugate vaccine) to include infants from six weeks of age to help protect against invasive meningococcal disease caused by Neisseria meningitidis serogroups A, C, W, and Y. MenQuadfi was previously approved in the EU for use in individuals aged 12 months and older.
Invasive meningococcal disease is a life-threatening bacterial infection that can progress rapidly, with patients potentially deteriorating from the onset of symptoms to death within 24 hours. Infants are among the populations at highest risk for invasive meningococcal disease, facing high rates of mortality and severe long-term complications. Although serogroup A is now rarely reported in the EU, serogroups C, W, and Y remain responsible for a significant share of invasive meningococcal disease cases.
Beyfortus (nirsevimab)
The Chinese National Medical Products Administration granted a priority review to Beyfortus for the regulatory submission to extend the indication to children up to 24 months of age during their second respiratory syncytial virus (RSV) season. Beyfortus is currently approved for the prevention of RSV lower respiratory tract infection in neonates and infants entering or during their first RSV season.
SP0087 (rabies)
The EMA’s Committee for Medicinal Products for Human Use (CHMP) issued a positive opinion for SP0087 for pre- and post-exposure prophylaxis against rabies in all age groups. This next-generation vaccine is highly purified, free from human and animal-origin materials, with enhanced thermostability and longer shelf-life.
SP0289 (influenza H5 pandemic)
The CHMP granted PRIME eligibility to the second generation structurally designed mRNA influenza H5 pandemic vaccine. This pandemic preparedness vaccine is intended for prevention of influenza in case of an officially declared pandemic. The CHMP acknowledged the vaccine's potential to address unmet medical need, noting the mRNA platform enables rapid manufacturing and adaptation to emerging virus variants or novel pandemic strains.
A status on the Sanofi pipeline as of September 30, 2026, is available at: https://www.sanofi.com/en/our-science/our-pipeline.
SANOFI PRESS RELEASE Q3 2026
7
Sustainability update
Acting for nature: reducing dependencies, building resilience
Biodiversity is a key focus area in the efforts to limit the impact on nature and reduce to a minimum the use of natural resources.
Sanofi has completed a nature-related risk and dependency analysis across its operations and value chain. The analysis identified four critical nature-based commodities: horseshoe crab blood, palm oil, cattle, and pig derivatives. Although the projected cost impacts are financially immaterial, Sanofi is proactively strengthening its long-term resilience through targeted adaptation measures.
Horseshoe crab blood is essential for testing the safety of injectable medicines and vaccines, as required by regulators. Sanofi is accelerating its transition to synthetic alternatives and has an action plan with the following targets to be achieved by the end of 2030: (1) 70% of endotoxin tests performed without horseshoe crab reagents in all Sanofi quality control laboratories; (2) All new launches submitted with synthetic method.
This plan reinforces Sanofi's commitment to reducing its impact on nature, while safeguarding uninterrupted access to medicines for patients worldwide.
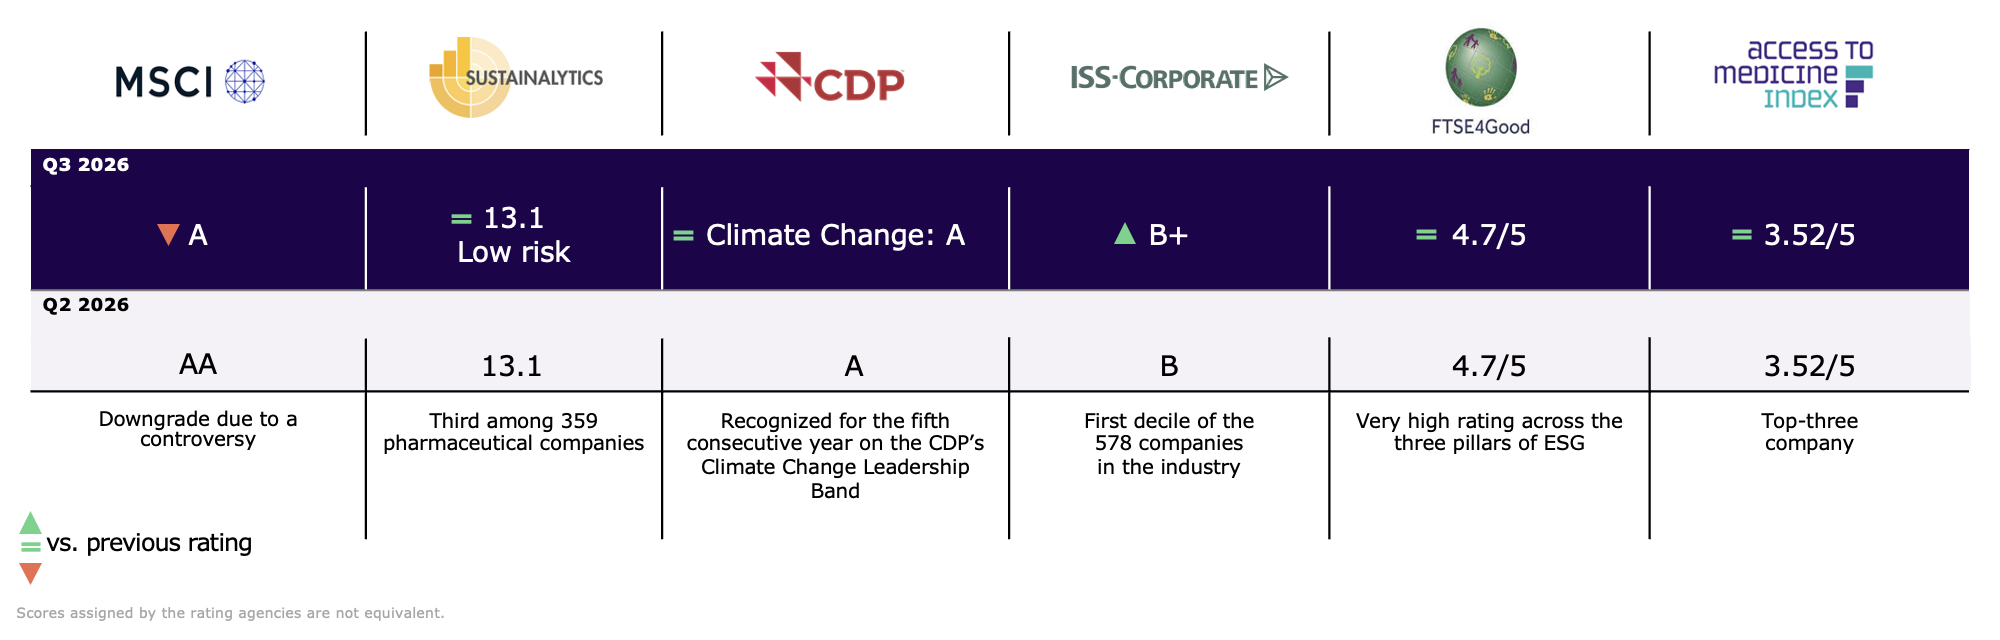
ESG ratings
Sanofi’s current ESG rankings:
SANOFI PRESS RELEASE Q3 2026
8
Q3 and YTD 2026 financial results
Business net income1
Net sales were €14,444 million in Q3 2026 and increased by 16.2% (14.3% at CER) from €12,434 million in Q3 2025. In YTD 2026, net sales were €36,550 million and increased by 13.1% (15.2% at CER) from €32,323 million in YTD 2025.
Other revenues were €789 million in Q3 2026 and increased by 7.2% (5.6% at CER) from €736 million in Q3 2025. VaxServe sales of non-Sanofi vaccines were €494 million and increased by 2.1% (0.4% at CER). In addition, other revenues included sales of Opella consumer-health products in certain markets (€149 million), manufacturing services and other (€75 million), royalties (€49 million), and supply sales to Opella (€22 million). In YTD 2026, other revenues were €2,227 million and increased by 1.8% (3.7% at CER) from €2,188 million in YTD 2025. VaxServe sales of non-Sanofi vaccines were €1,240 million and decreased by 6.5% (3.4% at CER). In addition, other revenues included sales of Opella consumer-health products in certain markets (€419 million), manufacturing services and other (€346 million), royalties (€140 million), and supply sales to Opella (€82 million).
Business gross profit was €11,698 million in Q3 2026 and increased by 19.2% (17.2% at CER) from €9,815 million in Q3 2025. The business gross margin was 81.0% and increased by 2.1pp (81.0% at CER, up by 2.1pp). The margin improvement in Q3 was driven by improved product mix, including a higher proportion of specialty care and rare disease medicines and an element of benefit from favourable gross-to-net price adjustments. In YTD 2026, business gross profit was €29,297 million and increased by 15.9% (18.3% at CER) from €25,275 million in YTD 2025. The business gross margin was 80.2% and increased by 2.0pp (80.3% at CER, up by 2.1pp).
Research and Development expenses were €1,849 million in Q3 2026 and increased by 0.8% (down by 0.1% at CER) from €1,834 million in Q3 2025, mainly reflecting past project terminations in Vaccines. The ratio of R&D to net sales was 12.8% and decreased by 1.9pp (12.9% at CER, down by 1.8pp). In YTD 2026, R&D expenses were €5,829 million and increased by 5.0% (6.6% at CER) from €5,551 million in YTD 2025. The ratio of R&D to net sales was 15.9% and decreased by 1.3pp (15.9% at CER, down by 1.3pp).
Selling and general expenses were €2,309 million in Q3 2026 and increased by 0.8% (down by 0.9% at CER) from €2,291 million in Q3 2025, reflecting cost discipline. The ratio of expenses to net sales was 16.0% and decreased by 2.4pp (16.0% at CER, down by 2.4pp). In YTD 2026, SG&A expenses were €7,101 million and increased by 4.5% (6.5% at CER) from €6,797 million in YTD 2025. The ratio of SG&A to net sales was 19.4% and decreased by 1.6pp (19.4% at CER, down by 1.6pp).
Other operating income net of expenses was -€2,168 million in Q3 2026 and increased by 66.4% (64.4% at CER) from -€1,303 million in Q3 2025. In YTD 2026, other operating income net of expenses was -€4,804 million and increased by 48.0% (53.9% at CER) from -€3,246 million in YTD 2025. Details are available from the table below:
(€ million)
Q3 2026
Q3 2025
YTD 2026
YTD 2025
Net gains/(losses) on disposals of operating assets or businesses
14
85
255
428
of which medicine divestments/portfolio streamlining
(3)
85
225
419
Amvuttra® licensing income
296
138
694
258
Other
74
74
235
144
Total other operating income
384
297
1,184
830
Regeneron alliance:
(2,399)
(1,369)
(5,627)
(3,696)
(i) (Profit)/loss sharing
(2,230)
(1,487)
(5,716)
(3,962)
(ii) Additional profit share for development cost from Regeneron
11
293
605
787
(iii) Selling expense reimbursements to Regeneron
(180)
(175)
(516)
(521)
Other
(153)
(231)
(361)
(380)
Total other operating expenses
(2,552)
(1,600)
(5,988)
(4,076)
Other operating income/(expense), net
(2,168)
(1,303)
(4,804)
(3,246)
Share of profit from investments accounted for using the equity method was €62 million in Q3 2026 and unchanged from €62 million in Q3 2025 and mainly included the share of profit related to Vaxelis. EUROAPI and Opella are included only in the IFRS accounts (please see the net income reconciliation below). In YTD 2026, the share of profit from investments accounted for using the equity method was €136 million compared to €139 million in YTD 2025 and mainly included the share of profit related to Vaxelis.
Business operating income was €5,430 million in Q3 2026 and increased by 22.2% (19.7% at CER) from €4,445 million in Q3 2025. The ratio of BOI to net sales was 37.6% and increased by 1.9pp (37.4% at CER, up by 1.7pp). The increase was mainly driven by growth in business gross profit and operating leverage partly offset by the increase in other operating expenses from higher profit sharing to Sanofi’s collaboration partner Regeneron. In YTD 2026, BOI was €11,688 million and increased by 19.2% (21.1% at CER) from €9,808 million in YTD 2025. The ratio of BOI to net sales was 32.0% and increased by 1.7pp (31.9% at CER, up by 1.6pp).
Net financial expenses were €101 million in Q3 2026 compared to €64 million in Q3 2025, reflecting higher net debt in the quarter. In YTD 2026, net financial expenses were €283 million compared to €191 million in YTD 2025, similarly reflecting higher net debt.
1 See Appendix 3 for the IFRS consolidated income statement, see Appendix 8 for definitions of non-IFRS financial measures, and see Appendix 4 for
a reconciliation of IFRS net income to business net income.
SANOFI PRESS RELEASE Q3 2026
9
The effective tax rate was 20.4% in Q3 2026 and increased from 19.3% in Q3 2025. Generally, the effective tax rate will fluctuate from quarter to quarter. In YTD 2026, the effective tax rate was 21.1% and increased from 20.2% in YTD 2025. Following decisions made on the pipeline, Sanofi now anticipates an effective tax rate in 2026 of c.21%.
Business net income was €4,255 million in Q3 2026 and increased by 20.0% (+17.6% at CER) from €3,547 million in Q3 2025. The ratio of business net income to net sales was 29.5% and increased by 1.0pp (29.3% at CER, up by 0.8pp). In YTD 2026, business net income was €9,020 million and increased by 17.2% (19.1% at CER) from €7,699 million in YTD 2025. The ratio of business net income to net sales was 24.7% and increased by 0.9pp (24.6% at CER, up by 0.8pp).
Business earnings per share (business EPS) was €3.55 in Q3 2026 and increased by 22.0% (19.6% at CER) from €2.91 in Q3 2025. The average number of shares outstanding was 1,200.0 million in Q3 2026 compared to 1,218.1 million in Q3 2025. In YTD 2026, business EPS was €7.52 and increased by 19.4% (21.3% at CER) from €6.30 in YTD 2025. The average number of shares outstanding was 1,200.2 million in YTD 2026 compared to 1,223.0 million in YTD 2025.
Opella
On April 30, 2025, Sanofi and CD&R closed the Opella transaction, creating an independent global consumer healthcare leader. Sanofi retained a significant shareholding in Opella through a 48.2% equity interest in OPAL JV Co, which indirectly holds 100% of Opella. Bpifrance owns 1.8% and CD&R the remaining 50.0%. The transaction was completed on the terms previously disclosed, and Sanofi received net cash proceeds of €10.4 billion in 2025. To aid the ongoing assessment of the value of Sanofi’s Opella stake, Opella’s summary financials are disclosed at Q2/H1 and Q4/FY financial results.
Reconciliation of IFRS net income to business net income (see Appendix 4)
In YTD 2026, IFRS net income was €4,979 million. The main items excluded from business net income were:
•Net income from discontinued operations, amounting to €26 million.
•Amortisation expense of €1,643 million. Of this, €1,579 million related to intangible assets measured at their acquisition-date fair values (Ayvakit €442 million, Bioverativ €430 million, Tzield €157 million, Ablynx €123 million, Rezurock €114 million, Beyfortus €88 million, Heplisav-B €63 million, and Aventis €3 million), and €64 million related to intangible assets from other acquisitions and initially measured at acquisition cost (licenses/products). These items had no cash impact.
•Impairment expense of €1,018 million, mainly comprising a €952 million impairment loss related to the amlitelimab intangible asset booked in Q2 2026.
•The €307 million impact of the unwinding of the step-up of inventories remeasured at their acquisition-date fair values, which relates to the Blueprint and Dynavax acquisitions and is reported within cost of sales in the IFRS consolidated income statement.
•Restructuring costs and similar items of €648 million, mainly related to redundancy plans of €308 million, expenses related to assets of €225 million, and integration and acquisition costs of €91 million (including Blueprint and Dynavax).
•Other gains and losses, and litigation, of €382 million, mainly related to ongoing major litigations.
•A financial expense of €191 million related to the re-measurement of the liability related to royalties on Beyfortus US sales.
•A €566 million tax effect arising from the items listed above, mainly comprising €290 million of deferred taxes generated by amortisation and impairment of intangible assets, and €105 million associated with restructuring costs and similar items.
•Other items included Sanofi’s share of losses from investments accounted for using the equity method, relating to its associates EUROAPI and OPAL JV Co (Opella).
Cash flow
In YTD 2026, after a decrease in net working capital of €801 million and capital expenditures of €1,512 million, free cash flow before restructuring, acquisitions, and disposals amounted to €7,771 million. After cash outflows of €599 million related to restructuring and similar items and of €674 million related to acquisitions1, and proceeds from disposals1 of €495 million, free cash flow2 was €6,993 million.
Net debt
Net debt increased by €1,213 million. Free cash flow of €6,993 million was more than offset by: the acquisition of Dynavax for €1,645 million; the share buyback of €1,013 million; the dividend payout of €4,923 million; the net cash outflow from the Opella transaction of €225 million; a negative foreign exchange impact on net debt of €219 million; and other negative items of €181 million. As a result, net debt increased from €10,988 million on January 1, 2026 (after the adjustment from the IFRS 9 amendment at the start of the period) to €12,201 million on September 30, 2026 (net of €5,966 million in cash and cash equivalents).
Shareholder return
On April 29, 2026, at the annual general meeting, shareholders approved the proposed dividend of €4.12 per share for 2025, marking 31 years of consecutive dividend increases. Additionally, Sanofi executed a €1 billion share buyback programme in 2026, with the purpose of share cancellation. The programme was completed in April 2026.
1 Not exceeding €500 million per transaction (inclusive of all payments related to the transaction).
2 Non-IFRS financial measure (see definition in Appendix 8).
Appendix 1: Q3 2026 net sales by medicine/vaccine and geography
Q3 2026
(€ million)
Total sales
Change at CER
Change
US
Change at CER
Europe
Change at CER
Rest of World
Change at CER
Immunology
Dupixent
5,687
+34.8
%
+36.8
%
4,376
+40.2
%
588
+16.1
%
723
+22.6
%
Kevzara
222
+67.9
%
+69.5
%
167
+87.4
%
38
+22.6
%
17
+46.2
%
Rare diseases
ALTUVIIIO (*)
408
+37.8
%
+38.8
%
345
+37.2
%
—
—
%
63
+40.4
%
Fabrazyme
260
+6.2
%
+7.4
%
138
+8.9
%
63
+1.6
%
59
+5.4
%
Nexviazyme/Nexviadyme (*)
211
+4.0
%
+5.5
%
114
+14.3
%
66
-12.2
%
31
+10.7
%
Ayvakit (*)
203
+46.0
%
+48.2
%
178
+47.1
%
23
+43.8
%
2
0.0
%
Cerezyme
173
+6.2
%
+7.5
%
44
-2.3
%
54
-3.6
%
75
+21.3
%
Alprolix
172
+13.4
%
+15.4
%
117
+7.5
%
—
—
%
55
+27.9
%
Myozyme/Lumizyme
105
-15.6
%
-13.9
%
37
-9.8
%
33
-20.0
%
35
-17.1
%
Cerdelga
95
+8.1
%
+10.5
%
55
+20.0
%
35
-2.7
%
5
-25.0
%
Aldurazyme
77
-3.8
%
-2.5
%
20
+11.8
%
20
0.0
%
37
-11.9
%
Cablivi (*)
70
+6.1
%
+6.1
%
39
+8.6
%
26
+4.0
%
5
0.0
%
Xenpozyme (*)
63
+8.8
%
+10.5
%
27
+17.4
%
22
0.0
%
14
+8.3
%
Eloctate
45
-41.6
%
-41.6
%
33
-22.0
%
—
—
%
12
-63.9
%
Wayrilz (*)
19
+1800.0
%
+1800.0
%
19
+1800.0
%
—
—
%
—
—
%
Qfitlia (*)
8
+75.0
%
+100.0
%
7
+75.0
%
—
—
%
1
—
%
Myqorzo (*)
3
—
%
—
%
—
—
%
—
—
%
3
—
%
Anxu (*)
1
—
%
—
%
—
—
%
—
—
%
1
—
%
Redemplo (*)
1
—
%
—
%
—
—
%
—
—
%
1
—
%
Oncology
Sarclisa (*)
196
+25.8
%
+26.5
%
73
+18.0
%
59
+28.3
%
64
+33.3
%
Jevtana
67
+8.1
%
+8.1
%
53
+8.5
%
1
0.0
%
13
+7.1
%
Other main medicines
Lantus
530
+18.5
%
+21.0
%
293
+35.0
%
73
-2.7
%
164
+5.4
%
Toujeo
430
+31.2
%
+34.0
%
124
+121.8
%
130
+4.8
%
176
+19.0
%
Plavix
206
-10.8
%
-7.6
%
1
0.0
%
20
-9.1
%
185
-11.0
%
Lovenox
174
-12.8
%
-11.2
%
3
+200.0
%
89
-17.8
%
82
-9.1
%
Rezurock (*)
165
+43.0
%
+44.7
%
125
+24.0
%
19
0.0
%
21
+40.0
%
Praluent
156
+20.5
%
+22.8
%
—
—
%
133
+24.5
%
23
0.0
%
Thymoglobulin
134
+10.2
%
+13.6
%
77
+6.9
%
11
+22.2
%
46
+13.5
%
Aprovel
103
-1.0
%
+3.0
%
2
+100.0
%
17
-5.6
%
84
-1.2
%
Soliqua/iGlarLixi
93
+45.2
%
+50.0
%
40
+105.3
%
12
-15.4
%
41
+33.3
%
Multaq
93
+17.9
%
+19.2
%
85
+18.3
%
2
0.0
%
6
+20.0
%
Apidra
69
+3.1
%
+6.2
%
4
+33.3
%
23
-11.1
%
42
+11.4
%
Synvisc
47
-9.8
%
-7.8
%
30
-9.4
%
3
-25.0
%
14
-6.7
%
Tzield/Teizeild (*)
42
+127.8
%
+133.3
%
39
+123.5
%
3
+100.0
%
0
0.0
%
Others
842
-7.3
%
-5.6
%
99
+10.6
%
235
-14.0
%
508
-7.0
%
Industrial Sales
89
-7.4
%
-6.3
%
(2)
—
%
91
-5.3
%
—
—
%
Vaccines
Influenza, COVID-19 (**)
1,256
-18.8
%
-17.6
%
911
-13.4
%
243
-32.0
%
102
-26.0
%
Polio/pertussis/hib primary and boosters, incl. Heplisav-B (**)
823
+24.9
%
+28.2
%
353
+69.8
%
123
+15.1
%
347
+0.3
%
Beyfortus (**)
631
-15.4
%
-14.6
%
240
-39.3
%
266
+1.9
%
125
+38.2
%
Meningitis, travel, and endemic
476
+4.2
%
+5.5
%
335
+5.1
%
59
+1.8
%
82
+2.5
%
Biopharma
14,444
+14.3
%
+16.2
%
8,603
+23.9
%
2,579
-0.9
%
3,262
+5.7
%
Pharma launches (*)
1,390
+31.4
%
+32.9
%
966
+34.9
%
218
+17.5
%
206
+31.6
%
Launches (*), (**)
2,176
+19.2
%
+20.6
%
1,360
+20.1
%
484
+8.3
%
332
+34.4
%
SANOFI PRESS RELEASE Q3 2026
13
Appendix 1: YTD 2026 net sales by medicine/vaccine and geography
YTD 2026
(€ million)
Total sales
Change at CER
Change
US
Change at CER
Europe
Change at CER
Rest of World
Change at CER
Immunology
Dupixent
15,011
+34.5
%
+30.9
%
11,298
+39.8
%
1,734
+19.2
%
1,979
+21.5
%
Kevzara
523
+42.3
%
+39.1
%
374
+60.9
%
111
+14.6
%
38
—
%
Rare diseases
ALTUVIIIO (*)
1,082
+34.2
%
+29.4
%
921
+35.4
%
—
—
%
161
+27.8
%
Fabrazyme
783
+4.7
%
+2.1
%
394
+6.0
%
201
+2.0
%
188
+4.8
%
Nexviazyme/Nexviadyme (*)
637
+10.9
%
+8.5
%
325
+15.0
%
218
+5.3
%
94
+10.2
%
Ayvakit (*)
570
+329.2
%
+316.1
%
500
+334.5
%
67
+318.8
%
3
+100.0
%
Cerezyme
525
+0.8
%
+0.2
%
130
0.0
%
180
+2.3
%
215
0.0
%
Alprolix
454
+3.3
%
0.0
%
332
-0.6
%
—
—
%
122
+15.7
%
Myozyme/Lumizyme
325
-17.4
%
-18.1
%
114
-9.8
%
95
-31.4
%
116
-10.2
%
Cerdelga
278
+12.3
%
+10.3
%
156
+20.9
%
109
+3.8
%
13
-7.7
%
Aldurazyme
224
-6.2
%
-7.4
%
56
+9.4
%
64
+1.6
%
104
-16.7
%
Cablivi (*)
223
+12.9
%
+10.4
%
126
+22.6
%
84
+5.0
%
13
-12.5
%
Xenpozyme (*)
190
+15.0
%
+13.8
%
74
+10.0
%
66
0.0
%
50
+58.1
%
Eloctate
187
-7.1
%
-11.8
%
110
-16.7
%
—
—
%
77
+10.8
%
Wayrilz (*)
46
+4600.0
%
+4500.0
%
46
+4600.0
%
—
—
%
—
—
%
Qfitlia (*)
20
+300.0
%
+300.0
%
19
+300.0
%
—
—
%
1
—
%
Myqorzo (*)
6
—
%
—
%
—
—
%
—
—
%
6
—
%
Anxu (*)
1
—
%
—
%
—
—
%
—
—
%
1
—
%
Redemplo (*)
1
—
%
—
%
—
—
%
—
—
%
1
—
%
Oncology
Sarclisa (*)
550
+30.4
%
+27.6
%
205
+17.8
%
167
+29.5
%
178
+50.0
%
Jevtana
203
+5.4
%
0.0
%
147
-1.9
%
2
-33.3
%
54
+33.3
%
Other main medicines
Lantus
1,343
+3.7
%
+2.2
%
637
+8.0
%
219
-2.7
%
487
+1.0
%
Toujeo
1,159
+15.0
%
+14.4
%
258
+47.0
%
389
+4.0
%
512
+11.3
%
Plavix
646
-6.5
%
-7.2
%
3
0.0
%
60
-9.1
%
583
-6.2
%
Lovenox
538
-17.3
%
-16.3
%
8
-20.0
%
291
-18.9
%
239
-15.1
%
Praluent
473
+19.0
%
+20.1
%
—
—
%
398
+25.4
%
75
-6.3
%
Rezurock (*)
461
+25.7
%
+22.3
%
343
+11.3
%
55
+150.0
%
63
+80.0
%
Thymoglobulin
391
+9.0
%
+6.8
%
234
+7.5
%
31
+3.3
%
126
+13.6
%
Aprovel
321
+2.6
%
+2.9
%
3
-25.0
%
50
-5.7
%
268
+4.7
%
Soliqua/iGlarLixi
258
+30.8
%
+30.3
%
93
+50.8
%
36
-7.7
%
129
+33.3
%
Multaq
244
+6.3
%
+2.5
%
222
+6.9
%
7
0.0
%
15
0.0
%
Apidra
209
+2.0
%
+2.0
%
6
-25.0
%
74
-6.3
%
129
+9.3
%
Synvisc
140
-14.5
%
-15.2
%
89
-8.0
%
12
-7.7
%
39
-28.8
%
Tzield/Teizeild (*)
79
+70.2
%
+68.1
%
71
+63.6
%
7
+200.0
%
1
+100.0
%
Others
2,542
-10.4
%
-10.8
%
261
-18.1
%
749
-13.7
%
1,532
-7.2
%
Industrial Sales
279
-17.9
%
-19.4
%
5
+400.0
%
272
-17.6
%
2
-77.8
%
Vaccines
Polio/pertussis/hib primary and boosters, incl. Heplisav-B (**)
2,187
+9.9
%
+9.2
%
840
+64.6
%
329
-0.3
%
1,018
-12.2
%
Influenza, COVID-19 (**)
1,377
-21.7
%
-20.8
%
927
-15.9
%
276
-32.4
%
174
-29.7
%
Meningitis, travel, and endemic
1,041
-0.5
%
-1.8
%
603
-3.0
%
177
+15.0
%
261
-3.3
%
Beyfortus (**)
1,023
-6.1
%
-6.6
%
305
-33.0
%
353
+2.0
%
365
+26.4
%
Biopharma
36,550
+15.2
%
+13.1
%
20,236
+27.4
%
6,883
+1.9
%
9,431
+3.1
%
Pharma launches (*)
3,866
+42.3
%
+38.6
%
2,630
+47.7
%
664
+27.1
%
572
+37.6
%
Launches (*), (**)
5,223
+36.7
%
+33.8
%
3,251
+44.4
%
1,030
+18.7
%
942
+33.6
%
SANOFI PRESS RELEASE Q3 2026
14
Appendix 2: Business net income
Q3 2026
Biopharma
Other
Total group
(€ million)
Q3 2026
Q3 2025
Change
Q3 2026
Q3 2025
Change
Q3 2026
Q3 2025
Change
Net sales
14,444
12,434
+16.2
%
—
—
—
%
14,444
12,434
+16.2
%
Other revenues
640
611
+4.7
%
149
125
+19.2
%
789
736
+7.2
%
Cost of sales
(3,462)
(3,292)
+5.2
%
(73)
(63)
+15.9
%
(3,535)
(3,355)
+5.4
%
As % of net sales
(24.0
%)
(26.5
%)
2.5pp
—
%
—
%
(24.5
%)
(27.0
%)
2.5pp
Business gross profit
11,622
9,753
+19.2
%
76
62
+22.6
%
11,698
9,815
+19.2
%
As % of net sales
80.5
%
78.4
%
2.1pp
—
%
—
%
81.0
%
78.9
%
2.1pp
Research and development expenses
(1,848)
(1,834)
+0.8
%
(1)
—
—
%
(1,849)
(1,834)
+0.8
%
As % of net sales
(12.8
%)
(14.7
%)
1.9pp
—
%
—
%
(12.8
%)
(14.7
%)
1.9pp
Selling and general expenses
(2,256)
(2,242)
+0.6
%
(53)
(49)
+8.2
%
(2,309)
(2,291)
+0.8
%
As % of net sales
(15.6
%)
(18.0
%)
2.4pp
—
%
—
%
(16.0
%)
(18.4
%)
2.4pp
Other operating income/(expenses)
(2,177)
(1,282)
+69.8
%
9
(21)
-142.9
%
(2,168)
(1,303)
+66.4
%
Share of profit/(loss) from investments accounted for using the equity method1
62
47
—
15
62
62
Net income attributable to non-controlling interests
(4)
(4)
—
—
(4)
(4)
Business operating income
5,399
4,438
+21.7
%
31
7
+342.9
%
5,430
4,445
+22.2
%
As % of net sales
37.4
%
35.7
%
1.7pp
—
%
—
%
37.6
%
35.7
%
1.9pp
Financial income and expenses
(101)
(64)
+57.8
%
Income tax expenses
(1,074)
(834)
+28.8
%
Effective tax rate2
(20.4
%)
(19.3
%)
Business net income
4,255
3,547
+20.0
%
As % of net sales
29.5
%
28.5
%
1.0pp
Business EPS (in euros)3
3.55
2.91
+22.0
%
1 Net of tax.
2 Non-IFRS financial measure (see definition in Appendix 8).
3 Based on an average number of shares outstanding of 1,200.0 million in Q3 2026 and 1,218.1 million in Q3 2025.
SANOFI PRESS RELEASE Q3 2026
15
YTD 2026
Biopharma
Other
Total group
(€ million)
YTD 2026
YTD 2025
Change
YTD 2026
YTD 2025
Change
YTD 2026
YTD 2025
Change
Net sales
36,550
32,323
+13.1
%
—
—
—
%
36,550
32,323
+13.1
%
Other revenues
1,808
1,857
-2.6
%
419
331
+26.6
%
2,227
2,188
+1.8
%
Cost of sales
(9,274)
(9,045)
+2.5
%
(206)
(191)
+7.9
%
(9,480)
(9,236)
+2.6
%
As % of net sales
(25.4
%)
(28.0
%)
2.6pp
—
%
—
%
(25.9
%)
(28.6
%)
2.7pp
Business gross profit
29,084
25,135
+15.7
%
213
140
+52.1
%
29,297
25,275
+15.9
%
As % of net sales
79.6
%
77.8
%
1.8pp
—
%
—
%
80.2
%
78.2
%
2.0pp
Research and development expenses
(5,827)
(5,550)
+5.0
%
(2)
(1)
+100.0
%
(5,829)
(5,551)
+5.0
%
As % of net sales
(15.9
%)
(17.2
%)
1.3pp
—
%
—
%
(15.9
%)
(17.2
%)
1.3pp
Selling and general expenses
(6,946)
(6,689)
+3.8
%
(155)
(108)
+43.5
%
(7,101)
(6,797)
+4.5
%
As % of net sales
(19.0
%)
(20.7
%)
1.7pp
—
%
—
%
(19.4
%)
(21.0
%)
1.6pp
Other operating income/(expenses)
(4,807)
(3,223)
+49.1
%
3
(23)
-113.0
%
(4,804)
(3,246)
+48.0
%
Share of profit/(loss) of investments accounted for using the equity method1
136
124
—
15
136
139
Net income attributable to non-controlling interests
(11)
(12)
—
—
(11)
(12)
Business operating income
11,629
9,785
+18.8
%
59
23
+156.5
%
11,688
9,808
+19.2
%
As % of net sales
31.8
%
30.3
%
1.5pp
—
%
—
%
32.0
%
30.3
%
1.7pp
Financial income and expenses
(283)
(191)
+48.2
%
Income tax expenses
(2,385)
(1,918)
+24.3
%
Effective tax rate2
(21.1
%)
(20.2
%)
Business net income
9,020
7,699
+17.2
%
As % of net sales
24.7
%
23.8
%
0.9pp
Business EPS (in euros)3
7.52
6.30
+19.4
%
1 Net of tax.
2 Non-IFRS financial measure (see definition in Appendix 8).
3 Based on an average number of shares outstanding of 1,200.2 million in YTD 2026 and 1,223.0 million in YTD 2025.
SANOFI PRESS RELEASE Q3 2026
16
Appendix 3: Consolidated income statement
(€ million)
Q3 2026
Q3 2025
YTD 2026
YTD 2025
Net sales
14,444
12,434
36,550
32,323
Other revenues
789
736
2,227
2,188
Cost of sales
(3,632)
(3,412)
(9,787)
(9,293)
Gross profit
11,601
9,758
28,990
25,218
Research and development expenses
(1,849)
(1,834)
(5,829)
(5,551)
Selling and general expenses
(2,309)
(2,291)
(7,101)
(6,797)
Other operating income
384
297
1,184
830
Other operating expenses
(2,552)
(1,600)
(5,988)
(4,076)
Amortisation of intangible assets
(556)
(461)
(1,643)
(1,238)
Impairment of intangible assets
13
(18)
(1,018)
(228)
Fair value remeasurement of contingent consideration
(10)
(56)
(47)
(117)
Restructuring costs and similar items
(86)
(172)
(648)
(602)
Other gains and losses, and litigation
(287)
—
(382)
(57)
Operating income
4,349
3,623
7,518
7,382
Financial expenses
(222)
(227)
(688)
(588)
Financial income
77
114
214
298
Income before tax and investments accounted for using the equity method
4,204
3,510
7,044
7,092
Income tax expense
(1,195)
(680)
(2,065)
(1,391)
Share of profit/(loss) from investments accounted for using the equity method
20
(2)
22
83
Net income from continuing operations
3,029
2,828
5,001
5,784
Net income from discontinued operations
—
(20)
26
2,861
Net income
3,029
2,808
5,027
8,645
Net income attributable to non-controlling interests
8
6
48
31
Net income attributable to equity holders of Sanofi
3,021
2,802
4,979
8,614
Average number of shares outstanding (million)
1,200.0
1,218.1
1,200.2
1,223.0
Basic earnings per share from continuing operations (€)
2.52
2.32
4.13
4.71
Basic earnings per share from discontinued operations (€)
—
(0.02)
0.02
2.33
Basic earnings per share (€)
2.52
2.30
4.15
7.04
SANOFI PRESS RELEASE Q3 2026
17
Appendix 4: Reconciliation of net income attributable to equity holders of Sanofi (IFRS) to business net income
(€ million)
Q3 2026
Q3 2025
YTD 2026
YTD 2025
Net income attributable to equity holders of Sanofi (IFRS)
3,021
2,802
4,979
8,614
Net income from discontinued operations
—
20
(26)
(2,861)
Amortisation of intangible assets1
556
461
1,643
1,238
Impairment of intangible assets
(13)
18
1,018
228
Fair value remeasurement of contingent consideration
14
59
84
127
Expenses arising from the impact of acquisitions on inventories
97
57
307
57
Restructuring costs and similar items
86
172
648
602
Other gains and losses, and litigation
287
—
382
57
Financial (income) / expense related to liabilities carried at amortised cost other than net debt
44
49
191
99
Tax effect of the items listed above:
(144)
(159)
(566)
(543)
Amortisation and impairment of intangible assets
(92)
(84)
(290)
(257)
Fair value remeasurement of contingent consideration
(3)
(14)
(9)
(28)
Expenses arising from the impact of acquisitions on inventories
(22)
(15)
(69)
(15)
Restructuring costs and similar items
(16)
(34)
(105)
(147)
Other items
(11)
(12)
(93)
(96)
Other tax effects
265
5
246
16
Other items
42
63
114
65
Business net income
4,255
3,547
9,020
7,699
Business earnings per share (€)2
3.55
2.91
7.52
6.30
Basic earnings per share (€)2
2.52
2.30
4.15
7.04
1 Of which amortisation expense generated by intangible assets measured at their acquisition-date fair values: €642 million in Q3 2026 and
€446 million in Q3 2025.
2 Based on an average number of shares outstanding of 1,200.0 million in Q3 2026 and 1,218.1 million in Q3 2025.
SANOFI PRESS RELEASE Q3 2026
18
Appendix 5: Change in net debt and summarised statement of cash flows
(€ million)
YTD 2026
YTD 2025
Business net income
9,020
7,699
Depreciation, amortisation and impairment of property, plant and equipment and software
1,103
1,080
Other items
(39)
(796)
Operating cash flow
10,084
7,983
Changes in working capital
(801)
136
Acquisitions of property, plant and equipment and software
(1,512)
(1,288)
Free cash flow before restructuring, acquisitions, and disposals
7,771
6,831
Acquisitions of intangible assets, investments, and other non-current financial assets1
(674)
(1,415)
Restructuring costs and similar items paid
(599)
(491)
Proceeds from disposals of property, plant, and equipment, intangible assets, and other non-current assets net of taxes1
495
527
Free cash flow
6,993
5,452
Acquisitions2
(1,707)
(9,546)
Proceeds from disposal, net of taxes2
29
—
Issuance of Sanofi shares
144
170
Acquisition of treasury shares and related tax effect
(1,013)
(4,128)
Dividends paid to shareholders of Sanofi
(4,923)
(4,772)
Other items
(511)
(357)
Net cash in/(out)flow from Opella transaction
(225)
10,662
Net cash provided by/(used in) the discontinued Opella business
—
136
Change in net debt before Opella reclassification to “Assets held-for-sale”
(1,213)
(2,383)
Opella net debt reclassified to held for sale as of December 31, 2024
—
98
Change in net debt
(1,213)
(2,285)
Net debt at beginning of period3
10,988
8,772
Net debt at end of period
12,201
11,057
(€ million)
YTD 2026
YTD 2025
Net cash provided by/(used in) continuing operating activities
8,514
7,118
Net cash provided by/(used in) operating activities of the discontinued Opella business
—
187
Net cash provided by/(used in) operating activities
8,514
7,305
Net cash provided by/(used in) continuing investing activities
(2,959)
(10,937)
Net cash provided by/(used in) investing activities of the discontinued Opella business
—
(36)
Net cash in/(out)flow from the Opella transaction
(225)
10,657
Net cash provided by/(used in) investing activities
(3,184)
(316)
Net cash provided by/(used in) continuing financing activities
(7,045)
(5,589)
Net cash provided by/(used in) financing activities of the discontinued Opella business
—
(48)
Net cash provided by/(used in) financing activities
(7,045)
(5,637)
Impact of exchange rates on cash and cash equivalents
18
(54)
Cash and cash equivalents reported as held for sale as of December 31, 2024
—
167
Net change in cash and cash equivalents
(1,697)
1,465
Cash and cash equivalents, beginning of period3
7,663
7,441
Cash and cash equivalents, end of period
5,966
8,906
1 Free cash flow includes investments and divestments not exceeding a cap of €500 million per transaction (inclusive of all payments related to the
transaction).
2 Includes transactions that are above a cap of €500 million per transaction (inclusive of all payments related to the transaction).
3 Includes the impact of the IFRS 9 amendment relating to the classification of financial instruments applicable from January 1, 2026.
SANOFI PRESS RELEASE Q3 2026
19
Appendix 6: Simplified consolidated balance sheet
Assets
(€ million)
September 30, 2026
December 31, 2025
Equity and liabilities
(€ million)
September 30, 2026
December 31, 2025
Equity attributable to equity holders of Sanofi
72,879
71,376
Equity attributable to non-controlling interests
362
334
Total equity
73,241
71,710
Long-term debt
14,593
14,248
Property, plant, and equipment – owned assets
10,508
10,052
Non-current lease liabilities
1,687
1,467
Right-of-use assets
1,568
1,459
Non-current liabilities related to business combinations and to non-controlling interests
666
585
Intangible assets (including goodwill)
67,626
67,561
Non-current provisions and other non-current liabilities
6,609
6,703
Non-current income tax assets
585
550
Non-current income tax liabilities
2,151
2,081
Other non-current assets, investments accounted for using the equity method and deferred tax assets
16,793
16,231
Deferred tax liabilities
1,573
1,666
Non-current assets
97,080
95,853
Non-current liabilities
27,279
26,750
Accounts payable and other current liabilities
24,553
22,926
Current liabilities related to business combinations and to non-controlling interests
0
0
Inventories, accounts receivable and other current assets
25,023
22,690
Current income tax liabilities
1,429
751
Current income tax assets
326
397
Current lease liabilities
216
272
Cash and cash equivalents
5,966
7,657
Short-term debt and current portion of long-term debt
3,349
4,342
Assets held for sale
1,892
208
Liabilities related to assets held for sale
220
54
Current assets
33,207
30,952
Current liabilities
29,767
28,345
Total assets
130,287
126,805
Total equity and liabilities
130,287
126,805
SANOFI PRESS RELEASE Q3 2026
20
Appendix 7: Currency
Actual average currency rates
Q3 2025
Q3 2026
Change
Euro/US Dollar
1.168
1.151
-1.5
%
Euro/Japanese Yen
172.290
183.257
+6.4
%
Euro/Chinese Yuan
8.365
7.760
-7.2
%
Euro/Brazilian Real
6.366
5.913
-7.1
%
Euro/Russian Ruble
94.158
94.597
+0.5
%
Actual currency split of net sales
Currency
Q3 2026
US Dollar
60.4
%
Euro
15.3
%
Chinese Yuan
5.2
%
Japanese Yen
2.4
%
Canadian Dollar
1.6
%
Brazilian Real
1.4
%
Mexican Peso
1.2
%
British Pound
1.0
%
South Korean Won
0.8
%
Turkish Lira
0.7
%
Others
10.0
%
Anticipated currency sensitivities on net sales and business EPS
Currency
Variation
2026 sensitivity on net sales
2026 sensitivity on business EPS
US Dollar
+0.05 USD/EUR
-€1,069
m
-€0.23
Japanese Yen
+5 JPY/EUR
-€46
m
-€0.02
Chinese Yuan
+0.2 CNY/EUR
-€60
m
-€0.02
Brazilian Real
+0.4 BRL/EUR
-€44
m
-€0.01
SANOFI PRESS RELEASE Q3 2026
21
Appendix 8: Definitions of non-IFRS financial measures
Sales at constant exchange rates
References to changes in net sales “at constant exchange rates” (CER) means that the effect of changes in exchange rates is eliminated. The effect of exchange rates is eliminated by recalculating net sales for the relevant period at the exchange rates used for the previous period.
Reconciliation of IFRS net sales to sales at CER
(€ million)
Q3 2026
Net sales (IFRS)
14,444
Effect of exchange rates
228
Sales at constant exchange rates
14,216
Business gross profit
Business gross profit is a non-IFRS financial measure that excludes from gross profit as reported under IFRS the impact of expenses arising from the fair value remeasurement of inventories following acquisitions that are either (i) a business combination under IFRS 3 or (ii) part of a group of assets within the meaning of paragraph 2b of IFRS 3.
Business operating income
Business operating income is a non-IFRS financial measure which is derived from operating income as reported under IFRS, after eliminating:
•amortisation and impairment losses charged against intangible assets (other than software and other rights of an industrial or operational nature);
•fair value remeasurements of contingent consideration relating to business combinations or business divestments;
•expenses arising from the remeasurement of inventories following business combinations, or acquisitions of groups of assets that do not constitute a business within the meaning of paragraph 2b of IFRS 3;
•restructuring costs and similar items; and
•gains and losses (including gains and losses on major divestments), and costs and provisions related to litigation, as reported within “Other gains and losses, and litigation” under IFRS.
In addition:
•the share of profits/losses from investments accounted for using the equity method is added, to the extent that this relates (i) to joint ventures or (ii) to associates with which Sanofi has entered into R&D agreements and/or whose operations are managed as an integral part of Sanofi’s business activities; and
•net income attributable to non-controlling interests related to continuing operations, and excluding the effects of the above reconciling items, is deducted.
Business net income
Business net income is a key non-IFRS financial measure. It is defined as net income attributable to equity holders of Sanofi as reported under IFRS, excluding:
•net income from discontinued operations;
•amortisation of intangible assets;
•impairment of intangible assets;
•fair value remeasurement of contingent consideration related to business combinations or to disposals;
•expenses arising from the impact of acquisitions on inventories;
•restructuring costs and similar items (comprising transaction, integration, and separation costs in relation to major acquisitions and disposals)1;
•other gains and losses (including gains and losses on disposals of non-current assets1);
•costs or provisions associated with litigation1;
•financial (income)/expense related to liabilities carried at amortised cost, other than net debt;
•tax effects related to the items listed above as well as effects of major tax disputes;
•the share of profits/losses from investments accounted for using the equity method, except to the extent that this relates (i) to joint ventures or (ii) to associates with which Sanofi has entered into R&D agreements and/or whose operations are managed as an integral part of Sanofi’s business activities; and,
•net income attributable to non-controlling interests related to the items listed above.
Business EPS
Sanofi also publishes business earnings per share (business EPS), a non-IFRS financial measure obtained by dividing business net
income by the weighted average number of shares outstanding.
1 Reported in the IFRS line items “Restructuring costs and similar items” and “Gains and losses on disposals, and litigation”.
SANOFI PRESS RELEASE Q3 2026
22
Effective tax rate
The effective tax rate is a non-IFRS financial measure calculated on the basis of business operating income, minus net financial expenses and before (i) the share of profit/loss from investments accounted for using the equity method and (ii) net income attributable to non-controlling interests.
Free cash flow
Free cash flow is a non-IFRS financial measure which is reviewed by management, and which management believes provides useful information to measure the net cash generated from Sanofi’s operations that is available for strategic investments1 (net of divestments1), for debt repayment, and for payments to shareholders. “Free cash flow” is determined from the business net income after adding back (in the case of expenses and losses) or deducting (in the case of income and gains) the following items: depreciation, amortisation, and impairment, share of undistributed earnings from investments accounted for using the equity method, gains and losses on disposals of non-current assets, net change in provisions (including pensions and other post-employment benefits), deferred taxes, share-based expense, and other non-cash items. It also includes net changes in working capital, capital expenditures and other asset acquisitions2 net of disposal proceeds2, and payments related to restructuring and similar items. “Free cash flow” is not defined by IFRS, and it is not a substitute for “Net cash provided by/(used in) operating activities” as reported under IFRS.
Reconciliation of “Net cash provided by/(used in) operating activities” to free cash flow
(€ million)
YTD 2026
YTD 2025
Net cash provided by/(used in) operating activities (IFRS)3
8,514
7,305
Net cash provided by/(used in) operating activities (IFRS) of the discontinued Opella business
—
(187)
Acquisition of property, plant, and equipment and software
(1,512)
(1,288)
Acquisitions of intangible assets, investments, and other non-current financial assets2
(674)
(1,415)
Proceeds from disposals of property, plant and equipment, intangible assets, and other non-current assets net of taxes2
495
527
Repayment of lease liabilities
(207)
(184)
Others4
377
694
Free cash flow5
6,993
5,452
1 Amount of the transaction above a cap of €500 million per transaction (inclusive of all payments related to the transaction).
2 Not exceeding a cap of €500 million per transaction (inclusive of all payments related to the transaction).
3 Most directly comparable IFRS measure to free cash flow.
4 This line item includes cash outflows from major litigation not included in free cash flow, in particular Plavix Hawaii in 2025.
5 Non IFRS financial measure (see definition above).
SANOFI PRESS RELEASE Q3 2026
23
Appendix 9: Sustainability dashboard
The KPIs below indicate progress on the new sustainability strategy.
Topic
Ambition
Progress
Access to healthcare
Q3 2026
Q2 2026
Access diabetes
Increase patient reach by expanding access to diabetes care programmes
Diabetes care programmes in four countries (excl. GHU countries)
151,471 patients treated (cumulative)
Diabetes care programmes in four countries (excl. GHU countries)
98,582 patients treated (cumulative)
Global Health Unit (GHU)
Reach 1.5 million non-communicable disease patients by 2026 (cumulative since 2022) and 2 million by 2030
288,854 patients treated in 37 countries (cumulative)
86 active healthcare partnerships in 33 countries
Nine investments signed through the Impact Fund
195,263 patients treated in 35 countries (cumulative)
99 active healthcare partnerships in 33 countries
Eight investments signed through the Impact Fund
Global access plans
Develop a global access plan for all new medicines/vaccines to make them available within two years after first launch
13 global access plans initiated or developed covering more than 15 indications
13 global access plans initiated or developed covering more than 15 indications
Environmental impact
Q3 2026
Q2 2026
Climate change – carbon footprint Scope 1 and 2
(CO2 emissions)
55% reduction in scope 1 and 2 greenhouse gas emissions (GHG) (CO2 equivalent) by 2030 (cumulative vs 2019 baseline) to contribute to carbon neutrality by 2030 and net-zero emissions by 2045 (all scopes)
Next update in Q4
51% GHG reduction vs 2019
Climate change – carbon footprint Scope 3
(CO2 emissions)
30% reduction in scope 3 GHG by 2030 (cumulative vs 2019 baseline) to contribute to carbon neutrality by 2030 and net-zero emissions by 2045 (all scopes)
Next update in Q4
14% GHG reduction vs 2019
Renewable electricity
100% of renewable electricity at all sites by 2030
Next update in Q4
86%
Eco-design
20 top-selling medicines and vaccines following eco-design approach by 2030
60%
60%
20261
20251
Blister-free syringe vaccines
100% blister-free syringe vaccines by 2027
Data updated annually, next update in Q4 2026
61% blister-free vaccines
Resilience of healthcare systems
Q3 2026
Q2 2026
Patient care pathways
Assess CO2 emissions for the patient care journey for launches across global business units
Six patient care pathways assessed for new launches (cumulative since 2025)
Four patient care pathways assessed for new launches (cumulative since 2025)
Fundamentals
Q3 2026
Q2 2026
Global gender representation
Women in senior leadership roles
49%
48%
Women in executive roles
44%
44%
End.
1 This indicator considers vaccines produced in Sanofi’s internal network only.
SANOFI PRESS RELEASE Q3 2026
24
Forward-looking statements
This press release contains forward-looking statements within the meaning of applicable securities laws, including the Private Securities Litigation Reform Act of 1995, as amended.
Forward-looking statements are statements that are not historical facts. These statements include projections and estimates and their underlying assumptions, statements regarding plans, objectives, intentions, and expectations with respect to future financial results, events, operations, services, product development and potential, and statements regarding future events and economic performance. Words such as “expect,” “anticipate,” “believe,” “intend,” “estimate,” “plan,” “can,” “contemplate,” “could,” “is designed to,” “may,” “might,” “potential,” “objective,” "attempt," “target,” “project,” "strategy," "strive," "desire," “predict,” “forecast,” “ambition,” “guideline,” "seek," “should,” “will,” "goal," or the negative of these, and similar expressions are intended to identify forward-looking statements.
Although Sanofi’s management believes that the expectations reflected in such forward-looking statements are reasonable, investors are cautioned that forward-looking information and statements are subject to various risks and uncertainties, many of which are difficult to predict and generally beyond the control of Sanofi, that could cause actual results and developments to differ materially from those expressed in, or implied or projected by, the forward-looking information and statements. These risks and uncertainties include among other things, the uncertainties inherent in research and development, future clinical data and analysis, including post marketing, decisions by regulatory authorities, such as the US Food and Drug Administration or the European Medicines Agency, regarding whether and when to approve any drug, device or biological application that may be filed for any such product candidates as well as their decisions regarding labelling and other matters that could affect the availability or commercial potential of such product candidates; the fact that product candidates if approved may not be commercially successful; unexpected regulatory actions or delays, or government regulation generally; authorities’ decisions regarding whether and when to approve a product candidate; political pressure in the United States to mandate lower drug prices including “most favored nation” pricing for State Medicaid programs; the future approval and commercial success of therapeutic alternatives; Sanofi’s ability to benefit from external growth opportunities, to complete related transactions and/or obtain regulatory clearances, including future clinical data and analysis of existing clinical data relating to the product, including post marketing, unexpected safety, quality or manufacturing issues, competition in general; risks associated with intellectual property and any related pending or future litigation and the ultimate outcome of such litigation; trends in exchange rates and prevailing interest rates, volatile economic and market conditions, cost containment initiatives and subsequent changes thereto, and the impact that global crises may have on us, our customers, suppliers, vendors, and other business partners, and the financial condition of any one of them, as well as on our employees and on the global economy as a whole. The risks and uncertainties also include the uncertainties discussed or identified in the public filings with the SEC and the French Markets Authority (AMF) made by Sanofi, including those listed under “Risk Factors” and “Cautionary Statement Regarding Forward-Looking Statements” in Sanofi’s annual report on Form 20-F for the year ended December 31, 2025, or contained in our periodic reports on Form 6-K. Other than as required by applicable law, Sanofi does not undertake any obligation to update or revise any forward-looking information or statements. Considering these risks, uncertainties, and assumptions, you should not place undue reliance on any forward-looking statements contained herein.
All Sanofi trademarks mentioned in this document are protected.