
HBio Confidential 1 NASDAQ: HBIO HBIO Investor Overview January 202 6
2 Forward Looking Statements This document contains forward - looking statements within the meaning of the federal securities laws, including the Private Securities Litigation Reform Act of 1995 . Forward - looking statements may be identified by the use of words such as “may,” “will,” “expect,” “plan,” “anticipate,” “estimate,” “intend” and similar expressions or statements that do not relate to historical matters . Forward - looking statements include, but are not limited to, information concerning expected future financial and operational performance including revenues, gross margins, adjusted EBITDA and EBITDA margin, cash and debt position, growth and the introduction of new products, and the strength of the Company’s market position and business model and anticipated macroeconomic conditions . Forward - looking statements are not guarantees of future performance and involve known and unknown uncertainties, risks, assumptions, and contingencies, many of which are outside the Company’s control . Risks and other factors that could cause the Company’s actual results to differ materially from those described its forward - looking statements include those described in the “Risk Factors” section of the Company’s most recently filed Annual Report on Form 10 - K as well as in the Company’s other filings with the Securities and Exchange Commission . Forward - looking statements are based on the Company’s expectations and assumptions as of the date of this document . Except as required by law, the Company assumes no obligation to update forward - looking statements to reflect any change in expectations, even as new information becomes available . Use of Non - GAAP Financial Information This document contains non - GAAP financial information, including one or more of adjusted operating income (loss), adjusted operating margin, adjusted net income (loss), adjusted EBITDA, adjusted EBITDA margin, diluted adjusted earnings (loss) per share, and net debt . We believe that this non - GAAP financial information provides investors with an enhanced understanding of the underlying operations of our business . For the periods presented, these non - GAAP financial measures have excluded certain expenses and income resulting from items that we do not believe are representative of the underlying operations of the business . Items excluded include stock - based compensation, amortization of intangibles related to acquisitions, other operating expenses, loss on equity securities, income taxes, and the tax impact of reconciling items . Management believes that this non - GAAP financial information is important in comparing current results with prior period results and is useful to investors and financial analysts in assessing the Company’s operating performance . Non - GAAP historical financial statement information included herein is accompanied by a reconciliation to the nearest corresponding GAAP measure which is included below . With respect to non - GAAP forward - looking measures, we provide an outlook for adjusted EBITDA margin . Many of the items that we exclude from this forward - looking measure calculation may not be subject to the control of or may not be reliably predicted by management . These items could cause our non - GAAP forward looking measures to vary materially from measures reported under GAAP . The non - GAAP financial information provided in this document should be considered in addition to, not as a substitute for, the financial information provided and presented in accordance with GAAP and may be different than other companies’ non - GAAP financial information . Forward - Looking Statements and Non - GAAP Financial Information
▪ Leading global tools provider with wide range of pre - clinical workflows and applications in several growth markets 3 Solid Operating Platform to Support Growth & Improved Profitability ▪ Largest business unit (Preclinical) with #1 position in high demand animal telemetry tools market ▪ Leader in rapidly growing organoid market ▪ Well positioned to capture share in translational medicine tools market with FDA Push for NAM’s ▪ Currently #1 or #2 in 7 out of 10 product lines ▪ Large, diversified customer base that generates significant recurring revenue ▪ Restructured balance sheet provides financial flexibility to support long term growth objectives ▪ New management team in place focused on generating improved cash flow, sustained profitability and enhanced shareholder value.
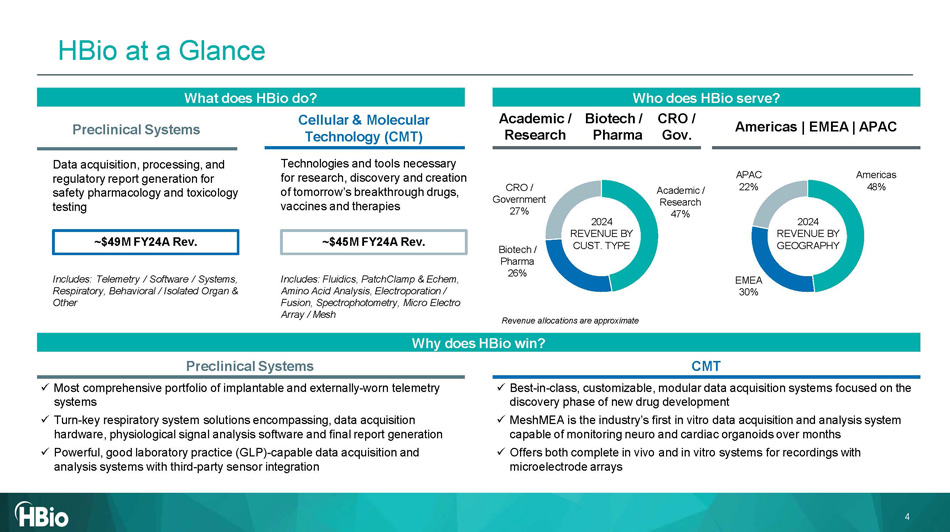
Who does HBio s erve? Preclinical Systems CMT Why does HBio w in? 2024 REVENUE BY GEOGRAPHY 2024 REVENUE BY CUST. TYPE Revenue allocations are approximate x Most comprehensive portfolio of implantable and externally - worn telemetry systems x Turn - key respiratory system solutions encompassing, data acquisition hardware, physiological signal analysis software and final report generation x Powerful, good laboratory practice (GLP) - capable data acquisition and analysis systems with third - party sensor integration x Best - in - class, customizable, modular data acquisition systems focused on the discovery phase of new drug development x MeshMEA is the industry’s first in vitro data acquisition and analysis system capable of monitoring neuro and cardiac organoids over months x Offers both complete in vivo and in vitro systems for recordings with microelectrode arrays Americas 48% EMEA 30% APAC 22% Biotech / P h arma Academic / Research CRO / Gov. Biotech / P h arma 26% Academic / Research 47% CRO / Government 27% What does HBio do ? Cellular & Molecular Technology (CMT) Technologies and tools necessary for research, discovery and creation of tomorrow’s breakthrough drugs, vaccines and therapies Includes : Telemetry / Software / Systems, Respiratory, Behavioral / Isolated Organ & Other Preclinical Systems Data acquisition, processing, and regulatory report generation for safety pharmacology and toxicology testing Includes: Fluidics, PatchClamp & Echem, Amino Acid Analysis, Electroporation / Fusion, Spectrophotometry, Micro Electro Array / Mesh Americas | EMEA | APAC 4 ~$4 5 M FY24A Rev. ~$49M FY24A Rev. HBio at a Glance
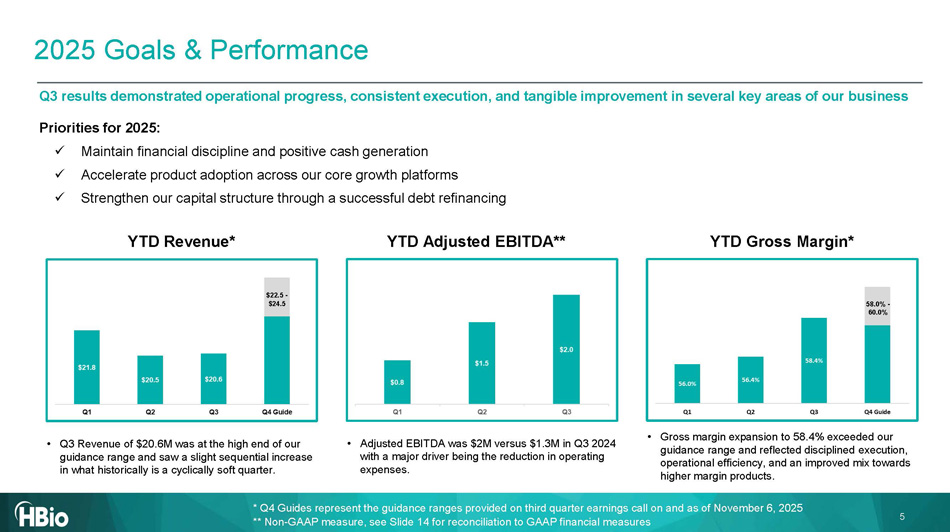
5 Q3 results demonstrated operational progress, consistent execution, and tangible improvement in several key areas of our busi nes s 2025 Goals & Performance YTD Revenue* YTD Adjusted EBITDA** YTD Gross Margin* $22.5 - $ 24.5 58.0% - 60.0% Priorities for 2025: x Maintain financial discipline and positive cash generation x Accelerate product adoption across our core growth platforms x Strengthen our capital structure through a successful debt refinancing • Q3 Revenue of $20.6M was at the high end of our guidance range and saw a slight sequential increase in what historically is a cyclically soft quarter. • Adjusted EBITDA was $2M versus $1.3M in Q3 2024 with a major driver being the reduction in operating expenses. • Gross margin expansion to 58.4% exceeded our guidance range and reflected disciplined execution, operational efficiency, and an improved mix towards higher margin products. * Q4 Guides represent the guidance ranges provided on third quarter earnings call on and as of November 6, 2025 ** Non - GAAP measure, see Slide 14 for reconciliation to GAAP financial measures
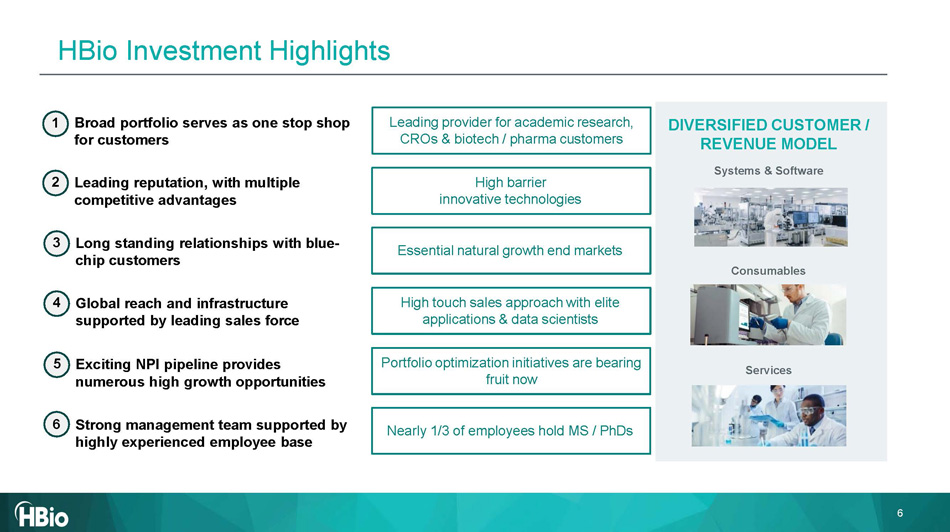
Essential natural growth end markets High barrier innovative technologies High touch sales approach with elite applications & data scientists Leading provider for academic research, CROs & biotech / pharma customers DIVERSIFIED CUSTOMER / REVENUE MODEL Systems & Software Consumables Services Portfolio optimization initiatives are bearing fruit now Nearly 1/3 of employees hold MS / PhDs 1 Broad portfolio serves as one stop shop for customers 2 Leading reputation , with multiple competitive advantages 3 Long standing relationships with blue - chip customers 4 Global reach and infrastructure supported by leading sales force 5 Exciting NPI pipeline provides numerous high growth opportunities 6 Strong management team supported by highly experienced employee base 6 HBio Investment Highlights
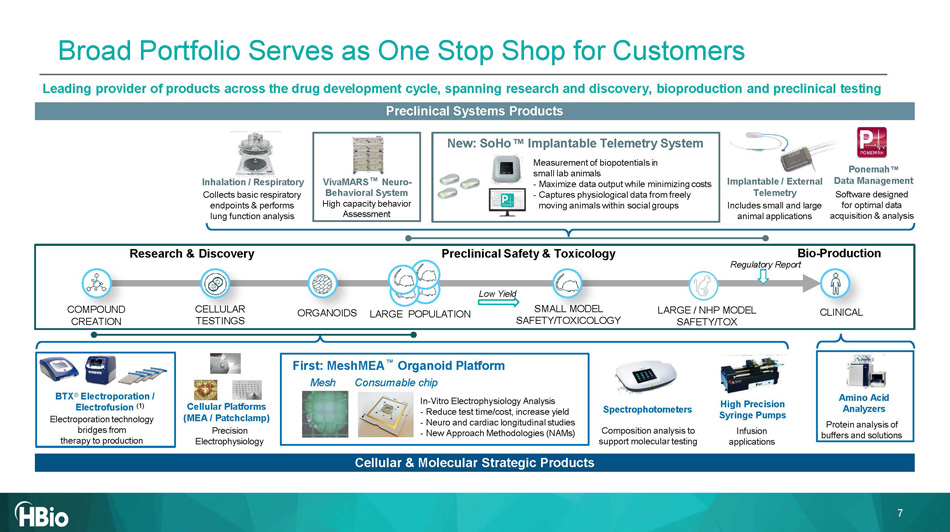
Research & Discovery Preclinical Safety & Toxicology CELLULAR TESTINGS COMPOUND CREATION CLINICAL SMALL MODEL SAFETY/TOXICOLOGY LARGE / NHP MODEL SAFETY/TOX Bio - Production Regulatory Report Low Yield ORGANOIDS LARGE POPULATION Leading provider of products across the drug development cycle, spanning research and discovery, bioproduction and preclinical testing Cellular & Molecular Strategic Products Preclinical Systems Products BTX ® Electroporation / Electrofusion (1) Electroporation technology bridges from therapy to production Cellular Platforms (MEA / Patchclamp) Precision Electrophysiology First: MeshMEA Organoid Platform Mesh Consumable chip In - Vitro Electrophysiology Analysis - Reduce test time/cost, increase yield - Neuro and cardiac longitudinal studies - New Approach Methodologies (NAMs) Amino Acid Analyzers Protein analysis of buffers and solutions Spectrophotometers Composition analysis to support molecular testing High Precision Syringe Pumps Infusion applications VivaMARS Neuro - Behavioral System High capacity behavior Assessment Ponemah Data Management Software designed for optimal data acquisition & analysis Inhalation / Respiratory Collects basic respiratory endpoints & performs lung function analysis New: SoHo Implantable Telemetry System Measurement of biopotentials in small lab animals - Maximize data output while minimizing costs - Captures physiological data from freely moving animals within social groups Implantable / External Telemetry Includes small and large animal applications 7 Broad Portfolio Serves as One Stop Shop for Customers
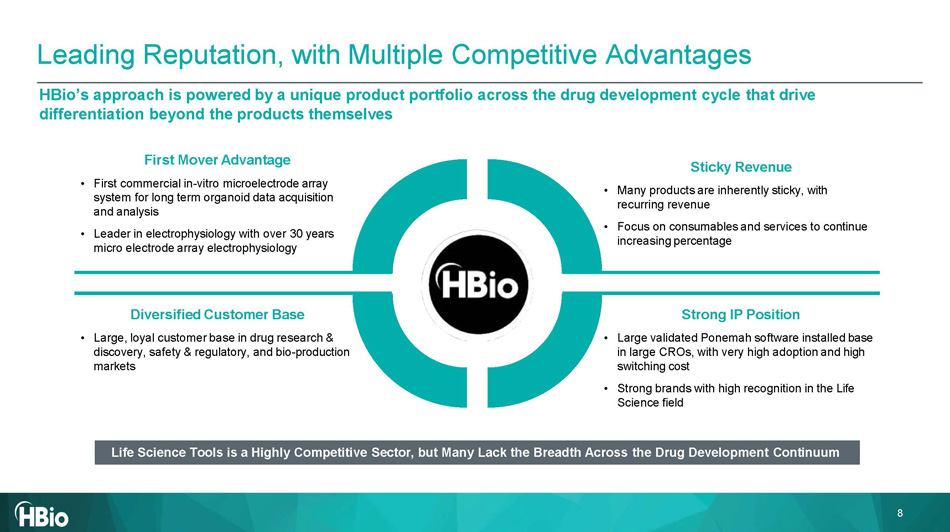
Leading Reputation , with Multiple Competitive Advantages HBio’s approach is powered by a unique product portfolio across the drug development cycle that drive differentiation beyond the products themselves 8 Diversified Customer Base • Large, loyal customer base in drug research & discovery, safety & regulatory, and bio - production markets First Mover Advantage • First commercial in - vitro microelectrode array system for long term organoid data acquisition and analysis • Leader in electrophysiology with over 30 years micro electrode array electrophysiology Sticky Revenue • Many products are inherently sticky, with recurring revenue • Focus on consumables and services to continue increasing percentage Strong IP Position • Large validated Ponemah software installed base in large CROs, with very high adoption and high switching cost • Strong brands with high recognition in the Life Science field Life Science Tools is a Highly Competitive Sector, but Many Lack the Breadth Across the Drug Development Continuum
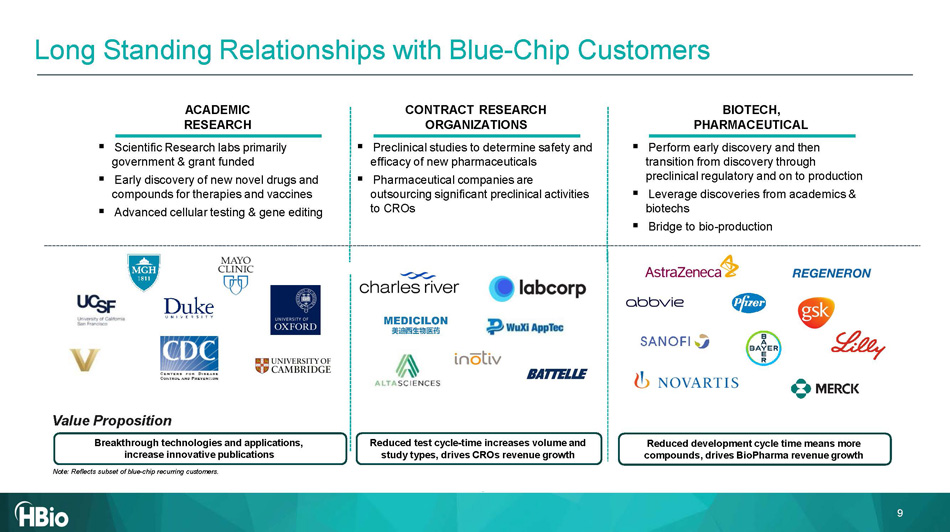
▪ Scientific Research labs primarily government & grant funded ▪ Early discovery of new novel drugs and compounds for therapies and vaccines ▪ Advanced cellular testing & gene editing ACADEMIC RESEARCH ▪ Perform early discovery and then transition from discovery through preclinical regulatory and on to production ▪ Leverage discoveries from academics & biotechs ▪ Bridge to bio - production BIOTECH, PHARMACEUTICAL CONTRACT RESEARCH ORGANIZATIONS ▪ Preclinical studies to determine safety and efficacy of new pharmaceuticals ▪ Pharmaceutical companies are outsourcing significant preclinical activities to CROs Value Proposition Breakthrough technologies and applications, increase innovative publications Note: Reflects subset of blue - chip recurring customers. Reduced test cycle - time increases volume and study types, drives CROs revenue growth Reduced development cycle time means more compounds, drives BioPharma revenue growth Long Standing Relationships with Blue - Chip Customers 9
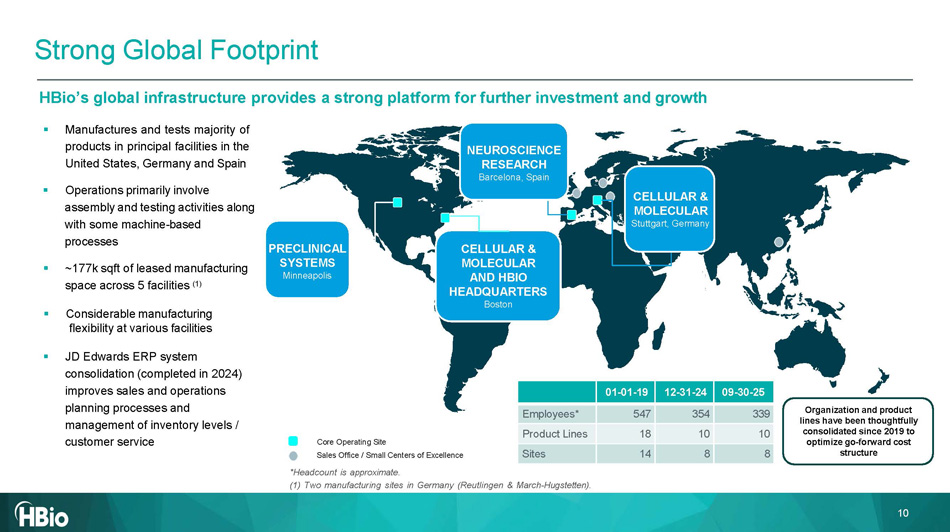
CELLULAR & MOLECULAR AND HBIO HEADQUARTERS Boston PRECLINICAL SYSTEMS Minneapolis Core Operating Site Sales Office / Small Centers of Excellence *Headcount is approximate. (1) Two manufacturing sites in Germany (Reutlingen & March - Hugstetten). 0 9 - 30 - 25 12 - 31 - 24 01 - 01 - 19 33 9 354 547 Employees* 10 10 18 Product Lines 8 8 14 Sites HBio’s global infrastructure provides a strong platform for further investment and growth ▪ Manufactures and tests majority of products in principal facilities in the United States, Germany and Spain ▪ Operations primarily involve assembly and testing activities along with some machine - based processes ▪ ~177k sqft of leased manufacturing space across 5 facilities (1) ▪ Considerable manufacturing flexibility at various facilitie s ▪ JD Edwards ERP system consolidation (completed in 2024) improves sales and operations planning processes and management of inventory levels / customer service NEUROSCIENCE RESEARCH Barcelona, Spain Strong Global Footprint Organization and product lines have been thoughtfully consolidated since 2019 to optimize go - forward cost structure CELLULAR & 10 MOLECULAR Stuttgart, Germany
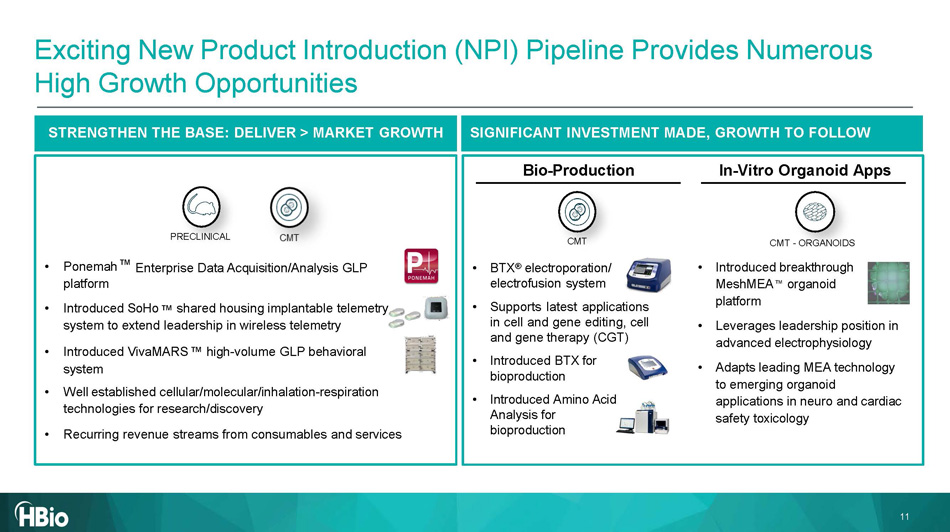
Enterprise Data Acquisition/Analysis GLP • Ponemah platform • Introduced SoHo shared housing implantable telemetry system to extend leadership in wireless telemetry • Introduced VivaMARS high - volume GLP behavioral system • Well established cellular/molecular/inhalation - respiration technologies for research/discovery • Recurring revenue streams from consumables and services STRENGTHEN THE BASE: DELIVER > MARKET GROWTH • BTX ® electroporation/ electrofusion system • Supports latest applications in cell and gene editing, cell and gene therapy (CGT) • Introduced BTX for bioproduction • Introduced Amino Acid Analysis for bioproduction • Introduced breakthrough MeshMEA organoid platform • Leverages leadership position in advanced electrophysiology • Adapts leading MEA technology to emerging organoid applications in neuro and cardiac safety toxicology SIGNIFICANT INVESTMENT MADE, GROWTH TO FOLLOW CMT - ORGANOIDS CMT PRECLINICAL Bio - Production In - Vitro Organoid Apps 11 Exciting New Product Introduction (NPI) Pipeline Provides Numerous High Growth Opportunities
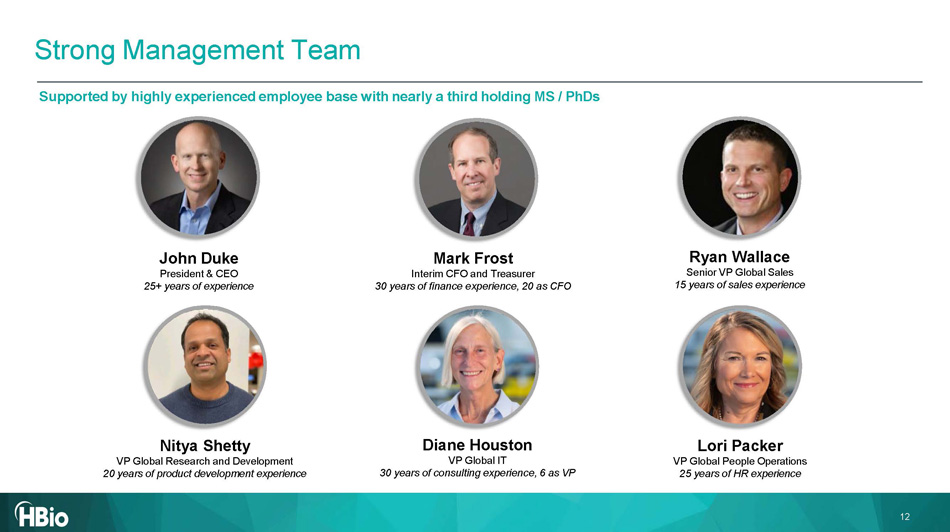
Diane Houston VP Global IT 30 years of consulting experience, 6 as VP Mark Frost Interim CFO and Treasurer 30 years of finance experience, 20 as CFO John Duke President & CEO 25+ years of experience Ryan Wallace Senior VP Global Sales 15 years of sales experience Nitya Shetty VP Global Research and Development 20 years of product development experience Lori Packer VP Global People Operations 25 years of HR experience 12 Supported by highly experienced employee base with nearly a third holding MS / PhDs Strong Management Team

Non - GAAP Reconciliation Table 13
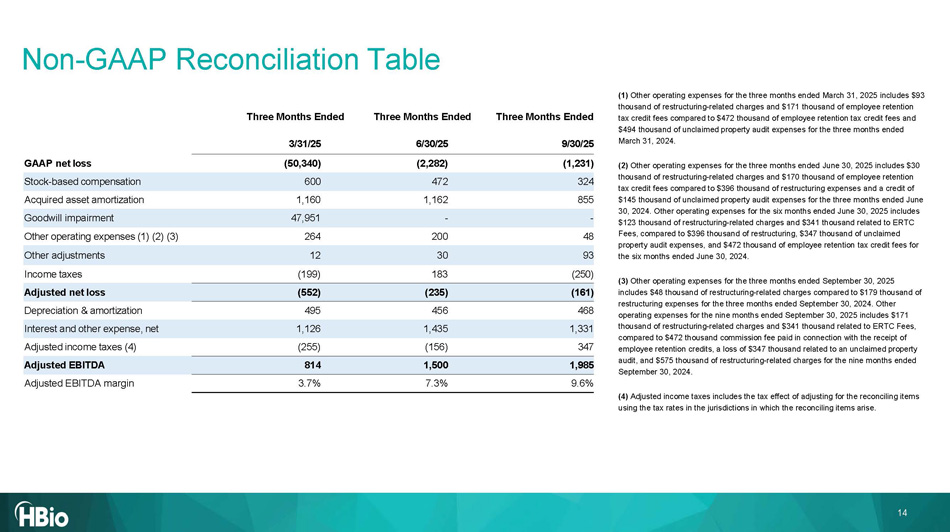
Three Months Ended Three Months Ended Three Months Ended 9 /3 0 /2 5 6 /3 0 /2 5 3 /31/2 5 (1, 231 ) (2,282) (50,340) GAAP net loss 324 472 600 Stock - based compensation 855 1,162 1,160 Acquired asset amortization - - 47,951 Goodwill impairment 48 200 264 Other operating expenses (1) (2) (3) 93 30 12 Other adjustments (250) 183 (199) Income taxes (161) (235) (552) Adjusted net loss 468 456 495 Depreciation & amortization 1,331 1,435 1,126 Interest and other expense, net 347 (156) (255) Adjusted income taxes (4) 1,985 1,500 814 Adjusted EBITDA 9.6% 7.3% 3.7% Adjusted EBITDA margin 14 Non - GAAP Reconciliation Table (1) Other operating expenses for the three months ended March 31, 2025 includes $93 thousand of restructuring - related charges and $171 thousand of employee retention tax credit fees compared to $472 thousand of employee retention tax credit fees and $494 thousand of unclaimed property audit expenses for the three months ended March 31, 2024. (2) Other operating expenses for the three months ended June 30, 2025 includes $30 thousand of restructuring - related charges and $170 thousand of employee retention tax credit fees compared to $396 thousand of restructuring expenses and a credit of $145 thousand of unclaimed property audit expenses for the three months ended June 30, 2024. Other operating expenses for the six months ended June 30, 2025 includes $123 thousand of restructuring - related charges and $341 thousand related to ERTC Fees, compared to $396 thousand of restructuring, $347 thousand of unclaimed property audit expenses, and $472 thousand of employee retention tax credit fees for the six months ended June 30, 2024. (3) Other operating expenses for the three months ended September 30, 2025 includes $48 thousand of restructuring - related charges compared to $179 thousand of restructuring expenses for the three months ended September 30, 2024. Other operating expenses for the nine months ended September 30, 2025 includes $171 thousand of restructuring - related charges and $341 thousand related to ERTC Fees, compared to $472 thousand commission fee paid in connection with the receipt of employee retention credits, a loss of $347 thousand related to an unclaimed property audit, and $575 thousand of restructuring - related charges for the nine months ended September 30, 2024. (4) Adjusted income taxes includes the tax effect of adjusting for the reconciling items using the tax rates in the jurisdictions in which the reconciling items arise.

18