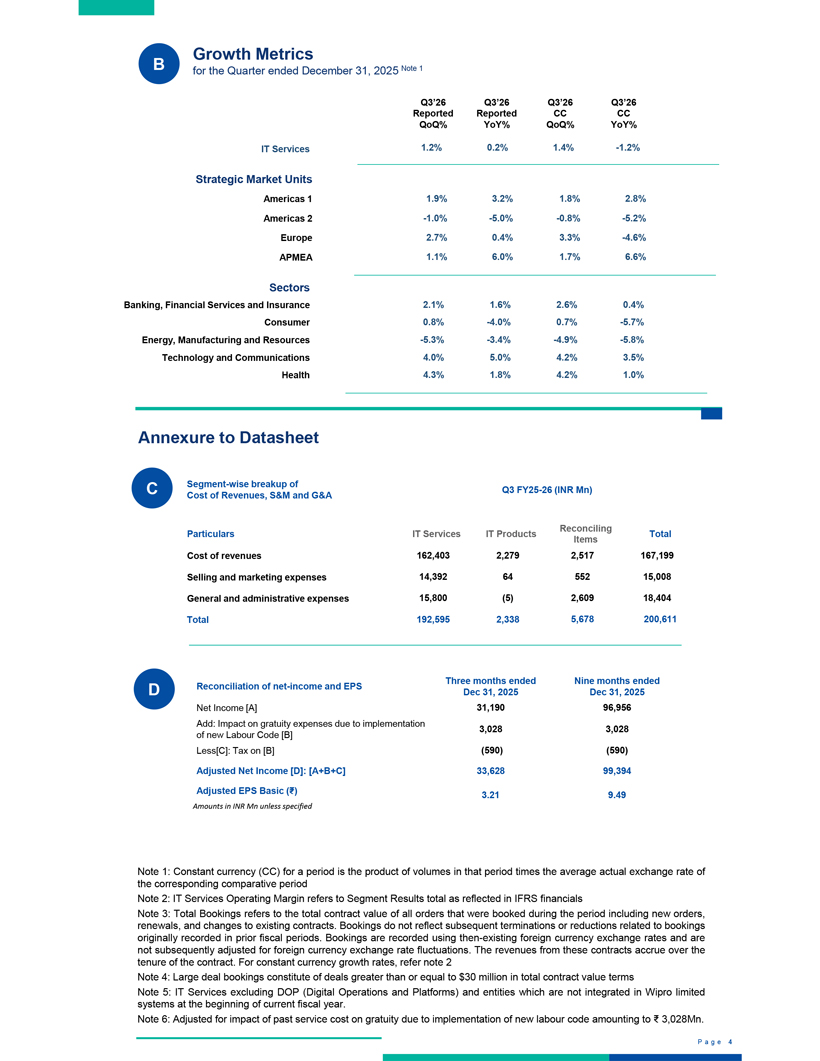
P a g e 4 B Growth Metrics for the Quarter ended December 31, 2025 Note 1 C Annexure to Datasheet Segment-wise breakup of Q3 FY25-26 (INR Mn) Cost of Revenues, S&M and G&A Reconciling Total Particulars IT Services IT Products Items Cost of revenues 162,403 2,279 2,517 167,199 Selling and marketing expenses 14,392 64 552 15,008
General and administrative expenses 15,800 (5) 2,609 18,404 Total 192,595 2,338 5,678 200,611 Strategic Market Units Americas 1 1.9% 3.2% 1.8% 2.8% Americas 2 -1.0%
-5.0% -0.8% -5.2% Europe 2.7% 0.4% 3.3% -4.6% APMEA 1.1% 6.0% 1.7% 6.6% Sectors Banking,
Financial Services and Insurance 2.1% 1.6% 2.6% 0.4% Consumer 0.8% -4.0% 0.7% -5.7% Energy, Manufacturing and Resources -5.3% -3.4% -4.9% -5.8% Technology and Communications 4.0% 5.0% 4.2% 3.5% Health 4.3% 1.8% 4.2% 1.0% Q3’26 CC YoY% Q3’26 CC QoQ%
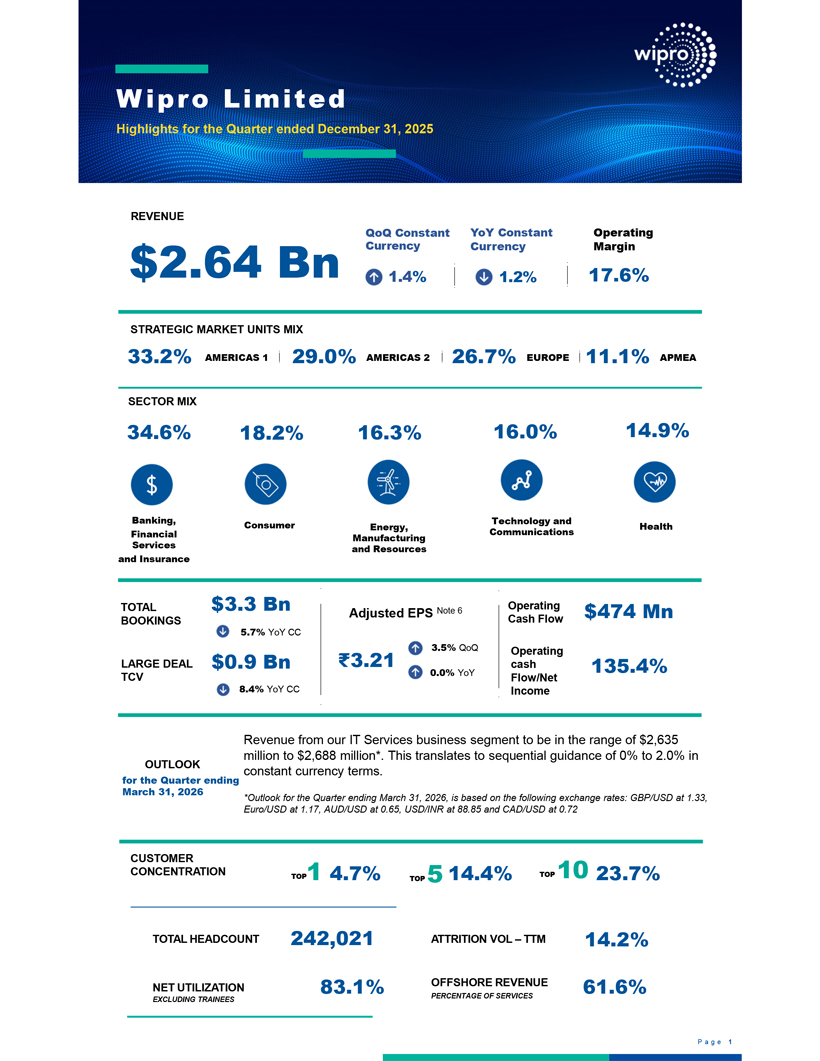
Q3’26 Reported YoY% Q3’26 Reported QoQ% IT Services 1.2% 0.2% 1.4% -1.2% Note 1: Constant currency (CC) for a period is the product of volumes in that period times the average actual exchange
rate of the corresponding comparative period Note 2: IT Services Operating Margin refers to Segment Results total as reflected in IFRS financials Note 3: Total Bookings refers to the total contract value of all orders that were booked during the
period including new orders, renewals, and changes to existing contracts. Bookings do not reflect subsequent terminations or reductions related to bookings originally recorded in prior fiscal periods. Bookings are recorded using then-existing
foreign currency exchange rates and are not subsequently adjusted for foreign currency exchange rate fluctuations. The revenues from these contracts accrue over the tenure of the contract. For constant currency growth rates, refer note 2 Note 4:
Large deal bookings constitute of deals greater than or equal to $30 million in total contract value terms Note 5: IT Services excluding DOP (Digital Operations and Platforms) and entities which are not integrated in Wipro limited systems at
the beginning of current fiscal year. Note 6: Adjusted for impact of past service cost on gratuity due to implementation of new labour code amounting to ₹ 3,028Mn. Nine months ended Dec 31, 2025
Three months ended Reconciliation of net-income and EPS Dec 31, 2025 Net Income [A] 31,190 96,956 Add: Impact on gratuity expenses due to implementation 3,028 3,028 of new Labour Code [B] Less[C]: Tax on [B]
(590) (590) Adjusted Net Income [D]: [A+B+C] 33,628 99,394 Adjusted EPS Basic (₹ ) 3.21 9.49 D Amounts in INR Mn unless specifiedP a g e 4 B Growth Metrics for the Quarter ended December 31,
2025 Note 1 C Annexure to Datasheet Segment-wise breakup of Q3 FY25-26 (INR Mn) Cost of Revenues, S&M and G&A Reconciling Total Particulars IT Services IT Products Items Cost of revenues 162,403 2,279
2,517 167,199 Selling and marketing expenses 14,392 64 552 15,008 General and administrative expenses 15,800 (5) 2,609 18,404 Total 192,595 2,338 5,678 200,611 Strategic Market Units Americas 1 1.9% 3.2% 1.8% 2.8% Americas 2 -1.0% -5.0% -0.8% -5.2% Europe 2.7% 0.4% 3.3% -4.6%
APMEA 1.1% 6.0% 1.7% 6.6% Sectors Banking, Financial Services and Insurance 2.1% 1.6% 2.6% 0.4% Consumer 0.8% -4.0% 0.7% -5.7% Energy, Manufacturing and Resources -5.3% -3.4% -4.9% -5.8% Technology and Communications 4.0% 5.0% 4.2% 3.5% Health 4.3% 1.8% 4.2%
1.0% Q3’26 CC YoY% Q3’26 CC QoQ% Q3’26 Reported YoY% Q3’26 Reported QoQ% IT Services 1.2% 0.2% 1.4% -1.2% Note 1: Constant currency (CC) for a period is the product of volumes in
that period times the average actual exchange rate of the corresponding comparative period Note 2: IT Services Operating Margin refers to Segment Results total as reflected in IFRS financials Note 3: Total Bookings refers to the total contract value
of all orders that were booked during the period including new orders, renewals, and changes to existing contracts. Bookings do not reflect subsequent terminations or reductions related to bookings originally recorded in prior fiscal periods.
Bookings are recorded using then-existing foreign currency exchange rates and are not subsequently adjusted for foreign currency exchange rate fluctuations. The revenues from these contracts accrue over the tenure of the contract. For constant
currency growth rates, refer note 2 Note 4: Large deal bookings constitute of deals greater than or equal to $30 million in total contract value terms Note 5: IT Services excluding DOP (Digital Operations and Platforms) and entities which are
not integrated in Wipro limited systems at the beginning of current fiscal year. Note 6: Adjusted for impact of past service cost on gratuity due to implementation of new labour code amounting to
₹ 3,028Mn. Nine months ended Dec 31, 2025 Three months ended Reconciliation of net-income and EPS Dec 31, 2025 Net Income [A] 31,190 96,956 Add: Impact on
gratuity expenses due to implementation 3,028 3,028 of new Labour Code [B] Less[C]: Tax on [B] (590) (590) Adjusted Net Income [D]: [A+B+C] 33,628 99,394 Adjusted EPS Basic (₹ ) 3.21 9.49 D Amounts
in INR Mn unless specified