2020 FINANCIAL SUMMARY
.3
| Three months ended | | Twelve months ended | ||||||||||
SELECTED FINANCIAL RESULTS | December 31, | | December 31, | ||||||||||
|
| 2020 |
| 2019 | |
| 2020 |
| 2019 | ||||
Financial (CDN$, thousands, except ratios) | | | | | | | | | | | | | |
Net Income/(Loss) | | $ | (204,167) | | $ | (429,143) | | | $ | (923,367) | | $ | (259,720) |
Adjusted Net Income(1) | | | 22,149 | | | 34,365 | | | | 19,758 | | | 243,160 |
Cash Flow from Operating Activities | | | 96,079 | | | 188,492 | | | | 446,365 | | | 694,240 |
Adjusted Funds Flow(1) |
| | 91,871 |
| | 178,922 | |
| | 358,160 |
| | 708,992 |
Dividends to Shareholders - Declared | | | 6,677 | | | 6,656 | | | | 26,698 | | | 27,688 |
Total Debt Net of Cash(1) | | | 375,967 | | | 454,984 | | | | 375,967 | | | 454,984 |
Capital Spending | | | 52,414 | | | 99,389 | | | | 291,468 | | | 618,910 |
Property and Land Acquisitions | | | 2,061 | | | 6,126 | | | | 10,121 | | | 24,406 |
Property Divestments | | | 47 | | | (316) | | | | 6,145 | | | 9,583 |
Net Debt to Adjusted Funds Flow Ratio(1) | | | 1.0x | | | 0.6x | | | | 1.0x | | | 0.6x |
| | | | | | | | | | | | | |
Financial per Weighted Average Shares Outstanding |
| | |
| | | |
| | |
| | |
Net Income/(Loss) - Basic | | $ | (0.92) | | $ | (1.93) | | | $ | (4.15) | | $ | (1.12) |
Net Income/(Loss) - Diluted | | | (0.92) | | | (1.93) | | | | (4.15) | | | (1.12) |
Weighted Average Number of Shares Outstanding (000’s) - Basic | | | 222,548 | | | 222,227 | | | | 222,503 | | | 231,334 |
Weighted Average Number of Shares Outstanding (000’s) - Diluted | | | 222,548 | | | 222,227 | | | | 222,503 | | | 231,334 |
| | | | | | | | | | | | | |
Selected Financial Results per BOE(2)(3) | | | | | | | | | | | | | |
Crude Oil & Natural Gas Sales(4) |
| $ | 30.60 |
| $ | 41.64 | |
| $ | 27.82 |
| $ | 42.65 |
Royalties and Production Taxes | | | (7.67) | | | (10.93) | | | | (7.12) | | | (10.88) |
Commodity Derivative Instruments | | | 3.12 | | | 0.07 | | | | 3.95 | | | 0.42 |
Operating Expenses | | | (8.20) | | | (8.05) | | | | (7.94) | | | (7.88) |
Transportation Costs | | | (3.89) | | | (3.82) | | | | (3.99) | | | (3.93) |
General and Administrative Expenses | | | (1.46) | | | (1.34) | | | | (1.35) | | | (1.32) |
Cash Share-Based Compensation | | | (0.11) | | | 0.01 | | | | 0.04 | | | (0.02) |
Interest, Foreign Exchange and Other Expenses | | | (0.81) | | | (0.89) | | | | (1.06) | | | (0.72) |
Current Income Tax Recovery | | | — | | | 1.41 | | | | 0.44 | | | 0.91 |
Adjusted Funds Flow(1) |
| $ | 11.58 |
| $ | 18.10 | |
| $ | 10.79 |
| $ | 19.23 |
| Three months ended | | Twelve months ended | ||||||||||
SELECTED OPERATING RESULTS | December 31, | | December 31, | ||||||||||
|
| 2020 |
| 2019 | |
| 2020 |
| 2019 | ||||
Average Daily Production(3) | | | | | | | | | | | | | |
Crude Oil (bbls/day) | |
| 43,405 | |
| 54,344 | | |
| 45,421 | |
| 49,704 |
Natural Gas Liquids (bbls/day) | |
| 5,790 | |
| 5,502 | | |
| 5,633 | |
| 4,929 |
Natural Gas (Mcf/day) | |
| 222,293 | |
| 285,537 | | |
| 237,857 | |
| 278,451 |
Total (BOE/day) | |
| 86,244 | |
| 107,436 | | |
| 90,697 | |
| 101,042 |
| | | | | | | | | | | | | |
% Crude Oil and Natural Gas Liquids | |
| 57% | |
| 56% | | |
| 56% | |
| 54% |
| | | | | | | | | | | | | |
Average Selling Price(3)(4) | | | | | | | | | | | | | |
Crude Oil (per bbl) |
| $ | 47.95 |
| $ | 67.23 | |
| $ | 44.35 |
| $ | 68.98 |
Natural Gas Liquids (per bbl) | | | 17.19 | | | 18.28 | | | | 10.29 | | | 15.19 |
Natural Gas (per Mcf) | | | 2.04 | | | 2.50 | | | | 1.87 | | | 2.87 |
| | | | | | | | | | | | | |
Net Wells Drilled | | | 2 | | | 9 | | | | 42 | | | 56 |
| (1) | These non-GAAP measures may not be directly comparable to similar measures presented by other entities. See “Non-GAAP Measures” section in the following MD&A. |
| (2) | Non-cash amounts have been excluded. |
| (3) | Based on Company interest production volumes. See “Basis of Presentation” section in the following MD&A. |
| (4) | Before transportation costs, royalties and commodity derivative instruments. |
ENERPLUS 2020 FINANCIAL SUMMARY 1
| Three months ended | | Twelve months ended | ||||||||||
| December 31, | | December 31, | ||||||||||
Average Benchmark Pricing |
| 2020 | | 2019 | | | 2020 | | 2019 | ||||
WTI crude oil (US$/bbl) |
| $ | 42.66 |
| $ | 56.96 | |
| $ | 39.40 |
| $ | 57.03 |
Brent (ICE) crude oil (US$/bbl) | | | 45.24 | | | 62.51 | | | | 43.21 | | | 64.18 |
NYMEX natural gas – last day (US$/Mcf) | | | 2.66 | | | 2.50 | | | | 2.08 | | | 2.63 |
US/CDN average exchange rate | | | 1.30 | | | 1.32 | | | | 1.34 | | | 1.33 |
Share Trading Summary |
| CDN(1) – ERF |
| U.S.(2) – ERF | ||
For the twelve months ended December 31, 2020 | | (CDN$) | | (US$) | ||
High |
| $ | 9.55 |
| $ | 7.35 |
Low |
| $ | 1.62 |
| $ | 1.15 |
Close |
| $ | 3.98 |
| $ | 3.13 |
| (1) | TSX and other Canadian trading data combined. |
| (2) | NYSE and other U.S. trading data combined. |
2020 Dividends per Share |
| CDN$ |
| US$(1) |
First Quarter Total | $ | 0.03 | $ | 0.02 |
Second Quarter Total | $ | 0.03 | $ | 0.02 |
Third Quarter Total | $ | 0.03 | $ | 0.02 |
Fourth Quarter Total | $ | 0.03 | $ | 0.02 |
Total Year to Date | $ | 0.12 | $ | 0.08 |
| (1) | CDN$ dividends converted at the relevant foreign exchange rate on the payment date. |
2 ENERPLUS 2020 FINANCIAL SUMMARY
2020 HIGHLIGHTS
Financial & Operational Highlights
| ● | We delivered 2020 production at the high end of our annual guidance ranges, with total production of 90,697 BOE/day, including crude oil and natural gas liquids production of 51,054 bbls/day, a decrease of 10% and 7%, respectively, compared to 2019 due to the temporary curtailment of crude oil production during the second quarter and the significant reduction in capital activity in North Dakota during 2020 in response to the decline in crude oil prices. Natural gas production decreased 15% year-over-year due to lower capital activity for our Marcellus natural gas asset during 2020. |
| ● | Full year 2020 cash flow from operating activities and adjusted funds flow were $446.4 million and $358.2 million, respectively, compared to $694.2 million and $709.0 million, respectively, in 2019. Cash flow from operating activities and adjusted funds flow decreased from 2019 due to lower benchmark crude oil prices and reduced production volumes. |
| ● | We reported a full year 2020 net loss of $923.4 million, or ($4.15) per share, compared to a net loss of $259.7 million, or ($1.12) per share, in 2019. The higher net loss was primarily due to larger non-cash impairment charges, lower benchmark crude oil prices and reduced production volumes in 2020. We recorded non-cash impairments totaling $1,197.6 million in 2020 related to property, plant and equipment (“PP&E”) and goodwill due to the low commodity price environment and the use of 12-month trailing prices to test for impairment, as required under U.S. Securities and Exchange Commission (“SEC”) guidelines. Excluding these impairments and certain other non-cash or non-recurring items, full year 2020 adjusted net income was $19.8 million, or $0.09 per share, compared to $243.2 million, or $1.05 per share, in 2019. Adjusted net income decreased from 2020 due to lower benchmark crude oil prices and reduced production volumes. |
| ● | Our 2020 Bakken crude oil price differential was US$4.96/bbl below WTI, compared to US$3.61/bbl below WTI in 2019. The weaker year-over-year differential was due to the significant benchmark oil price volatility and the narrowing of Brent-WTI differentials in 2020. Our 2020 Marcellus natural gas price differential was US$0.65/Mcf below NYMEX, compared to US$0.39/Mcf below NYMEX in 2019. Regional pricing in the Marcellus was particularly weak from September to November of 2020 due to nearly full regional storage combined with low demand due to mild weather. |
| ● | Operating expenses in 2020 were $7.94/BOE, compared to $7.88/BOE in 2019. Cash G&A expenses in 2020 were $1.35/BOE, compared to $1.32/BOE in 2019. |
| ● | Exploration and development capital spending totaled $291.4 million in 2020, below our capital budget guidance of $295 million. We paid $26.7 million in dividends in 2020. |
| ● | We ended the year with total debt net of cash of $376.0 million, a decrease from $455.0 million in 2019, and we were undrawn on our US$600 million unsecured bank credit facility. At December 31, 2020, our net debt to adjusted funds flow ratio was 1.0x. |
Reserves Highlights
| ● | Total proved plus probable (“2P”) reserves were 424.4 MMBOE at year end 2020, 4% lower than year end 2019. |
| ● | We replaced 50% of our total 2020 production, adding 16.7 MMBOE of 2P reserves (including technical revisions and economic factors). In North Dakota, we replaced 69% of our 2020 production, adding 11.3 MMBOE of 2P reserves. |
| ● | Excluding economic factors, we replaced 89% of our total 2020 production, adding 29.2 MMBOE of 2P reserves. In North Dakota, we replaced 119% of our 2020 production excluding economic factors, adding 19.4 MMBOE of 2P reserves. Economic factors are reserves revisions due to the significant reduction in year-over-year forecast prices. |
| ● | F&D costs were $26.51/BOE for proved developed producing (“PDP”) reserves, $6.78/BOE for proved reserves, and $6.50/BOE for 2P reserves, including future development costs (“FDC”). |
| ● | Finding, development and acquisition (“FD&A”) costs were $6.97/BOE for proved reserves and $6.74/BOE for 2P reserves, including FDC. |
ENERPLUS 2020 FINANCIAL SUMMARY 3
MD&A
.3
Management’s Discussion and Analysis (“MD&A”)
The following discussion and analysis of financial results is dated February 18, 2021 and is to be read in conjunction with the audited Consolidated Financial Statements (the “Financial Statements”) of Enerplus Corporation (“Enerplus” or the “Company”), as at December 31, 2020 and 2019 and for the years ended December 31, 2020, 2019 and 2018.
The following MD&A contains forward-looking information and statements. We refer you to the end of the MD&A under “Forward-Looking Information and Statements” for further information. The following MD&A also contains financial measures that do not have a standardized meaning as prescribed by accounting principles generally accepted in the United States of America (“U.S. GAAP”). See “Non-GAAP Measures” at the end of this MD&A for further information.
BASIS OF PRESENTATION
The Financial Statements and notes have been prepared in accordance with U.S. GAAP. All amounts are stated in Canadian dollars unless otherwise specified and all note references relate to the notes included with the Financial Statements. Certain prior period amounts have been restated to conform with current period presentation.
Where applicable, natural gas has been converted to barrels of oil equivalent (“BOE”) based on 6 Mcf:1 BOE and crude oil and natural gas liquids (“NGL”) have been converted to thousand cubic feet of gas equivalent (“Mcfe”) based on 0.167 bbl:1 Mcfe. The BOE and Mcfe rates are based on an energy equivalent conversion method primarily applicable at the burner tip and do not represent a value equivalent at the wellhead. Given that the value ratio based on the current price of natural gas as compared to crude oil is significantly different from the energy equivalency of 6:1 or 0.167:1, as applicable, utilizing a conversion on this basis may be misleading as an indication of value. Use of BOE and Mcfe in isolation may be misleading. All production volumes are presented on a Company interest basis, being the Company’s working interest share before deduction of any royalties paid to others, plus the Company’s royalty interests, unless otherwise stated. Company interest is not a term defined in Canadian National Instrument 51-101– Standards of Disclosure for Oil and Gas Activities (“NI 51-101”) and may not be comparable to information produced by other entities. All reserves information presented herein has been prepared in accordance with NI 51-101 and is presented at December 31, 2020 unless otherwise stated.
All references to “liquids” in this MD&A include light and medium oil, heavy oil and tight oil (all together referred to as “crude oil”) and natural gas liquids on a combined basis. All references to “natural gas” in this MD&A include conventional natural gas and shale gas.
In accordance with U.S. GAAP, crude oil and natural gas sales are presented net of royalties in the Financial Statements. Under International Financial Reporting Standards, industry standard is to present crude oil and natural gas sales before deduction of royalties and as such this MD&A presents production, crude oil and natural gas sales, and BOE measures before deduction of royalties to remain comparable with our Canadian peers.
Unless otherwise expressly stated, information presented in this MD&A does not give effect to the proposed acquisition (the "Bruin Acquisition") by Enerplus Resources (USA) Corporation, an indirect wholly-owned subsidiary of the Company, of all of the equity interests of Bruin E&P HoldCo, LLC ("Bruin") from Bruin Purchaser LLC pursuant to a membership interest purchase and sale agreement dated as of January 25, 2021 (the "Purchase Agreement").
4 ENERPLUS 2020 FINANCIAL SUMMARY
The following table provides a reconciliation of our production volumes:
| | Year ended December 31, | ||||
Average Daily Production Volumes | 2020 | 2019 | 2018 | |||
Company interest production volumes | | | | | | |
Light and medium oil (bbls/day) | | 3,277 | | 3,908 | | 4,287 |
Heavy oil (bbls/day) | | 3,901 | | 4,717 | | 4,995 |
Tight oil (bbls/day) | | 38,243 | | 41,079 | | 36,142 |
Total crude oil (bbls/day) |
| 45,421 |
| 49,704 |
| 45,424 |
| | | | | | |
Natural gas liquids (bbls/day) |
| 5,633 |
| 4,929 |
| 4,486 |
| | | | | | |
Conventional natural gas (Mcf/day) | | 12,314 | | 23,400 | | 27,159 |
Shale gas (Mcf/day) | | 225,543 | | 255,051 | | 232,678 |
Total natural gas (Mcf/day) |
| 237,857 |
| 278,451 |
| 259,837 |
Company interest production volumes (BOE/day) |
| 90,697 |
| 101,042 |
| 93,216 |
| | | | | | |
Royalty volumes | | | | | | |
Light and medium oil (bbls/day) | | 676 | | 944 | | 957 |
Heavy oil (bbls/day) | | 477 | | 969 | | 916 |
Tight oil (bbls/day) | | 7,587 | | 8,121 | | 7,181 |
Total crude oil (bbls/day) |
| 8,740 |
| 10,034 |
| 9,054 |
| | | | | | |
Natural gas liquids (bbls/day) |
| 1,134 |
| 977 |
| 951 |
| | | | | | |
Conventional natural gas (Mcf/day) | | 898 | | 2,080 | | 2,588 |
Shale gas (Mcf/day) | | 45,945 | | 50,790 | | 46,335 |
Total natural gas (Mcf/day) |
| 46,843 |
| 52,870 |
| 48,923 |
Royalty volumes (BOE/day) |
| 17,681 |
| 19,823 |
| 18,159 |
| | | | | | |
Net production volumes | | | | | | |
Light and medium oil (bbls/day) | | 2,601 | | 2,964 | | 3,330 |
Heavy oil (bbls/day) | | 3,424 | | 3,748 | | 4,079 |
Tight oil (bbls/day) | | 30,656 | | 32,958 | | 28,961 |
Total crude oil (bbls/day) |
| 36,681 |
| 39,670 |
| 36,370 |
| | | | | | |
Natural gas liquids (bbls/day) |
| 4,499 |
| 3,952 |
| 3,535 |
| | | | | | |
Conventional natural gas (Mcf/day) | | 11,416 | | 21,320 | | 24,571 |
Shale gas (Mcf/day) | | 179,598 | | 204,261 | | 186,343 |
Total natural gas (Mcf/day) |
| 191,014 |
| 225,581 |
| 210,914 |
Net production volumes (BOE/day) |
| 73,016 |
| 81,219 |
| 75,057 |
2020 FOURTH QUARTER OVERVIEW
Fourth quarter production averaged 86,244 BOE/day, at the high end of our fourth quarter production guidance range of 84,000 – 87,000 BOE/day and a decrease compared to third quarter 2020 production of 91,022 BOE/day. Crude oil and natural gas liquids production averaged 49,195 bbls/day compared to the third quarter average of 52,539 bbls/day and exceeded our fourth quarter liquids production guidance range of 47,000 – 49,000 bbls/day. Our fourth quarter capital spending was $52.4 million, bringing total 2020 capital spending to $291.4 million, below our guidance of $295 million.
We reported a net loss of $204.2 million in the fourth quarter compared to a net loss of $112.8 million in the third quarter of 2020. The increase in net loss was primarily the result of a $311.2 million non-cash PP&E impairment recorded in the fourth quarter compared to a $256.8 million PP&E impairment in the third quarter, both as a result of the low commodity price environment and the requirement to use SEC twelve month trailing prices to test for impairment.
Fourth quarter cash flow from operating activities decreased to $96.1 million from $137.0 million in the third quarter of 2020 primarily due to a decrease in non-cash operating working capital of $8.9 million during the fourth quarter, compared to a change of $55.8 million in the third quarter. Fourth quarter adjusted funds flow increased to $91.9 million, from $83.1 million during the third quarter, largely due to a $5.0 million increase in realized cash gains on commodity derivative instruments during the fourth quarter.
ENERPLUS 2020 FINANCIAL SUMMARY 5
Selected Fourth Quarter Canadian and U.S. Financial Results
| | Three months ended | | | Three months ended | ||||||||||||||
| | December 31, 2020 | | | December 31, 2019 | ||||||||||||||
($ millions, except per unit amounts) |
| Canada |
| U.S. |
| Total | |
| Canada |
| U.S. |
| Total | ||||||
Average Daily Production Volumes(1) | | | | | | | | | | | | | | | | | | | |
Light and medium oil (bbls/day) | | | 3,192 | | | — | | | 3,192 | | | | 3,560 | | | — | | | 3,560 |
Heavy oil (bbls/day) | | | 4,216 | | | — | | | 4,216 | | | | 4,587 | | | — | | | 4,587 |
Tight oil (bbls/day) | | | — | | | 35,997 | | | 35,997 | | | | — | | | 46,197 | | | 46,197 |
Total crude oil (bbls/day) | |
| 7,408 | |
| 35,997 | |
| 43,405 | | |
| 8,147 | |
| 46,197 | |
| 54,344 |
| | | | | | | | | | | | | | | | | | | |
Natural gas liquids (bbls/day) | |
| 580 | |
| 5,210 | |
| 5,790 | | |
| 797 | |
| 4,705 | |
| 5,502 |
| | | | | | | | | | | | | | | | | | | |
Conventional natural gas (Mcf/day) | | | 10,381 | | | — | | | 10,381 | | | | 21,379 | | | — | | | 21,379 |
Shale gas (Mcf/day) | | | 146 | | | 211,766 | | | 211,912 | | | | 285 | | | 263,873 | | | 264,158 |
Total natural gas (Mcf/day) | |
| 10,527 | |
| 211,766 | |
| 222,293 | | |
| 21,664 | |
| 263,873 | |
| 285,537 |
Total average daily production (BOE/day) | |
| 9,743 | |
| 76,501 | |
| 86,244 | | |
| 12,555 | |
| 94,881 | |
| 107,436 |
| | | | | | | | | | | | | | | | | | | |
Pricing(2) | | | | | | | | | | | | | | | | | | | |
Crude oil (per bbl) |
| $ | 41.75 |
| $ | 49.22 |
| $ | 47.95 | |
| $ | 55.69 |
| $ | 69.26 |
| $ | 67.23 |
Natural gas liquids (per bbl) | | | 26.68 | | | 16.14 | | | 17.19 | | | | 28.61 | | | 16.53 | | | 18.28 |
Natural gas (per Mcf) | | | 3.25 | | | 1.98 | | | 2.04 | | | | 2.53 | | | 2.50 | | | 2.50 |
| | | | | | | | | | | | | | | | | | | |
Capital Expenditures | | | | | | | | | | | | | | | | | | | |
Capital spending |
| $ | 2.9 |
| $ | 49.5 |
| $ | 52.4 | |
| $ | 7.5 |
| $ | 91.9 |
| $ | 99.4 |
Acquisitions | | | 0.5 | | | 1.6 | | | 2.1 | | | | 3.1 | | | 3.0 | | | 6.1 |
Divestments | | | — | | | — | | | — | | | | 0.3 | | | — | | | 0.3 |
| | | | | | | | | | | | | | | | | | | |
Netback(3) Before Hedging | | | | | | | | | | | | | | | | | | | |
Crude oil and natural gas sales |
| $ | 33.4 |
| $ | 209.3 |
| $ | 242.7 | |
| $ | 49.5 |
| $ | 362.1 |
| $ | 411.6 |
Royalties | | | (4.7) | | | (43.0) | | | (47.7) | | | | (11.3) | | | (73.3) | | | (84.6) |
Production taxes | | | (0.5) | | | (12.7) | | | (13.2) | | | | (0.7) | | | (22.8) | | | (23.5) |
Operating expenses | | | (14.0) | | | (51.1) | | | (65.1) | | | | (18.2) | | | (61.3) | | | (79.5) |
Transportation costs | | | (2.4) | | | (28.4) | | | (30.8) | | | | (2.1) | | | (35.7) | | | (37.8) |
Netback before hedging |
| $ | 11.8 |
| $ | 74.1 |
| $ | 85.9 | |
| $ | 17.2 |
| $ | 169.0 |
| $ | 186.2 |
| | | | | | | | | | | | | | | | | | | |
Other Expenses | | | | | | | | | | | | | | | | | | | |
Asset impairment | | $ | 33.5 | | $ | 277.7 | | $ | 311.2 | | | $ | — | | $ | — | | $ | — |
Goodwill impairment | | | — | | | — | | | — | | | | 451.1 | | | — | | | 451.1 |
Commodity derivative instruments loss/(gain) |
| | 12.5 |
| | — |
| | 12.5 | |
| | 28.8 |
| | — |
| | 28.8 |
General and administrative expense(4) | | | 3.3 | | | 13.2 | | | 16.5 | | | | 8.7 | | | 10.1 | | | 18.8 |
Current income tax recovery | | | — | | | — | | | — | | | | — | | | (14.0) | | | (14.0) |
(1) | Company interest volumes. |
(2) | Before transportation costs, royalties and the effects of commodity derivative instruments. |
(3) | See “Non-GAAP Measures” section in this MD&A. |
(4) | Includes share-based compensation. |
Comparing the fourth quarter of 2020 with the same period in 2019:
| ● | Average daily production was 86,244 BOE/day, a decrease of 20% from 107,436 BOE/day. The decrease in crude oil production was a result of the suspension of our operated North Dakota drilling and completions program early in 2020 as a result of weak commodity prices. Natural gas production decreased due to limited capital activity in the Marcellus and our decision to shut-in, abandon and reclaim our Canadian natural gas property in Tommy Lakes during the first quarter of 2020. These impacts were partially offset by an increase in natural gas liquids production over the same period due to an increase in natural gas liquids recoveries. |
| ● | Our crude oil and natural gas liquids production accounted for 57% of our total production mix in the fourth quarter of 2020, compared to 56% in 2019. |
| ● | Capital spending decreased to $52.4 million compared to $99.4 million in the fourth quarter of 2019 due to the suspension of our operated North Dakota drilling and completions program early in 2020. The majority of our capital investment in the fourth quarter of 2020 was focused on our U.S. crude oil properties, including the completion of four drilled uncompleted wells and approximately three net-operated wells. |
| ● | Operating expenses decreased to $65.1 million ($8.20/BOE) compared to $79.5 million ($8.05/BOE) in the fourth quarter of 2019. Operating costs increased on a per BOE basis due to lower production. |
6 ENERPLUS 2020 FINANCIAL SUMMARY
| ● | Cash general and administrative (“G&A”) expenses decreased to $11.6 million compared to $13.3 million in 2019, however increased on a per BOE basis totaling $1.46/BOE in the fourth quarter of 2020, compared to $1.34/BOE in the same period of 2019 due to lower production. |
| ● | During the fourth quarter of 2020, our Bakken crude oil price differential widened to US$4.82/bbl below WTI, compared to US$4.40/bbl below WTI for the same period in 2019, due to much narrower Brent-WTI differentials. Our fourth quarter 2020 Marcellus natural gas differential was US$1.07/Mcf below NYMEX, compared to US$0.63/Mcf below NYMEX during the same period in 2019. Regional pricing in the Marcellus was particularly weak from September to November 2020 due to nearly full regional storage combined with low demand due to mild weather. |
| ● | We reported a net loss of $204.2 million in the fourth quarter of 2020 compared to net loss of $429.1 million in the fourth quarter of 2019. Our net loss decreased by $224.9 million due to lower non-cash impairment charges, with a non-cash PP&E impairment of $311.2 million recorded in the fourth quarter of 2020 compared to a non-cash goodwill impairment of $451.1 million recorded in the fourth quarter of 2019. The decrease in the net loss was also due to a $116.7 million deferred income tax recovery in the fourth quarter of 2020 compared to an expense of $31.8 million in the same period in 2019. |
| ● | Cash flow from operating activities and adjusted funds flow decreased to $96.1 million and $91.9 million, respectively, compared to $188.5 million and $178.9 million, respectively, in the fourth quarter of 2019. The decreases were primarily the result of a $132.0 million decrease in crude oil and natural gas sales, net of royalties, partially offset by $24.7 million in realized cash gains on commodity derivative instruments in the fourth quarter of 2020. |
| ● | Net debt to adjusted funds flow increased to 1.0x in the fourth quarter of 2020 compared to 0.6x in the fourth quarter of 2019. |
2020 OVERVIEW
Summary of Guidance and Results | | Revised 2020 Guidance | | 2020 Results |
Capital spending ($ millions) | | $295 | | $291 |
Average annual production (BOE/day) | | 90,000 - 91,000 | | 90,697 |
Average annual crude oil and natural gas liquids production (bbls/day) | | 50,500 - 51,000 | | 51,054 |
Fourth quarter average production (BOE/day) | | 84,000 - 87,000 | | 86,244 |
Fourth quarter average crude oil and natural gas liquids production (bbls/day) | | 47,000 - 49,000 | | 49,195 |
Average royalty and production tax rate (% of gross sales, before transportation) | | 26% | | 26% |
Operating expenses (per BOE) | | $8.00 | | $7.94 |
Transportation costs (per BOE) | | $4.00 | | $3.99 |
Cash G&A expenses (per BOE) | | $1.35 | | $1.35 |
| | | | |
Differential/Basis Outlook and Results(1) | | | | |
Average U.S. Bakken crude oil differential (compared to WTI crude oil) | | US$(5.00)/bbl | | US$(4.96)/bbl |
Average Marcellus natural gas differential (compared to NYMEX natural gas) | | US$(0.60)/Mcf | | US$(0.65)/Mcf |
| (1) | Excludes transportation costs |
The coronavirus (“COVID-19”) pandemic had a major impact on the global economy in 2020 and posed significant challenges for our industry. In response to a dramatic decline in crude oil demand and historically low prices during the second quarter of 2020, we temporarily curtailed certain wells across our crude oil and natural gas liquids properties and suspended our operated drilling and completions activity in North Dakota. In response to strengthening prices, our previously curtailed production was fully restored during the third quarter and we completed four net operated wells in North Dakota and approximately three net non-operated wells during the fourth quarter. Although markets remain volatile and the timing of a full economic recovery remains uncertain, crude oil prices continue to improve as supply moderates and demand levels begin to recover. We remained committed to preserving our strong financial position through a focus on reducing costs, maintaining capital discipline and delivering strong operational performance.
Our 2020 annual average production was 90,697 BOE/day with crude oil and natural gas liquids volumes of 51,054 bbls/day, meeting our revised production guidance target of 90,000 – 91,000 BOE/day and exceeding our revised crude oil and natural gas liquids production guidance of 50,500 – 51,000 bbls/day. Our capital spending for the year totaled $291.4 million, below our revised guidance of $295 million. The majority of our capital was directed to our U.S. crude oil properties, with approximately 80% of total spending focused on our North Dakota and Colorado properties.
Our Bakken sales price differentials widened in comparison to the prior year averaging US$4.96/bbl below WTI, in line with our guidance of US$5.00/bbl below WTI. Bakken differentials were negatively impacted by the significant benchmark oil price volatility and the narrowing of the Brent-WTI price differentials in 2020. Our Marcellus differential of US$0.65/Mcf below NYMEX was slightly higher than our revised differential outlook of US$0.60/Mcf below NYMEX and wider than our 2019 differential of US$0.39/Mcf below NYMEX. Regional pricing in the Marcellus was particularly weak from September to November of 2020 as a result of nearly full regional storage combined with low demand due to mild weather.
ENERPLUS 2020 FINANCIAL SUMMARY 7
Operating expenses were $7.94/BOE, below our revised guidance of $8.00/BOE. Cash G&A expenses were $1.35/BOE, in line with our revised guidance of $1.35/BOE.
Cash flow from operations and adjusted funds flow decreased to $446.4 million and $358.2 million, respectively, from $694.2 million and $709.0 million, respectively, in 2019. The decrease was mainly due to a $517.6 million reduction in crude oil and natural gas sales, net of royalties, due to a decrease in realized commodity prices and lower production compared to 2019. This was partially offset by a $115.6 million increase in realized commodity derivative instrument gains.
We reported a net loss of $923.4 million in 2020, an increase from a net loss of $259.7 million in 2019. Our net loss was impacted by non-cash impairments of $994.8 million on PP&E and $202.8 million on goodwill as a result of low commodity prices. These reductions were partially offset by a total income tax recovery of $260.8 million in 2020 compared to an expense of $47.9 million in 2019.
Total debt net of cash at December 31, 2020 was $376.0 million, comprised of $490.4 million of senior notes less $114.5 million in cash. At December 31, 2020, we were undrawn on our US$600 million senior unsecured bank credit facility and had a net debt to adjusted funds flow ratio of 1.0x.
2021 OUTLOOK
On January 25, 2021, we entered into the Purchase Agreement to acquire all the equity interests of Bruin, a pure play Williston Basin private company, for total cash consideration of US$465 million, with no assumption of debt and subject to certain adjustments. On the same date, we entered into a binding commitment letter for a new three-year senior unsecured US$400 million term facility (the "Term Facility") to be fully drawn down on the closing date of the Bruin Acquisition to pay for a portion of the purchase price. We intend to fund the remaining portion of the purchase price with net proceeds from a $132.3 million bought deal equity financing, which we completed on February 3, 2021. Closing of the Bruin Acquisition is expected to occur early in March 2021 and is subject to customary closing conditions and purchase price adjustments including those related to the fair value of Bruin’s commodity hedge contracts. Bruin’s current production is approximately 24,000 BOE/day (72% tight oil, 14% natural gas liquids, and 14% natural gas). Refer to the material change report dated January 29, 2021 in connection with the Bruin Acquisition and available under the Enerplus’ SEDAR profile at www.sedar.com and on the Enerplus’ EDGAR profile under Form 6-K at www.sec.gov.
We expect that the Bruin Acquisition will further support our 2021 strategy of creating value for our shareholders through strong free cash flow generation and disciplined returns-oriented focus, while maintaining balance sheet strength. We expect our net debt to trailing adjusted funds flow ratio to be approximately 1.0x at year end 2021 based on WTI of US$55.00/bbl and NYMEX of US$3.00/Mcf. We expect to be undrawn on our US$600 million credit facility upon the closing of the Bruin Acquisition.
Our 2021 production volumes are expected to average 103,500 – 108,500 BOE/day, including 63,000 – 67,000 bbl/day of crude oil and natural gas liquids production, assuming the Bruin Acquisition closes in early March 2021 and a ten-month contribution from Bruin’s assets. Based on the same assumption, we expect our capital budget range for 2021 is between $335 million and $385 million, with the majority directed to our North Dakota assets.
We expect our Bakken sales price differential to narrow to US$3.25/bbl below WTI in 2021, assuming the Dakota Access Pipeline (“DAPL”) continues to operate, an improvement from our 2020 differential of US$4.96/bbl below WTI. The expected improvement is due to declining regional production leading to increased pipeline egress. In the Marcellus, we have a differential outlook of US$0.55/Mcf below NYMEX in 2021.
To support our 2021 capital program, and assuming the closing of the Bruin Acquisition, we have hedged approximately 21,500 bbls/day and 17,000 bbls/day, respectively, of our expected crude oil production for 2021 and 2022. For natural gas, we have hedged 60,000 Mcf/day for March 2021 and 100,000 Mcf/day for April 1 to October 31, 2021.
We plan to provide additional 2021 guidance upon the closing of the Bruin Acquisition.
8 ENERPLUS 2020 FINANCIAL SUMMARY
RESULTS OF OPERATIONS
Production
Average Daily Production Volumes | | | 2020 | | | 2019 | | | 2018 |
Light and medium oil (bbls/day) | | | 3,277 | | | 3,908 | | | 4,287 |
Heavy oil (bbls/day) | | | 3,901 | | | 4,717 | | | 4,995 |
Tight oil (bbls/day) | | | 38,243 | | | 41,079 | | | 36,142 |
Total crude oil (bbls/day) | | | 45,421 | | | 49,704 | | | 45,424 |
| | | | | | | | | |
Natural gas liquids (bbls/day) | | | 5,633 | | | 4,929 | | | 4,486 |
| | | | | | | | | |
Conventional natural gas (Mcf/day) | | | 12,314 | | | 23,400 | | | 27,159 |
Shale gas (Mcf/day) | | | 225,543 | | | 255,051 | | | 232,678 |
Total natural gas (Mcf/day) | | | 237,857 | | | 278,451 | | | 259,837 |
Total daily sales (BOE/day) | | | 90,697 | | | 101,042 | | | 93,216 |
Production in 2020 averaged 90,697 BOE/day, in line with our revised production guidance range of 90,000 – 91,000 BOE/day, and resulting in a 10% decrease compared to 2019 production of 101,042 BOE/day. Crude oil and natural gas liquids production in 2020 averaged 51,054 bbls/day, exceeding our revised guidance range of 50,500 – 51,500 bbls/day. Compared to 2019, our crude oil and natural gas liquids production decreased 7% due to the temporary curtailment of certain crude oil and natural gas liquids properties and the suspension of all operated drilling and completion activity in North Dakota during the second quarter of 2020, in response to the significant decline in crude oil prices.
Our U.S. production volumes decreased by 8% compared to 2019 and our U.S. crude oil and natural gas liquids production decreased by 4% to 43,248 bbls/day, primarily due to temporary production curtailments and the suspension of our operated North Dakota drilling and completions program early in 2020 due to weak commodity prices. Our U.S. natural gas production decreased by 12% due to limited capital activity in the Marcellus.
Canadian production volumes decreased by 27% compared to the prior year, due to our decision to shut-in, abandon and reclaim our Canadian natural gas property in Tommy Lakes during the first quarter of 2020.
Our crude oil and natural gas liquids production accounted for 56% of our total average daily production in 2020, an increase from 54% in 2019.
Production for 2019 increased by 7,826 BOE/day to 101,042 BOE/day, compared to 2018. The 8% increase was largely due to an increase to the 2019 capital spending program and additional wells brought on-stream in North Dakota and Colorado. During the same period, U.S. natural gas production increased 10% due to strong well performance in the Marcellus in 2019.
2021 Guidance
We expect annual average production for 2021 of 103,500 – 108,500 BOE/day, including 63,000 – 67,000 bbls/day of crude oil and natural gas liquids production, assuming the closing of the Bruin Acquisition in early March 2021 and a ten month contribution from Bruin’s assets in 2021.
ENERPLUS 2020 FINANCIAL SUMMARY 9
Pricing
The prices received for our crude oil and natural gas production directly impact our earnings, cash flow from operating activities, adjusted funds flow and financial condition. The following table summarizes our average selling prices, benchmark prices and differentials:
Pricing (average for the period) |
| 2020 |
| 2019 |
| 2018 | |||
Benchmarks | | | | | | | | | |
WTI crude oil (US$/bbl) | | $ | 39.40 |
| $ | 57.03 |
| $ | 64.77 |
Brent (ICE) crude oil (US$/bbl) | | | 43.21 | | | 64.18 | | | 71.53 |
NYMEX natural gas – last day (US$/Mcf) | | | 2.08 | | | 2.63 | | | 3.09 |
US/CDN average exchange rate | | | 1.34 | | | 1.33 | | | 1.30 |
US/CDN period end exchange rate | | | 1.27 | | | 1.30 | | | 1.36 |
| | | | | | | | | |
Enerplus selling price(1) | | | | | | | | | |
Crude oil ($/bbl) | | $ | 44.35 |
| $ | 68.98 |
| $ | 74.59 |
Natural gas liquids ($/bbl) | | | 10.29 | | | 15.19 | | | 28.31 |
Natural gas ($/Mcf) | | | 1.87 | | | 2.87 | | | 3.42 |
| | | | | | | | | |
Average benchmark differentials | | | | | | | | | |
Bakken DAPL - WTI (US$/bbl) | | $ | (4.27) | | $ | (3.46) | | $ | (3.73) |
Brent (ICE) - WTI (US$/bbl) | | | 3.81 | | | 7.15 | | | 6.77 |
MSW Edmonton – WTI (US$/bbl) | | | (5.33) |
| | (4.88) |
| | (11.12) |
WCS Hardisty – WTI (US$/bbl) | | | (12.60) | | | (12.76) | | | (26.31) |
Transco Leidy monthly – NYMEX (US$/Mcf) | | | (0.72) | | | (0.46) | | | (0.64) |
Transco Z6 Non-New York monthly – NYMEX (US$/Mcf) | | | 0.34 | | | 0.23 | | | 0.75 |
| | | | | | | | | |
Enerplus realized differentials(1)(2) | | | | | | | | | |
Bakken crude oil – WTI (US$/bbl) | | $ | (4.96) | | $ | (3.61) | | $ | (3.78) |
Marcellus natural gas – NYMEX (US$/Mcf) | | | (0.65) | | | (0.39) | | | (0.43) |
Canada crude oil – WTI (US$/bbl) | | | (13.04) | | | (12.11) |
| | (21.83) |
| (1) | Excluding transportation costs, royalties and the effects of commodity derivative instruments. |
| (2) | Based on a weighted average differential for the period. |
CRUDE OIL AND NATURAL GAS LIQUIDS
Benchmark WTI prices averaged US$39.40/bbl in 2020, a 31% decrease from 2019, largely due to the COVID-19 pandemic and the resulting reduction in crude oil demand due to restrictions on mobility and travel. WTI prices fell sharply in the second quarter of 2020, at one point reaching negative values in April, which resulted in production curtailments across North America that helped balance the market further throughout the year. The Organization of Petroleum Exporting Countries (“OPEC”) lowered its production quotas in response to the pandemic in the spring. Crude oil markets recovered through the second half of the year as global economies stabilized and demand for crude oil began to recover. This resulted in lower global crude oil storage and higher WTI prices at the end of the year. Our 2020 realized crude oil price averaged $44.35/bbl, representing a 36% decrease compared to 2019 and a 31% decrease in benchmark WTI prices as a result of wider Bakken crude oil differentials compared to the previous year.
Our Bakken sales price differentials weakened in 2020 compared to 2019, averaging US$4.96/bbl below WTI, in line with our guidance of US$5.00/bbl below WTI. Bakken prices were volatile in the second quarter of 2020 due to significant benchmark oil price fluctuations. Additionally, weakness in U.S. Gulf Coast grades and a narrow Brent-WTI differential reduced our realized pricing on physical sales that were linked to these markets. We expect our realized Bakken differential to average US$3.25/bbl below WTI in 2021, assuming DAPL continues to operate.
Canadian crude oil differentials weakened slightly in 2020 compared to the prior year. Differentials were weaker in the first quarter of 2020 prior to industry wide production curtailments. Differentials narrowed after April and throughout the remainder of year as spare capacity increased on export pipelines as a result of lower production levels.
We realized an average price of $10.29/bbl on our natural gas liquids production in 2020, a 32% decrease compared to 2019 and in line with changes to benchmark oil prices. A significant portion of our natural gas liquid sales are linked to WTI prices, particularly condensate and butane.
10 ENERPLUS 2020 FINANCIAL SUMMARY
NATURAL GAS
Our realized natural gas price averaged $1.87/Mcf in 2020, a 35% decrease from 2019. This decrease was greater than the 21% decline in benchmark natural gas prices due to significantly weaker gas prices in the Marcellus in 2020.
In the Marcellus, we realized an average sales price differential of US$0.65/Mcf below NYMEX, slightly higher than our revised guidance of $0.60/Mcf below NYMEX for the year and wider compared to our 2019 realized sales price differential of $0.39/Mcf. The Transco Leidy monthly benchmark differential averaged US$0.72/Mcf below NYMEX for 2020, which was weaker than 2019 as the local market suffered from high storage levels and a lack of weather-induced demand, particularly in the shoulder months of September and October. At the same time, NYMEX Natural Gas prices at Henry Hub were significantly stronger due to the much improved supply and demand outlook for the upcoming winter. Transco Z6 Non-New York Leidy monthly benchmark differentials averaged US$0.34/Mcf above NYMEX for 2020, a slight improvement over the full 2019 differential. We expect our Marcellus differential to average US$0.55/Mcf below NYMEX in 2021.
Monthly Crude Oil Prices

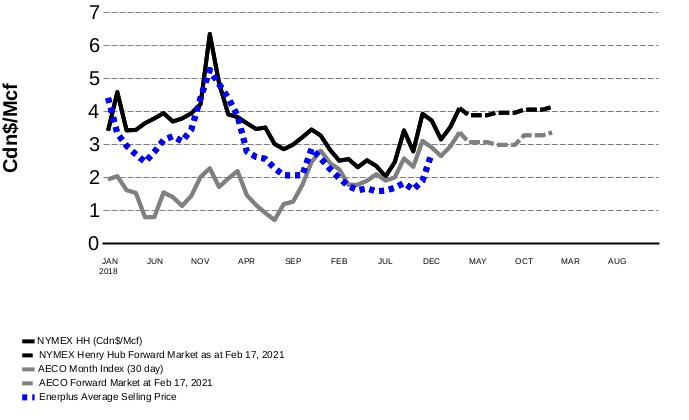
Monthly Natural Gas Prices

ENERPLUS 2020 FINANCIAL SUMMARY 11
FOREIGN EXCHANGE
Our crude oil and natural gas sales are impacted by foreign exchange fluctuations as the majority of our sales are based on U.S. dollar denominated benchmark indices. A stronger Canadian dollar decreases the amount of our realized sales, as well as the amount of our U.S. denominated costs, such as capital, the interest on our U.S. denominated debt, and the value of our outstanding U.S. senior notes.
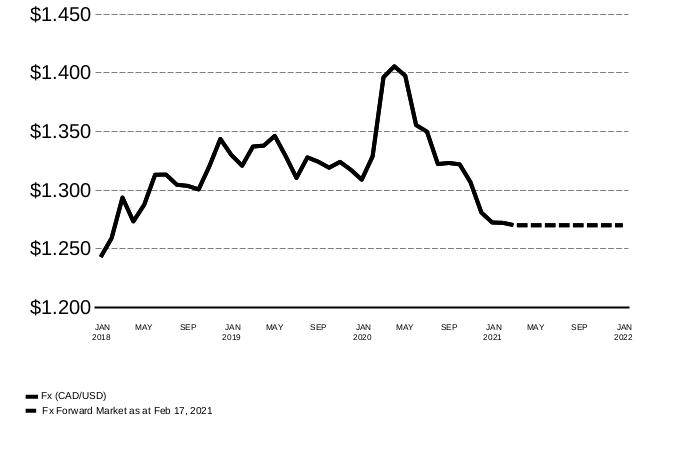
The Canadian dollar weakened during 2020 in response to lower commodity prices as a result of the global excess supply of crude oil and the decreased demand impact of the COVID-19 pandemic. The USD/CDN exchange rate peaked at 1.45 USD/CDN in March and remained volatile for the remainder of the year, resulting in an average exchange rate of 1.34 USD/CDN during 2020 compared to an average of 1.33 in 2019. The Canadian dollar strengthened at the end of the 2020 to close at 1.27 USD/CDN compared to 1.30 USD/CDN at December 31, 2019.
Monthly USD/CDN Exchange Rate

Price Risk Management
We have a price risk management program that considers our overall financial position and the economics of our capital expenditures.
As of February 18, 2021, we have hedged approximately 21,500 bbls/day and 17,000 bbls/day, respectively, of our expected crude oil production for 2021 and 2022. Our crude oil hedges are predominantly three way collars. The three way collars provide us with exposure to significant upward price moves; however, the sold put effectively limits the amount of downside protection we have to the difference between the strike price of the purchased and sold puts. For natural gas, we have hedged 60,000 Mcf/day for March 2021 and 100,000 Mcf/day for April 1 to October 31, 2021. Overall, we expect our crude oil and natural gas related hedging contracts to protect a significant portion of our cash flow from operating activities and adjusted funds flow in both 2021 and 2022.
12 ENERPLUS 2020 FINANCIAL SUMMARY
The following is a summary of Enerplus’ financial contracts in place at February 18, 2021:
| | WTI Crude Oil (US$/bbl)(1) | | NYMEX Natural Gas (US$/Mcf) | ||||
|
| Jan 1, 2021 – | Apr 1, 2021- | Jul 1, 2021 - | Jan 1 ,2022 - | | Mar 1, 2021- | Apr 1, 2021 - |
| | Mar 31, 2021 | Jun 30, 2021 | Dec 31, 2021 | Dec 31, 2022 | | Mar 31, 2021 | Oct 31, 2021 |
Swaps | | | | | | | | |
Volume (bbls/d or Mcf/d) | | 5,000 | - | - | - | | 60,000 | 60,000 |
Sold Swaps | | $ 45.55 | - | - | - | | $ 3.16 | $ 2.90 |
| | | | | | | | |
Three Way Collars | | | | | | | | |
Volume (bbls/d or Mcf/d) | | 15,000 | 20,000 | 23,000 | 17,000 | | - | 40,000 |
Sold Puts | | $ 32.00 | $ 32.00 | $ 36.39 | $ 40.00 | | - | $ 2.15 |
Purchased Puts | | $ 40.53 | $ 40.90 | $ 46.39 | $ 50.00 | | - | $ 2.75 |
Sold Calls | | $ 50.29 | $ 50.72 | $ 56.70 | $ 57.91 | | - | $ 3.25 |
| (1) | The total average deferred premium spent on our outstanding hedges is US$0.80/bbl from January 1, 2021 – December 31, 2021 and US$1.50/bbl from January 1, 2022 – December 31, 2022. |
As of February 18, 2021, the following is a summary of Bruin’s financial contracts, which Enerplus will assume upon the close of the Bruin Acquisition.
| WTI Crude Oil (US$/bbl)(1)(2) | |||
| Mar 1, 2021 - | Jan 1, 2022 - | Jan 1, 2023 - | Nov 1, 2023- |
| Dec 31, 2021 | Dec 31, 2022 | Oct 31, 2023 | Dec 31, 2023 |
Swaps | | | | |
Volume (bbls/d) | 9,000 | 3,900 | 250 | - |
Sold Swaps | $ 42.35 | $ 42.38 | $ 42.10 | - |
| | | | |
Collars | | | | |
Volume (bbls/d) | - | - | 2,000 | 2,000 |
Purchased Puts | - | - | $ 5.00 | $ 5.00 |
Sold Calls | - | - | $ 75.00 | $ 75.00 |
| (1) | Transactions with a common term have been aggregated and presented at weighted average prices and volumes. |
| (2) | Upon close of the Bruin Acquisition, these hedges will be recorded at fair value on the Consolidated Balance Sheets. Realized and unrealized gains and losses on the acquired hedges will be recorded in the Consolidated Statement of Income/(Loss) and the Consolidated Balance Sheets, respectively, to reflect changes in WTI prices from the date of the close of the Bruin Acquisition. |
ACCOUNTING FOR PRICE RISK MANAGEMENT
Commodity Derivative Instruments Gains/(Losses) | | | | | | | | | |
($ millions) |
| 2020 |
| 2019 |
| 2018 | |||
Cash gains/(losses): | | | | | | | | | |
Crude oil |
| $ | 131.0 |
| $ | (12.1) |
| $ | (52.0) |
Natural gas | | | — | | | 27.4 | | | 16.2 |
Total cash gains/(losses) |
| $ | 131.0 |
| $ | 15.3 |
| $ | (35.8) |
| | | | | | | | | |
Non-cash gains/(losses): | | | | | | | | | |
Crude oil |
| $ | (25.7) |
| $ | (70.5) |
| $ | 114.8 |
Natural gas | | | 3.5 | | | (10.9) | | | 9.2 |
Total non-cash gains/(losses) |
| $ | (22.2) |
| $ | (81.4) |
| $ | 124.0 |
Total commodity derivative instruments gains/(losses) |
| $ | 108.8 |
| $ | (66.1) |
| $ | 88.2 |
(Per BOE) |
| 2020 |
| 2019 |
| 2018 | |||
Total cash gains/(losses) |
| $ | 3.95 |
| $ | 0.42 |
| $ | (1.05) |
Total non-cash gains/(losses) | | | (0.66) | | | (2.21) | | | 3.64 |
Total commodity derivative instruments gains/(losses) |
| $ | 3.29 |
| $ | (1.79) |
| $ | 2.59 |
During 2020, we realized cash gains of $131.0 million on crude oil contracts and no cash gains or losses on our natural gas contracts, compared to cash losses of $12.1 million on crude oil contracts and cash gains of $27.4 million on our natural gas contracts in 2019. Cash gains in 2020 on crude oil contracts were primarily due to prices falling below the swap level as well as the net effect of benchmark prices below the put levels on both our put spreads and three way collars.
ENERPLUS 2020 FINANCIAL SUMMARY 13
As the forward markets for crude oil and natural gas fluctuate, as new contracts are executed, and as existing contracts are realized, changes in fair value are reflected as either a non-cash charge or gain to earnings. The fair value of our crude oil contracts at December 31, 2020 was a net liability position of $15.6 million (December 31, 2019 – net asset position of $10.1 million). The fair value of our natural gas contracts at December 31, 2020 was in a net asset position of $3.5 million (December 31, 2019 – no contracts outstanding). The change in fair value of our crude oil and natural gas contracts represented losses of $25.7 million and gains of $3.5 million, respectively, during 2020 and losses of $70.5 million and $10.9 million, respectively, during 2019.
Revenues
($ millions) |
| 2020 |
| 2019 |
| 2018 | |||
Crude oil and natural gas sales |
| $ | 923.5 |
| $ | 1,572.9 |
| $ | 1,610.9 |
Royalties | | | (186.3) | | | (318.1) | | | (318.2) |
Crude oil and natural gas sales, net of royalties |
| $ | 737.2 |
| $ | 1,254.8 |
| $ | 1,292.7 |
Crude oil and natural gas sales revenue for 2020 totaled $923.5 million, a decrease of 41% from $1,572.9 million in 2019. The decrease in revenue was a result of lower commodity prices and a decrease in production volumes.
Crude oil and natural gas sales revenue for 2019 totaled $1,572.9 million, a decrease of 2% from $1,610.9 million in 2018. The decrease in revenue was a result of lower commodity prices, which more than offset the increase in production volumes.
Royalties and Production Taxes
($ millions, except per BOE amounts) |
| 2020 |
| 2019 |
| 2018 |
| |||
Royalties |
| $ | 186.3 |
| $ | 318.1 |
| $ | 318.2 | |
Per BOE |
| $ | 5.61 |
| $ | 8.63 |
| $ | 9.35 | |
| | | | | | | | | | |
Production taxes |
| $ | 49.9 |
| $ | 83.1 |
| $ | 87.3 | |
Per BOE |
| $ | 1.51 |
| $ | 2.25 |
| $ | 2.57 | |
Royalties and production taxes |
| $ | 236.2 |
| $ | 401.2 |
| $ | 405.5 | |
Per BOE |
| $ | 7.12 |
| $ | 10.88 |
| $ | 11.92 | |
| | | | | | | | | | |
Royalties and production taxes (% of crude oil and natural gas sales) | | | 25.6% |
| | 25.5% |
| | 25.2% | |
Royalties are paid to government entities, land owners and mineral rights owners. Production taxes include state production taxes, Pennsylvania impact fees and freehold mineral taxes. A large percentage of our production is from U.S. properties where royalty rates are generally higher than in Canada and less sensitive to commodity price levels.
Royalties and production taxes were in line with our guidance of 26% for 2020, averaging 25.6% of crude oil and natural gas sales, before transportation. Royalties and production taxes of $236.2 million in 2020, decreased in comparison to prior years due to lower realized commodity prices and production volumes. Royalties and production taxes of $401.2 million in 2019 were consistent with 2018, but decreased on a per BOE basis due to lower realized commodity prices.
Operating Expenses
($ millions, except per BOE amounts) |
| 2020 |
| 2019 |
| 2018 | |||
Operating expenses |
| $ | 263.6 |
| $ | 290.8 |
| $ | 238.3 |
Per BOE |
| $ | 7.94 |
| $ | 7.88 |
| $ | 7.00 |
Operating expenses for 2020 were $263.6 million or $7.94/BOE, beating our revised guidance of $8.00/BOE and representing a decrease of $27.2 million or an increase of $0.06/BOE from the prior year. The decrease was largely due to lower fluid handling costs associated with lower production volumes. This was partially offset by additional well service activity and repairs and maintenance during the third quarter of 2020, as previously curtailed production was restored.
Operating expenses for 2019 were $290.8 million or $7.88/BOE, representing an increase of $52.5 million or $0.88/BOE from 2018. The increase was mainly attributable to additional well service activity, higher fluid handling costs and gas processing charges related to our North Dakota asset.
14 ENERPLUS 2020 FINANCIAL SUMMARY
Transportation Costs
($ millions, except per BOE amounts) |
| 2020 |
| 2019 |
| 2018 | |||
Transportation costs |
| $ | 132.4 |
| $ | 144.9 |
| $ | 123.5 |
Per BOE |
| $ | 3.99 |
| $ | 3.93 |
| $ | 3.63 |
Transportation costs in 2020 were in line with our revised guidance of $4.00/BOE, averaging $3.99/BOE or $132.4 million, compared to $3.93/BOE or $144.9 million in 2019. The reduction in transportation costs was primarily a result of lower U.S. production with higher associated transportation costs compared to the same period in the prior year, partly due to price related production curtailments in the second quarter of 2020. On a per BOE basis, transportation costs were in line with the prior year.
Transportation costs in 2019 were $3.93/BOE, an increase from $3.63/BOE in 2018. The overall increase in transportation costs were due to additional crude oil firm transportation commitments that provide access to sell a portion of our production at U.S. Gulf Coast or Brent pricing that commenced March 1, 2019.
Netbacks
The crude oil and natural gas classifications below contain properties according to their dominant production category. These properties may include associated crude oil, natural gas or natural gas liquids volumes which have been converted to the equivalent BOE/day or Mcfe/day and as such, the revenue per BOE or per Mcfe may not correspond with the average selling price under the “Pricing” section of this MD&A.
| Year ended December 31, 2020 | ||||||||
Average Daily Production | |
| 56,055 BOE/day | |
| 207,855 Mcfe/day | |
| 90,697 BOE/day |
Netback(1) $ per BOE or Mcfe | |
| (per BOE) | |
| (per Mcfe) | |
| (per BOE) |
Crude oil and natural gas sales |
| $ | 37.78 |
| $ | 1.95 |
| $ | 27.82 |
Royalties and production taxes | | | (10.07) | | | (0.39) | | | (7.12) |
Operating expenses | | | (11.75) | | | (0.29) | | | (7.94) |
Transportation costs | | | (2.90) | | | (0.96) | | | (3.99) |
Netback before hedging |
| $ | 13.06 |
| $ | 0.31 |
| $ | 8.77 |
Cash gains/(losses) | | | 6.38 | | | — | | | 3.95 |
Netback after hedging |
| $ | 19.44 |
| $ | 0.31 |
| $ | 12.72 |
Netback before hedging ($ millions) |
| $ | 268.0 |
| $ | 23.3 |
| $ | 291.3 |
Netback after hedging ($ millions) |
| $ | 399.0 |
| $ | 23.3 |
| $ | 422.3 |
| Year ended December 31, 2019 | ||||||||
Average Daily Production | |
| 58,679 BOE/day | |
| 254,177 Mcfe/day | |
| 101,042 BOE/day |
Netback(1) $ per BOE or Mcfe | |
| (per BOE) | |
| (per Mcfe) | |
| (per BOE) |
Crude oil and natural gas sales |
| $ | 60.60 |
| $ | 2.97 |
| $ | 42.65 |
Royalties and production taxes | | | (16.30) | | | (0.56) | | | (10.88) |
Operating expenses | | | (12.23) | | | (0.31) | | | (7.88) |
Transportation costs | | | (2.97) | | | (0.88) | | | (3.93) |
Netback before hedging |
| $ | 29.10 |
| $ | 1.22 |
| $ | 19.96 |
Cash gains/(losses) | | | (0.57) | | | 0.30 | | | 0.42 |
Netback after hedging |
| $ | 28.53 |
| $ | 1.52 |
| $ | 20.38 |
Netback before hedging ($ millions) |
| $ | 623.3 |
| $ | 112.7 |
| $ | 736.0 |
Netback after hedging ($ millions) |
| $ | 611.1 |
| $ | 140.3 |
| $ | 751.4 |
| (1) | See “Non-GAAP Measures” in this MD&A. |
ENERPLUS 2020 FINANCIAL SUMMARY 15
| Year ended December 31, 2018 | ||||||||
Netbacks by Property Type | | Crude Oil | | Natural Gas | | Total | |||
Average Daily Production |
|
| 53,294 BOE/day | |
| 239,532 Mcfe/day | |
| 93,216 BOE/day |
Netback(1) $ per BOE or Mcfe | |
| (per BOE) | |
| (per Mcfe) | |
| (per BOE) |
Crude oil and natural gas sales |
| $ | 67.43 |
| $ | 3.42 |
| $ | 47.35 |
Royalties and production taxes | | | (17.90) | | | (0.65) | | | (11.92) |
Operating expenses | | | (10.54) | | | (0.38) | | | (7.00) |
Transportation costs | | | (2.40) | | | (0.88) | | | (3.63) |
Netback before hedging |
| $ | 36.59 |
| $ | 1.51 |
| $ | 24.80 |
Cash gains/(losses) | | | (2.67) | | | 0.19 | | | (1.05) |
Netback after hedging |
| $ | 33.92 |
| $ | 1.70 |
| $ | 23.75 |
Netback before hedging ($ millions) |
| $ | 711.7 |
| $ | 131.9 |
| $ | 843.6 |
Netback after hedging ($ millions) |
| $ | 659.7 |
| $ | 148.1 |
| $ | 807.8 |
| (1) | See “Non-GAAP Measures” in this MD&A. |
As a result of the low commodity price environment, total netbacks before and after hedging decreased by 60% and 44%, respectively, in 2020 compared to 2019. Our price risk management program continued to provide adjusted funds flow protection, with realized cash gains on our crude oil derivative instruments partially offsetting the impact of lower realized pricing. During 2020, our crude oil properties accounted for 92% and 94% of our netback before and after hedging, respectively, compared to 85% and 81%, respectively, in 2019.
General and Administrative Expenses
Total G&A expenses include cash G&A expenses and share-based compensation (“SBC”) charges related to our long-term incentive plans (“LTI plans”). See Note 11, Note 14 and Note 15 to the Financial Statements for further details.
($ millions) |
| 2020 |
| 2019 |
| 2018 | |||
Cash: | | | | | | | | | |
G&A expense |
| $ | 44.9 |
| $ | 48.8 |
| $ | 50.0 |
Share-based compensation expense | | | (1.4) | | | 0.7 | | | 0.1 |
| | | | | | | | | |
Non-Cash: | | | | | | | | | |
Share-based compensation expense | | | 13.0 | | | 22.3 | | | 25.9 |
Equity swap loss/(gain) | | | 1.4 | | | 0.3 | | | (0.2) |
G&A expense/(recovery) | | | (0.3) | | | 0.7 | | | — |
Total G&A expenses |
| $ | 57.6 |
| $ | 72.8 |
| $ | 75.8 |
(Per BOE) |
| 2020 |
| 2019 |
| 2018 | |||
Cash: | | | | | | | | | |
G&A expense |
| $ | 1.35 |
| $ | 1.32 |
| $ | 1.47 |
Share-based compensation expense | | | (0.04) | | | 0.02 | | | 0.01 |
| | | | | | | | | |
Non-Cash: | | | | | | | | | |
Share-based compensation expense | | | 0.39 | | | 0.61 | | | 0.76 |
Equity swap loss/(gain) | | | 0.04 | | | 0.01 | | | (0.01) |
G&A expense/(recovery) | | | (0.01) | | | 0.02 | | | — |
Total G&A expenses |
| $ | 1.73 |
| $ | 1.98 |
| $ | 2.23 |
Cash G&A expenses were $44.9 million, or $1.35/BOE, in 2020, meeting our revised guidance of $1.35/BOE and lower in comparison to our 2019 Cash G&A of $48.8 million, or $1.32/BOE. Cash G&A expenses were lower in 2020 in part due to government funding received related to the second quarter, at the height of the uncertainty brought on by the COVID-19 pandemic, which reimbursed qualifying Canadian employers for a portion of salaries paid. Cash G&A expenses were further lowered by cash compensation reductions for our Board of Directors, executives and employees in effect during a portion of 2020, and other non-salary cost saving initiatives.
During 2020, we reported a cash SBC recovery of $1.4 million due to the impact of a lower share price on our outstanding Director Deferred Share Units (“DSUs”) and Director Restricted Share Units (“RSUs”), compared to an expense of $0.7 million in 2019. We recorded a non-cash SBC expense of $13.0 million, or $0.39/BOE, in 2020, compared to an expense of $22.3 million, or $0.61/BOE, in 2019. The decrease in non-cash SBC in 2020 was a result of a lower multiplier on our Performance Share Units (“PSUs”) compared to 2019.
16 ENERPLUS 2020 FINANCIAL SUMMARY
Cash G&A expenses in 2019 were $48.8 million, or $1.32/BOE, a decrease from $50.0 million, or $1.47/BOE, in 2018, mostly due to an increase in our production over the period. Cash SBC expense was $0.7 million, or $0.02/BOE, in 2019 compared to an expense of $0.1 million, or $0.01/BOE, in 2018. We recorded non-cash SBC of $22.3 million, or $0.61/BOE in 2019 compared to $25.9 million, or $0.76/BOE, in 2018. The decrease in non-cash SBC in 2019 was a result of a lower multiplier on our PSUs compared to 2018.
We have hedged a portion of the outstanding cash-settled units under our LTI plans. We recorded a non-cash mark-to-market loss of $1.4 million on these hedges in 2020 (2019 – $0.3 million loss; 2018 – $0.2 million gain).
Interest Expense
Interest on our senior notes and bank credit facility for 2020 totaled $28.4 million, a decrease of 16% from $33.9 million in 2019. The decrease was due to the repayment of a portion of our 2009 and 2012 senior notes during the second quarter of 2020.
Interest on our senior notes and bank credit facility for 2019 of $33.9 million decreased compared to $36.8 million in 2018 due to the repayment of a portion of our 2009 senior notes and the bullet repayment of the full principal amount of our 2012 $30 million senior notes during 2019.
At December 31, 2020, we were undrawn on our US$600 million bank credit facility and our debt consisted of fixed interest rate senior notes with a weighted average interest rate of 4.4%. See Note 7 to the Financial Statements for further details on our outstanding notes.
Foreign Exchange
($ millions) |
| 2020 |
| 2019 |
| 2018 | |||
Realized: |
| | |
| | |
| | |
Foreign exchange loss/(gain) on settlements | | $ | 0.6 | | $ | (0.1) | | $ | 0.5 |
Translation of U.S. dollar cash held in Canada loss/(gain) | | | (1.2) | | | 8.8 | | | (19.6) |
Unrealized loss/(gain) | | | 1.9 | | | (34.1) | | | 58.6 |
Total foreign exchange loss/(gain) |
| $ | 1.3 |
| $ | (25.4) |
| $ | 39.5 |
US/CDN average exchange rate | | | 1.34 | | | 1.33 | | | 1.30 |
US/CDN period end exchange rate | | | 1.27 | | | 1.30 | | | 1.36 |
We recorded a total foreign exchange loss of $1.3 million in 2020, compared to a gain of $25.4 million in 2019 and a loss of $39.5 million in 2018. Realized gains and losses relate primarily to day-to-day transactions recorded in foreign currencies and the translation of our U.S. dollar denominated cash held in Canada, while unrealized gains and losses are recorded on the translation of our U.S. dollar denominated bank debt and working capital held in Canada at each period-end.
Effective January 1, 2020, we have designated our outstanding senior notes as a net investment hedge related to our U.S. operations. As a result of the adoption of net investment hedge accounting, any unrealized foreign exchange gains and losses on the translation of this U.S. dollar denominated debt are included in Other Comprehensive Income/(Loss). At December 31, 2020, US$385.4 million of senior notes outstanding were designated as a net investment hedge. For the year ended December 31, 2020, Other Comprehensive Income/(Loss) included an unrealized gain of $2.2 million on our outstanding U.S. dollar denominated senior notes. For December 31, 2019 and 2018, the unrealized gains and losses recorded on the translation of our senior notes was included in Consolidated Net Income/(Loss). Comparing December 31, 2019 to December 31, 2018, the Canadian dollar strengthened relative to the U.S. dollar, resulting in an unrealized gain of $34.1 million. See Note 2(k) to the Financial Statements for further details.
Capital Investment
($ millions) |
| 2020 |
| 2019 |
| 2018 | |||
Capital spending |
| $ | 291.4 |
| $ | 618.9 |
| $ | 593.9 |
Office capital | | | 4.3 | | | 5.8 | | | 6.5 |
Line fill | | | — | | | 5.1 | | | — |
Sub-total | | | 295.7 | | | 629.8 | | | 600.4 |
Property and land acquisitions |
| $ | 10.1 |
| $ | 24.4 |
| $ | 25.8 |
Property divestments | | | (6.1) | | | (9.6) | | | (6.9) |
Sub-total | | | 4.0 | | | 14.8 | | | 18.9 |
Total(1) |
| $ | 299.7 |
| $ | 644.6 |
| $ | 619.3 |
| (1) | Excludes changes in non-cash investing working capital. See Note 18(b) of the Consolidated Financial Statements for additional information. |
ENERPLUS 2020 FINANCIAL SUMMARY 17
2020
Capital spending in 2020 totaled $291.4 million, lower than our revised guidance of $295 million. In 2020, we spent $234.8 million on our U.S. crude oil properties, $22.9 million on our Canadian crude oil properties and $33.1 million on our Marcellus natural gas assets. The decrease in capital spending in 2020 compared to prior years was mainly due to minimal drilling and completions activity in North Dakota during the second and third quarters of 2020 in response to low crude oil prices as a result of the COVID-19 pandemic. Through our capital program in 2020, we added 16.7 MMBOE of gross proved plus probable reserves, replacing 50% of our 2020 production, including economic factors and technical revisions and before accounting for acquisitions and divestments. Excluding economic factors, we replaced 89% of total 2020 production and added 29.2 MMBOE of gross proved plus probable reserves.
Property and land acquisitions in 2020 totaled $10.1 million, which included minor acquisitions of leases and undeveloped land. We recorded net divestments of $6.1 million in 2020.
Subsequent to the year end, on January 25, 2021, Enerplus entered into the Purchase Agreement to acquire the outstanding equity interests of Bruin for total cash consideration of US$465 million, subject to certain purchase price adjustments. Closing of the Bruin Acquisition is expected to occur in early March 2021.
2019
Capital spending in 2019 totaled $618.9 million, including $531.7 million on our U.S. crude oil properties, $34.8 million on our Canadian crude oil properties and $49.3 million on our Marcellus natural gas assets. Through our capital program in 2019, we added 51.0 MMBOE of gross proved plus probable reserves, replacing 139% of our 2019 production, before accounting for acquisitions and divestments. In 2019, we spent $5.1 million on line fill to meet the requirements of a multi-year transportation contract that began in March 2019.
Property and land acquisitions in 2019 totaled $24.4 million and consisted primarily of undeveloped land in North Dakota. We recorded net divestments of $9.6 million related to the sale of properties in southeastern Saskatchewan with associated production of approximately 350 bbls/day.
2018
Capital spending in 2018 totaled $593.9 million, 30% higher than 2017. In 2018, we spent $474.4 million on our U.S. crude oil properties, $46.3 million on our Canadian crude oil properties, and $66.2 million on our Marcellus natural gas assets. In 2018, we added 65.7 MMBOE of gross proved plus probable reserves, replacing 194% of our 2018 production, before accounting for acquisitions and divestments.
Property and land acquisitions in 2018 totaled $25.8 million and included land acquisitions in Colorado and a property swap in North Dakota. We recorded net divestments of $6.9 million in 2018, primarily related to a property swap in North Dakota.
2021 Guidance
Our capital spending guidance range for 2021 is $335 million to $385 million, and assumes closing of the Bruin Acquisition in early March 2021.
Depletion, Depreciation and Accretion (“DD&A”)
($ millions, except per BOE amounts) |
| 2020 |
| 2019 |
| 2018 | |||
DD&A expense |
| $ | 293.2 |
| $ | 356.8 |
| $ | 304.3 |
Per BOE |
| $ | 8.83 |
| $ | 9.68 |
| $ | 8.94 |
DD&A of PP&E is recognized using the unit of production method based on proved reserves. We recorded DD&A of $293.2 million during 2020, a decrease compared to $356.8 million in 2019, as a result of lower overall production volumes and the impact of PP&E impairments and decreased capital activity in 2020.
Impairments
PP&E
Under U.S. GAAP, the full cost ceiling test is performed on a country-by-country cost centre basis using estimated after-tax future net cash flows discounted at 10 percent from proved reserves (“Standardized Measure”), using constant prices as defined by the SEC. SEC prices are calculated as the unweighted average of the trailing twelve first-day-of-the-month commodity prices. The Standardized Measure is not related to Enerplus’ investment criteria and is not a fair value-based measurement, but rather a prescribed accounting calculation. Impairments are non-cash and are not reversed in future periods under U.S. GAAP.
18 ENERPLUS 2020 FINANCIAL SUMMARY
Trailing twelve month average crude oil and natural gas prices declined throughout 2020. For the twelve months ended December 31, 2020, we recorded a non-cash PP&E impairment of $994.8 million (Canadian cost centre: $134.4 million, U.S. cost centre: $860.4 million). There were no impairments recorded in 2019 and 2018.
Many factors influence the allowed ceiling value versus our net capitalized cost base, making it difficult to predict with reasonable certainty the value of impairment losses from future ceiling tests. For the upcoming year, the primary factors include future first-day-of-the-month commodity prices, reserves revisions, capital expenditure levels and timing, acquisition and divestment activity, as well as production levels, which affect DD&A expense. See "Risk Factors and Risk Management - Risk of Impairment of Oil and Gas Properties, Deferred Tax Assets and Goodwill" in this MD&A.
The following table outlines the twelve-month average trailing benchmark prices and exchange rates used in our ceiling test at December 31, 2020, 2019 and 2018:
| | WTI Crude Oil | | Edm Light Crude | | U.S. Henry Hub | | | Exchange Rate | |||
Year | | US$/bbl | | CDN$/bbl | | Gas US$/Mcf | | | US/CDN | |||
2020 |
| $ | 39.54 |
| $ | 45.56 |
| $ | 2.00 |
| | 1.34 |
2019 |
| $ | 55.85 |
| $ | 66.73 |
| $ | 2.58 |
| | 1.33 |
2018 |
| $ | 65.56 |
| $ | 69.58 |
| $ | 3.10 |
| | 1.28 |
Goodwill
Enerplus recognizes goodwill relating to business acquisitions when the total purchase price exceeds the fair value of the net identifiable assets and liabilities acquired. Goodwill is stated at cost less impairment and is not amortized or deductible for income tax purposes.
Goodwill is assessed for impairment annually or more frequently if events or changes in circumstances indicate that goodwill may be impaired. Enerplus first performs a qualitative assessment to determine whether events or changes in circumstances indicate that goodwill may be impaired. If it is more likely than not that the fair value of the reporting unit is less than its carrying value, quantitative impairment tests are performed. If the carrying value of the reporting unit exceeds its fair value, goodwill is written down the reporting unit’s fair value, with an offsetting non-cash charge to earnings in the Consolidated Statements of Income/(Loss). The loss recognized should not exceed the total amount of goodwill allocated to that reporting unit.
During 2020, we recorded a non-cash goodwill impairment of $202.8 million related to our U.S. reporting unit. The impairment was a result of the deterioration in macroeconomic conditions and low commodity prices due to the COVID-19 pandemic, which resulted in a reduction in fair value of the U.S. reporting unit and a full write down of our U.S. goodwill asset. In 2019, we recorded a non-cash goodwill impairment of $451.1 million representing the full value of the goodwill attributable to our Canadian reporting unit. At December 31, 2020, there was no goodwill remaining on our Condensed Consolidated Balance Sheet.
Asset Retirement Obligation
In connection with our operations, we incur abandonment, reclamation and remediation costs related to assets, such as surface leases, wells, facilities and pipelines. Total asset retirement obligations included on our balance sheet are based on management’s estimate of our net ownership interest, costs to abandon, reclaim and remediate and the timing of the costs to be incurred in future periods.
We have estimated the net present value of our asset retirement obligation to be $130.2 million at December 31, 2020, compared to $138.0 million at December 31, 2019. See Note 8 to the Financial Statements for further information.
We take an active approach to managing our abandonment, reclamation and remediation obligations. During 2020, we spent $17.7 million (2019 – $16.7 million) on our asset retirement obligations and we expect to spend approximately $16.5 million in 2021. The majority of our abandonment, reclamation and remediation costs are expected to be incurred between 2024 and 2046. We do not reserve cash or assets for the purpose of funding our future asset retirement obligations. Any abandonment, reclamation and remediation costs are anticipated to be funded out of adjusted funds flow and our bank credit facility.
Leases
Enerplus recognizes Right-Of-Use (“ROU”) assets and lease liabilities on the Consolidated Balance Sheet for qualifying leases with a term greater than 12 months. We incur lease payments related to office space, drilling rig commitments, vehicles and other equipment. Total lease liabilities included on our balance sheet are based on the present value of lease payments over the lease term. Total ROU assets included on our balance sheet represent our right to use an underlying asset for the lease term. At December 31, 2020, our total lease liability was $36.8 million compared to $53.1 million at December 31, 2019. The decrease was largely due to terminated contracts during 2020. At December 31, 2020, our ROU asset was $32.9 million, which equates to our lease liabilities less lease incentives. See Note 9 to the Consolidated Financial Statements for further details.
ENERPLUS 2020 FINANCIAL SUMMARY 19
Income Taxes
($ millions) |
| 2020 |
| 2019 |
| 2018 | |||
Current tax expense/(recovery) |
| $ | (14.6) |
| $ | (33.4) |
| $ | (27.1) |
Deferred tax expense/(recovery) | | | (246.2) | | | 81.3 | | | 130.3 |
Total tax expense/(recovery) |
| $ | (260.8) |
| $ | 47.9 |
| $ | 103.2 |
In 2020, we recorded a current tax recovery of $14.6 million compared to $33.4 million in 2019 and $27.1 million in 2018. The recovery in 2020 related primarily to the recognition of our final U.S. Alternative Minimum Tax ("AMT") refund. The recovery in 2019 was related to the favorable settlement of a tax dispute in Canada of $13.9 million and the reclassification of the AMT refund of $13.9 million. The recovery in 2018 was primarily related to the AMT refund reclassification of $27.2 million.
In 2020, we recorded a deferred income tax recovery of $246.2 million compared to expenses of $81.3 million in 2019 and $130.3 million in 2018. The recovery in 2020 is primarily due to lower income in 2020 from non-cash PP&E impairments in both our Canadian and U.S. cost centres. The deferred tax expense in 2019 included a $22.7 million expense from the remeasurement of our net Canadian deferred income tax assets for the change in the Alberta corporate income tax rate from 12% to 8%.
Each period, we assess the recoverability of our deferred tax assets to determine whether it is more likely than not all or a portion of our deferred tax assets will not be realized. In making that assessment, we consider the available positive and negative evidence including future taxable income and reversing existing temporary differences. We have evaluated the overall net deferred income tax asset and concluded that it is more likely than not that our non-capital Canadian deferred income tax assets will be realized as there is sufficient future taxable income to realize the benefit. As a result, for 2020 we have recovered the valuation allowance previously recorded against the Canadian deferred income tax assets. Our remaining valuation allowance is primarily related to our capital loss carryforward balance. We do not anticipate future capital gains that will allow us to utilize these losses. No valuation allowance was recorded against our U.S. deferred income tax assets. This assessment is primarily the result of projecting future taxable income using total proved and probable reserves at forecast average prices and costs. There is risk of further valuation allowance in future periods if commodity prices weaken or other evidence indicates more of our deferred income tax assets will not be realized. After recording the valuation allowance recovery, our overall net deferred income tax asset was $607.0 million as at December 31, 2020 (December 31, 2019 - $372.5 million).
Our estimated tax pools at December 31, 2020 are as follows:
Pool Type ($ millions) |
| 2020 | |
Canada | | | |
Canadian oil and gas property expense | | $ | 8 |
Canadian development expense |
| | 117 |
Canadian exploration expense | | | 238 |
Undepreciated capital costs | | | 170 |
Non-capital losses and other credits | | | 294 |
|
| | 827 |
U.S. | | | |
Net operating losses and other credits |
| $ | 1,203 |
Depletable and depreciable assets | | | 775 |
|
| | 1,978 |
Total tax pools and credits |
| $ | 2,805 |
| | | |
Capital losses |
| $ | 1,053 |
LIQUIDITY AND CAPITAL RESOURCES
There are numerous factors that influence how we assess our liquidity and leverage, including commodity price cycles, capital spending levels, acquisition and divestment plans, hedging, share repurchases and dividend levels. We also assess our leverage relative to our most restrictive debt covenant, which is a maximum senior debt to earnings before interest, taxes, depreciation, amortization, impairment and other non-cash charges (“adjusted EBITDA”) ratio of 3.5x for a period of up to six months, after which it drops to 3.0x. At December 31, 2020, our senior debt to adjusted EBITDA ratio was 1.4x and our net debt to adjusted funds flow ratio increased to 1.0x. Although it is not included in our debt covenants, the net debt to adjusted funds flow ratio is often used by investors and analysts to evaluate our liquidity. Refer to the definitions and footnotes below.
Total debt net of cash at December 31, 2020 decreased to $376.0 million, compared to $455.0 million at December 31, 2019. Total debt was comprised of $490.4 million in senior notes less $114.5 million in cash. During the year we made scheduled repayments of US$81.6 million on our 2009 and 2012 senior notes using cash on hand. Our next scheduled senior note repayments of US$59.6 million and US$22.0 million are due in May and June 2021, respectively, with remaining maturities extending to 2026. At December 31, 2020, we were undrawn on our US$600 million bank credit facility.
20 ENERPLUS 2020 FINANCIAL SUMMARY
Our adjusted payout ratio, which is calculated as cash dividends plus capital, office expenditures and line fill divided by adjusted funds flow, was 90% for 2020 compared to 93% in 2019.
Our working capital deficiency, excluding cash and cash equivalents and current derivative financial assets and liabilities, increased to $257.8 million at December 31, 2020 from $210.4 million at December 31, 2019 due to a reduction in accrued revenues as a result of lower production and realized commodity prices and the receipt of the remaining AMT refunds. Our working capital varies primarily due to the timing of the cash realization of our current assets and current liabilities, and the current level of business activity, including our capital spending program, along with commodity price volatility. We expect to finance our working capital deficit and ongoing working capital requirements through cash, adjusted funds flow and our bank credit facility. In addition, we have sufficient liquidity to meet our financial commitments for the near term, as disclosed under “Commitments”.
During 2020, a total of $29.2 million was returned to shareholders through the repurchase of 340,434 common shares under our Normal Course Issuer Bid (“NCIB”) at an average price of $7.44 per share and dividend payments of $26.7 million. In comparison, we returned a total of $206.5 million to shareholders in 2019 through the repurchase of 18,231,401 common shares under the NCIB at an average price of $9.80 per share and dividend payments of $27.7 million. We expect to continue to pay monthly dividends to our shareholders of $0.01 per share in 2021; however, if economic conditions change, we may make adjustments.
On January 25, 2021, Enerplus entered into the Purchase Agreement to acquire all the outstanding equity interests of Bruin for total cash consideration of US$465 million, subject to certain purchase price adjustments. Enerplus will not assume any debt of Bruin as a part of the Bruin Acquisition, which is expected to close in early March 2021.
We intend to fund a portion of the purchase price of the Bruin Acquisition with a new three-year, senior unsecured US$400 million Term Facility. The Term Facility will include financial and other covenants and pricing consistent with Enerplus' existing US$600 million revolving credit facility, which matures October 31, 2023. Funding under the Term Facility is subject to limited conditions, including completion of the Bruin Acquisition and delivery of customary credit facility documentation. Following the announcement of the Bruin Acquisition, Enerplus completed a bought deal equity financing, issuing 33.1 million common shares at a price of $4.00 per share for gross proceeds of $132.3 million ($126.2 million, net of issuance costs). The net proceeds will be used to fund the remainder of the purchase price. We expect to be undrawn on our US$600 million credit facility upon close of the Bruin Acquisition.
At December 31, 2020, we were in compliance with all covenants under our bank credit facility and outstanding senior notes. Our bank credit facility and senior note purchase agreements have been filed as material documents on our SEDAR profile at www.sedar.com.
The following table lists our financial covenants at December 31, 2020:
Covenant Description |
| |
| December 31, 2020 |
Bank Credit Facility: |
| Maximum Ratio | | |
Senior debt to adjusted EBITDA(1) |
| 3.5x |
| 1.4x |
Total debt to adjusted EBITDA(1) |
| 4.0x |
| 1.4x |
Total debt to capitalization |
| 55% |
| 24% |
| | | | |
Senior Notes: |
| Maximum Ratio |
| |
Senior debt to adjusted EBITDA(1)(2) |
| 3.0x – 3.5x |
| 1.4x |
Senior debt to consolidated present value of total proved reserves(3) |
| 60% |
| 29% |
| | | | |
|
| Minimum Ratio |
| |
Adjusted EBITDA to interest (1) |
| 4.0x |
| 13.2x |
Definitions
“Senior Debt” is calculated as the sum of drawn amounts on our bank credit facility, outstanding letters of credit and the principal amount of senior notes.
“Adjusted EBITDA” is calculated as net income less interest, taxes, depletion, depreciation, amortization, and other non-cash gains and losses. Adjusted EBITDA is calculated on a trailing twelve-month basis and is adjusted for material acquisitions and divestments. Adjusted EBITDA for the three months and the trailing twelve months ended December 31, 2020 were $96.4 million and $373.1 million, respectively.
“Total Debt” is calculated as the sum of senior debt plus subordinated debt. Enerplus currently does not have any subordinated debt.
“Capitalization” is calculated as the sum of total debt and shareholder’s equity plus a $1.1 billion adjustment related to our adoption of U.S. GAAP.
Footnotes
| (1) | See “Non-GAAP Measures” in this MD&A for a reconciliation of adjusted EBITDA to net income. |
| (2) | Senior debt to adjusted EBITDA for the senior notes may increase to 3.5x for a period of 6 months, after which the ratio decreases to 3.0x. |
| (3) | Senior debt to consolidated present value of total proved reserves is calculated annually on December 31 based on before tax reserves at forecast prices discounted at 10%. |
ENERPLUS 2020 FINANCIAL SUMMARY 21
Counterparty Credit
CRUDE OIL AND NATURAL GAS SALES COUNTERPARTIES
Our crude oil and natural gas receivables are with customers in the crude oil and gas industry and are subject to normal credit risks. Concentration of credit risk is mitigated by marketing production to numerous purchasers under normal industry sale and payment terms. A credit review process is in place to assess and monitor our counterparties’ creditworthiness on a regular basis. This process involves reviewing and ratifying our corporate credit guidelines, assessing the credit ratings of our counterparties and setting exposure limits. When warranted, we obtain financial assurances such as letters of credit, parental guarantees or third-party insurance to mitigate a portion of our credit risk. This process is utilized for both our crude oil and natural gas sales counterparties as well as our financial derivative counterparties.
FINANCIAL DERIVATIVE COUNTERPARTIES
We are exposed to credit risk in the event of non-performance by our financial counterparties regarding our derivative contracts. We mitigate this risk by entering into transactions with major financial institutions, the majority of which are members of our bank syndicate. We have International Swaps and Derivatives Association (“ISDA”) agreements in place with the majority of our financial counterparties. These agreements provide some credit protection by generally allowing parties to aggregate amounts owing to each other under all outstanding transactions and settle with a single net amount in the case of a credit event. To date we have not experienced any losses due to non-performance by our derivative counterparties. All of our derivative counterparties are considered investment grade. At December 31, 2020, we had $3.6 million in financial derivative assets offset by $19.3 million of financial derivative liabilities resulting in a net liability position of $15.7 million.
Dividends
($ millions, except per share amounts) |
| 2020 |
| 2019 |
| 2018 | |||
Cash dividends(1) |
| $ | 26.7 |
| $ | 27.7 |
| $ | 29.3 |
Per weighted average share (Basic) |
| $ | 0.12 |
| $ | 0.12 |
| $ | 0.12 |
| (1) | Excludes changes in non-cash financing working capital. See Note 18(b) of the Consolidated Financial Statements for additional information. |
We reported total dividends of $26.7 million or $0.12 per share to our shareholders in 2020. During 2019 and 2018, we reported total dividends of $27.7 million or $0.12 per share and $29.3 million or $0.12 per share, respectively.
The dividend is part of our strategy to return capital to our shareholders. We continue to monitor commodity prices and economic conditions and are prepared to make adjustments as necessary.
Shareholders’ Capital
|
| 2020 |
| 2019 |
| 2018 | |||
Share capital ($ millions) |
| $ | 3,097.0 |
| $ | 3,088.1 |
| $ | 3,337.6 |
| | | | | | | | | |
Common shares outstanding (thousands) | | | 222,548 | | | 221,744 | | | 239,411 |
Weighted average shares outstanding – basic (thousands) | | | 222,503 | | | 231,334 | | | 244,076 |
Weighted average shares outstanding – diluted (thousands) | | | 222,503 | | | 231,334 | | | 247,261 |
For the twelve months ended December 31, 2020, a total of 2,044,718 units vested pursuant to our treasury settled LTI plans (2019 – 1,007,234; 2018 – 2,539,498). In total, 1,160,000 common shares were issued from treasury and $13.8 million was transferred from paid-in capital to share capital (2019 – 564,000 and $4.4 million; 2018 – 2,539,498 and $23.4 million). We elected to cash settle the remaining units related to the required tax withholdings (2020 – $7.2 million, 2019 – $5.0 million; 2018 - nil). During 2020, no common shares were issued pursuant to our stock option plan (2019 – nil; 2018 – 668,000 common shares for $9.1 million).
During the twelve months ended December 31, 2020, we repurchased 340,434 common shares under the previous NCIB at an average price of $7.44 per share, for total consideration of $2.5 million (2019 – 18,231,401, $178.8 million; 2018 – 5,925,084, $79.0 million). Of the amount paid, $4.7 million was charged to share capital and $2.2 million was credited to accumulated deficit (2019 – $253.9 million; $75.1 million; 2018 – $82.6 million and $3.6 million). We chose not to renew our NCIB after its expiry on March 25, 2020 in order to preserve capital and maintain our balance sheet strength.
Subsequent to December 31, 2020, on February 3, 2021, Enerplus issued 33,062,500 common shares at a price of $4.00 per common share for gross proceeds of $132.3 million ($126.2 million net of issue costs) pursuant to a bought deal prospectus offering under its base shelf prospectus.
As of February 18, 2021, we had 256,235,100 common shares outstanding. In addition, an aggregate of 5,475,625 common shares may be issued to settle outstanding grants under our share award incentive plan (in the form of PSUs and RSUs), assuming the maximum payout multiplier of 2.0 times for the PSUs. For further details see Note 14 to the Financial Statements.
22 ENERPLUS 2020 FINANCIAL SUMMARY
Commitments
We have the following minimum annual contractual commitments:
| | | | | | | | | | | | | | | | | | | | Total | |
| | | | | Minimum Annual Commitment Each Year | | Committed | ||||||||||||||
($ millions) |
| Total |
| 2021 |
| 2022 |
| 2023 |
| 2024 |
| 2025 |
| after 2025 | |||||||
Senior notes(1) | | $ | 490.4 | | $ | 103.8 | | $ | 128.0 | | $ | 102.6 | | $ | 102.6 | | $ | 26.7 | | $ | 26.7 |
Transportation commitments(2) | | | 290.0 | | | 44.5 | | | 30.4 | | | 29.4 | | | 29.1 | | | 29.1 | | | 127.5 |
Processing commitments | | | 9.5 | | | 1.6 | | | 1.5 | | | 1.5 | | | 1.5 | | | 1.5 | | | 1.9 |
Operating lease obligations | | | 40.0 | | | 14.6 | | | 8.3 | | | 7.0 | | | 6.2 | | | 1.2 | | | 2.7 |
Total commitments(3) |
| $ | 829.9 |
| $ | 164.5 |
| $ | 168.2 |
| $ | 140.5 |
| $ | 139.4 |
| $ | 58.5 |
| $ | 158.8 |
| (1) | Interest payments have not been included. |
| (2) | Crown and surface royalties, production taxes, lease rentals and mineral taxes (hydrocarbon production rights) have not been included as amounts paid depend on future ownership, production, prices and the legislative environment. |
| (3) | US$ commitments have been converted to CDN$ using the December 31, 2020 foreign exchange rate of 1.27. |
In the Marcellus, we have firm transportation agreements in place for approximately 68,000 Mcf/day of natural gas, which expire between 2022 and 2036. This includes an agreement for firm pipeline capacity on the Tennessee Gas Pipeline from our Marcellus producing region to downstream connections for 30,000 Mcf/day of natural gas until mid-2027, reducing to 15,000 Mcf/day for an additional 9 years, with a total estimated transportation commitment of US$76.6 million through 2036. In the Bakken region, we hold firm pipeline capacity to transport a portion of our crude oil production to the U.S. Gulf Coast, which expires in early 2029.
In Canada, we have various firm transportation agreements for approximately 1,800 BOE/day of our crude oil and natural gas liquids production in 2021, decreasing to approximately 820 BOE/day on average from 2022 to 2027. We have firm natural gas liquids fractionation contracts for 1,125 bbls/day through 2027, and firm natural gas transportation contracts for approximately 30,000 Mcf/day as of December 31, 2020.
Our commitments and contingencies are more fully described in Note 16 to the Financial Statements. Our operating lease obligations are detailed in Note 9 to the Financial Statements.
ENERPLUS 2020 FINANCIAL SUMMARY 23
SELECTED ANNUAL CANADIAN AND U.S. FINANCIAL RESULTS
| Year ended | | Year ended | |||||||||||||||
| December 31, 2020 | | December 31, 2019 | |||||||||||||||
($ millions, except per unit amounts) |
| Canada |
| U.S. |
| Total |
| Canada |
| U.S. |
| Total | ||||||
Average Daily Production Volumes(1) | | | | | | | | | | | | | | | | | | |
Crude oil (bbls/day) |
|
| 7,178 |
|
| 38,243 |
|
| 45,421 |
|
| 8,625 |
|
| 41,079 | | | 49,704 |
Natural gas liquids (bbls/day) |
|
| 628 |
|
| 5,005 |
|
| 5,633 |
|
| 895 |
|
| 4,034 | | | 4,929 |
Natural gas (Mcf/day) |
|
| 12,481 |
|
| 225,376 |
|
| 237,857 |
|
| 23,706 |
|
| 254,745 | | | 278,451 |
Total average daily production (BOE/day) |
|
| 9,886 |
|
| 80,811 |
|
| 90,697 |
|
| 13,471 |
|
| 87,571 | | | 101,042 |
| | | | | | | | | | | | | | | | | | |
Pricing(2) | | | | | | | | | | | | | | | | | | |
Crude oil (per bbl) |
| $ | 36.14 |
| $ | 45.89 |
| $ | 44.35 |
| $ | 59.71 |
| $ | 70.92 |
| $ | 68.98 |
Natural gas liquids (per bbl) | | | 21.32 | | | 8.90 | | | 10.29 | | | 28.82 | | | 12.16 | | | 15.19 |
Natural gas (per Mcf) | | | 2.59 | | | 1.83 | | | 1.87 | | | 2.42 | | | 2.91 | | | 2.87 |
| | | | | | | | | | | | | | | | | | |
Capital Expenditures | | | | | | | | | | | | | | | | | | |
Capital spending |
| $ | 23.4 |
| $ | 268.0 |
| $ | 291.4 |
| $ | 37.9 |
| $ | 581.0 |
| $ | 618.9 |
Acquisitions | | | 2.6 | | | 7.5 | | | 10.1 | | | 6.0 | | | 18.4 | | | 24.4 |
Divestments | | | 0.1 | | | (6.2) | | | (6.1) | | | (9.0) | | | (0.6) | | | (9.6) |
| | | | | | | | | | | | | | | | | | |
Netback(3) Before Hedging | | | | | | | | | | | | | | | | | | |
Crude oil and natural gas sales |
| $ | 113.6 |
| $ | 809.9 |
| $ | 923.5 |
| $ | 220.8 |
| $ | 1,352.1 |
| $ | 1,572.9 |
Royalties | | | (17.1) | | | (169.2) | | | (186.3) | | | (43.5) | | | (274.6) | | | (318.1) |
Production taxes | | | (1.1) | | | (48.8) | | | (49.9) | | | (2.6) | | | (80.5) | | | (83.1) |
Operating expenses | | | (55.9) | | | (207.7) | | | (263.6) | | | (72.1) | | | (218.7) | | | (290.8) |
Transportation costs | | | (8.7) | | | (123.7) | | | (132.4) | | | (10.1) | | | (134.8) | | | (144.9) |
Netback before hedging |
| $ | 30.8 |
| $ | 260.5 |
| $ | 291.3 |
| $ | 92.5 |
| $ | 643.5 |
| $ | 736.0 |
| | | | | | | | | | | | | | | | | | |
Other Expenses | | | | | | | | | | | | | | | | | | |
Asset impairment | | $ | 134.4 | | $ | 860.4 | | $ | 994.8 | | $ | — | | $ | — | | $ | — |
Goodwill impairment | | | 202.8 | | | — | | | 202.8 | | | 451.1 | | | — | | | 451.1 |
Commodity derivative instruments loss/(gain) |
| | (108.8) |
| | — |
| | (108.8) |
| | 66.1 |
| | — |
| | 66.1 |
General and administrative expense(4) | | | 2.3 | | | 55.3 | | | 57.6 | | | 29.0 | | | 43.8 | | | 72.8 |
Current income tax expense/(recovery) | | | — | | | (14.5) | | | (14.5) | | | (13.9) | | | (19.5) | | | (33.4) |
| (1) | Company interest volumes. |
| (2) | Before transportation costs, royalties and the effects of commodity derivative instruments. |
| (3) | See “Non-GAAP Measures” section in this MD&A. |
| (4) | Includes share-based compensation. |
THREE YEAR SUMMARY OF KEY MEASURES
($ millions, except per share amounts) | 2020 |
| 2019 |
| 2018 | |||
Crude oil and natural gas sales, net of royalties | $ | 737.2 |
| $ | 1,254.8 |
| $ | 1,292.7 |
| | | | | | | | |
Net income/(loss) | | (923.4) | | | (259.7) | | | 378.3 |
Per share (Basic) | | (4.15) | | | (1.12) | | | 1.55 |
Per share (Diluted) | | (4.15) | | | (1.12) | | | 1.53 |
| | | | | | | | |
Adjusted net income(1) | | 19.8 | | | 243.2 | | | 344.8 |
| | | | | | | | |
Cash flow from operating activities | | 446.4 | | | 694.2 | | | 738.8 |
Adjusted funds flow(1) | | 358.2 | | | 709.0 | | | 753.5 |
| | | | | | | | |
Cash dividends(2) | | 26.7 | | | 27.7 | | | 29.3 |
Per share (Basic)(2) | | 0.12 | | | 0.12 | | | 0.12 |
Total assets | | 1,466.5 | | | 2,565.8 | | | 3,118.3 |
Total debt | | 490.4 | | | 606.5 | | | 696.8 |
| | | | | | | | |
Total debt net of cash(1) | | 376.0 | | | 455.0 | | | 333.5 |
| (1) | See “Non-GAAP Measures” section of this MD&A. |
| (2) | Calculated based on dividends paid or payable. |
24 ENERPLUS 2020 FINANCIAL SUMMARY
2020 versus 2019
Oil and natural gas sales, net of royalties, were $737.2 million in 2020 compared to $1,254.8 million in 2019 due to lower realized commodity prices and decreased production in 2020.
We reported a net loss of $923.4 million in 2020 compared to a net loss of $259.7 million in 2019. The decrease in 2020 was primarily due to a $994.8 million non-cash PP&E impairment and a $202.8 million non-cash U.S. goodwill impairment.
Cash flow from operating activities and adjusted funds flow decreased to $446.4 million and $358.2 million, respectively, in 2020 from $694.2 million and $709.0 million in 2019. The decrease was primarily the result of a $517.6 million decrease in net crude oil and natural gas sales due to lower realized commodity prices and lower production, partially offset by a $115.6 million increase in realized commodity derivative gains.
2019 versus 2018
Oil and natural gas sales, net of royalties, were $1,254.8 million in 2019 compared to $1,292.7 million in 2018, with the impact of higher production more than offset by lower commodity prices.
We reported a net loss of $259.7 million in 2019 compared to net income of $378.3 million in 2018. The decrease in 2019 was primarily due to a $451.1 million non-cash Canadian goodwill impairment, along with losses on commodity derivative instruments.
Cash flow from operations and adjusted funds flow decreased to $694.2 million and $709.0 million, respectively, from $738.8 million and $753.5 million, respectively, in 2018. Crude oil and natural gas sales decreased due to lower realized commodity prices, while operating expenses increased over the same period, in part due to higher liquids volumes. These decreases were offset by realized commodity derivative gains in 2019 compared to losses in 2018.
QUARTERLY FINANCIAL INFORMATION
| | Crude oil and | | | | | | | | | | |
| | Natural Gas Sales, | | Net | | Net Income/(Loss) Per Share | ||||||
($ millions, except per share amounts) |
| Net of Royalties |
| Income/(Loss) |
| Basic |
| Diluted | ||||
2020 | |
| | |
| | |
| | |
|
|
Fourth Quarter |
| $ | 195.1 |
| $ | (204.2) |
| $ | (0.92) |
| $ | (0.92) |
Third Quarter | | | 191.9 | | | (112.8) | | | (0.51) | | | (0.51) |
Second Quarter | | | 122.1 | | | (609.3) | | | (2.74) | | | (2.74) |
First Quarter | | | 228.1 | | | 2.9 | | | 0.01 | | | 0.01 |
Total 2020 |
| $ | 737.2 |
| $ | (923.4) |
| $ | (4.15) |
| $ | (4.15) |
2019 | | | | | | | | | | | | |
Fourth Quarter |
| $ | 327.0 |
| $ | (429.1) |
| $ | (1.93) |
| $ | (1.93) |
Third Quarter | | | 318.9 | | | 65.1 | | | 0.28 | | | 0.28 |
Second Quarter | | | 321.4 | | | 85.1 | | | 0.36 | | | 0.36 |
First Quarter | | | 287.5 | | | 19.2 | | | 0.08 | | | 0.08 |
Total 2019 |
| $ | 1,254.8 |
| $ | (259.7) |
| $ | (1.12) |
| $ | (1.12) |
Crude oil and natural gas sales, net of royalties, decreased in 2020 compared to 2019 due to lower realized commodity prices, and decreased production. We reported a net loss in 2020 due to a non-cash goodwill impairment of $202.8 million on our U.S. reporting unit and a non-cash PP&E impairment of $994.8 million recorded in the twelve months ended December 31, 2020.
During 2019, we reported crude oil and gas sales, net of royalties, of $1,254.8 million. We reported a net loss in 2019 due to a non-cash impairment of $451.1 million on our Canadian goodwill asset recorded in the fourth quarter.
ENERPLUS 2020 FINANCIAL SUMMARY 25
ENVIRONMENT, SOCIAL AND GOVERNANCE (“ESG”)
Enerplus believes that minimizing the environmental impacts of its operations is a foundational tenet of corporate responsibility. Moreover, as the global economy transitions to a lower carbon future, climate related policies and regulations around carbon emissions are becoming increasingly stringent, requiring businesses to adapt to support long-term business resilience. We intend to continue to improve energy efficiencies and proactively manage our environmental impact in compliance with applicable government regulations, including regulations enacted at the provincial, state and federal jurisdictions in which we operate.
Our Board of Directors is responsible for overseeing our ESG initiatives. Specific accountability for our six material focus areas have been mapped to the relevant Board subcommittees, including the Compensation and Human Resources Committee, the Safety and Social Responsibility Committee (the “S&SR Committee”) and the Corporate Governance and Nominating Committee. The six material focus areas are:
| ● | Greenhouse Gas (“GHG”) Emissions |
| ● | Water Management |
| ● | Culture |
| ● | Community Engagement |
| ● | Health and Safety |
| ● | Board Constitution and Culture |
As part of our continued integration of ESG issues into our business strategy and operations, early in 2020 we established targets for reducing GHG emissions intensity and freshwater use. Using 2019 as a baseline, we targeted a 10% reduction of our scope 1 and 2 GHG emissions per BOE in 2020. Based on preliminary estimates, we expect to have reduced our 2020 GHG emissions intensity by more than 20% compared to 2019. Finalized emissions will be available in our annual ESG Report and Data Tables, expected to be published later in 2021.
In 2020, we targeted a reduction in freshwater use per well completion in North Dakota by 15%, compared to 2019. We ended 2020 using, on average, 23% less freshwater per well completion in North Dakota, compared to 2019.
We set a Health & Safety target of reducing our Lost Time Injury Frequency (LTIF) by 25%, on average, from 2020 to 2023, relative to a 2019 baseline. In 2020, we reported an LTIF of 0.08 injuries per 200,000 worker hours, a 67% improvement from 2019. We will continue to update the market as we progress closer to the end of our 2023 target. We are pleased to announce our 2020 LTIF was the best safety performance in our organization’s history.
We expect to integrate the assets acquired through the Bruin Acquisition into our existing ESG strategy throughout 2021. More information will be available with the publication of our 2021 ESG Report later in the year.
We have a Health & Safety Policy (“H&S Policy”) and an Environmental, Social and Governance Policy (“ESG Policy”), which articulate our commitment to health and safety, community engagement, environmental and regulatory compliance, and social and governance practices. Our Board of Directors and President & Chief Executive Officer are ultimately accountable for ensuring compliance with these policies. The S&SR Committee of our Board of Directors is responsible for overseeing our H&S performance. The Board of Directors are responsible for overseeing our ESG performance and strategy. This ensures there are adequate systems in place to support ongoing compliance, and to plan the Company’s activities in a safe, socially responsible and sustainable manner.
The S&SR Committee regularly reviews health, safety, environmental and regulatory updates, and risks. At present, we believe we are, and expect to continue to be, in compliance with all material applicable environmental laws and regulations and we have included appropriate amounts in our capital expenditure budget to continue to meet our ongoing environmental obligations. However, increased capital and operating costs may be incurred if regulations in Canada or the U.S. impose more stringent compliance requirements.
Annually, we publish an ESG Report in accordance with the Sustainability Accounting Standards Boards (SASB) materiality metrics, the Global Reporting Initiative (GRI) Core option, and the International Petroleum Industry Environmental Conservation Association’s (“IPIECA”) “Oil and gas industry guidance on voluntary sustainability reporting” (a joint publication with the American Petroleum Institute and the International Association of Oil & Gas Producers). The report summarizes our environmental, safety, social responsibility and governance performance, and can be found on our website at www.enerplus.com.
CRITICAL ACCOUNTING ESTIMATES
The preparation of financial statements in accordance with U.S. GAAP requires management to make certain judgments and estimates. Due to the timing of when activities occur compared to the reporting of those activities, management must estimate and accrue operating results and capital spending. Changes in these judgments and estimates could have a material impact on our financial results and financial condition.
26 ENERPLUS 2020 FINANCIAL SUMMARY
Crude Oil and Natural Gas Properties and Reserves
Enerplus follows the full cost method of accounting for crude oil and natural gas properties. The process of estimating reserves is critical in determining several accounting estimates including the Company’s depletion, ceiling test, valuation allowance on deferred income tax assets, gain or loss calculations and purchase equations. The estimation of crude oil and natural gas reserves and the related present value of future cash flows involves the use of independent reservoir engineering specialists and numerous estimates and assumptions including forecasted production volumes, forecasted operating, royalty and capital cost assumptions and assumptions around commodity pricing. Estimating reserves requires significant judgments based on available geological, geophysical, engineering and economic data. These estimates may change substantially as data from ongoing development and production activities becomes available, and as economic conditions impacting oil and natural gas prices, operating costs and royalty burdens change. Reserves estimates impact net income through depletion, the determination of asset retirement obligation and the application of impairment tests. Revisions or changes in reserves estimates can have either a positive or a negative impact on net income.
Asset Impairment
Ceiling Test
Under the full cost method of accounting for PP&E, we are subject to quarterly calculations of a ceiling or limitation on the amount of our crude oil and natural gas properties that can be capitalized on our balance sheet by cost centre. If the net capitalized costs of our crude oil and natural gas properties exceed the cost centre ceiling, we are subject to a ceiling test write-down to the extent of such excess. These write-downs reduce net income and impact shareholders’ equity in the period of occurrence and result in lower depletion expense in future periods. The volume and discounted present value of our proved reserves is a major component of the ceiling calculation and represents the component that requires the most subjective judgments. However, the associated prices of crude oil and natural gas that are used to calculate the discounted present value of the reserves do not require judgment. The ceiling calculation dictates that we use the unweighted arithmetic average price of crude oil and natural gas as of the first day of each month for the 12-month period ending at the balance sheet date. If average crude oil and natural gas prices decline, or if we have downward revisions to our estimated proved reserves, it is possible that further write-downs of our crude oil and natural gas properties could occur in the future. Under U.S. GAAP impairments are not reversed in future periods.
Goodwill
Enerplus recognizes goodwill relating to business acquisitions when the total purchase price exceeds the fair value of the net assets acquired. Goodwill is allocated to reporting units and is assessed for impairment at least annually. To assess impairment, the Company first evaluates qualitative factors, such as industry and market considerations and overall financial performance, to determine whether events or changes in circumstances indicate that goodwill may be impaired. If it is more likely than not that the fair value of the reporting unit is less than its carrying value including goodwill, a quantitative impairment test is performed. If the carrying amount of the reporting unit exceeds its related fair value, goodwill is written down to the reporting unit’s fair value. The fair value used in the impairment test is based on estimates of discounted future cash flows which involve assumptions of natural gas and liquids reserves, including commodity prices, future costs and discount rates. At December 31, 2020, there was no goodwill remaining on our Condensed Consolidated Balance Sheet.
Income Taxes
Management makes certain estimates in calculating deferred tax assets and liabilities, as well as income tax expense. These estimates often involve judgment regarding differences in the timing and recognition of revenue and expense for tax and financial reporting purposes as well as the tax basis of our assets and liabilities at the balance sheet date before tax returns are completed. Additionally, we must assess the likelihood we will be able to recover or utilize our deferred tax assets. We must record a valuation allowance against a deferred tax asset where all or a portion of that asset is not expected to be realized. In evaluating whether a valuation allowance should be applied, we consider evidence such as future taxable income, among other factors, both positive and negative. This determination involves numerous judgments and assumptions and includes estimating factors such as commodity prices, production and other operating conditions. If any of those factors, assumptions or judgments change, the deferred tax asset could change, and in particular decrease in a period where we determine it is more likely than not that the asset will not be realized. Alternatively, a valuation allowance may be reversed where it is determined it is more likely than not that the asset will be realized.
Asset Retirement Obligation
Management calculates the asset retirement obligation based on estimated costs to abandon, reclaim and remediate its ownership interest in all wells, facilities and pipelines and the estimated timing of the costs to be incurred in future periods. The fair value estimate is capitalized to PP&E as part of the cost of the related asset and depleted over its useful life. There are uncertainties related to asset retirement obligations and the impact on the financial statements could be material as the eventual timing and costs for the obligations could differ from our estimates. Factors that could cause our estimates to differ include any changes to laws or regulations, reserves estimates, costs and technology.
ENERPLUS 2020 FINANCIAL SUMMARY 27
Business Combinations
Management makes various assumptions in determining the fair value of any acquired company’s assets and liabilities in a business combination. The most significant assumptions and judgments made relate to the estimation of the fair value of the oil and gas properties. To determine the fair value of these properties, we, and independent evaluators, estimate crude oil and natural gas reserves and future prices of crude oil and natural gas.
Derivative Financial Instruments
We utilize derivative financial instruments to manage our exposure to market risks relating to commodity prices, foreign currency exchange rates and interest rates. Fair values of derivative contracts fluctuate depending on the underlying estimate of future commodity prices, foreign currency exchange rates, interest rates and counterparty credit risk.
RECENT U.S. GAAP ACCOUNTING AND RELATED PRONOUNCEMENTS
Refer to Note 2(p) in our Financial Statements for Standards and Interpretations that were issued but not yet effective at December 31, 2020.
RISK FACTORS AND RISK MANAGEMENT
Risks Relating to the Impact of the COVID-19 Pandemic and Continued Weakness and Volatility in Commodity Prices
The global outbreak of the COVID-19 pandemic and the ongoing uncertainty as to the extent and duration of this pandemic, as well as governmental authorities response thereto, has resulted in, and continues to result in, among other things: increased volatility in financial markets, including credit markets and foreign currency and interest exchange rates; disruptions to global supply chains; labour shortages; reductions in trade volumes; temporary operational restrictions, quarantine orders, business closures and travel bans; an overall slowdown in the global economy; political and economic instability; and civil unrest. In particular, the COVID-19 pandemic has resulted in, and continues to result in, a reduction in the demand for crude oil and natural gas.
In addition, recent market events and conditions, including excess global crude oil and natural gas supply and decreased global demand due to the COVID-19 pandemic, have caused significant weakness and volatility in commodity prices. While the commodity prices began to stabilize as global economies began to re-open, the recent resurgence of COVID-19 cases in certain geographic areas, and the possibility that a resurgence may occur in other areas, has resulted in the re-imposition of certain restrictions noted above by local authorities. This further increases the risk and uncertainty as to the extent and duration of the COVID-19 pandemic and the resultant impact on commodity demand and prices. The overall result of these recent events and conditions could lead to a prolonged period of depressed prices for crude oil and natural gas which may result in further curtailments, voluntary or otherwise. We are continuing to evaluate the impact of the COVID-19 pandemic and the continued commodity environment instability on our business, financial condition and results of operations; however, the full extent of such impact continues to be unknown at this time and will depend on future developments (which are highly uncertain and cannot be predicted with any degree of confidence) and may be adverse and could result, among other things, in PP&E or deferred tax asset impairment, or exceeding our debt covenants, among others. See disclosure under "Impairment – PP&E", “Income Taxes” and "Liquidity and Capital Resources" in this MD&A.
We are also subject to risks relating to the health and safety of our personnel, including the potential for a slowdown or temporary suspension of our operations in locations impacted by an outbreak or further regulatory changes. Such a suspension in operations could also be mandated by governmental authorities in response to the COVID-19 pandemic. This would negatively impact our production volumes, which could adversely impact our business, financial condition and results of operations.
Depending on the extent and duration of the COVID-19 pandemic, it may also have the effect of heightening many of the other risks described in the Annual Information Form and the Annual MD&A.
28 ENERPLUS 2020 FINANCIAL SUMMARY
Commodity Price Risk
Our operating results and financial condition are dependent on the prices we receive for our crude oil, natural gas liquids, and natural gas production. These prices have fluctuated widely in response to a variety of factors including global and domestic supply and demand of crude oil, natural gas and natural gas liquids, actions taken by OPEC or non-OPEC members to set, maintain or alter production levels to help in achieving a balanced market, geopolitical uncertainty, sustained pandemics, including the COVID-19 pandemic, or epidemics that disrupt economies, whether local or global, impacting supply, demand and prices for crude oil, natural gas liquids and natural gas, economic conditions including currency fluctuations, global gross domestic product growth, weather conditions, the level of consumer demand, the ability to export oil and liquefied natural gas and natural gas liquids from North America and the supply and price of imported oil and liquefied natural gas, the production and storage levels of North American crude oil, natural gas and natural gas liquids, political stability, transportation facilities, availability of processing, fractionation and refining facilities, the effect of world-wide energy conservation and greenhouse gas reduction measures, the price and availability of alternative fuels and existing and proposed changes to government regulations and policy decisions, including moratoriums with respect thereto.
A future decline in crude oil or natural gas prices may have a material adverse effect on our operations and cash flows, financial condition, borrowing ability, levels of reserves and resources and the level of expenditures for the development of our crude oil and natural gas reserves or resources. Certain oil or natural gas wells may become or remain uneconomic to produce if commodity prices are low, thereby impacting our production volumes, or our desire to market our production in unsatisfactory market conditions. Furthermore, we may be subject to the decisions of third party operators or to legislative decisions by regional governments who, independently and using different economic parameters, may decide to curtail or shut-in jointly owned production or to mandate industry-wide production curtailments.
We may use financial derivative instruments and other hedging mechanisms to help limit the adverse effects of crude oil, natural gas liquids, and natural gas price volatility. However, we do not hedge all of our production and expect there will always be a portion that remains unhedged. Furthermore, we may use financial derivative instruments that offer only limited protection within selected price ranges. To the extent price exposure is hedged, we may forego the benefits that would otherwise be experienced if commodity prices increase. At February 18, 2021, we have hedged approximately 21,500 bbls/day and 17,000 bbls/day, respectively, of our expected crude oil production for 2021 and 2022, 60,000 Mcf/day of natural gas production for March 2021 and 100,000 Mcf/day of natural gas production for April 1 to October 31, 2021, at price levels disclosed in the “Price Risk Management” section above. Refer to the “Price Risk Management” section for further details on our price risk management program.
Risks Relating to Climate Change
Enerplus is subject to climate change related risks which are generally grouped into two categories: physical risks and transition risks. Physical risks include the impact that a change in climate could have on our operations, including limited water availability, severe weather or fire. These events may increase the cost of water, energy, insurance or capital projects, impacting our profitability. The physical risks of climate change may also result in operational delays, depending on the nature of the event. Enerplus does not believe that its current or near-term operations expose it to any particular physical risks which differ from those facing a typical North American onshore oil and gas producer, and currently cannot predict or quantify the potential financial impact of any such risks.
Transition risk is broader and relates to the consequences of a global transition to reduced carbon, including the risk of regulatory and policy change and reputational concerns. The growing push for decarbonization increases the risk of potentially burdensome regulatory and/or policy changes that could increase Enerplus’ risk in obtaining access to service providers, including but not limited to debt holders, insurers, and the investment community. In addition, Enerplus could also have stranded assets, i.e. be unable to obtain value for, or from, its reserves. More specific concerns of the fossil fuels, industry relate to GHG emissions, as well as water and land use, could also result in more stringent legislation, including requirements to significantly reduce GHG emissions, water consumption or setback requirements for facilities and wells, all of which could be costly to implement. For example, on January 27, 2021, President Biden signed an executive order calling for substantial action on climate change, including, among other things, the increased use of zero-emissions vehicles by the U.S. federal government, the elimination of subsidies provided to the fossil fuel industry, and increased emphasis on climate-related risks across agencies and economic sectors. Failure to comply with such regulations and laws could also result in significant penalties being imposed. In addition, a potential increase in capital expenditures, operating expenses, abandonment and reclamation obligations and distribution costs or the loss of operating licenses, any of which may not be recoverable in the marketplace, could result in operations or growth projects becoming less profitable, uneconomic, or result in the Enerplus’ inability to continue development of assets. Additionally, there is a risk that financial institutions will be required to adopt policies that have the effect of reducing the funding provided to the fossil fuel sector; both the Bank of Canada and the Federal Reserve of the United States have joined the Network for Greening the Financial System, a consortium of financial regulators focused on addressing climate-related risks in the financial sector.
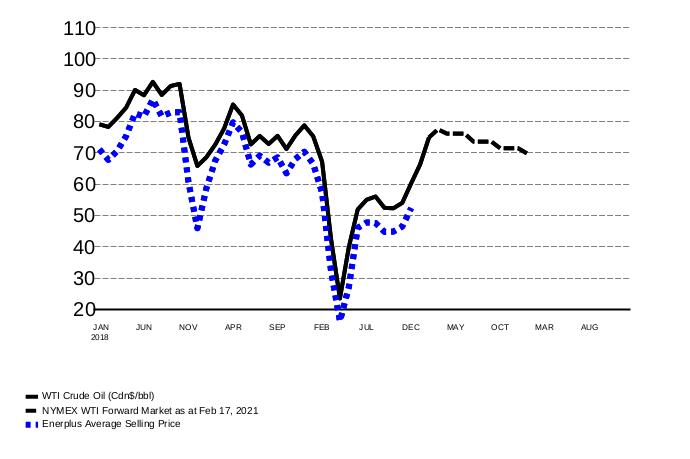
ENERPLUS 2020 FINANCIAL SUMMARY 29
There is also a reputational risk associated with climate change, which considers the public perception of Enerplus’ role in the transition to a low carbon economy. We seek to mitigate this risk through a strong ESG program with six material focus areas which are overseen by the Company’s Board of Directors and applicable Board subcommittees. Our strategy is to be a “best in basin” operator – in the eyes of our shareholders, employees, contractors, regulators, communities and the general public. Despite these efforts, activities undertaken directly by Enerplus or its employees, or by others in industry, could adversely affect Enerplus’ reputation. If the reputation of the Corporation, or the oil and gas industry in general, is diminished, it could result in: the loss of employees or revenue; delays in regulatory approvals; increased operating, capital, financing and regulatory costs; reduced shareholder confidence and negative stock price movement.
Regulatory Risk and Greenhouse Gas Emissions
Government royalties, environmental laws and regulatory requirements can have a significant financial and operational impact on us. As an oil and gas producer, we operate under federal, provincial, state, tribal and municipal legislation and regulation that govern such matters as royalties, land tenure, prices, production rates, various environmental protection controls, well and facility design and operation, income taxes and the exportation of crude oil, natural gas and other products. We may be required to apply for regulatory approvals in the ordinary course of business. To the extent that we fail to comply with applicable government regulations or regulatory approvals, we may be subject to compliance and enforcement actions that are either remedial or punitive to deter future noncompliance. Such actions include fines or fees, notices of noncompliance, warnings, orders, curtailment, administrative sanctions and prosecution.
Government regulations may be changed from time to time in response to economic, political or socioeconomic conditions, including the election of new state, provincial or federal leaders. Additionally, our entry into new jurisdictions or adoption of new technology may attract additional regulatory oversight which could result in higher costs or require changes to proposed operations. U.S. federal and state and Canadian federal and provincial continue to scrutinize emissions, as well as the usage and disposal of chemicals and water used in fracturing procedures in the oil and gas industry; certain states have called for bans on oil and gas drilling using hydraulic fracturing and the new U.S. administration has taken actions towards fulfilling its initiative of curtailing hydraulic fracturing of federal lands. Additionally, various levels of U.S. and Canadian governments are considering or have implemented legislation to reduce emissions of greenhouse gases, including volatile organic compounds (“VOC”) and methane gas emissions.
The exercise of discretion by governmental authorities under existing regulations, the implementation of new regulations or the modification of existing regulations could negatively impact the development of crude oil and natural gas properties and assets, reduce demand for crude oil and natural gas or impose increased costs on oil and gas companies including taxes, fees or other penalties.
Although we have no control over these regulatory risks, we continuously monitor changes in these areas by participating in industry organizations, conferences, exchanging information with third party experts and employing qualified individuals to assess the impact of such changes on our financial and operating results. Accordingly, while we continue to prepare to meet the potential requirements at each of the provincial, state and federal levels, the actual cost impact and its materiality to our business remains uncertain.
Anticipated Benefits of Acquisitions or Divestments
From time to time, we may acquire additional crude oil and natural gas properties and related assets. Achieving the anticipated benefits of such acquisitions will depend in part on successfully consolidating functions and integrating operations, procedures, and personnel in a timely and efficient manner, as well as our ability to realize the anticipated growth opportunities from combining and integrating the acquired assets and properties into our existing business. These activities will require the dedication of substantial management effort, time, capital, and other resources, which may divert management's focus, capital and other resources from other strategic opportunities and operational matters during this process. The risk factors specified in this MD&A relating to the crude oil and natural gas business and our operations, reserves and resources apply equally to future properties or assets that we may acquire. We conduct due diligence in connection with acquisitions, but there is no assurance that we will identify all the potential risks and liabilities related to such properties.
When acquiring assets, we are subject to inherent risks associated with predicting the future performance of those assets. We may make certain estimates and assumptions respecting the characteristics of the assets we acquire, that may not be realized over time. As such, assets acquired may not possess the value we attribute to them, which could adversely impact our future cash flows. To the extent that we make acquisitions with higher growth potential, the higher risks often associated may result in increased chances that actual results may vary from our initial estimates. An initial assessment of an acquisition may be based on a report by engineers or firms of engineers that have different evaluation methods, approaches, and assumptions than those of our engineers, and these initial assessments may differ significantly from our subsequent assessments. There is also no assurance that the acquired assets will be viewed favourably by our investors and could result in a negative effect to the price of our common shares.
30 ENERPLUS 2020 FINANCIAL SUMMARY
Certain acquisitions, and in particular acquisitions of higher risk/higher growth assets and the development of those acquired assets, may require capital expenditures and we may not receive cash flow from operating activities from these acquisitions for several years, or in amounts less than anticipated. Accordingly, the timing and amount of capital expenditures may adversely affect our cash flow.
The closing of the Bruin Acquisition is subject to satisfaction of certain closing conditions. There is no certainty, nor can we provide any assurance, that these conditions will be satisfied or, if satisfied, when they will be satisfied. If the Bruin Acquisition is not completed as contemplated, Enerplus could suffer adverse consequences, including the loss of investor confidence. If the Bruin Acquisition is completed, there is a risk that some or all of the expected benefits of the Bruin Acquisition may fail to materialize, may cost more to achieve or may not occur within the time periods we anticipate.
We may also seek to divest of properties and assets from time to time. These divestments may consist of non-core properties or assets, or may consist of assets or properties that are being monetized to fund alternative projects or development or debt repayments. There can be no assurance that we will be successful, that we will realize the amount of desired proceeds, or that such divestments will be viewed positively by the financial markets. Divestments may negatively affect our results of operations or the trading price of our common shares. In addition, although divestments typically transfer future obligations to the buyer, we may not be exempt from certain future obligations, including abandonment, reclamation, and/or remediation if applicable, which may have an adverse effect on our operations and financial condition.
Access to Capital Markets
Our access to capital has allowed us to fund a portion of our acquisitions and development capital program through issuance of equity and debt in past years. Continued access to capital is dependent on our ability to optimize our existing assets and to demonstrate the advantages of the acquisition or development program that we are financing at the time, as well as investors’ view of the oil and gas industry overall. We may not be able to access the capital markets in the future on terms favorable to us, or at all. Our continued access to capital markets is dependent on corporate performance and investor perception of future performance (both corporately and for the oil and gas sector in general).
We are required to assess our foreign private issuer (“FPI”) status under U.S. securities laws on an annual basis. If we lose our FPI status, we may have restricted access to capital markets for a period of time until the required approvals are in place from the SEC.
Access to Transportation and Processing Capacity
Market access for crude oil, natural gas liquids and natural gas production in the U.S. and Canada is dependent on our ability, and the ability of our buyers as applicable, to obtain transportation capacity on third party pipelines and rail as well as access to processing facilities. As production increases in the regions where we operate, it is possible production may exceed the existing capacity of the gathering, pipeline, processing or rail infrastructure. While third party pipelines, processors and independent rail operators generally expand capacity to meet market needs, there can be differences in timing between the growth of production and the growth of capacity. There are occasionally operational reasons for curtailing transportation and processing capacity. Accordingly, there can be periods where transportation and processing capacity is insufficient to accommodate all the production from a given region, causing added expense and/or volume curtailments for all shippers. Our assets are concentrated in specific regions where government or other third parties could limit or ban the shipping of commodities by truck, pipeline or rail. Special interest groups and/or social instability could also prevent access to leased land or continue their opposition to infrastructure development, at either the regulatory or judicial level, including the ongoing matters with respect to DAPL (which are before the District Court for the District of Columbia), resulting in operational delays, or even the cancellation of construction of the required infrastructure, or the shutdown of already operating infrastructure projects, further impeding our ability to operate, produce and market our products. Additionally, the transportation of crude oil by rail has been under closer scrutiny by government regulatory agencies in Canada and the U.S. over the past few years. As a result, transporting crude oil by rail may carry a higher cost versus traditional pipeline infrastructure or other means of transporting production.
We monitor this risk for both the short and longer term through dialogue and review with the third party pipelines and other market participants. Where available and commercially appropriate, given the production profile and commodity, we attempt to mitigate transportation and processing risk by contracting for firm pipeline or processing capacity or using other means of transportation, including trucking or selling to third parties that have access to pipeline or rail capacity.
Risk of Curtailed or Shut-in Production
Should we be required to curtail or shut-in production as a result of low commodity prices, environmental regulation, government regulation or third party operational practices, it could result in a reduction to cash flow and production levels and may result in additional operating and capital costs for the well to achieve prior production levels. In addition, curtailments or shut-ins may cause damage to the reservoir and may prevent us from achieving production and operating levels that were in place prior to the curtailment or shutting-in of the reservoir. Combined with the ongoing volatility in commodity prices, any shortage in pipeline infrastructure in producing regions where we operate may result in discounted prices and an ongoing risk of price-related production curtailments.
ENERPLUS 2020 FINANCIAL SUMMARY 31
The recent changes in control of the U.S. Congress and the election of President Biden may result in legislative and regulatory changes that could have an adverse effect on Enerplus. In particular, President Biden has indicated that his administration will seek to curtail oil and gas development on federal lands, possibly through temporary or permanent bans on new leasing, delays or bans on the issuance of drilling permits, and his administration may pursue other regulatory initiatives, executive actions and legislation in support of his regulatory agenda. Implementation by the U.S. government of new legislative or regulatory policies could impose additional costs, decrease U.S. demand for our products, or otherwise negatively impact Enerplus, which may have a material adverse effect on our business, financial condition and operations.
Risk of Increased Capital or Operating Costs
Higher capital or operating costs associated with our operations will directly impact our capital efficiencies and cash flow. Capital costs of completions, specifically the costs of proppant, pumper services, and operating costs such as electricity, chemicals, supplies, energy services and labour costs, are a few of the costs that are susceptible to material fluctuation. Although we have a portion of our current capital and operating costs protected with existing agreements, changing regulatory conditions, such as potential new or revised regulations in the U.S. requiring certain raw materials, such as steel, for use on certain projects to be sourced from the U.S., or that goods and/or services be procured from specific vendors or classes of vendors on certain projects, may result in higher than expected supply costs for the company.
Production Replacement Risk
Oil and natural gas reserves naturally deplete as they are produced over time. Our ability to replace production depends on our success in acquiring new land, reserves and/or resources and developing existing reserves and resources. Acquisitions of oil and gas assets will depend on our assessment of value at the time of acquisition and ability to secure the acquisitions generally through a competitive bid process.
Acquisitions and our development capital program are subject to investment guidelines, due diligence and review. Major acquisitions and our annual capital development budget are approved by the Board of Directors and where appropriate, independent reserve engineer evaluations are obtained.
Oil and Gas Reserves and Resources Risk
The value of our company is based on, among other things, the underlying value of our oil and gas reserves and resources. Geological and operational risks along with product price forecasts can affect the quantity and quality of reserves and resources and the cost of ultimately recovering those reserves and resources. Lower crude oil, natural gas liquids, and natural gas prices along with lower development capital spending associated with certain projects may increase the risk of write-downs for our oil and gas property investments. Changes in reporting methodology as well as regulatory practices can result in reserves or resources write-downs.
Each year, independent reserves engineers evaluate the majority of our proved and probable reserves as well as evaluate or audit the resources attributable to a significant portion of our undeveloped land. All reserves information, including our U.S. reserves, has been prepared in accordance with NI 51-101 standards. For U.S. GAAP accounting purposes, our proved reserves are estimated to be technically the same as our proved reserves prepared under NI 51-101 and have been adjusted for the effects of SEC constant prices. Independent reserves evaluations have been conducted on approximately 98% of the total proved plus probable net present value (discounted at 10% and using NI 51-101 standards) of our reserves at December 31, 2020. McDaniel & Associates Consultants Ltd. (“McDaniel”) evaluated 86% of our Canadian reserves and reviewed the internal evaluation completed by Enerplus on the remaining portion. McDaniel also evaluated 100% of the reserves associated with our U.S. tight oil assets. Netherland, Sewell & Associates, Inc. (“NSAI”) evaluated 100% of our U.S. Marcellus shale gas assets.
The evaluation of best estimate development pending contingent resources associated with our North Dakota assets was conducted by Enerplus’ qualified reserves evaluators and audited by McDaniel. NSAI evaluated our Marcellus shale gas best estimate development pending contingent resources.
The Reserves Committee of the Board of Directors and the Board of Directors has reviewed and approved the reserves and resources reports of the independent evaluators.
Risk of Impairment of Oil and Gas Properties and Deferred Tax Assets
Under U.S. GAAP, the net capitalized cost of crude oil and natural gas properties, net of deferred income taxes, is limited to the present value of after-tax future net revenue from proved reserves, discounted at 10%, and based on the unweighted average of the closing prices for the applicable commodity on the first day of the twelve months preceding the issuer’s reporting date. The amount by which the net capitalized costs exceed the discounted value will be charged to net income.
32 ENERPLUS 2020 FINANCIAL SUMMARY
Under U.S. GAAP, the net deferred tax asset is limited to the estimate of future taxable income resulting from existing properties. We estimate future taxable income based on before-tax future net revenue from proved plus probable reserves, undiscounted, using forecast prices, and adjusted for other significant items affecting taxable income. The amount by which the gross deferred tax assets exceed the estimate of future taxable income will be charged to net income, however these amounts can be reversed in future periods if future taxable income increases.
We recorded an impairment of $994.8 million (Canadian cost centre: $134.4 million, U.S. cost centre $860.4 million) on our crude oil and natural gas assets in 2020. There were no crude oil and natural gas assets impairments recorded in 2019 and 2018. In 2020, we reversed our valuation allowance of $13.9 million recorded in 2019 against a portion of our Canadian deferred income tax asset, as projected future taxable income in Canada was sufficient to recognize these assets. No valuation allowance was recorded against our U.S. deferred income tax asset. There is a risk of impairment on our oil and gas properties, deferred tax asset and goodwill if commodity prices weaken, costs increase, or if there is a downward revision to reserves. Please refer to the “Impairments” and “Income Taxes” sections of the MD&A and Notes 5 and 13 of the Financial Statements for further details.
Changes in Income Tax and Other Laws
Income tax, other laws or government incentive programs relating to the oil and gas industry may change in a manner that adversely affects us or our security holders. Canadian, U.S. and foreign tax authorities may interpret applicable tax laws, tax treaties or administrative positions differently than we do or may disagree with how we calculate our income for tax purposes in a manner which is detrimental to us and our security holders.
We monitor developments with respect to pending legal changes and work with the industry and professional groups to ensure that our concerns with any changes are made known to various government agencies. We obtain confirmation from independent legal counsel and advisors with respect to the interpretation and reporting of material transactions.
Counterparty and Joint Venture Credit Exposure
We are subject to the risk that the counterparties to our risk management contracts, marketing arrangements and operating agreements and other suppliers of products and services may default on their obligations under such agreements as a result of liquidity requirements or insolvency. Low crude oil and natural gas prices increase the risk of bad debts related to our joint venture and industry partners. A failure of our counterparties to perform their financial or operational obligations may adversely affect our operations and financial position. In addition to the usual delays in payment by purchasers of crude oil and natural gas, payments may also be delayed by, among other things: (i) capital or liquidity constraints experienced by our counterparties, including restrictions imposed by lenders; (ii) accounting delays or adjustments for prior periods; (iii) delays in the sale or delivery of products or delays in the connection of wells to a gathering system; (iv) weather related delays, such as freeze-offs, flooding and premature thawing; (v) blow-outs or other accidents; or (vi) recovery by the operator of expenses incurred in the operation of the properties or the establishment by the operator of reserves for these expenses. Any of these delays could reduce the amount of our cash flow and the payment of cash dividends to our shareholders in a given period and expose us to additional third-party credit risks.
A credit review process is in place to assess and monitor our counterparties’ credit worthiness on a regular basis. This includes reviewing and ratifying our corporate credit guidelines, assessing the credit ratings of our counterparties and setting exposure limits. When warranted we attempt to obtain financial assurances such as letters of credit, parental guarantees, or third-party insurance to mitigate our counterparty risk. In addition, we monitor our receivables against a watch list of publicly traded companies that have high debt-to-cash flow ratios or fully drawn bank facilities and, where possible, take our production in kind rather than relying on third party operators. In certain instances, we may be able to aggregate all amounts owing to each other and settle with a single net amount.
See the “Liquidity and Capital Resources” section for further information.
Debt covenants may be exceeded with no ability to negotiate covenant relief
Declines or continued volatility in crude oil and natural gas prices may result in a significant reduction in earnings or cash flow, which could lead us to increase amounts drawn under our bank credit facility in order to carry out our operations and fulfill our obligations. Significant reductions to cash flow, significant increases in drawn amounts under the bank credit facility, or significant reductions to proved reserves may result in us breaching our debt covenants under the credit facility, senior notes and Term Facility. If a breach occurs, there is a risk that we may not be able to negotiate covenant relief with one or more of our lenders under the credit facility, senior notes or Term Facility. Failure to comply with debt covenants, or negotiate relief, may result in our indebtedness under the credit facility, senior notes or Term Facility becoming immediately due and payable, which may have a material adverse effect on our operations and financial condition.
ENERPLUS 2020 FINANCIAL SUMMARY 33
The credit facility, senior notes, Term Facility and any replacement credit facility may not provide sufficient liquidity
Although we believe that our existing credit facility, senior notes and the recently added Term Facility are sufficient, there can be no assurance that the current amount will continue to be available, or will be adequate for our financial obligations, or that additional funds can be obtained as required or on terms which are economically advantageous to Enerplus. The amounts available under the credit facility, senior notes and Term Facility may not be sufficient for future operations, or we may not be able to renew our bank credit facility or Term Facility or obtain additional financing on attractive economic terms, if at all. The Term Facility matures in early 2024 (three years post-closing date of the Bruin Acquisition). The bank credit facility is generally available on a four-year term, extendable each year with a bullet payment required at the end of four years if the facility is not renewed. We renewed our bank credit facility in 2019 and it currently expires on October 31, 2023. There can be no assurance that such a renewal will be available on favourable terms or that all the current lenders under the facility will participate or renew at their current commitment levels. If this occurs, we may need to obtain alternate financing. Any failure of a member of the lending syndicate to fund its obligations under the bank credit facility or to renew its commitment in respect of such bank credit facility, or failure by Enerplus to obtain replacement financing or financing on favourable terms, may have a material adverse effect on our business and operations. In addition, dividends to shareholders may be eliminated, as repayment of debt under the credit facility, senior notes and Term Facility has priority over dividend payments to our shareholders.
Access to Field Services
Our ability to drill, complete and tie-in wells in a timely manner may be impacted by our access to service providers and supplies. Activity levels in each area may limit our access to these resources, restricting our ability to execute our capital plans in a timely manner. In addition, field service costs are influenced by market conditions and therefore can become cost prohibitive.
Although we have entered into service contracts for a portion of field services that will secure some of our drilling and fracturing services through 2021, access to field services and supplies in other areas of our business will continue to be subject to market availability.
Cyber Security Risks
We are subject to a variety of information technology and system risks as part of our normal course operations, including potential breakdown, invasion, virus, cyber-attack, cyber-fraud, security breach and destruction or interruption of our information technology systems by third parties or insiders. Additionally, use of personal devices can create further avenues for potential cyber-related incidents, as we have little or no control over the safety of these devices. Information technology and cyber risks have increased during the COVID-19 pandemic, as increased malicious activities are creating more threats for cyberattacks including COVID-19 phishing emails, malware-embedded mobile apps that purport to track infection rates, and targeting of vulnerabilities in remote access platforms as many companies continue to operate with work from home arrangements. Although we have security measures and controls in place that are designed to mitigate these risks, a breach of our security and/or a loss of information could occur and result in business interruptions, service disruptions, financial loss, theft of intellectual property and confidential information, litigation, enhanced regulatory attention and penalties, as well as reputational damage. Furthermore, the adoption of emerging technologies, such as cloud computing, artificial intelligence and robotics, call for continued focus and investment to manage risks effectively. Not managing this risk effectively may have an adverse effect and, therefore, may increase the risk of financial or reputational loss. The significance of any such event is difficult to quantify, but may be material in certain circumstances and could have a material effect on our business, financial condition and results of operations.
Ability to Divest Properties
Regulatory changes in Alberta and Saskatchewan have increased the minimum corporate liability rating required of purchasers of crude oil and natural gas properties. As a result, the potential number of parties able to acquire our non-core assets has been reduced, we may not be able to obtain full value for such assets, or transactions may involve greater risk and complexity. The Supreme Court of Canada’s decision in the Redwater Energy Corporation case may also impact our ability to transfer licenses, approvals or permits, and may result in increased costs and delays or require changes to our abandonment of projects and transactions. We also understand that further regulatory changes are being planned in Alberta and British Columbia, which may result in additional factors being considered when evaluating such transactions.
Title Defects or Litigation
Unforeseen title defects or litigation may result in a loss of entitlement to production, reserves and resources.
Although we conduct title reviews prior to the purchase of assets these reviews do not guarantee that an unforeseen defect in the chain of title will not arise. We maintain good working relationships with our industry partners; however, disputes may arise from time to time with respect to ownership of rights of certain properties or resources.
34 ENERPLUS 2020 FINANCIAL SUMMARY
Foreign Currency Exposure
We have exposure to fluctuations in foreign currency as all of our senior notes, our credit facility and our Term Facility are denominated in U.S. dollars. Our U.S. operations are directly exposed to fluctuations in the U.S. dollar when translated to our Canadian dollar denominated financial statements. We also have indirect exposure to fluctuations in foreign currency as our crude oil sales and a portion of our natural gas sales are based on U.S. dollar indices. Our oil and gas revenues are positively impacted when the Canadian dollar weakens relative to the U.S. dollar. However, our U.S. capital spending, transportation and operating costs, interest expense and U.S. dollar denominated debt are negatively impacted with a weak Canadian dollar.
Currently, we do not have any foreign exchange contracts in place to hedge our foreign exchange exposure. However, we continue to monitor fluctuations in foreign exchange and the impact on our operations.
Interest Rate Exposure
Movements in interest rates and credit markets may affect our borrowing costs and value of investments such as our shares as well as other equity investments.
At December 31, 2020, we were undrawn on our US$600 million bank credit facility and our debt consisted of fixed interest rate senior notes.
On January 25, 2021, we entered into the Purchase Agreement to acquire all the equity interests of Bruin for total cash consideration of US$465 million, subject to certain adjustments. On the same date, we entered into a new three-year, senior unsecured US$400 million Term Facility, to be fully drawn down on the closing date of the Bruin Acquisition to pay for a portion of the purchase price. The Term Facility includes financial and other covenants and pricing consistent with our existing US$600 million revolving credit facility, which matures October 31, 2023. Funding under the Term Facility is subject to limited conditions, including completion of the acquisition and delivery of customary credit facility documentation.
ADJUSTED FUNDS FLOW SENSITIVITY
The sensitivities below reflect all of Enerplus’ commodity contracts listed in Note 15 to the Financial Statements and are based on 2021 guidance production, assuming the successful closing of the Bruin Acquisition in early March, and price levels of: WTI - US$55.00/bbl, NYMEX - US$3.00/Mcf and a USD/CDN exchange rate of 1.27. To the extent crude oil and natural gas prices change significantly from current levels, the sensitivities will no longer be relevant.
| | Estimated Effect on 2021 | |
Sensitivity Table | | Adjusted Funds Flow per Share(1) | |
Increase of US$5.00 per barrel in the price of WTI crude oil |
| $ | 0.26 |
Decrease of US$5.00 per barrel in the price of WTI crude oil | | $ | (0.32) |
Increase of US$0.50 per Mcf in the price of NYMEX natural gas |
| $ | 0.12 |
Decrease of US$0.50 per Mcf in the price of NYMEX natural gas | | $ | (0.12) |
Change of 1,000 BOE/day in production |
| $ | 0.03 |
Change of $0.01 in the US/CDN exchange rate |
| $ | 0.02 |
Change of 1% in interest rate(2) |
| $ | 0.02 |
| (1) | Calculated using 256.2 million shares outstanding at February 18, 2021. |
| (2) | The interest rate sensitivity reflects the Term Facility, which will be fully drawn upon closing of the Bruin Acquisition. Enerplus is currently undrawn on its floating interest rate bank credit facility and all outstanding senior notes are based on fixed interest rates. |
2021 GUIDANCE(1)
Summary of 2021 Annual Expectations |
| Target |
Capital spending |
| $335 - $385 million |
Average annual production | | 103,500 – 108,500 BOE/day |
Average annual crude oil and natural gas liquids production | | 63,000 – 67,000 bbls/day |
| | |
2021 Differential/Basis Outlook(2) | | Target |
Average U.S. Bakken crude oil differential (compared to WTI crude oil) | | US$(3.25)/bbl |
Average Marcellus natural gas differential (compared to NYMEX natural gas) | | US$(0.55)/Mcf |
| (1) | Guidance is based on the continued operation of DAPL, the completion of the Bruin Acquisition at the beginning of March 2021 and a ten-month contribution from the Bruin assets. |
| (2) | Excludes transportation costs |
NON-GAAP MEASURES
The Company utilizes the following terms for measurement within the MD&A that do not have a standardized meaning or definition as prescribed by U.S. GAAP and therefore may not be comparable with the calculation of similar measures by other entities:
ENERPLUS 2020 FINANCIAL SUMMARY 35
“Netback” is used by Enerplus and is useful to investors and securities analysts in evaluating operating performance of our crude oil and natural gas assets. Netback is calculated as crude oil and natural gas sales less royalties, production taxes, operating expenses and transportation costs.
Calculation of Netback | Year ended December 31, | ||||||||
($ millions) |
| 2020 |
| 2019 |
| 2018 | |||
Crude oil and natural gas sales, net of royalties |
| $ | 737.2 |
| $ | 1,254.8 |
| $ | 1,292.7 |
Less: | | | | | | | | | |
Production taxes | | | (49.9) | | | (83.1) | | | (87.3) |
Operating expenses | | | (263.6) | | | (290.8) | | | (238.3) |
Transportation costs | | | (132.4) | | | (144.9) | | | (123.5) |
Netback before hedging |
| $ | 291.3 |
| $ | 736.0 |
| $ | 843.6 |
Cash gains/(losses) on derivative instruments | | | 131.0 | | | 15.4 | | | (35.8) |
Netback after hedging |
| $ | 422.3 |
| $ | 751.4 |
| $ | 807.8 |
“Adjusted funds flow” is used by Enerplus and is useful to investors and securities analysts in analyzing operating and financial performance, leverage and liquidity. Adjusted funds flow is calculated as cash flow from operating activities before asset retirement obligation expenditures and changes in non-cash operating working capital.
Reconciliation of Cash Flow from Operating Activities to Adjusted Funds Flow | Year ended December 31, | ||||||||
($ millions) |
| 2020 |
| 2019 |
| 2018 | |||
Cash flow from operating activities |
| $ | 446.4 |
| $ | 694.2 |
| $ | 738.8 |
Asset retirement obligation expenditures | | | 17.7 | | | 16.7 | | | 11.3 |
Changes in non-cash operating working capital | | | (105.9) | | | (1.9) | | | 3.4 |
Adjusted funds flow |
| $ | 358.2 |
| $ | 709.0 |
| $ | 753.5 |
“Free cash flow” is used by Enerplus and is useful to investors and securities analysts in analyzing operating and financial performance, leverage and liquidity. Free cash flow is calculated as adjusted funds flow minus capital spending.
Calculation of Free Cash Flow | Year ended December 31, | ||||||||
($ millions) |
| 2020 |
| 2019 |
| 2018 | |||
Adjusted funds flow | | $ | 358.2 | | $ | 709.0 | | $ | 753.5 |
Capital spending | | | (291.4) | | | (618.9) | | | (593.9) |
Free cash flow | | $ | 66.8 | | $ | 90.1 | | $ | 159.6 |
“Adjusted net income” is used by Enerplus and is useful to investors and securities analysts in evaluating the financial performance of the company by understanding the impact of certain non-cash items and other items that the Company considers appropriate to adjust given the irregular nature and relevance to comparable companies. Adjusted net income is calculated as net income adjusted for unrealized derivative instrument gain/loss, asset impairments, unrealized foreign exchange gain/loss, the tax effect of these items, goodwill impairment, the impact of statutory changes to the Company’s corporate tax rate and the valuation allowance on our deferred income tax assets. Adjusted net income in 2020 included adjustments related to asset impairments and the valuation allowance on deferred taxes. No asset impairments or valuation allowance on deferred taxes were recorded in 2019 or 2018.
Calculation of Adjusted Net Income | Year ended December 31, | ||||||||
($ millions) |
| 2020 |
| 2019 |
| 2018 | |||
Net income/(loss) |
| $ | (923.4) |
| $ | (259.7) |
| $ | 378.3 |
Unrealized derivative instrument (gain)/loss | | | 23.6 | | | 81.7 | | | (124.3) |
Asset impairment | | | 994.8 | | | — | | | — |
Unrealized foreign exchange (gain)/loss | | | 1.9 | | | (34.1) | | | 58.6 |
Tax effect on above items | | | (266.0) | | | (18.5) | | | 32.2 |
Goodwill impairment | | | 202.8 | | | 451.1 | | | — |
Income tax rate adjustment on deferred taxes | | | — | | | 22.7 | | | — |
Valuation allowance on deferred taxes | | | (13.9) | | | — | | | — |
Adjusted net income |
| $ | 19.8 |
| $ | 243.2 |
| $ | 344.8 |
“Total debt net of cash” is used by Enerplus and is useful to investors and securities analysts in analyzing leverage and liquidity. Total debt net of cash is calculated as senior notes plus any outstanding bank credit facility balance, minus cash and cash equivalents.
36 ENERPLUS 2020 FINANCIAL SUMMARY
“Net debt to adjusted funds flow ratio” is used by Enerplus and is useful to investors and securities analysts in analyzing leverage and liquidity. The net debt to adjusted funds flow ratio is calculated as total debt net of cash divided by a trailing twelve months of adjusted funds flow. This measure is not equivalent to debt to earnings before interest, taxes, depletion, depreciation, amortization, impairment and other non-cash charges (“adjusted EBITDA”) and is not a debt covenant.
“Adjusted payout ratio” is used by Enerplus and is useful to investors and securities analysts in analyzing operating performance, leverage and liquidity. We calculate our adjusted payout ratio as cash dividends plus capital spending, office expenditures and line fill divided by adjusted funds flow.
Calculation of Adjusted Payout Ratio | Year ended December 31, | ||||||||
($ millions) |
| 2020 |
| 2019 |
| 2018 | |||
Cash dividends |
| $ | 26.7 |
| $ | 27.7 |
| $ | 29.3 |
Capital, office expenditures and line fill | | | 295.7 | | | 629.8 | | | 600.4 |
Sub-total |
| $ | 322.4 |
| $ | 657.5 |
| $ | 629.7 |
Adjusted funds flow |
| $ | 358.2 |
| $ | 709.0 |
| $ | 753.5 |
Adjusted payout ratio (%) | | | 90% | | | 93% | | | 84% |
“Adjusted EBITDA” is used by Enerplus and its lenders to determine compliance with financial covenants under its bank credit facility and outstanding senior notes.
Reconciliation of Net Income to Adjusted EBITDA(1) |
| | |
($ millions) | | December 31, 2020 | |
Net income/(loss) | | $ | (923.4) |
Add: | |
| |
Asset impairment | | | 994.8 |
Goodwill impairment | | | 202.8 |
Interest | |
| 28.4 |
Current and deferred tax expense/(recovery) | |
| (260.8) |
DD&A | |
| 293.2 |
Other non-cash charges(2) | |
| 38.1 |
Adjusted EBITDA | | $ | 373.1 |
| (1) | Adjusted EBITDA is calculated based on the trailing four quarters. |
| (2) | Includes the change in fair value of commodity derivatives, equity swaps, non-cash SBC expense, and unrealized foreign exchange gains/losses. |
In addition, the Company uses certain financial measures within the “Overview” and “Liquidity and Capital Resources” sections of this MD&A that do not have a standardized meaning or definition as prescribed by U.S. GAAP and, therefore, may not be comparable with the calculation of similar measures by other entities. Such measures include “senior debt to adjusted EBITDA”, “senior net debt to adjusted EBITDA”, “total debt to adjusted EBITDA”, “total debt to capitalization”, “senior debt to consolidated present value of total proved reserves” and “adjusted EBITDA to interest” and are used to determine the Company’s compliance with financial covenants under its bank credit facility and outstanding senior notes. Calculation of such terms is described under the “Liquidity and Capital Resources” section of this MD&A.
INTERNAL CONTROLS AND PROCEDURES
Internal Controls over Financial Reporting
We maintain internal controls over financial reporting that is designed to provide reasonable assurance regarding the reliability of financial reporting and the preparation of financial statements for external purposes in accordance with U.S. GAAP. Management is responsible for establishing and maintaining adequate internal controls over financial reporting, as defined in Rule 13a – 15(f) and 15d – 15(f) under the U.S. Securities Exchange Act of 1934, as amended (the Exchange Act) and under National Instrument 52-109 Certification of Disclosure in Issuers’ Annual and Interim Filings (NI 51-109). Management, including the Chief Executive Officer (“CEO”) and Chief Financial Officer (“CFO”) of Enerplus Corporation, have conducted an evaluation of our internal control over financial reporting based on criteria established in Internal Control – Integrated Framework (2013) issued by the Committee of Sponsoring Organizations of the Treadway Commission (COSO 2013). Based on management’s assessment as of December 31, 2020, management has concluded that our internal controls over financial reporting is effective.
The effectiveness of internal controls over financial reporting as of December 31, 2020 was audited by KPMG LLP, an independent registered public accounting firm, as stated in their Report of Independent Registered Public Accounting Firm, which is included with the annual financial statements.
ENERPLUS 2020 FINANCIAL SUMMARY 37
Due to its inherent limitations, internal controls over financial reporting is not intended to provide absolute assurance that a misstatement of our financial statements would be prevented or detected. Further, the evaluation of the effectiveness of internal
control over financial reporting was made as of a specific date, and continued effectiveness in future periods is subject to the risks that controls may become inadequate.
Changes in Internal Controls over Financial Reporting
There were no changes in our internal control over financial reporting in 2020 that have materially affected or are reasonably likely to materially affect our internal controls over financial reporting.
Disclosure Controls and Procedures
We maintain disclosure controls and procedures designed to provide reasonable assurance that information required to be disclosed in our interim and annual filings is reviewed, recognized and disclosed accurately and in the appropriate time period. Management, including the CEO and CFO, carried out an evaluation, as of December 31, 2020, of the effectiveness of the design and operation of disclosure controls and procedures of Enerplus, as defined in Rule 13a – 15(e) and 15d – 15(e) under the Exchange Act and NI 52-109. Based on that evaluation, the CEO and CFO have concluded that the design and operation of disclosure controls and procedures at Enerplus were effective to ensure that information required to be disclosed in the reports we file or submit under the Exchange Act or Canadian securities legislation is recorded, processed, summarized and reported within the time periods specified in the rules and forms therein.
It should be noted that while the CEO and CFO believe that our disclosure controls and procedures provide a reasonable level of assurance that they are effective, they do not expect that these disclosure controls and procedures will prevent all errors and fraud. A control system, no matter how well conceived or operated, can provide only reasonable, not absolute, assurance that the objectives of the control system are met.
ADDITIONAL INFORMATION
Additional information relating to Enerplus, including our current Annual Information Form, is available under our profile on the SEDAR website at www.sedar.com, on the EDGAR website at www.sec.gov and at www.enerplus.com.
38 ENERPLUS 2020 FINANCIAL SUMMARY
FORWARD-LOOKING INFORMATION AND STATEMENTS
This MD&A contains certain forward-looking information and statements ("forward-looking information") within the meaning of applicable securities laws. The use of any of the words "expect", "anticipate", "continue", "estimate", “guidance”, "ongoing", "may", "will", "project", "plans", “budget”, "strategy" and similar expressions are intended to identify forward-looking information. In particular, but without limiting the foregoing, this MD&A contains forward-looking information pertaining to the following: the continued uncertainty regarding timing and impact of COVID-19, expected 2021 average production volumes, timing thereof and the anticipated production mix; the proportion of our anticipated oil and gas production that is hedged and the effectiveness of such hedges in protecting our adjusted funds flow; anticipated production volumes subject to curtailment; the results from our drilling program and the timing of related production and ultimate well recoveries; oil and natural gas prices and differentials and our commodity risk management program in 2021 and in the future; expectations regarding our realized oil and natural gas prices; future royalty rates on our production and future production taxes; anticipated cash G&A, share-based compensation and financing expenses; operating and transportation costs; capital spending levels in 2021 and impact thereof on our production levels and land holdings; potential future asset impairments, as well as relevant factors that may affect such impairments; the amount of our future abandonment and reclamation costs and asset retirement obligations; future environmental expenses; our future royalty and production and U.S. cash taxes; deferred income taxes, our tax pools and the time at which we may pay Canadian cash taxes; future debt and working capital levels and net debt to adjusted funds flow ratio and adjusted payout ratio, financial capacity, liquidity and capital resources to fund capital spending and working capital requirements, including the entering into of Term Facility; expectations regarding our ability to comply with debt covenants under our bank credit facility and outstanding senior notes; our future acquisitions and dispositions including the Bruin Acquisition and the completion, timing and anticipated benefits thereof; the impact of the Bruin Acquisition on Enerplus’ operations, reserves, inventory and opportunities, financial condition and overall strategy; expecting timing thereof and use of proceeds therefrom; the amount of future cash dividends that we may pay to our shareholders, and our ESG initiatives, including GHG emissions and water reduction targets for 2021.
The forward-looking information contained in this MD&A reflects several material factors and expectations and assumptions of Enerplus including, without limitation: that we will conduct our operations and achieve results of operations as anticipated, including the continued operation of DAPL; that our development plans will achieve the expected results; that lack of adequate infrastructure will not result in curtailment of production and/or reduced realized prices beyond our current expectations; current commodity price, differentials and cost assumptions; the general continuance of current or, where applicable, assumed industry conditions; the continuation of assumed tax, royalty and regulatory regimes; the accuracy of the estimates of our reserve and contingent resource volumes; the continued availability of adequate debt and/or equity financing and adjusted funds flow to fund our capital, operating and working capital requirements, and dividend payments as needed; the continued availability and sufficiency of our adjusted funds flow and availability under our bank credit facility to fund our working capital deficiency; the satisfaction of the conditions to close the Bruin Acquisition and the Term Facility; the availability of third party services; the extent of our liabilities; and the availability of technology and process to achieve environmental targets. In addition, our 2021 guidance contained in this MD&A is based on the following: the completion of the Bruin Acquisition in the timeframe currently contemplated; and a WTI price of US$55.00/bbl, a NYMEX price of US$3.00/Mcf, a Bakken crude oil price differential of US$3.25/bbl below WTI and a USD/CDN exchange rate of 1.27. Enerplus believes the material factors, expectations and assumptions reflected in the forward-looking information are reasonable but no assurance can be given that these factors, expectations and assumptions will prove to be correct.
The forward-looking information included in this MD&A is not a guarantee of future performance and should not be unduly relied upon. Such information involves known and unknown risks, uncertainties and other factors that may cause actual results or events to differ materially from those anticipated in such forward-looking information including, without limitation: continued low commodity prices environment or further volatility in commodity prices; changes in realized prices of Enerplus’ products; changes in the demand for or supply of our products; unanticipated operating results, results from our capital spending activities or production declines; curtailment of our production due to low realized prices or lack of adequate infrastructure; changes in tax or environmental laws, royalty rates or other regulatory matters; changes in our capital plans or by third party operators of our properties; increased debt levels or debt service requirements; inability to comply with debt covenants under our bank credit facility and outstanding senior notes; inaccurate estimation of our oil and gas reserve and contingent resource volumes; limited, unfavourable or a lack of access to capital markets; increased costs; a lack of adequate insurance coverage; the impact of competitors, reliance on industry partners and third party service providers; failure to complete the Bruin Acquisition in accordance with its terms or at all and failure to realize the anticipated benefits of the Bruin Acquisition; and certain other risks detailed from time to time in our public disclosure documents (including, without limitation, those risks identified in our AIF and Form 40-F as at December 31, 2020).
The purpose of our adjusted funds flow sensitivity is to assist readers in understanding our expected and targeted financial results, and this information may not be appropriate for other purposes. The forward-looking information contained in this MD&A speaks only as of the date of this MD&A, and we do not assume any obligation to publicly update or revise such forward-looking information to reflect new events or circumstances, except as may be required pursuant to applicable laws.
ENERPLUS 2020 FINANCIAL SUMMARY 39