Please wait

       2023 FINANCIAL SUMMARY

.3


Three months ended

Twelve months ended

SELECTED FINANCIAL RESULTS

December 31, 

December 31, 


2023


2022

2023


2022

Financial (US$, thousands, except ratios)

Net Income/(Loss)

$

116,702

$

330,708

$

456,076

$

914,302

Adjusted Net Income(1)

115,253

181,069

477,570

707,061

Cash Flow from Operating Activities

297,946

316,584

938,190

1,173,382

Adjusted Funds Flow(1)


240,526

315,379

961,243

1,230,289

Dividends to Shareholders - Declared

12,242

12,223

48,603

41,597

Net Debt(1)

119,298

221,516

119,298

221,516

Capital Spending

91,507

85,647

532,450

432,004

Property and Land Acquisitions

1,681

2,853

7,342

22,515

Property and Land Divestments

1,267

211,987

2,969

231,373

Net Debt to Adjusted Funds Flow Ratio(1)

0.1x

0.2x

0.1x

0.2x

Financial per Weighted Average Shares Outstanding


Net Income/(Loss) - Basic

$

0.57

$

1.49

$

2.16

$

3.91

Net Income/(Loss) - Diluted

0.55

1.43

2.09

3.77

Weighted Average Number of Shares Outstanding (000’s) - Basic

204,624

222,404

211,353

233,946

Weighted Average Number of Shares Outstanding (000’s) - Diluted

211,176

231,149

217,896

242,673

Selected Financial Results per BOE(2)(3)

Crude Oil & Natural Gas Sales(4)


$

45.88

$

55.78

$

45.56

$

64.27

Commodity Derivative Instruments

0.33

(4.83)

1.56

(9.48)

Operating Expenses

(11.67)

(9.68)

(10.67)

(9.99)

Transportation Costs

(3.84)

(4.04)

(3.99)

(4.22)

Production Taxes

(3.81)

(4.03)

(3.70)

(4.56)

General and Administrative Expenses

(1.41)

(1.15)

(1.33)

(1.17)

Cash Share-Based Compensation Recovery/(Expense)

0.15

(0.21)

0.01

(0.16)

Interest, Foreign Exchange and Other Expenses

(0.36)

0.56

(0.36)

(0.32)

Current Income Tax Recovery/(Expense)

(0.02)

(0.34)

(0.75)

(0.77)

Adjusted Funds Flow(1)


$

25.25


$

32.06

$

26.33


$

33.60

Three months ended

Twelve months ended

SELECTED OPERATING RESULTS

December 31, 

December 31, 


2023


2022

2023


2022

Average Daily Production(3)

Crude Oil (bbls/day)


54,011

54,601

50,779

52,017

Natural Gas Liquids (bbls/day)


13,086

10,755

11,429

9,681

Natural Gas (Mcf/day)


218,675

249,351

226,840

231,770

Total (BOE/day)


103,543

106,915

100,015

100,326

% Crude Oil and Natural Gas Liquids


65%


61%


62%


61%

Average Selling Price(3)(4)

Crude Oil (per bbl)


$

77.21

$

83.06

$

77.42

$

93.63

Natural Gas Liquids (per bbl)

16.86

21.88

17.93

30.70

Natural Gas (per Mcf)

1.65

4.76

1.85

5.51

Net Wells Drilled

15.8

9.9

65.9

51.7

(1)This is a non-GAAP financial measure. Refer to “Non-GAAP and Other Financial Measures” section in the following MD&A.
(2)Non-cash amounts have been excluded.
(3)Represents net production volumes. See “Basis of Presentation” section in the following MD&A.
(4)Before transportation costs and commodity derivative instruments.

ENERPLUS 2023 FINANCIAL SUMMARY             1


Three months ended

Twelve months ended

December 31, 

December 31, 

Average Benchmark Pricing


2023

2022

2023

2022

WTI Crude Oil ($/bbl)


$

78.32

$

82.65

$

77.62

$

94.23

Brent (ICE) Crude Oil ($/bbl)

82.67

88.60

82.22

98.89

Propane – Conway ($/bbl)

27.04

34.21

28.93

46.03

NYMEX Natural Gas – Last Day ($/Mcf)

2.88

6.26

2.74

6.64

CDN/US Average Exchange Rate

0.73

0.74

0.74

0.77

Share Trading Summary


U.S.(1) – ERF


CDN(2) – ERF

For the twelve months ended December 31, 2023

(US$)

(CDN$)

High


$

18.17

$

24.74

Low


$

12.84

$

17.65

Close


$

15.34

$

20.32

(1)NYSE and other U.S. trading data combined.
(2)TSX and other Canadian trading data combined.

2023 Dividends Declared per Share


US$

First Quarter Total

$

0.055

Second Quarter Total

$

0.055

Third Quarter Total

$

0.060

Fourth Quarter Total

$

0.060

Total Year to Date

$

0.230

2             ENERPLUS 2023 FINANCIAL SUMMARY


       2023 HIGHLIGHTS

FINANCIAL & OPERATIONAL HIGHLIGHTS

On February 21, 2024, Enerplus entered into an arrangement agreement with Chord Energy Corporation (“Chord”), pursuant to which, upon completion of the transaction, Enerplus shareholders will receive 0.10125 shares of Chord common stock and $1.84 in cash for each share of Enerplus (90% stock and 10% cash consideration). The transaction is subject to various approvals and conditions to close and is expected to be completed mid-2024.
Total production for 2023 was 100,015 BOE/day, consistent with 2022. Crude oil and natural gas liquids production in 2023 was 62,208 bbls/day, an increase of 1% compared to 2022. Crude oil and natural gas liquids production increased by 9% year-over-year when adjusted for the Canadian asset divestment in 2022. Our 2023 production exceeded the top end of our total and liquids guidance ranges of 98,000 - 99,000 BOE/day and 60,500 - 61,500 bbls/day, respectively.
We reported full year 2023 net income of $456.1 million, or $2.16 per share (basic), compared to net income of $914.3 million, or $3.91 per share (basic), in 2022. Excluding certain non-cash or non-recurring items, 2023 adjusted net income1 was $477.6 million, or $2.26 per share (basic), compared to $707.1 million, or $3.02 per share (basic), in 2022. The lower net income in 2023 was due to the gain on the sale of the Canadian assets recorded during 2022, as well as lower production and commodity prices, which also decreased adjusted net income, relative to the prior year period.
Our 2023 realized Bakken crude oil price differential was $0.45/bbl below WTI, compared to $1.09/bbl above WTI in 2022. Bakken differentials weakened in 2023 due to local production growth resulting in less spare pipeline capacity, along with the deterioration of refinery demand due to a decline in global refinery margins. Our 2023 Marcellus natural gas price differential was $0.92/Mcf below NYMEX, compared to $0.72/Mcf below NYMEX in 2022.
Operating expenses in 2023 were $10.67/BOE, compared to $9.99/BOE in 2022. The increase in per BOE operating expenses was primarily due to inflation adjusted contract pricing and higher gas facility and fluid handling charges as a result of increased production in North Dakota. Cash G&A expenses in 2023 were $1.33/BOE, compared to $1.17/BOE in 2022 due to inflationary pressures on labour and services.
Current tax expense was $27.2 million in 2023.
Capital spending totaled $532.5 million in 2023, approximately the midpoint of our guidance range of $520 - $540 million.
During 2023, a total of $306.9 million was returned to shareholders, representing 72% of free cash flow1, through share repurchases and dividends. In 2023, we repurchased 16.4 million shares at an average price of $15.71 per share for a total cost of $258.3 million and paid $48.6 million in dividends.
The Board of Directors has approved an 8% increase to our quarterly dividend to $0.065 per share, effective with the March 2024 payment.
We ended the year with net debt1 of $119.3 million, with $63.4 million drawn on our sustainability linked lending bank credit facilities of $900 million and $365 million. At December 31, 2023, our net debt to adjusted funds flow1 ratio was 0.1x compared to 0.2x at December 31, 2022.

1 This financial measure is a non-GAAP financial measure. See “Non-GAAP and Other Financial Measures” section in the following MD&A.

ENERPLUS 2023 FINANCIAL SUMMARY             3


YEAR END 2023 RESERVES SUMMARY

Canadian NI 51-101 Standards1 - before deduction of royalties (“gross”), forecast prices, U.S. dollars:

Gross proved plus probable (“2P”) reserves were 585.1 MMBOE, a decrease of 3% year-over-year, with reserves additions largely offsetting production, technical revisions, economic factors and dispositions.
Gross 2P reserves in North Dakota were 422.9 MMBOE, approximately flat to year-end 2022.
Enerplus added 33.0 MMBOE of gross 2P reserves from North Dakota in 2023 (including technical revisions and economic factors), replacing 100% of 2023 North Dakota production.
In North Dakota, gross 2P finding and development (“F&D”) costs were $20.67 per BOE, including future development costs (“FDC”).

U.S. Standards2 - after deduction of royalties (“net”), constant prices, U.S. dollars:

Net total proved reserves were 281.8 MMBOE, a decrease of 13% year-over-year, primarily due to Marcellus volume revisions as a result of the approximately 60% lower constant natural gas price used for the year-end 2023 reserves (per SEC rules).
Net proved reserves in North Dakota decreased 2% compared to year-end 2022.
Enerplus added 24.4 MMBOE of net proved reserves from North Dakota in 2023 (including technical revisions and economic factors), replacing 92% of 2023 North Dakota production.
In North Dakota, net proved F&D costs were $26.08 per BOE, including FDC.

1 See “Basis of Presentation” section in the following MD&A for definition of Canadian NI 51-101 Standards.

2 See “Presentation of Reserves Information” section in the following MD&A for definition of U.S. Standards.

4             ENERPLUS 2023 FINANCIAL SUMMARY


       MD&A

.3

Management’s Discussion and Analysis (“MD&A”)

The following discussion and analysis of financial results is dated February 21, 2024 and is to be read in conjunction with the audited consolidated financial statements (the “Financial Statements”) of Enerplus Corporation (“Enerplus” or the “Company”), at December 31, 2023 and 2022 and for the years ended December 31, 2023, 2022 and 2021.

The following MD&A contains forward-looking information and statements. We refer you to the end of the MD&A under “Forward-Looking Information and Statements” for further information. The following MD&A also contains financial measures that do not have a standardized meaning as prescribed by accounting principles generally accepted in the United States of America (“U.S. GAAP”). See “Non-GAAP and Other Financial Measures” at the end of this MD&A for further information.

BASIS OF PRESENTATION

The Financial Statements and notes thereto have been prepared in accordance with U.S. GAAP. Unless otherwise stated, all dollar amounts are presented in U.S. dollars. Certain prior period amounts have been restated to conform with current period presentation.

The functional currency of the parent company was changed prospectively from Canadian dollars to U.S. dollars effective January 1, 2023 as a result of a gradual change in the primary economic environment in which the entity operates, culminating in the sale of Enerplus’ remaining Canadian operating assets at the end of 2022. All assets and liabilities held by the parent company were translated at the exchange rate at December 31, 2022 to determine opening balances in U.S. dollars. Amounts that are part of Shareholders’ Equity of the parent company were translated at historical exchange rates. Monetary assets and liabilities denominated in Canadian dollars will be revalued at current exchange rates at each reporting period. Upon settlement and/or realization of Canadian dollar denominated assets and liabilities, there may be realized foreign exchange gains and losses depending on the change in the foreign exchange rate when the transaction was originally recorded and the final settlement date.

Where applicable, natural gas has been converted to barrels of oil equivalent (“BOE”) based on 6 Mcf:1 BOE and crude oil and natural gas liquids (“NGL”) have been converted to thousand cubic feet of gas equivalent (“Mcfe”) based on 0.167 bbl:1 Mcfe. The BOE and Mcfe rates are based on an energy equivalent conversion method primarily applicable at the burner tip and do not represent a value equivalent at the wellhead. Given that the value ratio based on the current price of natural gas as compared to crude oil is significantly different from the energy equivalency of 6:1 or 0.167:1, as applicable, utilizing a conversion on this basis may be misleading as an indication of value. Use of BOE and Mcfe in isolation may be misleading.

In accordance with U.S. GAAP, crude oil and natural gas sales are presented net of royalties in the Financial Statements. In addition, unless otherwise noted, all production volumes are presented on a “net” basis (after deduction of royalty obligations plus the Company’s royalty interests) consistent with U.S. oil and gas reporting standards. All reserves information in this MD&A has been prepared in accordance with Canadian National Instrument 51-101 – Standards of Disclosure for Oil and Gas Activities (“Canadian NI 51-101 Standards”) and also in accordance with oil and gas disclosure framework of the United States Securities and Exchange Commission (the “SEC”). See “Presentation of Reserves Information” section in this MD&A.

All references to “liquids” in this MD&A include light and medium oil, heavy oil and tight oil (all together referred to as “crude oil”) and natural gas liquids on a combined basis. All references to “natural gas” in this MD&A include conventional natural gas and shale gas.

ENERPLUS 2023 FINANCIAL SUMMARY             5


2024 RECENT DEVELOPMENTS

On February 21, 2024, Enerplus entered into an arrangement agreement (the "Arrangement Agreement") with Chord Energy Corporation ("Chord"), pursuant to which, upon completion of the transaction (the "Arrangement"), Enerplus shareholders will receive 0.10125 shares of Chord common stock and $1.84 in cash for each share of Enerplus, representing 90% stock and 10% cash consideration. It is anticipated that the quarterly dividend payments made by Enerplus until closing of the transaction will be equalized to those made by Chord, after giving effect to the exchange ratio, through an additional Enerplus dividend declared shortly prior to the closing.

The Arrangement will be completed as a plan of arrangement under the Business Corporations Act (Alberta) and is subject to the approval of at least two-thirds of the votes cast by holders of Enerplus shares at a meeting to be called to consider the Arrangement. The issuance of shares of Chord stock is subject to the approval of the majority of votes cast by holders of shares of Chord in connection with the transaction, pursuant to the rules of the Nasdaq Global Select Market ("NASDAQ").

The Arrangement has been unanimously approved by the Board of Directors and the board of directors of Chord. The Arrangement is subject to customary closing conditions in the United States and Canada, as well as the approvals by Chord and Enerplus’ shareholders referenced above, the approval of the Court of King's Bench of Alberta, the listing of shares of Chord's stock on NASDAQ and regulatory clearances or approvals. Subject to the foregoing approvals, the Arrangement is expected to close by mid-year 2024. See “Forward-Looking Information and Statements” section in this MD&A.

2023 FOURTH QUARTER OVERVIEW

Production in the fourth quarter of 2023 averaged 103,543 BOE/day, exceeding the top end of our production guidance range of 95,000 BOE/day - 99,000 BOE/day, and higher than production of 103,192 BOE/day in the third quarter of 2023. Crude oil and natural gas liquids production averaged 67,097 bbls/day, exceeding the top end of our liquids production guidance range of 60,500 bbls/day - 64,500 bbls/day, and higher than the third quarter 2023 liquids production of 66,625 bbls/day. The outperformance was due to continued strong well performance from both our 2023 capital program and base production. Our fourth quarter capital spending was $91.5 million, bringing total capital spending to $532.5 million in 2023, in line with our revised guidance range of $520 - $540 million.

We reported net income of $116.7 million in the fourth quarter of 2023, compared to net income of $127.7 million in the third quarter of 2023. The decrease was due to lower realized crude oil and natural gas liquids prices, offset by commodity derivative instrument gains during the fourth quarter.

Fourth quarter cash flow from operating activities increased to $297.9 million from $212.2 million in the third quarter of 2023 primarily due to changes in our non-cash operating working capital, offset by a decrease in crude oil and natural gas sales due to lower realized pricing. Fourth quarter adjusted funds flow1 decreased to $240.5 million from $263.7 million in the third quarter of 2023 due to lower realized crude oil and natural gas liquids prices in the fourth quarter of 2023.

Comparing the fourth quarter of 2023 with the same period in 2022:

Average daily production was 103,543 BOE/day, a decrease of 3% from 106,915 BOE/day in the fourth quarter of 2022. The decrease in production was primarily due to lower natural gas production in the Marcellus as a result of limited capital investment during 2023, and the impact of Canadian asset divestments completed during the fourth quarter of 2022. These decreases were offset in large part by strong well performance on new wells brought online in 2023, and an increase in gas capture which contributed to higher production volumes in North Dakota.

Our crude oil and natural gas liquids production accounted for 65% of our total production mix in the fourth quarter of 2023, compared to 61% in 2022.

Capital spending increased to $91.5 million compared to $85.6 million in the fourth quarter of 2022, with the majority of the spending focused on our U.S. crude oil properties, including 15.4 net wells drilled in North Dakota in the fourth quarter of 2023.

Operating expenses were $111.2 million or $11.67/BOE compared to $95.2 million or $9.68/BOE in the fourth quarter of 2022. The increase was primarily due to inflation adjusted contract pricing and higher gas facility and fluid handling charges as a result of increased production in North Dakota, partially offset by the impact of Canadian asset divestments completed during the fourth quarter of 2022.

Cash G&A expenses increased to $13.4 million or $1.41/BOE compared to $11.3 million or $1.15/BOE in the fourth quarter of 2022 due to inflationary pressure on labour and services.

1 This financial measure is a non-GAAP financial measure. See “Non-GAAP and Other Financial Measures” section in this MD&A.

6             ENERPLUS 2023 FINANCIAL SUMMARY


During the fourth quarter of 2023, our Bakken crude oil price differential averaged $1.26/bbl below WTI, compared to $1.05/bbl above WTI for the same period in 2022. Bakken crude oil price differentials weakened in 2023 due to local production growth resulting in less spare pipeline capacity, and a deterioration in refinery demand.

Our fourth quarter 2023 Marcellus natural gas differential was $1.20/Mcf below NYMEX, consistent with $1.18/Mcf below NYMEX during the same period in 2022.

We reported net income of $116.7 million in the fourth quarter of 2023 compared to $330.7 million in the fourth quarter of 2022. Net income decreased primarily due to a $151.9 million gain on the sale of substantially all of our Canadian assets recorded in the fourth quarter of 2022, along with lower realized commodity prices and production in the fourth quarter of 2023.

Cash flow from operating activities and adjusted funds flow1 decreased to $297.9 million and $240.5 million, respectively, in the fourth quarter of 2023, compared to $316.6 million and $315.4 million in the fourth quarter of 2022 due to lower realized commodity prices. The impact of lower realized commodity prices on fourth quarter 2023 cash flow from operating activities was partially offset by a $61.1 million change in our non-cash operating working capital deficit during the quarter.

During the fourth quarter of 2023, we repurchased and cancelled 5.8 million shares under our normal course issuer bid (“NCIB”) at an average price of $16.09 per share. During the fourth quarter of 2022, we repurchased and cancelled 9.8 million shares under the NCIB at an average price of $17.24 per share.

Our net debt to adjusted funds flow ratio1 was 0.1x at December 31, 2023 compared to 0.2x at December 31, 2022.

2023 OVERVIEW

Summary of Guidance and Results

Revised 2023 Guidance

2023 Results

Capital spending ($ millions)

$520 - $540

$532

Average annual production (BOE/day)

98,000 - 99,000

100,015

Average annual crude oil and natural gas liquids production (bbls/day)

60,500 - 61,500

62,208

Fourth quarter average production (BOE/day)

95,000 - 99,000

103,543

Fourth quarter average crude oil and natural gas liquids production (bbls/day)

60,500 - 64,500

67,097

Average production tax rate (% of crude oil and natural gas sales)

8%

8%

Operating expenses (per BOE)

$10.75 - $11.00

$10.67

Transportation costs (per BOE)

$4.05

$3.99

Cash G&A expenses (per BOE)

$1.35

$1.33

Current tax expense (% of adjusted funds flow before tax)(1)

3% - 4%

3%

Differential/Basis Outlook and Results(2)

Average U.S. Bakken crude oil differential (compared to WTI crude oil)

($0.25)/bbl

$(0.45)/bbl

Average Marcellus natural gas differential (compared to last day NYMEX natural gas)

($0.85)/Mcf

$(0.92)/Mcf

(1)This financial measure, including related guidance, as applicable, is a non-GAAP financial measure. See “Non-GAAP and Other Financial Measures” section in this MD&A
(2)Excludes transportation costs.

Our 2023 annual average production and crude oil and natural gas liquids production exceeded the top end of our revised production guidance ranges of 98,000 BOE/day - 99,000 BOE/day and 60,500 bbls/day - 61,500 bbls/day, respectively, averaging 100,015 BOE/day and 62,208 bbls/day. Our capital spending for the year totaled $532.5 million, in line with our revised guidance of $520 - $540 million. The majority of our capital spending was directed to our U.S. crude oil properties, with approximately 94% of total spending focused on our North Dakota properties. The success of our capital program delivered crude oil and natural gas liquids production growth of 9% in North Dakota compared to 2022.

During 2023, a total of $306.9 million, representing 72% of free cash flow1, was returned to shareholders through share repurchases and dividends compared to $452.5 million and 57% of free cash flow1 in 2022. In 2023, we repurchased 8% of our outstanding shares at an average price of $15.71 per share. During 2023, we increased our quarterly dividend by 9% to $0.060 per share and paid a total of $48.6 million (December 31, 2022 - $41.6 million). Subsequent to December 31, 2023, the Board of Directors approved an 8% increase to the quarterly dividend to $0.065 per share beginning March 2024.

Our Bakken sales price differentials averaged $0.45/bbl below WTI, wider than our revised guidance of $0.25/bbl below WTI. Bakken differentials weakened in 2023 due to local production growth resulting in less spare pipeline capacity, along with the deterioration of refinery demand due to a decline in global refinery margins. Our Marcellus differential of $0.92/Mcf below NYMEX was slightly wider than our revised differential guidance of $0.85/Mcf below NYMEX.

1 This financial measure is a non-GAAP financial measure. See “Non-GAAP and Other Financial Measures” section in this MD&A.

ENERPLUS 2023 FINANCIAL SUMMARY             7


Operating expenses were $10.67/BOE, lower than our revised guidance range of $10.75/BOE - $11.00/BOE and represented a 7% increase from the prior year. On a per BOE basis, the increase was primarily due to inflation adjusted contract pricing, higher gas facility and fluid handling charges as a result of increased production in North Dakota. Cash G&A expenses were $1.33/BOE, in line with our guidance of $1.35/BOE.

Cash flow from operating activities and adjusted funds flow1 decreased to $938.2 million and $961.2 million, respectively, from $1,173.4 million and $1,230.3 million in 2022. The decrease was primarily due to lower commodity prices, partially offset by realized commodity derivative instrument gains recorded in 2023 compared to realized commodity derivative instrument losses recorded in 2022.

We reported net income of $456.1 million in 2023, compared to net income of $914.3 million in 2022. The decrease in net income was primarily due to a decrease in crude oil and natural gas sales related to lower commodity prices and a $151.9 million gain on the sale of substantially all of our Canadian assets recorded in the fourth quarter of 2022, partially offset by commodity derivative instrument gains recorded in 2023 compared to commodity derivative instrument losses recorded in 2022.

At December 31, 2023, net debt1 was $119.3 million compared to $221.5 million at December 31, 2022 and our net debt to adjusted funds flow ratio1 ratio decreased to 0.1x in 2023 from 0.2x in 2022. Net debt is calculated as total debt of $186.0 million, which was comprised of our senior notes and borrowing on our sustainability linked lending bank credit facilities of $900 million and $365 million (together referred to as the “Bank Credit Facilities”), less cash on hand of $66.7 million. At December 31, 2023, a total of $63.4 million was drawn on our Bank Credit Facilities.

2024 OUTLOOK

As previously announced, Enerplus expects 2024 capital spending of approximately $550 million and annual average liquids production of approximately 64,000 bbls/day. We expect 2024 annual average total production of approximately 99,000 BOE/day. The Company’s 2024 outlook is subject to changes as a result of completion of the Arrangement, which is currently expected to close mid-2024.

On February 21, 2024, the Board of Directors approved an 8% increase to the quarterly dividend of $0.065 per share, from $0.060 per share, beginning with the March 2024 dividend.

See “Forward-Looking Information and Statements” section in this MD&A.

RESULTS OF OPERATIONS

Production

Average Daily Production Volumes

2023

2022

2021

Tight oil (bbls/day)

50,779

47,511

42,981

Light and medium oil (bbls/day)

1,950

2,231

Heavy oil (bbls/day)

2,556

3,302

Total crude oil (bbls/day)

50,779

52,017

48,514

Natural gas liquids (bbls/day)

11,429

9,681

7,823

Shale gas - Marcellus (Mcf/day)

155,329

168,947

157,947

Shale gas - Bakken and DJ Basin (Mcf/day)

71,511

56,719

49,296

Shale gas - Other (Mcf/day)

179

243

Conventional natural gas (Mcf/day)

5,925

7,818

Total natural gas (Mcf/day)

226,840

231,770

215,304

Total daily sales (BOE/day)

100,015

100,326

92,221

Production in 2023 exceeded the top end of our revised production guidance range of 98,000 BOE/day - 99,000 BOE/day, and averaged 100,015 BOE/day, consistent with 2022 production of 100,326 BOE/day. Crude oil and natural gas liquids production in 2023 exceeded the top end of our revised guidance range of 60,500 bbls/day - 61,500 bbls/day, and averaged 62,208 bbls/day, slightly higher than 2022 crude oil and natural gas liquids production of 61,698 bbls/day. The consistent year-over-year production was primarily due to an 8% increase in our crude oil and natural gas liquids production as a result of strong well performance from 53.5 net wells brought on-stream in 2023 and increased gas capture. These increases were partially offset by the full year impact of the sale of substantially all of our Canadian assets in the fourth quarter of 2022 and a decrease in natural gas production in the Marcellus as a result of limited capital investment during 2023.

Our crude oil and natural gas liquids production accounted for 62% of our total average daily production in 2023, compared to 61% in 2022.

8             ENERPLUS 2023 FINANCIAL SUMMARY


Production in 2022 increased by 9% compared to 2021 due to a full year of production from the acquisition of Bruin E&P Holdco, LLC (the “Bruin Acquisition”) and certain assets in the Williston Basin from Hess Bakken Investment II, LLC (the “Dunn County Acquisition”) acquired in the first half of 2021, and the impact of on-streams in North Dakota during 2022. These increases were partially offset by the impact of severe winter weather in North Dakota in 2022, the sale of our interests in Montana and the Russian Creek area in North Dakota during the fourth quarter of 2021, and the sale of substantially all of our Canadian assets in the fourth quarter of 2022.  

Pricing

The prices received for our crude oil and natural gas production directly impact our earnings, cash flow from operating activities, adjusted funds flow and financial condition. The following table summarizes our average selling prices, benchmark prices and differentials:

Pricing (average for the period)


2023


2022


2021

Benchmarks

WTI crude oil ($/bbl)

$

77.62

$

94.23

$

67.92

Brent (ICE) crude oil ($/bbl)

82.22

98.89

70.79

Propane – Conway ($/bbl)

28.93

46.03

43.74

NYMEX natural gas – last day ($/Mcf)

2.74

6.64

3.84

CDN/US average exchange rate

0.74

0.77

0.80

CDN/US period end exchange rate

0.76

0.74

0.79

Enerplus selling price(1)

Crude oil ($/bbl)

$

77.42

$

93.63

$

65.89

Natural gas liquids ($/bbl)

17.93

30.70

29.51

Natural gas ($/Mcf)

1.85

5.51

2.94

Average benchmark differentials

Bakken DAPL - WTI ($/bbl)

$

0.31

$

2.62

$

(0.79)

Brent (ICE) - WTI ($/bbl)

4.60

4.66

2.87

Transco Leidy monthly – NYMEX ($/Mcf)

(0.93)

(1.04)

(0.94)

Transco Z6 Non-New York monthly – NYMEX ($/Mcf)

0.16

(0.12)

(0.36)

Enerplus realized differentials(1)(2)

Bakken crude oil – WTI ($/bbl)

$

(0.45)

$

1.09

$

(2.15)

Marcellus natural gas – NYMEX ($/Mcf)

(0.92)

(0.72)

(0.81)

(1)Excluding transportation costs and the effects of commodity derivative instruments.
(2)Based on a weighted average differential for the period.


CRUDE OIL

Benchmark WTI prices averaged $77.62/bbl in 2023, an 18% decrease from 2022. Prices were elevated in 2022 due to Russia’s invasion of Ukraine and the consequential impact on global oil supply. Prices moderated during the second half of 2022 driven mainly by concerns of a global recession as central banks aggressively raised key interest rates in response to year-over-year inflation.

Prices in 2023 were supported in part by a recovery in Chinese demand as restrictions related to the coronavirus (“COVID-19”) pandemic were lifted in the first quarter of 2023, as well as increased voluntary production curtailments by the Organization of the Petroleum Exporting Countries Plus (“OPEC+”) during 2023. Strength in U.S. supply growth was stronger than anticipated and offset much of the price strength at the end of 2023. The global economic outlook has improved as the risk of a global recession has fallen with central banks appearing to have balanced inflation and recession risks through interest rate policy.

Our 2023 realized crude oil price averaged $77.42/bbl, representing a 17% decrease compared to 2022, which reflects the moderation in WTI pricing as well as changes in sales price differentials which were in line with underlying benchmarks.

Our Bakken sales price differential averaged $0.45/bbl below WTI in 2023. Differentials weakened through the second half of 2023 due to elevated local production growth driven by an acceleration in well completion activity, while refinery demand deteriorated in the fourth quarter of 2023 due to a decline in global refinery margins.

ENERPLUS 2023 FINANCIAL SUMMARY             9


Monthly Crude Oil Prices

Graphic


NATURAL GAS LIQUIDS

We realized an average price of $17.93/bbl on natural gas liquids production in 2023, a 42% decrease compared to 2022. North American natural gas liquids pricing decreased throughout 2023 due to increased production, limited domestic demand growth and an increasing reliance on exports to balance the North American market.

NATURAL GAS

Our realized natural gas price averaged $1.85/Mcf in 2023, a 66% decrease from 2022. The decrease in our realized price was consistent with the decrease in the NYMEX natural gas benchmark.

In the Marcellus, we realized an average sales price differential of $0.92/Mcf below NYMEX which was wider than our 2022 realized sales price differential of $0.72/Mcf below NYMEX. NYMEX natural gas prices at Henry Hub settled considerably lower during 2023 as both inventory and supply concerns normalized after being heavily influenced by European geopolitical forces in 2022. Weakness in NYMEX natural gas pricing in 2023 was due to lower demand due to warm winter conditions coupled with stronger than expected U.S. supply. The Transco TZ6 Non-New York monthly benchmark differentials averaged $0.16/Mcf above NYMEX for 2023, $0.28/Mcf stronger than 2022. The Transco Leidy monthly benchmark differential averaged $0.93/Mcf below NYMEX for 2023, $0.11/Mcf narrower than 2022. Although monthly Marcellus benchmarks were stronger on average in 2023, the significant volatility experienced during the first quarter of 2023 between cash prices and monthly benchmarks resulted in our annual realized Marcellus differential underperforming the monthly benchmarks.

10             ENERPLUS 2023 FINANCIAL SUMMARY


Monthly Natural Gas Prices

Graphic

Price Risk Management

We have a price risk management program that considers our overall financial position.

We expect our commodity derivative contracts to protect a portion of our cash flow from operating activities and adjusted funds flow. At February 20, 2024, we have hedged 5,000 bbls/day of WTI crude oil exposure for the first half of 2024. In addition, we have entered into 40,000 Mcf/day of Leidy basis differentials for February 2024. Our crude oil contracts consist of three-way collars, which limits upward price participation to the call strike level. Additionally, the sold put limits the amount of downside protection we have to the difference between the strike price of the purchased and sold puts.

The following table summarizes Enerplus’ price risk management positions at December 31, 2023, and positions entered into subsequent to December 31, 2023 and up to February 20, 2024:

WTI Crude Oil ($/bbl)(1)

Leidy Basis ($/Mcf)


Jan 1, 2024 – Jun 30, 2024

Feb 1, 2024 – Feb 29, 2024

Swaps

Volume (Mcf/day)

 –

40,000

Swap Strike

 –

($ 0.45)

3 Way Collars

Volume (bbls/day)

5,000

 –

Sold Puts

$ 65.00

 –

Purchased Puts

$ 77.00

 –

Sold Calls

$ 95.00

 –

(1)The total average deferred premium spent on our outstanding crude oil contracts is $1.25/bbl from January 1, 2024 – June 30, 2024.

ENERPLUS 2023 FINANCIAL SUMMARY             11


ACCOUNTING FOR PRICE RISK MANAGEMENT

Commodity Risk Management Gains/(Losses)

($ millions)


2023


2022


2021

Realized gains/(losses):

Crude oil


$

8.2


$

(275.7)


$

(146.3)

Natural gas

48.7

(71.5)

(16.7)

Total realized gains/(losses)


$

56.9


$

(347.2)


$

(163.0)

Unrealized gains/(losses):

Crude oil


$

1.1


$

125.8


$

(111.6)

Natural gas

(26.7)

23.7

0.2

Total unrealized gains/(losses)


$

(25.6)


$

149.5


$

(111.4)

Total commodity derivative instruments gains/(losses)


$

31.3


$

(197.7)


$

(274.4)

(Per BOE)


2023


2022


2021

Total realized gains/(losses)


$

1.56


$

(9.48)


$

(4.84)

Total unrealized gains/(losses)

(0.70)

4.08

(3.31)

Total commodity derivative instruments gains/(losses)


$

0.86


$

(5.40)


$

(8.15)

During 2023, Enerplus realized gains of $8.2 million on our crude oil contracts and $48.7 million on our natural gas contracts, compared to realized losses of $275.7 million on our crude oil contracts and $71.5 million on our natural gas contracts in 2022. Realized gains in 2023 on crude oil and natural gas contracts were due to commodity prices falling below the purchased put values on our commodity derivative contracts.

As the forward markets for crude oil and natural gas fluctuate, as new contracts are executed, and as existing contracts are realized, changes in fair value are reflected as either an unrealized loss or gain to earnings. At December 31, 2023, the fair value of our crude oil contracts was in an asset position of $3.2 million (December 31, 2022 - net liability position of $0.6 million). There were no natural gas contracts in place at December 31, 2023 (December 31, 2022 - net asset position of $26.7 million). The change in fair value of our crude oil and natural gas contracts represented unrealized gains of $1.1 million and unrealized losses of $26.7 million, respectively, during 2023 and unrealized gains of $125.8 million and $23.7 million during 2022.

Crude oil and natural gas sales

($ millions)


2023


2022


2021

Crude oil and natural gas sales


$

1,663.0


$

2,353.4


$

1,482.6

Per BOE

$

45.56

$

64.27

$

44.04

Crude oil and natural gas sales for 2023 totaled $1,663.0 million, or $45.56/BOE, compared to $2,353.4 million, or $64.27/BOE in 2022. The decrease in crude oil and natural gas sales was primarily due to lower commodity prices and lower Marcellus production in 2023, and the impact of the Canadian divestments completed in the fourth quarter of 2022. Refer to the “Pricing” section for further details in this MD&A.

Comparing 2022 to 2021, crude oil and natural gas sales were $2,353.4 million, or $64.27/BOE, compared to $1,482.6 million, or $44.04/BOE, as a result of increased production volumes from our capital program and higher commodity prices.

Operating Expenses

($ millions, except per BOE amounts)


2023


2022


2021

Operating expenses


$

389.7


$

365.7


$

292.4

Per BOE


$

10.67


$

9.99


$

8.69

Operating expenses for 2023 were $389.7 million or $10.67/BOE, lower than our revised guidance range of $10.75/BOE - $11.00/BOE and an increase of $24.0 million or $0.68/BOE from 2022. The increase in operating expenses was primarily due to inflation adjusted contract pricing and higher gas facility and fluid handling charges as a result of increased production in North Dakota. The increases were partially offset by the impact of Canadian divestments completed in the fourth quarter of 2022.

Operating expenses for 2022 were $365.7 million or $9.99/BOE, representing an increase of $73.3 million or $1.30/BOE from 2021. The increase was primarily due to the impact of inflation adjusted contract pricing and increased well service activity and costs.

12             ENERPLUS 2023 FINANCIAL SUMMARY


Transportation Costs

($ millions, except per BOE amounts)


2023


2022


2021

Transportation costs


$

145.6


$

154.7


$

128.3

Per BOE


$

3.99


$

4.22


$

3.81

Transportation costs in 2023 were lower than our revised guidance of $4.05/BOE, averaging $3.99/BOE or $145.6 million, compared to $4.22/BOE or $154.7 million in 2022. The decrease in transportation costs was primarily due to a higher proportion of total production volumes from areas with lower associated transportation costs.

Transportation costs in 2022 increased to $4.22/BOE compared to $3.81/BOE in 2021. The increase in transportation costs was primarily a result of increased U.S. production with higher associated transportation costs and additional firm transportation commitments on the Dakota Access Pipeline (“DAPL”) as a result of the Bruin Acquisition and our participation in the DAPL expansion in August 2021.

Production Taxes

($ millions, except per BOE amounts)


2023


2022


2021

Production taxes


$

135.1


$

167.0


$

102.0

Per BOE


$

3.70


$

4.56


$

3.03

Production taxes (% of crude oil and natural gas sales)

8.1%


7.1%


6.9%

Production taxes include state production taxes and Pennsylvania impact fees.

Production taxes were in line with our guidance of 8.0% for 2023, averaging 8.1% of crude oil and natural gas sales, before transportation. Production taxes of $135.1 million in 2023 were lower in comparison to 2022 due to lower realized crude oil prices. The increase in production taxes as a percentage of crude oil and natural gas sales was due to increased U.S. crude oil production which has higher rates of production tax combined with decreased natural gas revenues with lower associated production taxes.

Production taxes of $167.0 million in 2022 were higher in comparison to 2021 due to higher realized commodity prices and production volumes.

ENERPLUS 2023 FINANCIAL SUMMARY             13


Netbacks

The crude oil and natural gas classifications below contain properties according to their dominant production category. These properties may include associated crude oil, natural gas or natural gas liquids volumes which have been converted to the equivalent BOE/day or Mcfe/day and as such, the revenue per BOE or per Mcfe may not correspond with the average selling price under the “Pricing” section of this MD&A.

Year ended December 31, 2023

Netbacks by Property Type


Crude Oil


Natural Gas


Total

Average Daily Production


74,103 BOE/day

155,469 Mcfe/day

100,015 BOE/day

Netback $ per BOE or Mcfe


(per BOE)


(per Mcfe)


(per BOE)

Crude oil and natural gas sales


$

57.59

$

1.85

$

45.56

Operating expenses

(14.02)

(0.18)

(10.67)

Transportation costs

(3.50)

(0.90)

(3.99)

Production taxes

(4.93)

(0.03)

(3.70)

Netback before impact of commodity derivative contracts


$

35.14


$

0.74


$

27.20

Realized gains/(losses) on commodity derivative contracts

0.30

0.86

1.56

Netback after impact of commodity derivative contracts


$

35.44


$

1.60


$

28.76

Netback before impact of commodity derivative contracts(1) ($ millions)


$

950.5

$

42.1

$

992.6

Netback after impact of commodity derivative contracts(1) ($ millions)


$

958.7

$

90.8

$

1,049.5

(1)This financial measure is a non-GAAP financial measure. See “Non-GAAP and Other Financial Measures” section in this MD&A.

Year ended December 31, 2022

Netbacks by Property Type


Crude Oil


Natural Gas


Total

Average Daily Production


71,271 BOE/day

174,330 Mcfe/day

100,326 BOE/day

Netback $ per BOE or Mcfe


(per BOE)


(per Mcfe)


(per BOE)

Crude oil and natural gas sales


$

75.98

$

5.92

$

64.27

Operating expenses

(13.57)

(0.20)

(9.99)

Transportation costs

(3.76)

(0.89)

(4.22)

Production taxes

(6.30)

(0.05)

(4.56)

Netback before impact of commodity derivative contracts


$

52.35


$

4.78


$

45.50

Realized gains/(losses) on commodity derivative contracts

(10.60)

(1.12)

(9.48)

Netback after impact of commodity derivative contracts


$

41.75


$

3.66


$

36.02

Netback before impact of commodity derivative contracts(1) ($ millions)


$

1,361.8

$

304.2

$

1,666.0

Netback after impact of commodity derivative contracts(1) ($ millions)


$

1,086.1

$

232.9

$

1,318.8

(1)This financial measure is a non-GAAP financial measure. See “Non-GAAP and Other Financial Measures” section in this MD&A.

Year ended December 31, 2021

Netbacks by Property Type


Crude Oil


Natural Gas


Total

Average Daily Production


64,479 BOE/day

166,454 Mcfe/day

92,221 BOE/day

Netback $ per BOE or Mcfe


(per BOE)


(per Mcfe)


(per BOE)

Crude oil and natural gas sales


$

54.91

$

3.13

$

44.04

Operating expenses

(11.89)

(0.21)

(8.69)

Transportation costs

(3.11)

(0.91)

(3.81)

Production taxes

(4.23)

(0.04)

(3.03)

Netback before impact of commodity derivative contracts


$

35.68


$

1.97


$

28.51

Realized gains/(losses) on commodity derivative contracts

(6.22)

(0.28)

(4.84)

Netback after impact of commodity derivative contracts


$

29.46


$

1.69


$

23.67

Netback before impact of commodity derivative contracts(1) ($ millions)


$

840.0

$

119.9

$

959.9

Netback after impact of commodity derivative contracts(1) ($ millions)


$

693.7

$

103.2

$

796.9

(1)This financial measure is a non-GAAP financial measure. See “Non-GAAP and Other Financial Measures” section in this MD&A.

Total netbacks before and after the impact of commodity derivative contracts in 2023 were lower compared to 2022 due to lower realized commodity prices.

14             ENERPLUS 2023 FINANCIAL SUMMARY


During 2023, our crude oil properties accounted for 96% of our total netback before the impact of commodity derivative contracts and 91% of our total netback after the impact of commodity derivative contracts, compared to 82% of our total netback before and after the impact of commodity derivative contracts in 2022.

General and Administrative (“G&A”) Expenses

Total G&A expenses include cash G&A expenses and share-based compensation (“SBC”) charges related to our long-term incentive plans (“LTI plans”).

($ millions)


2023


2022


2021

Cash:

G&A expense


$

48.8

$

42.8

$

38.4

Share-based compensation expense/(recovery)

(0.4)

5.7

6.9

Non-Cash:

Share-based compensation expense/(recovery)

18.3

22.9

13.8

Equity swap loss/(gain)

(1.0)

(1.9)

G&A expense/(recovery)

(1.0)

(0.4)

(0.4)

Total G&A expenses


$

65.7


$

70.0


$

56.8

(Per BOE)


2023


2022


2021

Cash:

G&A expense


$

1.33

$

1.17

$

1.14

Share-based compensation expense/(recovery)

(0.01)

0.16

0.20

Non-Cash:

Share-based compensation expense/(recovery)

0.50

0.63

0.41

Equity swap loss/(gain)

(0.03)

(0.06)

G&A expense/(recovery)

(0.02)

(0.01)

(0.01)

Total G&A expenses


$

1.80


$

1.92


$

1.68

Cash G&A expenses were $48.8 million or $1.33/BOE in 2023, in line with our guidance of $1.35/BOE. The increase in total cash G&A expenses in 2023 and 2022 were primarily due to inflationary pressure on labour and services.  

SBC can be equity settled or cash-settled depending on the underlying plan to which it relates. Cash-settled SBC expense relates to our director plans and was a recovery of $0.4 million or $0.01/BOE in 2023, compared to an expense of $5.7 million or $0.16/BOE in 2022, and an expense of $6.9 million or $0.20/BOE in 2021. The recovery in 2023 was due to a decrease in Enerplus’ share price compared to 2022. The decrease in expense in 2022 compared to 2021 was due to fewer cash-settled units outstanding compared to the prior year, partially offset by an increase in share price.  

Equity settled non-cash SBC was $18.3 million or $0.50/BOE in 2023, compared to $22.9 million or $0.63/BOE in 2022 and $13.8 million or $0.41/BOE in 2021. Performance Share Units (“PSUs”), as one of the equity settled LTI plans, are impacted by performance multipliers. During 2023, the multipliers were lower than in 2022 resulting in a decreased expense. The equity settled non-cash SBC was lower in 2021, due to lower multipliers.  

Enerplus previously had hedged a portion of the outstanding cash-settled units under our LTI plans. During 2022, we recorded an unrealized gain of $1.0 million on these equity derivative contracts as a result of the improved share price (2021 – $1.9 million gain). Enerplus settled its equity derivative contracts during 2022 and did not have any equity derivatives outstanding at December 31, 2023 or 2022.

Interest Expense

Interest on our senior notes and Bank Credit Facilities for 2023 totaled $17.6 million, a decrease of 28% from $24.6 million in 2022. The decrease was primarily due to lower debt levels in 2023, as free cash flow was used to repay outstanding debt. During 2023, we made principal payments of $80.6 million on our senior notes. At December 31, 2023, we had $122.6 million of senior notes outstanding.

In 2022, interest on our senior notes and Bank Credit Facilities was $24.6 million, a decrease compared to $27.4 million in 2021 due to lower debt levels, partially offset by the impact of rising interest rates on our Bank Credit Facilities drawings in 2022.

At December 31, 2023, approximately 66% of our debt was based on fixed interest rates and 34% on floating interest rates (December 31, 2022 - 78%, 22%), with weighted average interest rates of 4.1% and 6.7%, respectively (December 31, 2022 - 4.1%, 5.7%).

ENERPLUS 2023 FINANCIAL SUMMARY             15


Property, Plant and Equipment (“PP&E”)

($ millions)


2023


2022


2021

Capital spending(1)


$

532.5

$

432.0

$

302.3

Office capital

3.5

1.3

1.6

Sub-total

536.0

433.3

303.9

Bruin Acquisition

$

$

$

520.2

Dunn County Acquisition

305.1

Canadian divestments(1)

(213.0)

Property and land acquisitions


7.3

22.5

9.8

Property and land divestments(1)

(3.0)

(18.4)

(112.7)

Sub-total

4.3

(208.9)

722.4

Total


$

540.3


$

224.4


$

1,026.3

(1)Excludes changes in non-cash investing working capital.

2023

Capital spending in 2023 totaled $532.5 million, in line with our revised guidance range of $520 - $540 million. In 2023, we spent $517.2 million on our U.S. crude oil properties and $15.3 million on our Marcellus natural gas assets. The increase in capital spending in 2023, compared to 2022, was due to increased operated and non-operated drilling and completions activity on our North Dakota properties, partially offset by minimal capital investment on our Marcellus natural gas properties. Through our capital program, we added 33.0 MMBOE of gross proved plus probable Canadian NI 51-101 Standards reserves in 2023, replacing 100% of our production, including economic factors and technical revisions and before accounting for acquisitions and divestments.

Property and land acquisitions in 2023 totaled $7.3 million and were primarily related to the acquisition of interests in North Dakota. We recorded property and land divestments of $3.0 million in 2023.

2022

Capital spending in 2022 totaled $432.0 million, in line with our revised guidance of $430 million. In 2022, we spent $368.0 million on our U.S. crude oil properties, and $57.6 million on our Marcellus natural gas assets. The increase in capital spending in 2022, compared to 2021, was due to increased capital activity on our North Dakota properties which includes properties from the Bruin Acquisition and the Dunn County Acquisition. Through our capital program, we added 63.3 MMBOE of gross proved plus probable Canadian NI 51-101 Standards reserves in 2022, replacing 139% of our production, including economic factors and technical revisions and before accounting for acquisitions and divestments.

In the fourth quarter of 2022, the Company divested substantially all of its Canadian assets in two transactions for total adjusted proceeds of $213.0 million after purchase price adjustments and transaction costs. These transactions resulted in a $151.9 million gain on asset divestments on the Consolidated Statements of Income/(Loss) in the fourth quarter of 2022, with $61.7 million allocated to PP&E, excluding the reduced asset retirement obligation.

Property and land acquisitions in 2022 totaled $22.5 million, which included minor acquisitions of leases and undeveloped land. We recorded other property and land divestments of $18.4 million in 2022.

2021

Capital spending in 2021 totaled $302.3 million, including $256.1 million on our U.S. crude oil properties, $13.8 million on our Canadian crude oil properties and $31.0 million on our Marcellus natural gas assets. Through our capital program in 2021, we added 85.0 MMBOE of gross proved plus probable Canadian NI 51-101 Standards reserves, replacing 204% of our production, including economic factors and technical revisions and before accounting for acquisitions and divestments. Including acquired and divested volumes, we replaced 558% of our 2021 production adding 233.0 MMBOE of gross proved plus probable reserves.

During 2021, we completed the Bruin Acquisition for total cash consideration of $465.0 million or $420.2 million after purchase price adjustments, with $520.2 million allocated to PP&E, excluding the assumed asset retirement obligation. We also completed the Dunn County Acquisition for total cash consideration of $306.8 million, with $305.1 million allocated to PP&E, excluding the assumed asset retirement obligation.

Property divestments were related to the sale of our interest in the Sleeping Giant field in Montana and the Russian Creek area in North Dakota in the Williston Basin during the fourth quarter of 2021 for total cash consideration of $107.8 million after purchase price adjustments, which was all allocated to PP&E, excluding the divested asset retirement obligation.

16             ENERPLUS 2023 FINANCIAL SUMMARY


Depletion, Depreciation and Accretion (“DD&A”)

($ millions, except per BOE amounts)


2023


2022


2021

DD&A expense


$

377.5


$

309.4


$

274.8

Per BOE


$

10.34


$

8.45


$

8.16

DD&A of PP&E is recognized using the unit of production method based on proved reserves. We recorded DD&A of $377.5 million, or $10.34/BOE, during 2023, an increase compared to $309.4 million, or $8.45/BOE, in 2022. The increase in total DD&A expense and per BOE is primarily a result of higher capital spending in North Dakota and reserve revisions in the Marcellus. In 2022, DD&A increased from the prior year as a result of higher overall production volumes and higher PP&E costs from the Bruin Acquisition and the Dunn County Acquisition.

PP&E Impairment

Under U.S. GAAP, the full cost ceiling test is performed on a country-by-country cost centre basis using estimated after-tax future net cash flows discounted at 10 percent from proved reserves (“Standardized Measure”), using constant prices as defined by the SEC guidelines. SEC prices are calculated as the unweighted average of the trailing twelve first-day-of-the-month commodity prices. The Standardized Measure is not related to Enerplus’ investment criteria and is not a fair value-based measurement, but rather a prescribed accounting calculation. Impairments are non-cash and are not reversed in future periods under U.S. GAAP.

Trailing twelve-month average crude oil prices have improved since 2021. There were no impairments for the twelve months ended December 31, 2023 or 2022. For the twelve months ended December 31, 2021, we recorded a PP&E impairment of $3.4 million related to our Canadian cost centre.

Many factors influence the allowed ceiling value compared to our net capitalized cost base, making it difficult to predict with reasonable certainty the value of impairment losses from future ceiling tests. For the upcoming year, the primary factors include future first-day-of-the-month commodity prices, reserves revisions, capital expenditure levels and timing, acquisition and divestment activity, as well as production levels, which affect DD&A expense. See "Risk Factors and Risk Management – Risk of Impairment of Oil and Gas Properties and Deferred Tax Assets" in this MD&A.

The following table outlines the twelve-month average trailing benchmark prices used in our ceiling test at December 31, 2023, 2022 and 2021:

WTI Crude Oil

U.S. Henry Hub

Year

$/bbl

$/Mcf

2023


$

78.21

$

2.59

2022


$

94.14

$

6.25

2021


$

66.55

$

3.64

Asset Retirement Obligation (“ARO”)

In connection with our operations, we incur abandonment, reclamation and remediation costs related to assets, such as surface leases, wells, facilities and pipelines. Total ARO included on our balance sheet is based on our net ownership interest and management’s estimate of costs to abandon, reclaim and remediate, the timing of the costs to be incurred in future periods and estimates for inflation. We have estimated the net present value of our asset retirement obligation to be $125.5 million at December 31, 2023, compared to $114.7 million at December 31, 2022.

During 2023, we spent $15.0 million (2022 - $17.4 million, 2021 - $13.0 million) on our asset retirement obligations. We do not reserve cash or assets for the purpose of funding our future asset retirement obligations. Any abandonment, reclamation and remediation costs are anticipated to be funded out of adjusted funds flow and our Bank Credit Facilities.

ENERPLUS 2023 FINANCIAL SUMMARY             17


Leases

Enerplus recognizes Right-Of-Use (“ROU”) assets and lease liabilities on the Consolidated Balance Sheet for qualifying leases with a term greater than 12 months. We incur lease payments related to office space, drilling rig commitments, vehicles and other equipment. Total lease liabilities included on our balance sheet are based on the present value of lease payments over the lease term. Total ROU assets included on our balance sheet represent the remaining unamortized amount of our right to use an underlying asset for its remaining lease term. At December 31, 2023 our total lease liability was $26.4 million, compared to $22.9 million at December 31, 2022. At December 31, 2023 our ROU asset was $25.0 million, compared to $20.6 million at December 31, 2022.

Income Taxes

($ millions)


2023


2022


2021

Current tax expense/(recovery)


$

27.2


$

28.1


$

2.7

Deferred tax expense/(recovery)

84.2

265.2

98.8

Total tax expense/(recovery)


$

111.4


$

293.3


$

101.5

In 2023, we recorded a current tax expense of $27.2 million or 3% of adjusted funds flow before tax1, in line with our revised guidance of 3% - 4% of adjusted funds flow before tax1, compared to an expense of $28.1 million in 2022 and $2.7 million in 2021. The current tax expense is related primarily to income generated from U.S. operations.

In 2023, we recorded a deferred income tax expense of $84.2 million compared to an expense of $265.2 million in 2022 and $98.8 million in 2021. The lower expense in 2023 is primarily due to lower U.S. income.

We assess the recoverability of our deferred income tax assets each period to determine whether it is more likely than not all or a portion of our deferred income tax assets will not be realized. We have considered available positive and negative evidence including future taxable income and reversing existing temporary differences in making this assessment. This assessment is primarily the result of projecting future taxable income using total proved and probable forecast prices and costs. There is risk of a valuation allowance in future periods if commodity prices weaken or other evidence indicates that some of our deferred income tax assets will not be realized. See “Risk Factors and Risk Management - Risk of Impairment of Oil and Gas Properties and Deferred Tax Assets” in this MD&A. For the year ended December 31, 2023, no valuation allowance was recorded against our Canadian income related deferred tax asset, however, a full valuation allowance has been recorded against our deferred income tax assets related to capital items. Our deferred income tax asset recorded in Canada was $133.0 million and the deferred income tax liability in the U.S. was $117.6 million at December 31, 2023 (December 31, 2022 - $155.0 million deferred income tax asset in Canada and $55.4 million deferred income tax liability in the U.S.).

Our estimated tax pools at December 31, 2023 are as follows:

Pool Type ($ millions)


2023

U.S.

Depletable, depreciable assets and other credits

$

956


$

956

Canada

Non-capital losses and other credits


$

395

Canadian exploration expense

140

Canadian development expense

9

Undepreciated capital costs

9


$

553

Total tax pools and credits


$

1,509

1 This financial measure is a non-GAAP financial measure. See “Non-GAAP and Other Financial Measures” section in this MD&A.

18             ENERPLUS 2023 FINANCIAL SUMMARY


LIQUIDITY AND CAPITAL RESOURCES

There are numerous factors that influence how we assess our liquidity and leverage, including commodity price cycles, capital spending levels, acquisition and divestment plans, commodity derivative contracts, share repurchases and dividend levels. We also assess our leverage relative to our most restrictive debt covenant, which is a maximum senior debt to earnings before interest, taxes, depreciation, amortization, impairment and other non-cash charges (“adjusted EBITDA1”) ratio of 3.5x for a period of up to six months, after which it drops to 3.0x. At December 31, 2023, our senior debt to adjusted EBITDA ratio was 0.2x and our net debt to adjusted funds flow1 ratio was 0.1x. Although a Non-GAAP measure that is not included in our debt covenants, the net debt to adjusted funds flow ratio is often used by investors and analysts to evaluate our liquidity. Refer to the definitions and footnotes below.

Net debt1 at December 31, 2023 decreased to $119.3 million, compared to $221.5 million at December 31, 2022. At December 31, 2023, total debt was comprised of our senior notes and Bank Credit Facilities, totaling $186.0 million, and cash on hand was $66.7 million. At December 31, 2023, through our Bank Credit Facilities, we had total credit capacity of $1.3 billion, of which $63.4 million was drawn. We expect to finance our working capital requirements through cash, adjusted funds flow and our credit capacity. We have sufficient liquidity to meet our financial commitments for the near term.

During 2023, a total of $306.9 million, representing 72% of free cash flow1, was returned to shareholders through share repurchases and dividends, compared to $452.5 million and 57% of free cash flow1 in 2022. In 2023, a total of 16.4 million shares were repurchased under the NCIB at an average price of $15.71 per share (December 31, 2022 - 27.9 million shares, $14.71 per share). Subsequent to December 31, 2023 and up to and including February 20, 2024, we repurchased 1.1 million shares under the NCIB at an average price of $14.34 per share, for total consideration of $16.0 million.

For the year ended December 31, 2023, Enerplus increased its quarterly dividend by 9% to $0.060 per share and paid a total of $48.6 million (December 31, 2022 - $41.6 million).

At December 31, 2023, we were in compliance with all covenants under the Bank Credit Facilities and outstanding senior notes. If we exceed or anticipate exceeding our covenants, we may be required to repay, refinance or renegotiate the terms of the debt. See "Risk Factors – Debt covenants of the Company may be exceeded with no ability to negotiate covenant relief" in the Company’s Annual Information Form dated February 21, 2024, for the year ended December 31, 2023 (the “Annual Information Form”). Agreements relating to our Bank Credit Facilities and senior note purchase agreements have been filed under our SEDAR+ profile at www.sedarplus.ca.  

1 This financial measure is a non-GAAP financial measure. See “Non-GAAP and Other Financial Measures” section in this MD&A.

ENERPLUS 2023 FINANCIAL SUMMARY             19


The following table lists our financial covenants, as defined by our debt agreements, at December 31, 2023:

Covenant Description


December 31, 2023

Bank Credit Facilities:


Maximum Ratio

Senior debt to adjusted EBITDA


3.5x

0.2x

Total debt to adjusted EBITDA


4.0x

0.2x

Total debt to capitalization


55%

9%

Senior Notes:


Maximum Ratio


Senior debt to adjusted EBITDA(1)


3.0x - 3.5x

0.2x

Senior debt to consolidated present value of total proved reserves(2)


60%

5%


Minimum Ratio


Adjusted EBITDA to interest


4.0x


57.3x

Definitions

“Senior Debt” is calculated as the sum of drawn amounts on our Bank Credit Facility, outstanding letters of credit and the principal amount of senior notes.

“Adjusted EBITDA” is calculated as net income less interest, taxes, depletion, depreciation, amortization, and other non-cash gains and losses. Adjusted EBITDA is calculated on a trailing twelve-month basis and is adjusted for material acquisitions and divestments. Adjusted EBITDA for the twelve months ended December 31, 2023 was $1,008.0 million.

“Total Debt” is calculated as the sum of senior debt plus subordinated debt. Enerplus currently does not have any subordinated debt.

“Capitalization” is calculated as the sum of total debt and shareholder’s equity plus a $823.7 million adjustment related to our adoption of U.S. GAAP.

Footnotes

(1)Senior debt to adjusted EBITDA for the senior notes may increase to 3.5x for a period of 6 months, after which the ratio decreases to 3.0x.
(2)Senior debt to consolidated present value of total proved reserves is calculated annually on December 31 based on before tax reserves at forecast prices discounted at 10%.


Counterparty Credit

CRUDE OIL AND NATURAL GAS SALES COUNTERPARTIES

Our crude oil and natural gas receivables are with customers in the oil and gas industry and are subject to normal credit risks. Concentration of credit risk is mitigated by marketing production to numerous purchasers under normal industry sale and payment terms. A credit review process is in place to assess and monitor our counterparties’ creditworthiness on a regular basis. This process involves reviewing and ratifying our corporate credit guidelines, assessing the credit ratings of our counterparties and setting exposure limits. When warranted, we obtain financial assurances such as letters of credit, parental guarantees or third-party insurance to mitigate a portion of our credit risk. This process is utilized for both our crude oil and natural gas sales counterparties as well as our financial derivative counterparties.

FINANCIAL DERIVATIVE COUNTERPARTIES

We are exposed to credit risk in the event of non-performance by our financial counterparties regarding our derivative contracts. We mitigate this risk by entering into transactions with major financial institutions, the majority of which are members of our bank syndicate. We have International Swaps and Derivatives Association (“ISDA”) agreements in place with the majority of our financial counterparties. These agreements provide some credit protection by generally allowing parties to aggregate amounts owing to each other under all outstanding transactions and settle with a single net amount in the case of a credit event. To date we have not experienced any losses due to non-performance by our derivative counterparties. All of our derivative counterparties are considered investment grade. At December 31, 2023, we had a net asset position of $3.2 million (December 31, 2022 - net asset position of $26.1 million).

Dividends

($ millions, except per share amounts)


2023


2022


2021

Dividends(1)


$

48.6


$

41.6


$

30.5

Per weighted average share (Basic)


$

0.230


$

0.181


$

0.121

(1)Excludes changes in non-cash financing working capital.

During 2023, we declared dividends of $0.230 per weighted average share totaling $48.6 million (2022 - $0.181 per share and $41.6 million; 2021 - $0.121 per share and $30.5 million).

In 2023, we declared a quarterly dividend of $0.055 per share for the first and second quarters, and $0.060 per share for the third and fourth quarters. On February 21, 2024, the Board of Directors approved an 8% increase to the quarterly dividend of $0.065 per share, from $0.060 per share, beginning with the March 2024 dividend. It is anticipated that the quarterly dividend payments made by Enerplus until closing of the transaction will be equalized to those made by Chord, after giving effect to the exchange ratio, through an additional Enerplus dividend declared shortly prior to the closing. We expect to fund the dividend through the free cash flow generated by the business.

20             ENERPLUS 2023 FINANCIAL SUMMARY


Shareholders’ Capital


2023


2022


2021

Share capital ($ millions)


$

2,692.1


$

2,837.3


$

3,094.1

Common shares outstanding (thousands)

202,198

217,285

243,852

Weighted average shares outstanding – basic (thousands)

211,353

233,946

251,909

Weighted average shares outstanding – diluted (thousands)

217,896

242,673

259,851

For the twelve months ended December 31, 2023, a total of 2.4 million units vested pursuant to our treasury settled LTI plans (2022 - 2.4 million; 2021 - 2.0 million). In total, 1.4 million shares were issued from treasury and $7.5 million was transferred from paid-in capital to share capital (2022 - 1.4 million and $10.0 million; 2021 - 1.1 million and $9.4 million). We elected to cash settle the remaining units related to the required tax withholdings (2023 - $16.7 million, 2022 - $13.4 million, ­2021 - $3.6 million).

On August 4, 2023, we filed a short form base shelf prospectus (the “Shelf Prospectus”) with securities regulatory authorities in each of the provinces and territories of Canada and a Registration Statement with the SEC. The Shelf Prospectus allows us to offer and issue shares, preferred shares, warrants, subscription receipts and units by way of one or more prospectus supplements during the 25-month period that the Shelf Prospectus remains valid.

On August 17, 2023, Enerplus renewed its NCIB to purchase up to 10% of the public float (within the meaning under Toronto Stock Exchange rules) during the following 12-month period. In July 2023, Enerplus completed its previous NCIB by repurchasing the maximum permitted of 23.1 million shares.

In 2023, 16.4 million shares were repurchased and cancelled under the NCIB at an average price of $15.71 per share, for total consideration of $258.3 million. Of the amount paid, $152.8 million was charged to share capital and $105.5 million was added to accumulated deficit. At December 31, 2023, 12.4 million shares were available for repurchase under the current NCIB.

Subsequent to December 31, 2023 and up to and including February 20, 2024, we repurchased 1.1 million shares under the NCIB at an average price of $14.34 per share, for total consideration of $16.0 million.

As of February 20, 2024, we had 203,260,372 shares outstanding. In addition, an aggregate of 3,921,539 shares may be issued to settle outstanding grants under our share award incentive plan (in the form of PSUs and RSUs), assuming the maximum payout multiplier of 2.0 times for the PSUs.

Commitments and Contingencies

We have the following minimum annual contractual commitments:

Total

Minimum Annual Commitment Each Year

Committed

($ millions)


Total


2024


2025


2026


2027


2028


after 2028

Senior notes(1)

$

122.6

$

80.6

$

21.0

$

21.0

$

$

$

Transportation commitments

416.4

72.6

73.5

74.0

61.9

37.5

96.9

Service workover rigs commitments

7.9

7.9

Operating lease obligations

28.9

13.4

8.9

3.3

1.7

0.9

0.7

Total commitments(2)


$

575.8


$

174.5


$

103.4


$

98.3


$

63.6


$

38.4


$

97.6

(1)Interest payments have not been included.
(2)Production taxes, lease rentals, mineral taxes (hydrocarbon production rights) and surface royalties have not been included as amounts paid depend on future ownership, production, prices and the legislative environment.

In the Marcellus, we have firm transportation agreements in place for approximately 64,900 Mcf/day of gross natural gas volumes, which expire between 2025 and 2036. This includes an agreement for firm pipeline capacity on the Tennessee Gas Pipeline from our Marcellus producing region to downstream connections for 30,000 Mcf/day of gross natural gas volumes until mid-2027, reducing to 15,000 Mcf/day for an additional nine years, with a total estimated transportation commitment of $55.8 million through 2036. In the Bakken region, we hold firm pipeline capacity to transport a portion of our crude oil production to the U.S. Gulf Coast, which expires between 2029 and 2031.

We have firm commitments in place for the operation of service workover rigs for $7.9 million for 2024.

ENERPLUS 2023 FINANCIAL SUMMARY             21


THREE YEAR SUMMARY OF KEY MEASURES

($ millions, except per share amounts)

2023


2022


2021

Crude oil and natural gas sales

$

1,663.0

$

2,353.4

$

1,482.6

Net income/(loss)

456.1

914.3

234.4

Per share (Basic)

2.16

3.91

0.93

Per share (Diluted)

2.09

3.77

0.90

Adjusted net income(1)

477.6

707.1

315.7

Cash flow from operating activities

938.2

1,173.4

604.8

Adjusted funds flow(1)

961.2

1,230.3

712.4

Dividends(2)

48.6

41.6

30.5

Per share (Basic)(2)

0.230

0.181

0.121

Total assets

2,068.5

1,938.0

1,990.1

Total debt

186.0

259.5

701.8

Net debt(1)

119.3

221.5

640.4

Total non-current financial liabilities

362.8

358.2

759.3

(1)This financial measure is a non-GAAP financial measure. See “Non-GAAP and Other Financial Measures” section in this MD&A.
(2)Calculated based on dividends paid and/or payable.

2023 versus 2022

Crude oil and natural gas sales were $1,663.0 million in 2023 compared to $2,353.4 million in 2022. We reported net income of $456.1 million in 2023 compared to net income of $914.3 million in 2022. The decreases were due to lower realized commodity prices and lower Marcellus production in 2023. The decrease in net income was further impacted by a $151.9 million gain on the sale of substantially all of our Canadian assets recorded in 2022, partially offset by commodity derivative instrument gains in 2023.

Cash flow from operating activities and adjusted funds flow1 decreased to $938.2 million and $961.2 million, respectively, in 2023 from $1,173.4 million and $1,230.3 million in 2022. The decrease was primarily due to lower realized commodity prices, partially offset by realized commodity derivative gains.

2022 versus 2021

Crude oil and natural gas sales were $2,353.4 million in 2022 compared to $1,482.6 million in 2021. We reported net income of $914.3 million in 2022 compared to a net income of $234.4 million in 2021. The increases were due to higher realized commodity prices and increased production from the acquisitions in North Dakota completed during the first half of 2021, increased completions activity in North Dakota and the Marcellus, and the gain on the sale of Canadian assets.

Cash flow from operating activities and adjusted funds flow1 increased to $1,173.4 million and $1,230.3 million, respectively, in 2022 from $604.8 million and $712.4 million in 2021. The increase was primarily the result of a $870.8 million increase in crude oil and natural gas sales due to higher realized commodity prices and higher production.

1 This financial measure is a non-GAAP financial measure. See “Non-GAAP and Other Financial Measures” section in this MD&A.

22             ENERPLUS 2023 FINANCIAL SUMMARY


QUARTERLY FINANCIAL INFORMATION

Crude Oil and

Net

Net Income/(Loss) Per Share

($ millions, except per share amounts)


Natural Gas Sales


Income/(Loss)


Basic


Diluted

2023


Fourth Quarter


$

437.1

$

116.7

$

0.57

$

0.55

Third Quarter

461.8

127.7

0.61

0.59

Second Quarter

350.9

74.2

0.35

0.34

First Quarter

413.2

137.5

0.63

0.62

Total 2023


$

1,663.0


$

456.1


$

2.16


$

2.09

2022

Fourth Quarter


$

548.7

$

330.7

$

1.49

$

1.43

Third Quarter

663.5

305.9

1.32

1.28

Second Quarter

628.0

244.4

1.01

0.99

First Quarter

513.2

33.2

0.14

0.13

Total 2022


$

2,353.4


$

914.3


$

3.91


$

3.77

During 2023, crude oil and natural gas sales decreased due to weaker realized pricing. Net income decreased during the first quarter of 2023 primarily due to the gain on the Canadian asset divestments recorded in the fourth quarter of 2022. Net income decreased during the second quarter of 2023 due to lower commodity prices, production and commodity derivative instrument gains. Net income increased during the third quarter of 2023 due to higher commodity prices and production. During the fourth quarter of 2023, net income decreased primarily due to lower realized crude oil and natural gas liquids commodity prices, partially offset by commodity derivative instrument gains.

During 2022, crude oil and natural gas sales increased due to higher production and improved realized pricing. Net income decreased during the first quarter of 2022 due to a $206.8 million loss recorded on commodity derivative instruments as a result of higher commodity prices. Net income increased during the second quarter of 2022 due to a smaller loss recorded on commodity derivative instruments. During the second half of 2022, net income increased due to a commodity derivative instruments gain and a $151.9 million gain on the sale of the Canadian assets in the fourth quarter of 2022.

ENERPLUS 2023 FINANCIAL SUMMARY             23


ENVIRONMENTAL, SOCIAL AND GOVERNANCE

Enerplus believes that minimizing the environmental impacts of its operations is a foundational tenet of corporate responsibility. Moreover, as the global economy transitions to a lower carbon future, climate related policies and regulations around carbon emissions are becoming increasingly stringent, requiring businesses to adapt to support long-term business resilience. We intend to continue to improve energy efficiencies and proactively manage our environmental impact in compliance with applicable government regulations, including regulations enacted at the provincial, state and federal jurisdictions in which we operate.  


Our Board of Directors is responsible for overseeing our Environmental, Social and Governance related risks and initiatives. Specific accountability for our five key focus areas have been mapped to the relevant Board committees, including the Compensation and Human Resources Committee, and the Reserves, Safety and Social Responsibility Committee (the “RS&SR Committee”). The five key focus areas are:  


Emissions Management 
Water Management 
Culture 
Community Engagement 
Health and Safety 


As part of our continued integration of our key focus areas into our business strategy and operations, in 2023 we updated our emissions and methane related targets based upon better than anticipated performance. We are targeting a Scope 1 emissions intensity of 7.0 kg CO2e/BOE by 2030, representing a 60% reduction from 2023. Additionally, we are targeting a combined Scope 1 and Scope 2 greenhouse gas emissions intensity of 13.0 kg CO2e/BOE by 2030, representing a 30% reduction from 2023. Finally, we are targeting a methane emissions intensity of 0.02 kg CH4/BOE by 2030, representing a 45% reduction from 2023. Based upon preliminary estimates, we reduced our Scope 1 and Scope 2 emissions by 40% in 2023 relative to our previous 2021 baseline and reduced our methane emissions by 45% in 2023 relative to our previous 2021 baseline.  


We set a Health & Safety target of reducing our Lost Time Injury Frequency (“LTIF”) by 25%, on average, from 2020 to 2023, relative to a 2019 baseline. In 2023, we reported an LTIF of 0.04 injuries per 200,000 worker hours, down from 0.24 in 2019. We have successfully achieved and exceeded our LTIF reduction target. 


We have a Health & Safety Policy and an Environmental, Social and Governance Policy which articulate our commitment to health and safety, community engagement, environmental and regulatory compliance, and social and governance practices. Our Board of Directors and President & Chief Executive Officer are ultimately accountable for overseeing compliance with these policies.  


The RS&SR Committee of our Board of Directors is responsible for overseeing our health and safety performance and safety and social responsibility risks. The Board of Directors are responsible for overseeing our Environmental, Social, and Governance performance, risks and strategy. We believe that this governance structure promotes adequate systems in place to support ongoing compliance, and to plan the Company’s activities in a safe, socially responsible and sustainable manner.   


The RS&SR Committee regularly reviews health, safety, environmental and regulatory updates, and risks. At present, we believe we are, and expect to continue to be, in compliance with all material applicable environmental laws and regulations and we have included appropriate amounts in our capital expenditure budget to continue to meet our ongoing environmental obligations. However, increased capital and operating costs may be incurred if regulations impose more stringent compliance requirements.  


Annually, we publish an Environmental, Social and Governance Report (the “Report”) in accordance with the Sustainability Accounting Standards Boards (“SASB”) Oil and Gas – Exploration and Production Standard materiality map, the Global Reporting Initiative (“GRI”) 11 – Oil & Gas Sector 2021 Standards, and the International Petroleum Industry Environmental Conservation Association’s (“IPIECA”) “Oil and gas industry guidance on voluntary sustainability reporting” (a joint publication with the American Petroleum Institute and the International Association of Oil & Gas Producers). Additionally, in conjunction with our Report, we publish a Reporting Table based on recommendations of the Task Force on Climate Related Financial Disclosure (“TCFD”). The Report summarizes our approach to and performance related to environmental, safety, social responsibility and governance performance, and can be found on our website at www.enerplus.com. In 2023, Enerplus underwent an external limited assurance audit of selected Environmental, Social and Governance metrics representing our public targets. Enerplus received Limited Assurance on absolute Scope 1 and Scope 2 emissions, Scope 1 and Scope 2 emissions intensities, produced water inclusion in completions activities, and LTIF. In 2023, we published metrics in line with the American Exploration and Production Council (“AXPC”) Environmental, Social and Governance Framework, which can also be found on our website.    

24             ENERPLUS 2023 FINANCIAL SUMMARY


CRITICAL ACCOUNTING ESTIMATES

The preparation of financial statements in accordance with U.S. GAAP requires management to make certain critical accounting estimates, which involve complexity, uncertainty, and professional judgment. Due to the timing of when activities occur compared to the reporting of those activities, management must estimate and accrue operating results and capital expenditures. Changes in these estimates could have a material impact on our financial results and financial condition.

Enerplus follows the full cost method of accounting for crude oil and natural gas properties. The process of estimating reserves is critical in determining several accounting estimates including the Company’s depletion and impairment of property, plant and equipment. The estimation of crude oil and natural gas reserves and the related present value of future cash flows involves the use of independent reservoir engineering specialists and numerous estimates and assumptions that involve uncertainty and complexity, including forecasted production volumes, operating costs, and capital costs. Estimating reserves requires significant judgments based on available geological, geophysical, engineering and economic data. These estimates may change substantially as data from ongoing development and production activities becomes available, and as economic conditions impacting oil and natural gas prices, operating costs and royalty burdens change. Revisions or changes in reserves estimates can have either a positive or a negative impact on net income.

RISK FACTORS AND RISK MANAGEMENT  

Failure to Satisfy Condition Precedents of the Arrangement Agreement

The completion of the Arrangement is subject to a number of conditions precedents, certain of which are outside the control of the Company, including obtaining the requisite approvals from the Enerplus and Chord shareholders and the Court of King's Bench of Alberta, the listing of Chord's stock on NASDAQ and regulatory clearances or approvals. There is no certainty, nor can Enerplus provide any assurance, that these conditions will be satisfied or, if satisfied, when they will be satisfied. A substantial delay in obtaining satisfactory approvals or the imposition of unfavourable terms or conditions by a governmental entity or regulator may adversely affect the business, financial condition or results of operations of Enerplus or the combined company following the completion of the Arrangement. If for any reason the Arrangement is not completed, or is materially delayed, the market price of the common shares of Enerplus and/or the shares of Chord common stock may be adversely affected. If the Arrangement Agreement is terminated and the Arrangement is not completed, there is no assurance that the Company will be able to complete a similar transaction.

Even if all approvals, orders and consents are obtained and conditions precedent to the completion of the Arrangement are satisfied, no assurance can be made as to the terms, conditions and timing of such approvals, orders and consents. These approvals, orders and consents may impose conditions on or require divestitures relating to the divisions, operations or assets of Enerplus and/or Chord or may impose requirements, limitations or costs or place restrictions on the conduct of Enerplus' or Chord's respective businesses, and if such approvals, orders or consents require an extended period of time to be obtained, such extended period of time could increase the chance that an adverse event occurs with respect to Enerplus or Chord. Such extended period of time may also increase the chance that other adverse effects with respect to Enerplus and/or Chord could occur, such as the loss of key personnel. Each party's obligation to complete the Arrangement is also subject to the accuracy of the representations and warranties of the other party (subject to certain qualifications and exceptions) and the performance in all material respects of the other party's covenants under the Arrangement Agreement. As a result of these conditions, the parties cannot provide assurance that the Arrangement will be completed on the terms or timeline contemplated in the Arrangement Agreement, or at all.

Failure to Realize Anticipated Benefits of the Arrangement

Enerplus and Chord are proposing to complete the Arrangement to create a larger operator in the Williston Basin and the opportunity to realize certain anticipated benefits, including, among other things, increased scale and high-quality inventory, potential synergies and cost savings. The Arrangement is subject to normal commercial risks that such transaction may not be completed on the terms negotiated or at all. Achieving the benefits of the Arrangement depends in part on successfully consolidating functions and integrating operations, procedures and personnel in a timely and efficient manner, as well as the combined company's ability to realize the anticipated growth opportunities and synergies from integrating the respective businesses of Enerplus and Chord following completion of the Arrangement. There can be no assurance that such benefits will occur in a timely manner or at all.

ENERPLUS 2023 FINANCIAL SUMMARY             25


Commodity Price Risk

Our operating results and financial condition are dependent on the prices we receive for our crude oil, natural gas liquids, and natural gas production. These prices have fluctuated in response to a variety of factors including:

global and domestic supply and demand of crude oil, natural gas and natural gas liquids
actions taken by OPEC+ or non-OPEC+ members to set, maintain or alter production levels
the ability to export crude oil and natural gas liquids from North America, considering government or political actions or orders, regulations, taxation, and market demand
geopolitical uncertainty, including the ongoing conflicts in Ukraine and the Middle East; the risk of international hostile actions, as well as actions in the United States or Canda that could disrupt trade or other relations
global and domestic economic conditions, as well as currency fluctuations and inflation
the level of consumer demand, including demand for different qualities and types of crude oil, natural gas liquids and natural gas
the production and storage levels of global crude oil, natural gas and natural gas liquids
supply chain challenges and disruptions
weather conditions
the proximity of reserves and resources to, and capacity of, gathering and transportation facilities, and the availability of storage, refining, processing, fractionation and transportation capacity
the impact of world-wide energy conservation and decarbonization efforts, greenhouse gas reduction measures
the price and availability of alternative fuels and the impact of regulatory initiatives associated therewith
existing and proposed changes to government regulations and policy decisions, including moratoriums with respect thereto as well as volatility in the political, legal and regulatory environments ahead of, and in connection with, the upcoming U.S. presidential election
sustained pandemics or epidemics which may disrupt economies, whether local or global, and may impact supply, demand or commodity prices for crude oil, natural gas liquids or natural gas

A future decline in crude oil or natural gas prices may have a material adverse effect on our operations and cash flows, financial condition, borrowing ability, levels of reserves and resources, dividend payments and the level of capital expenditures available for the development of our crude oil and natural gas reserves or resources. Certain oil or natural gas wells may become or remain uneconomic to produce if commodity prices are low, thereby impacting our production volumes, or our desire to market our production in when market conditions are less satisfactory for Enerplus. Furthermore, we may be subject to the decisions of third-party operators or to legislative decisions by regional governments who, independently and using different economic parameters, may decide to curtail or shut-in jointly owned production or to mandate industry-wide production curtailments.

We may use financial derivative instruments and other commodity derivative mechanisms to help limit the adverse effects of crude oil, natural gas liquids, and natural gas price volatility. However, we do not have commodity contracts in place for all our production and expect there will always be a portion that remains unhedged. Furthermore, we may use financial derivative instruments that offer only limited protection within selected price ranges. To the extent price exposure is hedged, we may forego the benefits that would otherwise be experienced if commodity prices increase. At February 20, 2024, we have hedged 5,000 bbls/day of WTI crude oil exposure for first half of 2024. Refer to the “Price Risk Management” section for further details on our price risk management program.

Production Replacement Risk

Oil and natural gas reserves naturally deplete as they are produced over time. Our ability to replace production depends on our success in acquiring new land, reserves and/or resources and developing existing reserves and resources. Acquisitions of oil and gas assets will depend on our assessment of value at the time of acquisition and ability to secure the acquisitions generally through a competitive bid process.

Acquisitions and our development capital program are subject to investment guidelines, due diligence and review. Major acquisitions and our annual capital development budget are approved by the Board of Directors and where appropriate, independent reserve engineer evaluations are obtained.

Oil and Gas Reserves and Resources Risk

The value of our company is based on, among other things, the underlying value of our oil and gas reserves and resources. Geological and operational risks along with product price forecasts can affect the quantity and quality of reserves and resources and the cost of ultimately recovering those reserves and resources. Lower crude oil, natural gas liquids, and natural gas prices along with lower development capital spending associated with certain projects may increase the risk of write-downs for our oil and gas property investments. Changes in reporting methodology as well as regulatory practices can result in reserves or resources write-downs.

26             ENERPLUS 2023 FINANCIAL SUMMARY


Each year, independent reserves engineers evaluate all of our reserves volumes as well as our lands with development pending contingent resources assigned. All reserves information, including our U.S. reserves, has been prepared in accordance with Canadian NI 51-101 Standards. For U.S. GAAP accounting purposes, our proved reserves are estimated to be technically the same as our proved reserves prepared under Canadian NI 51-101 Standards and have been adjusted for the effects of SEC constant prices. Independent reserves evaluations have been conducted on 100% of the total proved plus probable net present value (discounted at 10% and using Canadian NI 51-101 Standards) of our reserves at December 31, 2023. McDaniel & Associates Consultants Ltd. (“McDaniel”) evaluated 100% of the reserves associated with our U.S. tight oil assets. Netherland, Sewell & Associates, Inc. (“NSAI”) evaluated 100% of our U.S. Marcellus shale gas assets.

Anticipated Benefits of Acquisitions or Divestments

We are permitted under the Arrangement Agreement to pursue certain acquisitions and divestments. As a result, from time to time, we may acquire additional crude oil and natural gas properties and related assets. Achieving the anticipated benefits of such acquisitions will depend in part on successfully consolidating functions and integrating operations, procedures, and personnel in a timely and efficient manner, as well as our ability to realize the anticipated growth opportunities from combining and integrating the acquired assets and properties into our existing business. These activities will require the dedication of substantial management effort, time, capital, and other resources, which may divert management's focus, capital and other resources from other strategic opportunities and operational matters during this process. The risk factors specified in this MD&A relating to the crude oil and natural gas business and our operations, reserves and resources apply equally to future properties or assets that we may acquire. We conduct due diligence in connection with acquisitions, but there is no assurance that we will identify all the potential risks and liabilities related to such properties.

When acquiring assets, we are subject to inherent risks associated with predicting the future performance of those assets. We may make certain estimates and assumptions respecting the characteristics of the assets we acquire, that may not be realized over time. As such, assets acquired may not possess the value we attribute to them, which could adversely impact our future cash flows. To the extent that we make acquisitions with higher growth potential, the higher risks often associated may result in increased chances that actual results may vary from our initial estimates. An initial assessment of an acquisition may be based on a report by engineers or firms of engineers that have different evaluation methods, approaches, and assumptions than those of our engineers, and these initial assessments may differ significantly from our subsequent assessments. There is also no assurance that the acquired assets will be viewed favourably by our investors and could result in a negative effect to the price of our shares.

Certain acquisitions, and in particular acquisitions of higher risk/higher growth assets and the development of those acquired assets, may require capital expenditures and we may not receive cash flow from operating activities from these acquisitions for several years, or in amounts less than anticipated. Accordingly, the timing and amount of capital expenditures may adversely affect our cash flow.

We may also seek to divest of properties and assets that are permitted under the terms of the Arrangement Agreement. These divestments may consist of non-core properties or assets, or may consist of assets or properties that are being monetized to fund debt repayments, alternative projects or development. There can be no assurance that we will be successful, that we will realize the amount of desired proceeds, or that such divestments will be viewed positively by the financial markets. Divestments may negatively affect our results of operations or the trading price of our shares. In addition, although divestments typically transfer future obligations to the buyer, we may not be exempt from certain future obligations, including abandonment, reclamation, and/or remediation if applicable, which may have an adverse effect on our operations and financial condition.

See also "Failure to Satisfy Condition Precedents of the Arrangement Agreement" and "Failure to Realize Anticipated Benefits of the Arrangement" above.

Risk of Increased Capital or Operating Costs

Higher capital or operating costs associated with our operations will directly impact our capital efficiencies and/or decrease our cash flow and/or free cash flow. Capital costs of completions, specifically the costs of steel, proppant, pumper services, and operating costs such as electricity, chemicals, supplies, processing charges, energy services and labour costs, are a few of our costs that are susceptible to material fluctuation. Although we have a portion of our current capital and operating costs protected with existing agreements, changing regulatory conditions, such as potential new or revised regulations in the U.S. requiring certain raw materials, such as steel, for use on certain projects to be sourced from the U.S., or that goods and/or services be procured from specific vendors or classes of vendors on certain projects, other supply chain challenges or disruptions and adverse effects of inflation and rising interest rates, may result in higher than expected supply costs for us. Additionally, we have certain service contracts tied to inflationary measure benchmarks (such as the Consumer Price Index and WTI crude oil price), which increase our operating costs when the benchmarks rise significantly including in the recent high-inflation environment.

ENERPLUS 2023 FINANCIAL SUMMARY             27


Access to Field Services

Our ability to drill, complete and tie-in wells in a timely manner may be impacted by our access to service providers and supplies. Service providers, including those we rely on, are also in a highly competitive environment that is impacted by worker availability, commodity prices and global supply inventories. Where worker availability is impacted by shortages, due to location or pandemic related issues, for example, some may choose or be required to streamline or discontinue their business, further reducing the supply of vendors and potentially increasing the competition for service/supplies, and thereby the costs to producers. Activity levels in each area may limit our access to these resources, restricting our ability to execute our capital plans in a timely manner. In addition, field service costs are influenced by market conditions and therefore can become cost prohibitive.

Although we have entered into service contracts for a portion of field services that will secure some of our drilling and fracturing services through 2024, access to field services and supplies in other areas of our business will continue to be subject to market availability.

Risk of Increasing Attention to Environmental, Social and Governance (“ESG”) and Sustainability Matters

Companies across all industries, but particularly in the oil and gas industry, are facing increasing scrutiny from government and stakeholders related to their ESG and sustainability practices. The societal, investor, and regulatory expectations on companies relating to ESG matters, including climate change and other environmental and social impacts are evolving, and if we fail to comply with or meet such expectations, or are perceived to have not responded appropriately, regardless of whether there is a legal requirement to do so, we may suffer from reputational damage and the business, financial condition, and/or our share price could be materially and adversely affected. Increasing attention to climate change and sustainability related matters, increasing societal expectations on companies to address climate change, including setting and achieving climate related targets, and potential consumer use of substitutes to fossil fuel energy commodities may result in increased costs, reduced demand for hydrocarbon products, reduced profits, increased investigations and litigation, negative impacts on our share price and reduced access to capital markets and cause the market to prioritize sustainability initiatives over corporate results. Increasing attention to climate change-related and sustainability targets and expected actions, for example, may result in demand shifts for hydrocarbon products and additional governmental investigations and litigation against us. To the extent that societal pressures, regulatory, or political or other factors are involved, it is possible that such liability could be imposed without regard to our causation of or contribution to the asserted damage, or to other mitigating factors. For more information, see our risk factor titled “Risks Relating to Climate Change.”

Some capital markets participants are increasingly using certain components of ESG as a factor in their assessments, which could impact our cost of capital or access to financing. There has also been an acceleration in investor demand for ESG investing opportunities, and many institutional investors have committed to increasing the percentage of their portfolios that are allocated towards ESG-focused investments. As a result, there has been a proliferation of ESG focused investment funds and market participants seeking ESG-oriented investment products. There has also been an increase in third-party providers of company ESG ratings and rankings, and an increase in ESG-focused voting policies among proxy advisory firms, portfolio managers, and institutional investors. For example, organizations that provide information to investors on corporate governance and related matters have developed ratings processes for evaluating companies on their approach to ESG matters. Currently, there are no universal standards for such ratings, rankings and voting policies, they often differ based on the provider and the data they prioritize and are continually changing. However, such ratings, rankings and voting policies may be used by some investors to inform their investment and voting decisions. Additionally, certain investors may use these ratings or rankings to benchmark companies against their peers, and if a company is perceived as lagging, these investors may engage with us to require improved ESG disclosure or performance. Moreover, certain members of the broader investment community may consider a company’s sustainability rating or ranking as a reputational or other factor in making an investment decision. Consequently, a low sustainability rating or ranking could result in exclusion of our shares from consideration by certain investment funds, engagement by investors seeking to improve such ratings or rankings and a negative perception of our operations by certain investors. Additionally, to the extent ESG matters negatively impact our reputation, it may not be able to compete as effectively to recruit or retain employees, which may adversely affect its operations. Furthermore, there has recently been backlash from certain governments and investors against ESG funds and investment practices, which has resulted in increased scrutiny and withdrawals from such funds. Such backlash has also resulted in “anti-ESG” focused activism and investment funds, which may result in additional strains on our resources. If Enerplus is unable to meet the often conflicting ESG standards or investment, lending, ratings, or voting criteria and policies set by these parties, it may lose investors, investors may choose not to allocate a portion of their capital to us, it may face increased ESG- or anti-ESG-focused activism, its cost of capital may increase, and its reputation may also be negatively affected.

28             ENERPLUS 2023 FINANCIAL SUMMARY


We also make certain disclosures regarding sustainability from time to time, including publishing an ESG report that provides updates on its performance related to certain ESG topics and discloses certain ESG goals. Many of our disclosures are necessarily based on estimates and assumptions that are inherently difficult to assess and may or may not be representative of current or actual risks or events or forecasts of expected risks or events, including the costs associated therewith. Mandatory ESG-related disclosure is also emerging as an area where we may be, or may become, subject to required disclosures in certain jurisdictions, and any such mandatory disclosures may similarly necessitate the use of hypothetical, projected or estimated data, some of which is not controlled by Enerplus and is inherently subject to imprecision. Disclosures reliant upon such expectations and assumptions are necessarily uncertain and may be prone to error or subject to misinterpretation given the long timelines involved and the lack of an established single approach to identifying, measuring and reporting on many ESG matters. Moreover, Enerplus may not be able to adequately identify ESG-related risks and opportunities and, further, may not be able to meet ESG targets in the manner, or on such a timeline as initially contemplated, including as a result of unforeseen costs, consequences or technical difficulties associated with achieving such results. While we may elect to seek out various additional voluntary ESG targets now or in the future, such targets are generally aspirational. Notwithstanding this, Enerplus may receive pressure from investors, lenders, or other groups to adopt more aggressive climate or other ESG-related goals or policies, but it cannot guarantee it will be able to set or implement such goals or policies because of potential costs or technical or operational obstacles. In addition, we could be criticized by various anti-ESG stakeholders for the scope of Enerplus’ climate or ESG-related goals or policies, its strategic choices regarding ESG matters as they may impact its operations now or in the future, or for any revisions to the same, as well as initiatives that it may pursue or any public statements it may make. We could be subjected to negative responses by governmental actors (such as anti-ESG legislation or retaliatory legislative or administrative treatment) or consumers (such as boycotts or negative publicity campaigns), which could adversely affect its reputation, business, financial performance, market access and growth.

Furthermore, our reputation, as well as its stakeholder relationships, could be adversely impacted as a result of, among other things, any failure to meet its ESG plans or goals or stakeholder perceptions of statements made by Enerplus, its employees and executives, agents or other third parties, or public pressure from investors or policy groups to change its policies. Public statements with respect to ESG matters, including greenhouse gas (“GHG”) emissions reduction goals, environmental targets, or, more broadly, ESG-related goals, are becoming increasingly subject to heightened scrutiny from public and governmental authorities with respect to the risk of potential “greenwashing,” i.e., misleading information or false claims overstating potential ESG benefits. Both the SEC and the Canadian securities regulators have been monitoring issuers’ disclosures relating to various ESG-related matters and have published public guidance stating their concerns with certain practices involving unsupported claims that may constitute greenwashing. Certain non-governmental organizations and other private actors have filed lawsuits under various securities and consumer protection laws alleging that certain ESG-statements, including emissions reduction goals or standards used, were misleading, false, or otherwise deceptive. As a result, we may face increased litigation risks from private parties and governmental authorities related to it ESG efforts which could, in turn, lead to further negative sentiment and diversion of investments. Enerplus could also face increasing costs to comply with increased regulatory focus and scrutiny. To the extent that we are unable to respond timely and appropriately to any negative publicity, our reputation could be harmed. Damage to our overall reputation could have a negative impact on financial results and require additional resources to rebuild our reputation. In addition, to the extent alternative technologies are preferred, whether as a result of regulatory impacts, technological developments, or changes in industry practice, it may adversely impact Enerplus’ business or results of operation.

Trading Price of the Common Shares

The market price of the common shares of Enerplus (the "Common Shares") is primarily a function of the value of the properties owned by the Company, as well as the ability to grow or sustain production levels, cash flow and returns to shareholders, including dividends paid. The market price of the Common Shares is also sensitive to a variety of market-based factors, including, but not limited to, an increase in passive investing (through vehicles such as exchange traded funds) and options trading, high frequency trading, the inclusion or removal of the Common Shares from one or more stock market indexes or exchange traded funds, interest rates, and the comparability of the Company’s performance to other growth or yield-oriented exploration and production companies. Additionally, the Common Shares may, from time to time, not meet the investment criteria or characteristics of a particular institutional or other investor, including institutional investors who are not willing or able to hold securities of oil and gas companies for reasons unrelated to financial or operational performance. Any changes in market-based factors or investor strategies, including ESG, or responsible investing criteria/rankings (for example, ESG, social impact or environmental scores), the implementation of new financial market regulations and fossil fuel divestment initiatives undertaken by governments, pension funds and/or other institutional investors, may adversely affect the trading price of the Common Shares, and/or their inclusion in the portfolios of investment managers. In addition, should the trading price of the Common Shares fall below stock exchange listing thresholds, the exchanges will review the appropriateness of the Common Shares for continued listing on such exchanges.

In addition, the exchange ratio under the Arrangement is fixed and, other than in limited circumstances, will not be adjusted for changes in the market price of either of either Enerplus Common Shares or the shares of Chord common stock. Changes in the price of shares of Chord common stock prior to the completion of the Arrangement will affect the market value that Enerplus shareholders will be entitled to receive upon closing. Neither Enerplus nor Chord is permitted to terminate the Arrangement Agreement or resolicit the vote of the respective shareholders, solely because of changes in the market price of either corporation's shares.

ENERPLUS 2023 FINANCIAL SUMMARY             29


Regulatory Risk and Greenhouse Gas Emissions

Government royalties, environmental laws and regulatory requirements can have a significant financial and operational impact on us. As an oil and gas producer, we operate under federal, provincial, state, tribal and municipal legislation and regulation that govern such matters as royalties, land tenure, prices, production rates, various environmental protection controls, well and facility design and operation, income taxes, the gathering, transportation and the exportation of crude oil, natural gas and other products. We may be required to apply for regulatory approvals in the ordinary course of business. To the extent that we fail to comply with applicable government regulations or regulatory approvals, we may be subject to compliance and enforcement actions that are either remedial or punitive to deter future noncompliance. Such actions include penalties, fines or fees, notices of noncompliance, warnings, orders, curtailment, administrative sanctions and prosecution.

Government regulations may be changed from time to time in response to economic, political or socioeconomic conditions, including the election of new state, provincial or federal leaders. Additionally, our entry into new jurisdictions or adoption of new technology may attract additional regulatory oversight which could result in higher costs or require changes to proposed operations. U.S. federal and state governments continue to scrutinize emissions, as well as the usage and disposal of chemicals and water used in fracturing procedures in the oil and gas industry; certain states have called for bans on oil and gas drilling using hydraulic fracturing and the new United States government has taken certain actions towards fulfilling its initiative of curtailing hydraulic fracturing of federal lands. Additionally, various levels of governments are considering or have implemented legislation to reduce emissions of greenhouse gases, including volatile organic compounds (“VOC”) and methane gas emissions.

The exercise of discretion by governmental authorities under existing regulations, the implementation of new regulations or the modification of existing regulations could negatively impact the development of crude oil and natural gas properties and assets, reduce demand for crude oil and natural gas or impose increased costs on oil and gas companies including taxes, fees or other penalties.

Although we have no control over these regulatory risks, we continuously monitor changes in these areas by participating in industry organizations, conferences, exchanging information with third party experts and employing qualified individuals to assess the impact of such changes on our financial and operating results. Accordingly, while we continue to prepare to meet the potential requirements at each of the provincial, state, federal, tribal and municipal levels, the actual cost impact and its materiality to our business remains uncertain.

Changes in Income Tax and Other Laws

Income tax, other laws, or government incentive programs relating to the oil and gas industry may change in a manner that adversely affects us or our security holders. Canadian and U.S. tax authorities may change or interpret applicable tax laws, tax treaties or administrative positions differently than we do or may disagree with how we calculate our income for tax purposes in a manner which is detrimental to us and our security holders.

We monitor developments with respect to pending legal changes and work with the industry and professional groups to ensure that our concerns with any changes are made known to various government agencies. We obtain confirmation from independent legal counsel and advisors with respect to the interpretation and reporting of material transactions.

Risks Relating to Climate Change

Enerplus is subject to climate change related risks which are generally grouped into two categories: physical risks and transition risks. Physical risks include the impact that a change in climate could have on our operations, facilities and infrastructure, including limited water availability, severe weather causing flooding, prolonged drought and/or wildfires. These events may increase the cost of water, energy, insurance or capital projects, impacting our profitability. The physical risks of climate change may also result in operational delays, depending on the nature of the event. Enerplus does not believe that its current or near-term operations expose it to any particular physical risks which differ from those facing a typical North American onshore oil and gas producer, and currently cannot predict or quantify the potential financial impact of any such risks.

Transition risk is broader and relates to the consequences of a global transition to reduced carbon economy, including the risk of regulatory and policy change and reputational concerns. The global push to meet net zero emission targets by 2050 increases the risk of potentially burdensome regulatory and/or policy changes from governments, some of which could have a direct, negative impact on Enerplus should they impede access or negatively impact our relationship with our stakeholders, debt holders, insurers, and the investment community or various service providers. In addition, as a result of these regulations and policies, Enerplus could also have stranded assets, for example, be unable to obtain value for, or from, its reserves.

30             ENERPLUS 2023 FINANCIAL SUMMARY


More specific concerns of the fossil fuels, for the industry relate to GHG emissions, including methane, as well as water and land use. More stringent legislation or regulations in the United States, relative to other jurisdictions, including requirements to make certain climate change related disclosure and/or significantly reduce GHG emissions, water consumption or setback requirements for facilities and wells, could result in increased costs and competitive disadvantages. In addition, a potential increase in capital expenditures, operating expenses, abandonment and reclamation obligations or the loss of operating licenses, any of which may not be recoverable in the marketplace, could result in operations or growth projects becoming less profitable, uneconomic, or result in our inability to continue development of assets.

There is also a risk that financial institutions will adopt, or be pressured, or be required to adopt policies that have the effect of reducing the funding provided to the fossil fuel sector; for instance, both the Bank of Canada and the Federal Reserve of the United States have joined the Network for Greening the Financial System, a consortium of financial regulators focused on addressing climate related risks in the financial sector. As a result of new initiatives, we could be required to adopt new technologies, and make a significant investment in capital resources. These initiatives could also result in additional costs if climate related targets are not achieved, therefore negatively impacting our results and economics. The Canadian securities regulators and the SEC have separately released proposed rules that would establish a framework for the reporting of climate risks, targets, and metrics. Although the final form and substance of these rules and their requirements are not yet known, and the ultimate impact on us is uncertain, the proposed rules, if finalized, may result in increased compliance costs and increased costs of and restrictions on access to capital.

There is also a reputational risk associated with climate change, which considers the public perception of Enerplus’ role in the transition to a low carbon economy. We seek to mitigate this risk through a strong ESG program with five key focus areas which are overseen by our Board of Directors and applicable Board committees. Our strategy is to be a responsible operator from the perspective of our shareholders, employees, contractors, regulators, lenders, communities and the general public. Despite these efforts, activities undertaken directly by Enerplus or its employees in operating its business, or by others in industry, could adversely affect Enerplus’ reputation. If our reputation, or the oil and gas industry in general, is diminished, it could result in: the loss of employees or revenue; harm to our ability to recruit or retain employees; delays in regulatory approvals; increased operating, capital, financing and regulatory costs; reduced shareholder confidence and negative stock price movement; negative relationships with Indian Reservations and Indigenous groups; or a loss of public support in general.

Access to Transportation and Processing Capacity

Market access for crude oil, natural gas liquids and natural gas production in the U.S. is dependent on our ability, and the ability of our buyers as applicable, to obtain transportation capacity on third party pipelines and rail as well as access to processing facilities. As production increases in the regions where we operate, it is possible production may exceed the existing capacity of the gathering, pipeline, processing or rail infrastructure. While third party pipelines, processors and independent rail operators generally expand capacity to meet market needs, there can be differences in timing between the growth of production and the growth of capacity. There are occasionally operational reasons for curtailing transportation and processing capacity. Accordingly, there can be periods where transportation and processing capacity is insufficient to accommodate all the production from a given region, causing added expense and/or volume curtailments for all shippers. Our assets are concentrated in specific regions where government or other third parties could limit or ban the shipping of commodities by truck, pipeline or rail. Special interest groups and/or social instability could also prevent access to leased land or continue their opposition to infrastructure development, at either the regulatory or judicial level, including the ongoing matters with respect to DAPL, resulting in operational delays, or even the cancellation of construction of the required infrastructure, or the shutdown of already operating infrastructure projects, further impeding our ability to operate, produce and market our products. Additionally, the transportation of crude oil by rail has been under closer scrutiny by government regulatory agencies the U.S. over the past few years. As a result, transporting crude oil by rail may carry a higher cost versus traditional pipeline infrastructure or other means of transporting production.

We monitor this risk for both the short and longer term through dialogue and review with the third-party pipelines and other market participants. Where available and commercially appropriate, given the production profile and commodity, we attempt to mitigate transportation and processing risk by contracting for firm pipeline or processing capacity or using other means of transportation, including trucking or selling to third parties that have access to pipeline or rail capacity.

Risk of Curtailed or Shut-in Production

Should we be required to curtail or shut-in production as a result of environmental regulation, government regulation, third-party operational practices, or low commodity prices, it could result in a reduction to cash flow and production levels and may result in additional operating and capital costs for the well to achieve prior production levels. In addition, curtailments or shut-ins may cause damage to the reservoir and may prevent us from achieving production and operating levels that were in place prior to the curtailment or shutting-in of the reservoir. Combined with the ongoing volatility in commodity prices, any shortage in pipeline infrastructure in producing regions where we operate may result in discounted prices and an ongoing risk of price-related production curtailments.

ENERPLUS 2023 FINANCIAL SUMMARY             31


The evaluation of best estimate development pending contingent resources associated with our North Dakota assets was conducted by McDaniel. NSAI evaluated our Marcellus shale gas best estimate development pending contingent resources. The RS&SR Committee of the Board of Directors and the Board of Directors have reviewed and approved the reserves and resources reports of the independent evaluators.

Geopolitical Risks

Existing or future conflicts in major oil and gas producing nations and the international response may have potential wide-ranging consequences for global market volatility and economic conditions, including affecting crude oil and natural gas prices. Financial and trade sanctions that may be imposed against countries involved in such conflicts may have continued far-reaching effects on the global economy, energy and commodity prices. The short-, medium- and long-term implications of any such conflicts is difficult to predict with any degree of certainty. Depending on the extent, duration, and severity of such conflict(s), it may have the effect of heightening many of the other risks described in this MD&A and the Annual Information Form, including, without limitation, risks relating to global market volatility and economic conditions; cybersecurity threats; crude oil and natural gas prices; inflationary pressures, interest rates and costs of capital; and supply chains and cost-effective and timely transportation.

Cybersecurity Risks

We are subject to a variety of information technology and system risks as part of our normal course operations, including potential breakdown, invasion, virus, cyber-attack, cyber-fraud, cloud related threats and attacks on connected devices, business and email takeovers, security breach (including from a third party provider), ransomware and destruction or interruption of our information or operational technology systems by third parties (including software supply chain companies) or insiders. Technologies are often employed to assist, augment, automate or provide autonomous intelligence, which results in reduced reliance on human intervention and/or decision-making. Information technology ("IT"), operational technology (“OT”) and cyber risks, including cyberattacks, data breaches, cyber extortion and similar compromises, are significant risks due to our reliance on the internet to conduct day-to-day business activities, its technological infrastructure, and its use of third-party service providers. Additionally, use of personal devices by employees, vendors or other third parties can create further avenues for potential cyber-related incidents, as we have limited control over the use and safety of these devices. Our IT, OT and infrastructure, including process control systems, may be vulnerable to attacks by malicious persons or entities motivated by, among other things, geopolitical, financial or activist reasons, or may be breached due to employee error or malfeasance, or otherwise vulnerable due to other disruptions, including natural disasters and acts of war. Although we work to manage our exposure to these risks, we may not be able to fully prevent events resulting in business interruptions, service disruptions, financial loss, theft of intellectual property and confidential information, litigation, enhanced regulatory attention and penalties, as well as reputational damage which would have an adverse effect and, therefore, may increase our risk of financial or reputational loss; any damages sustained may not be adequately covered by our current insurance coverage, or at all.

IT, OT and cyber risks have increased recently, including as a result of cybercriminals taking advantage of remote working environments to increase malicious activities, creating more threats for cyberattacks. These include phishing emails, malware-embedded mobile apps and targeting of vulnerabilities in remote access platforms. In addition, as a general matter, the frequency and magnitude of cyberattacks is increasing and attackers have become more sophisticated. Cyberattacks are similarly evolving and include without limitation use of malicious software, surveillance, credential stuffing, spear phishing, social engineering, use of deepfakes (i.e., highly realistic synthetic media generated by artificial intelligence), attempts to gain unauthorized access to data, and other electronic security breaches that could lead to disruptions in critical systems, unauthorized release of confidential or otherwise protected information and corruption of data. We may be unable to anticipate, detect or prevent future attacks, particularly as the methodologies used by attackers change frequently or are not recognizable until deployed. We may also be unable to investigate or remediate incidents as attackers are increasingly using techniques and tools designed to circumvent controls, to avoid detection, and to remove or obfuscate forensic evidence.

Although we have security measures and controls in place that are designed to mitigate these risks, the growing use of the digital space could increase technopolitical risks (e.g., by monitoring/intercepting phones and communications, or surveilling or locating persons of interest) further increasing the risk of a breach of our security, which could result in a loss of material and confidential information and/or have a negative impact on our reputation, result in a breach of privacy laws, and/or disrupt business activities. Furthermore, the adoption of emerging technologies, such as cloud computing, artificial intelligence and robotics, call for continued focus and investment to manage risks effectively. Not managing this risk effectively may have an adverse effect and, therefore, may increase the risk of financial or reputational loss. In addition, third-party operators on whom we depend, and the operations of our customers and business partners are also subject to such risks.

Any such attack, breach, access, disclosure or loss of information could also result in legal claims or proceedings, liability under laws that protect the privacy of personal information, regulatory penalties, remediation costs, disruptions to our operations, decreased performance and production, an inability to settle transactions, misdirected wire transfers, reputational damage, increased costs, physical harm to people or the environment or other negative consequences. The significance of any such event is difficult to quantify but may be material in certain circumstances and could have a material effect on our business, financial condition and results of operations.
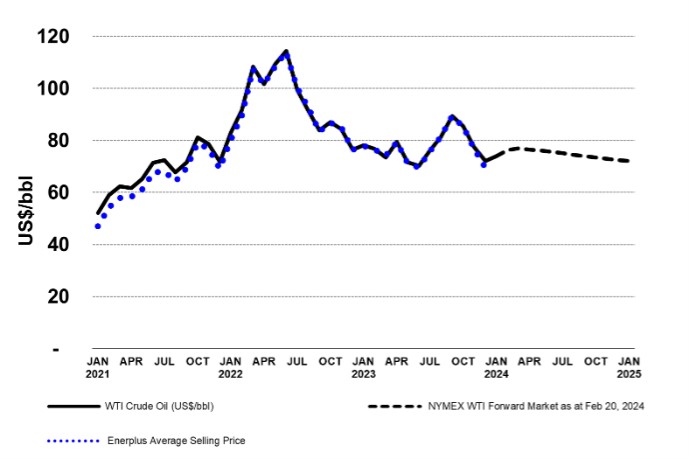
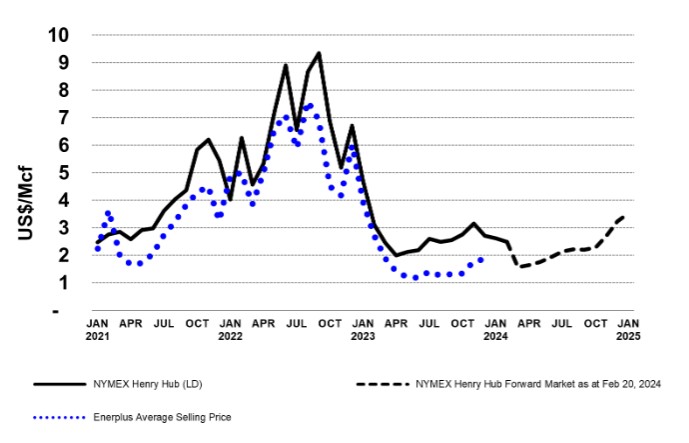
32             ENERPLUS 2023 FINANCIAL SUMMARY


Risk of Exceeding Debt Covenants

Declines or continued volatility in crude oil and natural gas prices may result in a significant reduction in earnings or cash flow, which could lead us to increase amounts drawn under our Bank Credit Facilities in order to carry out our operations and fulfill our obligations. Significant reductions to cash flow, significant increases in drawn amounts under the Bank Credit Facilities, or significant reductions to proved reserves may result in us breaching our debt covenants under the Bank Credit Facilities and senior notes. If a breach occurs, there is a risk that we may not be able to negotiate covenant relief with one or more of our lenders under the Bank Credit Facilities or senior notes. Failure to comply with debt covenants, or negotiate relief, may result in our indebtedness under the Bank Credit Facilities or senior notes becoming immediately due and payable, which may have a material adverse effect on our operations and financial condition.

Risk of Insufficient Liquidity

Although we believe that our existing Bank Credit Facilities and senior notes are sufficient, there can be no assurance that the current amount will continue to be available, or will be adequate for our financial obligations, or that additional funds can be obtained as required or on terms which are economically advantageous to Enerplus. The amounts available under the Bank Credit Facilities and senior notes may not be sufficient for future operations, or we may not be able to renew our Bank Credit Facilities or obtain additional financing on attractive economic terms, if at all. The Bank Credit Facilities are generally extendable each year with a bullet payment required at the end of the term if the facility is not renewed. We renewed the Bank Credit Facilities in 2022, incorporating ESG-linked incentive pricing terms, and if the sustainability performance targets are not met, may result in higher future borrowing costs. The $365 million Bank Credit Facility currently expires on October 31, 2025; $50 million and $850 million of the $900 million Bank Credit Facility expires on October 31, 2025 and October 31, 2026, respectively. There can be no assurance that such a renewal will be available on favourable terms or that all of the current lenders under the facility will participate or renew at their current commitment levels. If this occurs, we may need to obtain alternate financing. Any failure of a member of the lending syndicate to fund its obligations under the Bank Credit Facilities or to renew its commitment in respect of such Bank Credit Facilities, or failure by Enerplus to obtain replacement financing or financing on favourable terms, may have a material adverse effect on our business and operations. In addition, dividends to shareholders may be eliminated, as repayment of debt under the Bank Credit Facilities and senior notes has priority over dividend payments to our shareholders.

Title Defects or Litigation

Unforeseen title defects or litigation may result in a loss of entitlement to production, reserves and resources. Although we conduct title reviews prior to the purchase of assets these reviews do not guarantee that an unforeseen defect in the chain of title will not arise. We maintain good working relationships with our industry partners; however, disputes may arise from time to time with respect to ownership of rights of certain properties or resources.

Risk of Impairment of Oil and Gas Properties and Deferred Tax Assets

Under U.S. GAAP, the net capitalized cost of crude oil and natural gas properties, net of deferred income taxes, is limited to the present value of after-tax future net revenue from proved reserves, discounted at 10%, and based on the unweighted average of the closing prices for the applicable commodity on the first day of the twelve months preceding the issuer’s reporting date. The amount by which the net capitalized costs exceed the discounted value will be charged to net income.

Under U.S. GAAP, the net deferred tax asset is limited to the estimate of future taxable income resulting from existing properties. We estimate future taxable income based on before-tax future net revenue from proved plus probable reserves, undiscounted, using forecast prices, and adjusted for other significant items affecting taxable income. The amount by which the gross deferred tax assets exceed the estimate of future taxable income will be charged to net income, however these amounts can be reversed in future periods if future taxable income increases.

No impairment was recorded in 2023 or 2022. We recorded an impairment of $3.4 million related to our Canadian assets in 2021. We continue to record a valuation allowance against our capital related deferred tax assets, however, no valuation allowance was recorded in 2023, 2022 or 2021 against our income related deferred tax assets. There is a risk of impairment on our oil and gas properties, and deferred tax asset if commodity prices weaken, costs increase, or if there is a downward revision to reserves. Please refer to the “PP&E Impairment” and “Income Taxes” sections of this MD&A and Notes 5 and 12 of the Financial Statements for further details.

ENERPLUS 2023 FINANCIAL SUMMARY             33


Counterparty and Joint Venture Credit Exposure

We are subject to the risk that the counterparties to our risk management contracts, marketing arrangements and operating agreements and other suppliers of products and services may default on their obligations under such agreements as a result of liquidity requirements or insolvency. Low crude oil and natural gas prices increase the risk of bad debts related to our joint venture and industry partners. A failure of our counterparties to perform their financial or operational obligations may adversely affect our operations and financial position. In addition to the usual delays in payment by purchasers of crude oil and natural gas, payments may also be delayed by, among other things: (i) capital or liquidity constraints experienced by our counterparties, including restrictions imposed by lenders; (ii) accounting delays or adjustments for prior periods; (iii) delays in the sale or delivery of products or delays in the connection of wells to a gathering system; (iv) adverse weather conditions, such as freezing temperatures, storms, flooding and premature thawing; (v) blow-outs or other accidents; or (vi) recovery by the operator of expenses incurred in the operation of the properties or the establishment by the operator of reserves for these expenses. Any of these delays could reduce the amount of our cash flow and the payment of cash dividends to our shareholders in a given period and expose us to additional third-party credit risks.

A credit review process is in place to assess and monitor our counterparties’ credit worthiness on a regular basis. This includes reviewing and ratifying our corporate credit guidelines, assessing the credit ratings of our counterparties and setting exposure limits. When warranted we attempt to obtain financial assurances such as letters of credit, parental guarantees, or third-party insurance to mitigate our counterparty risk. In addition, we monitor our receivables against a watch list of publicly traded companies that have high debt-to-cash flow ratios or fully drawn bank facilities and, where possible, take our production in kind rather than relying on third party operators. In certain instances, we may be able to aggregate all amounts owing to each other and settle with a single net amount.

See the “Liquidity and Capital Resources” section for further information.

Foreign Currency Exposure

Enerplus is exposed to foreign exchange risk as it relates to Canadian and U.S. dollars. Effective January 1, 2023, the functional currency of the parent entity changed from Canadian dollars to U.S. dollars, consistent with the functional currency of the U.S. subsidiary. This was the result of a gradual change in the primary economic environment in which the entity operates, culminating in the sale of Enerplus’ remaining Canadian operating assets at the end of 2022. Transactions denominated in foreign currencies are translated to the U.S. dollar functional currency of the entity using the exchange rate prevailing at the date of the transaction. As a result, transactions denominated in Canadian dollars will continue to be affected by the exchange rate between the U.S. and Canadian dollar, including Canadian denominated payments including but not limited to general and administrative expenses and Canadian dollar cash dividend payments.

We continue to monitor fluctuations in foreign exchange and the impact on our operations as significant fluctuations in the Canada-U.S. foreign exchange rate may adversely impact our financial results.

Access to Capital Markets

Our access to capital has allowed us to fund a portion of our acquisitions and development capital program through issuance of equity and debt in past years. Continued access to capital is dependent on our ability to optimize our existing assets and to demonstrate the advantages of the acquisition or development program that we are financing at the time, as well as investors’ view of the oil and gas industry overall. We may not be able to access the capital markets in the future on terms favorable to us, or at all. Our continued access to capital markets is dependent on corporate performance and investor perception of future performance (both corporately and for the oil and gas sector in general).

We are required to assess our foreign private issuer (“FPI”) status under U.S. securities laws on an annual basis. If we lose our FPI status, we may have restricted access to capital markets for a period of time until the required approvals are in place from the SEC.

Interest Rate Exposure

Movements in interest rates and credit markets may affect our borrowing costs and value of investments such as our shares as well as other equity investments.

Enerplus’ senior notes bear interest at fixed rates while the Bank Credit Facilities bear interest at floating rates. At December 31, 2023, approximately 66% of Enerplus’ debt was based on fixed interest rates and 34% on floating interest rates (December 31, 2022 – 78% fixed and 22% floating), with weighted average interest rates of 4.1% and 6.7%, respectively (December 31, 2022 – 4.1% and 5.7%, respectively). At December 31, 2023 and 2022, Enerplus did not have any interest rate derivatives outstanding.

34             ENERPLUS 2023 FINANCIAL SUMMARY


RECENT ACCOUNTING STANDARDS

In future accounting periods, the Company will adopt the following Accounting Standards Updates (“ASU”) issued by the Financial Accounting Standards Board (“FASB”):

In November 2023, FASB issued ASU 2023-07, Segment Reporting (Topic 280): Improvements to Reportable Segment Disclosures. The new guidance will require additional disclosure of significant segment expenses that are regularly provided to the chief operating decision maker. In addition, certain annual disclosures will also be required for interim periods, and single reportable segment entities must apply Topic 280 in its entirety. The updated guidance is effective January 1, 2024 for annual periods and January 1, 2025 for interim periods and will be applied retrospectively. Enerplus has not early adopted this ASU and does not expect a material impact on the Financial Statements.  

In December 2023, the FASB issued ASU 2023-09, Income Taxes (Topic 740): Improvements to Income Tax Disclosures. The standard provides for greater transparency of income tax disclosures by requiring disaggregation of information in the rate reconciliation by specific categories and disaggregation of income taxes paid by jurisdiction. The updated guidance is in effect for annual periods beginning January 1, 2025 and will be applied prospectively. Enerplus has not early adopted this ASU and does not expect a material impact on the Financial Statements.

NON-GAAP AND OTHER FINANCIAL MEASURES

Non-GAAP Financial Measures

This MD&A includes references to certain non-GAAP financial measures and non-GAAP ratios used by the Company to evaluate its financial performance, financial position or cash flow. Non-GAAP financial measures are financial measures disclosed by a company that: (a) depict historical or expected future financial performance, financial position or cash flow of a company; (b) with respect to their composition, exclude amounts that are included in, or include amounts that are excluded from, the composition of the most directly comparable financial measure disclosed in the primary financial statements of the company; (c) are not disclosed in the financial statements of the company; and (d) are not a ratio, fraction, percentage or similar representation. Non- GAAP ratios are financial measures disclosed by a company that are in the form of a ratio, fraction, percentage or similar representation that has a non-GAAP financial measure as one or more of its components, and that are not disclosed in the financial statements of the company.

These non-GAAP financial measures and non-GAAP ratios do not have standardized meanings or definitions as prescribed by U.S. GAAP and may not be comparable with the calculation of similar financial measures by other entities.

For each measure, we have: (a) indicated the composition of the measure; (b) identified the most directly comparable GAAP financial measure and provided comparative detail where appropriate; (c) indicated the reconciliation of the measure to the most directly comparable GAAP financial measure to the extent one exists; and (d) provided details on the usefulness of the measure for the reader. These non-GAAP financial measures and non-GAAP ratios should not be considered as a substitute for, or superior to, measures of financial performance prepared in accordance with GAAP.

“Adjusted funds flow” is used by Enerplus and is useful to investors and securities analysts in analyzing Enerplus’ ability to generate funds to repay debt, pay dividends, and fund future capital investment. The most directly comparable GAAP measure is cash flow from operating activities. Adjusted funds flow is calculated as cash flow from operating activities before asset retirement obligation expenditures and changes in non-cash operating working capital.

Year ended December 31, 

($ millions)

2023

2022

2021

Cash flow from/(used in) operating activities


$

938.2


$

1,173.4

$

604.8

Asset retirement obligation settlements

15.0

17.4

13.0

Changes in non-cash operating working capital

8.0

39.5

94.6

Adjusted funds flow

$

961.2

$

1,230.3

$

712.4

ENERPLUS 2023 FINANCIAL SUMMARY             35


“Adjusted funds flow before tax” is used by Enerplus and is useful to investors and securities analysts in analyzing Enerplus’ current income tax expense as a percentage of adjusted funds flow before tax. The most directly comparable GAAP measure is cash flow from operating activities. Adjusted funds flow before tax is calculated as adjusted funds flow plus current income tax expense.

Year ended December 31, 

($ millions)

2023

2022

2021

Adjusted funds flow(1)

$

961.2

$

1,230.3

$

712.4

Current income tax expense

27.2

28.1

2.7

Adjusted funds flow before tax

$

988.4

$

1,258.4

$

715.1

(1)See adjusted funds flow reconciliation above for a breakdown of the adjustments made to cash flow from/(used in) operating activities.

“Adjusted net income/(loss)” is used by Enerplus and is useful to investors and securities analysts in evaluating the financial performance of the company by adjusting for certain unrealized items and other items that the company considers appropriate to adjust given their irregular nature. The most directly comparable GAAP measure is net income/(loss).

Year ended December 31, 

($ millions)


2023


2022


2021

Net income/(loss)


$

456.1

$

914.3

$

234.4

Unrealized derivative instrument, foreign exchange, and marketable securities (gain)/loss

29.7

(141.7)

101.4

Gain on divestment of assets

(151.9)

Other expense/(income) related to investing activities

(2.2)

13.6

(4.6)

Income tax rate adjustment on deferred taxes

8.8

6.0

Asset impairment

3.4

Tax effect

(6.0)

64.0

(24.9)

Adjusted net income/(loss)


$

477.6


$

707.1


$

315.7

“Free cash flow” is used by Enerplus and is useful to investors and securities analysts in analyzing operating and financial performance, leverage and liquidity. Free cash flow is calculated as adjusted funds flow minus capital spending. The most directly comparable GAAP measure is cash flow from operating activities.

Year ended December 31, 

($ millions)


2023


2022


2021

Adjusted funds flow(1)

$

961.2

$

1,230.3

$

712.4

Capital spending

(532.5)

(432.0)

(302.3)

Free cash flow

$

428.7

$

798.3

$

410.1

(1)See adjusted funds flow reconciliation above for a breakdown of the adjustments made to cash flow from/(used in) operating activities.

“Net debt” is used by Enerplus and is useful for investors and securities analysts in analyzing overall leverage and financial position at the end of the period. Net debt is calculated as current and long-term debt associated with senior notes plus any outstanding Bank Credit Facilities balances, less cash and cash equivalents. There is no directly comparable GAAP equivalent for this measure.

Year ended December 31, 

($ millions)

2023

2022

Current portion of long-term debt

$

80.6


$

80.6

Long-term debt

105.4

178.9

Less: Cash and cash equivalents

(66.7)

(38.0)

Net debt

$

119.3

$

221.5

“Net debt to adjusted funds flow ratio” is used by Enerplus and is useful to investors and securities analysts in analyzing leverage and liquidity. The net debt to adjusted funds flow ratio is calculated as net debt divided by a trailing twelve months of adjusted funds flow. There is no directly comparable GAAP equivalent for this measure, and it is not equivalent to any of our debt covenants.

Year ended December 31, 

($ millions)

2023

2022

Net debt(1)

$

119.3

$

221.5

Trailing adjusted funds flow

961.2

1,230.3

Net debt to adjusted funds flow ratio

0.1x

0.2x

(1)See net debt reconciliation above.

36             ENERPLUS 2023 FINANCIAL SUMMARY


“Netback before impact of commodity derivative contracts” and “Netback after impact of commodity derivative contracts” are used by Enerplus and are useful to investors and securities analysts, in evaluating operating performance of our crude oil and natural gas assets, both before and after consideration of our realized gain/(loss) on commodity derivative instruments. A direct GAAP equivalent does not exist for these measures, although a reconciliation is provided below:

Year ended December 31, 

($ millions)


2023


2022


2021

Crude oil and natural gas sales


$

1,663.0

$

2,353.4

$

1,482.6

Less:

Operating expenses

(389.7)

(365.7)

(292.4)

Transportation expenses

(145.6)

(154.7)

(128.3)

Production taxes

(135.1)

(167.0)

(102.0)

Netback before impact of commodity derivative contracts


$

992.6


$

1,666.0


$

959.9

Net realized gain/(loss) on derivative instruments

56.9

(347.2)

(163.0)

Netback after impact of commodity derivative contracts


$

1,049.5


$

1,318.8


$

796.9

Other Financial Measures

SUPPLEMENTARY FINANCIAL MEASURES

Supplementary financial measures are financial measures disclosed by a company that (a) are, or are intended to be, disclosed on a periodic basis to depict the historical or expected future financial performance, financial position or cash flow of a company, (b) are not disclosed in the financial statements of the company, (c) are not non-GAAP financial measures, and (d) are not non-GAAP ratios. The following section provides an explanation of the composition of those supplementary financial measures if not previously provided:

“Capital spending” Capital and office expenditures, excluding other capital assets/office capital, property and land acquisitions and divestments, and non-cash investing working capital.

“Cash general and administrative expenses” or “Cash G&A expenses” General and administrative expenses that are settled through cash payout, as opposed to expenses that relate to accretion or other non-cash allocations that are recorded as part of general and administrative expenses.

“Cash share-based compensation” or “Cash SBC expenses” Share-based compensation that is settled by way of cash payout, as opposed to equity settled.

INTERNAL CONTROLS AND PROCEDURES

Internal Controls over Financial Reporting

We maintain internal controls over financial reporting that are designed to provide reasonable assurance regarding the reliability of financial reporting and the preparation of financial statements for external purposes in accordance with U.S. GAAP. Management is responsible for establishing and maintaining adequate internal controls over financial reporting, as defined in Rule 13a – 15(f) and 15d – 15(f) under the U.S. Securities Exchange Act of 1934, as amended (the Exchange Act) and under National Instrument 52-109 Certification of Disclosure in Issuers’ Annual and Interim Filings (NI 51-109). Management, including the Chief Executive Officer (“CEO”) and Chief Financial Officer (“CFO”) of Enerplus, have conducted an evaluation of our internal control over financial reporting based on criteria established in Internal Control – Integrated Framework (2013) issued by the Committee of Sponsoring Organizations of the Treadway Commission (COSO 2013). Based on management’s assessment as of December 31, 2023, management has concluded that our internal controls over financial reporting are effective.  

The effectiveness of internal controls over financial reporting as of December 31, 2023 was audited by KPMG LLP, an independent registered public accounting firm, as stated in their Report of Independent Registered Public Accounting Firm, which is included with the annual financial statements.

Due to inherent limitations, internal controls over financial reporting are not intended to provide absolute assurance that a misstatement of our financial statements would be prevented or detected. Further, the evaluation of the effectiveness of internal

control over financial reporting was made as of a specific date, and continued effectiveness in future periods is subject to the risks that controls may become inadequate.

Changes in Internal Controls over Financial Reporting

There were no changes in our internal control over financial reporting in 2023 that have materially affected or are reasonably likely to materially affect our internal controls over financial reporting.

ENERPLUS 2023 FINANCIAL SUMMARY             37


Disclosure Controls and Procedures

We maintain disclosure controls and procedures designed to provide reasonable assurance that information required to be disclosed in our interim and annual filings is reviewed, recognized and disclosed accurately and in the appropriate time period. Management, including the CEO and CFO, carried out an evaluation, as of December 31, 2023, of the effectiveness of the design and operation of disclosure controls and procedures of Enerplus, as defined in Rule 13a – 15(e) and 15d – 15(e) under the Exchange Act and NI 52-109. Based on that evaluation, the CEO and CFO have concluded that the design and operation of disclosure controls and procedures at Enerplus were effective to ensure that information required to be disclosed in the reports we file or submit under the Exchange Act or Canadian securities legislation is recorded, processed, summarized and reported within the time periods specified in the rules and forms therein.

It should be noted that while the CEO and CFO believe that our disclosure controls and procedures provide a reasonable level of assurance that they are effective, they do not expect that these disclosure controls and procedures will prevent all errors and fraud. A control system, no matter how well conceived or operated, can provide only reasonable, not absolute, assurance that the objectives of the control system are met.

ADDITIONAL INFORMATION

Additional information relating to Enerplus, including our current Annual Information Form, is available under our profile on the SEDAR+ website at www.sedarplus.ca, on the EDGAR website at www.sec.gov and at www.enerplus.com.

38             ENERPLUS 2023 FINANCIAL SUMMARY


PRESENTATION OF RESERVES INFORMATION

All of Enerplus’ reserves have been evaluated in accordance with Canadian NI 51-101 Standards. Independent reserves evaluations have been conducted on properties comprising 100% of the net present value (discounted at 10%, before tax, using January 1, 2024 forecast prices and costs) of Enerplus’ total proved plus probable reserves. McDaniel, an independent petroleum consulting firm based in Calgary, Alberta, has evaluated all of Enerplus’ proved plus probable reserves associated with the Enerplus’ properties located in North Dakota and Colorado. NSAI, independent petroleum consultants based in Dallas, Texas, has evaluated all of Enerplus’ reserves associated with Enerplus’ properties in Pennsylvania in accordance with Canadian NI 51-101 Standards. For consistency in the Enerplus’ reserves reporting, NSAI also used the average commodity price forecasts and inflation rates of McDaniel, GLJ Ltd. and Sproule Associates Limited, independent petroleum consultants, as of January 1, 2024 to prepare its report.

Enerplus has also presented certain reserves information effective December 31, 2023 in accordance with the provisions of the Financial Accounting Standards Board’s ASC Topic 932 Extractive Activities – Oil and Gas, which generally utilize definitions and estimations of proved reserves that are consistent with Rule 4-10 of Regulation S-X promulgated by the SEC, but does not necessarily include all of the disclosure required by the SEC disclosure standards set forth in Subpart 1200 of Regulation S-K (the "U.S. Standards"). Concurrent to the evaluation of Enerplus’ Canadian NI 51-101 Standards reserves, McDaniel and NSAI prepared and reviewed estimates of Enerplus’ reserves under the U.S. Standards. The practice of preparing production and reserves data under Canadian NI 51-101 Standards differs from the U.S. Standards. The primary differences between the two reporting requirements include:

the Canadian NI 51-101 Standards require disclosure of proved and probable reserves, while the U.S. Standards require disclosure of only proved reserves;
the Canadian NI 51-101 Standards require the use of forecast prices in the estimation of reserves, while the U.S. Standards require the use of 12-month average trailing historical prices, which are held constant;
the Canadian NI 51-101 Standards require disclosure of reserves on a gross (before royalties) and net (after royalties) basis, while the U.S. Standards require disclosure on a net (after royalties) basis;
the Canadian NI 51-101 Standards require disclosure of production on a gross (before royalties) basis, while the U.S. Standards require disclosure on a net (after royalties) basis;
the Canadian NI 51-101 Standards require that reserves and other data be reported on a more granular product type basis than required by the U.S. Standards; and
the Canadian NI 51-101 Standards require that proved undeveloped reserves be reviewed annually for retention or reclassification if development has not proceeded as previously planned, while the U.S. Standards specify a five-year limit after initial booking for the development of proved undeveloped reserves.

Finding and development (“F&D”) costs presented in this MD&A are calculated (i) in the case of F&D costs for proved developed producing reserves, by dividing the sum of the exploration and development costs incurred in the year, by the additions to proved developed producing reserves in the year, (ii) in the case of F&D costs for proved reserves, by dividing the sum of exploration and development costs incurred in the year plus the change in estimated future development costs in the year, by the additions to proved reserves in the year, and (iii) in the case of F&D costs for proved plus probable reserves, by dividing the sum of exploration and development costs incurred in the year plus the change in estimated future development costs in the year, by the additions to proved plus probable reserves in the year. The aggregate of the exploration and development costs incurred in the most recent financial year and the change during that year in estimated future development costs generally reflect total finding and development costs related to its reserves additions for that year. F&D costs are presented in U.S. dollars per net of gross BOE as specified.

Complete disclosure of our oil and gas reserves and other oil and gas information presented in accordance with Canadian NI 51-101 Standards, as well as supplemental information presented in accordance with U.S. Standards, is contained within our Annual Information Form, which is available on our website at www.enerplus.com and under our SEDAR+ profile at www.sedarplus.ca. Additionally, our Annual Information Form forms part of our Form 40-F that is filed with the U.S. Securities and Exchange Commission and is available on EDGAR at www.sec.gov.

ENERPLUS 2023 FINANCIAL SUMMARY             39


FORWARD-LOOKING INFORMATION AND STATEMENTS

This MD&A contains certain forward-looking information and statements ("forward-looking information") within the meaning of applicable securities laws. The use of any of the words "expect", "anticipate", "continue", "estimate", “guidance”, "ongoing", "may", "will", "project", "plans", “budget”, "strategy" and similar expressions are intended to identify forward-looking information. In particular, but without limiting the foregoing, this MD&A contains forward-looking information pertaining to the following: expected transaction with Chord, including timing for completion thereof and its effect on Enerplus; expected 2024 average production volumes, timing thereof and the anticipated production mix; expected free cash flow generation and use thereof, including to fund dividends; the anticipated percentage of free cash flow planned to be returned to shareholders’; the proportion of our anticipated oil and gas production that is hedged and the effectiveness of such hedges in protecting our cash flow from operating activities and adjusted funds flow; adjusted funds flow sensitivity and the estimated effect on adjusted funds flow per share in 2024; oil and natural gas prices and differentials; expectations regarding market environment and our commodity risk management program; expectations regarding our realized oil and natural gas prices; future royalty rates on our production and future production taxes; anticipated cash G&A, share-based compensation and financing expenses; operating, transportation and tax expenses; capital spending levels in 2024 and impact thereof on our production levels and land holdings; expected continued slowdown in refinery demand in 2024; the amount and timing of our future abandonment and reclamation costs and asset retirement obligations and the source of funds necessary in order to pay such obligations; our ESG initiatives, including Scope 1 and Scope 2 GHG emissions and methane emissions intensity and health and safety targets; estimates regarding 2023 reductions of Scope 1 and Scope 2 emissions relative to the 2021 baseline; future environmental expenses; our future royalty and production and cash taxes; deferred income taxes, our tax pools and the time at which we may pay cash taxes; future debt and working capital levels, financial capacity, liquidity and capital resources to fund capital spending and working capital requirements; expectations regarding our ability to comply with or renegotiate debt covenants under our Bank Credit Facilities and outstanding senior notes; our future acquisitions and dispositions; and the amount of future cash dividends that we may pay to our shareholders and the source of funds necessary in order to pay such dividends.


The forward-looking information contained in this MD&A reflects several material factors and expectations and assumptions of Enerplus including, without limitation: the completion of the Arrangement on the terms or within the timeline currently contemplated; the ability to fund our return of capital plans, including dividends at the current level from free cash flow as expected; changes in strategies regarding our return of capital plans; that we will conduct our operations and achieve results of operations as anticipated, including the continued operation of DAPL; that our development plans will achieve the expected results; that lack of adequate infrastructure will not result in curtailment of production and/or reduced realized prices beyond our current expectations; current and anticipated commodity prices, differentials and cost assumptions; the general continuance of current or, where applicable, assumed industry conditions; the impact of inflation, weather conditions, storage fundamentals and expectations regarding the duration and overall impact of the continued conflicts in Ukraine and the Middle East the continuation of assumed tax, royalty and regulatory regimes; the accuracy of the estimates of our reserve and contingent resource volumes; the continued availability of adequate debt and/or equity financing and adjusted funds flow to fund our capital, operating and working capital requirements, and dividend payments as needed; the continued availability and sufficiency of our adjusted funds flow and availability under our Bank Credit Facilities to fund our non-cash operating working capital deficit; our ability to comply with our debt covenants; our ability to meet the targets associated with Bank Credit Facilities; the availability of third party services; factors used to assess the realizability of our deferred income tax assets; the extent of our liabilities; and the availability of technology and process to achieve environmental targets. In addition, our 2024 guidance contained in this MD&A is based on the following: a WTI price of $75.00/bbl, a NYMEX price of $2.50/Mcf and a CDN/US exchange rate of 0.75. Enerplus believes the material factors, expectations and assumptions reflected in the forward-looking information are reasonable but no assurance can be given that these factors, expectations and assumptions will prove to be correct. The term material, in reference to the ESG material focus areas, is not used for, does not have, and is not intended to have, the same meaning as such term is assigned under applicable securities laws, including, but not limited to, with respect to financial materiality, materiality to investors or creditors, enterprise value, or other indications of financial impact, and is used solely to reflect the Company’s identification of those ESG issues that the Company has determined within its judgement present significant ESG risks or opportunities to its operations.


40             ENERPLUS 2023 FINANCIAL SUMMARY


The forward-looking information included in this MD&A is not a guarantee of future performance and should not be unduly relied upon. Such information involves known and unknown risks, uncertainties and other factors that may cause actual results or events to differ materially from those anticipated in such forward-looking information including, without limitation: failure to complete the proposed transaction with Chord in a timely manner, or at all, due to a failure to satisfy any of the conditions set forth therein or otherwise, or the anticipated benefits of the Arrangement may not be realized; continued instability, or further deterioration, in global economic and market conditions, including inflation and/or Ukraine/Russia conflict, the Middle East conflict and heightened geopolitical risk; decreases in commodity prices or volatility in commodity prices; changes in realized prices of Enerplus’ products from those currently anticipated; changes in the demand for or supply of our products, including global energy demand and including as a result of ongoing disruptions to global supply chains; volatility in our share trading price and free cash flows or other changes in circumstances or strategy, that could impact our planned dividend levels; unanticipated operating results, results from our capital spending activities or production declines; curtailment of our production due to low realized prices or lack of adequate infrastructure; changes in tax or environmental laws, royalty rates or other regulatory matters and increased capital and operating costs resulting therefrom; inability to comply with applicable environmental government regulations or regulatory approvals and resulting compliance and enforcement actions; changes in our capital plans or by third party operators of our properties; increased debt levels or debt service requirements; inability to comply with debt covenants under our Bank Credit Facilities and outstanding senior notes; inaccurate estimation of our oil and gas reserve and contingent resource volumes; limited, unfavourable or a lack of access to capital markets; increased costs; a lack of adequate insurance coverage; the impact of competitors, reliance on industry partners and third party service providers; changes in law or government programs or policies in Canada or the Unites States; and certain other risks detailed from time to time in our public disclosure documents (including, without limitation, those risks identified in this MD&A, our Annual Information Form and Form 40-F at December 31, 2023).


The forward-looking information contained in this MD&A speaks only as of the date of this MD&A, and we do not assume any obligation to publicly update or revise such forward-looking information to reflect new events or circumstances, except as may be required pursuant to applicable laws. Any forward-looking information contained herein is expressly qualified by this cautionary statement.

ENERPLUS 2023 FINANCIAL SUMMARY             41