.2
2025 Annual Report
.2
2025 Annual Report
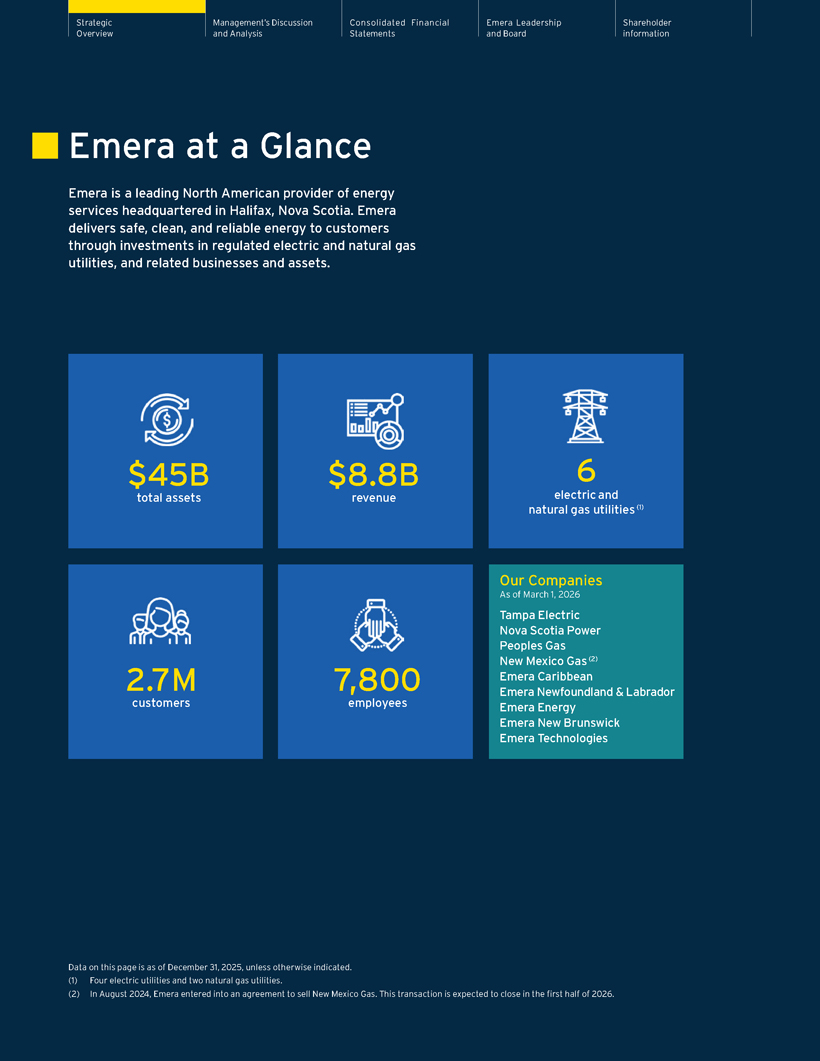
Strategic Management’s Discussion Consolidated Financial Emera Leadership Shareholder Overview and Analysis Statements and Board information Emera at a Glance Emera is a leading North American provider of energy services headquartered in Halifax, Nova Scotia. Emera delivers safe, clean, and reliable energy to customers through investments in regulated electric and natural gas utilities, and related businesses and assets. $45B $8.8B 6 total assets revenue electric and natural gas utilities (1) Our Companies As of March 1, 2026 Tampa Electric Nova Scotia Power Peoples Gas New Mexico Gas (2) 2.7M 7,800 Emera Caribbean customers employees Emera Newfoundland & Labrador Emera Energy Emera New Brunswick Emera Technologies Data on this page is as of December 31, 2025, unless otherwise indicated. (1) Four electric utilities and two natural gas utilities. (2) In August 2024, Emera entered into an agreement to sell New Mexico Gas. This transaction is expected to close in the first half of 2026.
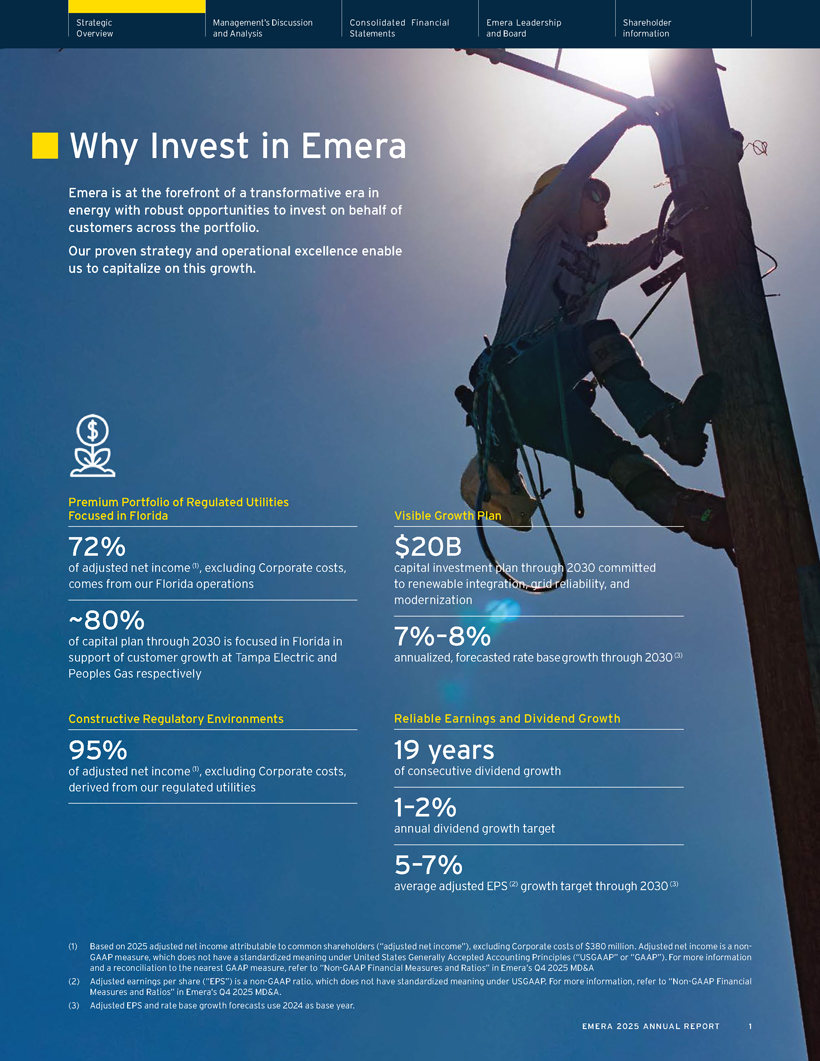
Strategic Management’s Discussion Consolidated Financial Emera Leadership Shareholder Overview and Analysis Statements and Board information Why Invest in Emera Emera is at the forefront of a transformative era in energy with robust opportunities to invest on behalf of customers across the portfolio. Our proven strategy and operational excellence enable us to capitalize on this growth. Premium Portfolio of Regulated Utilities Focused in Florida 72% of adjusted net income (1), excluding Corporate costs, comes from our Florida operations ~80% of capital plan through 2030 is focused in Florida in support of customer growth at Tampa Electric and Peoples Gas respectively Constructive Regulatory Environments 95% of adjusted net income (1), excluding Corporate costs, derived from our regulated utilities Visible Growth Plan $20B capital investment plan through 2030 committed to renewable integration, grid reliability, and modernization 7%–8% annualized, forecasted rate base growth through 2030 (3) Reliable Earnings and Dividend Growth 19 years of consecutive dividend growth 1–2% annual dividend growth target 5–7% average adjusted EPS (2) growth target through 2030 (3) (1) Based on 2025 adjusted net income attributable to common shareholders (“adjusted net income”), excluding Corporate costs of $380 million. Adjusted net income is a non-GAAP measure, which does not have a standardized meaning under United States Generally Accepted Accounting Principles (“USGAAP” or “GAAP”). For more information and a reconciliation to the nearest GAAP measure, refer to “Non-GAAP Financial Measures and Ratios” in Emera’s Q4 2025 MD&A (2) Adjusted earnings per share (“EPS”) is a non-GAAP ratio, which does not have standardized meaning under USGAAP. For more information, refer to “Non-GAAP Financial Measures and Ratios” in Emera’s Q4 2025 MD&A. (3) Adjusted EPS and rate base growth forecasts use 2024 as base year. EMERA 2025 ANNUAL REPORT 1
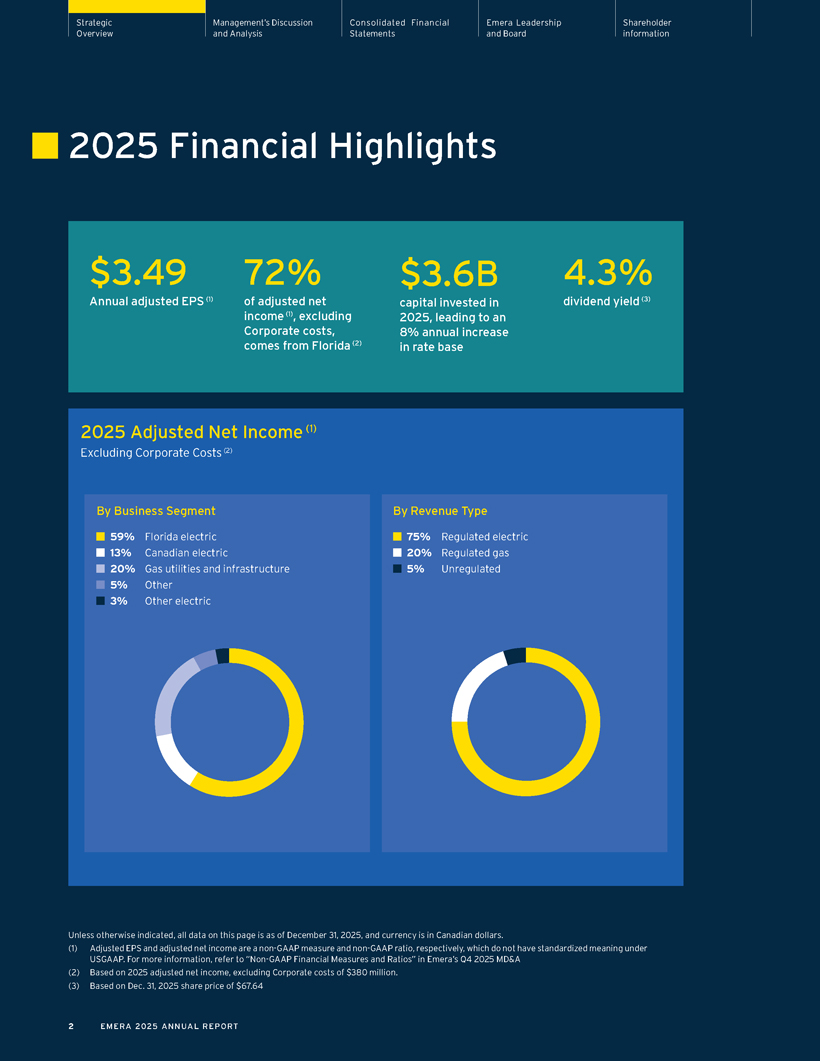
Strategic Management’s Discussion Consolidated Financial Emera Leadership Shareholder Overview and Analysis Statements and Board information 2025 Financial Highlights $3.49 72% $3.6B 4.3% Annual adjusted EPS (1) of adjusted net capital invested in dividend yield (3) income (1), excluding 2025, leading to an Corporate costs, 8% annual increase comes from Florida (2) in rate base 2025 Adjusted Net Income (1) Excluding Corporate Costs (2) By Business Segment 59% Florida electric 13% Canadian electric 20% Gas utilities and infrastructure 5% Other 3% Other electric By Revenue Type 75% Regulated electric 20% Regulated gas 5% Unregulated Unless otherwise indicated, all data on this page is as of December 31, 2025, and currency is in Canadian dollars. (1) Adjusted EPS and adjusted net income are a non-GAAP measure and non-GAAP ratio, respectively, which do not have standardized meaning under USGAAP. For more information, refer to “Non-GAAP Financial Measures and Ratios” in Emera’s Q4 2025 MD&A (2) Based on 2025 adjusted net income, excluding Corporate costs of $380 million. (3) Based on Dec. 31, 2025 share price of $67.64 2 EMERA 2025 ANNUAL REPORT
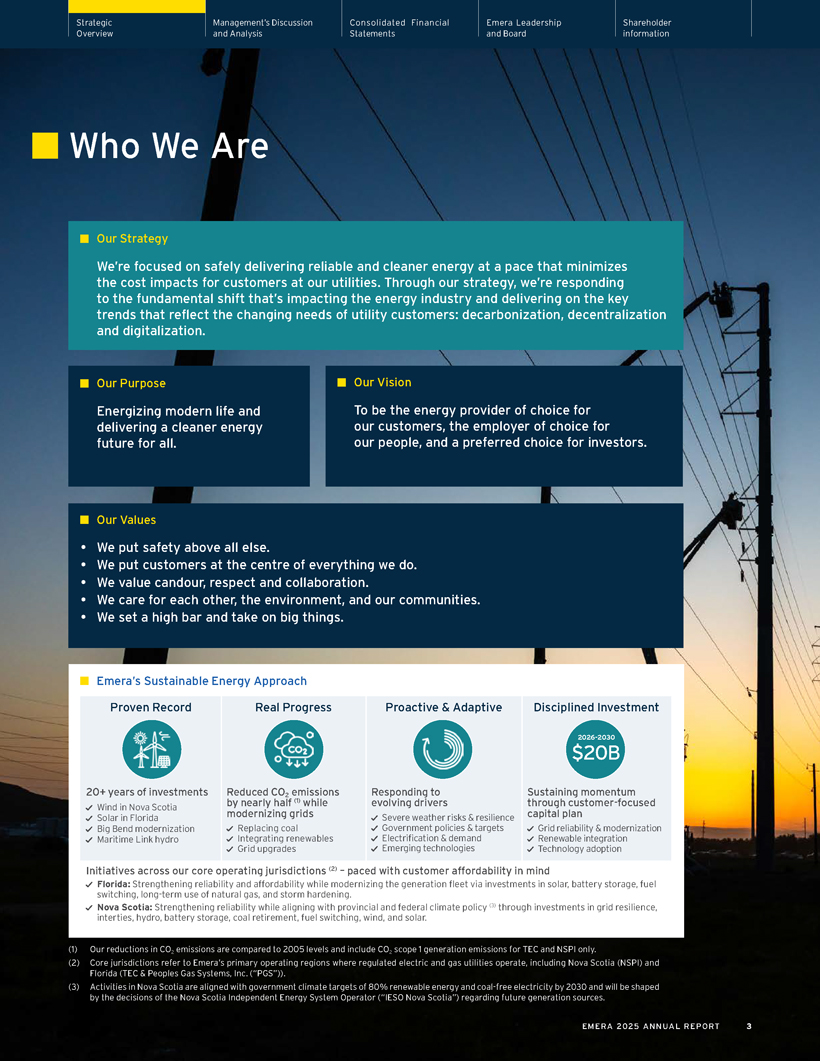
Strategic Management’s Discussion Consolidated Financial Emera Leadership Shareholder Overview and Analysis Statements and Board information Who We Are Our Strategy We’re focused on safely delivering reliable and cleaner energy at a pace that minimizes the cost impacts for customers at our utilities. Through our strategy, we’re responding to the fundamental shift that’s impacting the energy industry and delivering on the key trends that reflect the changing needs of utility customers: decarbonization, decentralization and digitalization. Our Purpose Energizing modern life and delivering a cleaner energy future for all. Our Vision To be the energy provider of choice for our customers, the employer of choice for our people, and a preferred choice for investors. Our Values • We put safety above all else. • We put customers at the centre of everything we do. • We value candour, respect and collaboration. • We care for each other, the environment, and our communities. • We set a high bar and take on big things. Emera’s Sustainable Energy Approach Proven Record 20+ years of investments Wind in Nova Scotia Solar in Florida Big Bend modernization Maritime Link hydro Real Progress Reduced CO2 emissions by nearly half (1) while modernizing grids Replacing coal Integrating renewables Grid upgrades Proactive & Adaptive Responding to evolving drivers Severe weather risks & resilience Government policies & targets Electrification & demand Emerging technologies Disciplined Investment 2026-2030 $20B Sustaining momentum through customer-focused capital plan Grid reliability & modernization Renewable integration Technology adoption Initiatives across our core operating jurisdictions (2) – paced with customer affordability in mind Florida: Strengthening reliability and affordability while modernizing the generation fleet via investments in solar, battery storage, fuel switching, long-term use of natural gas, and storm hardening. Nova Scotia: Strengthening reliability while aligning with provincial and federal climate policy (3) through investments in grid resilience, interties, hydro, battery storage, coal retirement, fuel switching, wind, and solar. (1) Our reductions in CO2 emissions are compared to 2005 levels and include CO2 scope 1 generation emissions for TEC and NSPI only. (2) Core jurisdictions refer to Emera’s primary operating regions where regulated electric and gas utilities operate, including Nova Scotia (NSPI) and Florida (TEC & Peoples Gas Systems, Inc. (“PGS”)). (3) Activities in Nova Scotia are aligned with government climate targets of 80% renewable energy and coal-free electricity by 2030 and will be shaped by the decisions of the Nova Scotia Independent Energy System Operator (“IESO Nova Scotia”) regarding future generation sources. EMERA 2025 ANNUAL REPORT 3

Strategic Management’s Discussion Consolidated Financial Emera Leadership Shareholder Overview and Analysis Statements and Board information Letter from the Chair and the CEO Fellow shareholders, 2025 was defined by meaningful progress for Emera, reflecting the benefit of years of disciplined investment, operational excellence, and continual focus on long-term strategy and delivery of value for our stakeholders. We also continued to strengthen our balance sheet and protect our investment grade credit metrics, prioritizing financial resilience alongside disciplined growth in a volatile environment. As a result, Emera’s positioning is strong, with a stable and resilient business focused on enduring value creation. We carry this momentum into 2026, while recognizing that discipline and focus have never been more important. Rising demand for energy, geopolitical volatility, government policy and regulatory requirements, rapid technological change, and greater expectations for reliable service at a manageable cost are placing higher demands on energy systems and the companies that operate them. Emera is meeting this moment—modernizing our electric and gas systems and strengthening overall system resilience—to deliver long-term value for customers amid broader economic pressures. In Florida—the largest market Emera serves—population and economic growth are driving demand. In response, we advanced projects focused on system capacity, reliability, and storm resiliency. The addition of solar and storage resources, as well as system expansion investments to serve new electric and gas customers ensure we meet increased energy demand and population growth. In Nova Scotia, we are executing a five-year reliability plan that modernizes infrastructure, strengthens the grid, and supports the continued integration of renewables and other technologies. Each investment we make is sequenced to align with evolving energy requirements and manage customer costs. Karen Sheriff Chair, Board of Directors, Emera Inc. Scott Balfour President and Chief Executive Officer, Emera Inc. 4 EMERA 2025 ANNUAL REPORT
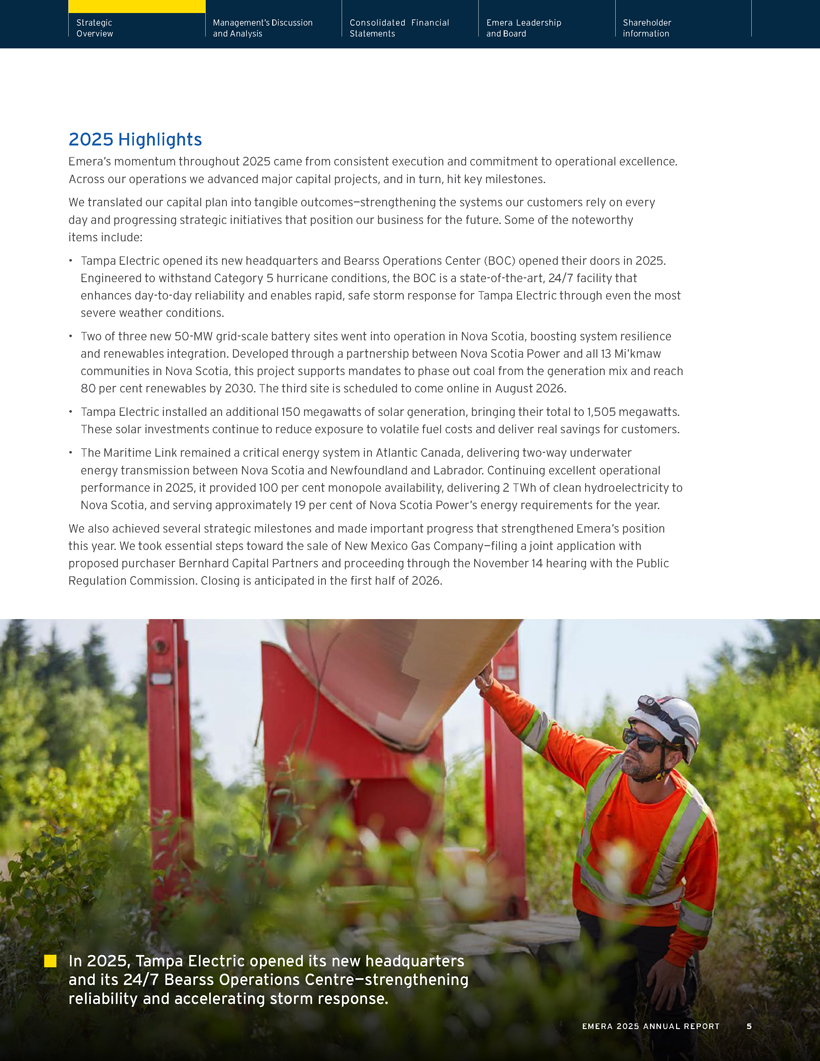
Strategic Management’s Discussion Consolidated Financial Emera Leadership Shareholder Overview and Analysis Statements and Board information 2025 Highlights Emera’s momentum throughout 2025 came from consistent execution and commitment to operational excellence. Across our operations we advanced major capital projects, and in turn, hit key milestones. We translated our capital plan into tangible outcomes—strengthening the systems our customers rely on every day and progressing strategic initiatives that position our business for the future. Some of the noteworthy items include: • Tampa Electric opened its new headquarters and Bearss Operations Center (BOC) opened their doors in 2025. Engineered to withstand Category 5 hurricane conditions, the BOC is a state-of-the-art, 24/7 facility that enhances day-to-day reliability and enables rapid, safe storm response for Tampa Electric through even the most severe weather conditions. • Two of three new 50-MW grid-scale battery sites went into operation in Nova Scotia, boosting system resilience and renewables integration. Developed through a partnership between Nova Scotia Power and all 13 Mi’kmaw communities in Nova Scotia, this project supports mandates to phase out coal from the generation mix and reach 80 per cent renewables by 2030. The third site is scheduled to come online in August 2026. • Tampa Electric installed an additional 150 megawatts of solar generation, bringing their total to 1,505 megawatts. These solar investments continue to reduce exposure to volatile fuel costs and deliver real savings for customers. • The Maritime Link remained a critical energy system in Atlantic Canada, delivering two-way underwater energy transmission between Nova Scotia and Newfoundland and Labrador. Continuing excellent operational performance in 2025, it provided 100 per cent monopole availability, delivering 2 TWh of clean hydroelectricity to Nova Scotia, and serving approximately 19 per cent of Nova Scotia Power’s energy requirements for the year. We also achieved several strategic milestones and made important progress that strengthened Emera’s position this year. We took essential steps toward the sale of New Mexico Gas Company—filing a joint application with proposed purchaser Bernhard Capital Partners and proceeding through the November 14 hearing with the Public Regulation Commission. Closing is anticipated in the first half of 2026. In 2025, Tampa Electric opened its new headquarters and its 24/7 Bearss Operations Centre—strengthening reliability and accelerating storm response. EMERA 2025 ANNUAL REPORT 5
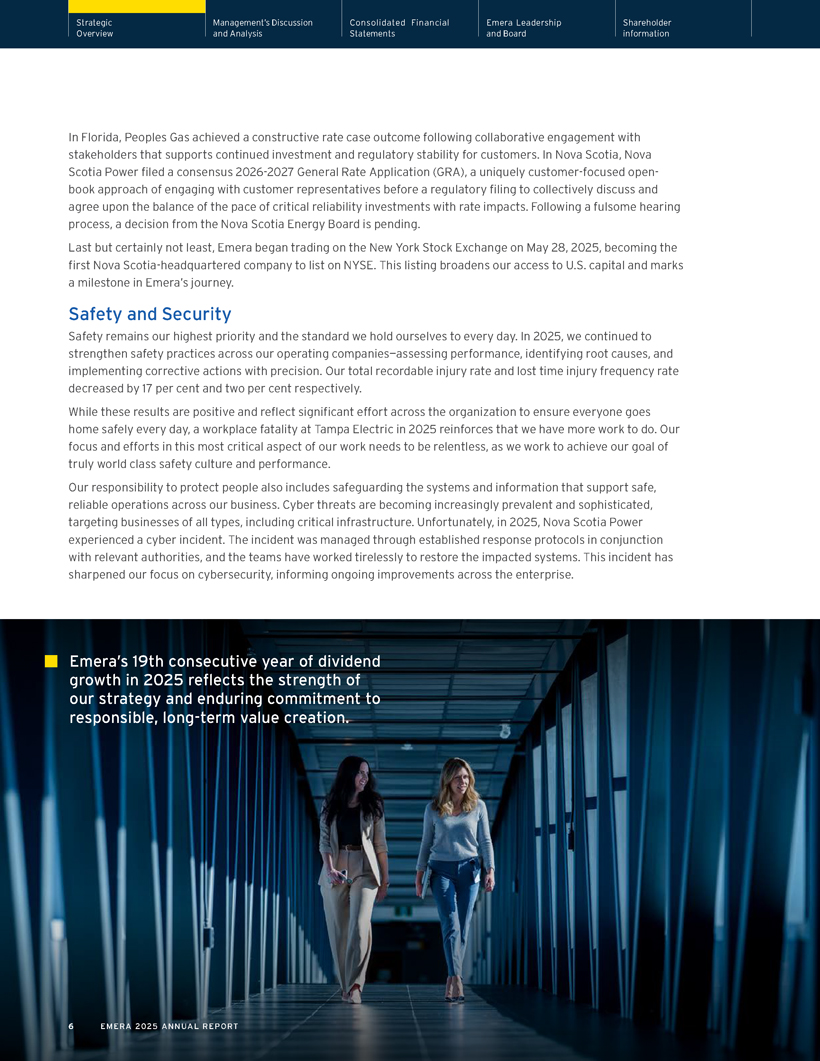
Strategic Management’s Discussion Consolidated Financial Emera Leadership Shareholder Overview and Analysis Statements and Board information In Florida, Peoples Gas achieved a constructive rate case outcome following collaborative engagement with stakeholders that supports continued investment and regulatory stability for customers. In Nova Scotia, Nova Scotia Power filed a consensus 2026-2027 General Rate Application (GRA), a uniquely customer-focused open-book approach of engaging with customer representatives before a regulatory filing to collectively discuss and agree upon the balance of the pace of critical reliability investments with rate impacts. Following a fulsome hearing process, a decision from the Nova Scotia Energy Board is pending. Last but certainly not least, Emera began trading on the New York Stock Exchange on May 28, 2025, becoming the first Nova Scotia-headquartered company to list on NYSE. This listing broadens our access to U.S. capital and marks a milestone in Emera’s journey. Safety and Security Safety remains our highest priority and the standard we hold ourselves to every day. In 2025, we continued to strengthen safety practices across our operating companies—assessing performance, identifying root causes, and implementing corrective actions with precision. Our total recordable injury rate and lost time injury frequency rate decreased by 17 per cent and two per cent respectively. While these results are positive and reflect significant effort across the organization to ensure everyone goes home safely every day, a workplace fatality at Tampa Electric in 2025 reinforces that we have more work to do. Our focus and efforts in this most critical aspect of our work needs to be relentless, as we work to achieve our goal of truly world class safety culture and performance. Our responsibility to protect people also includes safeguarding the systems and information that support safe, reliable operations across our business. Cyber threats are becoming increasingly prevalent and sophisticated, targeting businesses of all types, including critical infrastructure. Unfortunately, in 2025, Nova Scotia Power experienced a cyber incident. The incident was managed through established response protocols in conjunction with relevant authorities, and the teams have worked tirelessly to restore the impacted systems. This incident has sharpened our focus on cybersecurity, informing ongoing improvements across the enterprise. Emera’s 19th consecutive year of dividend growth in 2025 reflects the strength of our strategy and enduring commitment to responsible, long-term value creation. 6 EMERA 2025 ANNUAL REPORT
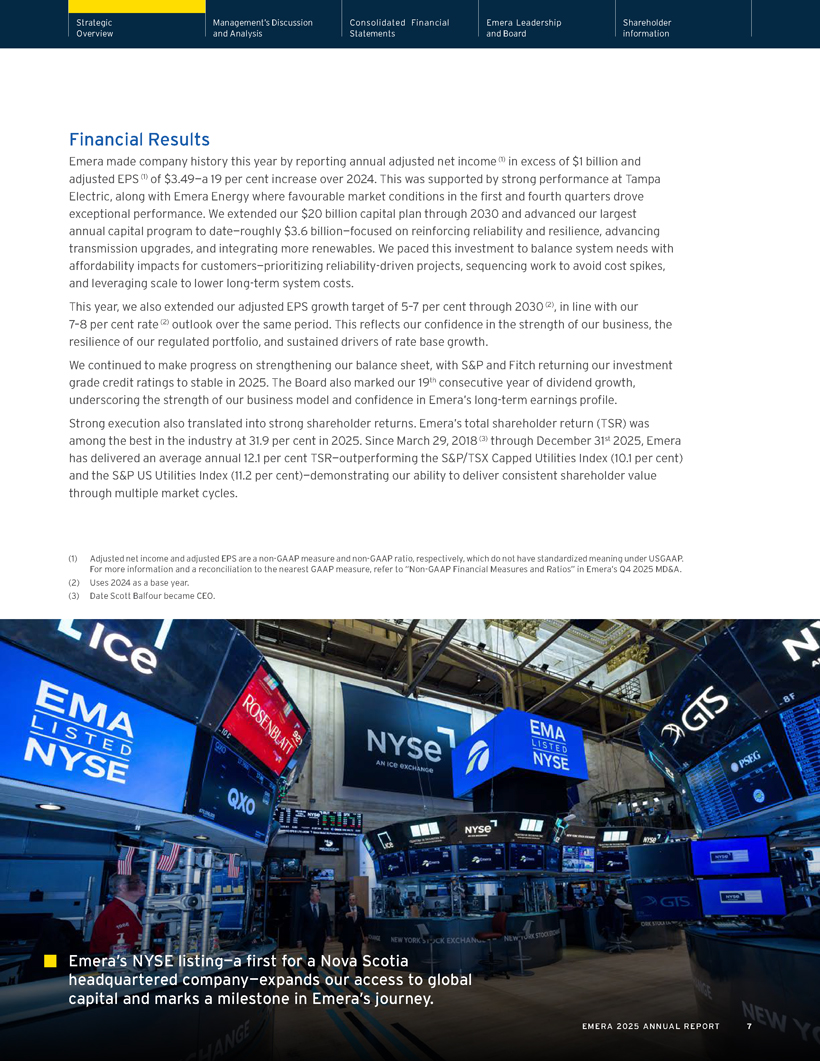
Strategic Management’s Discussion Consolidated Financial Emera Leadership Shareholder Overview and Analysis Statements and Board information Financial Results Emera made company history this year by reporting annual adjusted net income (1) in excess of $1 billion and adjusted EPS (1) of $3.49—a 19 per cent increase over 2024. This was supported by strong performance at Tampa Electric, along with Emera Energy where favourable market conditions in the first and fourth quarters drove exceptional performance. We extended our $20 billion capital plan through 2030 and advanced our largest annual capital program to date—roughly $3.6 billion—focused on reinforcing reliability and resilience, advancing transmission upgrades, and integrating more renewables. We paced this investment to balance system needs with affordability impacts for customers—prioritizing reliability-driven projects, sequencing work to avoid cost spikes, and leveraging scale to lower long-term system costs. This year, we also extended our adjusted EPS growth target of 5–7 per cent through 2030 (2), in line with our 7–8 per cent rate (2) outlook over the same period. This reflects our confidence in the strength of our business, the resilience of our regulated portfolio, and sustained drivers of rate base growth. We continued to make progress on strengthening our balance sheet, with S&P and Fitch returning our investment grade credit ratings to stable in 2025. The Board also marked our 19th consecutive year of dividend growth, underscoring the strength of our business model and confidence in Emera’s long-term earnings profile. Strong execution also translated into strong shareholder returns. Emera’s total shareholder return (TSR) was among the best in the industry at 31.9 per cent in 2025. Since March 29, 2018 (3) through December 31st 2025, Emera has delivered an average annual 12.1 per cent TSR—outperforming the S&P/TSX Capped Utilities Index (10.1 per cent) and the S&P US Utilities Index (11.2 per cent)—demonstrating our ability to deliver consistent shareholder value through multiple market cycles. (1) Adjusted net income and adjusted EPS are a non-GAAP measure and non-GAAP ratio, respectively, which do not have standardized meaning under USGAAP. For more information and a reconciliation to the nearest GAAP measure, refer to “Non-GAAP Financial Measures and Ratios” in Emera’s Q4 2025 MD&A. (2) Uses 2024 as a base year. (3) Date Scott Balfour became CEO. Emera’s NYSE listing—a first for a Nova Scotia headquartered company—expands our access to global capital and marks a milestone in Emera’s journey. EMERA 2025 ANNUAL REPORT 7
Strategic Management’s Discussion Consolidated Financial Emera Leadership Shareholder Overview and Analysis Statements and Board information Board Governance The Board’s disciplined oversight helped keep Emera focused on creating and delivering long-term value, balance sheet strength, and responsible growth as we advanced major investments. In a year marked by record performance and meaningful investment in reliability and clean energy, the Board remained actively engaged on strategy, enterprise risk, and capital allocation. We welcomed Isabelle Courville to the Board in September 2025, who brings extensive director experience in both public and private sectors, along with a strong executive leadership track record. We would like to recognize that Brian Porter will not be standing for re-election at the 2026 AGM and would like to thank him for his service and contributions. We are also grateful for the service and dedication provided by Jackie Sheppard, who completed her transition from the Board in January 2026 after more than a decade of leadership. Cybersecurity and digital resilience continued to be areas of focus for the Board this year. These types of threats—like the one at Nova Scotia Power—are becoming increasingly complex and challenging for organizations everywhere. Emera’s Board continues to oversee cybersecurity practices across all operating companies, and this event reinforces the importance of vigilance in this matter. As Emera implements broader digital transformation efforts, including rapidly evolving areas such as AI governance and cybersecurity risk, the Board remains committed to thorough oversight to help guide these efforts and support system reliability, operational efficiency, and long-term resilience. Thank You The progress we achieved this year reflects the hard work, expertise, and discipline of teams across our business. Together, we delivered record financial results, advanced major investments in reliability and clean energy, strengthened our balance sheet, and maintained a sharp focus on providing value for customers. With a strong foundation, a disciplined capital plan, and a premium portfolio of regulated utilities in high-quality jurisdictions, Emera is well-positioned for the opportunities ahead. We continue through 2026 with enduring momentum, a clear strategy, and confidence in our ability to continue delivering for our customers and our shareholders. To the Board of Directors and the entire team at Emera, thank you for your dedication and focus throughout the year. Your commitment to serving customers and supporting shareholder value has been instrumental in achieving a landmark year, and we look forward to building on this momentum in the coming months. To our valued shareholders, thank you for your continued confidence in Emera. Karen Sheriff Chair, Board of Directors, Emera Inc. Scott Balfour President and Chief Executive Officer, Emera Inc. 8 EMERA 2025 ANNUAL REPORT
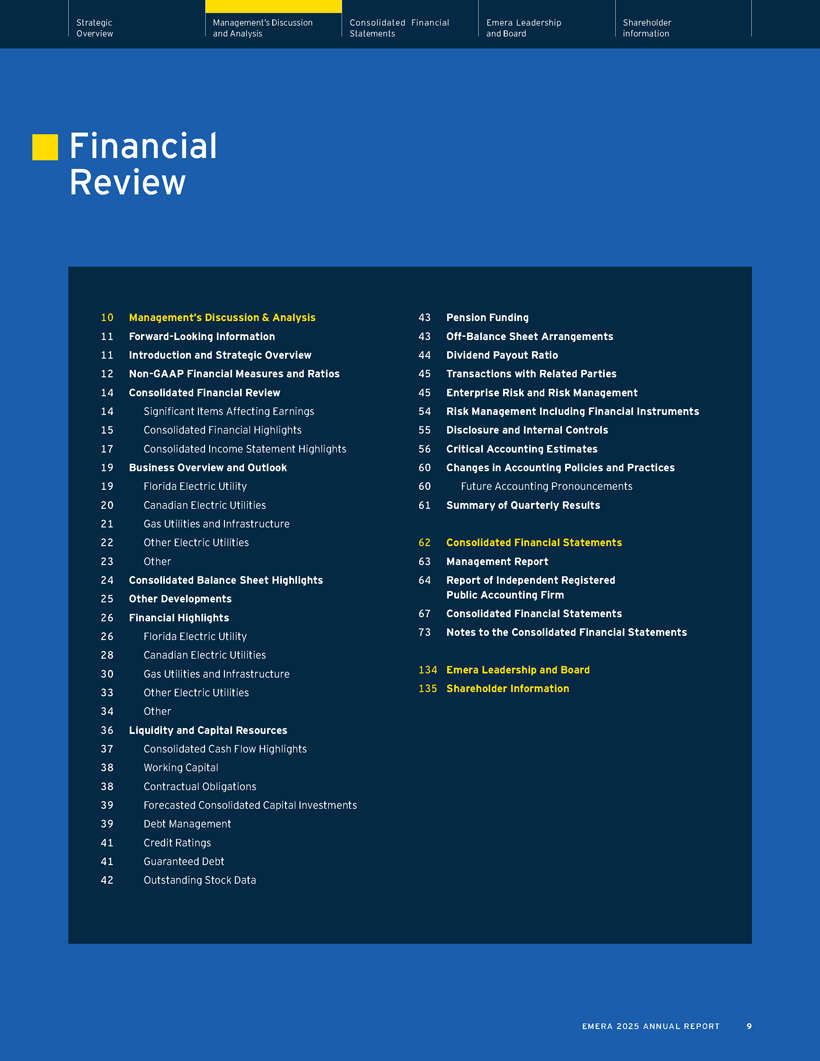
Strategic Management’s Discussion Consolidated Financial Emera Leadership Shareholder Overview and Analysis Statements and Board information Financial Review 10 Management’s Discussion & Analysis 11 Forward-Looking Information 11 Introduction and Strategic Overview 12 Non-GAAP Financial Measures and Ratios 14 Consolidated Financial Review 14 Significant Items Affecting Earnings 15 Consolidated Financial Highlights 17 Consolidated Income Statement Highlights 19 Business Overview and Outlook 19 Florida Electric Utility 20 Canadian Electric Utilities 21 Gas Utilities and Infrastructure 22 Other Electric Utilities 23 Other 24 Consolidated Balance Sheet Highlights 25 Other Developments 26 Financial Highlights 26 Florida Electric Utility 28 Canadian Electric Utilities 30 Gas Utilities and Infrastructure 33 Other Electric Utilities 34 Other 36 Liquidity and Capital Resources 37 Consolidated Cash Flow Highlights 38 Working Capital 38 Contractual Obligations 39 Forecasted Consolidated Capital Investments 39 Debt Management 41 Credit Ratings 41 Guaranteed Debt 42 Outstanding Stock Data 43 Pension Funding 43 Off-Balance Sheet Arrangements 44 Dividend Payout Ratio 45 Transactions with Related Parties 45 Enterprise Risk and Risk Management 54 Risk Management Including Financial Instruments 55 Disclosure and Internal Controls 56 Critical Accounting Estimates 60 Changes in Accounting Policies and Practices 60 Future Accounting Pronouncements 61 Summary of Quarterly Results 62 Consolidated Financial Statements 63 Management Report 64 Report of Independent Registered Public Accounting Firm 67 Consolidated Financial Statements 73 Notes to the Consolidated Financial Statements 134 Emera Leadership and Board 135 Shareholder Information EMERA 2025 ANNUAL REPORT 9
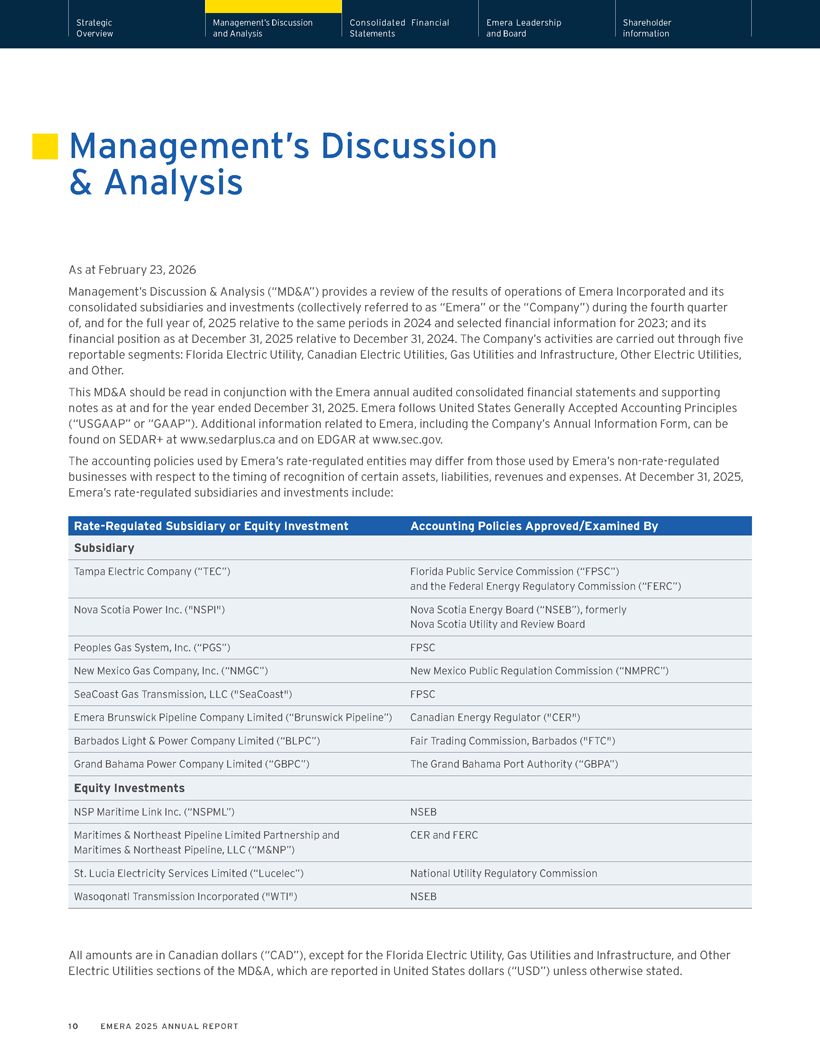
Strategic Management’s Discussion Consolidated Financial Emera Leadership Shareholder Overview and Analysis Statements and Board information Management’s Discussion & Analysis As at February 23, 2026 Management’s Discussion & Analysis (“MD&A”) provides a review of the results of operations of Emera Incorporated and its consolidated subsidiaries and investments (collectively referred to as “Emera” or the “Company”) during the fourth quarter of, and for the full year of, 2025 relative to the same periods in 2024 and selected financial information for 2023; and its financial position as at December 31, 2025 relative to December 31, 2024. The Company’s activities are carried out through five reportable segments: Florida Electric Utility, Canadian Electric Utilities, Gas Utilities and Infrastructure, Other Electric Utilities, and Other. This MD&A should be read in conjunction with the Emera annual audited consolidated financial statements and supporting notes as at and for the year ended December 31, 2025. Emera follows United States Generally Accepted Accounting Principles (“USGAAP” or “GAAP”). Additional information related to Emera, including the Company’s Annual Information Form, can be found on SEDAR+ at www.sedarplus.ca and on EDGAR at www.sec.gov. The accounting policies used by Emera’s rate-regulated entities may differ from those used by Emera’s non-rate-regulated businesses with respect to the timing of recognition of certain assets, liabilities, revenues and expenses. At December 31, 2025, Emera’s rate-regulated subsidiaries and investments include: Rate-Regulated Subsidiary or Equity Investment Accounting Policies Approved/Examined By Subsidiary Tampa Electric Company (“TEC”) Florida Public Service Commission (“FPSC”) and the Federal Energy Regulatory Commission (“FERC”) Nova Scotia Power Inc. (“NSPI”) Nova Scotia Energy Board (“NSEB”), formerly Nova Scotia Utility and Review Board Peoples Gas System, Inc. (“PGS”) FPSC New Mexico Gas Company, Inc. (“NMGC”) New Mexico Public Regulation Commission (“NMPRC”) SeaCoast Gas Transmission, LLC (“SeaCoast”) FPSC Emera Brunswick Pipeline Company Limited (“Brunswick Pipeline”) Canadian Energy Regulator (“CER”) Barbados Light & Power Company Limited (“BLPC”) Fair Trading Commission, Barbados (“FTC”) Grand Bahama Power Company Limited (“GBPC”) The Grand Bahama Port Authority (“GBPA”) Equity Investments NSP Maritime Link Inc. (“NSPML”) NSEB Maritimes & Northeast Pipeline Limited Partnership and CER and FERC Maritimes & Northeast Pipeline, LLC (“M&NP”) St. Lucia Electricity Services Limited (“Lucelec”) National Utility Regulatory Commission Wasoqonatl Transmission Incorporated (“WTI”) NSEB All amounts are in Canadian dollars (“CAD”), except for the Florida Electric Utility, Gas Utilities and Infrastructure, and Other Electric Utilities sections of the MD&A, which are reported in United States dollars (“USD”) unless otherwise stated. 10 EMERA 2025 ANNUAL REPORT
Strategic Management’s Discussion Consolidated Financial Emera Leadership Shareholder Overview and Analysis Statements and Board information Forward-Looking Information This MD&A contains “forward-looking information” and “forward-looking statements” (collectively, “FLI”) within the meaning of applicable Canadian and US securities laws, including the United States Private Securities Litigation Reform Act of 1995, which reflect the current view with respect to the Company’s expectations regarding future growth, results of operations, performance, earnings, capital investment, sales volumes, recovery of costs, timing of regulatory decisions, the expected timing and outcome of the pending sale of NMGC, the expected impact of Cybersecurity Incident (as defined herein) on the Company’s financial position and results of operations, information technology (“IT”) systems restoration, insurance recoveries, and business continuity processes as well as other matters relating to the Cybersecurity Incident, business prospects and opportunities, and may not be appropriate for other purposes. All such information and statements are made pursuant to safe harbour provisions contained in applicable securities legislation. The words “anticipates”, “believes”, “budget”, “could”, “estimates”, “expects”, “forecast”, “intends”, “may”, “might”, “plans”, “projects”, “schedule”, “should”, “targets”, “will”, “would” and similar expressions are often intended to identify FLI, although not all FLI contains these identifying words. The FLI reflects management’s current beliefs and is based on information currently available to Emera’s management and should not be read as guarantees of future events, performance or results, and will not necessarily be accurate indications of whether, or the time at which, such events, performance or results will be achieved. FLI is based on reasonable assumptions and is subject to risks, uncertainties and other factors that could cause actual results to differ materially from historical results or results anticipated by the FLI. Factors that could cause results or events to differ from current expectations include, without limitation: regulatory and political risk; change in law risk; system operating and maintenance risks; changes in economic conditions; commodity price and availability risk; liquidity and capital markets risk; changes in credit ratings; future dividend growth, rate base growth, and adjusted earnings per common share (“EPS”) growth; timing and costs associated with certain capital investments; expected impacts on Emera of challenges in the global economy; potential impacts of trade disputes and tariffs; estimated energy consumption rates; maintenance of adequate insurance coverage and receipt of proceeds; changes in customer energy usage patterns; developments in technology that could impact demand for electricity; climate risk; weather risk, including higher frequency and severity of weather events; risk of wildfires; unanticipated maintenance and other expenditures; derivative financial instruments and hedging; interest rate risk; inflation risk; counterparty risk; disruption of fuel supply; supply chain risk; environmental risks; foreign exchange (“FX”); regulatory and government decisions, including changes to environmental legislation, financial reporting and tax legislation; risks associated with pension plan performance and funding requirements; loss of service area; risks and costs associated with failure of IT infrastructure and cybersecurity incidents including IT systems restoration and business continuity processes; uncertainties associated with infectious diseases, pandemics and similar public health threats; risks associated with health and safety; market energy sales prices; labour relations; and availability of labour and management resources. Readers are cautioned not to place undue reliance on FLI, as actual results could differ materially from the plans, expectations, estimates or intentions and statements expressed in the FLI. All FLI in this MD&A is qualified in its entirety by the above cautionary statements and, except as required by law, Emera undertakes no obligation to revise or update any FLI as a result of new information, future events or otherwise. Introduction and Strategic Overview Emera (TSX/NYSE: EMA) is a North American provider of energy services, owning and operating a portfolio of cost-of-service, rate-regulated electric and gas utilities. Its largest operations are in Florida, with additional operations in Atlantic Canada, New Mexico, and the Caribbean. Emera is headquartered in Halifax, Nova Scotia, Canada. Emera’s business strategy is centred on continued investment in its regulated utilities, combined with a focus on operational excellence and efficiency, to safely and reliably deliver energy to its 2.7 million customers. Effective execution of these priorities supports predictable and growing earnings, cash flow, and dividends for shareholders. Earnings opportunities in regulated utilities are a function of the magnitude of net investment in the utility (known as “rate base”), the amount of equity in the capital structure, and the targeted return on that equity (“ROE”), all as established and approved through regulation. Earnings are also affected by sales volumes and operating expenses. In 2025, Emera’s regulated cost-of-service utilities in Florida accounted for 67 per cent of average consolidated rate base, with Atlantic Canada comprising 25 per cent, and the Caribbean and New Mexico at four per cent each. Emera’s capital investment plan is forecasted to be approximately $20 billion from 2026 through 2030 and is focused on delivering value for customers through prudent investments in reliability and system resiliency, infrastructure modernization, expansion to address customer growth, integration of renewables, and technological innovations to deliver better customer experiences. It is anticipated that approximately 80 per cent of this capital investment will be made in Emera’s Florida utilities, necessitated by customer growth and system requirements at both TEC and PGS. EMERA 2025 ANNUAL REPORT 11
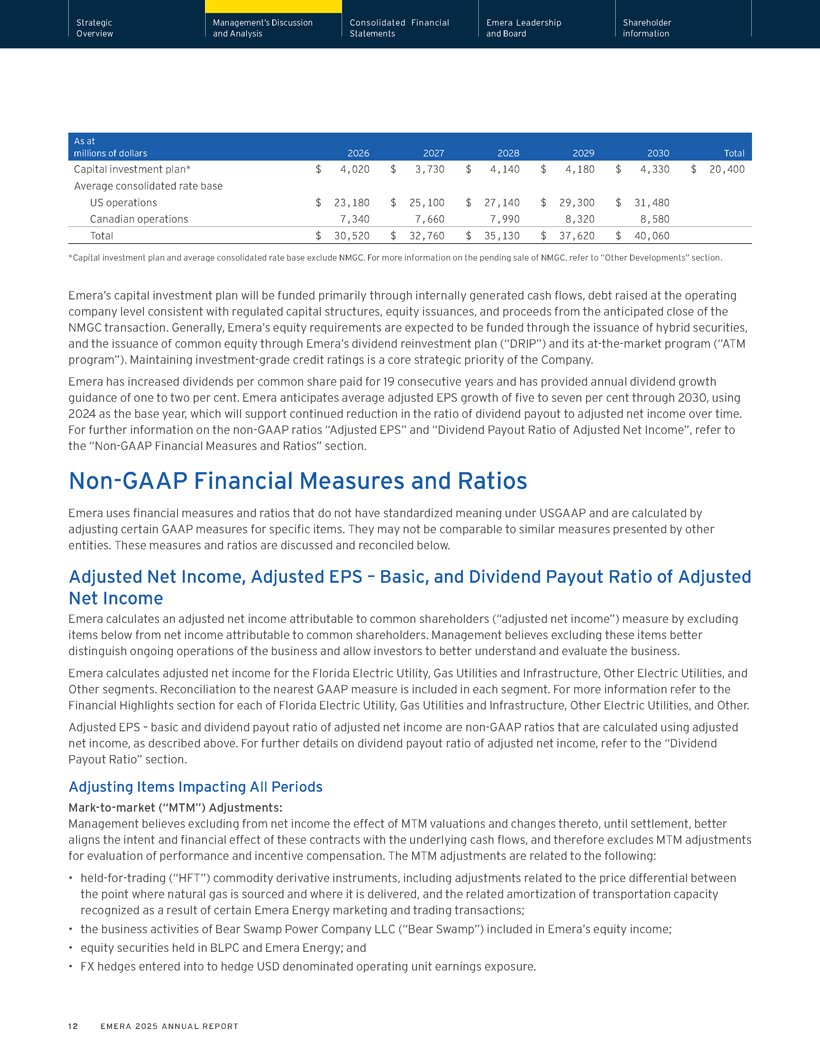
Strategic Management’s Discussion Consolidated Financial Emera Leadership Shareholder Overview and Analysis Statements and Board information As at millions of dollars 2026 2027 2028 2029 2030 Total Capital investment plan* $ 4,020 $ 3,730 $ 4,140 $ 4,180 $ 4,330 $ 20,400 Average consolidated rate base US operations $ 23,180 $ 25,100 $ 27,140 $ 29,300 $ 31,480 Canadian operations 7,340 7,660 7,990 8,320 8,580 Total $ 30,520 $ 32,760 $ 35,130 $ 37,620 $ 40,060 *Capital investment plan and average consolidated rate base exclude NMGC. For more information on the pending sale of NMGC, refer to “Other Developments” section. Emera’s capital investment plan will be funded primarily through internally generated cash flows, debt raised at the operating company level consistent with regulated capital structures, equity issuances, and proceeds from the anticipated close of the NMGC transaction. Generally, Emera’s equity requirements are expected to be funded through the issuance of hybrid securities, and the issuance of common equity through Emera’s dividend reinvestment plan (“DRIP”) and its at-the-market program (“ATM program”). Maintaining investment-grade credit ratings is a core strategic priority of the Company. Emera has increased dividends per common share paid for 19 consecutive years and has provided annual dividend growth guidance of one to two per cent. Emera anticipates average adjusted EPS growth of five to seven per cent through 2030, using 2024 as the base year, which will support continued reduction in the ratio of dividend payout to adjusted net income over time. For further information on the non-GAAP ratios “Adjusted EPS” and “Dividend Payout Ratio of Adjusted Net Income”, refer to the “Non-GAAP Financial Measures and Ratios” section. Non-GAAP Financial Measures and Ratios Emera uses financial measures and ratios that do not have standardized meaning under USGAAP and are calculated by adjusting certain GAAP measures for specific items. They may not be comparable to similar measures presented by other entities. These measures and ratios are discussed and reconciled below. Adjusted Net Income, Adjusted EPS – Basic, and Dividend Payout Ratio of Adjusted Net Income Emera calculates an adjusted net income attributable to common shareholders (“adjusted net income”) measure by excluding items below from net income attributable to common shareholders. Management believes excluding these items better distinguish ongoing operations of the business and allow investors to better understand and evaluate the business. Emera calculates adjusted net income for the Florida Electric Utility, Gas Utilities and Infrastructure, Other Electric Utilities, and Other segments. Reconciliation to the nearest GAAP measure is included in each segment. For more information refer to the Financial Highlights section for each of Florida Electric Utility, Gas Utilities and Infrastructure, Other Electric Utilities, and Other. Adjusted EPS – basic and dividend payout ratio of adjusted net income are non-GAAP ratios that are calculated using adjusted net income, as described above. For further details on dividend payout ratio of adjusted net income, refer to the “Dividend Payout Ratio” section. Adjusting Items Impacting All Periods Mark-to-market (“MTM”) Adjustments: Management believes excluding from net income the effect of MTM valuations and changes thereto, until settlement, better aligns the intent and financial effect of these contracts with the underlying cash flows, and therefore excludes MTM adjustments for evaluation of performance and incentive compensation. The MTM adjustments are related to the following: • held-for-trading (“HFT”) commodity derivative instruments, including adjustments related to the price differential between the point where natural gas is sourced and where it is delivered, and the related amortization of transportation capacity recognized as a result of certain Emera Energy marketing and trading transactions; • the business activities of Bear Swamp Power Company LLC (“Bear Swamp”) included in Emera’s equity income; • equity securities held in BLPC and Emera Energy; and • FX hedges entered into to hedge USD denominated operating unit earnings exposure. 12 EMERA 2025 ANNUAL REPORT
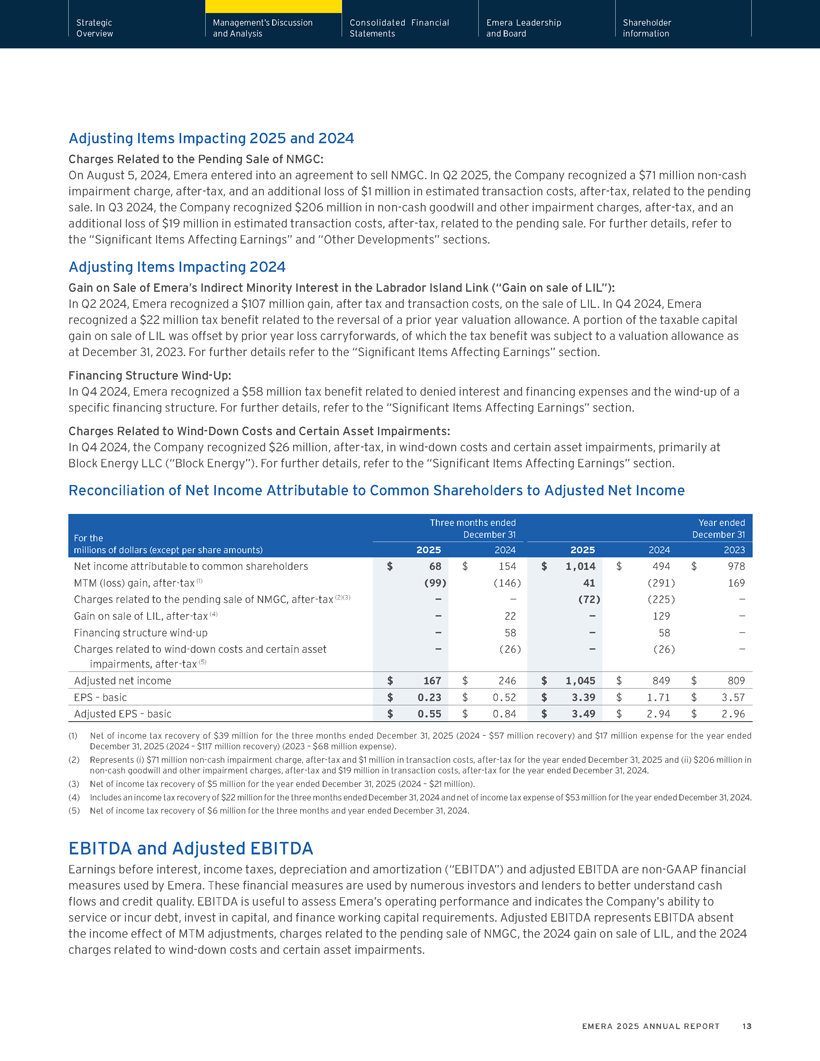
Strategic Management’s Discussion Consolidated Financial Emera Leadership Shareholder Overview and Analysis Statements and Board information Adjusting Items Impacting 2025 and 2024 Charges Related to the Pending Sale of NMGC: On August 5, 2024, Emera entered into an agreement to sell NMGC. In Q2 2025, the Company recognized a $71 million non-cash impairment charge, after-tax, and an additional loss of $1 million in estimated transaction costs, after-tax, related to the pending sale. In Q3 2024, the Company recognized $206 million in non-cash goodwill and other impairment charges, after-tax, and an additional loss of $19 million in estimated transaction costs, after-tax, related to the pending sale. For further details, refer to the “Significant Items Affecting Earnings” and “Other Developments” sections. Adjusting Items Impacting 2024 Gain on Sale of Emera’s Indirect Minority Interest in the Labrador Island Link (“Gain on sale of LIL”): In Q2 2024, Emera recognized a $107 million gain, after tax and transaction costs, on the sale of LIL. In Q4 2024, Emera recognized a $22 million tax benefit related to the reversal of a prior year valuation allowance. A portion of the taxable capital gain on sale of LIL was offset by prior year loss carryforwards, of which the tax benefit was subject to a valuation allowance as at December 31, 2023. For further details refer to the “Significant Items Affecting Earnings” section. Financing Structure Wind-Up: In Q4 2024, Emera recognized a $58 million tax benefit related to denied interest and financing expenses and the wind-up of a specific financing structure. For further details, refer to the “Significant Items Affecting Earnings” section. Charges Related to Wind-Down Costs and Certain Asset Impairments: In Q4 2024, the Company recognized $26 million, after-tax, in wind-down costs and certain asset impairments, primarily at Block Energy LLC (“Block Energy”). For further details, refer to the “Significant Items Affecting Earnings” section. Reconciliation of Net Income Attributable to Common Shareholders to Adjusted Net Income Three months ended Year ended For the December 31 December 31 millions of dollars (except per share amounts) 2025 2024 2025 2024 2023 Net income attributable to common shareholders $ 68 $ 154 $ 1,014 $ 494 $ 978 MTM (loss) gain, after-tax (1) (99) (146) 41 (291) 169 Charges related to the pending sale of NMGC, after-tax (2)(3) — — (72) (225) —Gain on sale of LIL, after-tax (4) — 22 — 129 —Financing structure wind-up — 58 — 58 —Charges related to wind-down costs and certain asset — (26) — (26) —impairments, after-tax (5) Adjusted net income $ 167 $ 246 $ 1,045 $ 849 $ 809 EPS – basic $ 0.23 $ 0.52 $ 3.39 $ 1.71 $ 3.57 Adjusted EPS – basic $ 0.55 $ 0.84 $ 3.49 $ 2.94 $ 2.96 (1) Net of income tax recovery of $39 million for the three months ended December 31, 2025 (2024 – $57 million recovery) and $17 million expense for the year ended December 31, 2025 (2024 – $117 million recovery) (2023 – $68 million expense). (2) Represents (i) $71 million non-cash impairment charge, after-tax and $1 million in transaction costs, after-tax for the year ended December 31, 2025 and (ii) $206 million in non-cash goodwill and other impairment charges, after-tax and $19 million in transaction costs, after-tax for the year ended December 31, 2024. (3) Net of income tax recovery of $5 million for the year ended December 31, 2025 (2024 – $21 million). (4) Includes an income tax recovery of $22 million for the three months ended December 31, 2024 and net of income tax expense of $53 million for the year ended December 31, 2024. (5) Net of income tax recovery of $6 million for the three months and year ended December 31, 2024. EBITDA and Adjusted EBITDA Earnings before interest, income taxes, depreciation and amortization (“EBITDA”) and adjusted EBITDA are non-GAAP financial measures used by Emera. These financial measures are used by numerous investors and lenders to better understand cash flows and credit quality. EBITDA is useful to assess Emera’s operating performance and indicates the Company’s ability to service or incur debt, invest in capital, and finance working capital requirements. Adjusted EBITDA represents EBITDA absent the income effect of MTM adjustments, charges related to the pending sale of NMGC, the 2024 gain on sale of LIL, and the 2024 charges related to wind-down costs and certain asset impairments. EMERA 2025 ANNUAL REPORT 13
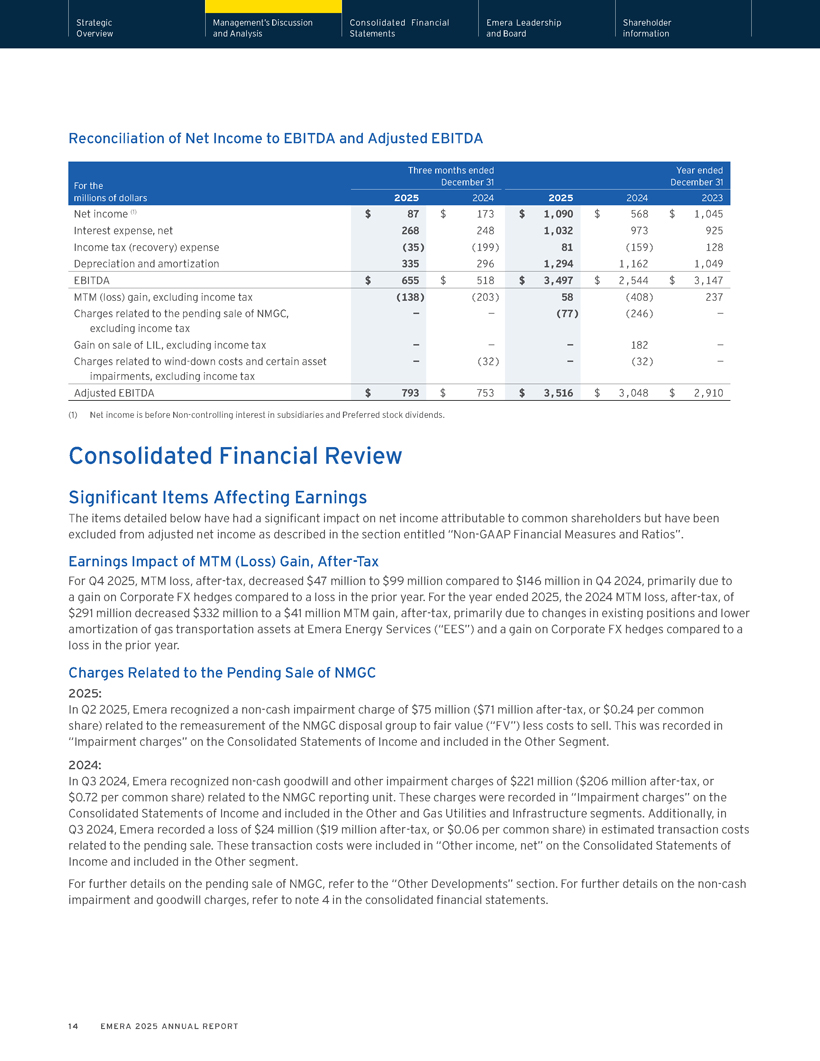
Strategic Management’s Discussion Consolidated Financial Emera Leadership Shareholder Overview and Analysis Statements and Board information Reconciliation of Net Income to EBITDA and Adjusted EBITDA Three months ended Year ended For the December 31 December 31 millions of dollars 2025 2024 2025 2024 2023 Net income (1) $ 87 $ 173 $ 1,090 $ 568 $ 1,045 Interest expense, net 268 248 1,032 973 925 Income tax (recovery) expense (35) (199) 81 (159) 128 Depreciation and amortization 335 296 1,294 1,162 1,049 EBITDA $ 655 $ 518 $ 3,497 $ 2,544 $ 3,147 MTM (loss) gain, excluding income tax (138) (203) 58 (408) 237 Charges related to the pending sale of NMGC, — — (77) (246) — excluding income tax Gain on sale of LIL, excluding income tax — — — 182 — Charges related to wind-down costs and certain asset — (32) — (32) — impairments, excluding income tax Adjusted EBITDA $ 793 $ 753 $ 3,516 $ 3,048 $ 2,910 (1) Net income is before Non-controlling interest in subsidiaries and Preferred stock dividends. Consolidated Financial Review Significant Items Affecting Earnings The items detailed below have had a significant impact on net income attributable to common shareholders but have been excluded from adjusted net income as described in the section entitled “Non-GAAP Financial Measures and Ratios”. Earnings Impact of MTM (Loss) Gain, After-Tax For Q4 2025, MTM loss, after-tax, decreased $47 million to $99 million compared to $146 million in Q4 2024, primarily due to a gain on Corporate FX hedges compared to a loss in the prior year. For the year ended 2025, the 2024 MTM loss, after-tax, of $291 million decreased $332 million to a $41 million MTM gain, after-tax, primarily due to changes in existing positions and lower amortization of gas transportation assets at Emera Energy Services (“EES”) and a gain on Corporate FX hedges compared to a loss in the prior year. Charges Related to the Pending Sale of NMGC 2025: In Q2 2025, Emera recognized a non-cash impairment charge of $75 million ($71 million after-tax, or $0.24 per common share) related to the remeasurement of the NMGC disposal group to fair value (“FV”) less costs to sell. This was recorded in “Impairment charges” on the Consolidated Statements of Income and included in the Other Segment. 2024: In Q3 2024, Emera recognized non-cash goodwill and other impairment charges of $221 million ($206 million after-tax, or $0.72 per common share) related to the NMGC reporting unit. These charges were recorded in “Impairment charges” on the Consolidated Statements of Income and included in the Other and Gas Utilities and Infrastructure segments. Additionally, in Q3 2024, Emera recorded a loss of $24 million ($19 million after-tax, or $0.06 per common share) in estimated transaction costs related to the pending sale. These transaction costs were included in “Other income, net” on the Consolidated Statements of Income and included in the Other segment. For further details on the pending sale of NMGC, refer to the “Other Developments” section. For further details on the non-cash impairment and goodwill charges, refer to note 4 in the consolidated financial statements. 14 EMERA 2025 ANNUAL REPORT
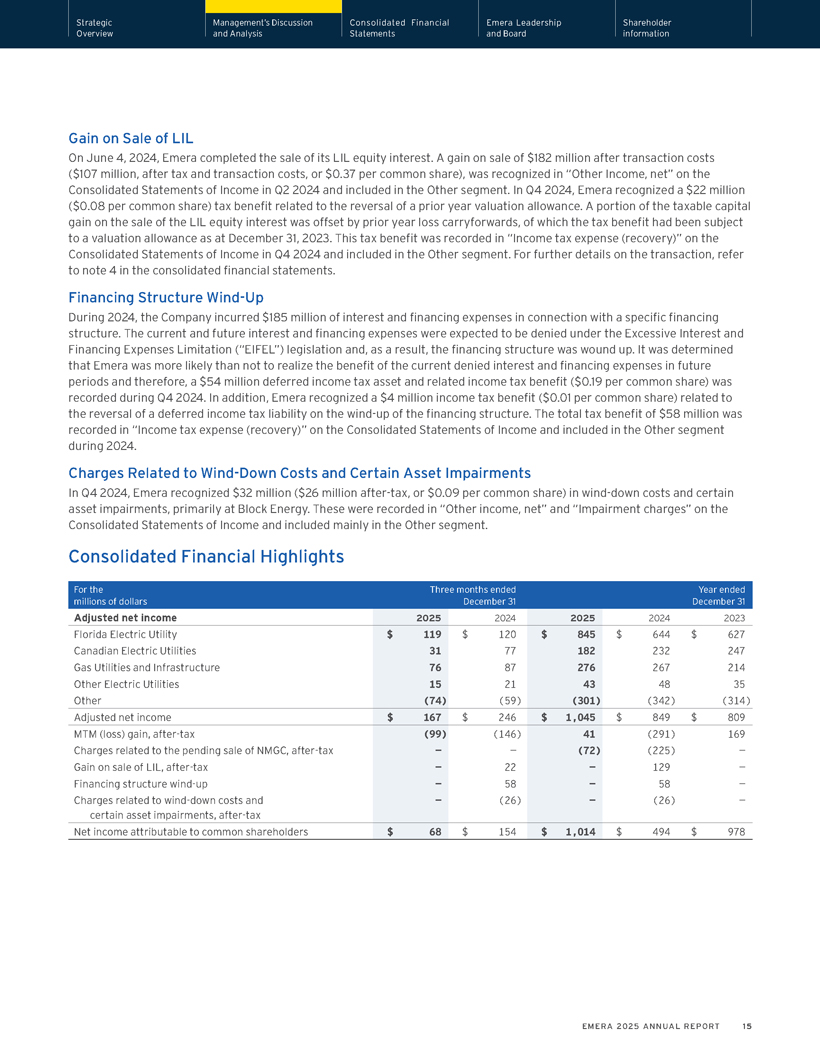
Strategic Management’s Discussion Consolidated Financial Emera Leadership Shareholder Overview and Analysis Statements and Board information Gain on Sale of LIL On June 4, 2024, Emera completed the sale of its LIL equity interest. A gain on sale of $182 million after transaction costs ($107 million, after tax and transaction costs, or $0.37 per common share), was recognized in “Other Income, net” on the Consolidated Statements of Income in Q2 2024 and included in the Other segment. In Q4 2024, Emera recognized a $22 million ($0.08 per common share) tax benefit related to the reversal of a prior year valuation allowance. A portion of the taxable capital gain on the sale of the LIL equity interest was offset by prior year loss carryforwards, of which the tax benefit had been subject to a valuation allowance as at December 31, 2023. This tax benefit was recorded in “Income tax expense (recovery)” on the Consolidated Statements of Income in Q4 2024 and included in the Other segment. For further details on the transaction, refer to note 4 in the consolidated financial statements. Financing Structure Wind-Up During 2024, the Company incurred $185 million of interest and financing expenses in connection with a specific financing structure. The current and future interest and financing expenses were expected to be denied under the Excessive Interest and Financing Expenses Limitation (“EIFEL”) legislation and, as a result, the financing structure was wound up. It was determined that Emera was more likely than not to realize the benefit of the current denied interest and financing expenses in future periods and therefore, a $54 million deferred income tax asset and related income tax benefit ($0.19 per common share) was recorded during Q4 2024. In addition, Emera recognized a $4 million income tax benefit ($0.01 per common share) related to the reversal of a deferred income tax liability on the wind-up of the financing structure. The total tax benefit of $58 million was recorded in “Income tax expense (recovery)” on the Consolidated Statements of Income and included in the Other segment during 2024. Charges Related to Wind-Down Costs and Certain Asset Impairments In Q4 2024, Emera recognized $32 million ($26 million after-tax, or $0.09 per common share) in wind-down costs and certain asset impairments, primarily at Block Energy. These were recorded in “Other income, net” and “Impairment charges” on the Consolidated Statements of Income and included mainly in the Other segment. Consolidated Financial Highlights For the Three months ended Year ended millions of dollars December 31 December 31 Adjusted net income 2025 2024 2025 2024 2023 Florida Electric Utility $ 119 $ 120 $ 845 $ 644 $ 627 Canadian Electric Utilities 31 77 182 232 247 Gas Utilities and Infrastructure 76 87 276 267 214 Other Electric Utilities 15 21 43 48 35 Other (74) (59) (301) (342) (314) Adjusted net income $ 167 $ 246 $ 1,045 $ 849 $ 809 MTM (loss) gain, after-tax (99) (146) 41 (291) 169 Charges related to the pending sale of NMGC, after-tax — — (72) (225) — Gain on sale of LIL, after-tax — 22 — 129 — Financing structure wind-up — 58 — 58 — Charges related to wind-down costs and — (26) — (26) — certain asset impairments, after-tax Net income attributable to common shareholders $ 68 $ 154 $ 1,014 $ 494 $ 978 EMERA 2025 ANNUAL REPORT 15
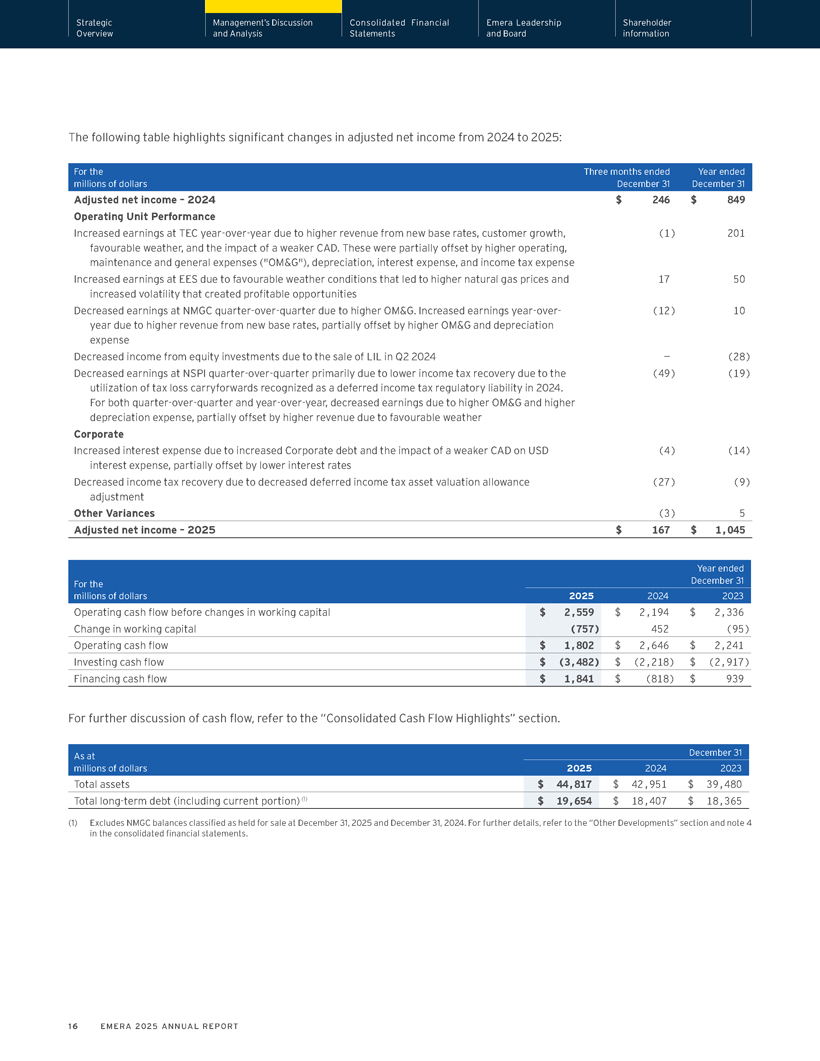
Strategic Management’s Discussion Consolidated Financial Emera Leadership Shareholder Overview and Analysis Statements and Board information The following table highlights significant changes in adjusted net income from 2024 to 2025: For the Three months ended Year ended millions of dollars December 31 December 31 Adjusted net income – 2024 $ 246 $ 849 Operating Unit Performance Increased earnings at TEC year-over-year due to higher revenue from new base rates, customer growth, (1) 201 favourable weather, and the impact of a weaker CAD. These were partially offset by higher operating, maintenance and general expenses (“OM&G”), depreciation, interest expense, and income tax expense Increased earnings at EES due to favourable weather conditions that led to higher natural gas prices and 17 50 increased volatility that created profitable opportunities Decreased earnings at NMGC quarter-over-quarter due to higher OM&G. Increased earnings year-over- (12) 10 year due to higher revenue from new base rates, partially offset by higher OM&G and depreciation expense Decreased income from equity investments due to the sale of LIL in Q2 2024 — (28) Decreased earnings at NSPI quarter-over-quarter primarily due to lower income tax recovery due to the (49) (19) utilization of tax loss carryforwards recognized as a deferred income tax regulatory liability in 2024. For both quarter-over-quarter and year-over-year, decreased earnings due to higher OM&G and higher depreciation expense, partially offset by higher revenue due to favourable weather Corporate Increased interest expense due to increased Corporate debt and the impact of a weaker CAD on USD (4) (14) interest expense, partially offset by lower interest rates Decreased income tax recovery due to decreased deferred income tax asset valuation allowance (27) (9) adjustment Other Variances (3) 5 Adjusted net income – 2025 $ 167 $ 1,045 Year ended For the December 31 millions of dollars 2025 2024 2023 Operating cash flow before changes in working capital $ 2,559 $ 2,194 $ 2,336 Change in working capital (757) 452 (95) Operating cash flow $ 1,802 $ 2,646 $ 2,241 Investing cash flow $ (3,482) $ (2,218) $ (2,917) Financing cash flow $ 1,841 $ (818) $ 939 For further discussion of cash flow, refer to the “Consolidated Cash Flow Highlights” section. As at December 31 millions of dollars 2025 2024 2023 Total assets $ 44,817 $ 42,951 $ 39,480 Total long-term debt (including current portion) (1) $ 19,654 $ 18,407 $ 18,365 (1) Excludes NMGC balances classified as held for sale at December 31, 2025 and December 31, 2024. For further details, refer to the “Other Developments” section and note 4 in the consolidated financial statements. 16 EMERA 2025 ANNUAL REPORT
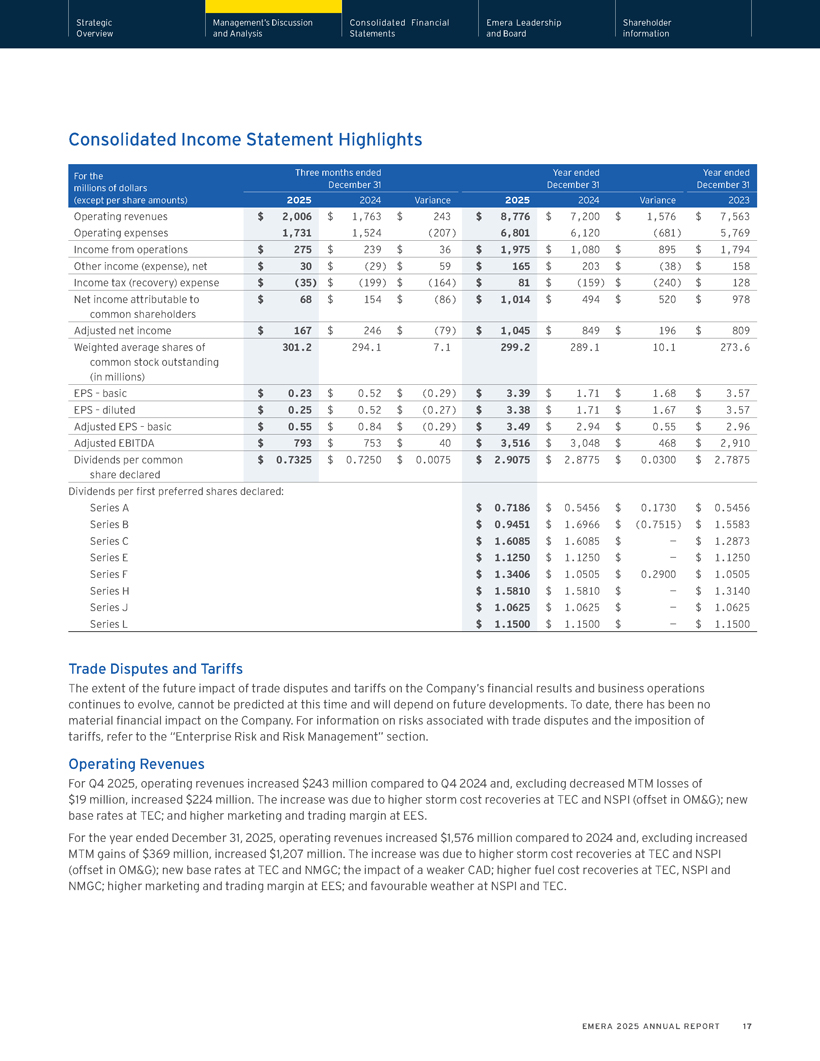
Strategic Management’s Discussion Consolidated Financial Emera Leadership Shareholder Overview and Analysis Statements and Board information Consolidated Income Statement Highlights For the Three months ended Year ended Year ended millions of dollars December 31 December 31 December 31 (except per share amounts) 2025 2024 Variance 2025 2024 Variance 2023 Operating revenues $ 2,006 $ 1,763 $ 243 $ 8,776 $ 7,200 $ 1,576 $ 7,563 Operating expenses 1,731 1,524 (207) 6,801 6,120 (681) 5,769 Income from operations $ 275 $ 239 $ 36 $ 1,975 $ 1,080 $ 895 $ 1,794 Other income (expense), net $ 30 $ (29) $ 59 $ 165 $ 203 $ (38) $ 158 Income tax (recovery) expense $ (35) $ (199) $ (164) $ 81 $ (159) $ (240) $ 128 Net income attributable to $ 68 $ 154 $ (86) $ 1,014 $ 494 $ 520 $ 978 common shareholders Adjusted net income $ 167 $ 246 $ (79) $ 1,045 $ 849 $ 196 $ 809 Weighted average shares of 301.2 294.1 7.1 299.2 289.1 10.1 273.6 common stock outstanding (in millions) EPS – basic $ 0.23 $ 0.52 $ (0.29) $ 3.39 $ 1.71 $ 1.68 $ 3.57 EPS – diluted $ 0.25 $ 0.52 $ (0.27) $ 3.38 $ 1.71 $ 1.67 $ 3.57 Adjusted EPS – basic $ 0.55 $ 0.84 $ (0.29) $ 3.49 $ 2.94 $ 0.55 $ 2.96 Adjusted EBITDA $ 793 $ 753 $ 40 $ 3,516 $ 3,048 $ 468 $ 2,910 Dividends per common $ 0.7325 $ 0.7250 $ 0.0075 $ 2.9075 $ 2.8775 $ 0.0300 $ 2.7875 share declared Dividends per first preferred shares declared: Series A $ 0.7186 $ 0.5456 $ 0.1730 $ 0.5456 Series B $ 0.9451 $ 1.6966 $ (0.7515) $ 1.5583 Series C $ 1.6085 $ 1.6085 $ — $ 1.2873 Series E $ 1.1250 $ 1.1250 $ — $ 1.1250 Series F $ 1.3406 $ 1.0505 $ 0.2900 $ 1.0505 Series H $ 1.5810 $ 1.5810 $ — $ 1.3140 Series J $ 1.0625 $ 1.0625 $ — $ 1.0625 Series L $ 1.1500 $ 1.1500 $ — $ 1.1500 Trade Disputes and Tariffs The extent of the future impact of trade disputes and tariffs on the Company’s financial results and business operations continues to evolve, cannot be predicted at this time and will depend on future developments. To date, there has been no material financial impact on the Company. For information on risks associated with trade disputes and the imposition of tariffs, refer to the “Enterprise Risk and Risk Management” section. Operating Revenues For Q4 2025, operating revenues increased $243 million compared to Q4 2024 and, excluding decreased MTM losses of $19 million, increased $224 million. The increase was due to higher storm cost recoveries at TEC and NSPI (offset in OM&G); new base rates at TEC; and higher marketing and trading margin at EES. For the year ended December 31, 2025, operating revenues increased $1,576 million compared to 2024 and, excluding increased MTM gains of $369 million, increased $1,207 million. The increase was due to higher storm cost recoveries at TEC and NSPI (offset in OM&G); new base rates at TEC and NMGC; the impact of a weaker CAD; higher fuel cost recoveries at TEC, NSPI and NMGC; higher marketing and trading margin at EES; and favourable weather at NSPI and TEC. EMERA 2025 ANNUAL REPORT 17
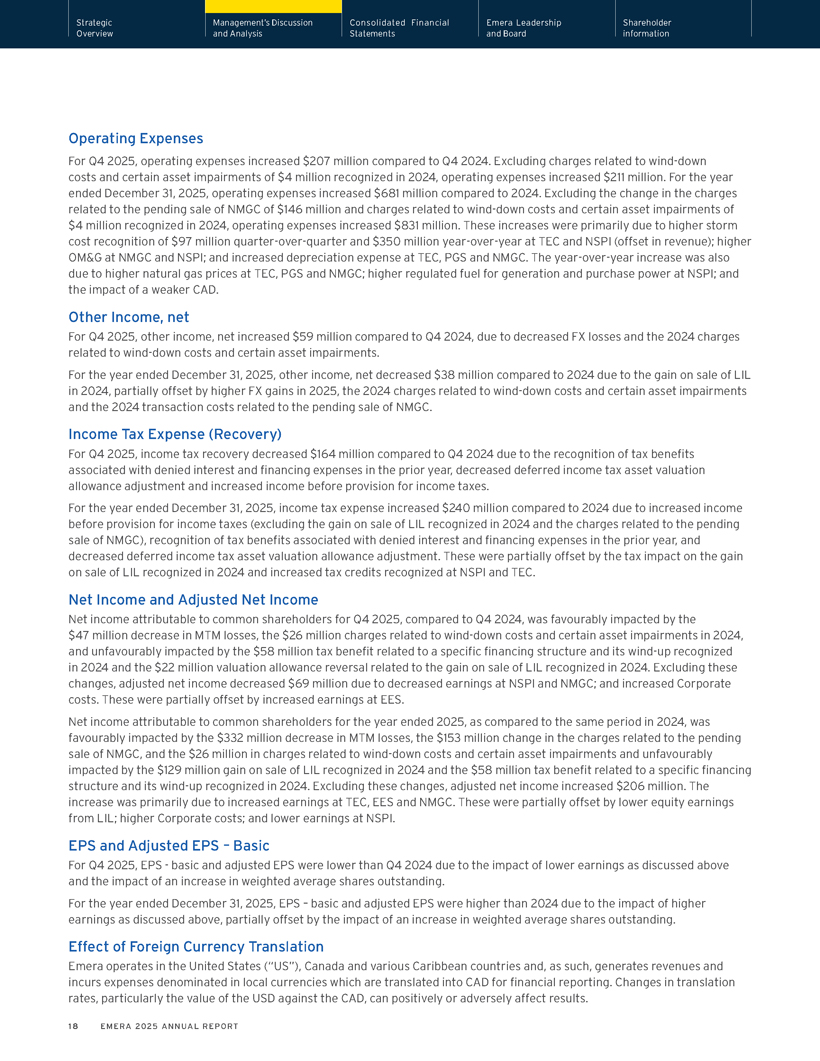
Strategic Management’s Discussion Consolidated Financial Emera Leadership Shareholder Overview and Analysis Statements and Board information Operating Expenses For Q4 2025, operating expenses increased $207 million compared to Q4 2024. Excluding charges related to wind-down costs and certain asset impairments of $4 million recognized in 2024, operating expenses increased $211 million. For the year ended December 31, 2025, operating expenses increased $681 million compared to 2024. Excluding the change in the charges related to the pending sale of NMGC of $146 million and charges related to wind-down costs and certain asset impairments of $4 million recognized in 2024, operating expenses increased $831 million. These increases were primarily due to higher storm cost recognition of $97 million quarter-over-quarter and $350 million year-over-year at TEC and NSPI (offset in revenue); higher OM&G at NMGC and NSPI; and increased depreciation expense at TEC, PGS and NMGC. The year-over-year increase was also due to higher natural gas prices at TEC, PGS and NMGC; higher regulated fuel for generation and purchase power at NSPI; and the impact of a weaker CAD. Other Income, net For Q4 2025, other income, net increased $59 million compared to Q4 2024, due to decreased FX losses and the 2024 charges related to wind-down costs and certain asset impairments. For the year ended December 31, 2025, other income, net decreased $38 million compared to 2024 due to the gain on sale of LIL in 2024, partially offset by higher FX gains in 2025, the 2024 charges related to wind-down costs and certain asset impairments and the 2024 transaction costs related to the pending sale of NMGC. Income Tax Expense (Recovery) For Q4 2025, income tax recovery decreased $164 million compared to Q4 2024 due to the recognition of tax benefits associated with denied interest and financing expenses in the prior year, decreased deferred income tax asset valuation allowance adjustment and increased income before provision for income taxes. For the year ended December 31, 2025, income tax expense increased $240 million compared to 2024 due to increased income before provision for income taxes (excluding the gain on sale of LIL recognized in 2024 and the charges related to the pending sale of NMGC), recognition of tax benefits associated with denied interest and financing expenses in the prior year, and decreased deferred income tax asset valuation allowance adjustment. These were partially offset by the tax impact on the gain on sale of LIL recognized in 2024 and increased tax credits recognized at NSPI and TEC. Net Income and Adjusted Net Income Net income attributable to common shareholders for Q4 2025, compared to Q4 2024, was favourably impacted by the $47 million decrease in MTM losses, the $26 million charges related to wind-down costs and certain asset impairments in 2024, and unfavourably impacted by the $58 million tax benefit related to a specific financing structure and its wind-up recognized in 2024 and the $22 million valuation allowance reversal related to the gain on sale of LIL recognized in 2024. Excluding these changes, adjusted net income decreased $69 million due to decreased earnings at NSPI and NMGC; and increased Corporate costs. These were partially offset by increased earnings at EES. Net income attributable to common shareholders for the year ended 2025, as compared to the same period in 2024, was favourably impacted by the $332 million decrease in MTM losses, the $153 million change in the charges related to the pending sale of NMGC, and the $26 million in charges related to wind-down costs and certain asset impairments and unfavourably impacted by the $129 million gain on sale of LIL recognized in 2024 and the $58 million tax benefit related to a specific financing structure and its wind-up recognized in 2024. Excluding these changes, adjusted net income increased $206 million. The increase was primarily due to increased earnings at TEC, EES and NMGC. These were partially offset by lower equity earnings from LIL; higher Corporate costs; and lower earnings at NSPI. EPS and Adjusted EPS – Basic For Q4 2025, EPS—basic and adjusted EPS were lower than Q4 2024 due to the impact of lower earnings as discussed above and the impact of an increase in weighted average shares outstanding. For the year ended December 31, 2025, EPS – basic and adjusted EPS were higher than 2024 due to the impact of higher earnings as discussed above, partially offset by the impact of an increase in weighted average shares outstanding. Effect of Foreign Currency Translation Emera operates in the United States (“US”), Canada and various Caribbean countries and, as such, generates revenues and incurs expenses denominated in local currencies which are translated into CAD for financial reporting. Changes in translation rates, particularly the value of the USD against the CAD, can positively or adversely affect results. 18 EMERA 2025 ANNUAL REPORT
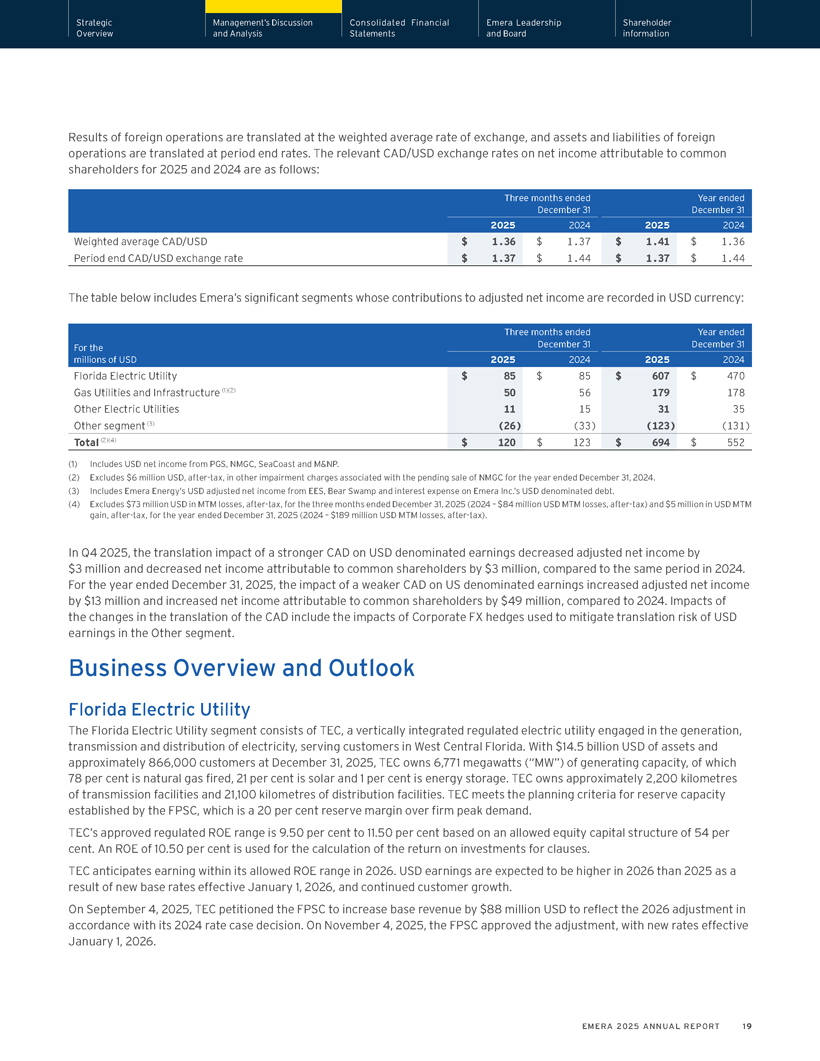
Strategic Management’s Discussion Consolidated Financial Emera Leadership Shareholder Overview and Analysis Statements and Board information Results of foreign operations are translated at the weighted average rate of exchange, and assets and liabilities of foreign operations are translated at period end rates. The relevant CAD/USD exchange rates on net income attributable to common shareholders for 2025 and 2024 are as follows: Three months ended Year ended December 31 December 31 2025 2024 2025 2024 Weighted average CAD/USD $ 1.36 $ 1.37 $ 1.41 $ 1.36 Period end CAD/USD exchange rate $ 1.37 $ 1.44 $ 1.37 $ 1.44 The table below includes Emera’s significant segments whose contributions to adjusted net income are recorded in USD currency: Three months ended Year ended For the December 31 December 31 millions of USD 2025 2024 2025 2024 Florida Electric Utility $ 85 $ 85 $ 607 $ 470 Gas Utilities and Infrastructure (1)(2) 50 56 179 178 Other Electric Utilities 11 15 31 35 Other segment (3) (26) (33) (123) (131) Total (2)(4) $ 120 $ 123 $ 694 $ 552 (1) Includes USD net income from PGS, NMGC, SeaCoast and M&NP. (2) Excludes $6 million USD, after-tax, in other impairment charges associated with the pending sale of NMGC for the year ended December 31, 2024. (3) Includes Emera Energy’s USD adjusted net income from EES, Bear Swamp and interest expense on Emera Inc.’s USD denominated debt. (4) Excludes $73 million USD in MTM losses, after-tax, for the three months ended December 31, 2025 (2024 – $84 million USD MTM losses, after-tax) and $5 million in USD MTM gain, after-tax, for the year ended December 31, 2025 (2024 – $189 million USD MTM losses, after-tax). In Q4 2025, the translation impact of a stronger CAD on USD denominated earnings decreased adjusted net income by $3 million and decreased net income attributable to common shareholders by $3 million, compared to the same period in 2024. For the year ended December 31, 2025, the impact of a weaker CAD on US denominated earnings increased adjusted net income by $13 million and increased net income attributable to common shareholders by $49 million, compared to 2024. Impacts of the changes in the translation of the CAD include the impacts of Corporate FX hedges used to mitigate translation risk of USD earnings in the Other segment. Business Overview and Outlook Florida Electric Utility The Florida Electric Utility segment consists of TEC, a vertically integrated regulated electric utility engaged in the generation, transmission and distribution of electricity, serving customers in West Central Florida. With $14.5 billion USD of assets and approximately 866,000 customers at December 31, 2025, TEC owns 6,771 megawatts (“MW”) of generating capacity, of which 78 per cent is natural gas fired, 21 per cent is solar and 1 per cent is energy storage. TEC owns approximately 2,200 kilometres of transmission facilities and 21,100 kilometres of distribution facilities. TEC meets the planning criteria for reserve capacity established by the FPSC, which is a 20 per cent reserve margin over firm peak demand. TEC’s approved regulated ROE range is 9.50 per cent to 11.50 per cent based on an allowed equity capital structure of 54 per cent. An ROE of 10.50 per cent is used for the calculation of the return on investments for clauses. TEC anticipates earning within its allowed ROE range in 2026. USD earnings are expected to be higher in 2026 than 2025 as a result of new base rates effective January 1, 2026, and continued customer growth. On September 4, 2025, TEC petitioned the FPSC to increase base revenue by $88 million USD to reflect the 2026 adjustment in accordance with its 2024 rate case decision. On November 4, 2025, the FPSC approved the adjustment, with new rates effective January 1, 2026. EMERA 2025 ANNUAL REPORT 19
Strategic Management’s Discussion Consolidated Financial Emera Leadership Shareholder Overview and Analysis Statements and Board information On February 3, 2025, the FPSC issued the final order approving the 2024 rate case decision, effective January 1, 2025. For additional details on the 2024 rate case, refer to note 7 in Emera’s consolidated financial statements. In February 2025, a motion for reconsideration on certain aspects of the final order was filed by an intervening party with the FPSC. On May 6, 2025, the FPSC denied the motion for reconsideration, except with respect to immaterial calculation corrections, and the final order was issued on June 11, 2025. In March 2025, two intervening parties each filed a notice of appeal to the Florida Supreme Court regarding the outcome of TEC’s 2024 base rate proceeding. On January 12, 2026, the intervening parties filed their briefs related to the appeal. To date, the FPSC has not responded to the briefs. On February 4, 2025, the FPSC approved TEC’s petition for the recovery of $466 million USD of costs associated with Hurricane Idalia, Hurricane Debby, Hurricane Helene and Hurricane Milton, and the associated interest to replenish the storm reserve over an 18-month recovery period, which began in March 2025. The amount of cost-recovery is subject to a true-up mechanism with the FPSC. For additional details on the storm reserve, refer to note 7 in Emera’s consolidated financial statements. In 2026, capital investment in the Florida Electric Utility segment is expected to be $1.8 billion USD (2025 – $1.6 billion USD), including allowance for funds used during construction (“AFUDC”). Capital projects include investment in generation reliability projects and storm hardening, grid modernization, and transmission expansion. Canadian Electric Utilities The Canadian Electric Utilities segment includes NSPI and NSPML. NSPI is a vertically integrated regulated electric utility engaged in the generation, transmission and distribution of electricity and the primary electricity supplier to customers in Nova Scotia. NSPML is a 100 per cent equity interest in the Maritime Link Project (“Maritime Link”), a transmission project between the island of Newfoundland and Nova Scotia. NSPI With $8.1 billion of assets and approximately 565,000 customers at December 31, 2025, NSPI owns 2,422 MW of generating capacity, of which 44 per cent is coal and/or oil-fired; 28 per cent is natural gas and/or oil; 19 per cent is hydro, wind, or solar; seven per cent is petroleum coke (“petcoke”) and 2 per cent is biomass-fueled generation. In 2025, NSPI began operations of two 50 MW grid-scale battery facilities to enhance reliability. In addition, NSPI has contracts to purchase renewable energy from independent power producers (“IPPs”) and community feed-in tariff (“COMFIT”) participants, which own 573 MW of capacity. NSPI also has rights to 153 MW of Maritime Link capacity, representing Newfoundland and Labrador Hydro’s (“NLH”) Nova Scotia Block (“NS Block”) delivery obligations, as discussed below. NSPI owns approximately 5,400 kilometres of transmission facilities and 28,700 kilometres of distribution facilities. NLH is obligated to provide NSPI with approximately 900 Gigawatt hours (“GWh”) of energy annually over 35 years. In addition, until March 31, 2026, NLH is obligated to provide approximately 240 GWh of additional energy from the Supplemental Energy Block transmitted through the Maritime Link. NSPI has the option of purchasing additional market-priced energy from NLH through the Energy Access Agreement. The Energy Access Agreement enables NSPI to access a market-priced bid from NLH for up to 1.8 Terawatt hours (“TWh”) of energy in any given year and, on average, 1.2 TWh of energy per year through August 31, 2041. NSPI’s approved regulated ROE range is 8.75 per cent to 9.25 per cent, based on an actual five-quarter average regulated common equity component of up to 40 per cent of approved rate base. Assuming new base rates are approved by the NSEB in the general rate application (“GRA”) and are generally consistent with the settlement agreement, NSPI anticipates earning at the low end of its allowed ROE in 2026 and expects earnings in 2026 to be higher than 2025. Sales volumes are expected to be higher in 2026 than 2025. On September 18, 2025, NSPI filed a consensus GRA with the NSEB, reflecting a settlement agreement reached with customer representatives. The GRA proposes average annual rate increases of 1.8 per cent in 2026 and 2.4 per cent in 2027. The proposed rates would result in annual revenue (fuel and non-fuel) increases of $62 million in 2026 and $108 million in 2027. The hearing for the matter concluded in January 2026 and a decision by the NSEB is expected by early Q2 2026. On March 5, 2025, NSPI, the Canada Infrastructure Bank (“CIB”) and the Wskijinu’k Mtmo’taqnuow Agency (“WMA”) announced the Wasoqonatl transmission line project to create a reliability intertie between Nova Scotia and New Brunswick. The project is owned by a new regulated utility, WTI, which is wholly-owned by a newly formed limited partnership between NSPI, CIB and WMA. NSPI is responsible for providing construction, operation, maintenance and administrative services to WTI. NSPI has a 50 per cent indirect voting interest in WTI which is recorded as an “Investments subject to significant influence” on Emera’s Consolidated Balance Sheets. 20 EMERA 2025 ANNUAL REPORT
Strategic Management’s Discussion Consolidated Financial Emera Leadership Shareholder Overview and Analysis Statements and Board information In 2026, capital investment is expected to be $720 million (2025 – $712 million), including AFUDC. NSPI is primarily investing in capital projects required to support power system reliability and reliable service for customers. Environmental Legislation and Regulations NSPI is subject to environmental laws and regulations set by both the Government of Canada and the Province of Nova Scotia (the “Province”). NSPI continues to work with both levels of government to comply with these laws and regulations to maximize efficiency of emission control measures and minimize customer cost. NSPI anticipates that costs prudently incurred to achieve legislated compliance will be recoverable under NSPI’s regulatory framework. NSPI faces risks associated with achieving climate-related and environmental legislative requirements, including the risk of non-compliance, which could adversely affect NSPI’s operations and financial performance. For further discussion on these risks and environmental legislation and regulations, refer to the “Enterprise Risk and Risk Management” section. Recent developments related to provincial and federal environmental laws and regulations are outlined below. Nova Scotia Energy Reform Act: On October 15, 2025, the Nova Scotia Independent Energy System Operator (“IESO Nova Scotia”) announced that the organization will be phased in over two phases during an 18-month period. On December 1, 2025, the first phase was complete following the transfer of system planning and interconnection functions. The second phase is expected to be complete in 2027 as IESO Nova Scotia assumes responsibility for system operations. The establishment of IESO Nova Scotia follows Bill 404—Energy Reform (2024) Act enacted in April 2024, which established the NSEB, and phased transition to IESO Nova Scotia. Renewable Energy Regulations (“RER”): On May 26, 2023, NSPI initiated an appeal, through a proceeding with the NSEB, of the $10 million penalty levied on NSPI by the Province for non-compliance with the RER compliance period ending in 2022. The hearing concluded in 2025 and NSPI is awaiting a decision. NSPML Equity earnings from the Maritime Link are dependent on the approved ROE and operational performance of NSPML. NSPML’s approved regulated ROE range is 8.75 per cent to 9.25 per cent, based on an actual five-quarter average regulated common equity component of up to 30 per cent. Equity earnings from NSPML in 2026 are expected to be consistent with 2025. The NSPML investment is recorded as “Investments subject to significant influence” on Emera’s Consolidated Balance Sheets. The Maritime Link assets entered service on January 15, 2018, enabling the transmission of energy between Newfoundland and Nova Scotia, improved reliability and ancillary benefits, supporting the efficiency and reliability of energy in both provinces. NLH’s NS Block delivery obligations commenced on August 15, 2021 and will be delivered over the next 35 years pursuant to the project agreements. On December 23, 2025, NSPML received an interim order from the NSEB to collect up to $199 million from NSPI for the recovery of costs associated with the Maritime Link in 2026, subject to a monthly holdback of up to $4 million. A final decision from the NSEB is pending. There was no holdback recorded for the year ended December 31, 2025. On February 4, 2026, NSPML submitted an application with the NSEB requesting the termination of the holdback mechanism. A decision is anticipated in Q3 2026. In 2026, the capital investment at NSPML is expected to be approximately $40 million (2025 – $7 million). Gas Utilities and Infrastructure The Gas Utilities and Infrastructure segment includes PGS, NMGC, SeaCoast, Brunswick Pipeline and Emera’s equity investment in M&NP. PGS is a regulated gas distribution utility engaged in the purchase, distribution and sale of natural gas serving customers in Florida. NMGC is an intrastate regulated gas distribution utility engaged in the purchase, transmission, distribution and sale of natural gas serving customers in New Mexico. SeaCoast is a regulated intrastate natural gas transmission company offering services in Florida. Brunswick Pipeline is a regulated 145-kilometre pipeline delivering re-gasified liquefied natural gas from Saint John, New Brunswick, to markets in the northeastern US. On August 5, 2024, Emera announced an agreement to sell NMGC. As a result of the pending sale, NMGC’s assets and liabilities were classified as held for sale as of Q3 2024. The public hearing was held in November 2025. The transaction is expected to close in the first half of 2026. For more information on the pending transaction, refer to the “Other Developments” section. EMERA 2025 ANNUAL REPORT 21
Strategic Management’s Discussion Consolidated Financial Emera Leadership Shareholder Overview and Analysis Statements and Board information PGS With $3.3 billion USD of assets and approximately 523,000 customers, the PGS system includes approximately 25,600 kilometres of natural gas mains and 14,800 kilometres of service lines. Natural gas throughput (the amount of gas delivered to its customers, including transportation-only service) was 2 billion therms in 2025. Beginning in 2026, the approved ROE range for PGS is 9.30 per cent to 11.30 per cent (2025 – 9.15 per cent to 11.15 per cent) based on an allowed equity capital structure of 54.7 per cent (2025 – 54.7 per cent). An ROE of 10.30 per cent (2025 – 10.15 per cent) is used for the calculation of return on investments for clauses. PGS anticipates earning within its allowed ROE range in 2026. USD earnings are expected to be higher in 2026 than 2025, as a result of new base rates effective January 1, 2026, and continued customer growth. On March 31, 2025, PGS filed a rate case with the FPSC for new rates to become effective January 1, 2026. On August 13, 2025, PGS and the intervening parties filed a settlement agreement with the FPSC for a $67 million USD increase in 2026 annual base rates, which includes $7 million USD from the cast iron and bare steel replacement rider, and additional adjustments of $25 million USD in 2027 and up to $5 million USD in 2028 (subject to FPSC approval). This reflects a 10.30 per cent midpoint ROE and 54.7 per cent equity thickness. On October 31, 2025, the FPSC issued the final order approving the settlement. In 2026, capital investment is expected to be approximately $445 million USD (2025 – $323 million USD), including AFUDC. PGS will make investments to maintain the reliability of their systems and support customer growth. NMGC With $1.6 billion USD of assets and approximately 553,000 customers, NMGC’s system includes approximately 2,300 kilometres of transmission pipelines and 18,200 kilometres of distribution pipelines. Annual natural gas throughput was approximately one billion therms in 2025. The approved ROE for NMGC is 9.375 per cent, on an allowed equity capital structure of 52 per cent. NMGC’s USD earnings contribution to Emera in 2026 are expected to be lower than in 2025 as a result of the pending sale of NMGC, which is expected to close in the first half of 2026. Other Electric Utilities Other Electric Utilities includes Emera (Caribbean) Incorporated (“ECI”), a holding company with regulated electric utilities. ECI’s regulated utilities include vertically integrated regulated electric utilities of BLPC on the island of Barbados, GBPC on Grand Bahama Island, and an equity investment in Lucelec on the island of St. Lucia. Other Electric Utilities’ USD earnings in 2026 are expected to be consistent with the prior year. In 2026, capital investment in the Other Electric Utilities segment is expected to be approximately $110 million USD (2025 – $67 million USD), including AFUDC, primarily in more efficient and cleaner sources of generation, including renewables and battery storage. BLPC With $547 million USD of assets and approximately 137,000 customers, BLPC owns 243 MW of generating capacity, of which 96 per cent is oil-fired and 4 per cent is solar. BLPC owns approximately 200 kilometres of transmission facilities and 4,000 kilometres of distribution facilities. BLPC’s approved regulated return on rate base is 10 per cent. In 2021, BLPC submitted a general rate review application to the FTC. In September 2022, the FTC granted BLPC interim rate relief, allowing an increase in base rates of approximately $1 million USD per month. On February 15, 2023, the FTC issued a decision on the application that included the following significant items: an allowed regulatory ROE of 11.75 per cent, an equity capital structure of 55 per cent, a directive to update the major components of rate base to September 16, 2022, and a directive to establish regulatory liabilities totalling approximately $71 million USD. On March 7, 2023, BLPC filed a Motion for Review and Variation (the “Motion”) and applied for a stay of the FTC’s decision, which was subsequently granted. On November 20, 2023, the FTC issued their decision dismissing the Motion. Interim rates continue to be in effect through to a date to be determined in a final decision and order. 22 EMERA 2025 ANNUAL REPORT
Strategic Management’s Discussion Consolidated Financial Emera Leadership Shareholder Overview and Analysis Statements and Board information On December 1, 2023, BLPC appealed certain aspects of the FTC’s February 15 and November 20, 2023 decisions to the Supreme Court of Barbados in the High Court of Justice (the “Court”) and requested they be stayed. On December 11, 2023, the Court granted the stay. BLPC’s position is that the FTC made errors of law and jurisdiction in their decisions and believes the success of the appeal is probable, and as a result, the adjustments to BLPC’s final rates and rate base, including any adjustments to regulatory assets and liabilities, have not been recorded at this time. The appeal was heard in December 2025, and will continue in early 2026. A decision is expected in 2026. BLPC currently operates pursuant to a single integrated licence to generate, transmit and distribute electricity on the island of Barbados until 2028. In 2019, the Government of Barbados passed legislation requiring multiple licences for the supply of electricity. In November 2025, the Government of Barbados and BLPC agreed to new Transmission, Distribution, Sales and Dispatch (“T&D”) and Generation and Energy Storage (“G&S”) licences. The G&S licence will be valid until 2047, unless otherwise extended. The T&DLicence will be valid for 30 years. These new non-exclusive licences have since been signed and will become effective upon the repeal of the existing license. BLPC continues to operate under its current statutory authority while preparing for the transition to the new licensing framework. GBPC With $378 million USD of assets and approximately 20,000 customers, GBPC owns 98 MW of oil-fired generation, approximately 100 kilometres of transmission facilities and 1,000 kilometres of distribution facilities. GBPC’s approved regulatory return on rate base is 8.52 per cent. On August 1, 2024, as required by the GBPA Operating Protocol and Regulatory Framework Agreement, GBPC filed a rate plan proposal. A review of the proposal by the GBPA is expected to commence in the first half of 2026. On June 1, 2024, the Electricity Act, 2024 took effect. The legislation purports to remove the jurisdiction of the GBPA over GBPC and to have the Utilities Regulation and Competition Authority (“URCA”), another Bahamian regulator, regulate GBPC. In 2024, URCA filed a claim in the Supreme Court of the Bahamas, seeking an order that the GBPA be prohibited and restrained from considering and/or approving any adjustment to rates sought by GBPC. URCA contends that it has regulatory authority over electricity provision on Grand Bahama pursuant to the Electricity Act. Management does not expect that the outcome of the proceedings will have a material impact to Emera. Other The Other segment includes business operations that in a normal year are below the required threshold for reporting as separate segments; and corporate expense and revenue items that are not directly allocated to Emera’s subsidiaries and investments. Business operations in the Other segment include Corporate; Emera Energy Services (“EES”), a physical energy marketing and trading business; and a 50 per cent joint venture interest in Bear Swamp, a 660 MW pumped storage hydroelectric facility in northwestern Massachusetts. Corporate includes certain corporate-wide functions including executive management, strategic planning, treasury services, legal, financial reporting, tax planning, corporate business development, corporate governance, investor relations, risk management, insurance, acquisition and disposition related costs, gains or losses on select assets sales, and corporate human resource activities. It includes interest revenue on intercompany financings and interest expense on corporate debt in both Canada and the US. Earnings from EES are generally dependent on market conditions. In particular, volatility in natural gas and electricity markets, which can be influenced by weather, local supply constraints and other supply and demand factors, can provide higher levels of margin opportunity. The business is seasonal, with Q1 and Q4 usually providing the greatest opportunity for earnings. EES is generally expected to deliver annual adjusted net income of $15 million USD to $30 million USD. In light of strong market conditions in early 2026, EES expects USD adjusted net income for 2026 to be in line with 2025 results. The adjusted net loss from the Other segment in 2026 is expected to be consistent with 2025. In 2026, capital investment is expected to be approximately $10 million (2025 – $6 million). EMERA 2025 ANNUAL REPORT 23
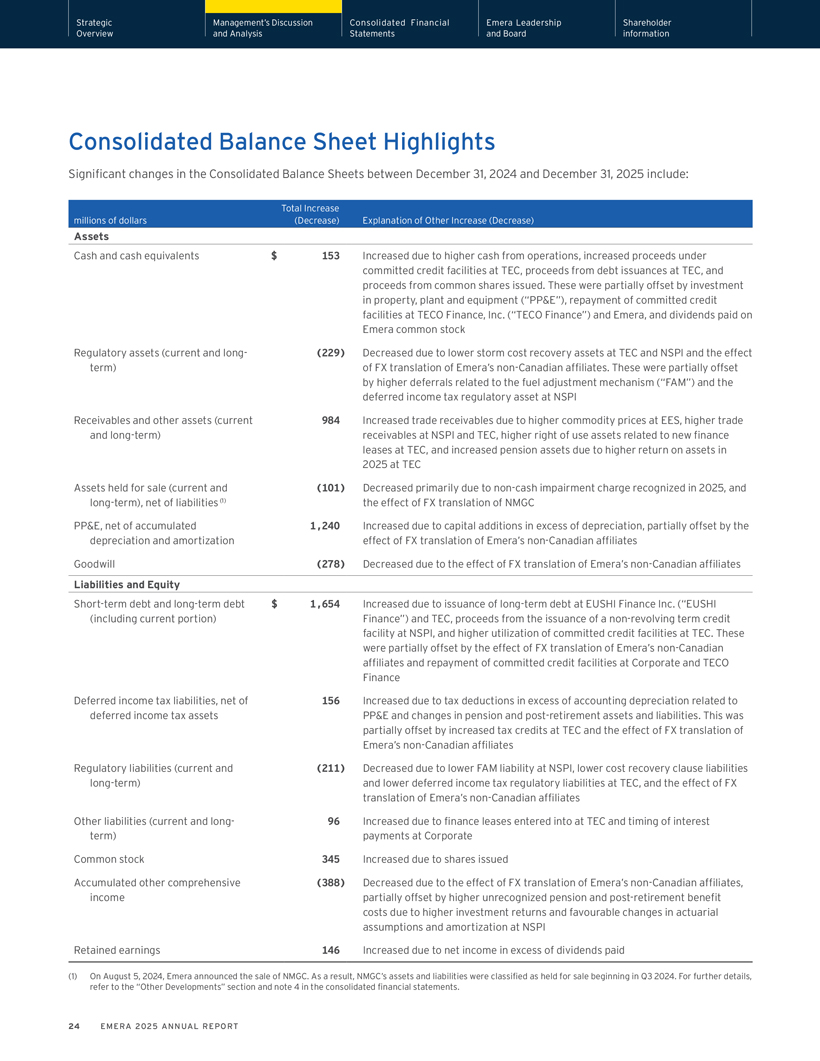
Strategic Management’s Discussion Consolidated Financial Emera Leadership Shareholder Overview and Analysis Statements and Board information Consolidated Balance Sheet Highlights Significant changes in the Consolidated Balance Sheets between December 31, 2024 and December 31, 2025 include: Total Increase millions of dollars (Decrease) Explanation of Other Increase (Decrease) Assets Cash and cash equivalents $ 153 Increased due to higher cash from operations, increased proceeds under committed credit facilities at TEC, proceeds from debt issuances at TEC, and proceeds from common shares issued. These were partially offset by investment in property, plant and equipment (“PP&E”), repayment of committed credit facilities at TECO Finance, Inc. (“TECO Finance”) and Emera, and dividends paid on Emera common stock Regulatory assets (current and long- (229) Decreased due to lower storm cost recovery assets at TEC and NSPI and the effect term) of FX translation of Emera’s non-Canadian affiliates. These were partially offset by higher deferrals related to the fuel adjustment mechanism (“FAM”) and the deferred income tax regulatory asset at NSPI Receivables and other assets (current 984 Increased trade receivables due to higher commodity prices at EES, higher trade and long-term) receivables at NSPI and TEC, higher right of use assets related to new finance leases at TEC, and increased pension assets due to higher return on assets in 2025 at TEC Assets held for sale (current and (101) Decreased primarily due to non-cash impairment charge recognized in 2025, and long-term), net of liabilities (1) the effect of FX translation of NMGC PP&E, net of accumulated 1,240 Increased due to capital additions in excess of depreciation, partially offset by the depreciation and amortization effect of FX translation of Emera’s non-Canadian affiliates Goodwill (278) Decreased due to the effect of FX translation of Emera’s non-Canadian affiliates Liabilities and Equity Short-term debt and long-term debt $ 1,654 Increased due to issuance of long-term debt at EUSHI Finance Inc. (“EUSHI (including current portion) Finance”) and TEC, proceeds from the issuance of a non-revolving term credit facility at NSPI, and higher utilization of committed credit facilities at TEC. These were partially offset by the effect of FX translation of Emera’s non-Canadian affiliates and repayment of committed credit facilities at Corporate and TECO Finance Deferred income tax liabilities, net of 156 Increased due to tax deductions in excess of accounting depreciation related to deferred income tax assets PP&E and changes in pension and post-retirement assets and liabilities. This was partially offset by increased tax credits at TEC and the effect of FX translation of Emera’s non-Canadian affiliates Regulatory liabilities (current and (211) Decreased due to lower FAM liability at NSPI, lower cost recovery clause liabilities long-term) and lower deferred income tax regulatory liabilities at TEC, and the effect of FX translation of Emera’s non-Canadian affiliates Other liabilities (current and long- 96 Increased due to finance leases entered into at TEC and timing of interest term) payments at Corporate Common stock 345 Increased due to shares issued Accumulated other comprehensive (388) Decreased due to the effect of FX translation of Emera’s non-Canadian affiliates, income partially offset by higher unrecognized pension and post-retirement benefit costs due to higher investment returns and favourable changes in actuarial assumptions and amortization at NSPI Retained earnings 146 Increased due to net income in excess of dividends paid (1) On August 5, 2024, Emera announced the sale of NMGC. As a result, NMGC’s assets and liabilities were classified as held for sale beginning in Q3 2024. For further details, refer to the “Other Developments” section and note 4 in the consolidated financial statements. 24 EMERA 2025 ANNUAL REPORT
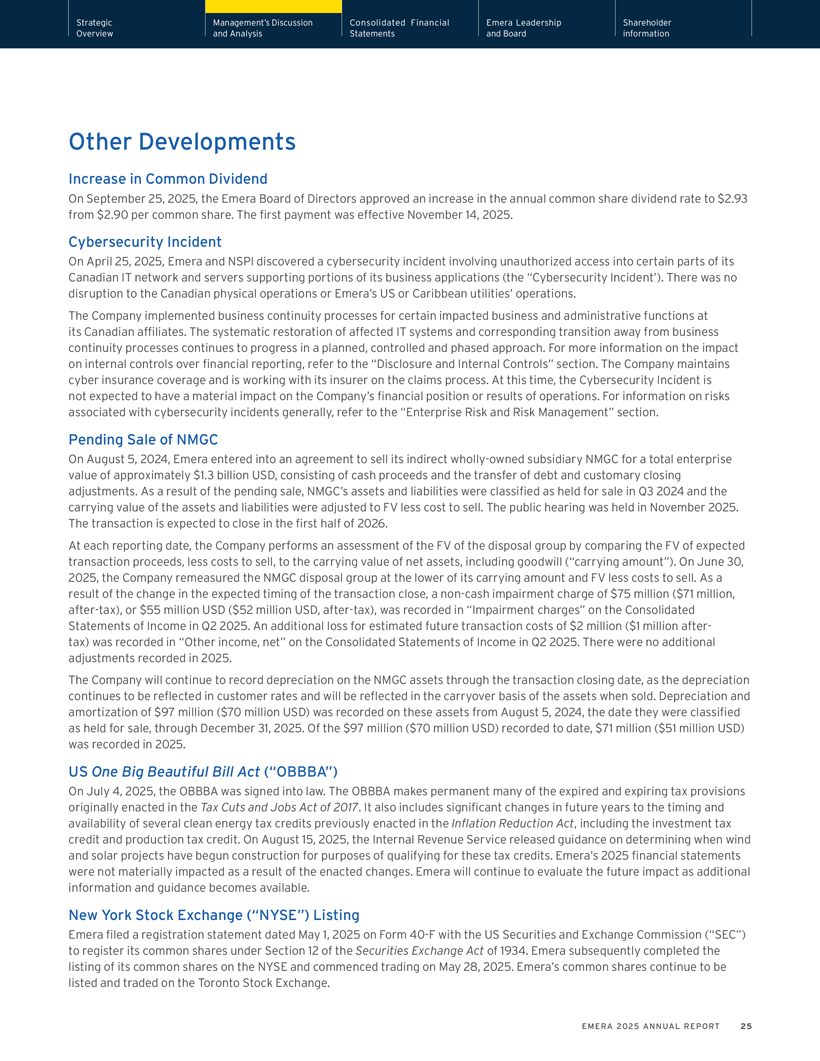
Strategic Management’s Discussion Consolidated Financial Emera Leadership Shareholder Overview and Analysis Statements and Board information Other Developments Increase in Common Dividend On September 25, 2025, the Emera Board of Directors approved an increase in the annual common share dividend rate to $2.93 from $2.90 per common share. The first payment was effective November 14, 2025. Cybersecurity Incident On April 25, 2025, Emera and NSPI discovered a cybersecurity incident involving unauthorized access into certain parts of its Canadian IT network and servers supporting portions of its business applications (the “Cybersecurity Incident’). There was no disruption to the Canadian physical operations or Emera’s US or Caribbean utilities’ operations. The Company implemented business continuity processes for certain impacted business and administrative functions at its Canadian affiliates. The systematic restoration of affected IT systems and corresponding transition away from business continuity processes continues to progress in a planned, controlled and phased approach. For more information on the impact on internal controls over financial reporting, refer to the “Disclosure and Internal Controls” section. The Company maintains cyber insurance coverage and is working with its insurer on the claims process. At this time, the Cybersecurity Incident is not expected to have a material impact on the Company’s financial position or results of operations. For information on risks associated with cybersecurity incidents generally, refer to the “Enterprise Risk and Risk Management” section. Pending Sale of NMGC On August 5, 2024, Emera entered into an agreement to sell its indirect wholly-owned subsidiary NMGC for a total enterprise value of approximately $1.3 billion USD, consisting of cash proceeds and the transfer of debt and customary closing adjustments. As a result of the pending sale, NMGC’s assets and liabilities were classified as held for sale in Q3 2024 and the carrying value of the assets and liabilities were adjusted to FV less cost to sell. The public hearing was held in November 2025. The transaction is expected to close in the first half of 2026. At each reporting date, the Company performs an assessment of the FV of the disposal group by comparing the FV of expected transaction proceeds, less costs to sell, to the carrying value of net assets, including goodwill (“carrying amount”). On June 30, 2025, the Company remeasured the NMGC disposal group at the lower of its carrying amount and FV less costs to sell. As a result of the change in the expected timing of the transaction close, a non-cash impairment charge of $75 million ($71 million, after-tax), or $55 million USD ($52 million USD, after-tax), was recorded in “Impairment charges” on the Consolidated Statements of Income in Q2 2025. An additional loss for estimated future transaction costs of $2 million ($1 million after-tax) was recorded in “Other income, net” on the Consolidated Statements of Income in Q2 2025. There were no additional adjustments recorded in 2025. The Company will continue to record depreciation on the NMGC assets through the transaction closing date, as the depreciation continues to be reflected in customer rates and will be reflected in the carryover basis of the assets when sold. Depreciation and amortization of $97 million ($70 million USD) was recorded on these assets from August 5, 2024, the date they were classified as held for sale, through December 31, 2025. Of the $97 million ($70 million USD) recorded to date, $71 million ($51 million USD) was recorded in 2025. US One Big Beautiful Bill Act (“OBBBA”) On July 4, 2025, the OBBBA was signed into law. The OBBBA makes permanent many of the expired and expiring tax provisions originally enacted in the Tax Cuts and Jobs Act of 2017. It also includes significant changes in future years to the timing and availability of several clean energy tax credits previously enacted in the Inflation Reduction Act, including the investment tax credit and production tax credit. On August 15, 2025, the Internal Revenue Service released guidance on determining when wind and solar projects have begun construction for purposes of qualifying for these tax credits. Emera’s 2025 financial statements were not materially impacted as a result of the enacted changes. Emera will continue to evaluate the future impact as additional information and guidance becomes available. New York Stock Exchange (“NYSE”) Listing Emera filed a registration statement dated May 1, 2025 on Form 40-F with the US Securities and Exchange Commission (“SEC”) to register its common shares under Section 12 of the Securities Exchange Act of 1934. Emera subsequently completed the listing of its common shares on the NYSE and commenced trading on May 28, 2025. Emera’s common shares continue to be listed and traded on the Toronto Stock Exchange. EMERA 2025 ANNUAL REPORT 25
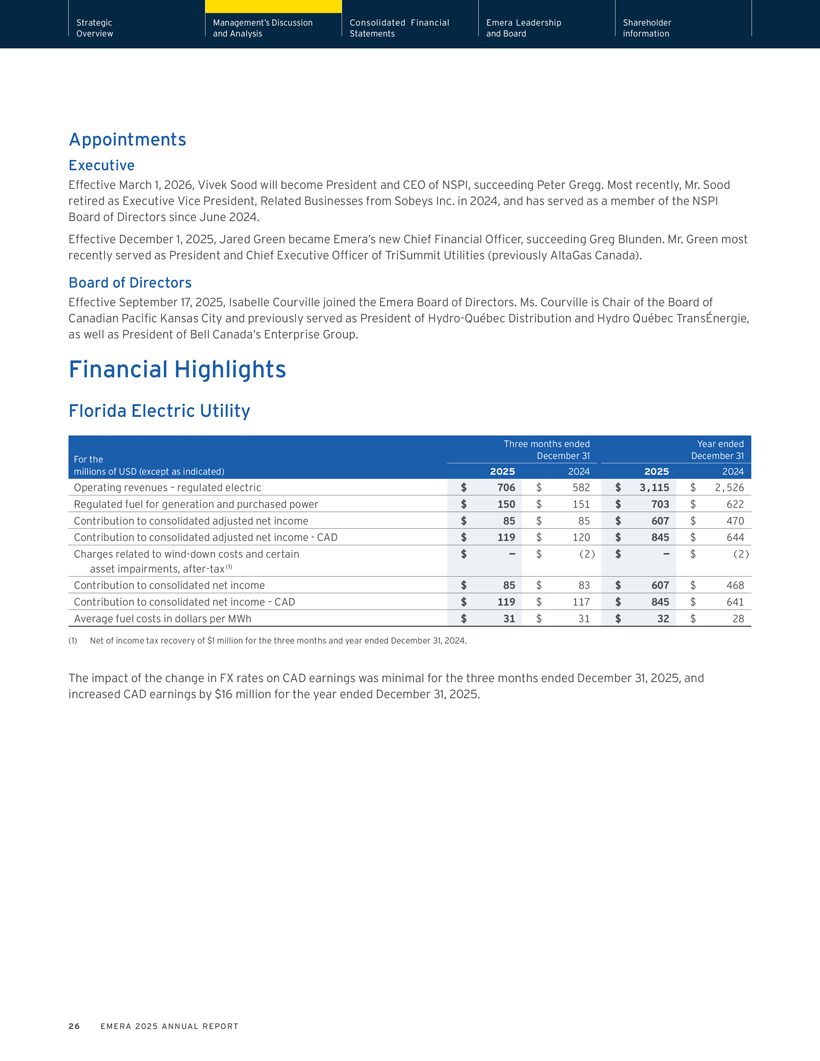
Strategic Management’s Discussion Consolidated Financial Emera Leadership Shareholder Overview and Analysis Statements and Board information Appointments Executive Effective March 1, 2026, Vivek Sood will become President and CEO of NSPI, succeeding Peter Gregg. Most recently, Mr. Sood retired as Executive Vice President, Related Businesses from Sobeys Inc. in 2024, and has served as a member of the NSPI Board of Directors since June 2024. Effective December 1, 2025, Jared Green became Emera’s new Chief Financial Officer, succeeding Greg Blunden. Mr. Green most recently served as President and Chief Executive Officer of TriSummit Utilities (previously AltaGas Canada). Board of Directors Effective September 17, 2025, Isabelle Courville joined the Emera Board of Directors. Ms. Courville is Chair of the Board of Canadian Pacific Kansas City and previously served as President of Hydro-Québec Distribution and Hydro Québec TransÉnergie, as well as President of Bell Canada’s Enterprise Group. Financial Highlights Florida Electric Utility Three months ended Year ended For the December 31 December 31 millions of USD (except as indicated) 2025 2024 2025 2024 Operating revenues – regulated electric $ 706 $ 582 $ 3,115 $ 2,526 Regulated fuel for generation and purchased power $ 150 $ 151 $ 703 $ 622 Contribution to consolidated adjusted net income $ 85 $ 85 $ 607 $ 470 Contribution to consolidated adjusted net income—CAD $ 119 $ 120 $ 845 $ 644 Charges related to wind-down costs and certain $ — $ (2) $ — $ (2) asset impairments, after-tax (1) Contribution to consolidated net income $ 85 $ 83 $ 607 $ 468 Contribution to consolidated net income – CAD $ 119 $ 117 $ 845 $ 641 Average fuel costs in dollars per MWh $ 31 $ 31 $ 32 $ 28 (1) Net of income tax recovery of $1 million for the three months and year ended December 31, 2024. The impact of the change in FX rates on CAD earnings was minimal for the three months ended December 31, 2025, and increased CAD earnings by $16 million for the year ended December 31, 2025. 26 EMERA 2025 ANNUAL REPORT
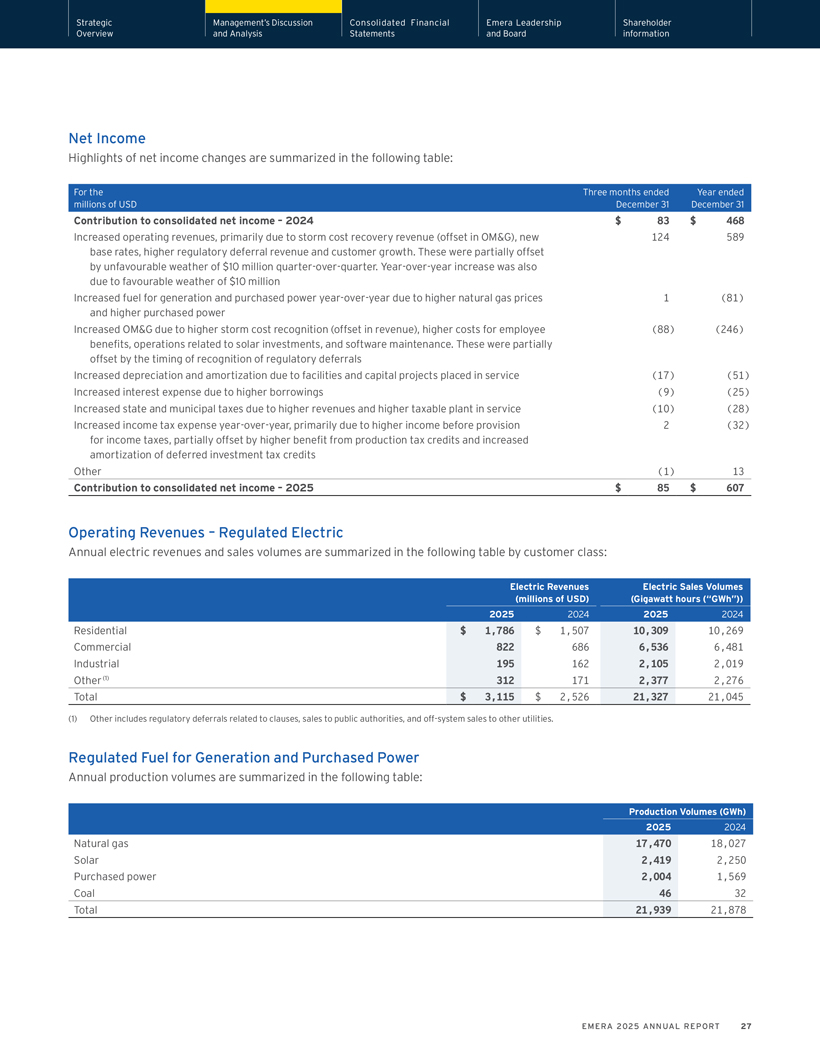
Strategic Management’s Discussion Consolidated Financial Emera Leadership Shareholder Overview and Analysis Statements and Board information Net Income Highlights of net income changes are summarized in the following table: For the Three months ended Year ended millions of USD December 31 December 31 Contribution to consolidated net income – 2024 $ 83 $ 468 Increased operating revenues, primarily due to storm cost recovery revenue (offset in OM&G), new 124 589 base rates, higher regulatory deferral revenue and customer growth. These were partially offset by unfavourable weather of $10 million quarter-over-quarter. Year-over-year increase was also due to favourable weather of $10 million Increased fuel for generation and purchased power year-over-year due to higher natural gas prices 1 (81) and higher purchased power Increased OM&G due to higher storm cost recognition (offset in revenue), higher costs for employee (88) (246) benefits, operations related to solar investments, and software maintenance. These were partially offset by the timing of recognition of regulatory deferrals Increased depreciation and amortization due to facilities and capital projects placed in service (17) (51) Increased interest expense due to higher borrowings (9) (25) Increased state and municipal taxes due to higher revenues and higher taxable plant in service (10) (28) Increased income tax expense year-over-year, primarily due to higher income before provision 2 (32) for income taxes, partially offset by higher benefit from production tax credits and increased amortization of deferred investment tax credits Other (1) 13 Contribution to consolidated net income – 2025 $ 85 $ 607 Operating Revenues – Regulated Electric Annual electric revenues and sales volumes are summarized in the following table by customer class: Electric Revenues Electric Sales Volumes (millions of USD) (Gigawatt hours (“GWh”)) 2025 2024 2025 2024 Residential $ 1,786 $ 1,507 10,309 10,269 Commercial 822 686 6,536 6,481 Industrial 195 162 2,105 2,019 Other (1) 312 171 2,377 2,276 Total $ 3,115 $ 2,526 21,327 21,045 (1) Other includes regulatory deferrals related to clauses, sales to public authorities, and off-system sales to other utilities. Regulated Fuel for Generation and Purchased Power Annual production volumes are summarized in the following table: Production Volumes (GWh) 2025 2024 Natural gas 17,470 18,027 Solar 2,419 2,250 Purchased power 2,004 1,569 Coal 46 32 Total 21,939 21,878 EMERA 2025 ANNUAL REPORT 27
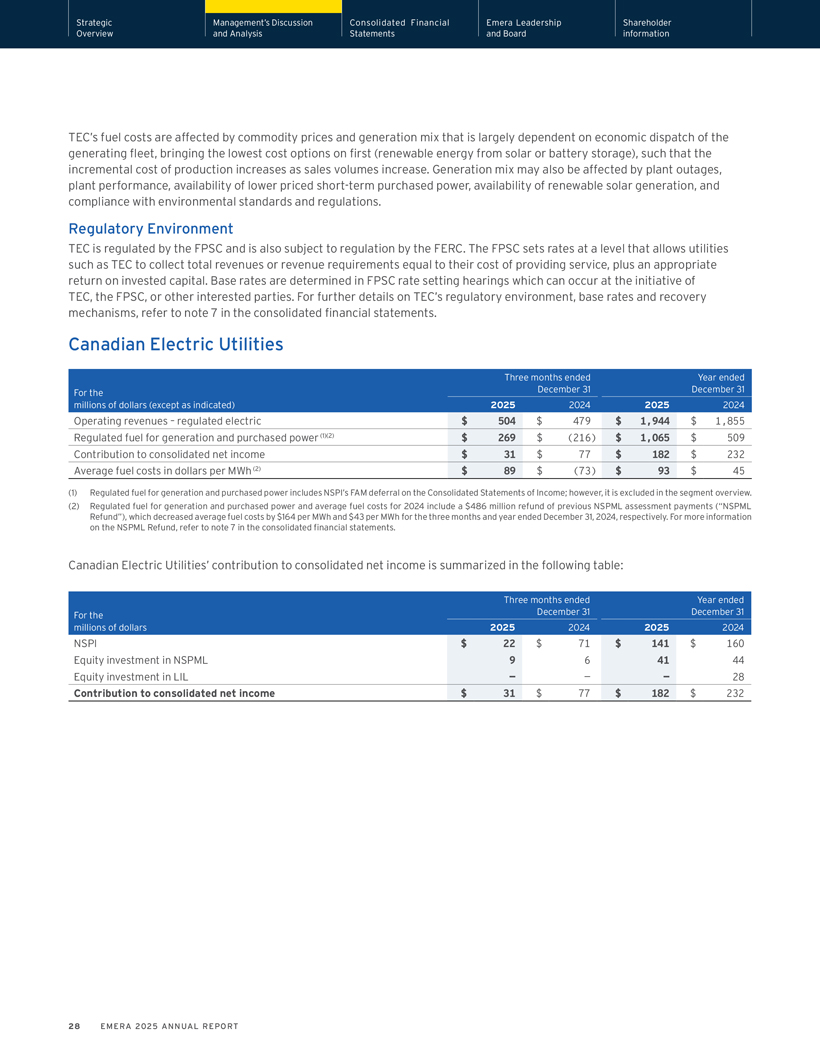
Strategic Management’s Discussion Consolidated Financial Emera Leadership Shareholder Overview and Analysis Statements and Board information TEC’s fuel costs are affected by commodity prices and generation mix that is largely dependent on economic dispatch of the generating fleet, bringing the lowest cost options on first (renewable energy from solar or battery storage), such that the incremental cost of production increases as sales volumes increase. Generation mix may also be affected by plant outages, plant performance, availability of lower priced short-term purchased power, availability of renewable solar generation, and compliance with environmental standards and regulations. Regulatory Environment TEC is regulated by the FPSC and is also subject to regulation by the FERC. The FPSC sets rates at a level that allows utilities such as TEC to collect total revenues or revenue requirements equal to their cost of providing service, plus an appropriate return on invested capital. Base rates are determined in FPSC rate setting hearings which can occur at the initiative of TEC, the FPSC, or other interested parties. For further details on TEC’s regulatory environment, base rates and recovery mechanisms, refer to note 7 in the consolidated financial statements. Canadian Electric Utilities Three months ended Year ended For the December 31 December 31 millions of dollars (except as indicated) 2025 2024 2025 2024 Operating revenues – regulated electric $ 504 $ 479 $ 1,944 $ 1,855 Regulated fuel for generation and purchased power (1)(2) $ 269 $ (216) $ 1,065 $ 509 Contribution to consolidated net income $ 31 $ 77 $ 182 $ 232 Average fuel costs in dollars per MWh (2) $ 89 $ (73) $ 93 $ 45 (1) Regulated fuel for generation and purchased power includes NSPI’s FAM deferral on the Consolidated Statements of Income; however, it is excluded in the segment overview. (2) Regulated fuel for generation and purchased power and average fuel costs for 2024 include a $486 million refund of previous NSPML assessment payments (“NSPML Refund”), which decreased average fuel costs by $164 per MWh and $43 per MWh for the three months and year ended December 31, 2024, respectively. For more information on the NSPML Refund, refer to note 7 in the consolidated financial statements. Canadian Electric Utilities’ contribution to consolidated net income is summarized in the following table: Three months ended Year ended For the December 31 December 31 millions of dollars 2025 2024 2025 2024 NSPI $ 22 $ 71 $ 141 $ 160 Equity investment in NSPML 9 6 41 44 Equity investment in LIL — — — 28 Contribution to consolidated net income $ 31 $ 77 $ 182 $ 232 28 EMERA 2025 ANNUAL REPORT
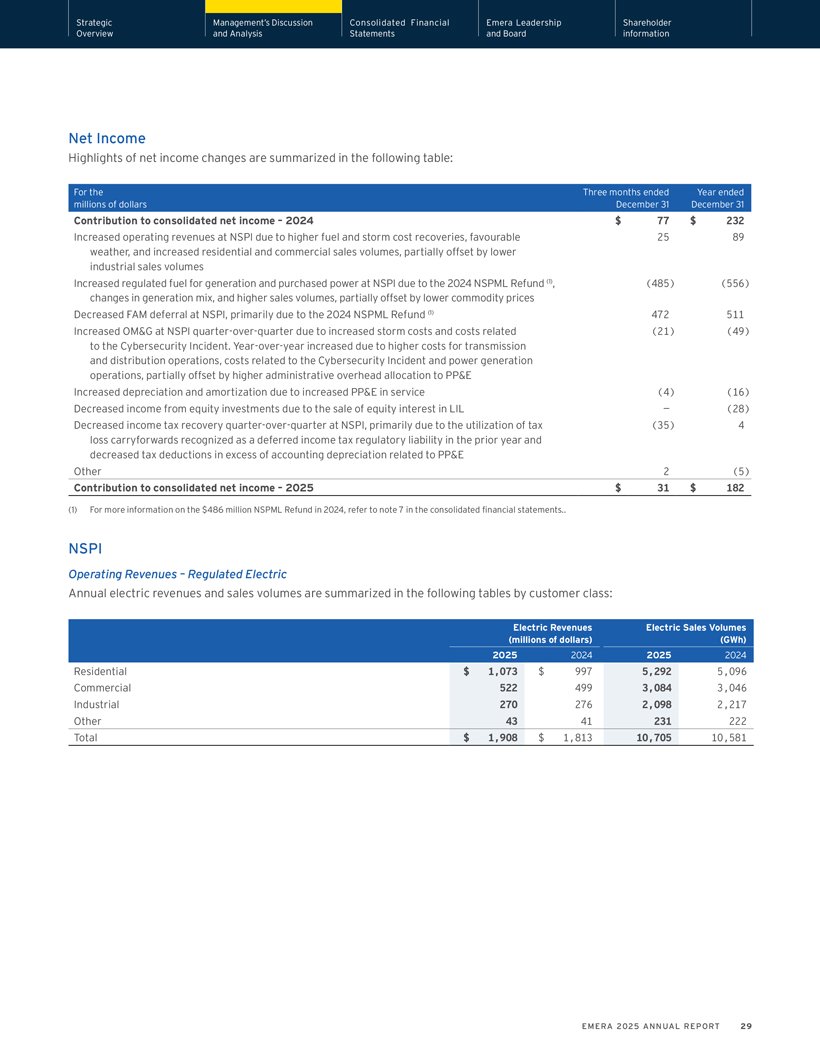
Strategic Management’s Discussion Consolidated Financial Emera Leadership Shareholder Overview and Analysis Statements and Board information Net Income Highlights of net income changes are summarized in the following table: For the Three months ended Year ended millions of dollars December 31 December 31 Contribution to consolidated net income – 2024 $ 77 $ 232 Increased operating revenues at NSPI due to higher fuel and storm cost recoveries, favourable 25 89 weather, and increased residential and commercial sales volumes, partially offset by lower industrial sales volumes Increased regulated fuel for generation and purchased power at NSPI due to the 2024 NSPML Refund (1), (485) (556) changes in generation mix, and higher sales volumes, partially offset by lower commodity prices Decreased FAM deferral at NSPI, primarily due to the 2024 NSPML Refund (1) 472 511 Increased OM&G at NSPI quarter-over-quarter due to increased storm costs and costs related (21) (49) to the Cybersecurity Incident. Year-over-year increased due to higher costs for transmission and distribution operations, costs related to the Cybersecurity Incident and power generation operations, partially offset by higher administrative overhead allocation to PP&E Increased depreciation and amortization due to increased PP&E in service (4) (16) Decreased income from equity investments due to the sale of equity interest in LIL — (28) Decreased income tax recovery quarter-over-quarter at NSPI, primarily due to the utilization of tax (35) 4 loss carryforwards recognized as a deferred income tax regulatory liability in the prior year and decreased tax deductions in excess of accounting depreciation related to PP&E Other 2 (5) Contribution to consolidated net income – 2025 $ 31 $ 182 (1) For more information on the $486 million NSPML Refund in 2024, refer to note 7 in the consolidated financial statements.. NSPI Operating Revenues – Regulated Electric Annual electric revenues and sales volumes are summarized in the following tables by customer class: Electric Revenues Electric Sales Volumes (millions of dollars) (GWh) 2025 2024 2025 2024 Residential $ 1,073 $ 997 5,292 5,096 Commercial 522 499 3,084 3,046 Industrial 270 276 2,098 2,217 Other 43 41 231 222 Total $ 1,908 $ 1,813 10,705 10,581 EMERA 2025 ANNUAL REPORT 29
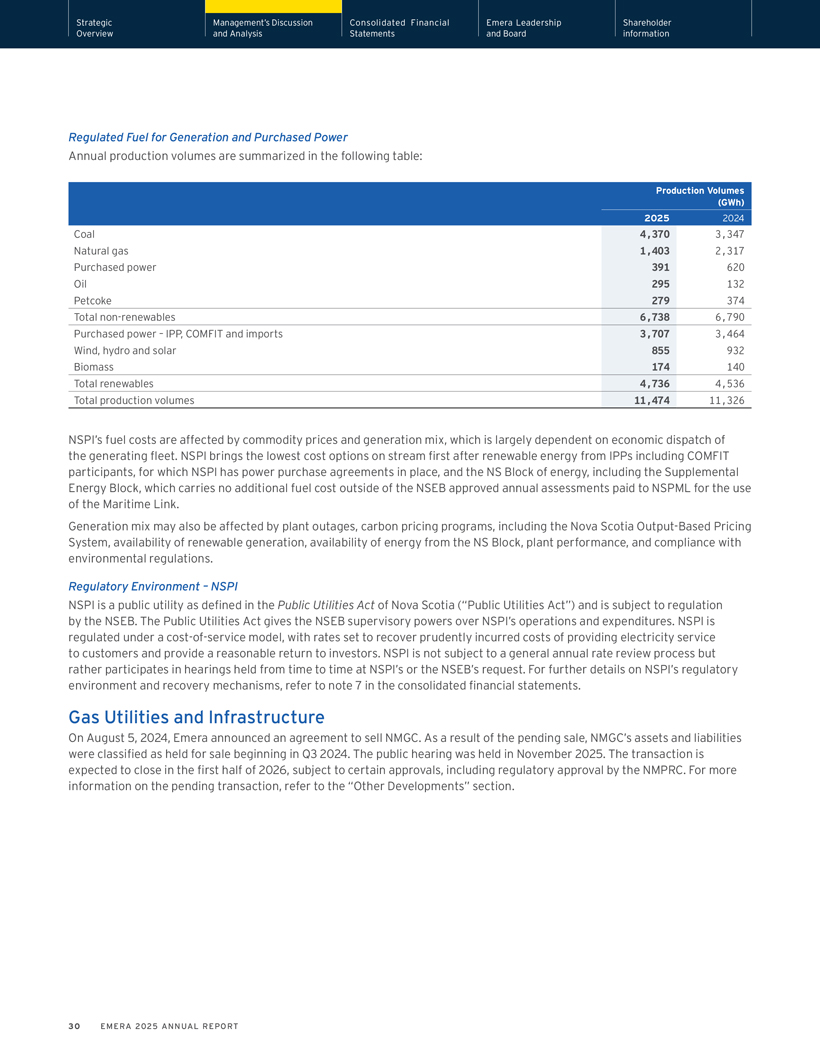
Strategic Management’s Discussion Consolidated Financial Emera Leadership Shareholder Overview and Analysis Statements and Board information Regulated Fuel for Generation and Purchased Power Annual production volumes are summarized in the following table: Production Volumes (GWh) 2025 2024 Coal 4,370 3,347 Natural gas 1,403 2,317 Purchased power 391 620 Oil 295 132 Petcoke 279 374 Total non-renewables 6,738 6,790 Purchased power – IPP, COMFIT and imports 3,707 3,464 Wind, hydro and solar 855 932 Biomass 174 140 Total renewables 4,736 4,536 Total production volumes 11,474 11,326 NSPI’s fuel costs are affected by commodity prices and generation mix, which is largely dependent on economic dispatch of the generating fleet. NSPI brings the lowest cost options on stream first after renewable energy from IPPs including COMFIT participants, for which NSPI has power purchase agreements in place, and the NS Block of energy, including the Supplemental Energy Block, which carries no additional fuel cost outside of the NSEB approved annual assessments paid to NSPML for the use of the Maritime Link. Generation mix may also be affected by plant outages, carbon pricing programs, including the Nova Scotia Output-Based Pricing System, availability of renewable generation, availability of energy from the NS Block, plant performance, and compliance with environmental regulations. Regulatory Environment – NSPI NSPI is a public utility as defined in the Public Utilities Act of Nova Scotia (“Public Utilities Act”) and is subject to regulation by the NSEB. The Public Utilities Act gives the NSEB supervisory powers over NSPI’s operations and expenditures. NSPI is regulated under a cost-of-service model, with rates set to recover prudently incurred costs of providing electricity service to customers and provide a reasonable return to investors. NSPI is not subject to a general annual rate review process but rather participates in hearings held from time to time at NSPI’s or the NSEB’s request. For further details on NSPI’s regulatory environment and recovery mechanisms, refer to note 7 in the consolidated financial statements. Gas Utilities and Infrastructure On August 5, 2024, Emera announced an agreement to sell NMGC. As a result of the pending sale, NMGC’s assets and liabilities were classified as held for sale beginning in Q3 2024. The public hearing was held in November 2025. The transaction is expected to close in the first half of 2026, subject to certain approvals, including regulatory approval by the NMPRC. For more information on the pending transaction, refer to the “Other Developments” section. 30 EMERA 2025 ANNUAL REPORT
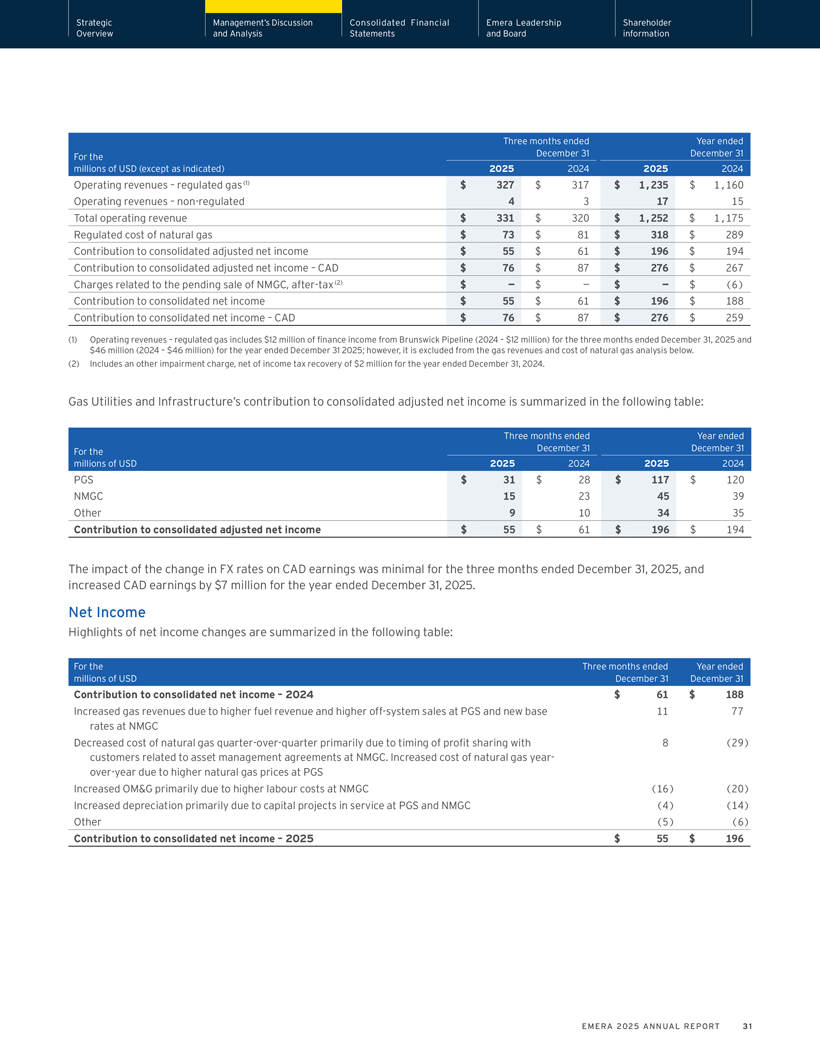
Strategic Management’s Discussion Consolidated Financial Emera Leadership Shareholder Overview and Analysis Statements and Board information Three months ended Year ended For the December 31 December 31 millions of USD (except as indicated) 2025 2024 2025 2024 Operating revenues – regulated gas (1) $ 327 $ 317 $ 1,235 $ 1,160 Operating revenues – non-regulated 4 3 17 15 Total operating revenue $ 331 $ 320 $ 1,252 $ 1,175 Regulated cost of natural gas $ 73 $ 81 $ 318 $ 289 Contribution to consolidated adjusted net income $ 55 $ 61 $ 196 $ 194 Contribution to consolidated adjusted net income – CAD $ 76 $ 87 $ 276 $ 267 Charges related to the pending sale of NMGC, after-tax (2) $ — $ — $ — $ (6) Contribution to consolidated net income $ 55 $ 61 $ 196 $ 188 Contribution to consolidated net income – CAD $ 76 $ 87 $ 276 $ 259 (1) Operating revenues – regulated gas includes $12 million of finance income from Brunswick Pipeline (2024 – $12 million) for the three months ended December 31, 2025 and $46 million (2024 – $46 million) for the year ended December 31 2025; however, it is excluded from the gas revenues and cost of natural gas analysis below. (2) Includes an other impairment charge, net of income tax recovery of $2 million for the year ended December 31, 2024. Gas Utilities and Infrastructure’s contribution to consolidated adjusted net income is summarized in the following table: Three months ended Year ended For the December 31 December 31 millions of USD 2025 2024 2025 2024 PGS $ 31 $ 28 $ 117 $ 120 NMGC 15 23 45 39 Other 9 10 34 35 Contribution to consolidated adjusted net income $ 55 $ 61 $ 196 $ 194 The impact of the change in FX rates on CAD earnings was minimal for the three months ended December 31, 2025, and increased CAD earnings by $7 million for the year ended December 31, 2025. Net Income Highlights of net income changes are summarized in the following table: For the Three months ended Year ended millions of USD December 31 December 31 Contribution to consolidated net income – 2024 $ 61 $ 188 Increased gas revenues due to higher fuel revenue and higher off-system sales at PGS and new base 11 77 rates at NMGC Decreased cost of natural gas quarter-over-quarter primarily due to timing of profit sharing with 8 (29) customers related to asset management agreements at NMGC. Increased cost of natural gas year-over-year due to higher natural gas prices at PGS Increased OM&G primarily due to higher labour costs at NMGC (16) (20) Increased depreciation primarily due to capital projects in service at PGS and NMGC (4) (14) Other (5) (6) Contribution to consolidated net income – 2025 $ 55 $ 196 EMERA 2025 ANNUAL REPORT 31
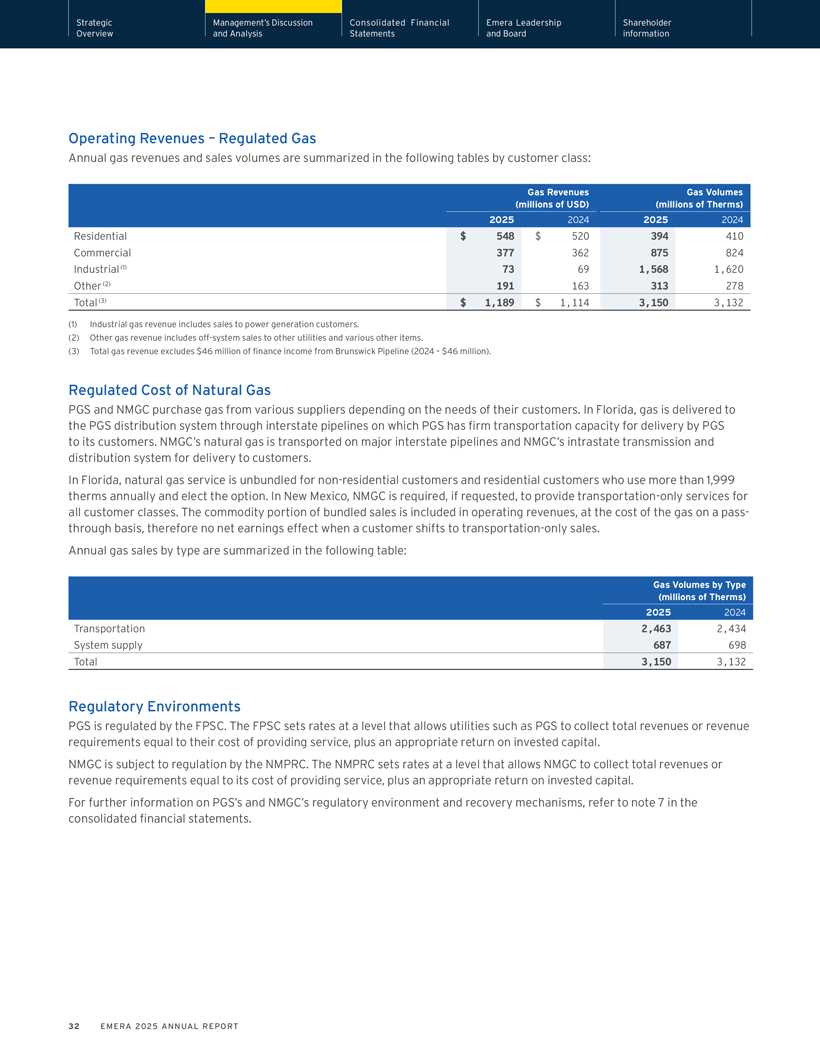
Strategic Management’s Discussion Consolidated Financial Emera Leadership Shareholder Overview and Analysis Statements and Board information Operating Revenues – Regulated Gas Annual gas revenues and sales volumes are summarized in the following tables by customer class: Gas Revenues Gas Volumes (millions of USD) (millions of Therms) 2025 2024 2025 2024 Residential $ 548 $ 520 394 410 Commercial 377 362 875 824 Industrial (1) 73 69 1,568 1,620 Other (2) 191 163 313 278 Total (3) $ 1,189 $ 1,114 3,150 3,132 (1) Industrial gas revenue includes sales to power generation customers. (2) Other gas revenue includes off-system sales to other utilities and various other items. (3) Total gas revenue excludes $46 million of finance income from Brunswick Pipeline (2024 – $46 million). Regulated Cost of Natural Gas PGS and NMGC purchase gas from various suppliers depending on the needs of their customers. In Florida, gas is delivered to the PGS distribution system through interstate pipelines on which PGS has firm transportation capacity for delivery by PGS to its customers. NMGC’s natural gas is transported on major interstate pipelines and NMGC’s intrastate transmission and distribution system for delivery to customers. In Florida, natural gas service is unbundled for non-residential customers and residential customers who use more than 1,999 therms annually and elect the option. In New Mexico, NMGC is required, if requested, to provide transportation-only services for all customer classes. The commodity portion of bundled sales is included in operating revenues, at the cost of the gas on a pass-through basis, therefore no net earnings effect when a customer shifts to transportation-only sales. Annual gas sales by type are summarized in the following table: Gas Volumes by Type (millions of Therms) 2025 2024 Transportation 2,463 2,434 System supply 687 698 Total 3,150 3,132 Regulatory Environments PGS is regulated by the FPSC. The FPSC sets rates at a level that allows utilities such as PGS to collect total revenues or revenue requirements equal to their cost of providing service, plus an appropriate return on invested capital. NMGC is subject to regulation by the NMPRC. The NMPRC sets rates at a level that allows NMGC to collect total revenues or revenue requirements equal to its cost of providing service, plus an appropriate return on invested capital. For further information on PGS’s and NMGC’s regulatory environment and recovery mechanisms, refer to note 7 in the consolidated financial statements. 32 EMERA 2025 ANNUAL REPORT
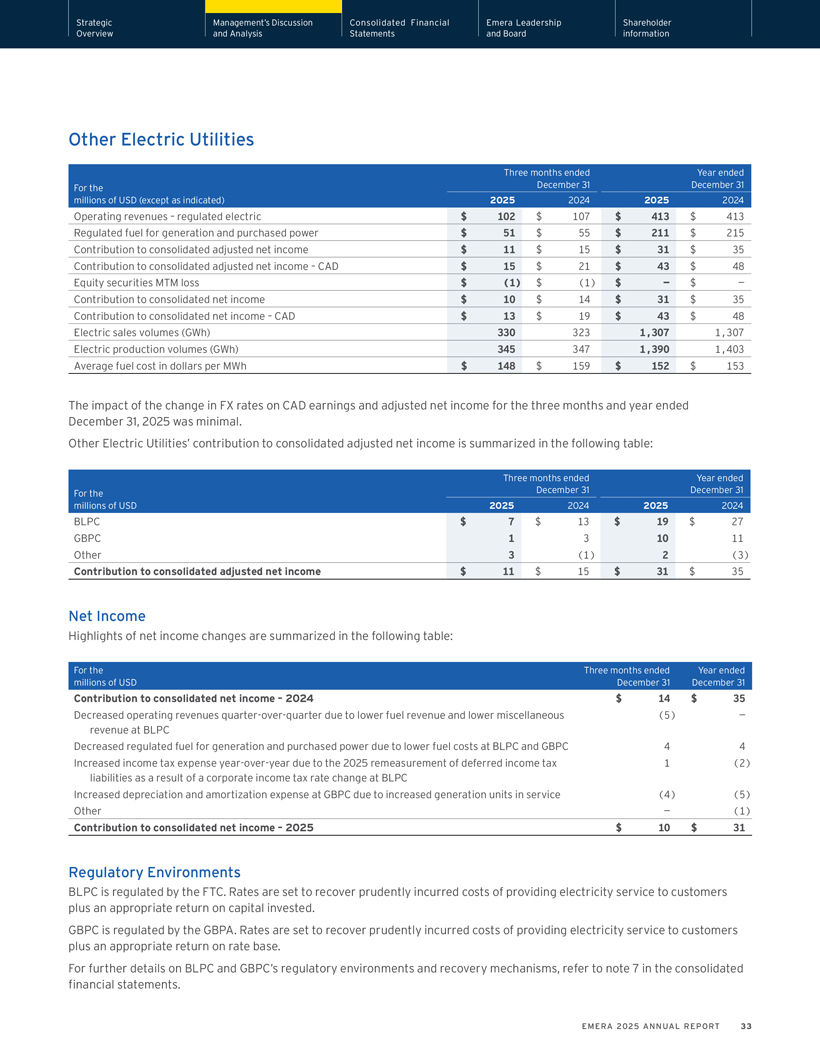
Strategic Management’s Discussion Consolidated Financial Emera Leadership Shareholder Overview and Analysis Statements and Board information Other Electric Utilities Three months ended Year ended For the December 31 December 31 millions of USD (except as indicated) 2025 2024 2025 2024 Operating revenues – regulated electric $ 102 $ 107 $ 413 $ 413 Regulated fuel for generation and purchased power $ 51 $ 55 $ 211 $ 215 Contribution to consolidated adjusted net income $ 11 $ 15 $ 31 $ 35 Contribution to consolidated adjusted net income – CAD $ 15 $ 21 $ 43 $ 48 Equity securities MTM loss $ (1) $ (1) $ — $ —Contribution to consolidated net income $ 10 $ 14 $ 31 $ 35 Contribution to consolidated net income – CAD $ 13 $ 19 $ 43 $ 48 Electric sales volumes (GWh) 330 323 1,307 1,307 Electric production volumes (GWh) 345 347 1,390 1,403 Average fuel cost in dollars per MWh $ 148 $ 159 $ 152 $ 153 The impact of the change in FX rates on CAD earnings and adjusted net income for the three months and year ended December 31, 2025 was minimal. Other Electric Utilities’ contribution to consolidated adjusted net income is summarized in the following table: Three months ended Year ended For the December 31 December 31 millions of USD 2025 2024 2025 2024 BLPC $ 7 $ 13 $ 19 $ 27 GBPC 1 3 10 11 Other 3 (1) 2 (3) Contribution to consolidated adjusted net income $ 11 $ 15 $ 31 $ 35 Net Income Highlights of net income changes are summarized in the following table: For the Three months ended Year ended millions of USD December 31 December 31 Contribution to consolidated net income – 2024 $ 14 $ 35 Decreased operating revenues quarter-over-quarter due to lower fuel revenue and lower miscellaneous (5) — revenue at BLPC Decreased regulated fuel for generation and purchased power due to lower fuel costs at BLPC and GBPC 4 4 Increased income tax expense year-over-year due to the 2025 remeasurement of deferred income tax 1 (2) liabilities as a result of a corporate income tax rate change at BLPC Increased depreciation and amortization expense at GBPC due to increased generation units in service (4) (5) Other — (1) Contribution to consolidated net income – 2025 $ 10 $ 31 Regulatory Environments BLPC is regulated by the FTC. Rates are set to recover prudently incurred costs of providing electricity service to customers plus an appropriate return on capital invested. GBPC is regulated by the GBPA. Rates are set to recover prudently incurred costs of providing electricity service to customers plus an appropriate return on rate base. For further details on BLPC and GBPC’s regulatory environments and recovery mechanisms, refer to note 7 in the consolidated financial statements. EMERA 2025 ANNUAL REPORT 33
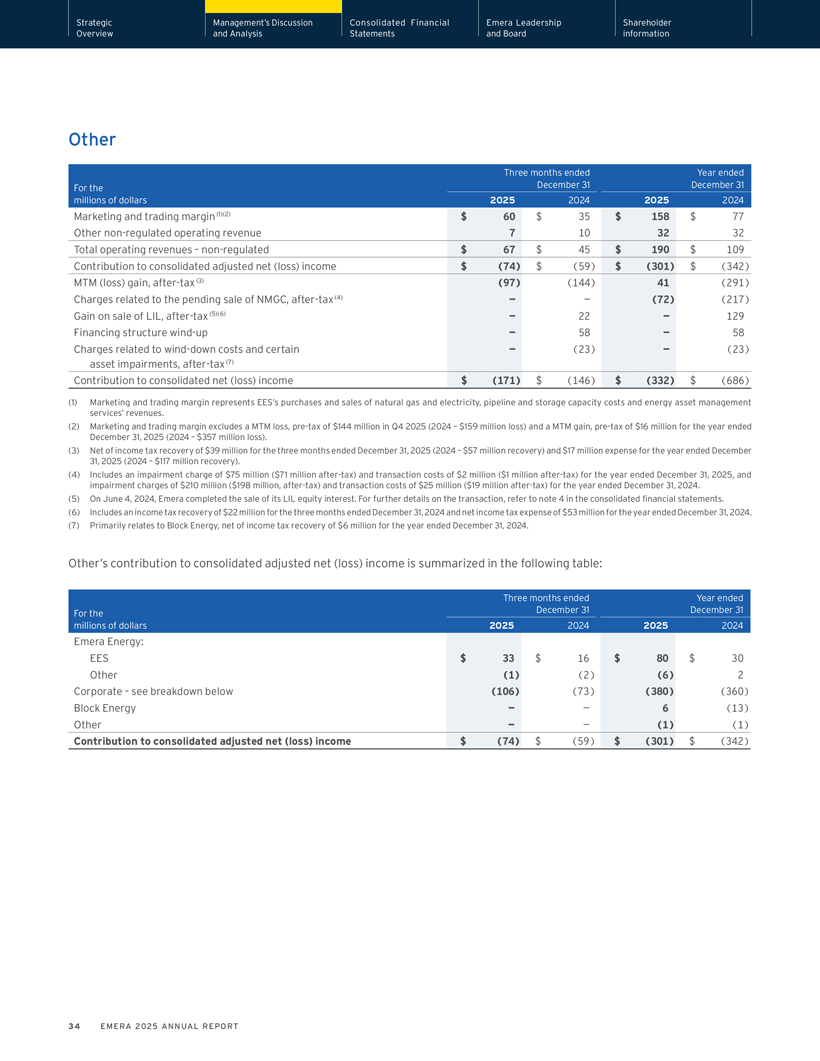
Strategic Management’s Discussion Consolidated Financial Emera Leadership Shareholder Overview and Analysis Statements and Board information Other Three months ended Year ended For the December 31 December 31 millions of dollars 2025 2024 2025 2024 Marketing and trading margin (1)(2) $ 60 $ 35 $ 158 $ 77 Other non-regulated operating revenue 7 10 32 32 Total operating revenues – non-regulated $ 67 $ 45 $ 190 $ 109 Contribution to consolidated adjusted net (loss) income $ (74) $ (59) $ (301) $ (342) MTM (loss) gain, after-tax (3) (97) (144) 41 (291) Charges related to the pending sale of NMGC, after-tax (4) — — (72) (217) Gain on sale of LIL, after-tax (5)(6) — 22 — 129 Financing structure wind-up — 58 — 58 Charges related to wind-down costs and certain — (23) — (23) asset impairments, after-tax (7) Contribution to consolidated net (loss) income $ (171) $ (146) $ (332) $ (686) (1) Marketing and trading margin represents EES’s purchases and sales of natural gas and electricity, pipeline and storage capacity costs and energy asset management services’ revenues. (2) Marketing and trading margin excludes a MTM loss, pre-tax of $144 million in Q4 2025 (2024 – $159 million loss) and a MTM gain, pre-tax of $16 million for the year ended December 31, 2025 (2024 – $357 million loss). (3) Net of income tax recovery of $39 million for the three months ended December 31, 2025 (2024 – $57 million recovery) and $17 million expense for the year ended December 31, 2025 (2024 – $117 million recovery). (4) Includes an impairment charge of $75 million ($71 million after-tax) and transaction costs of $2 million ($1 million after-tax) for the year ended December 31, 2025, and impairment charges of $210 million ($198 million, after-tax) and transaction costs of $25 million ($19 million after-tax) for the year ended December 31, 2024. (5) On June 4, 2024, Emera completed the sale of its LIL equity interest. For further details on the transaction, refer to note 4 in the consolidated financial statements. (6) Includes an income tax recovery of $22 million for the three months ended December 31, 2024 and net income tax expense of $53 million for the year ended December 31, 2024. (7) Primarily relates to Block Energy, net of income tax recovery of $6 million for the year ended December 31, 2024. Other’s contribution to consolidated adjusted net (loss) income is summarized in the following table: Three months ended Year ended For the December 31 December 31 millions of dollars 2025 2024 2025 2024 Emera Energy: EES $ 33 $ 16 $ 80 $ 30 Other (1) (2) (6) 2 Corporate – see breakdown below (106) (73) (380) (360) Block Energy — — 6 (13) Other — — (1) (1) Contribution to consolidated adjusted net (loss) income $ (74) $ (59) $ (301) $ (342) 34 EMERA 2025 ANNUAL REPORT
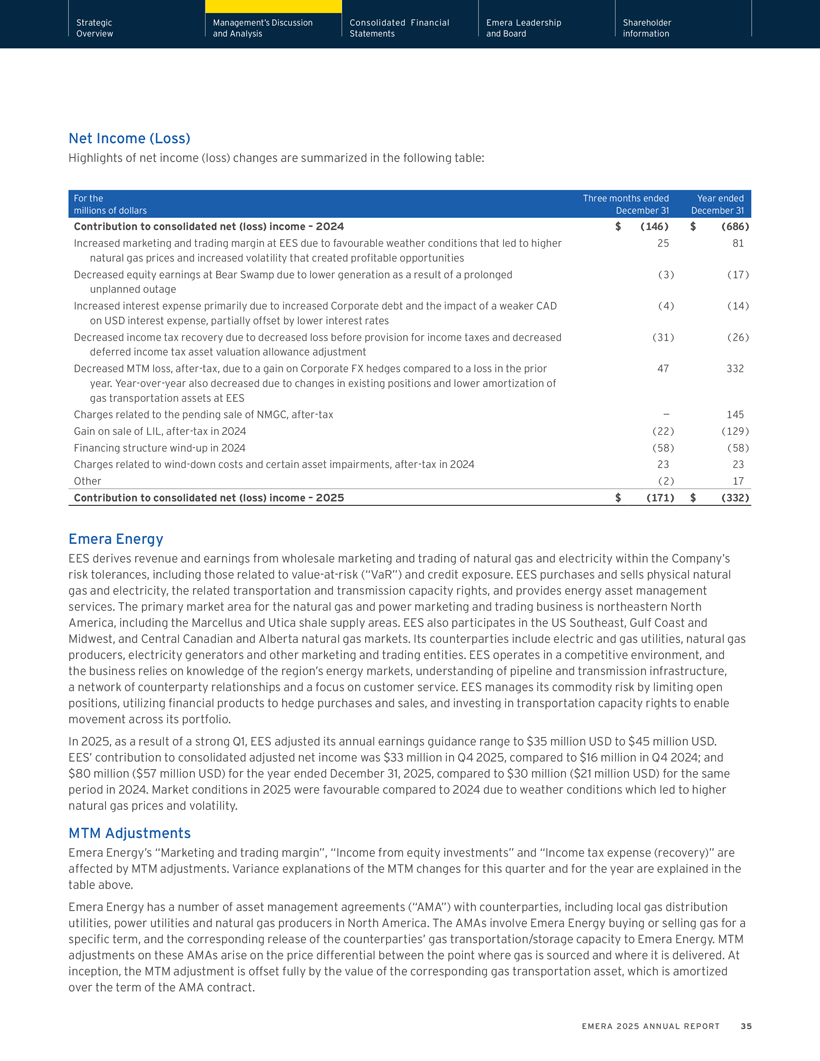
Strategic Management’s Discussion Consolidated Financial Emera Leadership Shareholder Overview and Analysis Statements and Board information Net Income (Loss) Highlights of net income (loss) changes are summarized in the following table: For the Three months ended Year ended millions of dollars December 31 December 31 Contribution to consolidated net (loss) income – 2024 $ (146) $ (686) Increased marketing and trading margin at EES due to favourable weather conditions that led to higher 25 81 natural gas prices and increased volatility that created profitable opportunities Decreased equity earnings at Bear Swamp due to lower generation as a result of a prolonged (3) (17) unplanned outage Increased interest expense primarily due to increased Corporate debt and the impact of a weaker CAD (4) (14) on USD interest expense, partially offset by lower interest rates Decreased income tax recovery due to decreased loss before provision for income taxes and decreased (31) (26) deferred income tax asset valuation allowance adjustment Decreased MTM loss, after-tax, due to a gain on Corporate FX hedges compared to a loss in the prior 47 332 year. Year-over-year also decreased due to changes in existing positions and lower amortization of gas transportation assets at EES Charges related to the pending sale of NMGC, after-tax — 145 Gain on sale of LIL, after-tax in 2024 (22) (129) Financing structure wind-up in 2024 (58) (58) Charges related to wind-down costs and certain asset impairments, after-tax in 2024 23 23 Other (2) 17 Contribution to consolidated net (loss) income – 2025 $ (171) $ (332) Emera Energy EES derives revenue and earnings from wholesale marketing and trading of natural gas and electricity within the Company’s risk tolerances, including those related to value-at-risk (“VaR”) and credit exposure. EES purchases and sells physical natural gas and electricity, the related transportation and transmission capacity rights, and provides energy asset management services. The primary market area for the natural gas and power marketing and trading business is northeastern North America, including the Marcellus and Utica shale supply areas. EES also participates in the US Southeast, Gulf Coast and Midwest, and Central Canadian and Alberta natural gas markets. Its counterparties include electric and gas utilities, natural gas producers, electricity generators and other marketing and trading entities. EES operates in a competitive environment, and the business relies on knowledge of the region’s energy markets, understanding of pipeline and transmission infrastructure, a network of counterparty relationships and a focus on customer service. EES manages its commodity risk by limiting open positions, utilizing financial products to hedge purchases and sales, and investing in transportation capacity rights to enable movement across its portfolio. In 2025, as a result of a strong Q1, EES adjusted its annual earnings guidance range to $35 million USD to $45 million USD. EES’ contribution to consolidated adjusted net income was $33 million in Q4 2025, compared to $16 million in Q4 2024; and $80 million ($57 million USD) for the year ended December 31, 2025, compared to $30 million ($21 million USD) for the same period in 2024. Market conditions in 2025 were favourable compared to 2024 due to weather conditions which led to higher natural gas prices and volatility. MTM Adjustments Emera Energy’s “Marketing and trading margin”, “Income from equity investments” and “Income tax expense (recovery)” are affected by MTM adjustments. Variance explanations of the MTM changes for this quarter and for the year are explained in the table above. Emera Energy has a number of asset management agreements (“AMA”) with counterparties, including local gas distribution utilities, power utilities and natural gas producers in North America. The AMAs involve Emera Energy buying or selling gas for a specific term, and the corresponding release of the counterparties’ gas transportation/storage capacity to Emera Energy. MTM adjustments on these AMAs arise on the price differential between the point where gas is sourced and where it is delivered. At inception, the MTM adjustment is offset fully by the value of the corresponding gas transportation asset, which is amortized over the term of the AMA contract. EMERA 2025 ANNUAL REPORT 35
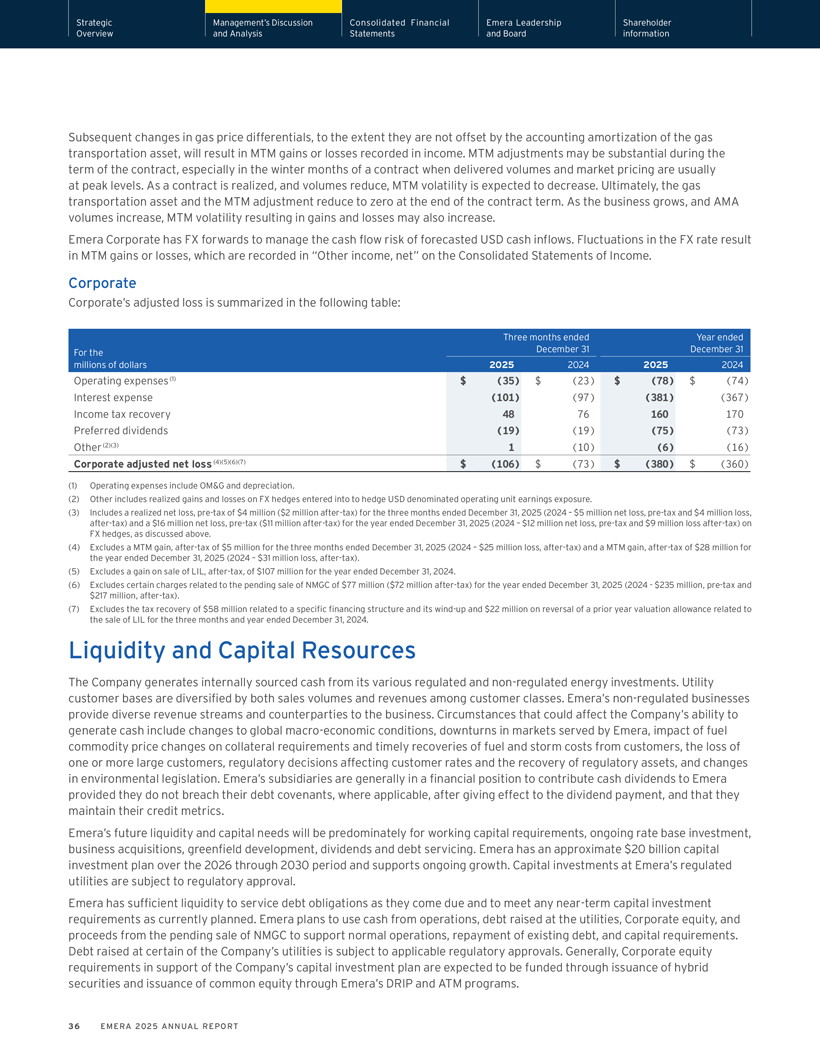
Strategic Management’s Discussion Consolidated Financial Emera Leadership Shareholder Overview and Analysis Statements and Board information Subsequent changes in gas price differentials, to the extent they are not offset by the accounting amortization of the gas transportation asset, will result in MTM gains or losses recorded in income. MTM adjustments may be substantial during the term of the contract, especially in the winter months of a contract when delivered volumes and market pricing are usually at peak levels. As a contract is realized, and volumes reduce, MTM volatility is expected to decrease. Ultimately, the gas transportation asset and the MTM adjustment reduce to zero at the end of the contract term. As the business grows, and AMA volumes increase, MTM volatility resulting in gains and losses may also increase. Emera Corporate has FX forwards to manage the cash flow risk of forecasted USD cash inflows. Fluctuations in the FX rate result in MTM gains or losses, which are recorded in “Other income, net” on the Consolidated Statements of Income. Corporate Corporate’s adjusted loss is summarized in the following table: Three months ended Year ended For the December 31 December 31 millions of dollars 2025 2024 2025 2024 Operating expenses (1) $ (35) $ (23) $ (78) $ (74) Interest expense (101) (97) (381) (367) Income tax recovery 48 76 160 170 Preferred dividends (19) (19) (75) (73) Other (2)(3) 1 (10) (6) (16) Corporate adjusted net loss (4)(5)(6)(7) $ (106) $ (73) $ (380) $ (360) (1) Operating expenses include OM&G and depreciation. (2) Other includes realized gains and losses on FX hedges entered into to hedge USD denominated operating unit earnings exposure. (3) Includes a realized net loss, pre-tax of $4 million ($2 million after-tax) for the three months ended December 31, 2025 (2024 – $5 million net loss, pre-tax and $4 million loss, after-tax) and a $16 million net loss, pre-tax ($11 million after-tax) for the year ended December 31, 2025 (2024 – $12 million net loss, pre-tax and $9 million loss after-tax) on FX hedges, as discussed above. (4) Excludes a MTM gain, after-tax of $5 million for the three months ended December 31, 2025 (2024 – $25 million loss, after-tax) and a MTM gain, after-tax of $28 million for the year ended December 31, 2025 (2024 – $31 million loss, after-tax). (5) Excludes a gain on sale of LIL, after-tax, of $107 million for the year ended December 31, 2024. (6) Excludes certain charges related to the pending sale of NMGC of $77 million ($72 million after-tax) for the year ended December 31, 2025 (2024—$235 million, pre-tax and $217 million, after-tax). (7) Excludes the tax recovery of $58 million related to a specific financing structure and its wind-up and $22 million on reversal of a prior year valuation allowance related to the sale of LIL for the three months and year ended December 31, 2024. Liquidity and Capital Resources The Company generates internally sourced cash from its various regulated and non-regulated energy investments. Utility customer bases are diversified by both sales volumes and revenues among customer classes. Emera’s non-regulated businesses provide diverse revenue streams and counterparties to the business. Circumstances that could affect the Company’s ability to generate cash include changes to global macro-economic conditions, downturns in markets served by Emera, impact of fuel commodity price changes on collateral requirements and timely recoveries of fuel and storm costs from customers, the loss of one or more large customers, regulatory decisions affecting customer rates and the recovery of regulatory assets, and changes in environmental legislation. Emera’s subsidiaries are generally in a financial position to contribute cash dividends to Emera provided they do not breach their debt covenants, where applicable, after giving effect to the dividend payment, and that they maintain their credit metrics. Emera’s future liquidity and capital needs will be predominately for working capital requirements, ongoing rate base investment, business acquisitions, greenfield development, dividends and debt servicing. Emera has an approximate $20 billion capital investment plan over the 2026 through 2030 period and supports ongoing growth. Capital investments at Emera’s regulated utilities are subject to regulatory approval. Emera has sufficient liquidity to service debt obligations as they come due and to meet any near-term capital investment requirements as currently planned. Emera plans to use cash from operations, debt raised at the utilities, Corporate equity, and proceeds from the pending sale of NMGC to support normal operations, repayment of existing debt, and capital requirements. Debt raised at certain of the Company’s utilities is subject to applicable regulatory approvals. Generally, Corporate equity requirements in support of the Company’s capital investment plan are expected to be funded through issuance of hybrid securities and issuance of common equity through Emera’s DRIP and ATM programs. 36 EMERA 2025 ANNUAL REPORT
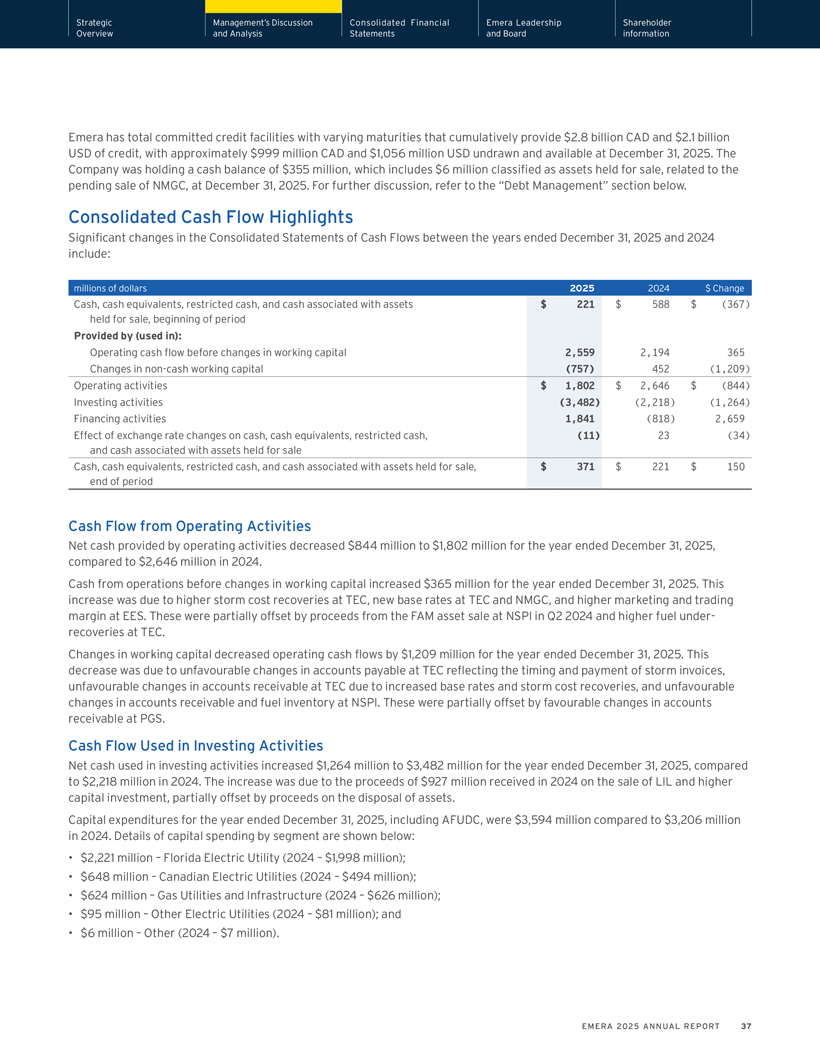
Strategic Management’s Discussion Consolidated Financial Emera Leadership Shareholder Overview and Analysis Statements and Board information Emera has total committed credit facilities with varying maturities that cumulatively provide $2.8 billion CAD and $2.1 billion USD of credit, with approximately $999 million CAD and $1,056 million USD undrawn and available at December 31, 2025. The Company was holding a cash balance of $355 million, which includes $6 million classified as assets held for sale, related to the pending sale of NMGC, at December 31, 2025. For further discussion, refer to the “Debt Management” section below. Consolidated Cash Flow Highlights Significant changes in the Consolidated Statements of Cash Flows between the years ended December 31, 2025 and 2024 include: millions of dollars 2025 2024 $ Change Cash, cash equivalents, restricted cash, and cash associated with assets $ 221 $ 588 $ (367) held for sale, beginning of period Provided by (used in): Operating cash flow before changes in working capital 2,559 2,194 365 Changes in non-cash working capital (757) 452 (1,209) Operating activities $ 1,802 $ 2,646 $ (844) Investing activities (3,482) (2,218) (1,264) Financing activities 1,841 (818) 2,659 Effect of exchange rate changes on cash, cash equivalents, restricted cash, (11) 23 (34) and cash associated with assets held for sale Cash, cash equivalents, restricted cash, and cash associated with assets held for sale, $ 371 $ 221 $ 150 end of period Cash Flow from Operating Activities Net cash provided by operating activities decreased $844 million to $1,802 million for the year ended December 31, 2025, compared to $2,646 million in 2024. Cash from operations before changes in working capital increased $365 million for the year ended December 31, 2025. This increase was due to higher storm cost recoveries at TEC, new base rates at TEC and NMGC, and higher marketing and trading margin at EES. These were partially offset by proceeds from the FAM asset sale at NSPI in Q2 2024 and higher fuel under-recoveries at TEC. Changes in working capital decreased operating cash flows by $1,209 million for the year ended December 31, 2025. This decrease was due to unfavourable changes in accounts payable at TEC reflecting the timing and payment of storm invoices, unfavourable changes in accounts receivable at TEC due to increased base rates and storm cost recoveries, and unfavourable changes in accounts receivable and fuel inventory at NSPI. These were partially offset by favourable changes in accounts receivable at PGS. Cash Flow Used in Investing Activities Net cash used in investing activities increased $1,264 million to $3,482 million for the year ended December 31, 2025, compared to $2,218 million in 2024. The increase was due to the proceeds of $927 million received in 2024 on the sale of LIL and higher capital investment, partially offset by proceeds on the disposal of assets. Capital expenditures for the year ended December 31, 2025, including AFUDC, were $3,594 million compared to $3,206 million in 2024. Details of capital spending by segment are shown below: • $2,221 million – Florida Electric Utility (2024 – $1,998 million); • $648 million – Canadian Electric Utilities (2024 – $494 million); • $624 million – Gas Utilities and Infrastructure (2024 – $626 million); • $95 million – Other Electric Utilities (2024 – $81 million); and • $6 million – Other (2024 – $7 million). EMERA 2025 ANNUAL REPORT 37
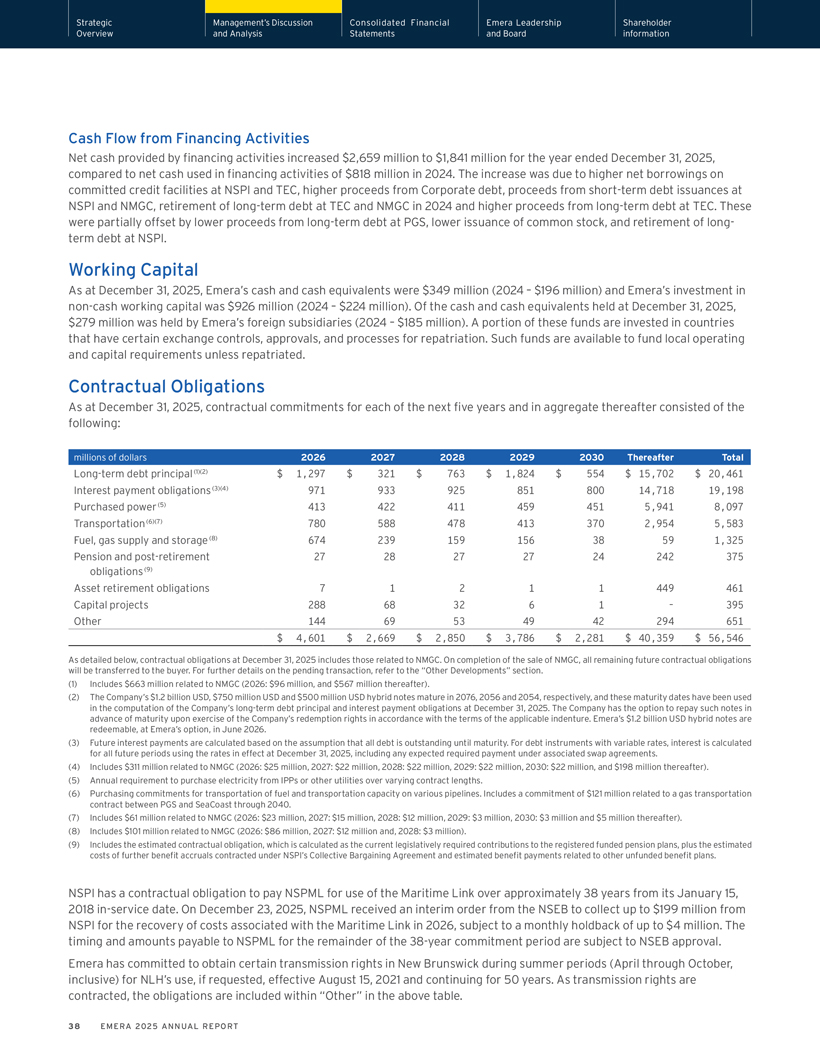
Strategic Management’s Discussion Consolidated Financial Emera Leadership Shareholder Overview and Analysis Statements and Board information Cash Flow from Financing Activities Net cash provided by financing activities increased $2,659 million to $1,841 million for the year ended December 31, 2025, compared to net cash used in financing activities of $818 million in 2024. The increase was due to higher net borrowings on committed credit facilities at NSPI and TEC, higher proceeds from Corporate debt, proceeds from short-term debt issuances at NSPI and NMGC, retirement of long-term debt at TEC and NMGC in 2024 and higher proceeds from long-term debt at TEC. These were partially offset by lower proceeds from long-term debt at PGS, lower issuance of common stock, and retirement of long-term debt at NSPI. Working Capital As at December 31, 2025, Emera’s cash and cash equivalents were $349 million (2024 – $196 million) and Emera’s investment in non-cash working capital was $926 million (2024 – $224 million). Of the cash and cash equivalents held at December 31, 2025, $279 million was held by Emera’s foreign subsidiaries (2024 – $185 million). A portion of these funds are invested in countries that have certain exchange controls, approvals, and processes for repatriation. Such funds are available to fund local operating and capital requirements unless repatriated. Contractual Obligations As at December 31, 2025, contractual commitments for each of the next five years and in aggregate thereafter consisted of the following: millions of dollars 2026 2027 2028 2029 2030 Thereafter Total Long-term debt principal (1)(2) $ 1,297 $ 321 $ 763 $ 1,824 $ 554 $ 15,702 $ 20,461 Interest payment obligations (3)(4) 971 933 925 851 800 14,718 19,198 Purchased power (5) 413 422 411 459 451 5,941 8,097 Transportation (6)(7) 780 588 478 413 370 2,954 5,583 Fuel, gas supply and storage (8) 674 239 159 156 38 59 1,325 Pension and post-retirement 27 28 27 27 24 242 375 obligations (9) Asset retirement obligations 7 1 2 1 1 449 461 Capital projects 288 68 32 6 1—395 Other 144 69 53 49 42 294 651 $ 4,601 $ 2,669 $ 2,850 $ 3,786 $ 2,281 $ 40,359 $ 56,546 As detailed below, contractual obligations at December 31, 2025 includes those related to NMGC. On completion of the sale of NMGC, all remaining future contractual obligations will be transferred to the buyer. For further details on the pending transaction, refer to the “Other Developments” section. (1) Includes $663 million related to NMGC (2026: $96 million, and $567 million thereafter). (2) The Company’s $1.2 billion USD, $750 million USD and $500 million USD hybrid notes mature in 2076, 2056 and 2054, respectively, and these maturity dates have been used in the computation of the Company’s long-term debt principal and interest payment obligations at December 31, 2025. The Company has the option to repay such notes in advance of maturity upon exercise of the Company’s redemption rights in accordance with the terms of the applicable indenture. Emera’s $1.2 billion USD hybrid notes are redeemable, at Emera’s option, in June 2026. (3) Future interest payments are calculated based on the assumption that all debt is outstanding until maturity. For debt instruments with variable rates, interest is calculated for all future periods using the rates in effect at December 31, 2025, including any expected required payment under associated swap agreements. (4) Includes $311 million related to NMGC (2026: $25 million, 2027: $22 million, 2028: $22 million, 2029: $22 million, 2030: $22 million, and $198 million thereafter). (5) Annual requirement to purchase electricity from IPPs or other utilities over varying contract lengths. (6) Purchasing commitments for transportation of fuel and transportation capacity on various pipelines. Includes a commitment of $121 million related to a gas transportation contract between PGS and SeaCoast through 2040. (7) Includes $61 million related to NMGC (2026: $23 million, 2027: $15 million, 2028: $12 million, 2029: $3 million, 2030: $3 million and $5 million thereafter). (8) Includes $101 million related to NMGC (2026: $86 million, 2027: $12 million and, 2028: $3 million). (9) Includes the estimated contractual obligation, which is calculated as the current legislatively required contributions to the registered funded pension plans, plus the estimated costs of further benefit accruals contracted under NSPI’s Collective Bargaining Agreement and estimated benefit payments related to other unfunded benefit plans. NSPI has a contractual obligation to pay NSPML for use of the Maritime Link over approximately 38 years from its January 15, 2018 in-service date. On December 23, 2025, NSPML received an interim order from the NSEB to collect up to $199 million from NSPI for the recovery of costs associated with the Maritime Link in 2026, subject to a monthly holdback of up to $4 million. The timing and amounts payable to NSPML for the remainder of the 38-year commitment period are subject to NSEB approval. Emera has committed to obtain certain transmission rights in New Brunswick during summer periods (April through October, inclusive) for NLH’s use, if requested, effective August 15, 2021 and continuing for 50 years. As transmission rights are contracted, the obligations are included within “Other” in the above table. 38 EMERA 2025 ANNUAL REPORT
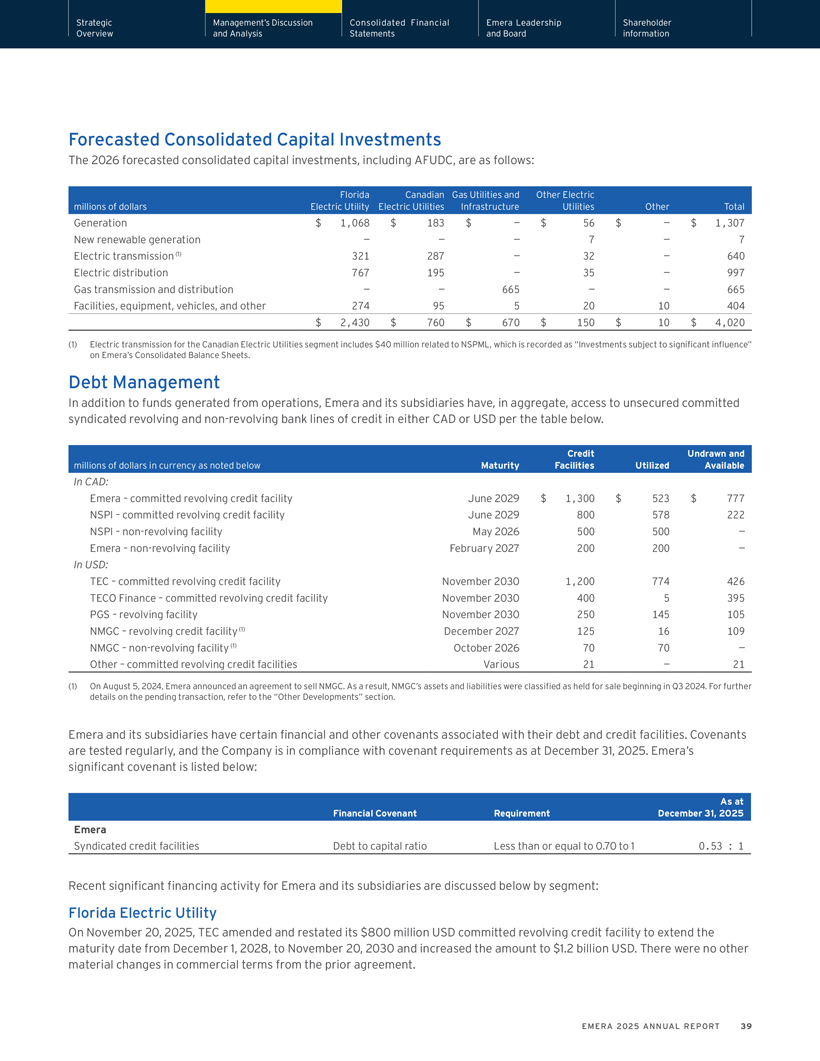
Strategic Management’s Discussion Consolidated Financial Emera Leadership Shareholder Overview and Analysis Statements and Board information Forecasted Consolidated Capital Investments The 2026 forecasted consolidated capital investments, including AFUDC, are as follows: Florida Canadian Gas Utilities and Other Electric millions of dollars Electric Utility Electric Utilities Infrastructure Utilities Other Total Generation $ 1,068 $ 183 $ — $ 56 $ — $ 1,307 New renewable generation — — — 7 — 7 Electric transmission (1) 321 287 — 32 — 640 Electric distribution 767 195 — 35 — 997 Gas transmission and distribution — — 665 — — 665 Facilities, equipment, vehicles, and other 274 95 5 20 10 404 $ 2,430 $ 760 $ 670 $ 150 $ 10 $ 4,020 (1) Electric transmission for the Canadian Electric Utilities segment includes $40 million related to NSPML, which is recorded as “Investments subject to significant influence” on Emera’s Consolidated Balance Sheets. Debt Management In addition to funds generated from operations, Emera and its subsidiaries have, in aggregate, access to unsecured committed syndicated revolving and non-revolving bank lines of credit in either CAD or USD per the table below. Credit Undrawn and millions of dollars in currency as noted below Maturity Facilities Utilized Available In CAD: Emera – committed revolving credit facility June 2029 $ 1,300 $ 523 $ 777 NSPI – committed revolving credit facility June 2029 800 578 222 NSPI – non-revolving facility May 2026 500 500 —Emera – non-revolving facility February 2027 200 200 — In USD: TEC – committed revolving credit facility November 2030 1,200 774 426 TECO Finance – committed revolving credit facility November 2030 400 5 395 PGS – revolving facility November 2030 250 145 105 NMGC – revolving credit facility (1) December 2027 125 16 109 NMGC – non-revolving facility (1) October 2026 70 70 —Other – committed revolving credit facilities Various 21 — 21 (1) On August 5, 2024, Emera announced an agreement to sell NMGC. As a result, NMGC’s assets and liabilities were classified as held for sale beginning in Q3 2024. For further details on the pending transaction, refer to the “Other Developments” section. Emera and its subsidiaries have certain financial and other covenants associated with their debt and credit facilities. Covenants are tested regularly, and the Company is in compliance with covenant requirements as at December 31, 2025. Emera’s significant covenant is listed below: As at Financial Covenant Requirement December 31, 2025 Emera Syndicated credit facilities Debt to capital ratio Less than or equal to 0.70 to 1 0.53 : 1 Recent significant financing activity for Emera and its subsidiaries are discussed below by segment: Florida Electric Utility On November 20, 2025, TEC amended and restated its $800 million USD committed revolving credit facility to extend the maturity date from December 1, 2028, to November 20, 2030 and increased the amount to $1.2 billion USD. There were no other material changes in commercial terms from the prior agreement. EMERA 2025 ANNUAL REPORT 39
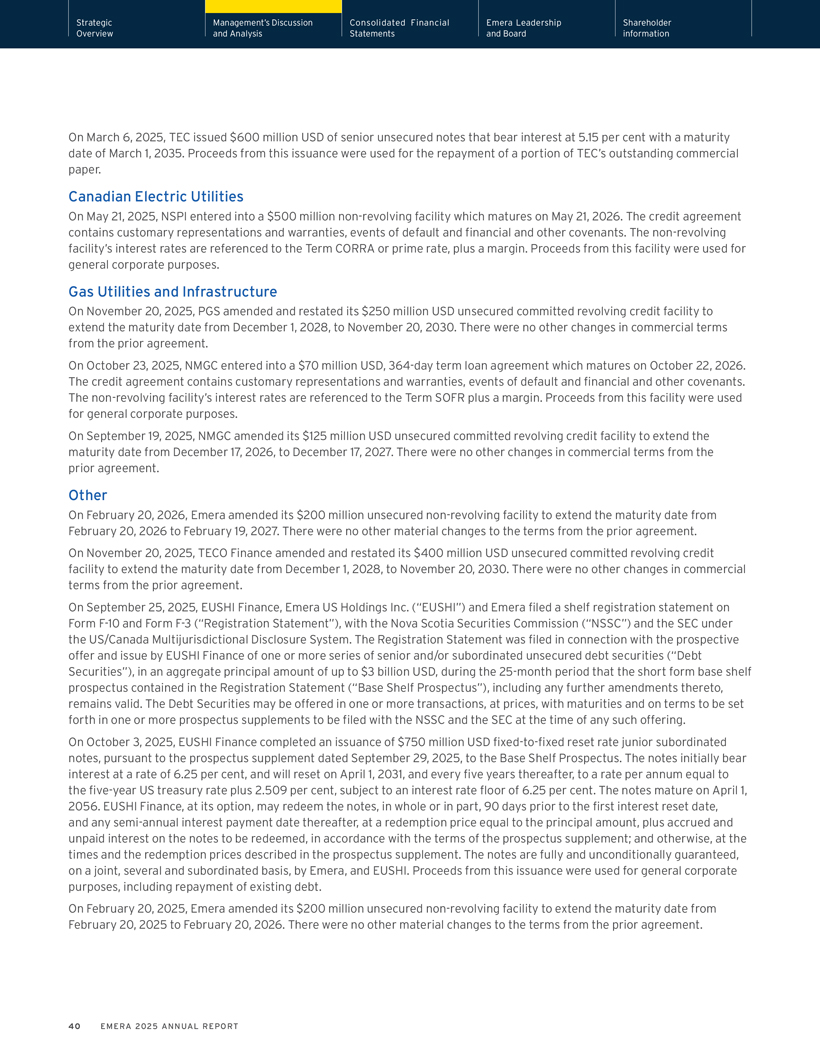
Strategic Management’s Discussion Consolidated Financial Emera Leadership Shareholder Overview and Analysis Statements and Board information On March 6, 2025, TEC issued $600 million USD of senior unsecured notes that bear interest at 5.15 per cent with a maturity date of March 1, 2035. Proceeds from this issuance were used for the repayment of a portion of TEC’s outstanding commercial paper. Canadian Electric Utilities On May 21, 2025, NSPI entered into a $500 million non-revolving facility which matures on May 21, 2026. The credit agreement contains customary representations and warranties, events of default and financial and other covenants. The non-revolving facility’s interest rates are referenced to the Term CORRA or prime rate, plus a margin. Proceeds from this facility were used for general corporate purposes. Gas Utilities and Infrastructure On November 20, 2025, PGS amended and restated its $250 million USD unsecured committed revolving credit facility to extend the maturity date from December 1, 2028, to November 20, 2030. There were no other changes in commercial terms from the prior agreement. On October 23, 2025, NMGC entered into a $70 million USD, 364-day term loan agreement which matures on October 22, 2026. The credit agreement contains customary representations and warranties, events of default and financial and other covenants. The non-revolving facility’s interest rates are referenced to the Term SOFR plus a margin. Proceeds from this facility were used for general corporate purposes. On September 19, 2025, NMGC amended its $125 million USD unsecured committed revolving credit facility to extend the maturity date from December 17, 2026, to December 17, 2027. There were no other changes in commercial terms from the prior agreement. Other On February 20, 2026, Emera amended its $200 million unsecured non-revolving facility to extend the maturity date from February 20, 2026 to February 19, 2027. There were no other material changes to the terms from the prior agreement. On November 20, 2025, TECO Finance amended and restated its $400 million USD unsecured committed revolving credit facility to extend the maturity date from December 1, 2028, to November 20, 2030. There were no other changes in commercial terms from the prior agreement. On September 25, 2025, EUSHI Finance, Emera US Holdings Inc. (“EUSHI”) and Emera filed a shelf registration statement on Form F-10 and Form F-3 (“Registration Statement”), with the Nova Scotia Securities Commission (“NSSC”) and the SEC under the US/Canada Multijurisdictional Disclosure System. The Registration Statement was filed in connection with the prospective offer and issue by EUSHI Finance of one or more series of senior and/or subordinated unsecured debt securities (“Debt Securities”), in an aggregate principal amount of up to $3 billion USD, during the 25-month period that the short form base shelf prospectus contained in the Registration Statement (“Base Shelf Prospectus”), including any further amendments thereto, remains valid. The Debt Securities may be offered in one or more transactions, at prices, with maturities and on terms to be set forth in one or more prospectus supplements to be filed with the NSSC and the SEC at the time of any such offering. On October 3, 2025, EUSHI Finance completed an issuance of $750 million USD fixed-to-fixed reset rate junior subordinated notes, pursuant to the prospectus supplement dated September 29, 2025, to the Base Shelf Prospectus. The notes initially bear interest at a rate of 6.25 per cent, and will reset on April 1, 2031, and every five years thereafter, to a rate per annum equal to the five-year US treasury rate plus 2.509 per cent, subject to an interest rate floor of 6.25 per cent. The notes mature on April 1, 2056. EUSHI Finance, at its option, may redeem the notes, in whole or in part, 90 days prior to the first interest reset date, and any semi-annual interest payment date thereafter, at a redemption price equal to the principal amount, plus accrued and unpaid interest on the notes to be redeemed, in accordance with the terms of the prospectus supplement; and otherwise, at the times and the redemption prices described in the prospectus supplement. The notes are fully and unconditionally guaranteed, on a joint, several and subordinated basis, by Emera, and EUSHI. Proceeds from this issuance were used for general corporate purposes, including repayment of existing debt. On February 20, 2025, Emera amended its $200 million unsecured non-revolving facility to extend the maturity date from February 20, 2025 to February 20, 2026. There were no other material changes to the terms from the prior agreement. 40 EMERA 2025 ANNUAL REPORT
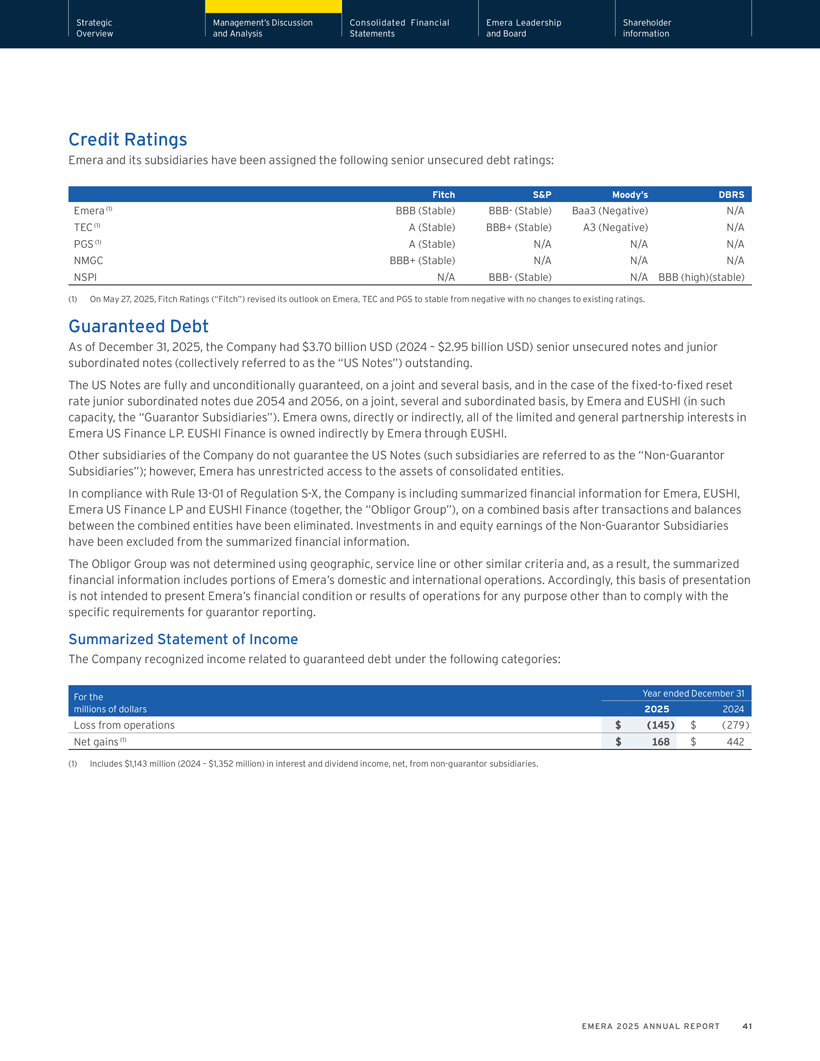
Strategic Management’s Discussion Consolidated Financial Emera Leadership Shareholder Overview and Analysis Statements and Board information Credit Ratings Emera and its subsidiaries have been assigned the following senior unsecured debt ratings: Fitch S&P Moody’s DBRS Emera (1) BBB (Stable) BBB- (Stable) Baa3 (Negative) N/A TEC (1) A (Stable) BBB+ (Stable) A3 (Negative) N/A PGS (1) A (Stable) N/A N/A N/A NMGC BBB+ (Stable) N/A N/A N/A NSPI N/A BBB- (Stable) N/A BBB (high)(stable) (1) On May 27, 2025, Fitch Ratings (“Fitch”) revised its outlook on Emera, TEC and PGS to stable from negative with no changes to existing ratings. Guaranteed Debt As of December 31, 2025, the Company had $3.70 billion USD (2024 – $2.95 billion USD) senior unsecured notes and junior subordinated notes (collectively referred to as the “US Notes”) outstanding. The US Notes are fully and unconditionally guaranteed, on a joint and several basis, and in the case of the fixed-to-fixed reset rate junior subordinated notes due 2054 and 2056, on a joint, several and subordinated basis, by Emera and EUSHI (in such capacity, the “Guarantor Subsidiaries”). Emera owns, directly or indirectly, all of the limited and general partnership interests in Emera US Finance LP. EUSHI Finance is owned indirectly by Emera through EUSHI. Other subsidiaries of the Company do not guarantee the US Notes (such subsidiaries are referred to as the “Non-Guarantor Subsidiaries”); however, Emera has unrestricted access to the assets of consolidated entities. In compliance with Rule 13-01 of Regulation S-X, the Company is including summarized financial information for Emera, EUSHI, Emera US Finance LP and EUSHI Finance (together, the “Obligor Group”), on a combined basis after transactions and balances between the combined entities have been eliminated. Investments in and equity earnings of the Non-Guarantor Subsidiaries have been excluded from the summarized financial information. The Obligor Group was not determined using geographic, service line or other similar criteria and, as a result, the summarized financial information includes portions of Emera’s domestic and international operations. Accordingly, this basis of presentation is not intended to present Emera’s financial condition or results of operations for any purpose other than to comply with the specific requirements for guarantor reporting. Summarized Statement of Income The Company recognized income related to guaranteed debt under the following categories: For the Year ended December 31 millions of dollars 2025 2024 Loss from operations $ (145) $ (279) Net gains (1) $ 168 $ 442 (1) Includes $1,143 million (2024 – $1,352 million) in interest and dividend income, net, from non-guarantor subsidiaries. EMERA 2025 ANNUAL REPORT 41
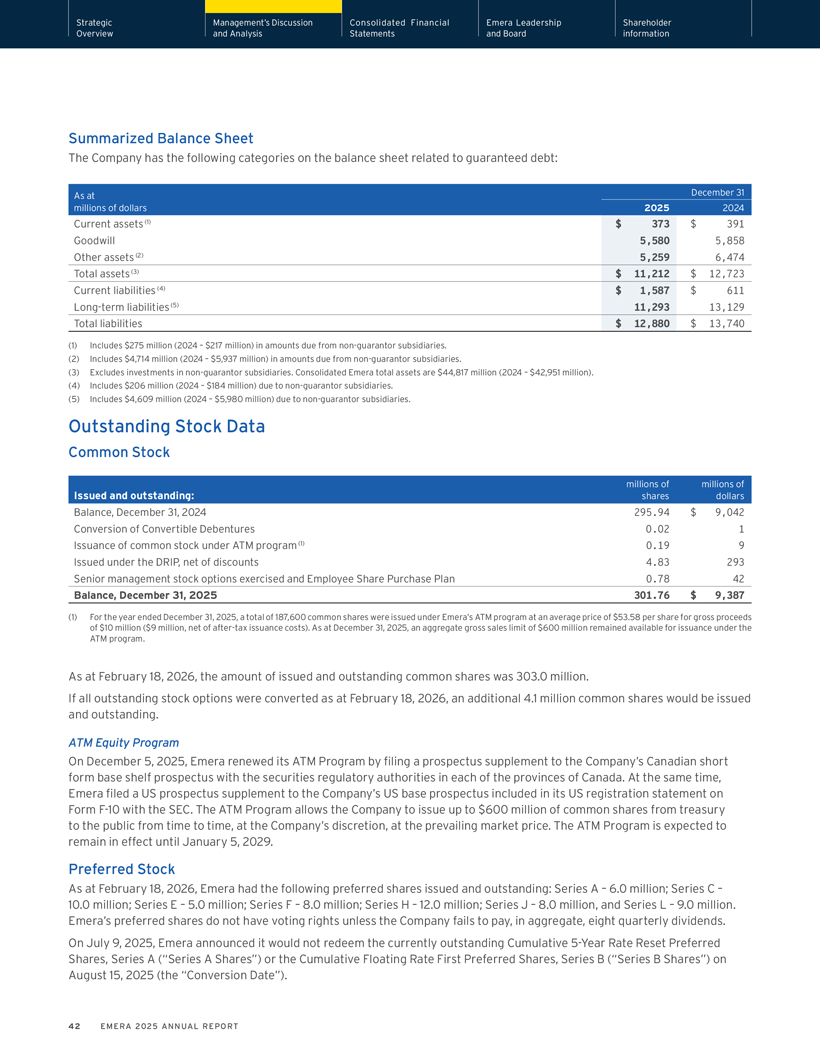
Strategic Management’s Discussion Consolidated Financial Emera Leadership Shareholder Overview and Analysis Statements and Board information Summarized Balance Sheet The Company has the following categories on the balance sheet related to guaranteed debt: As at December 31 millions of dollars 2025 2024 Current assets (1) $ 373 $ 391 Goodwill 5,580 5,858 Other assets (2) 5,259 6,474 Total assets (3) $ 11,212 $ 12,723 Current liabilities (4) $ 1,587 $ 611 Long-term liabilities (5) 11,293 13,129 Total liabilities $ 12,880 $ 13,740 (1) Includes $275 million (2024 – $217 million) in amounts due from non-guarantor subsidiaries. (2) Includes $4,714 million (2024 – $5,937 million) in amounts due from non-guarantor subsidiaries. (3) Excludes investments in non-guarantor subsidiaries. Consolidated Emera total assets are $44,817 million (2024 – $42,951 million). (4) Includes $206 million (2024 – $184 million) due to non-guarantor subsidiaries. (5) Includes $4,609 million (2024 – $5,980 million) due to non-guarantor subsidiaries. Outstanding Stock Data Common Stock millions of millions of Issued and outstanding: shares dollars Balance, December 31, 2024 295.94 $ 9,042 Conversion of Convertible Debentures 0.02 1 Issuance of common stock under ATM program (1) 0.19 9 Issued under the DRIP, net of discounts 4.83 293 Senior management stock options exercised and Employee Share Purchase Plan 0.78 42 Balance, December 31, 2025 301.76 $ 9,387 (1) For the year ended December 31, 2025, a total of 187,600 common shares were issued under Emera’s ATM program at an average price of $53.58 per share for gross proceeds of $10 million ($9 million, net of after-tax issuance costs). As at December 31, 2025, an aggregate gross sales limit of $600 million remained available for issuance under the ATM program. As at February 18, 2026, the amount of issued and outstanding common shares was 303.0 million. If all outstanding stock options were converted as at February 18, 2026, an additional 4.1 million common shares would be issued and outstanding. ATM Equity Program On December 5, 2025, Emera renewed its ATM Program by filing a prospectus supplement to the Company’s Canadian short form base shelf prospectus with the securities regulatory authorities in each of the provinces of Canada. At the same time, Emera filed a US prospectus supplement to the Company’s US base prospectus included in its US registration statement on Form F-10 with the SEC. The ATM Program allows the Company to issue up to $600 million of common shares from treasury to the public from time to time, at the Company’s discretion, at the prevailing market price. The ATM Program is expected to remain in effect until January 5, 2029. Preferred Stock As at February 18, 2026, Emera had the following preferred shares issued and outstanding: Series A – 6.0 million; Series C – 10.0 million; Series E – 5.0 million; Series F – 8.0 million; Series H – 12.0 million; Series J – 8.0 million, and Series L – 9.0 million. Emera’s preferred shares do not have voting rights unless the Company fails to pay, in aggregate, eight quarterly dividends. On July 9, 2025, Emera announced it would not redeem the currently outstanding Cumulative 5-Year Rate Reset Preferred Shares, Series A (“Series A Shares”) or the Cumulative Floating Rate First Preferred Shares, Series B (“Series B Shares”) on August 15, 2025 (the “Conversion Date”). 42 EMERA 2025 ANNUAL REPORT
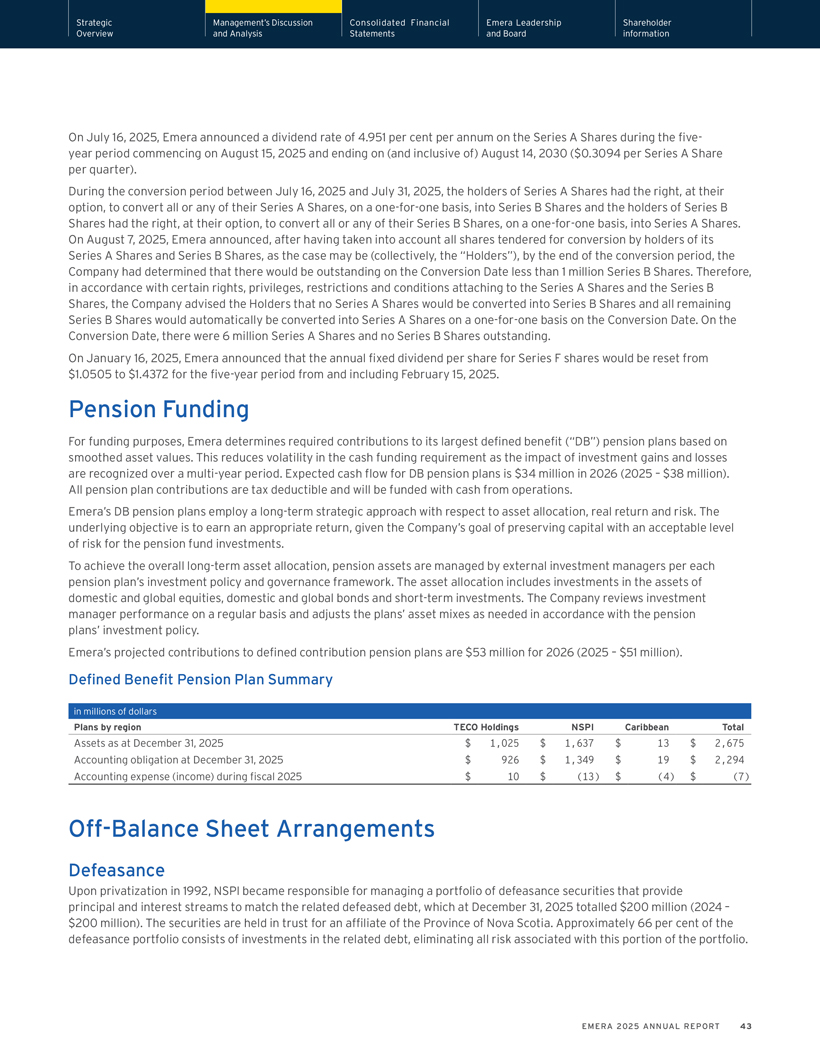
Strategic Management’s Discussion Consolidated Financial Emera Leadership Shareholder Overview and Analysis Statements and Board information On July 16, 2025, Emera announced a dividend rate of 4.951 per cent per annum on the Series A Shares during the five-year period commencing on August 15, 2025 and ending on (and inclusive of) August 14, 2030 ($0.3094 per Series A Share per quarter). During the conversion period between July 16, 2025 and July 31, 2025, the holders of Series A Shares had the right, at their option, to convert all or any of their Series A Shares, on a one-for-one basis, into Series B Shares and the holders of Series B Shares had the right, at their option, to convert all or any of their Series B Shares, on a one-for-one basis, into Series A Shares. On August 7, 2025, Emera announced, after having taken into account all shares tendered for conversion by holders of its Series A Shares and Series B Shares, as the case may be (collectively, the “Holders”), by the end of the conversion period, the Company had determined that there would be outstanding on the Conversion Date less than 1 million Series B Shares. Therefore, in accordance with certain rights, privileges, restrictions and conditions attaching to the Series A Shares and the Series B Shares, the Company advised the Holders that no Series A Shares would be converted into Series B Shares and all remaining Series B Shares would automatically be converted into Series A Shares on a one-for-one basis on the Conversion Date. On the Conversion Date, there were 6 million Series A Shares and no Series B Shares outstanding. On January 16, 2025, Emera announced that the annual fixed dividend per share for Series F shares would be reset from $1.0505 to $1.4372 for the five-year period from and including February 15, 2025. Pension Funding For funding purposes, Emera determines required contributions to its largest defined benefit (“DB”) pension plans based on smoothed asset values. This reduces volatility in the cash funding requirement as the impact of investment gains and losses are recognized over a multi-year period. Expected cash flow for DB pension plans is $34 million in 2026 (2025 – $38 million). All pension plan contributions are tax deductible and will be funded with cash from operations. Emera’s DB pension plans employ a long-term strategic approach with respect to asset allocation, real return and risk. The underlying objective is to earn an appropriate return, given the Company’s goal of preserving capital with an acceptable level of risk for the pension fund investments. To achieve the overall long-term asset allocation, pension assets are managed by external investment managers per each pension plan’s investment policy and governance framework. The asset allocation includes investments in the assets of domestic and global equities, domestic and global bonds and short-term investments. The Company reviews investment manager performance on a regular basis and adjusts the plans’ asset mixes as needed in accordance with the pension plans’ investment policy. Emera’s projected contributions to defined contribution pension plans are $53 million for 2026 (2025 – $51 million). Defined Benefit Pension Plan Summary in millions of dollars Plans by region TECO Holdings NSPI Caribbean Total Assets as at December 31, 2025 $ 1,025 $ 1,637 $ 13 $ 2,675 Accounting obligation at December 31, 2025 $ 926 $ 1,349 $ 19 $ 2,294 Accounting expense (income) during fiscal 2025 $ 10 $ (13) $ (4) $ (7) Off-Balance Sheet Arrangements Defeasance Upon privatization in 1992, NSPI became responsible for managing a portfolio of defeasance securities that provide principal and interest streams to match the related defeased debt, which at December 31, 2025 totalled $200 million (2024 – $200 million). The securities are held in trust for an affiliate of the Province of Nova Scotia. Approximately 66 per cent of the defeasance portfolio consists of investments in the related debt, eliminating all risk associated with this portion of the portfolio. EMERA 2025 ANNUAL REPORT 43
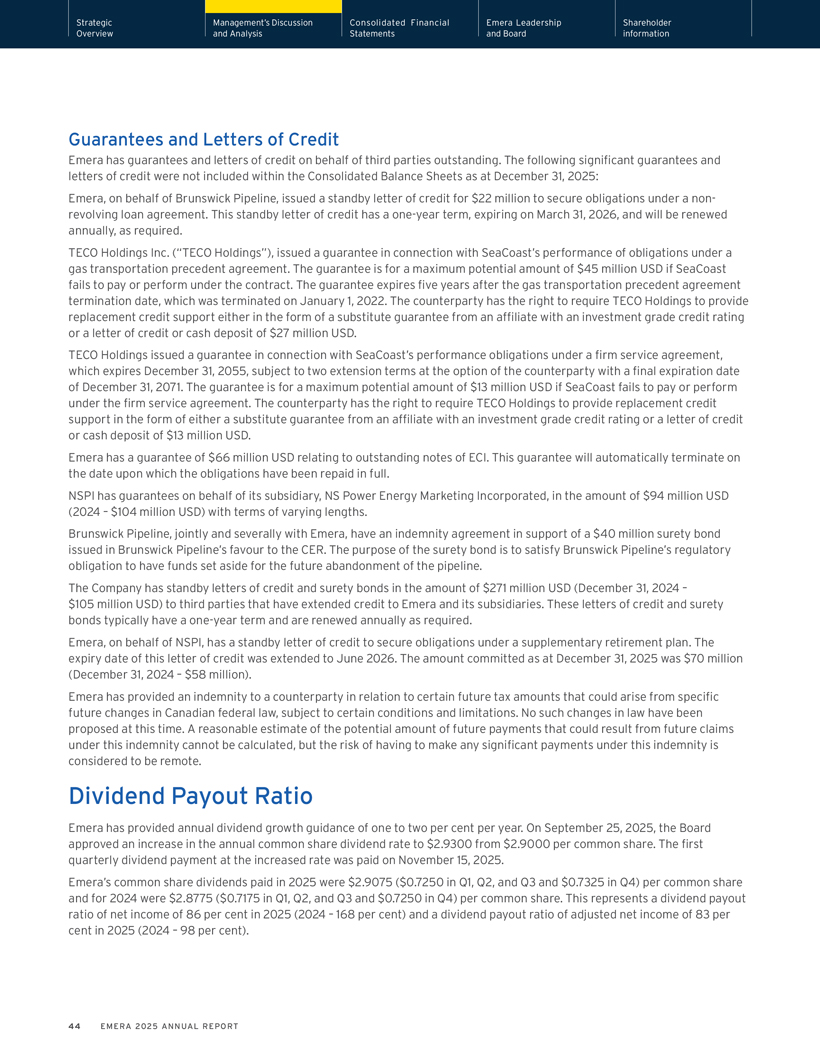
Strategic Management’s Discussion Consolidated Financial Emera Leadership Shareholder Overview and Analysis Statements and Board information Guarantees and Letters of Credit Emera has guarantees and letters of credit on behalf of third parties outstanding. The following significant guarantees and letters of credit were not included within the Consolidated Balance Sheets as at December 31, 2025: Emera, on behalf of Brunswick Pipeline, issued a standby letter of credit for $22 million to secure obligations under a non-revolving loan agreement. This standby letter of credit has a one-year term, expiring on March 31, 2026, and will be renewed annually, as required. TECO Holdings Inc. (“TECO Holdings”), issued a guarantee in connection with SeaCoast’s performance of obligations under a gas transportation precedent agreement. The guarantee is for a maximum potential amount of $45 million USD if SeaCoast fails to pay or perform under the contract. The guarantee expires five years after the gas transportation precedent agreement termination date, which was terminated on January 1, 2022. The counterparty has the right to require TECO Holdings to provide replacement credit support either in the form of a substitute guarantee from an affiliate with an investment grade credit rating or a letter of credit or cash deposit of $27 million USD. TECO Holdings issued a guarantee in connection with SeaCoast’s performance obligations under a firm service agreement, which expires December 31, 2055, subject to two extension terms at the option of the counterparty with a final expiration date of December 31, 2071. The guarantee is for a maximum potential amount of $13 million USD if SeaCoast fails to pay or perform under the firm service agreement. The counterparty has the right to require TECO Holdings to provide replacement credit support in the form of either a substitute guarantee from an affiliate with an investment grade credit rating or a letter of credit or cash deposit of $13 million USD. Emera has a guarantee of $66 million USD relating to outstanding notes of ECI. This guarantee will automatically terminate on the date upon which the obligations have been repaid in full. NSPI has guarantees on behalf of its subsidiary, NS Power Energy Marketing Incorporated, in the amount of $94 million USD (2024 – $104 million USD) with terms of varying lengths. Brunswick Pipeline, jointly and severally with Emera, have an indemnity agreement in support of a $40 million surety bond issued in Brunswick Pipeline’s favour to the CER. The purpose of the surety bond is to satisfy Brunswick Pipeline’s regulatory obligation to have funds set aside for the future abandonment of the pipeline. The Company has standby letters of credit and surety bonds in the amount of $271 million USD (December 31, 2024 – $105 million USD) to third parties that have extended credit to Emera and its subsidiaries. These letters of credit and surety bonds typically have a one-year term and are renewed annually as required. Emera, on behalf of NSPI, has a standby letter of credit to secure obligations under a supplementary retirement plan. The expiry date of this letter of credit was extended to June 2026. The amount committed as at December 31, 2025 was $70 million (December 31, 2024 – $58 million). Emera has provided an indemnity to a counterparty in relation to certain future tax amounts that could arise from specific future changes in Canadian federal law, subject to certain conditions and limitations. No such changes in law have been proposed at this time. A reasonable estimate of the potential amount of future payments that could result from future claims under this indemnity cannot be calculated, but the risk of having to make any significant payments under this indemnity is considered to be remote. Dividend Payout Ratio Emera has provided annual dividend growth guidance of one to two per cent per year. On September 25, 2025, the Board approved an increase in the annual common share dividend rate to $2.9300 from $2.9000 per common share. The first quarterly dividend payment at the increased rate was paid on November 15, 2025. Emera’s common share dividends paid in 2025 were $2.9075 ($0.7250 in Q1, Q2, and Q3 and $0.7325 in Q4) per common share and for 2024 were $2.8775 ($0.7175 in Q1, Q2, and Q3 and $0.7250 in Q4) per common share. This represents a dividend payout ratio of net income of 86 per cent in 2025 (2024 – 168 per cent) and a dividend payout ratio of adjusted net income of 83 per cent in 2025 (2024 – 98 per cent). 44 EMERA 2025 ANNUAL REPORT
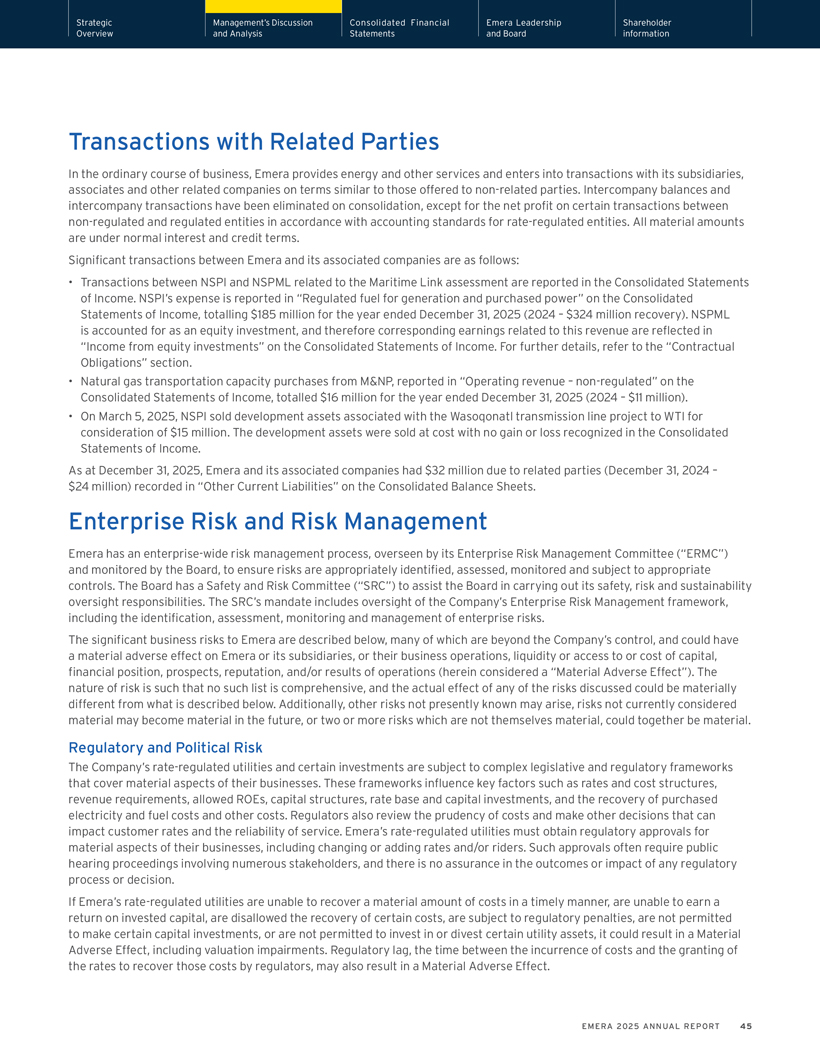
Strategic Management’s Discussion Consolidated Financial Emera Leadership Shareholder Overview and Analysis Statements and Board information Transactions with Related Parties In the ordinary course of business, Emera provides energy and other services and enters into transactions with its subsidiaries, associates and other related companies on terms similar to those offered to non-related parties. Intercompany balances and intercompany transactions have been eliminated on consolidation, except for the net profit on certain transactions between non-regulated and regulated entities in accordance with accounting standards for rate-regulated entities. All material amounts are under normal interest and credit terms. Significant transactions between Emera and its associated companies are as follows: • Transactions between NSPI and NSPML related to the Maritime Link assessment are reported in the Consolidated Statements of Income. NSPI’s expense is reported in “Regulated fuel for generation and purchased power” on the Consolidated Statements of Income, totalling $185 million for the year ended December 31, 2025 (2024 – $324 million recovery). NSPML is accounted for as an equity investment, and therefore corresponding earnings related to this revenue are reflected in “Income from equity investments” on the Consolidated Statements of Income. For further details, refer to the “Contractual Obligations” section. • Natural gas transportation capacity purchases from M&NP, reported in “Operating revenue – non-regulated” on the Consolidated Statements of Income, totalled $16 million for the year ended December 31, 2025 (2024 – $11 million). • On March 5, 2025, NSPI sold development assets associated with the Wasoqonatl transmission line project to WTI for consideration of $15 million. The development assets were sold at cost with no gain or loss recognized in the Consolidated Statements of Income. As at December 31, 2025, Emera and its associated companies had $32 million due to related parties (December 31, 2024 – $24 million) recorded in “Other Current Liabilities” on the Consolidated Balance Sheets. Enterprise Risk and Risk Management Emera has an enterprise-wide risk management process, overseen by its Enterprise Risk Management Committee (“ERMC”) and monitored by the Board, to ensure risks are appropriately identified, assessed, monitored and subject to appropriate controls. The Board has a Safety and Risk Committee (“SRC”) to assist the Board in carrying out its safety, risk and sustainability oversight responsibilities. The SRC’s mandate includes oversight of the Company’s Enterprise Risk Management framework, including the identification, assessment, monitoring and management of enterprise risks. The significant business risks to Emera are described below, many of which are beyond the Company’s control, and could have a material adverse effect on Emera or its subsidiaries, or their business operations, liquidity or access to or cost of capital, financial position, prospects, reputation, and/or results of operations (herein considered a “Material Adverse Effect”). The nature of risk is such that no such list is comprehensive, and the actual effect of any of the risks discussed could be materially different from what is described below. Additionally, other risks not presently known may arise, risks not currently considered material may become material in the future, or two or more risks which are not themselves material, could together be material. Regulatory and Political Risk The Company’s rate-regulated utilities and certain investments are subject to complex legislative and regulatory frameworks that cover material aspects of their businesses. These frameworks influence key factors such as rates and cost structures, revenue requirements, allowed ROEs, capital structures, rate base and capital investments, and the recovery of purchased electricity and fuel costs and other costs. Regulators also review the prudency of costs and make other decisions that can impact customer rates and the reliability of service. Emera’s rate-regulated utilities must obtain regulatory approvals for material aspects of their businesses, including changing or adding rates and/or riders. Such approvals often require public hearing proceedings involving numerous stakeholders, and there is no assurance in the outcomes or impact of any regulatory process or decision. If Emera’s rate-regulated utilities are unable to recover a material amount of costs in a timely manner, are unable to earn a return on invested capital, are disallowed the recovery of certain costs, are subject to regulatory penalties, are not permitted to make certain capital investments, or are not permitted to invest in or divest certain utility assets, it could result in a Material Adverse Effect, including valuation impairments. Regulatory lag, the time between the incurrence of costs and the granting of the rates to recover those costs by regulators, may also result in a Material Adverse Effect. EMERA 2025 ANNUAL REPORT 45
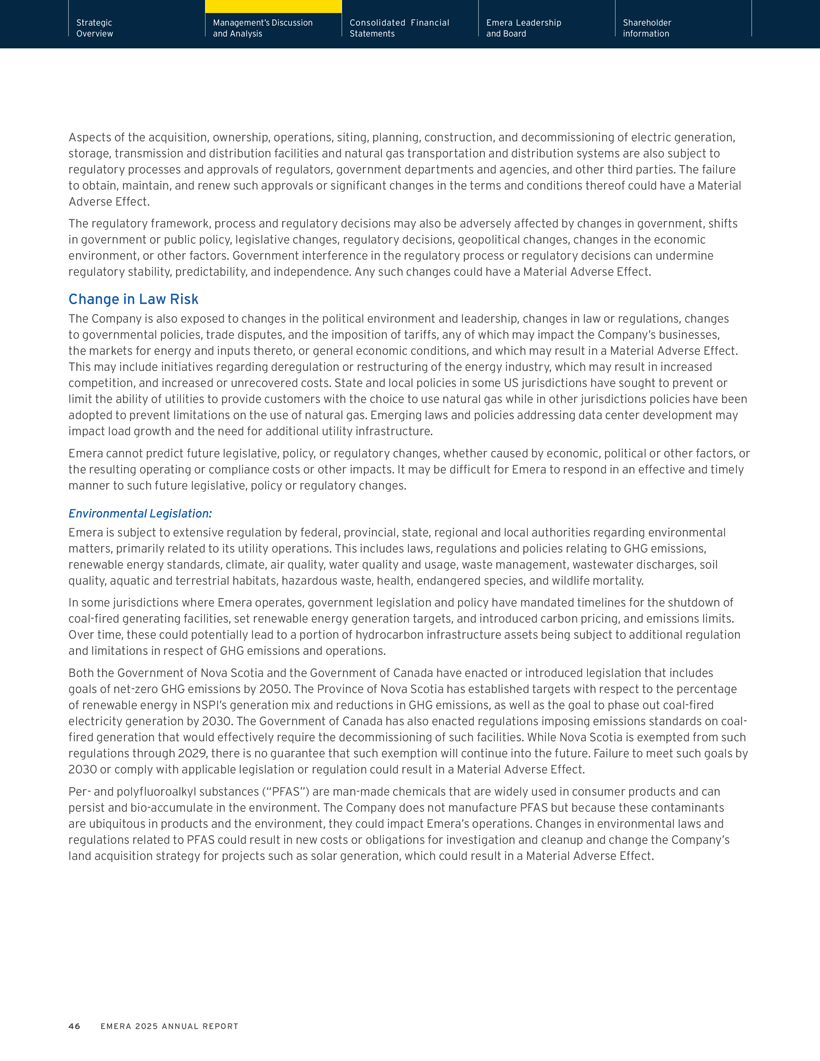
Strategic Management’s Discussion Consolidated Financial Emera Leadership Shareholder Overview and Analysis Statements and Board information Aspects of the acquisition, ownership, operations, siting, planning, construction, and decommissioning of electric generation, storage, transmission and distribution facilities and natural gas transportation and distribution systems are also subject to regulatory processes and approvals of regulators, government departments and agencies, and other third parties. The failure to obtain, maintain, and renew such approvals or significant changes in the terms and conditions thereof could have a Material Adverse Effect. The regulatory framework, process and regulatory decisions may also be adversely affected by changes in government, shifts in government or public policy, legislative changes, regulatory decisions, geopolitical changes, changes in the economic environment, or other factors. Government interference in the regulatory process or regulatory decisions can undermine regulatory stability, predictability, and independence. Any such changes could have a Material Adverse Effect. Change in Law Risk The Company is also exposed to changes in the political environment and leadership, changes in law or regulations, changes to governmental policies, trade disputes, and the imposition of tariffs, any of which may impact the Company’s businesses, the markets for energy and inputs thereto, or general economic conditions, and which may result in a Material Adverse Effect. This may include initiatives regarding deregulation or restructuring of the energy industry, which may result in increased competition, and increased or unrecovered costs. State and local policies in some US jurisdictions have sought to prevent or limit the ability of utilities to provide customers with the choice to use natural gas while in other jurisdictions policies have been adopted to prevent limitations on the use of natural gas. Emerging laws and policies addressing data center development may impact load growth and the need for additional utility infrastructure. Emera cannot predict future legislative, policy, or regulatory changes, whether caused by economic, political or other factors, or the resulting operating or compliance costs or other impacts. It may be difficult for Emera to respond in an effective and timely manner to such future legislative, policy or regulatory changes. Environmental Legislation: Emera is subject to extensive regulation by federal, provincial, state, regional and local authorities regarding environmental matters, primarily related to its utility operations. This includes laws, regulations and policies relating to GHG emissions, renewable energy standards, climate, air quality, water quality and usage, waste management, wastewater discharges, soil quality, aquatic and terrestrial habitats, hazardous waste, health, endangered species, and wildlife mortality. In some jurisdictions where Emera operates, government legislation and policy have mandated timelines for the shutdown of coal-fired generating facilities, set renewable energy generation targets, and introduced carbon pricing, and emissions limits. Over time, these could potentially lead to a portion of hydrocarbon infrastructure assets being subject to additional regulation and limitations in respect of GHG emissions and operations. Both the Government of Nova Scotia and the Government of Canada have enacted or introduced legislation that includes goals of net-zero GHG emissions by 2050. The Province of Nova Scotia has established targets with respect to the percentage of renewable energy in NSPI’s generation mix and reductions in GHG emissions, as well as the goal to phase out coal-fired electricity generation by 2030. The Government of Canada has also enacted regulations imposing emissions standards on coal-fired generation that would effectively require the decommissioning of such facilities. While Nova Scotia is exempted from such regulations through 2029, there is no guarantee that such exemption will continue into the future. Failure to meet such goals by 2030 or comply with applicable legislation or regulation could result in a Material Adverse Effect. Per- and polyfluoroalkyl substances (“PFAS”) are man-made chemicals that are widely used in consumer products and can persist and bio-accumulate in the environment. The Company does not manufacture PFAS but because these contaminants are ubiquitous in products and the environment, they could impact Emera’s operations. Changes in environmental laws and regulations related to PFAS could result in new costs or obligations for investigation and cleanup and change the Company’s land acquisition strategy for projects such as solar generation, which could result in a Material Adverse Effect. 46 EMERA 2025 ANNUAL REPORT
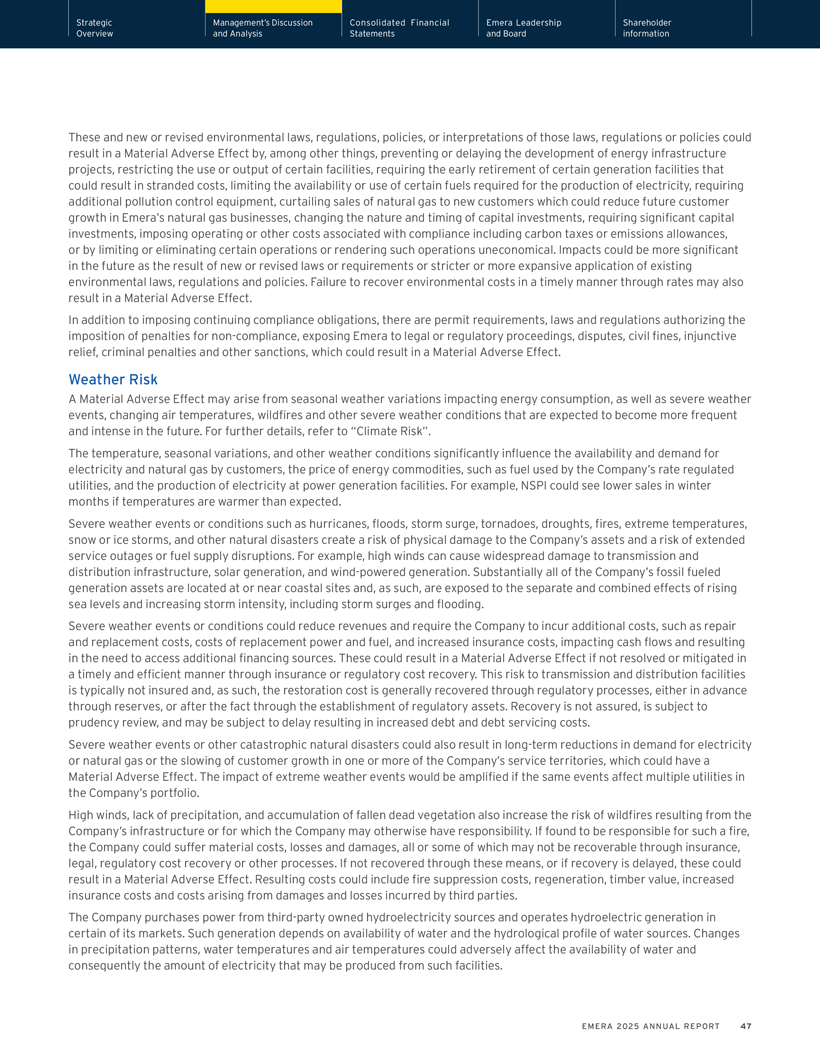
Strategic Management’s Discussion Consolidated Financial Emera Leadership Shareholder Overview and Analysis Statements and Board information These and new or revised environmental laws, regulations, policies, or interpretations of those laws, regulations or policies could result in a Material Adverse Effect by, among other things, preventing or delaying the development of energy infrastructure projects, restricting the use or output of certain facilities, requiring the early retirement of certain generation facilities that could result in stranded costs, limiting the availability or use of certain fuels required for the production of electricity, requiring additional pollution control equipment, curtailing sales of natural gas to new customers which could reduce future customer growth in Emera’s natural gas businesses, changing the nature and timing of capital investments, requiring significant capital investments, imposing operating or other costs associated with compliance including carbon taxes or emissions allowances, or by limiting or eliminating certain operations or rendering such operations uneconomical. Impacts could be more significant in the future as the result of new or revised laws or requirements or stricter or more expansive application of existing environmental laws, regulations and policies. Failure to recover environmental costs in a timely manner through rates may also result in a Material Adverse Effect. In addition to imposing continuing compliance obligations, there are permit requirements, laws and regulations authorizing the imposition of penalties for non-compliance, exposing Emera to legal or regulatory proceedings, disputes, civil fines, injunctive relief, criminal penalties and other sanctions, which could result in a Material Adverse Effect. Weather Risk A Material Adverse Effect may arise from seasonal weather variations impacting energy consumption, as well as severe weather events, changing air temperatures, wildfires and other severe weather conditions that are expected to become more frequent and intense in the future. For further details, refer to “Climate Risk”. The temperature, seasonal variations, and other weather conditions significantly influence the availability and demand for electricity and natural gas by customers, the price of energy commodities, such as fuel used by the Company’s rate regulated utilities, and the production of electricity at power generation facilities. For example, NSPI could see lower sales in winter months if temperatures are warmer than expected. Severe weather events or conditions such as hurricanes, floods, storm surge, tornadoes, droughts, fires, extreme temperatures, snow or ice storms, and other natural disasters create a risk of physical damage to the Company’s assets and a risk of extended service outages or fuel supply disruptions. For example, high winds can cause widespread damage to transmission and distribution infrastructure, solar generation, and wind-powered generation. Substantially all of the Company’s fossil fueled generation assets are located at or near coastal sites and, as such, are exposed to the separate and combined effects of rising sea levels and increasing storm intensity, including storm surges and flooding. Severe weather events or conditions could reduce revenues and require the Company to incur additional costs, such as repair and replacement costs, costs of replacement power and fuel, and increased insurance costs, impacting cash flows and resulting in the need to access additional financing sources. These could result in a Material Adverse Effect if not resolved or mitigated in a timely and efficient manner through insurance or regulatory cost recovery. This risk to transmission and distribution facilities is typically not insured and, as such, the restoration cost is generally recovered through regulatory processes, either in advance through reserves, or after the fact through the establishment of regulatory assets. Recovery is not assured, is subject to prudency review, and may be subject to delay resulting in increased debt and debt servicing costs. Severe weather events or other catastrophic natural disasters could also result in long-term reductions in demand for electricity or natural gas or the slowing of customer growth in one or more of the Company’s service territories, which could have a Material Adverse Effect. The impact of extreme weather events would be amplified if the same events affect multiple utilities in the Company’s portfolio. High winds, lack of precipitation, and accumulation of fallen dead vegetation also increase the risk of wildfires resulting from the Company’s infrastructure or for which the Company may otherwise have responsibility. If found to be responsible for such a fire, the Company could suffer material costs, losses and damages, all or some of which may not be recoverable through insurance, legal, regulatory cost recovery or other processes. If not recovered through these means, or if recovery is delayed, these could result in a Material Adverse Effect. Resulting costs could include fire suppression costs, regeneration, timber value, increased insurance costs and costs arising from damages and losses incurred by third parties. The Company purchases power from third-party owned hydroelectricity sources and operates hydroelectric generation in certain of its markets. Such generation depends on availability of water and the hydrological profile of water sources. Changes in precipitation patterns, water temperatures and air temperatures could adversely affect the availability of water and consequently the amount of electricity that may be produced from such facilities. EMERA 2025 ANNUAL REPORT 47
Strategic Management’s Discussion Consolidated Financial Emera Leadership Shareholder Overview and Analysis Statements and Board information Climate Risk Physical Risk: Changes in climate may negatively impact the Company’s operations as a result of increased frequency and intensity of weather events and related physical risks, any of which could result in a Material Adverse Effect (for more information refer to “Weather Risk” and “System Operating and Maintenance Risks”). An increase in physical risk associated with climate change can also adversely impact the cost and availability of insurance, insurance deductibles and self-retention, as well as credit ratings, which could affect credit risk spreads on new long-term debt and credit facilities, as well as their availability (refer to “Liquidity and Capital Markets Risk”). Transition Risk: As government policy related to the environment, renewable energy, and decarbonization continues to shift in various operating jurisdictions, the Company is exposed to increased uncertainty and risk arising from policy, legal, regulatory, technology, and market changes, which could result in a Material Adverse Effect. The energy transition will require the Company to address changes to environmental policies, laws and regulations which vary widely in operating jurisdictions (refer to “Environmental Legislation”). The Company’s ability to address transition risk for the long-term is impacted by this increased policy uncertainty and the need to balance stakeholder expectations for reliability and affordability of energy. The Company will be required to manage the impacts of these ongoing changes on customer demand and rates, while maintaining and integrating intermittent renewable energy and new technologies, making investments required to meet new resiliency and security standards, and adapting the Company’s infrastructure and generating capacity to meet load growth, changing customer demands, and usage patterns. The energy transition and the ability of the Company to achieve government mandated environmental requirements, will require significant capital investment, and is dependent upon many factors which are outside of the Company’s direct control, including the actions of governments, regulators, independent system operators, independent power producers, interconnected utilities, Indigenous communities, and other stakeholders; the development and commercialization of new and emerging technologies; and the use of offsets. These external factors and legislative, policy, or regulatory changes may cause the pace of the energy transition (including emissions reductions and the addition of more renewable energy) to materially differ from some stakeholder expectations. Depending on the regulatory response to government legislation and regulations, the Company may be exposed to the risk of reduced recovery through rates in respect of the affected assets. Given concerns regarding carbon-emitting generation, assets and businesses may, over time, become difficult or uneconomic to insure in commercial insurance markets. Some insurance companies have limited their exposure to coal-fired electricity generation and are evaluating the medium- and long-term impacts of changes in climate which may result in less insurance capacity, more restrictive coverage and increased premiums in the future. The Company could also face litigation or regulatory action related to environmental harms from GHG emissions or failure to substantiate certain environmental claims. The failure to effectively respond to risks associated with changes in climate could adversely affect the Company’s ability to deliver safe, reliable, and cost-effective service, the Company’s reputation with stakeholders, its ability to operate and grow, and the Company’s access to, and cost of, capital, each of which could result in a Material Adverse Effect. Cybersecurity Risk Emera is exposed to potential risks related to cyberattacks, data breaches, cyber-extortion, and unauthorized access that could result in a Material Adverse Effect. The Company increasingly relies on IT systems, networks and cloud infrastructure, and third-party service providers to effectively manage and safely operate its assets. This includes controls for interconnected systems of generation, distribution and transmission as well as financial, billing and other enterprise systems. As the Company operates critical energy infrastructure, it may be at greater risk of cyberattacks, which could include those from nation-state cyber threat actors. Major emerging and ongoing global conflicts may also elevate this risk, by increasing the sophistication, magnitude, and frequency of cyberattacks. Cyberattacks can reach the Company’s assets and information via their interfaces with third parties or the public internet and gain access to critical and non-critical infrastructures. Cyberattacks can also occur via personnel with access to critical assets or trusted networks. Methods used to attack critical assets could include generic or energy-sector-specific malware delivered via network transfer, removable media, attachments, links in e-mails or other communications, or social engineering. The methods used by attackers are continuously evolving and can be difficult to predict and detect and may become more sophisticated, frequent, severe, and difficult to stop to the extent that attackers are able to leverage evolving artificial intelligence (“AI”) models or tools. 48 EMERA 2025 ANNUAL REPORT
Strategic Management’s Discussion Consolidated Financial Emera Leadership Shareholder Overview and Analysis Statements and Board information Despite security measures in place, the Company’s systems, assets and information could experience security breaches that could cause system failures, disrupt energy supply and delivery, business operations, or adversely affect safety. Such breaches could compromise customer, employee-related or other information systems and could result in loss of service to customers, unavailability of critical assets, safety issues, compromise billing and customer-facing information, such as outage maps, disrupt internal control and financial and back office processes, or result in the release, loss, corruption, destruction, and/or misuse of critical, sensitive, confidential or proprietary information, intellectual property, or personal information of customers or employees. These breaches could also delay delivery or result in contamination or degradation of hydrocarbon products the Company transports, stores or distributes. Cyberattacks or unauthorized access may cause lost revenues, costs, losses, regulatory penalties and third-party damages, all or some of which, may not be recoverable through insurance, legal, regulatory cost recovery or other processes. To the extent that Emera maintains cybersecurity insurance coverage, such coverage is subject to aggregate limits that, depending on the scope and scale of impacts to the Company, are more likely to be exhausted as a result of a sophisticated single cyberattack or if multiple events were to occur within a single policy period. There is no guarantee that the Company will be able to renew such coverage on acceptable terms in the future. Resulting costs could include, amongst others, response, recovery and remediation costs, increased protection or insurance costs, and costs arising from damages and losses incurred by third parties. This could result in a Material Adverse Effect and there is no assurance that cyberattacks or other security breaches can be adequately addressed in a timely manner. The Company seeks to manage these risks by aligning to a common set of cybersecurity standards and policies derived, in part, on the National Institute of Standards and Technology’s Cyber Security Framework, by following program maturity objectives, through periodic security assessments, by exercising and improving cybersecurity incident readiness and response programs, by hiring third-party cybersecurity experts, and through employee communication and training. With respect to certain of its assets, the Company is required to comply with rules and standards relating to cybersecurity and IT including, but not limited to, those mandated by bodies such as the North American Electric Reliability Corporation, Northeast Power Coordinating Council, and the United States Department of Homeland Security. The status of key elements of the Company’s cybersecurity program is reported to the SRC on a quarterly basis. The Board also oversees cybersecurity risk, which is included in a risk dashboard at each regularly scheduled Board meeting. The recruitment and retention of qualified cybersecurity talent is a global issue, and difficulties in securing such resources may adversely impact the Company’s ability to address these risks. Energy Consumption Risk Emera’s rate-regulated utilities are affected by demand for energy based on changing customer patterns due to fluctuations in a number of factors including general economic conditions, weather events, customers’ focus on energy efficiency, changes in rates, and advancements in new technologies such as rooftop solar, electric vehicles, data centers, and battery storage. Government policies promoting energy efficiency, distributed generation, and new technology developments that enable those policies, have the potential to impact how electricity enters the system and how it is bought and sold. In addition, increases in distributed generation may impact demand resulting in lower load and revenues. These changes could negatively impact Emera’s operations, rate base, net earnings, and cash flows and result in a Material Adverse Effect. Foreign Exchange Risk The Company is exposed to foreign currency exchange rate changes. Emera operates internationally, with a significant amount of the Company’s net income earned outside of Canada. As such, Emera is exposed to movements in exchange rates between the CAD and, particularly, the USD, which could positively or adversely affect results. Emera manages currency risks through matching US denominated debt to finance its US operations and may use foreign currency derivative instruments to hedge specific transactions and earnings exposure. The Company may enter FX forward and swap contracts to limit exposure on certain foreign currency transactions such as fuel purchases, revenue streams and capital expenditures, and on net income earned outside of Canada. The regulatory framework for the Company’s rate-regulated utilities permits the recovery of prudently incurred costs, including FX. The Company does not utilize derivative financial instruments for foreign currency trading or speculative purposes or to hedge the value of its investments in foreign subsidiaries. Exchange gains and losses on net investments in foreign subsidiaries do not impact net income as they are reported in Accumulated Other Comprehensive Income (Loss) (“AOCI”). EMERA 2025 ANNUAL REPORT 49
Strategic Management’s Discussion Consolidated Financial Emera Leadership Shareholder Overview and Analysis Statements and Board information Liquidity and Capital Markets Risk Liquidity risk relates to Emera’s ability to ensure sufficient funds are available to meet its financial obligations. Emera’s access to capital and cost of borrowing is subject to several risk factors, including financial market conditions, market disruptions and ratings assigned by various market analysts, including credit rating agencies. Disruptions in capital markets could prevent Emera from issuing new securities or cause the Company to issue securities with less than preferred terms and conditions. Emera’s growth plan requires significant capital investments and the risk associated with changes in interest rates could have an adverse effect on the cost of financing. The Company’s future access to capital and cost of borrowing may be impacted by various market disruptions. The inability to access cost-effective capital could have a Material Adverse Effect on Emera’s ability to fund its growth plan. Emera is subject to financial risk associated with changes in its credit ratings. There are a number of factors that rating agencies evaluate to determine credit ratings, including the Company’s business, its regulatory framework and legislative environment, political interference in the regulatory process, the ability to recover costs and earn returns, diversification, leverage, liquidity and increased exposure to impacts related to changes in climate, including increased frequency and severity of hurricanes and other severe weather events. A decrease in a credit rating could result in higher interest rates in future financings, increased borrowing costs under certain existing credit facilities, limit access to the commercial paper market, or limit the availability of adequate credit support for subsidiary operations. For certain derivative instruments, if the credit ratings of the Company were reduced below investment grade, the full value of the net liability of these positions could be required to be posted as collateral. The Company has exposure to its own common share price through the issuance of various forms of stock-based compensation, which affect earnings through revaluation of the outstanding units every period. The Company uses equity derivatives to reduce the earnings volatility derived from stock-based compensation. General Economic Risk The Company has exposure to the macro-economic conditions in North America and in other geographic regions in which Emera operates. Like most utilities, economic factors such as consumer income, employment and housing affect demand for electricity and natural gas and, in turn, the Company’s financial results. Adverse changes in general economic conditions and inflation may impact the ability of customers to afford rate increases arising from increases to fuel, operating, capital, environmental compliance, and other costs, which could result in a Material Adverse Effect. This may also result in higher credit and counterparty risk, adverse shifts in government policy and legislation, and/or increased risk to full and timely recovery of costs and regulatory assets. Interest Rate Risk: Emera utilizes a combination of fixed and floating rate debt financing for operations and capital expenditures, resulting in an exposure to interest rate risk. For Emera’s rate-regulated utilities, the cost of debt is a component of rates and prudently incurred debt costs are recovered from customers. Regulatory ROE will generally follow the direction of interest rates, such that regulatory ROEs are likely to fall in times of reducing interest rates and rise in times of increasing interest rates, albeit not directly and generally with a lag period reflecting the regulatory process. Rising interest rates may also negatively affect the economic viability of project development and acquisition initiatives. Interest rates could also be impacted by changes in credit ratings. For more information, refer to “Liquidity and Capital Markets Risk”. As with most other utilities and other similar yield-returning investments, Emera’s share price may be affected by changes in interest rates and could underperform the market in an environment of rising interest rates. Inflation Risk: The Company may be exposed to changes in inflation that may result in increased operating and maintenance costs, capital investment, and fuel costs compared to the revenues provided by customer rates. Public Health Crisis Risk An outbreak of infectious disease, a pandemic or other public health threats, or a fear of any of the foregoing, could result in a Material Adverse Effect. This could include causing operating, supply chain and project development delays and disruptions, labour shortages and shutdowns (including as a result of government regulation and prevention measures), which could have a negative impact on the Company’s operations. 50 EMERA 2025 ANNUAL REPORT
Strategic Management’s Discussion Consolidated Financial Emera Leadership Shareholder Overview and Analysis Statements and Board information Any adverse changes in general economic and market conditions arising as a result of a public health threat could negatively impact demand for electricity and natural gas, revenue, operating costs, timing and extent of capital investments, capital market activities, and counterparty risk; which could result in a Material Adverse Effect. Health and Safety The Company’s operations inherently involve risk to the health and safety of employees, contractors and members of the public. Personal injury or loss of life resulting from failure to implement or observe appropriate health and safety procedures or comply with health and safety laws and regulations could result in adverse operational, reputational, legal, regulatory, or financial impacts, any of which could have a Material Adverse Effect. Project Development and Land Use Rights Risk The Company’s capital plan includes significant investment in generation, infrastructure modernization, and customer-focused technologies. Any projects planned or currently in construction, particularly significant capital projects, may be subject to risks that could result in a Material Adverse Effect including, but not limited to, impact on costs from schedule delays, increased demand for renewable energy inputs, risk of cost overruns, ensuring compliance with operating and environmental requirements and other events within or beyond the Company’s control. The Company’s projects may also require approvals and permits at the federal, provincial, state, regional and local levels. There is no assurance that Emera will be able to obtain the necessary project approvals or applicable permits or receive regulatory approval to recover the costs in rates. Some of the Company’s assets are located on land owned by third parties, including Indigenous Peoples, and may be subject to land claims. Present or future assets may be located on lands that have been used for traditional purposes and therefore subject to specific consultations, consents, or conditions for development or operation. If the Company’s rights to locate and operate its assets on any such lands are subject to expiry or become invalid, it may incur material costs to renew rights or obtain such rights. If reasonable terms for land-use rights cannot be negotiated, the Company may incur significant costs to remove and relocate its assets and restore the land. Additional costs incurred could cause projects to be uneconomical to proceed. Counterparty Risk Emera is exposed to risk related to its reliance on certain key partners, suppliers, and customers, any of whom may endure financial challenges resulting from commodity price and market volatility, economic instability or adversity, adverse political or regulatory changes and other causes which may cause or contribute to such parties’ insolvency, bankruptcy, restructuring or default on their contractual obligations to Emera. Emera is also exposed to potential losses related to amounts receivable from customers, energy marketing collateral deposits and derivative assets due to a counterparty’s non-performance under an agreement. There is no assurance that management strategies will be effective, and significant counterparty defaults could result in a Material Adverse Effect. Supply Chain Risk Emera’s ability to meet customer energy requirements, respond to storm-related disruptions and execute on the capital investment program in a cost-effective and timely manner are dependent on maintaining an efficient supply chain. Domestic and global supply chain issues may delay the delivery, increase the cost, or result in shortages of certain materials, fuel, equipment and other resources that are critical to the Company’s operations. These disruptions may be further exacerbated by trade restrictions, inflationary pressures, labour shortages, more frequent and severe weather events, government incentives increasing demand for clean energy projects, changes in carbon-related costs, policies and regulations, and the impact of international conflicts. In addition, the imposition of custom duties or other tariffs, or an increase in trade restrictions in the future could have a Material Adverse Effect. Fuel Supply Disruptions: Emera’s electric and natural gas utilities are exposed to the risk of fuel supply chain disruptions, both within and outside their service territories. Fuel supply disruptions may be caused by damage to, operational issues with, terrorist or cyberattacks on, impacts of severe weather or natural disasters on, third party fuel production, storage, pipeline, and distribution facilities. A significant unanticipated fuel supply disruption could result in increased exposure to commodity price risk for Emera’s regulated electric and gas utilities and Emera Energy, disruption to utility operations, and adverse reputational impacts, any of which could have a Material Adverse Effect. EMERA 2025 ANNUAL REPORT 51
Strategic Management’s Discussion Consolidated Financial Emera Leadership Shareholder Overview and Analysis Statements and Board information Commodity Price Risk The Company’s utility fuel supply and purchase of other commodities is subject to commodity price risk. In addition, Emera Energy is subject to commodity price risk through its portfolio of commodity contracts and arrangements. Regulated Utilities: The Company’s utility fuel supply is exposed to broader global market conditions, which may include impacts on delivery reliability and price, despite contracted terms. Supply and demand dynamics in fuel markets can be affected by a wide range of factors which are difficult to predict and may change rapidly, including but not limited to, currency fluctuations, changes in global economic conditions, natural disasters, transportation or production disruptions, and geo-political risks, such as political instability, conflicts, changes to international trade agreements, tariffs, trade sanctions or embargos. Prolonged and substantial increases in fuel prices could result in decreased rate affordability, increased risk of recovery of costs or regulatory assets, and/or negative impacts on customer consumption patterns and sales, any of which could result in a Material Adverse Effect. Emera Energy Marketing and Trading: The majority of Emera Energy’s portfolio of electricity and gas marketing and trading contracts and, in particular, its natural gas asset management arrangements, are contracted on a back-to-back basis, avoiding any material long or short commodity positions. However, the portfolio is subject to commodity price risk, particularly with respect to basis point differentials between relevant markets in the event of an operational issue, imposition of tariffs, or counterparty default. Changes in commodity prices can also result in increased collateral requirements associated with physical contracts and financial hedges, resulting in higher liquidity requirements and increased costs to the business. Future Employee Benefit Plan Performance and Funding Risk Emera subsidiaries have both defined benefit and defined contribution employee pension plans that cover employees and retirees. All defined benefit plans are closed to new entrants, except for the TECO Holdings Group Retirement Plan and the Grand Bahama Power Company Limited Union Employees’ Pension Plan. The cost of providing these benefit plans varies depending on plan provisions, interest rates, inflation, investment performance and actuarial assumptions concerning the future. Actuarial assumptions include earnings on plan assets, discount rates (interest rates used to determine funding levels, contributions to the plans and the pension and post-retirement liabilities) and expectations around future salary growth, inflation and mortality. The three largest drivers of cost are investment performance, interest rates and inflation, which are affected by global financial and capital markets. Depending on future interest rates and future inflation and actual versus expected investment performance, Emera could be required to make larger contributions in the future to fund these plans, which could have a Material Adverse Effect. Labour Risk Emera’s ability to deliver service to its customers and to execute its growth plan depends on attracting, developing and retaining a skilled workforce. Utilities are faced with demographic challenges related to trades, technical staff and engineers with an increasing number of employees expected to retire over the next several years. Failure to attract, develop and retain an appropriately qualified workforce could have a Material Adverse Effect. Approximately 30 per cent of Emera’s labour force is represented by unions and subject to collective labour agreements. The inability to maintain or negotiate future agreements on acceptable terms could result in higher labour costs and work disruptions, which could adversely affect service to customers and have a Material Adverse Effect. 52 EMERA 2025 ANNUAL REPORT
Strategic Management’s Discussion Consolidated Financial Emera Leadership Shareholder Overview and Analysis Statements and Board information Technology Risk Emera relies on various technology systems to manage operations, including increasing reliance on solutions operated by third parties, such as software as a service and third-party cloud hosting. This subjects Emera to inherent costs and risks associated with maintaining, upgrading, replacing and changing these systems. This includes impairment of its operations, potential disruption of internal control systems, substantial capital expenditures, demands on management time and other risks of delays, difficulties in upgrading existing systems, transitioning to new systems or integrating new systems into its current systems. Technological reliance may increase vulnerability to cyberattacks and data breaches and increase operational reliance on technology systems and third parties. The rapid evolution of AI has the potential to disrupt existing business models and markets and could result in a Material Adverse Effect. If the Company does not successfully integrate AI in a timely and cost-effective manner, it may not fully realize anticipated efficiencies, cost savings, or service improvements. If AI systems or tools do not operate as expected, it could result in adverse operational, safety, reputational, financial, legal, privacy, data security, or other outcomes. Emera’s digital transformation strategy, including investment in infrastructure modernization, emerging technologies such as Generative AI, and customer focused technologies, is driving increased investment in technology solutions, resulting in increased project risks associated with the implementation of these solutions. Income Tax Risk The computation of the Company’s provision for income taxes is impacted by changes in tax legislation in Canada, the US and the Caribbean and any such changes could have a Material Adverse Effect. The value of Emera’s existing deferred income tax assets and liabilities are determined by existing tax laws and could be negatively impacted by changes in laws. System Operating and Maintenance Risks The safe and reliable operation of electric generation and electric and natural gas transmission and distribution systems is critical to Emera’s operations. There are a variety of hazards and operational risks inherent in operating electric utilities and natural gas transmission and distribution pipelines. Electric generation, transmission and distribution operations can be impacted by risks such as mechanical failures, supply chain issues impacting timely access to critical equipment, activities of third parties, terrorism, cyberattacks, human error, damage to facilities, and infrastructure caused by hurricanes, storms, falling trees, lightning strikes, floods, fires and other natural disasters. Natural gas pipeline operations can be impacted by risks such as leaks, explosions, mechanical failures, activities of third parties, terrorism, cyberattacks, and damage to the pipeline facilities and equipment caused by hurricanes, storms, floods, fires and other natural disasters. Electric utility and natural gas transmission and distribution pipeline operation interruption could negatively affect customer and public confidence, and public safety, cause damage to Company infrastructure or third-party property, and have a Material Adverse Effect. Insurance, warranties, or recovery through regulatory mechanisms may not cover any or all these losses, which could have a Material Adverse Effect. Uninsured Risk Emera and its subsidiaries maintain insurance to cover accidental loss suffered to its facilities and to provide indemnity in the event of liability to third parties. A significant portion of Emera’s electric utilities’ transmission and distribution assets and its gas utilities’ distribution assets are not insured, as is customary in the industry, as the cost of coverage is prohibitive. In addition, Emera accepts deductibles and self-insured retentions under its various insurance policies. Insurance is subject to coverage limits as well as time sensitive claims discovery and reporting provisions and there can be no assurance that the types of liabilities or losses that may be incurred will be covered by insurance. The occurrence of significant uninsured claims, claims in excess of the insurance coverage limits, or claims that fall within a significant self-insured retention could have a Material Adverse Effect, if regulatory recovery is not available. EMERA 2025 ANNUAL REPORT 53
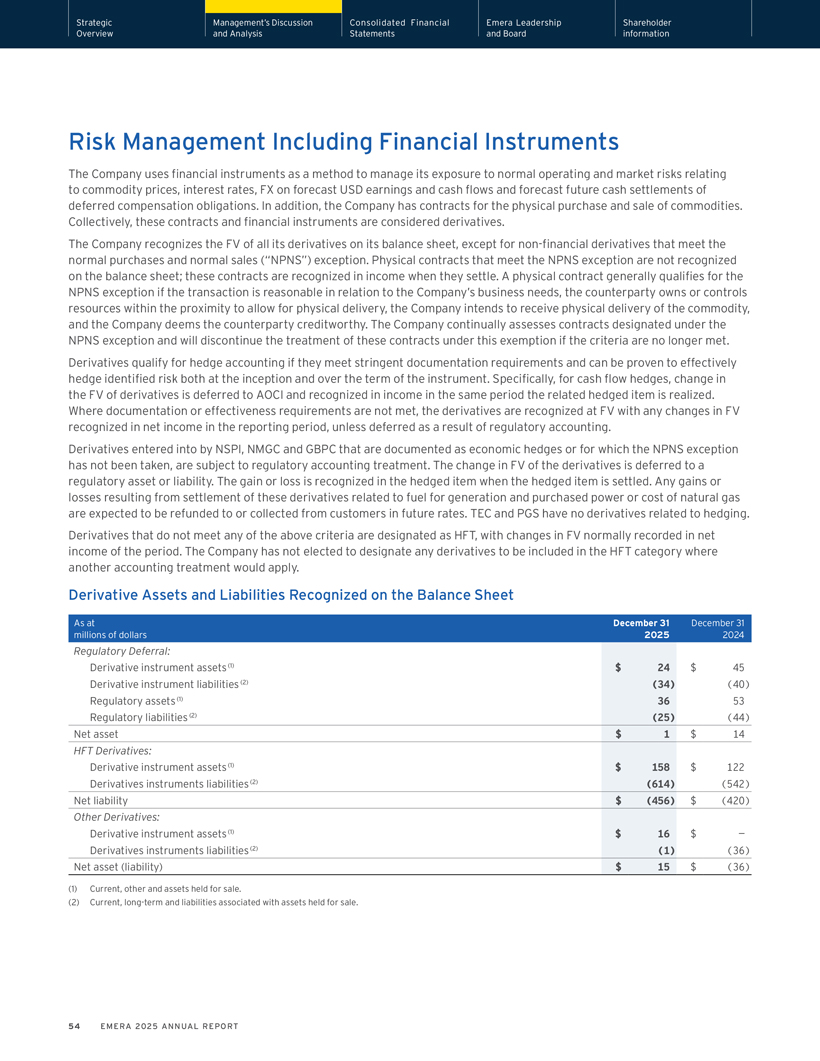
Strategic Management’s Discussion Consolidated Financial Emera Leadership Shareholder Overview and Analysis Statements and Board information Risk Management Including Financial Instruments The Company uses financial instruments as a method to manage its exposure to normal operating and market risks relating to commodity prices, interest rates, FX on forecast USD earnings and cash flows and forecast future cash settlements of deferred compensation obligations. In addition, the Company has contracts for the physical purchase and sale of commodities. Collectively, these contracts and financial instruments are considered derivatives. The Company recognizes the FV of all its derivatives on its balance sheet, except for non-financial derivatives that meet the normal purchases and normal sales (“NPNS”) exception. Physical contracts that meet the NPNS exception are not recognized on the balance sheet; these contracts are recognized in income when they settle. A physical contract generally qualifies for the NPNS exception if the transaction is reasonable in relation to the Company’s business needs, the counterparty owns or controls resources within the proximity to allow for physical delivery, the Company intends to receive physical delivery of the commodity, and the Company deems the counterparty creditworthy. The Company continually assesses contracts designated under the NPNS exception and will discontinue the treatment of these contracts under this exemption if the criteria are no longer met. Derivatives qualify for hedge accounting if they meet stringent documentation requirements and can be proven to effectively hedge identified risk both at the inception and over the term of the instrument. Specifically, for cash flow hedges, change in the FV of derivatives is deferred to AOCI and recognized in income in the same period the related hedged item is realized. Where documentation or effectiveness requirements are not met, the derivatives are recognized at FV with any changes in FV recognized in net income in the reporting period, unless deferred as a result of regulatory accounting. Derivatives entered into by NSPI, NMGC and GBPC that are documented as economic hedges or for which the NPNS exception has not been taken, are subject to regulatory accounting treatment. The change in FV of the derivatives is deferred to a regulatory asset or liability. The gain or loss is recognized in the hedged item when the hedged item is settled. Any gains or losses resulting from settlement of these derivatives related to fuel for generation and purchased power or cost of natural gas are expected to be refunded to or collected from customers in future rates. TEC and PGS have no derivatives related to hedging. Derivatives that do not meet any of the above criteria are designated as HFT, with changes in FV normally recorded in net income of the period. The Company has not elected to designate any derivatives to be included in the HFT category where another accounting treatment would apply. Derivative Assets and Liabilities Recognized on the Balance Sheet As at December 31 December 31 millions of dollars 2025 2024 Regulatory Deferral: Derivative instrument assets (1) $ 24 $ 45 Derivative instrument liabilities (2) (34) (40) Regulatory assets (1) 36 53 Regulatory liabilities (2) (25) (44) Net asset $ 1 $ 14 HFT Derivatives: Derivative instrument assets (1) $ 158 $ 122 Derivatives instruments liabilities (2) (614) (542) Net liability $ (456) $ (420) Other Derivatives: Derivative instrument assets (1) $ 16 $ — Derivatives instruments liabilities (2) (1) (36) Net asset (liability) $ 15 $ (36) (1) Current, other and assets held for sale. (2) Current, long-term and liabilities associated with assets held for sale. 54 EMERA 2025 ANNUAL REPORT
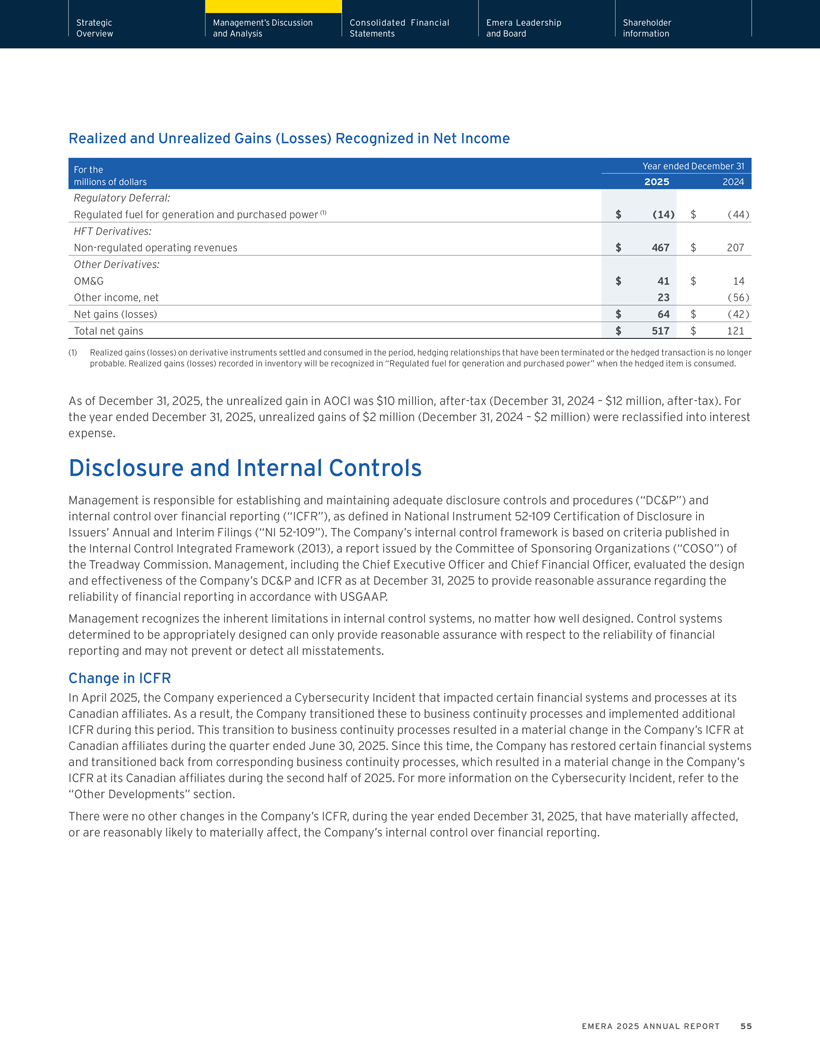
Strategic Management’s Discussion Consolidated Financial Emera Leadership Shareholder Overview and Analysis Statements and Board information Realized and Unrealized Gains (Losses) Recognized in Net Income For the Year ended December 31 millions of dollars 2025 2024 Regulatory Deferral: Regulated fuel for generation and purchased power (1) $ (14) $ (44) HFT Derivatives: Non-regulated operating revenues $ 467 $ 207 Other Derivatives: OM&G $ 41 $ 14 Other income, net 23 (56) Net gains (losses) $ 64 $ (42) Total net gains $ 517 $ 121 (1) Realized gains (losses) on derivative instruments settled and consumed in the period, hedging relationships that have been terminated or the hedged transaction is no longer probable. Realized gains (losses) recorded in inventory will be recognized in “Regulated fuel for generation and purchased power” when the hedged item is consumed. As of December 31, 2025, the unrealized gain in AOCI was $10 million, after-tax (December 31, 2024 – $12 million, after-tax). For the year ended December 31, 2025, unrealized gains of $2 million (December 31, 2024 – $2 million) were reclassified into interest expense. Disclosure and Internal Controls Management is responsible for establishing and maintaining adequate disclosure controls and procedures (“DC&P”) and internal control over financial reporting (“ICFR”), as defined in National Instrument 52-109 Certification of Disclosure in Issuers’ Annual and Interim Filings (“NI 52-109”). The Company’s internal control framework is based on criteria published in the Internal Control Integrated Framework (2013), a report issued by the Committee of Sponsoring Organizations (“COSO”) of the Treadway Commission. Management, including the Chief Executive Officer and Chief Financial Officer, evaluated the design and effectiveness of the Company’s DC&P and ICFR as at December 31, 2025 to provide reasonable assurance regarding the reliability of financial reporting in accordance with USGAAP. Management recognizes the inherent limitations in internal control systems, no matter how well designed. Control systems determined to be appropriately designed can only provide reasonable assurance with respect to the reliability of financial reporting and may not prevent or detect all misstatements. Change in ICFR In April 2025, the Company experienced a Cybersecurity Incident that impacted certain financial systems and processes at its Canadian affiliates. As a result, the Company transitioned these to business continuity processes and implemented additional ICFR during this period. This transition to business continuity processes resulted in a material change in the Company’s ICFR at Canadian affiliates during the quarter ended June 30, 2025. Since this time, the Company has restored certain financial systems and transitioned back from corresponding business continuity processes, which resulted in a material change in the Company’s ICFR at its Canadian affiliates during the second half of 2025. For more information on the Cybersecurity Incident, refer to the “Other Developments” section. There were no other changes in the Company’s ICFR, during the year ended December 31, 2025, that have materially affected, or are reasonably likely to materially affect, the Company’s internal control over financial reporting. EMERA 2025 ANNUAL REPORT 55
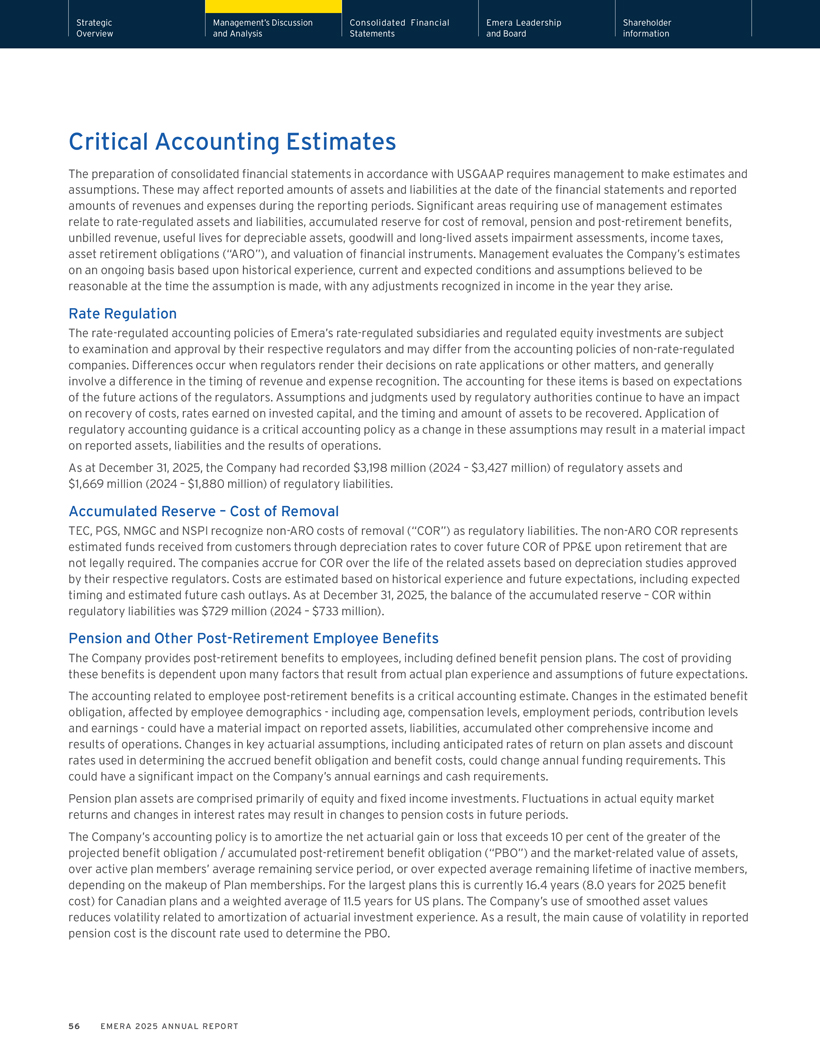
Strategic Management’s Discussion Consolidated Financial Emera Leadership Shareholder Overview and Analysis Statements and Board information Critical Accounting Estimates The preparation of consolidated financial statements in accordance with USGAAP requires management to make estimates and assumptions. These may affect reported amounts of assets and liabilities at the date of the financial statements and reported amounts of revenues and expenses during the reporting periods. Significant areas requiring use of management estimates relate to rate-regulated assets and liabilities, accumulated reserve for cost of removal, pension and post-retirement benefits, unbilled revenue, useful lives for depreciable assets, goodwill and long-lived assets impairment assessments, income taxes, asset retirement obligations (“ARO”), and valuation of financial instruments. Management evaluates the Company’s estimates on an ongoing basis based upon historical experience, current and expected conditions and assumptions believed to be reasonable at the time the assumption is made, with any adjustments recognized in income in the year they arise. Rate Regulation The rate-regulated accounting policies of Emera’s rate-regulated subsidiaries and regulated equity investments are subject to examination and approval by their respective regulators and may differ from the accounting policies of non-rate-regulated companies. Differences occur when regulators render their decisions on rate applications or other matters, and generally involve a difference in the timing of revenue and expense recognition. The accounting for these items is based on expectations of the future actions of the regulators. Assumptions and judgments used by regulatory authorities continue to have an impact on recovery of costs, rates earned on invested capital, and the timing and amount of assets to be recovered. Application of regulatory accounting guidance is a critical accounting policy as a change in these assumptions may result in a material impact on reported assets, liabilities and the results of operations. As at December 31, 2025, the Company had recorded $3,198 million (2024 – $3,427 million) of regulatory assets and $1,669 million (2024 – $1,880 million) of regulatory liabilities. Accumulated Reserve – Cost of Removal TEC, PGS, NMGC and NSPI recognize non-ARO costs of removal (“COR”) as regulatory liabilities. The non-ARO COR represents estimated funds received from customers through depreciation rates to cover future COR of PP&E upon retirement that are not legally required. The companies accrue for COR over the life of the related assets based on depreciation studies approved by their respective regulators. Costs are estimated based on historical experience and future expectations, including expected timing and estimated future cash outlays. As at December 31, 2025, the balance of the accumulated reserve – COR within regulatory liabilities was $729 million (2024 – $733 million). Pension and Other Post-Retirement Employee Benefits The Company provides post-retirement benefits to employees, including defined benefit pension plans. The cost of providing these benefits is dependent upon many factors that result from actual plan experience and assumptions of future expectations. The accounting related to employee post-retirement benefits is a critical accounting estimate. Changes in the estimated benefit obligation, affected by employee demographics—including age, compensation levels, employment periods, contribution levels and earnings—could have a material impact on reported assets, liabilities, accumulated other comprehensive income and results of operations. Changes in key actuarial assumptions, including anticipated rates of return on plan assets and discount rates used in determining the accrued benefit obligation and benefit costs, could change annual funding requirements. This could have a significant impact on the Company’s annual earnings and cash requirements. Pension plan assets are comprised primarily of equity and fixed income investments. Fluctuations in actual equity market returns and changes in interest rates may result in changes to pension costs in future periods. The Company’s accounting policy is to amortize the net actuarial gain or loss that exceeds 10 per cent of the greater of the projected benefit obligation / accumulated post-retirement benefit obligation (“PBO”) and the market-related value of assets, over active plan members’ average remaining service period, or over expected average remaining lifetime of inactive members, depending on the makeup of Plan memberships. For the largest plans this is currently 16.4 years (8.0 years for 2025 benefit cost) for Canadian plans and a weighted average of 11.5 years for US plans. The Company’s use of smoothed asset values reduces volatility related to amortization of actuarial investment experience. As a result, the main cause of volatility in reported pension cost is the discount rate used to determine the PBO. 56 EMERA 2025 ANNUAL REPORT
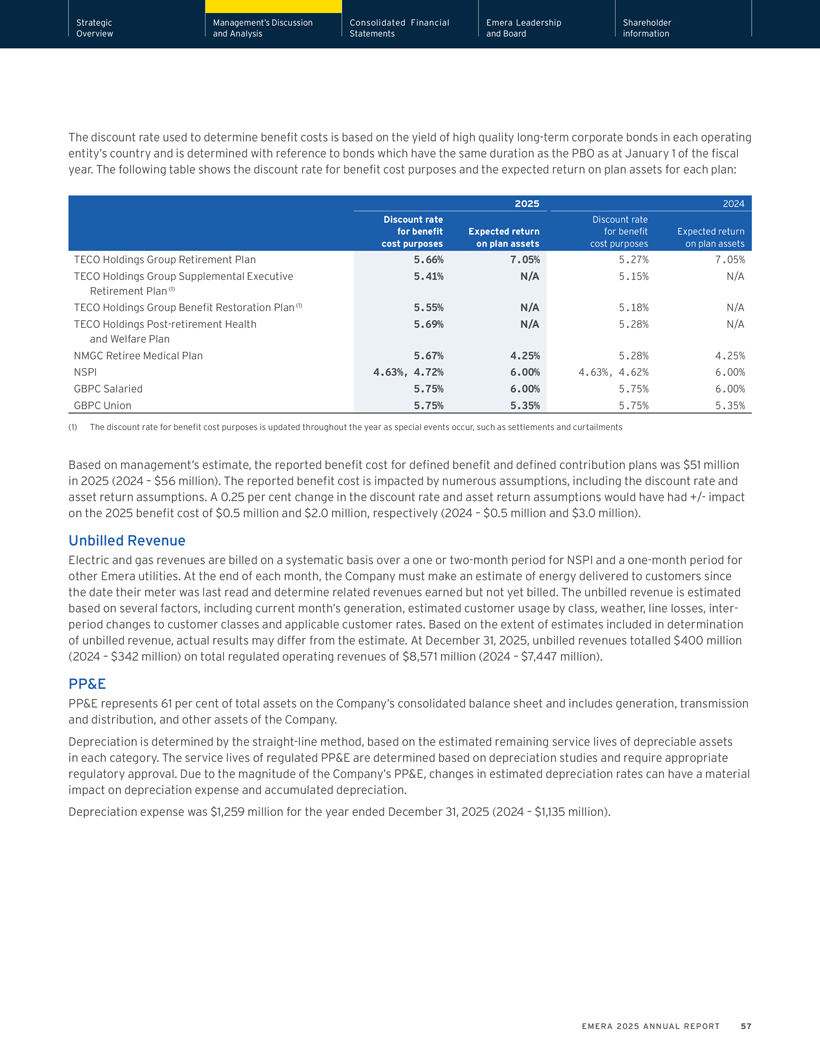
Strategic Management’s Discussion Consolidated Financial Emera Leadership Shareholder Overview and Analysis Statements and Board information The discount rate used to determine benefit costs is based on the yield of high quality long-term corporate bonds in each operating entity’s country and is determined with reference to bonds which have the same duration as the PBO as at January 1 of the fiscal year. The following table shows the discount rate for benefit cost purposes and the expected return on plan assets for each plan: 2025 2024 Discount rate Discount rate for benefit Expected return for benefit Expected return cost purposes on plan assets cost purposes on plan assets TECO Holdings Group Retirement Plan 5.66% 7.05% 5.27% 7.05% TECO Holdings Group Supplemental Executive 5.41% N/A 5.15% N/A Retirement Plan (1) TECO Holdings Group Benefit Restoration Plan (1) 5.55% N/A 5.18% N/A TECO Holdings Post-retirement Health 5.69% N/A 5.28% N/A and Welfare Plan NMGC Retiree Medical Plan 5.67% 4.25% 5.28% 4.25% NSPI 4.63%, 4.72% 6.00% 4.63%, 4.62% 6.00% GBPC Salaried 5.75% 6.00% 5.75% 6.00% GBPC Union 5.75% 5.35% 5.75% 5.35% (1) The discount rate for benefit cost purposes is updated throughout the year as special events occur, such as settlements and curtailments Based on management’s estimate, the reported benefit cost for defined benefit and defined contribution plans was $51 million in 2025 (2024 – $56 million). The reported benefit cost is impacted by numerous assumptions, including the discount rate and asset return assumptions. A 0.25 per cent change in the discount rate and asset return assumptions would have had +/- impact on the 2025 benefit cost of $0.5 million and $2.0 million, respectively (2024 – $0.5 million and $3.0 million). Unbilled Revenue Electric and gas revenues are billed on a systematic basis over a one or two-month period for NSPI and a one-month period for other Emera utilities. At the end of each month, the Company must make an estimate of energy delivered to customers since the date their meter was last read and determine related revenues earned but not yet billed. The unbilled revenue is estimated based on several factors, including current month’s generation, estimated customer usage by class, weather, line losses, inter-period changes to customer classes and applicable customer rates. Based on the extent of estimates included in determination of unbilled revenue, actual results may differ from the estimate. At December 31, 2025, unbilled revenues totalled $400 million (2024 – $342 million) on total regulated operating revenues of $8,571 million (2024 – $7,447 million). PP&E PP&E represents 61 per cent of total assets on the Company’s consolidated balance sheet and includes generation, transmission and distribution, and other assets of the Company. Depreciation is determined by the straight-line method, based on the estimated remaining service lives of depreciable assets in each category. The service lives of regulated PP&E are determined based on depreciation studies and require appropriate regulatory approval. Due to the magnitude of the Company’s PP&E, changes in estimated depreciation rates can have a material impact on depreciation expense and accumulated depreciation. Depreciation expense was $1,259 million for the year ended December 31, 2025 (2024 – $1,135 million). EMERA 2025 ANNUAL REPORT 57
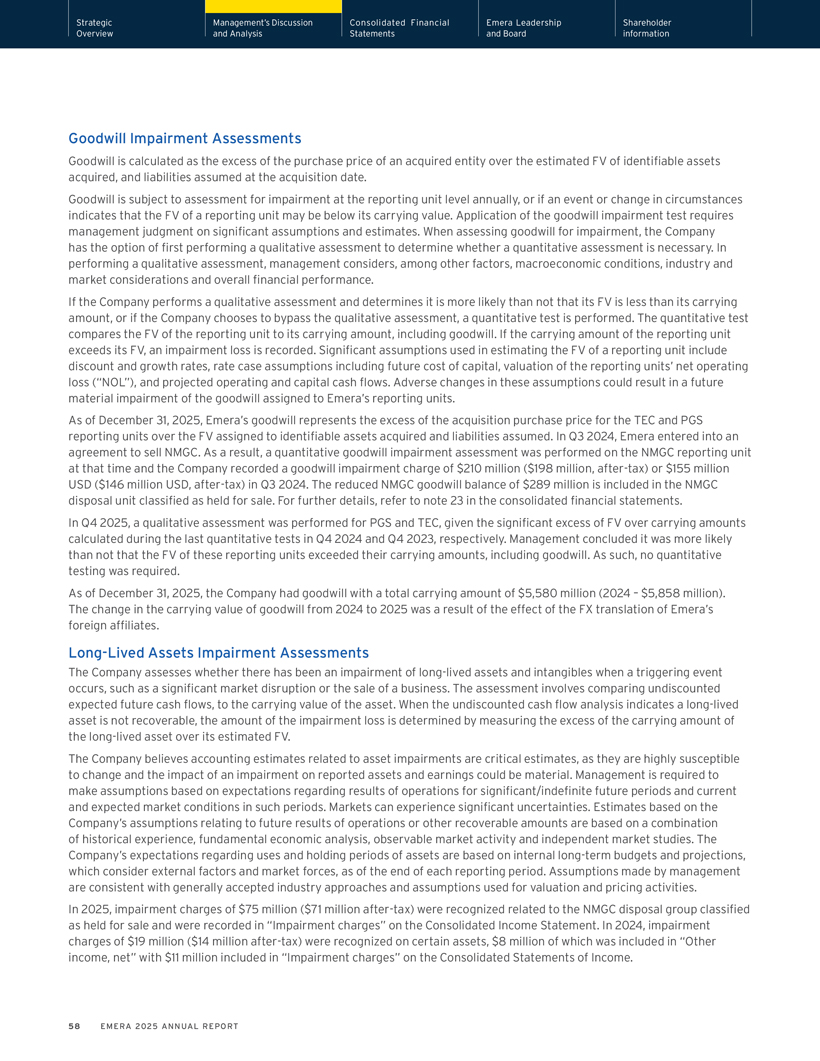
Strategic Management’s Discussion Consolidated Financial Emera Leadership Shareholder Overview and Analysis Statements and Board information Goodwill Impairment Assessments Goodwill is calculated as the excess of the purchase price of an acquired entity over the estimated FV of identifiable assets acquired, and liabilities assumed at the acquisition date. Goodwill is subject to assessment for impairment at the reporting unit level annually, or if an event or change in circumstances indicates that the FV of a reporting unit may be below its carrying value. Application of the goodwill impairment test requires management judgment on significant assumptions and estimates. When assessing goodwill for impairment, the Company has the option of first performing a qualitative assessment to determine whether a quantitative assessment is necessary. In performing a qualitative assessment, management considers, among other factors, macroeconomic conditions, industry and market considerations and overall financial performance. If the Company performs a qualitative assessment and determines it is more likely than not that its FV is less than its carrying amount, or if the Company chooses to bypass the qualitative assessment, a quantitative test is performed. The quantitative test compares the FV of the reporting unit to its carrying amount, including goodwill. If the carrying amount of the reporting unit exceeds its FV, an impairment loss is recorded. Significant assumptions used in estimating the FV of a reporting unit include discount and growth rates, rate case assumptions including future cost of capital, valuation of the reporting units’ net operating loss (“NOL”), and projected operating and capital cash flows. Adverse changes in these assumptions could result in a future material impairment of the goodwill assigned to Emera’s reporting units. As of December 31, 2025, Emera’s goodwill represents the excess of the acquisition purchase price for the TEC and PGS reporting units over the FV assigned to identifiable assets acquired and liabilities assumed. In Q3 2024, Emera entered into an agreement to sell NMGC. As a result, a quantitative goodwill impairment assessment was performed on the NMGC reporting unit at that time and the Company recorded a goodwill impairment charge of $210 million ($198 million, after-tax) or $155 million USD ($146 million USD, after-tax) in Q3 2024. The reduced NMGC goodwill balance of $289 million is included in the NMGC disposal unit classified as held for sale. For further details, refer to note 23 in the consolidated financial statements. In Q4 2025, a qualitative assessment was performed for PGS and TEC, given the significant excess of FV over carrying amounts calculated during the last quantitative tests in Q4 2024 and Q4 2023, respectively. Management concluded it was more likely than not that the FV of these reporting units exceeded their carrying amounts, including goodwill. As such, no quantitative testing was required. As of December 31, 2025, the Company had goodwill with a total carrying amount of $5,580 million (2024 – $5,858 million). The change in the carrying value of goodwill from 2024 to 2025 was a result of the effect of the FX translation of Emera’s foreign affiliates. Long-Lived Assets Impairment Assessments The Company assesses whether there has been an impairment of long-lived assets and intangibles when a triggering event occurs, such as a significant market disruption or the sale of a business. The assessment involves comparing undiscounted expected future cash flows, to the carrying value of the asset. When the undiscounted cash flow analysis indicates a long-lived asset is not recoverable, the amount of the impairment loss is determined by measuring the excess of the carrying amount of the long-lived asset over its estimated FV. The Company believes accounting estimates related to asset impairments are critical estimates, as they are highly susceptible to change and the impact of an impairment on reported assets and earnings could be material. Management is required to make assumptions based on expectations regarding results of operations for significant/indefinite future periods and current and expected market conditions in such periods. Markets can experience significant uncertainties. Estimates based on the Company’s assumptions relating to future results of operations or other recoverable amounts are based on a combination of historical experience, fundamental economic analysis, observable market activity and independent market studies. The Company’s expectations regarding uses and holding periods of assets are based on internal long-term budgets and projections, which consider external factors and market forces, as of the end of each reporting period. Assumptions made by management are consistent with generally accepted industry approaches and assumptions used for valuation and pricing activities. In 2025, impairment charges of $75 million ($71 million after-tax) were recognized related to the NMGC disposal group classified as held for sale and were recorded in “Impairment charges” on the Consolidated Income Statement. In 2024, impairment charges of $19 million ($14 million after-tax) were recognized on certain assets, $8 million of which was included in “Other income, net” with $11 million included in “Impairment charges” on the Consolidated Statements of Income. 58 EMERA 2025 ANNUAL REPORT
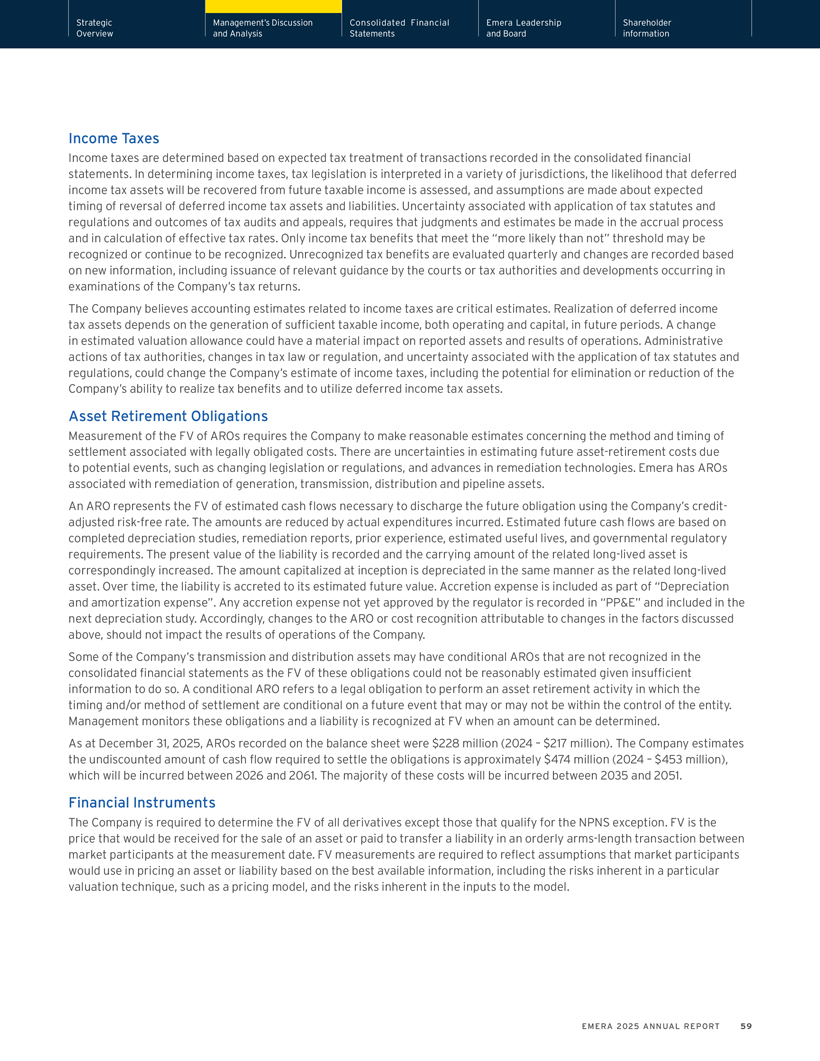
Strategic Management’s Discussion Consolidated Financial Emera Leadership Shareholder Overview and Analysis Statements and Board information Income Taxes Income taxes are determined based on expected tax treatment of transactions recorded in the consolidated financial statements. In determining income taxes, tax legislation is interpreted in a variety of jurisdictions, the likelihood that deferred income tax assets will be recovered from future taxable income is assessed, and assumptions are made about expected timing of reversal of deferred income tax assets and liabilities. Uncertainty associated with application of tax statutes and regulations and outcomes of tax audits and appeals, requires that judgments and estimates be made in the accrual process and in calculation of effective tax rates. Only income tax benefits that meet the “more likely than not” threshold may be recognized or continue to be recognized. Unrecognized tax benefits are evaluated quarterly and changes are recorded based on new information, including issuance of relevant guidance by the courts or tax authorities and developments occurring in examinations of the Company’s tax returns. The Company believes accounting estimates related to income taxes are critical estimates. Realization of deferred income tax assets depends on the generation of sufficient taxable income, both operating and capital, in future periods. A change in estimated valuation allowance could have a material impact on reported assets and results of operations. Administrative actions of tax authorities, changes in tax law or regulation, and uncertainty associated with the application of tax statutes and regulations, could change the Company’s estimate of income taxes, including the potential for elimination or reduction of the Company’s ability to realize tax benefits and to utilize deferred income tax assets. Asset Retirement Obligations Measurement of the FV of AROs requires the Company to make reasonable estimates concerning the method and timing of settlement associated with legally obligated costs. There are uncertainties in estimating future asset-retirement costs due to potential events, such as changing legislation or regulations, and advances in remediation technologies. Emera has AROs associated with remediation of generation, transmission, distribution and pipeline assets. An ARO represents the FV of estimated cash flows necessary to discharge the future obligation using the Company’s credit-adjusted risk-free rate. The amounts are reduced by actual expenditures incurred. Estimated future cash flows are based on completed depreciation studies, remediation reports, prior experience, estimated useful lives, and governmental regulatory requirements. The present value of the liability is recorded and the carrying amount of the related long-lived asset is correspondingly increased. The amount capitalized at inception is depreciated in the same manner as the related long-lived asset. Over time, the liability is accreted to its estimated future value. Accretion expense is included as part of “Depreciation and amortization expense”. Any accretion expense not yet approved by the regulator is recorded in “PP&E” and included in the next depreciation study. Accordingly, changes to the ARO or cost recognition attributable to changes in the factors discussed above, should not impact the results of operations of the Company. Some of the Company’s transmission and distribution assets may have conditional AROs that are not recognized in the consolidated financial statements as the FV of these obligations could not be reasonably estimated given insufficient information to do so. A conditional ARO refers to a legal obligation to perform an asset retirement activity in which the timing and/or method of settlement are conditional on a future event that may or may not be within the control of the entity. Management monitors these obligations and a liability is recognized at FV when an amount can be determined. As at December 31, 2025, AROs recorded on the balance sheet were $228 million (2024 – $217 million). The Company estimates the undiscounted amount of cash flow required to settle the obligations is approximately $474 million (2024 – $453 million), which will be incurred between 2026 and 2061. The majority of these costs will be incurred between 2035 and 2051. Financial Instruments The Company is required to determine the FV of all derivatives except those that qualify for the NPNS exception. FV is the price that would be received for the sale of an asset or paid to transfer a liability in an orderly arms-length transaction between market participants at the measurement date. FV measurements are required to reflect assumptions that market participants would use in pricing an asset or liability based on the best available information, including the risks inherent in a particular valuation technique, such as a pricing model, and the risks inherent in the inputs to the model. EMERA 2025 ANNUAL REPORT 59
Strategic Management’s Discussion Consolidated Financial Emera Leadership Shareholder Overview and Analysis Statements and Board information Level Determinations and Classifications The Company uses Level 1, 2, and 3 classifications in the FV hierarchy. The FV measurement of a financial instrument is included in only one of the three levels and is based on the lowest level input significant to the derivation of the FV. FV is determined, directly or indirectly, using inputs that are observable for the asset or liability. Only in limited circumstances does the Company enter into commodity transactions involving non-standard features where market observable data is not available or have contract terms that extend beyond five years. Changes in Accounting Policies and Practices The new USGAAP accounting policy that is applicable to, and adopted by the Company in 2025, is described as follows: Improvements to Income Tax Disclosures The Company adopted Accounting Standard Update (“ASU”) 2023-09, Income Taxes (Topic 740), Improvements to Income Tax Disclosures, effective December 31, 2025. The standard enhances the transparency, decision usefulness and effectiveness of income tax disclosures by requiring consistent categories and greater disaggregation of information in the reconciliation of income taxes computed using the enacted statutory income tax rate to the actual income tax provision and effective income tax rate, as well as the disaggregation of income taxes paid (refunded) by jurisdiction. Adoption of the standard resulted in additional disclosures provided in note 11 and note 31 of Emera’s consolidated financial statements. Future Accounting Pronouncements The Company considers the applicability and impact of all ASUs issued by the Financial Accounting Standards Board (“FASB”). The following updates have been issued by the FASB but, as allowed, have not yet been adopted by Emera. Any ASUs not included below were assessed and determined to be either not applicable to the Company or to have an insignificant impact on the consolidated financial statements. Accounting for Government Grants Received by Business Entities In December 2025, the FASB issued ASU 2025-10, Government Grants (Topic 832) – Accounting for Government Grants Received by Business Entities. The ASU adds guidance to ASC 832 on the recognition, measurement, and presentation of government grants. The guidance will be effective for annual reporting periods beginning after December 15, 2028, and interim reporting periods within those annual reporting periods. Early adoption is permitted. The standard updates are to be applied using either a modified prospective, modified retrospective, or full retrospective approach, as detailed in the ASU. The Company is currently evaluating the impact of adoption of the standard update on its consolidated financial statements. Targeted Improvements to the Accounting for Internal-Use Software In September 2025, the FASB issued ASU 2025-06, Intangibles – Goodwill and Other – Internal-Use Software (Subtopic 350-40): Targeted Improvements to the Accounting for Internal-Use Software. The standard update modernizes accounting for internal-use software by eliminating references to project stages and clarifying the threshold to begin capitalizing costs. The standard update also specifies that the disclosure requirements under ASC 360, Property, Plant and Equipment, apply to capitalized software costs accounted under ASC 350-40. The guidance will be effective for annual reporting periods beginning after December 15, 2027, and interim reporting periods within those annual reporting periods. Early adoption is permitted. The standard updates are to be applied using either a prospective, retrospective, or modified transition approach. The Company is currently evaluating the impact of adoption of the standard update on its consolidated financial statements. Disaggregation of Income Statement Expenses In November 2024, the FASB issued ASU 2024-03, Income Statement Reporting – Comprehensive Income – Expense Disaggregation Disclosures (Subtopic 220-40): Disaggregation of Income Statement Expenses. The standard update improves the disclosures about a public business entity’s expenses by requiring more detailed information about the types of expenses (including purchases of inventory, employee compensation, depreciation and amortization) included within income statement expense captions. The guidance will be effective for annual reporting periods beginning after December 15, 2026, and interim reporting periods beginning after December 15, 2027. Early adoption is permitted. The standard updates are to be applied prospectively with the option for retrospective application. The Company is currently evaluating the impact of adoption of the standard update on its consolidated financial statements disclosures. 60 EMERA 2025 ANNUAL REPORT
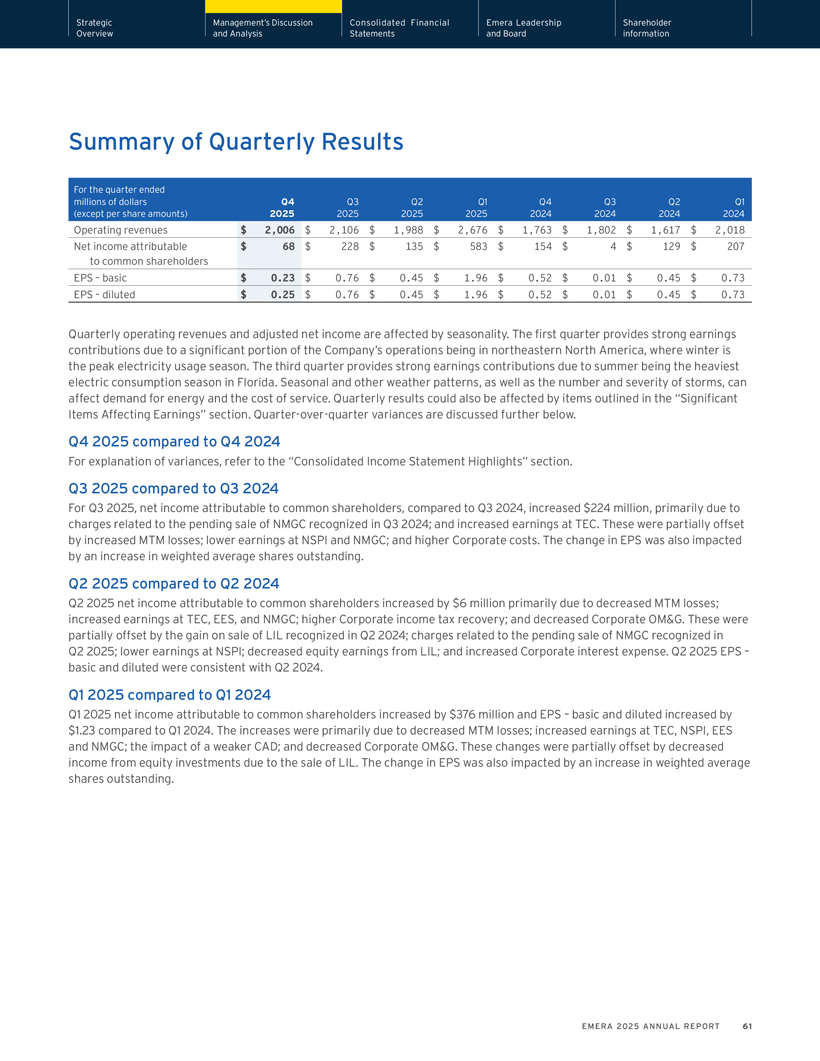
Strategic Management’s Discussion Consolidated Financial Emera Leadership Shareholder Overview and Analysis Statements and Board information Summary of Quarterly Results For the quarter ended millions of dollars Q4 Q3 Q2 Q1 Q4 Q3 Q2 Q1 (except per share amounts) 2025 2025 2025 2025 2024 2024 2024 2024 Operating revenues $ 2,006 $ 2,106 $ 1,988 $ 2,676 $ 1,763 $ 1,802 $ 1,617 $ 2,018 Net income attributable $ 68 $ 228 $ 135 $ 583 $ 154 $ 4 $ 129 $ 207 to common shareholders EPS – basic $ 0.23 $ 0.76 $ 0.45 $ 1.96 $ 0.52 $ 0.01 $ 0.45 $ 0.73 EPS – diluted $ 0.25 $ 0.76 $ 0.45 $ 1.96 $ 0.52 $ 0.01 $ 0.45 $ 0.73 Quarterly operating revenues and adjusted net income are affected by seasonality. The first quarter provides strong earnings contributions due to a significant portion of the Company’s operations being in northeastern North America, where winter is the peak electricity usage season. The third quarter provides strong earnings contributions due to summer being the heaviest electric consumption season in Florida. Seasonal and other weather patterns, as well as the number and severity of storms, can affect demand for energy and the cost of service. Quarterly results could also be affected by items outlined in the “Significant Items Affecting Earnings” section. Quarter-over-quarter variances are discussed further below. Q4 2025 compared to Q4 2024 For explanation of variances, refer to the “Consolidated Income Statement Highlights” section. Q3 2025 compared to Q3 2024 For Q3 2025, net income attributable to common shareholders, compared to Q3 2024, increased $224 million, primarily due to charges related to the pending sale of NMGC recognized in Q3 2024; and increased earnings at TEC. These were partially offset by increased MTM losses; lower earnings at NSPI and NMGC; and higher Corporate costs. The change in EPS was also impacted by an increase in weighted average shares outstanding. Q2 2025 compared to Q2 2024 Q2 2025 net income attributable to common shareholders increased by $6 million primarily due to decreased MTM losses; increased earnings at TEC, EES, and NMGC; higher Corporate income tax recovery; and decreased Corporate OM&G. These were partially offset by the gain on sale of LIL recognized in Q2 2024; charges related to the pending sale of NMGC recognized in Q2 2025; lower earnings at NSPI; decreased equity earnings from LIL; and increased Corporate interest expense. Q2 2025 EPS –basic and diluted were consistent with Q2 2024. Q1 2025 compared to Q1 2024 Q1 2025 net income attributable to common shareholders increased by $376 million and EPS – basic and diluted increased by $1.23 compared to Q1 2024. The increases were primarily due to decreased MTM losses; increased earnings at TEC, NSPI, EES and NMGC; the impact of a weaker CAD; and decreased Corporate OM&G. These changes were partially offset by decreased income from equity investments due to the sale of LIL. The change in EPS was also impacted by an increase in weighted average shares outstanding. EMERA 2025 ANNUAL REPORT 61

Strategic Management’s Discussion Consolidated Financial Emera Leadership Shareholder Overview and Analysis Statements and Board information Consolidated Financial Statements 62 EMERA 2025 ANNUAL REPORT
Strategic Management’s Discussion Consolidated Financial Emera Leadership Shareholder Overview and Analysis Statements and Board information Management Report Management’s Responsibility for Financial Reporting The accompanying consolidated financial statements of Emera Incorporated and the information in this annual report are the responsibility of management and have been approved by the Board of Directors (“Board”). The consolidated financial statements have been prepared by management in accordance with United States Generally Accepted Accounting Principles. When alternative accounting methods exist, management has chosen those it considers most appropriate in the circumstances. In preparation of these consolidated financial statements, estimates are sometimes necessary when transactions affecting the current accounting period cannot be finalized with certainty until future periods. Management represents that such estimates, which have been properly reflected in the accompanying consolidated financial statements, are based on careful judgments and are within reasonable limits of materiality. Management has determined such amounts on a reasonable basis in order to ensure that the consolidated financial statements are presented fairly in all material respects. Management has prepared the financial information presented elsewhere in the annual report and has ensured that it is consistent with that in the consolidated financial statements. Emera Incorporated maintains effective systems of internal accounting and administrative controls, consistent with reasonable cost. Such systems are designed to provide reasonable assurance that the financial information is reliable and accurate, and that Emera Incorporated’s assets are appropriately accounted for and adequately safeguarded. The Board is responsible for ensuring that management fulfils its responsibilities for financial reporting and is ultimately responsible for reviewing and approving the consolidated financial statements. The Board carries out this responsibility principally through its Audit Committee. The Audit Committee is appointed by the Board, and its members are directors who are not officers or employees of Emera Incorporated. The Audit Committee meets periodically with management, as well as with the internal auditors and with the external auditors, to discuss internal controls over the financial reporting process, auditing matters and financial reporting issues, to satisfy itself that each party is properly discharging its responsibilities, and to review the annual report, the consolidated financial statements and the external auditors’ report. The Audit Committee reports its findings to the Board for consideration when approving the consolidated financial statements for issuance to the shareholders. The Audit Committee also considers, for review by the Board and approval by the shareholders, the appointment of the external auditors. The consolidated financial statements have been audited by Ernst & Young LLP, the external auditors, in accordance with the standards of the Public Company Accounting Oversight Board. Ernst & Young LLP has full and free access to the Audit Committee. February 23, 2026 “Scott Balfour” “Jared Green” President and Chief Executive Officer Chief Financial Officer EMERA 2025 ANNUAL REPORT 63
Strategic Management’s Discussion Consolidated Financial Emera Leadership Shareholder Overview and Analysis Statements and Board information Report of Independent Registered Public Accounting Firm To the Shareholders and the Board of Directors of Emera Incorporated Opinion on the Consolidated Financial Statements We have audited the accompanying Consolidated Balance Sheets of Emera Incorporated (the “Company“) as of December 31, 2025 and 2024, the related Consolidated Statements of Income, Consolidated Statements of Comprehensive Income, Consolidated Statements of Changes in Equity and Consolidated Statements of Cash Flows for the years then ended, and the related notes (collectively referred to as the “consolidated financial statements“). In our opinion, the consolidated financial statements present fairly, in all material respects, the consolidated financial position of the Company as of December 31, 2025 and 2024, and the consolidated results of its operations and its consolidated cash flows for each of the two years in the period ended December 31, 2025, in conformity with United States generally accepted accounting principles. Basis for Opinion These consolidated financial statements are the responsibility of the Company‘s management. Our responsibility is to express an opinion on the Company‘s consolidated financial statements based on our audits. We are a public accounting firm registered with the Public Company Accounting Oversight Board (United States) (“PCAOB”) and are required to be independent with respect to the Company in accordance with the U.S. federal securities laws and the applicable rules and regulations of the Securities and Exchange Commission and the PCAOB. We conducted our audits in accordance with the standards of the PCAOB. Those standards require that we plan and perform the audits to obtain reasonable assurance about whether the consolidated financial statements are free of material misstatement, whether due to error or fraud. The Company is not required to have, nor were we engaged to perform, an audit of its internal control over financial reporting. As part of our audits we are required to obtain an understanding of internal control over financial reporting but not for the purpose of expressing an opinion on the effectiveness of the Company’s internal control over financial reporting. Accordingly, we express no such opinion. Our audits included performing procedures to assess the risks of material misstatement of the consolidated financial statements, whether due to error or fraud, and performing procedures that respond to those risks. Such procedures included examining, on a test basis, evidence regarding the amounts and disclosures in the consolidated financial statements. Our audits also included evaluating the accounting principles used and significant estimates made by management, as well as evaluating the overall presentation of the consolidated financial statements. We believe that our audits provide a reasonable basis for our opinion. Critical Audit Matters The critical audit matters communicated below are matters arising from the current period audit of the financial statements that were communicated or required to be communicated to the audit committee and that: (1) relate to accounts or disclosures that are material to the financial statements and (2) involved our especially challenging, subjective or complex judgments. The communication of critical audit matters does not alter in any way our opinion on the consolidated financial statements, taken as a whole, and we are not, by communicating the critical audit matters below, providing separate opinions on the critical audit matters or on the accounts or disclosures to which they relate. 64 EMERA 2025 ANNUAL REPORT
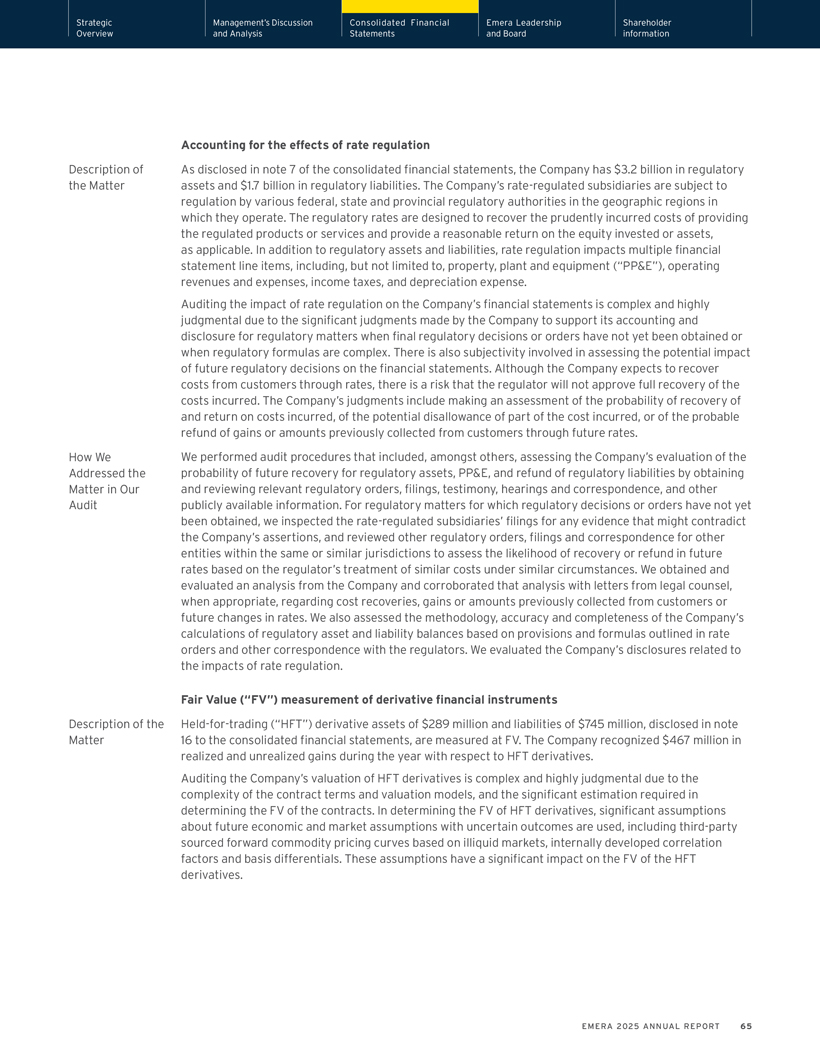
Strategic Management’s Discussion Consolidated Financial Emera Leadership Shareholder Overview and Analysis Statements and Board information Accounting for the effects of rate regulation Description of As disclosed in note 7 of the consolidated financial statements, the Company has $3.2 billion in regulatory the Matter assets and $1.7 billion in regulatory liabilities. The Company’s rate-regulated subsidiaries are subject to regulation by various federal, state and provincial regulatory authorities in the geographic regions in which they operate. The regulatory rates are designed to recover the prudently incurred costs of providing the regulated products or services and provide a reasonable return on the equity invested or assets, as applicable. In addition to regulatory assets and liabilities, rate regulation impacts multiple financial statement line items, including, but not limited to, property, plant and equipment (“PP&E”), operating revenues and expenses, income taxes, and depreciation expense. Auditing the impact of rate regulation on the Company’s financial statements is complex and highly judgmental due to the significant judgments made by the Company to support its accounting and disclosure for regulatory matters when final regulatory decisions or orders have not yet been obtained or when regulatory formulas are complex. There is also subjectivity involved in assessing the potential impact of future regulatory decisions on the financial statements. Although the Company expects to recover costs from customers through rates, there is a risk that the regulator will not approve full recovery of the costs incurred. The Company’s judgments include making an assessment of the probability of recovery of and return on costs incurred, of the potential disallowance of part of the cost incurred, or of the probable refund of gains or amounts previously collected from customers through future rates. How We We performed audit procedures that included, amongst others, assessing the Company’s evaluation of the Addressed the probability of future recovery for regulatory assets, PP&E, and refund of regulatory liabilities by obtaining Matter in Our and reviewing relevant regulatory orders, filings, testimony, hearings and correspondence, and other Audit publicly available information. For regulatory matters for which regulatory decisions or orders have not yet been obtained, we inspected the rate-regulated subsidiaries’ filings for any evidence that might contradict the Company’s assertions, and reviewed other regulatory orders, filings and correspondence for other entities within the same or similar jurisdictions to assess the likelihood of recovery or refund in future rates based on the regulator’s treatment of similar costs under similar circumstances. We obtained and evaluated an analysis from the Company and corroborated that analysis with letters from legal counsel, when appropriate, regarding cost recoveries, gains or amounts previously collected from customers or future changes in rates. We also assessed the methodology, accuracy and completeness of the Company’s calculations of regulatory asset and liability balances based on provisions and formulas outlined in rate orders and other correspondence with the regulators. We evaluated the Company’s disclosures related to the impacts of rate regulation. Fair Value (“FV”) measurement of derivative financial instruments Description of the Held-for-trading (“HFT”) derivative assets of $289 million and liabilities of $745 million, disclosed in note Matter 16 to the consolidated financial statements, are measured at FV. The Company recognized $467 million in realized and unrealized gains during the year with respect to HFT derivatives. Auditing the Company’s valuation of HFT derivatives is complex and highly judgmental due to the complexity of the contract terms and valuation models, and the significant estimation required in determining the FV of the contracts. In determining the FV of HFT derivatives, significant assumptions about future economic and market assumptions with uncertain outcomes are used, including third-party sourced forward commodity pricing curves based on illiquid markets, internally developed correlation factors and basis differentials. These assumptions have a significant impact on the FV of the HFT derivatives. EMERA 2025 ANNUAL REPORT 65
Strategic Management’s Discussion Consolidated Financial Emera Leadership Shareholder Overview and Analysis Statements and Board information How We We performed audit procedures that included, amongst others, reviewing executed contracts and Addressed the agreements for the identification of inputs and assumptions impacting the valuation of derivatives. With Matter in Our the support of our valuation specialists, we assessed the methodology and mathematical accuracy of the Audit Company’s valuation models and compared the commodity pricing curves used by the Company to current market and economic data. For the forward commodity pricing curves, we compared the Company’s pricing curves to independently sourced pricing curves. We also assessed the methodology and mathematical accuracy of the Company’s calculations to develop correlation factors and basis differentials. In addition, we assessed whether the FV hierarchy disclosures in note 17 to the consolidated financial statements were consistent with the source of the significant inputs and assumptions used in determining the FV of derivatives. Chartered Professional Accountants We have served as the Company‘s auditor since 1998. Halifax, Canada February 23, 2026 66 EMERA 2025 ANNUAL REPORT
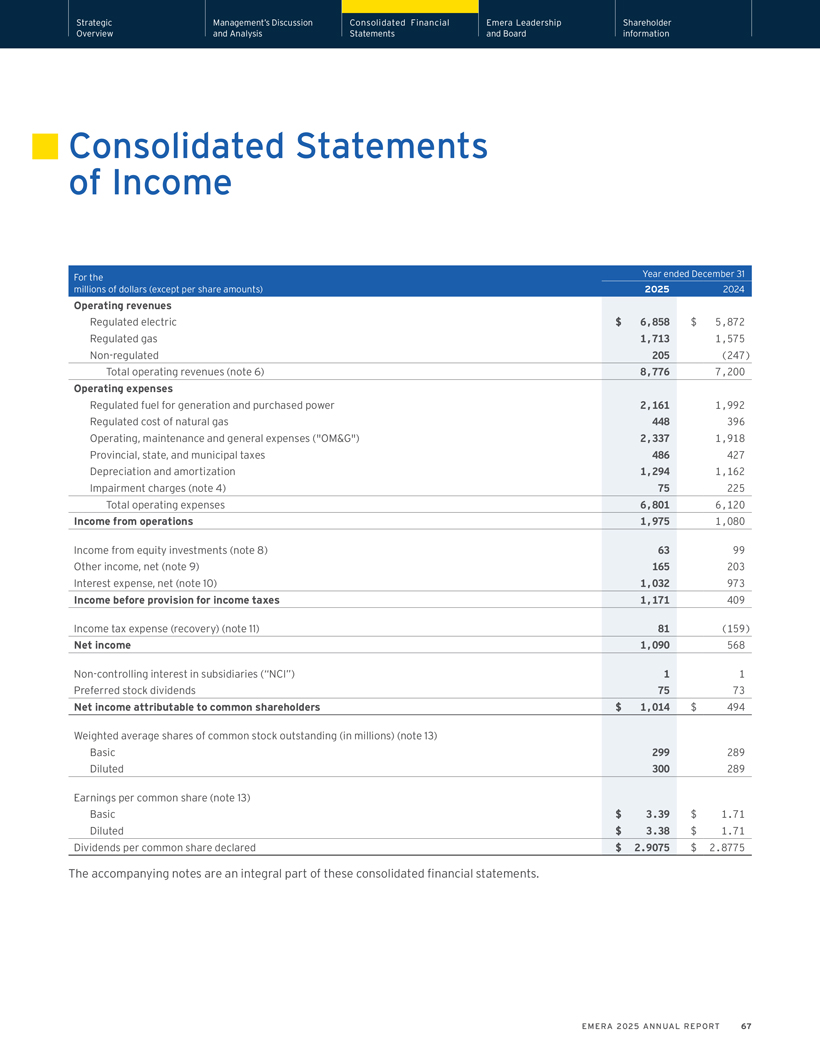
Strategic Management’s Discussion Consolidated Financial Emera Leadership Shareholder Overview and Analysis Statements and Board information Consolidated Statements of Income For the Year ended December 31 millions of dollars (except per share amounts) 2025 2024 Operating revenues Regulated electric $ 6,858 $ 5,872 Regulated gas 1,713 1,575 Non-regulated 205 (247) Total operating revenues (note 6) 8,776 7,200 Operating expenses Regulated fuel for generation and purchased power 2,161 1,992 Regulated cost of natural gas 448 396 Operating, maintenance and general expenses (“OM&G”) 2,337 1,918 Provincial, state, and municipal taxes 486 427 Depreciation and amortization 1,294 1,162 Impairment charges (note 4) 75 225 Total operating expenses 6,801 6,120 Income from operations 1,975 1,080 Income from equity investments (note 8) 63 99 Other income, net (note 9) 165 203 Interest expense, net (note 10) 1,032 973 Income before provision for income taxes 1,171 409 Income tax expense (recovery) (note 11) 81 (159) Net income 1,090 568 Non-controlling interest in subsidiaries (“NCI”) 1 1 Preferred stock dividends 75 73 Net income attributable to common shareholders $ 1,014 $ 494 Weighted average shares of common stock outstanding (in millions) (note 13) Basic 299 289 Diluted 300 289 Earnings per common share (note 13) Basic $ 3.39 $ 1.71 Diluted $ 3.38 $ 1.71 Dividends per common share declared $ 2.9075 $ 2.8775 The accompanying notes are an integral part of these consolidated financial statements. EMERA 2025 ANNUAL REPORT 67
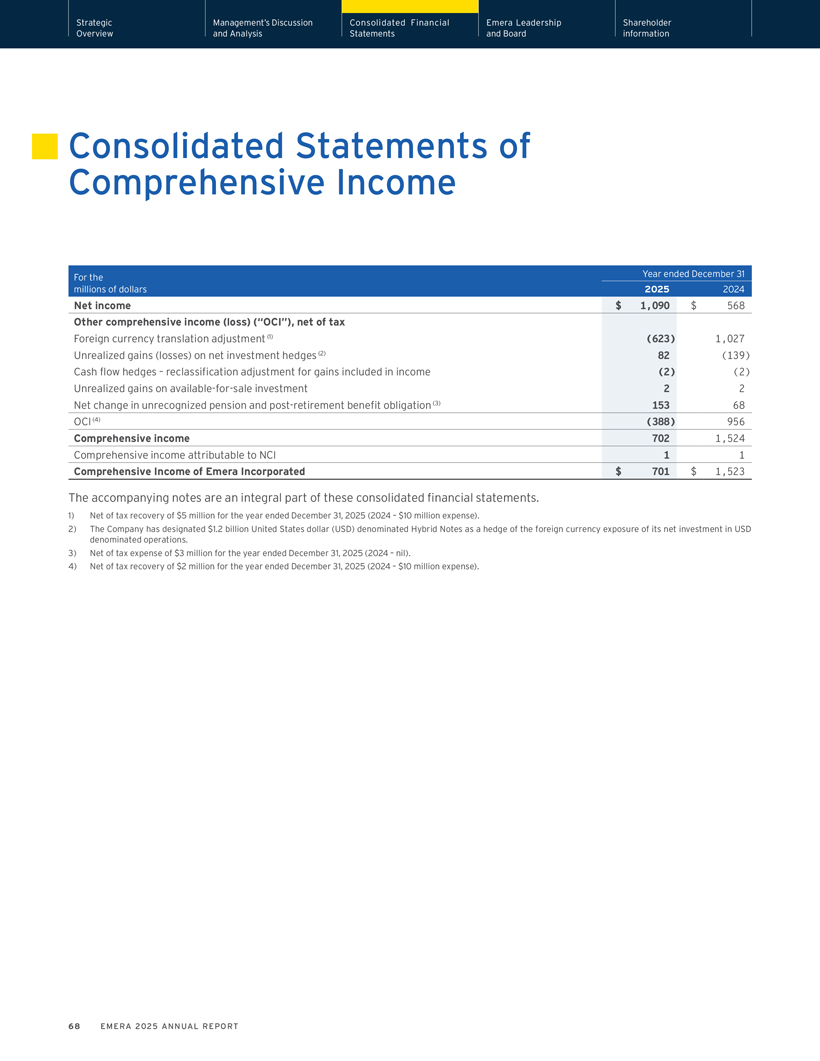
Strategic Management’s Discussion Consolidated Financial Emera Leadership Shareholder Overview and Analysis Statements and Board information Consolidated Statements of Comprehensive Income For the Year ended December 31 millions of dollars 2025 2024 Net income $ 1,090 $ 568 Other comprehensive income (loss) (“OCI”), net of tax Foreign currency translation adjustment (1) (623) 1,027 Unrealized gains (losses) on net investment hedges (2) 82 (139) Cash flow hedges – reclassification adjustment for gains included in income (2) (2) Unrealized gains on available-for-sale investment 2 2 Net change in unrecognized pension and post-retirement benefit obligation (3) 153 68 OCI (4) (388) 956 Comprehensive income 702 1,524 Comprehensive income attributable to NCI 1 1 Comprehensive Income of Emera Incorporated $ 701 $ 1,523 The accompanying notes are an integral part of these consolidated financial statements. 1) Net of tax recovery of $5 million for the year ended December 31, 2025 (2024 – $10 million expense). 2) The Company has designated $1.2 billion United States dollar (USD) denominated Hybrid Notes as a hedge of the foreign currency exposure of its net investment in USD denominated operations. 3) Net of tax expense of $3 million for the year ended December 31, 2025 (2024 – nil). 4) Net of tax recovery of $2 million for the year ended December 31, 2025 (2024 – $10 million expense). 68 EMERA 2025 ANNUAL REPORT
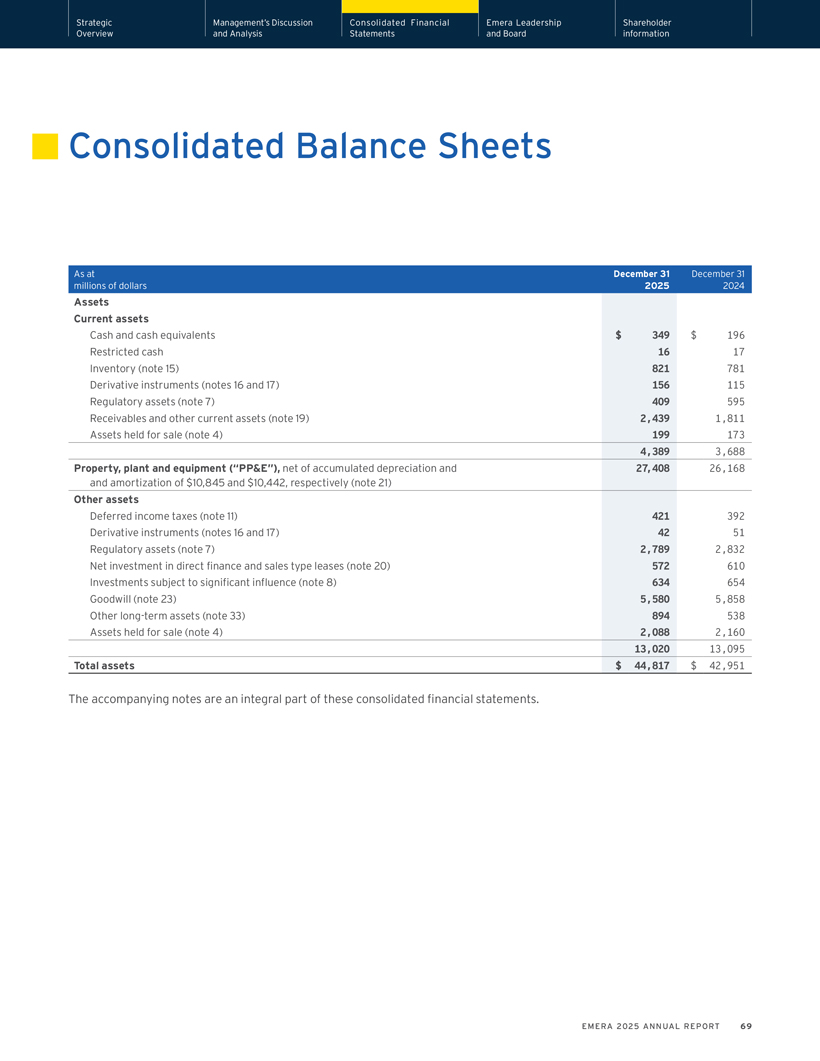
Strategic Management’s Discussion Consolidated Financial Emera Leadership Shareholder Overview and Analysis Statements and Board information Consolidated Balance Sheets As at December 31 December 31 millions of dollars 2025 2024 Assets Current assets Cash and cash equivalents $ 349 $ 196 Restricted cash 16 17 Inventory (note 15) 821 781 Derivative instruments (notes 16 and 17) 156 115 Regulatory assets (note 7) 409 595 Receivables and other current assets (note 19) 2,439 1,811 Assets held for sale (note 4) 199 173 4,389 3,688 Property, plant and equipment (“PP&E”), net of accumulated depreciation and 27,408 26,168 and amortization of $10,845 and $10,442, respectively (note 21) Other assets Deferred income taxes (note 11) 421 392 Derivative instruments (notes 16 and 17) 42 51 Regulatory assets (note 7) 2,789 2,832 Net investment in direct finance and sales type leases (note 20) 572 610 Investments subject to significant influence (note 8) 634 654 Goodwill (note 23) 5,580 5,858 Other long-term assets (note 33) 894 538 Assets held for sale (note 4) 2,088 2,160 13,020 13,095 Total assets $ 44,817 $ 42,951 The accompanying notes are an integral part of these consolidated financial statements. EMERA 2025 ANNUAL REPORT 69
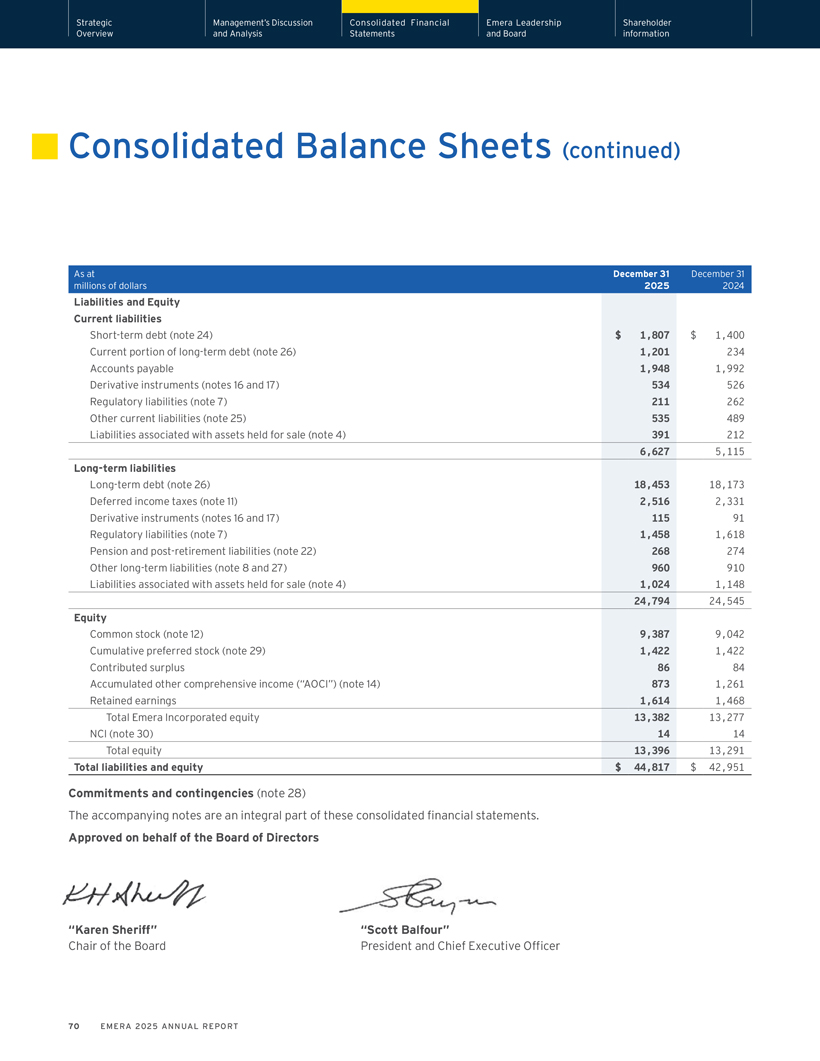
Strategic Management’s Discussion Consolidated Financial Emera Leadership Shareholder Overview and Analysis Statements and Board information Consolidated Balance Sheets (continued) As at December 31 December 31 millions of dollars 2025 2024 Liabilities and Equity Current liabilities Short-term debt (note 24) $ 1,807 $ 1,400 Current portion of long-term debt (note 26) 1,201 234 Accounts payable 1,948 1,992 Derivative instruments (notes 16 and 17) 534 526 Regulatory liabilities (note 7) 211 262 Other current liabilities (note 25) 535 489 Liabilities associated with assets held for sale (note 4) 391 212 6,627 5,115 Long-term liabilities Long-term debt (note 26) 18,453 18,173 Deferred income taxes (note 11) 2,516 2,331 Derivative instruments (notes 16 and 17) 115 91 Regulatory liabilities (note 7) 1,458 1,618 Pension and post-retirement liabilities (note 22) 268 274 Other long-term liabilities (note 8 and 27) 960 910 Liabilities associated with assets held for sale (note 4) 1,024 1,148 24,794 24,545 Equity Common stock (note 12) 9,387 9,042 Cumulative preferred stock (note 29) 1,422 1,422 Contributed surplus 86 84 Accumulated other comprehensive income (“AOCI”) (note 14) 873 1,261 Retained earnings 1,614 1,468 Total Emera Incorporated equity 13,382 13,277 NCI (note 30) 14 14 Total equity 13,396 13,291 Total liabilities and equity $ 44,817 $ 42,951 Commitments and contingencies (note 28) The accompanying notes are an integral part of these consolidated financial statements. Approved on behalf of the Board of Directors “Karen Sheriff” “Scott Balfour” Chair of the Board President and Chief Executive Officer 70 EMERA 2025 ANNUAL REPORT
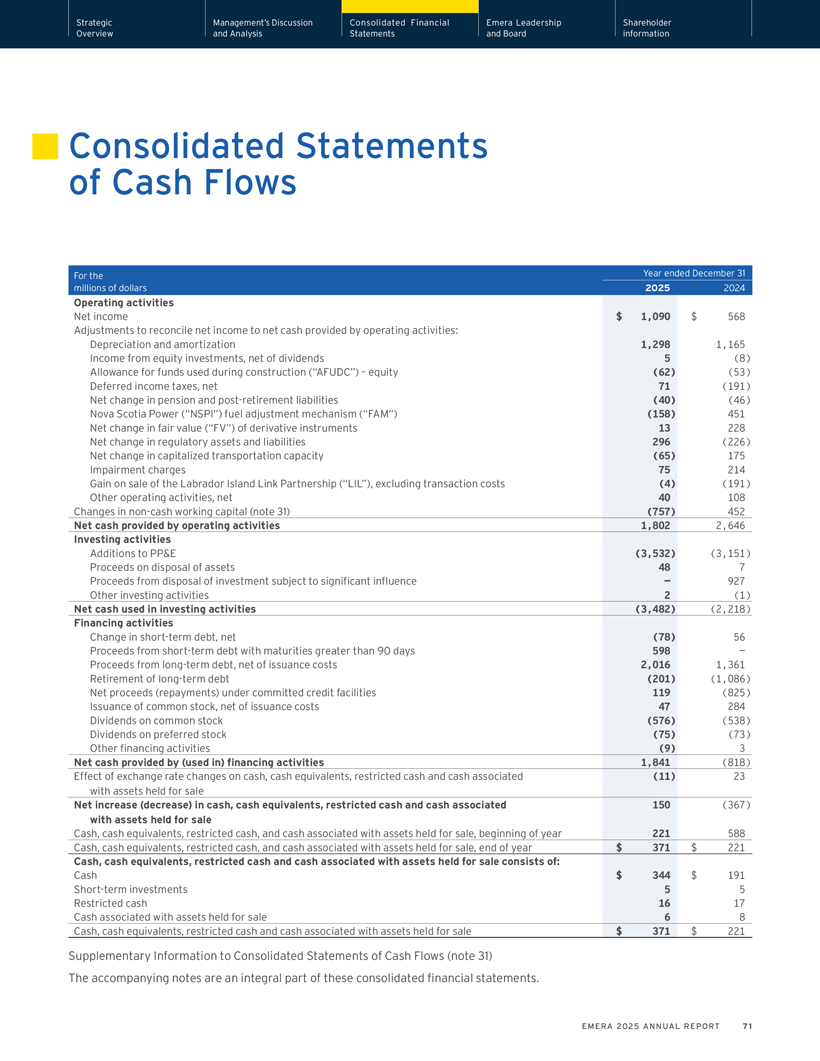
Strategic Management’s Discussion Consolidated Financial Emera Leadership Shareholder Overview and Analysis Statements and Board information Consolidated Statements of Cash Flows For the Year ended December 31 millions of dollars 2025 2024 Operating activities Net income $ 1,090 $ 568 Adjustments to reconcile net income to net cash provided by operating activities: Depreciation and amortization 1,298 1,165 Income from equity investments, net of dividends 5 (8) Allowance for funds used during construction (“AFUDC”) – equity (62) (53) Deferred income taxes, net 71 (191) Net change in pension and post-retirement liabilities (40) (46) Nova Scotia Power (“NSPI”) fuel adjustment mechanism (“FAM”) (158) 451 Net change in fair value (“FV”) of derivative instruments 13 228 Net change in regulatory assets and liabilities 296 (226) Net change in capitalized transportation capacity (65) 175 Impairment charges 75 214 Gain on sale of the Labrador Island Link Partnership (“LIL”), excluding transaction costs (4) (191) Other operating activities, net 40 108 Changes in non-cash working capital (note 31) (757) 452 Net cash provided by operating activities 1,802 2,646 Investing activities Additions to PP&E (3,532) (3,151) Proceeds on disposal of assets 48 7 Proceeds from disposal of investment subject to significant influence — 927 Other investing activities 2 (1) Net cash used in investing activities (3,482) (2,218) Financing activities Change in short-term debt, net (78) 56 Proceeds from short-term debt with maturities greater than 90 days 598 — Proceeds from long-term debt, net of issuance costs 2,016 1,361 Retirement of long-term debt (201) (1,086) Net proceeds (repayments) under committed credit facilities 119 (825) Issuance of common stock, net of issuance costs 47 284 Dividends on common stock (576) (538) Dividends on preferred stock (75) (73) Other financing activities (9) 3 Net cash provided by (used in) financing activities 1,841 (818) Effect of exchange rate changes on cash, cash equivalents, restricted cash and cash associated (11) 23 with assets held for sale Net increase (decrease) in cash, cash equivalents, restricted cash and cash associated 150 (367) with assets held for sale Cash, cash equivalents, restricted cash, and cash associated with assets held for sale, beginning of year 221 588 Cash, cash equivalents, restricted cash, and cash associated with assets held for sale, end of year $ 371 $ 221 Cash, cash equivalents, restricted cash and cash associated with assets held for sale consists of: Cash $ 344 $ 191 Short-term investments 5 5 Restricted cash 16 17 Cash associated with assets held for sale 6 8 Cash, cash equivalents, restricted cash and cash associated with assets held for sale $ 371 $ 221 Supplementary Information to Consolidated Statements of Cash Flows (note 31) The accompanying notes are an integral part of these consolidated financial statements. EMERA 2025 ANNUAL REPORT 71
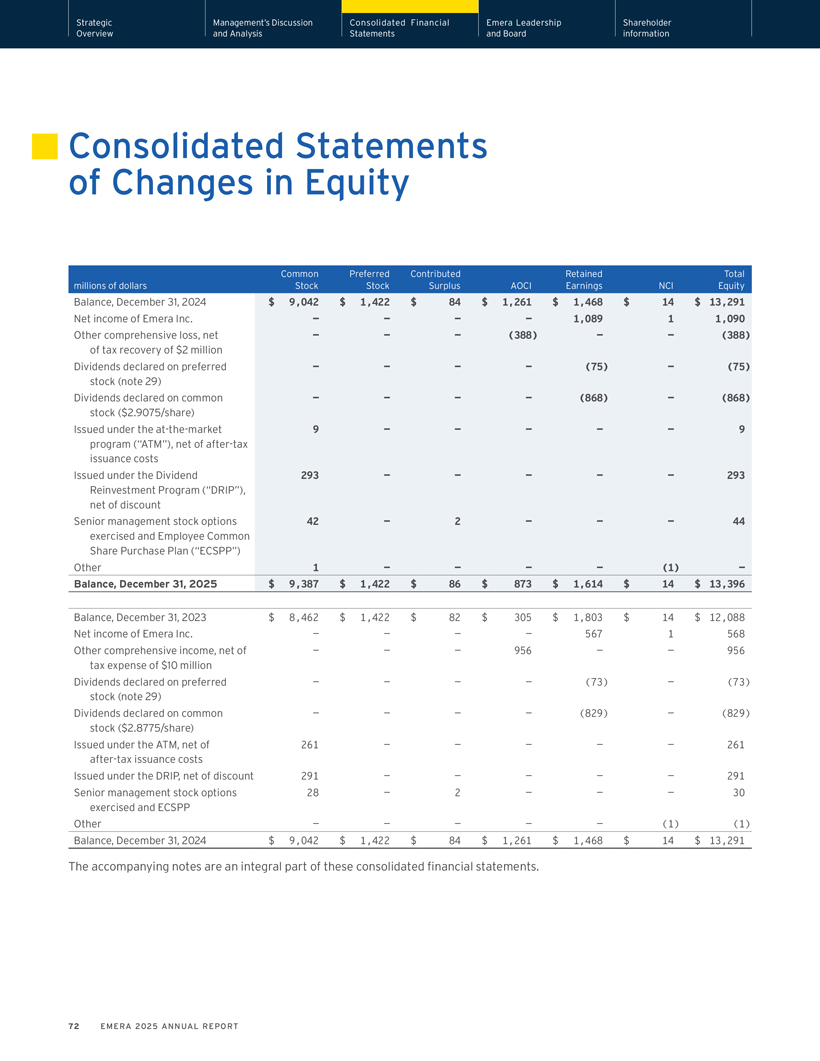
Strategic Management’s Discussion Consolidated Financial Emera Leadership Shareholder Overview and Analysis Statements and Board information Consolidated Statements of Changes in Equity Common Preferred Contributed Retained Total millions of dollars Stock Stock Surplus AOCI Earnings NCI Equity Balance, December 31, 2024 $ 9,042 $ 1,422 $ 84 $ 1,261 $ 1,468 $ 14 $ 13,291 Net income of Emera Inc. — — — — 1,089 1 1,090 Other comprehensive loss, net — — — (388) — — (388) of tax recovery of $2 million Dividends declared on preferred — — — — (75) — (75) stock (note 29) Dividends declared on common — — — — (868) — (868) stock ($2.9075/share) Issued under the at-the-market 9 — — — — — 9 program (“ATM”), net of after-tax issuance costs Issued under the Dividend 293 — — — — — 293 Reinvestment Program (“DRIP”), net of discount Senior management stock options 42 — 2 — — — 44 exercised and Employee Common Share Purchase Plan (“ECSPP”) Other 1 — — — — (1) — Balance, December 31, 2025 $ 9,387 $ 1,422 $ 86 $ 873 $ 1,614 $ 14 $ 13,396 Balance, December 31, 2023 $ 8,462 $ 1,422 $ 82 $ 305 $ 1,803 $ 14 $ 12,088 Net income of Emera Inc. — — — — 567 1 568 Other comprehensive income, net of — — — 956 — — 956 tax expense of $10 million Dividends declared on preferred — — — — (73) — (73) stock (note 29) Dividends declared on common — — — — (829) — (829) stock ($2.8775/share) Issued under the ATM, net of 261 — — — — — 261 after-tax issuance costs Issued under the DRIP, net of discount 291 — — — — — 291 Senior management stock options 28 — 2 — — — 30 exercised and ECSPP Other — — — — — (1) (1) Balance, December 31, 2024 $ 9,042 $ 1,422 $ 84 $ 1,261 $ 1,468 $ 14 $ 13,291 The accompanying notes are an integral part of these consolidated financial statements. 72 EMERA 2025 ANNUAL REPORT
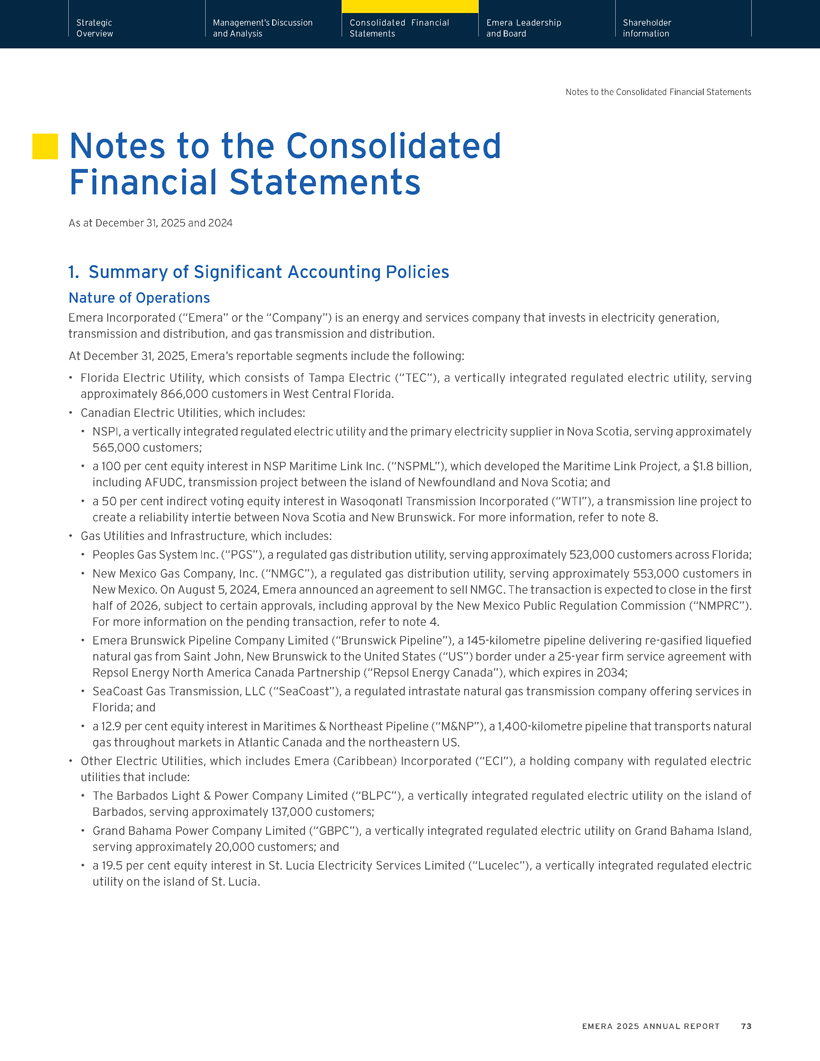
Strategic Management’s Discussion Consolidated Financial Emera Leadership Shareholder Overview and Analysis Statements and Board information Notes to the Consolidated Financial Statements Notes to the Consolidated Financial Statements As at December 31, 2025 and 2024 1. Summary of Significant Accounting Policies Nature of Operations Emera Incorporated (“Emera” or the “Company”) is an energy and services company that invests in electricity generation, transmission and distribution, and gas transmission and distribution. At December 31, 2025, Emera’s reportable segments include the following: • Florida Electric Utility, which consists of Tampa Electric (“TEC”), a vertically integrated regulated electric utility, serving approximately 866,000 customers in West Central Florida. • Canadian Electric Utilities, which includes: • NSPI, a vertically integrated regulated electric utility and the primary electricity supplier in Nova Scotia, serving approximately 565,000 customers; • a 100 per cent equity interest in NSP Maritime Link Inc. (“NSPML”), which developed the Maritime Link Project, a $1.8 billion, including AFUDC, transmission project between the island of Newfoundland and Nova Scotia; and • a 50 per cent indirect voting equity interest in Wasoqonatl Transmission Incorporated (“WTI”), a transmission line project to create a reliability intertie between Nova Scotia and New Brunswick. For more information, refer to note 8. • Gas Utilities and Infrastructure, which includes: • Peoples Gas System Inc. (“PGS”), a regulated gas distribution utility, serving approximately 523,000 customers across Florida; • New Mexico Gas Company, Inc. (“NMGC”), a regulated gas distribution utility, serving approximately 553,000 customers in New Mexico. On August 5, 2024, Emera announced an agreement to sell NMGC. The transaction is expected to close in the first half of 2026, subject to certain approvals, including approval by the New Mexico Public Regulation Commission (“NMPRC”). For more information on the pending transaction, refer to note 4. • Emera Brunswick Pipeline Company Limited (“Brunswick Pipeline”), a 145-kilometre pipeline delivering re-gasified liquefied natural gas from Saint John, New Brunswick to the United States (“US”) border under a 25-year firm service agreement with Repsol Energy North America Canada Partnership (“Repsol Energy Canada”), which expires in 2034; • SeaCoast Gas Transmission, LLC (“SeaCoast”), a regulated intrastate natural gas transmission company offering services in Florida; and • a 12.9 per cent equity interest in Maritimes & Northeast Pipeline (“M&NP”), a 1,400-kilometre pipeline that transports natural gas throughout markets in Atlantic Canada and the northeastern US. • Other Electric Utilities, which includes Emera (Caribbean) Incorporated (“ECI”), a holding company with regulated electric utilities that include: • The Barbados Light & Power Company Limited (“BLPC”), a vertically integrated regulated electric utility on the island of Barbados, serving approximately 137,000 customers; • Grand Bahama Power Company Limited (“GBPC”), a vertically integrated regulated electric utility on Grand Bahama Island, serving approximately 20,000 customers; and • a 19.5 per cent equity interest in St. Lucia Electricity Services Limited (“Lucelec”), a vertically integrated regulated electric utility on the island of St. Lucia. EMERA 2025 ANNUAL REPORT 73
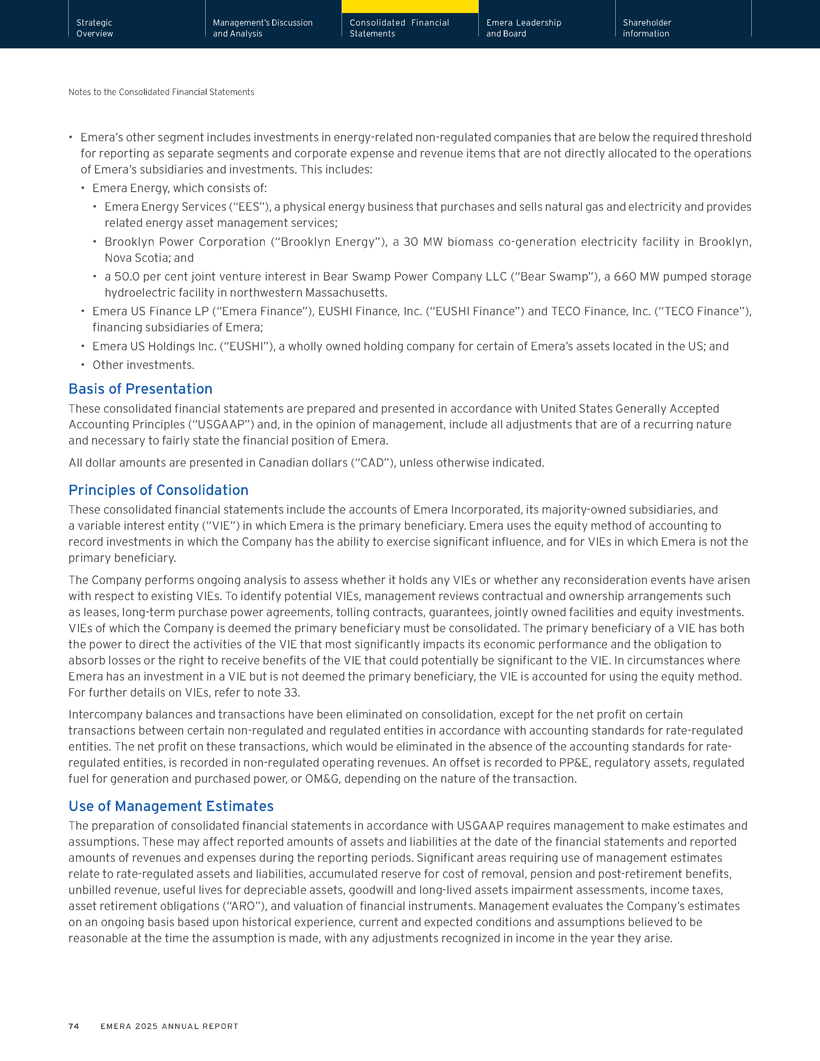
Strategic Management’s Discussion Consolidated Financial Emera Leadership Shareholder Overview and Analysis Statements and Board information Notes to the Consolidated Financial Statements • Emera’s other segment includes investments in energy-related non-regulated companies that are below the required threshold for reporting as separate segments and corporate expense and revenue items that are not directly allocated to the operations of Emera’s subsidiaries and investments. This includes: • Emera Energy, which consists of: • Emera Energy Services (“EES”), a physical energy business that purchases and sells natural gas and electricity and provides related energy asset management services; • Brooklyn Power Corporation (“Brooklyn Energy”), a 30 MW biomass co-generation electricity facility in Brooklyn, Nova Scotia; and • a 50.0 per cent joint venture interest in Bear Swamp Power Company LLC (“Bear Swamp”), a 660 MW pumped storage hydroelectric facility in northwestern Massachusetts. • Emera US Finance LP (“Emera Finance”), EUSHI Finance, Inc. (“EUSHI Finance”) and TECO Finance, Inc. (“TECO Finance”), financing subsidiaries of Emera; • Emera US Holdings Inc. (“EUSHI”), a wholly owned holding company for certain of Emera’s assets located in the US; and • Other investments. Basis of Presentation These consolidated financial statements are prepared and presented in accordance with United States Generally Accepted Accounting Principles (“USGAAP”) and, in the opinion of management, include all adjustments that are of a recurring nature and necessary to fairly state the financial position of Emera. All dollar amounts are presented in Canadian dollars (“CAD”), unless otherwise indicated. Principles of Consolidation These consolidated financial statements include the accounts of Emera Incorporated, its majority-owned subsidiaries, and a variable interest entity (“VIE”) in which Emera is the primary beneficiary. Emera uses the equity method of accounting to record investments in which the Company has the ability to exercise significant influence, and for VIEs in which Emera is not the primary beneficiary. The Company performs ongoing analysis to assess whether it holds any VIEs or whether any reconsideration events have arisen with respect to existing VIEs. To identify potential VIEs, management reviews contractual and ownership arrangements such as leases, long-term purchase power agreements, tolling contracts, guarantees, jointly owned facilities and equity investments. VIEs of which the Company is deemed the primary beneficiary must be consolidated. The primary beneficiary of a VIE has both the power to direct the activities of the VIE that most significantly impacts its economic performance and the obligation to absorb losses or the right to receive benefits of the VIE that could potentially be significant to the VIE. In circumstances where Emera has an investment in a VIE but is not deemed the primary beneficiary, the VIE is accounted for using the equity method. For further details on VIEs, refer to note 33. Intercompany balances and transactions have been eliminated on consolidation, except for the net profit on certain transactions between certain non-regulated and regulated entities in accordance with accounting standards for rate-regulated entities. The net profit on these transactions, which would be eliminated in the absence of the accounting standards for rate-regulated entities, is recorded in non-regulated operating revenues. An offset is recorded to PP&E, regulatory assets, regulated fuel for generation and purchased power, or OM&G, depending on the nature of the transaction. Use of Management Estimates The preparation of consolidated financial statements in accordance with USGAAP requires management to make estimates and assumptions. These may affect reported amounts of assets and liabilities at the date of the financial statements and reported amounts of revenues and expenses during the reporting periods. Significant areas requiring use of management estimates relate to rate-regulated assets and liabilities, accumulated reserve for cost of removal, pension and post-retirement benefits, unbilled revenue, useful lives for depreciable assets, goodwill and long-lived assets impairment assessments, income taxes, asset retirement obligations (“ARO”), and valuation of financial instruments. Management evaluates the Company’s estimates on an ongoing basis based upon historical experience, current and expected conditions and assumptions believed to be reasonable at the time the assumption is made, with any adjustments recognized in income in the year they arise. 74 EMERA 2025 ANNUAL REPORT
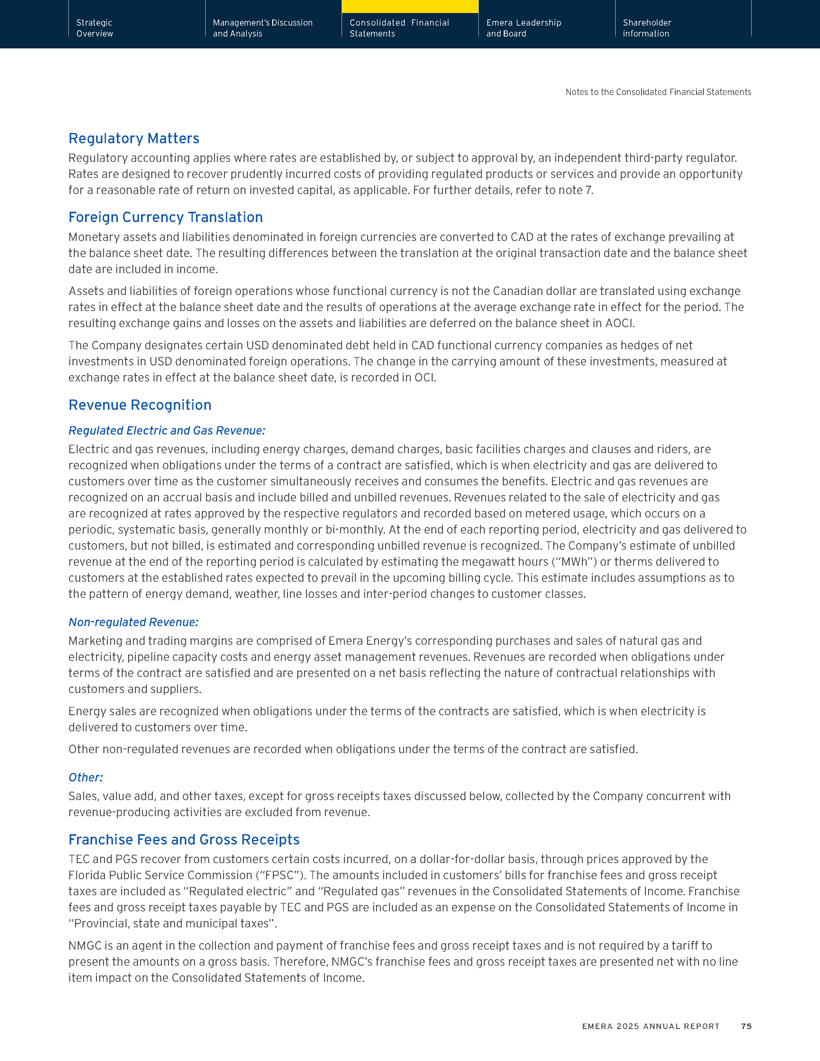
Strategic Management’s Discussion Consolidated Financial Emera Leadership Shareholder Overview and Analysis Statements and Board information Notes to the Consolidated Financial Statements Regulatory Matters Regulatory accounting applies where rates are established by, or subject to approval by, an independent third-party regulator. Rates are designed to recover prudently incurred costs of providing regulated products or services and provide an opportunity for a reasonable rate of return on invested capital, as applicable. For further details, refer to note 7. Foreign Currency Translation Monetary assets and liabilities denominated in foreign currencies are converted to CAD at the rates of exchange prevailing at the balance sheet date. The resulting differences between the translation at the original transaction date and the balance sheet date are included in income. Assets and liabilities of foreign operations whose functional currency is not the Canadian dollar are translated using exchange rates in effect at the balance sheet date and the results of operations at the average exchange rate in effect for the period. The resulting exchange gains and losses on the assets and liabilities are deferred on the balance sheet in AOCI. The Company designates certain USD denominated debt held in CAD functional currency companies as hedges of net investments in USD denominated foreign operations. The change in the carrying amount of these investments, measured at exchange rates in effect at the balance sheet date, is recorded in OCI. Revenue Recognition Regulated Electric and Gas Revenue: Electric and gas revenues, including energy charges, demand charges, basic facilities charges and clauses and riders, are recognized when obligations under the terms of a contract are satisfied, which is when electricity and gas are delivered to customers over time as the customer simultaneously receives and consumes the benefits. Electric and gas revenues are recognized on an accrual basis and include billed and unbilled revenues. Revenues related to the sale of electricity and gas are recognized at rates approved by the respective regulators and recorded based on metered usage, which occurs on a periodic, systematic basis, generally monthly or bi-monthly. At the end of each reporting period, electricity and gas delivered to customers, but not billed, is estimated and corresponding unbilled revenue is recognized. The Company’s estimate of unbilled revenue at the end of the reporting period is calculated by estimating the megawatt hours (“MWh”) or therms delivered to customers at the established rates expected to prevail in the upcoming billing cycle. This estimate includes assumptions as to the pattern of energy demand, weather, line losses and inter-period changes to customer classes. Non-regulated Revenue: Marketing and trading margins are comprised of Emera Energy’s corresponding purchases and sales of natural gas and electricity, pipeline capacity costs and energy asset management revenues. Revenues are recorded when obligations under terms of the contract are satisfied and are presented on a net basis reflecting the nature of contractual relationships with customers and suppliers. Energy sales are recognized when obligations under the terms of the contracts are satisfied, which is when electricity is delivered to customers over time. Other non-regulated revenues are recorded when obligations under the terms of the contract are satisfied. Other: Sales, value add, and other taxes, except for gross receipts taxes discussed below, collected by the Company concurrent with revenue-producing activities are excluded from revenue. Franchise Fees and Gross Receipts TEC and PGS recover from customers certain costs incurred, on a dollar-for-dollar basis, through prices approved by the Florida Public Service Commission (“FPSC”). The amounts included in customers’ bills for franchise fees and gross receipt taxes are included as “Regulated electric” and “Regulated gas” revenues in the Consolidated Statements of Income. Franchise fees and gross receipt taxes payable by TEC and PGS are included as an expense on the Consolidated Statements of Income in “Provincial, state and municipal taxes”. NMGC is an agent in the collection and payment of franchise fees and gross receipt taxes and is not required by a tariff to present the amounts on a gross basis. Therefore, NMGC’s franchise fees and gross receipt taxes are presented net with no line item impact on the Consolidated Statements of Income. EMERA 2025 ANNUAL REPORT 75
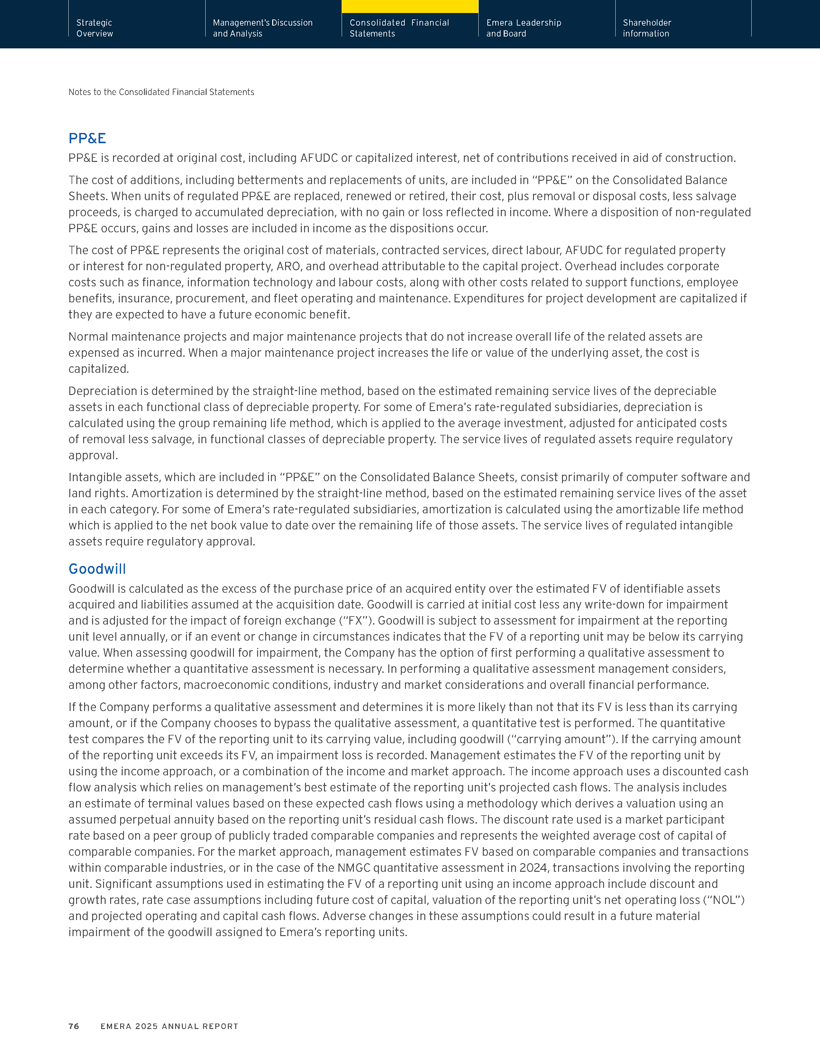
Strategic Management’s Discussion Consolidated Financial Emera Leadership Shareholder Overview and Analysis Statements and Board information Notes to the Consolidated Financial Statements PP&E PP&E is recorded at original cost, including AFUDC or capitalized interest, net of contributions received in aid of construction. The cost of additions, including betterments and replacements of units, are included in “PP&E” on the Consolidated Balance Sheets. When units of regulated PP&E are replaced, renewed or retired, their cost, plus removal or disposal costs, less salvage proceeds, is charged to accumulated depreciation, with no gain or loss reflected in income. Where a disposition of non-regulated PP&E occurs, gains and losses are included in income as the dispositions occur. The cost of PP&E represents the original cost of materials, contracted services, direct labour, AFUDC for regulated property or interest for non-regulated property, ARO, and overhead attributable to the capital project. Overhead includes corporate costs such as finance, information technology and labour costs, along with other costs related to support functions, employee benefits, insurance, procurement, and fleet operating and maintenance. Expenditures for project development are capitalized if they are expected to have a future economic benefit. Normal maintenance projects and major maintenance projects that do not increase overall life of the related assets are expensed as incurred. When a major maintenance project increases the life or value of the underlying asset, the cost is capitalized. Depreciation is determined by the straight-line method, based on the estimated remaining service lives of the depreciable assets in each functional class of depreciable property. For some of Emera’s rate-regulated subsidiaries, depreciation is calculated using the group remaining life method, which is applied to the average investment, adjusted for anticipated costs of removal less salvage, in functional classes of depreciable property. The service lives of regulated assets require regulatory approval. Intangible assets, which are included in “PP&E” on the Consolidated Balance Sheets, consist primarily of computer software and land rights. Amortization is determined by the straight-line method, based on the estimated remaining service lives of the asset in each category. For some of Emera’s rate-regulated subsidiaries, amortization is calculated using the amortizable life method which is applied to the net book value to date over the remaining life of those assets. The service lives of regulated intangible assets require regulatory approval. Goodwill Goodwill is calculated as the excess of the purchase price of an acquired entity over the estimated FV of identifiable assets acquired and liabilities assumed at the acquisition date. Goodwill is carried at initial cost less any write-down for impairment and is adjusted for the impact of foreign exchange (“FX”). Goodwill is subject to assessment for impairment at the reporting unit level annually, or if an event or change in circumstances indicates that the FV of a reporting unit may be below its carrying value. When assessing goodwill for impairment, the Company has the option of first performing a qualitative assessment to determine whether a quantitative assessment is necessary. In performing a qualitative assessment management considers, among other factors, macroeconomic conditions, industry and market considerations and overall financial performance. If the Company performs a qualitative assessment and determines it is more likely than not that its FV is less than its carrying amount, or if the Company chooses to bypass the qualitative assessment, a quantitative test is performed. The quantitative test compares the FV of the reporting unit to its carrying value, including goodwill (“carrying amount”). If the carrying amount of the reporting unit exceeds its FV, an impairment loss is recorded. Management estimates the FV of the reporting unit by using the income approach, or a combination of the income and market approach. The income approach uses a discounted cash flow analysis which relies on management’s best estimate of the reporting unit’s projected cash flows. The analysis includes an estimate of terminal values based on these expected cash flows using a methodology which derives a valuation using an assumed perpetual annuity based on the reporting unit’s residual cash flows. The discount rate used is a market participant rate based on a peer group of publicly traded comparable companies and represents the weighted average cost of capital of comparable companies. For the market approach, management estimates FV based on comparable companies and transactions within comparable industries, or in the case of the NMGC quantitative assessment in 2024, transactions involving the reporting unit. Significant assumptions used in estimating the FV of a reporting unit using an income approach include discount and growth rates, rate case assumptions including future cost of capital, valuation of the reporting unit’s net operating loss (“NOL”) and projected operating and capital cash flows. Adverse changes in these assumptions could result in a future material impairment of the goodwill assigned to Emera’s reporting units. 76 EMERA 2025 ANNUAL REPORT
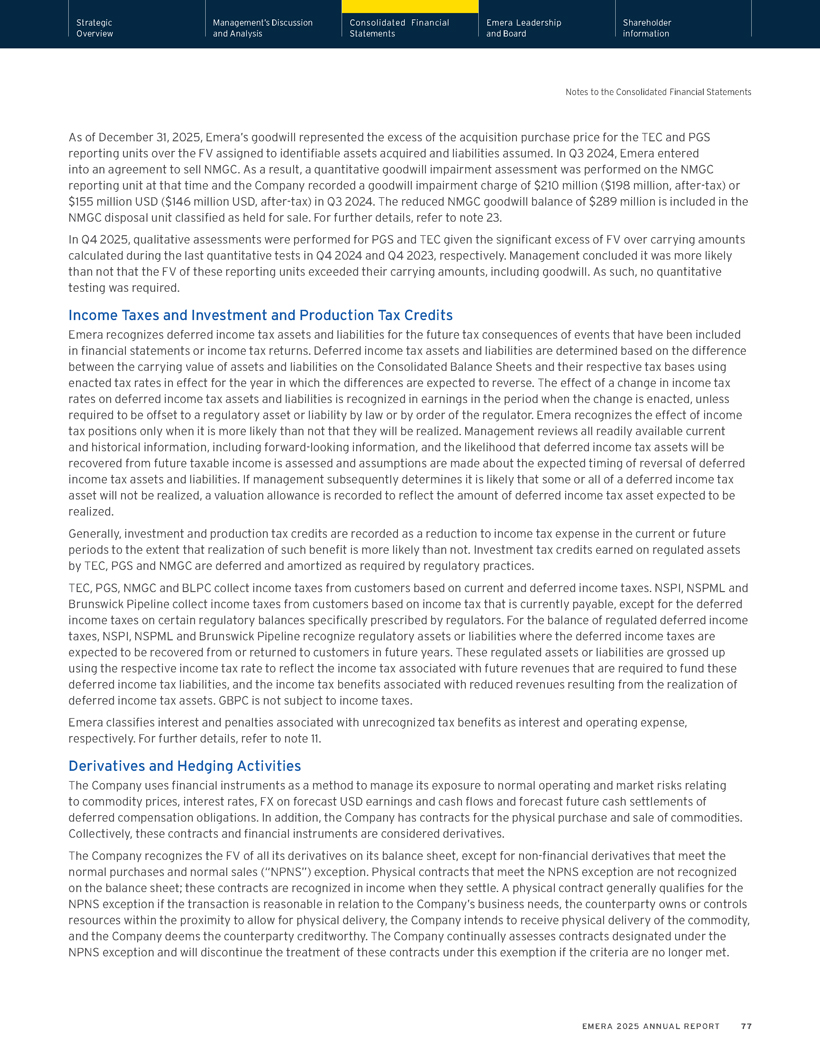
Strategic Management’s Discussion Consolidated Financial Emera Leadership Shareholder Overview and Analysis Statements and Board information Notes to the Consolidated Financial Statements As of December 31, 2025, Emera’s goodwill represented the excess of the acquisition purchase price for the TEC and PGS reporting units over the FV assigned to identifiable assets acquired and liabilities assumed. In Q3 2024, Emera entered into an agreement to sell NMGC. As a result, a quantitative goodwill impairment assessment was performed on the NMGC reporting unit at that time and the Company recorded a goodwill impairment charge of $210 million ($198 million, after-tax) or $155 million USD ($146 million USD, after-tax) in Q3 2024. The reduced NMGC goodwill balance of $289 million is included in the NMGC disposal unit classified as held for sale. For further details, refer to note 23. In Q4 2025, qualitative assessments were performed for PGS and TEC given the significant excess of FV over carrying amounts calculated during the last quantitative tests in Q4 2024 and Q4 2023, respectively. Management concluded it was more likely than not that the FV of these reporting units exceeded their carrying amounts, including goodwill. As such, no quantitative testing was required. Income Taxes and Investment and Production Tax Credits Emera recognizes deferred income tax assets and liabilities for the future tax consequences of events that have been included in financial statements or income tax returns. Deferred income tax assets and liabilities are determined based on the difference between the carrying value of assets and liabilities on the Consolidated Balance Sheets and their respective tax bases using enacted tax rates in effect for the year in which the differences are expected to reverse. The effect of a change in income tax rates on deferred income tax assets and liabilities is recognized in earnings in the period when the change is enacted, unless required to be offset to a regulatory asset or liability by law or by order of the regulator. Emera recognizes the effect of income tax positions only when it is more likely than not that they will be realized. Management reviews all readily available current and historical information, including forward-looking information, and the likelihood that deferred income tax assets will be recovered from future taxable income is assessed and assumptions are made about the expected timing of reversal of deferred income tax assets and liabilities. If management subsequently determines it is likely that some or all of a deferred income tax asset will not be realized, a valuation allowance is recorded to reflect the amount of deferred income tax asset expected to be realized. Generally, investment and production tax credits are recorded as a reduction to income tax expense in the current or future periods to the extent that realization of such benefit is more likely than not. Investment tax credits earned on regulated assets by TEC, PGS and NMGC are deferred and amortized as required by regulatory practices. TEC, PGS, NMGC and BLPC collect income taxes from customers based on current and deferred income taxes. NSPI, NSPML and Brunswick Pipeline collect income taxes from customers based on income tax that is currently payable, except for the deferred income taxes on certain regulatory balances specifically prescribed by regulators. For the balance of regulated deferred income taxes, NSPI, NSPML and Brunswick Pipeline recognize regulatory assets or liabilities where the deferred income taxes are expected to be recovered from or returned to customers in future years. These regulated assets or liabilities are grossed up using the respective income tax rate to reflect the income tax associated with future revenues that are required to fund these deferred income tax liabilities, and the income tax benefits associated with reduced revenues resulting from the realization of deferred income tax assets. GBPC is not subject to income taxes. Emera classifies interest and penalties associated with unrecognized tax benefits as interest and operating expense, respectively. For further details, refer to note 11. Derivatives and Hedging Activities The Company uses financial instruments as a method to manage its exposure to normal operating and market risks relating to commodity prices, interest rates, FX on forecast USD earnings and cash flows and forecast future cash settlements of deferred compensation obligations. In addition, the Company has contracts for the physical purchase and sale of commodities. Collectively, these contracts and financial instruments are considered derivatives. The Company recognizes the FV of all its derivatives on its balance sheet, except for non-financial derivatives that meet the normal purchases and normal sales (“NPNS”) exception. Physical contracts that meet the NPNS exception are not recognized on the balance sheet; these contracts are recognized in income when they settle. A physical contract generally qualifies for the NPNS exception if the transaction is reasonable in relation to the Company’s business needs, the counterparty owns or controls resources within the proximity to allow for physical delivery, the Company intends to receive physical delivery of the commodity, and the Company deems the counterparty creditworthy. The Company continually assesses contracts designated under the NPNS exception and will discontinue the treatment of these contracts under this exemption if the criteria are no longer met. EMERA 2025 ANNUAL REPORT 77
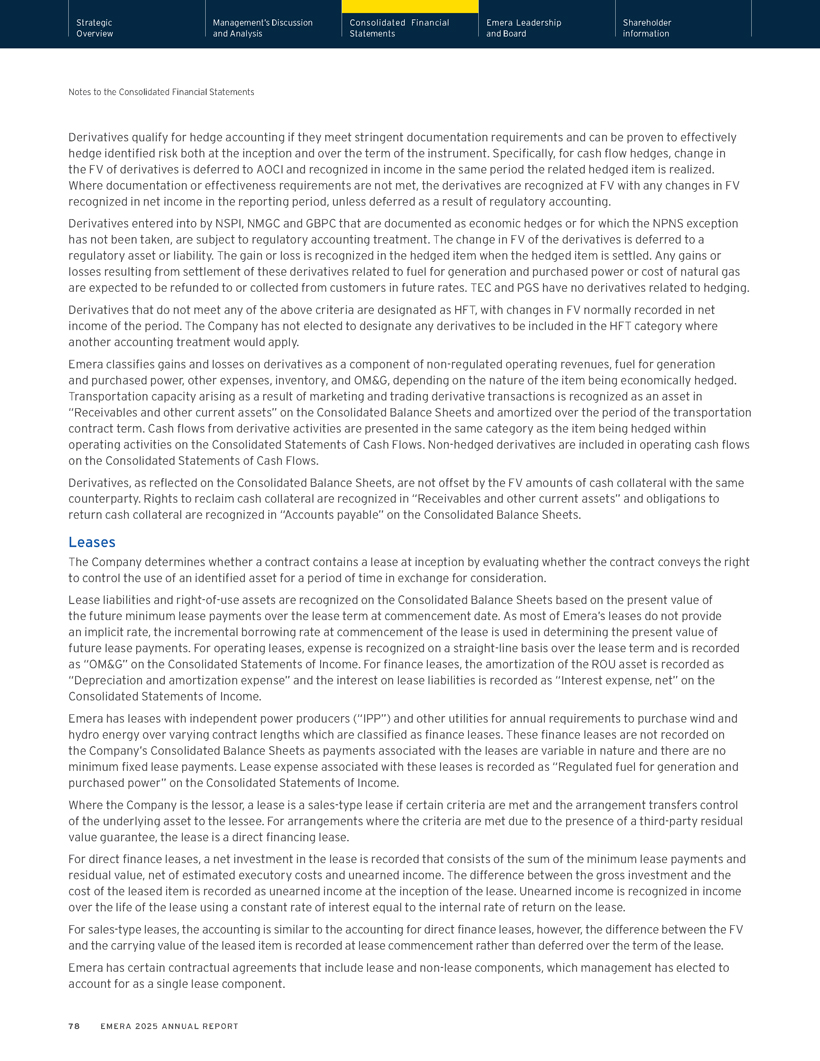
Strategic Management’s Discussion Consolidated Financial Emera Leadership Shareholder Overview and Analysis Statements and Board information Notes to the Consolidated Financial Statements Derivatives qualify for hedge accounting if they meet stringent documentation requirements and can be proven to effectively hedge identified risk both at the inception and over the term of the instrument. Specifically, for cash flow hedges, change in the FV of derivatives is deferred to AOCI and recognized in income in the same period the related hedged item is realized. Where documentation or effectiveness requirements are not met, the derivatives are recognized at FV with any changes in FV recognized in net income in the reporting period, unless deferred as a result of regulatory accounting. Derivatives entered into by NSPI, NMGC and GBPC that are documented as economic hedges or for which the NPNS exception has not been taken, are subject to regulatory accounting treatment. The change in FV of the derivatives is deferred to a regulatory asset or liability. The gain or loss is recognized in the hedged item when the hedged item is settled. Any gains or losses resulting from settlement of these derivatives related to fuel for generation and purchased power or cost of natural gas are expected to be refunded to or collected from customers in future rates. TEC and PGS have no derivatives related to hedging. Derivatives that do not meet any of the above criteria are designated as HFT, with changes in FV normally recorded in net income of the period. The Company has not elected to designate any derivatives to be included in the HFT category where another accounting treatment would apply. Emera classifies gains and losses on derivatives as a component of non-regulated operating revenues, fuel for generation and purchased power, other expenses, inventory, and OM&G, depending on the nature of the item being economically hedged. Transportation capacity arising as a result of marketing and trading derivative transactions is recognized as an asset in “Receivables and other current assets” on the Consolidated Balance Sheets and amortized over the period of the transportation contract term. Cash flows from derivative activities are presented in the same category as the item being hedged within operating activities on the Consolidated Statements of Cash Flows. Non-hedged derivatives are included in operating cash flows on the Consolidated Statements of Cash Flows. Derivatives, as reflected on the Consolidated Balance Sheets, are not offset by the FV amounts of cash collateral with the same counterparty. Rights to reclaim cash collateral are recognized in “Receivables and other current assets” and obligations to return cash collateral are recognized in “Accounts payable” on the Consolidated Balance Sheets. Leases The Company determines whether a contract contains a lease at inception by evaluating whether the contract conveys the right to control the use of an identified asset for a period of time in exchange for consideration. Lease liabilities and right-of-use assets are recognized on the Consolidated Balance Sheets based on the present value of the future minimum lease payments over the lease term at commencement date. As most of Emera’s leases do not provide an implicit rate, the incremental borrowing rate at commencement of the lease is used in determining the present value of future lease payments. For operating leases, expense is recognized on a straight-line basis over the lease term and is recorded as “OM&G” on the Consolidated Statements of Income. For finance leases, the amortization of the ROU asset is recorded as “Depreciation and amortization expense” and the interest on lease liabilities is recorded as “Interest expense, net” on the Consolidated Statements of Income. Emera has leases with independent power producers (“IPP”) and other utilities for annual requirements to purchase wind and hydro energy over varying contract lengths which are classified as finance leases. These finance leases are not recorded on the Company’s Consolidated Balance Sheets as payments associated with the leases are variable in nature and there are no minimum fixed lease payments. Lease expense associated with these leases is recorded as “Regulated fuel for generation and purchased power” on the Consolidated Statements of Income. Where the Company is the lessor, a lease is a sales-type lease if certain criteria are met and the arrangement transfers control of the underlying asset to the lessee. For arrangements where the criteria are met due to the presence of a third-party residual value guarantee, the lease is a direct financing lease. For direct finance leases, a net investment in the lease is recorded that consists of the sum of the minimum lease payments and residual value, net of estimated executory costs and unearned income. The difference between the gross investment and the cost of the leased item is recorded as unearned income at the inception of the lease. Unearned income is recognized in income over the life of the lease using a constant rate of interest equal to the internal rate of return on the lease. For sales-type leases, the accounting is similar to the accounting for direct finance leases, however, the difference between the FV and the carrying value of the leased item is recorded at lease commencement rather than deferred over the term of the lease. Emera has certain contractual agreements that include lease and non-lease components, which management has elected to account for as a single lease component. 78 EMERA 2025 ANNUAL REPORT
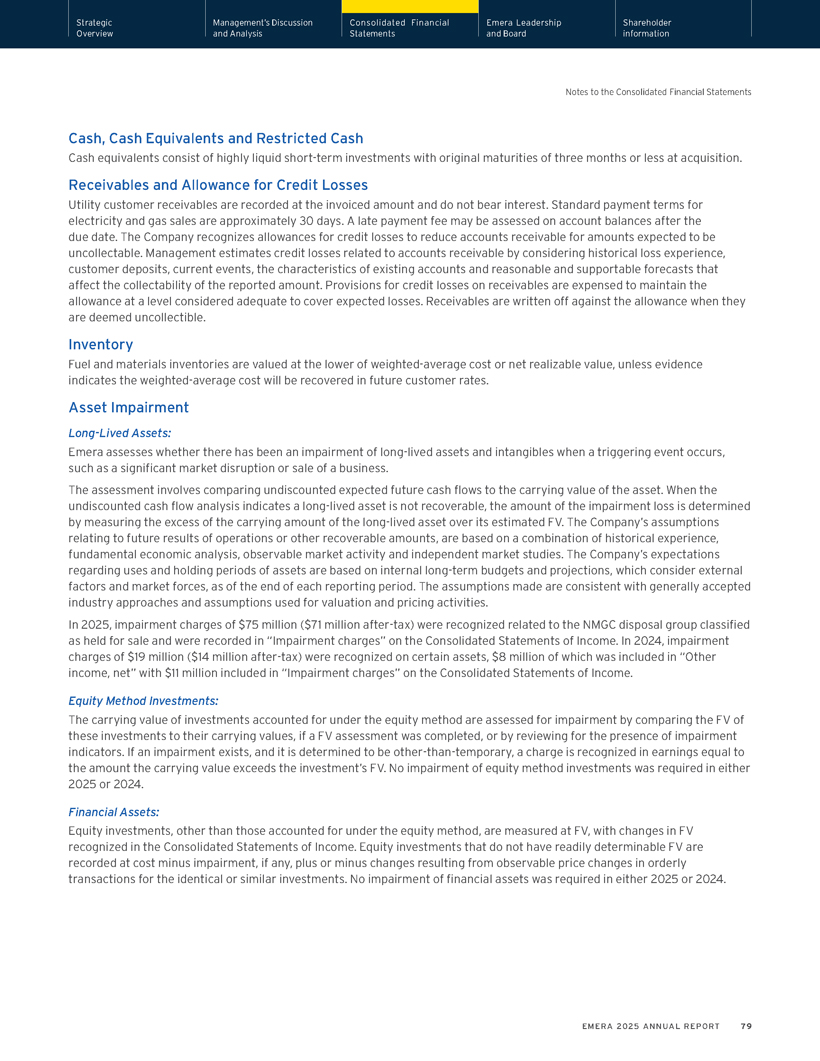
Strategic Management’s Discussion Consolidated Financial Emera Leadership Shareholder Overview and Analysis Statements and Board information Notes to the Consolidated Financial Statements Cash, Cash Equivalents and Restricted Cash Cash equivalents consist of highly liquid short-term investments with original maturities of three months or less at acquisition. Receivables and Allowance for Credit Losses Utility customer receivables are recorded at the invoiced amount and do not bear interest. Standard payment terms for electricity and gas sales are approximately 30 days. A late payment fee may be assessed on account balances after the due date. The Company recognizes allowances for credit losses to reduce accounts receivable for amounts expected to be uncollectable. Management estimates credit losses related to accounts receivable by considering historical loss experience, customer deposits, current events, the characteristics of existing accounts and reasonable and supportable forecasts that affect the collectability of the reported amount. Provisions for credit losses on receivables are expensed to maintain the allowance at a level considered adequate to cover expected losses. Receivables are written off against the allowance when they are deemed uncollectible. Inventory Fuel and materials inventories are valued at the lower of weighted-average cost or net realizable value, unless evidence indicates the weighted-average cost will be recovered in future customer rates. Asset Impairment Long-Lived Assets: Emera assesses whether there has been an impairment of long-lived assets and intangibles when a triggering event occurs, such as a significant market disruption or sale of a business. The assessment involves comparing undiscounted expected future cash flows to the carrying value of the asset. When the undiscounted cash flow analysis indicates a long-lived asset is not recoverable, the amount of the impairment loss is determined by measuring the excess of the carrying amount of the long-lived asset over its estimated FV. The Company’s assumptions relating to future results of operations or other recoverable amounts, are based on a combination of historical experience, fundamental economic analysis, observable market activity and independent market studies. The Company’s expectations regarding uses and holding periods of assets are based on internal long-term budgets and projections, which consider external factors and market forces, as of the end of each reporting period. The assumptions made are consistent with generally accepted industry approaches and assumptions used for valuation and pricing activities. In 2025, impairment charges of $75 million ($71 million after-tax) were recognized related to the NMGC disposal group classified as held for sale and were recorded in “Impairment charges” on the Consolidated Statements of Income. In 2024, impairment charges of $19 million ($14 million after-tax) were recognized on certain assets, $8 million of which was included in “Other income, net” with $11 million included in “Impairment charges” on the Consolidated Statements of Income. Equity Method Investments: The carrying value of investments accounted for under the equity method are assessed for impairment by comparing the FV of these investments to their carrying values, if a FV assessment was completed, or by reviewing for the presence of impairment indicators. If an impairment exists, and it is determined to be other-than-temporary, a charge is recognized in earnings equal to the amount the carrying value exceeds the investment’s FV. No impairment of equity method investments was required in either 2025 or 2024. Financial Assets: Equity investments, other than those accounted for under the equity method, are measured at FV, with changes in FV recognized in the Consolidated Statements of Income. Equity investments that do not have readily determinable FV are recorded at cost minus impairment, if any, plus or minus changes resulting from observable price changes in orderly transactions for the identical or similar investments. No impairment of financial assets was required in either 2025 or 2024. EMERA 2025 ANNUAL REPORT 79
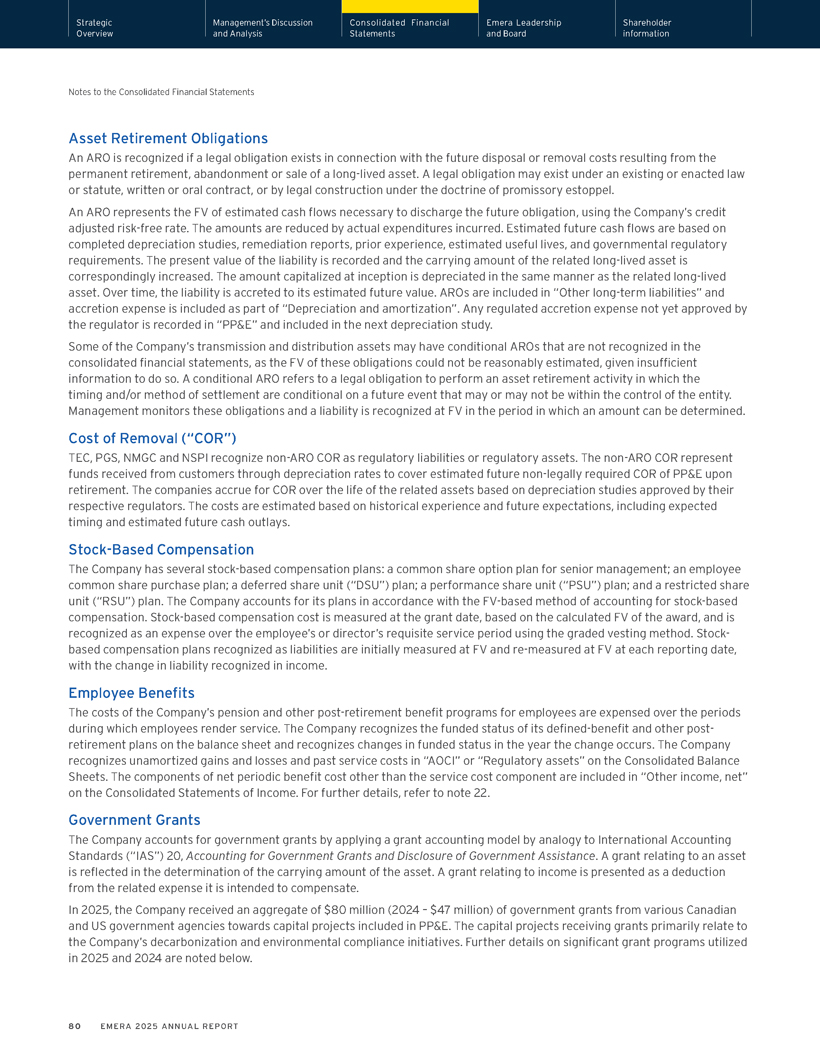
Strategic Management’s Discussion Consolidated Financial Emera Leadership Shareholder Overview and Analysis Statements and Board information Notes to the Consolidated Financial Statements Asset Retirement Obligations An ARO is recognized if a legal obligation exists in connection with the future disposal or removal costs resulting from the permanent retirement, abandonment or sale of a long-lived asset. A legal obligation may exist under an existing or enacted law or statute, written or oral contract, or by legal construction under the doctrine of promissory estoppel. An ARO represents the FV of estimated cash flows necessary to discharge the future obligation, using the Company’s credit adjusted risk-free rate. The amounts are reduced by actual expenditures incurred. Estimated future cash flows are based on completed depreciation studies, remediation reports, prior experience, estimated useful lives, and governmental regulatory requirements. The present value of the liability is recorded and the carrying amount of the related long-lived asset is correspondingly increased. The amount capitalized at inception is depreciated in the same manner as the related long-lived asset. Over time, the liability is accreted to its estimated future value. AROs are included in “Other long-term liabilities” and accretion expense is included as part of “Depreciation and amortization”. Any regulated accretion expense not yet approved by the regulator is recorded in “PP&E” and included in the next depreciation study. Some of the Company’s transmission and distribution assets may have conditional AROs that are not recognized in the consolidated financial statements, as the FV of these obligations could not be reasonably estimated, given insufficient information to do so. A conditional ARO refers to a legal obligation to perform an asset retirement activity in which the timing and/or method of settlement are conditional on a future event that may or may not be within the control of the entity. Management monitors these obligations and a liability is recognized at FV in the period in which an amount can be determined. Cost of Removal (“COR”) TEC, PGS, NMGC and NSPI recognize non-ARO COR as regulatory liabilities or regulatory assets. The non-ARO COR represent funds received from customers through depreciation rates to cover estimated future non-legally required COR of PP&E upon retirement. The companies accrue for COR over the life of the related assets based on depreciation studies approved by their respective regulators. The costs are estimated based on historical experience and future expectations, including expected timing and estimated future cash outlays. Stock-Based Compensation The Company has several stock-based compensation plans: a common share option plan for senior management; an employee common share purchase plan; a deferred share unit (“DSU”) plan; a performance share unit (“PSU”) plan; and a restricted share unit (“RSU”) plan. The Company accounts for its plans in accordance with the FV-based method of accounting for stock-based compensation. Stock-based compensation cost is measured at the grant date, based on the calculated FV of the award, and is recognized as an expense over the employee’s or director’s requisite service period using the graded vesting method. Stock-based compensation plans recognized as liabilities are initially measured at FV and re-measured at FV at each reporting date, with the change in liability recognized in income. Employee Benefits The costs of the Company’s pension and other post-retirement benefit programs for employees are expensed over the periods during which employees render service. The Company recognizes the funded status of its defined-benefit and other post-retirement plans on the balance sheet and recognizes changes in funded status in the year the change occurs. The Company recognizes unamortized gains and losses and past service costs in “AOCI” or “Regulatory assets” on the Consolidated Balance Sheets. The components of net periodic benefit cost other than the service cost component are included in “Other income, net” on the Consolidated Statements of Income. For further details, refer to note 22. Government Grants The Company accounts for government grants by applying a grant accounting model by analogy to International Accounting Standards (“IAS”) 20, Accounting for Government Grants and Disclosure of Government Assistance. A grant relating to an asset is reflected in the determination of the carrying amount of the asset. A grant relating to income is presented as a deduction from the related expense it is intended to compensate. In 2025, the Company received an aggregate of $80 million (2024 – $47 million) of government grants from various Canadian and US government agencies towards capital projects included in PP&E. The capital projects receiving grants primarily relate to the Company’s decarbonization and environmental compliance initiatives. Further details on significant grant programs utilized in 2025 and 2024 are noted below. 80 EMERA 2025 ANNUAL REPORT
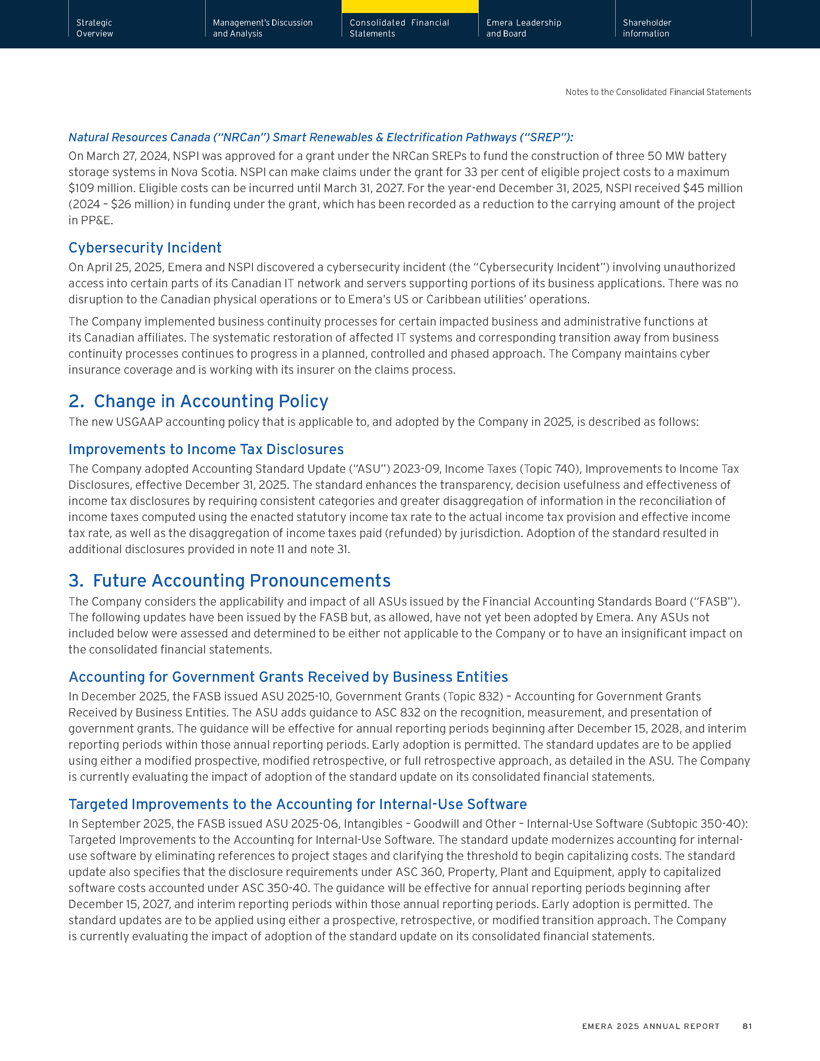
Strategic Management’s Discussion Consolidated Financial Emera Leadership Shareholder Overview and Analysis Statements and Board information Notes to the Consolidated Financial Statements Natural Resources Canada (“NRCan”) Smart Renewables & Electrification Pathways (“SREP”): On March 27, 2024, NSPI was approved for a grant under the NRCan SREPs to fund the construction of three 50 MW battery storage systems in Nova Scotia. NSPI can make claims under the grant for 33 per cent of eligible project costs to a maximum $109 million. Eligible costs can be incurred until March 31, 2027. For the year-end December 31, 2025, NSPI received $45 million (2024 – $26 million) in funding under the grant, which has been recorded as a reduction to the carrying amount of the project in PP&E. Cybersecurity Incident On April 25, 2025, Emera and NSPI discovered a cybersecurity incident (the “Cybersecurity Incident”) involving unauthorized access into certain parts of its Canadian IT network and servers supporting portions of its business applications. There was no disruption to the Canadian physical operations or to Emera’s US or Caribbean utilities’ operations. The Company implemented business continuity processes for certain impacted business and administrative functions at its Canadian affiliates. The systematic restoration of affected IT systems and corresponding transition away from business continuity processes continues to progress in a planned, controlled and phased approach. The Company maintains cyber insurance coverage and is working with its insurer on the claims process. 2. Change in Accounting Policy The new USGAAP accounting policy that is applicable to, and adopted by the Company in 2025, is described as follows: Improvements to Income Tax Disclosures The Company adopted Accounting Standard Update (“ASU”) 2023-09, Income Taxes (Topic 740), Improvements to Income Tax Disclosures, effective December 31, 2025. The standard enhances the transparency, decision usefulness and effectiveness of income tax disclosures by requiring consistent categories and greater disaggregation of information in the reconciliation of income taxes computed using the enacted statutory income tax rate to the actual income tax provision and effective income tax rate, as well as the disaggregation of income taxes paid (refunded) by jurisdiction. Adoption of the standard resulted in additional disclosures provided in note 11 and note 31. 3. Future Accounting Pronouncements The Company considers the applicability and impact of all ASUs issued by the Financial Accounting Standards Board (“FASB”). The following updates have been issued by the FASB but, as allowed, have not yet been adopted by Emera. Any ASUs not included below were assessed and determined to be either not applicable to the Company or to have an insignificant impact on the consolidated financial statements. Accounting for Government Grants Received by Business Entities In December 2025, the FASB issued ASU 2025-10, Government Grants (Topic 832) – Accounting for Government Grants Received by Business Entities. The ASU adds guidance to ASC 832 on the recognition, measurement, and presentation of government grants. The guidance will be effective for annual reporting periods beginning after December 15, 2028, and interim reporting periods within those annual reporting periods. Early adoption is permitted. The standard updates are to be applied using either a modified prospective, modified retrospective, or full retrospective approach, as detailed in the ASU. The Company is currently evaluating the impact of adoption of the standard update on its consolidated financial statements. Targeted Improvements to the Accounting for Internal-Use Software In September 2025, the FASB issued ASU 2025-06, Intangibles – Goodwill and Other – Internal-Use Software (Subtopic 350-40): Targeted Improvements to the Accounting for Internal-Use Software. The standard update modernizes accounting for internal-use software by eliminating references to project stages and clarifying the threshold to begin capitalizing costs. The standard update also specifies that the disclosure requirements under ASC 360, Property, Plant and Equipment, apply to capitalized software costs accounted under ASC 350-40. The guidance will be effective for annual reporting periods beginning after December 15, 2027, and interim reporting periods within those annual reporting periods. Early adoption is permitted. The standard updates are to be applied using either a prospective, retrospective, or modified transition approach. The Company is currently evaluating the impact of adoption of the standard update on its consolidated financial statements. EMERA 2025 ANNUAL REPORT 81
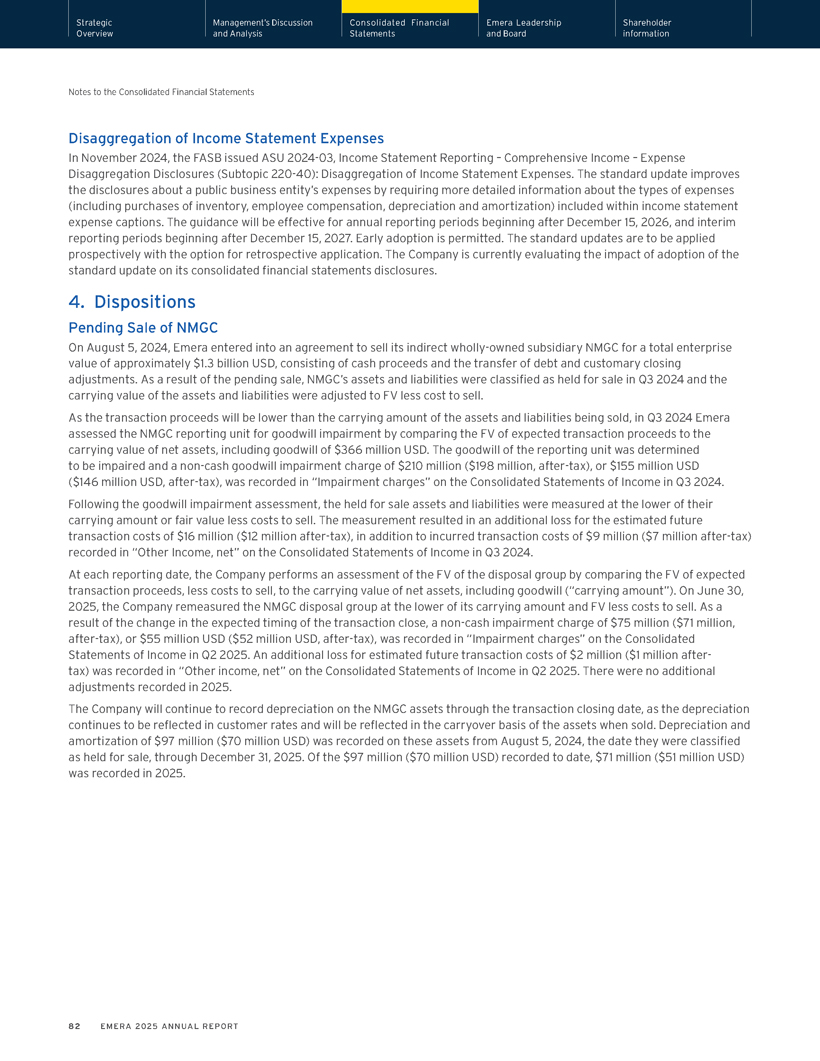
Strategic Management’s Discussion Consolidated Financial Emera Leadership Shareholder Overview and Analysis Statements and Board information Notes to the Consolidated Financial Statements Disaggregation of Income Statement Expenses In November 2024, the FASB issued ASU 2024-03, Income Statement Reporting – Comprehensive Income – Expense Disaggregation Disclosures (Subtopic 220-40): Disaggregation of Income Statement Expenses. The standard update improves the disclosures about a public business entity’s expenses by requiring more detailed information about the types of expenses (including purchases of inventory, employee compensation, depreciation and amortization) included within income statement expense captions. The guidance will be effective for annual reporting periods beginning after December 15, 2026, and interim reporting periods beginning after December 15, 2027. Early adoption is permitted. The standard updates are to be applied prospectively with the option for retrospective application. The Company is currently evaluating the impact of adoption of the standard update on its consolidated financial statements disclosures. 4. Dispositions Pending Sale of NMGC On August 5, 2024, Emera entered into an agreement to sell its indirect wholly-owned subsidiary NMGC for a total enterprise value of approximately $1.3 billion USD, consisting of cash proceeds and the transfer of debt and customary closing adjustments. As a result of the pending sale, NMGC’s assets and liabilities were classified as held for sale in Q3 2024 and the carrying value of the assets and liabilities were adjusted to FV less cost to sell. As the transaction proceeds will be lower than the carrying amount of the assets and liabilities being sold, in Q3 2024 Emera assessed the NMGC reporting unit for goodwill impairment by comparing the FV of expected transaction proceeds to the carrying value of net assets, including goodwill of $366 million USD. The goodwill of the reporting unit was determined to be impaired and a non-cash goodwill impairment charge of $210 million ($198 million, after-tax), or $155 million USD ($146 million USD, after-tax), was recorded in “Impairment charges” on the Consolidated Statements of Income in Q3 2024. Following the goodwill impairment assessment, the held for sale assets and liabilities were measured at the lower of their carrying amount or fair value less costs to sell. The measurement resulted in an additional loss for the estimated future transaction costs of $16 million ($12 million after-tax), in addition to incurred transaction costs of $9 million ($7 million after-tax) recorded in “Other Income, net” on the Consolidated Statements of Income in Q3 2024. At each reporting date, the Company performs an assessment of the FV of the disposal group by comparing the FV of expected transaction proceeds, less costs to sell, to the carrying value of net assets, including goodwill (“carrying amount”). On June 30, 2025, the Company remeasured the NMGC disposal group at the lower of its carrying amount and FV less costs to sell. As a result of the change in the expected timing of the transaction close, a non-cash impairment charge of $75 million ($71 million, after-tax), or $55 million USD ($52 million USD, after-tax), was recorded in “Impairment charges” on the Consolidated Statements of Income in Q2 2025. An additional loss for estimated future transaction costs of $2 million ($1 million after-tax) was recorded in “Other income, net” on the Consolidated Statements of Income in Q2 2025. There were no additional adjustments recorded in 2025. The Company will continue to record depreciation on the NMGC assets through the transaction closing date, as the depreciation continues to be reflected in customer rates and will be reflected in the carryover basis of the assets when sold. Depreciation and amortization of $97 million ($70 million USD) was recorded on these assets from August 5, 2024, the date they were classified as held for sale, through December 31, 2025. Of the $97 million ($70 million USD) recorded to date, $71 million ($51 million USD) was recorded in 2025. 82 EMERA 2025 ANNUAL REPORT
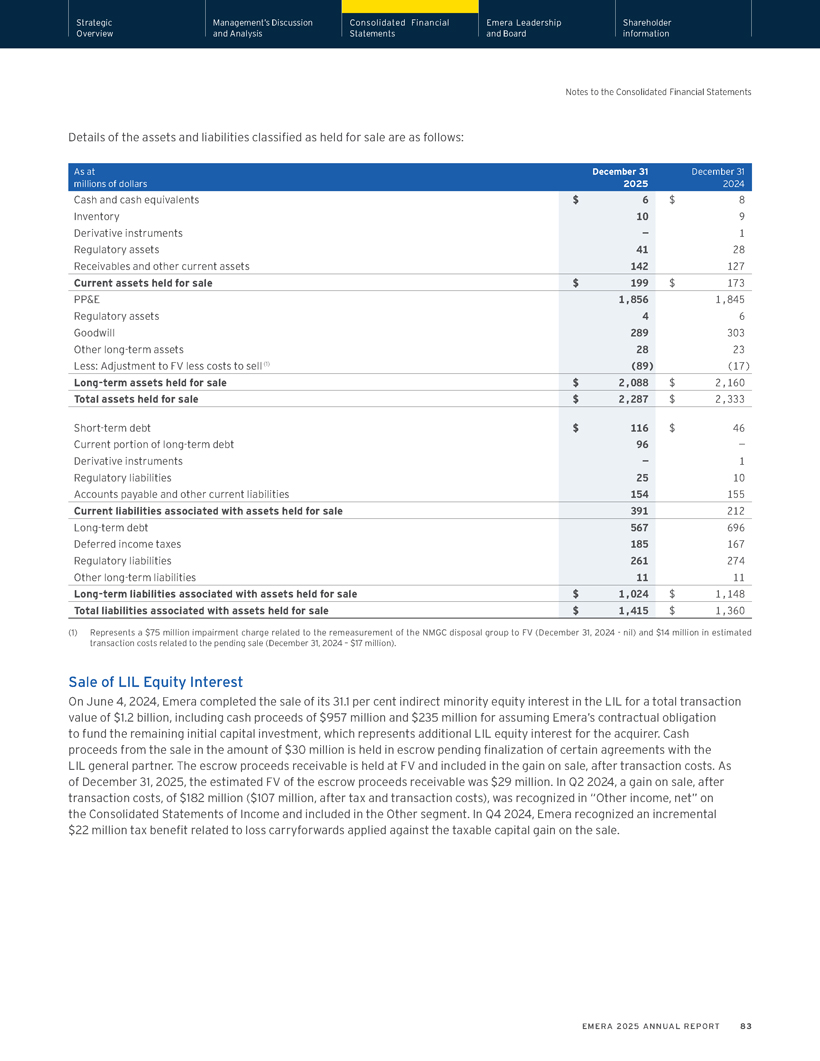
Strategic Management’s Discussion Consolidated Financial Emera Leadership Shareholder Overview and Analysis Statements and Board information Notes to the Consolidated Financial Statements Details of the assets and liabilities classified as held for sale are as follows: As at December 31 December 31 millions of dollars 2025 2024 Cash and cash equivalents $ 6 $ 8 Inventory 10 9 Derivative instruments — 1 Regulatory assets 41 28 Receivables and other current assets 142 127 Current assets held for sale $ 199 $ 173 PP&E 1,856 1,845 Regulatory assets 4 6 Goodwill 289 303 Other long-term assets 28 23 Less: Adjustment to FV less costs to sell (1) (89) (17) Long-term assets held for sale $ 2,088 $ 2,160 Total assets held for sale $ 2,287 $ 2,333 Short-term debt $ 116 $ 46 Current portion of long-term debt 96 — Derivative instruments — 1 Regulatory liabilities 25 10 Accounts payable and other current liabilities 154 155 Current liabilities associated with assets held for sale 391 212 Long-term debt 567 696 Deferred income taxes 185 167 Regulatory liabilities 261 274 Other long-term liabilities 11 11 Long-term liabilities associated with assets held for sale $ 1,024 $ 1,148 Total liabilities associated with assets held for sale $ 1,415 $ 1,360 (1) Represents a $75 million impairment charge related to the remeasurement of the NMGC disposal group to FV (December 31, 2024—nil) and $14 million in estimated transaction costs related to the pending sale (December 31, 2024 – $17 million). Sale of LIL Equity Interest On June 4, 2024, Emera completed the sale of its 31.1 per cent indirect minority equity interest in the LIL for a total transaction value of $1.2 billion, including cash proceeds of $957 million and $235 million for assuming Emera’s contractual obligation to fund the remaining initial capital investment, which represents additional LIL equity interest for the acquirer. Cash proceeds from the sale in the amount of $30 million is held in escrow pending finalization of certain agreements with the LIL general partner. The escrow proceeds receivable is held at FV and included in the gain on sale, after transaction costs. As of December 31, 2025, the estimated FV of the escrow proceeds receivable was $29 million. In Q2 2024, a gain on sale, after transaction costs, of $182 million ($107 million, after tax and transaction costs), was recognized in “Other income, net” on the Consolidated Statements of Income and included in the Other segment. In Q4 2024, Emera recognized an incremental $22 million tax benefit related to loss carryforwards applied against the taxable capital gain on the sale. EMERA 2025 ANNUAL REPORT 83
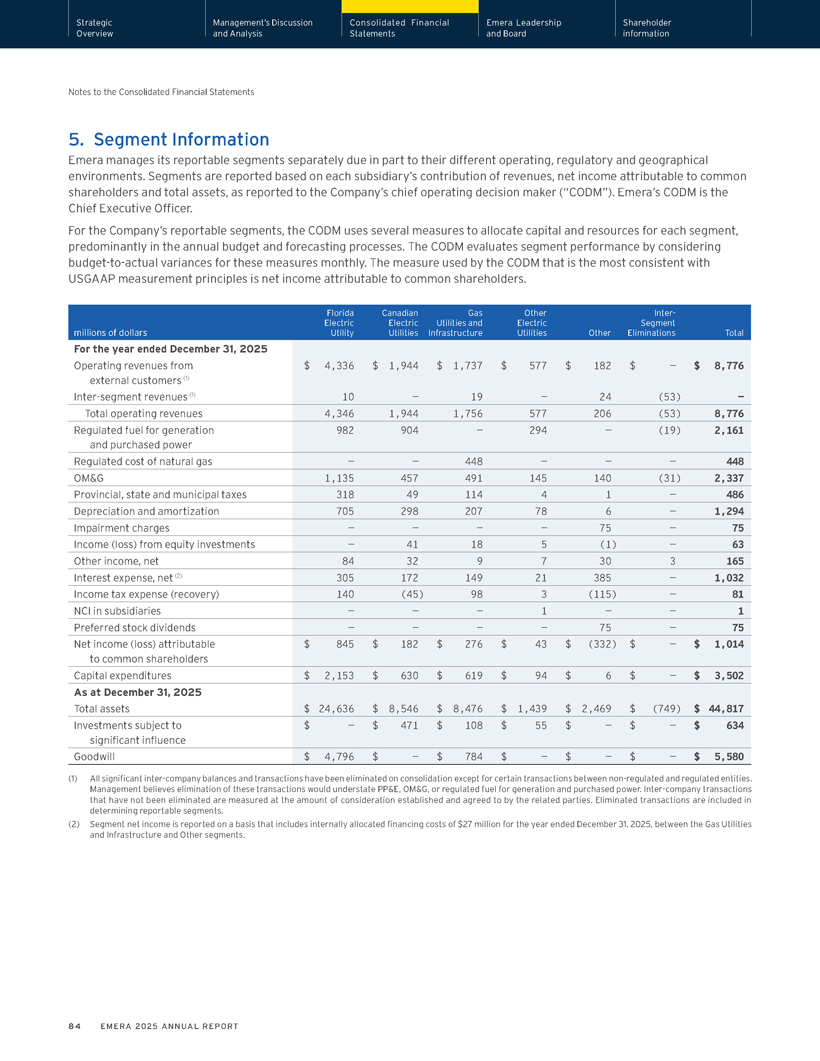
Strategic Management’s Discussion Consolidated Financial Emera Leadership Shareholder Overview and Analysis Statements and Board information Notes to the Consolidated Financial Statements 5. Segment Information Emera manages its reportable segments separately due in part to their different operating, regulatory and geographical environments. Segments are reported based on each subsidiary’s contribution of revenues, net income attributable to common shareholders and total assets, as reported to the Company’s chief operating decision maker (“CODM”). Emera’s CODM is the Chief Executive Officer. For the Company’s reportable segments, the CODM uses several measures to allocate capital and resources for each segment, predominantly in the annual budget and forecasting processes. The CODM evaluates segment performance by considering budget-to-actual variances for these measures monthly. The measure used by the CODM that is the most consistent with USGAAP measurement principles is net income attributable to common shareholders. Florida Canadian Gas Other Inter- Electric Electric Utilities and Electric Segment millions of dollars Utility Utilities Infrastructure Utilities Other Eliminations Total For the year ended December 31, 2025 Operating revenues from $ 4,336 $ 1,944 $ 1,737 $ 577 $ 182 $ — $ 8,776 external customers (1) Inter-segment revenues (1) 10 — 19 — 24 (53) — Total operating revenues 4,346 1,944 1,756 577 206 (53) 8,776 Regulated fuel for generation 982 904 — 294 — (19) 2,161 and purchased power Regulated cost of natural gas — — 448 — — — 448 OM&G 1,135 457 491 145 140 (31) 2,337 Provincial, state and municipal taxes 318 49 114 4 1 — 486 Depreciation and amortization 705 298 207 78 6 — 1,294 Impairment charges — — — — 75 — 75 Income (loss) from equity investments — 41 18 5 (1) — 63 Other income, net 84 32 9 7 30 3 165 Interest expense, net (2) 305 172 149 21 385 — 1,032 Income tax expense (recovery) 140 (45) 98 3 (115) — 81 NCI in subsidiaries — — — 1 — — 1 Preferred stock dividends — — — — 75 — 75 Net income (loss) attributable $ 845 $ 182 $ 276 $ 43 $ (332) $ — $ 1,014 to common shareholders Capital expenditures $ 2,153 $ 630 $ 619 $ 94 $ 6 $ — $ 3,502 As at December 31, 2025 Total assets $ 24,636 $ 8,546 $ 8,476 $ 1,439 $ 2,469 $ (749) $ 44,817 Investments subject to $ — $ 471 $ 108 $ 55 $ — $ — $ 634 significant influence Goodwill $ 4,796 $ — $ 784 $ — $ — $ — $ 5,580 (1) All significant inter-company balances and transactions have been eliminated on consolidation except for certain transactions between non-regulated and regulated entities. Management believes elimination of these transactions would understate PP&E, OM&G, or regulated fuel for generation and purchased power. Inter-company transactions that have not been eliminated are measured at the amount of consideration established and agreed to by the related parties. Eliminated transactions are included in determining reportable segments. (2) Segment net income is reported on a basis that includes internally allocated financing costs of $27 million for the year ended December 31, 2025, between the Gas Utilities and Infrastructure and Other segments. 84 EMERA 2025 ANNUAL REPORT
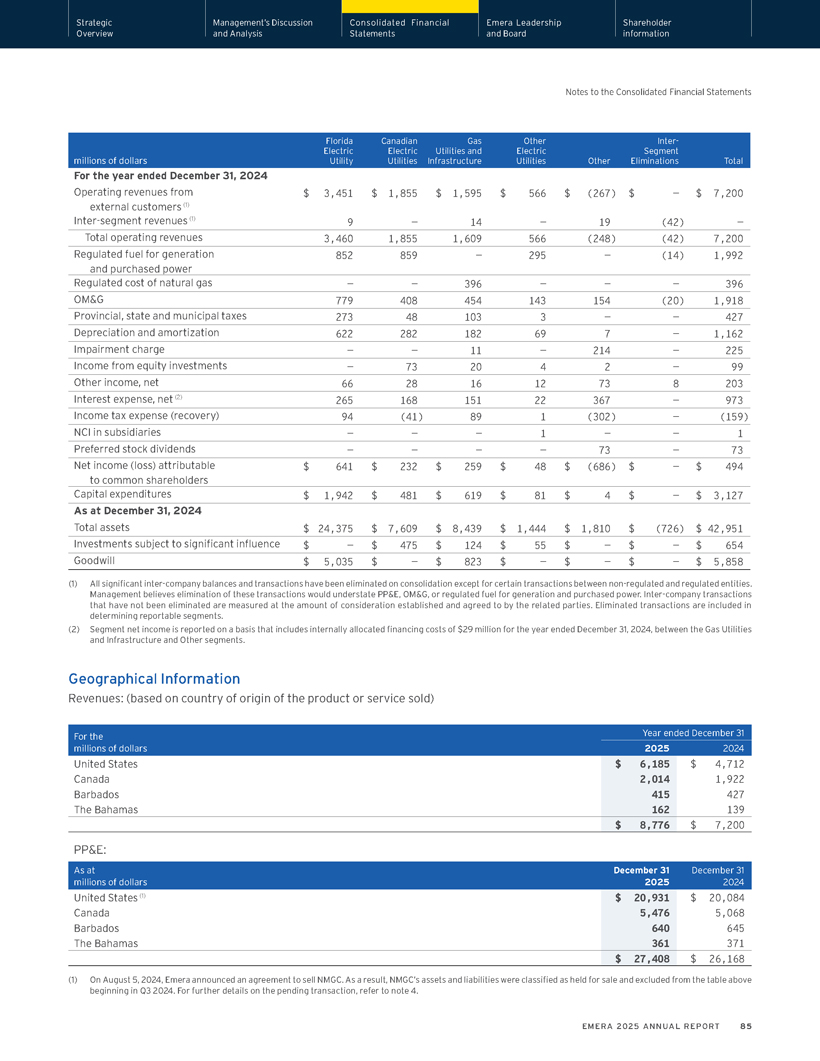
Strategic Management’s Discussion Consolidated Financial Emera Leadership Shareholder Overview and Analysis Statements and Board information Notes to the Consolidated Financial Statements Florida Canadian Gas Other Inter- Electric Electric Utilities and Electric Segment millions of dollars Utility Utilities Infrastructure Utilities Other Eliminations Total For the year ended December 31, 2024 Operating revenues from $ 3,451 $ 1,855 $ 1,595 $ 566 $ (267) $ — $ 7,200 external customers (1) Inter-segment revenues (1) 9 — 14 — 19 (42) — Total operating revenues 3,460 1,855 1,609 566 (248) (42) 7,200 Regulated fuel for generation 852 859 — 295 — (14) 1,992 and purchased power Regulated cost of natural gas — — 396 — — — 396 OM&G 779 408 454 143 154 (20) 1,918 Provincial, state and municipal taxes 273 48 103 3 — — 427 Depreciation and amortization 622 282 182 69 7 — 1,162 Impairment charge — — 11 — 214 — 225 Income from equity investments — 73 20 4 2 — 99 Other income, net 66 28 16 12 73 8 203 Interest expense, net (2) 265 168 151 22 367 — 973 Income tax expense (recovery) 94 (41) 89 1 (302) — (159) NCI in subsidiaries — — — 1 — — 1 Preferred stock dividends — — — — 73 — 73 Net income (loss) attributable $ 641 $ 232 $ 259 $ 48 $ (686) $ — $ 494 to common shareholders Capital expenditures $ 1,942 $ 481 $ 619 $ 81 $ 4 $ — $ 3,127 As at December 31, 2024 Total assets $ 24,375 $ 7,609 $ 8,439 $ 1,444 $ 1,810 $ (726) $ 42,951 Investments subject to significant influence $ — $ 475 $ 124 $ 55 $ — $ — $ 654 Goodwill $ 5,035 $ — $ 823 $ — $ — $ — $ 5,858 (1) All significant inter-company balances and transactions have been eliminated on consolidation except for certain transactions between non-regulated and regulated entities. Management believes elimination of these transactions would understate PP&E, OM&G, or regulated fuel for generation and purchased power. Inter-company transactions that have not been eliminated are measured at the amount of consideration established and agreed to by the related parties. Eliminated transactions are included in determining reportable segments. (2) Segment net income is reported on a basis that includes internally allocated financing costs of $29 million for the year ended December 31, 2024, between the Gas Utilities and Infrastructure and Other segments. Geographical Information Revenues: (based on country of origin of the product or service sold) For the Year ended December 31 millions of dollars 2025 2024 United States $ 6,185 $ 4,712 Canada 2,014 1,922 Barbados 415 427 The Bahamas 162 139 $ 8,776 $ 7,200 PP&E: As at December 31 December 31 millions of dollars 2025 2024 United States (1) $ 20,931 $ 20,084 Canada 5,476 5,068 Barbados 640 645 The Bahamas 361 371 $ 27,408 $ 26,168 (1) On August 5, 2024, Emera announced an agreement to sell NMGC. As a result, NMGC’s assets and liabilities were classified as held for sale and excluded from the table above beginning in Q3 2024. For further details on the pending transaction, refer to note 4. EMERA 2025 ANNUAL REPORT 85
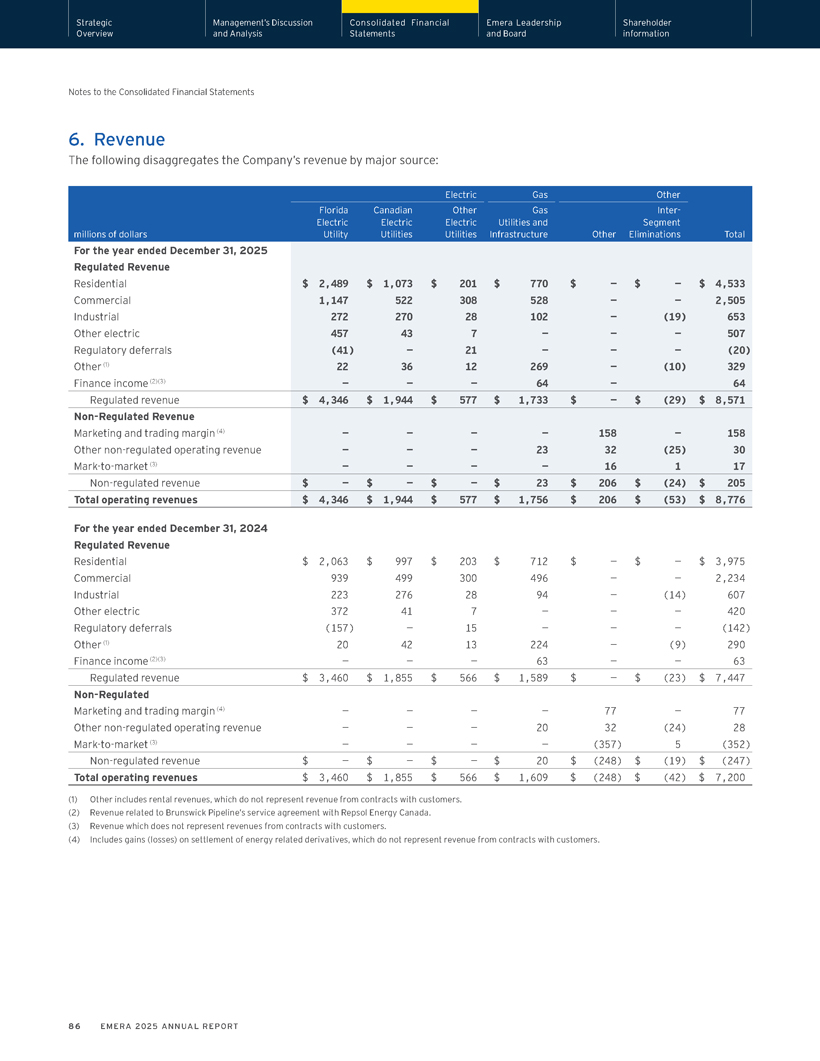
Strategic Management’s Discussion Consolidated Financial Emera Leadership Shareholder Overview and Analysis Statements and Board information Notes to the Consolidated Financial Statements 6. Revenue The following disaggregates the Company’s revenue by major source: Electric Gas Other Florida Canadian Other Gas Inter- Electric Electric Electric Utilities and Segment millions of dollars Utility Utilities Utilities Infrastructure Other Eliminations Total For the year ended December 31, 2025 Regulated Revenue Residential $ 2,489 $ 1,073 $ 201 $ 770 $ — $ — $ 4,533 Commercial 1,147 522 308 528 — — 2,505 Industrial 272 270 28 102 — (19) 653 Other electric 457 43 7 — — — 507 Regulatory deferrals (41) — 21 — — — (20) Other (1) 22 36 12 269 — (10) 329 Finance income (2)(3) — — — 64 — 64 Regulated revenue $ 4,346 $ 1,944 $ 577 $ 1,733 $ — $ (29) $ 8,571 Non-Regulated Revenue Marketing and trading margin (4) — — — — 158 — 158 Other non-regulated operating revenue — — — 23 32 (25) 30 Mark-to-market (3) — — — — 16 1 17 Non-regulated revenue $ — $ — $ — $ 23 $ 206 $ (24) $ 205 Total operating revenues $ 4,346 $ 1,944 $ 577 $ 1,756 $ 206 $ (53) $ 8,776 For the year ended December 31, 2024 Regulated Revenue Residential $ 2,063 $ 997 $ 203 $ 712 $ — $ — $ 3,975 Commercial 939 499 300 496 — — 2,234 Industrial 223 276 28 94 — (14) 607 Other electric 372 41 7 — — — 420 Regulatory deferrals (157) — 15 — — — (142) Other (1) 20 42 13 224 — (9) 290 Finance income (2)(3) — — — 63 — — 63 Regulated revenue $ 3,460 $ 1,855 $ 566 $ 1,589 $ — $ (23) $ 7,447 Non-Regulated Marketing and trading margin (4) — — — — 77 — 77 Other non-regulated operating revenue — — — 20 32 (24) 28 Mark-to-market (3) — — — — (357) 5 (352) Non-regulated revenue $ — $ — $ — $ 20 $ (248) $ (19) $ (247) Total operating revenues $ 3,460 $ 1,855 $ 566 $ 1,609 $ (248) $ (42) $ 7,200 (1) Other includes rental revenues, which do not represent revenue from contracts with customers. (2) Revenue related to Brunswick Pipeline’s service agreement with Repsol Energy Canada. (3) Revenue which does not represent revenues from contracts with customers. (4) Includes gains (losses) on settlement of energy related derivatives, which do not represent revenue from contracts with customers. 86 EMERA 2025 ANNUAL REPORT
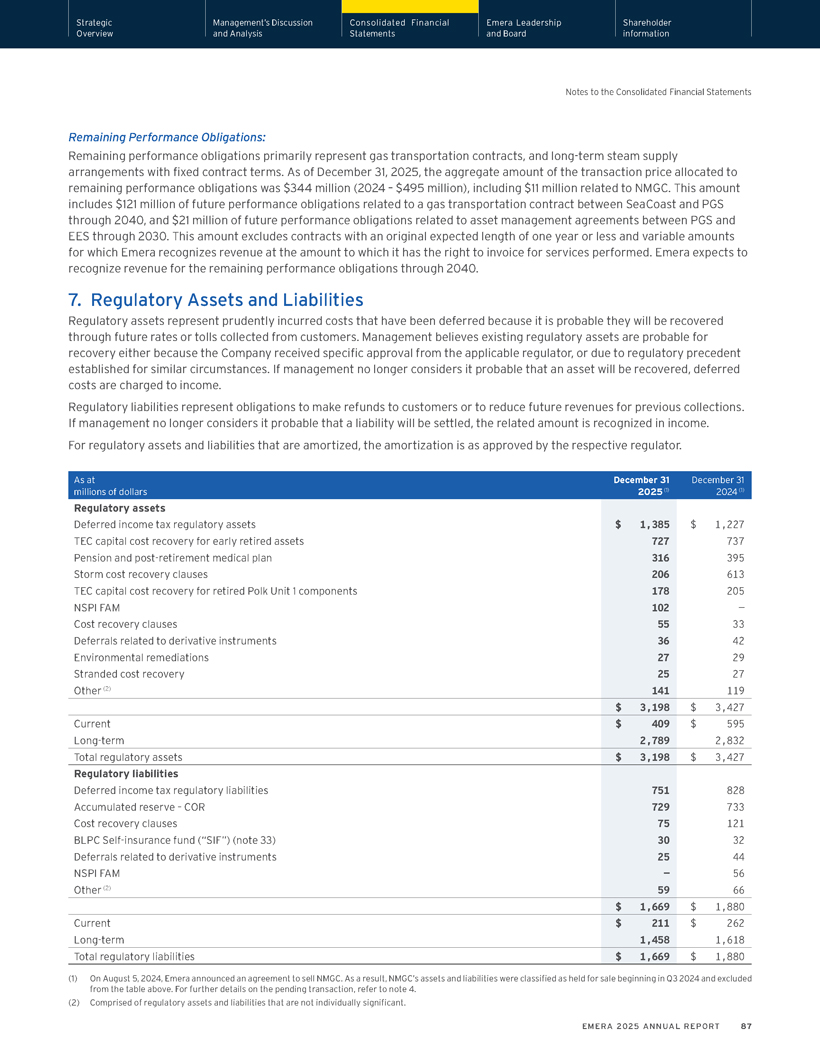
Strategic Management’s Discussion Consolidated Financial Emera Leadership Shareholder Overview and Analysis Statements and Board information Notes to the Consolidated Financial Statements Remaining Performance Obligations: Remaining performance obligations primarily represent gas transportation contracts, and long-term steam supply arrangements with fixed contract terms. As of December 31, 2025, the aggregate amount of the transaction price allocated to remaining performance obligations was $344 million (2024 – $495 million), including $11 million related to NMGC. This amount includes $121 million of future performance obligations related to a gas transportation contract between SeaCoast and PGS through 2040, and $21 million of future performance obligations related to asset management agreements between PGS and EES through 2030. This amount excludes contracts with an original expected length of one year or less and variable amounts for which Emera recognizes revenue at the amount to which it has the right to invoice for services performed. Emera expects to recognize revenue for the remaining performance obligations through 2040. 7. Regulatory Assets and Liabilities Regulatory assets represent prudently incurred costs that have been deferred because it is probable they will be recovered through future rates or tolls collected from customers. Management believes existing regulatory assets are probable for recovery either because the Company received specific approval from the applicable regulator, or due to regulatory precedent established for similar circumstances. If management no longer considers it probable that an asset will be recovered, deferred costs are charged to income. Regulatory liabilities represent obligations to make refunds to customers or to reduce future revenues for previous collections. If management no longer considers it probable that a liability will be settled, the related amount is recognized in income. For regulatory assets and liabilities that are amortized, the amortization is as approved by the respective regulator. As at December 31 December 31 millions of dollars 2025 (1) 2024 (1) Regulatory assets Deferred income tax regulatory assets $ 1,385 $ 1,227 TEC capital cost recovery for early retired assets 727 737 Pension and post-retirement medical plan 316 395 Storm cost recovery clauses 206 613 TEC capital cost recovery for retired Polk Unit 1 components 178 205 NSPI FAM 102 —Cost recovery clauses 55 33 Deferrals related to derivative instruments 36 42 Environmental remediations 27 29 Stranded cost recovery 25 27 Other (2) 141 119 $ 3,198 $ 3,427 Current $ 409 $ 595 Long-term 2,789 2,832 Total regulatory assets $ 3,198 $ 3,427 Regulatory liabilities Deferred income tax regulatory liabilities 751 828 Accumulated reserve – COR 729 733 Cost recovery clauses 75 121 BLPC Self-insurance fund (“SIF”) (note 33) 30 32 Deferrals related to derivative instruments 25 44 NSPI FAM — 56 Other (2) 59 66 $ 1,669 $ 1,880 Current $ 211 $ 262 Long-term 1,458 1,618 Total regulatory liabilities $ 1,669 $ 1,880 (1) On August 5, 2024, Emera announced an agreement to sell NMGC. As a result, NMGC’s assets and liabilities were classified as held for sale beginning in Q3 2024 and excluded from the table above. For further details on the pending transaction, refer to note 4. (2) Comprised of regulatory assets and liabilities that are not individually significant. EMERA 2025 ANNUAL REPORT 87
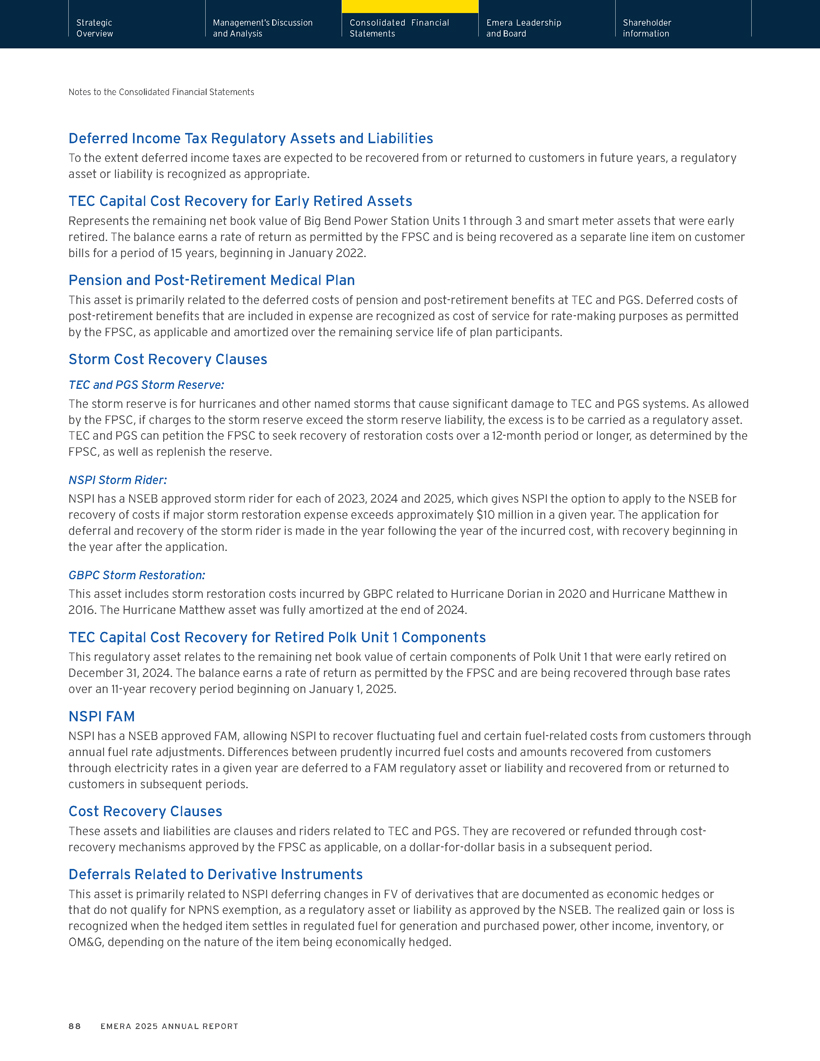
Strategic Management’s Discussion Consolidated Financial Emera Leadership Shareholder Overview and Analysis Statements and Board information Notes to the Consolidated Financial Statements Deferred Income Tax Regulatory Assets and Liabilities To the extent deferred income taxes are expected to be recovered from or returned to customers in future years, a regulatory asset or liability is recognized as appropriate. TEC Capital Cost Recovery for Early Retired Assets Represents the remaining net book value of Big Bend Power Station Units 1 through 3 and smart meter assets that were early retired. The balance earns a rate of return as permitted by the FPSC and is being recovered as a separate line item on customer bills for a period of 15 years, beginning in January 2022. Pension and Post-Retirement Medical Plan This asset is primarily related to the deferred costs of pension and post-retirement benefits at TEC and PGS. Deferred costs of post-retirement benefits that are included in expense are recognized as cost of service for rate-making purposes as permitted by the FPSC, as applicable and amortized over the remaining service life of plan participants. Storm Cost Recovery Clauses TEC and PGS Storm Reserve: The storm reserve is for hurricanes and other named storms that cause significant damage to TEC and PGS systems. As allowed by the FPSC, if charges to the storm reserve exceed the storm reserve liability, the excess is to be carried as a regulatory asset. TEC and PGS can petition the FPSC to seek recovery of restoration costs over a 12-month period or longer, as determined by the FPSC, as well as replenish the reserve. NSPI Storm Rider: NSPI has a NSEB approved storm rider for each of 2023, 2024 and 2025, which gives NSPI the option to apply to the NSEB for recovery of costs if major storm restoration expense exceeds approximately $10 million in a given year. The application for deferral and recovery of the storm rider is made in the year following the year of the incurred cost, with recovery beginning in the year after the application. GBPC Storm Restoration: This asset includes storm restoration costs incurred by GBPC related to Hurricane Dorian in 2020 and Hurricane Matthew in 2016. The Hurricane Matthew asset was fully amortized at the end of 2024. TEC Capital Cost Recovery for Retired Polk Unit 1 Components This regulatory asset relates to the remaining net book value of certain components of Polk Unit 1 that were early retired on December 31, 2024. The balance earns a rate of return as permitted by the FPSC and are being recovered through base rates over an 11-year recovery period beginning on January 1, 2025. NSPI FAM NSPI has a NSEB approved FAM, allowing NSPI to recover fluctuating fuel and certain fuel-related costs from customers through annual fuel rate adjustments. Differences between prudently incurred fuel costs and amounts recovered from customers through electricity rates in a given year are deferred to a FAM regulatory asset or liability and recovered from or returned to customers in subsequent periods. Cost Recovery Clauses These assets and liabilities are clauses and riders related to TEC and PGS. They are recovered or refunded through cost-recovery mechanisms approved by the FPSC as applicable, on a dollar-for-dollar basis in a subsequent period. Deferrals Related to Derivative Instruments This asset is primarily related to NSPI deferring changes in FV of derivatives that are documented as economic hedges or that do not qualify for NPNS exemption, as a regulatory asset or liability as approved by the NSEB. The realized gain or loss is recognized when the hedged item settles in regulated fuel for generation and purchased power, other income, inventory, or OM&G, depending on the nature of the item being economically hedged. 88 EMERA 2025 ANNUAL REPORT
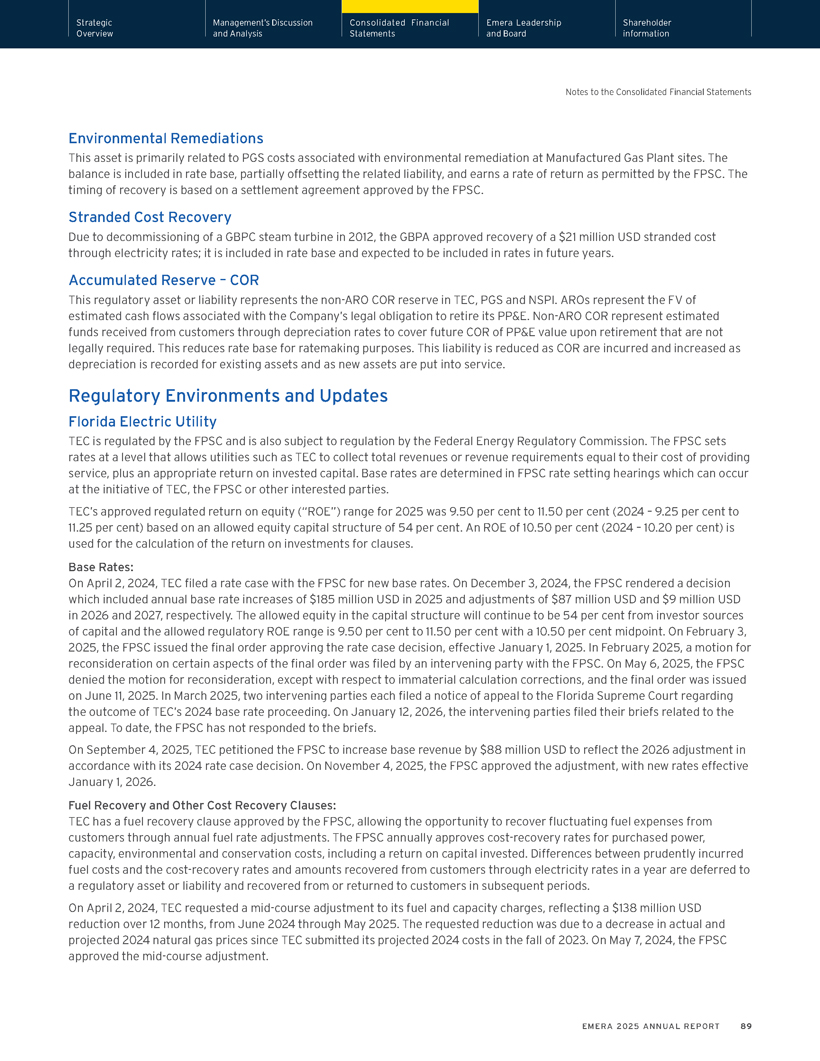
Strategic Management’s Discussion Consolidated Financial Emera Leadership Shareholder Overview and Analysis Statements and Board information Notes to the Consolidated Financial Statements Environmental Remediations This asset is primarily related to PGS costs associated with environmental remediation at Manufactured Gas Plant sites. The balance is included in rate base, partially offsetting the related liability, and earns a rate of return as permitted by the FPSC. The timing of recovery is based on a settlement agreement approved by the FPSC. Stranded Cost Recovery Due to decommissioning of a GBPC steam turbine in 2012, the GBPA approved recovery of a $21 million USD stranded cost through electricity rates; it is included in rate base and expected to be included in rates in future years. Accumulated Reserve – COR This regulatory asset or liability represents the non-ARO COR reserve in TEC, PGS and NSPI. AROs represent the FV of estimated cash flows associated with the Company’s legal obligation to retire its PP&E. Non-ARO COR represent estimated funds received from customers through depreciation rates to cover future COR of PP&E value upon retirement that are not legally required. This reduces rate base for ratemaking purposes. This liability is reduced as COR are incurred and increased as depreciation is recorded for existing assets and as new assets are put into service. Regulatory Environments and Updates Florida Electric Utility TEC is regulated by the FPSC and is also subject to regulation by the Federal Energy Regulatory Commission. The FPSC sets rates at a level that allows utilities such as TEC to collect total revenues or revenue requirements equal to their cost of providing service, plus an appropriate return on invested capital. Base rates are determined in FPSC rate setting hearings which can occur at the initiative of TEC, the FPSC or other interested parties. TEC’s approved regulated return on equity (“ROE”) range for 2025 was 9.50 per cent to 11.50 per cent (2024 – 9.25 per cent to 11.25 per cent) based on an allowed equity capital structure of 54 per cent. An ROE of 10.50 per cent (2024 – 10.20 per cent) is used for the calculation of the return on investments for clauses. Base Rates: On April 2, 2024, TEC filed a rate case with the FPSC for new base rates. On December 3, 2024, the FPSC rendered a decision which included annual base rate increases of $185 million USD in 2025 and adjustments of $87 million USD and $9 million USD in 2026 and 2027, respectively. The allowed equity in the capital structure will continue to be 54 per cent from investor sources of capital and the allowed regulatory ROE range is 9.50 per cent to 11.50 per cent with a 10.50 per cent midpoint. On February 3, 2025, the FPSC issued the final order approving the rate case decision, effective January 1, 2025. In February 2025, a motion for reconsideration on certain aspects of the final order was filed by an intervening party with the FPSC. On May 6, 2025, the FPSC denied the motion for reconsideration, except with respect to immaterial calculation corrections, and the final order was issued on June 11, 2025. In March 2025, two intervening parties each filed a notice of appeal to the Florida Supreme Court regarding the outcome of TEC’s 2024 base rate proceeding. On January 12, 2026, the intervening parties filed their briefs related to the appeal. To date, the FPSC has not responded to the briefs. On September 4, 2025, TEC petitioned the FPSC to increase base revenue by $88 million USD to reflect the 2026 adjustment in accordance with its 2024 rate case decision. On November 4, 2025, the FPSC approved the adjustment, with new rates effective January 1, 2026. Fuel Recovery and Other Cost Recovery Clauses: TEC has a fuel recovery clause approved by the FPSC, allowing the opportunity to recover fluctuating fuel expenses from customers through annual fuel rate adjustments. The FPSC annually approves cost-recovery rates for purchased power, capacity, environmental and conservation costs, including a return on capital invested. Differences between prudently incurred fuel costs and the cost-recovery rates and amounts recovered from customers through electricity rates in a year are deferred to a regulatory asset or liability and recovered from or returned to customers in subsequent periods. On April 2, 2024, TEC requested a mid-course adjustment to its fuel and capacity charges, reflecting a $138 million USD reduction over 12 months, from June 2024 through May 2025. The requested reduction was due to a decrease in actual and projected 2024 natural gas prices since TEC submitted its projected 2024 costs in the fall of 2023. On May 7, 2024, the FPSC approved the mid-course adjustment. EMERA 2025 ANNUAL REPORT 89
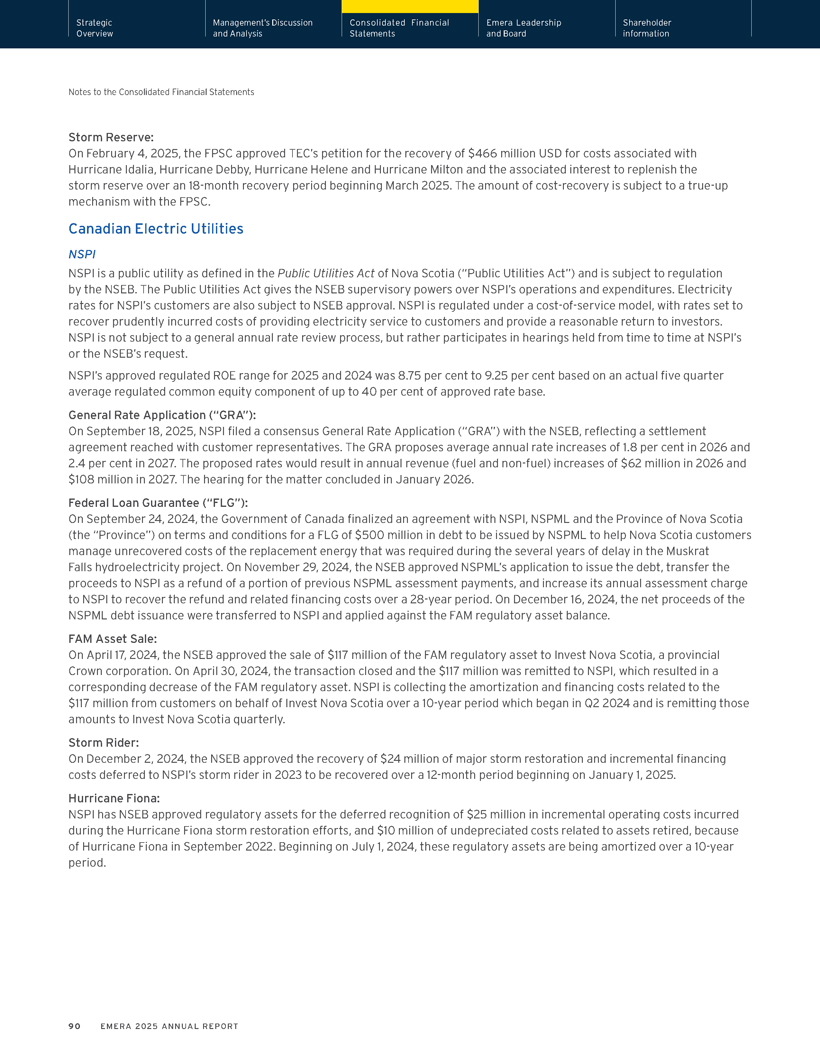
Strategic Management’s Discussion Consolidated Financial Emera Leadership Shareholder Overview and Analysis Statements and Board information Notes to the Consolidated Financial Statements Storm Reserve: On February 4, 2025, the FPSC approved TEC’s petition for the recovery of $466 million USD for costs associated with Hurricane Idalia, Hurricane Debby, Hurricane Helene and Hurricane Milton and the associated interest to replenish the storm reserve over an 18-month recovery period beginning March 2025. The amount of cost-recovery is subject to a true-up mechanism with the FPSC. Canadian Electric Utilities NSPI NSPI is a public utility as defined in the Public Utilities Act of Nova Scotia (“Public Utilities Act”) and is subject to regulation by the NSEB. The Public Utilities Act gives the NSEB supervisory powers over NSPI’s operations and expenditures. Electricity rates for NSPI’s customers are also subject to NSEB approval. NSPI is regulated under a cost-of-service model, with rates set to recover prudently incurred costs of providing electricity service to customers and provide a reasonable return to investors. NSPI is not subject to a general annual rate review process, but rather participates in hearings held from time to time at NSPI’s or the NSEB’s request. NSPI’s approved regulated ROE range for 2025 and 2024 was 8.75 per cent to 9.25 per cent based on an actual five quarter average regulated common equity component of up to 40 per cent of approved rate base. General Rate Application (“GRA”): On September 18, 2025, NSPI filed a consensus General Rate Application (“GRA”) with the NSEB, reflecting a settlement agreement reached with customer representatives. The GRA proposes average annual rate increases of 1.8 per cent in 2026 and 2.4 per cent in 2027. The proposed rates would result in annual revenue (fuel and non-fuel) increases of $62 million in 2026 and $108 million in 2027. The hearing for the matter concluded in January 2026. Federal Loan Guarantee (“FLG”): On September 24, 2024, the Government of Canada finalized an agreement with NSPI, NSPML and the Province of Nova Scotia (the “Province”) on terms and conditions for a FLG of $500 million in debt to be issued by NSPML to help Nova Scotia customers manage unrecovered costs of the replacement energy that was required during the several years of delay in the Muskrat Falls hydroelectricity project. On November 29, 2024, the NSEB approved NSPML’s application to issue the debt, transfer the proceeds to NSPI as a refund of a portion of previous NSPML assessment payments, and increase its annual assessment charge to NSPI to recover the refund and related financing costs over a 28-year period. On December 16, 2024, the net proceeds of the NSPML debt issuance were transferred to NSPI and applied against the FAM regulatory asset balance. FAM Asset Sale: On April 17, 2024, the NSEB approved the sale of $117 million of the FAM regulatory asset to Invest Nova Scotia, a provincial Crown corporation. On April 30, 2024, the transaction closed and the $117 million was remitted to NSPI, which resulted in a corresponding decrease of the FAM regulatory asset. NSPI is collecting the amortization and financing costs related to the $117 million from customers on behalf of Invest Nova Scotia over a 10-year period which began in Q2 2024 and is remitting those amounts to Invest Nova Scotia quarterly. Storm Rider: On December 2, 2024, the NSEB approved the recovery of $24 million of major storm restoration and incremental financing costs deferred to NSPI’s storm rider in 2023 to be recovered over a 12-month period beginning on January 1, 2025. Hurricane Fiona: NSPI has NSEB approved regulatory assets for the deferred recognition of $25 million in incremental operating costs incurred during the Hurricane Fiona storm restoration efforts, and $10 million of undepreciated costs related to assets retired, because of Hurricane Fiona in September 2022. Beginning on July 1, 2024, these regulatory assets are being amortized over a 10-year period. 90 EMERA 2025 ANNUAL REPORT
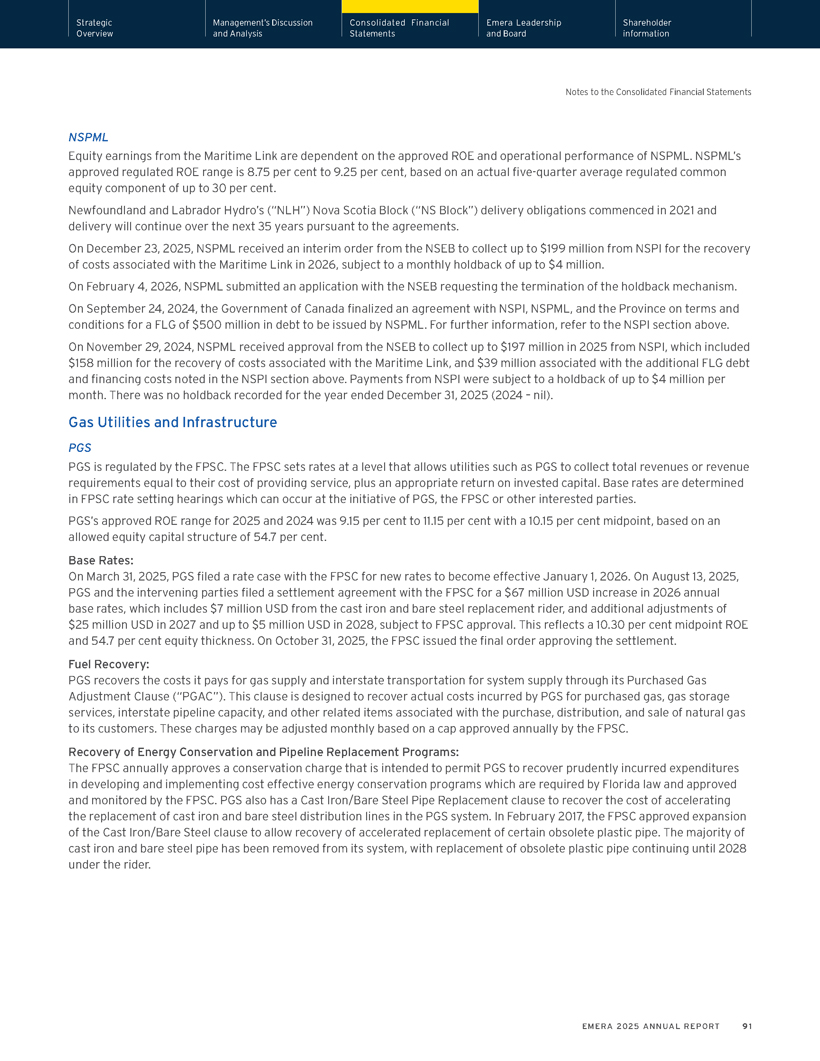
Strategic Management’s Discussion Consolidated Financial Emera Leadership Shareholder Overview and Analysis Statements and Board information Notes to the Consolidated Financial Statements NSPML Equity earnings from the Maritime Link are dependent on the approved ROE and operational performance of NSPML. NSPML’s approved regulated ROE range is 8.75 per cent to 9.25 per cent, based on an actual five-quarter average regulated common equity component of up to 30 per cent. Newfoundland and Labrador Hydro’s (“NLH”) Nova Scotia Block (“NS Block”) delivery obligations commenced in 2021 and delivery will continue over the next 35 years pursuant to the agreements. On December 23, 2025, NSPML received an interim order from the NSEB to collect up to $199 million from NSPI for the recovery of costs associated with the Maritime Link in 2026, subject to a monthly holdback of up to $4 million. On February 4, 2026, NSPML submitted an application with the NSEB requesting the termination of the holdback mechanism. On September 24, 2024, the Government of Canada finalized an agreement with NSPI, NSPML, and the Province on terms and conditions for a FLG of $500 million in debt to be issued by NSPML. For further information, refer to the NSPI section above. On November 29, 2024, NSPML received approval from the NSEB to collect up to $197 million in 2025 from NSPI, which included $158 million for the recovery of costs associated with the Maritime Link, and $39 million associated with the additional FLG debt and financing costs noted in the NSPI section above. Payments from NSPI were subject to a holdback of up to $4 million per month. There was no holdback recorded for the year ended December 31, 2025 (2024 – nil). Gas Utilities and Infrastructure PGS PGS is regulated by the FPSC. The FPSC sets rates at a level that allows utilities such as PGS to collect total revenues or revenue requirements equal to their cost of providing service, plus an appropriate return on invested capital. Base rates are determined in FPSC rate setting hearings which can occur at the initiative of PGS, the FPSC or other interested parties. PGS’s approved ROE range for 2025 and 2024 was 9.15 per cent to 11.15 per cent with a 10.15 per cent midpoint, based on an allowed equity capital structure of 54.7 per cent. Base Rates: On March 31, 2025, PGS filed a rate case with the FPSC for new rates to become effective January 1, 2026. On August 13, 2025, PGS and the intervening parties filed a settlement agreement with the FPSC for a $67 million USD increase in 2026 annual base rates, which includes $7 million USD from the cast iron and bare steel replacement rider, and additional adjustments of $25 million USD in 2027 and up to $5 million USD in 2028, subject to FPSC approval. This reflects a 10.30 per cent midpoint ROE and 54.7 per cent equity thickness. On October 31, 2025, the FPSC issued the final order approving the settlement. Fuel Recovery: PGS recovers the costs it pays for gas supply and interstate transportation for system supply through its Purchased Gas Adjustment Clause (“PGAC”). This clause is designed to recover actual costs incurred by PGS for purchased gas, gas storage services, interstate pipeline capacity, and other related items associated with the purchase, distribution, and sale of natural gas to its customers. These charges may be adjusted monthly based on a cap approved annually by the FPSC. Recovery of Energy Conservation and Pipeline Replacement Programs: The FPSC annually approves a conservation charge that is intended to permit PGS to recover prudently incurred expenditures in developing and implementing cost effective energy conservation programs which are required by Florida law and approved and monitored by the FPSC. PGS also has a Cast Iron/Bare Steel Pipe Replacement clause to recover the cost of accelerating the replacement of cast iron and bare steel distribution lines in the PGS system. In February 2017, the FPSC approved expansion of the Cast Iron/Bare Steel clause to allow recovery of accelerated replacement of certain obsolete plastic pipe. The majority of cast iron and bare steel pipe has been removed from its system, with replacement of obsolete plastic pipe continuing until 2028 under the rider. EMERA 2025 ANNUAL REPORT 91
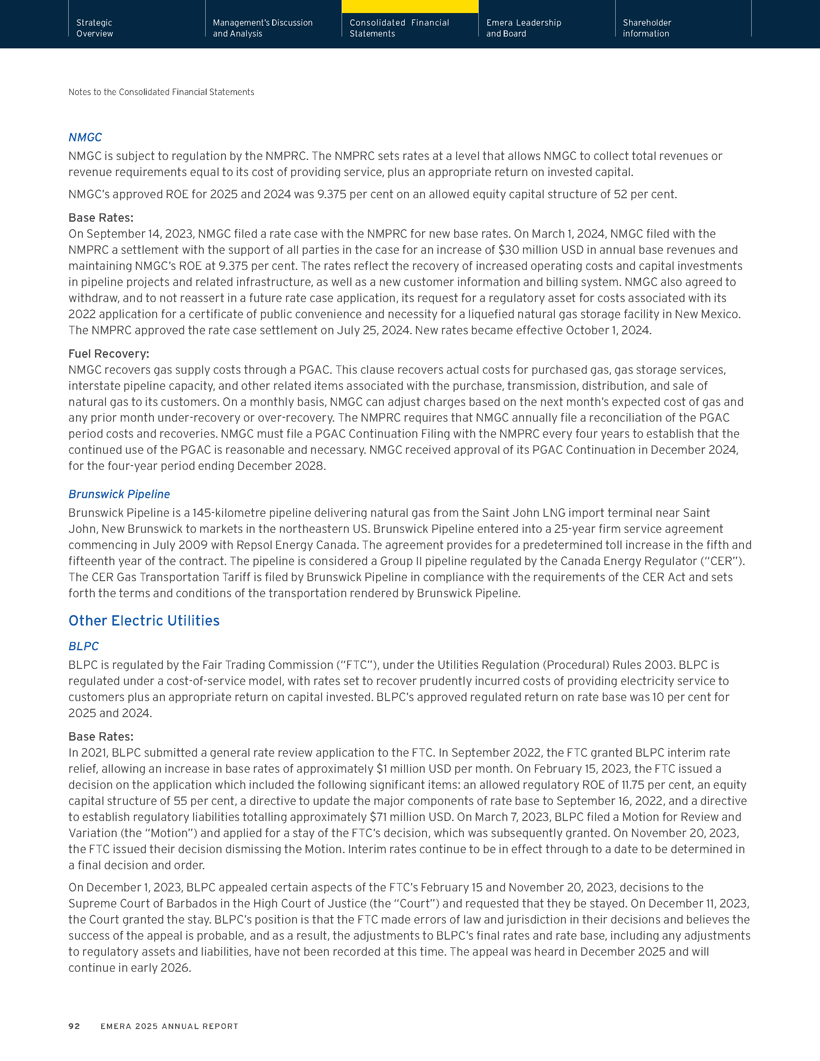
Strategic Management’s Discussion Consolidated Financial Emera Leadership Shareholder Overview and Analysis Statements and Board information Notes to the Consolidated Financial Statements NMGC NMGC is subject to regulation by the NMPRC. The NMPRC sets rates at a level that allows NMGC to collect total revenues or revenue requirements equal to its cost of providing service, plus an appropriate return on invested capital. NMGC’s approved ROE for 2025 and 2024 was 9.375 per cent on an allowed equity capital structure of 52 per cent. Base Rates: On September 14, 2023, NMGC filed a rate case with the NMPRC for new base rates. On March 1, 2024, NMGC filed with the NMPRC a settlement with the support of all parties in the case for an increase of $30 million USD in annual base revenues and maintaining NMGC’s ROE at 9.375 per cent. The rates reflect the recovery of increased operating costs and capital investments in pipeline projects and related infrastructure, as well as a new customer information and billing system. NMGC also agreed to withdraw, and to not reassert in a future rate case application, its request for a regulatory asset for costs associated with its 2022 application for a certificate of public convenience and necessity for a liquefied natural gas storage facility in New Mexico. The NMPRC approved the rate case settlement on July 25, 2024. New rates became effective October 1, 2024. Fuel Recovery: NMGC recovers gas supply costs through a PGAC. This clause recovers actual costs for purchased gas, gas storage services, interstate pipeline capacity, and other related items associated with the purchase, transmission, distribution, and sale of natural gas to its customers. On a monthly basis, NMGC can adjust charges based on the next month’s expected cost of gas and any prior month under-recovery or over-recovery. The NMPRC requires that NMGC annually file a reconciliation of the PGAC period costs and recoveries. NMGC must file a PGAC Continuation Filing with the NMPRC every four years to establish that the continued use of the PGAC is reasonable and necessary. NMGC received approval of its PGAC Continuation in December 2024, for the four-year period ending December 2028. Brunswick Pipeline Brunswick Pipeline is a 145-kilometre pipeline delivering natural gas from the Saint John LNG import terminal near Saint John, New Brunswick to markets in the northeastern US. Brunswick Pipeline entered into a 25-year firm service agreement commencing in July 2009 with Repsol Energy Canada. The agreement provides for a predetermined toll increase in the fifth and fifteenth year of the contract. The pipeline is considered a Group II pipeline regulated by the Canada Energy Regulator (“CER”). The CER Gas Transportation Tariff is filed by Brunswick Pipeline in compliance with the requirements of the CER Act and sets forth the terms and conditions of the transportation rendered by Brunswick Pipeline. Other Electric Utilities BLPC BLPC is regulated by the Fair Trading Commission (“FTC”), under the Utilities Regulation (Procedural) Rules 2003. BLPC is regulated under a cost-of-service model, with rates set to recover prudently incurred costs of providing electricity service to customers plus an appropriate return on capital invested. BLPC’s approved regulated return on rate base was 10 per cent for 2025 and 2024. Base Rates: In 2021, BLPC submitted a general rate review application to the FTC. In September 2022, the FTC granted BLPC interim rate relief, allowing an increase in base rates of approximately $1 million USD per month. On February 15, 2023, the FTC issued a decision on the application which included the following significant items: an allowed regulatory ROE of 11.75 per cent, an equity capital structure of 55 per cent, a directive to update the major components of rate base to September 16, 2022, and a directive to establish regulatory liabilities totalling approximately $71 million USD. On March 7, 2023, BLPC filed a Motion for Review and Variation (the “Motion”) and applied for a stay of the FTC’s decision, which was subsequently granted. On November 20, 2023, the FTC issued their decision dismissing the Motion. Interim rates continue to be in effect through to a date to be determined in a final decision and order. On December 1, 2023, BLPC appealed certain aspects of the FTC’s February 15 and November 20, 2023, decisions to the Supreme Court of Barbados in the High Court of Justice (the “Court”) and requested that they be stayed. On December 11, 2023, the Court granted the stay. BLPC’s position is that the FTC made errors of law and jurisdiction in their decisions and believes the success of the appeal is probable, and as a result, the adjustments to BLPC’s final rates and rate base, including any adjustments to regulatory assets and liabilities, have not been recorded at this time. The appeal was heard in December 2025 and will continue in early 2026. 92 EMERA 2025 ANNUAL REPORT
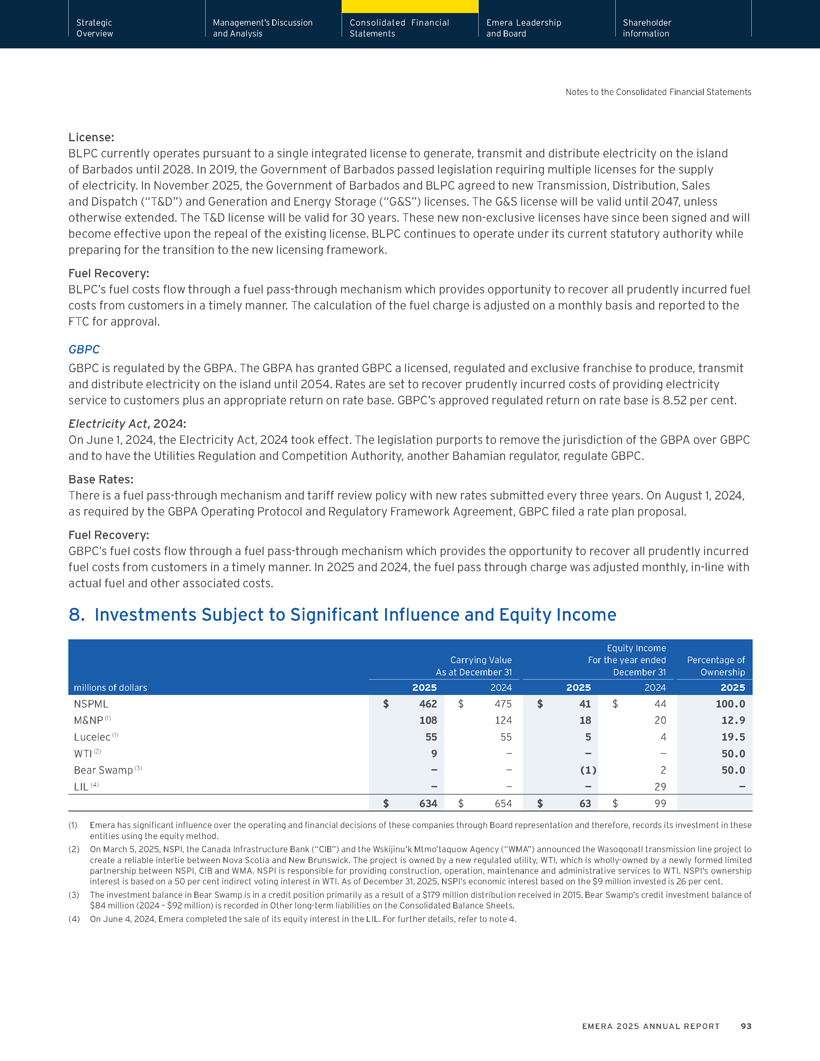
Strategic Management’s Discussion Consolidated Financial Emera Leadership Shareholder Overview and Analysis Statements and Board information Notes to the Consolidated Financial Statements License: BLPC currently operates pursuant to a single integrated license to generate, transmit and distribute electricity on the island of Barbados until 2028. In 2019, the Government of Barbados passed legislation requiring multiple licenses for the supply of electricity. In November 2025, the Government of Barbados and BLPC agreed to new Transmission, Distribution, Sales and Dispatch (“T&D”) and Generation and Energy Storage (“G&S”) licenses. The G&S license will be valid until 2047, unless otherwise extended. The T&D license will be valid for 30 years. These new non-exclusive licenses have since been signed and will become effective upon the repeal of the existing license. BLPC continues to operate under its current statutory authority while preparing for the transition to the new licensing framework. Fuel Recovery: BLPC’s fuel costs flow through a fuel pass-through mechanism which provides opportunity to recover all prudently incurred fuel costs from customers in a timely manner. The calculation of the fuel charge is adjusted on a monthly basis and reported to the FTC for approval. GBPC GBPC is regulated by the GBPA. The GBPA has granted GBPC a licensed, regulated and exclusive franchise to produce, transmit and distribute electricity on the island until 2054. Rates are set to recover prudently incurred costs of providing electricity service to customers plus an appropriate return on rate base. GBPC’s approved regulated return on rate base is 8.52 per cent. Electricity Act, 2024: On June 1, 2024, the Electricity Act, 2024 took effect. The legislation purports to remove the jurisdiction of the GBPA over GBPC and to have the Utilities Regulation and Competition Authority, another Bahamian regulator, regulate GBPC. Base Rates: There is a fuel pass-through mechanism and tariff review policy with new rates submitted every three years. On August 1, 2024, as required by the GBPA Operating Protocol and Regulatory Framework Agreement, GBPC filed a rate plan proposal. Fuel Recovery: GBPC’s fuel costs flow through a fuel pass-through mechanism which provides the opportunity to recover all prudently incurred fuel costs from customers in a timely manner. In 2025 and 2024, the fuel pass through charge was adjusted monthly, in-line with actual fuel and other associated costs. 8. Investments Subject to Significant Influence and Equity Income Equity Income Carrying Value For the year ended Percentage of As at December 31 December 31 Ownership millions of dollars 2025 2024 2025 2024 2025 NSPML $ 462 $ 475 $ 41 $ 44 100.0 M&NP (1) 108 124 18 20 12.9 Lucelec (1) 55 55 5 4 19.5 WTI (2) 9 — — — 50.0 Bear Swamp (3) — — (1) 2 50.0 LIL (4) — — — 29 —$ 634 $ 654 $ 63 $ 99 (1) Emera has significant influence over the operating and financial decisions of these companies through Board representation and therefore, records its investment in these entities using the equity method. (2) On March 5, 2025, NSPI, the Canada Infrastructure Bank (“CIB”) and the Wskijinu’k Mtmo’taquow Agency (“WMA”) announced the Wasoqonatl transmission line project to create a reliable intertie between Nova Scotia and New Brunswick. The project is owned by a new regulated utility, WTI, which is wholly-owned by a newly formed limited partnership between NSPI, CIB and WMA. NSPI is responsible for providing construction, operation, maintenance and administrative services to WTI. NSPI’s ownership interest is based on a 50 per cent indirect voting interest in WTI. As of December 31, 2025, NSPI’s economic interest based on the $9 million invested is 26 per cent. (3) The investment balance in Bear Swamp is in a credit position primarily as a result of a $179 million distribution received in 2015. Bear Swamp’s credit investment balance of $84 million (2024 – $92 million) is recorded in Other long-term liabilities on the Consolidated Balance Sheets. (4) On June 4, 2024, Emera completed the sale of its equity interest in the LIL. For further details, refer to note 4. EMERA 2025 ANNUAL REPORT 93
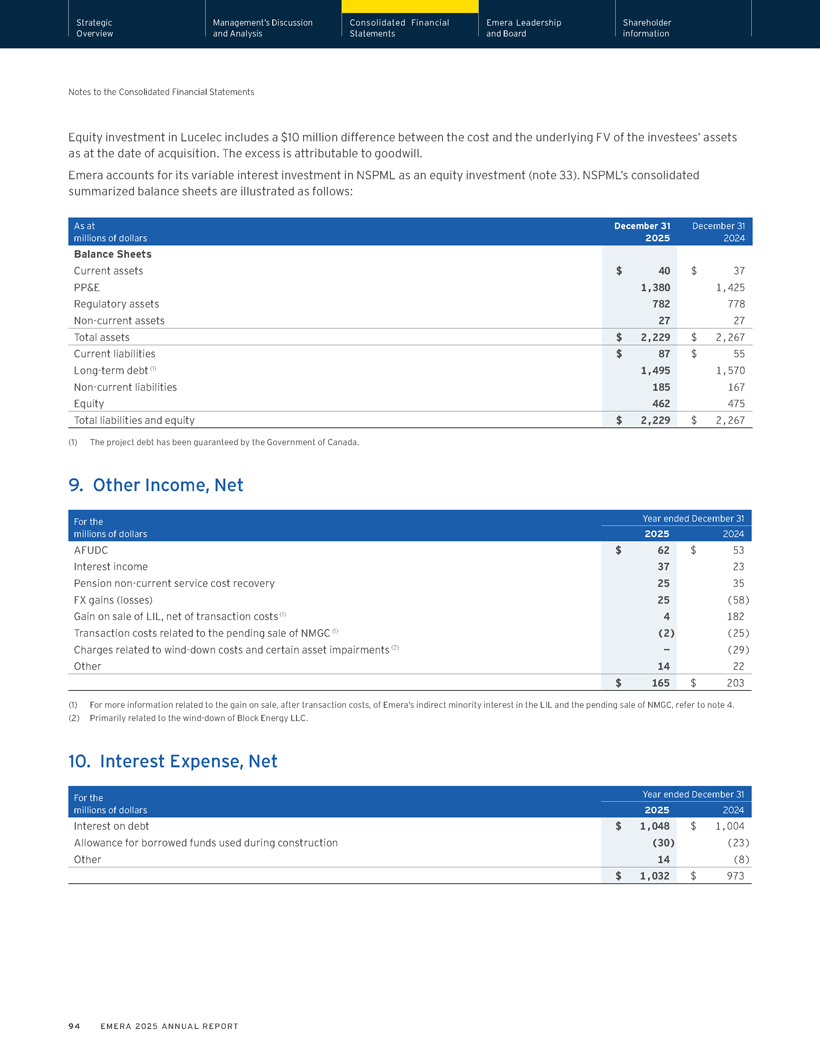
Strategic Management’s Discussion Consolidated Financial Emera Leadership Shareholder Overview and Analysis Statements and Board information Notes to the Consolidated Financial Statements Equity investment in Lucelec includes a $10 million difference between the cost and the underlying FV of the investees’ assets as at the date of acquisition. The excess is attributable to goodwill. Emera accounts for its variable interest investment in NSPML as an equity investment (note 33). NSPML’s consolidated summarized balance sheets are illustrated as follows: As at December 31 December 31 millions of dollars 2025 2024 Balance Sheets Current assets $ 40 $ 37 PP&E 1,380 1,425 Regulatory assets 782 778 Non-current assets 27 27 Total assets $ 2,229 $ 2,267 Current liabilities $ 87 $ 55 Long-term debt (1) 1,495 1,570 Non-current liabilities 185 167 Equity 462 475 Total liabilities and equity $ 2,229 $ 2,267 (1) The project debt has been guaranteed by the Government of Canada. 9. Other Income, Net For the Year ended December 31 millions of dollars 2025 2024 AFUDC $ 62 $ 53 Interest income 37 23 Pension non-current service cost recovery 25 35 FX gains (losses) 25 (58) Gain on sale of LIL, net of transaction costs (1) 4 182 Transaction costs related to the pending sale of NMGC (1) (2) (25) Charges related to wind-down costs and certain asset impairments (2) — (29) Other 14 22 $ 165 $ 203 (1) For more information related to the gain on sale, after transaction costs, of Emera’s indirect minority interest in the LIL and the pending sale of NMGC, refer to note 4. (2) Primarily related to the wind-down of Block Energy LLC. 10. Interest Expense, Net For the Year ended December 31 millions of dollars 2025 2024 Interest on debt $ 1,048 $ 1,004 Allowance for borrowed funds used during construction (30) (23) Other 14 (8) $ 1,032 $ 973 94 EMERA 2025 ANNUAL REPORT
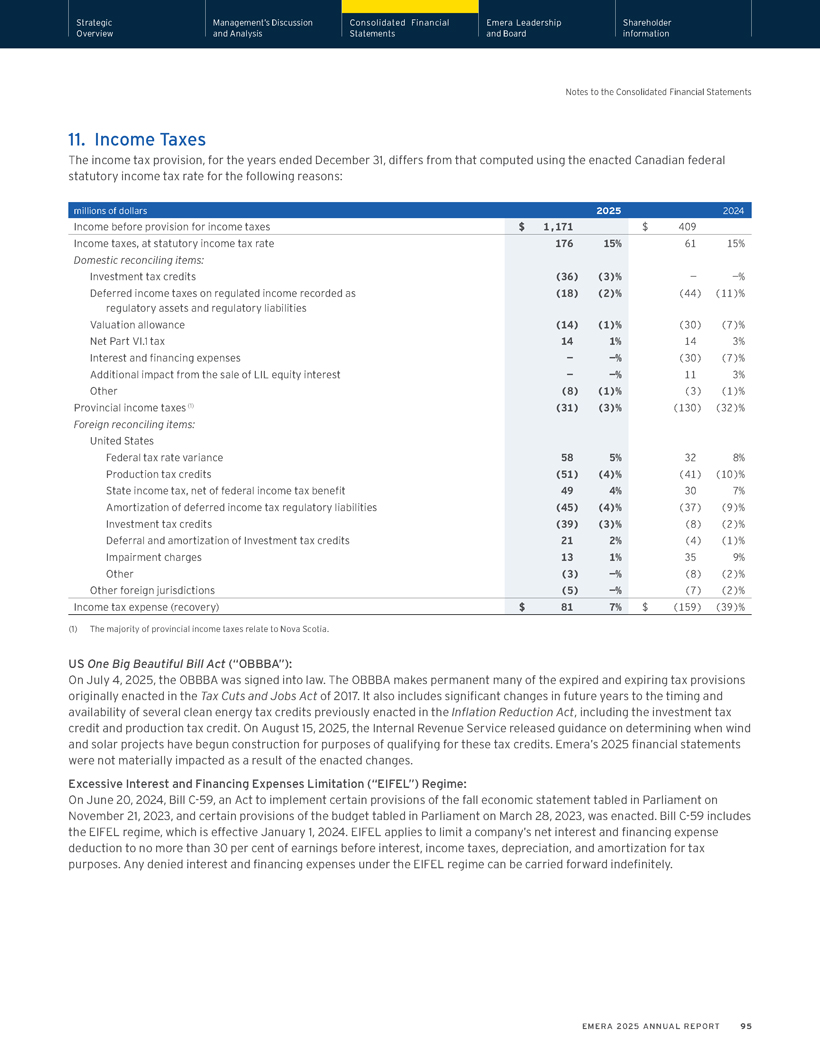
Strategic Management’s Discussion Consolidated Financial Emera Leadership Shareholder Overview and Analysis Statements and Board information Notes to the Consolidated Financial Statements 11. Income Taxes The income tax provision, for the years ended December 31, differs from that computed using the enacted Canadian federal statutory income tax rate for the following reasons: millions of dollars 2025 2024 Income before provision for income taxes $ 1,171 $ 409 Income taxes, at statutory income tax rate 176 15% 61 15% Domestic reconciling items: Investment tax credits (36) (3)% — —% Deferred income taxes on regulated income recorded as (18) (2)% (44) (11)% regulatory assets and regulatory liabilities Valuation allowance (14) (1)% (30) (7)% Net Part VI.1 tax 14 1% 14 3% Interest and financing expenses — —% (30) (7)% Additional impact from the sale of LIL equity interest — —% 11 3% Other (8) (1)% (3) (1)% Provincial income taxes (1) (31) (3)% (130) (32)% Foreign reconciling items: United States Federal tax rate variance 58 5% 32 8% Production tax credits (51) (4)% (41) (10)% State income tax, net of federal income tax benefit 49 4% 30 7% Amortization of deferred income tax regulatory liabilities (45) (4)% (37) (9)% Investment tax credits (39) (3)% (8) (2)% Deferral and amortization of Investment tax credits 21 2% (4) (1)% Impairment charges 13 1% 35 9% Other (3) —% (8) (2)% Other foreign jurisdictions (5) —% (7) (2)% Income tax expense (recovery) $ 81 7% $ (159) (39)% (1) The majority of provincial income taxes relate to Nova Scotia. US One Big Beautiful Bill Act (“OBBBA”): On July 4, 2025, the OBBBA was signed into law. The OBBBA makes permanent many of the expired and expiring tax provisions originally enacted in the Tax Cuts and Jobs Act of 2017. It also includes significant changes in future years to the timing and availability of several clean energy tax credits previously enacted in the Inflation Reduction Act, including the investment tax credit and production tax credit. On August 15, 2025, the Internal Revenue Service released guidance on determining when wind and solar projects have begun construction for purposes of qualifying for these tax credits. Emera’s 2025 financial statements were not materially impacted as a result of the enacted changes. Excessive Interest and Financing Expenses Limitation (“EIFEL”) Regime: On June 20, 2024, Bill C-59, an Act to implement certain provisions of the fall economic statement tabled in Parliament on November 21, 2023, and certain provisions of the budget tabled in Parliament on March 28, 2023, was enacted. Bill C-59 includes the EIFEL regime, which is effective January 1, 2024. EIFEL applies to limit a company’s net interest and financing expense deduction to no more than 30 per cent of earnings before interest, income taxes, depreciation, and amortization for tax purposes. Any denied interest and financing expenses under the EIFEL regime can be carried forward indefinitely. EMERA 2025 ANNUAL REPORT 95
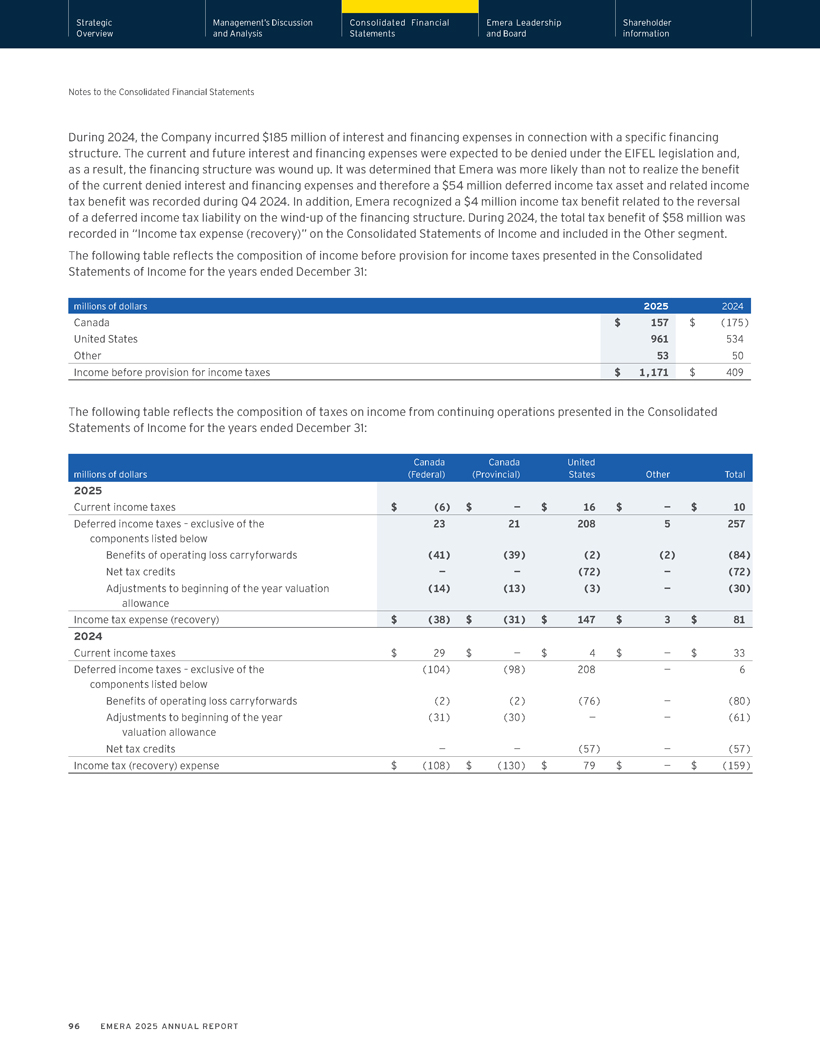
Strategic Management’s Discussion Consolidated Financial Emera Leadership Shareholder Overview and Analysis Statements and Board information Notes to the Consolidated Financial Statements During 2024, the Company incurred $185 million of interest and financing expenses in connection with a specific financing structure. The current and future interest and financing expenses were expected to be denied under the EIFEL legislation and, as a result, the financing structure was wound up. It was determined that Emera was more likely than not to realize the benefit of the current denied interest and financing expenses and therefore a $54 million deferred income tax asset and related income tax benefit was recorded during Q4 2024. In addition, Emera recognized a $4 million income tax benefit related to the reversal of a deferred income tax liability on the wind-up of the financing structure. During 2024, the total tax benefit of $58 million was recorded in “Income tax expense (recovery)” on the Consolidated Statements of Income and included in the Other segment. The following table reflects the composition of income before provision for income taxes presented in the Consolidated Statements of Income for the years ended December 31: millions of dollars 2025 2024 Canada $ 157 $ (175) United States 961 534 Other 53 50 Income before provision for income taxes $ 1,171 $ 409 The following table reflects the composition of taxes on income from continuing operations presented in the Consolidated Statements of Income for the years ended December 31: Canada Canada United millions of dollars (Federal) (Provincial) States Other Total 2025 Current income taxes $ (6) $ — $ 16 $ — $ 10 Deferred income taxes – exclusive of the 23 21 208 5 257 components listed below Benefits of operating loss carryforwards (41) (39) (2) (2) (84) Net tax credits — — (72) — (72) Adjustments to beginning of the year valuation (14) (13) (3) — (30) allowance Income tax expense (recovery) $ (38) $ (31) $ 147 $ 3 $ 81 2024 Current income taxes $ 29 $ — $ 4 $ — $ 33 Deferred income taxes – exclusive of the (104) (98) 208 — 6 components listed below Benefits of operating loss carryforwards (2) (2) (76) — (80) Adjustments to beginning of the year (31) (30) — — (61) valuation allowance Net tax credits — — (57) — (57) Income tax (recovery) expense $ (108) $ (130) $ 79 $ — $ (159) 96 EMERA 2025 ANNUAL REPORT
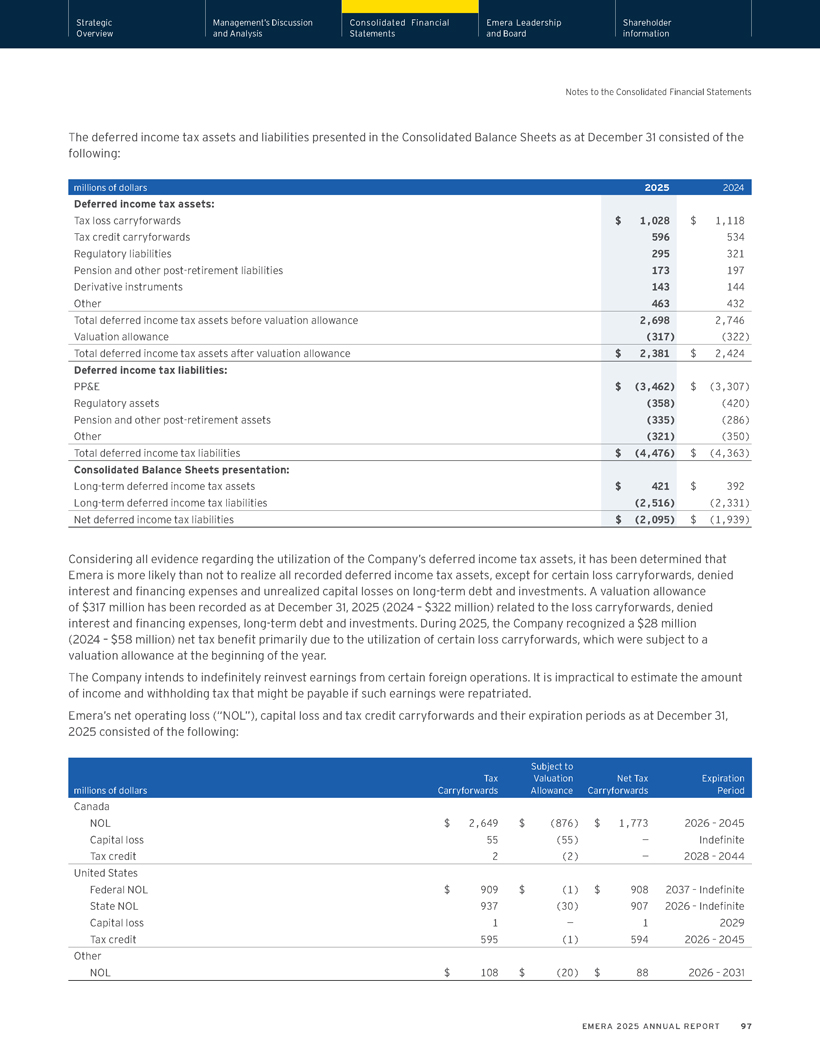
Strategic Management’s Discussion Consolidated Financial Emera Leadership Shareholder Overview and Analysis Statements and Board information Notes to the Consolidated Financial Statements The deferred income tax assets and liabilities presented in the Consolidated Balance Sheets as at December 31 consisted of the following: millions of dollars 2025 2024 Deferred income tax assets: Tax loss carryforwards $ 1,028 $ 1,118 Tax credit carryforwards 596 534 Regulatory liabilities 295 321 Pension and other post-retirement liabilities 173 197 Derivative instruments 143 144 Other 463 432 Total deferred income tax assets before valuation allowance 2,698 2,746 Valuation allowance (317) (322) Total deferred income tax assets after valuation allowance $ 2,381 $ 2,424 Deferred income tax liabilities: PP&E $ (3,462) $ (3,307) Regulatory assets (358) (420) Pension and other post-retirement assets (335) (286) Other (321) (350) Total deferred income tax liabilities $ (4,476) $ (4,363) Consolidated Balance Sheets presentation: Long-term deferred income tax assets $ 421 $ 392 Long-term deferred income tax liabilities (2,516) (2,331) Net deferred income tax liabilities $ (2,095) $ (1,939) Considering all evidence regarding the utilization of the Company’s deferred income tax assets, it has been determined that Emera is more likely than not to realize all recorded deferred income tax assets, except for certain loss carryforwards, denied interest and financing expenses and unrealized capital losses on long-term debt and investments. A valuation allowance of $317 million has been recorded as at December 31, 2025 (2024 – $322 million) related to the loss carryforwards, denied interest and financing expenses, long-term debt and investments. During 2025, the Company recognized a $28 million (2024 – $58 million) net tax benefit primarily due to the utilization of certain loss carryforwards, which were subject to a valuation allowance at the beginning of the year. The Company intends to indefinitely reinvest earnings from certain foreign operations. It is impractical to estimate the amount of income and withholding tax that might be payable if such earnings were repatriated. Emera’s net operating loss (“NOL”), capital loss and tax credit carryforwards and their expiration periods as at December 31, 2025 consisted of the following: Subject to Tax Valuation Net Tax Expiration millions of dollars Carryforwards Allowance Carryforwards Period Canada NOL $ 2,649 $ (876) $ 1,773 2026 – 2045 Capital loss 55 (55) — Indefinite Tax credit 2 (2) — 2028 – 2044 United States Federal NOL $ 909 $ (1) $ 908 2037 – Indefinite State NOL 937 (30) 907 2026 – Indefinite Capital loss 1 — 1 2029 Tax credit 595 (1) 594 2026 – 2045 Other NOL $ 108 $ (20) $ 88 2026 – 2031 EMERA 2025 ANNUAL REPORT 97
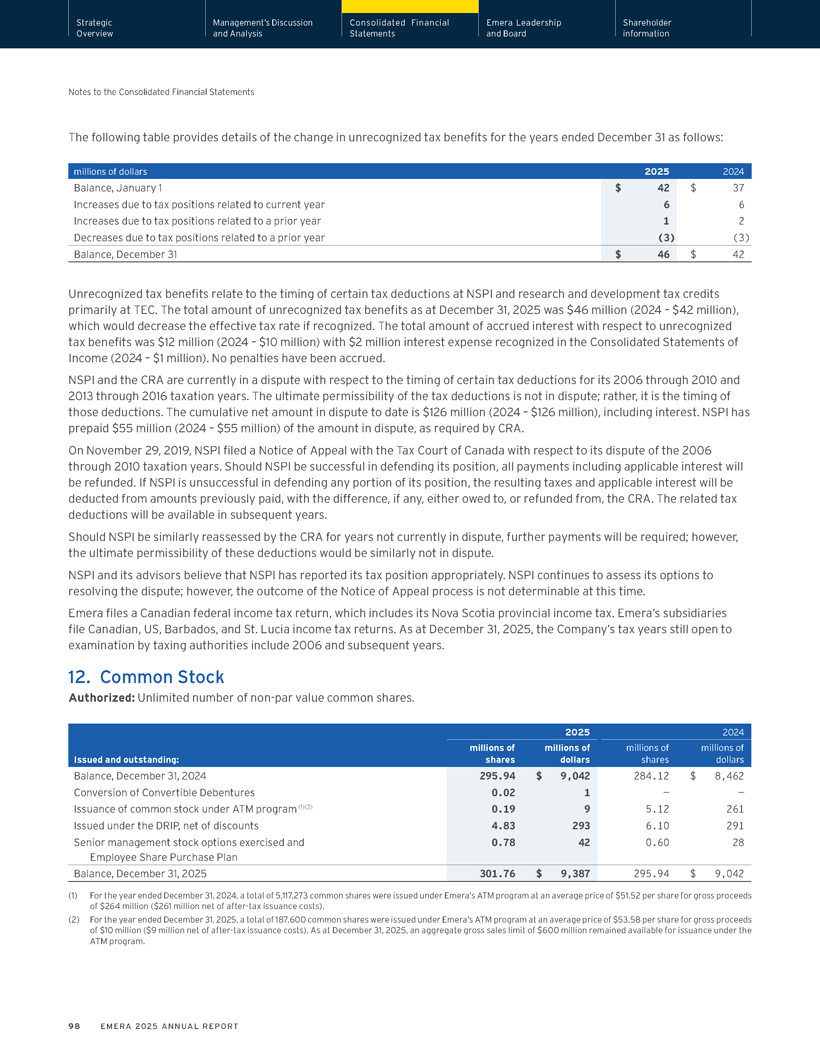
Strategic Management’s Discussion Consolidated Financial Emera Leadership Shareholder Overview and Analysis Statements and Board information Notes to the Consolidated Financial Statements The following table provides details of the change in unrecognized tax benefits for the years ended December 31 as follows: millions of dollars 2025 2024 Balance, January 1 $ 42 $ 37 Increases due to tax positions related to current year 6 6 Increases due to tax positions related to a prior year 1 2 Decreases due to tax positions related to a prior year (3) (3) Balance, December 31 $ 46 $ 42 Unrecognized tax benefits relate to the timing of certain tax deductions at NSPI and research and development tax credits primarily at TEC. The total amount of unrecognized tax benefits as at December 31, 2025 was $46 million (2024 – $42 million), which would decrease the effective tax rate if recognized. The total amount of accrued interest with respect to unrecognized tax benefits was $12 million (2024 – $10 million) with $2 million interest expense recognized in the Consolidated Statements of Income (2024 – $1 million). No penalties have been accrued. NSPI and the CRA are currently in a dispute with respect to the timing of certain tax deductions for its 2006 through 2010 and 2013 through 2016 taxation years. The ultimate permissibility of the tax deductions is not in dispute; rather, it is the timing of those deductions. The cumulative net amount in dispute to date is $126 million (2024 – $126 million), including interest. NSPI has prepaid $55 million (2024 – $55 million) of the amount in dispute, as required by CRA. On November 29, 2019, NSPI filed a Notice of Appeal with the Tax Court of Canada with respect to its dispute of the 2006 through 2010 taxation years. Should NSPI be successful in defending its position, all payments including applicable interest will be refunded. If NSPI is unsuccessful in defending any portion of its position, the resulting taxes and applicable interest will be deducted from amounts previously paid, with the difference, if any, either owed to, or refunded from, the CRA. The related tax deductions will be available in subsequent years. Should NSPI be similarly reassessed by the CRA for years not currently in dispute, further payments will be required; however, the ultimate permissibility of these deductions would be similarly not in dispute. NSPI and its advisors believe that NSPI has reported its tax position appropriately. NSPI continues to assess its options to resolving the dispute; however, the outcome of the Notice of Appeal process is not determinable at this time. Emera files a Canadian federal income tax return, which includes its Nova Scotia provincial income tax. Emera’s subsidiaries file Canadian, US, Barbados, and St. Lucia income tax returns. As at December 31, 2025, the Company’s tax years still open to examination by taxing authorities include 2006 and subsequent years. 12. Common Stock Authorized: Unlimited number of non-par value common shares. 2025 2024 millions of millions of millions of millions of Issued and outstanding: shares dollars shares dollars Balance, December 31, 2024 295.94 $ 9,042 284.12 $ 8,462 Conversion of Convertible Debentures 0.02 1 — —Issuance of common stock under ATM program (1)(2) 0.19 9 5.12 261 Issued under the DRIP, net of discounts 4.83 293 6.10 291 Senior management stock options exercised and 0.78 42 0.60 28 Employee Share Purchase Plan Balance, December 31, 2025 301.76 $ 9,387 295.94 $ 9,042 (1) For the year ended December 31, 2024, a total of 5,117,273 common shares were issued under Emera’s ATM program at an average price of $51.52 per share for gross proceeds of $264 million ($261 million net of after-tax issuance costs). (2) For the year ended December 31, 2025, a total of 187,600 common shares were issued under Emera’s ATM program at an average price of $53.58 per share for gross proceeds of $10 million ($9 million net of after-tax issuance costs). As at December 31, 2025, an aggregate gross sales limit of $600 million remained available for issuance under the ATM program. 98 EMERA 2025 ANNUAL REPORT
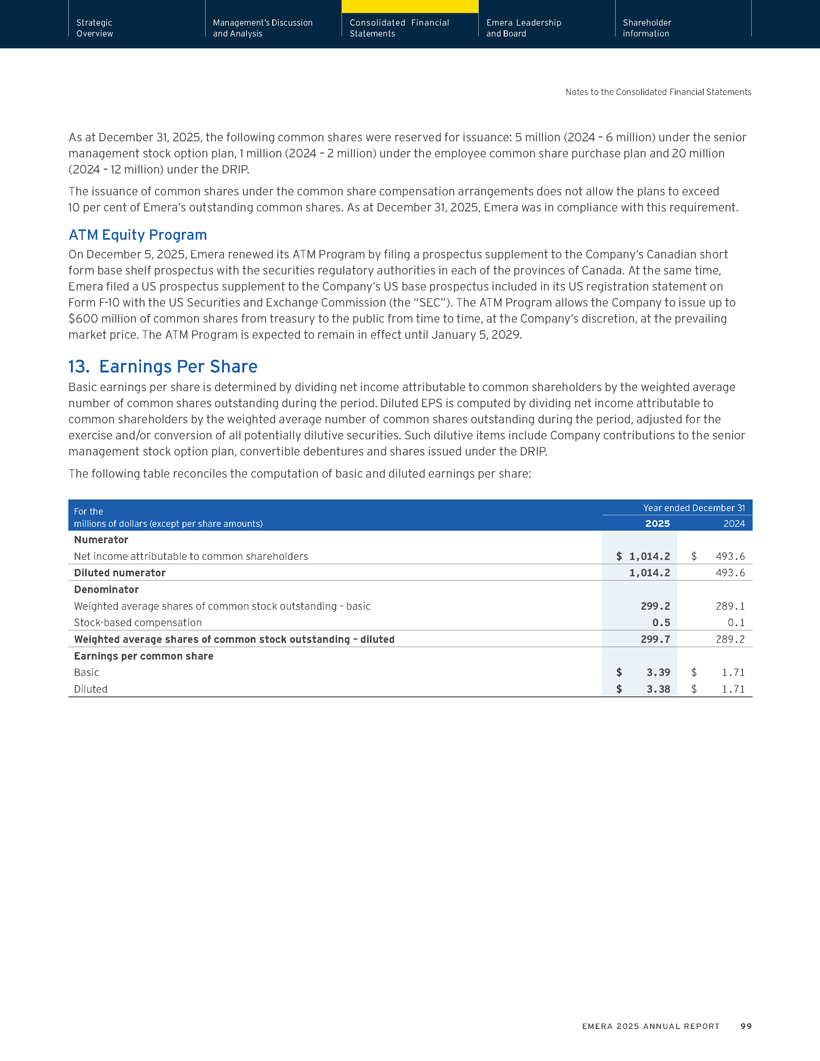
Strategic Management’s Discussion Consolidated Financial Emera Leadership Shareholder Overview and Analysis Statements and Board information Notes to the Consolidated Financial Statements As at December 31, 2025, the following common shares were reserved for issuance: 5 million (2024 – 6 million) under the senior management stock option plan, 1 million (2024 – 2 million) under the employee common share purchase plan and 20 million (2024 – 12 million) under the DRIP. The issuance of common shares under the common share compensation arrangements does not allow the plans to exceed 10 per cent of Emera’s outstanding common shares. As at December 31, 2025, Emera was in compliance with this requirement. ATM Equity Program On December 5, 2025, Emera renewed its ATM Program by filing a prospectus supplement to the Company’s Canadian short form base shelf prospectus with the securities regulatory authorities in each of the provinces of Canada. At the same time, Emera filed a US prospectus supplement to the Company’s US base prospectus included in its US registration statement on Form F-10 with the US Securities and Exchange Commission (the “SEC”). The ATM Program allows the Company to issue up to $600 million of common shares from treasury to the public from time to time, at the Company’s discretion, at the prevailing market price. The ATM Program is expected to remain in effect until January 5, 2029. 13. Earnings Per Share Basic earnings per share is determined by dividing net income attributable to common shareholders by the weighted average number of common shares outstanding during the period. Diluted EPS is computed by dividing net income attributable to common shareholders by the weighted average number of common shares outstanding during the period, adjusted for the exercise and/or conversion of all potentially dilutive securities. Such dilutive items include Company contributions to the senior management stock option plan, convertible debentures and shares issued under the DRIP. The following table reconciles the computation of basic and diluted earnings per share: For the Year ended December 31 millions of dollars (except per share amounts) 2025 2024 Numerator Net income attributable to common shareholders $ 1,014.2 $ 493.6 Diluted numerator 1,014.2 493.6 Denominator Weighted average shares of common stock outstanding – basic 299.2 289.1 Stock-based compensation 0.5 0.1 Weighted average shares of common stock outstanding – diluted 299.7 289.2 Earnings per common share Basic $ 3.39 $ 1.71 Diluted $ 3.38 $ 1.71 EMERA 2025 ANNUAL REPORT 99
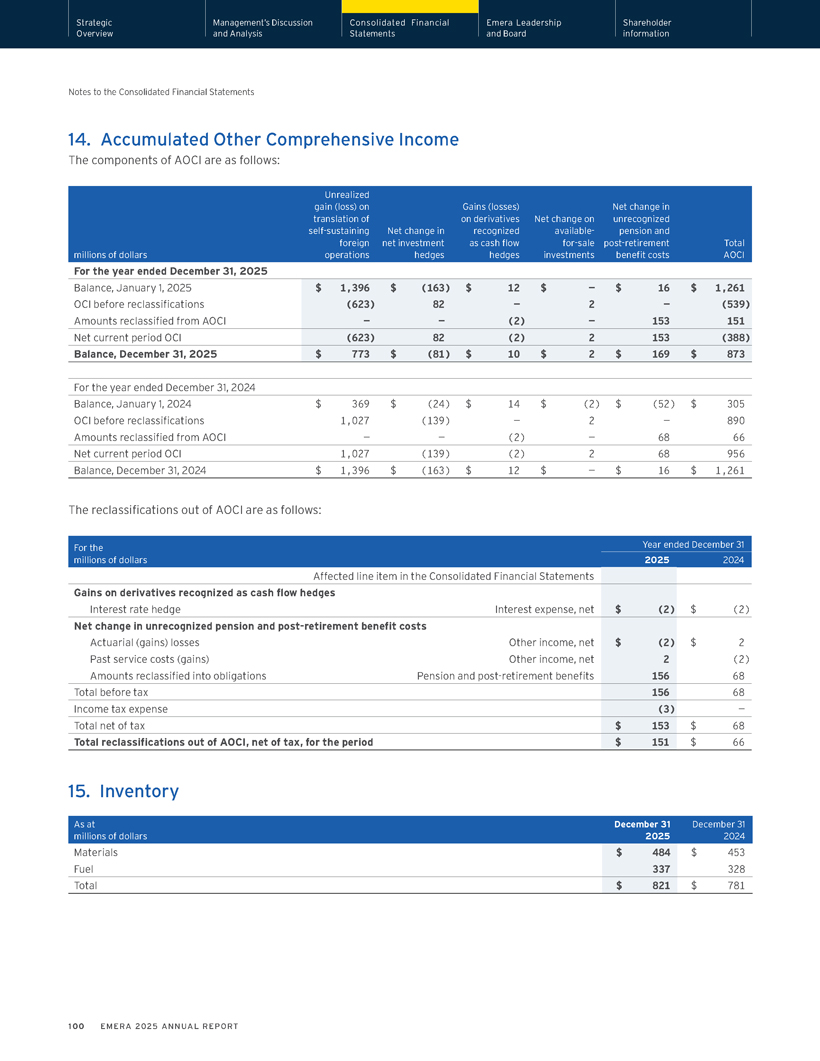
Strategic Management’s Discussion Consolidated Financial Emera Leadership Shareholder Overview and Analysis Statements and Board information Notes to the Consolidated Financial Statements 14. Accumulated Other Comprehensive Income The components of AOCI are as follows: Unrealized gain (loss) on Gains (losses) Net change in translation of on derivatives Net change on unrecognized self-sustaining Net change in recognized available- pension and foreign net investment as cash flow for-sale post-retirement Total millions of dollars operations hedges hedges investments benefit costs AOCI For the year ended December 31, 2025 Balance, January 1, 2025 $ 1,396 $ (163) $ 12 $ — $ 16 $ 1,261 OCI before reclassifications (623) 82 — 2 — (539) Amounts reclassified from AOCI — — (2) — 153 151 Net current period OCI (623) 82 (2) 2 153 (388) Balance, December 31, 2025 $ 773 $ (81) $ 10 $ 2 $ 169 $ 873 For the year ended December 31, 2024 Balance, January 1, 2024 $ 369 $ (24) $ 14 $ (2) $ (52) $ 305 OCI before reclassifications 1,027 (139) — 2 — 890 Amounts reclassified from AOCI — — (2) — 68 66 Net current period OCI 1,027 (139) (2) 2 68 956 Balance, December 31, 2024 $ 1,396 $ (163) $ 12 $ — $ 16 $ 1,261 The reclassifications out of AOCI are as follows: For the Year ended December 31 millions of dollars 2025 2024 Affected line item in the Consolidated Financial Statements Gains on derivatives recognized as cash flow hedges Interest rate hedge Interest expense, net $ (2) $ (2) Net change in unrecognized pension and post-retirement benefit costs Actuarial (gains) losses Other income, net $ (2) $ 2 Past service costs (gains) Other income, net 2 (2) Amounts reclassified into obligations Pension and post-retirement benefits 156 68 Total before tax 156 68 Income tax expense (3) — Total net of tax $ 153 $ 68 Total reclassifications out of AOCI, net of tax, for the period $ 151 $ 66 15. Inventory As at December 31 December 31 millions of dollars 2025 2024 Materials $ 484 $ 453 Fuel 337 328 Total $ 821 $ 781 100 EMERA 2025 ANNUAL REPORT
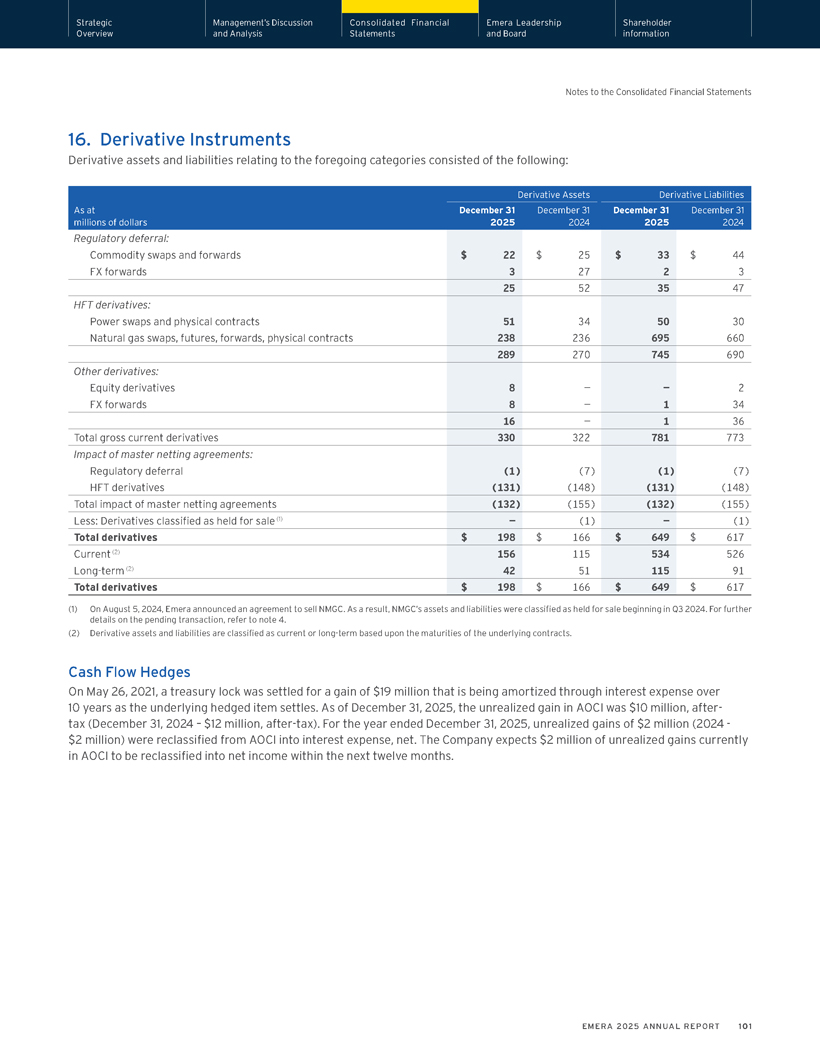
Strategic Management’s Discussion Consolidated Financial Emera Leadership Shareholder Overview and Analysis Statements and Board information Notes to the Consolidated Financial Statements 16. Derivative Instruments Derivative assets and liabilities relating to the foregoing categories consisted of the following: Derivative Assets Derivative Liabilities As at December 31 December 31 December 31 December 31 millions of dollars 2025 2024 2025 2024 Regulatory deferral: Commodity swaps and forwards $ 22 $ 25 $ 33 $ 44 FX forwards 3 27 2 3 25 52 35 47 HFT derivatives: Power swaps and physical contracts 51 34 50 30 Natural gas swaps, futures, forwards, physical contracts 238 236 695 660 289 270 745 690 Other derivatives: Equity derivatives 8 — — 2 FX forwards 8 — 1 34 16 — 1 36 Total gross current derivatives 330 322 781 773 Impact of master netting agreements: Regulatory deferral (1) (7) (1) (7) HFT derivatives (131) (148) (131) (148) Total impact of master netting agreements (132) (155) (132) (155) Less: Derivatives classified as held for sale (1) — (1) — (1) Total derivatives $ 198 $ 166 $ 649 $ 617 Current (2) 156 115 534 526 Long-term (2) 42 51 115 91 Total derivatives $ 198 $ 166 $ 649 $ 617 (1) On August 5, 2024, Emera announced an agreement to sell NMGC. As a result, NMGC’s assets and liabilities were classified as held for sale beginning in Q3 2024. For further details on the pending transaction, refer to note 4. (2) Derivative assets and liabilities are classified as current or long-term based upon the maturities of the underlying contracts. Cash Flow Hedges On May 26, 2021, a treasury lock was settled for a gain of $19 million that is being amortized through interest expense over 10 years as the underlying hedged item settles. As of December 31, 2025, the unrealized gain in AOCI was $10 million, after-tax (December 31, 2024 – $12 million, after-tax). For the year ended December 31, 2025, unrealized gains of $2 million (2024—$2 million) were reclassified from AOCI into interest expense, net. The Company expects $2 million of unrealized gains currently in AOCI to be reclassified into net income within the next twelve months. EMERA 2025 ANNUAL REPORT 101
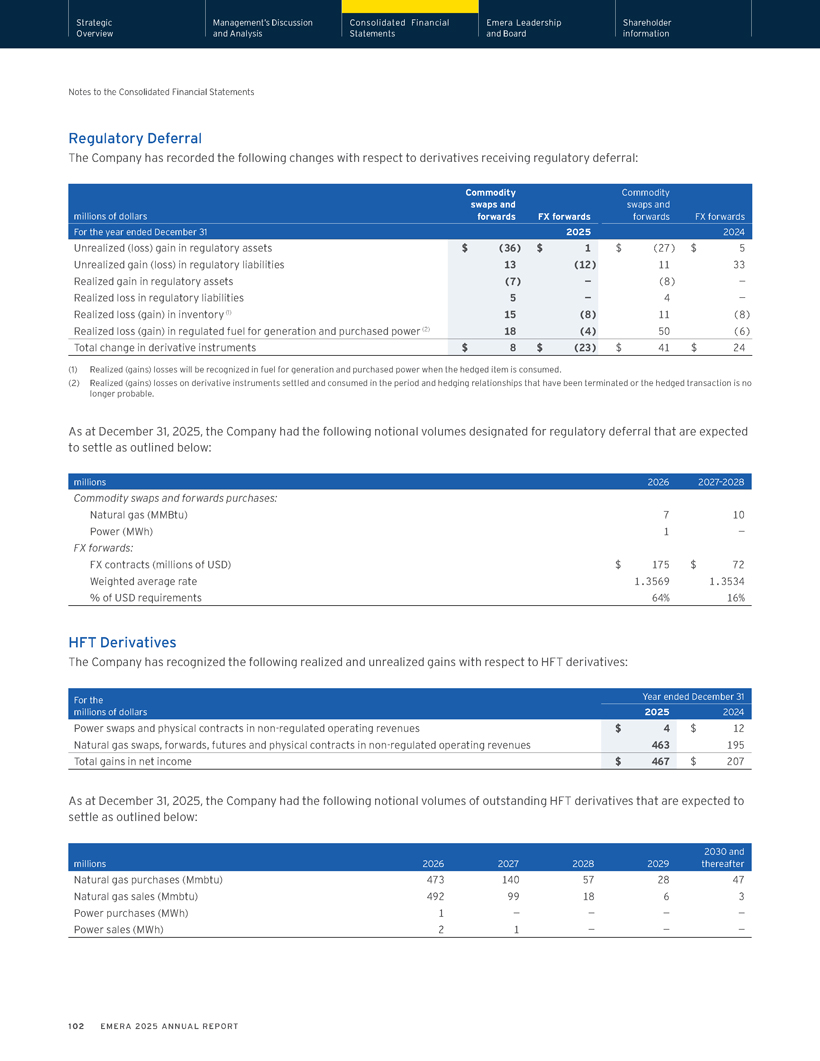
Strategic Management’s Discussion Consolidated Financial Emera Leadership Shareholder Overview and Analysis Statements and Board information Notes to the Consolidated Financial Statements Regulatory Deferral The Company has recorded the following changes with respect to derivatives receiving regulatory deferral: Commodity Commodity swaps and swaps and millions of dollars forwards FX forwards forwards FX forwards For the year ended December 31 2025 2024 Unrealized (loss) gain in regulatory assets $ (36) $ 1 $ (27) $ 5 Unrealized gain (loss) in regulatory liabilities 13 (12) 11 33 Realized gain in regulatory assets (7) — (8) — Realized loss in regulatory liabilities 5 — 4 — Realized loss (gain) in inventory (1) 15 (8) 11 (8) Realized loss (gain) in regulated fuel for generation and purchased power (2) 18 (4) 50 (6) Total change in derivative instruments $ 8 $ (23) $ 41 $ 24 (1) Realized (gains) losses will be recognized in fuel for generation and purchased power when the hedged item is consumed. (2) Realized (gains) losses on derivative instruments settled and consumed in the period and hedging relationships that have been terminated or the hedged transaction is no longer probable. As at December 31, 2025, the Company had the following notional volumes designated for regulatory deferral that are expected to settle as outlined below: millions 2026 2027–2028 Commodity swaps and forwards purchases: Natural gas (MMBtu) 7 10 Power (MWh) 1 — FX forwards: FX contracts (millions of USD) $ 175 $ 72 Weighted average rate 1.3569 1.3534 % of USD requirements 64% 16% HFT Derivatives The Company has recognized the following realized and unrealized gains with respect to HFT derivatives: For the Year ended December 31 millions of dollars 2025 2024 Power swaps and physical contracts in non-regulated operating revenues $ 4 $ 12 Natural gas swaps, forwards, futures and physical contracts in non-regulated operating revenues 463 195 Total gains in net income $ 467 $ 207 As at December 31, 2025, the Company had the following notional volumes of outstanding HFT derivatives that are expected to settle as outlined below: 2030 and millions 2026 2027 2028 2029 thereafter Natural gas purchases (Mmbtu) 473 140 57 28 47 Natural gas sales (Mmbtu) 492 99 18 6 3 Power purchases (MWh) 1 — — — —Power sales (MWh) 2 1 — — — 102 EMERA 2025 ANNUAL REPORT
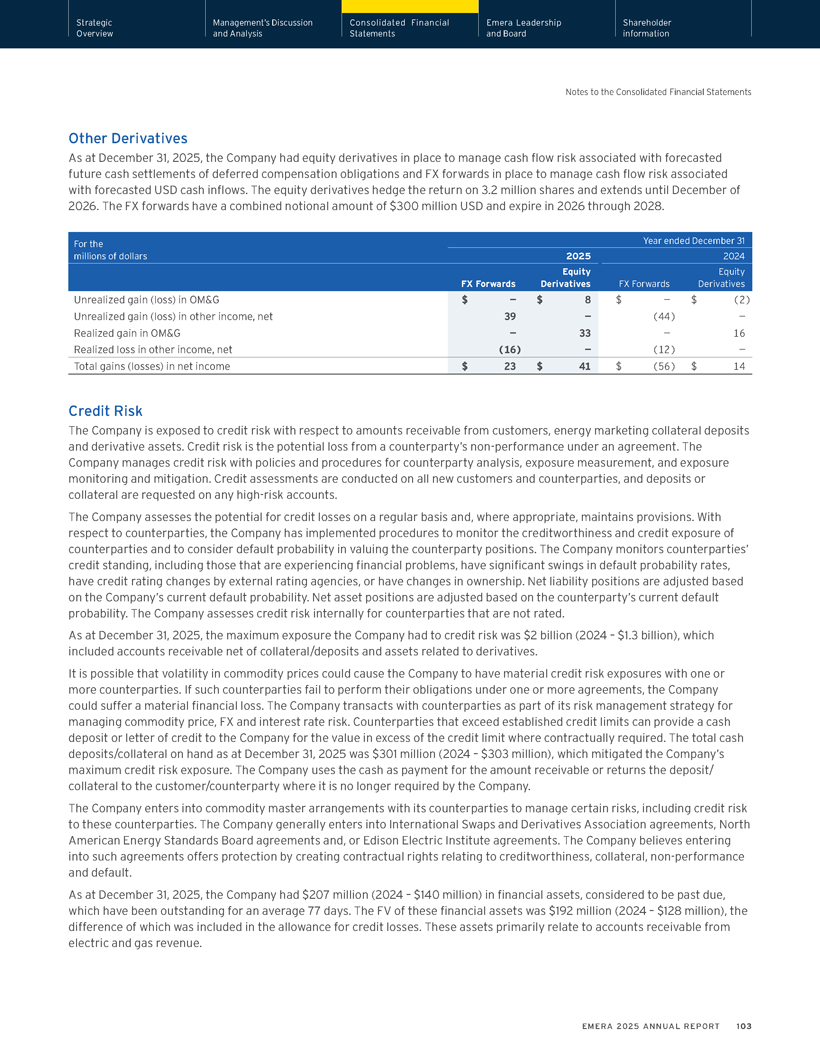
Strategic Management’s Discussion Consolidated Financial Emera Leadership Shareholder Overview and Analysis Statements and Board information Notes to the Consolidated Financial Statements Other Derivatives As at December 31, 2025, the Company had equity derivatives in place to manage cash flow risk associated with forecasted future cash settlements of deferred compensation obligations and FX forwards in place to manage cash flow risk associated with forecasted USD cash inflows. The equity derivatives hedge the return on 3.2 million shares and extends until December of 2026. The FX forwards have a combined notional amount of $300 million USD and expire in 2026 through 2028. For the Year ended December 31 millions of dollars 2025 2024 Equity Equity FX Forwards Derivatives FX Forwards Derivatives Unrealized gain (loss) in OM&G $ — $ 8 $ — $ (2) Unrealized gain (loss) in other income, net 39 — (44) — Realized gain in OM&G — 33 — 16 Realized loss in other income, net (16) — (12) — Total gains (losses) in net income $ 23 $ 41 $ (56) $ 14 Credit Risk The Company is exposed to credit risk with respect to amounts receivable from customers, energy marketing collateral deposits and derivative assets. Credit risk is the potential loss from a counterparty’s non-performance under an agreement. The Company manages credit risk with policies and procedures for counterparty analysis, exposure measurement, and exposure monitoring and mitigation. Credit assessments are conducted on all new customers and counterparties, and deposits or collateral are requested on any high-risk accounts. The Company assesses the potential for credit losses on a regular basis and, where appropriate, maintains provisions. With respect to counterparties, the Company has implemented procedures to monitor the creditworthiness and credit exposure of counterparties and to consider default probability in valuing the counterparty positions. The Company monitors counterparties’ credit standing, including those that are experiencing financial problems, have significant swings in default probability rates, have credit rating changes by external rating agencies, or have changes in ownership. Net liability positions are adjusted based on the Company’s current default probability. Net asset positions are adjusted based on the counterparty’s current default probability. The Company assesses credit risk internally for counterparties that are not rated. As at December 31, 2025, the maximum exposure the Company had to credit risk was $2 billion (2024 – $1.3 billion), which included accounts receivable net of collateral/deposits and assets related to derivatives. It is possible that volatility in commodity prices could cause the Company to have material credit risk exposures with one or more counterparties. If such counterparties fail to perform their obligations under one or more agreements, the Company could suffer a material financial loss. The Company transacts with counterparties as part of its risk management strategy for managing commodity price, FX and interest rate risk. Counterparties that exceed established credit limits can provide a cash deposit or letter of credit to the Company for the value in excess of the credit limit where contractually required. The total cash deposits/collateral on hand as at December 31, 2025 was $301 million (2024 – $303 million), which mitigated the Company’s maximum credit risk exposure. The Company uses the cash as payment for the amount receivable or returns the deposit/ collateral to the customer/counterparty where it is no longer required by the Company. The Company enters into commodity master arrangements with its counterparties to manage certain risks, including credit risk to these counterparties. The Company generally enters into International Swaps and Derivatives Association agreements, North American Energy Standards Board agreements and, or Edison Electric Institute agreements. The Company believes entering into such agreements offers protection by creating contractual rights relating to creditworthiness, collateral, non-performance and default. As at December 31, 2025, the Company had $207 million (2024 – $140 million) in financial assets, considered to be past due, which have been outstanding for an average 77 days. The FV of these financial assets was $192 million (2024 – $128 million), the difference of which was included in the allowance for credit losses. These assets primarily relate to accounts receivable from electric and gas revenue. EMERA 2025 ANNUAL REPORT 103
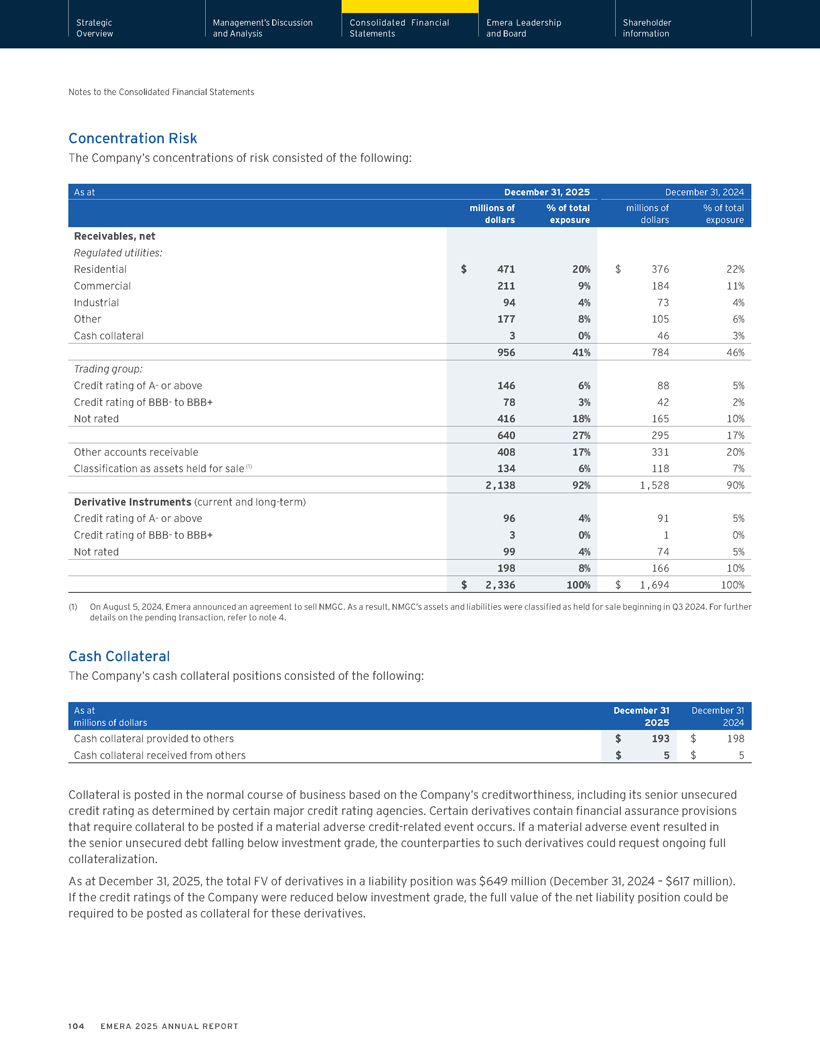
Strategic Management’s Discussion Consolidated Financial Emera Leadership Shareholder Overview and Analysis Statements and Board information Notes to the Consolidated Financial Statements Concentration Risk The Company’s concentrations of risk consisted of the following: As at December 31, 2025 December 31, 2024 millions of % of total millions of % of total dollars exposure dollars exposure Receivables, net Regulated utilities: Residential $ 471 20% $ 376 22% Commercial 211 9% 184 11% Industrial 94 4% 73 4% Other 177 8% 105 6% Cash collateral 3 0% 46 3% 956 41% 784 46% Trading group: Credit rating of A- or above 146 6% 88 5% Credit rating of BBB- to BBB+ 78 3% 42 2% Not rated 416 18% 165 10% 640 27% 295 17% Other accounts receivable 408 17% 331 20% Classification as assets held for sale (1) 134 6% 118 7% 2,138 92% 1,528 90% Derivative Instruments (current and long-term) Credit rating of A- or above 96 4% 91 5% Credit rating of BBB- to BBB+ 3 0% 1 0% Not rated 99 4% 74 5% 198 8% 166 10% $ 2,336 100% $ 1,694 100% (1) On August 5, 2024, Emera announced an agreement to sell NMGC. As a result, NMGC’s assets and liabilities were classified as held for sale beginning in Q3 2024. For further details on the pending transaction, refer to note 4. Cash Collateral The Company’s cash collateral positions consisted of the following: As at December 31 December 31 millions of dollars 2025 2024 Cash collateral provided to others $ 193 $ 198 Cash collateral received from others $ 5 $ 5 Collateral is posted in the normal course of business based on the Company’s creditworthiness, including its senior unsecured credit rating as determined by certain major credit rating agencies. Certain derivatives contain financial assurance provisions that require collateral to be posted if a material adverse credit-related event occurs. If a material adverse event resulted in the senior unsecured debt falling below investment grade, the counterparties to such derivatives could request ongoing full collateralization. As at December 31, 2025, the total FV of derivatives in a liability position was $649 million (December 31, 2024 – $617 million). If the credit ratings of the Company were reduced below investment grade, the full value of the net liability position could be required to be posted as collateral for these derivatives. 104 EMERA 2025 ANNUAL REPORT
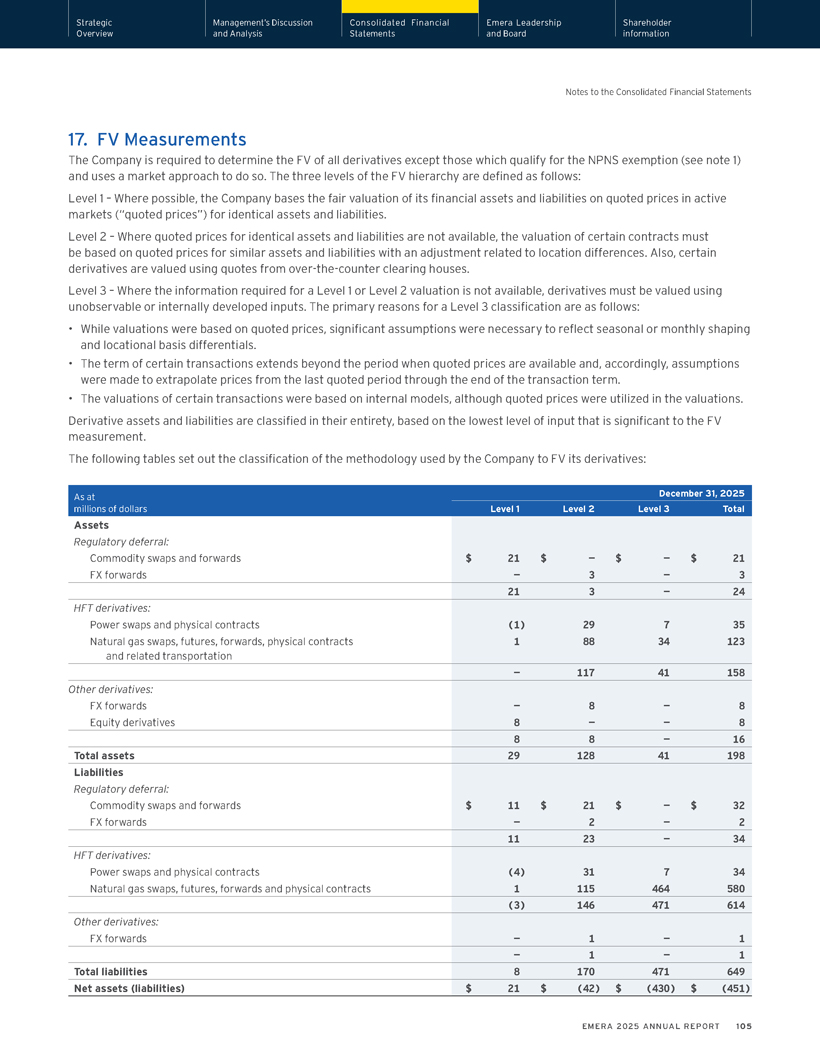
Strategic Management’s Discussion Consolidated Financial Emera Leadership Shareholder Overview and Analysis Statements and Board information Notes to the Consolidated Financial Statements 17. FV Measurements The Company is required to determine the FV of all derivatives except those which qualify for the NPNS exemption (see note 1) and uses a market approach to do so. The three levels of the FV hierarchy are defined as follows: Level 1 – Where possible, the Company bases the fair valuation of its financial assets and liabilities on quoted prices in active markets (“quoted prices”) for identical assets and liabilities. Level 2 – Where quoted prices for identical assets and liabilities are not available, the valuation of certain contracts must be based on quoted prices for similar assets and liabilities with an adjustment related to location differences. Also, certain derivatives are valued using quotes from over-the-counter clearing houses. Level 3 – Where the information required for a Level 1 or Level 2 valuation is not available, derivatives must be valued using unobservable or internally developed inputs. The primary reasons for a Level 3 classification are as follows: • While valuations were based on quoted prices, significant assumptions were necessary to reflect seasonal or monthly shaping and locational basis differentials. • The term of certain transactions extends beyond the period when quoted prices are available and, accordingly, assumptions were made to extrapolate prices from the last quoted period through the end of the transaction term. • The valuations of certain transactions were based on internal models, although quoted prices were utilized in the valuations. Derivative assets and liabilities are classified in their entirety, based on the lowest level of input that is significant to the FV measurement. The following tables set out the classification of the methodology used by the Company to FV its derivatives: As at December 31, 2025 millions of dollars Level 1 Level 2 Level 3 Total Assets Regulatory deferral: Commodity swaps and forwards $ 21 $ — $ — $ 21 FX forwards — 3 — 3 21 3 — 24 HFT derivatives: Power swaps and physical contracts (1) 29 7 35 Natural gas swaps, futures, forwards, physical contracts 1 88 34 123 and related transportation — 117 41 158 Other derivatives: FX forwards — 8 — 8 Equity derivatives 8 — — 8 8 8 — 16 Total assets 29 128 41 198 Liabilities Regulatory deferral: Commodity swaps and forwards $ 11 $ 21 $ — $ 32 FX forwards — 2 — 2 11 23 — 34 HFT derivatives: Power swaps and physical contracts (4) 31 7 34 Natural gas swaps, futures, forwards and physical contracts 1 115 464 580 (3) 146 471 614 Other derivatives: FX forwards — 1 — 1 — 1 — 1 Total liabilities 8 170 471 649 Net assets (liabilities) $ 21 $ (42) $ (430) $ (451) EMERA 2025 ANNUAL REPORT 105
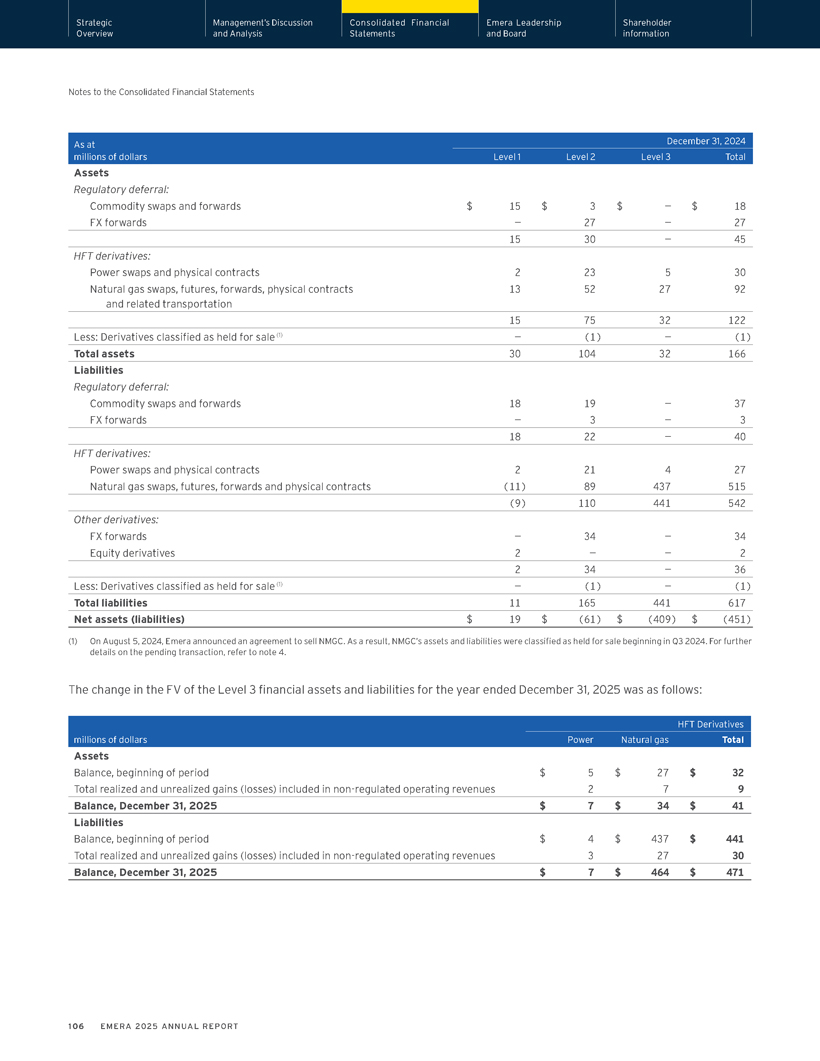
Strategic Management’s Discussion Consolidated Financial Emera Leadership Shareholder Overview and Analysis Statements and Board information Notes to the Consolidated Financial Statements As at December 31, 2024 millions of dollars Level 1 Level 2 Level 3 Total Assets Regulatory deferral: Commodity swaps and forwards $ 15 $ 3 $ — $ 18 FX forwards — 27 — 27 15 30 — 45 HFT derivatives: Power swaps and physical contracts 2 23 5 30 Natural gas swaps, futures, forwards, physical contracts 13 52 27 92 and related transportation 15 75 32 122 Less: Derivatives classified as held for sale (1) — (1) — (1) Total assets 30 104 32 166 Liabilities Regulatory deferral: Commodity swaps and forwards 18 19 — 37 FX forwards — 3 — 3 18 22 — 40 HFT derivatives: Power swaps and physical contracts 2 21 4 27 Natural gas swaps, futures, forwards and physical contracts (11) 89 437 515 (9) 110 441 542 Other derivatives: FX forwards — 34 — 34 Equity derivatives 2 — — 2 2 34 — 36 Less: Derivatives classified as held for sale (1) — (1) — (1) Total liabilities 11 165 441 617 Net assets (liabilities) $ 19 $ (61) $ (409) $ (451) (1) On August 5, 2024, Emera announced an agreement to sell NMGC. As a result, NMGC’s assets and liabilities were classified as held for sale beginning in Q3 2024. For further details on the pending transaction, refer to note 4. The change in the FV of the Level 3 financial assets and liabilities for the year ended December 31, 2025 was as follows: HFT Derivatives millions of dollars Power Natural gas Total Assets Balance, beginning of period $ 5 $ 27 $ 32 Total realized and unrealized gains (losses) included in non-regulated operating revenues 2 7 9 Balance, December 31, 2025 $ 7 $ 34 $ 41 Liabilities Balance, beginning of period $ 4 $ 437 $ 441 Total realized and unrealized gains (losses) included in non-regulated operating revenues 3 27 30 Balance, December 31, 2025 $ 7 $ 464 $ 471 106 EMERA 2025 ANNUAL REPORT
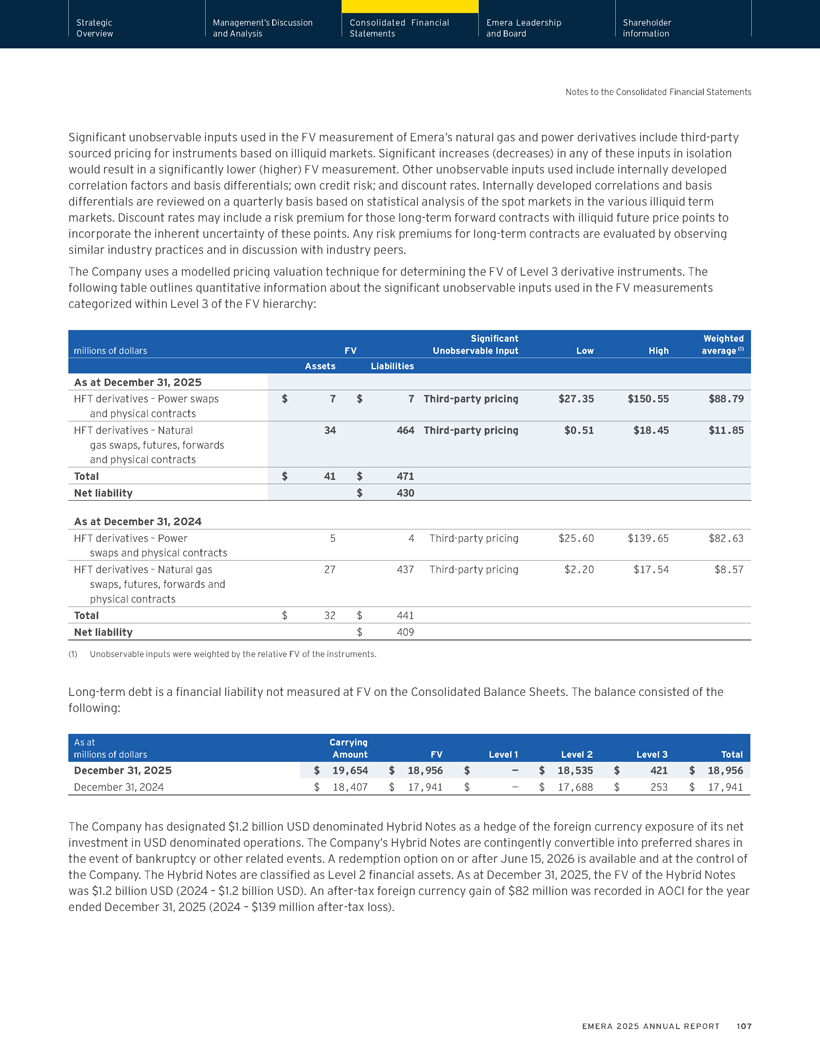
Strategic Management’s Discussion Consolidated Financial Emera Leadership Shareholder Overview and Analysis Statements and Board information Notes to the Consolidated Financial Statements Significant unobservable inputs used in the FV measurement of Emera’s natural gas and power derivatives include third-party sourced pricing for instruments based on illiquid markets. Significant increases (decreases) in any of these inputs in isolation would result in a significantly lower (higher) FV measurement. Other unobservable inputs used include internally developed correlation factors and basis differentials; own credit risk; and discount rates. Internally developed correlations and basis differentials are reviewed on a quarterly basis based on statistical analysis of the spot markets in the various illiquid term markets. Discount rates may include a risk premium for those long-term forward contracts with illiquid future price points to incorporate the inherent uncertainty of these points. Any risk premiums for long-term contracts are evaluated by observing similar industry practices and in discussion with industry peers. The Company uses a modelled pricing valuation technique for determining the FV of Level 3 derivative instruments. The following table outlines quantitative information about the significant unobservable inputs used in the FV measurements categorized within Level 3 of the FV hierarchy: Significant Weighted millions of dollars FV Unobservable Input Low High average (1) Assets Liabilities As at December 31, 2025 HFT derivatives – Power swaps $ 7 $ 7 Third-party pricing $27.35 $150.55 $88.79 and physical contracts HFT derivatives – Natural 34 464 Third-party pricing $0.51 $18.45 $11.85 gas swaps, futures, forwards and physical contracts Total $ 41 $ 471 Net liability $ 430 As at December 31, 2024 HFT derivatives – Power 5 4 Third-party pricing $25.60 $139.65 $82.63 swaps and physical contracts HFT derivatives – Natural gas 27 437 Third-party pricing $2.20 $17.54 $8.57 swaps, futures, forwards and physical contracts Total $ 32 $ 441 Net liability $ 409 (1) Unobservable inputs were weighted by the relative FV of the instruments. Long-term debt is a financial liability not measured at FV on the Consolidated Balance Sheets. The balance consisted of the following: As at Carrying millions of dollars Amount FV Level 1 Level 2 Level 3 Total December 31, 2025 $ 19,654 $ 18,956 $ — $ 18,535 $ 421 $ 18,956 December 31, 2024 $ 18,407 $ 17,941 $ — $ 17,688 $ 253 $ 17,941 The Company has designated $1.2 billion USD denominated Hybrid Notes as a hedge of the foreign currency exposure of its net investment in USD denominated operations. The Company’s Hybrid Notes are contingently convertible into preferred shares in the event of bankruptcy or other related events. A redemption option on or after June 15, 2026 is available and at the control of the Company. The Hybrid Notes are classified as Level 2 financial assets. As at December 31, 2025, the FV of the Hybrid Notes was $1.2 billion USD (2024 – $1.2 billion USD). An after-tax foreign currency gain of $82 million was recorded in AOCI for the year ended December 31, 2025 (2024 – $139 million after-tax loss). EMERA 2025 ANNUAL REPORT 107
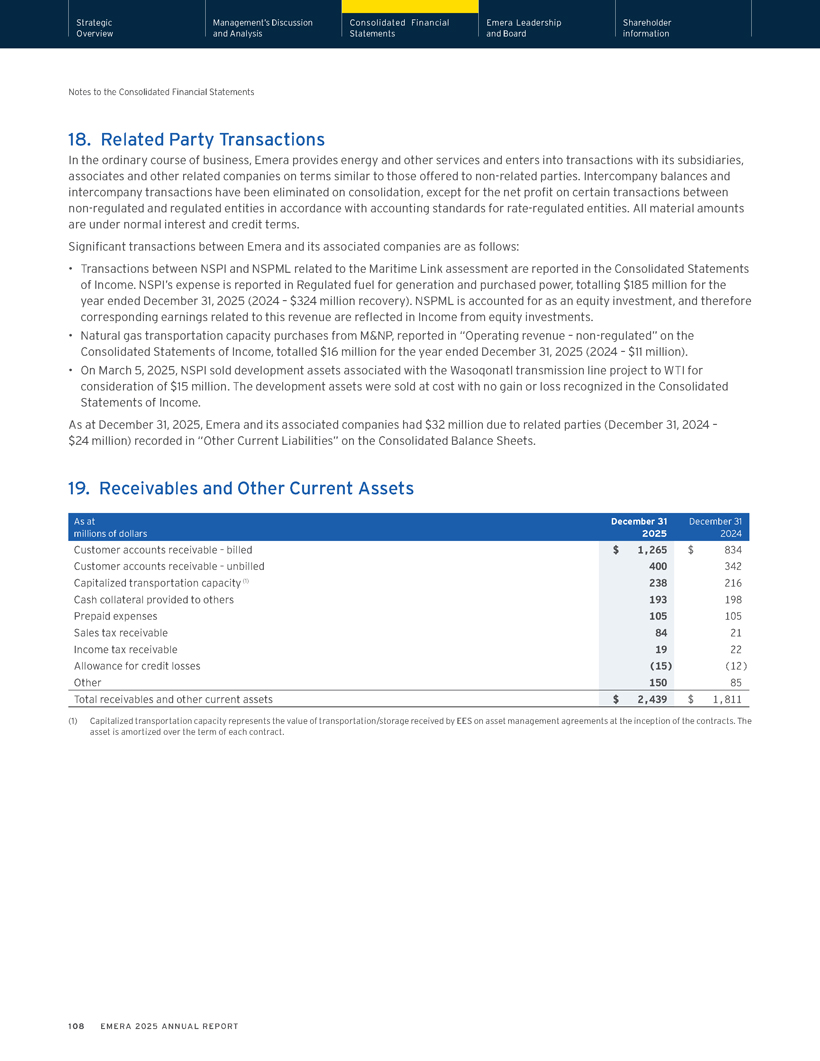
Strategic Management’s Discussion Consolidated Financial Emera Leadership Shareholder Overview and Analysis Statements and Board information Notes to the Consolidated Financial Statements 18. Related Party Transactions In the ordinary course of business, Emera provides energy and other services and enters into transactions with its subsidiaries, associates and other related companies on terms similar to those offered to non-related parties. Intercompany balances and intercompany transactions have been eliminated on consolidation, except for the net profit on certain transactions between non-regulated and regulated entities in accordance with accounting standards for rate-regulated entities. All material amounts are under normal interest and credit terms. Significant transactions between Emera and its associated companies are as follows: • Transactions between NSPI and NSPML related to the Maritime Link assessment are reported in the Consolidated Statements of Income. NSPI’s expense is reported in Regulated fuel for generation and purchased power, totalling $185 million for the year ended December 31, 2025 (2024 – $324 million recovery). NSPML is accounted for as an equity investment, and therefore corresponding earnings related to this revenue are reflected in Income from equity investments. • Natural gas transportation capacity purchases from M&NP, reported in “Operating revenue – non-regulated” on the Consolidated Statements of Income, totalled $16 million for the year ended December 31, 2025 (2024 – $11 million). • On March 5, 2025, NSPI sold development assets associated with the Wasoqonatl transmission line project to WTI for consideration of $15 million. The development assets were sold at cost with no gain or loss recognized in the Consolidated Statements of Income. As at December 31, 2025, Emera and its associated companies had $32 million due to related parties (December 31, 2024 –$24 million) recorded in “Other Current Liabilities” on the Consolidated Balance Sheets. 19. Receivables and Other Current Assets As at December 31 December 31 millions of dollars 2025 2024 Customer accounts receivable – billed $ 1,265 $ 834 Customer accounts receivable – unbilled 400 342 Capitalized transportation capacity (1) 238 216 Cash collateral provided to others 193 198 Prepaid expenses 105 105 Sales tax receivable 84 21 Income tax receivable 19 22 Allowance for credit losses (15) (12) Other 150 85 Total receivables and other current assets $ 2,439 $ 1,811 (1) Capitalized transportation capacity represents the value of transportation/storage received by EES on asset management agreements at the inception of the contracts. The asset is amortized over the term of each contract. 108 EMERA 2025 ANNUAL REPORT
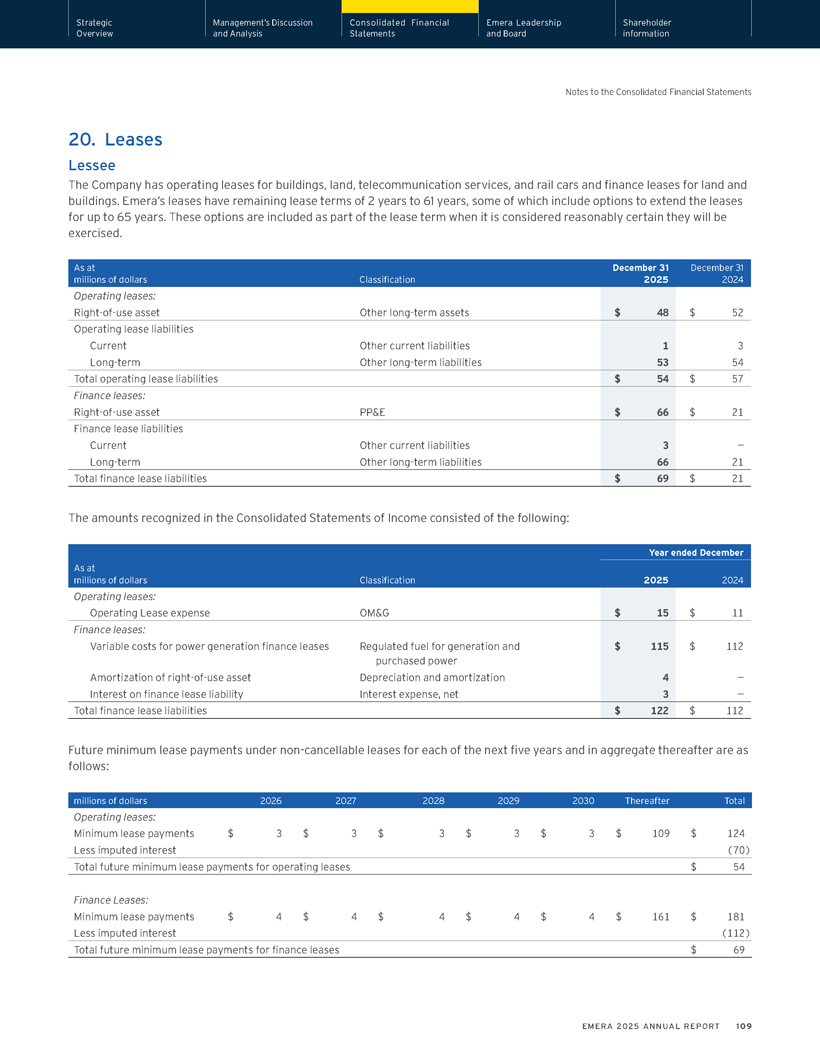
Strategic Management’s Discussion Consolidated Financial Emera Leadership Shareholder Overview and Analysis Statements and Board information Notes to the Consolidated Financial Statements 20. Leases Lessee The Company has operating leases for buildings, land, telecommunication services, and rail cars and finance leases for land and buildings. Emera’s leases have remaining lease terms of 2 years to 61 years, some of which include options to extend the leases for up to 65 years. These options are included as part of the lease term when it is considered reasonably certain they will be exercised. As at December 31 December 31 millions of dollars Classification 2025 2024 Operating leases: Right-of-use asset Other long-term assets $ 48 $ 52 Operating lease liabilities Current Other current liabilities 1 3 Long-term Other long-term liabilities 53 54 Total operating lease liabilities $ 54 $ 57 Finance leases: Right-of-use asset PP&E $ 66 $ 21 Finance lease liabilities Current Other current liabilities 3 —Long-term Other long-term liabilities 66 21 Total finance lease liabilities $ 69 $ 21 The amounts recognized in the Consolidated Statements of Income consisted of the following: Year ended December As at millions of dollars Classification 2025 2024 Operating leases: Operating Lease expense OM&G $ 15 $ 11 Finance leases: Variable costs for power generation finance leases Regulated fuel for generation and $ 115 $ 112 purchased power Amortization of right-of-use asset Depreciation and amortization 4 —Interest on finance lease liability Interest expense, net 3 —Total finance lease liabilities $ 122 $ 112 Future minimum lease payments under non-cancellable leases for each of the next five years and in aggregate thereafter are as follows: millions of dollars 2026 2027 2028 2029 2030 Thereafter Total Operating leases: Minimum lease payments $ 3 $ 3 $ 3 $ 3 $ 3 $ 109 $ 124 Less imputed interest (70) Total future minimum lease payments for operating leases $ 54 Finance Leases: Minimum lease payments $ 4 $ 4 $ 4 $ 4 $ 4 $ 161 $ 181 Less imputed interest (112) Total future minimum lease payments for finance leases $ 69 EMERA 2025 ANNUAL REPORT 109
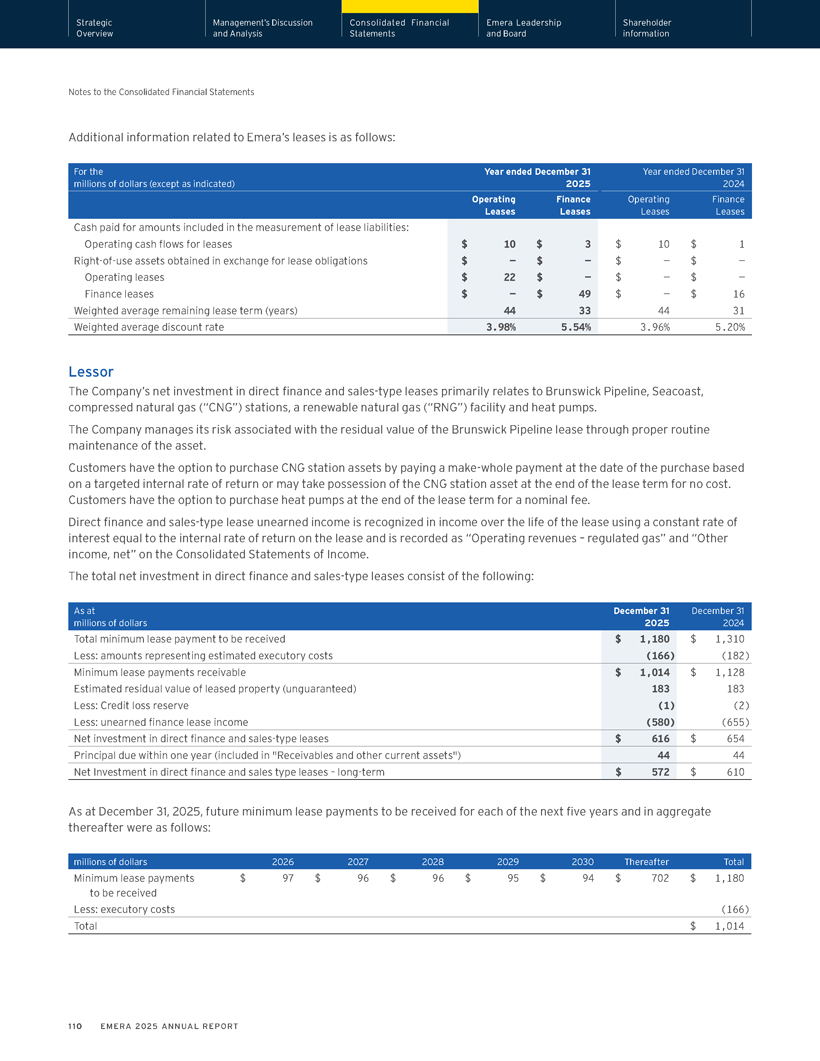
Strategic Management’s Discussion Consolidated Financial Emera Leadership Shareholder Overview and Analysis Statements and Board information Notes to the Consolidated Financial Statements Additional information related to Emera’s leases is as follows: For the Year ended December 31 Year ended December 31 millions of dollars (except as indicated) 2025 2024 Operating Finance Operating Finance Leases Leases Leases Leases Cash paid for amounts included in the measurement of lease liabilities: Operating cash flows for leases $ 10 $ 3 $ 10 $ 1 Right-of-use assets obtained in exchange for lease obligations $ — $ — $ — $ —Operating leases $ 22 $ — $ — $ —Finance leases $ — $ 49 $ — $ 16 Weighted average remaining lease term (years) 44 33 44 31 Weighted average discount rate 3.98% 5.54% 3.96% 5.20% Lessor The Company’s net investment in direct finance and sales-type leases primarily relates to Brunswick Pipeline, Seacoast, compressed natural gas (“CNG”) stations, a renewable natural gas (“RNG”) facility and heat pumps. The Company manages its risk associated with the residual value of the Brunswick Pipeline lease through proper routine maintenance of the asset. Customers have the option to purchase CNG station assets by paying a make-whole payment at the date of the purchase based on a targeted internal rate of return or may take possession of the CNG station asset at the end of the lease term for no cost. Customers have the option to purchase heat pumps at the end of the lease term for a nominal fee. Direct finance and sales-type lease unearned income is recognized in income over the life of the lease using a constant rate of interest equal to the internal rate of return on the lease and is recorded as “Operating revenues – regulated gas” and “Other income, net” on the Consolidated Statements of Income. The total net investment in direct finance and sales-type leases consist of the following: As at December 31 December 31 millions of dollars 2025 2024 Total minimum lease payment to be received $ 1,180 $ 1,310 Less: amounts representing estimated executory costs (166) (182) Minimum lease payments receivable $ 1,014 $ 1,128 Estimated residual value of leased property (unguaranteed) 183 183 Less: Credit loss reserve (1) (2) Less: unearned finance lease income (580) (655) Net investment in direct finance and sales-type leases $ 616 $ 654 Principal due within one year (included in “Receivables and other current assets”) 44 44 Net Investment in direct finance and sales type leases – long-term $ 572 $ 610 As at December 31, 2025, future minimum lease payments to be received for each of the next five years and in aggregate thereafter were as follows: millions of dollars 2026 2027 2028 2029 2030 Thereafter Total Minimum lease payments $ 97 $ 96 $ 96 $ 95 $ 94 $ 702 $ 1,180 to be received Less: executory costs (166) Total $ 1,014 110 EMERA 2025 ANNUAL REPORT
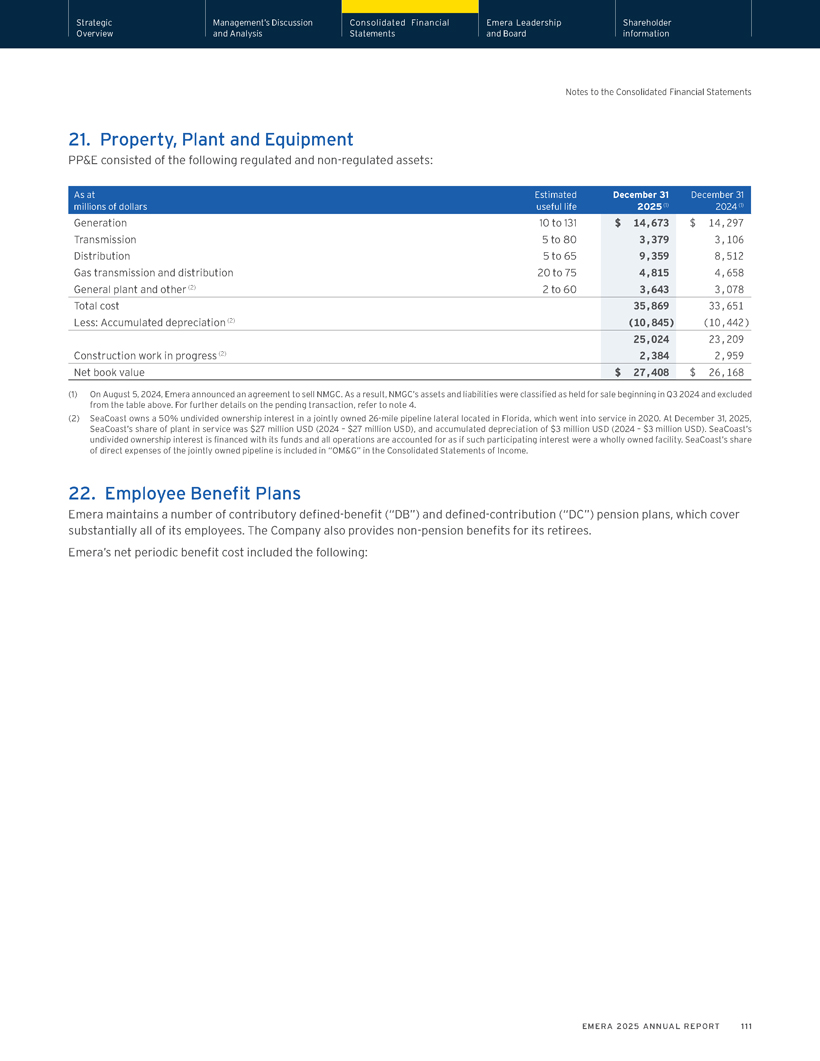
Strategic Management’s Discussion Consolidated Financial Emera Leadership Shareholder Overview and Analysis Statements and Board information Notes to the Consolidated Financial Statements 21. Property, Plant and Equipment PP&E consisted of the following regulated and non-regulated assets: As at Estimated December 31 December 31 millions of dollars useful life 2025 (1) 2024 (1) Generation 10 to 131 $ 14,673 $ 14,297 Transmission 5 to 80 3,379 3,106 Distribution 5 to 65 9,359 8,512 Gas transmission and distribution 20 to 75 4,815 4,658 General plant and other (2) 2 to 60 3,643 3,078 Total cost 35,869 33,651 Less: Accumulated depreciation (2) (10,845) (10,442) 25,024 23,209 Construction work in progress (2) 2,384 2,959 Net book value $ 27,408 $ 26,168 (1) On August 5, 2024, Emera announced an agreement to sell NMGC. As a result, NMGC’s assets and liabilities were classified as held for sale beginning in Q3 2024 and excluded from the table above. For further details on the pending transaction, refer to note 4. (2) SeaCoast owns a 50% undivided ownership interest in a jointly owned 26-mile pipeline lateral located in Florida, which went into service in 2020. At December 31, 2025, SeaCoast’s share of plant in service was $27 million USD (2024 – $27 million USD), and accumulated depreciation of $3 million USD (2024 – $3 million USD). SeaCoast’s undivided ownership interest is financed with its funds and all operations are accounted for as if such participating interest were a wholly owned facility. SeaCoast’s share of direct expenses of the jointly owned pipeline is included in “OM&G” in the Consolidated Statements of Income. 22. Employee Benefit Plans Emera maintains a number of contributory defined-benefit (“DB”) and defined-contribution (“DC”) pension plans, which cover substantially all of its employees. The Company also provides non-pension benefits for its retirees. Emera’s net periodic benefit cost included the following: EMERA 2025 ANNUAL REPORT 111
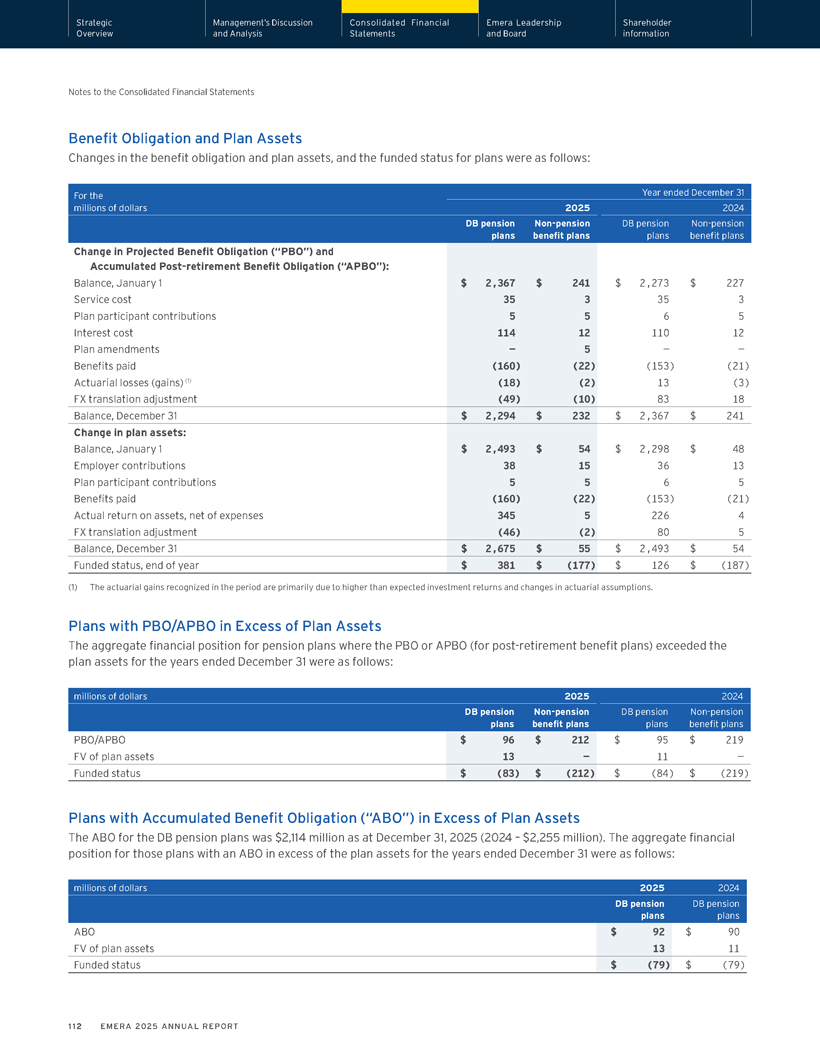
Strategic Management’s Discussion Consolidated Financial Emera Leadership Shareholder Overview and Analysis Statements and Board information Notes to the Consolidated Financial Statements Benefit Obligation and Plan Assets Changes in the benefit obligation and plan assets, and the funded status for plans were as follows: For the Year ended December 31 millions of dollars 2025 2024 DB pension Non-pension DB pension Non-pension plans benefit plans plans benefit plans Change in Projected Benefit Obligation (“PBO”) and Accumulated Post-retirement Benefit Obligation (“APBO”): Balance, January 1 $ 2,367 $ 241 $ 2,273 $ 227 Service cost 35 3 35 3 Plan participant contributions 5 5 6 5 Interest cost 114 12 110 12 Plan amendments — 5 — — Benefits paid (160) (22) (153) (21) Actuarial losses (gains) (1) (18) (2) 13 (3) FX translation adjustment (49) (10) 83 18 Balance, December 31 $ 2,294 $ 232 $ 2,367 $ 241 Change in plan assets: Balance, January 1 $ 2,493 $ 54 $ 2,298 $ 48 Employer contributions 38 15 36 13 Plan participant contributions 5 5 6 5 Benefits paid (160) (22) (153) (21) Actual return on assets, net of expenses 345 5 226 4 FX translation adjustment (46) (2) 80 5 Balance, December 31 $ 2,675 $ 55 $ 2,493 $ 54 Funded status, end of year $ 381 $ (177) $ 126 $ (187) (1) The actuarial gains recognized in the period are primarily due to higher than expected investment returns and changes in actuarial assumptions. Plans with PBO/APBO in Excess of Plan Assets The aggregate financial position for pension plans where the PBO or APBO (for post-retirement benefit plans) exceeded the plan assets for the years ended December 31 were as follows: millions of dollars 2025 2024 DB pension Non-pension DB pension Non-pension plans benefit plans plans benefit plans PBO/APBO $ 96 $ 212 $ 95 $ 219 FV of plan assets 13 — 11 — Funded status $ (83) $ (212) $ (84) $ (219) Plans with Accumulated Benefit Obligation (“ABO”) in Excess of Plan Assets The ABO for the DB pension plans was $2,114 million as at December 31, 2025 (2024 – $2,255 million). The aggregate financial position for those plans with an ABO in excess of the plan assets for the years ended December 31 were as follows: millions of dollars 2025 2024 DB pension DB pension plans plans ABO $ 92 $ 90 FV of plan assets 13 11 Funded status $ (79) $ (79) 112 EMERA 2025 ANNUAL REPORT
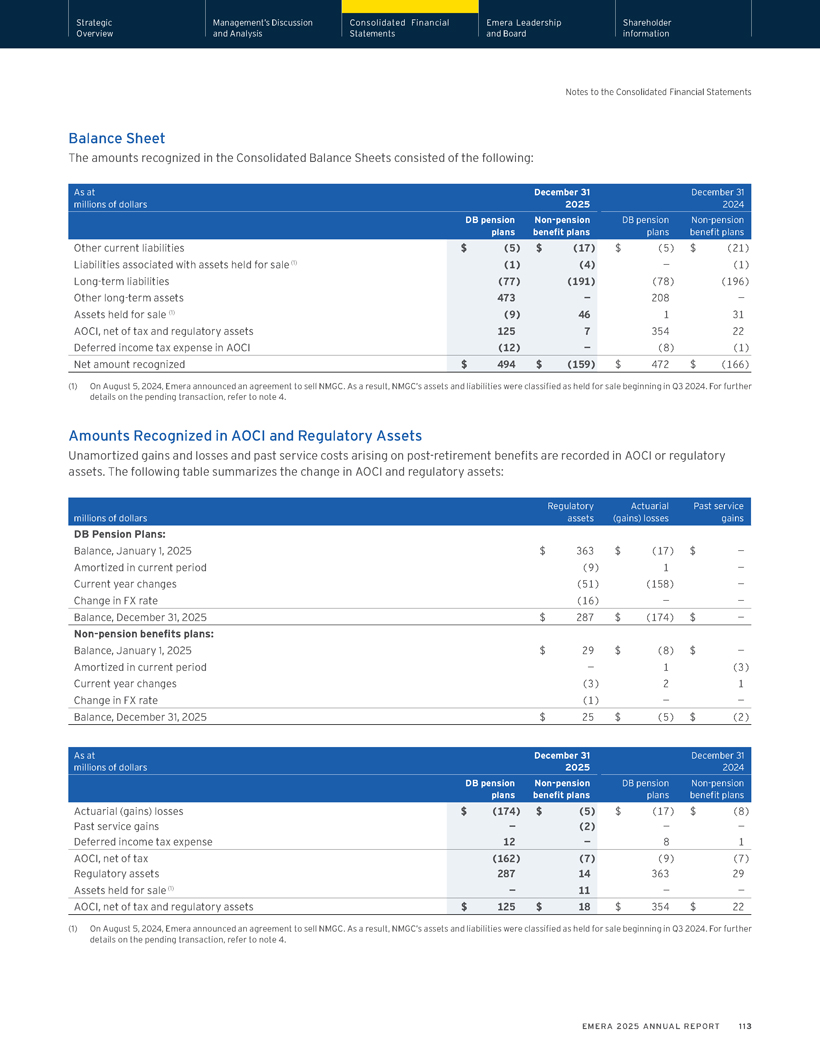
Strategic Management’s Discussion Consolidated Financial Emera Leadership Shareholder Overview and Analysis Statements and Board information Notes to the Consolidated Financial Statements Balance Sheet The amounts recognized in the Consolidated Balance Sheets consisted of the following: As at December 31 December 31 millions of dollars 2025 2024 DB pension Non-pension DB pension Non-pension plans benefit plans plans benefit plans Other current liabilities $ (5) $ (17) $ (5) $ (21) Liabilities associated with assets held for sale (1) (1) (4) — (1) Long-term liabilities (77) (191) (78) (196) Other long-term assets 473 — 208 — Assets held for sale (1) (9) 46 1 31 AOCI, net of tax and regulatory assets 125 7 354 22 Deferred income tax expense in AOCI (12) — (8) (1) Net amount recognized $ 494 $ (159) $ 472 $ (166) (1) On August 5, 2024, Emera announced an agreement to sell NMGC. As a result, NMGC’s assets and liabilities were classified as held for sale beginning in Q3 2024. For further details on the pending transaction, refer to note 4. Amounts Recognized in AOCI and Regulatory Assets Unamortized gains and losses and past service costs arising on post-retirement benefits are recorded in AOCI or regulatory assets. The following table summarizes the change in AOCI and regulatory assets: Regulatory Actuarial Past service millions of dollars assets (gains) losses gains DB Pension Plans: Balance, January 1, 2025 $ 363 $ (17) $ — Amortized in current period (9) 1 — Current year changes (51) (158) — Change in FX rate (16) — — Balance, December 31, 2025 $ 287 $ (174) $ — Non-pension benefits plans: Balance, January 1, 2025 $ 29 $ (8) $ — Amortized in current period — 1 (3) Current year changes (3) 2 1 Change in FX rate (1) — — Balance, December 31, 2025 $ 25 $ (5) $ (2) As at December 31 December 31 millions of dollars 2025 2024 DB pension Non-pension DB pension Non-pension plans benefit plans plans benefit plans Actuarial (gains) losses $ (174) $ (5) $ (17) $ (8) Past service gains — (2) — — Deferred income tax expense 12 — 8 1 AOCI, net of tax (162) (7) (9) (7) Regulatory assets 287 14 363 29 Assets held for sale (1) — 11 — — AOCI, net of tax and regulatory assets $ 125 $ 18 $ 354 $ 22 (1) On August 5, 2024, Emera announced an agreement to sell NMGC. As a result, NMGC’s assets and liabilities were classified as held for sale beginning in Q3 2024. For further details on the pending transaction, refer to note 4. EMERA 2025 ANNUAL REPORT 113
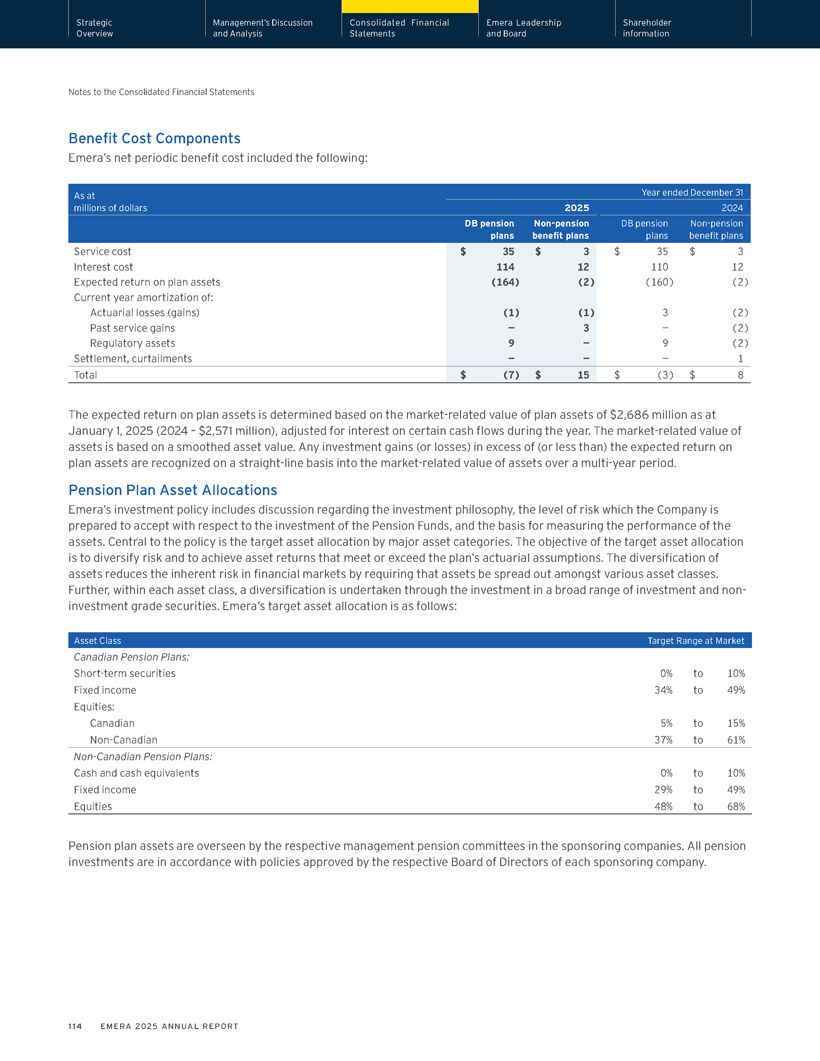
Strategic Management’s Discussion Consolidated Financial Emera Leadership Shareholder Overview and Analysis Statements and Board information Notes to the Consolidated Financial Statements Benefit Cost Components Emera’s net periodic benefit cost included the following: As at Year ended December 31 millions of dollars 2025 2024 DB pension Non-pension DB pension Non-pension plans benefit plans plans benefit plans Service cost $ 35 $ 3 $ 35 $ 3 Interest cost 114 12 110 12 Expected return on plan assets (164) (2) (160) (2) Current year amortization of: Actuarial losses (gains) (1) (1) 3 (2) Past service gains — 3 — (2) Regulatory assets 9 — 9 (2) Settlement, curtailments — — — 1 Total $ (7) $ 15 $ (3) $ 8 The expected return on plan assets is determined based on the market-related value of plan assets of $2,686 million as at January 1, 2025 (2024 – $2,571 million), adjusted for interest on certain cash flows during the year. The market-related value of assets is based on a smoothed asset value. Any investment gains (or losses) in excess of (or less than) the expected return on plan assets are recognized on a straight-line basis into the market-related value of assets over a multi-year period. Pension Plan Asset Allocations Emera’s investment policy includes discussion regarding the investment philosophy, the level of risk which the Company is prepared to accept with respect to the investment of the Pension Funds, and the basis for measuring the performance of the assets. Central to the policy is the target asset allocation by major asset categories. The objective of the target asset allocation is to diversify risk and to achieve asset returns that meet or exceed the plan’s actuarial assumptions. The diversification of assets reduces the inherent risk in financial markets by requiring that assets be spread out amongst various asset classes. Further, within each asset class, a diversification is undertaken through the investment in a broad range of investment and non-investment grade securities. Emera’s target asset allocation is as follows: Asset Class Target Range at Market Canadian Pension Plans: Short-term securities 0% to 10% Fixed income 34% to 49% Equities: Canadian 5% to 15% Non-Canadian 37% to 61% Non-Canadian Pension Plans: Cash and cash equivalents 0% to 10% Fixed income 29% to 49% Equities 48% to 68% Pension plan assets are overseen by the respective management pension committees in the sponsoring companies. All pension investments are in accordance with policies approved by the respective Board of Directors of each sponsoring company. 114 EMERA 2025 ANNUAL REPORT
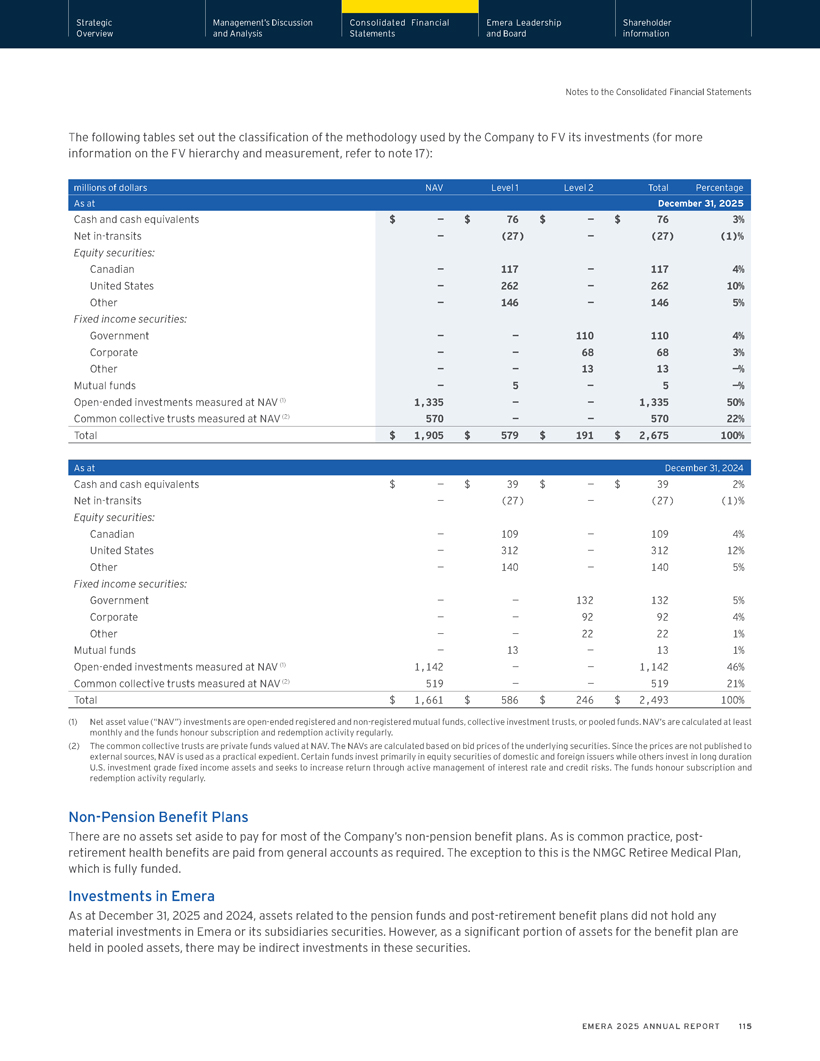
Strategic Management’s Discussion Consolidated Financial Emera Leadership Shareholder Overview and Analysis Statements and Board information Notes to the Consolidated Financial Statements The following tables set out the classification of the methodology used by the Company to FV its investments (for more information on the FV hierarchy and measurement, refer to note 17): millions of dollars NAV Level 1 Level 2 Total Percentage As at December 31, 2025 Cash and cash equivalents $ — $ 76 $ — $ 76 3% Net in-transits — (27) — (27) (1)% Equity securities: Canadian — 117 — 117 4% United States — 262 — 262 10% Other — 146 — 146 5% Fixed income securities: Government — — 110 110 4% Corporate — — 68 68 3% Other — — 13 13 —% Mutual funds — 5 — 5 —% Open-ended investments measured at NAV (1) 1,335 — — 1,335 50% Common collective trusts measured at NAV (2) 570 — — 570 22% Total $ 1,905 $ 579 $ 191 $ 2,675 100% As at December 31, 2024 Cash and cash equivalents $ — $ 39 $ — $ 39 2% Net in-transits — (27) — (27) (1)% Equity securities: Canadian — 109 — 109 4% United States — 312 — 312 12% Other — 140 — 140 5% Fixed income securities: Government — — 132 132 5% Corporate — — 92 92 4% Other — — 22 22 1% Mutual funds — 13 — 13 1% Open-ended investments measured at NAV (1) 1,142 — — 1,142 46% Common collective trusts measured at NAV (2) 519 — — 519 21% Total $ 1,661 $ 586 $ 246 $ 2,493 100% (1) Net asset value (“NAV”) investments are open-ended registered and non-registered mutual funds, collective investment trusts, or pooled funds. NAV’s are calculated at least monthly and the funds honour subscription and redemption activity regularly. (2) The common collective trusts are private funds valued at NAV. The NAVs are calculated based on bid prices of the underlying securities. Since the prices are not published to external sources, NAV is used as a practical expedient. Certain funds invest primarily in equity securities of domestic and foreign issuers while others invest in long duration U.S. investment grade fixed income assets and seeks to increase return through active management of interest rate and credit risks. The funds honour subscription and redemption activity regularly. Non-Pension Benefit Plans There are no assets set aside to pay for most of the Company’s non-pension benefit plans. As is common practice, post-retirement health benefits are paid from general accounts as required. The exception to this is the NMGC Retiree Medical Plan, which is fully funded. Investments in Emera As at December 31, 2025 and 2024, assets related to the pension funds and post-retirement benefit plans did not hold any material investments in Emera or its subsidiaries securities. However, as a significant portion of assets for the benefit plan are held in pooled assets, there may be indirect investments in these securities. EMERA 2025 ANNUAL REPORT 115
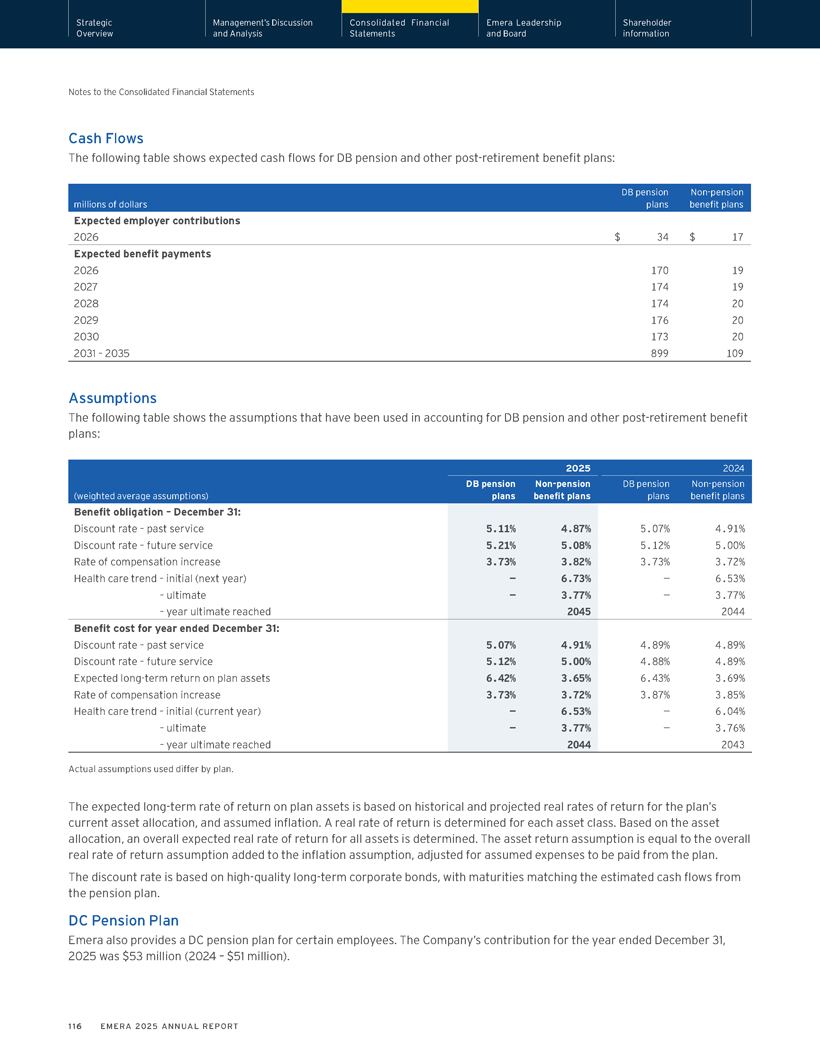
Strategic Management’s Discussion Consolidated Financial Emera Leadership Shareholder Overview and Analysis Statements and Board information Notes to the Consolidated Financial Statements Cash Flows The following table shows expected cash flows for DB pension and other post-retirement benefit plans: DB pension Non-pension millions of dollars plans benefit plans Expected employer contributions 2026 $ 34 $ 17 Expected benefit payments 2026 170 19 2027 174 19 2028 174 20 2029 176 20 2030 173 20 2031 – 2035 899 109 Assumptions The following table shows the assumptions that have been used in accounting for DB pension and other post-retirement benefit plans: 2025 2024 DB pension Non-pension DB pension Non-pension (weighted average assumptions) plans benefit plans plans benefit plans Benefit obligation – December 31: Discount rate – past service 5.11% 4.87% 5.07% 4.91% Discount rate – future service 5.21% 5.08% 5.12% 5.00% Rate of compensation increase 3.73% 3.82% 3.73% 3.72% Health care trend – initial (next year) — 6.73% — 6.53% – ultimate — 3.77% — 3.77% – year ultimate reached 2045 2044 Benefit cost for year ended December 31: Discount rate – past service 5.07% 4.91% 4.89% 4.89% Discount rate – future service 5.12% 5.00% 4.88% 4.89% Expected long-term return on plan assets 6.42% 3.65% 6.43% 3.69% Rate of compensation increase 3.73% 3.72% 3.87% 3.85% Health care trend – initial (current year) — 6.53% — 6.04% – ultimate — 3.77% — 3.76% – year ultimate reached 2044 2043 Actual assumptions used differ by plan. The expected long-term rate of return on plan assets is based on historical and projected real rates of return for the plan’s current asset allocation, and assumed inflation. A real rate of return is determined for each asset class. Based on the asset allocation, an overall expected real rate of return for all assets is determined. The asset return assumption is equal to the overall real rate of return assumption added to the inflation assumption, adjusted for assumed expenses to be paid from the plan. The discount rate is based on high-quality long-term corporate bonds, with maturities matching the estimated cash flows from the pension plan. DC Pension Plan Emera also provides a DC pension plan for certain employees. The Company’s contribution for the year ended December 31, 2025 was $53 million (2024 – $51 million). 116 EMERA 2025 ANNUAL REPORT
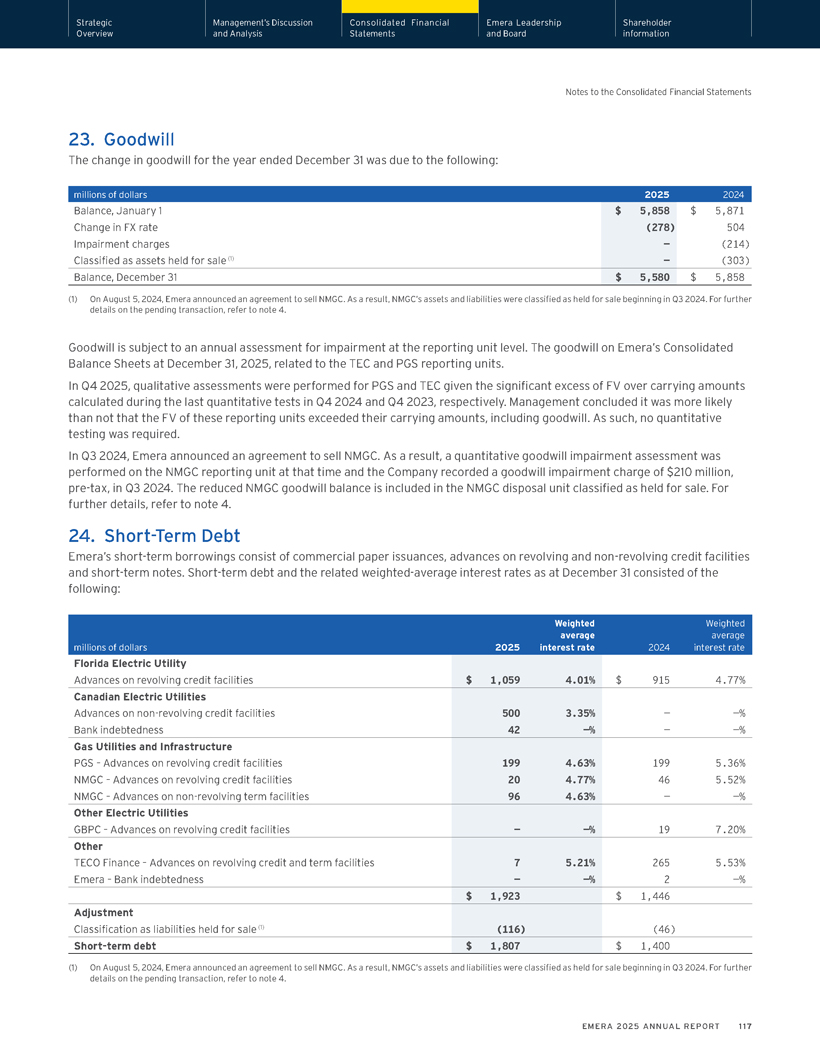
Strategic Management’s Discussion Consolidated Financial Emera Leadership Shareholder Overview and Analysis Statements and Board information Notes to the Consolidated Financial Statements 23. Goodwill The change in goodwill for the year ended December 31 was due to the following: millions of dollars 2025 2024 Balance, January 1 $ 5,858 $ 5,871 Change in FX rate (278) 504 Impairment charges — (214) Classified as assets held for sale (1) — (303) Balance, December 31 $ 5,580 $ 5,858 (1) On August 5, 2024, Emera announced an agreement to sell NMGC. As a result, NMGC’s assets and liabilities were classified as held for sale beginning in Q3 2024. For further details on the pending transaction, refer to note 4. Goodwill is subject to an annual assessment for impairment at the reporting unit level. The goodwill on Emera’s Consolidated Balance Sheets at December 31, 2025, related to the TEC and PGS reporting units. In Q4 2025, qualitative assessments were performed for PGS and TEC given the significant excess of FV over carrying amounts calculated during the last quantitative tests in Q4 2024 and Q4 2023, respectively. Management concluded it was more likely than not that the FV of these reporting units exceeded their carrying amounts, including goodwill. As such, no quantitative testing was required. In Q3 2024, Emera announced an agreement to sell NMGC. As a result, a quantitative goodwill impairment assessment was performed on the NMGC reporting unit at that time and the Company recorded a goodwill impairment charge of $210 million, pre-tax, in Q3 2024. The reduced NMGC goodwill balance is included in the NMGC disposal unit classified as held for sale. For further details, refer to note 4. 24. Short-Term Debt Emera’s short-term borrowings consist of commercial paper issuances, advances on revolving and non-revolving credit facilities and short-term notes. Short-term debt and the related weighted-average interest rates as at December 31 consisted of the following: Weighted Weighted average average millions of dollars 2025 interest rate 2024 interest rate Florida Electric Utility Advances on revolving credit facilities $ 1,059 4.01% $ 915 4.77% Canadian Electric Utilities Advances on non-revolving credit facilities 500 3.35% — —% Bank indebtedness 42 —% — —% Gas Utilities and Infrastructure PGS – Advances on revolving credit facilities 199 4.63% 199 5.36% NMGC – Advances on revolving credit facilities 20 4.77% 46 5.52% NMGC – Advances on non-revolving term facilities 96 4.63% — —% Other Electric Utilities GBPC – Advances on revolving credit facilities — —% 19 7.20% Other TECO Finance – Advances on revolving credit and term facilities 7 5.21% 265 5.53% Emera – Bank indebtedness — —% 2 —% $ 1,923 $ 1,446 Adjustment Classification as liabilities held for sale (1) (116) (46) Short-term debt $ 1,807 $ 1,400 (1) On August 5, 2024, Emera announced an agreement to sell NMGC. As a result, NMGC’s assets and liabilities were classified as held for sale beginning in Q3 2024. For further details on the pending transaction, refer to note 4. EMERA 2025 ANNUAL REPORT 117
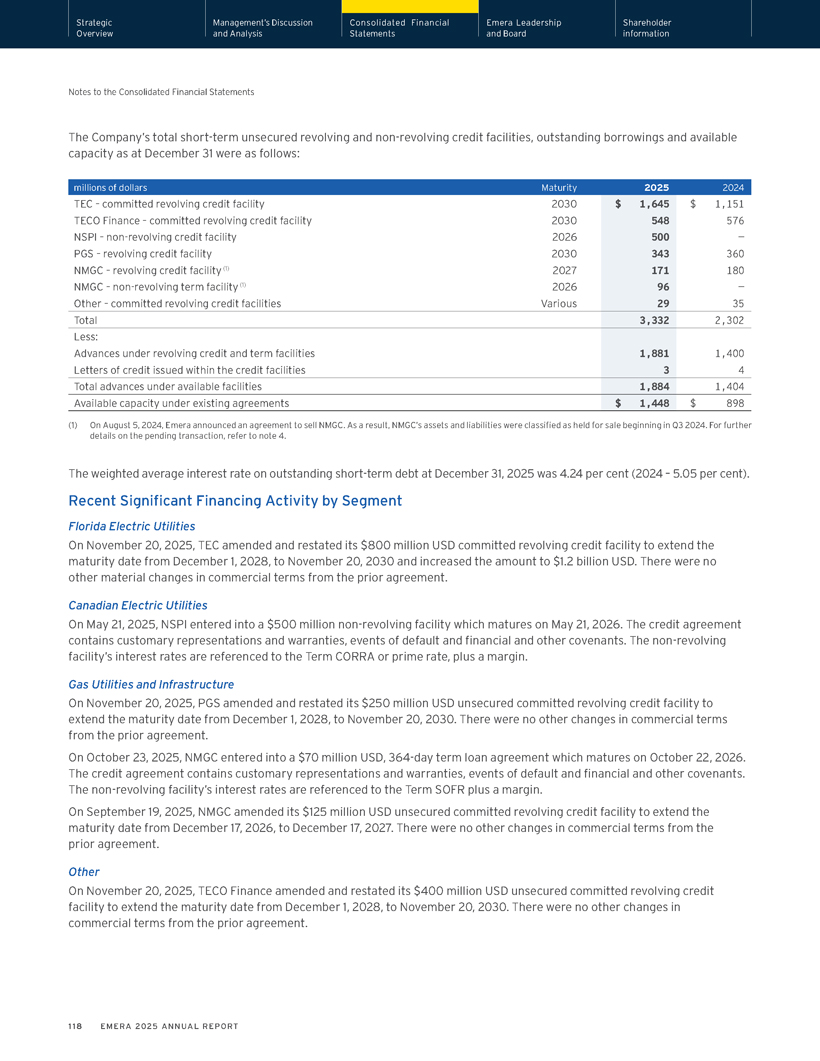
Strategic Management’s Discussion Consolidated Financial Emera Leadership Shareholder Overview and Analysis Statements and Board information Notes to the Consolidated Financial Statements The Company’s total short-term unsecured revolving and non-revolving credit facilities, outstanding borrowings and available capacity as at December 31 were as follows: millions of dollars Maturity 2025 2024 TEC – committed revolving credit facility 2030 $ 1,645 $ 1,151 TECO Finance – committed revolving credit facility 2030 548 576 NSPI – non-revolving credit facility 2026 500 —PGS – revolving credit facility 2030 343 360 NMGC – revolving credit facility (1) 2027 171 180 NMGC – non-revolving term facility (1) 2026 96 —Other – committed revolving credit facilities Various 29 35 Total 3,332 2,302 Less: Advances under revolving credit and term facilities 1,881 1,400 Letters of credit issued within the credit facilities 3 4 Total advances under available facilities 1,884 1,404 Available capacity under existing agreements $ 1,448 $ 898 (1) On August 5, 2024, Emera announced an agreement to sell NMGC. As a result, NMGC’s assets and liabilities were classified as held for sale beginning in Q3 2024. For further details on the pending transaction, refer to note 4. The weighted average interest rate on outstanding short-term debt at December 31, 2025 was 4.24 per cent (2024 – 5.05 per cent). Recent Significant Financing Activity by Segment Florida Electric Utilities On November 20, 2025, TEC amended and restated its $800 million USD committed revolving credit facility to extend the maturity date from December 1, 2028, to November 20, 2030 and increased the amount to $1.2 billion USD. There were no other material changes in commercial terms from the prior agreement. Canadian Electric Utilities On May 21, 2025, NSPI entered into a $500 million non-revolving facility which matures on May 21, 2026. The credit agreement contains customary representations and warranties, events of default and financial and other covenants. The non-revolving facility’s interest rates are referenced to the Term CORRA or prime rate, plus a margin. Gas Utilities and Infrastructure On November 20, 2025, PGS amended and restated its $250 million USD unsecured committed revolving credit facility to extend the maturity date from December 1, 2028, to November 20, 2030. There were no other changes in commercial terms from the prior agreement. On October 23, 2025, NMGC entered into a $70 million USD, 364-day term loan agreement which matures on October 22, 2026. The credit agreement contains customary representations and warranties, events of default and financial and other covenants. The non-revolving facility’s interest rates are referenced to the Term SOFR plus a margin. On September 19, 2025, NMGC amended its $125 million USD unsecured committed revolving credit facility to extend the maturity date from December 17, 2026, to December 17, 2027. There were no other changes in commercial terms from the prior agreement. Other On November 20, 2025, TECO Finance amended and restated its $400 million USD unsecured committed revolving credit facility to extend the maturity date from December 1, 2028, to November 20, 2030. There were no other changes in commercial terms from the prior agreement. 118 EMERA 2025 ANNUAL REPORT
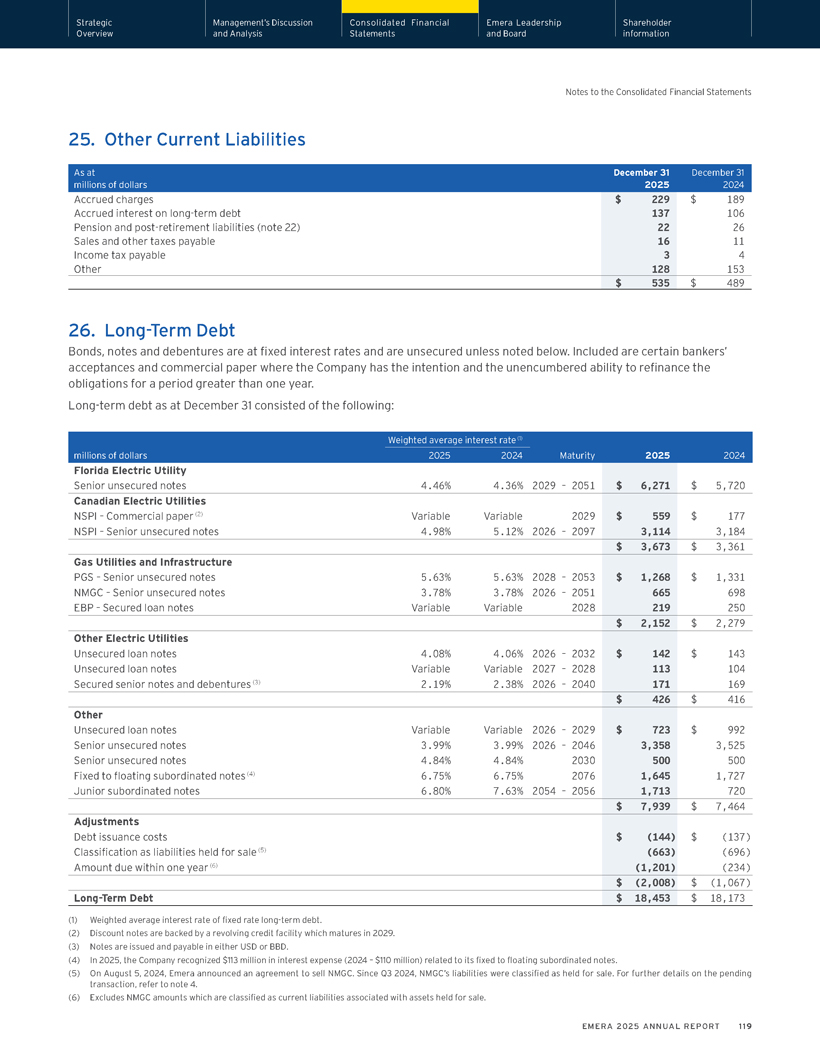
Strategic Management’s Discussion Consolidated Financial Emera Leadership Shareholder Overview and Analysis Statements and Board information Notes to the Consolidated Financial Statements The Company’s total short-term unsecured revolving and non-revolving credit facilities, outstanding borrowings and available capacity as at December 31 were as follows: millions of dollars Maturity 2025 2024 TEC – committed revolving credit facility 2030 $ 1,645 $ 1,151 TECO Finance – committed revolving credit facility 2030 548 576 NSPI – non-revolving credit facility 2026 500 —PGS – revolving credit facility 2030 343 360 NMGC – revolving credit facility (1) 2027 171 180 NMGC – non-revolving term facility (1) 2026 96 —Other – committed revolving credit facilities Various 29 35 Total 3,332 2,302 Less: Advances under revolving credit and term facilities 1,881 1,400 Letters of credit issued within the credit facilities 3 4 Total advances under available facilities 1,884 1,404 Available capacity under existing agreements $ 1,448 $ 898 (1) On August 5, 2024, Emera announced an agreement to sell NMGC. As a result, NMGC’s assets and liabilities were classified as held for sale beginning in Q3 2024. For further details on the pending transaction, refer to note 4. The weighted average interest rate on outstanding short-term debt at December 31, 2025 was 4.24 per cent (2024 – 5.05 per cent). Recent Significant Financing Activity by Segment Florida Electric Utilities On November 20, 2025, TEC amended and restated its $800 million USD committed revolving credit facility to extend the maturity date from December 1, 2028, to November 20, 2030 and increased the amount to $1.2 billion USD. There were no other material changes in commercial terms from the prior agreement. Canadian Electric Utilities On May 21, 2025, NSPI entered into a $500 million non-revolving facility which matures on May 21, 2026. The credit agreement contains customary representations and warranties, events of default and financial and other covenants. The non-revolving facility’s interest rates are referenced to the Term CORRA or prime rate, plus a margin. Gas Utilities and Infrastructure On November 20, 2025, PGS amended and restated its $250 million USD unsecured committed revolving credit facility to extend the maturity date from December 1, 2028, to November 20, 2030. There were no other changes in commercial terms from the prior agreement. On October 23, 2025, NMGC entered into a $70 million USD, 364-day term loan agreement which matures on October 22, 2026. The credit agreement contains customary representations and warranties, events of default and financial and other covenants. The non-revolving facility’s interest rates are referenced to the Term SOFR plus a margin. On September 19, 2025, NMGC amended its $125 million USD unsecured committed revolving credit facility to extend the maturity date from December 17, 2026, to December 17, 2027. There were no other changes in commercial terms from the prior agreement. Other On November 20, 2025, TECO Finance amended and restated its $400 million USD unsecured committed revolving credit facility to extend the maturity date from December 1, 2028, to November 20, 2030. There were no other changes in commercial terms from the prior agreement. 118 EMERA 2025 ANNUAL REPORT Strategic Management’s Discussion Consolidated Financial Emera Leadership Shareholder Overview and Analysis Statements and Board information Notes to the Consolidated Financial Statements 25. Other Current Liabilities As at December 31 December 31 millions of dollars 2025 2024 Accrued charges $ 229 $ 189 Accrued interest on long-term debt 137 106 Pension and post-retirement liabilities (note 22) 22 26 Sales and other taxes payable 16 11 Income tax payable 3 4 Other 128 153 $ 535 $ 489 26. Long-Term Debt Bonds, notes and debentures are at fixed interest rates and are unsecured unless noted below. Included are certain bankers’ acceptances and commercial paper where the Company has the intention and the unencumbered ability to refinance the obligations for a period greater than one year. Long-term debt as at December 31 consisted of the following: Weighted average interest rate (1) millions of dollars 2025 2024 Maturity 2025 2024 Florida Electric Utility Senior unsecured notes 4.46% 4.36% 2029—2051 $ 6,271 $ 5,720 Canadian Electric Utilities NSPI – Commercial paper (2) Variable Variable 2029 $ 559 $ 177 NSPI – Senior unsecured notes 4.98% 5.12% 2026—2097 3,114 3,184 $ 3,673 $ 3,361 Gas Utilities and Infrastructure PGS – Senior unsecured notes 5.63% 5.63% 2028—2053 $ 1,268 $ 1,331 NMGC – Senior unsecured notes 3.78% 3.78% 2026—2051 665 698 EBP – Secured loan notes Variable Variable 2028 219 250 $ 2,152 $ 2,279 Other Electric Utilities Unsecured loan notes 4.08% 4.06% 2026—2032 $ 142 $ 143 Unsecured loan notes Variable Variable 2027—2028 113 104 Secured senior notes and debentures (3) 2.19% 2.38% 2026—2040 171 169 $ 426 $ 416 Other Unsecured loan notes Variable Variable 2026—2029 $ 723 $ 992 Senior unsecured notes 3.99% 3.99% 2026—2046 3,358 3,525 Senior unsecured notes 4.84% 4.84% 2030 500 500 Fixed to floating subordinated notes (4) 6.75% 6.75% 2076 1,645 1,727 Junior subordinated notes 6.80% 7.63% 2054—2056 1,713 720 $ 7,939 $ 7,464 Adjustments Debt issuance costs $ (144) $ (137) Classification as liabilities held for sale (5) (663) (696) Amount due within one year (6) (1,201) (234) $ (2,008) $ (1,067) Long-Term Debt $ 18,453 $ 18,173 (1) Weighted average interest rate of fixed rate long-term debt. (2) Discount notes are backed by a revolving credit facility which matures in 2029. (3) Notes are issued and payable in either USD or BBD. (4) In 2025, the Company recognized $113 million in interest expense (2024 – $110 million) related to its fixed to floating subordinated notes. (5) On August 5, 2024, Emera announced an agreement to sell NMGC. Since Q3 2024, NMGC’s liabilities were classified as held for sale. For further details on the pending transaction, refer to note 4. (6) Excludes NMGC amounts which are classified as current liabilities associated with assets held for sale. EMERA 2025 ANNUAL REPORT 119
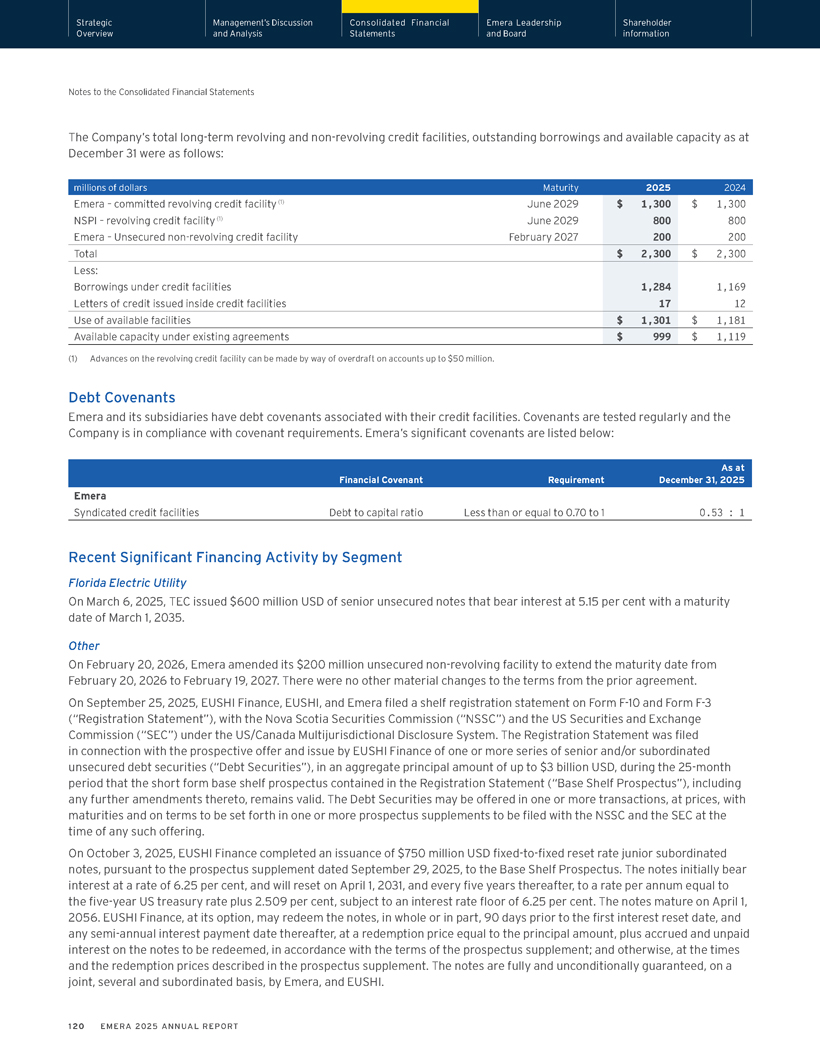
Strategic Management’s Discussion Consolidated Financial Emera Leadership Shareholder Overview and Analysis Statements and Board information Notes to the Consolidated Financial Statements The Company’s total long-term revolving and non-revolving credit facilities, outstanding borrowings and available capacity as at December 31 were as follows: millions of dollars Maturity 2025 2024 Emera – committed revolving credit facility (1) June 2029 $ 1,300 $ 1,300 NSPI – revolving credit facility (1) June 2029 800 800 Emera – Unsecured non-revolving credit facility February 2027 200 200 Total $ 2,300 $ 2,300 Less: Borrowings under credit facilities 1,284 1,169 Letters of credit issued inside credit facilities 17 12 Use of available facilities $ 1,301 $ 1,181 Available capacity under existing agreements $ 999 $ 1,119 (1) Advances on the revolving credit facility can be made by way of overdraft on accounts up to $50 million. Debt Covenants Emera and its subsidiaries have debt covenants associated with their credit facilities. Covenants are tested regularly and the Company is in compliance with covenant requirements. Emera’s significant covenants are listed below: As at Financial Covenant Requirement December 31, 2025 Emera Syndicated credit facilities Debt to capital ratio Less than or equal to 0.70 to 1 0.53 : 1 Recent Significant Financing Activity by Segment Florida Electric Utility On March 6, 2025, TEC issued $600 million USD of senior unsecured notes that bear interest at 5.15 per cent with a maturity date of March 1, 2035. Other On February 20, 2026, Emera amended its $200 million unsecured non-revolving facility to extend the maturity date from February 20, 2026 to February 19, 2027. There were no other material changes to the terms from the prior agreement. On September 25, 2025, EUSHI Finance, EUSHI, and Emera filed a shelf registration statement on Form F-10 and Form F-3 (“Registration Statement”), with the Nova Scotia Securities Commission (“NSSC”) and the US Securities and Exchange Commission (“SEC”) under the US/Canada Multijurisdictional Disclosure System. The Registration Statement was filed in connection with the prospective offer and issue by EUSHI Finance of one or more series of senior and/or subordinated unsecured debt securities (“Debt Securities”), in an aggregate principal amount of up to $3 billion USD, during the 25-month period that the short form base shelf prospectus contained in the Registration Statement (“Base Shelf Prospectus”), including any further amendments thereto, remains valid. The Debt Securities may be offered in one or more transactions, at prices, with maturities and on terms to be set forth in one or more prospectus supplements to be filed with the NSSC and the SEC at the time of any such offering. On October 3, 2025, EUSHI Finance completed an issuance of $750 million USD fixed-to-fixed reset rate junior subordinated notes, pursuant to the prospectus supplement dated September 29, 2025, to the Base Shelf Prospectus. The notes initially bear interest at a rate of 6.25 per cent, and will reset on April 1, 2031, and every five years thereafter, to a rate per annum equal to the five-year US treasury rate plus 2.509 per cent, subject to an interest rate floor of 6.25 per cent. The notes mature on April 1, 2056. EUSHI Finance, at its option, may redeem the notes, in whole or in part, 90 days prior to the first interest reset date, and any semi-annual interest payment date thereafter, at a redemption price equal to the principal amount, plus accrued and unpaid interest on the notes to be redeemed, in accordance with the terms of the prospectus supplement; and otherwise, at the times and the redemption prices described in the prospectus supplement. The notes are fully and unconditionally guaranteed, on a joint, several and subordinated basis, by Emera, and EUSHI. 120 EMERA 2025 ANNUAL REPORT
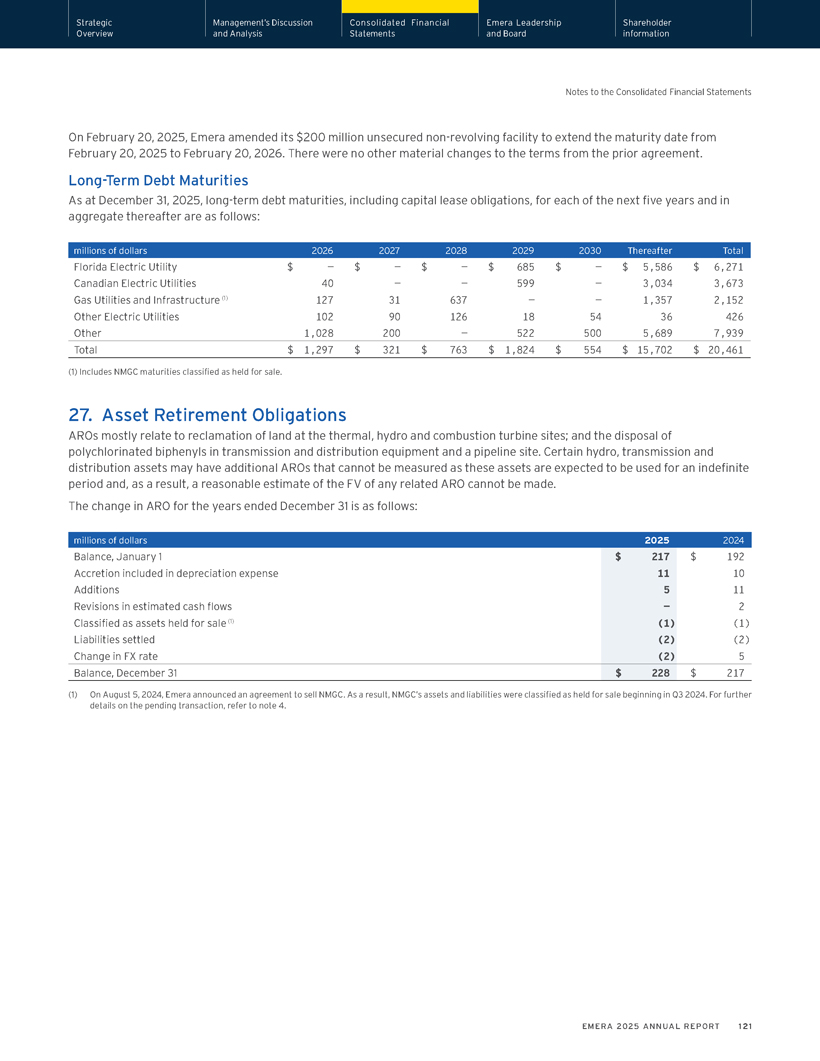
Strategic Management’s Discussion Consolidated Financial Emera Leadership Shareholder Overview and Analysis Statements and Board information Notes to the Consolidated Financial Statements On February 20, 2025, Emera amended its $200 million unsecured non-revolving facility to extend the maturity date from February 20, 2025 to February 20, 2026. There were no other material changes to the terms from the prior agreement. Long-Term Debt Maturities As at December 31, 2025, long-term debt maturities, including capital lease obligations, for each of the next five years and in aggregate thereafter are as follows: millions of dollars 2026 2027 2028 2029 2030 Thereafter Total Florida Electric Utility $ — $ — $ — $ 685 $ — $ 5,586 $ 6,271 Canadian Electric Utilities 40 — — 599 — 3,034 3,673 Gas Utilities and Infrastructure (1) 127 31 637 — — 1,357 2,152 Other Electric Utilities 102 90 126 18 54 36 426 Other 1,028 200 — 522 500 5,689 7,939 Total $ 1,297 $ 321 $ 763 $ 1,824 $ 554 $ 15,702 $ 20,461 (1) Includes NMGC maturities classified as held for sale. 27. Asset Retirement Obligations AROs mostly relate to reclamation of land at the thermal, hydro and combustion turbine sites; and the disposal of polychlorinated biphenyls in transmission and distribution equipment and a pipeline site. Certain hydro, transmission and distribution assets may have additional AROs that cannot be measured as these assets are expected to be used for an indefinite period and, as a result, a reasonable estimate of the FV of any related ARO cannot be made. The change in ARO for the years ended December 31 is as follows: millions of dollars 2025 2024 Balance, January 1 $ 217 $ 192 Accretion included in depreciation expense 11 10 Additions 5 11 Revisions in estimated cash flows — 2 Classified as assets held for sale (1) (1) (1) Liabilities settled (2) (2) Change in FX rate (2) 5 Balance, December 31 $ 228 $ 217 (1) On August 5, 2024, Emera announced an agreement to sell NMGC. As a result, NMGC’s assets and liabilities were classified as held for sale beginning in Q3 2024. For further details on the pending transaction, refer to note 4. EMERA 2025 ANNUAL REPORT 121
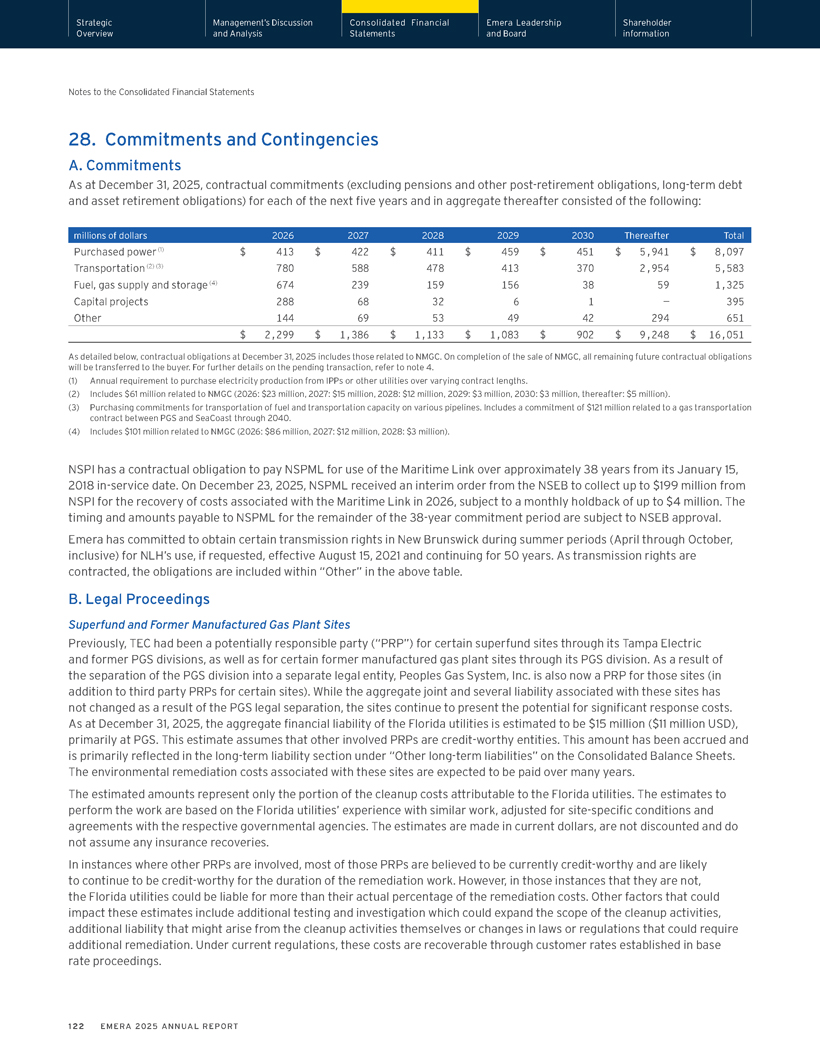
Strategic Management’s Discussion Consolidated Financial Emera Leadership Shareholder Overview and Analysis Statements and Board information Notes to the Consolidated Financial Statements 28. Commitments and Contingencies A. Commitments As at December 31, 2025, contractual commitments (excluding pensions and other post-retirement obligations, long-term debt and asset retirement obligations) for each of the next five years and in aggregate thereafter consisted of the following: millions of dollars 2026 2027 2028 2029 2030 Thereafter Total Purchased power (1) $ 413 $ 422 $ 411 $ 459 $ 451 $ 5,941 $ 8,097 Transportation (2) (3) 780 588 478 413 370 2,954 5,583 Fuel, gas supply and storage (4) 674 239 159 156 38 59 1,325 Capital projects 288 68 32 6 1 — 395 Other 144 69 53 49 42 294 651 $ 2,299 $ 1,386 $ 1,133 $ 1,083 $ 902 $ 9,248 $ 16,051 As detailed below, contractual obligations at December 31, 2025 includes those related to NMGC. On completion of the sale of NMGC, all remaining future contractual obligations will be transferred to the buyer. For further details on the pending transaction, refer to note 4. (1) Annual requirement to purchase electricity production from IPPs or other utilities over varying contract lengths. (2) Includes $61 million related to NMGC (2026: $23 million, 2027: $15 million, 2028: $12 million, 2029: $3 million, 2030: $3 million, thereafter: $5 million). (3) Purchasing commitments for transportation of fuel and transportation capacity on various pipelines. Includes a commitment of $121 million related to a gas transportation contract between PGS and SeaCoast through 2040. (4) Includes $101 million related to NMGC (2026: $86 million, 2027: $12 million, 2028: $3 million). NSPI has a contractual obligation to pay NSPML for use of the Maritime Link over approximately 38 years from its January 15, 2018 in-service date. On December 23, 2025, NSPML received an interim order from the NSEB to collect up to $199 million from NSPI for the recovery of costs associated with the Maritime Link in 2026, subject to a monthly holdback of up to $4 million. The timing and amounts payable to NSPML for the remainder of the 38-year commitment period are subject to NSEB approval. Emera has committed to obtain certain transmission rights in New Brunswick during summer periods (April through October, inclusive) for NLH’s use, if requested, effective August 15, 2021 and continuing for 50 years. As transmission rights are contracted, the obligations are included within “Other” in the above table. B. Legal Proceedings Superfund and Former Manufactured Gas Plant Sites Previously, TEC had been a potentially responsible party (“PRP”) for certain superfund sites through its Tampa Electric and former PGS divisions, as well as for certain former manufactured gas plant sites through its PGS division. As a result of the separation of the PGS division into a separate legal entity, Peoples Gas System, Inc. is also now a PRP for those sites (in addition to third party PRPs for certain sites). While the aggregate joint and several liability associated with these sites has not changed as a result of the PGS legal separation, the sites continue to present the potential for significant response costs. As at December 31, 2025, the aggregate financial liability of the Florida utilities is estimated to be $15 million ($11 million USD), primarily at PGS. This estimate assumes that other involved PRPs are credit-worthy entities. This amount has been accrued and is primarily reflected in the long-term liability section under “Other long-term liabilities” on the Consolidated Balance Sheets. The environmental remediation costs associated with these sites are expected to be paid over many years. The estimated amounts represent only the portion of the cleanup costs attributable to the Florida utilities. The estimates to perform the work are based on the Florida utilities’ experience with similar work, adjusted for site-specific conditions and agreements with the respective governmental agencies. The estimates are made in current dollars, are not discounted and do not assume any insurance recoveries. In instances where other PRPs are involved, most of those PRPs are believed to be currently credit-worthy and are likely to continue to be credit-worthy for the duration of the remediation work. However, in those instances that they are not, the Florida utilities could be liable for more than their actual percentage of the remediation costs. Other factors that could impact these estimates include additional testing and investigation which could expand the scope of the cleanup activities, additional liability that might arise from the cleanup activities themselves or changes in laws or regulations that could require additional remediation. Under current regulations, these costs are recoverable through customer rates established in base rate proceedings. 122 EMERA 2025 ANNUAL REPORT
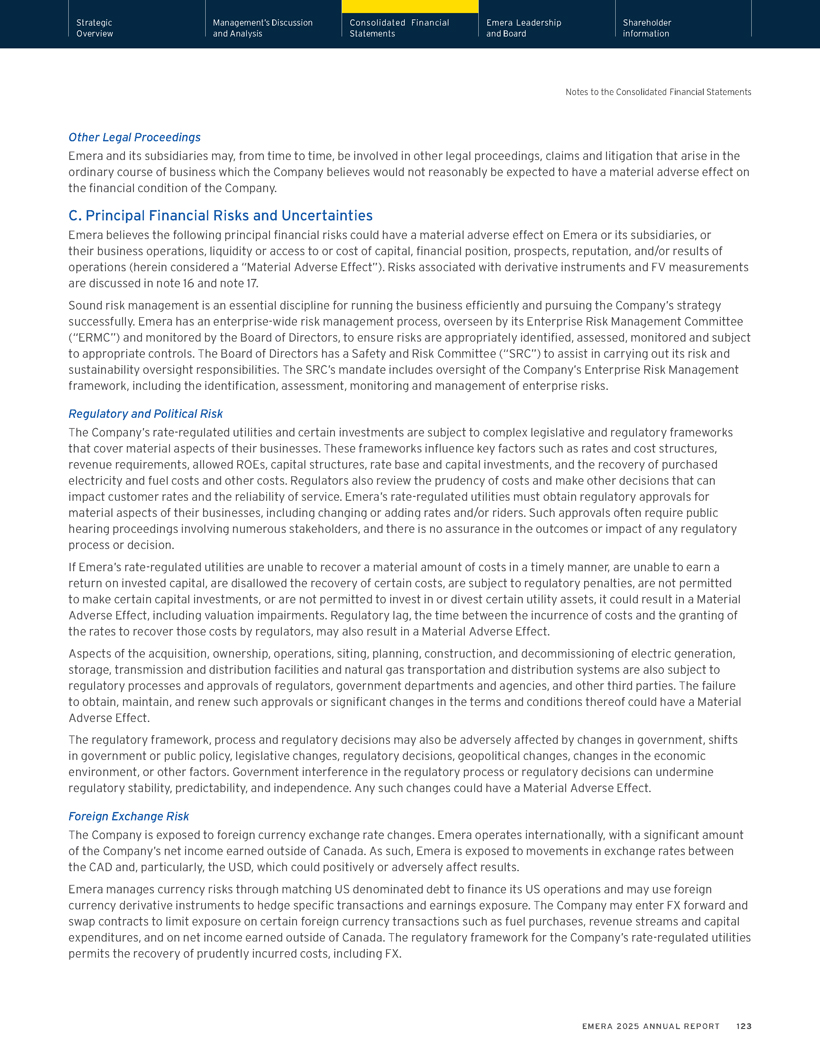
Strategic Management’s Discussion Consolidated Financial Emera Leadership Shareholder Overview and Analysis Statements and Board information Notes to the Consolidated Financial Statements Other Legal Proceedings Emera and its subsidiaries may, from time to time, be involved in other legal proceedings, claims and litigation that arise in the ordinary course of business which the Company believes would not reasonably be expected to have a material adverse effect on the financial condition of the Company. C. Principal Financial Risks and Uncertainties Emera believes the following principal financial risks could have a material adverse effect on Emera or its subsidiaries, or their business operations, liquidity or access to or cost of capital, financial position, prospects, reputation, and/or results of operations (herein considered a “Material Adverse Effect”). Risks associated with derivative instruments and FV measurements are discussed in note 16 and note 17. Sound risk management is an essential discipline for running the business efficiently and pursuing the Company’s strategy successfully. Emera has an enterprise-wide risk management process, overseen by its Enterprise Risk Management Committee (“ERMC”) and monitored by the Board of Directors, to ensure risks are appropriately identified, assessed, monitored and subject to appropriate controls. The Board of Directors has a Safety and Risk Committee (“SRC”) to assist in carrying out its risk and sustainability oversight responsibilities. The SRC’s mandate includes oversight of the Company’s Enterprise Risk Management framework, including the identification, assessment, monitoring and management of enterprise risks. Regulatory and Political Risk The Company’s rate-regulated utilities and certain investments are subject to complex legislative and regulatory frameworks that cover material aspects of their businesses. These frameworks influence key factors such as rates and cost structures, revenue requirements, allowed ROEs, capital structures, rate base and capital investments, and the recovery of purchased electricity and fuel costs and other costs. Regulators also review the prudency of costs and make other decisions that can impact customer rates and the reliability of service. Emera’s rate-regulated utilities must obtain regulatory approvals for material aspects of their businesses, including changing or adding rates and/or riders. Such approvals often require public hearing proceedings involving numerous stakeholders, and there is no assurance in the outcomes or impact of any regulatory process or decision. If Emera’s rate-regulated utilities are unable to recover a material amount of costs in a timely manner, are unable to earn a return on invested capital, are disallowed the recovery of certain costs, are subject to regulatory penalties, are not permitted to make certain capital investments, or are not permitted to invest in or divest certain utility assets, it could result in a Material Adverse Effect, including valuation impairments. Regulatory lag, the time between the incurrence of costs and the granting of the rates to recover those costs by regulators, may also result in a Material Adverse Effect. Aspects of the acquisition, ownership, operations, siting, planning, construction, and decommissioning of electric generation, storage, transmission and distribution facilities and natural gas transportation and distribution systems are also subject to regulatory processes and approvals of regulators, government departments and agencies, and other third parties. The failure to obtain, maintain, and renew such approvals or significant changes in the terms and conditions thereof could have a Material Adverse Effect. The regulatory framework, process and regulatory decisions may also be adversely affected by changes in government, shifts in government or public policy, legislative changes, regulatory decisions, geopolitical changes, changes in the economic environment, or other factors. Government interference in the regulatory process or regulatory decisions can undermine regulatory stability, predictability, and independence. Any such changes could have a Material Adverse Effect. Foreign Exchange Risk The Company is exposed to foreign currency exchange rate changes. Emera operates internationally, with a significant amount of the Company’s net income earned outside of Canada. As such, Emera is exposed to movements in exchange rates between the CAD and, particularly, the USD, which could positively or adversely affect results. Emera manages currency risks through matching US denominated debt to finance its US operations and may use foreign currency derivative instruments to hedge specific transactions and earnings exposure. The Company may enter FX forward and swap contracts to limit exposure on certain foreign currency transactions such as fuel purchases, revenue streams and capital expenditures, and on net income earned outside of Canada. The regulatory framework for the Company’s rate-regulated utilities permits the recovery of prudently incurred costs, including FX. EMERA 2025 ANNUAL REPORT 123
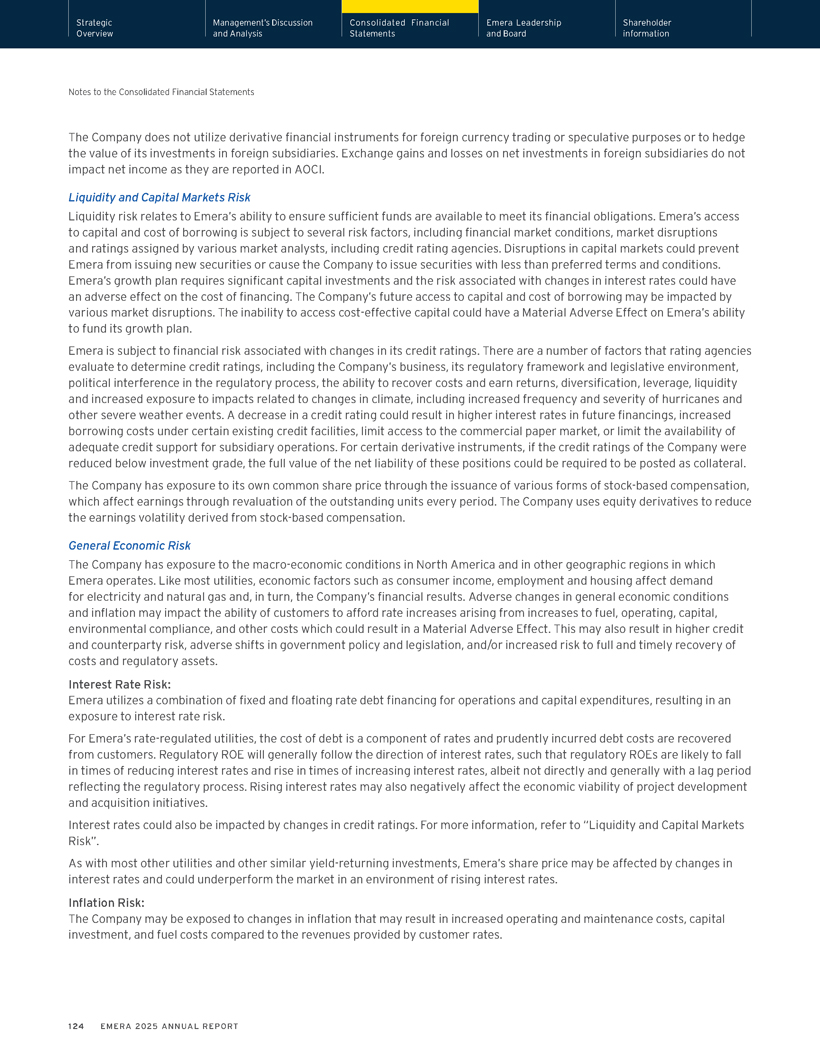
Strategic Management’s Discussion Consolidated Financial Emera Leadership Shareholder Overview and Analysis Statements and Board information Notes to the Consolidated Financial Statements The Company does not utilize derivative financial instruments for foreign currency trading or speculative purposes or to hedge the value of its investments in foreign subsidiaries. Exchange gains and losses on net investments in foreign subsidiaries do not impact net income as they are reported in AOCI. Liquidity and Capital Markets Risk Liquidity risk relates to Emera’s ability to ensure sufficient funds are available to meet its financial obligations. Emera’s access to capital and cost of borrowing is subject to several risk factors, including financial market conditions, market disruptions and ratings assigned by various market analysts, including credit rating agencies. Disruptions in capital markets could prevent Emera from issuing new securities or cause the Company to issue securities with less than preferred terms and conditions. Emera’s growth plan requires significant capital investments and the risk associated with changes in interest rates could have an adverse effect on the cost of financing. The Company’s future access to capital and cost of borrowing may be impacted by various market disruptions. The inability to access cost-effective capital could have a Material Adverse Effect on Emera’s ability to fund its growth plan. Emera is subject to financial risk associated with changes in its credit ratings. There are a number of factors that rating agencies evaluate to determine credit ratings, including the Company’s business, its regulatory framework and legislative environment, political interference in the regulatory process, the ability to recover costs and earn returns, diversification, leverage, liquidity and increased exposure to impacts related to changes in climate, including increased frequency and severity of hurricanes and other severe weather events. A decrease in a credit rating could result in higher interest rates in future financings, increased borrowing costs under certain existing credit facilities, limit access to the commercial paper market, or limit the availability of adequate credit support for subsidiary operations. For certain derivative instruments, if the credit ratings of the Company were reduced below investment grade, the full value of the net liability of these positions could be required to be posted as collateral. The Company has exposure to its own common share price through the issuance of various forms of stock-based compensation, which affect earnings through revaluation of the outstanding units every period. The Company uses equity derivatives to reduce the earnings volatility derived from stock-based compensation. General Economic Risk The Company has exposure to the macro-economic conditions in North America and in other geographic regions in which Emera operates. Like most utilities, economic factors such as consumer income, employment and housing affect demand for electricity and natural gas and, in turn, the Company’s financial results. Adverse changes in general economic conditions and inflation may impact the ability of customers to afford rate increases arising from increases to fuel, operating, capital, environmental compliance, and other costs which could result in a Material Adverse Effect. This may also result in higher credit and counterparty risk, adverse shifts in government policy and legislation, and/or increased risk to full and timely recovery of costs and regulatory assets. Interest Rate Risk: Emera utilizes a combination of fixed and floating rate debt financing for operations and capital expenditures, resulting in an exposure to interest rate risk. For Emera’s rate-regulated utilities, the cost of debt is a component of rates and prudently incurred debt costs are recovered from customers. Regulatory ROE will generally follow the direction of interest rates, such that regulatory ROEs are likely to fall in times of reducing interest rates and rise in times of increasing interest rates, albeit not directly and generally with a lag period reflecting the regulatory process. Rising interest rates may also negatively affect the economic viability of project development and acquisition initiatives. Interest rates could also be impacted by changes in credit ratings. For more information, refer to “Liquidity and Capital Markets Risk”. As with most other utilities and other similar yield-returning investments, Emera’s share price may be affected by changes in interest rates and could underperform the market in an environment of rising interest rates. Inflation Risk: The Company may be exposed to changes in inflation that may result in increased operating and maintenance costs, capital investment, and fuel costs compared to the revenues provided by customer rates. 124 EMERA 2025 ANNUAL REPORT
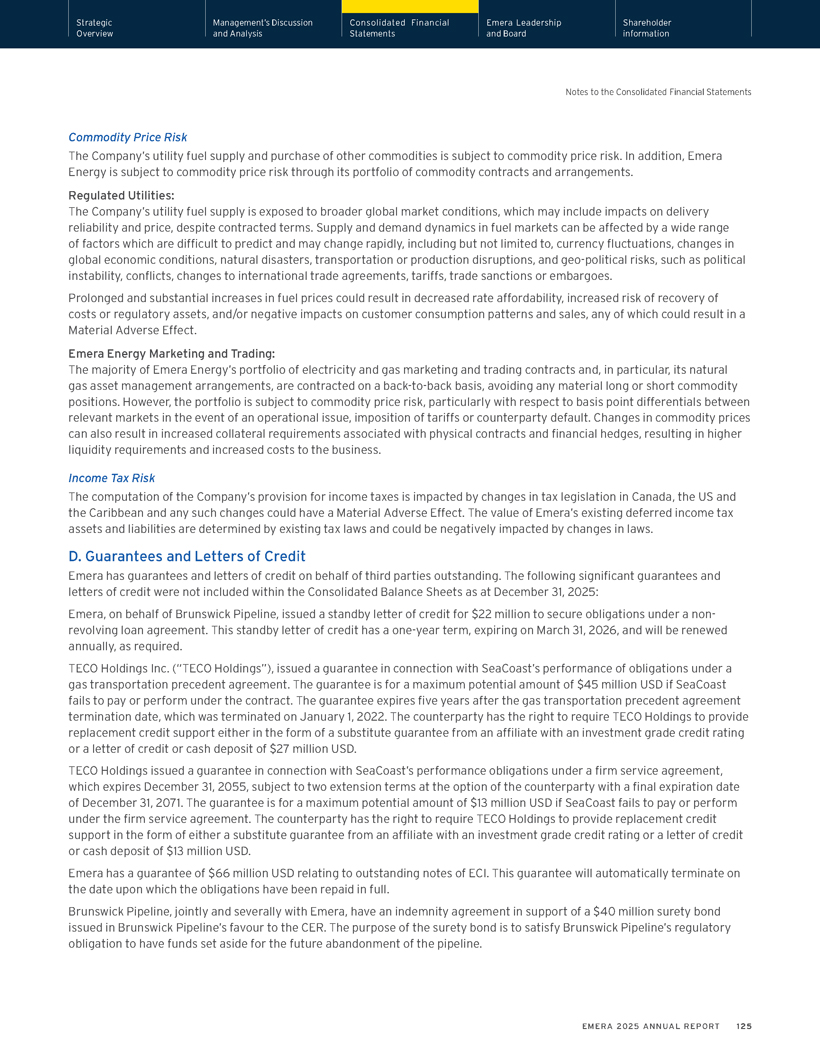
Strategic Management’s Discussion Consolidated Financial Emera Leadership Shareholder Overview and Analysis Statements and Board information Notes to the Consolidated Financial Statements Commodity Price Risk The Company’s utility fuel supply and purchase of other commodities is subject to commodity price risk. In addition, Emera Energy is subject to commodity price risk through its portfolio of commodity contracts and arrangements. Regulated Utilities: The Company’s utility fuel supply is exposed to broader global market conditions, which may include impacts on delivery reliability and price, despite contracted terms. Supply and demand dynamics in fuel markets can be affected by a wide range of factors which are difficult to predict and may change rapidly, including but not limited to, currency fluctuations, changes in global economic conditions, natural disasters, transportation or production disruptions, and geo-political risks, such as political instability, conflicts, changes to international trade agreements, tariffs, trade sanctions or embargoes. Prolonged and substantial increases in fuel prices could result in decreased rate affordability, increased risk of recovery of costs or regulatory assets, and/or negative impacts on customer consumption patterns and sales, any of which could result in a Material Adverse Effect. Emera Energy Marketing and Trading: The majority of Emera Energy’s portfolio of electricity and gas marketing and trading contracts and, in particular, its natural gas asset management arrangements, are contracted on a back-to-back basis, avoiding any material long or short commodity positions. However, the portfolio is subject to commodity price risk, particularly with respect to basis point differentials between relevant markets in the event of an operational issue, imposition of tariffs or counterparty default. Changes in commodity prices can also result in increased collateral requirements associated with physical contracts and financial hedges, resulting in higher liquidity requirements and increased costs to the business. Income Tax Risk The computation of the Company’s provision for income taxes is impacted by changes in tax legislation in Canada, the US and the Caribbean and any such changes could have a Material Adverse Effect. The value of Emera’s existing deferred income tax assets and liabilities are determined by existing tax laws and could be negatively impacted by changes in laws. D. Guarantees and Letters of Credit Emera has guarantees and letters of credit on behalf of third parties outstanding. The following significant guarantees and letters of credit were not included within the Consolidated Balance Sheets as at December 31, 2025: Emera, on behalf of Brunswick Pipeline, issued a standby letter of credit for $22 million to secure obligations under a non-revolving loan agreement. This standby letter of credit has a one-year term, expiring on March 31, 2026, and will be renewed annually, as required. TECO Holdings Inc. (“TECO Holdings”), issued a guarantee in connection with SeaCoast’s performance of obligations under a gas transportation precedent agreement. The guarantee is for a maximum potential amount of $45 million USD if SeaCoast fails to pay or perform under the contract. The guarantee expires five years after the gas transportation precedent agreement termination date, which was terminated on January 1, 2022. The counterparty has the right to require TECO Holdings to provide replacement credit support either in the form of a substitute guarantee from an affiliate with an investment grade credit rating or a letter of credit or cash deposit of $27 million USD. TECO Holdings issued a guarantee in connection with SeaCoast’s performance obligations under a firm service agreement, which expires December 31, 2055, subject to two extension terms at the option of the counterparty with a final expiration date of December 31, 2071. The guarantee is for a maximum potential amount of $13 million USD if SeaCoast fails to pay or perform under the firm service agreement. The counterparty has the right to require TECO Holdings to provide replacement credit support in the form of either a substitute guarantee from an affiliate with an investment grade credit rating or a letter of credit or cash deposit of $13 million USD. Emera has a guarantee of $66 million USD relating to outstanding notes of ECI. This guarantee will automatically terminate on the date upon which the obligations have been repaid in full. Brunswick Pipeline, jointly and severally with Emera, have an indemnity agreement in support of a $40 million surety bond issued in Brunswick Pipeline’s favour to the CER. The purpose of the surety bond is to satisfy Brunswick Pipeline’s regulatory obligation to have funds set aside for the future abandonment of the pipeline. EMERA 2025 ANNUAL REPORT 125
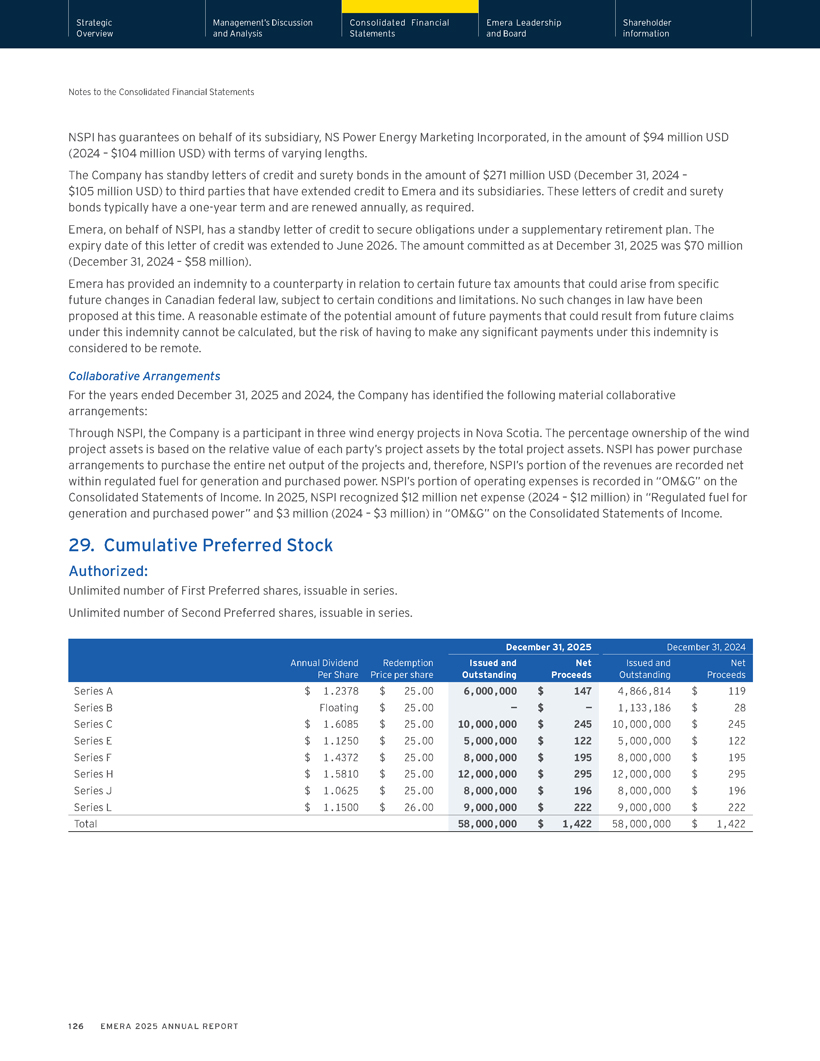
Strategic Management’s Discussion Consolidated Financial Emera Leadership Shareholder Overview and Analysis Statements and Board information Notes to the Consolidated Financial Statements NSPI has guarantees on behalf of its subsidiary, NS Power Energy Marketing Incorporated, in the amount of $94 million USD (2024 – $104 million USD) with terms of varying lengths. The Company has standby letters of credit and surety bonds in the amount of $271 million USD (December 31, 2024 – $105 million USD) to third parties that have extended credit to Emera and its subsidiaries. These letters of credit and surety bonds typically have a one-year term and are renewed annually, as required. Emera, on behalf of NSPI, has a standby letter of credit to secure obligations under a supplementary retirement plan. The expiry date of this letter of credit was extended to June 2026. The amount committed as at December 31, 2025 was $70 million (December 31, 2024 – $58 million). Emera has provided an indemnity to a counterparty in relation to certain future tax amounts that could arise from specific future changes in Canadian federal law, subject to certain conditions and limitations. No such changes in law have been proposed at this time. A reasonable estimate of the potential amount of future payments that could result from future claims under this indemnity cannot be calculated, but the risk of having to make any significant payments under this indemnity is considered to be remote. Collaborative Arrangements For the years ended December 31, 2025 and 2024, the Company has identified the following material collaborative arrangements: Through NSPI, the Company is a participant in three wind energy projects in Nova Scotia. The percentage ownership of the wind project assets is based on the relative value of each party’s project assets by the total project assets. NSPI has power purchase arrangements to purchase the entire net output of the projects and, therefore, NSPI’s portion of the revenues are recorded net within regulated fuel for generation and purchased power. NSPI’s portion of operating expenses is recorded in “OM&G” on the Consolidated Statements of Income. In 2025, NSPI recognized $12 million net expense (2024 – $12 million) in “Regulated fuel for generation and purchased power” and $3 million (2024 – $3 million) in “OM&G” on the Consolidated Statements of Income. 29. Cumulative Preferred Stock Authorized: Unlimited number of First Preferred shares, issuable in series. Unlimited number of Second Preferred shares, issuable in series. December 31, 2025 December 31, 2024 Annual Dividend Redemption Issued and Net Issued and Net Per Share Price per share Outstanding Proceeds Outstanding Proceeds Series A $ 1.2378 $ 25.00 6,000,000 $ 147 4,866,814 $ 119 Series B Floating $ 25.00 — $ — 1,133,186 $ 28 Series C $ 1.6085 $ 25.00 10,000,000 $ 245 10,000,000 $ 245 Series E $ 1.1250 $ 25.00 5,000,000 $ 122 5,000,000 $ 122 Series F $ 1.4372 $ 25.00 8,000,000 $ 195 8,000,000 $ 195 Series H $ 1.5810 $ 25.00 12,000,000 $ 295 12,000,000 $ 295 Series J $ 1.0625 $ 25.00 8,000,000 $ 196 8,000,000 $ 196 Series L $ 1.1500 $ 26.00 9,000,000 $ 222 9,000,000 $ 222 Total 58,000,000 $ 1,422 58,000,000 $ 1,422 126 EMERA 2025 ANNUAL REPORT
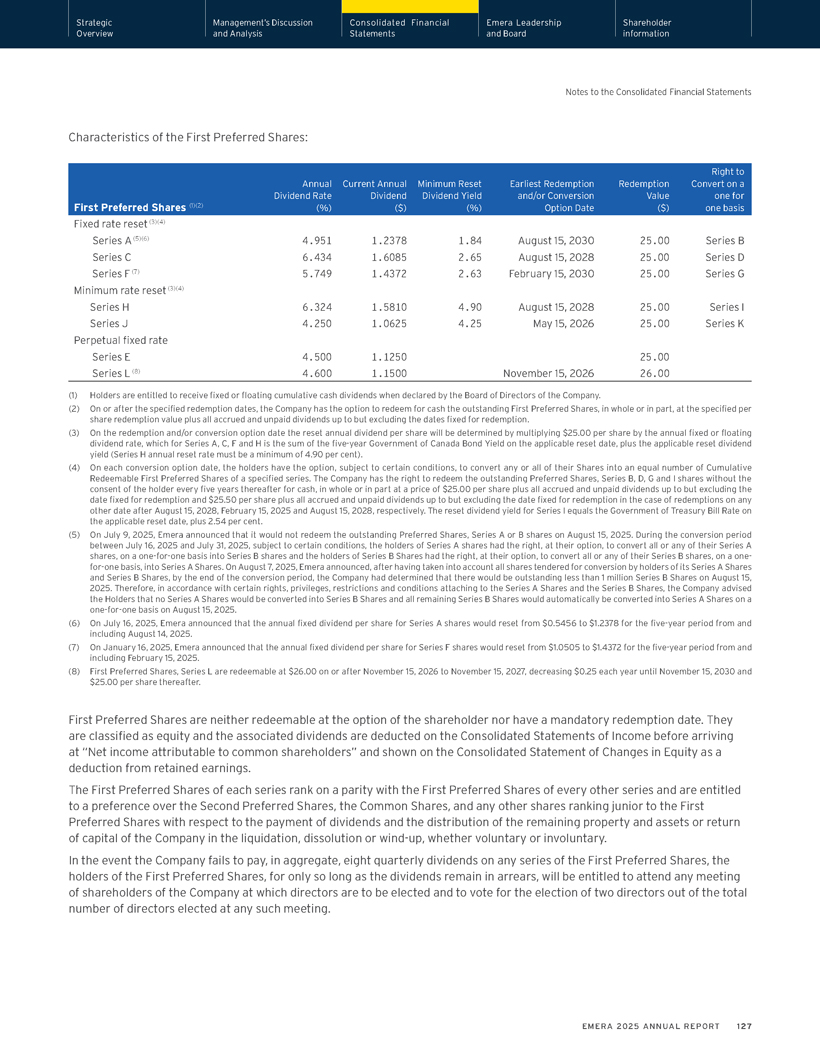
Strategic Management’s Discussion Consolidated Financial Emera Leadership Shareholder Overview and Analysis Statements and Board information Notes to the Consolidated Financial Statements Characteristics of the First Preferred Shares: Right to Annual Current Annual Minimum Reset Earliest Redemption Redemption Convert on a Dividend Rate Dividend Dividend Yield and/or Conversion Value one for First Preferred Shares (1)(2) (%) ($) (%) Option Date ($) one basis Fixed rate reset (3)(4) Series A (5)(6) 4.951 1.2378 1.84 August 15, 2030 25.00 Series B Series C 6.434 1.6085 2.65 August 15, 2028 25.00 Series D Series F (7) 5.749 1.4372 2.63 February 15, 2030 25.00 Series G Minimum rate reset (3)(4) Series H 6.324 1.5810 4.90 August 15, 2028 25.00 Series I Series J 4.250 1.0625 4.25 May 15, 2026 25.00 Series K Perpetual fixed rate Series E 4.500 1.1250 25.00 Series L (8) 4.600 1.1500 November 15, 2026 26.00 (1) Holders are entitled to receive fixed or floating cumulative cash dividends when declared by the Board of Directors of the Company. (2) On or after the specified redemption dates, the Company has the option to redeem for cash the outstanding First Preferred Shares, in whole or in part, at the specified per share redemption value plus all accrued and unpaid dividends up to but excluding the dates fixed for redemption. (3) On the redemption and/or conversion option date the reset annual dividend per share will be determined by multiplying $25.00 per share by the annual fixed or floating dividend rate, which for Series A, C, F and H is the sum of the five-year Government of Canada Bond Yield on the applicable reset date, plus the applicable reset dividend yield (Series H annual reset rate must be a minimum of 4.90 per cent). (4) On each conversion option date, the holders have the option, subject to certain conditions, to convert any or all of their Shares into an equal number of Cumulative Redeemable First Preferred Shares of a specified series. The Company has the right to redeem the outstanding Preferred Shares, Series B, D, G and I shares without the consent of the holder every five years thereafter for cash, in whole or in part at a price of $25.00 per share plus all accrued and unpaid dividends up to but excluding the date fixed for redemption and $25.50 per share plus all accrued and unpaid dividends up to but excluding the date fixed for redemption in the case of redemptions on any other date after August 15, 2028, February 15, 2025 and August 15, 2028, respectively. The reset dividend yield for Series I equals the Government of Treasury Bill Rate on the applicable reset date, plus 2.54 per cent. (5) On July 9, 2025, Emera announced that it would not redeem the outstanding Preferred Shares, Series A or B shares on August 15, 2025. During the conversion period between July 16, 2025 and July 31, 2025, subject to certain conditions, the holders of Series A shares had the right, at their option, to convert all or any of their Series A shares, on a one-for-one basis into Series B shares and the holders of Series B Shares had the right, at their option, to convert all or any of their Series B shares, on a one-for-one basis, into Series A Shares. On August 7, 2025, Emera announced, after having taken into account all shares tendered for conversion by holders of its Series A Shares and Series B Shares, by the end of the conversion period, the Company had determined that there would be outstanding less than 1 million Series B Shares on August 15, 2025. Therefore, in accordance with certain rights, privileges, restrictions and conditions attaching to the Series A Shares and the Series B Shares, the Company advised the Holders that no Series A Shares would be converted into Series B Shares and all remaining Series B Shares would automatically be converted into Series A Shares on a one-for-one basis on August 15, 2025. (6) On July 16, 2025, Emera announced that the annual fixed dividend per share for Series A shares would reset from $0.5456 to $1.2378 for the five-year period from and including August 14, 2025. (7) On January 16, 2025, Emera announced that the annual fixed dividend per share for Series F shares would reset from $1.0505 to $1.4372 for the five-year period from and including February 15, 2025. (8) First Preferred Shares, Series L are redeemable at $26.00 on or after November 15, 2026 to November 15, 2027, decreasing $0.25 each year until November 15, 2030 and $25.00 per share thereafter. First Preferred Shares are neither redeemable at the option of the shareholder nor have a mandatory redemption date. They are classified as equity and the associated dividends are deducted on the Consolidated Statements of Income before arriving at “Net income attributable to common shareholders” and shown on the Consolidated Statement of Changes in Equity as a deduction from retained earnings. The First Preferred Shares of each series rank on a parity with the First Preferred Shares of every other series and are entitled to a preference over the Second Preferred Shares, the Common Shares, and any other shares ranking junior to the First Preferred Shares with respect to the payment of dividends and the distribution of the remaining property and assets or return of capital of the Company in the liquidation, dissolution or wind-up, whether voluntary or involuntary. In the event the Company fails to pay, in aggregate, eight quarterly dividends on any series of the First Preferred Shares, the holders of the First Preferred Shares, for only so long as the dividends remain in arrears, will be entitled to attend any meeting of shareholders of the Company at which directors are to be elected and to vote for the election of two directors out of the total number of directors elected at any such meeting. EMERA 2025 ANNUAL REPORT 127
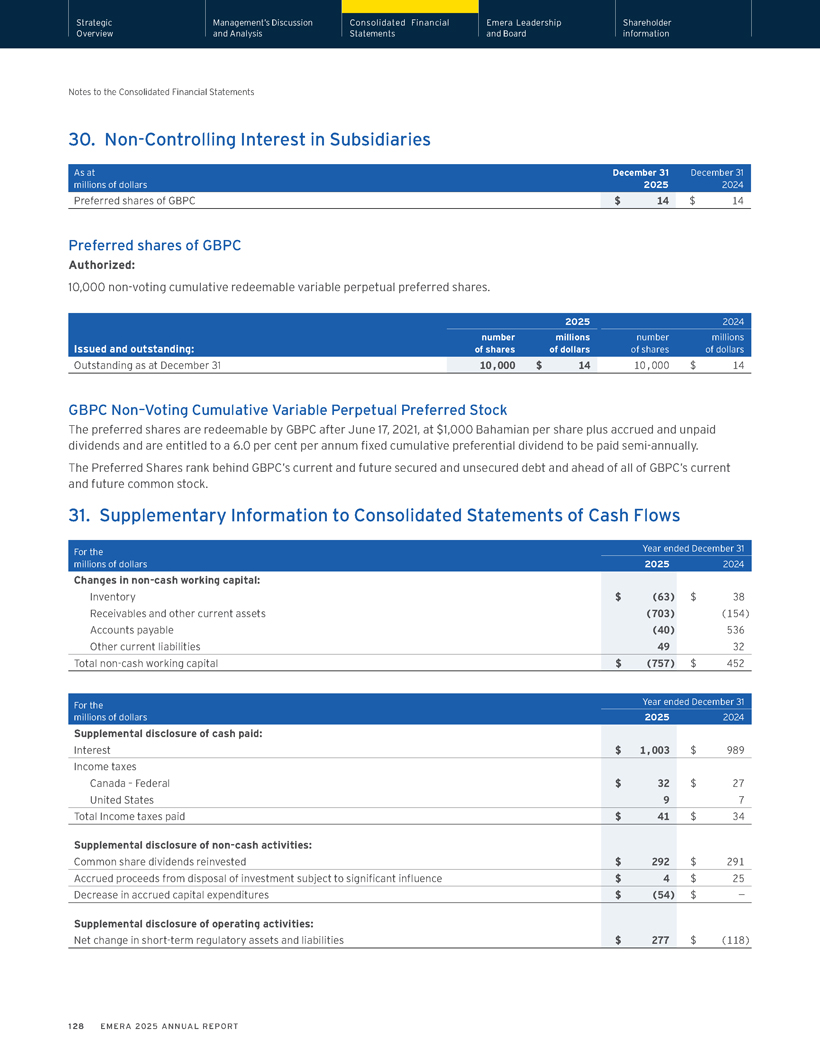
Strategic Management’s Discussion Consolidated Financial Emera Leadership Shareholder Overview and Analysis Statements and Board information Notes to the Consolidated Financial Statements 30. Non-Controlling Interest in Subsidiaries As at December 31 December 31 millions of dollars 2025 2024 Preferred shares of GBPC $ 14 $ 14 Preferred shares of GBPC Authorized: 10,000 non-voting cumulative redeemable variable perpetual preferred shares. 2025 2024 number millions number millions Issued and outstanding: of shares of dollars of shares of dollars Outstanding as at December 31 10,000 $ 14 10,000 $ 14 GBPC Non–Voting Cumulative Variable Perpetual Preferred Stock The preferred shares are redeemable by GBPC after June 17, 2021, at $1,000 Bahamian per share plus accrued and unpaid dividends and are entitled to a 6.0 per cent per annum fixed cumulative preferential dividend to be paid semi-annually. The Preferred Shares rank behind GBPC’s current and future secured and unsecured debt and ahead of all of GBPC’s current and future common stock. 31. Supplementary Information to Consolidated Statements of Cash Flows For the Year ended December 31 millions of dollars 2025 2024 Changes in non-cash working capital: Inventory $ (63) $ 38 Receivables and other current assets (703) (154) Accounts payable (40) 536 Other current liabilities 49 32 Total non-cash working capital $ (757) $ 452 For the Year ended December 31 millions of dollars 2025 2024 Supplemental disclosure of cash paid: Interest $ 1,003 $ 989 Income taxes Canada – Federal $ 32 $ 27 United States 9 7 Total Income taxes paid $ 41 $ 34 Supplemental disclosure of non-cash activities: Common share dividends reinvested $ 292 $ 291 Accrued proceeds from disposal of investment subject to significant influence $ 4 $ 25 Decrease in accrued capital expenditures $ (54) $ — Supplemental disclosure of operating activities: Net change in short-term regulatory assets and liabilities $ 277 $ (118) 128 EMERA 2025 ANNUAL REPORT
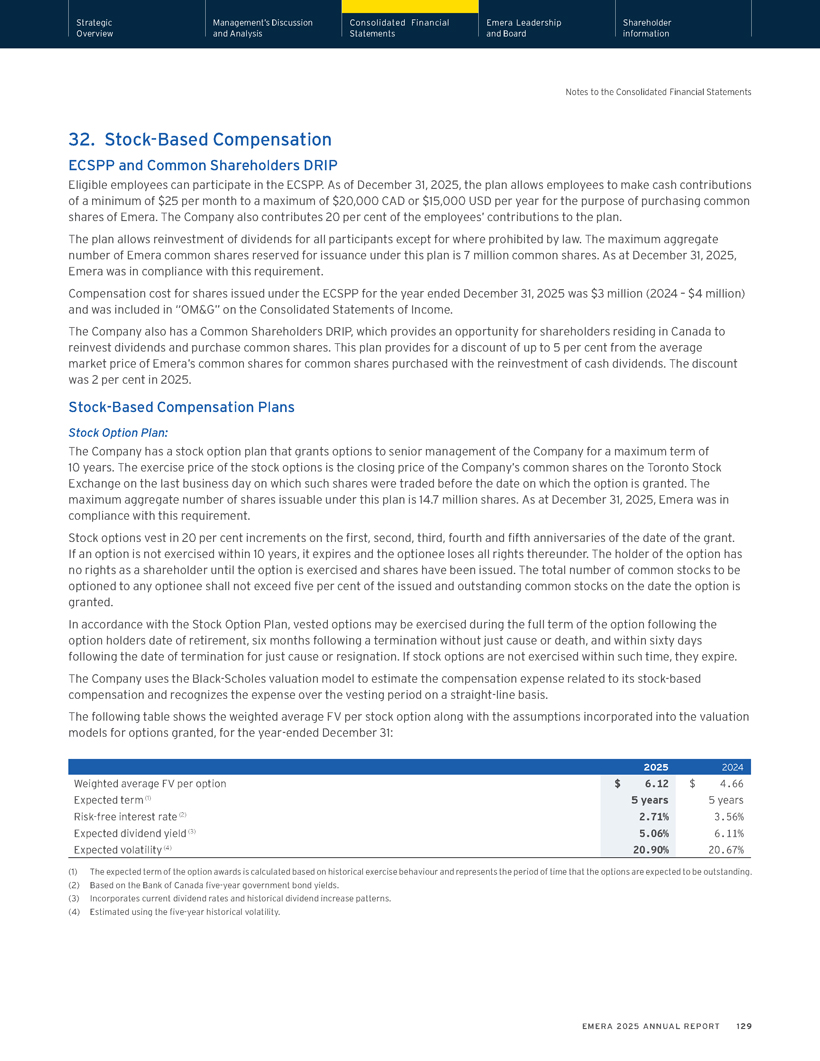
Strategic Management’s Discussion Consolidated Financial Emera Leadership Shareholder Overview and Analysis Statements and Board information Notes to the Consolidated Financial Statements 32. Stock-Based Compensation ECSPP and Common Shareholders DRIP Eligible employees can participate in the ECSPP. As of December 31, 2025, the plan allows employees to make cash contributions of a minimum of $25 per month to a maximum of $20,000 CAD or $15,000 USD per year for the purpose of purchasing common shares of Emera. The Company also contributes 20 per cent of the employees’ contributions to the plan. The plan allows reinvestment of dividends for all participants except for where prohibited by law. The maximum aggregate number of Emera common shares reserved for issuance under this plan is 7 million common shares. As at December 31, 2025, Emera was in compliance with this requirement. Compensation cost for shares issued under the ECSPP for the year ended December 31, 2025 was $3 million (2024 – $4 million) and was included in “OM&G” on the Consolidated Statements of Income. The Company also has a Common Shareholders DRIP, which provides an opportunity for shareholders residing in Canada to reinvest dividends and purchase common shares. This plan provides for a discount of up to 5 per cent from the average market price of Emera’s common shares for common shares purchased with the reinvestment of cash dividends. The discount was 2 per cent in 2025. Stock-Based Compensation Plans Stock Option Plan: The Company has a stock option plan that grants options to senior management of the Company for a maximum term of 10 years. The exercise price of the stock options is the closing price of the Company’s common shares on the Toronto Stock Exchange on the last business day on which such shares were traded before the date on which the option is granted. The maximum aggregate number of shares issuable under this plan is 14.7 million shares. As at December 31, 2025, Emera was in compliance with this requirement. Stock options vest in 20 per cent increments on the first, second, third, fourth and fifth anniversaries of the date of the grant. If an option is not exercised within 10 years, it expires and the optionee loses all rights thereunder. The holder of the option has no rights as a shareholder until the option is exercised and shares have been issued. The total number of common stocks to be optioned to any optionee shall not exceed five per cent of the issued and outstanding common stocks on the date the option is granted. In accordance with the Stock Option Plan, vested options may be exercised during the full term of the option following the option holders date of retirement, six months following a termination without just cause or death, and within sixty days following the date of termination for just cause or resignation. If stock options are not exercised within such time, they expire. The Company uses the Black-Scholes valuation model to estimate the compensation expense related to its stock-based compensation and recognizes the expense over the vesting period on a straight-line basis. The following table shows the weighted average FV per stock option along with the assumptions incorporated into the valuation models for options granted, for the year-ended December 31: 2025 2024 Weighted average FV per option $ 6.12 $ 4.66 Expected term (1) 5 years 5 years Risk-free interest rate (2) 2.71% 3.56% Expected dividend yield (3) 5.06% 6.11% Expected volatility (4) 20.90% 20.67% (1) The expected term of the option awards is calculated based on historical exercise behaviour and represents the period of time that the options are expected to be outstanding. (2) Based on the Bank of Canada five-year government bond yields. (3) Incorporates current dividend rates and historical dividend increase patterns. (4) Estimated using the five-year historical volatility. EMERA 2025 ANNUAL REPORT 129
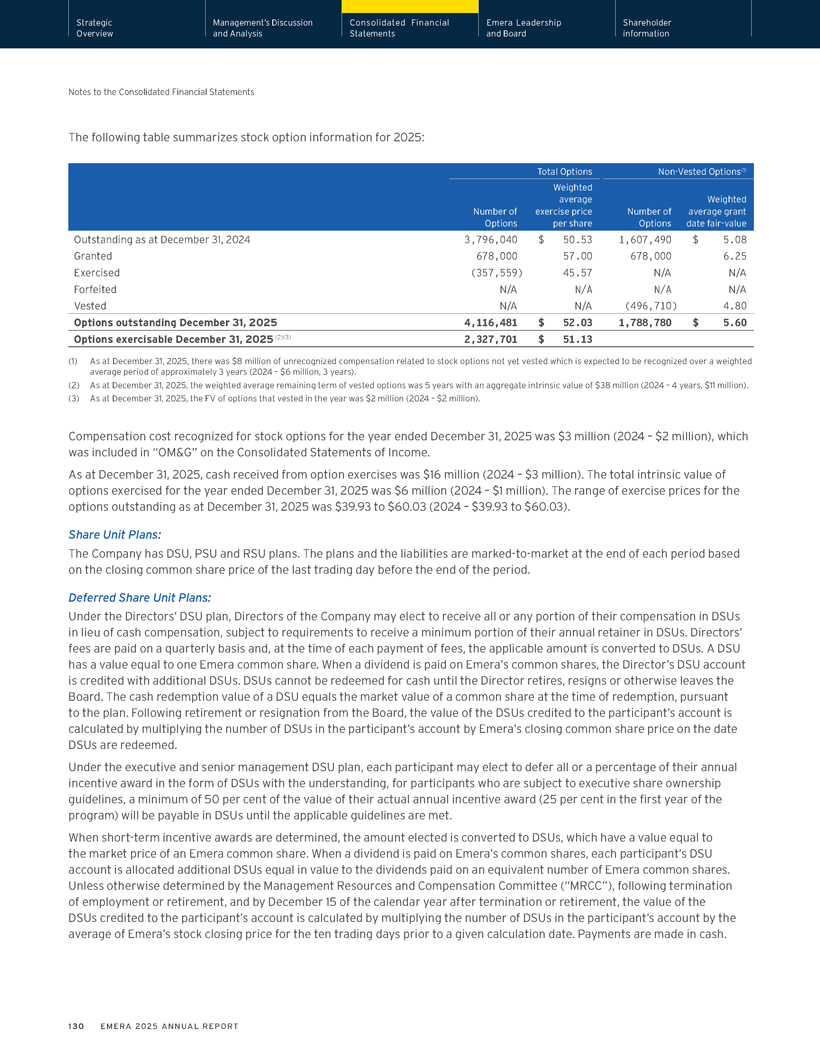
Strategic Management’s Discussion Consolidated Financial Emera Leadership Shareholder Overview and Analysis Statements and Board information Notes to the Consolidated Financial Statements The following table summarizes stock option information for 2025: Total Options Non-Vested Options(1) Weighted average Weighted Number of exercise price Number of average grant Options per share Options date fair-value Outstanding as at December 31, 2024 3,796,040 $ 50.53 1,607,490 $ 5.08 Granted 678,000 57.00 678,000 6.25 Exercised (357,559) 45.57 N/A N/A Forfeited N/A N/A N/A N/A Vested N/A N/A (496,710) 4.80 Options outstanding December 31, 2025 4,116,481 $ 52.03 1,788,780 $ 5.60 Options exercisable December 31, 2025 (2)(3) 2,327,701 $ 51.13 (1) As at December 31, 2025, there was $8 million of unrecognized compensation related to stock options not yet vested which is expected to be recognized over a weighted average period of approximately 3 years (2024 – $6 million, 3 years). (2) As at December 31, 2025, the weighted average remaining term of vested options was 5 years with an aggregate intrinsic value of $38 million (2024 – 4 years, $11 million). (3) As at December 31, 2025, the FV of options that vested in the year was $2 million (2024 – $2 million). Compensation cost recognized for stock options for the year ended December 31, 2025 was $3 million (2024 – $2 million), which was included in “OM&G” on the Consolidated Statements of Income. As at December 31, 2025, cash received from option exercises was $16 million (2024 – $3 million). The total intrinsic value of options exercised for the year ended December 31, 2025 was $6 million (2024 – $1 million). The range of exercise prices for the options outstanding as at December 31, 2025 was $39.93 to $60.03 (2024 – $39.93 to $60.03). Share Unit Plans: The Company has DSU, PSU and RSU plans. The plans and the liabilities are marked-to-market at the end of each period based on the closing common share price of the last trading day before the end of the period. Deferred Share Unit Plans: Under the Directors’ DSU plan, Directors of the Company may elect to receive all or any portion of their compensation in DSUs in lieu of cash compensation, subject to requirements to receive a minimum portion of their annual retainer in DSUs. Directors’ fees are paid on a quarterly basis and, at the time of each payment of fees, the applicable amount is converted to DSUs. A DSU has a value equal to one Emera common share. When a dividend is paid on Emera’s common shares, the Director’s DSU account is credited with additional DSUs. DSUs cannot be redeemed for cash until the Director retires, resigns or otherwise leaves the Board. The cash redemption value of a DSU equals the market value of a common share at the time of redemption, pursuant to the plan. Following retirement or resignation from the Board, the value of the DSUs credited to the participant’s account is calculated by multiplying the number of DSUs in the participant’s account by Emera’s closing common share price on the date DSUs are redeemed. Under the executive and senior management DSU plan, each participant may elect to defer all or a percentage of their annual incentive award in the form of DSUs with the understanding, for participants who are subject to executive share ownership guidelines, a minimum of 50 per cent of the value of their actual annual incentive award (25 per cent in the first year of the program) will be payable in DSUs until the applicable guidelines are met. When short-term incentive awards are determined, the amount elected is converted to DSUs, which have a value equal to the market price of an Emera common share. When a dividend is paid on Emera’s common shares, each participant’s DSU account is allocated additional DSUs equal in value to the dividends paid on an equivalent number of Emera common shares. Unless otherwise determined by the Management Resources and Compensation Committee (“MRCC”), following termination of employment or retirement, and by December 15 of the calendar year after termination or retirement, the value of the DSUs credited to the participant’s account is calculated by multiplying the number of DSUs in the participant’s account by the average of Emera’s stock closing price for the ten trading days prior to a given calculation date. Payments are made in cash. 130 EMERA 2025 ANNUAL REPORT
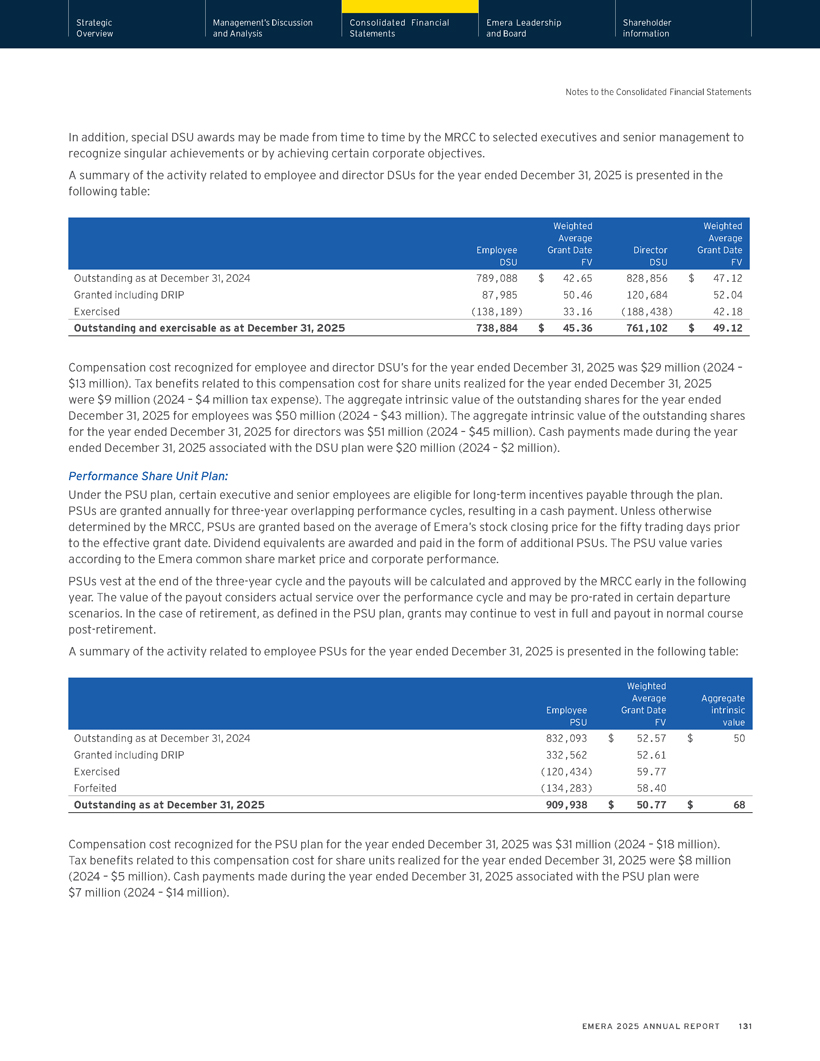
Strategic Management’s Discussion Consolidated Financial Emera Leadership Shareholder Overview and Analysis Statements and Board information Notes to the Consolidated Financial Statements In addition, special DSU awards may be made from time to time by the MRCC to selected executives and senior management to recognize singular achievements or by achieving certain corporate objectives. A summary of the activity related to employee and director DSUs for the year ended December 31, 2025 is presented in the following table: Weighted Weighted Average Average Employee Grant Date Director Grant Date DSU FV DSU FV Outstanding as at December 31, 2024 789,088 $ 42.65 828,856 $ 47.12 Granted including DRIP 87,985 50.46 120,684 52.04 Exercised (138,189) 33.16 (188,438) 42.18 Outstanding and exercisable as at December 31, 2025 738,884 $ 45.36 761,102 $ 49.12 Compensation cost recognized for employee and director DSU’s for the year ended December 31, 2025 was $29 million (2024 – $13 million). Tax benefits related to this compensation cost for share units realized for the year ended December 31, 2025 were $9 million (2024 – $4 million tax expense). The aggregate intrinsic value of the outstanding shares for the year ended December 31, 2025 for employees was $50 million (2024 – $43 million). The aggregate intrinsic value of the outstanding shares for the year ended December 31, 2025 for directors was $51 million (2024 – $45 million). Cash payments made during the year ended December 31, 2025 associated with the DSU plan were $20 million (2024 – $2 million). Performance Share Unit Plan: Under the PSU plan, certain executive and senior employees are eligible for long-term incentives payable through the plan. PSUs are granted annually for three-year overlapping performance cycles, resulting in a cash payment. Unless otherwise determined by the MRCC, PSUs are granted based on the average of Emera’s stock closing price for the fifty trading days prior to the effective grant date. Dividend equivalents are awarded and paid in the form of additional PSUs. The PSU value varies according to the Emera common share market price and corporate performance. PSUs vest at the end of the three-year cycle and the payouts will be calculated and approved by the MRCC early in the following year. The value of the payout considers actual service over the performance cycle and may be pro-rated in certain departure scenarios. In the case of retirement, as defined in the PSU plan, grants may continue to vest in full and payout in normal course post-retirement. A summary of the activity related to employee PSUs for the year ended December 31, 2025 is presented in the following table: Weighted Average Aggregate Employee Grant Date intrinsic PSU FV value Outstanding as at December 31, 2024 832,093 $ 52.57 $ 50 Granted including DRIP 332,562 52.61 Exercised (120,434) 59.77 Forfeited (134,283) 58.40 Outstanding as at December 31, 2025 909,938 $ 50.77 $ 68 Compensation cost recognized for the PSU plan for the year ended December 31, 2025 was $31 million (2024 – $18 million). Tax benefits related to this compensation cost for share units realized for the year ended December 31, 2025 were $8 million (2024 – $5 million). Cash payments made during the year ended December 31, 2025 associated with the PSU plan were $7 million (2024 – $14 million). EMERA 2025 ANNUAL REPORT 131
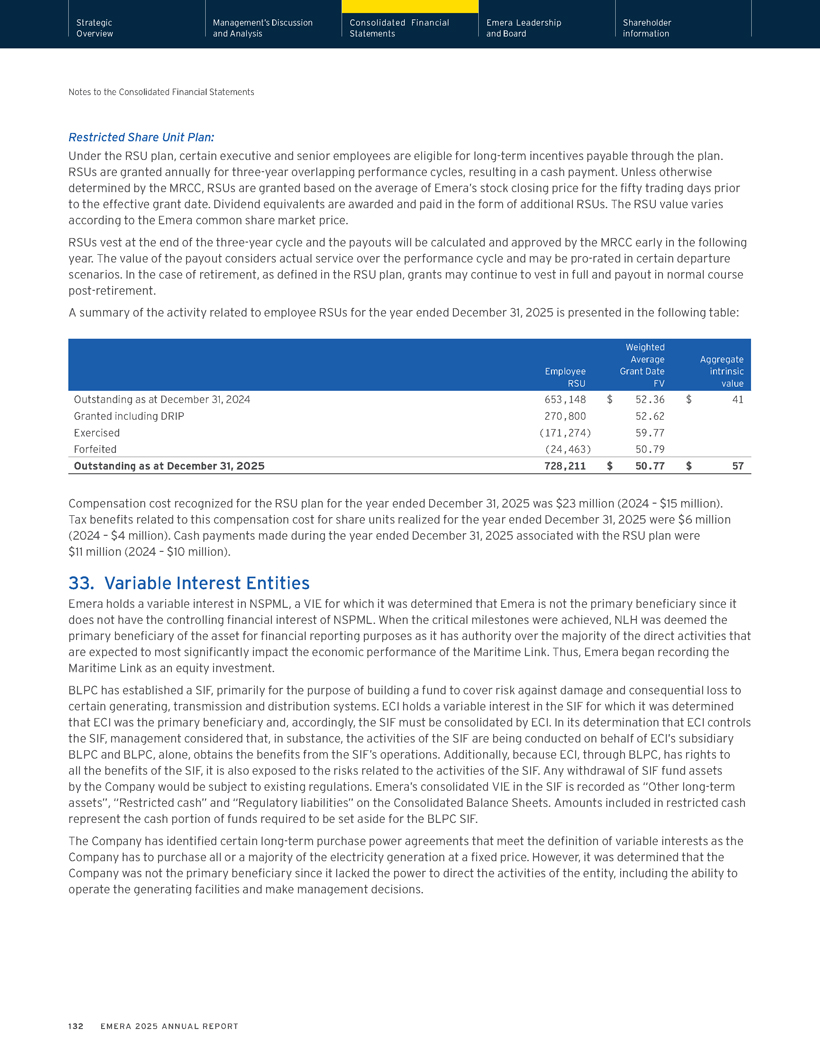
Strategic Management’s Discussion Consolidated Financial Emera Leadership Shareholder Overview and Analysis Statements and Board information Notes to the Consolidated Financial Statements Restricted Share Unit Plan: Under the RSU plan, certain executive and senior employees are eligible for long-term incentives payable through the plan. RSUs are granted annually for three-year overlapping performance cycles, resulting in a cash payment. Unless otherwise determined by the MRCC, RSUs are granted based on the average of Emera’s stock closing price for the fifty trading days prior to the effective grant date. Dividend equivalents are awarded and paid in the form of additional RSUs. The RSU value varies according to the Emera common share market price. RSUs vest at the end of the three-year cycle and the payouts will be calculated and approved by the MRCC early in the following year. The value of the payout considers actual service over the performance cycle and may be pro-rated in certain departure scenarios. In the case of retirement, as defined in the RSU plan, grants may continue to vest in full and payout in normal course post-retirement. A summary of the activity related to employee RSUs for the year ended December 31, 2025 is presented in the following table: Weighted Average Aggregate Employee Grant Date intrinsic RSU FV value Outstanding as at December 31, 2024 653,148 $ 52.36 $ 41 Granted including DRIP 270,800 52.62 Exercised (171,274) 59.77 Forfeited (24,463) 50.79 Outstanding as at December 31, 2025 728,211 $ 50.77 $ 57 Compensation cost recognized for the RSU plan for the year ended December 31, 2025 was $23 million (2024 – $15 million). Tax benefits related to this compensation cost for share units realized for the year ended December 31, 2025 were $6 million (2024 – $4 million). Cash payments made during the year ended December 31, 2025 associated with the RSU plan were $11 million (2024 – $10 million). 33. Variable Interest Entities Emera holds a variable interest in NSPML, a VIE for which it was determined that Emera is not the primary beneficiary since it does not have the controlling financial interest of NSPML. When the critical milestones were achieved, NLH was deemed the primary beneficiary of the asset for financial reporting purposes as it has authority over the majority of the direct activities that are expected to most significantly impact the economic performance of the Maritime Link. Thus, Emera began recording the Maritime Link as an equity investment. BLPC has established a SIF, primarily for the purpose of building a fund to cover risk against damage and consequential loss to certain generating, transmission and distribution systems. ECI holds a variable interest in the SIF for which it was determined that ECI was the primary beneficiary and, accordingly, the SIF must be consolidated by ECI. In its determination that ECI controls the SIF, management considered that, in substance, the activities of the SIF are being conducted on behalf of ECI’s subsidiary BLPC and BLPC, alone, obtains the benefits from the SIF’s operations. Additionally, because ECI, through BLPC, has rights to all the benefits of the SIF, it is also exposed to the risks related to the activities of the SIF. Any withdrawal of SIF fund assets by the Company would be subject to existing regulations. Emera’s consolidated VIE in the SIF is recorded as “Other long-term assets”, “Restricted cash” and “Regulatory liabilities” on the Consolidated Balance Sheets. Amounts included in restricted cash represent the cash portion of funds required to be set aside for the BLPC SIF. The Company has identified certain long-term purchase power agreements that meet the definition of variable interests as the Company has to purchase all or a majority of the electricity generation at a fixed price. However, it was determined that the Company was not the primary beneficiary since it lacked the power to direct the activities of the entity, including the ability to operate the generating facilities and make management decisions. 132 EMERA 2025 ANNUAL REPORT
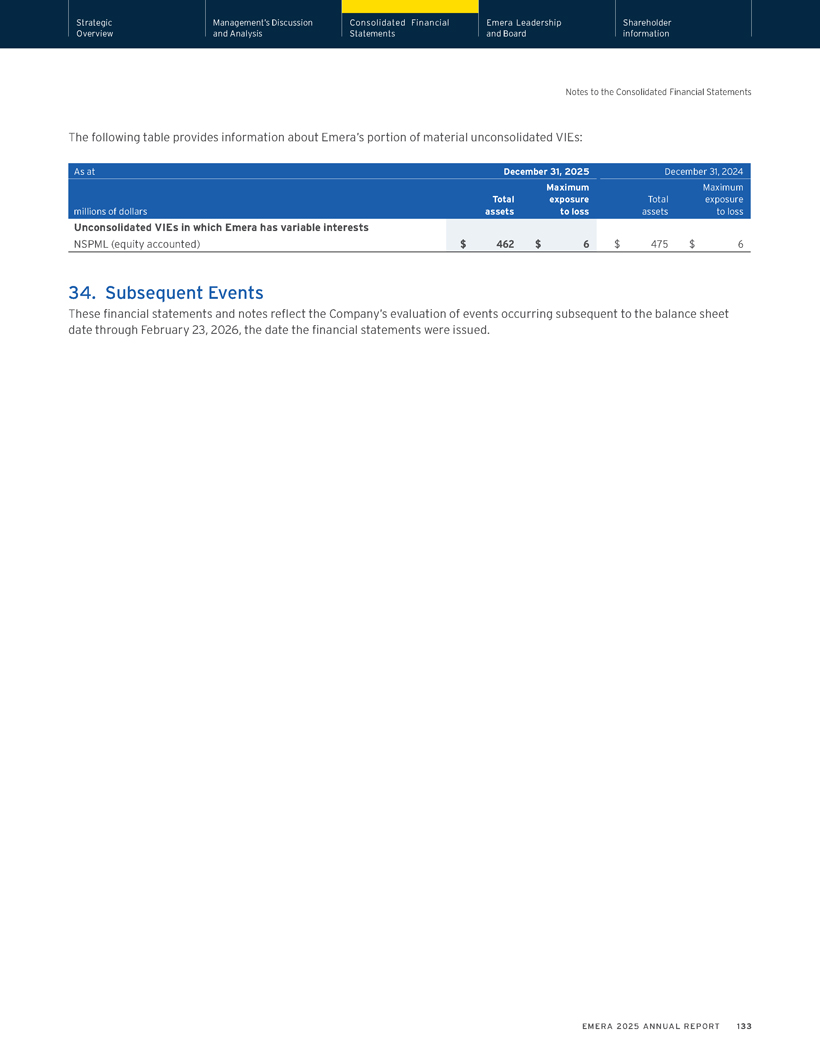
Strategic Management’s Discussion Consolidated Financial Emera Leadership Shareholder Overview and Analysis Statements and Board information Notes to the Consolidated Financial Statements The following table provides information about Emera’s portion of material unconsolidated VIEs: As at December 31, 2025 December 31, 2024 Maximum Maximum Total exposure Total exposure millions of dollars assets to loss assets to loss Unconsolidated VIEs in which Emera has variable interests NSPML (equity accounted) $ 462 $ 6 $ 475 $ 6 34. Subsequent Events These financial statements and notes reflect the Company’s evaluation of events occurring subsequent to the balance sheet date through February 23, 2026, the date the financial statements were issued. EMERA 2025 ANNUAL REPORT 133

Strategic Management’s Discussion Consolidated Financial Emera Leadership Shareholder Overview and Analysis Statements and Board information Emera Leadership and Board As of March 31, 2026 Emera Leadership Scott C. Balfour Peter Gregg Ryan Shell President and Executive Vice President, Strategy and President, Chief Executive Officer, Policy, Emera Inc. New Mexico Gas Company Inc. Emera Inc. Karen Hutt Vivek Sood Mike Barrett Executive Vice President, Corporate President and Chief Executive Officer, Executive Vice President, Development, Emera Inc. Nova Scotia Power Legal and General Counsel, Janelle Poole Judy Steele Emera Inc. Vice President, Corporate Affairs, President and Chief Operating Officer, Archie Collins Emera Inc. Emera Energy President and Chief Executive Officer, Michael Roberts Helen Wesley Tampa Electric Chief Human Resources Officer, President, Peoples Gas System, Inc. Jared Green Emera Inc. Chief Financial Officer, Emera Inc. Board of Directors Karen H. Sheriff Isabelle Courville Brian J. Porter Chair of the Board Mont-Tremblant, Quebec Toronto, Ontario Picton, Ontario Henry E. Demone Ian E. Robertson Scott C. Balfour Lunenburg, Nova Scotia Oakville, Ontario President and Chief Executive Officer Paula Y. Gold-Williams Jochen E. Tilk Halifax, Nova Scotia San Antonio, Texas Toronto, Ontario James V. Bertram Kent M. Harvey Carla M. Tully Calgary, Alberta New York, New York Arlington, Virginia B. Lynn Loewen Montreal, Quebec 134 EMERA 2025 ANNUAL REPORT
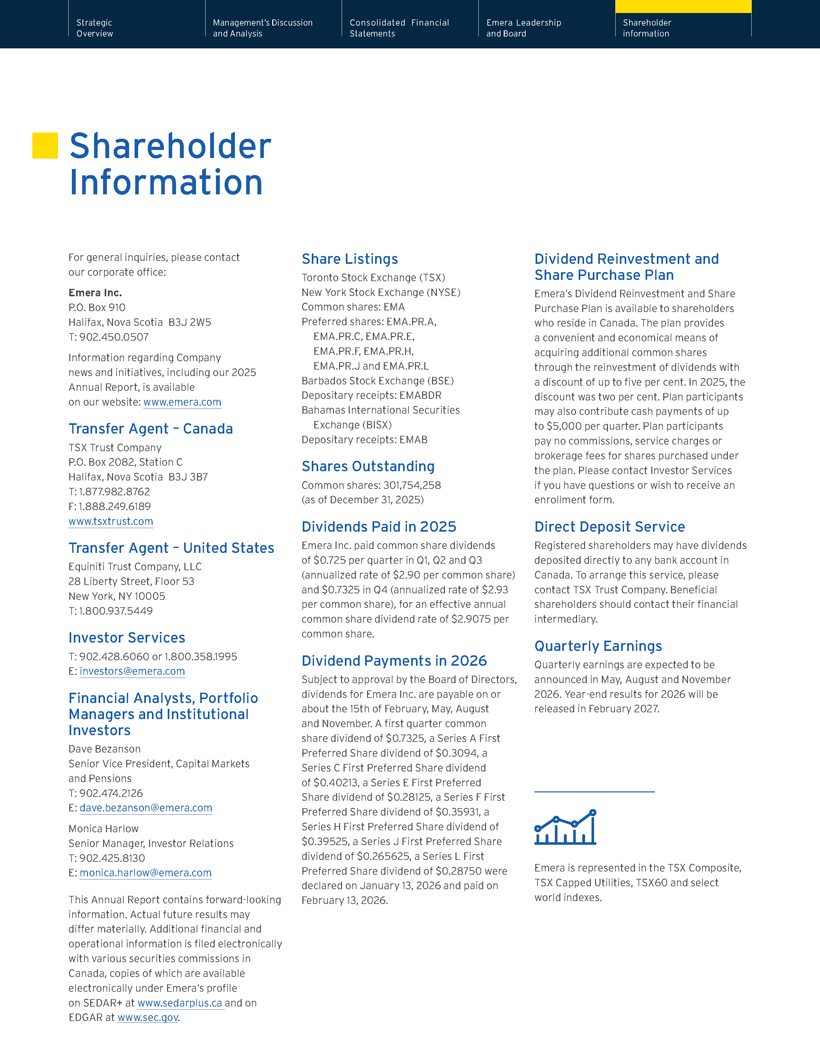
Strategic Management’s Discussion Consolidated Financial Emera Leadership Shareholder Overview and Analysis Statements and Board information Shareholder Information For general inquiries, please contact our corporate office: Emera Inc. P.O. Box 910 Halifax, Nova Scotia B3J 2W5 T: 902.450.0507 Information regarding Company news and initiatives, including our 2025 Annual Report, is available on our website: www.emera.com Transfer Agent – Canada TSX Trust Company P.O. Box 2082, Station C Halifax, Nova Scotia B3J 3B7 T: 1.877.982.8762 F: 1.888.249.6189 www.tsxtrust.com Transfer Agent – United States Equiniti Trust Company, LLC 28 Liberty Street, Floor 53 New York, NY 10005 T: 1.800.937.5449 Investor Services T: 902.428.6060 or 1.800.358.1995 E: investors@emera.com Financial Analysts, Portfolio Managers and Institutional Investors Dave Bezanson Senior Vice President, Capital Markets and Pensions T: 902.474.2126 E: dave.bezanson@emera.com Monica Harlow Senior Manager, Investor Relations T: 902.425.8130 E: monica.harlow@emera.com This Annual Report contains forward-looking information. Actual future results may differ materially. Additional financial and operational information is filed electronically with various securities commissions in Canada, copies of which are available electronically under Emera’s profile on SEDAR+ at www.sedarplus.ca and on EDGAR at www.sec.gov. Share Listings Toronto Stock Exchange (TSX) New York Stock Exchange (NYSE) Common shares: EMA Preferred shares: EMA.PR.A, EMA.PR.C, EMA.PR.E, EMA.PR.F, EMA.PR.H, EMA.PR.J and EMA.PR.L Barbados Stock Exchange (BSE) Depositary receipts: EMABDR Bahamas International Securities Exchange (BISX) Depositary receipts: EMAB Shares Outstanding Common shares: 301,754,258 (as of December 31, 2025) Dividends Paid in 2025 Emera Inc. paid common share dividends of $0.725 per quarter in Q1, Q2 and Q3 (annualized rate of $2.90 per common share) and $0.7325 in Q4 (annualized rate of $2.93 per common share), for an effective annual common share dividend rate of $2.9075 per common share. Dividend Payments in 2026 Subject to approval by the Board of Directors, dividends for Emera Inc. are payable on or about the 15th of February, May, August and November. A first quarter common share dividend of $0.7325, a Series A First Preferred Share dividend of $0.3094, a Series C First Preferred Share dividend of $0.40213, a Series E First Preferred Share dividend of $0.28125, a Series F First Preferred Share dividend of $0.35931, a Series H First Preferred Share dividend of $0.39525, a Series J First Preferred Share dividend of $0.265625, a Series L First Preferred Share dividend of $0.28750 were declared on January 13, 2026 and paid on February 13, 2026. Dividend Reinvestment and Share Purchase Plan Emera’s Dividend Reinvestment and Share Purchase Plan is available to shareholders who reside in Canada. The plan provides a convenient and economical means of acquiring additional common shares through the reinvestment of dividends with a discount of up to five per cent. In 2025, the discount was two per cent. Plan participants may also contribute cash payments of up to $5,000 per quarter. Plan participants pay no commissions, service charges or brokerage fees for shares purchased under the plan. Please contact Investor Services if you have questions or wish to receive an enrollment form. Direct Deposit Service Registered shareholders may have dividends deposited directly to any bank account in Canada. To arrange this service, please contact TSX Trust Company. Beneficial shareholders should contact their financial intermediary. Quarterly Earnings Quarterly earnings are expected to be announced in May, August and November 2026. Year-end results for 2026 will be released in February 2027. Emera is represented in the TSX Composite, TSX Capped Utilities, TSX60 and select world indexes.

www.emera.com