2025 Investor Update CenterPoint Energy | 1 Investor Update September 2025 2026 2035
2025 Investor Update CenterPoint Energy | 2 Cautionary Statement and Other Disclosures Introduction This presentation and the oral statements made in connection herewith contain “forward-looking statements” within the meaning of Section 27A of the Securities Act of 1933 and Section 21E of the Securities Exchange Act of 1934. All statements other than statements of historical fact included in this presentation and the oral statements made in connection herewith are forward-looking statements made in good faith by CenterPoint Energy, Inc. (“CenterPoint Energy” or the “Company”) and are intended to qualify for the safe harbor from liability established by the Private Securities Litigation Reform Act of 1995, including statements concerning CenterPoint Energy’s expectations, beliefs, plans, objectives, goals, strategies, future operations, events, financial position, earnings and guidance, growth, costs, prospects, capital investments or performance or underlying assumptions and other statements that are not historical facts. You should not place undue reliance on forward-looking statements. You can generally identify our forward-looking statements by the words “anticipate,” “believe,” “continue,” “could,” “estimate,” “expect,” “forecast,” “goal,” “intend,” “may,” “objective,” “plan,” “potential,” “predict,” “projection,” “should,” “target,” “will,” or other similar words. The absence of these words, however, does not mean that the statements are not forward-looking. Examples of forward-looking statements in this presentation and the oral statements made in connection herewith include statements about CenterPoint’s new and previous 10-year capital investment plans and the projects and programs therein (which include Houston Electric’s Greater Houston Resiliency Initiative (“GHRI”) and System Resiliency Plan (“SRP”), the Texas Gas transmission pipeline project, the Downtown Houston Revitalization project, and programs relating to electric transmission, resiliency, gas meter upgrades, and pipeline modernization), including the timing, execution, financing, costs and anticipated benefits thereof, regulatory matters relating thereto, and related matters, other capital investments and opportunities therefor (including with respect to incremental capital opportunities, deployment of capital, execution, financing and timing of such projects, and anticipated benefits related thereto), future earnings and guidance, CenterPoint’s goals regarding the resiliency, reliability, and safety of our electric and gas systems, CenterPoint’s long-term growth rate and plans related thereto, dividend growth and payouts, customer charges and rate affordability, operations and maintenance expense reductions, the proposed sale of our Ohio natural gas LDC business (including with respect to timing, anticipated benefits, and related matters), the timing of, projections for, and anticipated benefits from the settlement of, rate cases for CenterPoint and its subsidiaries, CenterPoint’s recovery through interim capital trackers and the timing thereof, base rate growth and population growth in CenterPoint’s service territories, CenterPoint’s ability to support economic growth, meet customer needs and improve customer experiences, Houston Electric’s release of its 15 large 27 megawatt (“MW”) to 32 MW temporary emergency electric energy facilities ("TEEEF") units to the San Antonio area and its ability to complete one or more other future transactions involving various sizes of TEEEF units (including with respect to timing, filings related thereto, corresponding reductions in Houston Electric’s TEEEF fleet capacity, anticipated benefits including with respect to rates, expected market demand for the units, and related matters), the timing and extent of CenterPoint's recovery of investments, electric demand growth in CenterPoint’s service territories (including forecasts and the drivers thereof, capital investment opportunities related thereto and our ability to attract them, the timing of investments related thereto, and anticipated benefits of such growth), financing plans (including in relation to operating cash flow, capital recycling, and the need for, timing of, and anticipated benefits of any future equity or debt issuances, forward sales, and securitization, credit metrics and parent level debt), generation plans and projects, including the timing, costs, and anticipated benefits thereof (including with respect to greenhouse gas emissions reductions), the Company’s 2.0% Zero-Premium Exchangeable Subordinated Notes due 2029 (“ZENS”) and impacts of the maturity of ZENS, CenterPoint’s credit health, balance sheet strength, future financial performance and results of operations, value creation, opportunities and expectations. We have based our forward- looking statements on our management’s beliefs and assumptions based on information currently available to our management at the time the statements are made. We caution you that assumptions, beliefs, expectations, intentions, and projections about future events may and often do vary materially from actual results. Therefore, we cannot assure you that actual results will not differ materially from those expressed or implied by our forward-looking statements. Some of the factors that could cause actual results to differ from those expressed or implied by our forward-looking information include, but are not limited to, risks and uncertainties relating to: (1) the business strategies and strategic initiatives, restructurings, joint ventures and acquisitions or dispositions of assets or businesses involving CenterPoint or its industry, including the ability to successfully complete such strategies, initiatives, transactions or plans on the timelines we expect or at all, such as our plan to sell our Ohio natural gas LDC business or the completed sale of our Louisiana and Mississippi natural gas LDC businesses, which we cannot assure you will have the anticipated benefits to us; (2) industrial, commercial and residential growth in CenterPoint’s service territories and changes in market demand, including in relation to the expansion of data centers, energy export facilities, including hydrogen facilities, electrification of industrial processes and transport and logistics, as well as the effects of energy efficiency measures and demographic patterns, and our ability to appropriately estimate and effectively manage business opportunities relating to such matters; (3) CenterPoint’s ability to fund and invest planned capital, and the timely recovery of its investments, including those related to Houston Electric’s GHRI and SRP; (4) the ability to timely execute Houston Electric’s GHRI and SRP; (5) our ability to successfully construct, repair, maintain and restart electric generating facilities, natural gas facilities, TEEEF and electric transmission facilities; (6) the timing and success of, and our ability to obtain approval for, Houston Electric’s release of its large TEEEF units to the San Antonio area, reduction of its TEEEF fleet capacity and reduction of rates to reflect the removal of the large TEEEF units from Houston Electric’s TEEEF fleet, as well as our ability to complete one or more other future transactions involving various sizes of TEEEF units on acceptable terms and conditions within the anticipated timeframe; (7) financial market and general economic conditions, including access to debt and equity capital, inflation, potential for recession, interest rates, and their effect on sales, prices and costs; (8) disruptions to the global supply chain and volatility in commodity prices, including resulting from tariffs, trade agreements, retaliatory trade measures or changes in trade relationships; (9) actions by credit rating agencies, including any potential downgrades to credit ratings; (10) the timing and impact of regulatory proceedings and actions and legal proceedings, including those related to, among other things, the May 2024 Storm Events, Hurricane Beryl, Houston Electric’s TEEEF units and the February 2021 winter storm event, and requested or favorable adjustments to rates and approval of other requested items as part of base rate proceedings or interim rate mechanisms; (11) federal, state and local legislative, executive, regulatory and political actions or developments, including any actions resulting from Hurricane Beryl, actions pertaining to trade (including tariffs, bans, retaliatory trade measures taken against the United States or related government action), tax legislation (including effects of the One Big Beautiful Bill Act, Executive Order 14315, and the Inflation Reduction Act) and developments related to the environment; (12) the impact of public health threats; (13) weather variations and other natural phenomena, including severe weather events, and CenterPoint’s ability to mitigate weather impacts, including the approval and timing of securitization issuances; (14) the impact of potential wildfires; (15) changes in business plans; (16) advances in, our ability to timely adopt, develop and deploy, artificial intelligence; (17) the availability of, prices for and our ability to procure materials, supplies or services and scarcity of and changes in labor for current and future projects and operations and maintenance costs; (18) CenterPoint’s ability to timely obtain and maintain necessary licenses and permits from local, federal and other regulatory authorities on acceptable terms and resolve third-party challenges to such licenses or permits, as applicable; (19) CenterPoint’s ability to execute on its initiatives, targets and goals, including its net zero and greenhouse gas emissions reduction goals and operations and maintenance goals; and (20) other factors discussed in CenterPoint’s Annual Report on Form 10-K for the fiscal year ended December 31, 2024 and CenterPoint’s Quarterly Report on Form 10-Q for the quarters ended March 31, 2025, and June 30, 2025, including under “Risk Factors,” “Cautionary Statements Regarding Forward-Looking Information” and “Management’s Discussion and Analysis of Financial Condition and Results of Operations — Certain Factors Affecting Future Earnings” in such reports and in other filings with the Securities and Exchange Commission (“SEC”) by CenterPoint, which can be found at www.centerpointenergy.com on the Investor Relations page or on the SEC website at www.sec.gov. This presentation contains time-sensitive information that is accurate only as of September 29, 2025. Any transmission or distribution of this presentation on a later date should not be construed as a confirmation or reaffirmation by CenterPoint Energy of the information contained herein, including guidance. CenterPoint Energy undertakes no obligation to update the information presented herein, except as required by applicable law. Use of Non-GAAP Financial Measures In this presentation and the oral statements made in connection herewith, the Company presents certain financial measures which are non-GAAP financial measures, including non-GAAP income and non-GAAP diluted earnings per share. Generally, a non-GAAP financial measure is a numerical measure of a company’s historical or future financial performance that excludes or includes amounts that are not normally excluded or included in the most directly comparable GAAP financial measure. Please refer to Slide 81 for a detailed discussion of the use of non-GAAP financial measures presented herein.
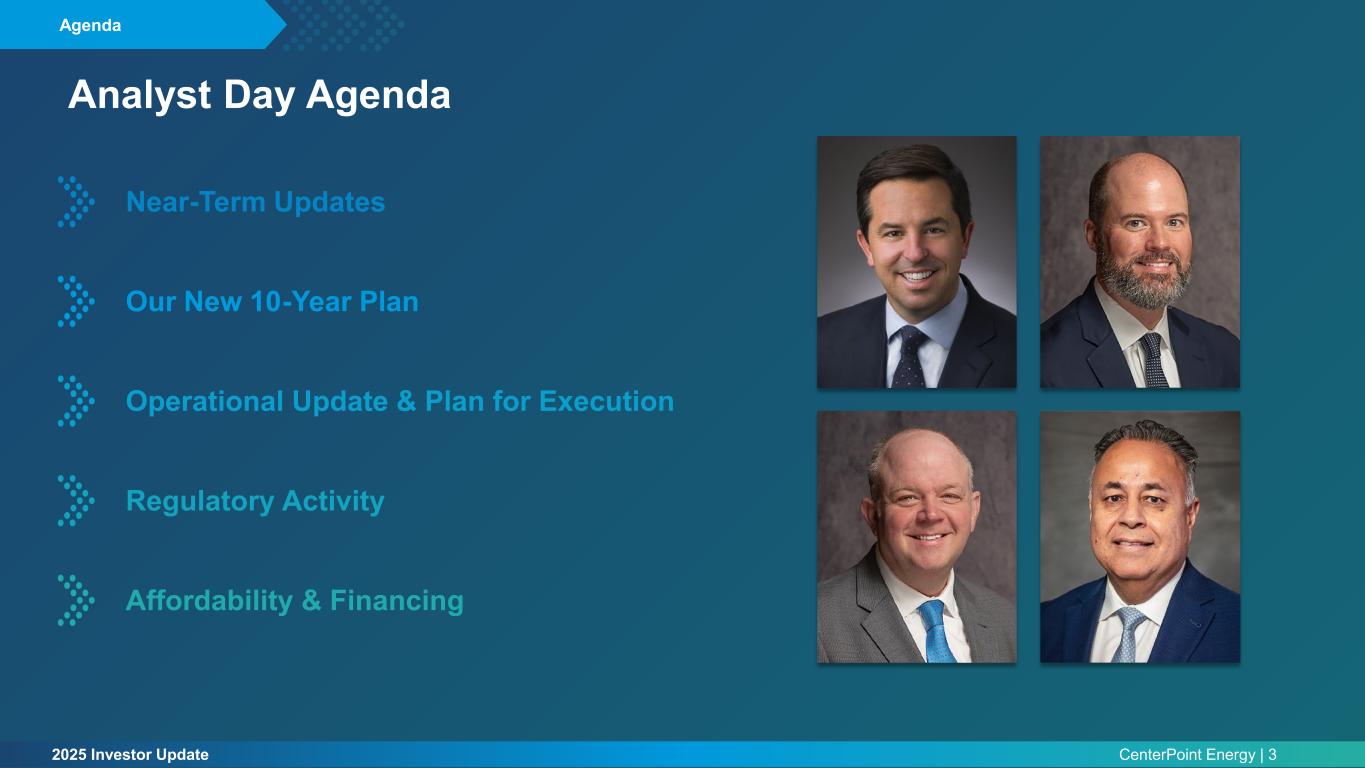
2025 Investor Update CenterPoint Energy | 3 Agenda Analyst Day Agenda Near-Term Updates Our New 10-Year Plan Operational Update & Plan for Execution Regulatory Activity Affordability & Financing
2025 Investor Update CenterPoint Energy | 4 Introduction and Overview Jason Wells President and CEO
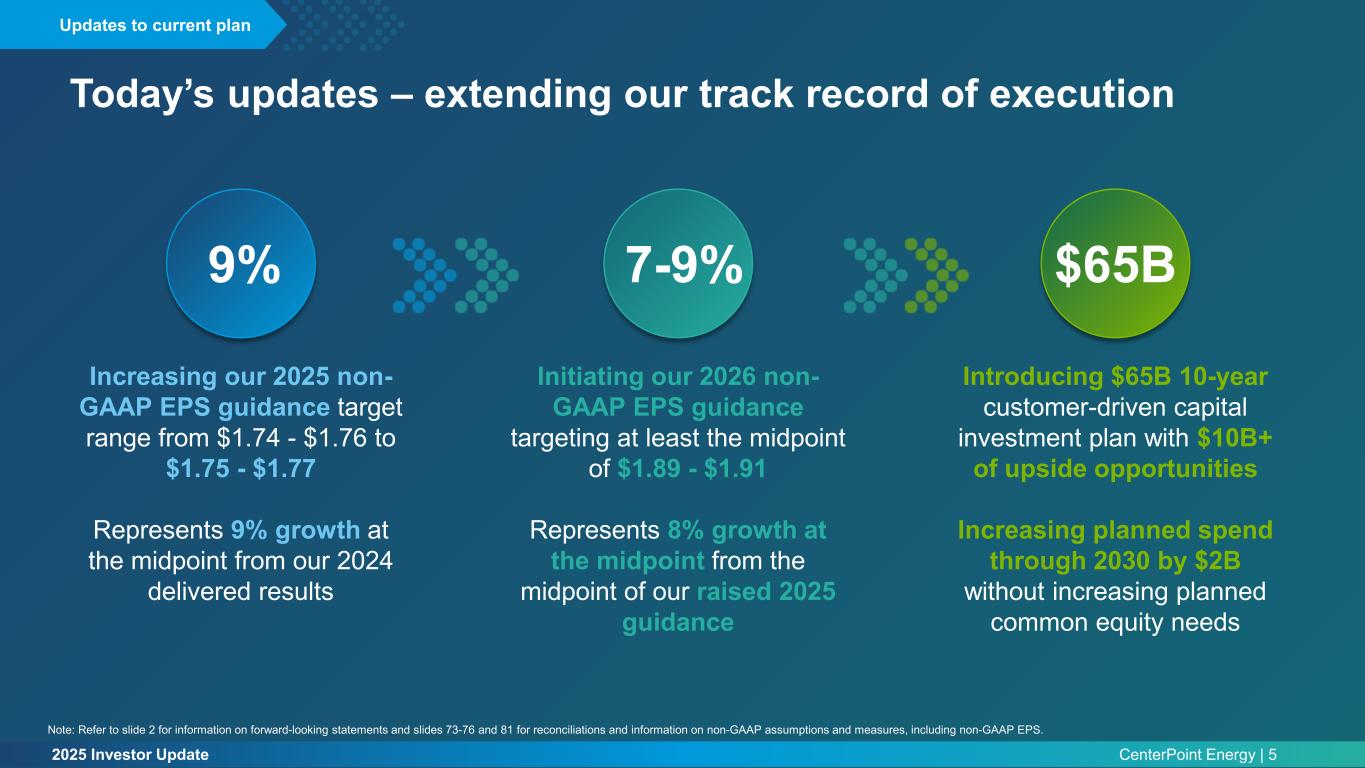
2025 Investor Update CenterPoint Energy | 5 Updates to current plan 7-9% Initiating our 2026 non- GAAP EPS guidance targeting at least the midpoint of $1.89 - $1.91 Represents 8% growth at the midpoint from the midpoint of our raised 2025 guidance 9% Increasing our 2025 non- GAAP EPS guidance target range from $1.74 - $1.76 to $1.75 - $1.77 Represents 9% growth at the midpoint from our 2024 delivered results $65B Introducing $65B 10-year customer-driven capital investment plan with $10B+ of upside opportunities Increasing planned spend through 2030 by $2B without increasing planned common equity needs Today’s updates – extending our track record of execution Note: Refer to slide 2 for information on forward-looking statements and slides 73-76 and 81 for reconciliations and information on non-GAAP assumptions and measures, including non-GAAP EPS.
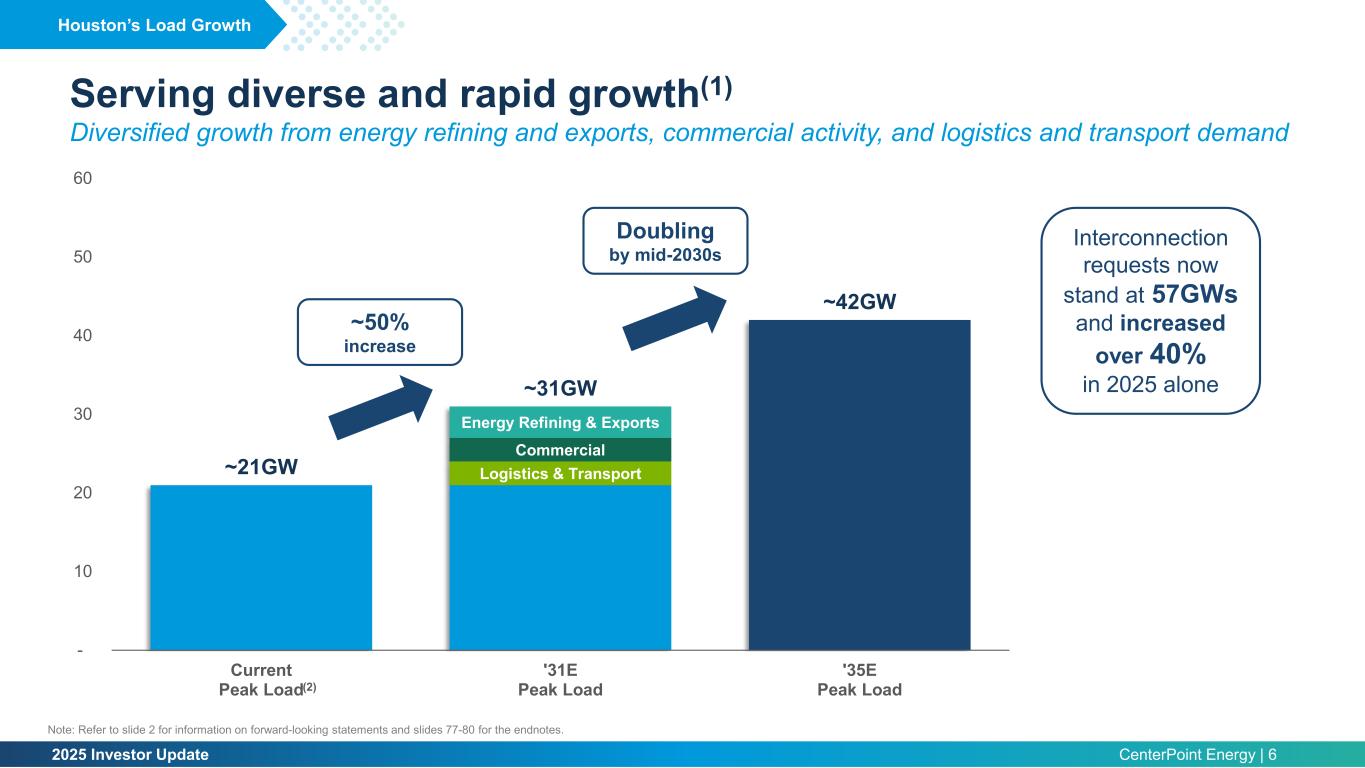
2025 Investor Update CenterPoint Energy | 6 Houston’s Load Growth Note: Refer to slide 2 for information on forward-looking statements and slides 77-80 for the endnotes. Serving diverse and rapid growth(1) Diversified growth from energy refining and exports, commercial activity, and logistics and transport demand Logistics & Transport Commercial Energy Refining & Exports ~21GW ~31GW ~42GW - 10 20 30 40 50 60 Current Peak Load '31E Peak Load '35E Peak Load Interconnection requests now stand at 57GWs and increased over 40% in 2025 alone (2) ~50% increase Doubling by mid-2030s
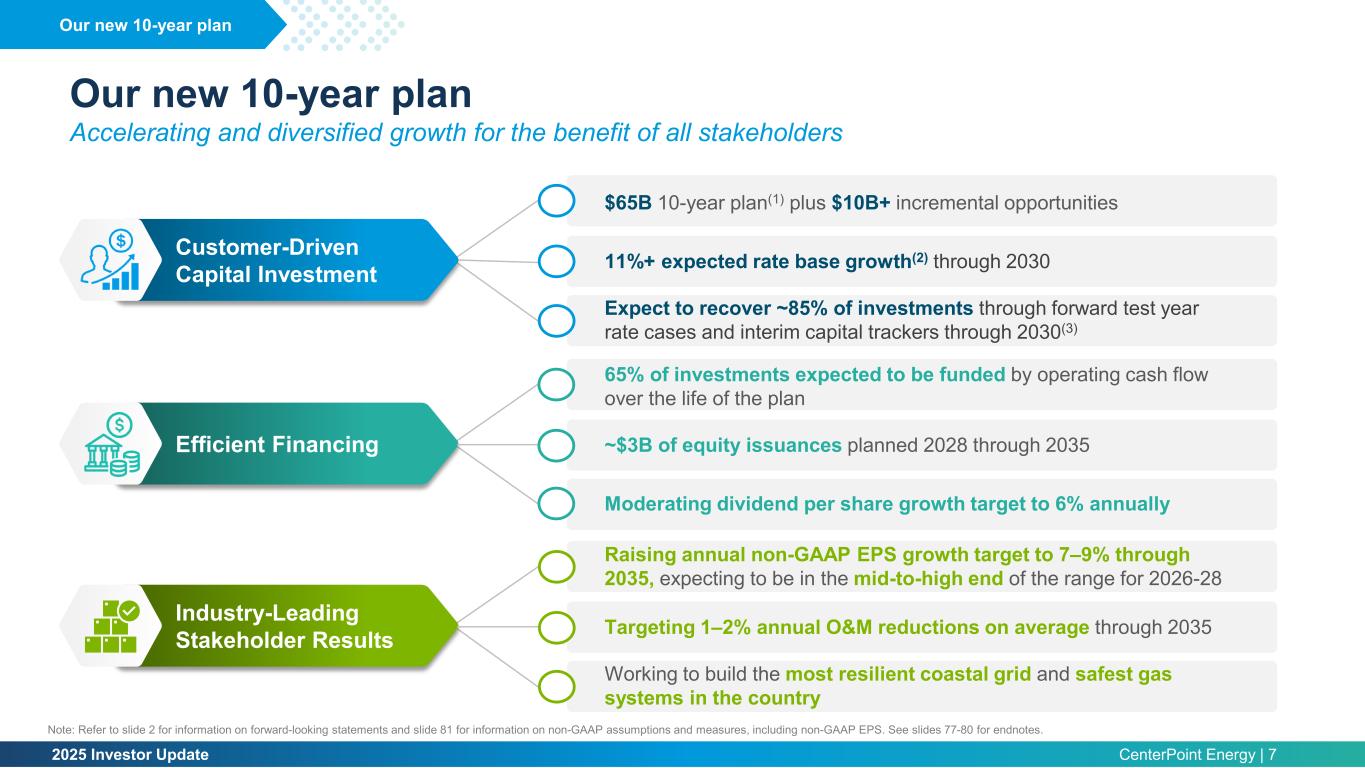
2025 Investor Update CenterPoint Energy | 7 Our new 10-year plan Accelerating and diversified growth for the benefit of all stakeholders Our new 10-year plan Note: Refer to slide 2 for information on forward-looking statements and slide 81 for information on non-GAAP assumptions and measures, including non-GAAP EPS. See slides 77-80 for endnotes. $65B 10-year plan(1) plus $10B+ incremental opportunities 11%+ expected rate base growth(2) through 2030 Expect to recover ~85% of investments through forward test year rate cases and interim capital trackers through 2030(3) Customer-Driven Capital Investment 65% of investments expected to be funded by operating cash flow over the life of the plan ~$3B of equity issuances planned 2028 through 2035 Moderating dividend per share growth target to 6% annually Efficient Financing Raising annual non-GAAP EPS growth target to 7–9% through 2035, expecting to be in the mid-to-high end of the range for 2026-28 Targeting 1–2% annual O&M reductions on average through 2035 Working to build the most resilient coastal grid and safest gas systems in the country Industry-Leading Stakeholder Results
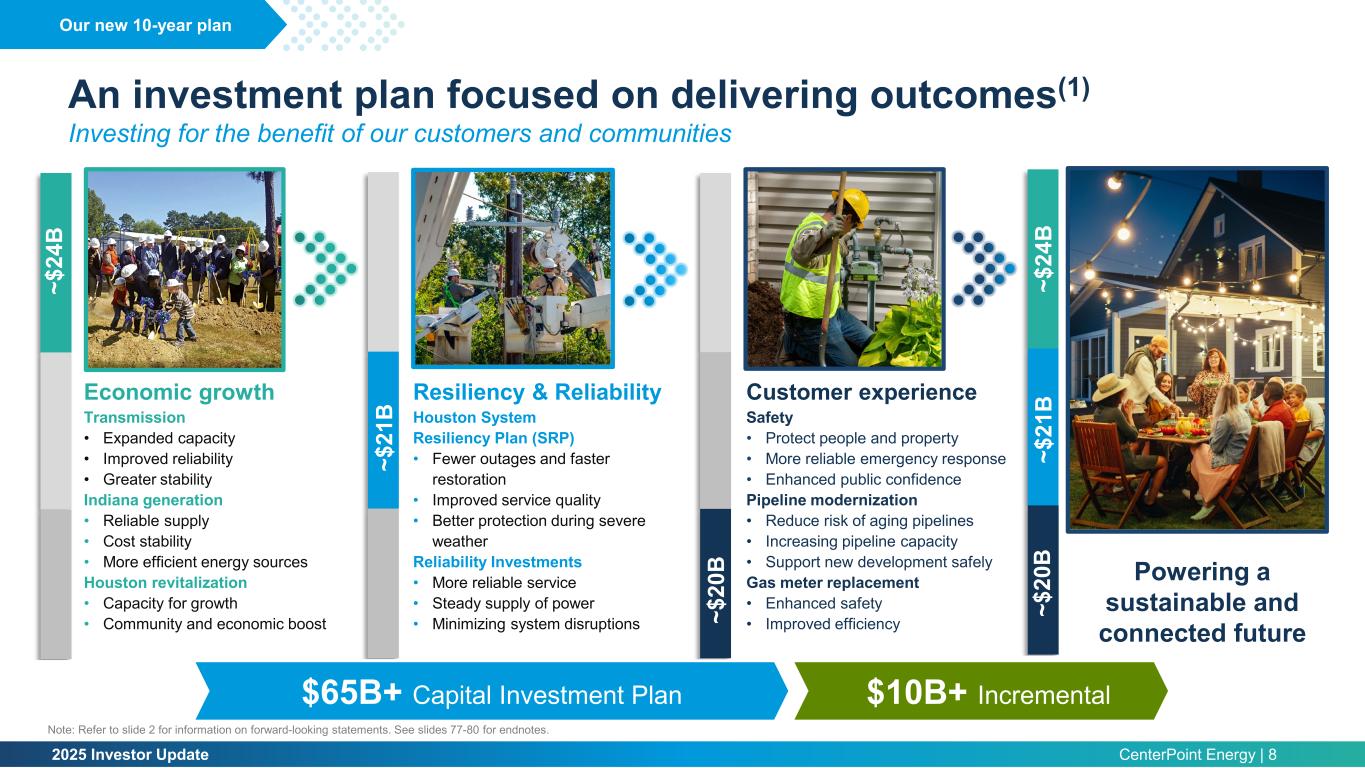
2025 Investor Update CenterPoint Energy | 8 An investment plan focused on delivering outcomes(1) Investing for the benefit of our customers and communities Economic growth Transmission • Expanded capacity • Improved reliability • Greater stability Indiana generation • Reliable supply • Cost stability • More efficient energy sources Houston revitalization • Capacity for growth • Community and economic boost Our new 10-year plan ~$ 24 B Resiliency & Reliability Houston System Resiliency Plan (SRP) • Fewer outages and faster restoration • Improved service quality • Better protection during severe weather Reliability Investments • More reliable service • Steady supply of power • Minimizing system disruptions ~$ 21 B Customer experience Safety • Protect people and property • More reliable emergency response • Enhanced public confidence Pipeline modernization • Reduce risk of aging pipelines • Increasing pipeline capacity • Support new development safely Gas meter replacement • Enhanced safety • Improved efficiency~$ 20 B ~$ 24 B ~$ 21 B ~$ 20 B $65B+ Capital Investment Plan $10B+ Incremental Powering a sustainable and connected future Note: Refer to slide 2 for information on forward-looking statements. See slides 77-80 for endnotes.
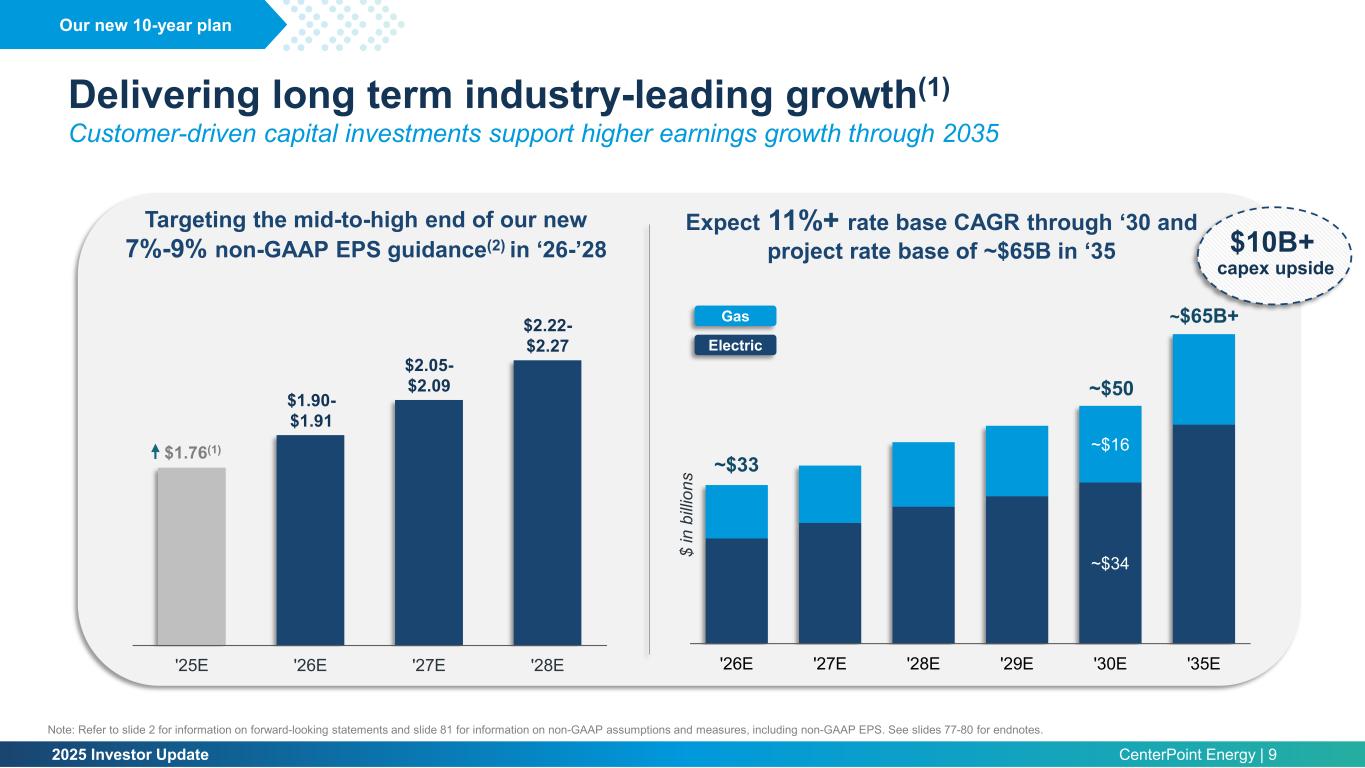
2025 Investor Update CenterPoint Energy | 9 ~$34 ~$16 ~$33 ~$50 '26E '27E '28E '29E '30E '35E $ in b illi on s ~$65B+ Gas Electric Delivering long term industry-leading growth(1) Customer-driven capital investments support higher earnings growth through 2035 Our new 10-year plan Note: Refer to slide 2 for information on forward-looking statements and slide 81 for information on non-GAAP assumptions and measures, including non-GAAP EPS. See slides 77-80 for endnotes. '25E '26E '27E '28E Expect 11%+ rate base CAGR through ‘30 and project rate base of ~$65B in ‘35 Targeting the mid-to-high end of our new 7%-9% non-GAAP EPS guidance(2) in ‘26-’28 $10B+ capex upside $1.90- $1.91 $2.05- $2.09 $2.22- $2.27 $1.76(1)
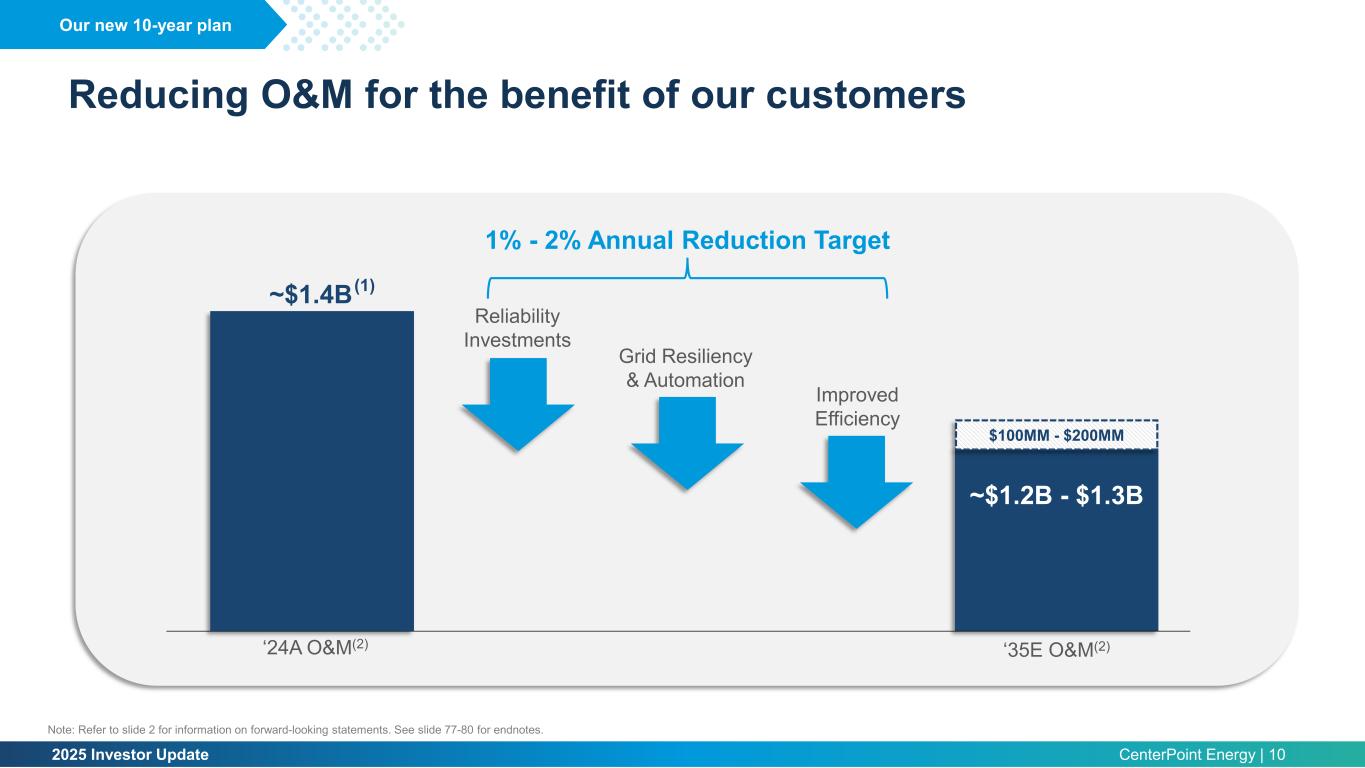
2025 Investor Update CenterPoint Energy | 10 Reducing O&M for the benefit of our customers Our new 10-year plan 1% - 2% Annual Reduction Target Grid Resiliency & Automation Improved Efficiency Reliability Investments ‘35E O&M(2) $100MM - $200MM ~$1.2B - $1.3B ‘24A O&M(2) ~$1.4B Note: Refer to slide 2 for information on forward-looking statements. See slide 77-80 for endnotes. (1)
2025 Investor Update CenterPoint Energy | 11 Established Track Record of Delivering for Stakeholders
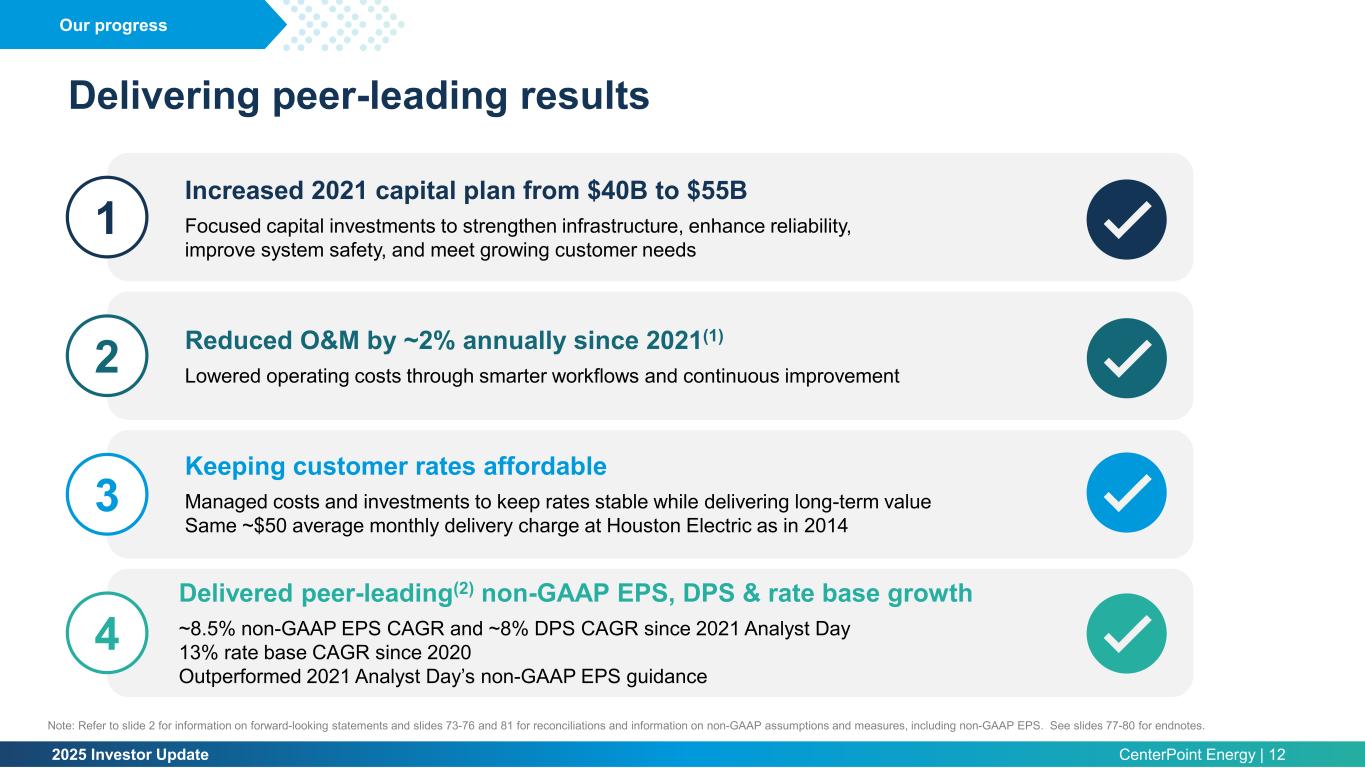
2025 Investor Update CenterPoint Energy | 12 Delivering peer-leading results 1 Increased 2021 capital plan from $40B to $55B Focused capital investments to strengthen infrastructure, enhance reliability, improve system safety, and meet growing customer needs 2 Reduced O&M by ~2% annually since 2021(1) Lowered operating costs through smarter workflows and continuous improvement 3 Keeping customer rates affordable Managed costs and investments to keep rates stable while delivering long-term value Same ~$50 average monthly delivery charge at Houston Electric as in 2014 Our progress 4 Delivered peer-leading(2) non-GAAP EPS, DPS & rate base growth ~8.5% non-GAAP EPS CAGR and ~8% DPS CAGR since 2021 Analyst Day 13% rate base CAGR since 2020 Outperformed 2021 Analyst Day’s non-GAAP EPS guidance Note: Refer to slide 2 for information on forward-looking statements and slides 73-76 and 81 for reconciliations and information on non-GAAP assumptions and measures, including non-GAAP EPS. See slides 77-80 for endnotes.
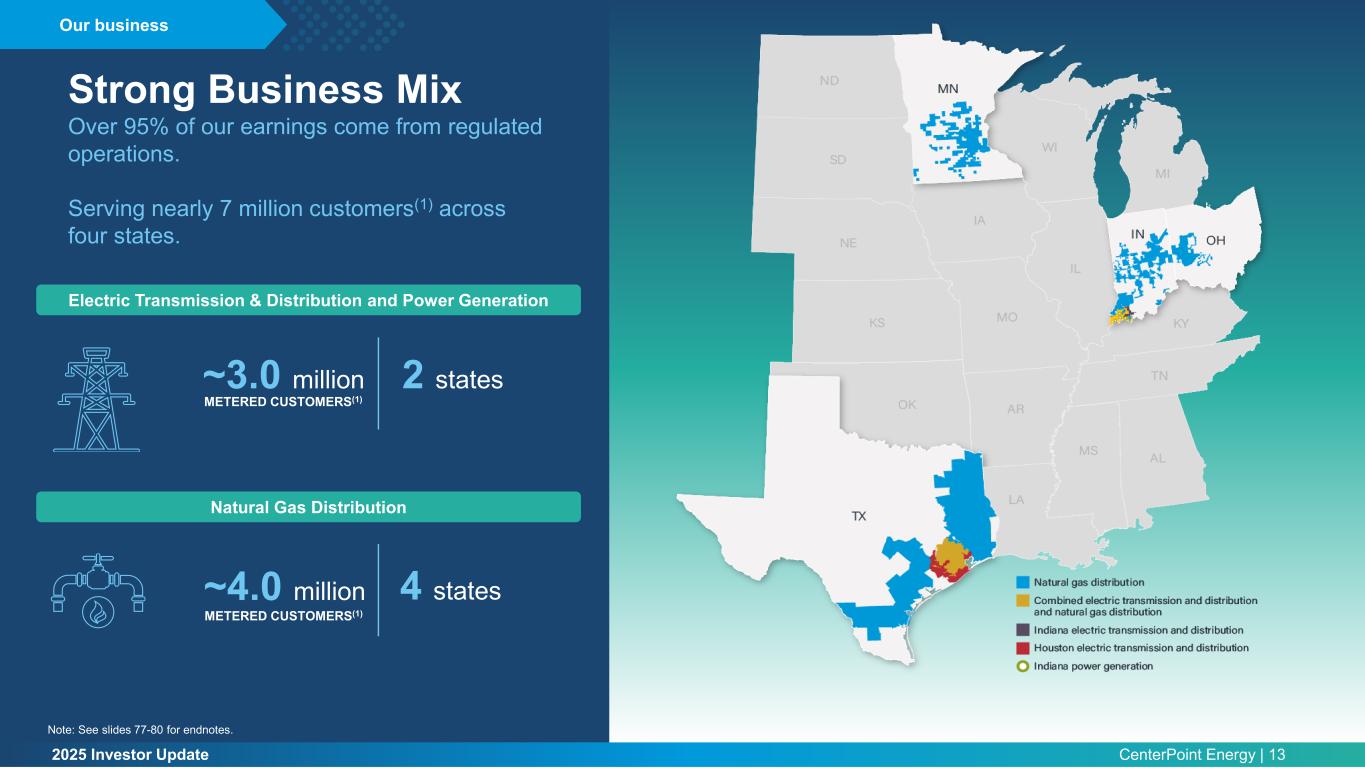
2025 Investor Update CenterPoint Energy | 13 Electric Transmission & Distribution and Power Generation ~3.0 million METERED CUSTOMERS(1) 2 states Natural Gas Distribution ~4.0 million METERED CUSTOMERS(1) 4 states Strong Business Mix Over 95% of our earnings come from regulated operations. Serving nearly 7 million customers(1) across four states. Our business Note: See slides 77-80 for endnotes.
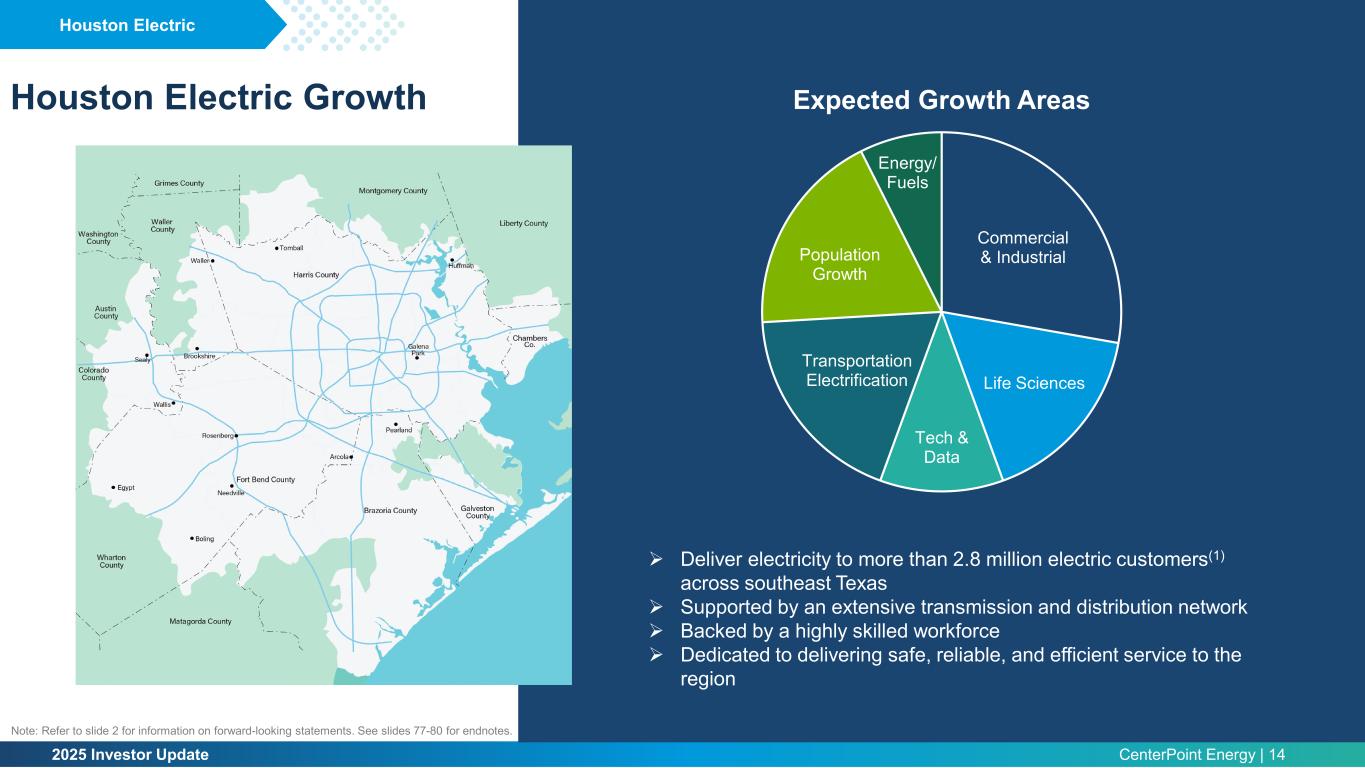
2025 Investor Update CenterPoint Energy | 14 Houston Electric Growth Commercial & Industrial Life Sciences Tech & Data Transportation Electrification Population Growth Energy/ Fuels Expected Growth Areas Deliver electricity to more than 2.8 million electric customers(1) across southeast Texas Supported by an extensive transmission and distribution network Backed by a highly skilled workforce Dedicated to delivering safe, reliable, and efficient service to the region Houston Electric Note: Refer to slide 2 for information on forward-looking statements. See slides 77-80 for endnotes.
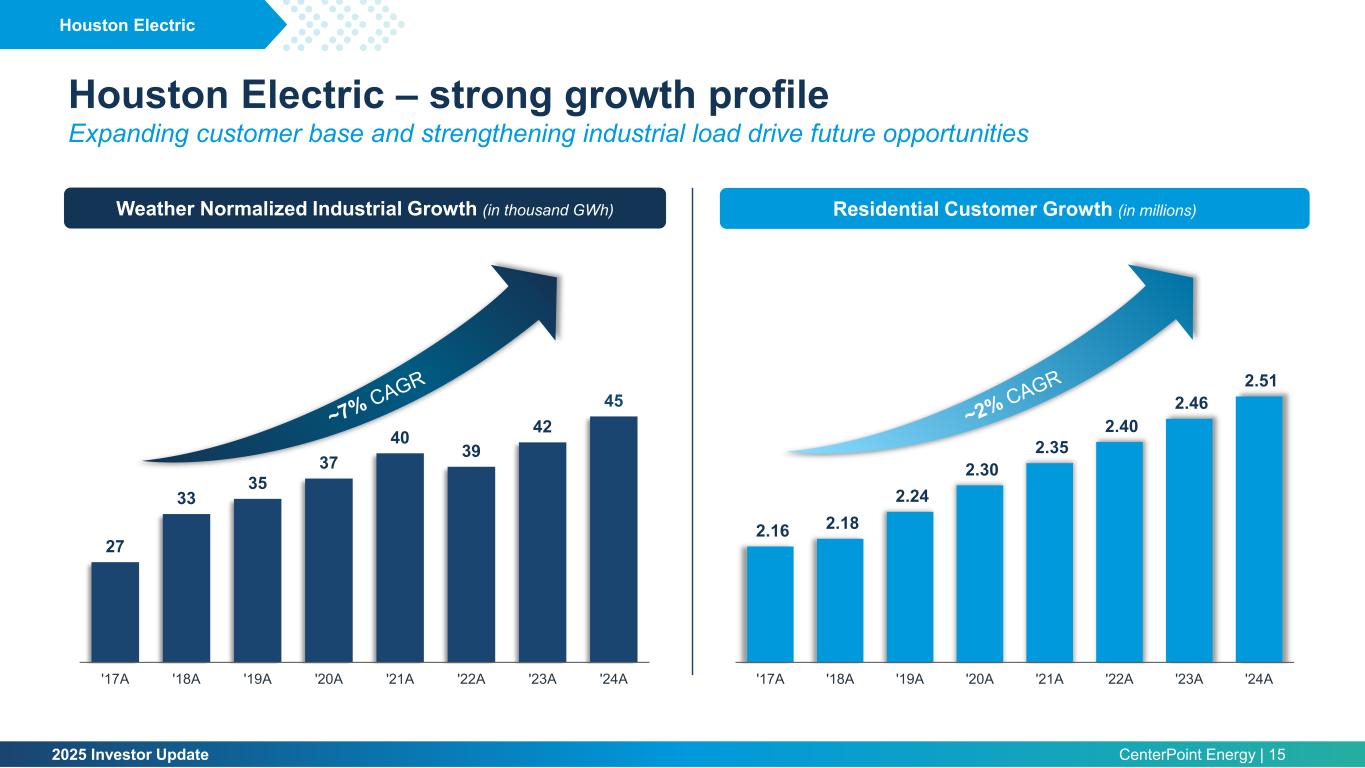
2025 Investor Update CenterPoint Energy | 15 Residential Customer Growth (in millions)Weather Normalized Industrial Growth (in thousand GWh) 2.16 2.18 2.24 2.30 2.35 2.40 2.46 2.51 '17A '18A '19A '20A '21A '22A '23A '24A 27 33 35 37 40 39 42 45 '17A '18A '19A '20A '21A '22A '23A '24A Houston Electric – strong growth profile Expanding customer base and strengthening industrial load drive future opportunities Houston Electric
2025 Investor Update CenterPoint Energy | 16 Electric and Gas Businesses Jesus Soto EVP and COO
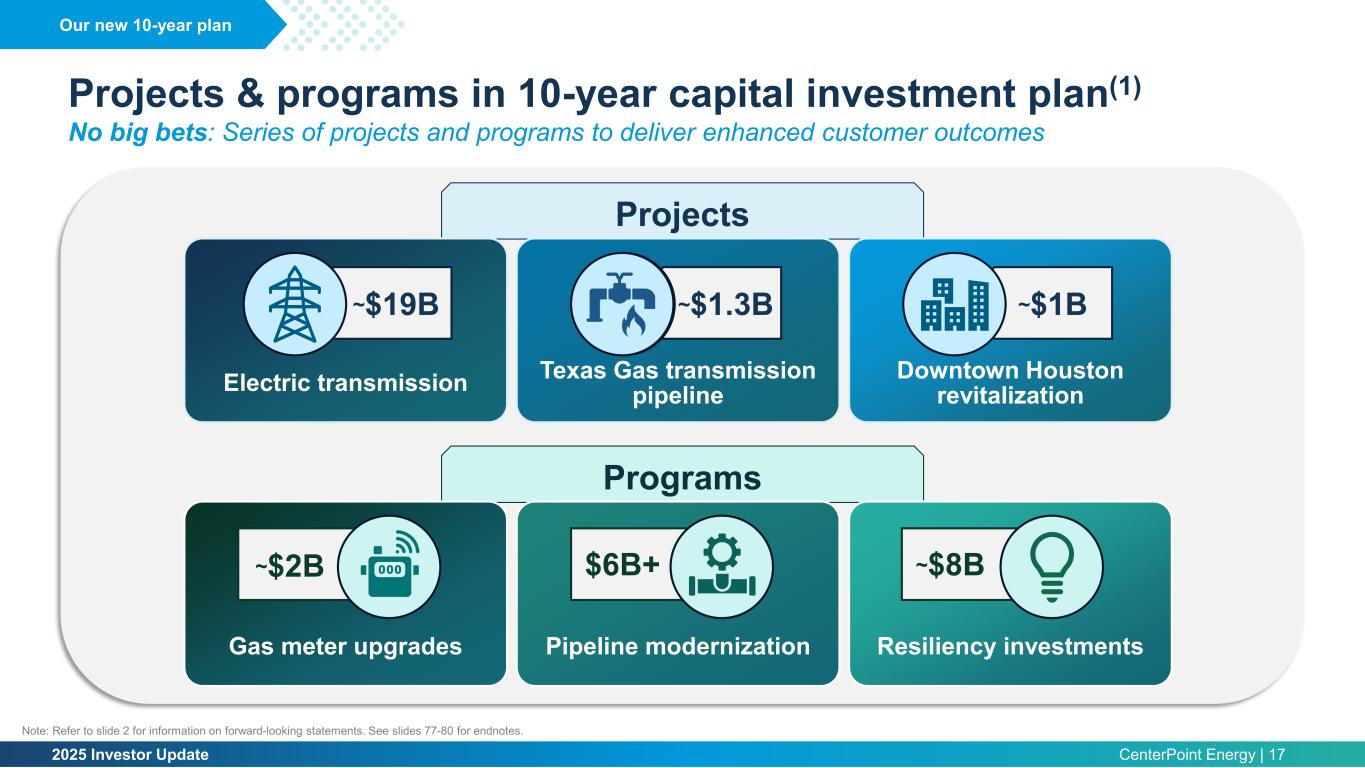
2025 Investor Update CenterPoint Energy | 17 Projects & programs in 10-year capital investment plan(1) No big bets: Series of projects and programs to deliver enhanced customer outcomes Projects Programs Our new 10-year plan Electric transmission Texas Gas transmission pipeline Downtown Houston revitalization Gas meter upgrades Pipeline modernization Resiliency investments ~$1.3B ~$1B ~$2B $6B+ ~$8B ~$19B Note: Refer to slide 2 for information on forward-looking statements. See slides 77-80 for endnotes.
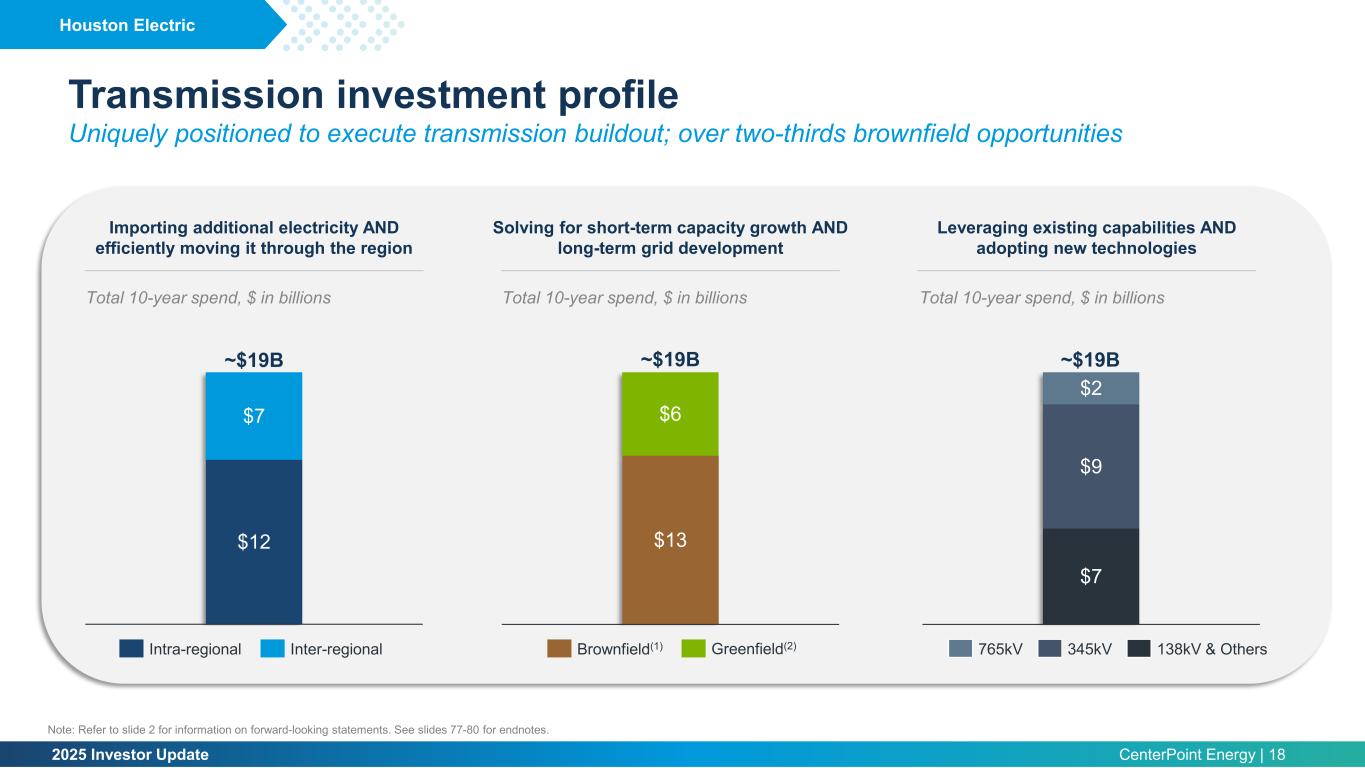
2025 Investor Update CenterPoint Energy | 18 Importing additional electricity AND efficiently moving it through the region Solving for short-term capacity growth AND long-term grid development Leveraging existing capabilities AND adopting new technologies Total 10-year spend, $ in billions $13 $6 ~$19B Brownfield(1) Greenfield(2) $7 $9 $2 ~$19B 765kV 345kV 138kV & Others $12 $7 ~$19B Intra-regional Inter-regional Total 10-year spend, $ in billions Total 10-year spend, $ in billions Transmission investment profile Uniquely positioned to execute transmission buildout; over two-thirds brownfield opportunities Houston Electric Note: Refer to slide 2 for information on forward-looking statements. See slides 77-80 for endnotes.
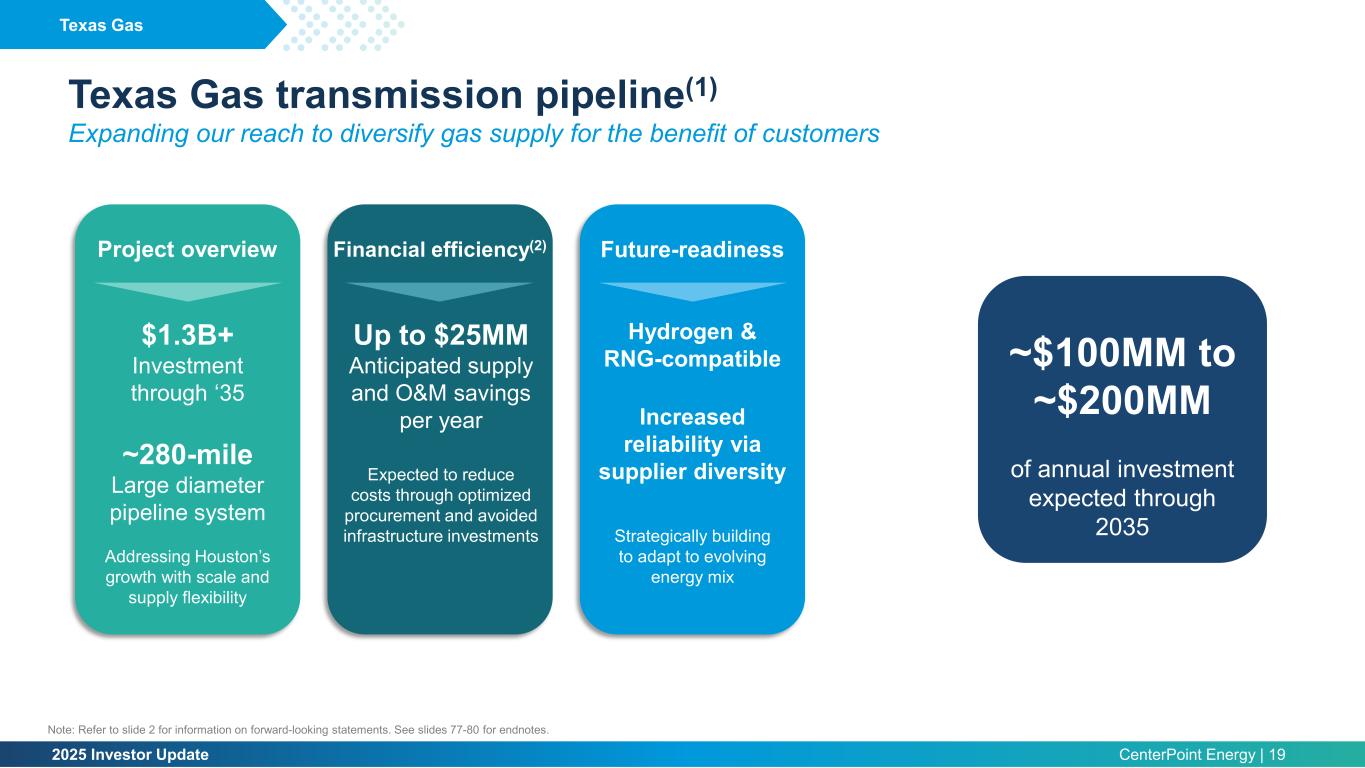
2025 Investor Update CenterPoint Energy | 19 Texas Gas transmission pipeline(1) Expanding our reach to diversify gas supply for the benefit of customers $1.3B+ Investment through ‘35 ~280-mile Large diameter pipeline system Addressing Houston’s growth with scale and supply flexibility Project overview Hydrogen & RNG-compatible Increased reliability via supplier diversity Strategically building to adapt to evolving energy mix Future-readiness Texas Gas Note: Refer to slide 2 for information on forward-looking statements. See slides 77-80 for endnotes. Up to $25MM Anticipated supply and O&M savings per year Expected to reduce costs through optimized procurement and avoided infrastructure investments Financial efficiency(2) of annual investment expected through 2035 ~$100MM to ~$200MM
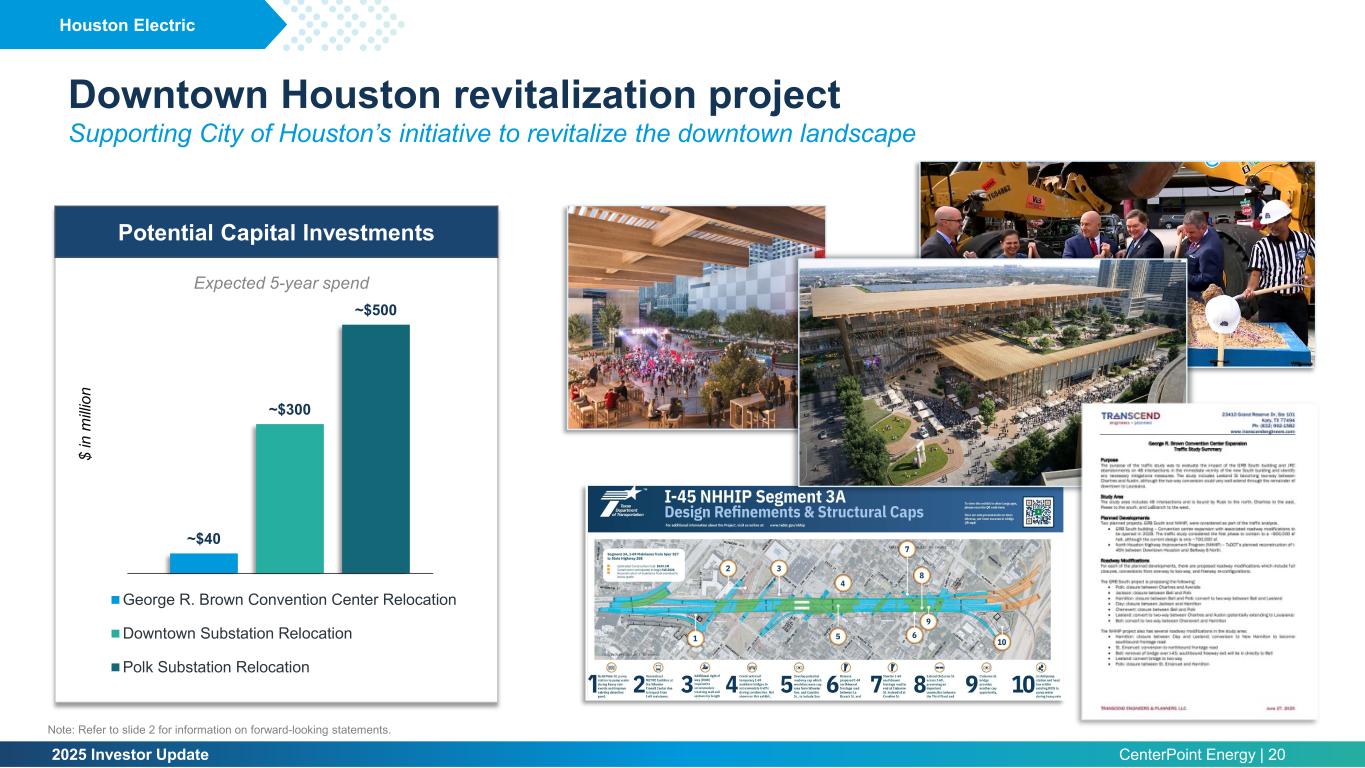
2025 Investor Update CenterPoint Energy | 20 Potential Capital Investments Downtown Houston revitalization project Supporting City of Houston’s initiative to revitalize the downtown landscape Houston Electric ~$40 ~$300 ~$500 $ in m illi on George R. Brown Convention Center Relocation Downtown Substation Relocation Polk Substation Relocation Note: Refer to slide 2 for information on forward-looking statements. Expected 5-year spend
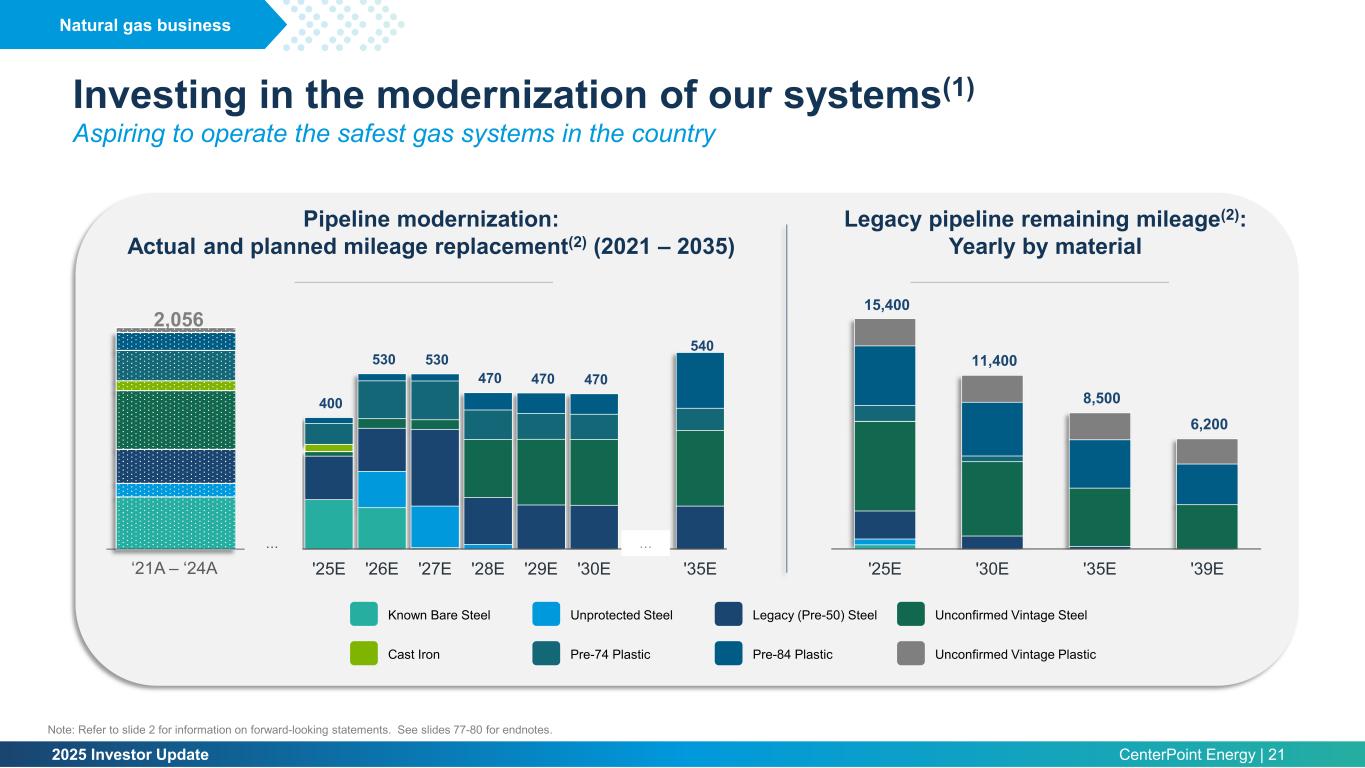
2025 Investor Update CenterPoint Energy | 21 Investing in the modernization of our systems(1) Aspiring to operate the safest gas systems in the country 400 530 530 470 470 470 540 '25E '26E '27E '28E '29E '30E '35E 15,400 11,400 8,500 6,200 '25E '30E '35E '39E 2,056 Pipeline modernization: Actual and planned mileage replacement(2) (2021 – 2035) Legacy pipeline remaining mileage(2): Yearly by material … ‘21A – ‘24A … Known Bare Steel Unprotected Steel Legacy (Pre-50) Steel Unconfirmed Vintage Steel Cast Iron Pre-74 Plastic Pre-84 Plastic Unconfirmed Vintage Plastic Natural gas business Note: Refer to slide 2 for information on forward-looking statements. See slides 77-80 for endnotes.
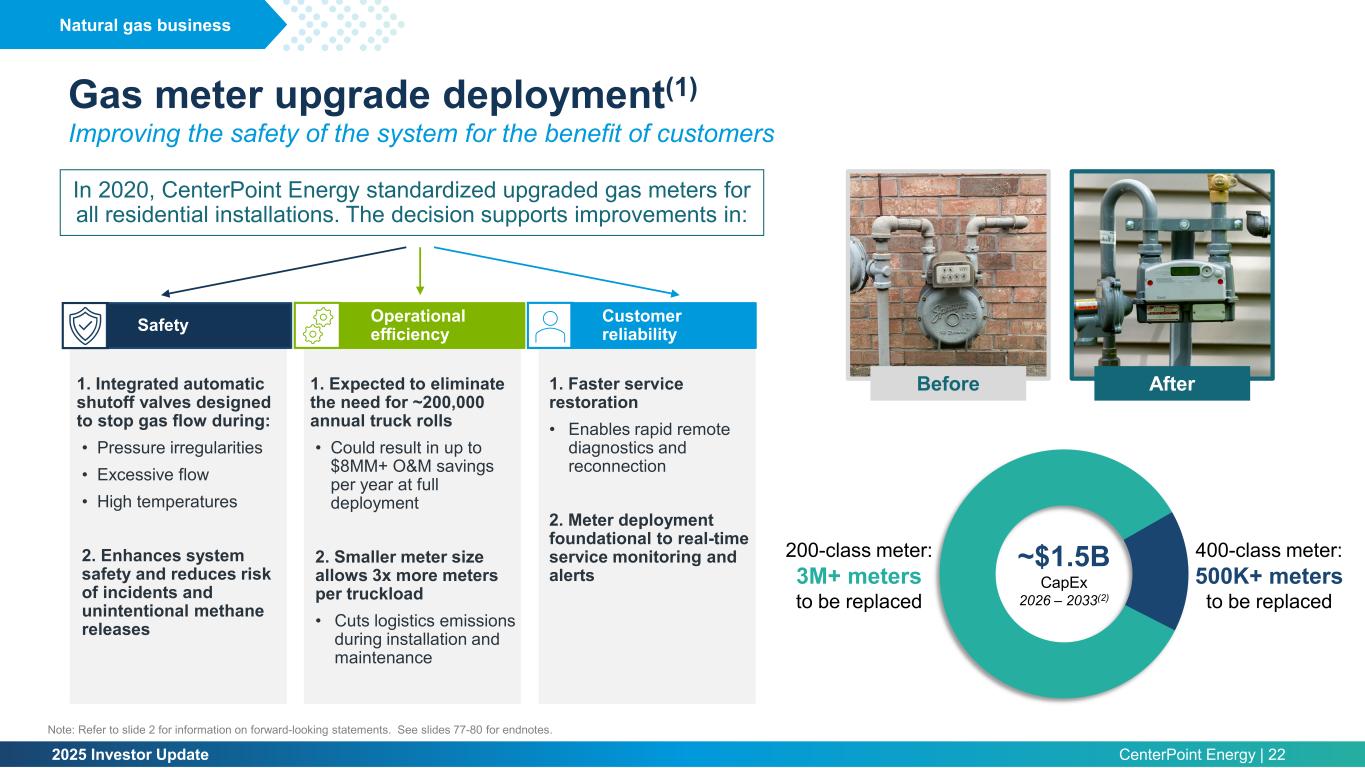
2025 Investor Update CenterPoint Energy | 22 Gas meter upgrade deployment(1) Improving the safety of the system for the benefit of customers In 2020, CenterPoint Energy standardized upgraded gas meters for all residential installations. The decision supports improvements in: 1. Integrated automatic shutoff valves designed to stop gas flow during: • Pressure irregularities • Excessive flow • High temperatures 2. Enhances system safety and reduces risk of incidents and unintentional methane releases Safety Operational efficiency 1. Expected to eliminate the need for ~200,000 annual truck rolls • Could result in up to $8MM+ O&M savings per year at full deployment 2. Smaller meter size allows 3x more meters per truckload • Cuts logistics emissions during installation and maintenance 1. Faster service restoration • Enables rapid remote diagnostics and reconnection 2. Meter deployment foundational to real-time service monitoring and alerts Customer reliability ~$1.5B CapEx 2026 – 2033(2) 200-class meter: 3M+ meters to be replaced 400-class meter: 500K+ meters to be replaced Natural gas business Before After Note: Refer to slide 2 for information on forward-looking statements. See slides 77-80 for endnotes.
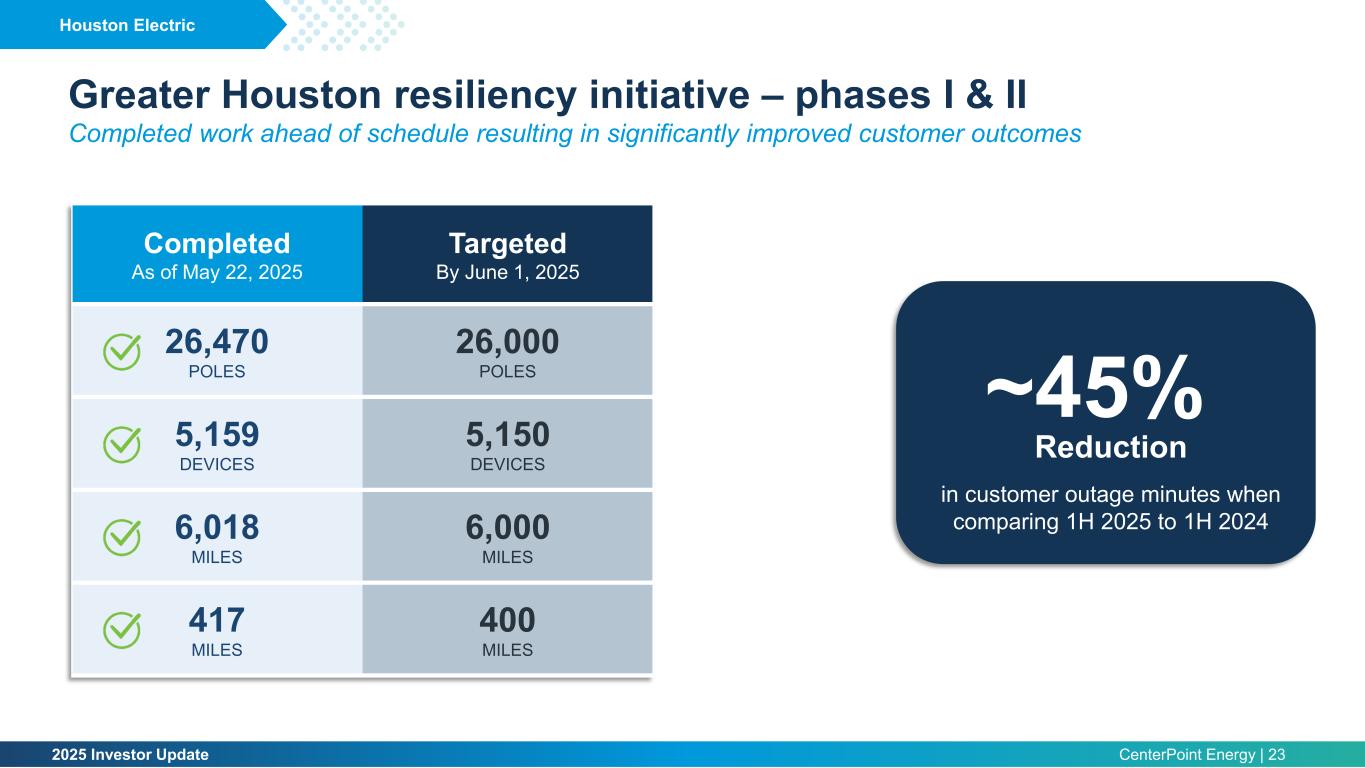
2025 Investor Update CenterPoint Energy | 23 Completed As of May 22, 2025 Targeted By June 1, 2025 26,470 POLES 26,000 POLES 5,159 DEVICES 5,150 DEVICES 6,018 MILES 6,000 MILES 417 MILES 400 MILES Greater Houston resiliency initiative – phases I & II Completed work ahead of schedule resulting in significantly improved customer outcomes Houston Electric ~45% in customer outage minutes when comparing 1H 2025 to 1H 2024 Reduction
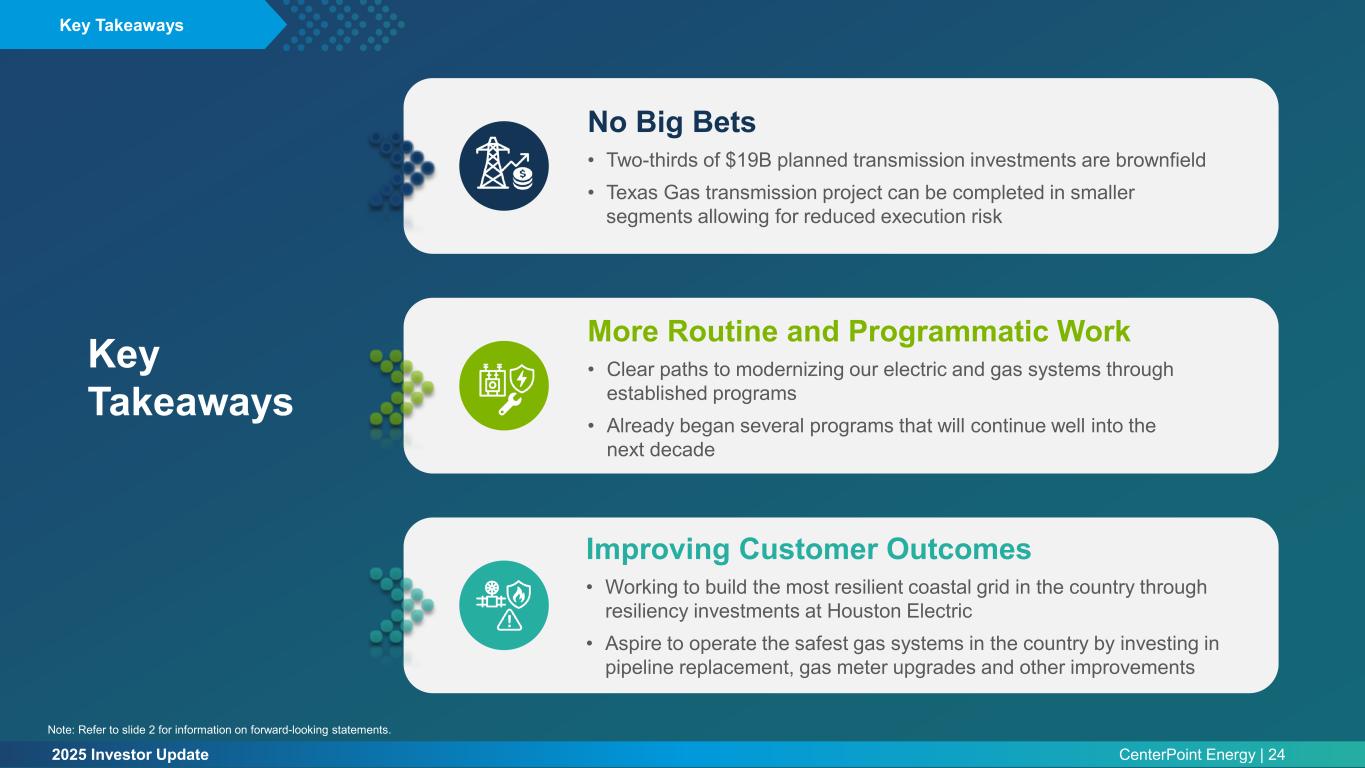
2025 Investor Update CenterPoint Energy | 24 No Big Bets • Two-thirds of $19B planned transmission investments are brownfield • Texas Gas transmission project can be completed in smaller segments allowing for reduced execution risk More Routine and Programmatic Work • Clear paths to modernizing our electric and gas systems through established programs • Already began several programs that will continue well into the next decade Improving Customer Outcomes • Working to build the most resilient coastal grid in the country through resiliency investments at Houston Electric • Aspire to operate the safest gas systems in the country by investing in pipeline replacement, gas meter upgrades and other improvements Key Takeaways Key Takeaways Note: Refer to slide 2 for information on forward-looking statements.
2025 Investor Update CenterPoint Energy | 25 Regulatory Update Jason Ryan EVP of Regulatory Services & Government Affairs
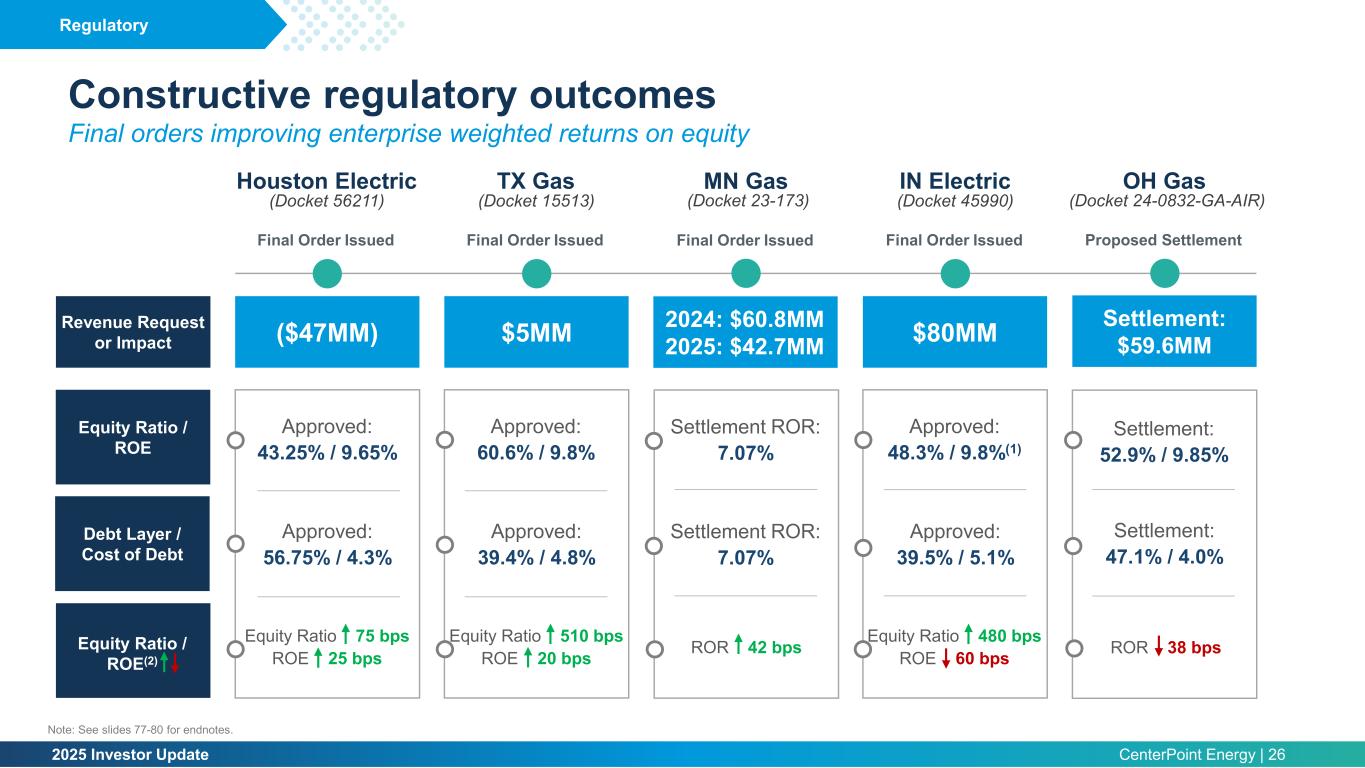
2025 Investor Update CenterPoint Energy | 26 Regulatory Houston Electric OH GasIN ElectricMN Gas ($47MM) $5MM Settlement: $59.6MM$80MM2024: $60.8MM 2025: $42.7MM Approved: 56.75% / 4.3% Approved: 39.4% / 4.8% Settlement: 47.1% / 4.0% Approved: 39.5% / 5.1% Approved: 43.25% / 9.65% Approved: 60.6% / 9.8% Settlement: 52.9% / 9.85% Approved: 48.3% / 9.8%(1) Settlement ROR: 7.07% Settlement ROR: 7.07% (Docket 15513) (Docket 24-0832-GA-AIR)(Docket 45990)(Docket 23-173)(Docket 56211) TX Gas Final Order Issued Proposed SettlementFinal Order IssuedFinal Order IssuedFinal Order Issued Revenue Request or Impact Equity Ratio / ROE Debt Layer / Cost of Debt Equity Ratio / ROE(2) Constructive regulatory outcomes Final orders improving enterprise weighted returns on equity Equity Ratio 75 bps ROE 25 bps ROR 38 bpsROR 42 bpsEquity Ratio 510 bps ROE 20 bps Equity Ratio 480 bps ROE 60 bps Note: See slides 77-80 for endnotes.
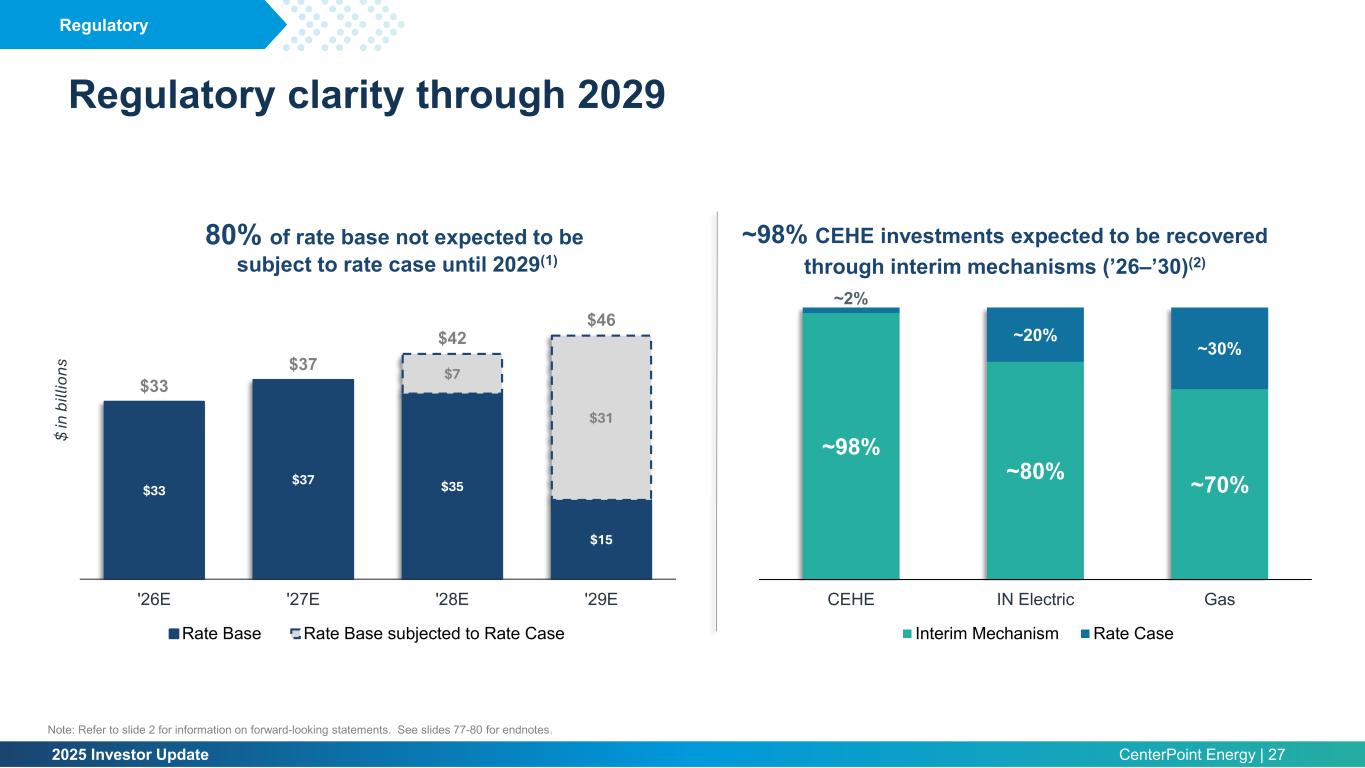
2025 Investor Update CenterPoint Energy | 27 Regulatory clarity through 2029 $33 $37 $35 $15 $7 $31 $33 $37 $42 $46 '26E '27E '28E '29E $ in b ill io ns Rate Base Rate Base subjected to Rate Case ~98% ~80% ~70% ~2% ~20% ~30% CEHE IN Electric Gas Interim Mechanism Rate Case Regulatory Note: Refer to slide 2 for information on forward-looking statements. See slides 77-80 for endnotes. 80% of rate base not expected to be subject to rate case until 2029(1) ~98% CEHE investments expected to be recovered through interim mechanisms (’26‒’30)(2)
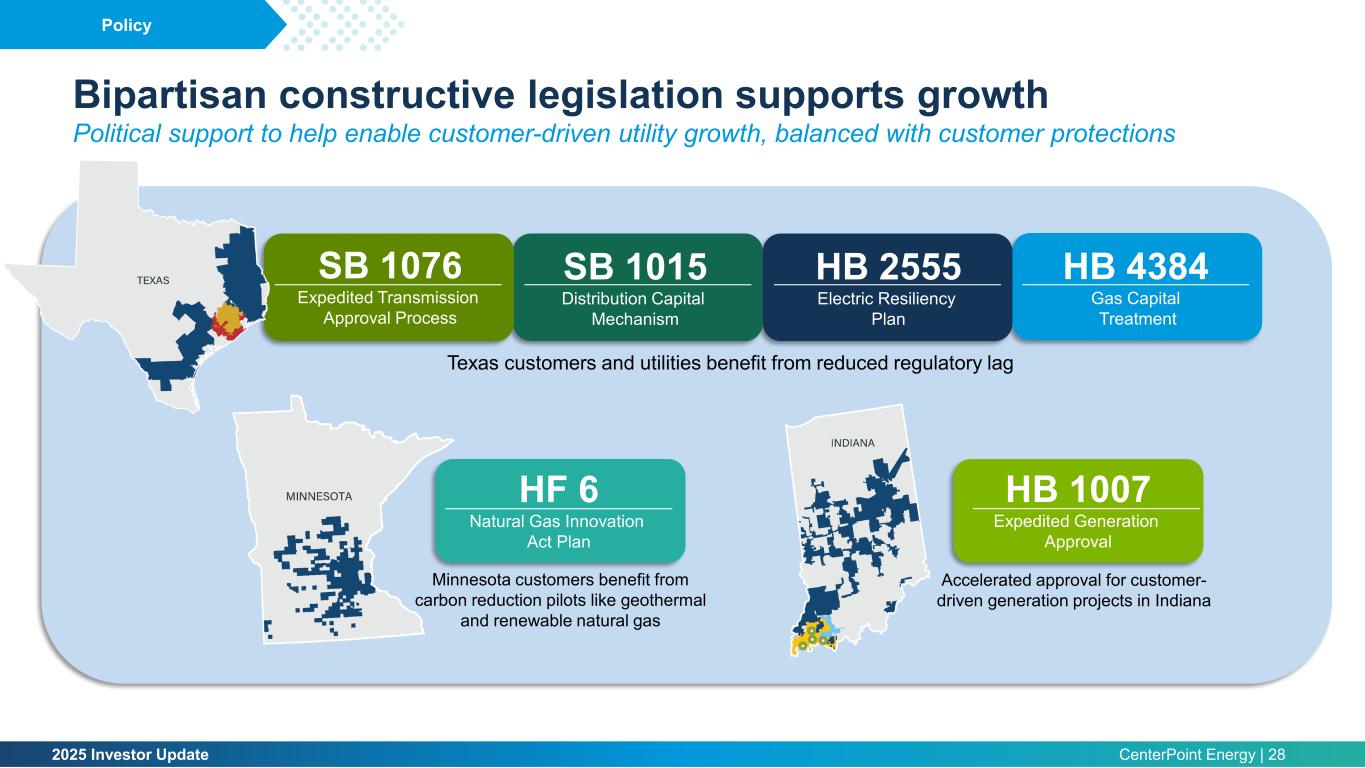
2025 Investor Update CenterPoint Energy | 28 SB 1076 Expedited Transmission Approval Process SB 1015 Distribution Capital Mechanism HB 2555 Electric Resiliency Plan HB 4384 Gas Capital Treatment Policy Bipartisan constructive legislation supports growth Political support to help enable customer-driven utility growth, balanced with customer protections Accelerated approval for customer- driven generation projects in Indiana HB 1007 Expedited Generation Approval Texas customers and utilities benefit from reduced regulatory lag Minnesota customers benefit from carbon reduction pilots like geothermal and renewable natural gas HF 6 Natural Gas Innovation Act Plan
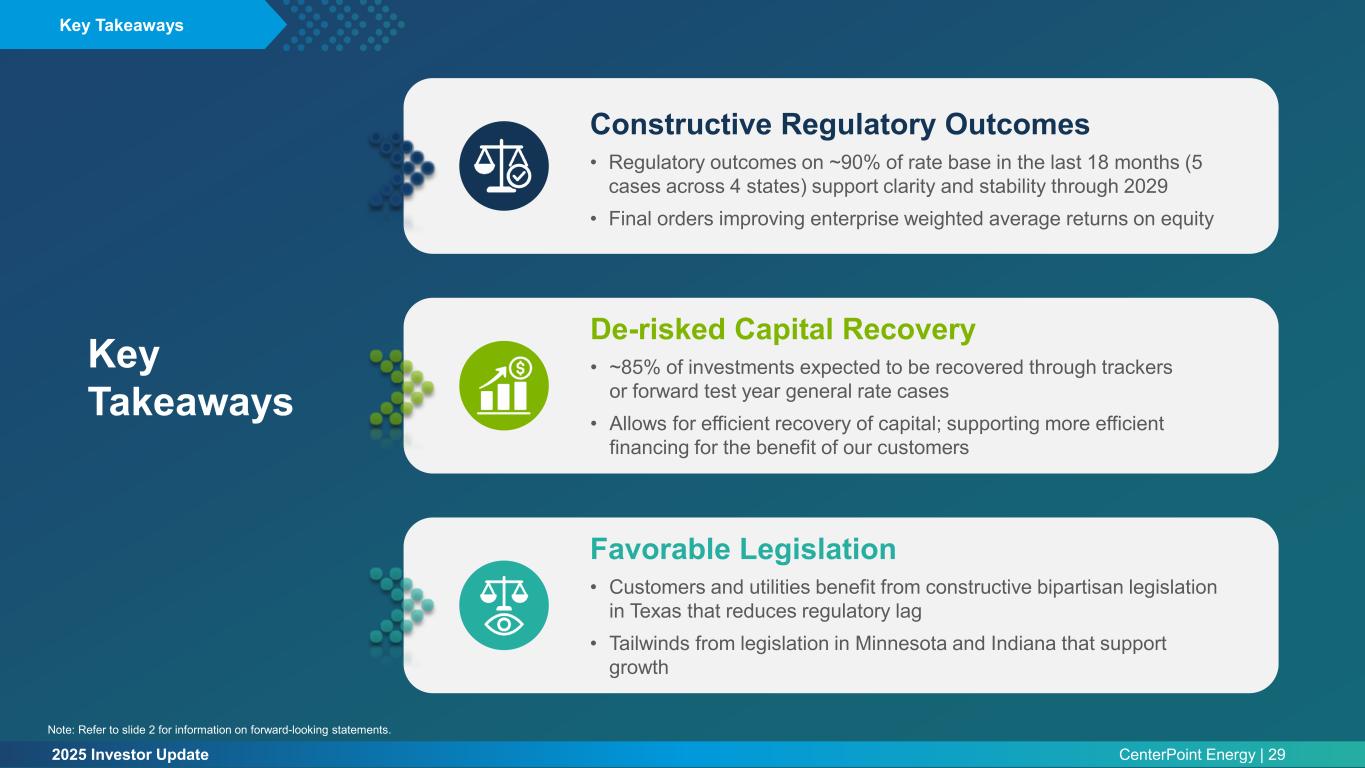
2025 Investor Update CenterPoint Energy | 29 Constructive Regulatory Outcomes • Regulatory outcomes on ~90% of rate base in the last 18 months (5 cases across 4 states) support clarity and stability through 2029 • Final orders improving enterprise weighted average returns on equity De-risked Capital Recovery • ~85% of investments expected to be recovered through trackers or forward test year general rate cases • Allows for efficient recovery of capital; supporting more efficient financing for the benefit of our customers Favorable Legislation • Customers and utilities benefit from constructive bipartisan legislation in Texas that reduces regulatory lag • Tailwinds from legislation in Minnesota and Indiana that support growth Key Takeaways Key Takeaways Note: Refer to slide 2 for information on forward-looking statements.
2025 Investor Update CenterPoint Energy | 30 Affordability & Financing Chris Foster EVP & CFO
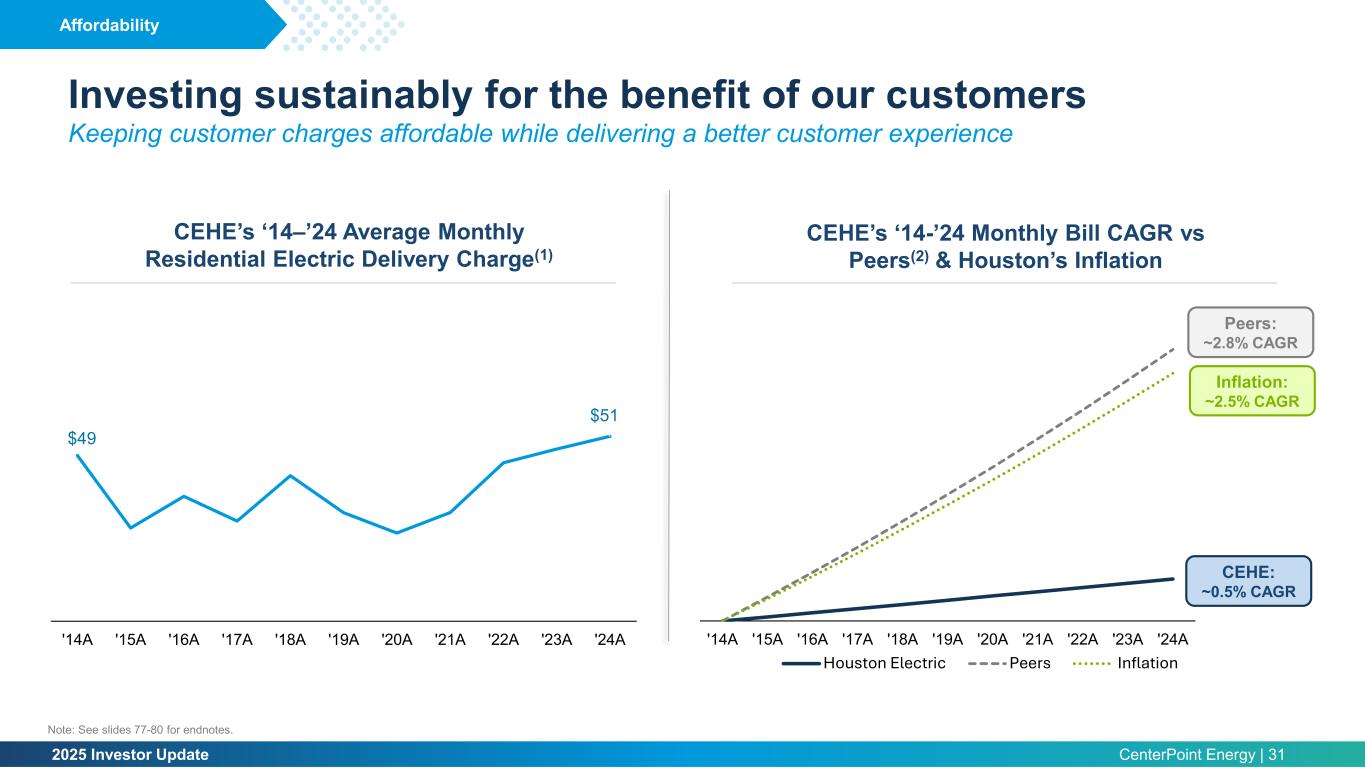
2025 Investor Update CenterPoint Energy | 31 Investing sustainably for the benefit of our customers Keeping customer charges affordable while delivering a better customer experience $1.0 '14A '15A '16A '17A '18A '19A '20A '21A '22A '23A '24A Houston Electric Peers Inflation CEHE’s ‘14-’24 Monthly Bill CAGR vs Peers(2) & Houston’s Inflation CEHE’s ‘14–’24 Average Monthly Residential Electric Delivery Charge(1) $49 $51 '14A '15A '16A '17A '18A '19A '20A '21A '22A '23A '24A Affordability CEHE: ~0.5% CAGR Peers: ~2.8% CAGR Inflation: ~2.5% CAGR Note: See slides 77-80 for endnotes.
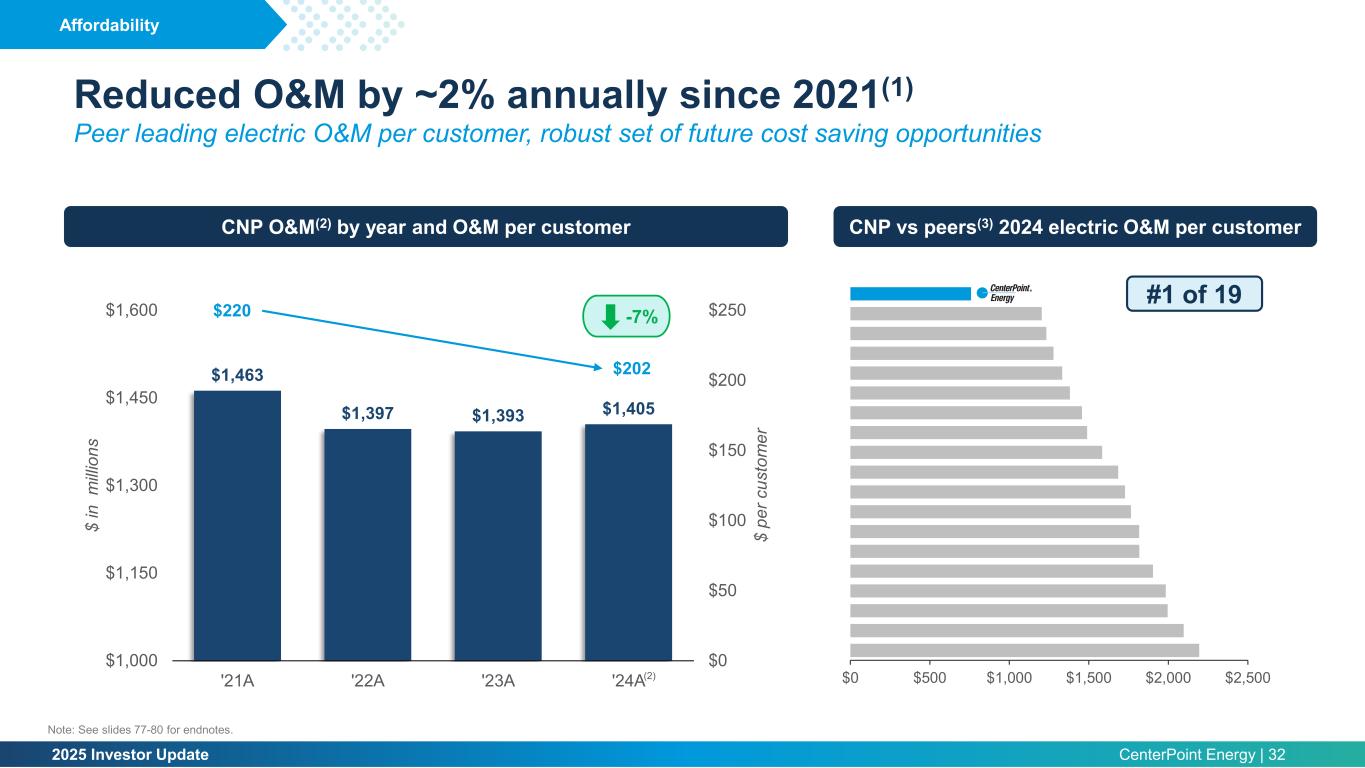
2025 Investor Update CenterPoint Energy | 32 Reduced O&M by ~2% annually since 2021(1) Peer leading electric O&M per customer, robust set of future cost saving opportunities $1,463 $1,397 $1,393 $1,405 $0 $50 $100 $150 $200 $250 $1,000 $1,150 $1,300 $1,450 $1,600 '21A '22A '23A '24A $ pe r c us to m er $ in m illi on s CNP O&M(2) by year and O&M per customer Affordability $0 $500 $1,000 $1,500 $2,000 $2,500 #1 of 19 CNP vs peers(3) 2024 electric O&M per customer (2) Note: See slides 77-80 for endnotes. $220 $202 -7%
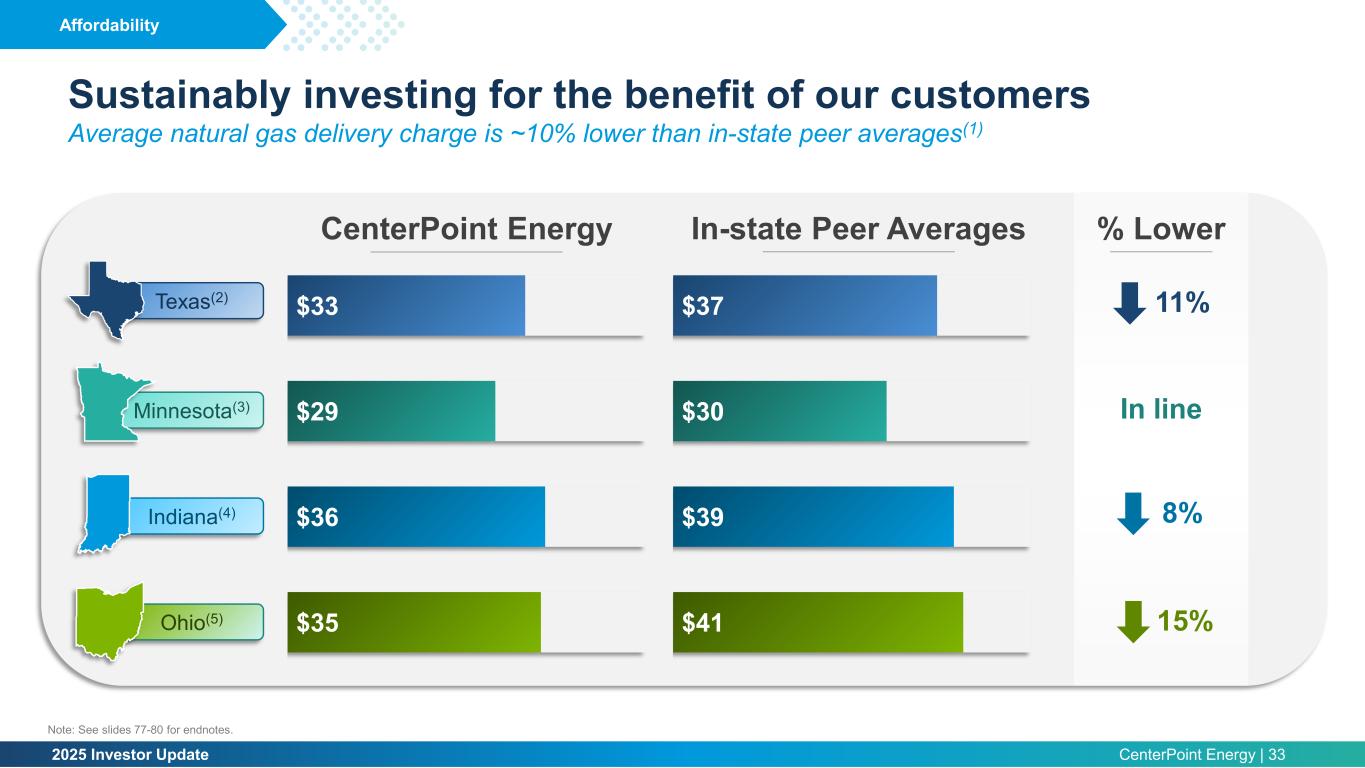
2025 Investor Update CenterPoint Energy | 33 $35 $36 $29 $33 $41 $39 $30 $37 Affordability Sustainably investing for the benefit of our customers Average natural gas delivery charge is ~10% lower than in-state peer averages(1) Texas(2) Minnesota(3) Indiana(4) Ohio(5) % Lower 11% In line 1 % 8% 15% CenterPoint Energy In-state Peer Averages % Lower Note: See slides 77-80 for endnotes.
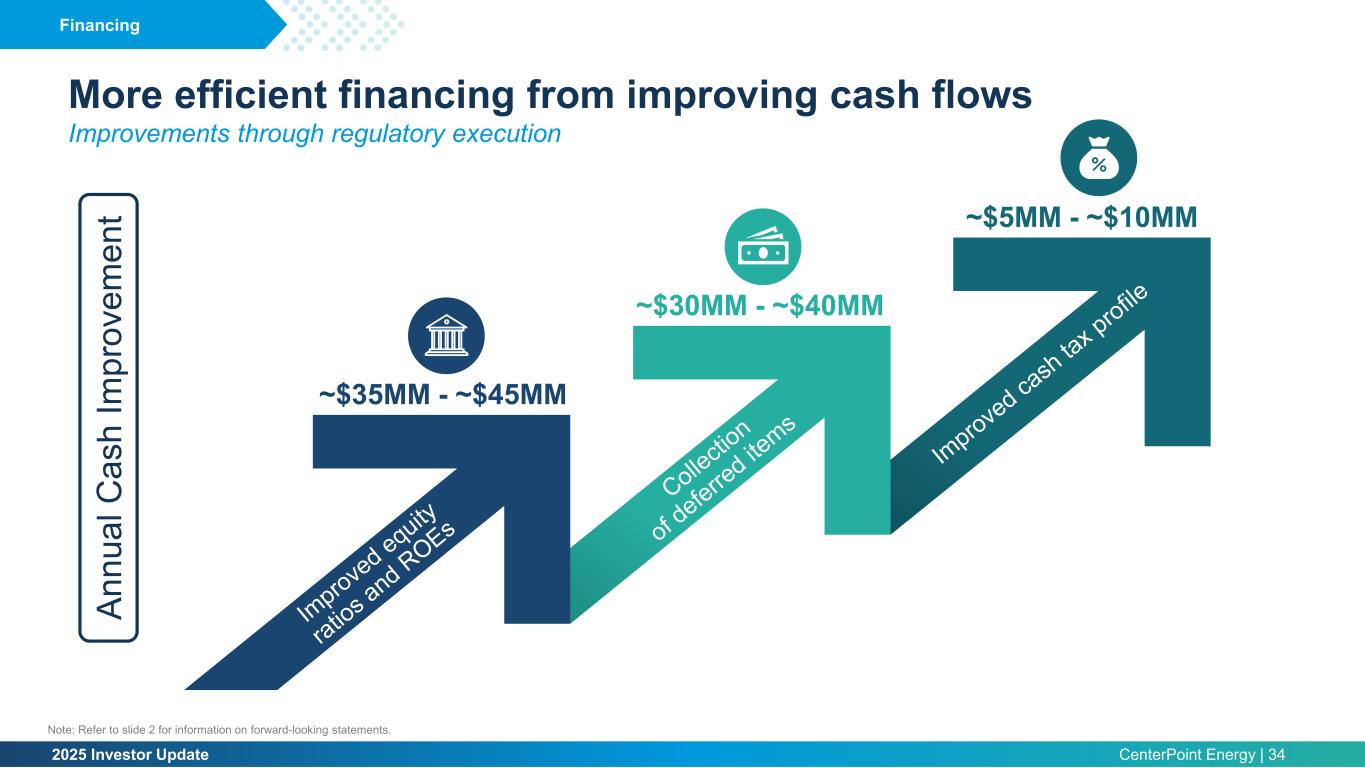
2025 Investor Update CenterPoint Energy | 34 More efficient financing from improving cash flows Improvements through regulatory execution Financing Note: Refer to slide 2 for information on forward-looking statements. ~$35MM - ~$45MM ~$30MM - ~$40MM ~$5MM - ~$10MM An nu al C as h Im pr ov em en t
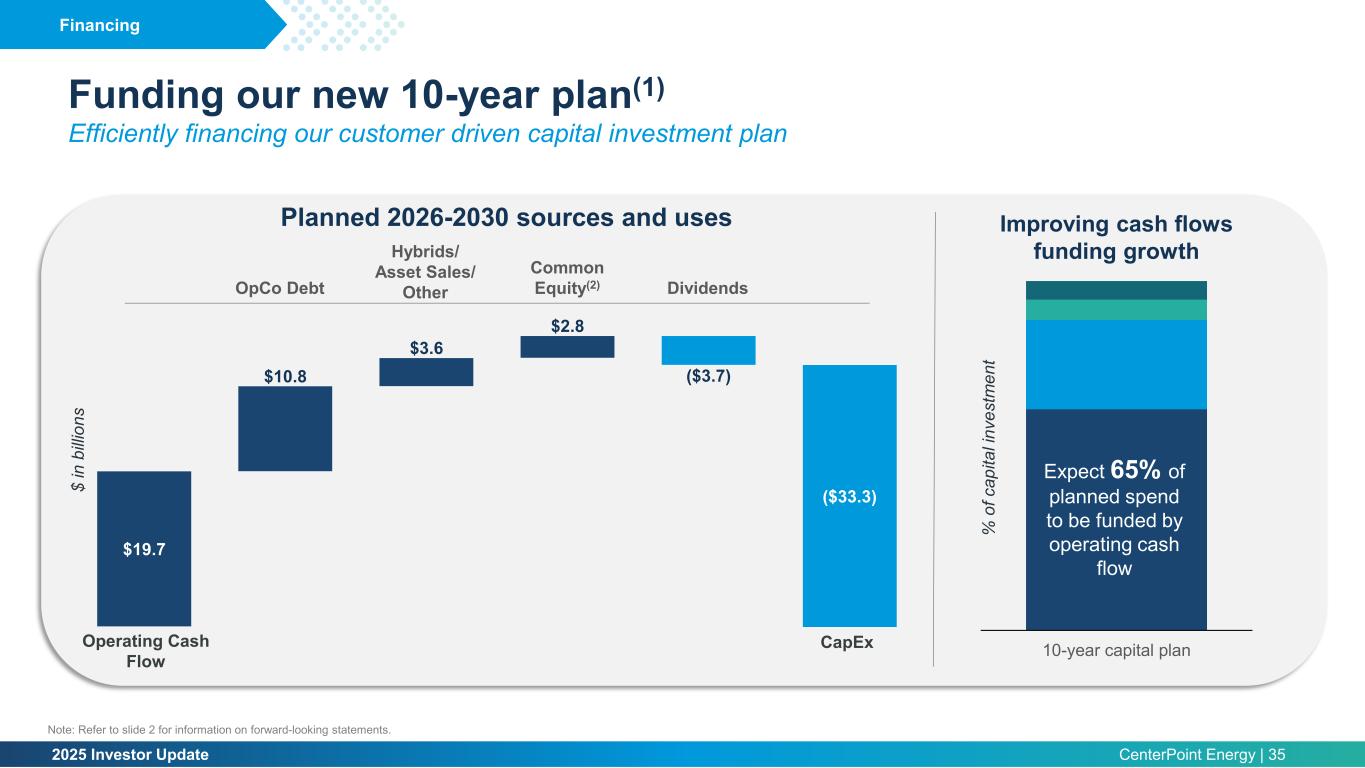
2025 Investor Update CenterPoint Energy | 35 Funding our new 10-year plan(1) Efficiently financing our customer driven capital investment plan Financing $19.7 $10.8 $3.6 $2.8 ($3.7) ($33.3) Operating Cash Flow CapEx $ in b illi on s OpCo Debt Hybrids/ Asset Sales/ Other Common Equity(2) Dividends Note: Refer to slide 2 for information on forward-looking statements. Planned 2026-2030 sources and uses 10-year capital plan % o f c ap ita l i nv es tm en t Expect 65% of planned spend to be funded by operating cash flow Improving cash flows funding growth
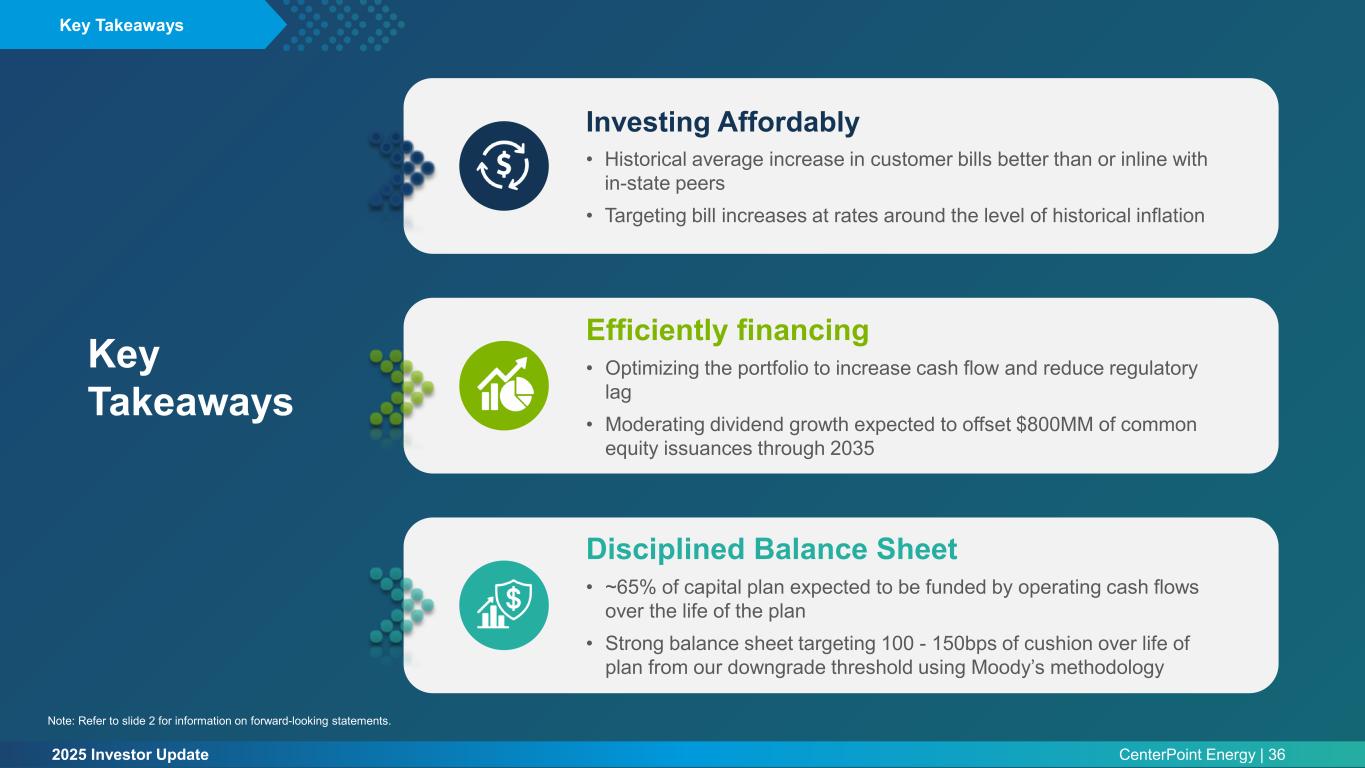
2025 Investor Update CenterPoint Energy | 36 Investing Affordably • Historical average increase in customer bills better than or inline with in-state peers • Targeting bill increases at rates around the level of historical inflation Efficiently financing • Optimizing the portfolio to increase cash flow and reduce regulatory lag • Moderating dividend growth expected to offset $800MM of common equity issuances through 2035 Disciplined Balance Sheet • ~65% of capital plan expected to be funded by operating cash flows over the life of the plan • Strong balance sheet targeting 100 - 150bps of cushion over life of plan from our downgrade threshold using Moody’s methodology Key Takeaways Key Takeaways Note: Refer to slide 2 for information on forward-looking statements.
2025 Investor Update CenterPoint Energy | 37 Closing Jason Wells President and CEO
2025 Investor Update CenterPoint Energy | 38 Appendix
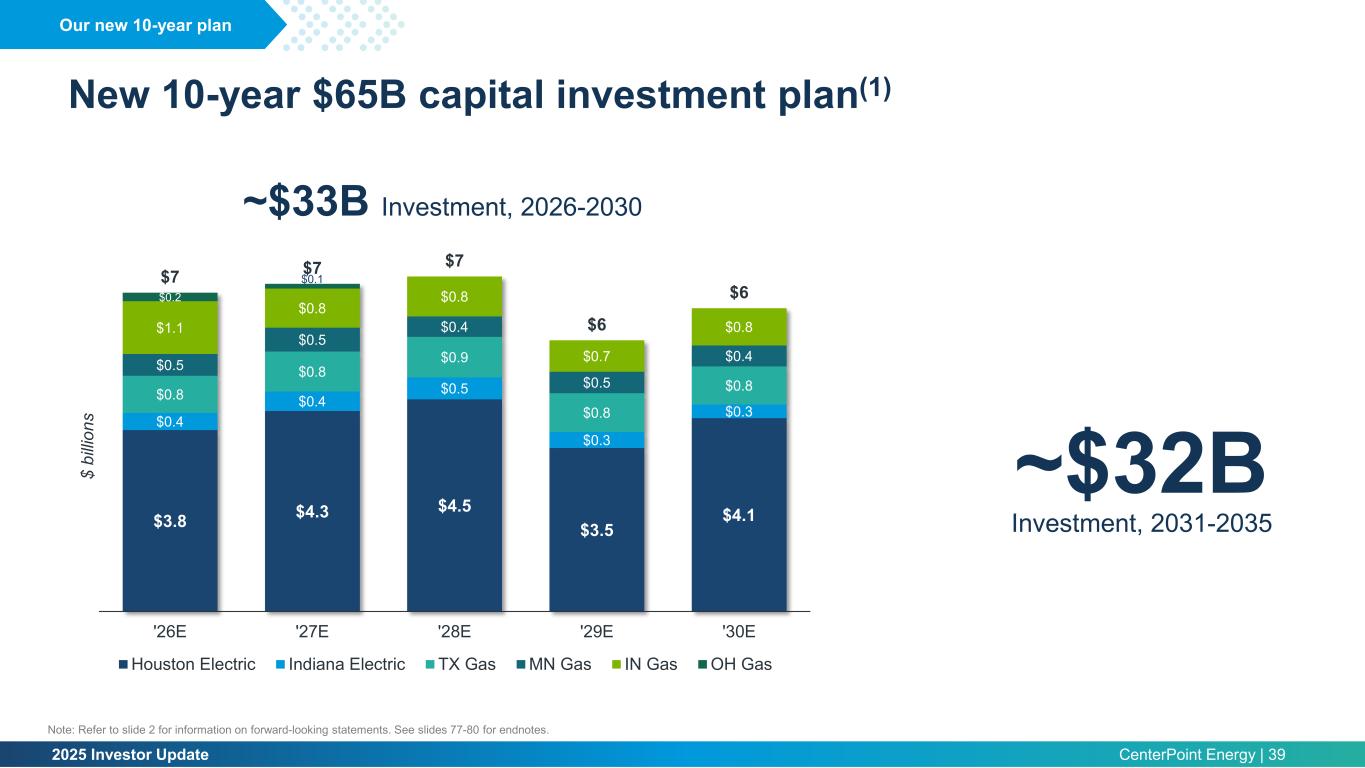
2025 Investor Update CenterPoint Energy | 39 New 10-year $65B capital investment plan(1) $3.8 $4.3 $4.5 $3.5 $4.1 $0.4 $0.4 $0.5 $0.3 $0.3 $0.8 $0.8 $0.9 $0.8 $0.8 $0.5 $0.5 $0.4 $0.5 $0.4 $1.1 $0.8 $0.8 $0.7 $0.8 $0.2 $0.1$7 $7 $7 $6 $6 '26E '27E '28E '29E '30E $ bi llio ns Houston Electric Indiana Electric TX Gas MN Gas IN Gas OH Gas ~$33B Investment, 2026-2030 Our new 10-year plan ~$32B Investment, 2031-2035 Note: Refer to slide 2 for information on forward-looking statements. See slides 77-80 for endnotes.
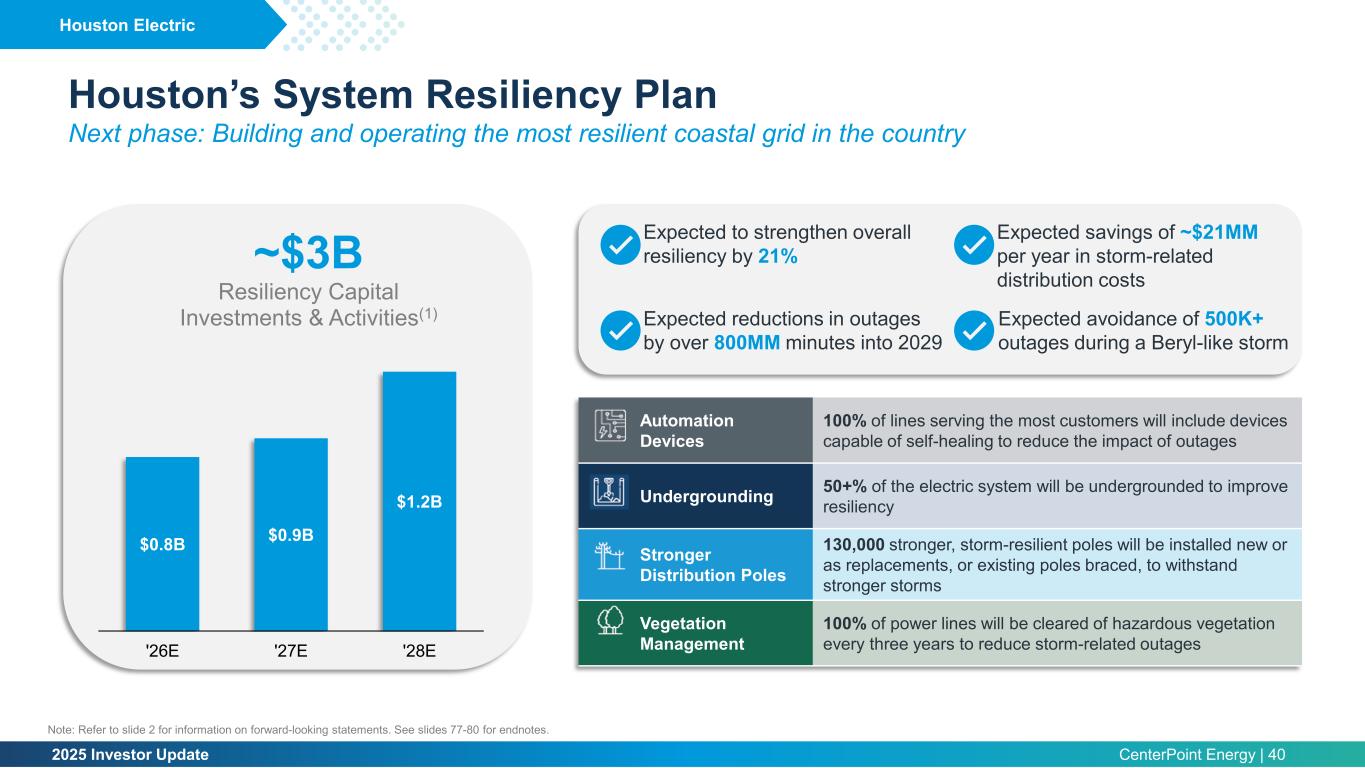
2025 Investor Update CenterPoint Energy | 40 Expected to strengthen overall resiliency by 21% Expected reductions in outages by over 800MM minutes into 2029 Expected savings of ~$21MM per year in storm-related distribution costs Expected avoidance of 500K+ outages during a Beryl-like storm Automation Devices 100% of lines serving the most customers will include devices capable of self-healing to reduce the impact of outages Undergrounding 50+% of the electric system will be undergrounded to improve resiliency Stronger Distribution Poles 130,000 stronger, storm-resilient poles will be installed new or as replacements, or existing poles braced, to withstand stronger storms Vegetation Management 100% of power lines will be cleared of hazardous vegetation every three years to reduce storm-related outages $0.8B $0.9B $1.2B '26E '27E '28E ~$3B Resiliency Capital Investments & Activities(1) Houston’s System Resiliency Plan Next phase: Building and operating the most resilient coastal grid in the country Houston Electric Note: Refer to slide 2 for information on forward-looking statements. See slides 77-80 for endnotes.
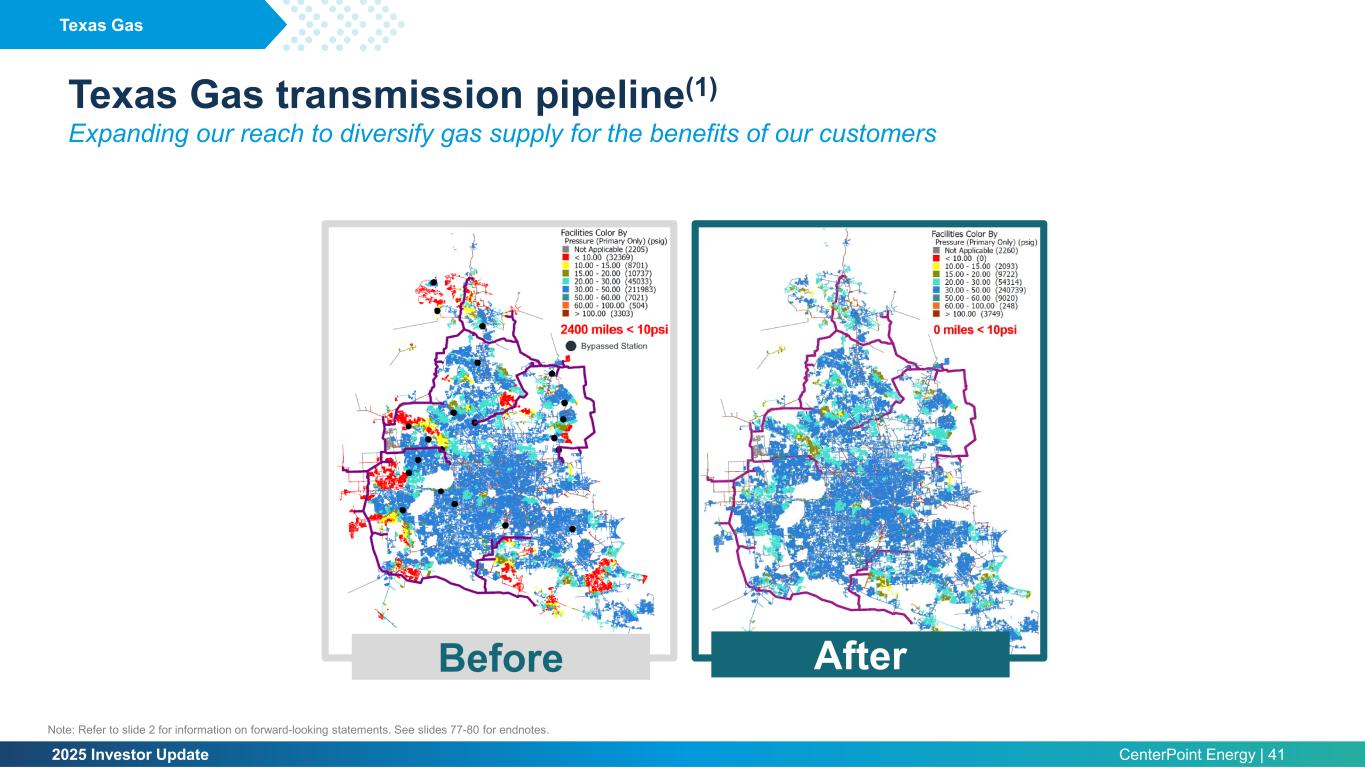
2025 Investor Update CenterPoint Energy | 41 Texas Gas transmission pipeline(1) Expanding our reach to diversify gas supply for the benefits of our customers Texas Gas Note: Refer to slide 2 for information on forward-looking statements. See slides 77-80 for endnotes. Before After
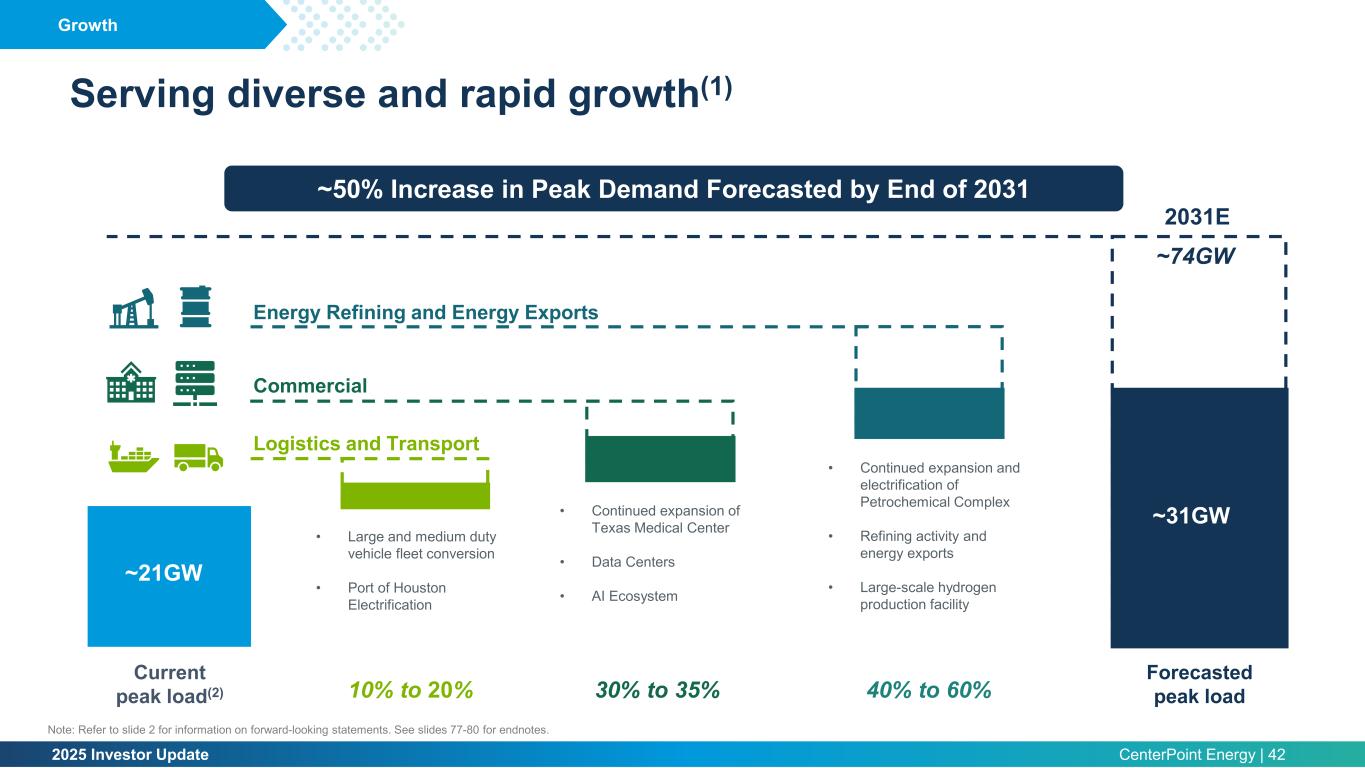
2025 Investor Update CenterPoint Energy | 42 Growth ~74GW Logistics and Transport • Large and medium duty vehicle fleet conversion • Port of Houston Electrification Commercial • Continued expansion of Texas Medical Center • Data Centers • AI Ecosystem ~21GW 2031E ~31GW Energy Refining and Energy Exports • Continued expansion and electrification of Petrochemical Complex • Refining activity and energy exports • Large-scale hydrogen production facility 10% to 20% 30% to 35% 40% to 60% Current peak load(2) Forecasted peak load Serving diverse and rapid growth(1) ~50% Increase in Peak Demand Forecasted by End of 2031 Note: Refer to slide 2 for information on forward-looking statements. See slides 77-80 for endnotes.
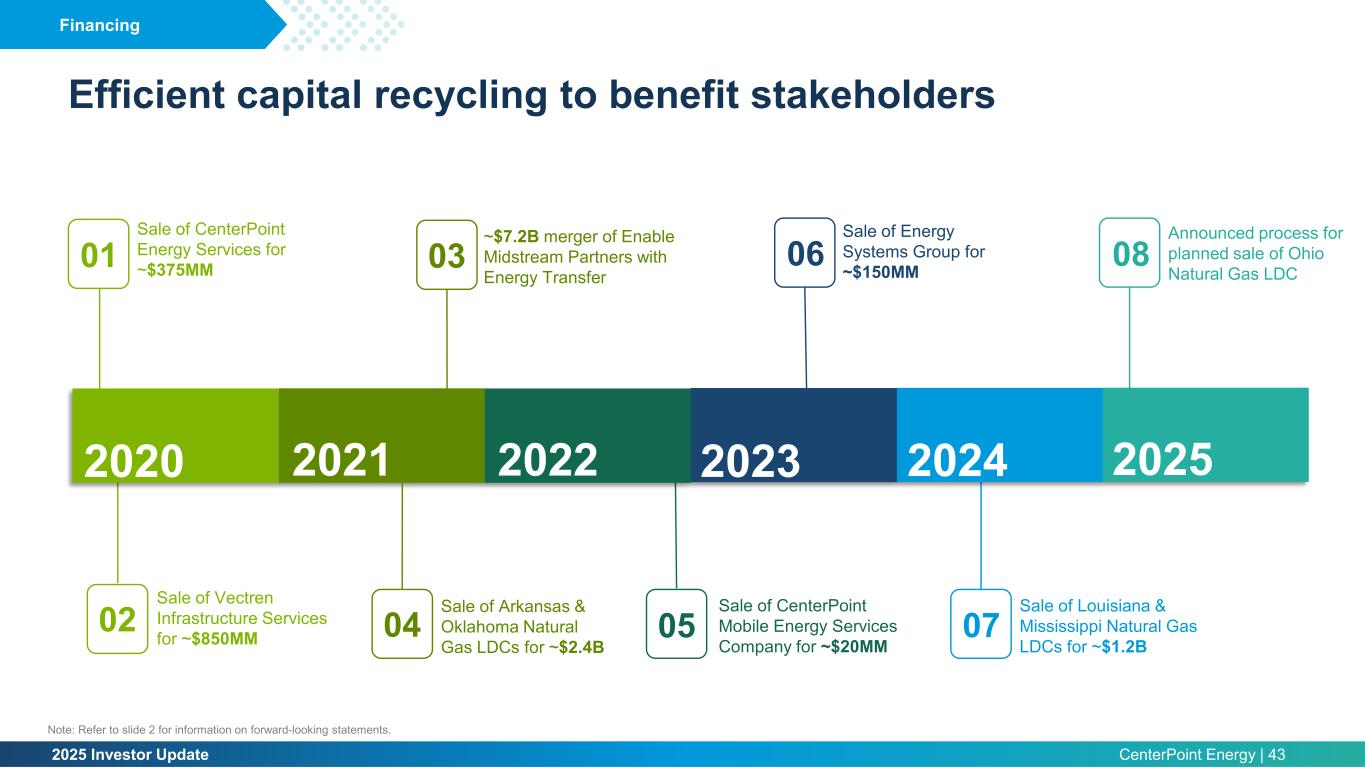
2025 Investor Update CenterPoint Energy | 43 07 Sale of Louisiana & Mississippi Natural Gas LDCs for ~$1.2B 05 Sale of CenterPoint Mobile Energy Services Company for ~$20MM 02 Sale of Vectren Infrastructure Services for ~$850MM 01 Sale of CenterPoint Energy Services for ~$375MM 08 Announced process for planned sale of Ohio Natural Gas LDC 2020 2021 2022 202520242023 03 ~$7.2B merger of Enable Midstream Partners with Energy Transfer 04 Sale of Arkansas & Oklahoma Natural Gas LDCs for ~$2.4B Sale of Energy Systems Group for ~$150MM 06 Efficient capital recycling to benefit stakeholders Financing Note: Refer to slide 2 for information on forward-looking statements.
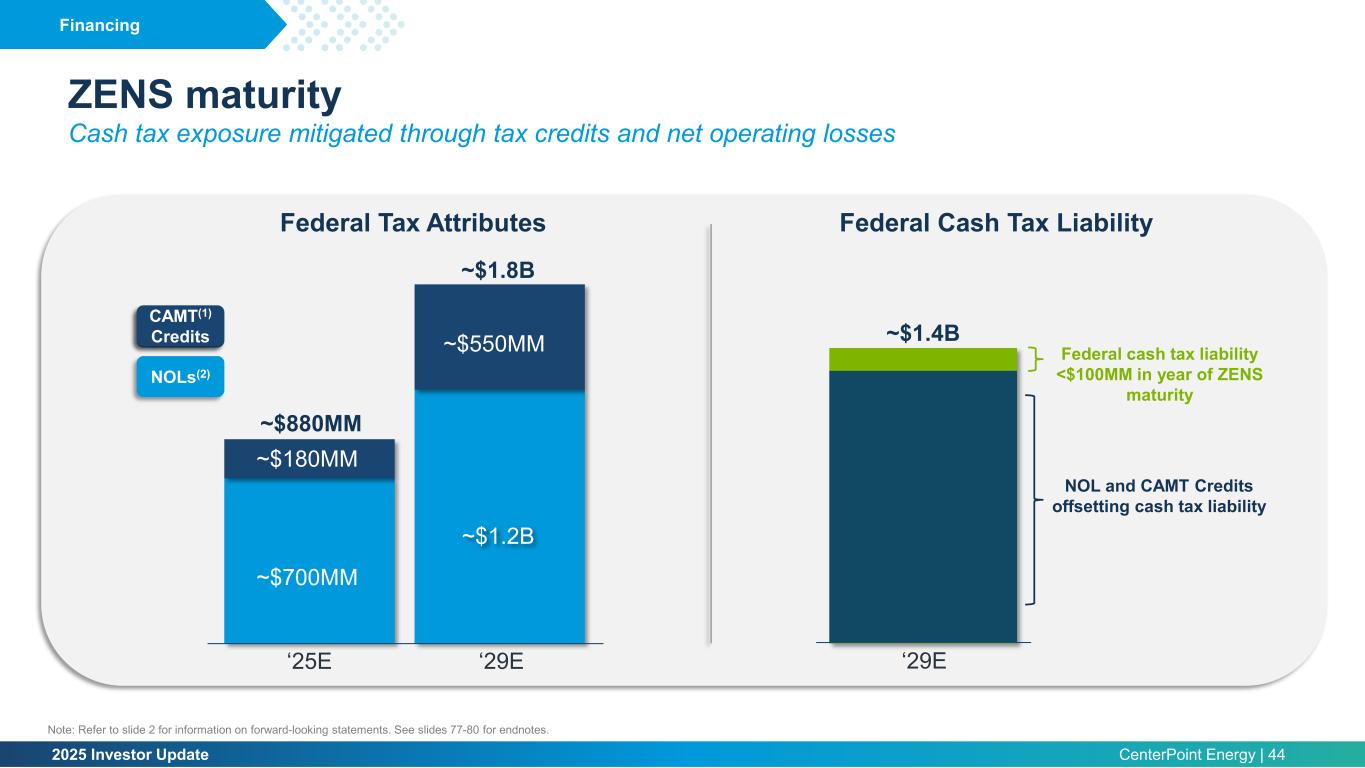
2025 Investor Update CenterPoint Energy | 44 ZENS maturity Cash tax exposure mitigated through tax credits and net operating losses Financing CAMT(1) Credits ‘25E ~$700MM ~$240MM ~$880MM ~$750MM ~$1.8B ‘29E Federal Tax Attributes Federal Cash Tax Liability NOLs(2) ~$180MM ~$1.2B ~$550MM ‘29E ~$1.4B Federal cash tax liability <$100MM in year of ZENS maturity Note: Refer to slide 2 for information on forward-looking statements. See slides 77-80 for endnotes. NOL and CAMT Credits offsetting cash tax liability
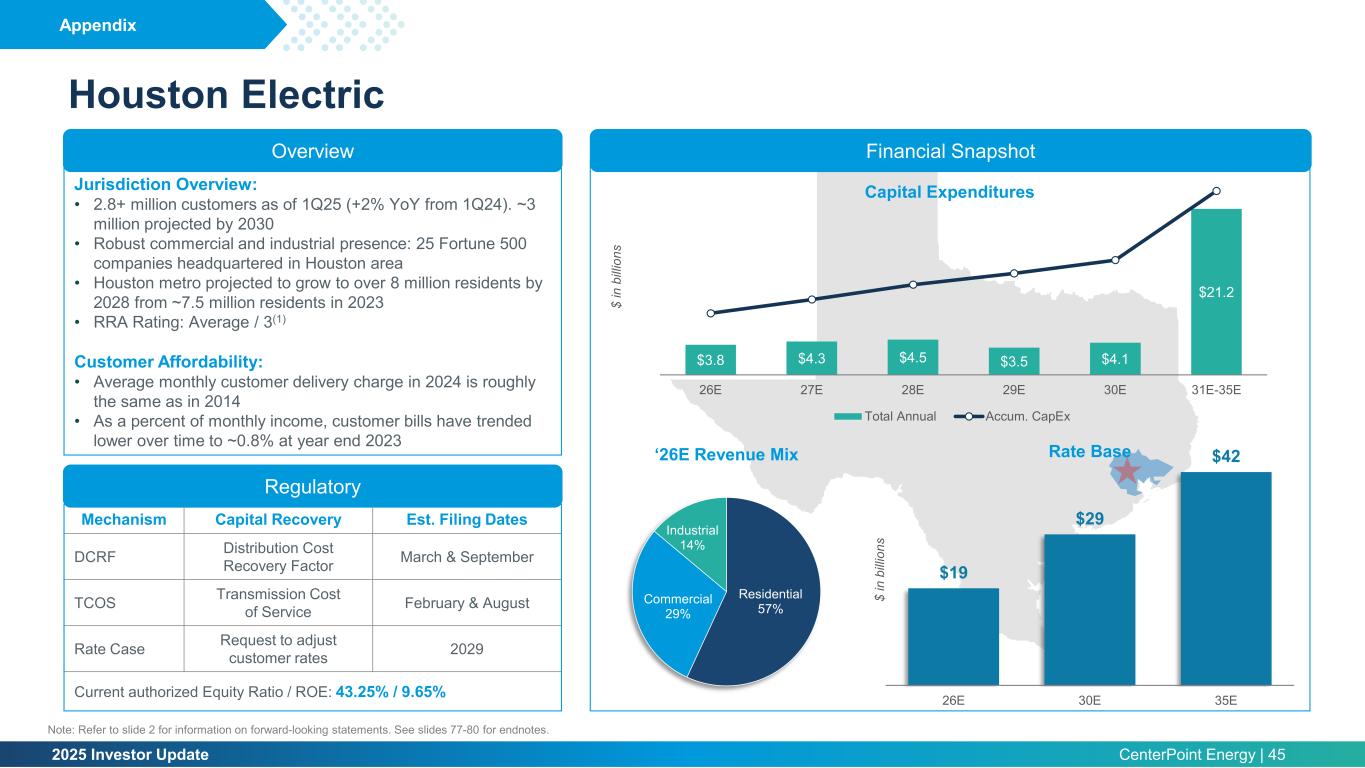
2025 Investor Update CenterPoint Energy | 45 Houston Electric Jurisdiction Overview: • 2.8+ million customers as of 1Q25 (+2% YoY from 1Q24). ~3 million projected by 2030 • Robust commercial and industrial presence: 25 Fortune 500 companies headquartered in Houston area • Houston metro projected to grow to over 8 million residents by 2028 from ~7.5 million residents in 2023 • RRA Rating: Average / 3(1) Customer Affordability: • Average monthly customer delivery charge in 2024 is roughly the same as in 2014 • As a percent of monthly income, customer bills have trended lower over time to ~0.8% at year end 2023 Regulatory Mechanism Capital Recovery Est. Filing Dates DCRF Distribution Cost Recovery Factor March & September TCOS Transmission Cost of Service February & August Rate Case Request to adjust customer rates 2029 Current authorized Equity Ratio / ROE: 43.25% / 9.65% Financial SnapshotOverview Appendix Note: Refer to slide 2 for information on forward-looking statements. See slides 77-80 for endnotes. $3.8 $4.3 $4.5 $3.5 $4.1 $21.2 -$15 $5 $25 $45 $0 $3 $5 $8 $10 $13 $15 $18 $20 $23 $25 26E 27E 28E 29E 30E 31E-35E $ in b ill io ns Capital Expenditures Total Annual Accum. CapEx $19 $29 $42 26E 30E 35E $ in b ill io ns Rate Base Residential 57% Commercial 29% Industrial 14% ‘26E Revenue Mix
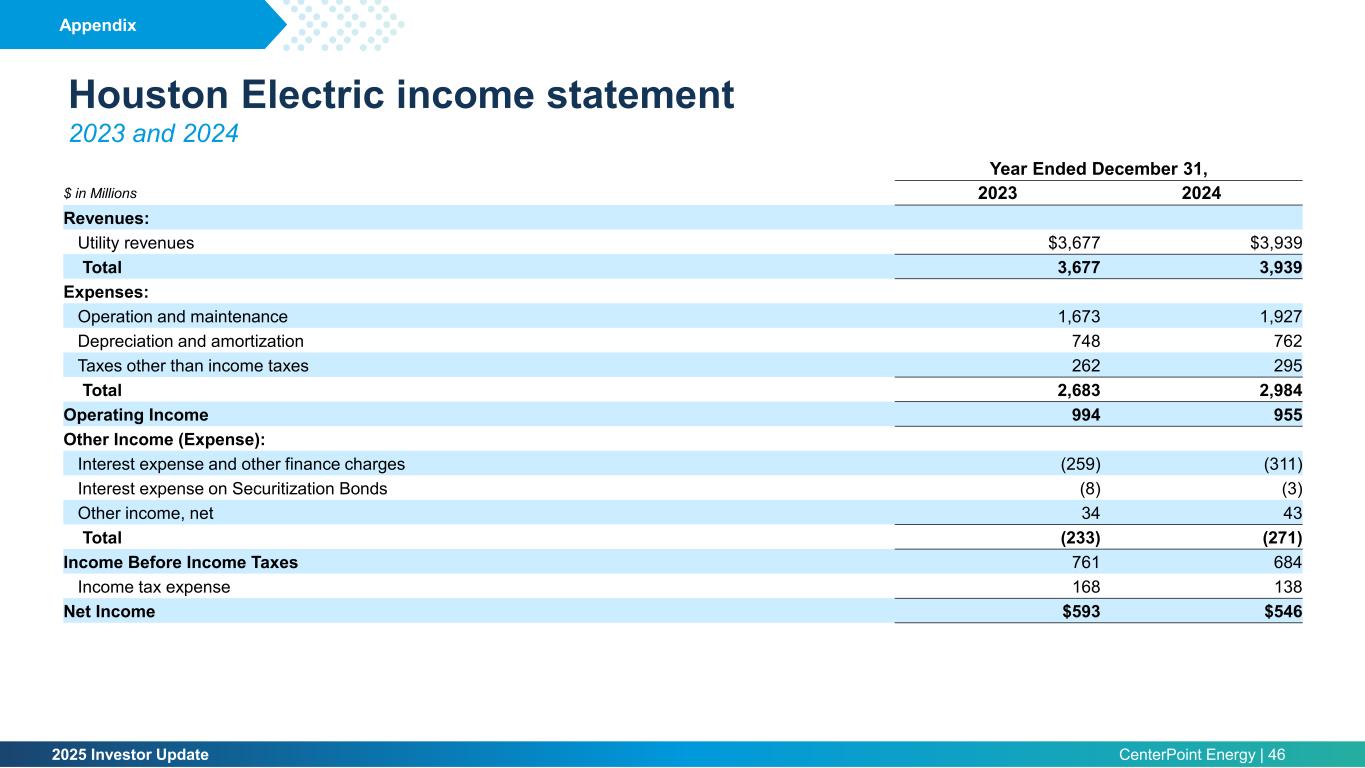
2025 Investor Update CenterPoint Energy | 46 Houston Electric income statement 2023 and 2024 Year Ended December 31, $ in Millions 2023 2024 Revenues: Utility revenues $3,677 $3,939 Total 3,677 3,939 Expenses: Operation and maintenance 1,673 1,927 Depreciation and amortization 748 762 Taxes other than income taxes 262 295 Total 2,683 2,984 Operating Income 994 955 Other Income (Expense): Interest expense and other finance charges (259) (311) Interest expense on Securitization Bonds (8) (3) Other income, net 34 43 Total (233) (271) Income Before Income Taxes 761 684 Income tax expense 168 138 Net Income $593 $546 Appendix
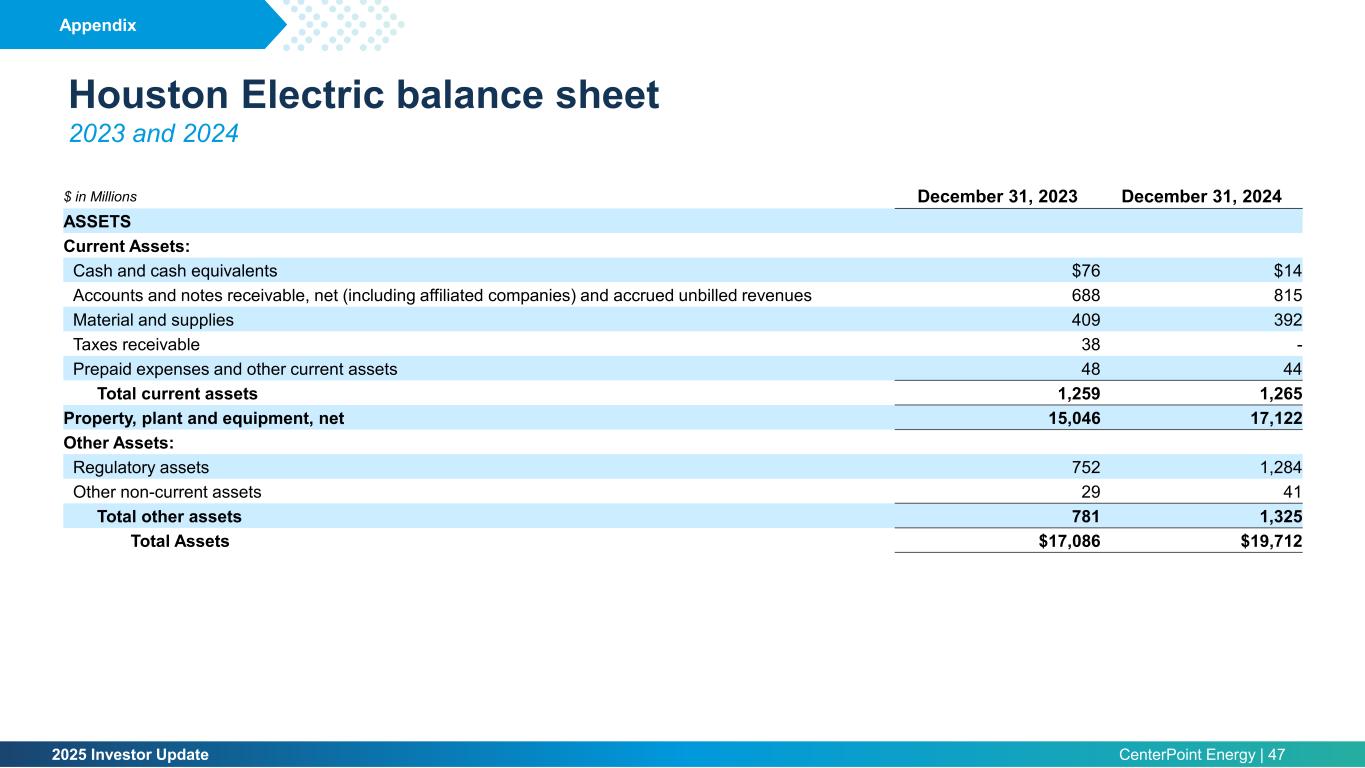
2025 Investor Update CenterPoint Energy | 47 Houston Electric balance sheet 2023 and 2024 $ in Millions December 31, 2023 December 31, 2024 ASSETS Current Assets: Cash and cash equivalents $76 $14 Accounts and notes receivable, net (including affiliated companies) and accrued unbilled revenues 688 815 Material and supplies 409 392 Taxes receivable 38 - Prepaid expenses and other current assets 48 44 Total current assets 1,259 1,265 Property, plant and equipment, net 15,046 17,122 Other Assets: Regulatory assets 752 1,284 Other non-current assets 29 41 Total other assets 781 1,325 Total Assets $17,086 $19,712 Appendix
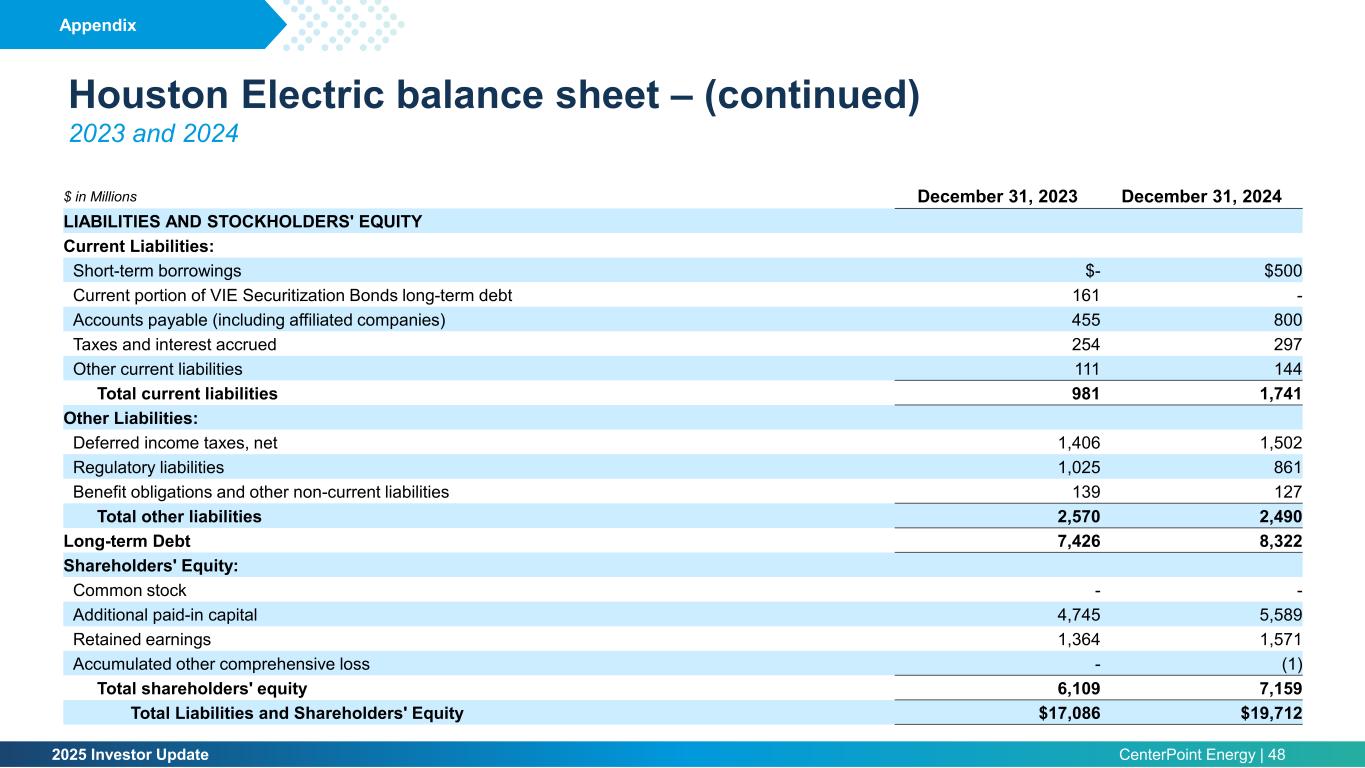
2025 Investor Update CenterPoint Energy | 48 Houston Electric balance sheet – (continued) 2023 and 2024 Appendix $ in Millions December 31, 2023 December 31, 2024 LIABILITIES AND STOCKHOLDERS' EQUITY Current Liabilities: Short-term borrowings $- $500 Current portion of VIE Securitization Bonds long-term debt 161 - Accounts payable (including affiliated companies) 455 800 Taxes and interest accrued 254 297 Other current liabilities 111 144 Total current liabilities 981 1,741 Other Liabilities: Deferred income taxes, net 1,406 1,502 Regulatory liabilities 1,025 861 Benefit obligations and other non-current liabilities 139 127 Total other liabilities 2,570 2,490 Long-term Debt 7,426 8,322 Shareholders' Equity: Common stock - - Additional paid-in capital 4,745 5,589 Retained earnings 1,364 1,571 Accumulated other comprehensive loss - (1) Total shareholders' equity 6,109 7,159 Total Liabilities and Shareholders' Equity $17,086 $19,712
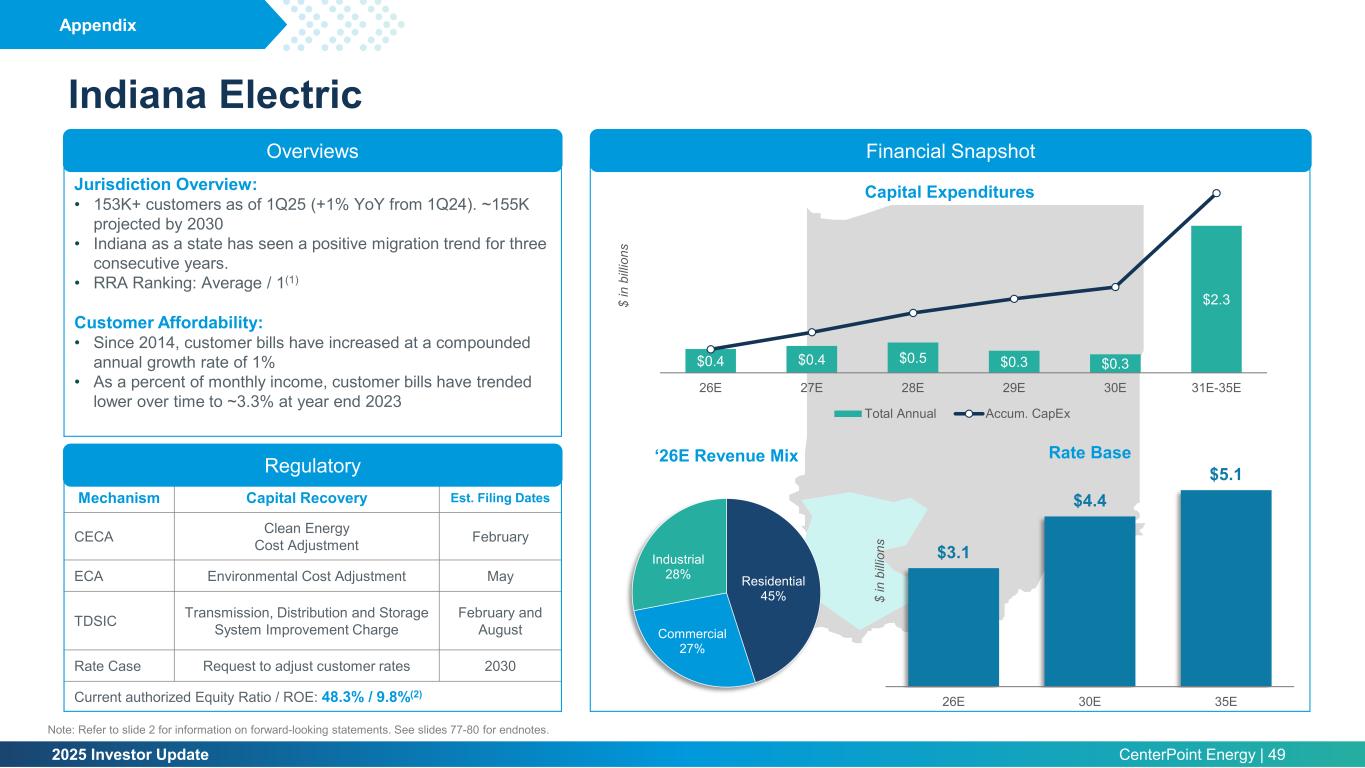
2025 Investor Update CenterPoint Energy | 49 Indiana Electric Appendix Note: Refer to slide 2 for information on forward-looking statements. See slides 77-80 for endnotes. Mechanism Capital Recovery Est. Filing Dates CECA Clean Energy Cost Adjustment February ECA Environmental Cost Adjustment May TDSIC Transmission, Distribution and Storage System Improvement Charge February and August Rate Case Request to adjust customer rates 2030 Current authorized Equity Ratio / ROE: 48.3% / 9.8%(2) Overviews Regulatory Financial Snapshot Jurisdiction Overview: • 153K+ customers as of 1Q25 (+1% YoY from 1Q24). ~155K projected by 2030 • Indiana as a state has seen a positive migration trend for three consecutive years. • RRA Ranking: Average / 1(1) Customer Affordability: • Since 2014, customer bills have increased at a compounded annual growth rate of 1% • As a percent of monthly income, customer bills have trended lower over time to ~3.3% at year end 2023 $0.4 $0.4 $0.5 $0.3 $0.3 $2.3 $0$0 $1 $1 $2 $2 $3 $3 26E 27E 28E 29E 30E 31E-35E $ in b ill io ns Capital Expenditures Total Annual Accum. CapEx $3.1 $4.4 $5.1 26E 30E 35E $ in b ill io ns Rate Base Residential 45% Commercial 27% Industrial 28% ‘26E Revenue Mix
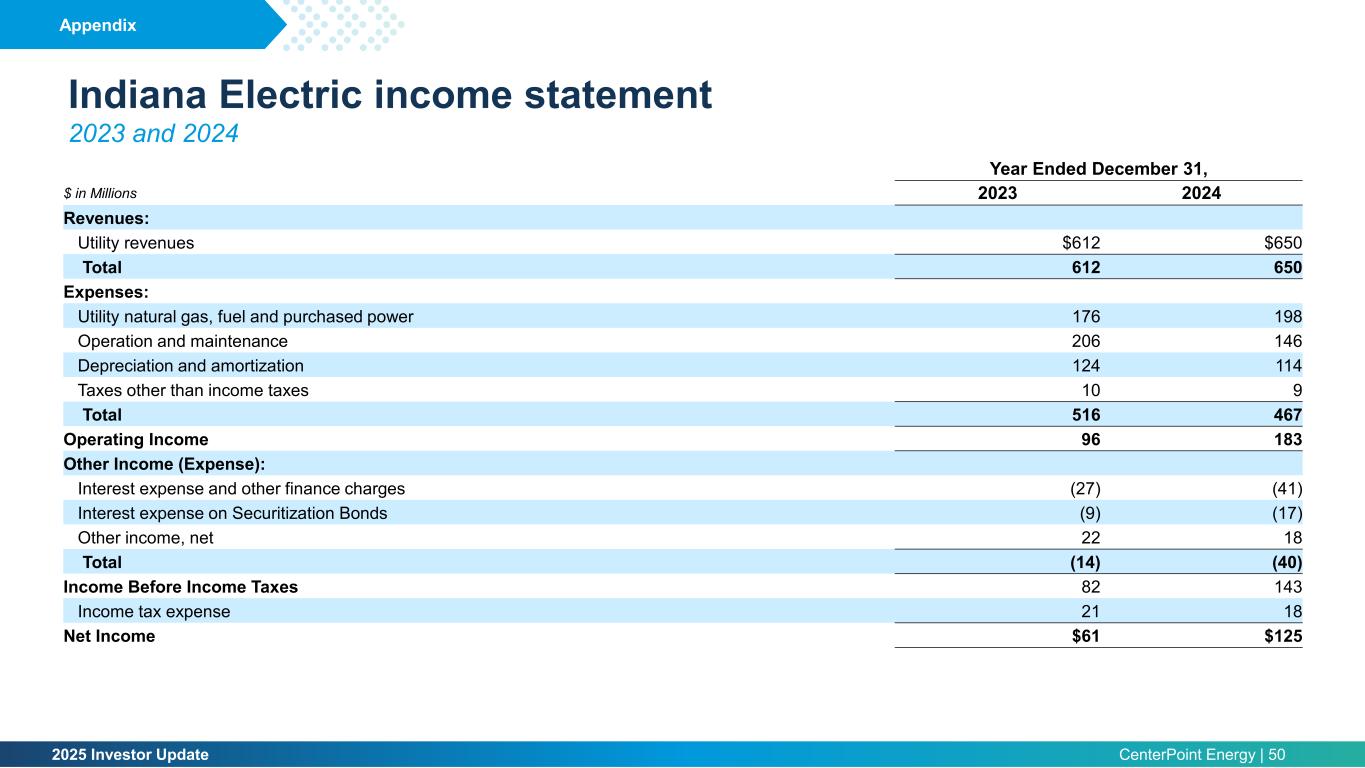
2025 Investor Update CenterPoint Energy | 50 Indiana Electric income statement 2023 and 2024 Year Ended December 31, $ in Millions 2023 2024 Revenues: Utility revenues $612 $650 Total 612 650 Expenses: Utility natural gas, fuel and purchased power 176 198 Operation and maintenance 206 146 Depreciation and amortization 124 114 Taxes other than income taxes 10 9 Total 516 467 Operating Income 96 183 Other Income (Expense): Interest expense and other finance charges (27) (41) Interest expense on Securitization Bonds (9) (17) Other income, net 22 18 Total (14) (40) Income Before Income Taxes 82 143 Income tax expense 21 18 Net Income $61 $125 Appendix
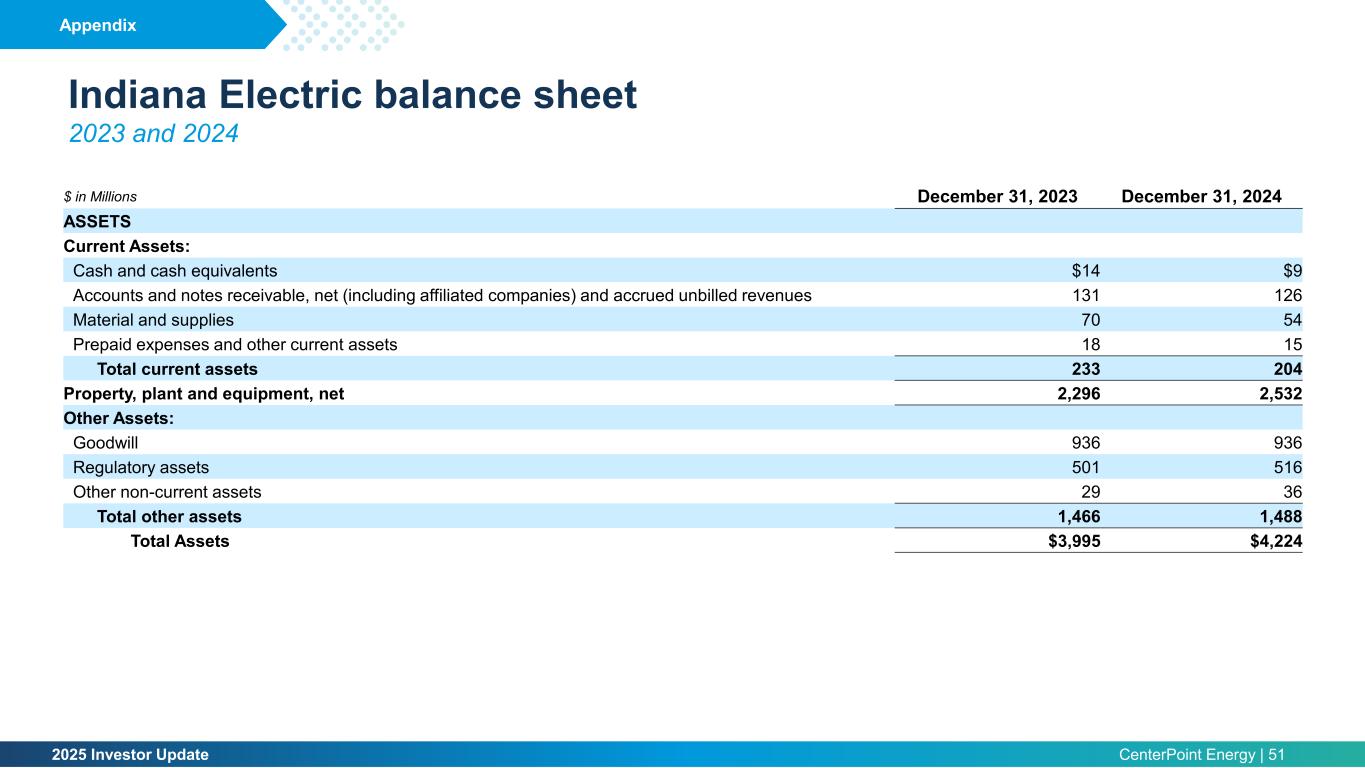
2025 Investor Update CenterPoint Energy | 51 Indiana Electric balance sheet 2023 and 2024 $ in Millions December 31, 2023 December 31, 2024 ASSETS Current Assets: Cash and cash equivalents $14 $9 Accounts and notes receivable, net (including affiliated companies) and accrued unbilled revenues 131 126 Material and supplies 70 54 Prepaid expenses and other current assets 18 15 Total current assets 233 204 Property, plant and equipment, net 2,296 2,532 Other Assets: Goodwill 936 936 Regulatory assets 501 516 Other non-current assets 29 36 Total other assets 1,466 1,488 Total Assets $3,995 $4,224 Appendix
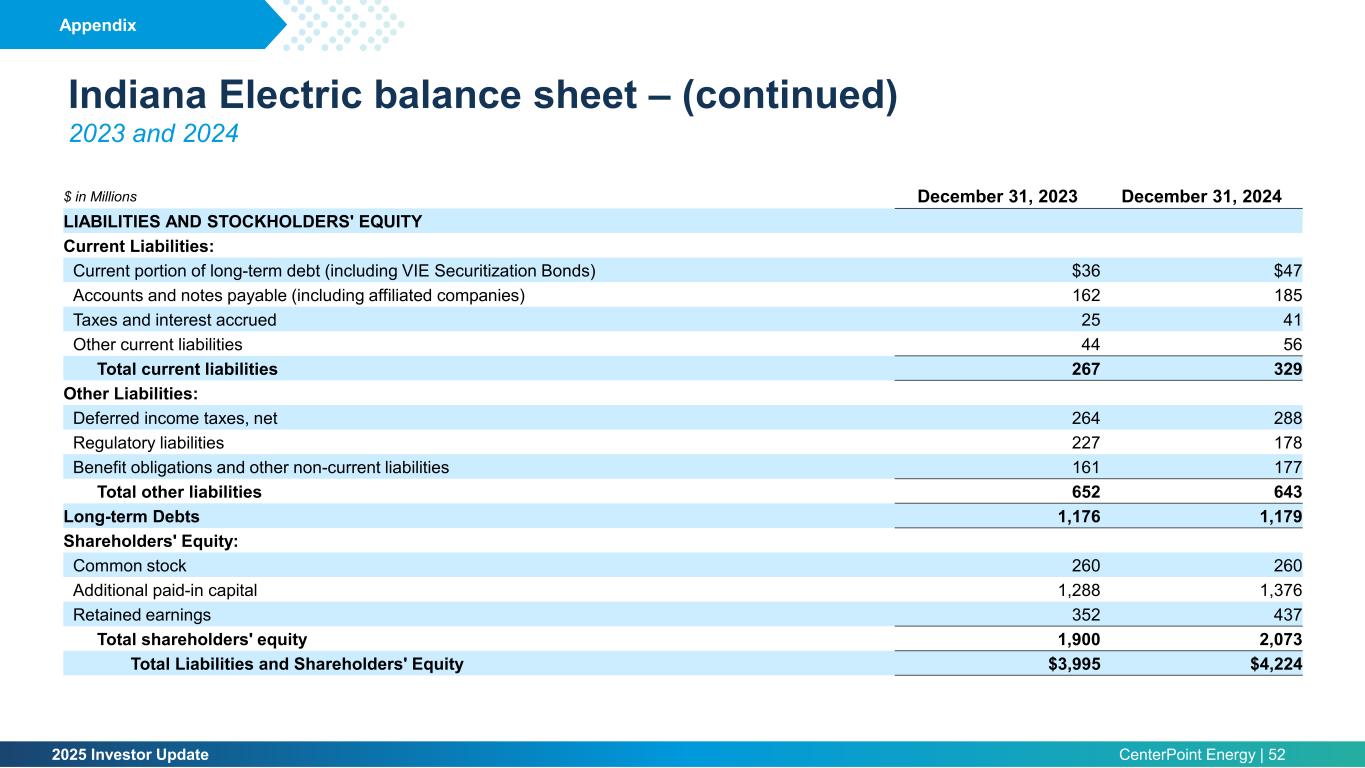
2025 Investor Update CenterPoint Energy | 52 Indiana Electric balance sheet – (continued) 2023 and 2024 Appendix $ in Millions December 31, 2023 December 31, 2024 LIABILITIES AND STOCKHOLDERS' EQUITY Current Liabilities: Current portion of long-term debt (including VIE Securitization Bonds) $36 $47 Accounts and notes payable (including affiliated companies) 162 185 Taxes and interest accrued 25 41 Other current liabilities 44 56 Total current liabilities 267 329 Other Liabilities: Deferred income taxes, net 264 288 Regulatory liabilities 227 178 Benefit obligations and other non-current liabilities 161 177 Total other liabilities 652 643 Long-term Debts 1,176 1,179 Shareholders' Equity: Common stock 260 260 Additional paid-in capital 1,288 1,376 Retained earnings 352 437 Total shareholders' equity 1,900 2,073 Total Liabilities and Shareholders' Equity $3,995 $4,224
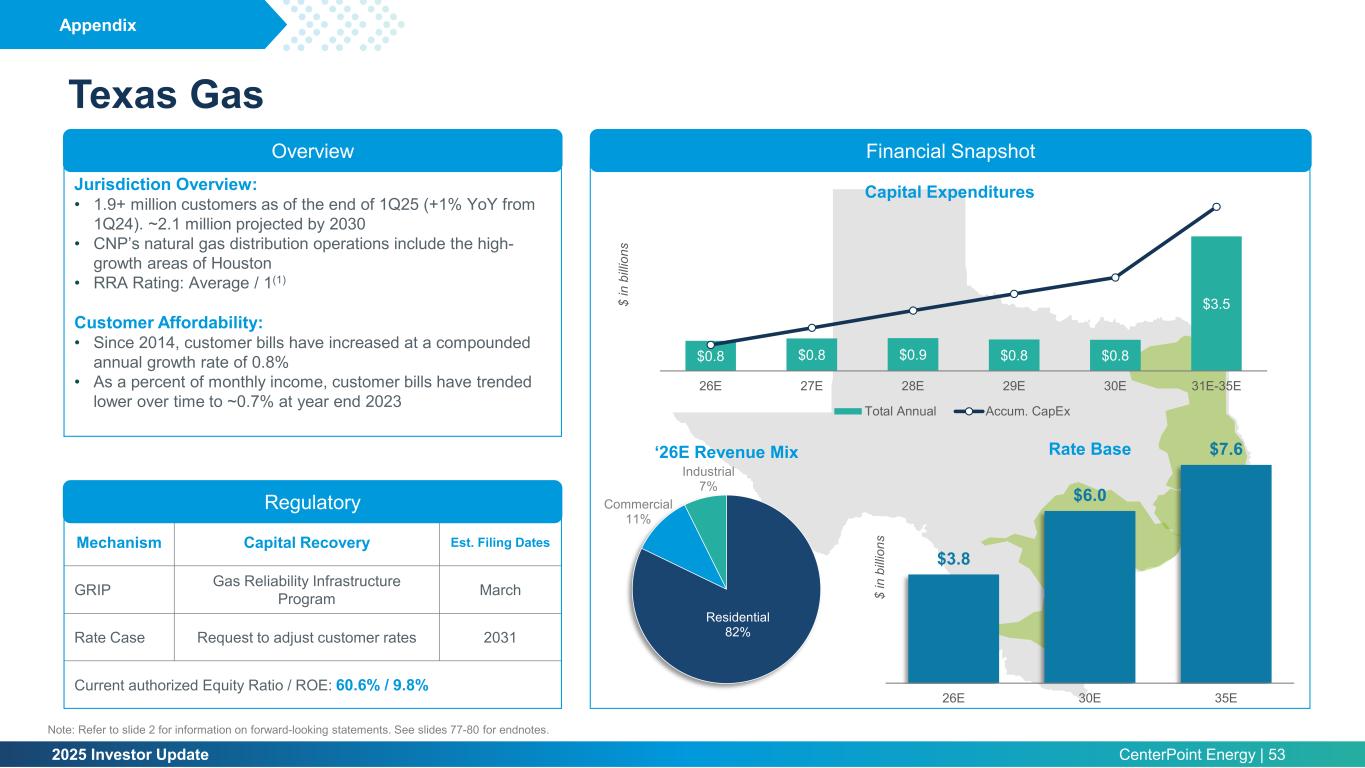
2025 Investor Update CenterPoint Energy | 53 Texas Gas Financial Snapshot Mechanism Capital Recovery Est. Filing Dates GRIP Gas Reliability Infrastructure Program March Rate Case Request to adjust customer rates 2031 Current authorized Equity Ratio / ROE: 60.6% / 9.8% (2) Overview Regulatory Jurisdiction Overview: • 1.9+ million customers as of the end of 1Q25 (+1% YoY from 1Q24). ~2.1 million projected by 2030 • CNP’s natural gas distribution operations include the high- growth areas of Houston • RRA Rating: Average / 1(1) Customer Affordability: • Since 2014, customer bills have increased at a compounded annual growth rate of 0.8% • As a percent of monthly income, customer bills have trended lower over time to ~0.7% at year end 2023 (2) Appendix Note: Refer to slide 2 for information on forward-looking statements. See slides 77-80 for endnotes. $0.8 $0.8 $0.9 $0.8 $0.8 $3.5 -$1$0 $1 $1 $2 $2 $3 $3 $4 $4 $5 $5 26E 27E 28E 29E 30E 31E-35E $ in b ill io ns Capital Expenditures Total Annual Accum. CapEx $3.8 $6.0 $7.6 26E 30E 35E $ in b ill io ns Rate Base Residential 82% Commercial 11% Industrial 7% ‘26E Revenue Mix
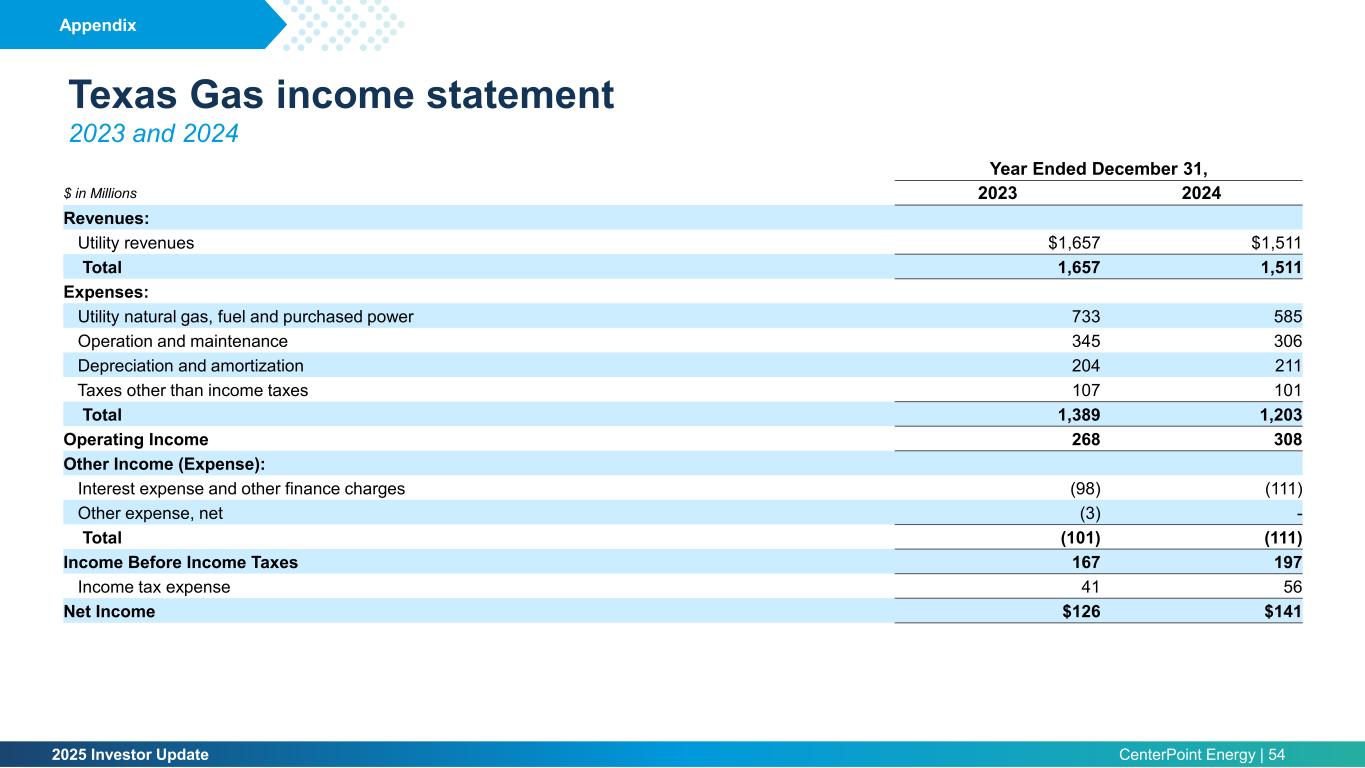
2025 Investor Update CenterPoint Energy | 54 Texas Gas income statement 2023 and 2024 Year Ended December 31, $ in Millions 2023 2024 Revenues: Utility revenues $1,657 $1,511 Total 1,657 1,511 Expenses: Utility natural gas, fuel and purchased power 733 585 Operation and maintenance 345 306 Depreciation and amortization 204 211 Taxes other than income taxes 107 101 Total 1,389 1,203 Operating Income 268 308 Other Income (Expense): Interest expense and other finance charges (98) (111) Other expense, net (3) - Total (101) (111) Income Before Income Taxes 167 197 Income tax expense 41 56 Net Income $126 $141 Appendix
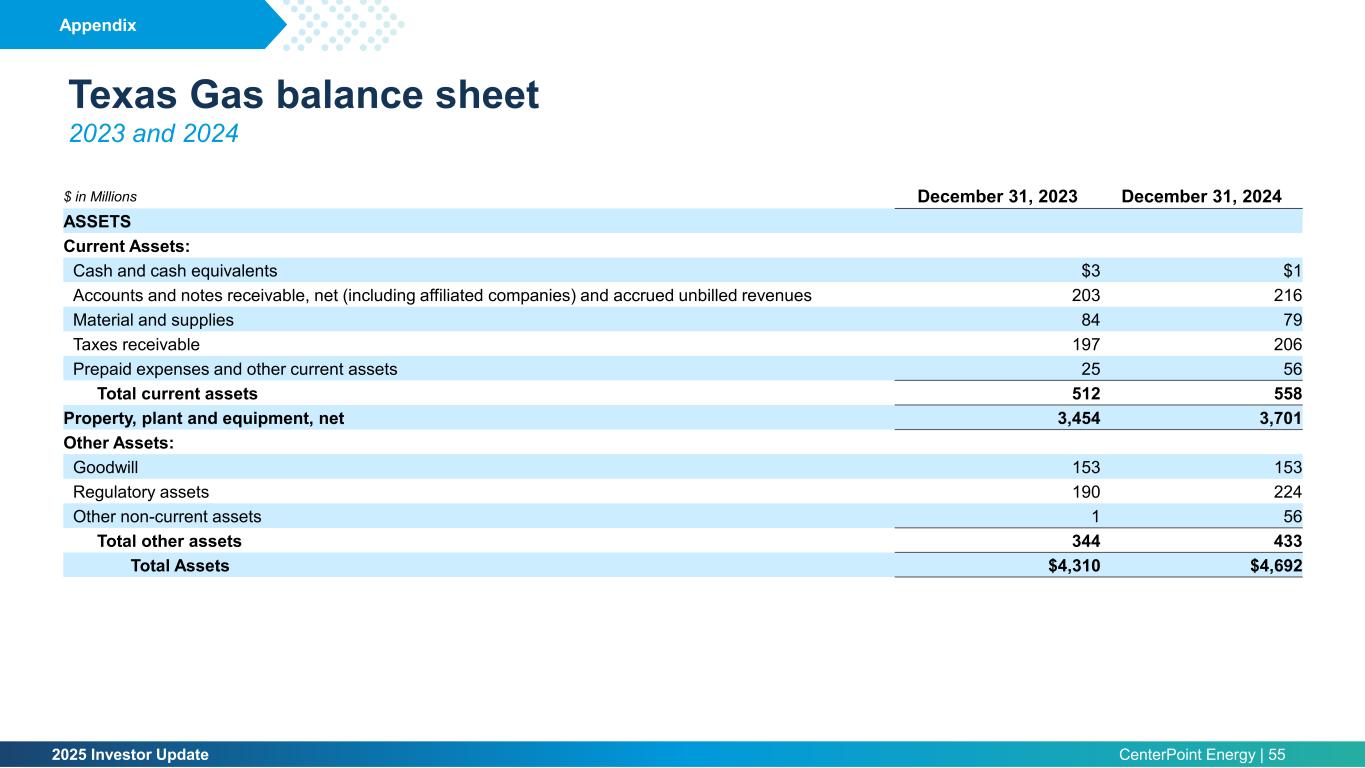
2025 Investor Update CenterPoint Energy | 55 Texas Gas balance sheet 2023 and 2024 $ in Millions December 31, 2023 December 31, 2024 ASSETS Current Assets: Cash and cash equivalents $3 $1 Accounts and notes receivable, net (including affiliated companies) and accrued unbilled revenues 203 216 Material and supplies 84 79 Taxes receivable 197 206 Prepaid expenses and other current assets 25 56 Total current assets 512 558 Property, plant and equipment, net 3,454 3,701 Other Assets: Goodwill 153 153 Regulatory assets 190 224 Other non-current assets 1 56 Total other assets 344 433 Total Assets $4,310 $4,692 Appendix
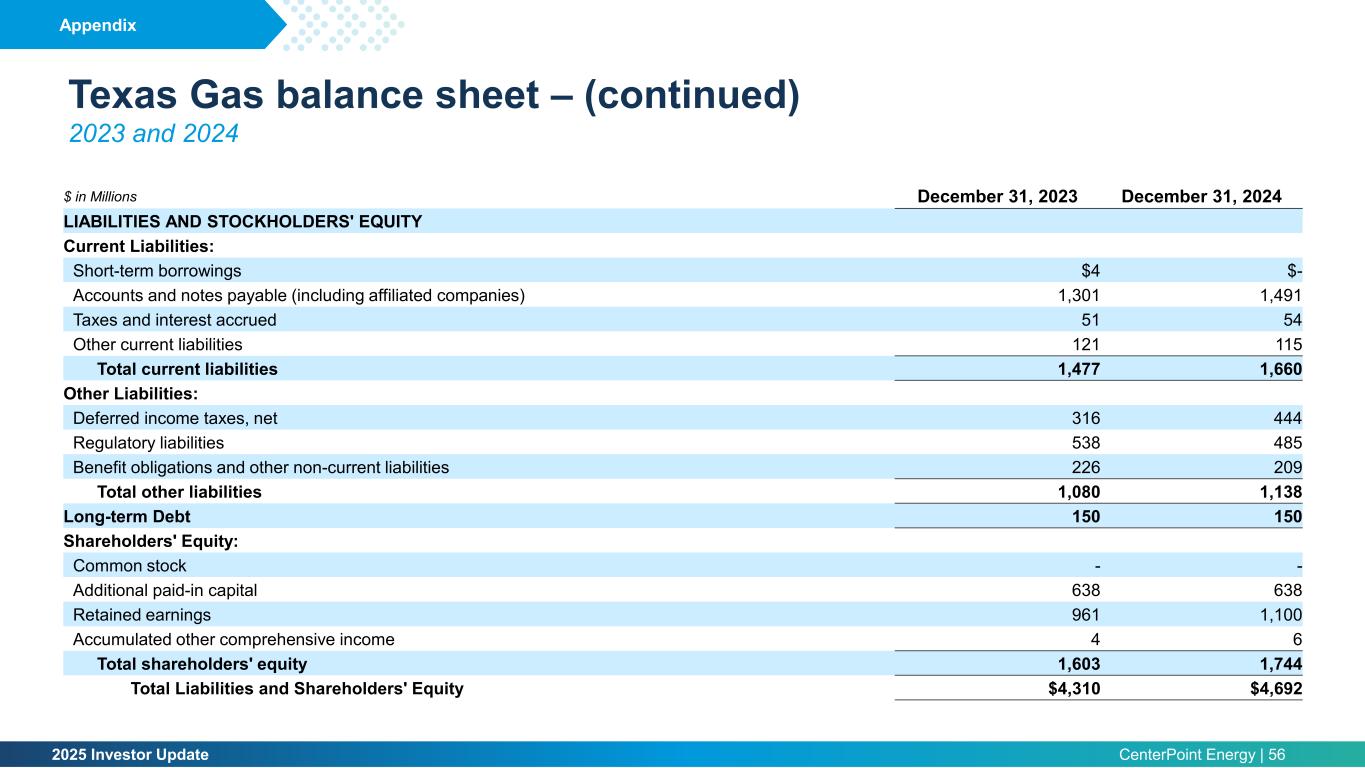
2025 Investor Update CenterPoint Energy | 56 Texas Gas balance sheet – (continued) 2023 and 2024 Appendix $ in Millions December 31, 2023 December 31, 2024 LIABILITIES AND STOCKHOLDERS' EQUITY Current Liabilities: Short-term borrowings $4 $- Accounts and notes payable (including affiliated companies) 1,301 1,491 Taxes and interest accrued 51 54 Other current liabilities 121 115 Total current liabilities 1,477 1,660 Other Liabilities: Deferred income taxes, net 316 444 Regulatory liabilities 538 485 Benefit obligations and other non-current liabilities 226 209 Total other liabilities 1,080 1,138 Long-term Debt 150 150 Shareholders' Equity: Common stock - - Additional paid-in capital 638 638 Retained earnings 961 1,100 Accumulated other comprehensive income 4 6 Total shareholders' equity 1,603 1,744 Total Liabilities and Shareholders' Equity $4,310 $4,692
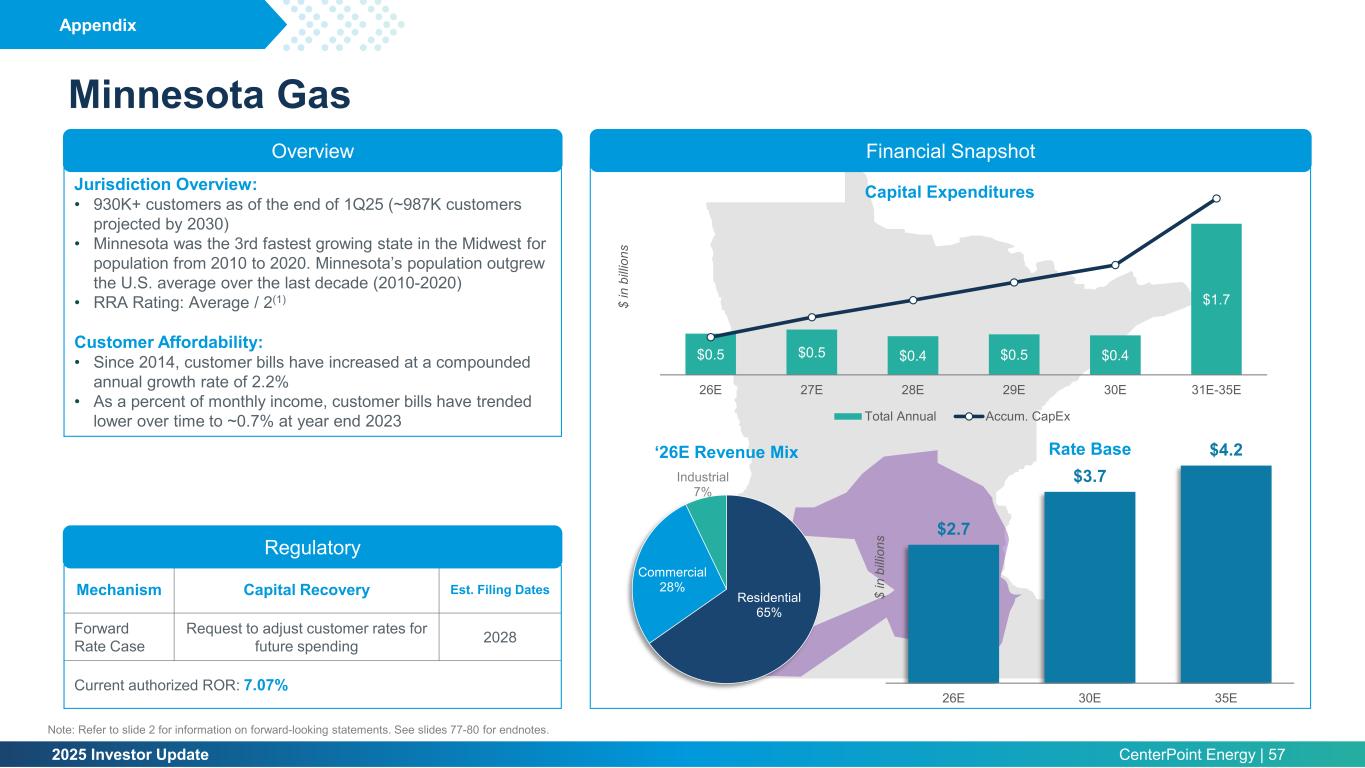
2025 Investor Update CenterPoint Energy | 57 Minnesota Gas Mechanism Capital Recovery Est. Filing Dates Forward Rate Case Request to adjust customer rates for future spending 2028 Current authorized ROR: 7.07% (2) Financial SnapshotOverview Regulatory Jurisdiction Overview: • 930K+ customers as of the end of 1Q25 (~987K customers projected by 2030) • Minnesota was the 3rd fastest growing state in the Midwest for population from 2010 to 2020. Minnesota’s population outgrew the U.S. average over the last decade (2010-2020) • RRA Rating: Average / 2(1) Customer Affordability: • Since 2014, customer bills have increased at a compounded annual growth rate of 2.2% • As a percent of monthly income, customer bills have trended lower over time to ~0.7% at year end 2023 Appendix Note: Refer to slide 2 for information on forward-looking statements. See slides 77-80 for endnotes. $0.5 $0.5 $0.4 $0.5 $0.4 $1.7 -$1$0 $0 $1 $1 $1 $1 $2 $2 $2 26E 27E 28E 29E 30E 31E-35E $ in b ill io ns Capital Expenditures Total Annual Accum. CapEx $2.7 $3.7 $4.2 26E 30E 35E $ in b ill io ns Rate Base Residential 65% Commercial 28% Industrial 7% ‘26E Revenue Mix
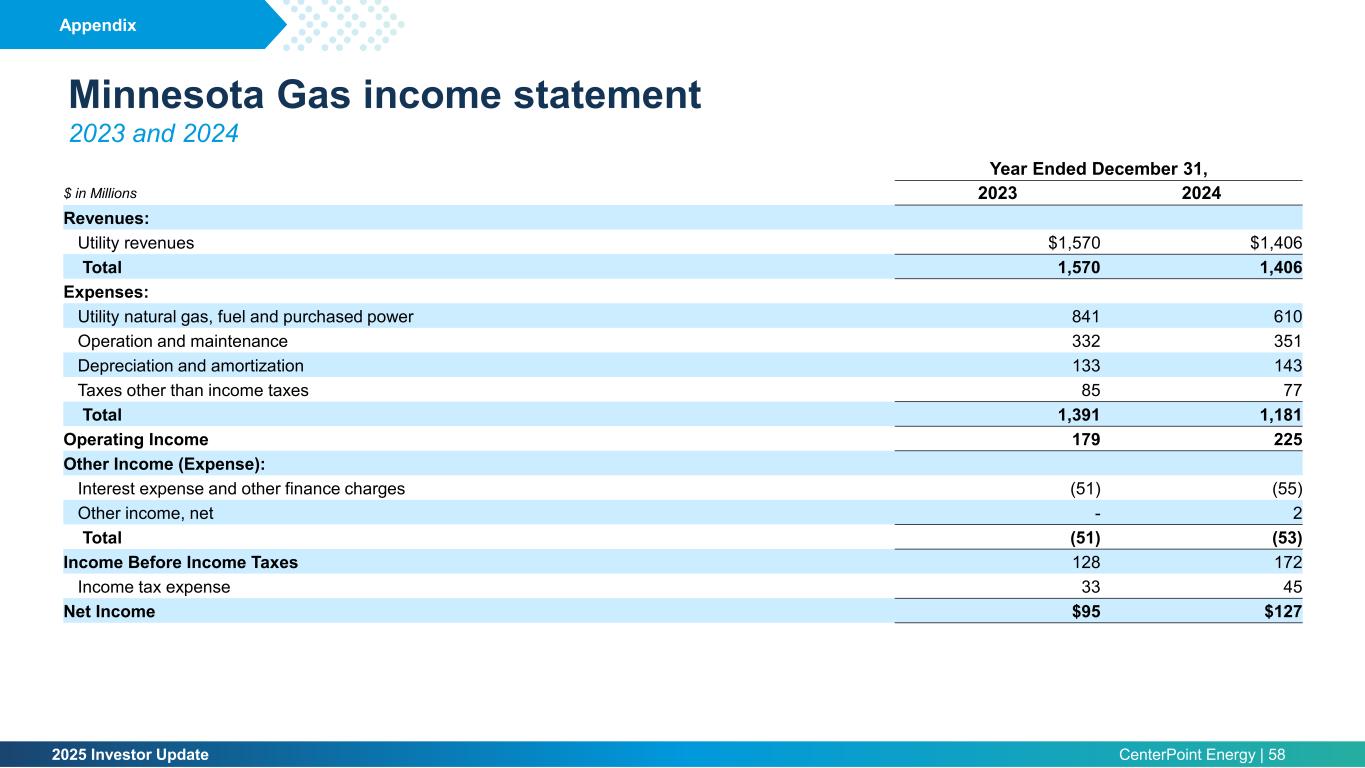
2025 Investor Update CenterPoint Energy | 58 Minnesota Gas income statement 2023 and 2024 Year Ended December 31, $ in Millions 2023 2024 Revenues: Utility revenues $1,570 $1,406 Total 1,570 1,406 Expenses: Utility natural gas, fuel and purchased power 841 610 Operation and maintenance 332 351 Depreciation and amortization 133 143 Taxes other than income taxes 85 77 Total 1,391 1,181 Operating Income 179 225 Other Income (Expense): Interest expense and other finance charges (51) (55) Other income, net - 2 Total (51) (53) Income Before Income Taxes 128 172 Income tax expense 33 45 Net Income $95 $127 Appendix
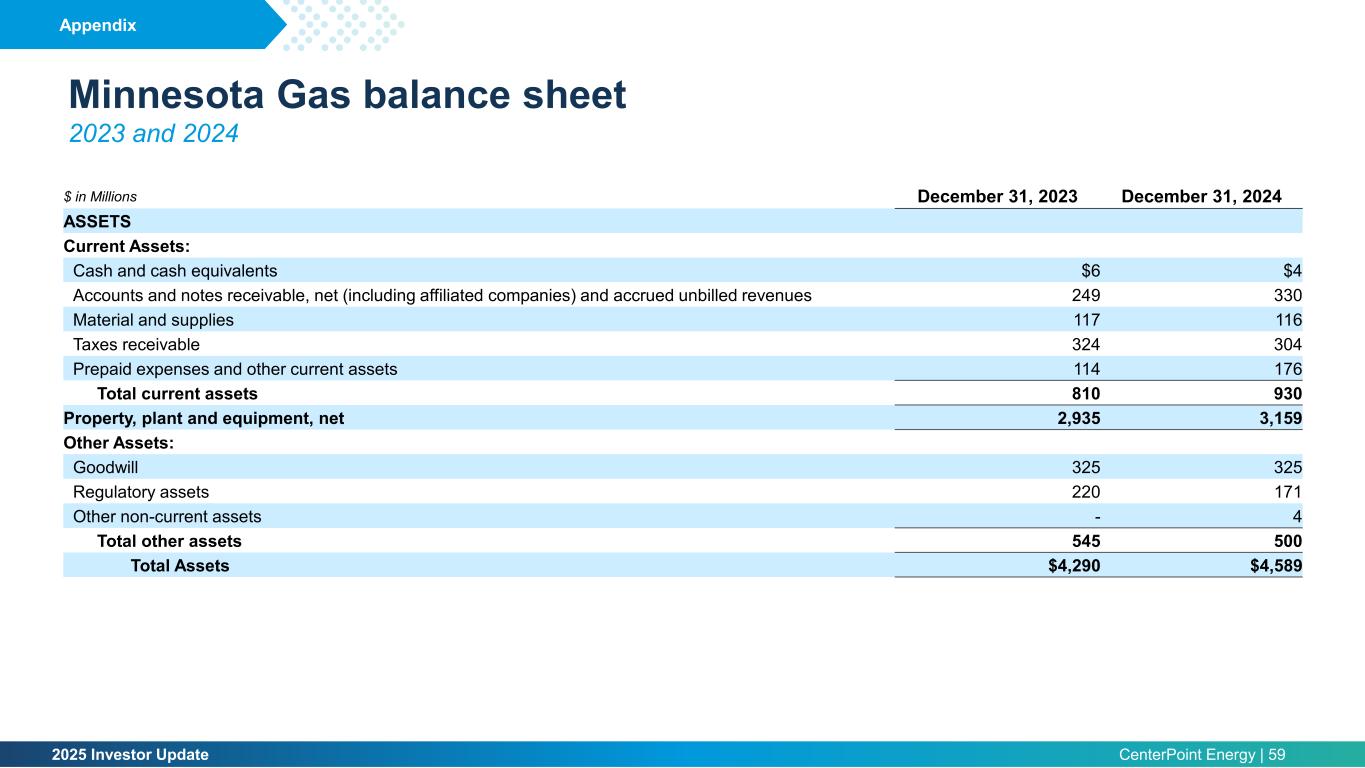
2025 Investor Update CenterPoint Energy | 59 Minnesota Gas balance sheet 2023 and 2024 $ in Millions December 31, 2023 December 31, 2024 ASSETS Current Assets: Cash and cash equivalents $6 $4 Accounts and notes receivable, net (including affiliated companies) and accrued unbilled revenues 249 330 Material and supplies 117 116 Taxes receivable 324 304 Prepaid expenses and other current assets 114 176 Total current assets 810 930 Property, plant and equipment, net 2,935 3,159 Other Assets: Goodwill 325 325 Regulatory assets 220 171 Other non-current assets - 4 Total other assets 545 500 Total Assets $4,290 $4,589 Appendix
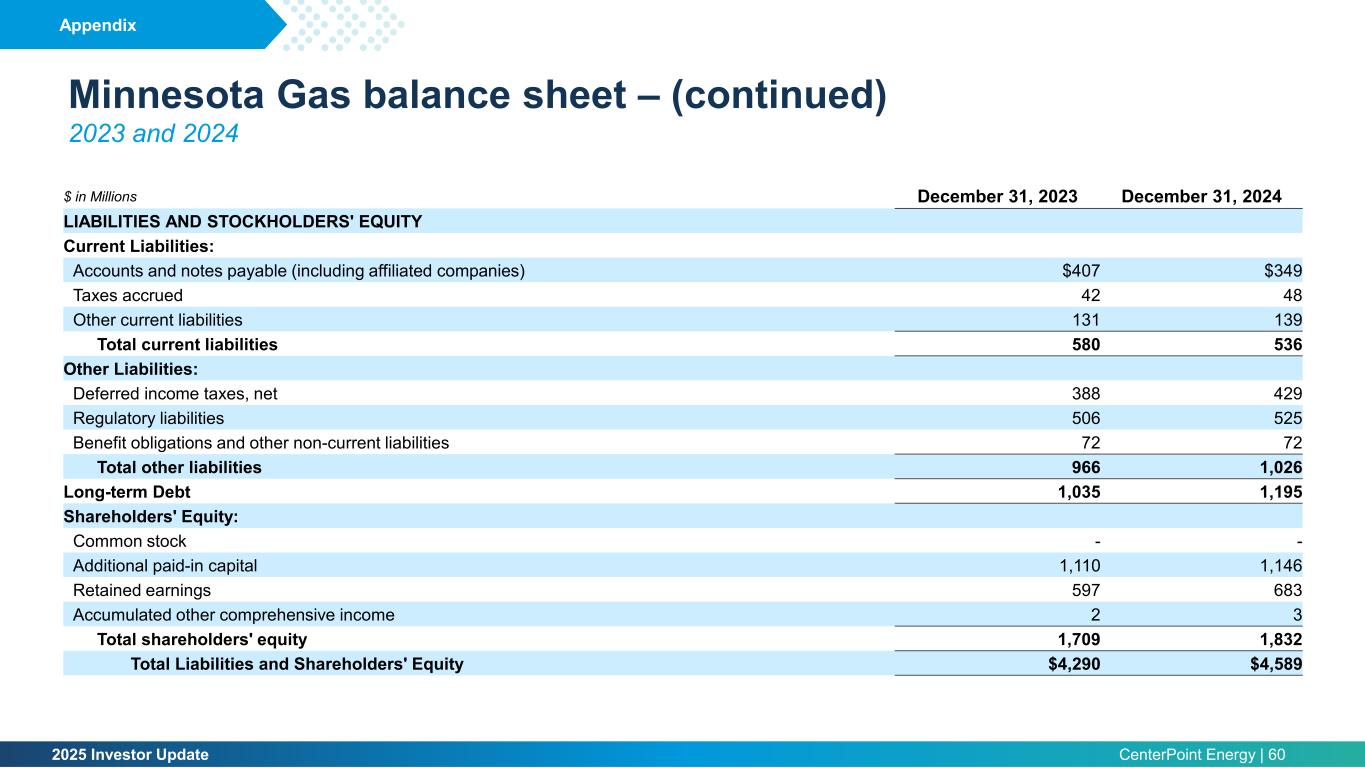
2025 Investor Update CenterPoint Energy | 60 Minnesota Gas balance sheet – (continued) 2023 and 2024 Appendix $ in Millions December 31, 2023 December 31, 2024 LIABILITIES AND STOCKHOLDERS' EQUITY Current Liabilities: Accounts and notes payable (including affiliated companies) $407 $349 Taxes accrued 42 48 Other current liabilities 131 139 Total current liabilities 580 536 Other Liabilities: Deferred income taxes, net 388 429 Regulatory liabilities 506 525 Benefit obligations and other non-current liabilities 72 72 Total other liabilities 966 1,026 Long-term Debt 1,035 1,195 Shareholders' Equity: Common stock - - Additional paid-in capital 1,110 1,146 Retained earnings 597 683 Accumulated other comprehensive income 2 3 Total shareholders' equity 1,709 1,832 Total Liabilities and Shareholders' Equity $4,290 $4,589
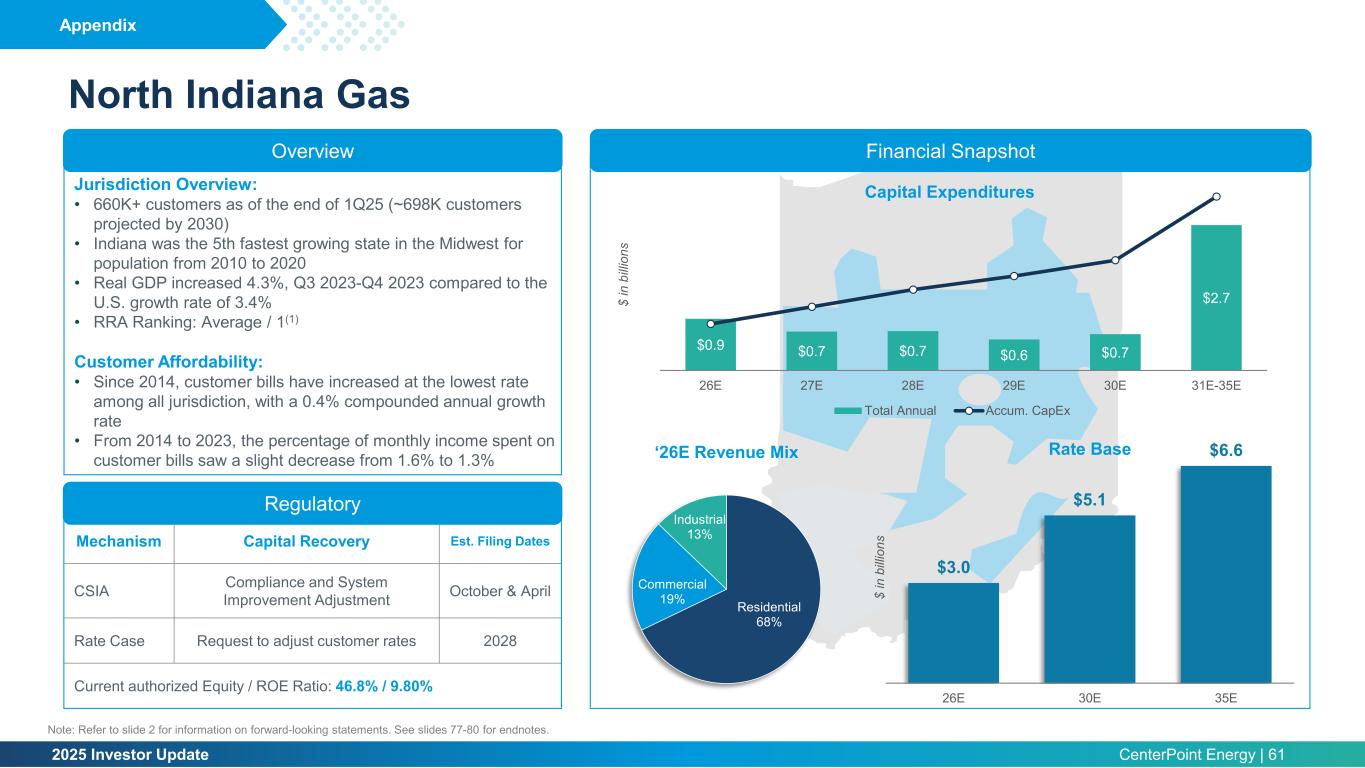
2025 Investor Update CenterPoint Energy | 61 North Indiana Gas (2) Mechanism Capital Recovery Est. Filing Dates CSIA Compliance and System Improvement Adjustment October & April Rate Case Request to adjust customer rates 2028 Current authorized Equity / ROE Ratio: 46.8% / 9.80% Financial SnapshotOverview Regulatory Jurisdiction Overview: • 660K+ customers as of the end of 1Q25 (~698K customers projected by 2030) • Indiana was the 5th fastest growing state in the Midwest for population from 2010 to 2020 • Real GDP increased 4.3%, Q3 2023-Q4 2023 compared to the U.S. growth rate of 3.4% • RRA Ranking: Average / 1(1) Customer Affordability: • Since 2014, customer bills have increased at the lowest rate among all jurisdiction, with a 0.4% compounded annual growth rate • From 2014 to 2023, the percentage of monthly income spent on customer bills saw a slight decrease from 1.6% to 1.3% Appendix Note: Refer to slide 2 for information on forward-looking statements. See slides 77-80 for endnotes. $0.9 $0.7 $0.7 $0.6 $0.7 $2.7 -$1$0 $0 $1 $1 $2 $2 $2 $3 $3 26E 27E 28E 29E 30E 31E-35E $ in b ill io ns Capital Expenditures Total Annual Accum. CapEx $3.0 $5.1 $6.6 26E 30E 35E $ in b ill io ns Rate Base Residential 68% Commercial 19% Industrial 13% ‘26E Revenue Mix
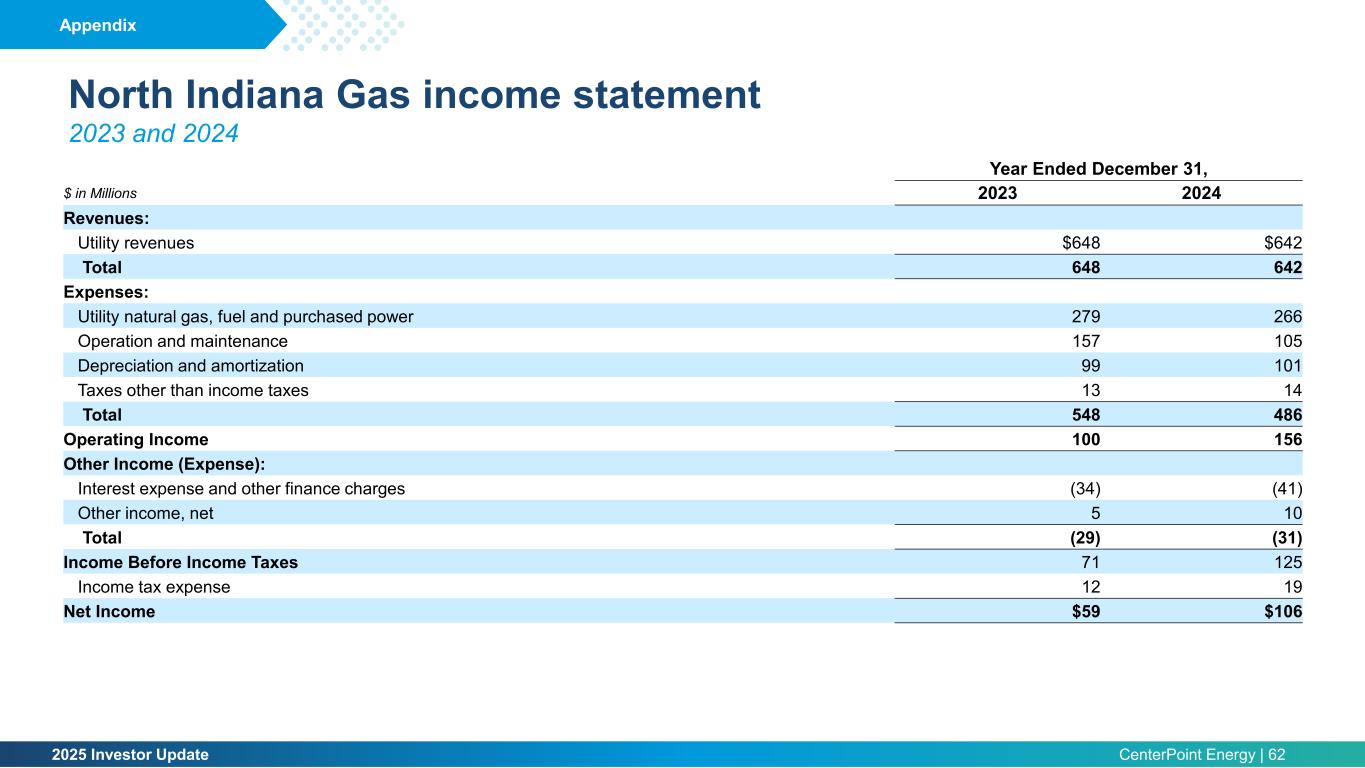
2025 Investor Update CenterPoint Energy | 62 North Indiana Gas income statement 2023 and 2024 Year Ended December 31, $ in Millions 2023 2024 Revenues: Utility revenues $648 $642 Total 648 642 Expenses: Utility natural gas, fuel and purchased power 279 266 Operation and maintenance 157 105 Depreciation and amortization 99 101 Taxes other than income taxes 13 14 Total 548 486 Operating Income 100 156 Other Income (Expense): Interest expense and other finance charges (34) (41) Other income, net 5 10 Total (29) (31) Income Before Income Taxes 71 125 Income tax expense 12 19 Net Income $59 $106 Appendix
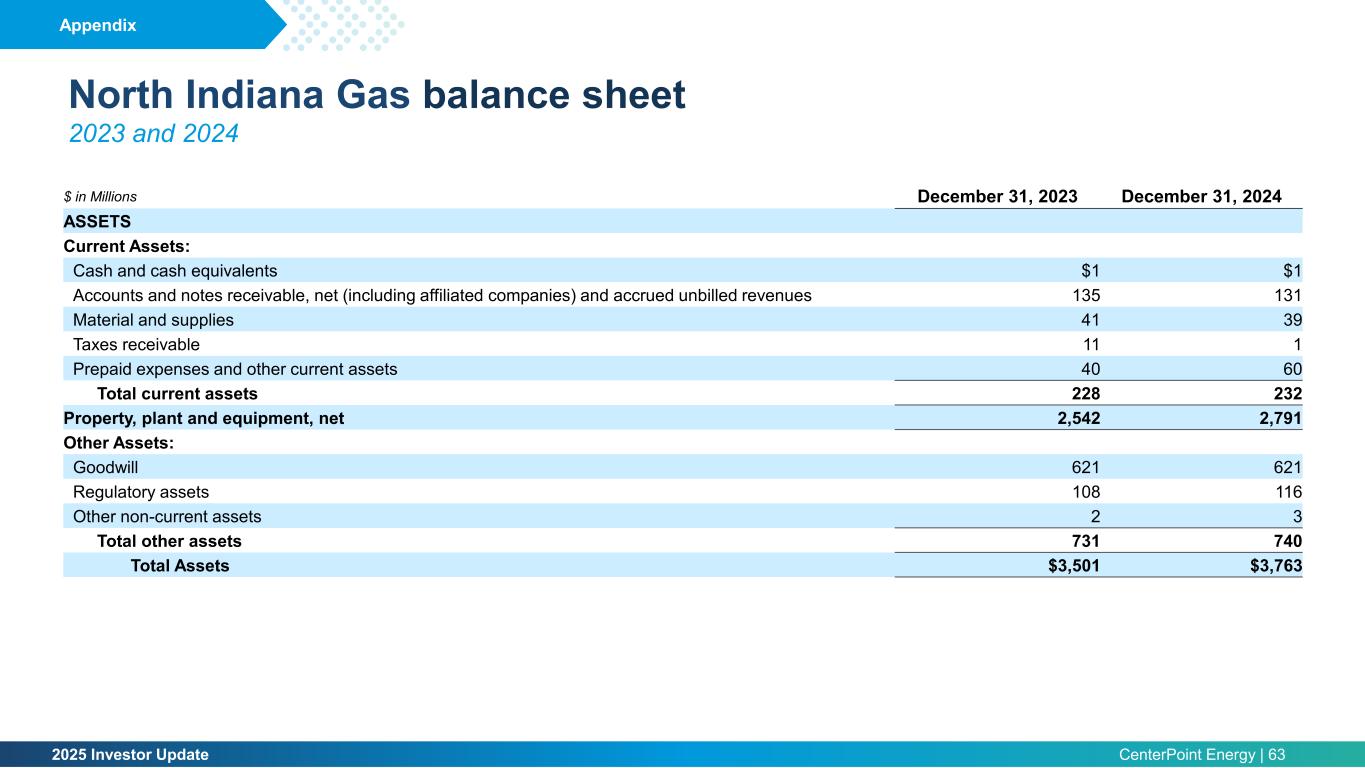
2025 Investor Update CenterPoint Energy | 63 North Indiana Gas balance sheet 2023 and 2024 Appendix $ in Millions December 31, 2023 December 31, 2024 ASSETS Current Assets: Cash and cash equivalents $1 $1 Accounts and notes receivable, net (including affiliated companies) and accrued unbilled revenues 135 131 Material and supplies 41 39 Taxes receivable 11 1 Prepaid expenses and other current assets 40 60 Total current assets 228 232 Property, plant and equipment, net 2,542 2,791 Other Assets: Goodwill 621 621 Regulatory assets 108 116 Other non-current assets 2 3 Total other assets 731 740 Total Assets $3,501 $3,763
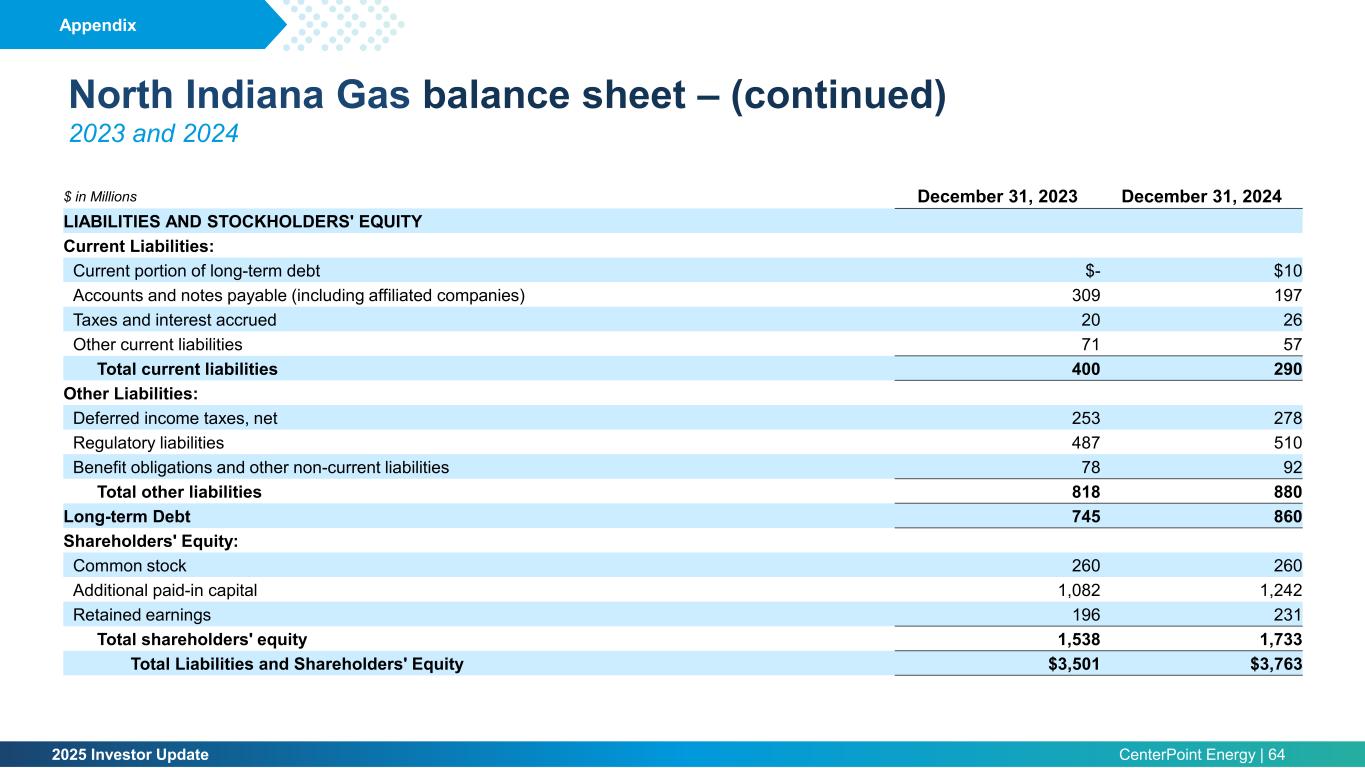
2025 Investor Update CenterPoint Energy | 64 North Indiana Gas balance sheet – (continued) 2023 and 2024 $ in Millions December 31, 2023 December 31, 2024 LIABILITIES AND STOCKHOLDERS' EQUITY Current Liabilities: Current portion of long-term debt $- $10 Accounts and notes payable (including affiliated companies) 309 197 Taxes and interest accrued 20 26 Other current liabilities 71 57 Total current liabilities 400 290 Other Liabilities: Deferred income taxes, net 253 278 Regulatory liabilities 487 510 Benefit obligations and other non-current liabilities 78 92 Total other liabilities 818 880 Long-term Debt 745 860 Shareholders' Equity: Common stock 260 260 Additional paid-in capital 1,082 1,242 Retained earnings 196 231 Total shareholders' equity 1,538 1,733 Total Liabilities and Shareholders' Equity $3,501 $3,763 Appendix
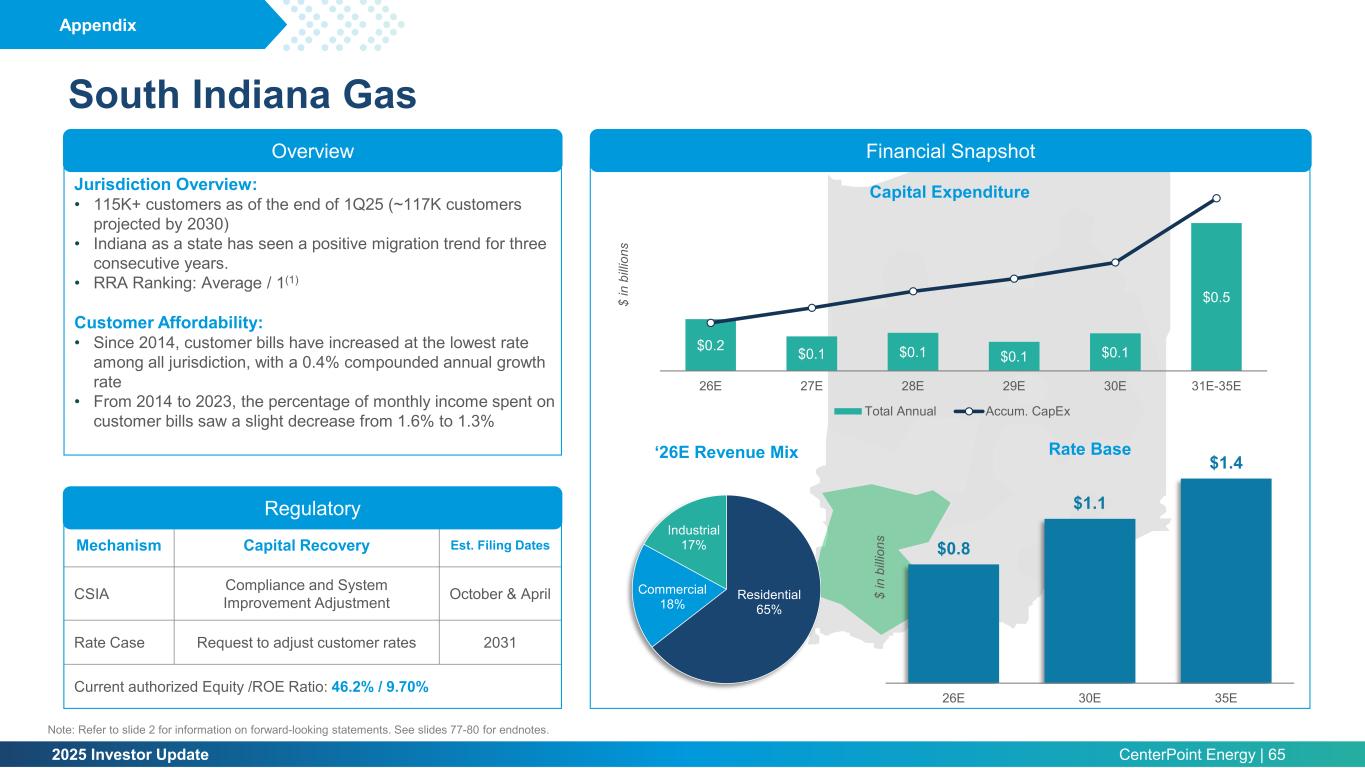
2025 Investor Update CenterPoint Energy | 65 South Indiana Gas (2) Mechanism Capital Recovery Est. Filing Dates CSIA Compliance and System Improvement Adjustment October & April Rate Case Request to adjust customer rates 2031 Current authorized Equity /ROE Ratio: 46.2% / 9.70% Financial Snapshot Jurisdiction Overview: • 115K+ customers as of the end of 1Q25 (~117K customers projected by 2030) • Indiana as a state has seen a positive migration trend for three consecutive years. • RRA Ranking: Average / 1(1) Customer Affordability: • Since 2014, customer bills have increased at the lowest rate among all jurisdiction, with a 0.4% compounded annual growth rate • From 2014 to 2023, the percentage of monthly income spent on customer bills saw a slight decrease from 1.6% to 1.3% Overview Regulatory Appendix Note: Refer to slide 2 for information on forward-looking statements. See slides 77-80 for endnotes. $0.2 $0.1 $0.1 $0.1 $0.1 $0.5 $0$0 $0 $0 $0 $0 $0 $0 $1 $1 26E 27E 28E 29E 30E 31E-35E $ in b ill io ns Capital Expenditure Total Annual Accum. CapEx $0.8 $1.1 $1.4 26E 30E 35E $ in b ill io ns Rate Base Residential 65% Commercial 18% Industrial 17% ‘26E Revenue Mix
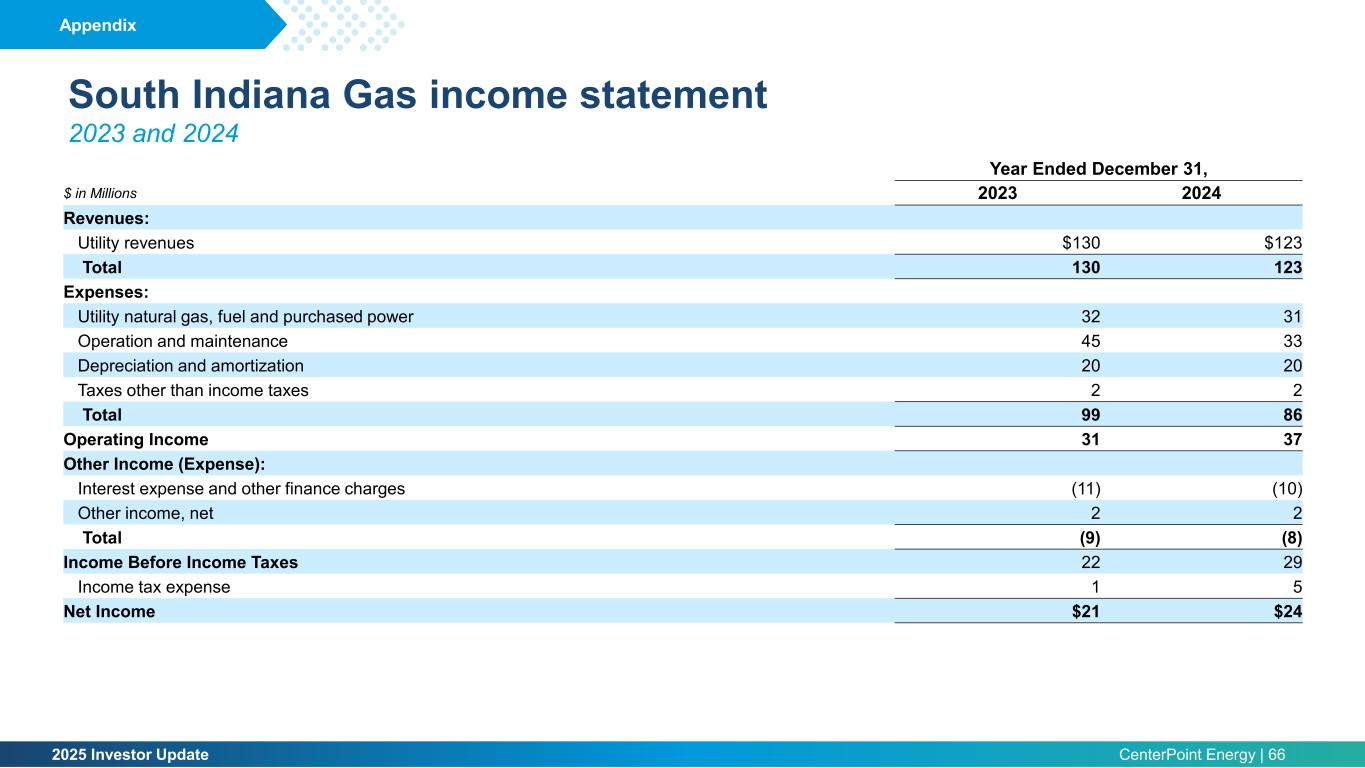
2025 Investor Update CenterPoint Energy | 66 South Indiana Gas income statement 2023 and 2024 Year Ended December 31, $ in Millions 2023 2024 Revenues: Utility revenues $130 $123 Total 130 123 Expenses: Utility natural gas, fuel and purchased power 32 31 Operation and maintenance 45 33 Depreciation and amortization 20 20 Taxes other than income taxes 2 2 Total 99 86 Operating Income 31 37 Other Income (Expense): Interest expense and other finance charges (11) (10) Other income, net 2 2 Total (9) (8) Income Before Income Taxes 22 29 Income tax expense 1 5 Net Income $21 $24 Appendix
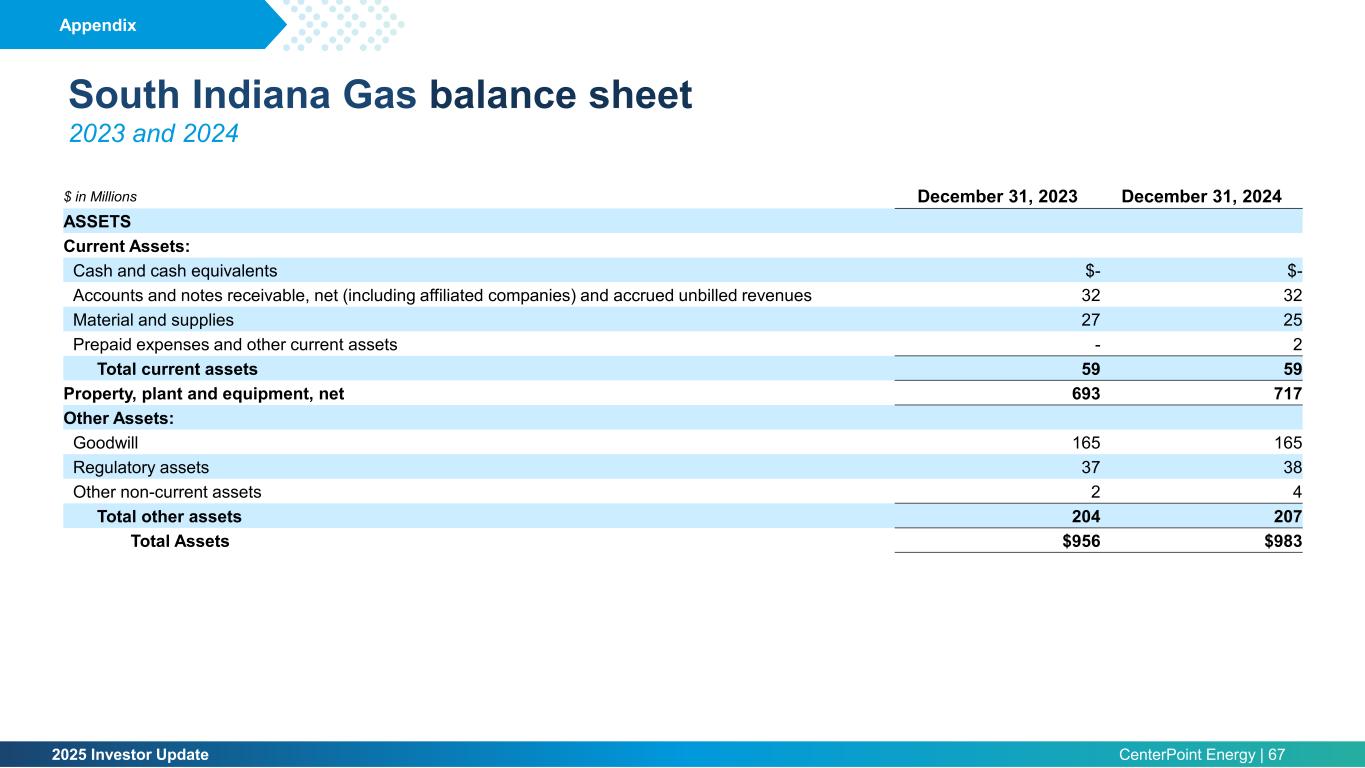
2025 Investor Update CenterPoint Energy | 67 South Indiana Gas balance sheet 2023 and 2024 Appendix $ in Millions December 31, 2023 December 31, 2024 ASSETS Current Assets: Cash and cash equivalents $- $- Accounts and notes receivable, net (including affiliated companies) and accrued unbilled revenues 32 32 Material and supplies 27 25 Prepaid expenses and other current assets - 2 Total current assets 59 59 Property, plant and equipment, net 693 717 Other Assets: Goodwill 165 165 Regulatory assets 37 38 Other non-current assets 2 4 Total other assets 204 207 Total Assets $956 $983
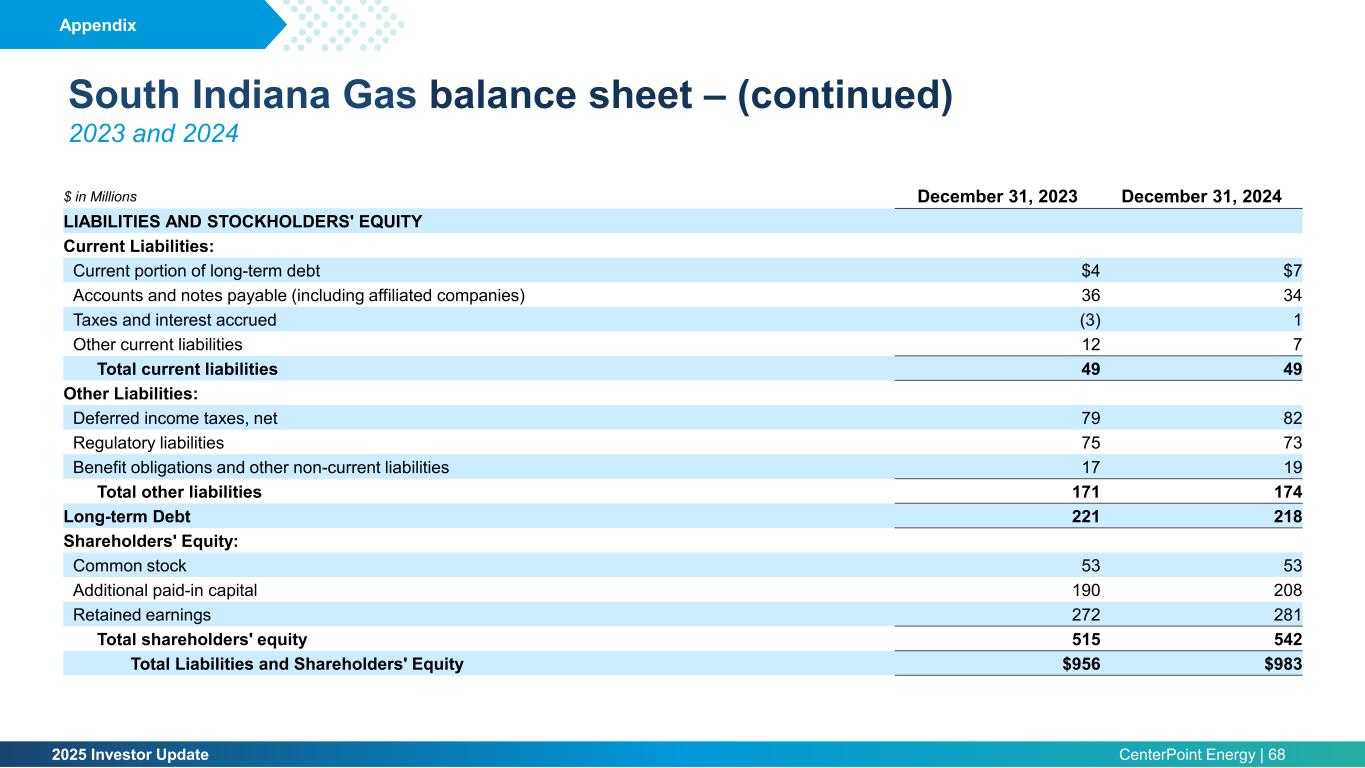
2025 Investor Update CenterPoint Energy | 68 South Indiana Gas balance sheet – (continued) 2023 and 2024 $ in Millions December 31, 2023 December 31, 2024 LIABILITIES AND STOCKHOLDERS' EQUITY Current Liabilities: Current portion of long-term debt $4 $7 Accounts and notes payable (including affiliated companies) 36 34 Taxes and interest accrued (3) 1 Other current liabilities 12 7 Total current liabilities 49 49 Other Liabilities: Deferred income taxes, net 79 82 Regulatory liabilities 75 73 Benefit obligations and other non-current liabilities 17 19 Total other liabilities 171 174 Long-term Debt 221 218 Shareholders' Equity: Common stock 53 53 Additional paid-in capital 190 208 Retained earnings 272 281 Total shareholders' equity 515 542 Total Liabilities and Shareholders' Equity $956 $983 Appendix
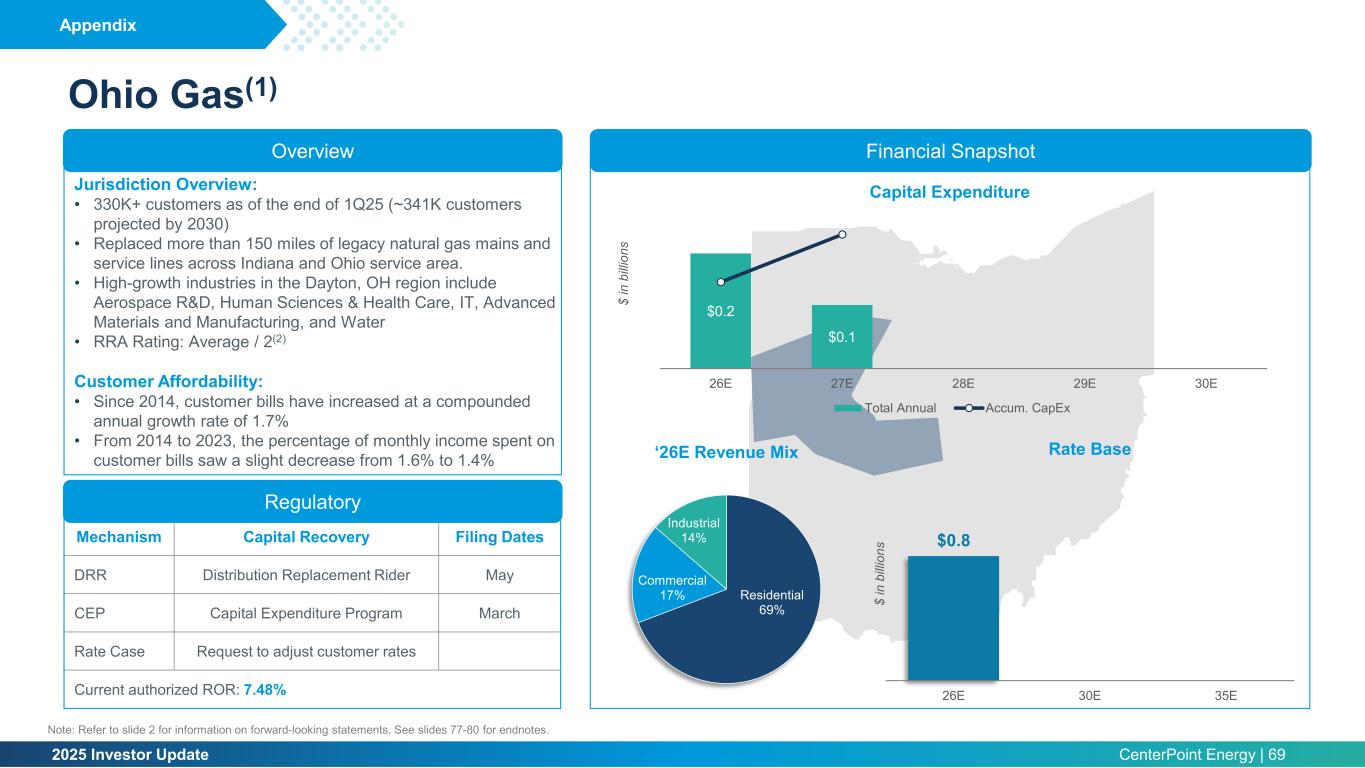
2025 Investor Update CenterPoint Energy | 69 Ohio Gas(1) (2) Mechanism Capital Recovery Filing Dates DRR Distribution Replacement Rider May CEP Capital Expenditure Program March Rate Case Request to adjust customer rates Current authorized ROR: 7.48% Financial SnapshotOverview Regulatory Jurisdiction Overview: • 330K+ customers as of the end of 1Q25 (~341K customers projected by 2030) • Replaced more than 150 miles of legacy natural gas mains and service lines across Indiana and Ohio service area. • High-growth industries in the Dayton, OH region include Aerospace R&D, Human Sciences & Health Care, IT, Advanced Materials and Manufacturing, and Water • RRA Rating: Average / 2(2) Customer Affordability: • Since 2014, customer bills have increased at a compounded annual growth rate of 1.7% • From 2014 to 2023, the percentage of monthly income spent on customer bills saw a slight decrease from 1.6% to 1.4% Appendix Note: Refer to slide 2 for information on forward-looking statements. See slides 77-80 for endnotes. $0.2 $0.1 $0$0 $0 $0 $0 26E 27E 28E 29E 30E $ in b ill io ns Capital Expenditure Total Annual Accum. CapEx $0.8 26E 30E 35E $ in b ill io ns Rate Base Residential 69% Commercial 17% Industrial 14% ‘26E Revenue Mix
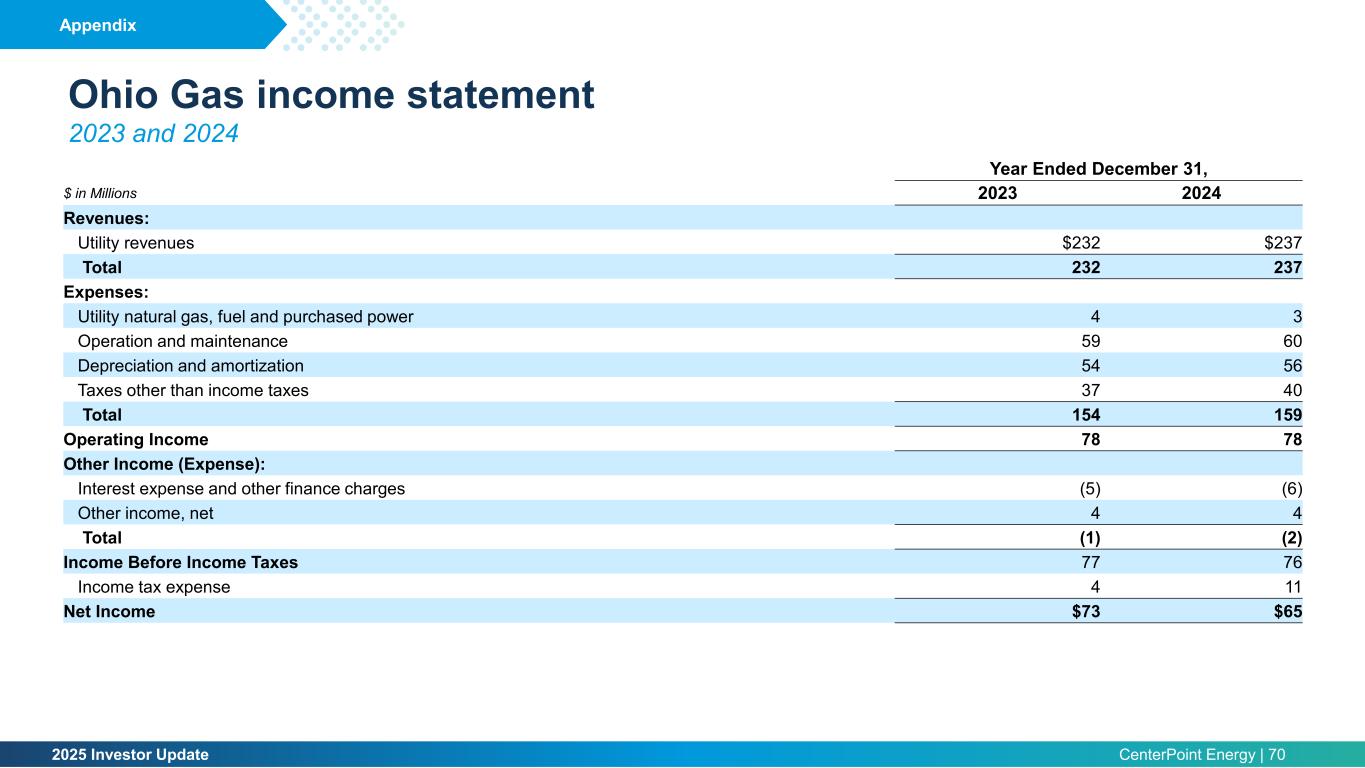
2025 Investor Update CenterPoint Energy | 70 Ohio Gas income statement 2023 and 2024 Year Ended December 31, $ in Millions 2023 2024 Revenues: Utility revenues $232 $237 Total 232 237 Expenses: Utility natural gas, fuel and purchased power 4 3 Operation and maintenance 59 60 Depreciation and amortization 54 56 Taxes other than income taxes 37 40 Total 154 159 Operating Income 78 78 Other Income (Expense): Interest expense and other finance charges (5) (6) Other income, net 4 4 Total (1) (2) Income Before Income Taxes 77 76 Income tax expense 4 11 Net Income $73 $65 Appendix
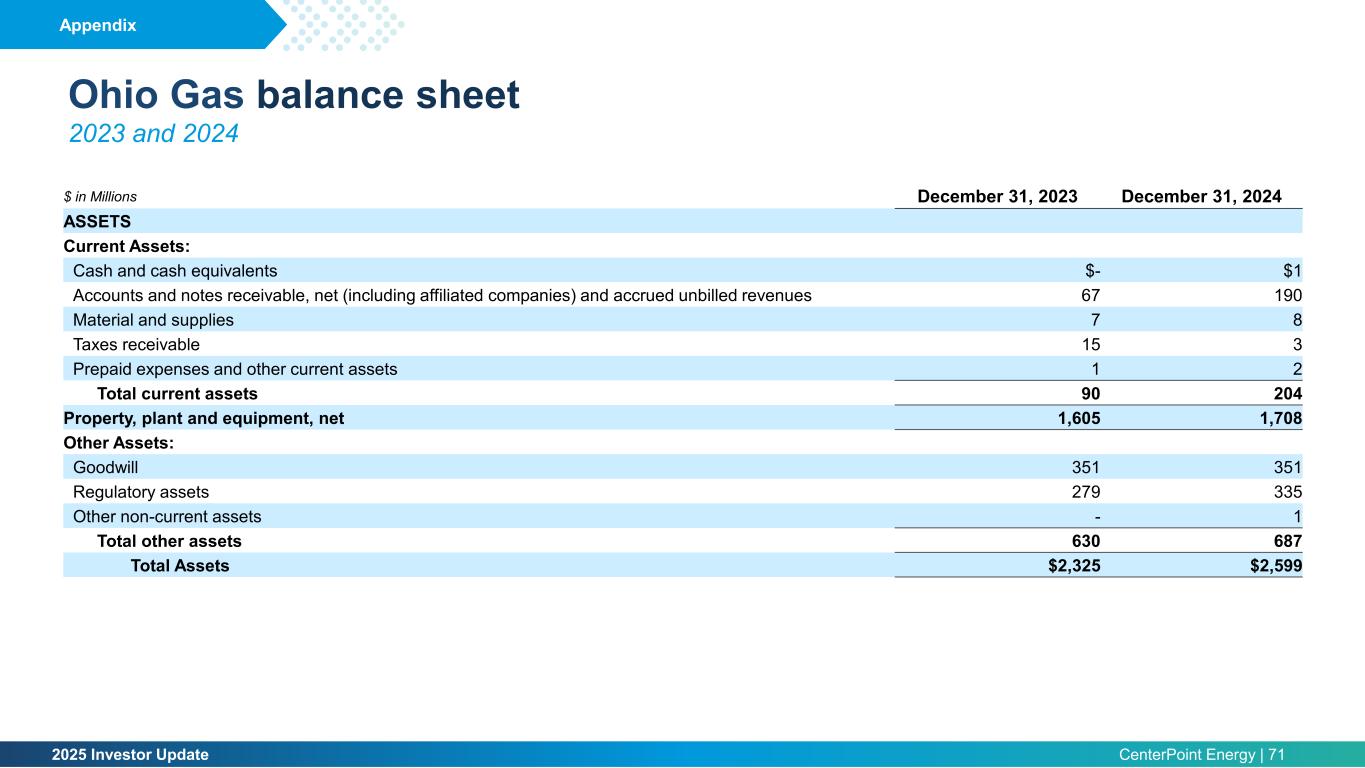
2025 Investor Update CenterPoint Energy | 71 Ohio Gas balance sheet 2023 and 2024 Appendix $ in Millions December 31, 2023 December 31, 2024 ASSETS Current Assets: Cash and cash equivalents $- $1 Accounts and notes receivable, net (including affiliated companies) and accrued unbilled revenues 67 190 Material and supplies 7 8 Taxes receivable 15 3 Prepaid expenses and other current assets 1 2 Total current assets 90 204 Property, plant and equipment, net 1,605 1,708 Other Assets: Goodwill 351 351 Regulatory assets 279 335 Other non-current assets - 1 Total other assets 630 687 Total Assets $2,325 $2,599
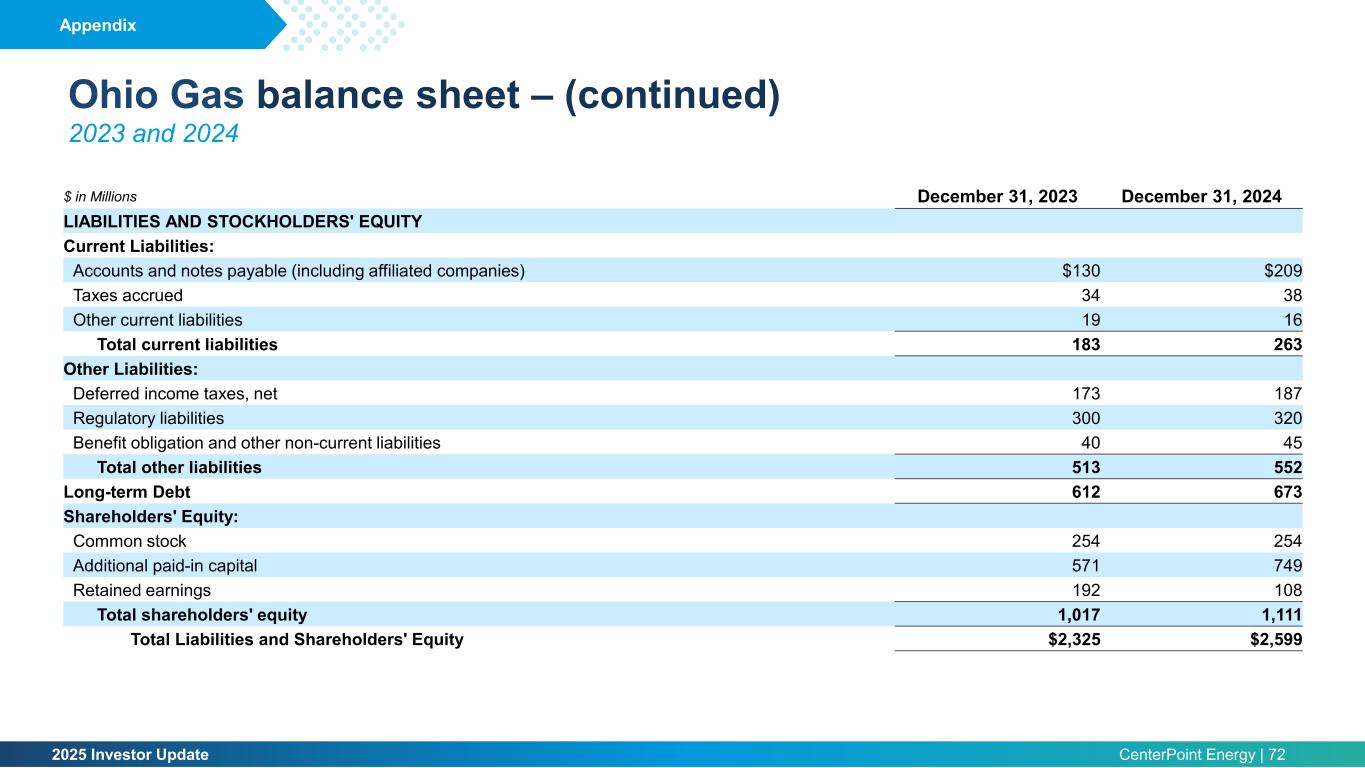
2025 Investor Update CenterPoint Energy | 72 Ohio Gas balance sheet – (continued) 2023 and 2024 $ in Millions December 31, 2023 December 31, 2024 LIABILITIES AND STOCKHOLDERS' EQUITY Current Liabilities: Accounts and notes payable (including affiliated companies) $130 $209 Taxes accrued 34 38 Other current liabilities 19 16 Total current liabilities 183 263 Other Liabilities: Deferred income taxes, net 173 187 Regulatory liabilities 300 320 Benefit obligation and other non-current liabilities 40 45 Total other liabilities 513 552 Long-term Debt 612 673 Shareholders' Equity: Common stock 254 254 Additional paid-in capital 571 749 Retained earnings 192 108 Total shareholders' equity 1,017 1,111 Total Liabilities and Shareholders' Equity $2,325 $2,599 Appendix
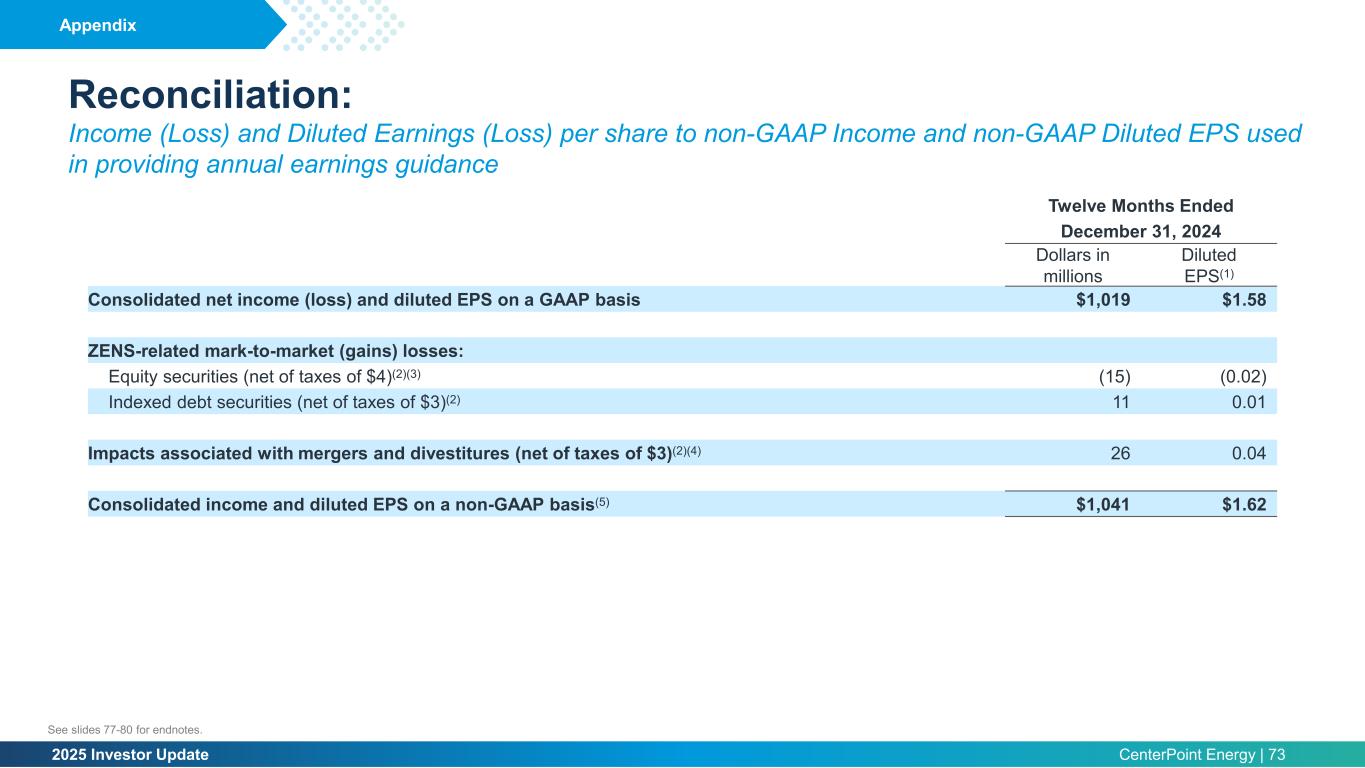
2025 Investor Update CenterPoint Energy | 73 Reconciliation: Income (Loss) and Diluted Earnings (Loss) per share to non-GAAP Income and non-GAAP Diluted EPS used in providing annual earnings guidance aaaaaaaaa Twelve Months Ended December 31, 2024 Dollars in millions Diluted EPS(1) Consolidated net income (loss) and diluted EPS on a GAAP basis $1,019 $1.58 ZENS-related mark-to-market (gains) losses: Equity securities (net of taxes of $4)(2)(3) (15) (0.02) Indexed debt securities (net of taxes of $3)(2) 11 0.01 Impacts associated with mergers and divestitures (net of taxes of $3)(2)(4) 26 0.04 Consolidated income and diluted EPS on a non-GAAP basis(5) $1,041 $1.62 Appendix See slides 77-80 for endnotes.
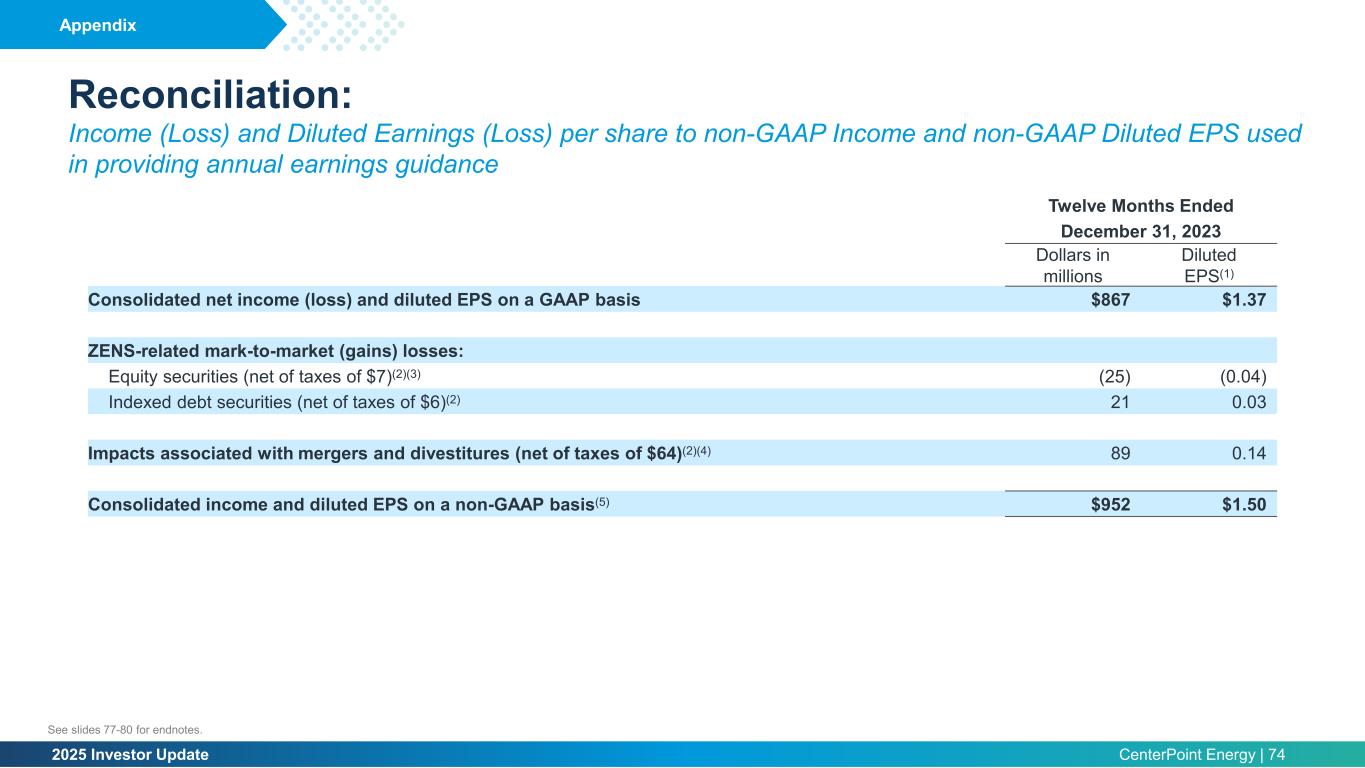
2025 Investor Update CenterPoint Energy | 74 Reconciliation: Income (Loss) and Diluted Earnings (Loss) per share to non-GAAP Income and non-GAAP Diluted EPS used in providing annual earnings guidance aaaaaaaaa Twelve Months Ended December 31, 2023 Dollars in millions Diluted EPS(1) Consolidated net income (loss) and diluted EPS on a GAAP basis $867 $1.37 ZENS-related mark-to-market (gains) losses: Equity securities (net of taxes of $7)(2)(3) (25) (0.04) Indexed debt securities (net of taxes of $6)(2) 21 0.03 Impacts associated with mergers and divestitures (net of taxes of $64)(2)(4) 89 0.14 Consolidated income and diluted EPS on a non-GAAP basis(5) $952 $1.50 Appendix See slides 77-80 for endnotes.
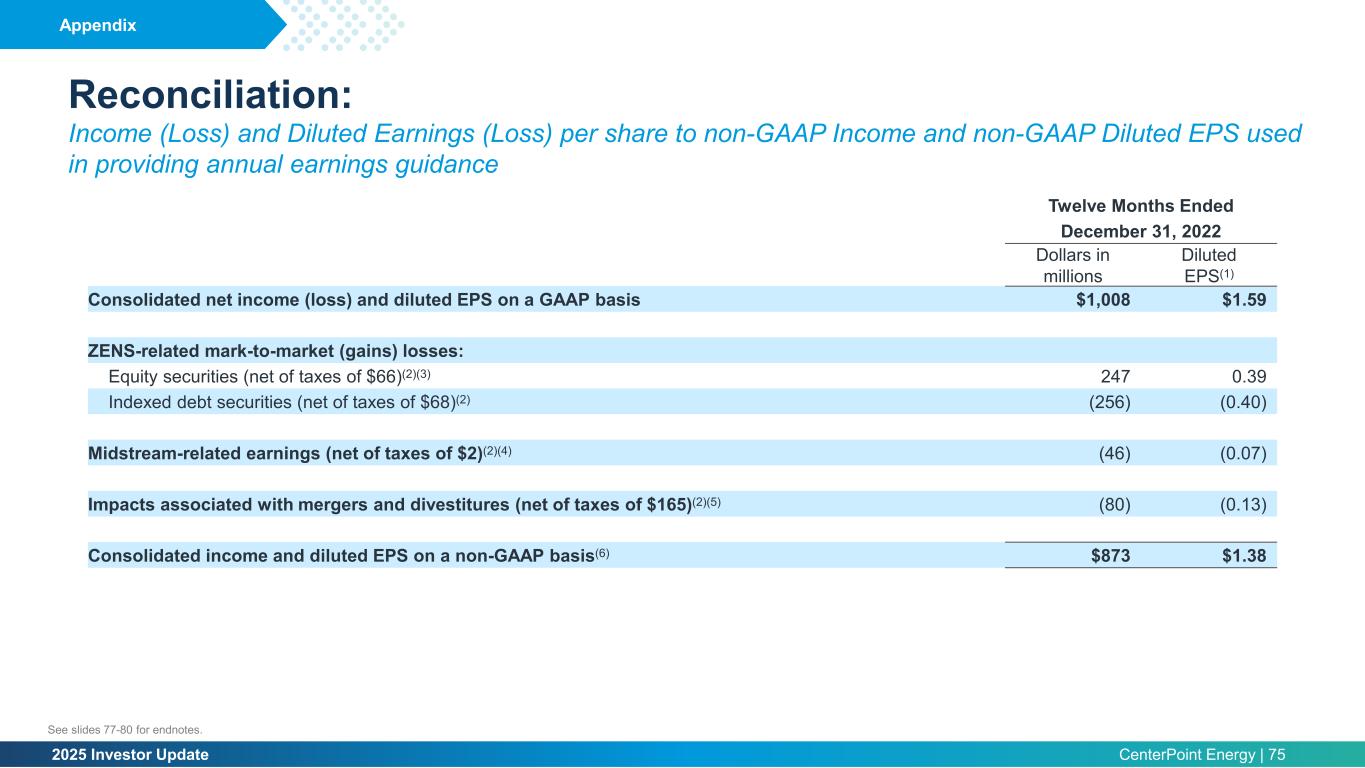
2025 Investor Update CenterPoint Energy | 75 Reconciliation: Income (Loss) and Diluted Earnings (Loss) per share to non-GAAP Income and non-GAAP Diluted EPS used in providing annual earnings guidance aaaaaaaaa Twelve Months Ended December 31, 2022 Dollars in millions Diluted EPS(1) Consolidated net income (loss) and diluted EPS on a GAAP basis $1,008 $1.59 ZENS-related mark-to-market (gains) losses: Equity securities (net of taxes of $66)(2)(3) 247 0.39 Indexed debt securities (net of taxes of $68)(2) (256) (0.40) Midstream-related earnings (net of taxes of $2)(2)(4) (46) (0.07) Impacts associated with mergers and divestitures (net of taxes of $165)(2)(5) (80) (0.13) Consolidated income and diluted EPS on a non-GAAP basis(6) $873 $1.38 Appendix See slides 77-80 for endnotes.
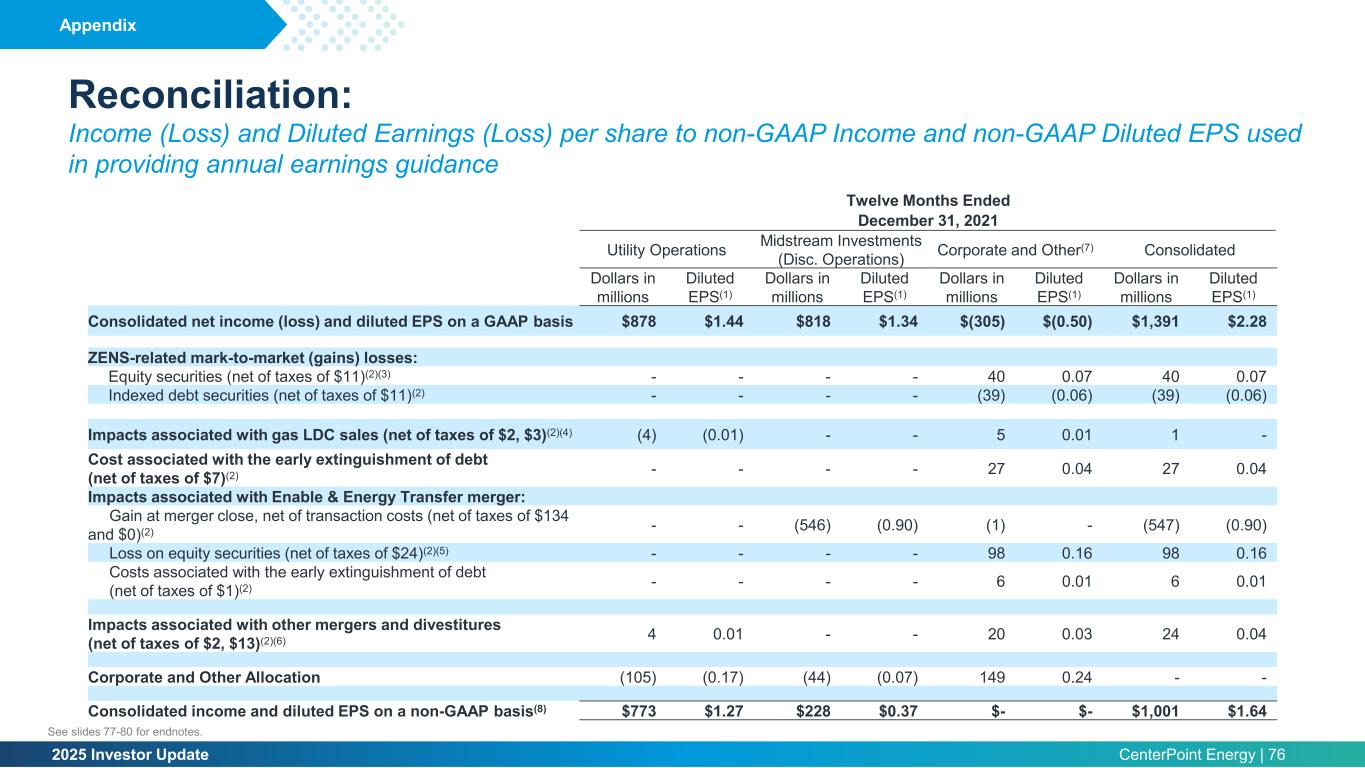
2025 Investor Update CenterPoint Energy | 76 Reconciliation: Income (Loss) and Diluted Earnings (Loss) per share to non-GAAP Income and non-GAAP Diluted EPS used in providing annual earnings guidance aaaaaaaaa Twelve Months Ended December 31, 2021 Utility Operations Midstream Investments (Disc. Operations) Corporate and Other(7) Consolidated Dollars in millions Diluted EPS(1) Dollars in millions Diluted EPS(1) Dollars in millions Diluted EPS(1) Dollars in millions Diluted EPS(1) Consolidated net income (loss) and diluted EPS on a GAAP basis $878 $1.44 $818 $1.34 $(305) $(0.50) $1,391 $2.28 ZENS-related mark-to-market (gains) losses: Equity securities (net of taxes of $11)(2)(3) - - - - 40 0.07 40 0.07 Indexed debt securities (net of taxes of $11)(2) - - - - (39) (0.06) (39) (0.06) Impacts associated with gas LDC sales (net of taxes of $2, $3)(2)(4) (4) (0.01) - - 5 0.01 1 - Cost associated with the early extinguishment of debt (net of taxes of $7)(2) - - - - 27 0.04 27 0.04 Impacts associated with Enable & Energy Transfer merger: Gain at merger close, net of transaction costs (net of taxes of $134 and $0)(2) - - (546) (0.90) (1) - (547) (0.90) Loss on equity securities (net of taxes of $24)(2)(5) - - - - 98 0.16 98 0.16 Costs associated with the early extinguishment of debt (net of taxes of $1)(2) - - - - 6 0.01 6 0.01 Impacts associated with other mergers and divestitures (net of taxes of $2, $13)(2)(6) 4 0.01 - - 20 0.03 24 0.04 Corporate and Other Allocation (105) (0.17) (44) (0.07) 149 0.24 - - Consolidated income and diluted EPS on a non-GAAP basis(8) $773 $1.27 $228 $0.37 $- $- $1,001 $1.64 Appendix See slides 77-80 for endnotes.
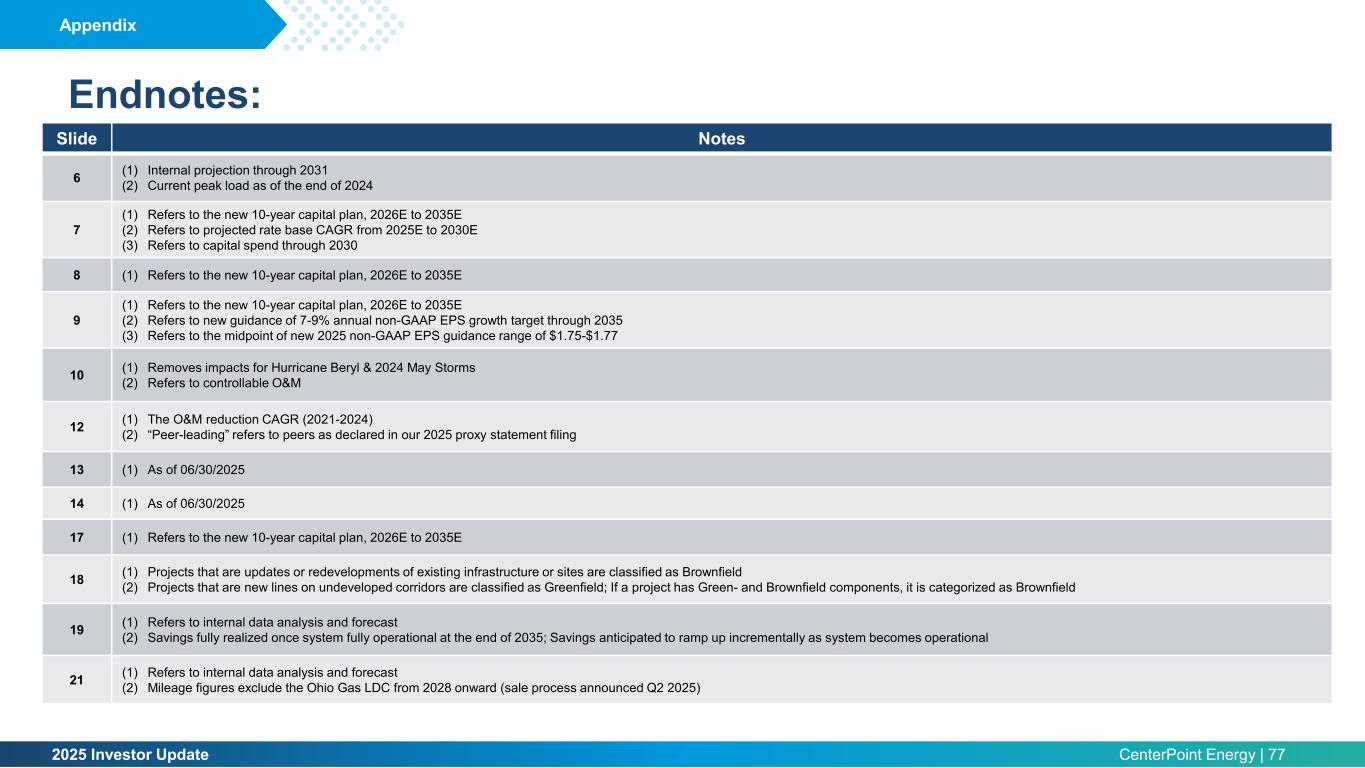
2025 Investor Update CenterPoint Energy | 77 Endnotes: Slide Notes 6 (1) Internal projection through 2031 (2) Current peak load as of the end of 2024 7 (1) Refers to the new 10-year capital plan, 2026E to 2035E (2) Refers to projected rate base CAGR from 2025E to 2030E (3) Refers to capital spend through 2030 8 (1) Refers to the new 10-year capital plan, 2026E to 2035E 9 (1) Refers to the new 10-year capital plan, 2026E to 2035E (2) Refers to new guidance of 7-9% annual non-GAAP EPS growth target through 2035 (3) Refers to the midpoint of new 2025 non-GAAP EPS guidance range of $1.75-$1.77 10 (1) Removes impacts for Hurricane Beryl & 2024 May Storms (2) Refers to controllable O&M 12 (1) The O&M reduction CAGR (2021-2024) (2) “Peer-leading” refers to peers as declared in our 2025 proxy statement filing 13 (1) As of 06/30/2025 14 (1) As of 06/30/2025 17 (1) Refers to the new 10-year capital plan, 2026E to 2035E 18 (1) Projects that are updates or redevelopments of existing infrastructure or sites are classified as Brownfield (2) Projects that are new lines on undeveloped corridors are classified as Greenfield; If a project has Green- and Brownfield components, it is categorized as Brownfield 19 (1) Refers to internal data analysis and forecast (2) Savings fully realized once system fully operational at the end of 2035; Savings anticipated to ramp up incrementally as system becomes operational 21 (1) Refers to internal data analysis and forecast (2) Mileage figures exclude the Ohio Gas LDC from 2028 onward (sale process announced Q2 2025) Appendix
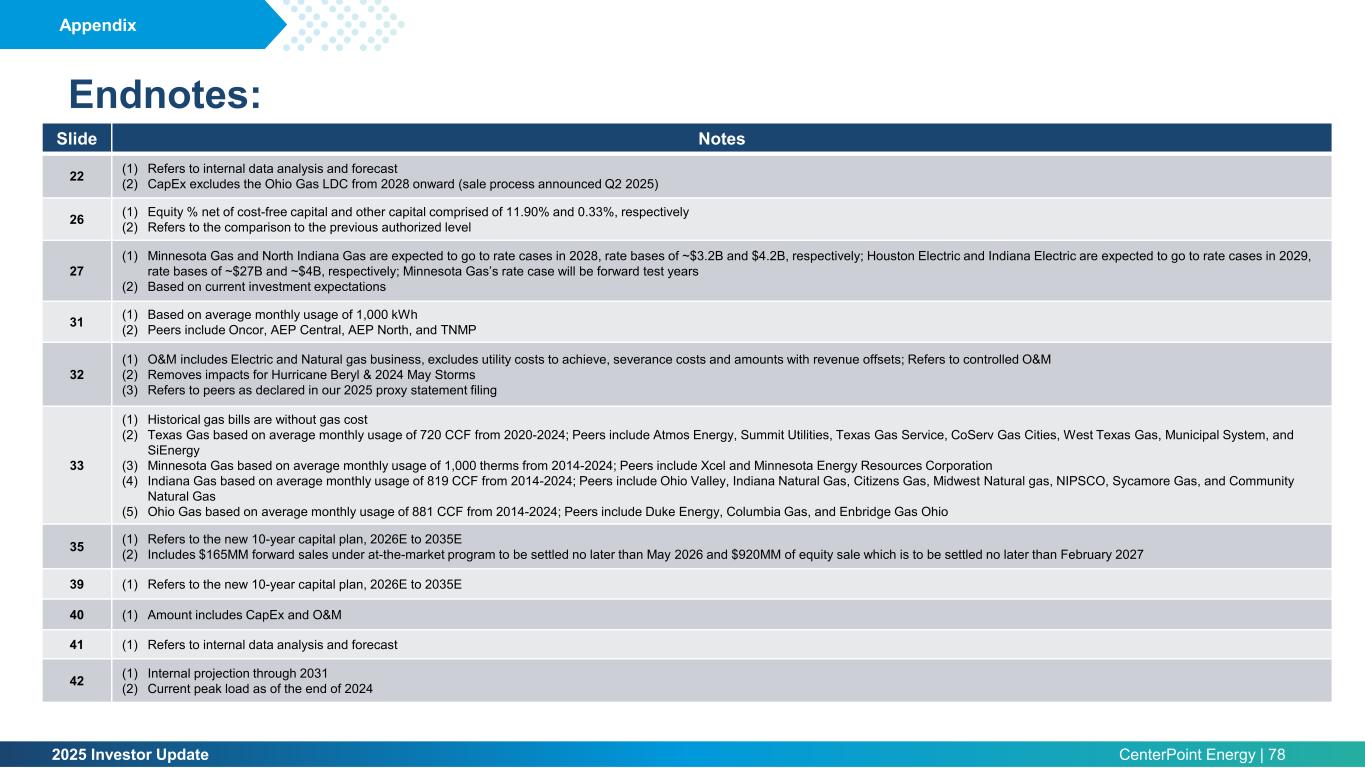
2025 Investor Update CenterPoint Energy | 78 Endnotes: Slide Notes 22 (1) Refers to internal data analysis and forecast (2) CapEx excludes the Ohio Gas LDC from 2028 onward (sale process announced Q2 2025) 26 (1) Equity % net of cost-free capital and other capital comprised of 11.90% and 0.33%, respectively (2) Refers to the comparison to the previous authorized level 27 (1) Minnesota Gas and North Indiana Gas are expected to go to rate cases in 2028, rate bases of ~$3.2B and $4.2B, respectively; Houston Electric and Indiana Electric are expected to go to rate cases in 2029, rate bases of ~$27B and ~$4B, respectively; Minnesota Gas’s rate case will be forward test years (2) Based on current investment expectations 31 (1) Based on average monthly usage of 1,000 kWh (2) Peers include Oncor, AEP Central, AEP North, and TNMP 32 (1) O&M includes Electric and Natural gas business, excludes utility costs to achieve, severance costs and amounts with revenue offsets; Refers to controlled O&M (2) Removes impacts for Hurricane Beryl & 2024 May Storms (3) Refers to peers as declared in our 2025 proxy statement filing 33 (1) Historical gas bills are without gas cost (2) Texas Gas based on average monthly usage of 720 CCF from 2020-2024; Peers include Atmos Energy, Summit Utilities, Texas Gas Service, CoServ Gas Cities, West Texas Gas, Municipal System, and SiEnergy (3) Minnesota Gas based on average monthly usage of 1,000 therms from 2014-2024; Peers include Xcel and Minnesota Energy Resources Corporation (4) Indiana Gas based on average monthly usage of 819 CCF from 2014-2024; Peers include Ohio Valley, Indiana Natural Gas, Citizens Gas, Midwest Natural gas, NIPSCO, Sycamore Gas, and Community Natural Gas (5) Ohio Gas based on average monthly usage of 881 CCF from 2014-2024; Peers include Duke Energy, Columbia Gas, and Enbridge Gas Ohio 35 (1) Refers to the new 10-year capital plan, 2026E to 2035E (2) Includes $165MM forward sales under at-the-market program to be settled no later than May 2026 and $920MM of equity sale which is to be settled no later than February 2027 39 (1) Refers to the new 10-year capital plan, 2026E to 2035E 40 (1) Amount includes CapEx and O&M 41 (1) Refers to internal data analysis and forecast 42 (1) Internal projection through 2031 (2) Current peak load as of the end of 2024 Appendix
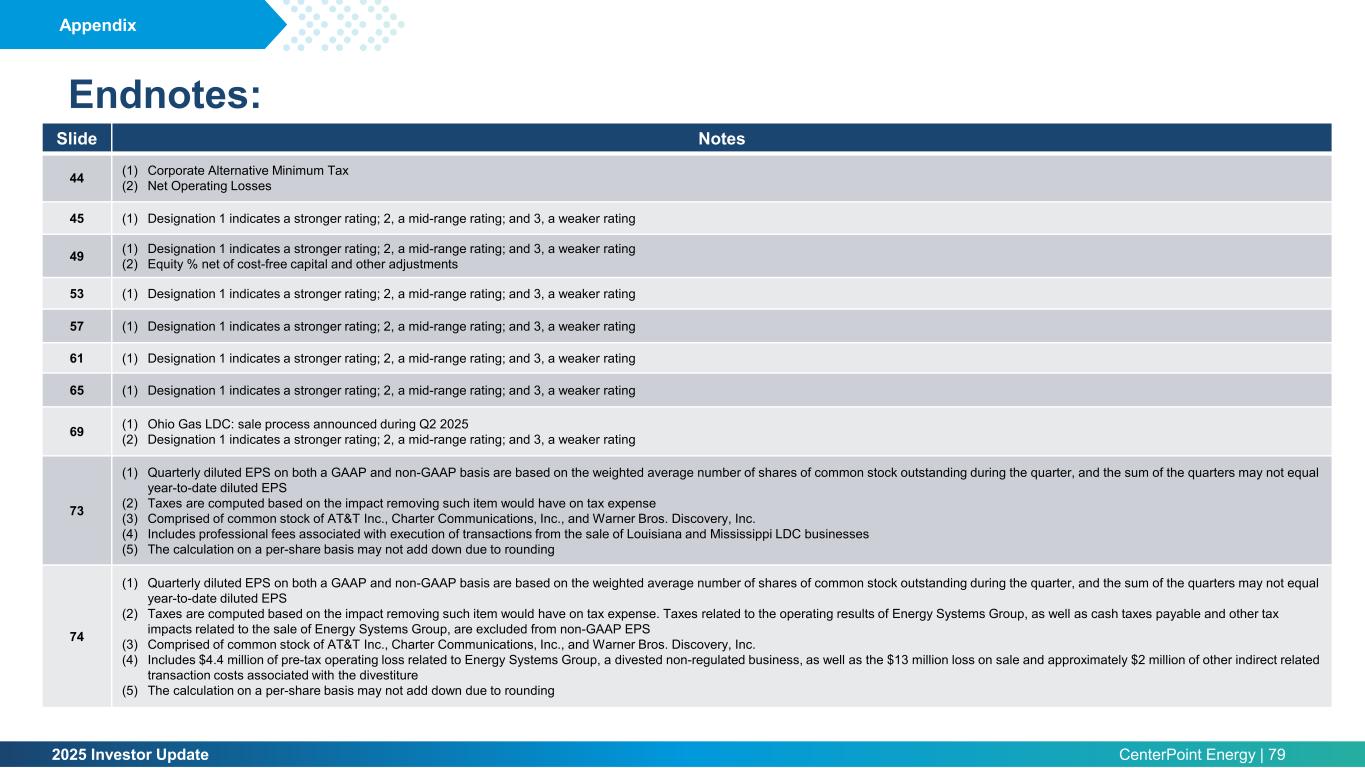
2025 Investor Update CenterPoint Energy | 79 Endnotes: Slide Notes 44 (1) Corporate Alternative Minimum Tax (2) Net Operating Losses 45 (1) Designation 1 indicates a stronger rating; 2, a mid-range rating; and 3, a weaker rating 49 (1) Designation 1 indicates a stronger rating; 2, a mid-range rating; and 3, a weaker rating (2) Equity % net of cost-free capital and other adjustments 53 (1) Designation 1 indicates a stronger rating; 2, a mid-range rating; and 3, a weaker rating 57 (1) Designation 1 indicates a stronger rating; 2, a mid-range rating; and 3, a weaker rating 61 (1) Designation 1 indicates a stronger rating; 2, a mid-range rating; and 3, a weaker rating 65 (1) Designation 1 indicates a stronger rating; 2, a mid-range rating; and 3, a weaker rating 69 (1) Ohio Gas LDC: sale process announced during Q2 2025 (2) Designation 1 indicates a stronger rating; 2, a mid-range rating; and 3, a weaker rating 73 (1) Quarterly diluted EPS on both a GAAP and non-GAAP basis are based on the weighted average number of shares of common stock outstanding during the quarter, and the sum of the quarters may not equal year-to-date diluted EPS (2) Taxes are computed based on the impact removing such item would have on tax expense (3) Comprised of common stock of AT&T Inc., Charter Communications, Inc., and Warner Bros. Discovery, Inc. (4) Includes professional fees associated with execution of transactions from the sale of Louisiana and Mississippi LDC businesses (5) The calculation on a per-share basis may not add down due to rounding 74 (1) Quarterly diluted EPS on both a GAAP and non-GAAP basis are based on the weighted average number of shares of common stock outstanding during the quarter, and the sum of the quarters may not equal year-to-date diluted EPS (2) Taxes are computed based on the impact removing such item would have on tax expense. Taxes related to the operating results of Energy Systems Group, as well as cash taxes payable and other tax impacts related to the sale of Energy Systems Group, are excluded from non-GAAP EPS (3) Comprised of common stock of AT&T Inc., Charter Communications, Inc., and Warner Bros. Discovery, Inc. (4) Includes $4.4 million of pre-tax operating loss related to Energy Systems Group, a divested non-regulated business, as well as the $13 million loss on sale and approximately $2 million of other indirect related transaction costs associated with the divestiture (5) The calculation on a per-share basis may not add down due to rounding Appendix
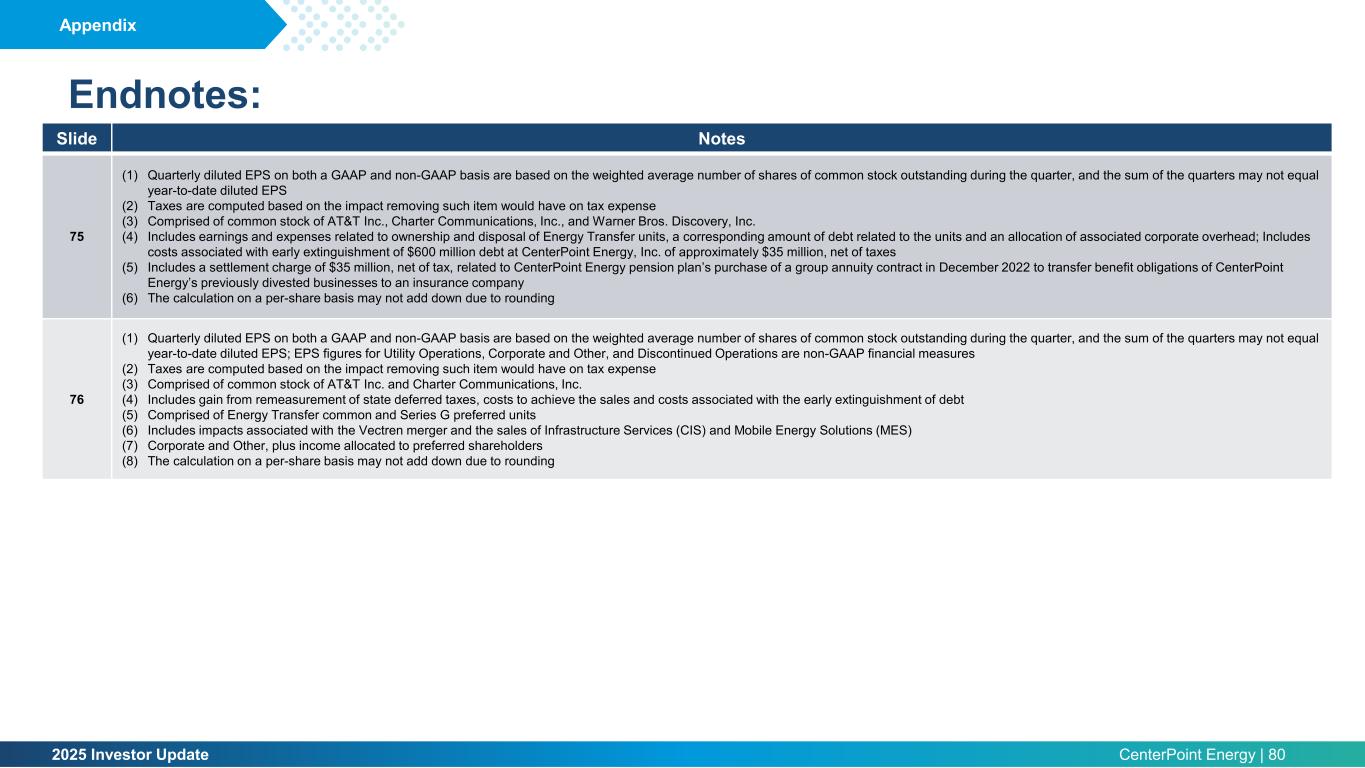
2025 Investor Update CenterPoint Energy | 80 Endnotes: Slide Notes 75 (1) Quarterly diluted EPS on both a GAAP and non-GAAP basis are based on the weighted average number of shares of common stock outstanding during the quarter, and the sum of the quarters may not equal year-to-date diluted EPS (2) Taxes are computed based on the impact removing such item would have on tax expense (3) Comprised of common stock of AT&T Inc., Charter Communications, Inc., and Warner Bros. Discovery, Inc. (4) Includes earnings and expenses related to ownership and disposal of Energy Transfer units, a corresponding amount of debt related to the units and an allocation of associated corporate overhead; Includes costs associated with early extinguishment of $600 million debt at CenterPoint Energy, Inc. of approximately $35 million, net of taxes (5) Includes a settlement charge of $35 million, net of tax, related to CenterPoint Energy pension plan’s purchase of a group annuity contract in December 2022 to transfer benefit obligations of CenterPoint Energy’s previously divested businesses to an insurance company (6) The calculation on a per-share basis may not add down due to rounding 76 (1) Quarterly diluted EPS on both a GAAP and non-GAAP basis are based on the weighted average number of shares of common stock outstanding during the quarter, and the sum of the quarters may not equal year-to-date diluted EPS; EPS figures for Utility Operations, Corporate and Other, and Discontinued Operations are non-GAAP financial measures (2) Taxes are computed based on the impact removing such item would have on tax expense (3) Comprised of common stock of AT&T Inc. and Charter Communications, Inc. (4) Includes gain from remeasurement of state deferred taxes, costs to achieve the sales and costs associated with the early extinguishment of debt (5) Comprised of Energy Transfer common and Series G preferred units (6) Includes impacts associated with the Vectren merger and the sales of Infrastructure Services (CIS) and Mobile Energy Solutions (MES) (7) Corporate and Other, plus income allocated to preferred shareholders (8) The calculation on a per-share basis may not add down due to rounding Appendix
2025 Investor Update CenterPoint Energy | 81 Additional Information Introduction Use of Non-GAAP Financial Measures In this presentation and the oral statements made in connection herewith, CenterPoint Energy presents, based on net income (loss) and diluted earnings (loss) per share, the following financial measures which are not generally accepted accounting principles (“GAAP”) financial measures: non-GAAP income and non-GAAP diluted earnings per share (“non-GAAP EPS”). Generally, a non-GAAP financial measure is a numerical measure of a company’s historical or future financial performance that excludes or includes amounts that are not normally excluded or included in the most directly comparable GAAP financial measure. 2021 non-GAAP Utility EPS included net income from CenterPoint Energy's Electric and Natural Gas segments, as well as after tax Corporate and Other operating income and an allocation of corporate overhead based upon Electric’s and Natural Gas’s relative earnings contribution. Corporate overhead consisted primarily of interest expense, preferred stock dividend requirements, and other items directly attributable to the parent along with the associated income taxes. 2021 non-GAAP Utility EPS excluded: (a) Earnings or losses from the change in value of ZENS and related securities; (b) Earnings and losses associated with the ownership and disposal of midstream common and preferred units (including amounts reported in discontinued operations), net gain associated with the consummation of the merger between Enable Midstream Partners, LP and Energy Transfer LP, a corresponding amount of debt related to midstream common and preferred units, and an allocation of associated corporate overhead; (c) Cost associated with the early extinguishment of debt; (d) Impacts associated with Arkansas and Oklahoma gas LDC sales; and (e) Certain impacts associated with other mergers and divestitures. 2022 non-GAAP EPS excluded: (a) Earnings or losses from the change in value of ZENS and related securities; (b) Gain and impact, including related expenses, associated with Arkansas and Oklahoma gas LDC sales; and (c) Income and expense related to ownership and disposal of Energy Transfer common and Series G preferred units, and a corresponding amount of debt related to the units. 2023 and 2024 non-GAAP EPS excluded: (a) Earnings or losses from the change in value of ZENS and related securities and (b) Gains, losses and impacts, including related expenses, associated with mergers and divestitures, such as the divestiture of our Louisiana and Mississippi natural gas LDC businesses. Non-GAAP EPS guidance also excludes impacts related to TEEEF once they are no longer part of our rate-regulated business. In providing non-GAAP EPS and non-GAAP EPS guidance, CenterPoint Energy does not consider the items noted above and other potential impacts such as changes in accounting standards, impairments, or other unusual items, which could have a material impact on GAAP reported results for the applicable guidance period. The non-GAAP EPS guidance ranges also consider assumptions for certain significant variables that may impact earnings, such as customer growth and usage including normal weather, throughput, recovery of capital invested, effective tax rates, financing activities and related interest rates, and regulatory and judicial proceedings. To the extent actual results deviate from these assumptions, the non-GAAP EPS guidance range for any particular year may not be met, or the projected annual non-GAAP EPS growth rate may change. CenterPoint Energy is unable to present a quantitative reconciliation of forward-looking non-GAAP diluted earnings per share without unreasonable effort because changes in the value of ZENS and related securities, future impairments, and other unusual items are not estimable and are difficult to predict due to various factors outside of management’s control. Management evaluates the Company’s financial performance in part based on non-GAAP income and non-GAAP EPS. Management believes that presenting these non-GAAP financial measures enhances an investor’s understanding of CenterPoint Energy’s overall financial performance by providing them with an additional meaningful and relevant comparison of current and anticipated future results across periods. The adjustments made in these non-GAAP financial measures exclude items that Management believes do not most accurately reflect the Company’s fundamental business performance. These excluded items are reflected in the reconciliation tables, where applicable. CenterPoint Energy’s non-GAAP income and non-GAAP EPS measures should be considered as a supplement to, and not as a substitute for, or superior to, net income (loss) and diluted earnings (loss) per share which, respectively, are the most directly comparable GAAP financial measures. These non-GAAP financial measures also may be different than non-GAAP financial measures used by other companies. Net Zero Disclaimer CenterPoint Energy’s Scope 1 greenhouse gas ("GHG") emissions estimates are calculated from GHG emissions that directly come from its operations. CenterPoint Energy’s Scope 2 GHG emissions estimates are calculated from GHG emissions that indirectly come from its energy usage, but because Texas is in an unregulated market, its Scope 2 GHG emissions estimates do not take into account Texas electric transmission and distribution assets in the line loss calculation and exclude GHG emissions related to purchased power between 2024E- 2026E. CenterPoint Energy’s Scope 3 GHG emissions estimates are based on the total natural gas supply delivered to residential and commercial customers as reported in the U.S. Energy Information Administration (EIA) Form EIA-176 reports and do not take into account the GHG emissions of transport customers and GHG emissions related to upstream extraction. CenterPoint Energy's analysis and plan for execution to achieve its Net Zero GHG emissions (Scope 1 and certain Scope 2) by 2035 goals and its 20-30% reduction in Scope 3 GHG emissions by 2035 as compared to 2021 levels goal require it to make a number of assumptions. These goals and underlying assumptions involve risks and uncertainties and are not guarantees. Should one or more of these underlying assumptions require updating, CenterPoint Energy’s actual results and ability to make progress towards and achieve its Net Zero and GHG emissions reduction goals and the timing thereof could differ materially from its expectations. Certain of the assumptions that could impact its ability to make progress towards and meet its Net Zero and GHG emissions reduction goals and the timing thereof include, but are not limited to: GHG emission levels, service territory size and capacity needs remaining in line with company expectations (including with respect to demand for our services); the ability to appropriately estimate and effectively manage business opportunities from new customers and load growth resulting from, among other things, expansion of data centers, energy export facilities, including hydrogen facilities, electrification of industrial processes and transport and logistics in our service territories; regulatory approvals related to Indiana Electric’s generation transition plan and CenterPoint Energy's ability to obtain such approvals; impacts on affordability of customer rates; customer demand for GHG emissions free or lower GHG emissions energy; impacts of regulations, executive action or legislation, including those related to the environment and tax matters (including the effects of the OBBBA, Executive Order 14315 and the IRA and any further changes to or the repeal of the IRA); impacts of future carbon pricing regulation or legislation; price, availability and regulation of carbon offsets; price of fuel, such as natural gas; cost of energy generation technologies, such as wind and solar, natural gas and storage solutions; adoption of alternative energy by the public, including adoption of electric vehicles; rate of technology innovation with regards to alternative energy resources; CenterPoint Energy’s ability to implement its modernization plans for its pipelines and facilities; the ability to complete and timely implement generation alternatives to Indiana Electric’s coal generation and retirement or fuel conversion dates of Indiana Electric’s coal facilities by 2035; the ability to construct and/or permit new natural gas pipelines; the ability to procure resources needed to build at a reasonable cost, the lack of or scarcity of resources and labor, the lack of any project cancellations, construction delays or overruns (including as a result of tariffs, legislation, bans, potential retaliatory trade measures taken against the United States or related governmental action) and the ability to appropriately estimate costs of new generation; impact of any supply chain disruptions; changes in applicable standards, metrics, methodologies or frameworks; and enhancement of energy efficiencies.