CenterPoint Energy | 1 Third Quarter 2025 Investor Update
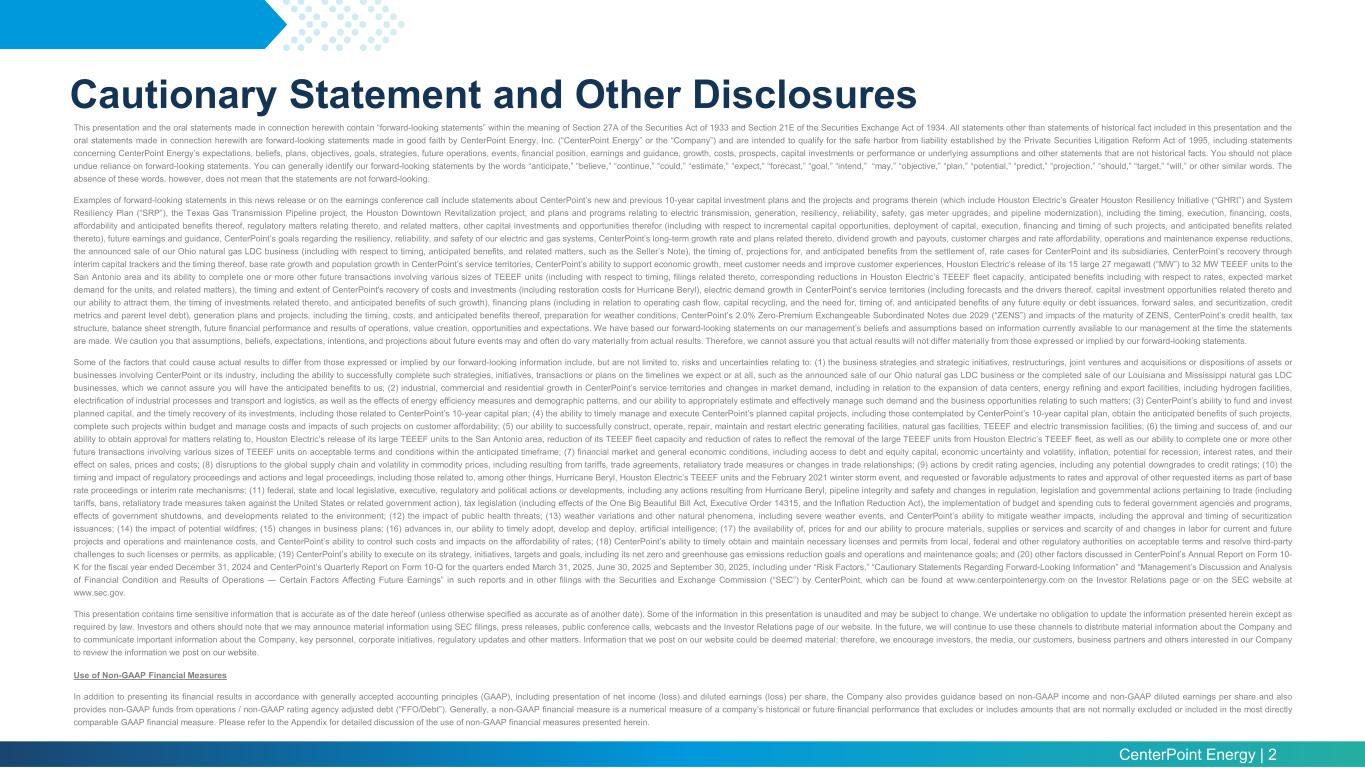
CenterPoint Energy | 2 Cautionary Statement and Other Disclosures This presentation and the oral statements made in connection herewith contain “forward-looking statements” within the meaning of Section 27A of the Securities Act of 1933 and Section 21E of the Securities Exchange Act of 1934. All statements other than statements of historical fact included in this presentation and the oral statements made in connection herewith are forward-looking statements made in good faith by CenterPoint Energy, Inc. (“CenterPoint Energy” or the “Company”) and are intended to qualify for the safe harbor from liability established by the Private Securities Litigation Reform Act of 1995, including statements concerning CenterPoint Energy’s expectations, beliefs, plans, objectives, goals, strategies, future operations, events, financial position, earnings and guidance, growth, costs, prospects, capital investments or performance or underlying assumptions and other statements that are not historical facts. You should not place undue reliance on forward-looking statements. You can generally identify our forward-looking statements by the words “anticipate,” “believe,” “continue,” “could,” “estimate,” “expect,” “forecast,” “goal,” “intend,” “may,” “objective,” “plan,” “potential,” “predict,” “projection,” “should,” “target,” “will,” or other similar words. The absence of these words, however, does not mean that the statements are not forward-looking. Examples of forward-looking statements in this news release or on the earnings conference call include statements about CenterPoint’s new and previous 10-year capital investment plans and the projects and programs therein (which include Houston Electric’s Greater Houston Resiliency Initiative (“GHRI”) and System Resiliency Plan (“SRP”), the Texas Gas Transmission Pipeline project, the Houston Downtown Revitalization project, and plans and programs relating to electric transmission, generation, resiliency, reliability, safety, gas meter upgrades, and pipeline modernization), including the timing, execution, financing, costs, affordability and anticipated benefits thereof, regulatory matters relating thereto, and related matters, other capital investments and opportunities therefor (including with respect to incremental capital opportunities, deployment of capital, execution, financing and timing of such projects, and anticipated benefits related thereto), future earnings and guidance, CenterPoint’s goals regarding the resiliency, reliability, and safety of our electric and gas systems, CenterPoint’s long-term growth rate and plans related thereto, dividend growth and payouts, customer charges and rate affordability, operations and maintenance expense reductions, the announced sale of our Ohio natural gas LDC business (including with respect to timing, anticipated benefits, and related matters, such as the Seller’s Note), the timing of, projections for, and anticipated benefits from the settlement of, rate cases for CenterPoint and its subsidiaries, CenterPoint’s recovery through interim capital trackers and the timing thereof, base rate growth and population growth in CenterPoint’s service territories, CenterPoint’s ability to support economic growth, meet customer needs and improve customer experiences, Houston Electric’s release of its 15 large 27 megawatt (“MW”) to 32 MW TEEEF units to the San Antonio area and its ability to complete one or more other future transactions involving various sizes of TEEEF units (including with respect to timing, filings related thereto, corresponding reductions in Houston Electric’s TEEEF fleet capacity, anticipated benefits including with respect to rates, expected market demand for the units, and related matters), the timing and extent of CenterPoint's recovery of costs and investments (including restoration costs for Hurricane Beryl), electric demand growth in CenterPoint’s service territories (including forecasts and the drivers thereof, capital investment opportunities related thereto and our ability to attract them, the timing of investments related thereto, and anticipated benefits of such growth), financing plans (including in relation to operating cash flow, capital recycling, and the need for, timing of, and anticipated benefits of any future equity or debt issuances, forward sales, and securitization, credit metrics and parent level debt), generation plans and projects, including the timing, costs, and anticipated benefits thereof, preparation for weather conditions, CenterPoint’s 2.0% Zero-Premium Exchangeable Subordinated Notes due 2029 (“ZENS”) and impacts of the maturity of ZENS, CenterPoint’s credit health, tax structure, balance sheet strength, future financial performance and results of operations, value creation, opportunities and expectations. We have based our forward-looking statements on our management’s beliefs and assumptions based on information currently available to our management at the time the statements are made. We caution you that assumptions, beliefs, expectations, intentions, and projections about future events may and often do vary materially from actual results. Therefore, we cannot assure you that actual results will not differ materially from those expressed or implied by our forward-looking statements. Some of the factors that could cause actual results to differ from those expressed or implied by our forward-looking information include, but are not limited to, risks and uncertainties relating to: (1) the business strategies and strategic initiatives, restructurings, joint ventures and acquisitions or dispositions of assets or businesses involving CenterPoint or its industry, including the ability to successfully complete such strategies, initiatives, transactions or plans on the timelines we expect or at all, such as the announced sale of our Ohio natural gas LDC business or the completed sale of our Louisiana and Mississippi natural gas LDC businesses, which we cannot assure you will have the anticipated benefits to us; (2) industrial, commercial and residential growth in CenterPoint’s service territories and changes in market demand, including in relation to the expansion of data centers, energy refining and export facilities, including hydrogen facilities, electrification of industrial processes and transport and logistics, as well as the effects of energy efficiency measures and demographic patterns, and our ability to appropriately estimate and effectively manage such demand and the business opportunities relating to such matters; (3) CenterPoint’s ability to fund and invest planned capital, and the timely recovery of its investments, including those related to CenterPoint’s 10-year capital plan; (4) the ability to timely manage and execute CenterPoint’s planned capital projects, including those contemplated by CenterPoint’s 10-year capital plan, obtain the anticipated benefits of such projects, complete such projects within budget and manage costs and impacts of such projects on customer affordability; (5) our ability to successfully construct, operate, repair, maintain and restart electric generating facilities, natural gas facilities, TEEEF and electric transmission facilities; (6) the timing and success of, and our ability to obtain approval for matters relating to, Houston Electric’s release of its large TEEEF units to the San Antonio area, reduction of its TEEEF fleet capacity and reduction of rates to reflect the removal of the large TEEEF units from Houston Electric’s TEEEF fleet, as well as our ability to complete one or more other future transactions involving various sizes of TEEEF units on acceptable terms and conditions within the anticipated timeframe; (7) financial market and general economic conditions, including access to debt and equity capital, economic uncertainty and volatility, inflation, potential for recession, interest rates, and their effect on sales, prices and costs; (8) disruptions to the global supply chain and volatility in commodity prices, including resulting from tariffs, trade agreements, retaliatory trade measures or changes in trade relationships; (9) actions by credit rating agencies, including any potential downgrades to credit ratings; (10) the timing and impact of regulatory proceedings and actions and legal proceedings, including those related to, among other things, Hurricane Beryl, Houston Electric’s TEEEF units and the February 2021 winter storm event, and requested or favorable adjustments to rates and approval of other requested items as part of base rate proceedings or interim rate mechanisms; (11) federal, state and local legislative, executive, regulatory and political actions or developments, including any actions resulting from Hurricane Beryl, pipeline integrity and safety and changes in regulation, legislation and governmental actions pertaining to trade (including tariffs, bans, retaliatory trade measures taken against the United States or related government action), tax legislation (including effects of the One Big Beautiful Bill Act, Executive Order 14315, and the Inflation Reduction Act), the implementation of budget and spending cuts to federal government agencies and programs, effects of government shutdowns, and developments related to the environment; (12) the impact of public health threats; (13) weather variations and other natural phenomena, including severe weather events, and CenterPoint’s ability to mitigate weather impacts, including the approval and timing of securitization issuances; (14) the impact of potential wildfires; (15) changes in business plans; (16) advances in, our ability to timely adopt, develop and deploy, artificial intelligence; (17) the availability of, prices for and our ability to procure materials, supplies or services and scarcity of and changes in labor for current and future projects and operations and maintenance costs, and CenterPoint’s ability to control such costs and impacts on the affordability of rates; (18) CenterPoint’s ability to timely obtain and maintain necessary licenses and permits from local, federal and other regulatory authorities on acceptable terms and resolve third-party challenges to such licenses or permits, as applicable; (19) CenterPoint’s ability to execute on its strategy, initiatives, targets and goals, including its net zero and greenhouse gas emissions reduction goals and operations and maintenance goals; and (20) other factors discussed in CenterPoint’s Annual Report on Form 10- K for the fiscal year ended December 31, 2024 and CenterPoint’s Quarterly Report on Form 10-Q for the quarters ended March 31, 2025, June 30, 2025 and September 30, 2025, including under “Risk Factors,” “Cautionary Statements Regarding Forward-Looking Information” and “Management’s Discussion and Analysis of Financial Condition and Results of Operations — Certain Factors Affecting Future Earnings” in such reports and in other filings with the Securities and Exchange Commission (“SEC”) by CenterPoint, which can be found at www.centerpointenergy.com on the Investor Relations page or on the SEC website at www.sec.gov. This presentation contains time sensitive information that is accurate as of the date hereof (unless otherwise specified as accurate as of another date). Some of the information in this presentation is unaudited and may be subject to change. We undertake no obligation to update the information presented herein except as required by law. Investors and others should note that we may announce material information using SEC filings, press releases, public conference calls, webcasts and the Investor Relations page of our website. In the future, we will continue to use these channels to distribute material information about the Company and to communicate important information about the Company, key personnel, corporate initiatives, regulatory updates and other matters. Information that we post on our website could be deemed material; therefore, we encourage investors, the media, our customers, business partners and others interested in our Company to review the information we post on our website. Use of Non-GAAP Financial Measures In addition to presenting its financial results in accordance with generally accepted accounting principles (GAAP), including presentation of net income (loss) and diluted earnings (loss) per share, the Company also provides guidance based on non-GAAP income and non-GAAP diluted earnings per share and also provides non-GAAP funds from operations / non-GAAP rating agency adjusted debt (“FFO/Debt”). Generally, a non-GAAP financial measure is a numerical measure of a company’s historical or future financial performance that excludes or includes amounts that are not normally excluded or included in the most directly comparable GAAP financial measure. Please refer to the Appendix for detailed discussion of the use of non-GAAP financial measures presented herein.
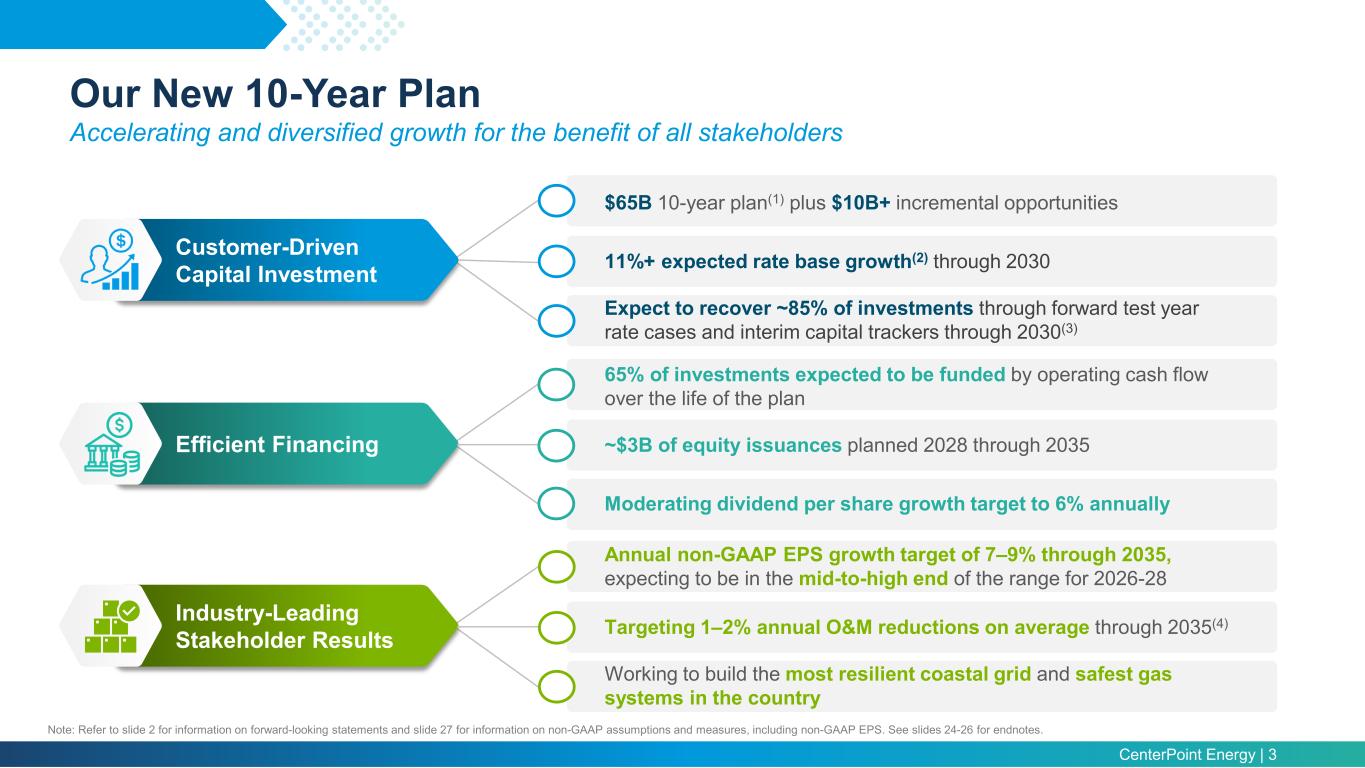
CenterPoint Energy | 3 Our New 10-Year Plan Accelerating and diversified growth for the benefit of all stakeholders $65B 10-year plan(1) plus $10B+ incremental opportunities 11%+ expected rate base growth(2) through 2030 Expect to recover ~85% of investments through forward test year rate cases and interim capital trackers through 2030(3) Customer-Driven Capital Investment 65% of investments expected to be funded by operating cash flow over the life of the plan ~$3B of equity issuances planned 2028 through 2035 Moderating dividend per share growth target to 6% annually Efficient Financing Annual non-GAAP EPS growth target of 7–9% through 2035, expecting to be in the mid-to-high end of the range for 2026-28 Targeting 1–2% annual O&M reductions on average through 2035(4) Working to build the most resilient coastal grid and safest gas systems in the country Industry-Leading Stakeholder Results Note: Refer to slide 2 for information on forward-looking statements and slide 27 for information on non-GAAP assumptions and measures, including non-GAAP EPS. See slides 24-26 for endnotes.
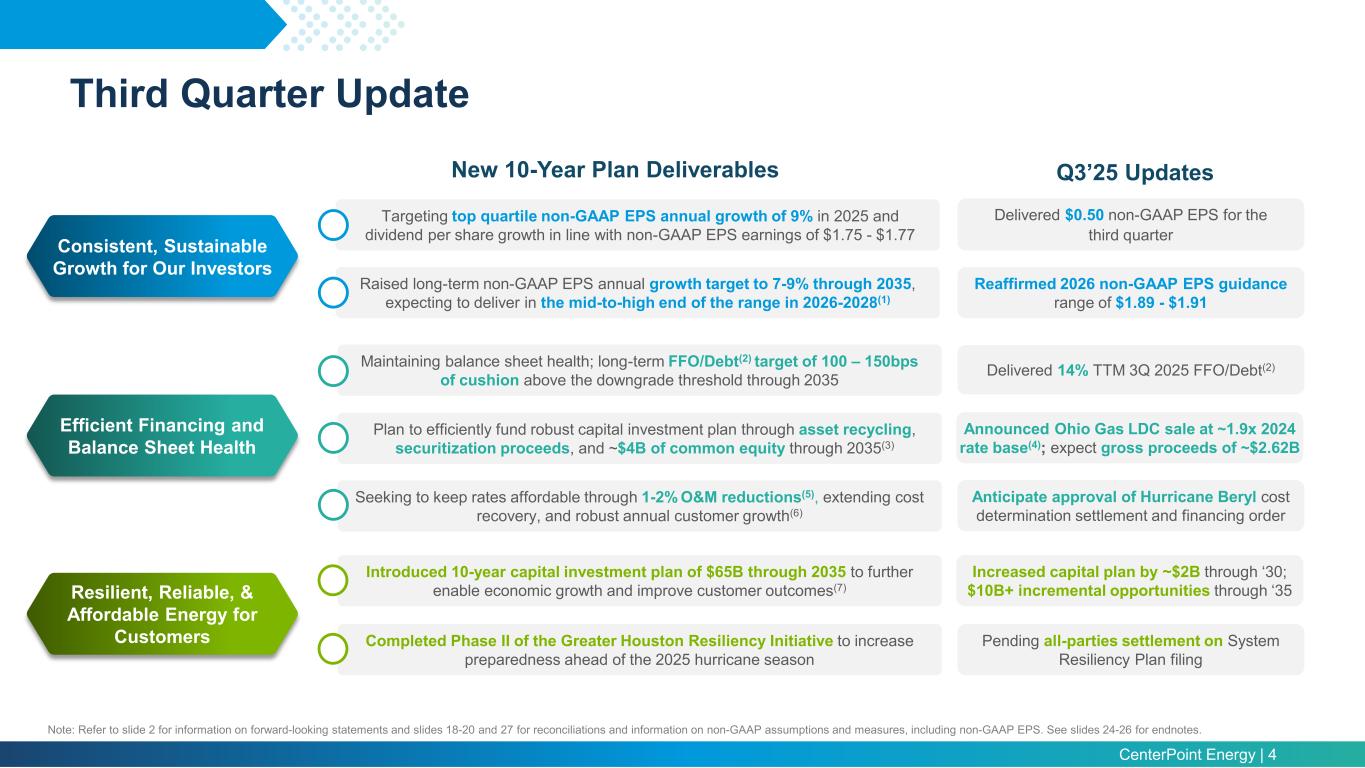
CenterPoint Energy | 4 Third Quarter Update Note: Refer to slide 2 for information on forward-looking statements and slides 18-20 and 27 for reconciliations and information on non-GAAP assumptions and measures, including non-GAAP EPS. See slides 24-26 for endnotes. Consistent, Sustainable Growth for Our Investors Resilient, Reliable, & Affordable Energy for Customers Efficient Financing and Balance Sheet Health New 10-Year Plan Deliverables Q3’25 Updates Delivered $0.50 non-GAAP EPS for the third quarter Reaffirmed 2026 non-GAAP EPS guidance range of $1.89 - $1.91 Announced Ohio Gas LDC sale at ~1.9x 2024 rate base(4); expect gross proceeds of ~$2.62B Anticipate approval of Hurricane Beryl cost determination settlement and financing order Increased capital plan by ~$2B through ‘30; $10B+ incremental opportunities through ‘35 Delivered 14% TTM 3Q 2025 FFO/Debt(2) Pending all-parties settlement on System Resiliency Plan filing Targeting top quartile non-GAAP EPS annual growth of 9% in 2025 and dividend per share growth in line with non-GAAP EPS earnings of $1.75 - $1.77 Raised long-term non-GAAP EPS annual growth target to 7-9% through 2035, expecting to deliver in the mid-to-high end of the range in 2026-2028(1) Maintaining balance sheet health; long-term FFO/Debt(2) target of 100 – 150bps of cushion above the downgrade threshold through 2035 Plan to efficiently fund robust capital investment plan through asset recycling, securitization proceeds, and ~$4B of common equity through 2035(3) Seeking to keep rates affordable through 1-2% O&M reductions(5), extending cost recovery, and robust annual customer growth(6) Introduced 10-year capital investment plan of $65B through 2035 to further enable economic growth and improve customer outcomes(7) Completed Phase II of the Greater Houston Resiliency Initiative to increase preparedness ahead of the 2025 hurricane season
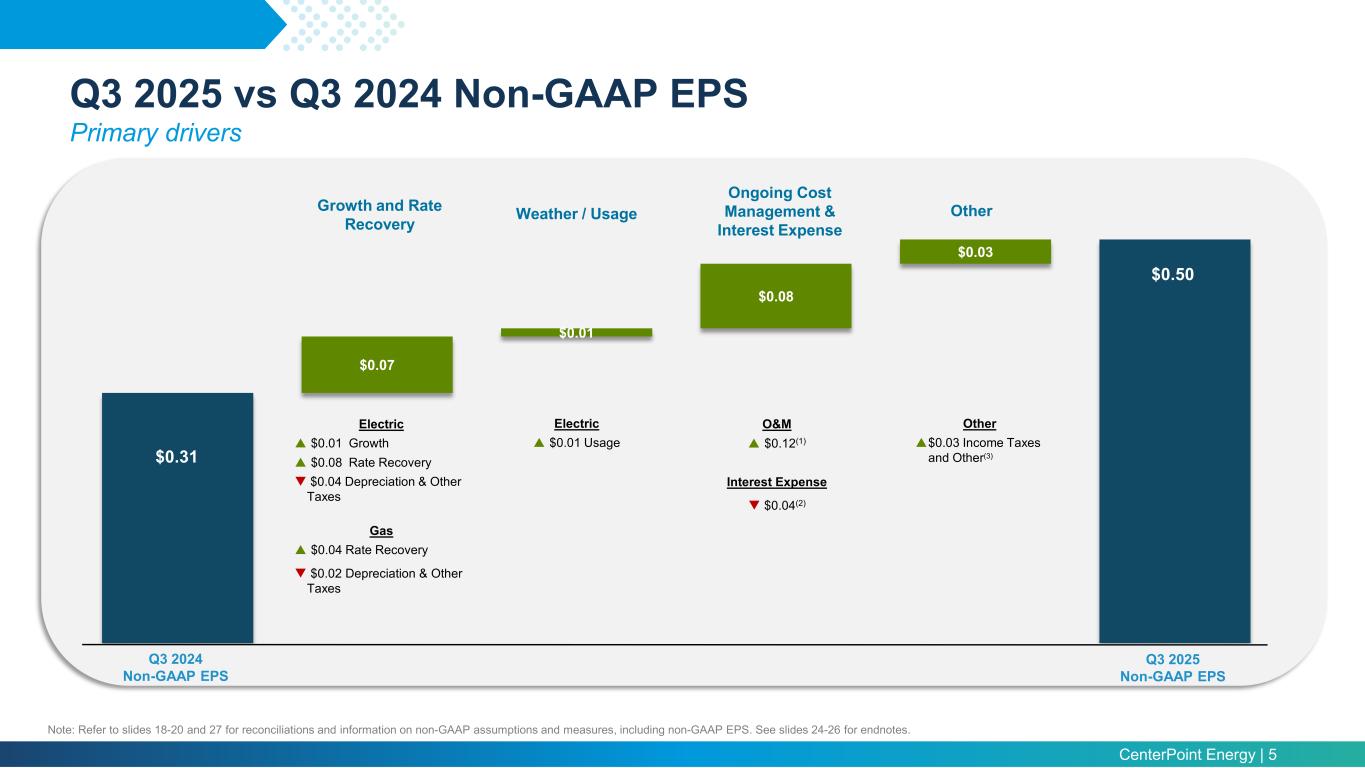
CenterPoint Energy | 5 Q3 2025 vs Q3 2024 Non-GAAP EPS Primary drivers Note: Refer to slides 18-20 and 27 for reconciliations and information on non-GAAP assumptions and measures, including non-GAAP EPS. See slides 24-26 for endnotes. $0.07 $0.01 $0.08 $0.03 Q3 2024 Non-GAAP EPS Q3 2025 Non-GAAP EPS $0.31 Growth and Rate Recovery Ongoing Cost Management & Interest Expense Weather / Usage Other Electric $0.01 Growth $0.08 Rate Recovery $0.04 Depreciation & Other Taxes Gas $0.04 Rate Recovery $0.02 Depreciation & Other Taxes O&M $0.12(1) Interest Expense $0.04(2) $0.50 Other $0.03 Income Taxes and Other(3) Electric $0.01 Usage
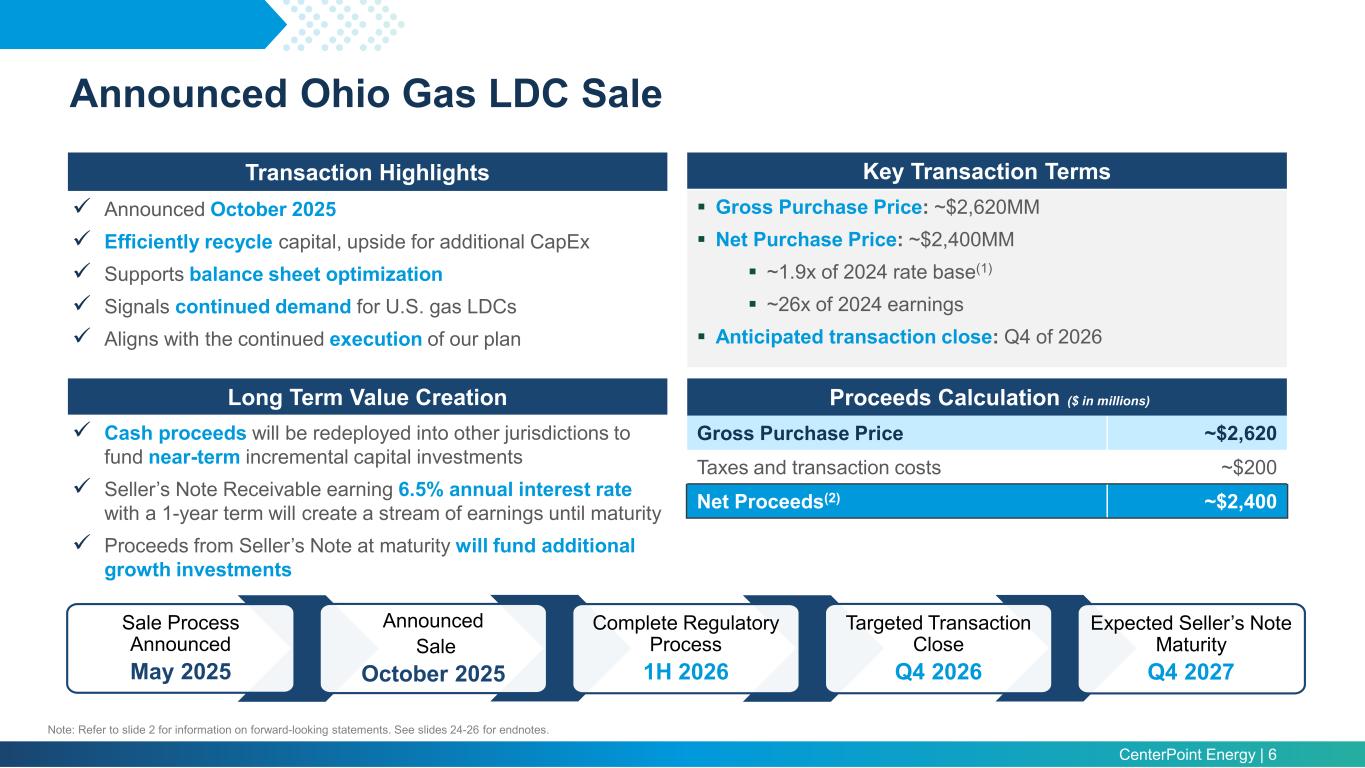
CenterPoint Energy | 6 Transaction Highlights Announced October 2025 Efficiently recycle capital, upside for additional CapEx Supports balance sheet optimization Signals continued demand for U.S. gas LDCs Aligns with the continued execution of our plan Key Transaction Terms Gross Purchase Price: ~$2,620MM Net Purchase Price: ~$2,400MM ~1.9x of 2024 rate base(1) ~26x of 2024 earnings Anticipated transaction close: Q4 of 2026 Proceeds Calculation ($ in millions) Gross Purchase Price ~$2,620 Taxes and transaction costs ~$200 Net Proceeds(2) ~$2,400 Long Term Value Creation Cash proceeds will be redeployed into other jurisdictions to fund near-term incremental capital investments Seller’s Note Receivable earning 6.5% annual interest rate with a 1-year term will create a stream of earnings until maturity Proceeds from Seller’s Note at maturity will fund additional growth investments Note: Refer to slide 2 for information on forward-looking statements. See slides 24-26 for endnotes. Expected Seller’s Note Maturity Q4 2027 Sale Process Announced May 2025 Announced Sale October 2025 Complete Regulatory Process 1H 2026 Targeted Transaction Close Q4 2026 Announced Ohio Gas LDC Sale
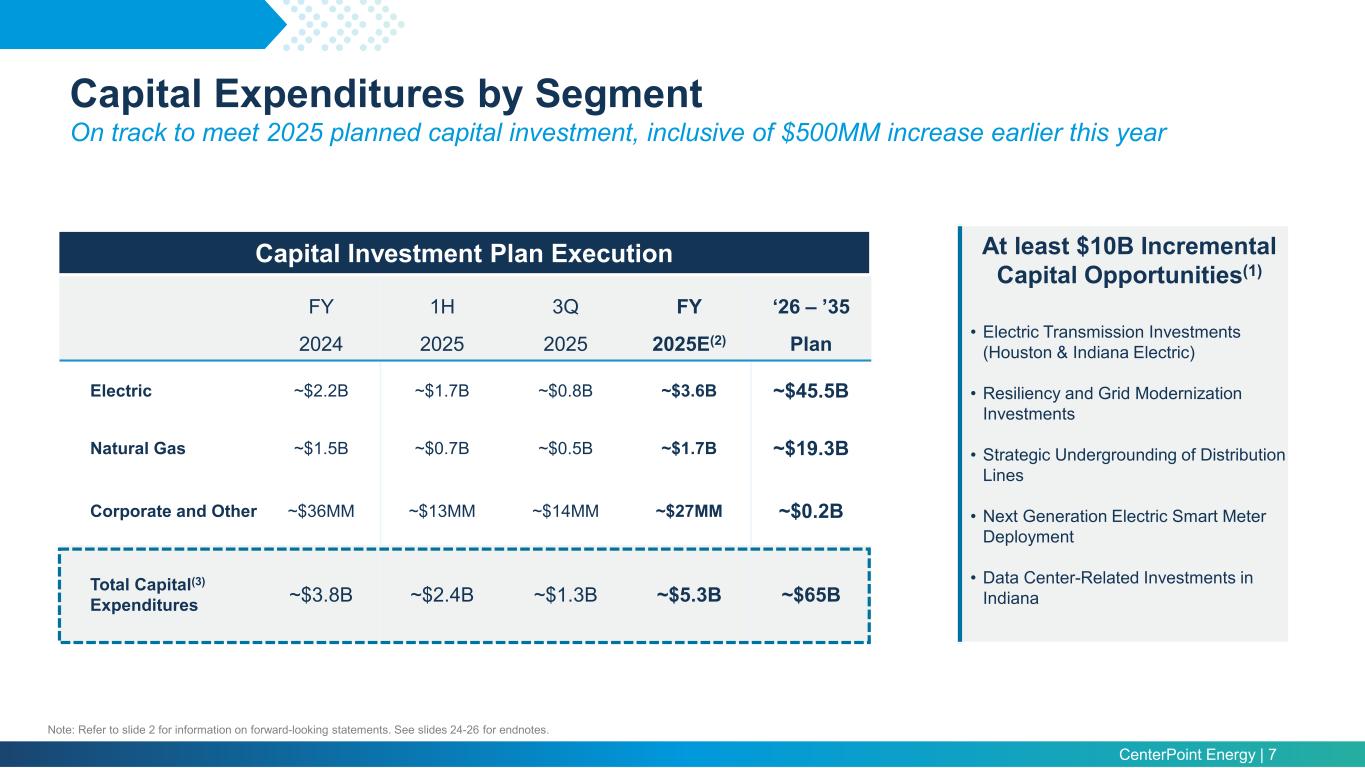
CenterPoint Energy | 7 Capital Expenditures by Segment On track to meet 2025 planned capital investment, inclusive of $500MM increase earlier this year FY 1H 3Q FY ‘26 – ’35 2024 2025 2025 2025E(2) Plan Electric ~$2.2B ~$1.7B ~$0.8B ~$3.6B ~$45.5B Natural Gas ~$1.5B ~$0.7B ~$0.5B ~$1.7B ~$19.3B Corporate and Other ~$36MM ~$13MM ~$14MM ~$27MM ~$0.2B Total Capital(3) Expenditures ~$3.8B ~$2.4B ~$1.3B ~$5.3B ~$65B Capital Investment Plan Execution At least $10B Incremental Capital Opportunities(1) • Electric Transmission Investments (Houston & Indiana Electric) • Resiliency and Grid Modernization Investments • Strategic Undergrounding of Distribution Lines • Next Generation Electric Smart Meter Deployment • Data Center-Related Investments in Indiana Note: Refer to slide 2 for information on forward-looking statements. See slides 24-26 for endnotes.
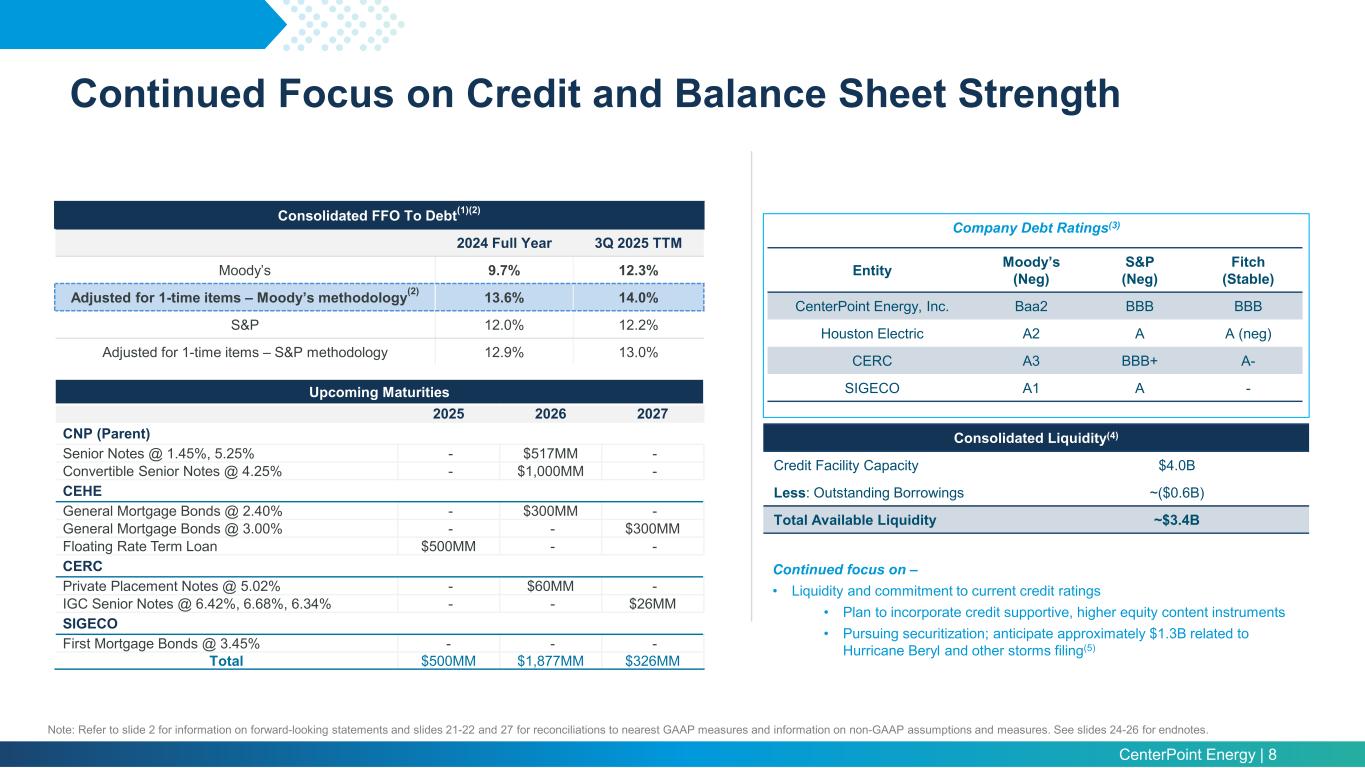
CenterPoint Energy | 8 Entity Moody’s (Neg) S&P (Neg) Fitch (Stable) CenterPoint Energy, Inc. Baa2 BBB BBB Houston Electric A2 A A (neg) CERC A3 BBB+ A- SIGECO A1 A - Company Debt Ratings(3) Consolidated FFO To Debt(1)(2) 2024 Full Year 3Q 2025 TTM Moody’s 9.7% 12.3% Adjusted for 1-time items – Moody’s methodology(2) 13.6% 14.0% S&P 12.0% 12.2% Adjusted for 1-time items – S&P methodology 12.9% 13.0% Continued focus on – • Liquidity and commitment to current credit ratings • Plan to incorporate credit supportive, higher equity content instruments • Pursuing securitization; anticipate approximately $1.3B related to Hurricane Beryl and other storms filing(5) Upcoming Maturities 2025 2026 2027 CNP (Parent) Senior Notes @ 1.45%, 5.25% - $517MM - Convertible Senior Notes @ 4.25% - $1,000MM - CEHE General Mortgage Bonds @ 2.40% - $300MM - General Mortgage Bonds @ 3.00% - - $300MM Floating Rate Term Loan $500MM - - CERC Private Placement Notes @ 5.02% - $60MM - IGC Senior Notes @ 6.42%, 6.68%, 6.34% - - $26MM SIGECO First Mortgage Bonds @ 3.45% - - - Total $500MM $1,877MM $326MM Consolidated Liquidity(4) Credit Facility Capacity $4.0B Less: Outstanding Borrowings ~($0.6B) Total Available Liquidity ~$3.4B Continued Focus on Credit and Balance Sheet Strength Note: Refer to slide 2 for information on forward-looking statements and slides 21-22 and 27 for reconciliations to nearest GAAP measures and information on non-GAAP assumptions and measures. See slides 24-26 for endnotes.
CenterPoint Energy | 9 Contacts Ben Vallejo Director Investor Relations and Corporate Planning Tel. (713) 207 – 5461 ben.vallejo@centerpointenergy.com Ellie Wood Manager Investor Relations Tel. (713) 207 – 7703 ellen.wood@centerpointenergy.com General Contact Tel. (713) 207 – 6500 https://investors.centerpointenergy.com/contact-us

CenterPoint Energy | 10 Appendix
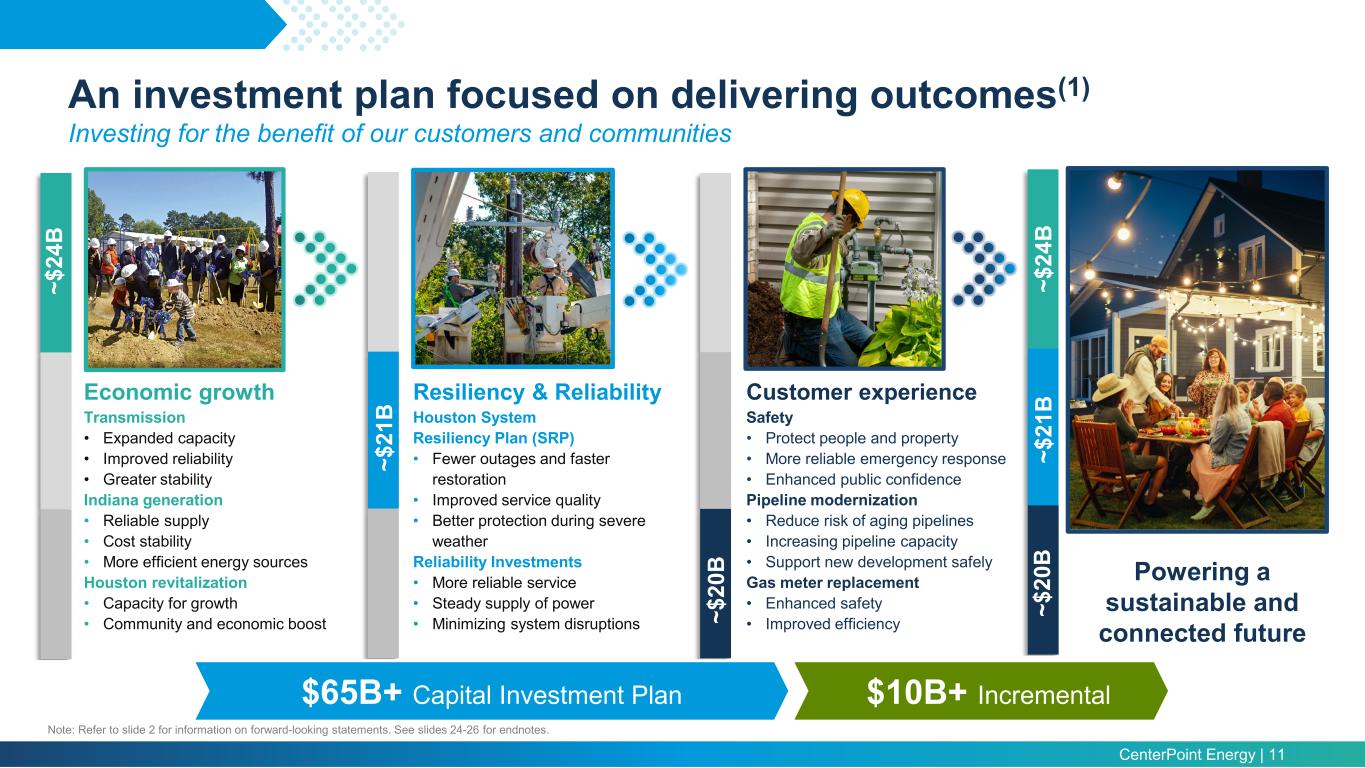
CenterPoint Energy | 11 An investment plan focused on delivering outcomes(1) Investing for the benefit of our customers and communities Economic growth Transmission • Expanded capacity • Improved reliability • Greater stability Indiana generation • Reliable supply • Cost stability • More efficient energy sources Houston revitalization • Capacity for growth • Community and economic boost ~$ 24 B Resiliency & Reliability Houston System Resiliency Plan (SRP) • Fewer outages and faster restoration • Improved service quality • Better protection during severe weather Reliability Investments • More reliable service • Steady supply of power • Minimizing system disruptions ~$ 21 B Customer experience Safety • Protect people and property • More reliable emergency response • Enhanced public confidence Pipeline modernization • Reduce risk of aging pipelines • Increasing pipeline capacity • Support new development safely Gas meter replacement • Enhanced safety • Improved efficiency~$ 20 B ~$ 24 B ~$ 21 B ~$ 20 B $65B+ Capital Investment Plan $10B+ Incremental Powering a sustainable and connected future Note: Refer to slide 2 for information on forward-looking statements. See slides 24-26 for endnotes.
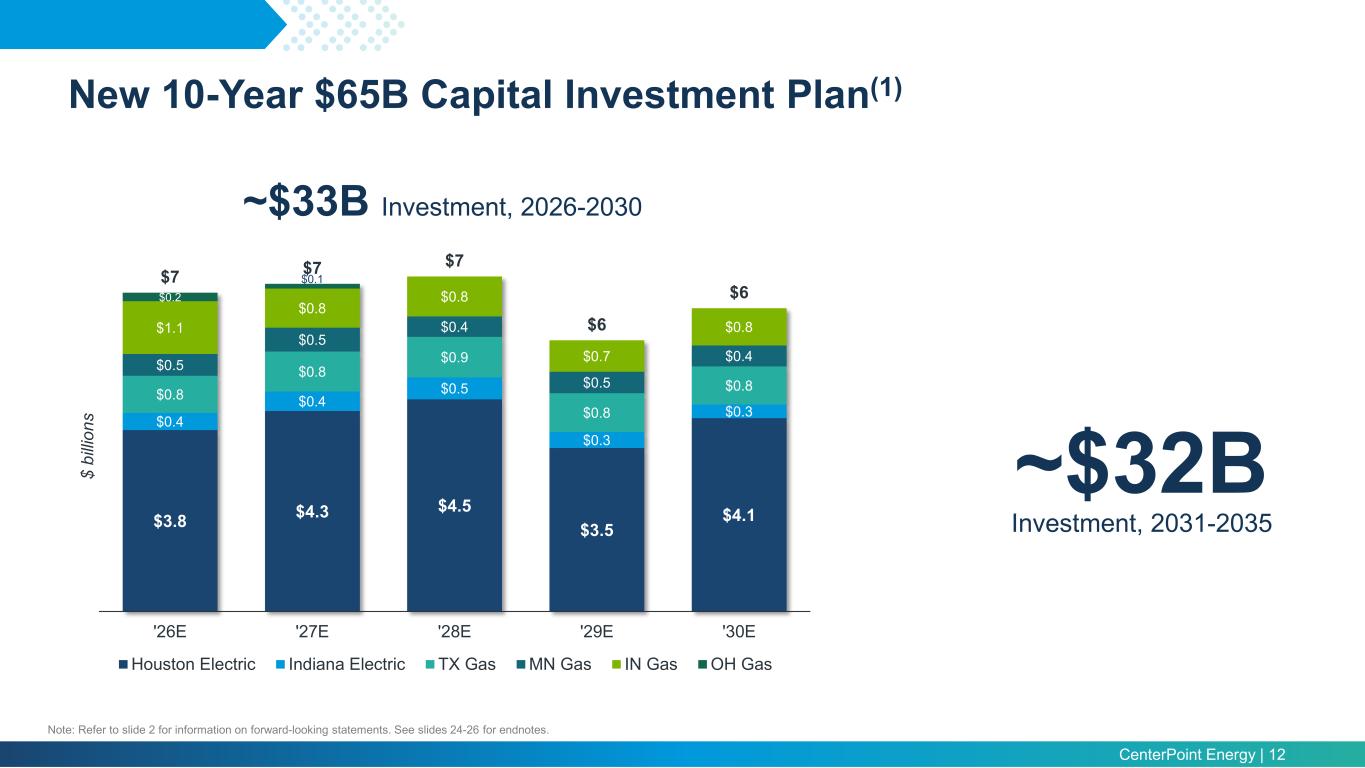
CenterPoint Energy | 12 New 10-Year $65B Capital Investment Plan(1) $3.8 $4.3 $4.5 $3.5 $4.1 $0.4 $0.4 $0.5 $0.3 $0.3 $0.8 $0.8 $0.9 $0.8 $0.8 $0.5 $0.5 $0.4 $0.5 $0.4 $1.1 $0.8 $0.8 $0.7 $0.8 $0.2 $0.1$7 $7 $7 $6 $6 '26E '27E '28E '29E '30E $ bi llio ns Houston Electric Indiana Electric TX Gas MN Gas IN Gas OH Gas ~$33B Investment, 2026-2030 ~$32B Investment, 2031-2035 Note: Refer to slide 2 for information on forward-looking statements. See slides 24-26 for endnotes.
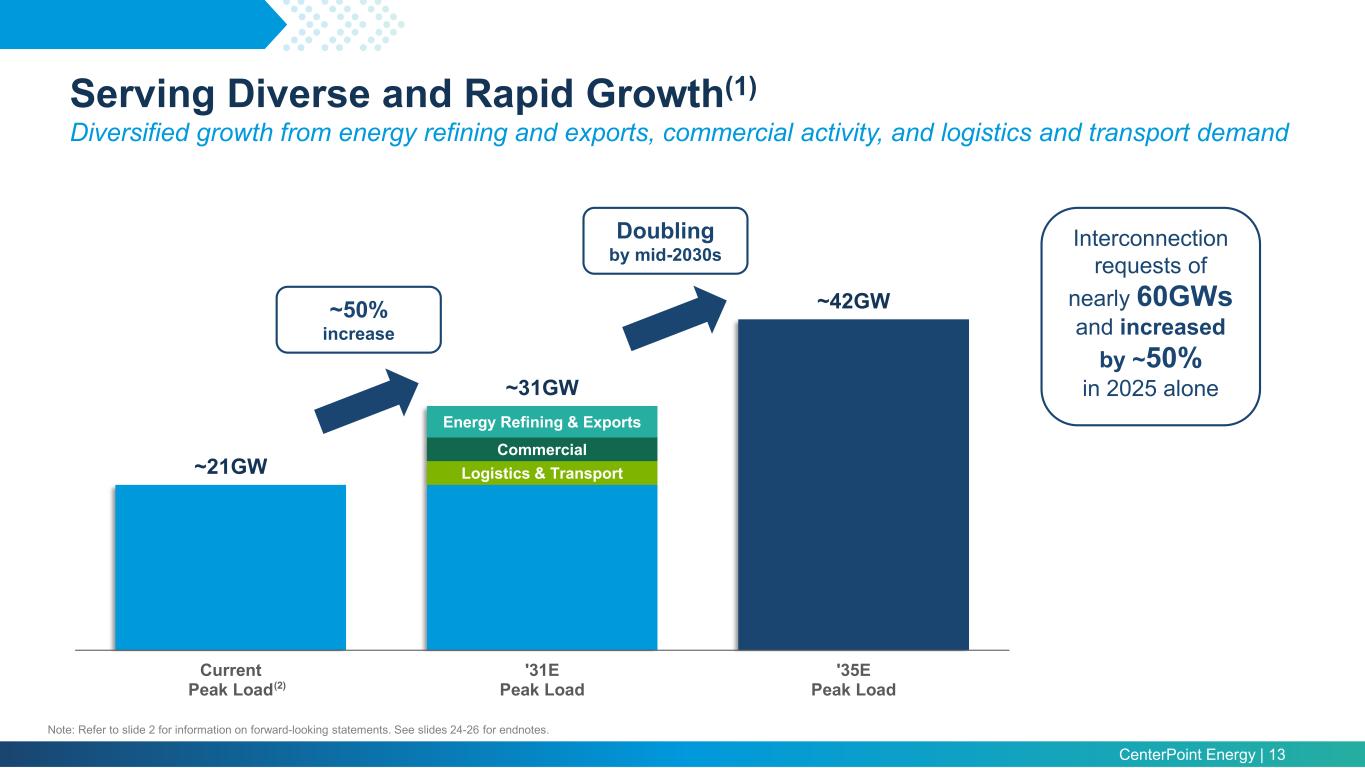
CenterPoint Energy | 13 Note: Refer to slide 2 for information on forward-looking statements. See slides 24-26 for endnotes. Serving Diverse and Rapid Growth(1) Diversified growth from energy refining and exports, commercial activity, and logistics and transport demand Logistics & Transport Commercial Energy Refining & Exports ~21GW ~31GW ~42GW Current Peak Load '31E Peak Load '35E Peak Load Interconnection requests of nearly 60GWs and increased by ~50% in 2025 alone (2) ~50% increase Doubling by mid-2030s
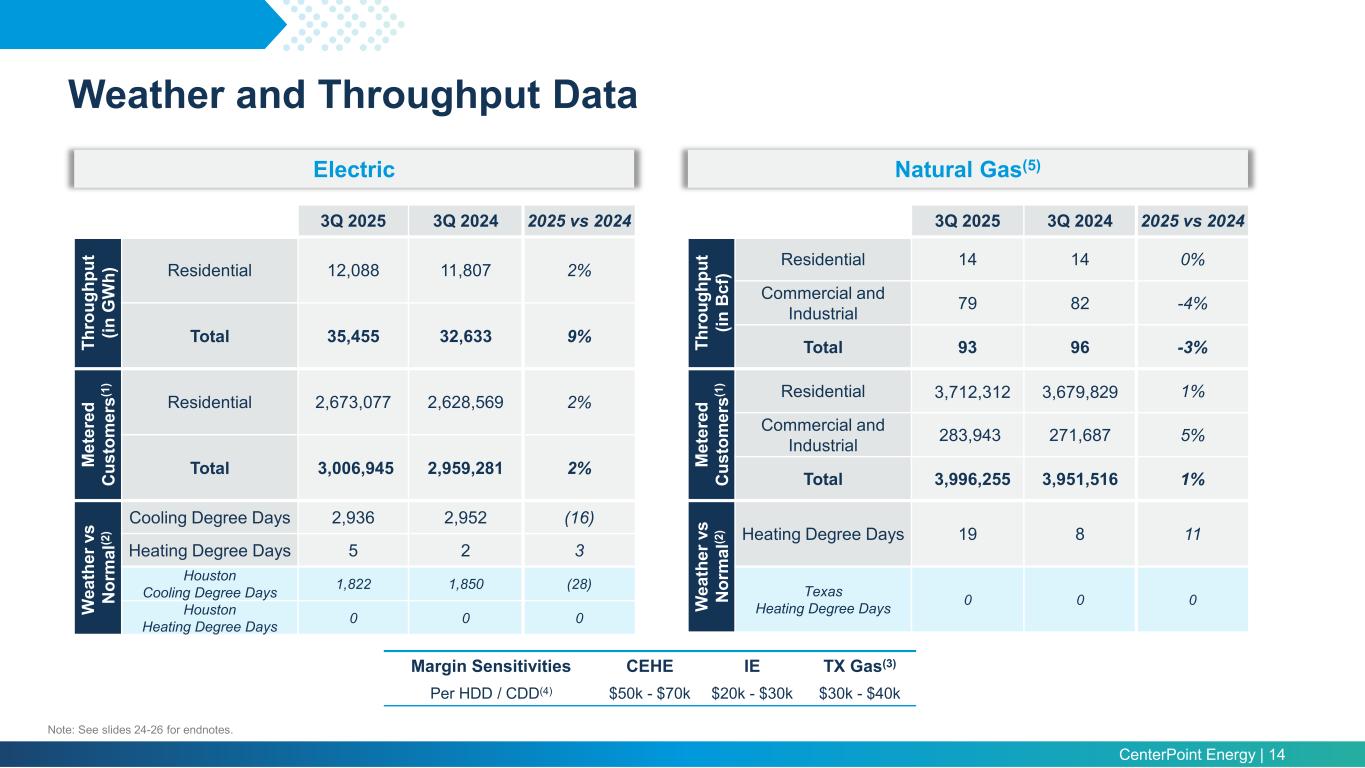
CenterPoint Energy | 14 aaaaaaaaa Electric Natural Gas(5) 3Q 2025 3Q 2024 2025 vs 2024 Th ro ug hp ut (in G W h) Residential 12,088 11,807 2% Total 35,455 32,633 9% M et er ed C us to m er s( 1) Residential 2,673,077 2,628,569 2% Total 3,006,945 2,959,281 2% W ea th er v s N or m al (2 ) Cooling Degree Days 2,936 2,952 (16) Heating Degree Days 5 2 3 Houston Cooling Degree Days 1,822 1,850 (28) Houston Heating Degree Days 0 0 0 3Q 2025 3Q 2024 2025 vs 2024 Th ro ug hp ut (in B cf ) Residential 14 14 0% Commercial and Industrial 79 82 -4% Total 93 96 -3% M et er ed C us to m er s( 1) Residential 3,712,312 3,679,829 1% Commercial and Industrial 283,943 271,687 5% Total 3,996,255 3,951,516 1% W ea th er v s N or m al (2 ) Heating Degree Days 19 8 11 Texas Heating Degree Days 0 0 0 Margin Sensitivities CEHE IE TX Gas(3) Per HDD / CDD(4) $50k - $70k $20k - $30k $30k - $40k Note: See slides 24-26 for endnotes. Weather and Throughput Data
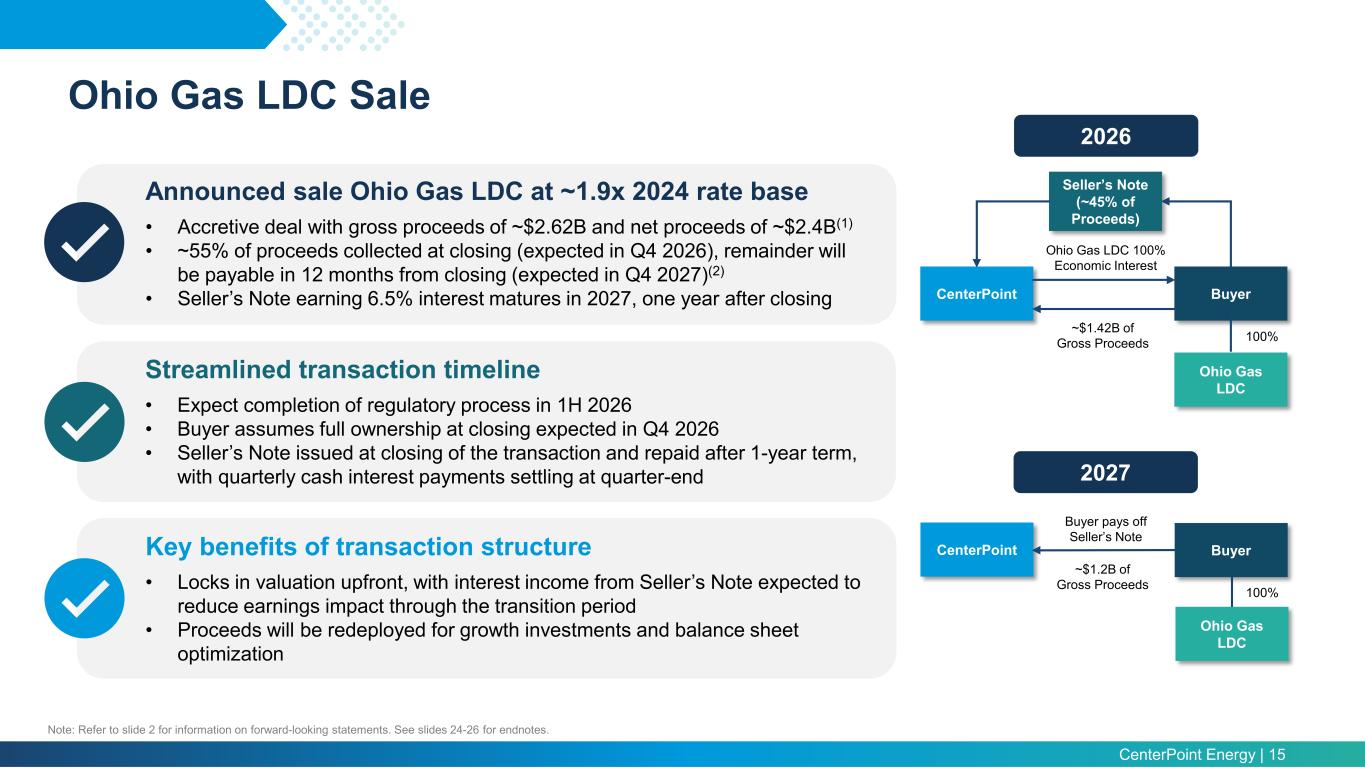
CenterPoint Energy | 15 Ohio Gas LDC Sale Announced sale Ohio Gas LDC at ~1.9x 2024 rate base • Accretive deal with gross proceeds of ~$2.62B and net proceeds of ~$2.4B(1) • ~55% of proceeds collected at closing (expected in Q4 2026), remainder will be payable in 12 months from closing (expected in Q4 2027)(2) • Seller’s Note earning 6.5% interest matures in 2027, one year after closing Streamlined transaction timeline • Expect completion of regulatory process in 1H 2026 • Buyer assumes full ownership at closing expected in Q4 2026 • Seller’s Note issued at closing of the transaction and repaid after 1-year term, with quarterly cash interest payments settling at quarter-end Key benefits of transaction structure • Locks in valuation upfront, with interest income from Seller’s Note expected to reduce earnings impact through the transition period • Proceeds will be redeployed for growth investments and balance sheet optimization 2026 CenterPoint Seller’s Note (~45% of Proceeds) Ohio Gas LDC Buyer ~$1.42B of Gross Proceeds 100% Ohio Gas LDC 100% Economic Interest BuyerCenterPoint ~$1.2B of Gross Proceeds 100% Ohio Gas LDC Buyer pays off Seller’s Note 2027 Note: Refer to slide 2 for information on forward-looking statements. See slides 24-26 for endnotes.
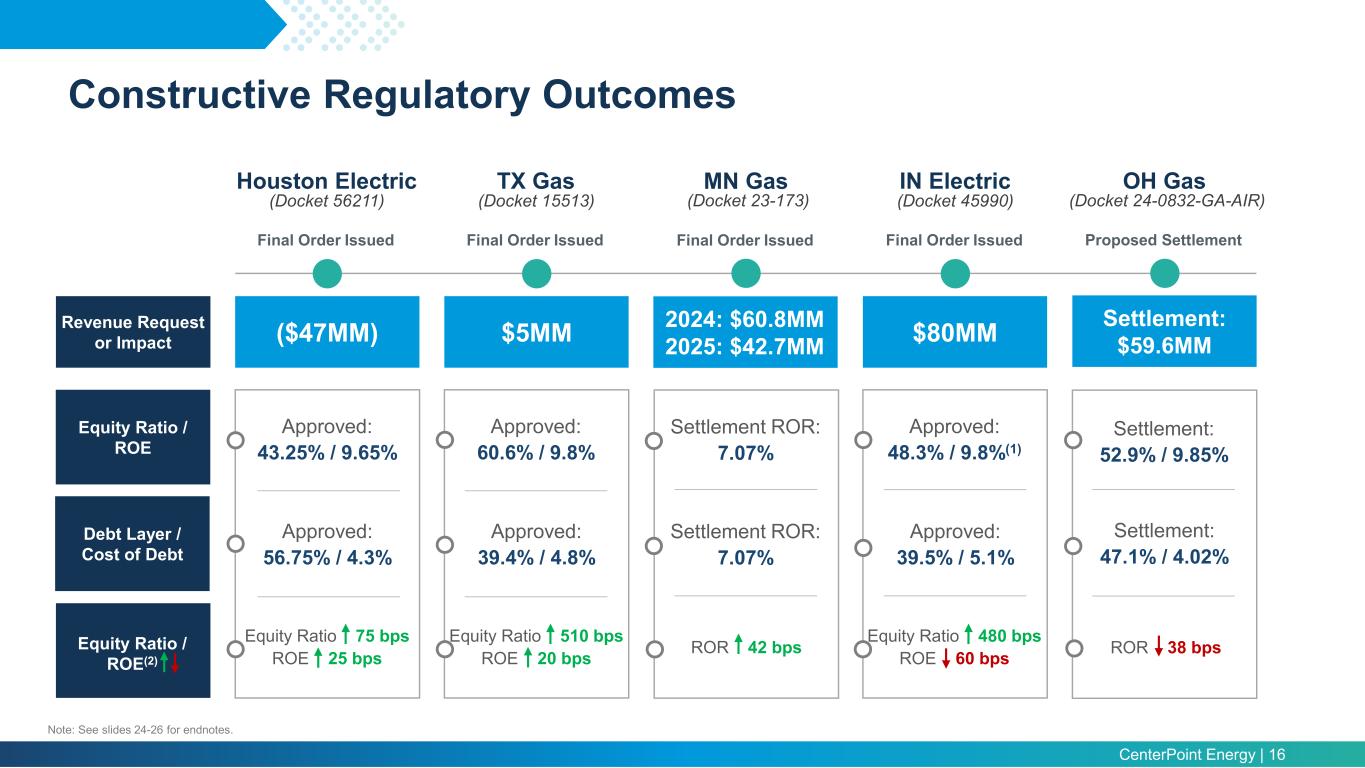
CenterPoint Energy | 16 Houston Electric OH GasIN ElectricMN Gas ($47MM) $5MM Settlement: $59.6MM$80MM2024: $60.8MM 2025: $42.7MM Approved: 56.75% / 4.3% Approved: 39.4% / 4.8% Settlement: 47.1% / 4.02% Approved: 39.5% / 5.1% Approved: 43.25% / 9.65% Approved: 60.6% / 9.8% Settlement: 52.9% / 9.85% Approved: 48.3% / 9.8%(1) Settlement ROR: 7.07% Settlement ROR: 7.07% (Docket 15513) (Docket 24-0832-GA-AIR)(Docket 45990)(Docket 23-173)(Docket 56211) TX Gas Final Order Issued Proposed SettlementFinal Order IssuedFinal Order IssuedFinal Order Issued Revenue Request or Impact Equity Ratio / ROE Debt Layer / Cost of Debt Equity Ratio / ROE(2) Constructive Regulatory Outcomes Equity Ratio 75 bps ROE 25 bps ROR 38 bpsROR 42 bpsEquity Ratio 510 bps ROE 20 bps Equity Ratio 480 bps ROE 60 bps Note: See slides 24-26 for endnotes.
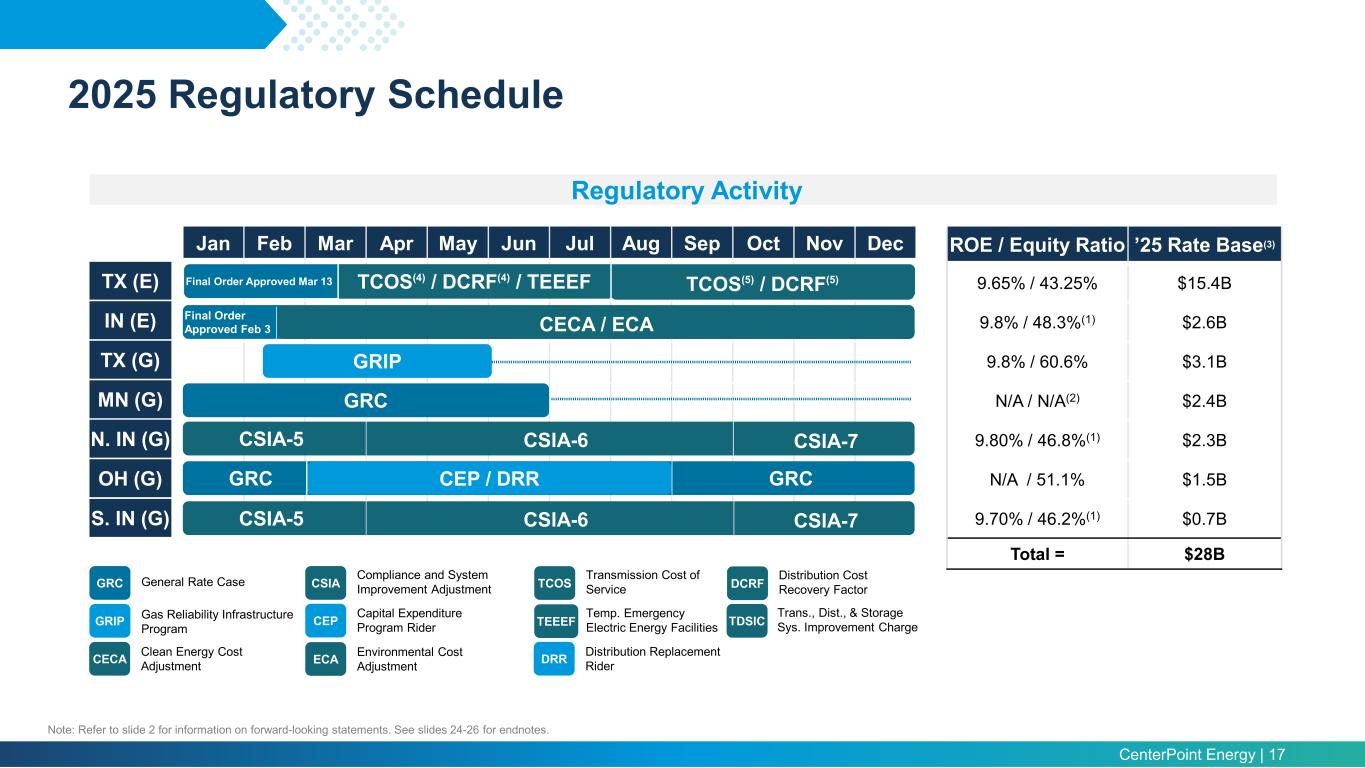
CenterPoint Energy | 17 Jan Feb Mar Apr May Jun Jul Aug Sep Oct Nov Dec TX (E) IN (E) TX (G) MN (G) N. IN (G) OH (G) S. IN (G) ROE / Equity Ratio ’25 Rate Base(3) 9.65% / 43.25% $15.4B 9.8% / 48.3%(1) $2.6B 9.8% / 60.6% $3.1B N/A / N/A(2) $2.4B 9.80% / 46.8%(1) $2.3B N/A / 51.1% $1.5B 9.70% / 46.2%(1) $0.7B Total = $28B Regulatory Activity CSIA-5 GRC GRC General Rate Case Final Order Approved Feb 3 Settlement filed April 23 Final Order Approved Mar 13 GRIP Gas Reliability Infrastructure Program CSIA Compliance and System Improvement Adjustment CEP Capital Expenditure Program Rider GRIP CSIA-6 CSIA-7 CSIA-5 CSIA-6 CSIA-7 TCOS Transmission Cost of Service TEEEF Temp. Emergency Electric Energy Facilities DCRF Distribution Cost Recovery Factor TDSIC Trans., Dist., & Storage Sys. Improvement Charge CECA Clean Energy Cost Adjustment ECA Environmental Cost Adjustment TCOS(5) / DCRF(5)TCOS(4) / DCRF(4) / TEEEF CECA / ECA GRC GRC CEP / DRR DRR Distribution Replacement Rider Note: Refer to slide 2 for information on forward-looking statements. See slides 24-26 for endnotes. 2025 Regulatory Schedule
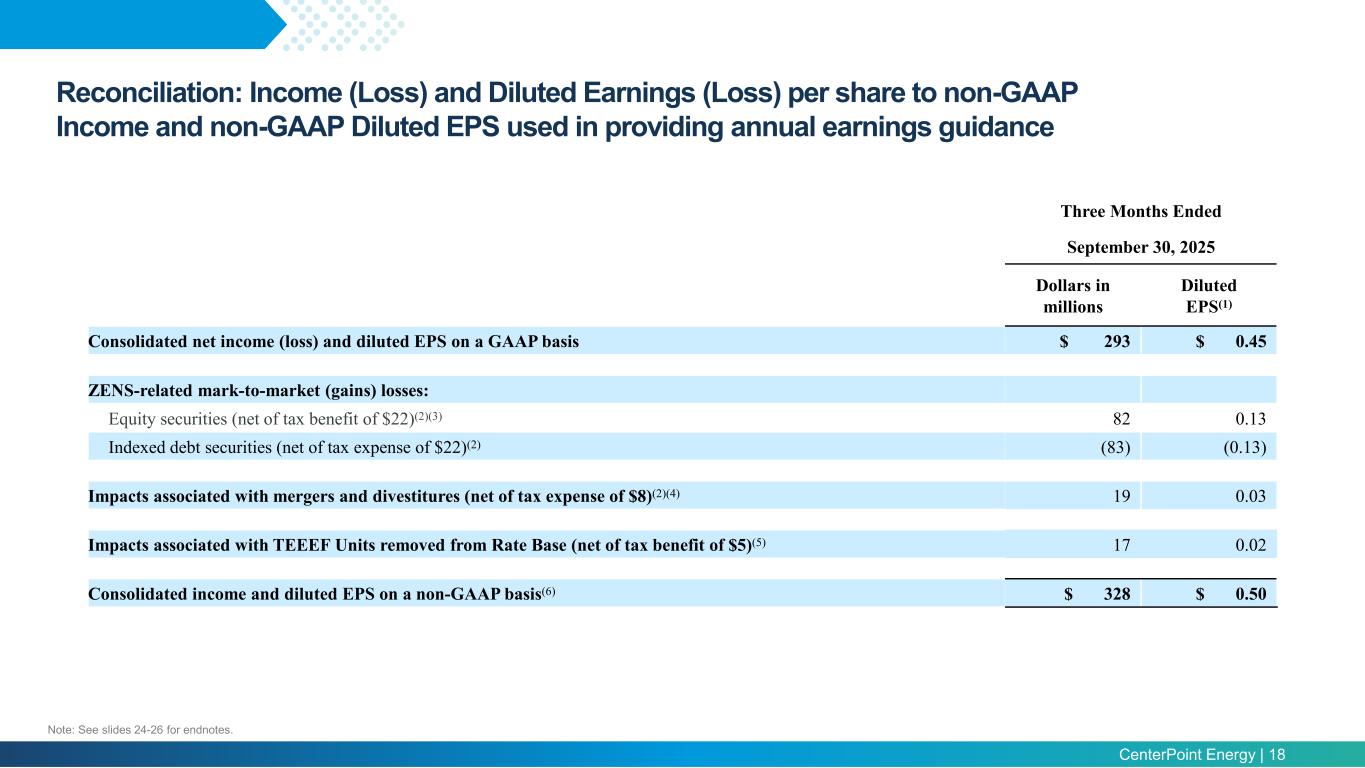
CenterPoint Energy | 18 aaaaaaaaa Three Months Ended September 30, 2025 Dollars in millions Diluted EPS(1) Consolidated net income (loss) and diluted EPS on a GAAP basis $ 293 $ 0.45 ZENS-related mark-to-market (gains) losses: Equity securities (net of tax benefit of $22)(2)(3) 82 0.13 Indexed debt securities (net of tax expense of $22)(2) (83) (0.13) Impacts associated with mergers and divestitures (net of tax expense of $8)(2)(4) 19 0.03 Impacts associated with TEEEF Units removed from Rate Base (net of tax benefit of $5)(5) 17 0.02 Consolidated income and diluted EPS on a non-GAAP basis(6) $ 328 $ 0.50 Reconciliation: Income (Loss) and Diluted Earnings (Loss) per share to non-GAAP Income and non-GAAP Diluted EPS used in providing annual earnings guidance Note: See slides 24-26 for endnotes.
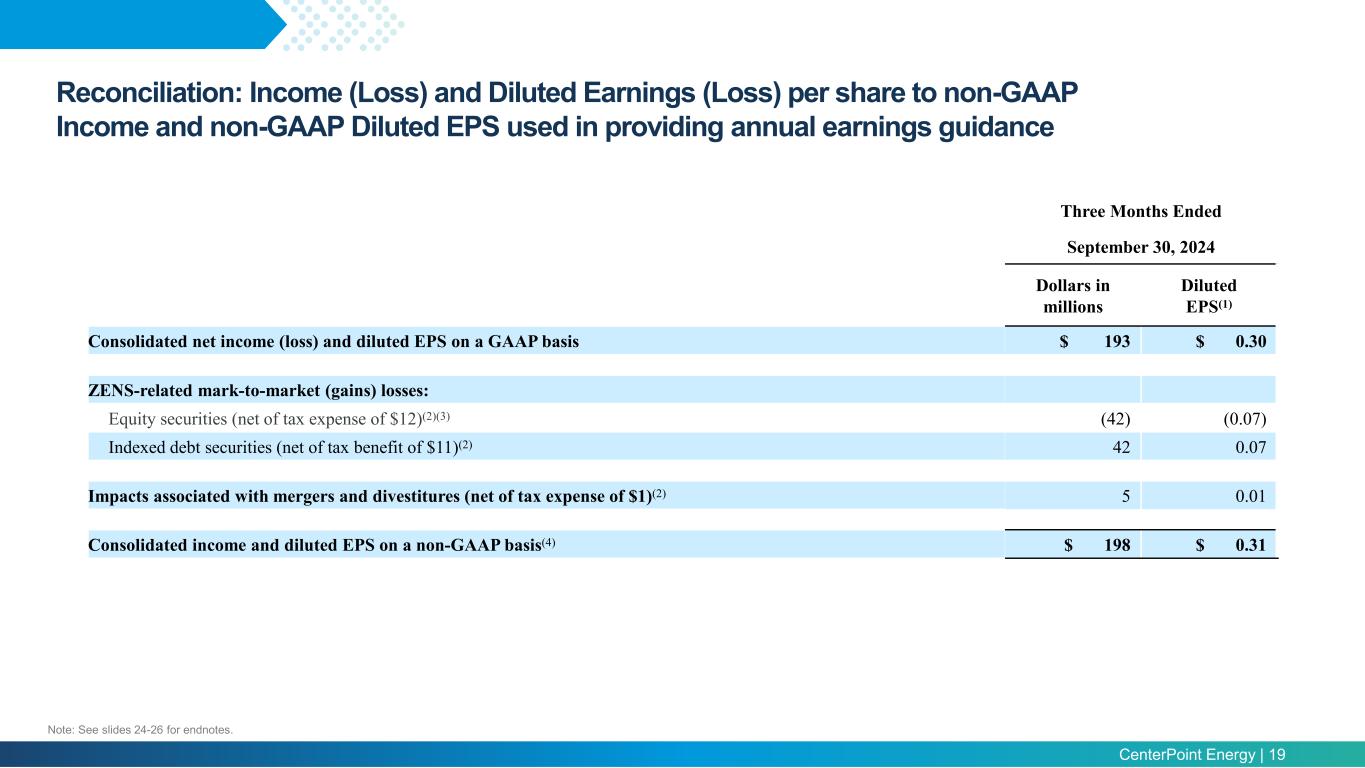
CenterPoint Energy | 19 aaaaaaaaa Three Months Ended September 30, 2024 Dollars in millions Diluted EPS(1) Consolidated net income (loss) and diluted EPS on a GAAP basis $ 193 $ 0.30 ZENS-related mark-to-market (gains) losses: Equity securities (net of tax expense of $12)(2)(3) (42) (0.07) Indexed debt securities (net of tax benefit of $11)(2) 42 0.07 Impacts associated with mergers and divestitures (net of tax expense of $1)(2) 5 0.01 Consolidated income and diluted EPS on a non-GAAP basis(4) $ 198 $ 0.31 Reconciliation: Income (Loss) and Diluted Earnings (Loss) per share to non-GAAP Income and non-GAAP Diluted EPS used in providing annual earnings guidance Note: See slides 24-26 for endnotes.
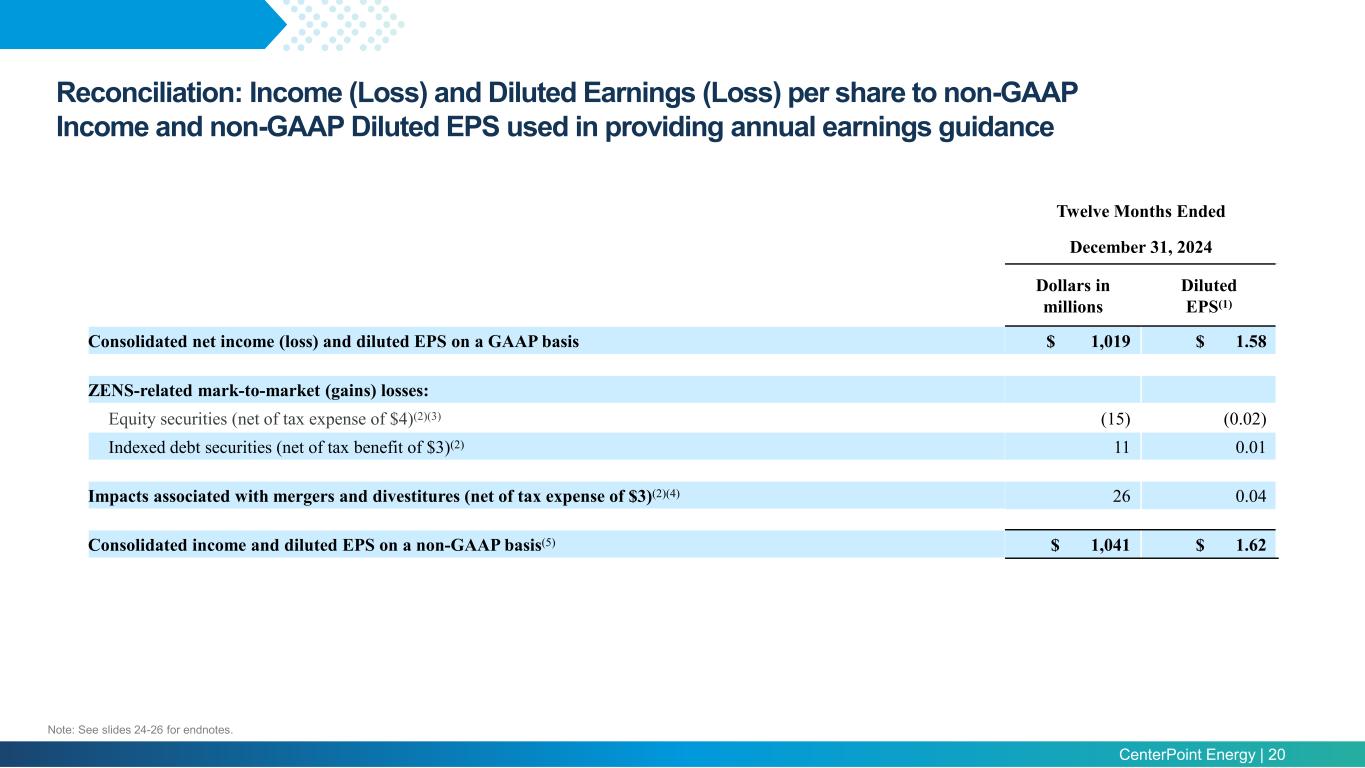
CenterPoint Energy | 20 aaaaaaaaa Reconciliation: Income (Loss) and Diluted Earnings (Loss) per share to non-GAAP Income and non-GAAP Diluted EPS used in providing annual earnings guidance Twelve Months Ended December 31, 2024 Dollars in millions Diluted EPS(1) Consolidated net income (loss) and diluted EPS on a GAAP basis $ 1,019 $ 1.58 ZENS-related mark-to-market (gains) losses: Equity securities (net of tax expense of $4)(2)(3) (15) (0.02) Indexed debt securities (net of tax benefit of $3)(2) 11 0.01 Impacts associated with mergers and divestitures (net of tax expense of $3)(2)(4) 26 0.04 Consolidated income and diluted EPS on a non-GAAP basis(5) $ 1,041 $ 1.62 Note: See slides 24-26 for endnotes.
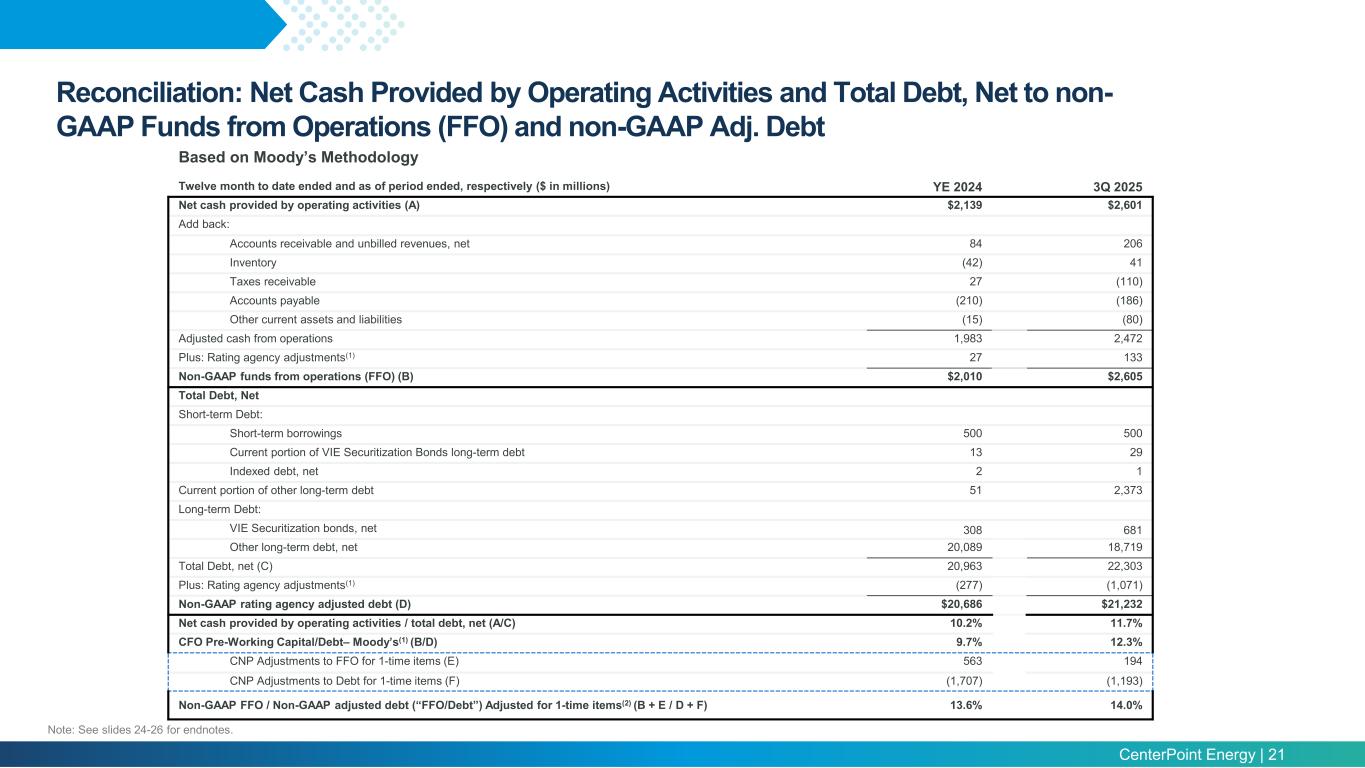
CenterPoint Energy | 21 aaaaaaaaa Twelve month to date ended and as of period ended, respectively ($ in millions) YE 2024 3Q 2025 Net cash provided by operating activities (A) $2,139 $2,601 Add back: Accounts receivable and unbilled revenues, net 84 206 Inventory (42) 41 Taxes receivable 27 (110) Accounts payable (210) (186) Other current assets and liabilities (15) (80) Adjusted cash from operations 1,983 2,472 Plus: Rating agency adjustments(1) 27 133 Non-GAAP funds from operations (FFO) (B) $2,010 $2,605 Total Debt, Net Short-term Debt: Short-term borrowings 500 500 Current portion of VIE Securitization Bonds long-term debt 13 29 Indexed debt, net 2 1 Current portion of other long-term debt 51 2,373 Long-term Debt: VIE Securitization bonds, net 308 681 Other long-term debt, net 20,089 18,719 Total Debt, net (C) 20,963 22,303 Plus: Rating agency adjustments(1) (277) (1,071) Non-GAAP rating agency adjusted debt (D) $20,686 $21,232 Net cash provided by operating activities / total debt, net (A/C) 10.2% 11.7% CFO Pre-Working Capital/Debt– Moody’s(1) (B/D) 9.7% 12.3% CNP Adjustments to FFO for 1-time items (E) 563 194 CNP Adjustments to Debt for 1-time items (F) (1,707) (1,193) Non-GAAP FFO / Non-GAAP adjusted debt (“FFO/Debt”) Adjusted for 1-time items(2) (B + E / D + F) 13.6% 14.0% Based on Moody’s Methodology Reconciliation: Net Cash Provided by Operating Activities and Total Debt, Net to non- GAAP Funds from Operations (FFO) and non-GAAP Adj. Debt Note: See slides 24-26 for endnotes.
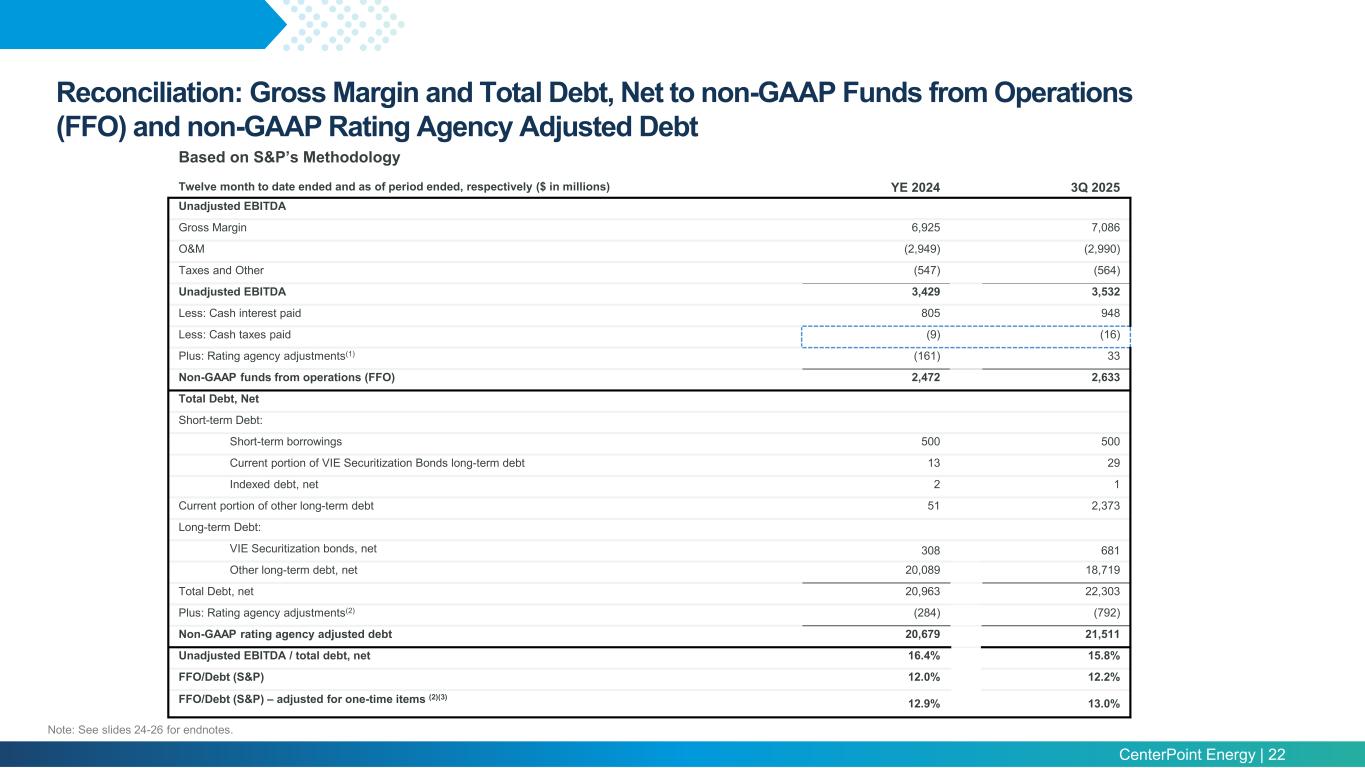
CenterPoint Energy | 22 Reconciliation: Gross Margin and Total Debt, Net to non-GAAP Funds from Operations (FFO) and non-GAAP Rating Agency Adjusted Debt Based on S&P’s Methodology Twelve month to date ended and as of period ended, respectively ($ in millions) YE 2024 3Q 2025 Unadjusted EBITDA Gross Margin 6,925 7,086 O&M (2,949) (2,990) Taxes and Other (547) (564) Unadjusted EBITDA 3,429 3,532 Less: Cash interest paid 805 948 Less: Cash taxes paid (9) (16) Plus: Rating agency adjustments(1) (161) 33 Non-GAAP funds from operations (FFO) 2,472 2,633 Total Debt, Net Short-term Debt: Short-term borrowings 500 500 Current portion of VIE Securitization Bonds long-term debt 13 29 Indexed debt, net 2 1 Current portion of other long-term debt 51 2,373 Long-term Debt: VIE Securitization bonds, net 308 681 Other long-term debt, net 20,089 18,719 Total Debt, net 20,963 22,303 Plus: Rating agency adjustments(2) (284) (792) Non-GAAP rating agency adjusted debt 20,679 21,511 Unadjusted EBITDA / total debt, net 16.4% 15.8% FFO/Debt (S&P) 12.0% 12.2% FFO/Debt (S&P) – adjusted for one-time items (2)(3) 12.9% 13.0% Note: See slides 24-26 for endnotes.
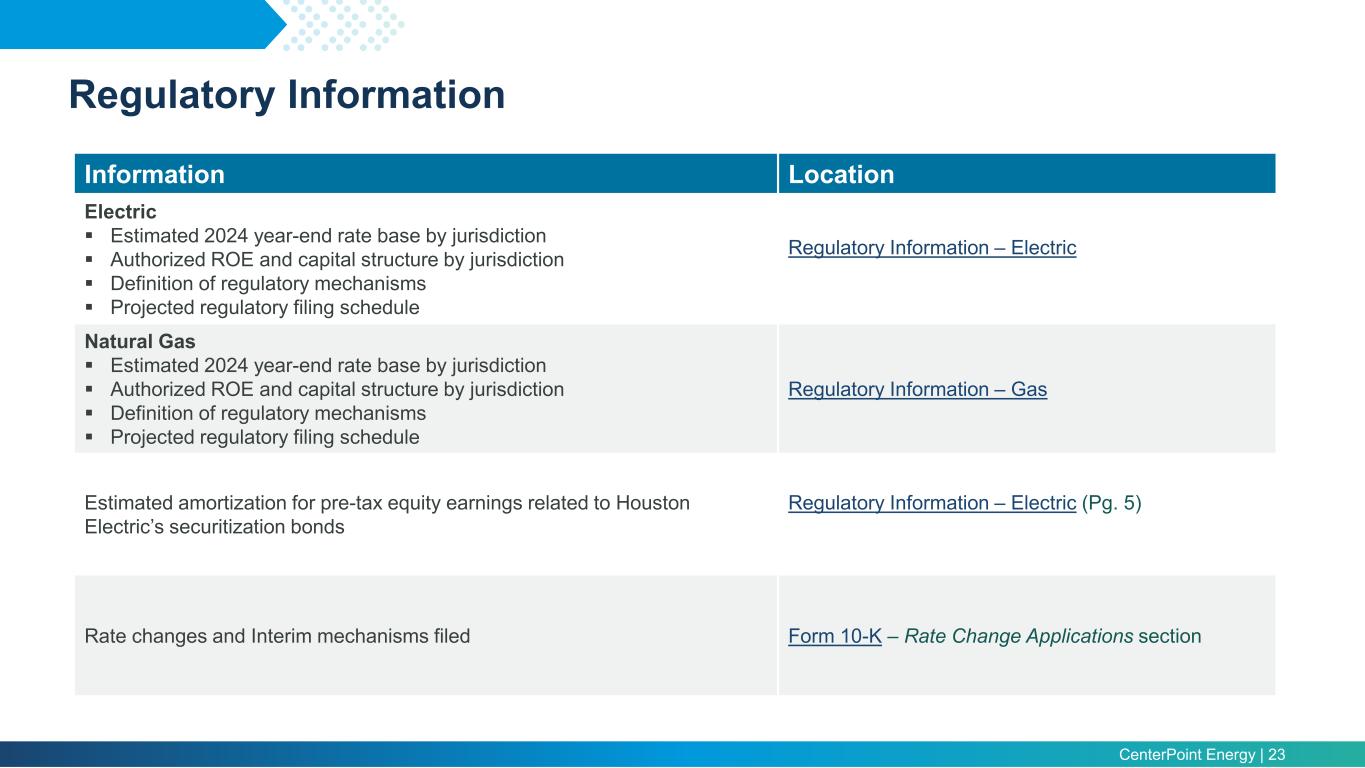
CenterPoint Energy | 23 aaaaaaaaa Information Location Electric Estimated 2024 year-end rate base by jurisdiction Authorized ROE and capital structure by jurisdiction Definition of regulatory mechanisms Projected regulatory filing schedule Regulatory Information – Electric Natural Gas Estimated 2024 year-end rate base by jurisdiction Authorized ROE and capital structure by jurisdiction Definition of regulatory mechanisms Projected regulatory filing schedule Regulatory Information – Gas Estimated amortization for pre-tax equity earnings related to Houston Electric’s securitization bonds Regulatory Information – Electric (Pg. 5) Rate changes and Interim mechanisms filed Form 10-K – Rate Change Applications section Regulatory Information
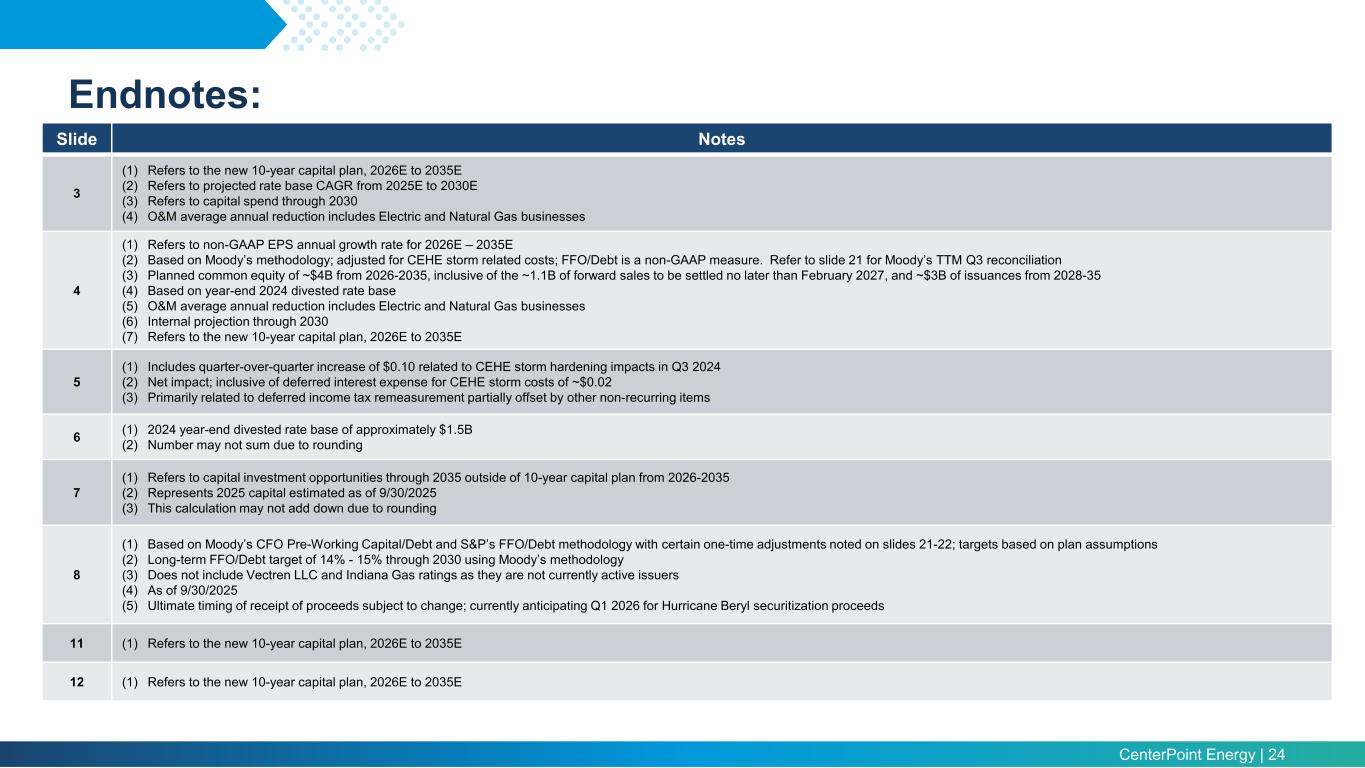
CenterPoint Energy | 24 Endnotes: Slide Notes 3 (1) Refers to the new 10-year capital plan, 2026E to 2035E (2) Refers to projected rate base CAGR from 2025E to 2030E (3) Refers to capital spend through 2030 (4) O&M average annual reduction includes Electric and Natural Gas businesses 4 (1) Refers to non-GAAP EPS annual growth rate for 2026E – 2035E (2) Based on Moody’s methodology; adjusted for CEHE storm related costs; FFO/Debt is a non-GAAP measure. Refer to slide 21 for Moody’s TTM Q3 reconciliation (3) Planned common equity of ~$4B from 2026-2035, inclusive of the ~1.1B of forward sales to be settled no later than February 2027, and ~$3B of issuances from 2028-35 (4) Based on year-end 2024 divested rate base (5) O&M average annual reduction includes Electric and Natural Gas businesses (6) Internal projection through 2030 (7) Refers to the new 10-year capital plan, 2026E to 2035E 5 (1) Includes quarter-over-quarter increase of $0.10 related to CEHE storm hardening impacts in Q3 2024 (2) Net impact; inclusive of deferred interest expense for CEHE storm costs of ~$0.02 (3) Primarily related to deferred income tax remeasurement partially offset by other non-recurring items 6 (1) 2024 year-end divested rate base of approximately $1.5B (2) Number may not sum due to rounding 7 (1) Refers to capital investment opportunities through 2035 outside of 10-year capital plan from 2026-2035 (2) Represents 2025 capital estimated as of 9/30/2025 (3) This calculation may not add down due to rounding 8 (1) Based on Moody’s CFO Pre-Working Capital/Debt and S&P’s FFO/Debt methodology with certain one-time adjustments noted on slides 21-22; targets based on plan assumptions (2) Long-term FFO/Debt target of 14% - 15% through 2030 using Moody’s methodology (3) Does not include Vectren LLC and Indiana Gas ratings as they are not currently active issuers (4) As of 9/30/2025 (5) Ultimate timing of receipt of proceeds subject to change; currently anticipating Q1 2026 for Hurricane Beryl securitization proceeds 11 (1) Refers to the new 10-year capital plan, 2026E to 2035E 12 (1) Refers to the new 10-year capital plan, 2026E to 2035E
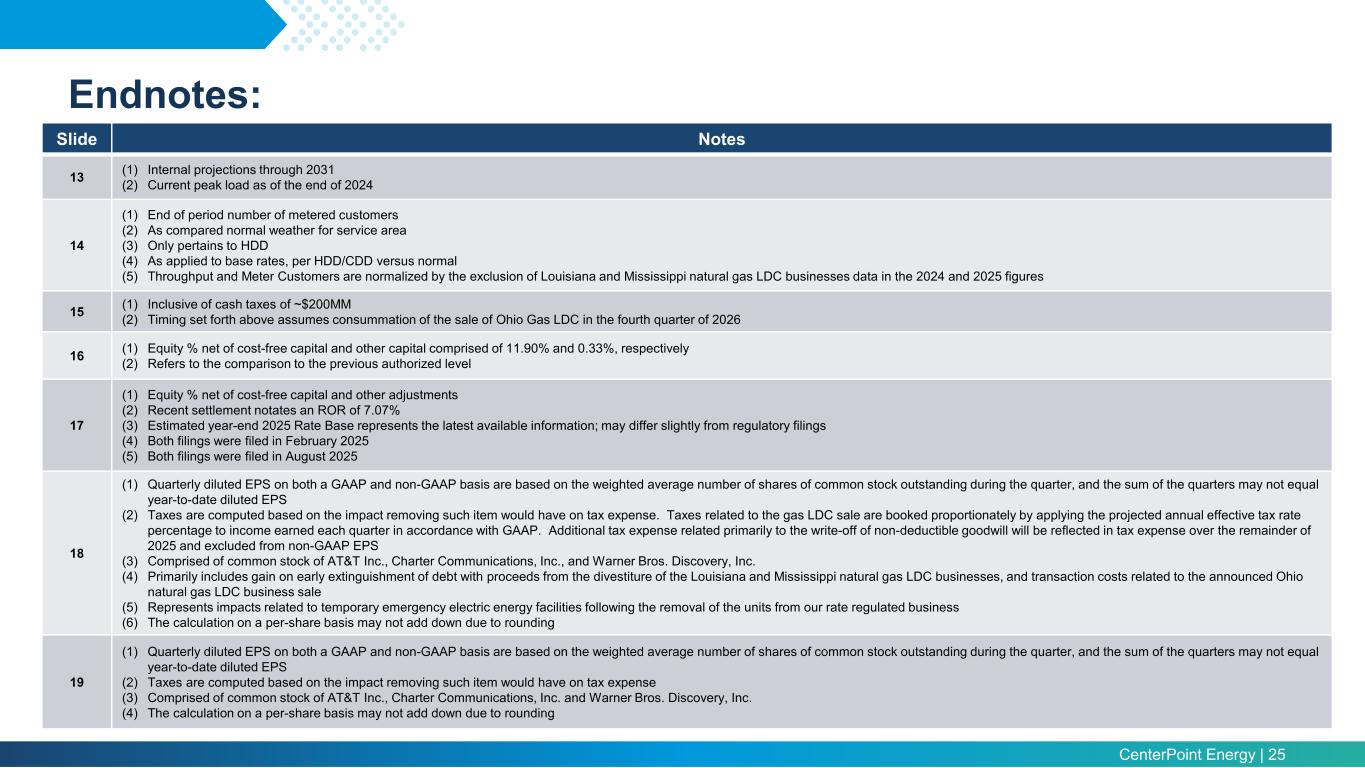
CenterPoint Energy | 25 Endnotes: Slide Notes 13 (1) Internal projections through 2031 (2) Current peak load as of the end of 2024 14 (1) End of period number of metered customers (2) As compared normal weather for service area (3) Only pertains to HDD (4) As applied to base rates, per HDD/CDD versus normal (5) Throughput and Meter Customers are normalized by the exclusion of Louisiana and Mississippi natural gas LDC businesses data in the 2024 and 2025 figures 15 (1) Inclusive of cash taxes of ~$200MM (2) Timing set forth above assumes consummation of the sale of Ohio Gas LDC in the fourth quarter of 2026 16 (1) Equity % net of cost-free capital and other capital comprised of 11.90% and 0.33%, respectively (2) Refers to the comparison to the previous authorized level 17 (1) Equity % net of cost-free capital and other adjustments (2) Recent settlement notates an ROR of 7.07% (3) Estimated year-end 2025 Rate Base represents the latest available information; may differ slightly from regulatory filings (4) Both filings were filed in February 2025 (5) Both filings were filed in August 2025 18 (1) Quarterly diluted EPS on both a GAAP and non-GAAP basis are based on the weighted average number of shares of common stock outstanding during the quarter, and the sum of the quarters may not equal year-to-date diluted EPS (2) Taxes are computed based on the impact removing such item would have on tax expense. Taxes related to the gas LDC sale are booked proportionately by applying the projected annual effective tax rate percentage to income earned each quarter in accordance with GAAP. Additional tax expense related primarily to the write-off of non-deductible goodwill will be reflected in tax expense over the remainder of 2025 and excluded from non-GAAP EPS (3) Comprised of common stock of AT&T Inc., Charter Communications, Inc., and Warner Bros. Discovery, Inc. (4) Primarily includes gain on early extinguishment of debt with proceeds from the divestiture of the Louisiana and Mississippi natural gas LDC businesses, and transaction costs related to the announced Ohio natural gas LDC business sale (5) Represents impacts related to temporary emergency electric energy facilities following the removal of the units from our rate regulated business (6) The calculation on a per-share basis may not add down due to rounding 19 (1) Quarterly diluted EPS on both a GAAP and non-GAAP basis are based on the weighted average number of shares of common stock outstanding during the quarter, and the sum of the quarters may not equal year-to-date diluted EPS (2) Taxes are computed based on the impact removing such item would have on tax expense (3) Comprised of common stock of AT&T Inc., Charter Communications, Inc. and Warner Bros. Discovery, Inc. (4) The calculation on a per-share basis may not add down due to rounding
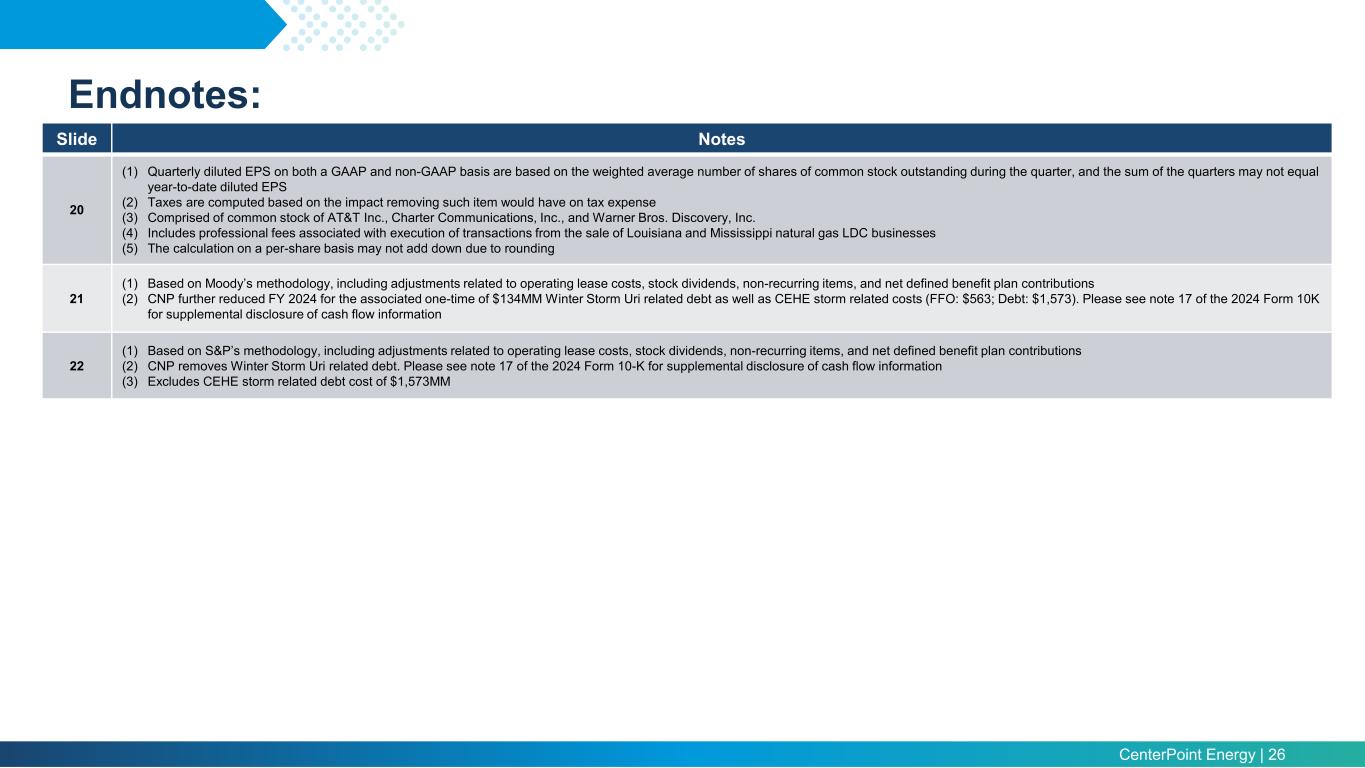
CenterPoint Energy | 26 Endnotes: Slide Notes 20 (1) Quarterly diluted EPS on both a GAAP and non-GAAP basis are based on the weighted average number of shares of common stock outstanding during the quarter, and the sum of the quarters may not equal year-to-date diluted EPS (2) Taxes are computed based on the impact removing such item would have on tax expense (3) Comprised of common stock of AT&T Inc., Charter Communications, Inc., and Warner Bros. Discovery, Inc. (4) Includes professional fees associated with execution of transactions from the sale of Louisiana and Mississippi natural gas LDC businesses (5) The calculation on a per-share basis may not add down due to rounding 21 (1) Based on Moody’s methodology, including adjustments related to operating lease costs, stock dividends, non-recurring items, and net defined benefit plan contributions (2) CNP further reduced FY 2024 for the associated one-time of $134MM Winter Storm Uri related debt as well as CEHE storm related costs (FFO: $563; Debt: $1,573). Please see note 17 of the 2024 Form 10K for supplemental disclosure of cash flow information 22 (1) Based on S&P’s methodology, including adjustments related to operating lease costs, stock dividends, non-recurring items, and net defined benefit plan contributions (2) CNP removes Winter Storm Uri related debt. Please see note 17 of the 2024 Form 10-K for supplemental disclosure of cash flow information (3) Excludes CEHE storm related debt cost of $1,573MM
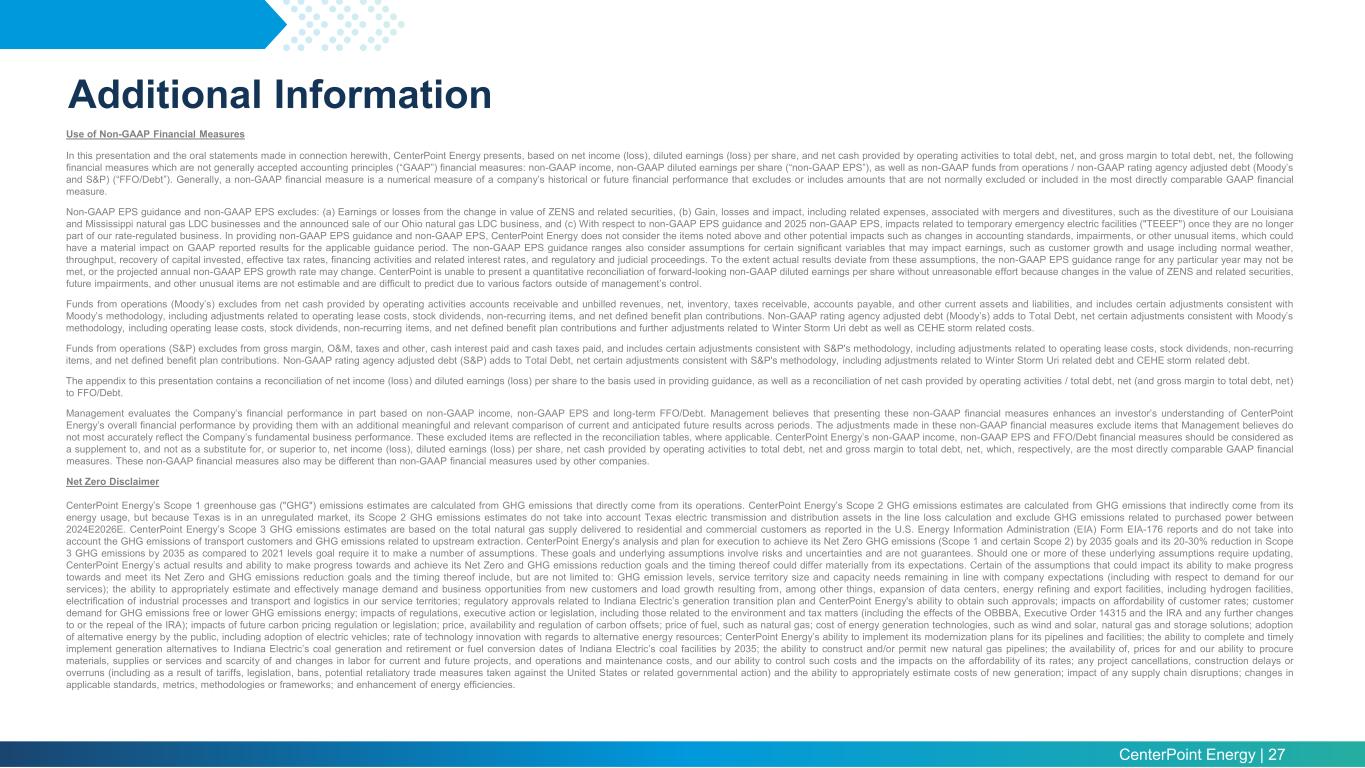
CenterPoint Energy | 27 Additional Information Use of Non-GAAP Financial Measures In this presentation and the oral statements made in connection herewith, CenterPoint Energy presents, based on net income (loss), diluted earnings (loss) per share, and net cash provided by operating activities to total debt, net, and gross margin to total debt, net, the following financial measures which are not generally accepted accounting principles (“GAAP”) financial measures: non-GAAP income, non-GAAP diluted earnings per share (“non-GAAP EPS”), as well as non-GAAP funds from operations / non-GAAP rating agency adjusted debt (Moody’s and S&P) (“FFO/Debt”). Generally, a non-GAAP financial measure is a numerical measure of a company’s historical or future financial performance that excludes or includes amounts that are not normally excluded or included in the most directly comparable GAAP financial measure. Non-GAAP EPS guidance and non-GAAP EPS excludes: (a) Earnings or losses from the change in value of ZENS and related securities, (b) Gain, losses and impact, including related expenses, associated with mergers and divestitures, such as the divestiture of our Louisiana and Mississippi natural gas LDC businesses and the announced sale of our Ohio natural gas LDC business, and (c) With respect to non-GAAP EPS guidance and 2025 non-GAAP EPS, impacts related to temporary emergency electric facilities ("TEEEF") once they are no longer part of our rate-regulated business. In providing non-GAAP EPS guidance and non-GAAP EPS, CenterPoint Energy does not consider the items noted above and other potential impacts such as changes in accounting standards, impairments, or other unusual items, which could have a material impact on GAAP reported results for the applicable guidance period. The non-GAAP EPS guidance ranges also consider assumptions for certain significant variables that may impact earnings, such as customer growth and usage including normal weather, throughput, recovery of capital invested, effective tax rates, financing activities and related interest rates, and regulatory and judicial proceedings. To the extent actual results deviate from these assumptions, the non-GAAP EPS guidance range for any particular year may not be met, or the projected annual non-GAAP EPS growth rate may change. CenterPoint is unable to present a quantitative reconciliation of forward-looking non-GAAP diluted earnings per share without unreasonable effort because changes in the value of ZENS and related securities, future impairments, and other unusual items are not estimable and are difficult to predict due to various factors outside of management’s control. Funds from operations (Moody’s) excludes from net cash provided by operating activities accounts receivable and unbilled revenues, net, inventory, taxes receivable, accounts payable, and other current assets and liabilities, and includes certain adjustments consistent with Moody’s methodology, including adjustments related to operating lease costs, stock dividends, non-recurring items, and net defined benefit plan contributions. Non-GAAP rating agency adjusted debt (Moody’s) adds to Total Debt, net certain adjustments consistent with Moody’s methodology, including operating lease costs, stock dividends, non-recurring items, and net defined benefit plan contributions and further adjustments related to Winter Storm Uri debt as well as CEHE storm related costs. Funds from operations (S&P) excludes from gross margin, O&M, taxes and other, cash interest paid and cash taxes paid, and includes certain adjustments consistent with S&P's methodology, including adjustments related to operating lease costs, stock dividends, non-recurring items, and net defined benefit plan contributions. Non-GAAP rating agency adjusted debt (S&P) adds to Total Debt, net certain adjustments consistent with S&P's methodology, including adjustments related to Winter Storm Uri related debt and CEHE storm related debt. The appendix to this presentation contains a reconciliation of net income (loss) and diluted earnings (loss) per share to the basis used in providing guidance, as well as a reconciliation of net cash provided by operating activities / total debt, net (and gross margin to total debt, net) to FFO/Debt. Management evaluates the Company’s financial performance in part based on non-GAAP income, non-GAAP EPS and long-term FFO/Debt. Management believes that presenting these non-GAAP financial measures enhances an investor’s understanding of CenterPoint Energy’s overall financial performance by providing them with an additional meaningful and relevant comparison of current and anticipated future results across periods. The adjustments made in these non-GAAP financial measures exclude items that Management believes do not most accurately reflect the Company’s fundamental business performance. These excluded items are reflected in the reconciliation tables, where applicable. CenterPoint Energy’s non-GAAP income, non-GAAP EPS and FFO/Debt financial measures should be considered as a supplement to, and not as a substitute for, or superior to, net income (loss), diluted earnings (loss) per share, net cash provided by operating activities to total debt, net and gross margin to total debt, net, which, respectively, are the most directly comparable GAAP financial measures. These non-GAAP financial measures also may be different than non-GAAP financial measures used by other companies. Net Zero Disclaimer CenterPoint Energy’s Scope 1 greenhouse gas ("GHG") emissions estimates are calculated from GHG emissions that directly come from its operations. CenterPoint Energy’s Scope 2 GHG emissions estimates are calculated from GHG emissions that indirectly come from its energy usage, but because Texas is in an unregulated market, its Scope 2 GHG emissions estimates do not take into account Texas electric transmission and distribution assets in the line loss calculation and exclude GHG emissions related to purchased power between 2024E2026E. CenterPoint Energy’s Scope 3 GHG emissions estimates are based on the total natural gas supply delivered to residential and commercial customers as reported in the U.S. Energy Information Administration (EIA) Form EIA-176 reports and do not take into account the GHG emissions of transport customers and GHG emissions related to upstream extraction. CenterPoint Energy's analysis and plan for execution to achieve its Net Zero GHG emissions (Scope 1 and certain Scope 2) by 2035 goals and its 20-30% reduction in Scope 3 GHG emissions by 2035 as compared to 2021 levels goal require it to make a number of assumptions. These goals and underlying assumptions involve risks and uncertainties and are not guarantees. Should one or more of these underlying assumptions require updating, CenterPoint Energy’s actual results and ability to make progress towards and achieve its Net Zero and GHG emissions reduction goals and the timing thereof could differ materially from its expectations. Certain of the assumptions that could impact its ability to make progress towards and meet its Net Zero and GHG emissions reduction goals and the timing thereof include, but are not limited to: GHG emission levels, service territory size and capacity needs remaining in line with company expectations (including with respect to demand for our services); the ability to appropriately estimate and effectively manage demand and business opportunities from new customers and load growth resulting from, among other things, expansion of data centers, energy refining and export facilities, including hydrogen facilities, electrification of industrial processes and transport and logistics in our service territories; regulatory approvals related to Indiana Electric’s generation transition plan and CenterPoint Energy's ability to obtain such approvals; impacts on affordability of customer rates; customer demand for GHG emissions free or lower GHG emissions energy; impacts of regulations, executive action or legislation, including those related to the environment and tax matters (including the effects of the OBBBA, Executive Order 14315 and the IRA and any further changes to or the repeal of the IRA); impacts of future carbon pricing regulation or legislation; price, availability and regulation of carbon offsets; price of fuel, such as natural gas; cost of energy generation technologies, such as wind and solar, natural gas and storage solutions; adoption of alternative energy by the public, including adoption of electric vehicles; rate of technology innovation with regards to alternative energy resources; CenterPoint Energy’s ability to implement its modernization plans for its pipelines and facilities; the ability to complete and timely implement generation alternatives to Indiana Electric’s coal generation and retirement or fuel conversion dates of Indiana Electric’s coal facilities by 2035; the ability to construct and/or permit new natural gas pipelines; the availability of, prices for and our ability to procure materials, supplies or services and scarcity of and changes in labor for current and future projects, and operations and maintenance costs, and our ability to control such costs and the impacts on the affordability of its rates; any project cancellations, construction delays or overruns (including as a result of tariffs, legislation, bans, potential retaliatory trade measures taken against the United States or related governmental action) and the ability to appropriately estimate costs of new generation; impact of any supply chain disruptions; changes in applicable standards, metrics, methodologies or frameworks; and enhancement of energy efficiencies.