As filed with the U.S. Securities and Exchange Commission on September 20, 2024.
Registration No. 333-275939
UNITED STATES
SECURITIES AND EXCHANGE COMMISSION
Washington, D.C. 20549
Amendment No. 2
to
FORM S-1
REGISTRATION STATEMENT
UNDER
THE SECURITIES ACT OF 1933
Hornbeck Offshore Services, Inc.
(Exact name of registrant as specified in its charter)
| Delaware | 4424 | 72-1375844 | ||
| (State or other jurisdiction of incorporation or organization) |
(Primary Standard Industrial Classification Code Number) |
(I.R.S. Employer Identification No.) |
103 Northpark Boulevard, Suite 300
Covington, Louisiana 70433
Telephone: (985) 727-2000
(Address, including zip code, and telephone number, including area code, of registrant’s principal executive offices)
Todd M. Hornbeck
Chairman of the Board, President and Chief Executive Officer
103 Northpark Boulevard, Suite 300
Covington, Louisiana 70433
Telephone: (985) 727-2000
(Name, address, including zip code, and telephone number, including area code, of agent for service)
With copies to:
| Matthew R. Pacey, P.C. Ieuan A. List Kirkland & Ellis LLP 609 Main Street Houston, TX 77002 (713) 836-3786 |
T. Mark Kelly E. Ramey Layne Vinson & Elkins LLP |
Approximate date of commencement of proposed sale to the public: As soon as practicable after this Registration Statement is declared effective.
If any of the securities being registered on this Form are to be offered on a delayed or continuous basis pursuant to Rule 415 under the Securities Act of 1933 check the following box: ☐
If this Form is filed to register additional securities for an offering pursuant to Rule 462(b) under the Securities Act, please check the following box and list the Securities Act registration statement number of the earlier effective registration statement for the same offering. ☐
If this Form is a post-effective amendment filed pursuant to Rule 462(c) under the Securities Act, check the following box and list the Securities Act registration statement number of the earlier effective registration statement for the same offering. ☐
If this Form is a post-effective amendment filed pursuant to Rule 462(d) under the Securities Act, check the following box and list the Securities Act registration statement number of the earlier effective registration statement for the same offering. ☐
Indicate by check mark whether the registrant is a large accelerated filer, an accelerated filer, a non-accelerated filer, smaller reporting company, or an emerging growth company. See the definitions of “large accelerated filer,” “accelerated filer,” “smaller reporting company,” and “emerging growth company” in Rule 12b-2 of the Exchange Act.
| Large accelerated filer | ☐ | Accelerated filer | ☐ | |||
| Non-accelerated filer | ☒ | Smaller reporting company | ☐ | |||
| Emerging growth company | ☐ | |||||
If an emerging growth company, indicate by check mark if the registrant has elected not to use the extended transition period for complying with any new or revised financial accounting standards provided pursuant to Section 7(a)(2)(B) of the Securities Act. ☐
The registrant hereby amends this registration statement on such date or dates as may be necessary to delay its effective date until the registrant shall file a further amendment which specifically states that this registration statement shall thereafter become effective in accordance with Section 8(a) of the Securities Act of 1933, as amended, or until this registration statement shall become effective on such date as the Securities and Exchange Commission, acting pursuant to said Section 8(a), may determine.
The information in this prospectus is not complete and may be changed. We may not sell these securities until the registration statement filed with the Securities and Exchange Commission is effective. This prospectus is not an offer to sell these securities and it is not soliciting an offer to buy these securities in any jurisdiction where the offer or sale is not permitted.
Subject to Completion, dated , 2024
PROSPECTUS
Shares

Hornbeck Offshore Services, Inc.
Common Stock
This is an initial public offering of shares of our common stock, $0.00001 par value per share. We are offering shares of our common stock. Certain selling stockholders identified in this prospectus are offering shares of our common stock.
Prior to this offering, there has been no public market for our common stock. We estimate that the initial public offering price per share will be between $ and $ . See “Underwriting (Conflicts of Interest)” for a discussion of the factors to be considered in determining the initial offering price. We have applied to list our common stock on the New York Stock Exchange (the “NYSE”) under the symbol “HOS.”
Investing in shares of our common stock involves significant risks. See “Risk Factors” beginning on page 31.
By participating in this offering, you are representing that you are a citizen of the United States, as defined in the Jones Act (as defined herein). The Jones Act requires that at least 75% of the outstanding shares of each class or series of our capital stock must be owned and controlled by U.S. citizens and, in order to provide a reasonable margin for compliance with this requirement, our amended and restated certificate of incorporation will provide that all non-U.S. citizens in the aggregate may not own more than 21% of the outstanding shares of our common stock, with certain limited grandfathered circumstances allowing up to 24% of the outstanding shares of our common stock to be owned by non-U.S. citizens on and after the effective date of the initial public offering. Failure to comply with the Jones Act could cause us to lose the privilege of owning and operating vessels in the coastwise trade. Accordingly, our common stock is subject to limitations on foreign ownership and possible required divestiture by non-U.S. citizen stockholders. See “Description of Capital Stock and Warrants—Limitations on Ownership by Non-U.S. Citizens” and “Risk Factors—Our common stock is subject to restrictions on foreign ownership and possible required divestiture by non-U.S. citizen stockholders.”
Neither the Securities and Exchange Commission nor any other regulatory body has approved or disapproved of these securities or passed upon the adequacy or accuracy of this prospectus. Any representation to the contrary is a criminal offense.
| Per Share | Total | |||||||
| Initial public offering price |
$ | $ | ||||||
| Underwriting discounts and commissions(1) |
$ | $ | ||||||
| Proceeds, before expenses, to us |
$ | $ | ||||||
| Proceeds, before expenses, to the selling stockholders |
$ | $ | ||||||
| (1) | We have agreed to reimburse the underwriters for certain expenses. See “Underwriting (Conflicts of Interest).” |
At our request, the underwriters have reserved up to 5% of the shares of common stock offered by the prospectus for sale, at the initial public offering price, to certain individuals associated with us. See “Underwriting (Conflicts of Interest)—Directed Share Program.”
The selling stockholders have granted the underwriters an option for a period of 30 days from the date of this prospectus to purchase up to an additional shares of our common stock at the initial public offering price, less the underwriting discounts and commissions. We will not receive any proceeds from the sale of shares of our common stock by the selling stockholders, including upon the sale of shares of our common stock by the selling stockholders if the underwriters exercise their option.
Highbridge Capital Management LLC, a holder of approximately 10.6% of the outstanding shares of our common stock, is an indirect subsidiary of J.P. Morgan Chase & Co. and will receive greater than 5% of the net proceeds of this offering. Accordingly, J.P. Morgan Chase & Co. is deemed to have a “conflict of interest” under Rule 5121 of the Financial Industry Regulatory Authority, or FINRA, and this offering is being conducted in accordance with the applicable provisions of FINRA Rule 5121, including the requirement that a “qualified independent underwriter” participate in the preparation of the prospectus and exercise the usual standards of due diligence in connection with such participation. Barclays Capital Inc. has agreed to serve as the qualified independent underwriter for this offering. See “Underwriting (Conflicts of Interest).”
The underwriters expect to deliver the shares of common stock to purchasers on or about , 2024.
| J.P. Morgan | Barclays | |||
| Goldman Sachs | DNB Markets | Piper Sandler | Guggenheim Securities | Raymond James |
| BTIG | Johnson Rice & Company | Pickering Energy Partners | Seaport Global Securities | |||||
| Academy Securities | Drexel Hamilton | |||||||
Prospectus dated , 2024
| Page | ||||
| x | ||||
| 1 | ||||
| 31 | ||||
| 64 | ||||
| 65 | ||||
| 66 | ||||
| 68 | ||||
| MANAGEMENT’S DISCUSSION AND ANALYSIS OF FINANCIAL CONDITION AND RESULTS OF OPERATIONS |
70 | |||
| 104 | ||||
| 132 | ||||
| 141 | ||||
| 165 | ||||
| 169 | ||||
| 172 | ||||
| 179 | ||||
| MATERIAL U.S. FEDERAL INCOME TAX CONSIDERATIONS FOR NON-U.S. HOLDERS |
182 | |||
| 187 | ||||
| 194 | ||||
| 194 | ||||
| 194 | ||||
| F-1 | ||||
Through and including , 2024 (the 25th day after the date of this prospectus), all dealers effecting transactions in these securities, whether or not participating in this offering, may be required to deliver a prospectus. This is in addition to a dealer’s obligation to deliver a prospectus when acting as an underwriter and with respect to an unsold allotment or subscription.
Neither we, the selling stockholders, nor the underwriters (and any of our or their affiliates) have done anything that would permit this offering or possession or distribution of this prospectus in any jurisdiction where action for that purpose is required, other than in the United States. Persons outside the United States who obtain this prospectus must inform themselves about, and observe any restrictions relating to, the offering of the shares of common stock and the distribution of this prospectus outside of the United States.
i
COMMONLY USED DEFINED TERMS
As used in this prospectus, unless the context indicates or otherwise requires, the terms listed below have the following meanings:
“2024 Omnibus Incentive Plan” means Hornbeck Offshore Services, Inc. 2024 Omnibus Incentive Plan, the form of which is attached as Exhibit 10.4;
“2020 Management Incentive Plan” means the 2020 Management Incentive Plan of Hornbeck Offshore Services, Inc., a copy of which is attached as Exhibit 10.2, as amended by that certain First Amendment to 2020 Management Incentive Plan of Hornbeck Offshore Services, Inc. a copy of which is attached as Exhibit 10.3;
“Annual Financial Statements” means the audited consolidated financial statements of Hornbeck Offshore Services, Inc. at December 31, 2023 and 2022, and for the years ended December 31, 2023, 2022 and 2021;
“Ares” means Ares Management LLC;
“ASC” means Financial Accounting Standards Board Accounting Standards Codification;
“Chapter 11 Cases” means the Company’s Chapter 11 cases in the United States Bankruptcy Court for the Southern District of Texas, Houston Division, or the Bankruptcy Court, consummated September 4, 2020;
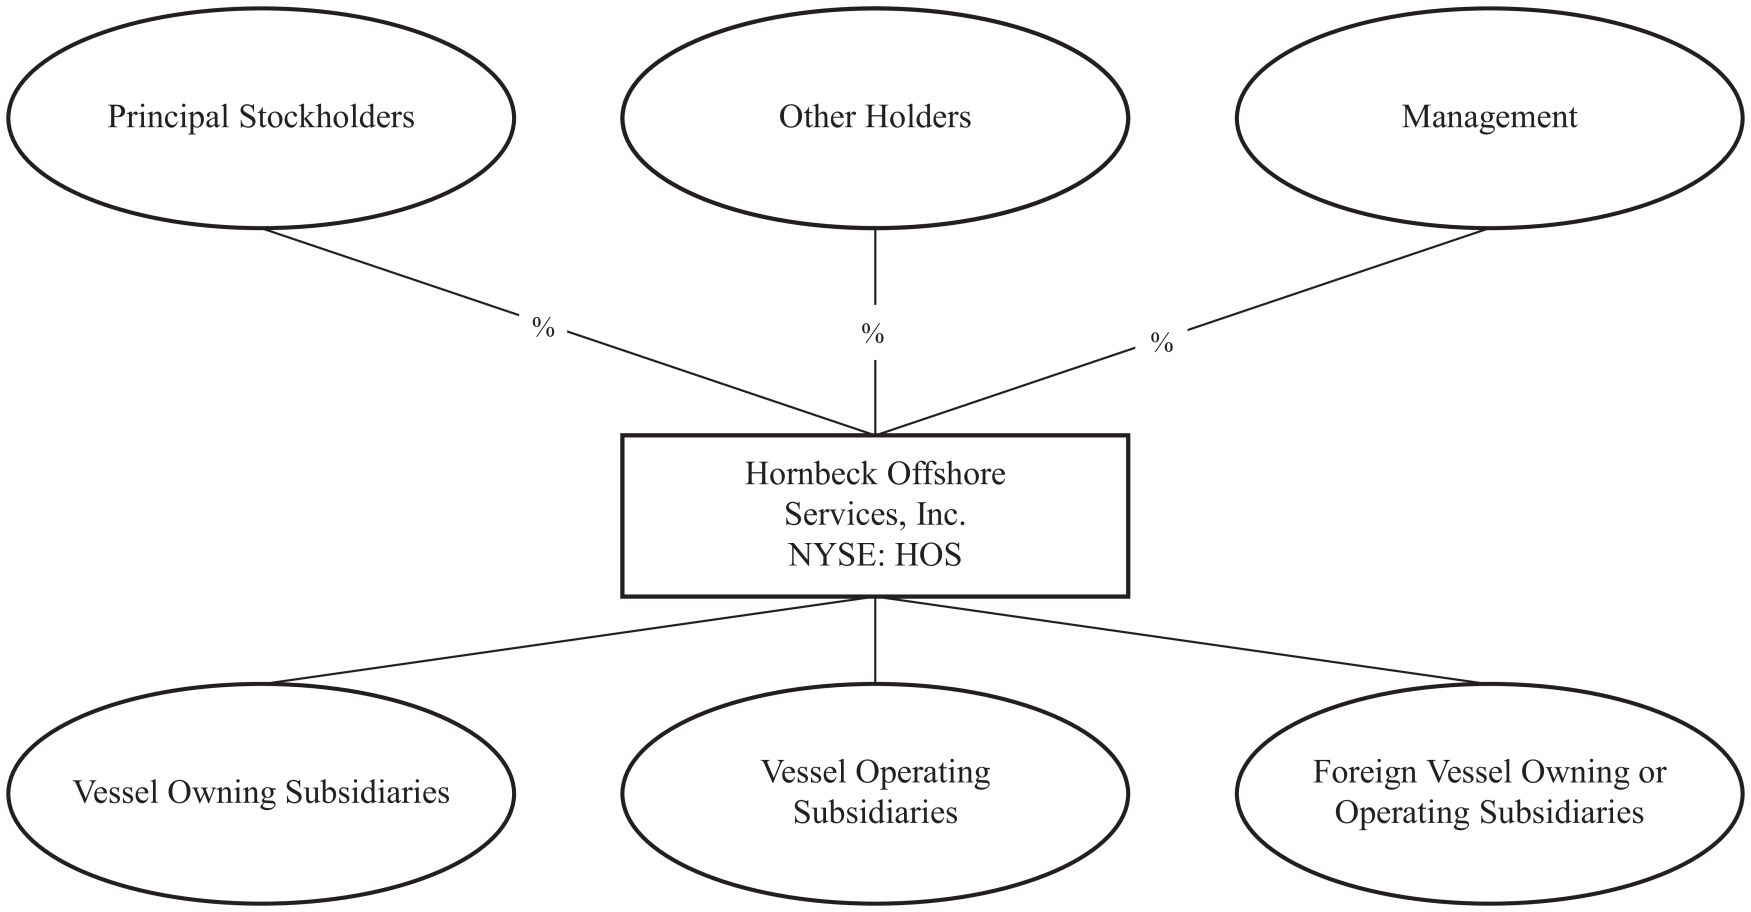
“Company,” “Hornbeck,” “we,” “our” or “us” means, unless otherwise indicated or the context otherwise requires, Hornbeck Offshore Services, Inc., a Delaware corporation, and its consolidated subsidiaries;
“Credit Agreement Closing Date” means the closing date of the First Lien Credit Agreement;
“Creditor Warrants” means those certain warrants issued to certain claimants in settlement of certain pre-Chapter 11 Cases liabilities;
“Eastern” means Eastern Shipbuilding Group, Inc.;
“ECO” means Edison Chouest Offshore;
“ECO Acquisitions” means the ECO Acquisitions #1 and the ECO Acquisitions #2;
“ECO Acquisitions #1” means the acquisition of six high-spec OSVs effected pursuant to the definitive purchase agreements the Company entered into with certain affiliates of ECO on January 10, 2022, as amended;
“ECO Acquisitions #2” means the acquisition of six high-spec OSVs effected as contemplated by the controlling purchase agreement the Company entered into with Nautical, an ECO affiliate, on December 22, 2022, as subsequently divided into separate agreements and as each was amended;
“Financial Statements” means our Annual Financial Statements and our Quarterly Financial Statements;
“First Lien Credit Agreement” means the Credit Agreement, dated as of August 13, 2024, by and among the Company, DNB Bank ASA, New York Branch, as administrative agent, Wilmington Trust, National Association, as collateral agent, and the lenders party thereto;
“First Lien Revolving Credit Facility” means the revolving credit facility established pursuant to the terms of the First Lien Credit Agreement;
“GAAP” means United States generally accepted accounting principles;
ii
“Gulf Island” means Gulf Island Shipyards, LLC;
“high-specification” or “high-spec” means, when referring to OSVs, vessels with cargo-carrying capacity of between 3,500 and 5,000 DWT (i.e., primarily 265 to 280 class OSV notations), and dynamic-positioning systems with a DP-2 classification or higher; for the avoidance of doubt, any MPSV is a high-spec vessel (other than any MPSVs of greater than 5,000 DWT, which are ultra high-spec vessels);
“Highbridge” means Highbridge Capital Management LLC;
“Jones Act Warrants” means those certain warrants issued to certain non-U.S. citizens in settlement of certain pre-Chapter 11 Cases liabilities and in connection with subsequent private offerings of the Company’s equity;
“low-specification” or “low-spec” means, when referring to OSVs, vessels with cargo-carrying capacity of less than 2,500 DWT (i.e., primarily 200 class OSV notations), and/or vessels with dynamic-positioning systems with a DP-1 classification or lower;
“mid-specification” or “mid-spec” means, when referring to OSVs, vessels with cargo-carrying capacity of between 2,500 and 3,500 DWT (i.e., primarily 240 class OSV notations), and dynamic positioning (“DP”) systems with a DP-2 classification or higher;
“Nautical” means Nautical Solutions, L.L.C., an ECO affiliate;
“PEMEX” means Petroleos Mexicanos;
“Petrobras” means Petroleo Brasileiro S.A.;
“principal stockholders” means funds, investment vehicles or accounts managed or advised by Ares, Whitebox or Highbridge or their respective affiliates, in each case, that own shares of our common stock;
“Quarterly Financial Statements” means the unaudited condensed consolidated financial statements for the three and six months ended June 30, 2024 and 2023;
“Replacement First Lien Term Loans” means the first lien replacement term loans under that certain first lien term loan credit agreement, dated September 4, 2020 (as amended and restated pursuant to that certain Amendment No. 1 to First Lien Credit Agreement and Amendment No. 1 to the Effective Date Junior Lien Intercreditor Agreement, dated December 22, 2021, as further amended pursuant to that certain First Amendment to Restated First Lien Credit Agreement, dated June 6, 2022, as further amended pursuant to that certain Interest Rate Index Replacement Agreement and Second Amendment to First Lien Credit Agreement, dated July 27, 2023), by and among the Company, as parent borrower, Hornbeck Offshore Services, LLC, as co-borrower, Wilmington Trust, National Association, as administrative agent and collateral agent, and the lenders party thereto, all obligations under which were fully paid and terminated on August 31, 2023;
“Second Lien Credit Agreement” means that certain second lien term loan credit agreement, dated September 4, 2020 (as amended pursuant to that certain Amendment No. 1 to Second Lien Credit Agreement and Amendment No. 1 to the Effective Date Junior Lien Intercreditor Agreement, dated December 22, 2021, as further amended pursuant to that certain Second Amendment to Second Lien Credit Agreement, dated June 6, 2022, and as further amended, restated, amended and restated, supplemented or otherwise modified from time to time), by and among the Company, as parent borrower, Hornbeck Offshore Services, LLC, as co-borrower, Wilmington Trust, National Association, as administrative agent and collateral agent, and the lenders from time to time party thereto;
“Second Lien Term Loans” means our outstanding term loans under the Second Lien Credit Agreement;
iii
“Securities Act” means the Securities Act of 1933, as amended;
“Surety” means Zurich Insurance Company of America and Fidelity & Deposit Company of Maryland;
“ultra high-specification” or “ultra high-spec” means, when referring to OSVs, vessels with cargo-carrying capacity of greater than 5,000 DWT (i.e., 300 class OSV notations or higher), and dynamic-positioning systems with a DP-2 classification or higher; for the avoidance of doubt, any MPSV of greater than 5,000 DWT is an ultra high-spec vessel; and
“Whitebox” means Whitebox Advisors LLC.
iv
GLOSSARY OF TERMS
The following are abbreviations and definitions of certain terms used in this document, which are commonly used in the offshore support vessel industry:
“active utilization” means, when referring to OSVs or MPSVs, the weighted-average rate that active vessels are utilized, or generating revenues, based on a denominator comprised only of vessel-days available for service by the active fleet, which excludes the impact of inactive or stacked vessel days;
“average dayrate” means, when referring to OSVs or MPSVs, average revenue per day, which includes charter hire, crewing services and net brokerage revenues, based on the number of days during the period that the OSVs or MPSVs, as applicable, generated revenue. For purposes of vessel brokerage arrangements, this calculation excludes that portion of revenue that is equal to the cost of in-chartering third-party equipment paid by customers;
“average utilization” means, when referring to OSVs or MPSVs, the weighted-average rate that vessels are utilized, or generating revenues, based on a 365-day year;
“BOEM” means the Bureau of Ocean Energy Management;
“cabotage laws” means laws pertaining to the privilege of owning and operating vessels in the navigable, territorial waters of a nation;
“coastwise trade” means the transportation of merchandise or passengers by water, or by land and water, between points in the United States, either directly or via a foreign port within the meaning of 46 U.S.C. Chapter 551 and any successor statutes thereto, as amended or supplemented from time to time;
“CO2e/kboe” means carbon dioxide equivalent per thousand barrels of oil equivalent;
“C/SOV” means a multi-purpose service vessel that can be utilized in the offshore wind market as either a CSOV or an SOV. A CSOV is a Commissioning Service Operation Vessel, typically serving during the commissioning and installation phases of an offshore wind farm, under contracts that are usually less than one year in duration. A SOV is a Service Operation Vessel, typically performing operations and maintenance services during the life of an offshore wind farm, under contracts that can be for multi-year terms;
“deep-well” means a well drilled to a true vertical depth of 15,000’ or greater, regardless of whether the well was drilled in the shallow water of the Outer Continental Shelf or in the deepwater or ultra-deepwater;
“deepwater” means offshore areas, generally 1,000’ to 5,000’ in depth;
“D-FARs” means Defense Federal Acquisition Regulations;
“DP-1,” “DP-2” and “DP-3” mean various classifications of DP systems on vessels to automatically maintain a vessel’s position and heading through anchor-less station-keeping;
“DWT” means deadweight tons;
“effective dayrate” means the average dayrate multiplied by the average utilization rate;
“FARs” means Federal Acquisition Regulations;
“flotel” means on-vessel accommodations services, such as lodging, meals and office space;
v
“GoM” means the U.S. GoM and the Mexico GoM;
“IRM” means inspection, repair and maintenance, also known as “IMR,” or inspection, maintenance and repair, depending on regional preference;
“Jones Act” means the U.S. citizenship and cabotage laws principally contained in 46 U.S.C. § 50501(a), (b) and (d) and 46 U.S.C. Chapters 121 and 551 and any successor statutes thereto, together with the rules and regulations promulgated thereunder by the USCG and the U.S. Department of Transportation’s Maritime Administration and their practices enforcing, administering and interpreting such laws, statutes, rules and regulations, in each case as amended or supplemented from time to time, relating to the ownership and operation of U.S.-flag vessels in the coastwise trade;
“Jones Act-qualified” means, when referring to a vessel, a U.S.-flagged vessel qualified to engage in domestic coastwise trade under the Jones Act;
“long-term contract” means a time charter of one year or longer in duration;
“Mexico GoM” means the territorial waters of Mexico in the Gulf of Mexico;
“MPSV” means a multi-purpose support vessel, and we consider all of our MPSVs to be high-spec or ultra high-spec;
“MSC” means the Military Sealift Command;
“Naviera” means a Mexican company authorized by Mexican law to engage in shipping activities, including Mexican cabotage and international shipping under Mexican flag;
“OSV” means an offshore supply vessel, also known as a “PSV,” or platform supply vessel, depending on regional preference;
“ROV” means a remotely operated vehicle, which is a tethered submersible vehicle remotely operated from the surface;
“SEMAR” means Secretaría de Marina, the government agency responsible for, among other things, administering Mexico’s territorial sea and exclusive economic zone;
“TRIR,” means the total recordable incident rate, which is measured as the number of recordable incidents, multiplied by 200,000, then divided by the total number of exposure hours worked in a year;
“ultra-deepwater” means offshore areas, generally more than 5,000’ in depth;
“U.S. GoM” means the territorial waters of the United States in the Gulf of Mexico; and
“USCG” means United States Coast Guard.
vi
MARKET AND INDUSTRY DATA
This prospectus includes market and industry data and forecasts that we have derived from publicly available information, various industry publications, other published industry sources and our internal data and estimates.
Additionally, our internal data and estimates are based upon information obtained from trade and business organizations and other contacts in the markets in which we operate. Although we believe these third-party sources are reliable as of their respective dates, we have not had this information further verified by any other independent sources. These sources include industry data from Wood Mackenzie’s Emissions Benchmarking Tool, a report titled “Short-Term Energy Outlook,” dated July 2024, by the U.S. Energy Information Administration (the “2023 EIA Outlook”), a report titled “Macro and OSV Demand Drivers Outlook,” dated July 2024, by Rystad Energy Consultants, and a report titled “OSV Market Study,” dated August 2024, by Fearnley Offshore Supply. Similarly, our internal research is based upon our understanding of industry conditions. The industry in which we operate is subject to a high degree of uncertainty and risk due to a variety of factors, including those described in the sections entitled “Risk Factors” and “Special Note Regarding Forward-Looking Statements.” These and other factors could cause results to differ materially from those expressed in our estimates and these third-party sources.
Certain valuation information included in this prospectus is an aggregation based on reports prepared by VesselsValue, a Veson Nautical company, which is an independent online valuation and market intelligence provider for the maritime industry (“VesselsValue”). None of such reports were commissioned by or on behalf of Hornbeck, and none of the information contained therein was prepared in connection with, or specifically for use in, this prospectus. The VesselsValue market value data presented in this prospectus is an estimate of the fair market price and newbuild, or replacement cost, of our vessels, in U.S. dollars, as at the valuation date only, and is based on the price VesselsValue estimates in good faith that the vessels would obtain in a hypothetical transaction between a willing buyer and a willing seller on the basis of prompt charter-free delivery at an acceptable worldwide delivery port, for cash payment on standard sale terms. For the purposes of those estimates, it is assumed that the particulars of the vessels are correct, and that the vessels are in good, sound and seaworthy condition, free of maritime liens and all debts whatsoever, fully classed to the requirements of present classification society, free of class recommendations, with clean and valid trading certificates, and where relevant to type and age of each vessel with full oil majors vetting approval, “Rightship” satisfactory inspection/safety score and any other relevant approvals in place. It should be noted that these market valuations are not based on a physical inspection of the vessel nor an inspection of the class records of the vessels by VesselsValue. The estimated market values are for the valuation date only and no assurance is given that any such value will be sustained or is realizable in an actual transaction.
TRADEMARKS, TRADENAMES AND SERVICE MARKS
We own or have rights to trademarks or trade names that we use in conjunction with the operation of our business and that appear in this prospectus. For more information about our license to use certain trademarks and trade names, see “Risk Factors—We do not own the Hornbeck Brands, but may use the Hornbeck Brands pursuant to the terms of a license granted by HFR, and our business may be materially harmed if we breach our license agreement or it is terminated.” This prospectus also contains trademarks, service marks, trade names and copyrights of other companies which, to our knowledge, are the property of their respective owners. Solely for convenience, trademarks and trade names referred to in this prospectus may appear without the ® or ™ symbols, but the absence of such symbols does not indicate the registration status of the trademarks and is not intended to indicate, in any way, that we will not assert, to the fullest extent under applicable law, our rights or the right of the applicable licensor to such trademarks and trade names.
vii
BASIS OF PRESENTATION
Unless otherwise indicated or the context otherwise requires, references in this prospectus to the “Company,” “Hornbeck,” “we,” “us” and “our” refer to Hornbeck Offshore Services, Inc. and its consolidated subsidiaries.
Unless otherwise stated, discussions surrounding our vessels are as of July 31, 2024. Such discussions include two partially constructed Jones Act-qualified MPSV newbuilds to be completed pursuant to our settlement with the Surety, as further discussed in “Management’s Discussion and Analysis of Financial Condition and Results of Operations—Recent Developments—Resumption of MPSV Newbuild Construction,” and one OSV currently undergoing conversion into a MPSV for dual-service as either a C/SOV or flotel. Our vessels exclude four OSVs formerly owned by us that we now operate and maintain for the U.S. Navy.
In connection with the consummation of this offering and after the effectiveness of the registration statement of which this prospectus forms a part, we will effect a -for-one forward stock split with respect to our common stock (the “stock split”). In this prospectus, we include certain metrics on an “as adjusted” basis to give effect to the stock split.
PRESENTATION OF CERTAIN FINANCIAL MEASURES
We disclose and discuss EBITDA, Adjusted EBITDA and Adjusted Free Cash Flow as non-GAAP financial measures in this prospectus. We define EBITDA as earnings (net income or loss) before interest, income taxes, depreciation and amortization. Adjusted EBITDA reflects certain adjustments to EBITDA for gains or losses on early extinguishment of debt, terminated debt refinancing costs, stock-based compensation expense and interest income. In addition, Adjusted EBITDA excludes non-cash gains or losses on the fair value adjustment of liability-classified warrants. We define Adjusted Free Cash Flow as Adjusted EBITDA less cash paid for deferred drydocking charges, cash paid for maintenance capital improvements and non-vessel capital expenditures, cash paid for interest and cash paid for (refunds of) income taxes. Our measures of EBITDA, Adjusted EBITDA and Adjusted Free Cash Flow may not be comparable to similarly titled measures presented by other companies. Other companies may calculate EBITDA, Adjusted EBITDA and Adjusted Free Cash Flow differently than we do, which may limit their usefulness as comparative measures.
We view EBITDA, Adjusted EBITDA and Adjusted Free Cash Flow primarily as liquidity measures and, as such, we believe that the GAAP financial measure most directly comparable to those measures is cash flows provided by operating activities. Because EBITDA, Adjusted EBITDA and Adjusted Free Cash Flow are not measures of financial performance calculated in accordance with GAAP, they should not be considered in isolation or as a substitute for operating income, net income or loss, cash flows provided by operating, investing and financing activities, or other income or cash flow statement data prepared in accordance with GAAP. Additionally, Adjusted Free Cash Flow does not represent the total increase or decrease in our cash balance, and it should not be inferred that the entire amount of Adjusted Free Cash Flow is available for dividends, debt or share repurchases or other discretionary expenditures, since we have non-discretionary expenditures that are not deducted from this measure.
EBITDA, Adjusted EBITDA and Adjusted Free Cash Flow are widely used by investors and other users of our consolidated financial statements as supplemental financial measures that, when viewed with our GAAP results and the accompanying reconciliations, we believe provide additional information that is useful to gain an understanding of the factors and trends affecting our ability to service debt, pay income taxes and fund drydocking charges, maintenance capital improvements and non-vessel capital expenditures. We also believe the disclosure of EBITDA, Adjusted EBITDA and Adjusted Free Cash Flow helps investors or lenders meaningfully evaluate and compare our cash flow generating capacity from quarter to quarter and year to year.
viii
EBITDA, Adjusted EBITDA and Adjusted Free Cash Flow are also financial metrics used by management as supplemental internal measures for planning and forecasting overall expectations and for evaluating actual results against such expectations; for short-term cash bonus incentive compensation purposes; to compare to the EBITDA, Adjusted EBITDA and Adjusted Free Cash Flow of other companies, vessels or other assets when evaluating potential acquisitions; to assess our ability to service existing fixed charges and incur additional indebtedness; and to purchase, convert or construct additional vessels. Additionally, we have historically made certain adjustments to EBITDA to internally evaluate our performance based on the computation of ratios used in certain financial covenants of our credit agreements with various lenders, whenever applicable. Currently, our credit agreements have incurrence tests and other financial covenants, including coverage and leverage ratios. These ratios are calculated using certain adjustments to EBITDA defined by our credit agreements, which adjustments are consistent with those reflected in Adjusted EBITDA in this prospectus. In addition, we believe that, based on covenants in prior credit facilities, future debt arrangements may require compliance with certain ratios that will likely include EBITDA or Adjusted EBITDA in the computations. Adjusted EBITDA is also currently utilized in connection with the Company’s short-term cash bonus incentive compensation programs.
For reconciliations of EBITDA, Adjusted EBITDA and Adjusted Free Cash Flow to the most directly comparable measure under GAAP, see “Summary—Summary Historical Financial and Other Data” and “Management’s Discussion and Analysis of Financial Condition and Results of Operations—Non-GAAP Financial Measures.”
ABOUT THIS PROSPECTUS
None of we, the selling stockholders or the underwriters have authorized anyone to provide you with information or make any representations other than those contained in this prospectus. We, the selling stockholders and the underwriters take no responsibility for, and provide no assurance as to the reliability of, any other information that others may give you. This prospectus is an offer to sell only the shares offered hereby, and only under circumstances and in jurisdictions where it is lawful to do so. You should assume that the information appearing in this prospectus is accurate as of the date on the front cover of this prospectus only. Our business,
financial condition, results of operations and prospects may have changed since that date. We will update this prospectus as required by law, including with respect to any material change affecting us or our business prior to the completion of this offering.
Certain monetary amounts, percentages and other figures included in this prospectus have been subject to rounding adjustments. Accordingly, figures shown as totals in certain tables may not be the arithmetic aggregation of the figures that precede them, and figures expressed as percentages in the text may not total 100% or, as applicable, when aggregated may not be the arithmetic aggregation of the percentages that precede them.
ix
SPECIAL NOTE REGARDING FORWARD-LOOKING STATEMENTS
This prospectus contains forward-looking statements. Many statements included in this prospectus that are not statements of historical fact, including statements about our beliefs and expectations, are forward-looking statements. Forward-looking statements are inherently subject to risks and uncertainties, some of which cannot be predicted or quantified. These risks and other factors include, but are not limited to, those listed under “Risk Factors.” In some cases, you can identify forward-looking statements by terminology such as “anticipate,” “believe,” “continue,” “could,” “estimate,” “expect,” “intend,” “may,” “might,” “objective,” “ongoing,” “plan,” “predict,” “project,” “potential,” “should,” “will,” “would” or the negative of these terms or other comparable terminology. In particular, statements about the markets in which we operate and our expectations, beliefs, plans, strategies, objectives, prospects, assumptions or future events or performance contained in this prospectus under the headings “Summary,” “Risk Factors,” “Management’s Discussion and Analysis of Financial Condition and Results of Operations,” and “Business” are forward-looking statements. Forward-looking statements include, but are not limited to, statements about:
| • | our market opportunity and the potential growth of that market; |
| • | our strategy, outcomes, and growth prospects; |
| • | trends in our industry and service-offerings; and |
| • | the competitive environment in which we operate. |
Some of the factors that could cause actual results to differ materially from those expressed or implied by such forward-looking statements include:
| • | impacts from changes in oil and natural gas prices in the United States and worldwide; |
| • | changes in decisions and capital spending by customers in the energy industry and the industry expectations for offshore exploration, field development and production; |
| • | changes in decisions or plans or delays for offshore wind development in the United States; |
| • | uncertainty of global financial market conditions and potential constraints in accessing capital or credit if and when needed with favorable terms, if at all; |
| • | unplanned customer suspensions, cancellations, rate reductions or non-renewals of vessel charters or vessel management contracts, or failures to finalize commitments to charter or manage vessels; |
| • | delays or non-delivery of vessels subject to conversion and new construction agreements effective at the time of this offering, including completion of the conversion of one of our OSVs into a MPSV for dual-service as either a C/SOV or flotel and delivery of the two remaining vessels under our MPSV newbuild program; |
| • | the inability to accurately predict vessel utilization levels and dayrates; |
| • | the inability to successfully market across various industry applications the vessels that we own, are constructing, are converting, have recently acquired or might acquire, including in traditional energy as well as offshore wind, military and other non-oilfield applications; |
| • | integration of acquired businesses or vessels, or entry into new lines of business; |
| • | changing customer demands for vessel specifications, which may make some of our older vessels technologically obsolete for certain customer projects or in certain markets; |
| • | the operating risks normally incident to our lines of business, including the potential impact of liquidated counterparties; |
| • | industry over-supply resulting from reactivating currently-stacked vessels or from constructing new vessels; |
x
| • | any change in the U.S. government’s procurement policies and practices with regard to the chartering of privately-owned vessels or the management of government-owned vessels by private operators; |
| • | an oil spill or other significant event in the United States or another offshore drilling region having a broad impact on deepwater and ultra-deepwater and other offshore energy exploration and production activities, such as the suspension of activities or significant regulatory responses; |
| • | the imposition of laws or regulations that result in reduced exploration and production activities or that increase our or our customers’ operating costs or operating requirements, including laws and regulations addressing climate change; |
| • | potential liability for remedial actions or assessments under existing or future environmental regulations or litigation; |
| • | the impact of existing or future environmental regulations or litigation on our business or customer plans or projects; |
| • | our ability to achieve, reach or otherwise meet initiatives, plans or ambitions with respect to environmental, social and governance (“ESG”) matters, including mandates imposed by customers or governmental agencies; |
| • | disputes with customers or vendors; |
| • | consolidation of our customer base; |
| • | technological or regulatory changes that shorten the expected useful lives of our vessels; |
| • | increased regulatory burdens and oversight; |
| • | administrative, judicial or political barriers to exploration and production activities in Mexico, Brazil or other foreign locations; |
| • | changes in law, governmental policy or judicial or regulatory action, or the enforcement thereof, in Mexico affecting international trade or our Mexican registration and operation of our vessels in Mexican cabotage; |
| • | administrative or other legal changes in Mexican, Brazilian or other Latin American jurisdictions’ cabotage laws or maritime laws; |
| • | the emergence of new cabotage restrictions that impact our ability to operate in other foreign jurisdictions; |
| • | other legal or administrative changes in Mexico that adversely impact planned or expected offshore energy development; |
| • | unanticipated difficulty in effectively competing in or operating in international markets; |
| • | economic, social, tax, geopolitical and weather-related risks; |
| • | potential changes in various laws and regulations as a result of the upcoming United States presidential and congressional elections; |
| • | acts of terrorism, piracy or government-sanctioned privateering; |
| • | the impact of regional or global public health crises or pandemics; |
| • | other issues that may be encountered in expanding our service offering within our existing government franchise, in the emerging offshore wind industry, and in other non-oilfield applications; |
| • | the shortage of or the inability to attract and retain qualified personnel, when needed, including licensed vessel personnel for active vessels or vessels we may acquire or reactivate; |
| • | the repeal or administrative weakening of the Jones Act or adverse changes in the interpretation of the Jones Act; |
xi
| • | drydocking delays, supply chain shortages and cost overruns and related risks; |
| • | vessel accidents, pollution incidents or other events resulting in lost revenue, fines, penalties or other expenses that are unrecoverable from insurance policies or other third parties; |
| • | adverse outcomes in pending or future legal or administrative proceedings, and any unexpected litigation and insurance expenses; |
| • | the effects of asserted and unasserted claims and the extent of available insurance coverage; |
| • | fluctuations in foreign currency valuations compared to the U.S. dollar; |
| • | the impact of any unionization of our workforce; |
| • | shortages of qualified mariners resulting in increased wages, inability to crew vessels or both; |
| • | changes in laws impacting licensure or compensation paid to mariners; |
| • | risks associated with foreign operations, such as non-compliance with, the unanticipated effect of, or unexpected assessments/enforcement actions taken in connection with, tax laws, customs laws, immigration laws, importation laws or other legislation that result in higher than anticipated tax rates or other costs, especially in higher political risk countries where we operate; |
| • | changes to applicable tax laws and regulations; |
| • | political risks in countries outside of the United States, including unlawful detentions, arrests, confiscation or nationalization of our vessels; |
| • | limitations on our ability to use our net operating loss (“NOL”) carryforwards and other tax attributes; |
| • | our inability to refinance or otherwise retire certain funded debt obligations; |
| • | the potential for any impairment charges that could arise in the future; |
| • | the impact of potential information technology, cybersecurity or data security breaches; and |
| • | other risks and uncertainties, including those described under “Risk Factors.” |
In addition, our future results may be impacted by adverse economic conditions, such as inflation, deflation, fluctuations in foreign currency exchange rates, supply chain disruptions, lack of liquidity in the capital markets or an increase in interest rates, that may negatively affect us or parties with whom we do business resulting in their non-payment or inability to perform obligations owed to us, such as the failure of customers to fulfill their contractual obligations, if and when required.
We have based the forward-looking statements contained in this prospectus primarily on our current expectations and projections about future events and trends that we believe may affect our business, financial condition, results of operations, prospects, business strategy and financial needs. The outcome of the events described in these forward-looking statements is subject to risks, uncertainties, assumptions and other factors described under “Risk Factors” and elsewhere in this prospectus. These risks are not exhaustive. Other sections of this prospectus include additional factors that could adversely affect our business and financial performance. Moreover, we operate in a very competitive environment. New risks and uncertainties emerge from time to time, and it is not possible for us to predict all risks and uncertainties that could have an impact on the forward-looking statements contained in this prospectus. We cannot be sure that the results, events and circumstances reflected in the forward-looking statements will be achieved or occur, and actual results, events or circumstances could differ materially from those described in, or implied by, the forward-looking statements.
In addition, statements that “we believe” and similar statements reflect our beliefs and opinions on the relevant subject.These statements are based upon information available to us as of the date of this prospectus, and while we believe that information forms a reasonable basis for such statements, that information may be limited or incomplete, and our statements should not be read to indicate that we have concluded an exhaustive inquiry into, or review of, all potentially available relevant information.
xii
The forward-looking statements made in this prospectus relate only to events as of the date on which such statements are made. We undertake no obligation to update any forward-looking statements after the date of this prospectus or to conform such statements to actual results or revised expectations, except as required by law.
xiii
This summary highlights selected information contained elsewhere in this prospectus, but it does not contain all of the information that you should consider before deciding to invest in our common stock. You should carefully read the entire prospectus, including the information presented under the section entitled “Risk Factors” and the financial statements and the notes thereto, included elsewhere in this prospectus, before making an investment decision. Some of the statements in the following summary constitute forward-looking statements. See “Special Note Regarding Forward-Looking Statements.” Unless the context otherwise requires, all references in this summary to the “Company,” “Hornbeck,” “HOS,” “we,” “us,” “our” or similar terms refer to Hornbeck Offshore Services, Inc. and its consolidated subsidiaries. Where we present information on an “as adjusted basis,” it means that such information is presented giving effect to this offering and the use of proceeds therefrom, as reflected in more detail under the captions “Use of Proceeds” and “Capitalization.” Additionally, unless noted otherwise, discussions surrounding our vessels are as of July 31, 2024 and include two partially constructed Jones Act-qualified MPSV newbuilds to be completed pursuant to our settlement with the Surety, as discussed further in “Management’s Discussion and Analysis of Financial Condition and Results of Operations—Recent Developments—Resumption of MPSV Newbuild Construction,” and one OSV currently undergoing conversion into a MPSV for dual-service as either a C/SOV or flotel. Our vessels exclude four OSVs formerly owned by us that we now operate and maintain for the U.S. Navy.
We have defined certain industry terms used in this document in “Commonly Used Defined Terms” and “Glossary of Terms,” appearing immediately after the Table of Contents to this prospectus.
Company Overview
Hornbeck is a leading provider of marine transportation services to customers in the offshore oilfield market and diversified non-oilfield markets, including military support services, renewable energy development and other non-oilfield service offerings. Since our founding more than 27 years ago, we have focused on providing innovative, technologically advanced marine solutions to meet the evolving needs of our customers across our core geographic regions covering the United States and Latin America. Our team brings substantial industry expertise built through decades of experience and has leveraged that knowledge to amass what we believe is one of the largest, highest specification fleets of Offshore Supply Vessels (“OSVs”) and Multi-Purpose Support Vessels (“MPSVs”) in the industry. Approximately 75% of our total fleet consists of high-spec or ultra high-spec vessels, and we believe we have the number one ultra high-spec market position in the U.S., and the third largest fleet of high-spec and ultra high-spec OSVs in the world, measured by DWT capacity. We own a fleet of 75 multi-class OSVs and MPSVs, 58 of which are U.S. Jones Act-qualified vessels. Our Jones Act-qualified high-spec and ultra high-spec OSVs account for approximately 26% of the total industry supply of such vessels. We opportunistically expand our fleet within existing and/or into new, high-growth, cabotage-protected markets from time to time to enhance our fleet offerings to customers. Our mission is to be recognized as the energy industry’s marine transportation and service Company of Choice® for our customers, employees and investors through innovative, high-quality, value-added business solutions delivered with enthusiasm, integrity and professionalism with the utmost regard for the safety of individuals and the protection of the environment.
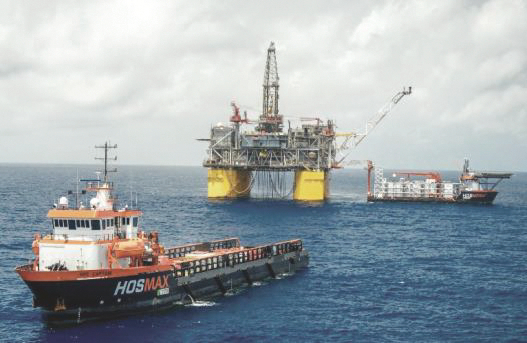
Our fleet of 60 OSVs primarily provides transportation of equipment, materials and supplies to offshore drilling rigs, production platforms, subsea construction projects and other non-oilfield applications. Increasingly, given their versatility, our OSVs are being deployed in a variety of non-oilfield applications including military support services, renewable energy development for offshore wind, humanitarian aid and disaster relief, aerospace and telecommunications. Our OSVs differ from other marine service vessels in that they provide increased cargo-carrying flexibility and capacity that can transport large quantities of deck cargoes, as well as various liquid and dry bulk cargoes in below-deck tanks providing flexibility for a variety of jobs.
1
Moreover, our OSVs are outfitted with advanced technologies, including DP capabilities, which allows each vessel to safely interface with another offshore vessel, exploration and production facility or an offshore asset by maintaining an absolute or relative station-keeping position when performing its work at sea.
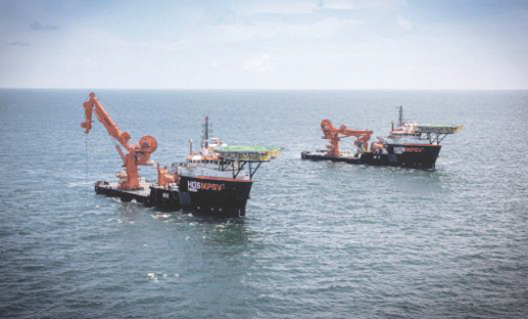
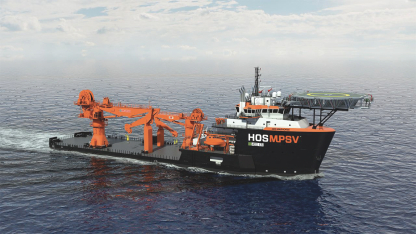
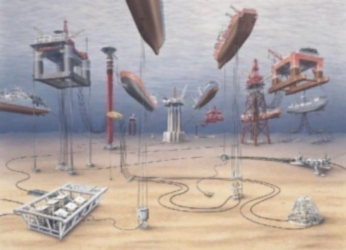
Our fleet of 15 MPSVs provides commissioning and decommissioning support services, asset construction capabilities, recurring inspection, repair and maintenance services and flotel accommodations. Such vessels primarily serve the oil and gas market, with capabilities including the installation of subsea and top-side oilfield infrastructure necessary in the modern deepwater and ultra-deepwater oilfields. Further, these vessels are capable of supporting a variety of other non-oilfield offshore infrastructure projects, including the development of offshore windfarms, by providing the equipment and capabilities to support the installation and maintenance of wind turbines and platforms. Because of our ability to serve a diverse set of end markets, MPSV operations are typically less directly linked with the number of active drilling rigs in operation and therefore can be less cyclical. Our high- and ultra high-spec OSVs can be contracted alongside our MPSVs on major projects, providing operating efficiencies and pull-through revenue. Most of our MPSVs have one or more deepwater or ultra-deepwater cranes fitted on the deck, deploy one or more Remotely Operated Vehicles (“ROVs”) to support subsea work, and have an installed helideck to facilitate the on-/off-boarding of specialist service providers and personnel. MPSVs can also be outfitted as flotels to provide accommodations, offices, catering, laundry, medical, and recreational facilities to large numbers of offshore workers for the duration of a project. When configured as flotels, our MPSVs have capacities to house up to 245 workers for major installation, maintenance and overhaul projects. Included in our total MPSV fleet count are the two HOS 400 class MPSVs that are currently under construction and one of our U.S.-flagged, HOSMAX 280 class OSVs that is currently undergoing conversion into a MPSV for dual-service as either a C/SOV or flotel. Based on overall length and total lifting capacity, the two HOS 400 class MPSVs are expected to be the largest Jones Act-qualified MPSVs in the market and will have additional capabilities due to their size and sophistication. In addition to the services performed by our existing fleet of MPSVs, the two newbuild vessels will be equipped with systems that we expect will make them suitable for complex services, including light well intervention, that require larger or more versatile vessels than the fleet of MPSVs currently available in the U.S. market. Once converted, our C/SOV + Flotel MPSV will be capable of providing services to the U.S. offshore wind market both during the commissioning phase of an offshore wind farm and during its operational life. We expect the converted MPSV to be placed into active service as either a C/SOV or flotel in 2025, while the two newbuild MPSVs are now expected to be placed into active service in 2026 or possibly thereafter.
Our ability to reconfigure or modify vessels in our fleet to meet evolving industry demands and the needs of our customers differentiates our success across maritime markets. This enables us to reconfigure stacked OSVs to service oilfield and non-oilfield service customers. As offshore activities expand in scope and become increasingly more complex, the demand for high specification, fit-for-purpose equipment and service capabilities has accelerated, creating disproportionate competitive advantages for companies able to adapt vessels and service offerings quickly to respond to changing customer needs.
With an average of over 37 years of experience in the marine transportation and service industry and having worked together at Hornbeck for over 20 years, our senior management team has the depth of experience necessary to successfully compete in the offshore vessel business. We have confidence that both our team and our strategy have been organized in a manner that best positions our Company to effectively execute in this dynamic and demanding operating environment.
Fleet Composition and Operating Regions
Hornbeck owns and operates what we believe is one of the highest specification, most technologically advanced fleets of OSVs and MPSVs in the industry. Our fleet of 75 vessels primarily operates across our core geographic markets of the United States and Latin America. We predominantly serve our oilfield customers in the GoM, the Caribbean, Northern South America and Brazil, while our vessels primarily serve our
2
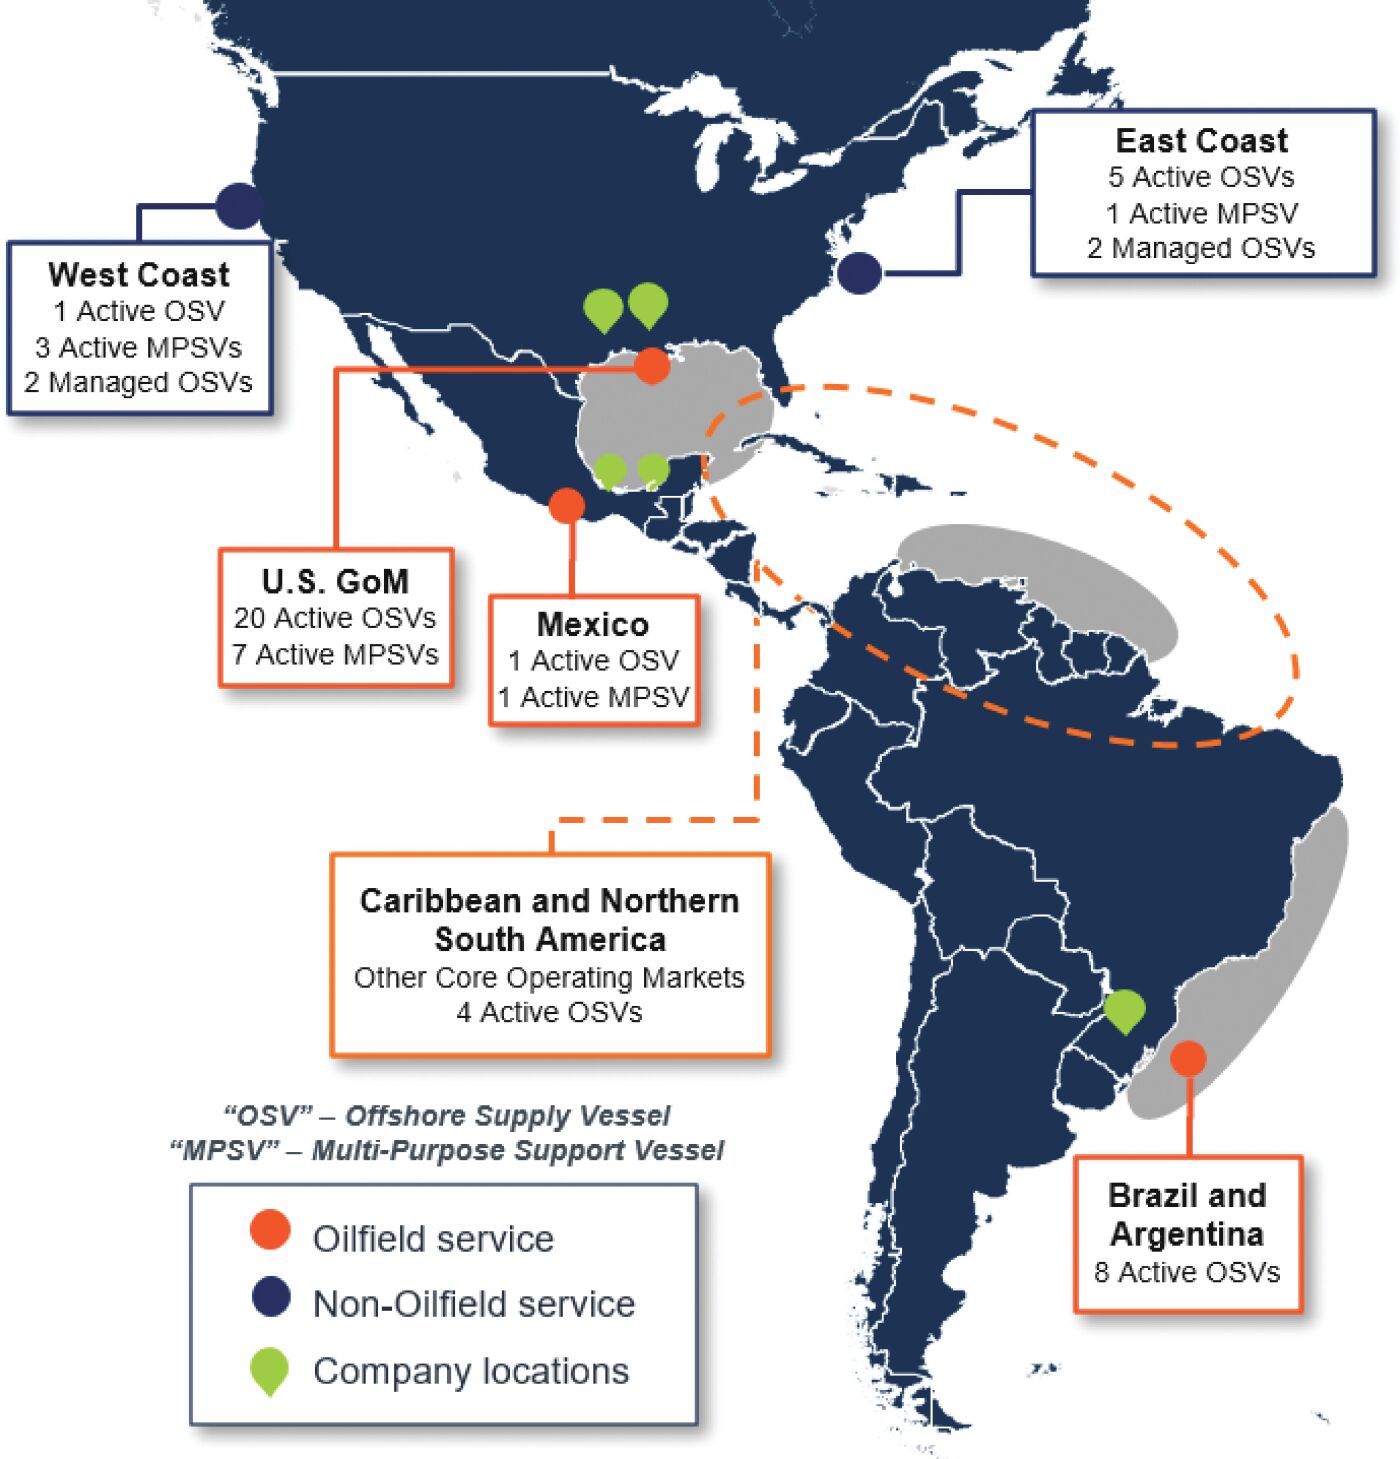
non-oilfield customers from the East and West Coasts of the United States and in the U.S. GoM. We operate our Mexican-flagged vessels across the Caribbean and Northern South America when not operated in Mexico, as well as in other international markets, utilizing a highly-skilled workforce of Mexican mariners and shore-side support team that have been trained in our safety systems and culture. A map illustrating our active vessel locations as of July 31, 2024 is below:
3
OSV Fleet
The following table illustrates our fleet of OSVs and the nations in which they are flagged as of July 31, 2024:
| Vessel Class | U.S. | Mexico | Vanuatu | Brazil | Avg DWT | Total in Class | ||||||||||||||||||||
|
|
||||||||||||||||||||||||||
| HOSFLEX 370 | 2 | — | — | — | 7,886 | 2 | ||||||||||||||||||||
| HOSMAX 320 | 9 | 1 | — | — | 6,052 | 10 | ||||||||||||||||||||
| HOSMAX 310 | 3 | — | — | 1 | 5,990 | 4 | ||||||||||||||||||||
| HOSMAX 300 | 2 | 4 | — | — | 5,489 | 6 | ||||||||||||||||||||
|
|
HOSMAX 280 | 12 | 1 | 1 | — | 4,666 | 14 | |||||||||||||||||||
| HOS 270 | — | 2 | — | — | 3,803 | 2 | ||||||||||||||||||||
| HOS 265 | 3 | — | — | — | 3,677 | 3 | ||||||||||||||||||||
|
|
||||||||||||||||||||||||||
| HOS 250 | 3 | — | — | — | 2,713 | 3 | ||||||||||||||||||||
| HOS 240 | 12 | 2 | — | — | 2,712 | 14 | ||||||||||||||||||||
| HOS 200 | — | 2 | — | — | 1,729 | 2 | ||||||||||||||||||||
| Total Owned OSVs |
46 | 12 | 1 | 1 | — | 60(2) | ||||||||||||||||||||
|
|
USN T-AGSE | 4 | — | — | — | DP-2 | 4(3) | |||||||||||||||||||
| Total Operated OSVs |
50 | 12 | 1 | 1 | — | 64 | ||||||||||||||||||||
| (1) | Includes mid-spec vessels and low-spec vessels. |
| (2) | Includes 21 stacked vessels, comprised of two HOS 200s, 13 HOS 240s, three HOS 250s, two HOS 265s, and one HOSFLEX 370. |
| (3) | Includes four OSVs formerly owned by us that we now operate and maintain for the U.S. Navy. |
4
MPSV Fleet
The following table illustrates our fleet of MPSVs and the nations in which they are flagged as of July 31, 2024:
| Vessel Class | U.S. | Mexico | Vanuatu | DP Class | Total in Class | |||||
| HOS C/SOV+FLOTEL(1) |
1 | — | — | DP-2 | 1 | |||||
| HOS FLOTEL |
1 | — | — | DP-2 | 1 | |||||
| HOS 430 |
— | 1 | 1 | DP-3 | 2 | |||||
| HOS 400(2) |
2 | — | — | DP-2 | 2 | |||||
| HOS 310/310ES |
4 | — | — | DP-2 | 4 | |||||
| HOS 265 |
— | 1 | — | DP-2 | 1 | |||||
| HOS 250 |
2 | — | — | DP-2 | 2 | |||||
| HOS 240 |
2 | — | — | DP-2 | 2 | |||||
| Total MPSVs |
12 | 2 | 1 | 15 | ||||||
| (1) | Includes one HOSMAX 280 OSV currently being converted into a MPSV for dual-service as either a C/SOV or flotel. |
| (2) | Includes two partially constructed Jones Act-qualified MPSV newbuilds to be completed pursuant to our settlement with the Surety, as discussed further in “Management’s Discussion and Analysis of Financial Condition and Results of Operations—Recent Developments—Resumption of MPSV Newbuild Construction.” |
There are a number of third-party services that consistently monitor and assess the value of vessels across the global OSV and MPSV fleets. These firms independently evaluate each vessel based on age, build specification, capabilities and recent comparable vessel sales, among other criteria, to derive a market-based estimate of current vessel value including fair market value, newbuild, or replacement, value, and liquidation value. According to one third-party provider, VesselsValue, our total fleet of 60 OSVs and 15 MPSVs had a fair market value of approximately $2.7 billion and a newbuild, or replacement, value of approximately $5.7 billion as of July 31, 2024, reinforcing the quality and differentiated capabilities of our vessels in today’s market.
Jones Act and other cabotage laws
Our 58 U.S.-flagged owned and operated vessels are all Jones Act-qualified. The majority of our U.S. operations are subject to the provisions of the Jones Act which, subject to limited exceptions, restricts maritime transportation of merchandise between points in the U.S. to vessels that are: (a) built in the United States; (b) registered under the U.S. flag; (c) crewed by U.S. citizens or lawful permanent residents; and (d) owned and operated by U.S. citizens within the meaning of the Jones Act. Based on publicly-available information compiled by the Company and data provided by Spinergie, the supply of Jones Act-qualified vessels is limited as there are only 83 active high- and ultra high-spec Jones Act-qualified OSVs in the U.S. GoM as of July 31, 2024. Of this limited supply, Hornbeck owns 26% of the market, representing the second largest such fleet in the industry. Mexico and Brazil each have their own cabotage laws that provide varying levels of insulation from foreign sources of competition that may be unwilling to invest capital or otherwise satisfy local ownership, crewing, tax and/or build requirements. As such, cabotage-protected markets create meaningful barriers to entry for foreign-flagged vessels. Since the fourth quarter of 2023, maritime regulators in Mexico have implemented new approaches in their oversight of Navieras that historically have had permissible levels of non-Mexican ownership, such as ours. As a result, we took legal action in Mexico to preserve our cabotage privileges there, and a Mexican court has ordered that our cabotage privileges be reinstated.
5
We have appealed this decision to further clarify the court’s ruling, and our cabotage privileges remain active during the pendency of the appeal. We expect the appellate process to last between one and three years. Despite these favorable court rulings, and the pendency of appeals, Mexican maritime regulators have limited our ability to object to the employment of non-Mexican flag vessels that compete with our own Mexican-flagged vessels, which is one of the privileges of a Mexican Naviera. Since the fourth quarter of 2023, we have moved all but two of our Mexican-flagged vessels into various non-Mexican international markets to continue utilizing our highly-skilled Mexican mariners and shore-based employees as part of our international services.
Customer Markets
The OSV and MPSV market has expanded rapidly since the 1970s, driven initially by growing offshore oil and gas production and more recently supported by diversified non-oilfield customer markets including military support services, renewable energy development and other non-oilfield service offerings. In response to changing market conditions and customer demand, we regularly transfer vessels between our core geographic areas and adapt equipment and features of our vessels to best meet potential revenue opportunities. Each customer market has specialized service needs and vessel requirements. For the six months ended June 30, 2024, approximately 49% of our revenues were attributed to oil and gas drilling support activities. The remaining approximately 51% of our revenues were generated away from the drill bit, comprised of approximately 25% coming from oilfield specialty activities, including offshore inspection, repair and maintenance, or “IRM,” construction and equipment installation, as well as decommissioning and plugging and abandonment work; approximately 19% coming from military support services and Humanitarian Aid and Disaster Relief (“HADR”); and approximately 7% coming from other non-oilfield support services, including offshore wind development, construction and support services. As we continue to diversify our customer markets, we expect the non-oilfield markets to contribute a greater portion of revenues in the future.
Oilfield Services
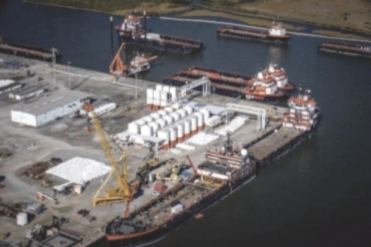
We predominantly serve our oilfield customers in the GoM, the Caribbean, Northern South America and Brazil. Our vessels provide support to offshore oil and gas exploration and production companies in two key areas: (i) oilfield drilling support and (ii) oilfield specialty services. Drilling support provides services that are specifically related to offshore drilling and production activities. This includes the transportation of drilling equipment, such as wellheads and drill pipe, as well as drilling fluids and other bulk products used in the development of new exploration wells and their subsequent production activities. Oilfield specialty services support ongoing or recurring oilfield activities, such as equipment installation services, IRM, flowback, well testing, pipeline flushing, decommissioning, and worker accommodations and transportation. In combination, we offer our oilfield customers a comprehensive range of vessel types and service offerings that cover the entire value chain of offshore hydrocarbon development. Additionally, we operate a port facility located in Port Fourchon, Louisiana, where we are able to stage equipment and cargos in support of such services and can also perform some of our own maintenance, outfitting and other in-the-water shipyard repair activities.
Non-Oilfield Services
Military Support Services
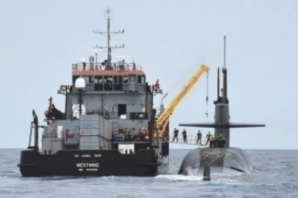
Since 2006, we have been a prominent, private sector service provider to the U.S. military by delivering vessels that support their readiness and security. We support our government customers in two key service offerings primarily from the East and West Coasts of the United States. We provide ongoing operation and maintenance of four highly specialized OSVs (which we previously developed, constructed, and sold to the U.S. Navy) via a long-term Operations & Maintenance (“O&M”) contract. We also own, operate, and charter vessels that provide submarine supply services, rescue and recovery capabilities, transportation services and training drills. Our military service capabilities are an accelerating component of our service portfolio and
6
military support is an end-customer market that is of particular importance given the stability provided by the U.S. government’s desire to execute long-term service agreements with qualified private contractors. We have received approximately $65.6 million, $105.5 million and $57.8 million of revenue for military support services for the years ended 2022 and 2023 and for the six months ended June 30, 2024, respectively.
Renewable Energy
Renewable energy, and particularly offshore windfarms and infrastructure, is in its early stage of development in the U.S. and represents an emerging market for our services. Certain of the development and maintenance aspects of U.S. offshore windfarms require the use of U.S.-flagged, Jones Act-qualified, high specification vessels, for which we are well-positioned to offer our services. We believe that vessels such as ours will be critical across all stages of the offshore windfarm development cycle, including installation support, geophysical survey, vessel support for testing and operations maintenance and repair. Offshore wind development and associated services represent a potential high-growth customer market for our business and our growing involvement positions our business to actively participate in the alternative energy market.
Other Non-Oilfield Services
The versatility of our vessels allows us to support communities in our core geographic areas by providing other non-oilfield services, including humanitarian aid and disaster relief, and service to the aerospace and telecommunications industries. For example, our fleet can support oil spill relief, hurricane recovery, vessel salvage and a broad range of search and rescue operations by deploying vessels to high-need areas in response to natural disasters or crises and providing those affected with lifesaving supplies and equipment. Additionally, our vessels are equipped to support aerospace launches that call for rocket component landing and recovery capabilities.
Collectively, our oilfield and non-oilfield customer markets provide a diverse platform from which we can leverage the capabilities of our vessels and creatively deploy them with customers to serve new markets or high-need service areas. We believe that the diversification benefits that come from servicing a broad range of customers reduces the potential variability in our operating performance, as well as the installation, testing and retrieval of fiber-optic cable for telecommunications.
Industry Overview
Offshore Exploration and Production
Over the last three decades, the offshore oil and gas industry has undergone significant technological change, marked by an ability to explore and produce hydrocarbons in deepwater and ultra-deepwater regions. These areas contain some of the largest hydrocarbon reserve deposits anywhere in the world with inventory that is expected to last decades.
Most deepwater and ultra-deepwater offshore drilling activity is concentrated in the U.S. GoM, South America (largely dominated by Brazil and more recently, Guyana) and West Africa. Based on Rystad industry data as of July 2024, approximately 70% of global deepwater and ultra-deepwater hydrocarbons are located in the GoM and South America. Moreover, per the Bureau of Safety and Environmental Enforcement (“BSEE”), average deepwater and ultra-deepwater well depths have been on an upward trajectory creating significant demand for high- and ultra high-spec OSVs and MPSVs, which are well-positioned to service larger, more remote projects given their greater storage capacities, larger deck space, and industry-leading technologies.
We expect offshore drilling activity to accelerate through 2028. Offshore activity is economically advantaged with low breakeven prices. Based on Rystad industry data as of July 2024, 90% of offshore proven reserves and probable reserves are economic when crude oil prices are at or below $50.00 per barrel, a level well below 2024 prices. As a result, offshore activity is expected to accelerate and Rystad forecasts that offshore rig
7
counts in Hornbeck’s core markets will increase approximately 23% through 2028. Contracted drilling rigs that provide exploration and drilling services to major exploration and development companies are a key leading indicator to OSV demand as each rig working to drill a well requires several OSVs to service it with equipment and supplies. The number of OSVs required to support a drilling rig depends on many factors including the type of drilling activity, the depth and development stage of the well, and the location of the rig. Typically, during the initial drilling stage, more OSVs are required to supply drilling mud, drill pipe, and other materials than at later stages in the drilling cycle. On average, and based on recent trends in active offshore drilling rigs and OSVs, we believe a typical offshore drilling rig requires approximately two to four OSVs to provide ongoing services at any one time with select infrastructure-remote areas such as Brazil and the Caribbean occasionally requiring a greater number of OSVs per drilling rig due to greater logistical challenges in those markets resulting in longer vessel turnaround times.
Our fleet of vessels provides logistics support and specialty services to the offshore oil and gas exploration and production industry, primarily in the GoM, the Caribbean, Northern South America and Brazil, as well as non-oilfield specialty services for the U.S. military and other non-oilfield service customers primarily in the U.S. GoM and from the East and West Coasts of the United States. The United States, Mexico and Brazil have strict cabotage laws that provide us varying levels of insulation from foreign sources of competition that may be unwilling to invest capital or otherwise satisfy local ownership, crewing, tax and/or build requirements. As such, cabotage-protected markets create meaningful barriers to entry for foreign-flagged vessels. We have vessels flagged in each of these jurisdictions and, due to treaties or other legal benefits, we are regularly able to move vessels and/or crews among these jurisdictions.
Below are more detailed descriptions of the industry dynamics impacting our core Oilfield Services operating markets:
U.S. GoM
The U.S. GoM continues to be a world-class basin, attracting significant capital from exploration and production companies. Based on Rystad industry data, U.S. GoM offshore rig counts have increased from 16 to 21 rigs from 2021 to 2023 and are expected to remain between 19 and 21 rigs through 2027. Similarly, U.S. GoM offshore well counts are expected to increase every year from 2023 through 2028 with an average CAGR of approximately 3.1%. Due to higher cost, greater complexity and longer equipment and permitting lead times compared to conventional onshore drilling, offshore projects are characterized by long-cycle planning and investment horizons. This dynamic results in greater stability and resilience through commodity price cycles. Historically, onshore rig counts are more variable during periods of commodity price volatility than offshore rig counts.
The increased focus on the need for low carbon-intensity production has also highlighted the importance of the U.S. GoM and its lower global greenhouse gas (“GHGs”) emissions intensity (CO2e/kboe) relative to other global offshore basins. According to Wood Mackenzie’s Emissions Benchmarking Tool, U.S. Gulf of Mexico Deepwater’s weighted average emissions intensity in 2023 was 8.16 tCO2e/kboe compared to a global weighted average of 20.45 tCO2e/kboe. As a result, we believe that the U.S. GoM will continue to be an area of increased investment and production by many of the large oil and gas producers.
Mexico GoM
While Mexico appears to hold significant promise as a deepwater and ultra-deepwater basin in the future, recent political setbacks and administrative challenges have frustrated plans for investment by non-Mexican oil and gas companies. Since the fourth quarter of 2023, maritime regulators have also curtailed our Naviera’s ability to enjoy Mexican cabotage and other privileges, despite our non-Mexican ownership levels being within the
8
thresholds permitted by Mexican law. See “—Recent Developments—Mexico Cabotage Status” for additional discussion of the status of our operations in the Mexican market.
Brazil
Based on Rystad industry data, Brazil is expected to receive the most deepwater and ultra-deepwater oil and gas investment worldwide between 2024 and 2027. Brazil has seen a significant increase in investment in its upstream resources from private exploration and production companies since the 2014 downturn, when state oil company Petrobras began selective asset sales to address its balance sheet issues. Supported by the current oil price environment, many large international oil companies, as well as local independents, are investing in deepwater and ultra-deepwater exploration and development activities. Additionally, Petrobras has publicly announced plans to spend approximately $73 billion on exploration and production activities from 2024 through 2028.
Based on Rystad industry data, the offshore rig count in Brazil is forecasted to increase to 32 rigs in 2025, a 33% increase from 2023 levels. In addition, Rystad industry data anticipates rig count levels remaining above 2024 levels through at least 2028. The increase in activity will likely require additional vessels to mobilize to the area to support this increased drilling activity. As of July 31, 2024, ten U.S. Jones Act high- and ultra high-spec vessels have relocated from the U.S. GoM to Brazil in order to fulfill the current demand in that region.
Caribbean and Northern South America
The Caribbean and Northern South America are developing markets for deepwater and ultra-deepwater exploration and production. Activity in the region is primarily focused in the Guyana-Suriname basin, but also includes Colombia, Trinidad and occasionally other Caribbean islands. Due to its proximity to the U.S. GoM and the Mexico GoM and the offshore operating environment, high-spec and ultra high-spec U.S.-flagged and Mexico-flagged OSVs are ideally suited to serve customers in this region. Currently, over 50% of the OSVs operating in the area are U.S.-flagged.
Since the discovery of the Liza-1 well in 2015, the Guyana-Suriname basin has become one of the fastest growing deepwater and ultra-deepwater exploration markets in the world. In April of 2022, ExxonMobil announced the final investment decision, or FID, for the Yellowtail development offshore Guyana, which was the fourth, and largest, project in the Staebroek Block. The total investment is expected to reach $12 billion and deliver a daily output of 250,000 barrels a day. According to published data from Hess Corporation as of May 2024, ExxonMobil’s partner in the Yellowtail development, the Staebroek Block’s gross discovered recoverable resource estimate is more than 11 billion barrels of oil equivalent. Other operators, such as TotalEnergies, have announced plans to invest in the region with a FID for Block 58 in Suriname expected to be approved in the fourth quarter of 2024.
As of July 31, 2024, there were six offshore rigs operating in this region. According to Rystad industry data, this number is expected to increase to 11 offshore rigs by 2028. These activity levels will require additional vessels to mobilize to the area to support drilling activity. We believe that additional U.S.-flagged vessels are well-suited to support these new drilling programs. As of July 31, 2024, 15 U.S. Jones Act high- and ultra high-spec vessels have relocated from the U.S. GoM to the Caribbean and South America in order to fulfill the current demand in those regions.
Non-Oilfield Services
Beyond Oilfield Services, our vessels are actively involved in the support of critical offshore activities in our core geographic regions, including military services, renewable energy development and other non-oilfield
9
service offerings. As of July 31, 2024, 18 U.S. Jones Act-qualified high- and ultra high-spec vessels were working in military, offshore wind, aerospace or other industries. These non-oilfield markets have had a material impact on an already tight U.S. Jones Act market. Below are more detailed descriptions of the industry dynamics within each of those end-customer markets:
Military Support Services
The United States has relied on private vessel owners and operators comprising the U.S. Merchant Marine to provide vessels that support U.S. military readiness and security, as well as peacetime and wartime services. We provide such support primarily from the East and West Coasts of the United States. The use of specialized vessels, including OSVs and MPSVs, has increased as the broad utility of these vessels has been recognized by government customers, particularly the U.S. Navy. We believe the opportunities for additional military use could include:
| • | Service offerings for the U.S. Special Operations Command, the organization tasked with overseeing the various special operations of the U.S. Army, Marine Corps, Navy and Air Force; |
| • | O&M contract opportunities; and |
| • | Operational support for a growing fleet of U.S. Navy vessels. |
Military support services represent a significant growth opportunity beyond the oilfield. Military business provides a diversified customer market that counterbalances oilfield volatility and generally comes with longer tenor contracts (generally more than three years). We continue to grow our military support services offerings and expect them to continue to grow in the future.
Renewable Energy Development
The offshore wind market is in its early stage of development and shows potential as an emerging market for our services in the U.S. GoM, as well as certain areas on the East and West Coasts of the United States. Field surveying, construction and operation for offshore wind require many of the core competencies and vessel specifications used in oilfield services, creating opportunities for legacy oilfield vessel providers to service this market. Moreover, many of the wind farms developed in domestic U.S. waters will require Jones Act-qualified vessels thereby creating cabotage protections for this work.
Vessel requirements for offshore wind development typically span three distinct phases:
| • | Pre-Construction Surveying: This phase of development requires surveying vessels to ascertain sea bottom, sea state, and wind conditions, as well as site clearing for potential project development. Examples of such services include removal of boulders and unexploded ordnances on the seabed, as well as providing sound barriers to protect sea mammals from offshore wind construction activities and noise. |
| • | Construction and Installation: This phase of development is the most vessel intensive and will require service vessels to execute and support a range of tasks including foundation, monopile, and wind turbine installations, cable laying, installation of electrical transmission lines between field units and the onshore/offshore electric grid, and the transportation and housing of construction and installation crews, among others. |
| • | Ongoing Service and Maintenance: This phase will require vessels to provide ongoing service and maintenance to offshore wind infrastructure assets including crew and equipment transfers, asset retrofitting and replacement, and ongoing infrastructure monitoring services. |
Further, in 2021, the Biden Administration released its Offshore Wind Energy Strategy outlining its goal of deploying 30 gigawatts of offshore wind in the United States by 2030. Higher than expected interest rates,
10
inflation and post-COVID supply chain restraints have hampered the pace of development, which is now forecasted to achieve approximately 18 gigawatts by 2030, but continuing to grow from there. According to Maritime Strategies International (“MSI”), 49 wind energy projects have been identified along U.S. coastlines with construction on 8 of these projects to begin between 2025 and 2027. Additionally, five lease sales on the West Coast of the United States and one lease sale in the U.S. GoM are expected to require floating installation capabilities and vessels, which Hornbeck’s fleet is capable of providing. According to MSI, U.S. offshore wind projects are characterized by increasing distance from shore and larger generating capacity. The average distance from shore is expected to grow from 12 km in 2020 to 38 km in 2035. The average generating capacity of offshore wind is expected to increase five-fold. We believe these larger and farther-from-shore projects will provide our existing fleet of vessels with new opportunities for which they are well-suited. In addition, these opportunities are likely to create demand for our C/SOV which is expected to be delivered in 2025. We know of only three other Jones Act qualified SOVs or CSOVs that are under construction. Thus, these types of vessels, which are uniquely suited for offshore wind projects, may be under-supplied as such offshore projects continue to be built. Continued growth of the offshore wind market in the U.S. is not guaranteed and is subject to change as a result of shifts in political policies that currently favor offshore wind growth. Such changes in policy may occur, for example, as a result of the November 2024 presidential election in the U.S.
Other Non-Oilfield Services
We have multiple areas of growth in other non-oilfield services including:
| • | Humanitarian Aid and Disaster Relief: Because of the versatility of our vessels, we are often contracted as part of the response to an offshore crisis, including as service support for the Federal Emergency Management Agency. In the past, we have supported oil spill relief, non-oilfield hurricane relief, aircraft disasters, vessel and other equipment salvage and other post-disaster recovery efforts. |
| • | Aerospace: Our vessels are equipped to support aerospace launches that call for rocket component landing and recovery capabilities. In addition, we have supported the aerospace industry through vessel crewing and other vessel management agreements. |
| • | Telecommunications: Our vessels can also be retrofitted to support the installation, testing and retrieval of fiber-optic cable. |
Our Competitive Strengths
Leading presence in the United States and Latin America
Hornbeck was established in 1997 and has one of the most capable and high-spec fleets of vessels in the industry. Based on publicly-available information compiled by the Company and data provided by Spinergie, we believe that our fleet of 41 high-spec and ultra high-spec OSVs, totaling 217,140 in DWT capacity, represents 6.6% of the 3,290,183 total DWT of such vessels in the world, making Hornbeck the third largest fleet out of 163 companies that own and operate high-spec or ultra high-spec OSVs worldwide. Furthermore, we believe that our fleet of 15 U.S.-flagged ultra high-spec OSVs, totaling 91,123 in DWT capacity, represents the largest fleet of such vessels operating in the United States measured by DWT capacity. Additionally, we are one of the top operators of OSVs, based on DWT, in each of our two core geographic markets, which include 2,459,593 DWT and constitute 41.7% of the total supply of 5,847,658 DWT to such markets. Our 46 U.S.-flagged OSVs, totaling 206,767 in DWT capacity, comprise the second largest fleet of technologically advanced, OSVs qualified for work in the U.S. GoM under the Jones Act. As of July 31, 2024, our active fleet of OSVs and MPSVs consisted of (i) 20 U.S.-flagged OSVs and seven MPSVs in the U.S. GoM, (ii) five OSVs and one MPSV throughout the U.S. Atlantic, (iii) one OSV and three MPSVs in the U.S. Pacific, (iv) seven OSVs offshore Brazil, (v) one OSV offshore Argentina, (vi) four OSVs in the Caribbean and Northern South America and (vii) one OSV and one MPSV offshore Mexico. We believe that having scale in our core markets with the flexibility to transfer vessels among regions benefits our customers and provides us with operating efficiencies.
11
Large and diverse fleet of technologically advanced high-spec and ultra high-spec vessels
Over the past 27 years, we have assembled a multi-class fleet of 60 OSVs and 15 MPSVs. Since 2014, we have focused on expanding our line of high-spec and ultra high-spec vessels, increasing our fleet of such vessels from 41% of our fleet in 2014 to 75% of our fleet in 2024. High-spec and ultra high-spec vessels incorporate sophisticated technologies that are designed specifically to operate safely in complex and challenging environments and are equipped with specialty equipment and other features to respond to the needs of our customers through the project development and operation lifecycle of an offshore oilfield. These technologies include DP, roll reduction systems and controllable pitch thrusters, which allow our vessels to maintain a fixed position with minimal variance. Our cargo-handling systems permit high-volume transfer rates of liquid mud and dry bulk materials. In addition, we are able to outfit our vessels with specialty equipment and certain features as needed for specific projects. The greater fuel efficiency, larger cargo-carrying capacity, advanced mud-handling systems and other technical features of our high-spec and ultra high-spec vessels enhance offshore project efficiency and create a compelling value proposition for our customers. As a result of our fleet mix, in-house engineering capabilities, operations history and market strategies, we believe that we earn higher average dayrates compared to our competitors. According to industry data from Fearnley Offshore Supply, our average dayrates were 87%, 41%, and 16% higher than the global average term rates of comparably sized vessels owned by other operators in 2022, 2023, and the six months ended June 30, 2024, respectively.
Strong market position due to qualification under the Jones Act and favorable sector tailwinds
As a leader in marine transportation services to the offshore oilfield industry, we believe Hornbeck is well-positioned to capitalize on favorable industry conditions for significant growth opportunities, particularly in offshore wind development and support services to the U.S. military on the East and West Coasts of the United States. The United States has strict cabotage laws that provide insulation from most sources of foreign competition for our U.S. fleet for coastwise services. In addition, the U.S. high-spec and ultra high-spec vessel supply is highly restricted with long lead times for new construction. High newbuild costs result in unfavorable return economics for newbuilds, which is exacerbated by limited pools of available capital to make investments into new fleet construction. We believe our reputation for high-quality, safe and reliable operations, complex problem solving, operational flexibility, and world-class vessels allows Hornbeck to compete effectively for and retain qualified mariners, which positions Hornbeck for long-term sustainable growth in a tight labor market. In addition, our robust offering of services, ranging from initial construction to decommissioning, has allowed us to compete effectively and remain a trusted service provider for active offshore companies, as well as the U.S. military.
Successful track record of strategic vessel acquisitions
We have built our fleet through a combination of newbuilds and strategic acquisitions from other operators. Our management team’s extensive naval architecture, marine engineering and shipyard experience has enabled us to quickly integrate newly acquired vessels into our fleet and retrofit them to meet our quality standards and customer needs cost-effectively. From time to time, we consider opportunistic acquisitions of single vessels, vessel fleets, and businesses that strategically complement our existing operations to enable us to grow our business and better serve our customers. Since 2017, we have successfully completed the acquisition of 19 OSVs, 18 of which are currently operating as part of our high-spec and ultra high-spec fleet and one of which is currently undergoing conversion into a MPSV for dual-service as either a C/SOV or flotel.
Diversified service offerings and customer markets provide stability to cash flows
We have well-established relationships with leading oilfield and non-oilfield companies and the U.S. government and believe such relationships are in part maintained because of our diversified service offerings in the oilfield and non-oilfield customer markets. Our diversified service offerings allow us to pivot based on our
12
customers’ needs and gives our customers confidence to commit to longer-term contracts for our services, which provides us with cash flow stability. Additionally, these large, integrated customers are financially stable and can better withstand economic or market downturns in a volatile market, and we believe maintaining relationships with these customers will ultimately result in better visibility to vessel utilization and greater liquidity for us in the future.
Experienced management team with proven track record
Our founder-led executive management team has an average of over 37 years of domestic and international marine transportation industry-related experience and has worked together at the Company for over 20 years. Our team is comprised of individuals with extensive, global experience with backgrounds across many diverse fields including engineering, project management, military service, finance, accounting, legal, risk management and corporate leadership. We believe that our team has successfully demonstrated its ability to grow our fleet through new construction and strategic acquisitions and to secure profitable contracts for our vessels in both favorable and unfavorable market conditions in domestic and foreign markets.
Attractive growth opportunities
Our fleet of technologically advanced high-spec and ultra high-spec vessels is increasingly being deployed to serve the accelerating needs of the U.S. Military, renewable energy, and aerospace industries. Many of these high-growth markets require U.S.-flagged Jones Act-qualified vessels, which can be custom tailored to address a broad spectrum of services. For these applications, our vessels are typically contracted for greater than three years, providing a counter-balance to cyclicality experienced in our oilfield end-markets.
Our Strategy
Leverage our geographic presence in the United States and Latin America and grow industry leading service capabilities
We have strategically chosen to focus our efforts in two core geographic markets, the United States and Latin America. While the U.S. GoM will continue to be a priority for us, in recent years we expanded our presence in each of the Mexico GoM, the East and West Coasts of the United States, the Caribbean, Northern South America and Brazil, as we anticipate long-term growth in those markets. Given the relative proximity of these markets, we are able to readily move our vessels among them and retain flexibility to relocate those vessels back to the U.S. GoM or into adjacent locations across our operating regions. We believe this allows us to conduct a more thorough on-going alternative analysis for vessel deployments among such markets and, thus, better manage our portfolio of contracts to enhance dayrates and utilization over time as contracting opportunities arise. Our Jones Act-qualified high-spec and ultra high-spec OSVs account for approximately 26% of the total industry supply of such vessels. Our vessels have been adapted to operate in a range of oilfield specialty configurations, including flotel services, extended-reach well testing, seismic, deepwater and ultra-deepwater well stimulation, other enhanced oil recovery activities, high pressure pumping, deep-well mooring, ROV support, subsea construction, installation, IRM work and decommissioning services. We are also growing our diverse non-oilfield specialty services, such as military applications, offshore wind farms, oceanographic research, telecommunications, and aerospace projects.
Pursue differentiated customer offerings to optimize utilization and free cash flow generation
We seek to balance and diversify our service offerings to customers, to optimize our vessel utilization and stabilize our free cash flow generation. For example, in addition to our long-term charters in oilfield services and with military and renewable energy customers that contribute to contracted backlog and provide utilization stability, we also seek out short-term charters such as spot oilfield services that typically have higher dayrates.
13
This contracting strategy balances our financial profile between longer-term charters and the flexibility to capture current market dayrates for a portion of our fleet. Our current contracting approach allows us to consistently perform well against our OSV peers when comparing average OSV dayrates and gross margins. The flexibility of our vessel capabilities is designed to optimize our utilization and allows us to pivot in response to market conditions and customer needs, which can lead to more stable free cash flow generation.
Apply existing, and develop new, technologies to meet our customers’ vessel needs and expand our fleet offerings
Our in-house engineering team has been instrumental in applying existing, and developing new, technologies that meet our customers’ vessel needs and provide us with the opportunity to enter new customer markets. For instance, our OSVs and MPSVs are designed to meet the higher capacity and performance needs of our oilfield clients’ increasingly complex drilling and production programs and the diverse needs of our U.S. military, renewable energy and humanitarian aid and disaster relief customers. Further, we are able to reconfigure or retrofit existing assets with existing or new technology to participate in new customer markets such as offshore wind, aerospace and telecommunications. Specifically, we are currently deploying capital to upgrade certain of our vessels to dual service capabilities to better service the oilfield services market as well as the emerging offshore wind market. We remain committed to applying existing and developing new technologies to maintain a technologically advanced fleet that will enable us to continue to provide a high level of customer service and meet the developing needs of our customers.
Focus on selective acquisitions that are strategically and financially accretive
We seek to opportunistically grow our fleet through strategic and financially accretive acquisitions. Our screening criteria focuses on expanding the depth and breadth of our fleet mix as well as diversifying service offerings in our core markets. From time to time, we consider opportunistic acquisitions of single vessels, vessel fleets, and businesses that strategically complement our existing operations to enable us to grow our business and better serve our customers. For example, we recently completed the acquisition of 12 high-spec OSVs, which we refer to as the ECO Acquisitions.
Maintain a conservative balance sheet, disciplined growth, and robust free cash flow generation through cycles
We adhere to financial principles designed to maintain a conservative balance sheet, disciplined growth, and robust free cash flow generation. Our balance sheet strategy targets less than 1.0x leverage with ample excess liquidity available to withstand industry cycles or take advantage of disciplined growth opportunities.
Our growth strategy involves a disciplined screening of opportunities for differentiated assets that create competitive advantages and is focused on returns and payback periods. Our cash flow generation abilities are centered around maintaining flexible costs and lean organizational structures that seek efficiencies through continuous operational improvement and working capital management.
Continued commitment to sustainability and safety
Safety is of great importance to us and offshore operators due to the environmental and regulatory sensitivity associated with offshore drilling and production activity and wind development. We believe certain of our efforts, such as adopting shipboard energy efficiency management plans, installing emission monitoring systems and pursuing other operational efficiencies, have been successful, allowing us to meet our customers’ needs while supporting our efforts to reduce our emissions of GHGs. Additionally, since 2020, our focus on safely addressing operational risk has contributed to maintaining an industry-low TRIR. Our most recent 5-year
14
average TRIR was 0.10, outperforming peer averages from the International Marine Contractors Association (“IMCA”) and International Support Owners Association (“ISOA”). Further, in addition to industry standard certifications, as part of our commitment to safety and quality, we have voluntarily pursued and received certifications and classifications that we believe are not generally held by other companies in our industry. We believe that customers recognize our relentless commitment to safety, which contributes to our positive reputation and competitive advantage.
We recently placed into service a high-tech DP simulator that provides an interactive and immersive training experience for current and future mariners who serve in DP officer (“DPO”) roles on our vessels. Configured to incorporate the controls and models of the three brands of DP systems that we use on our vessels, as well as to simulate four different specific vessel types and classes within our fleet, this highly customized design affords DPOs the opportunity to train on the same or substantially similar DP systems installed on our vessels. The simulator provides us with a sophisticated training platform from which to train our mariners. Our mariners are engaged in a virtual ship-like environment that can subject them to realistic failure situations in a controlled atmosphere, thus facilitating a dynamic learning process. Our DP simulator is designed to make training more efficient, cost effective and risk free, and ultimately provide an optimum outcome for trainees and the Company. The simulator is located at our headquarters in Covington, Louisiana.
We also provide our chief shipmates and other engine-room personnel training on a land-based version of our onboard oily water separator unit, which enhances crew knowledge of a critical environmental safeguard and, we believe, fosters our culture of environmental stewardship and risk mitigation.
Recent Developments
First Lien Revolving Credit Facility
On August 13, 2024, we entered into a First Lien Revolving Credit Facility with DNB Bank ASA, New York Branch, as administrative agent, Wilmington Trust, National Association, as collateral agent, and the lenders party thereto. The current aggregate commitments for the revolving loans (the “Revolving Loans”) under the First Lien Revolving Credit Facility total $75 million, all of which remain undrawn. The First Lien Revolving Credit Facility also has a customary uncommitted incremental facility in an amount up to $50 million (or such greater amount as consented to by all lenders). Our ability to borrow under the First Lien Revolving Credit Facility is subject to customary conditions precedent, including no default or event of default, representations and warranties being true and correct in all material respects, and pro forma compliance with the financial covenants therein. See “Management’s Discussion and Analysis of Financial Condition and Results of Operations—Liquidity and Capital Resources—Debt Agreements.”
Resumption of MPSV Newbuild Construction
In October 2023, we entered into a final settlement of a dispute with the Surety and Gulf Island related to the construction of two MPSV newbuilds. Pursuant to the settlement agreement, Gulf Island released all claims asserted against us and we released our claims against Gulf Island and the Surety. Further, the Surety agreed to take over and complete the construction of the two U.S.-flagged, Jones Act-qualified, HOS 400 class MPSVs at a shipyard acceptable to us. In December 2023, Eastern was mutually selected by the parties and was contracted by the Surety to complete construction of the two MPSVs. We are obligated to pay only the remaining portion of the original shipyard contract price for the two MPSVs, which amounted to $53.8 million in the aggregate on the settlement date. The Surety is required to cure all defaults of Gulf Island and pay all completion costs in excess of the $53.8 million remaining original contract price, excluding any approved change orders arising after the settlement date. There is no cap on the Surety’s completion cost. As of June 30, 2024, we had paid $5.3 million to Eastern related to the completion of these two MPSVs.
15
Pursuant to the settlement, the Surety is contractually required to deliver both MPSVs in 2025. We were provided an updated schedule by the Surety and Eastern indicating that they currently expect a six-month shipyard delay for the delivery of the first of the two MPSVs. An updated delivery schedule has not yet been provided for the second vessel. Following physical delivery by the shipyard, we expect each vessel to undergo crane and other system installations, which we expect will make the first vessel available for commercial service in the first half of 2026, and the second vessel thereafter. In addition to the remaining $48.5 million of the original contract price as of June 30, 2024, we expect to incur an incremental $91.2 million in the aggregate for outfitting, overhead and the post-delivery discretionary enhancements, of which $63.6 million solely relates to the purchase and installation of cranes on both vessels. As of June 30, 2024, we had incurred $0.8 million of such incremental amounts, excluding capitalized interest. Once placed in service, we expect that our book carrying value for each vessel will be approximately $80.0 million, which is significantly below the expected market value of Jones Act-qualified vessels of this age, type, size and specifications.
ECO Acquisitions
In January 2024, we took delivery of the sixth and final vessel under ECO Acquisitions #2 and paid $15.3 million for the remaining 90% of the original purchase price and $0.1 million for purchase price adjustments related to discretionary enhancements completed in the shipyard by Nautical. As of June 30, 2024, we had paid an aggregate of $102.0 million for the original purchase price, including deposits, and $10.6 million in purchase price adjustments associated with discretionary enhancements, additional outfitting and post-closing modifications for the ECO Acquisitions #2 vessels. Delivery of this final vessel marks the completion of the combined 12 vessel acquisitions under the ECO Acquisitions. We expect to incur an incremental $0.2 million related to additional outfitting, discretionary enhancements and post-closing modifications for certain of these vessels during the remainder of 2024.
Mexico Cabotage Status
In the fourth quarter of 2023, maritime regulators in Mexico implemented new approaches in their oversight of Navieras that have historically had permissible levels of non-Mexican ownership, such as ours. As a result, we took legal action in Mexico to preserve our cabotage privileges there, and a Mexican court ordered that our cabotage privileges be reinstated. We have appealed this decision to further clarify the court’s ruling, and our cabotage privileges remain active during the pendency of the appeal. We expect the appellate process to last between one and three years. Despite these favorable court rulings, and the pendency of appeals, Mexican maritime regulators have limited our ability to object to the employment of non-Mexican flag vessels that compete with our own Mexican-flagged vessels, which is one of the privileges of a Mexican Naviera. Since the fourth quarter of 2023, we have moved all but two of our Mexican-flagged vessels into various non-Mexican international markets, while continuing to utilize our highly-skilled Mexican mariners and shore-based employees as part of our international services.
Ongoing Acquisition/Investment Activities
We regularly evaluate additional acquisition opportunities and frequently engage in discussions with potential sellers. We are currently focused on pursuing acquisition opportunities that will further diversify our vessel holdings and the specialty services we offer. The timeline required to negotiate and close on any one or more acquisition opportunities is at times unpredictable and can vary greatly.
Our acquisitions may require material investments and could result in significant modifications to our capital plans, both in the aggregate amount of capital expenditures to be made and a reallocation of capital. Our acquisitions (including the ECO Acquisitions) are typically made for a purchase price which historically we have funded with a combination of borrowings, cash generated from operations and debt and/or equity issuances.
16
We typically do not announce a transaction until after we have executed a definitive agreement. In certain cases, in order to protect our business interests or for other reasons, we may defer public announcement of a transaction until closing or a later date. Past experience has demonstrated that discussions and negotiations regarding a potential transaction can advance or terminate in a short period of time. Moreover, the closing of any transaction for which we have entered into a definitive agreement may be subject to customary and other closing conditions, which may not ultimately be satisfied or waived. Accordingly, we can give no assurance that our current or future acquisition or investment efforts will be successful.
Risk Factors Summary
Our business is subject to numerous risks and uncertainties, including, but not limited to, those highlighted in the section titled “Risk Factors” and summarized below. We have various categories of risks, including risks relating to our business; risks relating to legal, regulatory, accounting and tax matters; risks relating to our indebtedness; and risks relating to this offering and ownership of our common stock, which are discussed more fully in the section titled “Risk Factors.” As a result, this risk factor summary does not contain all of the information that may be important to you, and you should read this risk factor summary together with the more detailed discussion of risks and uncertainties set forth in the section titled “Risk Factors.” These risks include, but are not limited to, the following:
Risks Relating to Our Business
| • | We derive substantial revenues from companies in the oil and natural gas exploration and production industry, which is a historically cyclical industry with levels of activity that are directly affected by the levels and volatility of oil and natural gas prices. |
| • | Our operations may be impacted by changing macroeconomic conditions, including inflation. |
| • | Recently completed and future acquisitions by us may create additional risks. |
| • | We must continue to comply with the Jones Act’s citizenship requirements. |
| • | Imposition of laws, executive actions or regulatory initiatives to restrict, delay or cancel leasing, permitting or drilling activities in deepwaters of the U.S. or foreign countries may reduce demand for our services and products and have a material adverse effect on our business, financial condition or results of operations. |
| • | We may not be able to complete the construction of our remaining two newbuilds and may experience delays related to such newbuilds. |
| • | We operate in a highly competitive industry. |
| • | In addition to industry concentrations, we have certain customer concentrations, and the loss of a significant customer would adversely impact our financial results. |
| • | The early termination of or inability to renew contracts for our vessels could have an adverse effect on our operations. |
| • | Uncertainty surrounding potential legal, regulatory and policy changes, as well as the potential for general market volatility and regulatory uncertainty, because of the upcoming U.S. presidential and congressional elections may have a material adverse effect on our results of operations, cash flows and financial position. |
| • | Our contracts with the United States government might not be renewed, may be renewed at lower rates or may impose additional requirements. |
| • | Our operations in international markets and shipyard activities in foreign shipyards subjects us to risks inherent in conducting business internationally. |
17
| • | Our operations may be materially adversely affected by tropical storms and hurricanes. |
| • | Our business may be subject to risks related to climate change, including physical risks such as increased adverse weather patterns and transition risks such as evolving climate change regulation, alternative fuel measures and/or mandates, shifting consumer preferences, technological advances and negative shifts in market perception towards the oil and natural gas industry and associated businesses, any of which could result in increased operating expenses and capital costs or decreased resources and adversely affect our financial results. |
Risks Relating to Our Legal, Regulatory, Accounting and Tax Matters
| • | We may be unable to maintain an effective system of disclosure controls and procedures or internal control over financial reporting and produce timely and accurate financial statements or comply with applicable regulations. |
| • | Changes in tax laws could adversely affect our business, financial condition and results of operations. |
| • | We are subject to various anti-corruption laws and regulations and laws and regulations relating to economic sanctions. Violations of these laws and regulations could have a material adverse effect on our business, financial condition and results of operations. |
Risks Relating to Our Indebtedness
| • | We may not be able to generate sufficient cash to service all of our indebtedness or repay such indebtedness when due and may be forced to take other actions to satisfy our obligations under our indebtedness, such as refinancings, which may not be successful or completed on favorable terms. |
| • | Despite our current level of indebtedness, we and our subsidiaries may still be able to incur substantially more debt. This could further exacerbate the risks to our financial condition described herein. |
| • | Our indebtedness could materially adversely affect our financial condition. |
Risks Related to this Offering and Ownership of Our Common Stock
| • | Our common stock is subject to restrictions on foreign ownership and possible divestiture by non-U.S. citizen stockholders. |
| • | We will incur significantly increased costs and become subject to additional regulations and requirements as a result of becoming a public company, and our management will be required to devote substantial time to new compliance matters, which could lower our profits or make it more difficult to run our business. |
| • | We have a high level of concentrated stock ownership. |
| • | Anti-takeover provisions in our organizational documents could delay or prevent a change of control. |
Additional risks, beyond those summarized above or discussed elsewhere in this prospectus, may apply to our business, activities or operations as currently conducted or as we may conduct them in the future or in the markets in which we operate or may in the future operate.
If we are unable to adequately address these and other risks we face, our business, results of operations, financial condition and prospects may be harmed. You should carefully consider all of the information set forth in this prospectus and, in particular, should evaluate the specific factors set forth under “Risk Factors” in deciding whether to invest in our common stock.
18
Organizational Structure
The following diagram illustrates our organizational structure after giving effect to this offering.
Our Principal Stockholders
Our principal stockholders consist of our three largest stockholders (funds, investment vehicles or accounts managed or advised by Ares, Whitebox or Highbridge or their respective affiliates), who, as of July 31, 2024, collectively own 62.6% of our common stock and 85.8% of our Jones Act Warrants, which are convertible under certain circumstances into 9,767,165 shares of our common stock ( shares after giving effect to the stock split). The principal stockholders are offering shares of our common stock (or shares if the underwriters exercise in full their option to purchase additional shares of common stock from the selling stockholders). After giving effect to this offering, the principal stockholders would own % of our common stock, and % of our Jones Act Warrants, which would be convertible under certain circumstances into shares of our common stock. On a diluted basis, after giving effect to the conversion of these Jones Act Warrants and this offering, the principal stockholders would own % of our common stock. See “—Principal and Selling Stockholders.”
Ares Management Corporation (NYSE: ARES) is a leading global alternative investment manager offering clients complementary primary and secondary investment solutions across the credit, real estate, private equity and infrastructure asset classes. Ares Management Corporation seeks to provide flexible capital to support
businesses and create value for its stakeholders and within its communities. By collaborating across its investment groups, Ares Management Corporation aims to generate consistent and attractive investment returns throughout market cycles. As of June 30, 2024, Ares Management Corporation’s global platform had approximately 3,000 employees operating across North America, Europe, Asia Pacific and the Middle East and approximately $447 billion of assets under management.
Whitebox Advisors LLC (“Whitebox”) is a multi-strategy alternative asset manager that seeks to generate optimal risk-adjusted returns for a diversified base of public institutions, private entities and qualified individuals. Founded in 1999, Whitebox invests across asset classes, geographies, and markets through the hedge fund vehicles and institutional accounts that it advises. The firm maintains offices in Minneapolis, Austin,
New York, London and Sydney.
19
Highbridge Capital Management (“Highbridge”) is a global alternative investment firm offering credit and volatility focused solutions across a range of liquidity and investment profiles, including hedge funds, drawdown vehicles, and co-investments. Highbridge manages capital for sophisticated investors, which include financial institutions, public and corporate pension funds, sovereign wealth funds, endowments, and family offices. Highbridge is headquartered in New York, with a research presence in London. Highbridge is an indirect subsidiary of J.P. Morgan Chase & Co.
We use the term “principal stockholders” in this prospectus to describe certain funds, investment vehicles or accounts managed or advised by Ares, Whitebox or Highbridge or their respective affiliates, in each case, that own shares of our common stock.
Stock Split
On , 2024, our Board of Directors approved a -for-one split of our common stock, which is to be effected after the effectiveness of the registration statement of which this prospectus forms a part and in connection with the consummation of this offering. The par value will not be adjusted as a result of the stock split; however, the number of shares that we are authorized to issue will be increased to .
Company Corporate Information
Hornbeck Offshore Services, Inc. was incorporated under the laws of the State of Delaware on June 2, 1997. Our principal executive offices are located at 103 Northpark Boulevard, Suite 300, Covington, LA 70433, and our telephone number is (985) 727-2000. Our website address is www.hornbeckoffshore.com. Information contained on, or that can be accessed through, our website is not part of and is not incorporated by reference into this prospectus, and you should not consider information on our website to be part of this prospectus.
20
The Offering
| Common stock offered by us |
shares. |
| Common stock offered by the selling stockholders |
shares. |
| Underwriters’ option to purchase additional shares of common stock from the selling stockholders |
The selling stockholders have granted the underwriters an option for a period of 30 days to purchase up to an aggregate of additional shares of our common stock. |
| Common stock outstanding after this offering |
shares.1 |
| Use of Proceeds |
We estimate that the net proceeds to us from this offering, after deducting estimated underwriting discounts and commissions and estimated offering expenses payable by us, will be approximately $ million, assuming an initial public offering price of $ per share (which is the midpoint of the estimated offering price range shown on the cover page of this prospectus). For a sensitivity analysis as to the offering price and other information, see “Use of Proceeds.” |
| We intend to use the net proceeds to us from this offering for general corporate purposes. We will not receive any proceeds from the sale of shares in this offering by the selling stockholders. |
| Dividend Policy |
We do not currently anticipate paying any dividends on our common stock immediately following this offering. We expect to retain all future earnings for use in the operation and expansion of our business. Following this offering and upon repayment of certain outstanding indebtedness, we may reevaluate our dividend policy. Any decision to declare and pay dividends in the future will be made at the sole discretion of our Board of Directors and will depend on various factors. See “Dividend Policy.” |
| Directed Share Program |
At our request, the underwriters have reserved up to 5% of the shares of common stock offered by this prospectus for sale, at the initial public offering price to certain individuals through a directed share program, including our directors, officers, employees and other persons identified by the Company. The number of shares of our common stock available for sale to the general public will be reduced to the extent these individuals purchase such reserved shares. Any reserved shares that are not so purchased will be offered by the |
| 1 | Does not reflect shares of common stock that may be issued upon exercise of outstanding Jones Act Warrants, at an exercise price of $0.00001 per share, or upon exercise of outstanding Creditor Warrants, at an exercise price of $ per share (after giving effect to the stock split). |
21
| underwriters to the general public on the same basis as the other shares offered by this prospectus. See “Underwriting (Conflicts of Interest)—Directed Share Program.” |
| Risk Factors |
See “Risk Factors” for a discussion of risks you should carefully consider before deciding to invest in our common stock. |
| Conflicts of Interest |
Highbridge, one of our principal stockholders, is an indirect subsidiary of J.P. Morgan Chase & Co. As a result, J.P. Morgan Chase & Co. will be deemed to have a “conflict of interest” within the meaning of Financial Industry Regulatory Authority (“FINRA”) Rule 5121. FINRA Rule 5121 imposes certain requirements on a FINRA member participating in the public offering of securities of an issuer if there is a conflict of interest and/or if that issuer controls, is controlled by, or is under common control with, the FINRA member. Accordingly, this offering is being made in compliance with the requirements of Rule 5121 regarding a FINRA member firm’s underwriting of securities of an affiliate. Neither J.P. Morgan Chase & Co. nor any other affiliated agent of J.P. Morgan Chase & Co. will sell any of our securities to any account over which it exercises discretionary authority unless it has received specific written approval from the account holder in accordance with Rule 5121. Barclays Capital Inc. has been appointed as a “qualified independent underwriter” in connection with this offering. |
| Listing |
We have applied to have our common stock approved for listing on the NYSE under the symbol “HOS.” |
The number of shares of our common stock to be outstanding after this offering is based on shares of our common stock outstanding as of June 30, 2024, after giving effect to the stock split, and does not reflect:
| • | shares of common stock that may be issued upon exercise of outstanding Jones Act Warrants, at an exercise price of $0.00001 per share; |
| • | shares of common stock that may be issued upon exercise of outstanding Creditor Warrants, at an exercise price of $ per share; |
| • | shares of common stock that may be issued upon the exercise of outstanding options at an average weighted exercise price of $ or the vesting of restricted stock units issued under our 2020 Management Incentive Plan; and |
| • | shares of common stock that may be issued pursuant to future awards under our 2020 Management Incentive Plan or our 2024 Omnibus Incentive Plan to be in effect following this offering. |
Unless otherwise indicated or the context otherwise requires, all information in this prospectus assumes or gives effect to:
| • | the filing and effectiveness of our amended and restated certificate of incorporation and the adoption of our amended and restated bylaws, each of which will occur immediately prior to the closing of this offering; |
| • | the -for-one stock split of our shares of common stock and the related increase of our authorized shares of common stock to shares; |
22
| • | an initial offering price of $ per share of common stock (which is the midpoint of the estimated offering price range shown on the cover page of this prospectus); |
| • | no exercise of the outstanding options or warrants described above; and |
| • | no exercise of the underwriters’ option to purchase up to an additional shares of common stock from the selling stockholders. |
23
Summary Historical Financial and Other Data
The following table shows our summary historical consolidated financial and other data for the periods and as of the dates indicated. The summary consolidated statements of operations and cash flow data for the six months ended June 30, 2024 and 2023 and the balance sheet data as of June 30, 2024 have been derived from our Quarterly Financial Statements included elsewhere in this prospectus. The summary consolidated statements of operations and cash flow data for the years ended December 31, 2023, 2022 and 2021 and the balance sheet data as of December 31, 2023 and 2022 have been derived from our Annual Financial Statements included elsewhere in this prospectus.
Our historical results are not necessarily indicative of the results to be expected in any future period. You should read the following summary financial and other data in conjunction with the sections titled “Management’s Discussion and Analysis of Financial Condition and Results of Operations” and our Financial Statements and related notes included elsewhere in this prospectus.
| Six Months Ended June 30, | Year Ended December 31, | |||||||||||||||||||
| (dollars in thousands) | 2024 | 2023 | 2023 | 2022 | 2021 | |||||||||||||||
| Statement of Operations Data: |
||||||||||||||||||||
| Revenues: |
||||||||||||||||||||
| Vessel revenues |
$ | 283,207 | $ | 256,487 | $ | 528,780 | $ | 406,034 | $ | 214,680 | ||||||||||
| Non-vessel revenues |
23,569 | 21,902 | 44,669 | 45,192 | 41,620 | |||||||||||||||
|
|
|
|
|
|
|
|
|
|
|
|||||||||||
| 306,776 | 278,389 | 573,449 | 451,226 | 256,300 | ||||||||||||||||
| Costs and expenses: |
||||||||||||||||||||
| Operating expense |
181,818 | 141,501 | 305,463 | 214,788 | 142,819 | |||||||||||||||
| Depreciation expense |
18,093 | 11,753 | 26,355 | 18,601 | 15,672 | |||||||||||||||
| Amortization expense |
12,163 | 10,366 | 21,496 | 10,339 | 2,711 | |||||||||||||||
| General and administrative expense |
32,430 | 32,366 | 66,108 | 58,946 | 40,632 | |||||||||||||||
| Stock-based compensation expense |
4,423 | 15,363 | 19,097 | 5,330 | 3,372 | |||||||||||||||
| Terminated debt refinancing costs |
— | 3,633 | 3,693 | — | — | |||||||||||||||
|
|
|
|
|
|
|
|
|
|
|
|||||||||||
| 248,927 | 214,982 | 442,212 | 308,004 | 205,206 | ||||||||||||||||
|
|
|
|
|
|
|
|
|
|
|
|||||||||||
| Gain on sale of assets |
31 | 2,566 | 2,702 | 21,837 | 2,679 | |||||||||||||||
|
|
|
|
|
|
|
|
|
|
|
|||||||||||
| Operating income |
57,880 | 65,973 | 133,939 | 165,059 | 53,773 | |||||||||||||||
| Net interest expense |
10,430 | 18,142 | 30,047 | 38,340 | 35,284 | |||||||||||||||
| Other expense, net |
61 | 4,634 | 12,859 | 38,783 | 13,969 | |||||||||||||||
|
|
|
|
|
|
|
|
|
|
|
|||||||||||
| Income before income taxes |
47,389 | 43,197 | 91,033 | 87,936 | 4,520 | |||||||||||||||
| Income tax expense |
3,163 | 6,362 | 16,495 | 7,174 | 1,533 | |||||||||||||||
|
|
|
|
|
|
|
|
|
|
|
|||||||||||
| Net income |
$ | 44,226 | $ | 36,835 | $ | 74,538 | $ | 80,762 | $ | 2,987 | ||||||||||
|
|
|
|
|
|
|
|
|
|
|
|||||||||||
| Per Share Data(1): |
||||||||||||||||||||
| Net income per share: |
||||||||||||||||||||
| Basic earnings per common share |
$ | 2.59 | $ | 2.17 | $ | 4.38 | $ | 4.80 | $ | 0.20 | ||||||||||
|
|
|
|
|
|
|
|
|
|
|
|||||||||||
| Diluted earnings per common share |
$ | 2.29 | $ | 1.94 | $ | 3.89 | $ | 4.39 | $ | 0.19 | ||||||||||
|
|
|
|
|
|
|
|
|
|
|
|||||||||||
| Weighted average shares used in computing net income per share: |
||||||||||||||||||||
| Basic |
17,099 | 17,036 | 17,004 | 16,829 | 14,980 | |||||||||||||||
| Diluted |
19,293 | 19,119 | 19,157 | 18,394 | 15,497 | |||||||||||||||
24
| Six Months Ended June 30, | Year Ended December 31, | |||||||||||||||||||
| (dollars in thousands) | 2024 | 2023 | 2023 | 2022 | 2021 | |||||||||||||||
| Pro Forma Per Share Data (unaudited)(2): |
||||||||||||||||||||
| Pro forma net income per share: |
||||||||||||||||||||
| Pro forma basic earnings per common share |
$ | $ | $ | $ | $ | |||||||||||||||
|
|
|
|
|
|
|
|
|
|
|
|||||||||||
| Pro forma diluted earnings per common share |
$ | $ | $ | $ | $ | |||||||||||||||
|
|
|
|
|
|
|
|
|
|
|
|||||||||||
| Pro forma weighted average shares used in computing net income per share: |
||||||||||||||||||||
| Basic |
||||||||||||||||||||
| Diluted |
||||||||||||||||||||
| (1) | See Note 5 of our Quarterly Financial Statements and Note 5 to our Annual Financial Statements included elsewhere in this prospectus for an explanation of the method used to calculate our basic and diluted net earnings per common share and the weighted-average number of shares used in the computation of the per share amounts. |
| (2) | The unaudited pro forma basic earnings per common share was calculated by dividing net income by the weighted-average number of shares of common stock and Jones Act Warrants outstanding during the period, each as adjusted for the implementation of a -for-1 stock split with respect to our common stock. The unaudited pro forma diluted earnings per common share was calculated by dividing net income by the weighted-average number of common shares and Jones Act Warrants outstanding during the period plus the effect of dilutive Creditor Warrants, dilutive stock options and restricted stock unit awards, each as adjusted for the implementation of a -for-1 stock split with respect to our common stock. |
| (dollars in thousands) | June 30, 2024 |
December 31, 2023 |
December 31, 2022 |
|||||||||
| Balance Sheet Data (at period end): |
||||||||||||
| Cash and cash equivalents |
$ | 91,078 | $ | 120,055 | $ | 217,303 | ||||||
| Total current assets |
272,799 | 270,824 | 357,933 | |||||||||
| Property, plant and equipment, net |
625,270 | 602,422 | 449,249 | |||||||||
| Total assets |
987,252 | 946,519 | 860,220 | |||||||||
| Total current liabilities |
132,917 | 130,415 | 88,203 | |||||||||
| Total long-term debt, net of original issue discount and deferred financing costs |
349,001 | 349,001 | 410,258 | |||||||||
| Total liabilities |
585,976 | 585,226 | 589,388 | |||||||||
| Total stockholders’ equity |
401,276 | 361,293 | 270,832 | |||||||||
| Six Months Ended June 30, | Year Ended December 31, | |||||||||||||||||||
| (dollars in thousands) | 2024 | 2023 | 2023 | 2022 | 2021 | |||||||||||||||
| Statement of Cash Flows Data |
||||||||||||||||||||
| Net Cash provided by (used in): |
||||||||||||||||||||
| Operating activities |
$ | 26,666 | $ | 62,349 | $ | 146,115 | $ | 112,967 | $ | 49,611 | ||||||||||
| Investing activities |
(49,482 | ) | (43,972 | ) | (168,345 | ) | (109,157 | ) | (4,124 | ) | ||||||||||
| Financing activities |
(3,942 | ) | (6,978 | ) | (76,038 | ) | 32,875 | 37,624 | ||||||||||||
| Other Financial Data (unaudited): |
||||||||||||||||||||
| EBITDA(1) |
$ | 88,075 | $ | 83,458 | $ | 168,931 | $ | 155,216 | $ | 58,187 | ||||||||||
| Adjusted EBITDA(1) |
94,809 | 111,817 | 213,629 | 204,830 | 77,219 | |||||||||||||||
| Adjusted Free Cash Flow(1) |
30,828 | 75,566 | 132,688 | 171,284 | 47,726 | |||||||||||||||
| Capital expenditures |
75,626 | 62,144 | 201,071 | 151,196 | 21,382 | |||||||||||||||
25
| (1) | EBITDA, Adjusted EBITDA and Adjusted Free Cash Flow are non-GAAP financial measures. As such, they should not be considered in isolation or as a substitute for operating income, net income or loss, cash flows provided by operating, investing and financing activities, or other income or cash flow statement data prepared in accordance with GAAP. See “—Non-GAAP Financial Measures” below for our definitions of EBITDA, Adjusted EBITDA and Adjusted Free Cash Flow and reconciliations of each to the most directly comparable GAAP financial measure. |
Non-GAAP Financial Measures
We disclose and discuss EBITDA, Adjusted EBITDA and Adjusted Free Cash Flow as non-GAAP financial measures in this prospectus. We define EBITDA as earnings (net income or loss) before interest, income taxes, depreciation and amortization. Adjusted EBITDA reflects certain adjustments to EBITDA for gains or losses on early extinguishment of debt, terminated debt refinancing costs, stock-based compensation expense and interest income. In addition, Adjusted EBITDA excludes non-cash gains or losses on the fair value adjustment of liability-classified warrants. We define Adjusted Free Cash Flow as Adjusted EBITDA less cash paid for deferred drydocking charges, cash paid for maintenance capital improvements and non-vessel capital expenditures, cash paid for interest and cash paid for (refunds of) income taxes. Our measures of EBITDA, Adjusted EBITDA and Adjusted Free Cash Flow may not be comparable to similarly titled measures presented by other companies. Other companies may calculate EBITDA, Adjusted EBITDA and Adjusted Free Cash Flow differently than we do, which may limit their usefulness as comparative measures.
We view EBITDA, Adjusted EBITDA and Adjusted Free Cash Flow primarily as liquidity measures and, as such, we believe that the GAAP financial measure most directly comparable to those measures is cash flows provided by operating activities. Because EBITDA, Adjusted EBITDA and Adjusted Free Cash Flow are not measures of financial performance calculated in accordance with GAAP, they should not be considered in isolation or as a substitute for operating income, net income or loss, cash flows provided by operating, investing and financing activities, or other income or cash flow statement data prepared in accordance with GAAP. Additionally, Adjusted Free Cash Flow does not represent the total increase or decrease in our cash balance, and it should not be inferred that the entire amount of Adjusted Free Cash Flow is available for dividends, debt or share repurchases or other discretionary expenditures, since we have non-discretionary expenditures that are not deducted from this measure.
EBITDA, Adjusted EBITDA and Adjusted Free Cash Flow are widely used by investors and other users of our consolidated financial statements as supplemental financial measures that, when viewed with our GAAP results and the accompanying reconciliations, we believe provide additional information that is useful to gain an understanding of the factors and trends affecting our ability to service debt, pay income taxes and fund drydocking charges, maintenance capital improvements and non-vessel capital expenditures. We also believe the disclosure of EBITDA, Adjusted EBITDA and Adjusted Free Cash Flow helps investors or lenders meaningfully evaluate and compare our cash flow generating capacity from quarter to quarter and year to year.
EBITDA, Adjusted EBITDA and Adjusted Free Cash Flow are also financial metrics used by management as supplemental internal measures for planning and forecasting overall expectations and for evaluating actual results against such expectations; for short-term cash bonus incentive compensation purposes; to compare to the EBITDA, Adjusted EBITDA and Adjusted Free Cash Flow of other companies, vessels or other assets when evaluating potential acquisitions; to assess our ability to service existing fixed charges and incur additional indebtedness; and to purchase, convert or construct additional vessels. Additionally, we have historically made certain adjustments to EBITDA to internally evaluate our performance based on the computation of ratios used in certain financial covenants of our credit agreements with various lenders, whenever applicable. Currently, our credit agreements have incurrence tests and other financial covenants, including coverage and leverage ratios.
26
These ratios are calculated using certain adjustments to EBITDA defined by our credit agreements, which adjustments are consistent with those reflected in Adjusted EBITDA in this prospectus. In addition, we believe that, based on covenants in prior credit facilities, future debt arrangements may require compliance with certain ratios that will likely include EBITDA or Adjusted EBITDA in the computations. Adjusted EBITDA is also currently utilized in connection with the Company’s short-term cash bonus incentive compensation programs.
The following tables reconcile cash flows provided by operating activities to EBITDA, Adjusted EBITDA and Adjusted Free Cash Flow, as we define those terms, for the six months ended June 30, 2024 and 2023, and the years ended December 31, 2023, 2022 and 2021, respectively:
| Six Months Ended June 30, |
Year Ended December 31, |
|||||||||||||||||||
| (dollars in thousands) | 2024 | 2023 | 2023 | 2022 | 2021 | |||||||||||||||
| EBITDA Reconciliation to GAAP: |
||||||||||||||||||||
| Net cash flows provided by operating activities |
$ | 26,666 | $ | 62,349 | $ | 146,115 | $ | 112,967 | $ | 49,611 | ||||||||||
| Cash paid for deferred drydocking charges |
26,106 | 15,416 | 29,828 | 19,114 | 14,113 | |||||||||||||||
| Cash paid for interest |
14,556 | 15,502 | 32,970 | 8,868 | 8,467 | |||||||||||||||
| Cash paid for income taxes |
13,035 | 1,136 | 9,311 | 474 | 2,399 | |||||||||||||||
| Recovery of (provision for) credit losses |
34 | (386 | ) | (551 | ) | (257 | ) | (44 | ) | |||||||||||
| Changes in other operating assets and liabilities |
11,805 | 7,260 | (19,166 | ) | 38,995 | (516 | ) | |||||||||||||
| Stock-based compensation expense |
(4,423 | ) | (15,363 | ) | (19,097 | ) | (5,330 | ) | (3,372 | ) | ||||||||||
| Amortization of deferred contract-specific costs of sales |
(431 | ) | (489 | ) | (1,028 | ) | — | — | ||||||||||||
| Fair value adjustment of liability-classified warrants |
696 | (4,533 | ) | (10,917 | ) | (41,408 | ) | (15,150 | ) | |||||||||||
| Loss on early extinguishment of debt, net |
— | — | (1,236 | ) | (44 | ) | — | |||||||||||||
| Gain on sale and disposal of assets |
31 | 2,566 | 2,702 | 21,837 | 2,679 | |||||||||||||||
|
|
|
|
|
|
|
|
|
|
|
|||||||||||
| EBITDA |
$ | 88,075 | $ | 83,458 | $ | 168,931 | $ | 155,216 | $ | 58,187 | ||||||||||
|
|
|
|
|
|
|
|
|
|
|
|||||||||||
| Adjusted EBITDA Reconciliation to GAAP: |
||||||||||||||||||||
| Net cash flows provided by operating activities |
$ | 26,666 | $ | 62,349 | $ | 146,115 | $ | 112,967 | $ | 49,611 | ||||||||||
| Cash paid for deferred drydocking charges |
26,106 | 15,416 | 29,828 | 19,114 | 14,113 | |||||||||||||||
| Cash paid for interest |
14,556 | 15,502 | 32,970 | 8,868 | 8,467 | |||||||||||||||
| Cash paid for income taxes |
13,035 | 1,136 | 9,311 | 474 | 2,399 | |||||||||||||||
| Recovery of (provision for) credit losses |
34 | (386 | ) | (551 | ) | (257 | ) | (44 | ) | |||||||||||
| Changes in other operating assets and liabilities |
11,805 | 7,260 | (19,166 | ) | 38,995 | (516 | ) | |||||||||||||
| Amortization of deferred contract-specific costs of sales |
(431 | ) | (489 | ) | (1,028 | ) | — | — | ||||||||||||
| Interest income |
3,007 | 4,830 | 9,755 | 2,832 | 510 | |||||||||||||||
| Gain on sale and disposal of assets |
31 | 2,566 | 2,702 | 21,837 | 2,679 | |||||||||||||||
| Terminated debt refinancing costs |
— | 3,633 | 3,693 | — | — | |||||||||||||||
|
|
|
|
|
|
|
|
|
|
|
|||||||||||
| Adjusted EBITDA |
$ | 94,809 | $ | 111,817 | $ | 213,629 | $ | 204,830 | $ | 77,219 | ||||||||||
|
|
|
|
|
|
|
|
|
|
|
|||||||||||
| Adjusted Free Cash Flow Reconciliation to GAAP: |
||||||||||||||||||||
| Net cash flows provided by operating activities |
$ | 26,666 | $ | 62,349 | $ | 146,115 | $ | 112,967 | $ | 49,611 | ||||||||||
| Cash paid for maintenance capital improvements |
(9,969 | ) | (3,782 | ) | (7,745 | ) | (3,762 | ) | (3,826 | ) | ||||||||||
| Cash paid for non-vessel capital expenditures |
(315 | ) | (415 | ) | (1,087 | ) | (1,328 | ) | (688 | ) | ||||||||||
| Recovery of (provision for) credit losses |
34 | (386 | ) | (551 | ) | (257 | ) | (44 | ) | |||||||||||
| Changes in other operating assets and liabilities |
11,805 | 7,260 | (19,166 | ) | 38,995 | (516 | ) | |||||||||||||
| Amortization of deferred contract-specific costs of sales |
(431 | ) | (489 | ) | (1,028 | ) | — | — | ||||||||||||
| Interest income |
3,007 | 4,830 | 9,755 | 2,832 | 510 | |||||||||||||||
| Gain on sale and disposal of assets |
31 | 2,566 | 2,702 | 21,837 | 2,679 | |||||||||||||||
| Terminated debt refinancing costs |
— | 3,633 | 3,693 | — | — | |||||||||||||||
|
|
|
|
|
|
|
|
|
|
|
|||||||||||
| Adjusted Free Cash Flow |
$ | 30,828 | $ | 75,566 | $ | 132,688 | $ | 171,284 | $ | 47,726 | ||||||||||
|
|
|
|
|
|
|
|
|
|
|
|||||||||||
27
The following table provides the detailed components of EBITDA, Adjusted EBITDA and Adjusted Free Cash Flow as we define those terms, for the six months ended June 30, 2024 and 2023, and the years ended December 31, 2023, 2022 and 2021 (in thousands):
| Six Months Ended June 30, |
Year Ended December 31, |
|||||||||||||||||||
| 2024 | 2023 | 2023 | 2022 | 2021 | ||||||||||||||||
| Components of EBITDA: |
||||||||||||||||||||
| Net income |
$ | 44,226 | $ | 36,835 | $ | 74,538 | $ | 80,762 | $ | 2,987 | ||||||||||
| Interest, net |
||||||||||||||||||||
| Interest expense |
13,437 | 22,972 | 39,802 | 41,172 | 35,794 | |||||||||||||||
| Interest income |
(3,007 | ) | (4,830 | ) | (9,755 | ) | (2,832 | ) | (510 | ) | ||||||||||
|
|
|
|
|
|
|
|
|
|
|
|||||||||||
| Total interest, net |
10,430 | 18,142 | 30,047 | 38,340 | 35,284 | |||||||||||||||
|
|
|
|
|
|
|
|
|
|
|
|||||||||||
| Income tax expense |
3,163 | 6,362 | 16,495 | 7,174 | 1,533 | |||||||||||||||
| Depreciation |
18,093 | 11,753 | 26,355 | 18,601 | 15,672 | |||||||||||||||
| Amortization |
12,163 | 10,366 | 21,496 | 10,339 | 2,711 | |||||||||||||||
|
|
|
|
|
|
|
|
|
|
|
|||||||||||
| EBITDA |
$ | 88,075 | $ | 83,458 | $ | 168,931 | $ | 155,216 | $ | 58,187 | ||||||||||
|
|
|
|
|
|
|
|
|
|
|
|||||||||||
| Loss on early extinguishment of debt, net |
$ | — | $ | — | $ | 1,236 | $ | 44 | $ | — | ||||||||||
| Stock-based compensation expense |
4,423 | 15,363 | 19,097 | 5,330 | 3,372 | |||||||||||||||
| Interest income |
3,007 | 4,830 | 9,755 | 2,832 | 510 | |||||||||||||||
| Fair value of liability-classified warrants |
(696 | ) | 4,533 | 10,917 | 41,408 | 15,150 | ||||||||||||||
| Terminated debt refinancing costs |
— | 3,633 | 3,693 | — | — | |||||||||||||||
|
|
|
|
|
|
|
|
|
|
|
|||||||||||
| Adjusted EBITDA |
$ | 94,809 | $ | 111,817 | $ | 213,629 | $ | 204,830 | $ | 77,219 | ||||||||||
|
|
|
|
|
|
|
|
|
|
|
|||||||||||
| Cash paid for deferred drydocking charges(1) |
$ | (26,106 | ) | $ | (15,416 | ) | $ | (29,828 | ) | $ | (19,114 | ) | $ | (14,113 | ) | |||||
| Cash paid for maintenance capital improvements(1) |
(9,969 | ) | (3,782 | ) | (7,745 | ) | (3,762 | ) | (3,826 | ) | ||||||||||
| Cash paid for non-vessel capital expenditures(1) |
(315 | ) | (415 | ) | (1,087 | ) | (1,328 | ) | (688 | ) | ||||||||||
| Cash paid for interest |
(14,556 | ) | (15,502 | ) | (32,970 | ) | (8,868 | ) | (8,467 | ) | ||||||||||
| Cash paid for income taxes |
(13,035 | ) | (1,136 | ) | (9,311 | ) | (474 | ) | (2,399 | ) | ||||||||||
|
|
|
|
|
|
|
|
|
|
|
|||||||||||
| Adjusted Free Cash Flow |
$ | 30,828 | $ | 75,566 | $ | 132,688 | $ | 171,284 | $ | 47,726 | ||||||||||
|
|
|
|
|
|
|
|
|
|
|
|||||||||||
| (1) | For additional information concerning these items, see “Management’s Discussion and Analysis of Financial Condition and Results of Operations—Liquidity and Capital Resources—Capital Expenditures and Related Commitments.” |
Set forth below are the material limitations associated with using EBITDA, Adjusted EBITDA and Adjusted Free Cash Flow as non-GAAP financial measures compared to cash flows provided by operating activities:
| • | EBITDA, Adjusted EBITDA and Adjusted Free Cash Flow do not reflect the future capital expenditure requirements that may be necessary to replace our existing vessels upon expiration of their useful lives; |
| • | EBITDA, Adjusted EBITDA and Adjusted Free Cash Flow do not reflect the interest, future principal payments and other financing-related charges necessary to service the debt that we have incurred in acquiring and constructing our vessels; |
| • | EBITDA, Adjusted EBITDA and Adjusted Free Cash Flow do not reflect the deferred income taxes that we will eventually have to pay once we are no longer in an overall NOL carryforward position, as applicable; and |
28
| • | EBITDA, Adjusted EBITDA and Adjusted Free Cash Flow do not reflect changes in our net working capital position. |
Management compensates for the above-described limitations in using EBITDA, Adjusted EBITDA and Adjusted Free Cash Flow as non-GAAP financial measures by only using EBITDA, Adjusted EBITDA and Adjusted Free Cash Flow to supplement our GAAP results.
Other Operating Data
| Six Months Ended June 30, |
Year Ended December 31, |
|||||||||||||||||||
| (dollars in thousands) | 2024 | 2023 | 2023 | 2022 | 2021 | |||||||||||||||
| Offshore Supply Vessels: |
||||||||||||||||||||
| Average number of OSVs(1) |
57.9 | 53.6 | 53.8 | 57.0 | 58.8 | |||||||||||||||
| Average number of active OSVs(2) |
36.9 | 31.4 | 32.2 | 26.7 | 22.2 | |||||||||||||||
| Average OSV fleet capacity (DWT)(3) |
256,552 | 232,419 | 235,514 | 229,001 | 228,256 | |||||||||||||||
| Average OSV capacity (DWT)(4) |
4,432 | 4,338 | 4,374 | 4,020 | 3,885 | |||||||||||||||
| Average OSV utilization rate(5) |
42.1 | % | 44.4 | % | 44.3 | % | 37.7 | % | 31.2 | % | ||||||||||
| Active OSV utilization rate(6) |
66.0 | % | 75.9 | % | 74.0 | % | 80.7 | % | 82.8 | % | ||||||||||
| Average OSV dayrate(7) |
$ | 41,030 | $ | 37,587 | $ | 39,297 | $ | 32,305 | $ | 19,785 | ||||||||||
| Effective OSV dayrate(8) |
$ | 17,274 | $ | 16,689 | $ | 17,409 | $ | 12,179 | $ | 6,173 | ||||||||||
| Multi-Purpose Support Vessels: |
||||||||||||||||||||
| Average number of MPSVs(1) |
12.0 | 12.0 | 12.0 | 12.0 | 12.0 | |||||||||||||||
| Average number of active MPSVs(2) |
12.0 | 11.0 | 11.2 | 10.4 | 8.9 | |||||||||||||||
| Average MPSV utilization rate(5) |
72.4 | % | 71.1 | % | 68.4 | % | 65.2 | % | 46.7 | % | ||||||||||
| Active MPSV utilization rate(6) |
72.4 | % | 77.5 | % | 73.6 | % | 75.0 | % | 63.0 | % | ||||||||||
| Average MPSV dayrate(7) |
$ | 64,130 | $ | 61,231 | $ | 62,372 | $ | 53,421 | $ | 40,245 | ||||||||||
| Effective MPSV dayrate(8) |
$ | 46,430 | $ | 43,535 | $ | 42,662 | $ | 34,830 | $ | 18,794 | ||||||||||
| (1) | Represents the weighted-average number of vessels owned during the period, adjusted to reflect date of acquisition or disposition of vessels. We owned 55 and 54 OSVs and 12 MPSVs as of December 31, 2023 and December 31, 2022, respectively. Excluded from the data as of December 31, 2023 and 2022 are four non-owned vessels that we now manage for the U.S. Navy, one OSV acquired from the U.S. Department of Transportation’s Maritime Administration that is currently undergoing conversion into a MPSV for dual-service as either a C/SOV or flotel, and two partially constructed Jones Act-qualified MPSV newbuilds to be completed pursuant to our settlement with the Surety. We owned 60 and 53 OSVs and 12 MPSVs as of June 30, 2024 and June 30, 2023, respectively. Excluded from the data as of June 30, 2024 and June 30, 2023 are four non-owned vessels that we manage for the U.S. Navy, one OSV acquired from the U.S. Department of Transportation’s Maritime Administration that is currently undergoing conversion into a MPSV for dual-service as either a C/SOV or flotel and two partially constructed Jones Act-qualified MPSV newbuilds to be completed pursuant to our settlement with the Surety. Also excluded from the data as of the dates indicated are the following vessels acquired under the ECO Acquisitions that had not yet been acquired or had not yet been placed in service: (i) as of December 31, 2022, nine such vessels, (ii) as of December 31, 2023, five such vessels and (iii) as of June 30, 2023, seven such vessels. The Company also sold two and ten OSVs during 2023 and 2022, respectively. |
| (2) | In response to weak market conditions, we elected to stack certain of our OSVs and MPSVs on various dates since October 2014. The average number of active OSVs represents the weighted-average number of vessels that were immediately available for service during each respective period, adjusted to reflect date of stacking or recommissioning of vessels. |
| (3) | Represents the weighted-average number of OSVs owned during the period multiplied by the weighted-average capacity of OSVs during the same period. |
29
| (4) | Represents actual capacity of the OSVs owned during the period on a weighted-average basis, adjusted to reflect date of acquisition or disposition of vessels. |
| (5) | Utilization rates are weighted-average rates based on a 365-day year. Vessels are considered utilized when they are generating revenues. |
| (6) | Active utilization rate is based on a denominator comprised only of vessel-days available for service by the active fleet, which excludes the impact of inactive or stacked vessel days. |
| (7) | Average OSV and MPSV dayrates represent weighted-average revenue per day, which includes charter hire, crewing services and net brokerage revenues, based on the number of days during the period that the OSVs and MPSVs, respectively, generated revenues. |
| (8) | Effective dayrate represents the average dayrate multiplied by the average utilization rate. |
30
An investment in our common stock involves a high degree of risk. You should carefully consider the risks described below, together with the other information in this prospectus, before deciding whether to purchase our common stock. If any of the risks described below actually occur, our business, financial condition, results of operations or prospects could be materially adversely affected. In any such case, the trading price of our common stock could decline and you could lose all or part of your investment.
Risks Relating to Our Business
We derive substantial revenues from companies in the oil and natural gas exploration and production industry, which is a historically cyclical industry with levels of activity that are directly affected by the levels and volatility of oil and natural gas prices.
The demand for our services from companies in various energy-related industries is cyclical, and to some extent, seasonal, depending primarily on the capital expenditures of offshore energy companies. These capital expenditures are influenced by such factors as:
| • | prevailing oil and natural gas prices, particularly with respect to prevailing prices on local price indexes in the areas in which we operate and expectations about future commodity prices; |
| • | the action of the Organization of the Petroleum Exporting Countries, plus (“OPEC+”), its members and other state-controlled oil companies relating to oil price and production controls; |
| • | worldwide and regional economic conditions impacting the global supply and demand for oil and natural gas; |
| • | domestic and international political, military, regulatory and economic conditions, including global inflationary pressures, Russia’s ongoing invasion of Ukraine and sanctions related thereto, as well as the ongoing conflict in Israel and the surrounding region; |
| • | delay and regulatory uncertainty stemming from local or environmental opposition to offshore energy development projects; |
| • | the cost of exploring for, producing and delivering hydrocarbons; |
| • | political risks within the countries where we operate that can result in reduced exploration and production activities; |
| • | the sale and expiration dates of available offshore leases; |
| • | the discovery rate, size and location of new hydrocarbon reserves, including in offshore areas; |
| • | the rate of decline of existing hydrocarbon reserves due to production; |
| • | laws and regulations related to environmental matters, including those addressing alternative energy sources and the risks of global climate change; |
| • | the development and exploitation of alternative fuels or energy sources and end-user conservation trends; |
| • | domestic, local and foreign governmental regulation and taxes; |
| • | technological advances, including technology related to the exploitation of shale oil, which can result in over-supply of hydrocarbons or a change in demand for hydrocarbons; and |
| • | the ability of offshore energy producers to generate funds for their capital-intensive businesses. |
Prices for oil and natural gas have historically been, and we anticipate they will continue to be, extremely volatile and reactive to changes in the supply of and demand for oil and natural gas (including changes resulting
31
from the ability of OPEC+ to establish and maintain production quotas), domestic and worldwide economic conditions and political instability in oil producing countries. In the past, low oil prices have adversely affected demand for our services and any decreases, over a sustained period of time, could have a material adverse effect on our business, financial condition, results of operations and cash flows.
Our business also depends on our obtaining significant contracts, primarily from companies in the oil and gas exploration and production industry. The timing of or failure to obtain contracts, delays in awards of contracts, cancellations of contracts, delays in completion of contracts, or failure to obtain timely payments from our customers, could result in significant periodic fluctuations in our results of operations and operating cash flows. If customers do not proceed with the completion of significant projects or if significant defaults on customer payment obligations to us arise, or if we encounter disputes with customers involving such payment obligations, we may face difficulties in collecting payment of amounts due to us, including for costs we previously incurred.
Impairment of our long-term assets may adversely impact our financial position and results of operations.
We periodically evaluate our long-lived assets, including our property and equipment, and intangible assets. In performing these assessments, we project future cash flows on an undiscounted basis for long-lived assets and compare these cash flows to the carrying amount of the related assets. These cash flow projections are based on our current operating plans, estimates and judgmental assumptions. We perform the assessment of potential impairment for our property and equipment and intangibles whenever facts and circumstances indicate that the carrying value of those assets may not be recoverable due to various external or internal factors. In such event, if we determine that our estimates of future cash flows were inaccurate or our actual results are materially different from what we have predicted, we could record additional impairment charges in future periods, which could have a material adverse effect on our financial position and results of operations.
The waiver, repeal or administrative weakening of the Jones Act could adversely impact our business.
Substantial portions of our operations are conducted in the U.S. coastwise trade, and thus, are subject to the provisions of the Jones Act which, subject to limited exceptions, restricts maritime transportation of merchandise between points in the United States (known as cabotage or coastwise trade) to vessels that are: (a) built in the United States; (b) registered under the U.S. flag; (c) crewed by U.S. citizens or lawful permanent residents; and (d) owned and operated by U.S. citizens within the meaning of the Jones Act. For years, there have been attempts to repeal or amend such provisions, and such attempts are expected to continue in the future. In addition, the President of the United States may waive the requirement for using U.S.-flag vessels with coastwise endorsements in the U.S. coastwise trade in the interest of national defense. Furthermore, the Jones Act restrictions on the coastwise trade are subject to certain exceptions under certain international trade agreements, including the General Agreement on Trade in Services. If maritime cabotage services were included in the General Agreement on Trade in Services or other international trade agreements, the shipping of maritime cargo between covered U.S. ports could be opened to foreign-flag vessels, foreign-built vessels or foreign-owned vessels. Repeal, substantial amendment, waiver of provisions, or other administrative weakening of the Jones Act could significantly adversely affect us by, among other things, resulting in additional competition from competitors with lower operating costs, because of their ability to use vessels built in lower-cost foreign shipyards, owned and manned by foreign nationals with promotional foreign tax incentives and with lower wages and benefits than U.S. citizens. Because foreign vessels may have lower construction costs and operate at significantly lower costs than companies operating in the U.S. coastwise trade, such a change could significantly increase competition in the U.S. coastwise trade, which could have a material adverse effect on our business, financial position, results of operations, cash flows and growth prospects.
We must continue to comply with the Jones Act’s citizenship requirements.
Because we own and operate U.S.-flagged vessels in the U.S. coastwise trade, the Jones Act requires that at least 75% of the outstanding shares of each class or series of the capital stock of the Company must be owned
32
and controlled by U.S. citizens. We are responsible for monitoring the ownership of our equity securities and subsidiaries to ensure compliance with the citizenship requirements of the Jones Act. If we do not continue to comply with such requirements, we would be prohibited from operating our U.S.-flagged vessels in the U.S. coastwise trade and may incur severe penalties, such as fines and/or forfeiture of such vessels and/or permanent loss of U.S. coastwise trading privileges for such vessels.
Our operations may be impacted by changing macroeconomic conditions, including inflation.
Inflation has been an ongoing concern in the U.S. since 2021. Ongoing inflationary pressures have resulted in and may result in additional increases to the costs of goods, services and personnel, which in turn could cause our capital expenditures and operating costs to rise. Sustained levels of high inflation caused the U.S. Federal Reserve and other central banks to increase interest rates multiple times in 2022 and 2023 in an effort to curb inflationary pressure on the costs of goods and services, which could have the effects of raising the cost of capital and depressing economic growth, either of which (or the combination thereof) could hurt the financial and operating results of our business. Further, we are unable to predict the impact of efforts by the U.S. Federal Reserve and other central banks to combat elevated levels of inflation. If their efforts are too aggressive, they may lead to a recession. Alternatively, if they are insufficient or are not sustained long enough to lower inflation to more acceptable levels, consumer spending may be adversely impacted for a prolonged period of time, which could impact oil prices. Any of these events could materially affect our business and operating results.
High oil prices are also inflationary and governmental or economic responses to high oil prices could impact the operations of our customers. Sustained high oil prices could also drive over-investment and create the potential for global over-supply, which could cause prices to fall, also impacting investment by our customers.
Any future reduction in worldwide economic growth and economic activity could, if sustained, ultimately lead to a global recession. In a global recession, it is likely that the demand for oil and natural gas would decline and the number of planned offshore energy projects would decrease. Such a scenario would negatively impact the demand for offshore support services, and in turn, our financial performance.
Certain developments in the global oil and gas markets, such as the Russian invasion of Ukraine and related sanctions, and the ongoing conflict in Israel and the surrounding region have had, and may continue to have, material adverse consequences for general economic, financial and business conditions, and could materially and adversely affect our business, financial condition, results of operations and liquidity and those of our customers, suppliers and other counterparties.
Changes in the supply of and demand for oil and gas impacts the level of services that we provide to customers, which in turn impacts our financial position, results of operations and cash flows.
Although as of the date of this prospectus we have not been materially impacted by the resulting supply chain disruptions, the Russian invasion of Ukraine and related sanctions have significantly disrupted supply chains for crude oil and natural gas. We cannot predict the level of future demand, effects on domestic pricing, and impacts on U.S. oil and gas production. Further, the Russia Ukraine conflict and other geopolitical tensions, as well as the related international response, have exacerbated inflationary pressures, causing increases in the prices for goods and services and exacerbating global supply chain disruptions, which have resulted in, and may continue to result in, shortages in materials and services and related uncertainties. Such shortages have resulted in, and may continue to result in, cost increases for labor, fuel, materials and services, and could continue to cause costs to increase, and also result in the scarcity of certain materials. Any economic slowdown or recession in Europe or globally, including as a result of such supply chain disruptions or sanctions, may also impact demand and depress the price for crude oil, natural gas or other products that we handle, which could have significant adverse consequences on our financial condition and the financial condition of our customers, suppliers and other counterparties, and could diminish our liquidity. The U.S. government has also implemented geographic restrictions for certain offshore oil and gas operators and projects, which may reduce the number of
33
projects our vessels may support. While the geographic areas in which we operate are largely unaffected by these sanctions, they could negatively impact our business and financial condition. Further, the ongoing conflict in Israel and the surrounding region could escalate into a broader conflict that could disrupt energy operations and supply chains globally.
Our results of operations are materially affected by conditions in the global capital markets and the economy generally, both in the U.S. and elsewhere around the world. Weak economic conditions sustained uncertainty about global economic conditions, concerns about future U.S. budgetary cuts, or a prolonged or further tightening of credit markets could cause our customers and potential customers to postpone or reduce spending on products or services or put downward pressure on prices, which could have an adverse effect on our business, results of operations or cash flows. In the event of extreme prolonged adverse market events, such as a global credit crisis, we could incur significant losses. The future impact of these current events on our financial condition, results of operations and cash flows depends largely on developments outside our control which cannot be predicted with certainty.
Our business and our customers’ businesses are subject to complex laws and regulations that can adversely affect the cost, manner, or feasibility of doing business.
Our operations are subject to extensive federal, state and local laws and regulations, including complex environmental laws and occupational health and safety laws. We may be required to make large expenditures to comply with such regulations. Failure to comply with these laws and regulations or accidental spills or releases of oil and/or hazardous substances may result in the suspension or termination of operations or permits and other authorizations, and subject us to administrative, civil, and criminal penalties. In the event of environmental violations or accidental spills or releases, we may be charged with the costs of investigation, remediation or other corrective actions. In addition, citizen groups and other third parties may file claims for nuisance, provision of alternative water supplies, property damage or bodily injury. Laws and regulations protecting the environment have become more stringent in recent years, and may, in some circumstances, result in liability for environmental damage regardless of negligence or fault through a strict, joint and several liability scheme, even if our operations were lawful at the time or in accordance with industry standards. In addition, pollution and similar environmental risks generally are not fully insurable. These liabilities and costs could have a material adverse effect on our business, financial condition, results of operations and cash flows.
Additionally, changes in environmental laws or regulations, including laws relating to the emission of carbon dioxide and other GHGs or other climate change concerns, could require us to devote capital or other resources to comply with these laws and regulations. These changes could also subject us to additional costs and restrictions, including increased fuel costs. Such changes in laws or regulations could increase costs of compliance and doing business for our customers and thereby decrease the demand for our services. Because our business depends on the level of activity in the offshore oil and gas industry, existing or future laws and regulations related to GHGs and climate change, including incentives to conserve energy or use alternative energy sources, could have a negative impact on our business if such laws and regulations reduce the worldwide demand for oil and gas or limit drilling opportunities for our customers.
Additionally, we operate our vessels in a number of international markets and are subject to various international treaties and the local laws and regulations in jurisdictions where our vessels operate and/or are registered. These conventions, laws and regulations govern matters of environmental protection, GHG emissions, worker health and safety, vessel and port security, and the manning, construction, ownership and operation of vessels, including cabotage requirements similar to the Jones Act. Changes in such international treaties and such local laws and regulations can be unpredictable and may adversely affect our ability to carry out operations overseas.
34
The Inflation Reduction Act of 2022 could accelerate the transition to a low carbon economy and impose increased costs on our customers.
In August 2022, President Biden signed the Inflation Reduction Act of 2022 (“IRA 2022”) into law. The IRA 2022 contains incentives for the development of renewable energy, clean hydrogen, clean fuels, electric vehicles and supporting infrastructure and carbon capture and sequestration, among other provisions. These incentives could further accelerate the transition of the U.S. economy away from the use of fossil fuels towards lower-or zero-carbon emissions alternatives, which could decrease demand for oil and gas and consequently reduce demand for our services in that sector. In addition, the IRA 2022 imposes the first ever federal fee on the emission of GHGs through a methane emissions charge. The IRA 2022 amends the federal Clean Air Act (“CAA”) to impose a fee on the emission of methane above certain thresholds established in the IRA 2022 from sources required to report their GHG emissions to the U.S. Environmental Protection Agency (“EPA”). The methane emissions charge will begin accruing during calendar year 2024 at a rate of $900 per ton of methane above applicable emissions thresholds, increase to $1,200 per ton above thresholds in 2025, and be set at $1,500 per ton above thresholds for 2026 and each year thereafter. In January 2024, the EPA issued a proposed rule that would require facilities to calculate and pay these methane emissions charges for the prior year’s emissions by March 31, 2025, with future filings due on an annual basis. The methane emissions charge and other related initiatives targeting methane emissions could increase our customers’ operating costs in the oil and gas industry and reduce demand for our services.
Imposition of laws, executive actions or regulatory initiatives to restrict, delay or cancel leasing, permitting or drilling activities in deepwaters of the U.S. or foreign countries may reduce demand for our services and products and have a material adverse effect on our business, financial condition or results of operations.
We provide services for oil and natural gas exploration and production customers operating offshore in the deepwaters of the U.S. and in other countries. In the U.S., President Biden issued an executive order in January 2021 that commits to substantial action on climate change, calling for, among other things, the elimination of subsidies provided to the fossil fuel industry and an increased emphasis on climate-related risks across government agencies and economic sectors. In September 2023, the Biden Administration announced that federal agencies will be directed to consider the social cost of GHGs in agency budgeting, procurement, and other agency decisions, including in environmental reviews conducted pursuant to the National Environmental Policy Act, where appropriate. Additionally, regulatory agencies under the Biden Administration may issue new or amended rulemakings regarding deepwater and ultra-deepwater leasing, permitting or drilling that could result in more stringent or costly restrictions, delays or cancellations in offshore oil and natural gas exploration and production activities. Additionally, decisions regarding federal offshore leasing have been subject to legal challenges that could delay or suspend offshore lease auctions, adversely affecting our customers’ businesses and reducing demand for our services. In December 2023, the U.S. Department of the Interior (“DOI”) finalized a new five-year offshore leasing plan for the U.S. GoM. The plan calls for a maximum of three offshore lease sales, in 2025, 2027 and 2029, and no lease sales will be held in 2024. The five-year lease plan represents the smallest number of planned sales in the history of the offshore leasing program. In early 2024, legal challenges to the plan were filed by both industry and environmental groups.
Any new legislation, executive actions or regulatory initiatives, whether in the U.S. or in other countries, that impose increased costs, more stringent operational standards or result in significant delays, cancellations or disruptions in our customers’ operations, could increase the risk of losing leasing or permitting opportunities, expired leases due to the time required to develop new technology, increased supplemental bonding costs, or cause our customers to incur penalties, fines or shut-in production at one or more of their facilities, any or all of which could reduce demand for our services. We cannot predict with any certainty the full impact of any new laws, regulations, executive actions or regulatory initiatives on our customers’ drilling operations or the opportunity to pursue such operations, or on the cost or availability of insurance to cover the risks associated with such operations. The matters described above, individually or in the aggregate, could have a material adverse effect on our business, financial condition and results of operations.
35
We operate in a highly competitive industry.
The offshore drilling and production support industry is both highly competitive and capital intensive and requires substantial resources and investment to satisfy customers and maintain profitability. Our customers award contracts based on price, industry reputation, service quality, vessel offerings and capabilities, transit costs and other similar factors. Increased competition for deepwater and ultra-deepwater drilling contracts could depress dayrates and utilization rates, adversely affecting our profitability. A sustained inability to win contracts in our key markets would put pressure on our ability to service our debt.
Our financial and operating performance may be subject to the state of the offshore wind energy market.
Our results of operations may be subject to the state of the offshore wind energy market and the inherent complexity of developing wind energy projects. In addition to the state and federal government policies supporting renewable energy, the growth and development of the offshore wind energy market is subject to a number of factors, including, among other things:
| • | a new and complex permitting process; |
| • | higher development costs than onshore alternatives; |
| • | the availability and cost of financing for the estimated pipeline of offshore wind energy projects; |
| • | fixed price contracts of wind development projects make it difficult to recover cost increases; |
| • | the deferral or cancellation of offshore wind projects, such as when several operators for east coast wind projects terminated their agreements for the provision of wind power due to higher than expected costs; |
| • | dynamics of the electricity market, which may be affected by a number of factors, including government regulation, power transmission, seasonality, fluctuations in demand, and the cost and availability of fuel, particularly natural gas; |
| • | the cost of raw materials used to make wind turbines, particularly steel; |
| • | the general increase in demand for electricity or “load growth”; |
| • | the costs of competing power sources, including natural gas, nuclear power, solar power and other power sources; |
| • | the development of new power generating technology, advances in existing technology or discovery of power generating natural resources; |
| • | the development of electrical transmission infrastructure; |
| • | state and federal laws and regulations, particularly those favoring low carbon energy generation alternatives; |
| • | administrative and legal challenges to proposed offshore wind energy development projects; and |
| • | heightened focus on environmental or habitat concerns. |
We may be unable to attract and retain qualified, skilled employees necessary to operate our business, and the loss of key personnel could adversely affect our relationship with the military.
Much of our success depends on our ability to attract and retain highly skilled and qualified personnel. Our inability to hire, train and retain a sufficient number of qualified employees, including mariners, could impair our ability to manage, maintain and grow our business.
In crewing our vessels, we require skilled employees who can perform physically demanding work. As a result of past volatility in the oil and gas industry, many industry employees chose to pursue employment in other
36
fields, leading the industry to experience a significant shortfall in qualified mariners. As conditions in the industry have improved, it has become more challenging to engage experienced personnel as crews on our vessels. We face strong competition within the broader oilfield industry for employees and potential employees, including competition from drilling rig operators for fleet personnel. We may have difficulty hiring employees or finding suitable replacements as needed and it is possible that we would have to raise wage rates or increase benefits offered to attract workers and to retain current employees. In such circumstances, if we are unable to increase our service rates to customers to compensate for wage increases or recruit qualified personnel to operate vessels at full utilization, our financial condition and results of operations may be adversely affected.
Additionally, the ongoing viability and potential growth of our contractual relationship with the U.S. military is dependent on our continued employment of certain key personnel. Any action taken by the U.S. military in response to the loss of key personnel, or potential loss of key personnel, from our operations could adversely affect our current and future business with the military and, in turn, adversely affect our financial results.
Further, our operations are dependent upon the efforts and continued employment of our executive officers and key management personnel, including, but not limited to, our Founder, Chairman, President and Chief Executive Officer, Todd M. Hornbeck, who has substantial experience and relationships with our major customers. Given industry management turnover resulting from restructurings and other corporate changes, seasoned managers are in demand. Although we have entered into employment agreements with our executive officers and key management personnel, there is no guarantee that they will remain employed by us. In the event of the loss of key management personnel, we would be required to hire a replacement and there can be no assurance that the replacement will be suitable or favorable to us, which could adversely affect our financial results and operations. The loss of services of one or more of our executive officers or key management personnel could have a negative impact on our financial condition and results of operations.
We may be adversely affected by potential litigation.
In the future, we may become parties to litigation. In general, litigation can be expensive and time consuming to bring or defend against. Such litigation could result in settlements or damages that could significantly affect our financial results. It is not possible to predict the potential litigation that we may become party to nor the final resolution of such litigation. The impact of any such litigation on our businesses and financial stability, however, could be material.
Stacked vessels, and the reactivation of such vessels, may require substantial capital and operating expenditures and regulatory approvals.
Due to then-applicable difficult market conditions, we have in the past elected, and may in the future elect, to stack certain vessels in our fleet in order to reduce the number of crew and personnel that operate and maintain such vessels. Though vessel stacking reduces the costs of operating a vessel, it reduces the number of available vessels we can deploy to service our customers and limits potential revenues. If market conditions should decline, we may be required to stack additional vessels.
When we elect to reactivate the stacked vessels, we will incur substantial capital and operating expenditures. These expenditures could increase as a result of changes in the cost of labor and materials, changes in technology, customer requirements for new or upgraded equipment, the size of our fleet, the cost of replacement parts for existing vessels, the geographic location of the vessels or the length of contracts. We will also incur costs associated with regulatory recertification and remobilization, changes in safety or other equipment standards and may incur additional costs to hire and train personnel to operate the vessels. Making such alterations may require the stacked vessels to remain out of service for extended periods of time, with corresponding losses of revenues. Such costs could have an adverse effect on our financial results and operations.
If we are unable to fund these capital expenditures with our liquidity, we may be required to incur additional borrowings, or seek out additional financing arrangements with banks or other capital providers. Our failure to
37
obtain the funds for necessary future capital expenditures could have a material adverse effect on our business and on our financial position, results of operations and cash flows.
Reactivation of vessels could adversely impact the market for OSVs and MPSVs.
As of July 31, 2024, within our fleet, 18 U.S.-flagged OSVs and three foreign-flagged OSVs were stacked. Certain of our competitors have also stacked OSVs and may also stack additional OSVs from time to time. To the extent that we or our competitors reactivate vessels in response to improvement or perceived improvement in market conditions faster than the market can absorb such additional vessels, the market for OSVs could become oversaturated and would adversely affect dayrates and utilization for our vessels.
Increases in the supply of vessels could decrease dayrates.
A material increase in the supply of OSVs or MPSVs, whether through new construction (including our own), refurbishment or conversion of vessels from other uses, remobilization, reactivation or changes in law or its application could increase competition for charters, lower utilization or lower dayrates, any of which would adversely affect our revenues and profitability. Such an increase in vessel capacity could also exacerbate the impact of any future downturn in the oil and gas industry, which would have an adverse impact on our business.
Additionally, because the Jones Act does not cover certain services provided by MPSVs, foreign competitors may deploy additional MPSVs to the U.S. GoM or build additional MPSVs that will compete with us in the U.S. GoM.
The early termination of or inability to renew contracts for our vessels could have an adverse effect on our operations.
Certain contracts for our vessels, including contracts with the United States government, allow for early termination at the customer’s option. Many of our contracts that contain early termination provisions contain remedies or other provisions that would compensate us in the event an option is exercised, such as early termination fees, but customers may choose to exercise their termination rights in spite of such remedies or provisions and such remedies may not fully compensate us for the loss of the contract.
Additionally, in economic downturns, customers have requested that we adjust the terms of their contracts to be more customer-friendly, including by assuming greater risks. While we are not required to give such concessions, commercial considerations may dictate that we do so, given the relatively few deepwater and ultra-deepwater customers operating in the U.S. GoM. Certain customers who seek to terminate our contracts may attempt to defeat or circumvent our protections against certain liabilities for which we receive indemnity. Our customers’ ability to perform their obligations under their contracts, including their ability to fulfill their indemnity obligations to us, may be negatively impacted by an economic downturn. Our customers, which include national energy companies, often have significant bargaining leverage over us. Should a counterparty fail to honor its obligations under an agreement with us, we could sustain losses, which could have an adverse effect on our business and on our financial position, results of operations or cash flows.
Until we replace the terminated contracts with new contracts, our business could be temporarily disrupted or adversely affected, as there may be a gap in the operation of the vessels between the current contracts and subsequent contracts, or we may not be able to secure new contracts on substantially similar terms due to the prevailing market or industry conditions at the time of expiration. The fluctuation in the demand for our services may be impacted by volatility in oil and gas markets, which could ultimately adversely affect our financial position, results of operations or cash flows. As of July 31, 2024, within our fleet, 18 U.S.-flagged OSVs and three foreign-flagged OSVs were stacked. Further, as of July 31, 2024, we had 46 existing contracts for our vessels that are currently operating, which have durations ranging from 8 days to five years. When oil and natural gas prices are low or it is expected that such prices will decrease in the future, we may be unable to obtain
38
contracts at attractive dayrates or at all. We may not be able to obtain new contracts in direct continuation with existing contracts, or depending on prevailing market conditions, we may enter into contracts at dayrates substantially below the existing dayrates or on terms otherwise less favorable.
We may not be able to complete the construction of our remaining two newbuilds and may experience delays related to the newbuilds.
We began constructing two Jones Act-qualified MPSVs under our prior newbuild program. These vessels are large and complex. We estimate that the cost to complete these vessels will exceed the $53.8 million total contract price we are required to pay for their completion and that the sureties that have taken over their construction will be required to pay significant sums in excess of our remaining original contract contribution. While the sureties are contractually required to fund these excess costs, they might not do so, which would result in delay and disputes. Moreover, the vessels are complex and the shipyard performing the completion work for the sureties may be unable or unwilling to perform on the anticipated timeline or at all, also potentially causing delay and disruption to our planned uses for the vessels.
Failure to successfully complete repairs, maintenance and routine drydockings on-time and on-budget could adversely affect our financial condition and operations.
We routinely engage shipyards to drydock vessels for regulatory compliance, repairs and maintenance. Equipment shortages, insufficient shipyard availability, unforeseen engineering issues, work stoppages, weather interference, unanticipated cost increases, inability to obtain necessary certifications and approvals, material shortages, labor issues, and other similar factors could lead to extended delays or additional costs. Significant delays could adversely affect our ability to perform under our contracts, and significant cost overruns could adversely affect our operations and profitability.
At July 31, 2024, our total contracted backlog was $666.8 million. The contractual revenue we ultimately receive may be lower than the contracted backlog due to a number of factors, including vessel downtime or suspension of operations. The actual dayrate may be lower than the contractual operating dayrate assumed in the contracted backlog described above because a down-time (such as waiting on weather) rate, repair rate, standby rate or force majeure rate, may apply under certain circumstances. Several factors could cause vessel downtime or a suspension of operations, including equipment breakdowns and other unforeseen engineering problems, marine casualties, labor strikes and other work stoppages, shortages of material and skilled labor, surveys by government and maritime authorities, periodic classification surveys, severe weather or harsh operating conditions, and force majeure events.
In certain contracts, the dayrate may be reduced to zero if, for example, repairs extend beyond a stated period of time. Our total contracted backlog includes only firm commitments and certain contracted option periods, which are represented by signed contracts or, in some cases, other definitive agreements awaiting contract execution. We may not be able to realize the full amount of our total contracted backlog due to events beyond our control. In addition, some of our customers have experienced liquidity issues in the past, including some recently, and these liquidity issues could be experienced again if commodity prices decline for an extended period of time. Liquidity issues and other market pressures could lead our customers to seek bankruptcy protection or to seek to repudiate, cancel or renegotiate these agreements for various reasons. Our inability to realize the full amount of our total contracted backlog may have an adverse effect on our financial position, results of operations or cash flows.
In addition to industry concentrations, we have certain customer concentrations, and the loss of a significant customer would adversely impact our financial results.
For the six months ended June 30, 2024 and the year ended December 31, 2023, Occidental Petroleum Company accounted for 15% and 20% of our consolidated revenues, respectively, and MSC accounted for 16%
39
of our consolidated revenues. The loss or material reduction of business from a significant customer could therefore have a material adverse effect on our results of operations and cash flows. Moreover, our customer contracts subject us to counterparty risks. See “—We may be unable to collect amounts owed to us by customers.” The ability of each of our counterparties to perform their obligations under a contract with us will depend on a number of factors that are beyond our control such as the overall financial condition of the counterparty. Should a significant customer fail to honor its obligations under an agreement with us, we could sustain losses, which could have a material adverse effect on our business, financial condition and results of operations.
Recently completed and future acquisitions by us may create additional risks.
We regularly consider possible acquisitions of single vessels, vessel fleets and businesses, such as our purchases of 19 OSVs since 2017. The success of this strategy is dependent upon our ability to identify appropriate acquisition targets, negotiate transactions on favorable terms, finance transactions, complete transactions and successfully integrate them into our existing business. Subject to the terms of our indebtedness, we may finance future acquisitions with cash from operations, additional indebtedness and/or by issuing additional equity or debt securities. Acquisitions can involve a number of special risks and challenges, including, but not limited to:
| • | diversion of management time and attention from existing business and other business opportunities; |
| • | delays in closing the acquisition due to third-party consents, regulatory approvals or other reasons; |
| • | adverse effects from disclosed or undisclosed matters pertaining to the acquisition; |
| • | loss or termination of employees and the costs associated with the termination or replacement of such employees; |
| • | the assumption of debt, litigation or other liabilities of the acquired business; |
| • | the incurrence of additional debt related to the acquisition; |
| • | costs, expenses and working capital requirements associated with the acquisition; |
| • | dilution of stock ownership of existing stockholders; |
| • | accounting charges for restructuring and related expenses, impairment of goodwill, amortization of intangible assets and stock-based compensation expense; and |
| • | risks associated with reactivation of idle vessels, such as higher than anticipated cost or time, unknown condition, and obsolescence or unavailability of spare parts or components. |
Even if we consummate an acquisition, the process of integrating the new acquisition into our operations may result in unforeseen operational difficulties and additional costs, and may adversely affect the effectiveness of internal controls over financial reporting. In addition, valuations supporting our acquisitions and strategic investments could change rapidly and integration may be more costly to accomplish than we expect. Moreover, our management may not be able to effectively manage a substantially larger business or successfully operate a new line of business. Failure to manage these acquisition risks could materially and adversely affect our ability to achieve anticipated levels of utilization, profitability or other benefits from the acquisitions, and ultimately could materially and adversely affect our business, results of operations and financial condition.
Uncertainty surrounding potential legal, regulatory and policy changes, as well as the potential for general market volatility and regulatory uncertainty, because of the upcoming United States presidential and congressional elections may have a material adverse effect on our results of operations, cash flows and financial position.
We and our customers, particularly in the oil and natural gas industry, face regulatory and tax uncertainties due to the upcoming United States presidential and congressional elections in the fall of 2024. The nature, timing
40
and economic effects of any potential change to the current legal and regulatory framework affecting our and our customers’ businesses are uncertain. Some changes may adversely affect our or our customers’ operations and have an adverse impact on our business, financial condition, results of operations and growth prospects. In addition, a significant portion of our revenue is generated from contracts with the United States government. For the six months ended June 30, 2024, charters with the MSC accounted for 16% of our consolidated revenues. Department of Defense (“DoD”) budgets could be negatively impacted by several factors, including, but not limited to, a change in defense spending policy as a result of the presidential election or otherwise, the United States government’s budget deficits, spending priorities, possible political pressure to reduce United States government military spending and the ability of the U.S. government to enact appropriations bills and other relevant legislation, each of which could cause the DoD budget to remain unchanged or to decline. A significant decline in United States military expenditures could negatively impact our revenue through an inability to enter into favorable charters with the United States government.
Our contracts with the United States government might not be renewed, may be renewed at lower rates or may impose additional requirements.
In 2023, we were informed that the MSC was conducting a market survey of companies capable of providing services we currently perform pursuant to a ten-year O&M contract scheduled to expire in February, 2025. We were subsequently informed that the MSC would seek to renegotiate that O&M contract with us on a sole-source basis. Due to factors outside our control, including government budget cuts or other political events, such as a prolonged government shutdown, we may be unable to renegotiate the contract on favorable terms or at all. Further, the contract or the sole-source determination may be challenged by third parties.
Our contracts with the United States government may impose requirements related to climate change, such as requirements that we disclose information about our GHG emissions or that we set and publicize emissions reductions targets for our operations. For example, in November 2022, the Federal Acquisition Regulatory Council proposed a rule under which we would qualify as a “major” contractor with at least $50 million in annual federal contracts, and thus would be required to disclose our Scope 1 and 2 GHG emissions and our relevant Scope 3 GHG emissions, make annual disclosures aligned with the recommendations of the Task Force on Climate-Related Financial Disclosures, and set science-based emissions reduction targets. See “Business—Government Regulation—Climate Change.” Our government contracts may be impacted by regulatory or legislative requirements related to climate change that could increase the cost of our government operations or accelerate obsolescence of vessels we employ for the government.
Our business involves a number of operational risks that may disrupt our business or adversely affect our financial results, and insurance may be unavailable or inadequate to protect against such risks.
Our vessels are subject to operating risks, including, but not limited to:
| • | catastrophic marine disaster; |
| • | adverse weather and sea conditions; |
| • | mechanical failure; |
| • | collisions or allisions; |
| • | oil spills or other hazardous substance releases; |
| • | navigational errors; |
| • | acts of God; and |
| • | war, terrorism or piracy. |
The occurrence of any of the enumerated events, or other similar events, may result in vessel damage, vessel loss, personnel injury or death, or environmental contamination. The occurrence of any such event could expose us to liability or costs.
41
Affected vessels may also be removed from service and thus be unavailable for income-generating activity.
Additionally, certain of our protection and indemnity insurance is provided by various mutual protection and indemnity associations. As associations, they rely on member premiums, investment reserves and income, and reinsurance to manage liability risks on behalf of their members. Increased investment losses, underwriting losses or reinsurance costs could cause domestic or international marine insurance associations to substantially raise the cost of premiums, resulting not only in higher premium costs, but also higher levels of deductibles. Increases in our premiums or deductible levels could adversely affect our operating costs.
While we believe that our insurance coverage is adequate and insures against risks that are customary in the industry, we may be unable to renew such coverage in the future at commercially reasonable rates. Moreover, existing or future coverage may not be sufficient to cover claims that may arise, and we do not maintain insurance for loss of income resulting from a marine casualty.
Operations in offshore waters have inherent and historically higher risk than onshore activities, and our operations could be affected by third-party actions.
Offshore operations are subject to a variety of operating risks specific to the marine environment, such as perils of the sea and marine casualty events that such perils can cause or contribute to, including capsizing, collisions, allisions and damage or loss from adverse weather conditions. In addition to being vulnerable to the risks associated with operating offshore, we may also be affected by actions of third-parties. For example, a third-party marine vessel may damage or destroy our assets or an accident caused by a third-party marine vessel may cause us to be subject to remediation and other costs resulting from releases of hazardous materials and other environmental and natural resource damages. In addition to utilization loss of our vessels and increased costs, these hazards could cause serious injuries, fatalities, contamination or property damage for which we could be held responsible.
Further, the offshore oil and gas and alternative energy industries are subject to unforeseen occurrences or catastrophic events such as hurricanes, fires, explosions, collisions involving marine vessels and oil spills. Such catastrophic events could negatively affect the industry as a whole, which could have a material adverse effect on our business and on our financial position, results of operations and cash flows.
Our operations may be materially adversely affected by tropical storms and hurricanes.
Tropical storms, hurricanes and the threat of tropical storms and hurricanes often result in the shutdown of operations in coastal regions, including the GoM, as well as operations within the path and the projected path of the tropical storms or hurricanes. The Atlantic hurricane season is June through November. In addition, climate change could result in an increase in the frequency and severity of tropical storms, hurricanes or other extreme weather events. In the future, during a tropical storm or hurricane, we may be unable to operate in the area of the storm. Additionally, tropical storms or hurricanes may cause evacuation of personnel, reduce the areas in which, or the number of days during which, our customers would contract for our vessels in general and cause damage to our vessels and other equipment, which may result in suspension of certain operations. The shutdowns, related evacuations and damage can create unpredictability in activity and utilization rates, as well as delays and cost overruns, which could have a material adverse effect on our business, financial condition and results of operations.
Cybersecurity attacks may result in potential liability or reputational damage or otherwise adversely affect our business.
Many of our business and operational processes are heavily dependent on traditional and emerging technology systems, some of which are managed by us and some of which are managed by third-party service and equipment providers, to conduct day-to-day operations, improve safety and efficiency and lower costs. We
42
use computerized systems to help run our financial and operations functions, including the processing of payment transactions, store confidential records and conduct vessel operations, which may subject our business to increased risks. If any of our financial, operational or other technology systems fail or have other significant shortcomings, our financial results could be adversely affected. Our financial results could also be adversely affected if an employee or other third party causes our operational systems to fail, either as a result of inadvertent error or by deliberately tampering with or manipulating our operational systems. In addition, dependence upon automated systems, including those on board our vessels, may further increase the risk of operational system flaws, and employee or other tampering or manipulation of those systems will result in losses that are difficult to detect.
Cybersecurity incidents are increasing in frequency and magnitude across all business types. We have experienced attempted cybersecurity attacks but have not suffered any material adverse effect to our business and operations as a result of such attempts. We have implemented security measures, internal controls and testing that are designed to detect and protect against cyberattacks. The Company regularly updates and reviews its testing protocols, however, no security measure is infallible. Despite these measures and any additional measures we may implement or adopt in the future, our facilities, vessels and systems, and those of our third-party service providers, have been and are vulnerable to security breaches, computer viruses, lost or misplaced data, programming errors, scams, burglary, human errors, misdirected wire transfers, and other adverse events, including threats to our critical operations technologies and process control networks. Third-party systems on which we rely could also suffer such attacks or operational system failures. Any of these occurrences could result in material harm to our business, including ransom payments, significant remediation and cybersecurity protection costs, loss of customer or employee data, loss of intellectual property or proprietary information, litigation and legal risks, including regulatory actions, potential liability, reputational damage, or damage to the company’s competitiveness, stock price and long-term shareholder value, or otherwise have an adverse effect on our business, operations and financial results.
In addition, laws and regulations governing data privacy and the unauthorized disclosure of confidential or protected information and recent legislation in certain U.S. states, pose increasingly complex compliance challenges and potentially elevate costs, and any failure to comply with these laws and regulations could result in significant penalties and legal liability.
Our operations in international markets and shipyard activities in foreign shipyards subjects us to risks inherent in conducting business internationally.
We derive a portion of our revenues from foreign sources. In addition, certain of our shipyard repair and procurement activities are being conducted with foreign vendors. We therefore face risks inherent in conducting business internationally, such as legal and governmental regulatory requirements, potential vessel detentions, seizures or nationalization of assets, import-export quotas or other trade barriers, difficulties in collecting accounts receivable and longer collection periods, political and economic instability, kidnapping of or assault on personnel, piracy, adverse tax consequences, difficulties and costs of staffing international operations and language and cultural differences. We do not hedge against foreign currency risk. While we endeavor to contract in U.S. dollars when operating internationally, some contracts may be denominated in a foreign currency, which would result in a foreign currency exposure risk. We also face risks related to administrative or other legal changes in foreign cabotage laws, or other legal or administrative changes that adversely impact planned or expected offshore energy development. For instance, since the fourth quarter of 2023, maritime regulators in Mexico have implemented new approaches in their oversight of Navieras that historically have had permissible levels of non-Mexican ownership, such as ours. As a result, we took legal action in Mexico to preserve our cabotage privileges there, and a Mexican court has ordered that our cabotage privileges be reinstated. We have appealed this decision to further clarify the court’s ruling, and our cabotage privileges remain active during the pendency of the appeal. We expect the appellate process to last between one and three years. If determined in a manner that is unfavorable to the Company, we expect that the Company may not be able to continue Mexican cabotage operations under its current structure. If the Company prevails in its appeal, we expect that the
43
Company will be able to continue to exercise its reinstated privileges, unless legislative or other actions disallow such operations. Despite these favorable court rulings, and the pendency of appeals, Mexican maritime regulators have limited our ability to object to the employment of non-Mexican flag vessels that compete with our own Mexican-flagged vessels, which is one of the privileges of a Mexican Naviera. Since the fourth quarter of 2023, we have moved all but two of our Mexican-flagged vessels into various non-Mexican international markets to continue utilizing our highly-skilled Mexican mariners and shore-based employees as part of our international services, which we believe will result in a temporary reduction of revenue for some of those vessels. All of these risks associated with our international operations are beyond our control and difficult to insure against. We cannot predict the nature and the likelihood of any such events. If such an event should occur, however, it could have a material adverse effect on our financial condition and results of operations.
Our employees are covered by federal laws that may subject us to job-related claims in addition to those provided by state laws.
Provisions of the Jones Act, the Death on the High Seas Act and general maritime law cover certain of our employees. These laws preempt state workers’ compensation laws and permit employees and their representatives to pursue actions against employers for job-related tort claims in federal courts. Because we are generally not protected by the damage limits imposed by state workers’ compensation statutes for these types of claims, we may be exposed to higher damage awards for these types of claims.
We are susceptible to unexpected increases in operating expenses such as crew wages, materials and supplies, maintenance and repairs and insurance costs.
Many of our operating costs, such as crew wages, materials and supplies, maintenance and repairs, and insurance costs are unpredictable and vary based on events beyond our control. Our profitability will vary based on fluctuations in operating costs. If our operating costs increase, we may not be able to recover such costs from customers. Such an increase in operating costs could adversely affect our financial results.
We may be unable to collect amounts owed to us by customers.
We typically grant customers credit on a short-term basis. Because we do not typically collect collateralized receivables from customers, we are subject to credit risk on the credit we extend. We estimate uncollectible accounts in our financial statements based on historical losses, current economic conditions, and individual customer evaluations. However, our estimates may not be accurate and the receivables due from customers as reflected in our financial statements may not be collectible.
Our business may be subject to risks related to climate change, including physical risks such as increased adverse weather patterns and transition risks such as evolving climate change regulation, alternative fuel measures and/or mandates, shifting consumer preferences, technological advances and negative shifts in market perception towards the oil and natural gas industry and associated businesses, any of which could result in increased operating expenses and capital costs or decreased resources and adversely affect our financial results.
One of the asserted long-term physical effects of climate change may be an increase in the severity and frequency of adverse weather conditions, such as hurricanes, which may increase our insurance costs or risk retention, limit insurance availability or reduce the areas in which, or the number of days during which, our customers would contract for our vessels in general and in the U.S. GoM in particular. Such conditions could also cause damage to our assets. Any of these impacts, individually or in the aggregate, could materially and adversely affect our business, financial conditions, and results of operations. We are currently unable to predict the manner or extent of any such effect. Our ability to mitigate the adverse physical impacts of climate change depends in part upon our disaster preparedness and response and business continuity planning.
44
Combating the effects of climate change continues to attract considerable attention in the United States and internationally, including from regulators, legislators, companies in a variety of industries, financial market participants and other stakeholders. This focus, together with government grants, incentives and subsidies focused on alternative energy development, such as those contained in the IRA 2022, and changes in consumer and industrial/commercial behavior, preferences and attitudes with respect to the generation and consumption of energy, petroleum products and the use of products manufactured with, or powered by, petroleum products, may in the long-term result in (i) the enactment of additional climate change-related regulations, policies and initiatives (at the government, regulator, corporate and/or investor community levels), including alternative energy requirements, new fuel consumption standards, energy conservation and emissions reductions measures and responsible energy development, (ii) technological advances with respect to the generation, transmission, storage and consumption of energy (e.g., wind, solar and hydrogen power, smart grid technology and battery technology, and increasing efficiency) and (iii) increased availability of, and increased consumer and industrial/commercial demand for, alternative energy sources and products manufactured with, or powered by, alternative energy sources (e.g., electric vehicles and renewable residential and commercial power supplies).
Climate change legislation and regulatory initiatives may arise from a variety of sources, including international, national, regional and state levels of government and associated administrative bodies, seeking to monitor, restrict or regulate existing emissions of GHGs, such as carbon dioxide and methane, as well as to restrict or eliminate future emissions. Restrictions on GHG emissions that may be imposed, or the adoption and implementation of regulations that require reporting of GHG emissions or other climate-related information or otherwise seek to limit GHG emissions (including carbon pricing schemes) from ourselves or our customers, could adversely affect our business and the oil and gas industry. Accordingly, our business and operations, and those of our customers, are subject to executive, regulatory, political and financial risks associated with marine transportation, petroleum products and the emission of GHGs. Any legislation or regulatory programs related to climate change could increase our costs and require substantial capital, compliance, operating and maintenance costs, reduce demand for petroleum and related marine transportation services, reduce our access to financial markets, and create greater potential for governmental investigations or litigation. For example, the adoption of legislation or regulatory programs to reduce GHG emissions could require us or our customers to incur increased operating costs or acquire emissions allowances or to comply with new regulatory requirements. Such regulatory initiatives could also stimulate demand for alternative forms of energy that do not rely on petroleum products and indirectly reduce demand for our services. Further, the U.S. Securities and Exchange Commission (the “SEC”) adopted its final rules for climate-related disclosures in March 2024 (the “SEC Climate Rules”), which will mandate extensive disclosure of certain climate-related information, including, among other items, material climate-related risks and related governance, strategy and risk management processes, and certain financial impacts. The SEC Climate Rules are currently stayed pending completion of judicial review and are widely expected to face additional legal challenges going forward. We cannot currently predict with certainty the timing and costs of implementation or any potential adverse impacts resulting from the SEC Climate Rules. However, assuming they take effect, we could incur additional operational and compliance burdens and increased costs relating to the assessment and disclosure of climate-related matters, including costs relating to establishment of additional internal controls and collecting, measuring and analyzing information related to such matters. Further, we cannot predict how any information disclosed pursuant to the rules may be used by financial institutions or investors. We may face increased litigation and enforcement risks, or limits or restrictions on our access to capital, related to disclosures made pursuant to the SEC Climate Rules.
Fuel conservation measures, alternative fuel requirements, increasing consumer demand for alternatives to oil and natural gas, technological advances in fuel economy and energy generation devices, and the increased competitiveness of and technological advances with respect to alternative energy sources (such as electric vehicles, wind, solar, geothermal, tidal, fuel cells and biofuels) could reduce demand for oil and natural gas and therefore indirectly negatively impact our revenues. Furthermore, as our competitors use or develop new technological advances designed to reduce their impacts on the environment or climate change, such as the use of alternative fuels for marine vessels, we may be placed at a competitive disadvantage or may be forced by competitive pressures to implement new technologies at substantial costs. We may not be able to respond to these
45
competitive pressures or implement new technologies on a timely basis or at an acceptable cost. If one or more of the technologies we use now or in the future were to become obsolete, our business, financial condition or results of operations could be materially and adversely affected.
Additionally, certain segments of the investor community have recently expressed negative sentiment towards investing in the oil and natural gas industry and associated businesses. Climate change-related developments in particular may result in negative perceptions of the traditional oil and gas industry and, in turn, reputational risks involving business activities associated with petroleum product exploration and production. There have been efforts in recent years, for example, to influence the investment community, including investment advisors, insurance companies, and certain sovereign wealth, pension and endowment funds and other groups, by promoting divestment of fossil fuel equities and pressuring lenders to limit funding and insurance underwriters to limit coverages to companies engaged in the extraction of fossil fuel reserves. Financial institutions may elect in the future to shift some or all of their investment into non-fossil fuel related sectors. Some investors, including certain pension funds, university endowments and family foundations, have stated policies to reduce or eliminate their investments in the oil and natural gas sector based on social and environmental considerations. Institutional lenders who provide financing to companies associated with the oil and gas industry have also become more attentive to sustainable lending practices, and some may elect not to provide traditional energy producers or companies that support such producers with funding. Such developments could ultimately result in reduced demand for our services or reduce our access to, and increase the cost of, debt or capital.
Any legislation, regulatory programs, technological advances or social pressures related to climate change could increase our or our customers’ operating and compliance costs, reduce demand for our services, and, together with negative investor sentiment, may have a material adverse effect on our business, financial condition, results of operations and cash flows. For further discussion, please see “Business—Government Regulation—Climate Change.”
Increased scrutiny and changing stakeholder expectations with respect to ESG matters may impact our business and expose us to additional risks.
In recent years, companies across all industries are facing increasing scrutiny from stakeholders related to their ESG and sustainability practices. A number of advocacy groups, both domestically and internationally, have engaged in activism campaigns centered around increasing attention and demands for governmental and private sector action related to climate change and promoting the use of substitutes to fossil fuel products. Further, failure or a perception (whether or not valid) of failure to implement our ESG strategy or achieve sustainability goals and targets we have set, could damage our reputation, causing our investors or other stakeholders to lose confidence in the Company, and negatively impact our operations. There can be no assurance that we will be able to accomplish any announced goals, targets initiatives, commitments or objectives related to our ESG strategy, as statements regarding the same reflect our current plans and aspirations and are not guarantees that we will be able to achieve them within the timelines we announce, or at all. In certain circumstances, we could determine in our discretion that it is not feasible or practical to implement or complete certain of our ESG goals, targets, initiatives, policies or procedures based on cost, timing or other considerations. Our continuing efforts to research, establish, accomplish and accurately report on the implementation of our ESG strategy, including any ESG goals, may also create additional operational risks and expenses and expose us to reputational, legal and other risks. Moreover, while we may create and publish voluntary disclosures regarding ESG matters from time to time, some of the statements in those voluntary disclosures may be based on hypothetical expectations and assumptions that may or may not be representative of current or actual risks or events or forecasts of expected risks or events, including the costs associated therewith. Such expectations and assumptions are necessarily uncertain and may be prone to error or subject to misinterpretation given the long timelines involved and the lack of an established single approach to identifying, measuring and reporting on many ESG matters. The occurrence of any of the foregoing could have a material adverse effect on our business and financial condition.
46
Further, our business and growth opportunities require us to have strong relationships with various key stakeholders, including our investors, employees, suppliers, customers and others. We may face pressures from stakeholders, many of whom are increasingly focused on climate change, to prioritize sustainable energy practices, reduce our carbon footprint and promote sustainability while at the same time remaining a successfully operating business. If we do not successfully manage expectations across these varied stakeholder interests, it could erode our stakeholder trust and thereby affect our brand and reputation. Such erosion of confidence could negatively impact our business through decreased demand and growth opportunities, delays in projects, increased legal action and regulatory oversight, adverse press coverage and other adverse public statements, difficulty hiring and retaining top talent, difficulty obtaining necessary approvals and permits from governments and regulatory agencies on a timely basis and on acceptable terms and difficulty securing investors and access to debt or capital.
In addition, organizations that provide information to investors on corporate governance and related matters have developed ratings processes for evaluating companies on their approach to ESG matters. Such ratings are used by some investors to inform their investment decisions and thus unfavorable ESG ratings could have a negative impact on our access to and cost of capital as well as our reputation.
Supplier capacity constraints or shortages in parts, equipment or materials, supplier production disruptions, supplier quality and sourcing issues or price increases could increase our operating costs, decrease our revenues and adversely impact our operations.
Our reliance on third-party suppliers, manufacturers and service providers to secure equipment and materials used in our operations exposes us to volatility in the quality, price and availability of such items. During periods of reduced demand, many of these third-party suppliers reduced their inventories of parts and equipment and, in some cases, reduced their production capacity. Further, the volatility of the price of steel can impact the construction and repair costs of our vessels. When we seek to reactivate stacked vessels, upgrade our active vessels or purchase additional vessels, these reductions and global supply chain constraints could make it more difficult for us to find equipment, materials, parts and labor for our vessels. If an alternative vendor to obtain equipment or parts is unavailable, many of the specialized parts and equipment we utilize are rebuildable, can be found in the aftermarket, or can be substituted with crossover components in a similar time period, or if such options were unavailable or could not be completed in a timely manner, we have a sufficient fleetsize with legacy technology to use component parts from certain vessels to keep our other vessels running. However, there is a risk that the use of one or more of such alternatives could cause a disruption or delay to our routes or operations resulting in an adverse effect on our business. While we believe we maintain a sufficient inventory of spare parts and equipment and have employed highly-trained, internal technical resources, including engineers and repair technicians, capable of maintaining, repairing or rebuilding the specialized machinery and equipment aboard our vessels, there can be no assurance that these measures would be sufficient to avoid an adverse impact on our business during periods of reduced demand or supply chain constraints. A disruption or delay in the deliveries from third-party suppliers, capacity constraints, production disruptions, price increases (including those related to the price of steel, inflation and supply chain disruptions), defects or quality-control issues, recalls or other decreased availability or servicing of parts and equipment could adversely affect our ability to meet our commitments to customers on a timely basis and adversely impact our operations and revenues by resulting in uncompensated downtime, reduced dayrates, the incurrence of liquidated damages or other penalties or the cancellation or termination of contracts, or increase our operating costs.
We may be unable to effectively and efficiently manage our fleet as we expand our business, which could have an adverse effect on our business, financial condition and results of operations.
We have expanded, and plan to continue to expand, the size, scope and nature of our business through mergers and acquisitions, resulting in an increase in the breadth of our fleet and service offerings and an expansion of our business geographically, including in traditional oilfield as well as offshore wind, military and other non-oilfield applications. Business expansion places increasing demands on us and/or our fleet. We must anticipate demand well into the future in order to service our extensive customer base. The inability to effectively and efficiently manage our assets to meet the current and future needs of our customers, which may vary widely
47
from what is originally forecast due to a number of factors beyond our control, including periods of difficult market conditions or slowdowns in any of the business sectors or various regions in which we operate, could have an adverse effect on our business, financial condition and results of operations. We could experience any of these conditions at the same time, resulting in a relatively greater impact on our results of operations than they might have on other companies that have more diversified operations.
Certain of our principal stockholders are involved in other ventures related to the offshore services industry and have the ability to take actions that could conflict with our interests.
Certain of our directors, including those directors appointed by our principal stockholders or their investment managers or respective affiliates are involved in the offshore services industry through their direct and indirect participation in businesses which are our potential competitors, service providers or customers. Situations may arise in connection with potential acquisitions, investments or contractual disputes where the other interests of these directors may conflict with our interests. Although our directors with conflicts of interest will be subject to and expected to follow the procedures set out in applicable legislation, regulations, rules and policies, any conflicts of interest may not be resolved in favor of our interests. Additionally, the involvement of our directors with other business ventures may require their time and attention be shared with their other business ventures.
Our principal stockholders may also have an interest in pursuing acquisitions, divestitures, financings or other transactions that, in their judgment, could enhance their equity investment, even though such transactions might involve risks to our other investors and lenders. In addition, our principal stockholders and their investment managers and respective affiliates are in the business of making investments in companies and may, from time to time, acquire interests in businesses that directly or indirectly compete with our business, as well as businesses that are significant existing or potential customers or service providers. Our principal stockholders or their investment managers or respective affiliates may also seek to acquire businesses and/or assets that we seek to acquire and, as a result, these acquisition opportunities may not be available to us or may be more expensive for us to pursue.
Risks Relating to Legal, Regulatory, Accounting and Tax Matters
We may be unable to maintain an effective system of disclosure controls and procedures or internal control over financial reporting and produce timely and accurate financial statements or comply with applicable regulations.
As a public company, we will be subject to the reporting requirements of the Securities Exchange Act of 1934, as amended (the “Exchange Act”) the Sarbanes-Oxley Act of 2002 (the “Sarbanes-Oxley Act”), and, if approved for listing, the rules and regulations and the listing standards of NYSE.
The Sarbanes-Oxley Act requires, among other things, that we maintain effective disclosure controls and procedures and internal control over financial reporting. We are continuing to develop and refine our disclosure controls and other procedures that are designed to ensure that information required to be disclosed by us in the reports that we will file with the SEC is recorded, processed, summarized and reported within the time periods specified in SEC rules and forms and that information required to be disclosed in reports under the Exchange Act is accumulated and communicated to our principal executive and financial officers. We are also continuing to improve our internal control over financial reporting. In order to maintain and improve the effectiveness of our disclosure controls and procedures and internal control over financial reporting, we have expended, and anticipate that we will continue to expend, significant resources, including accounting-related costs and significant management oversight.
We may discover weaknesses in our disclosure controls and procedures and internal control over financial reporting in the future. Any failure to develop or maintain effective controls or any difficulties encountered in their implementation or improvement could harm our operating results or cause us to fail to meet our reporting obligations and may result in a restatement of our financial statements for prior periods. Any failure to implement and maintain effective internal control over financial reporting also could adversely affect the results of periodic
48
management evaluations and annual independent registered public accounting firm attestation reports regarding the effectiveness of our internal control over financial reporting that we will eventually be required to include in our periodic reports that will be filed with the SEC. Ineffective disclosure controls and procedures and internal control over financial reporting could cause delays in our ability to comply with public company reporting requirements (including under the Exchange Act or stock exchange rules) and could also cause investors to lose confidence in our reported financial and other information, which could have a negative effect on the trading price of our common stock. In addition, if we are unable to continue to meet these requirements, we may not be able to remain listed on the NYSE. We are not currently required to comply with the SEC rules that implement Section 404 of the Sarbanes-Oxley Act and are therefore not required to make a formal assessment of the effectiveness of our internal control over financial reporting for that purpose. As a public company, we will be required to provide an annual management report on the effectiveness of our internal control over financial reporting commencing with our second annual report.
Our independent registered public accounting firm is not currently required to formally attest to the effectiveness of our internal control over financial reporting. Once such reporting becomes required, our independent registered public accounting firm may issue a report that is adverse in the event it is not satisfied with the level at which our internal control over financial reporting is documented, designed or operating. Any failure to maintain effective disclosure controls and internal control over financial reporting could have a material adverse effect on our business and operating results and could cause a decline in the price of our common stock.
We and our directors and executive officers may be subject to litigation for a variety of claims, which could harm our reputation and adversely affect our business, results of operations and financial condition.
In the ordinary course of business, we have in the past and may in the future be involved in and subject to litigation for a variety of claims or disputes and receive regulatory inquiries. These claims, lawsuits and proceedings could include labor and employment, wage and hour, commercial, regulatory, antitrust, alleged securities law violations or other investor claims, environmental damage, claims that our employees have wrongfully disclosed or we have wrongfully used proprietary information of our employees’ former employers and other matters. Claims under any such litigation may be material or may be indeterminate. The number and significance of these potential claims and disputes may increase as our business expands. Further, our general liability insurance may not cover all potential claims made against us or be sufficient to indemnify us for all liability that may be imposed. Any claim against us, regardless of its merit, could be costly, divert management’s attention and operational resources, and harm our reputation.
Our directors and executive officers may also be subject to litigation. The limitation of liability and indemnification provisions that are included in our amended and restated certificate of incorporation, our amended and restated bylaws and indemnification agreements that we have entered into with our directors and executive officers provide that we will indemnify our directors and officers to the fullest extent permitted by Delaware law and may discourage stockholders from bringing a lawsuit against our directors and executive officers for breach of their fiduciary duties. Such provisions may also reduce the likelihood of derivative litigation against our directors and executive officers, even though an action, if successful, might benefit us and other stockholders. Further, a stockholder’s investment may be harmed to the extent that we pay the costs of settlement and damage awards against our directors and executive officers as required by these indemnification provisions. We have obtained insurance policies under which, subject to the limitations of the policies, coverage is provided to our directors and executive officers against loss arising from claims made by reason of breach of fiduciary duty or other wrongful acts as a director or executive officer, including claims relating to securities matters, and to us with respect to payments that may be made by us to these directors and executive officers pursuant to our indemnification obligations or otherwise as a matter of law. These insurance policies may not cover all potential claims made against our directors and executive officers, may not be available to us in the future at a reasonable rate and may not be adequate to indemnify us for all liability that may be imposed.
49
As litigation is inherently unpredictable, we cannot assure you that any potential claims or disputes will not harm our business, results of operations and financial condition.
We do not own the Hornbeck Brands, but may use the Hornbeck Brands pursuant to the terms of a license granted by HFR, and our business may be materially harmed if we breach our license agreement or it is terminated.
In connection with the closing of this offering, we will amend and restate our Third Amended and Restated Trade Name and Trademark License Agreement, dated September 4, 2020 (the “Third A&R License Agreement”). Pursuant to the Fourth A&R License Agreement (as defined herein) between us and HFR, LLC (“HFR”), we will have an exclusive license to use the various Hornbeck trade names and trademarks provided in the Fourth A&R License Agreement, which include “Hornbeck,” “Hornbeck Offshore,” “Hornbeck Offshore Services,” “HOS,” “HOSMAX,” “HOSS” and our current horse head logos (the “Hornbeck Brands”). The Fourth A&R License Agreement will have a term of ten years, which can be extended at the option of the Company, provided that Todd M. Hornbeck is our CEO or Chairman of our Board of Directors and the Company pays a renewal fee of $10 million to HFR (as adjusted for inflation over the first ten-year term). The Fourth A&R License Agreement will be terminable by us for convenience, by HFR for our material breach of the Fourth A&R License Agreement, or if Todd Hornbeck is no longer our CEO or Chairman of our Board of Directors, whether he has been terminated with or without cause or has resigned or departed the Company. In each of these events, the Company is entitled to a wind-down period of between two and five years, depending upon the reason for termination and the date of its occurrence.
Termination of the Fourth A&R License Agreement would eliminate our rights to use the Hornbeck Brands and to use our corporate name and may result in our having to undergo other significant rebranding efforts. Loss of the rights to use the Hornbeck Brands could disrupt our recognition in the marketplace, damage goodwill we may have generated, and otherwise have a material adverse effect on us. These rebranding efforts may require significant resources and expenses and may affect our ability to attract and retain customers, all of which may have a material adverse effect on our business, contracts, financial condition, operating results, liquidity and prospects.
Our success also depends in part upon successful prosecution, maintenance, enforcement and protection of our owned and licensed intellectual property, including the Hornbeck Brands that we license from HFR. Under the Fourth A&R License Agreement, we will be obligated to take actions to obtain, maintain, enforce and protect the Hornbeck Brands. Should we fail to maintain, enforce or protect the Hornbeck Brands or other intellectual property, we could be materially harmed. See “Certain Relationships and Related Party Transactions—Third and Fourth Amended and Restated License Agreement.”
Defending against intellectual property claims could adversely affect our business.
We may from time to time face allegations that we are infringing, misappropriating or otherwise violating the intellectual property rights of third parties, including the intellectual property rights of our competitors. We may be unaware of the intellectual property rights that others may claim cover some or all of our technology or services. Irrespective of the validity of any such claims, we could incur significant costs and diversion of resources in defending against them, and there is no guarantee any such defense would be successful, which could have a material adverse effect on our business, contracts, financial condition, operating results, liquidity and prospects.
Even if these matters do not result in litigation or are resolved in our favor or without significant cash settlements, these matters, and the time and resources necessary to litigate or resolve them, could divert the time and resources of our management team and harm our business, our operating results and our reputation.
50
Subjective estimates and judgments used by management in the preparation of our financial statements, including estimates and judgments that may be required by new or changed accounting standards, may impact our financial condition and results of operations.
The preparation of financial statements requires management to make estimates and judgments that affect the reported amounts of assets, liabilities, revenue and expenses. Due to the inherent uncertainty in making estimates, results reported in future periods may be affected by changes in estimates reflected in our financial statements for earlier periods. Estimates and judgments are continually evaluated and are based on historical experience and other factors, including expectations of future events that are believed to be reasonable under the circumstances. From time to time, there may be changes in the financial accounting and reporting standards that govern the preparation of our financial statements. These changes can materially impact how we record and report our financial condition and results of operations. In some instances, we could be required to apply a new or revised standard retrospectively. If the estimates and judgments we use in preparing our financial statements are subsequently found to be incorrect or if we are required to restate prior financial statements, our financial condition or results of operations could be significantly affected.
Changes in tax laws could adversely affect our business, financial condition and results of operations.
Changes in tax laws in any of the multiple jurisdictions in which we operate, or adverse outcomes from tax audits that we may be subject to in any such jurisdiction, could result in an unfavorable change in our effective tax rate, which could adversely affect our business, financial condition and operating results. In particular, in the United States, the recently enacted IRA 2022 introduced, among other changes, a 15% corporate minimum tax on certain United States corporations and a 1% excise tax on certain stock redemptions by publicly traded United States corporations. We do not currently expect that the 15% corporate minimum tax or 1% excise tax would have an effect on our overall effective tax rate. However, we are currently unable to predict the ultimate impact of the IRA 2022 or any further changes in U.S. tax law on our business, financial condition and operating results. In addition, tax laws are dynamic and subject to change as new laws are passed and new interpretations of the law are issued or applied. For example, the Biden administration has proposed several tax increases, including raising the U.S. corporate income tax rate from 21% to 28%.
Further, we operate in a number of jurisdictions, which contributes to the volatility of our effective tax rate. Changes in tax laws or the interpretation of tax laws in the jurisdictions in which we operate may affect our effective tax rate. For example, a number of countries, as well as organizations such as the Organization for Economic Cooperation and Development, support a global minimum tax initiative. Such countries and organizations are also actively considering changes to existing tax laws or have proposed new tax laws that could increase our tax obligations. In addition, we are required under GAAP to place valuation allowances against our NOL carryforwards and other deferred tax assets in certain tax jurisdictions. These valuation allowances result from analysis of positive and negative evidence supporting the realization of tax benefits. Negative evidence includes a cumulative history of pre-tax operating losses in specific tax jurisdictions. Changes in valuation allowances have historically resulted in material fluctuations in our effective tax rate. Economic conditions or changes in tax laws may dictate the continued imposition of current valuation allowances and, potentially, the establishment of new valuation allowances. While significant valuation allowances remain, our effective tax rate will likely continue to experience significant fluctuations. Furthermore, certain foreign jurisdictions may take actions to delay our ability to collect value-added tax refunds.
Our ability to utilize our NOL carryforwards may be limited.
As of December 31, 2023, we had deferred tax assets related to U.S. federal NOL carryforwards of approximately $55.6 million and state NOL carryforwards of approximately $6.0 million. Our ability to utilize our U.S. federal and state NOL carryforwards depends on many factors, including our future income, which cannot be assured. Section 382 of the Internal Revenue Code of 1986, as amended (the “Code”) generally imposes an annual limitation on the amount of NOLs that may be used to offset taxable income when a
51
corporation has undergone an “ownership change” (as determined under Section 382 of the Code). An ownership change generally occurs if one or more stockholders (or groups of stockholders) who are each deemed to own at least 5% of such corporation’s stock increase their aggregate ownership by more than 50 percentage points over their lowest ownership percentage within a rolling three-year period. In the event that an ownership change occurs, utilization of the relevant corporation’s NOLs would be subject to an annual limitation under Section 382 of the Code, generally determined, subject to certain adjustments, by multiplying (i) the fair market value of the corporation’s equity at the time of the ownership change by (ii) the highest percentage approximately equivalent to the yield on long-term tax-exempt bonds for any month in the three-calendar month period ending with the calendar month in which the ownership change occurs. Any unused annual limitation may be carried over to later years. A portion of our NOLs is already limited under Section 382 of the Code as a result of an ownership change that occurred in connection with our reorganization in September 2020. We do not currently expect that this offering would result in an additional ownership change under Section 382 of the Code; however, future changes in our stock ownership, which may be outside of our control, may trigger an additional ownership change and, consequently, additional limitations under Section 382 of the Code. Any such limitations on our ability to use our NOL carryforwards to offset future taxable income could adversely affect our future cash flows. Many states have similar laws, in addition to laws that suspend, reduce or eliminate the ability to carry losses forward. Our state NOLs relate to Louisiana and a portion of such NOLs are subject to an annual limitation due to the ownership change described above. Accordingly, our state NOLs totaling $6.0 million as of December 31, 2023 may be carried forward indefinitely, but the deductibility of a portion of such state NOLs may be limited to the lesser of 72% of the current year taxable income or the available NOL carryforward for returns filed on or after July 1, 2015.
We are subject to various anti-corruption laws and regulations and laws and regulations relating to economic sanctions. Violations of these laws and regulations could have a material adverse effect on our business, financial condition and results of operations.
We are subject to various anti-corruption laws, including the U.S. Foreign Corrupt Practices Act, the United Nations Convention Against Corruption and the Brazil Clean Company Act. These laws generally prohibit companies and their intermediaries from engaging in bribery or making other improper payments of cash (or anything else of value) to government officials and other persons in order to obtain or retain business or to obtain an improper business benefit. Our business operations also must be conducted in compliance with applicable economic sanctions laws and regulations, including rules administered by the U.S. Department of the Treasury’s Office of Foreign Assets Control, the U.S. Department of State, the U.S. Department of Commerce, the United Nations Security Council, and other relevant authorities.
We strive to conduct our business activities in compliance with relevant anti-corruption laws and regulations, and we have adopted proactive procedures to promote such compliance. While we are not aware of issues of historical noncompliance, full compliance cannot be guaranteed. Violations of anti-corruption laws and regulations, or even allegations of such violations, could result in civil or criminal penalties or other fines or sanctions, including prohibition of our participating in or curtailment of business operations in those jurisdictions and the seizure of vessels or other assets, which could have a material adverse effect on our business, financial condition and results of operation. Moreover, we may be held liable for actions taken by local partners or agents in violation of applicable anti-bribery laws, even though these partners or agents may themselves not be subject to such laws. Further, changes to the applicable laws and regulations, and/or significant business growth, may result in the need for increased compliance-related resources and costs.
Our Creditor Warrants are accounted for as liabilities and changes in the value of these warrants could have a material effect on our financial results.
Our Creditor Warrants (warrants entitling holders to purchase common stock at a strike price set at an enterprise value of $621.2 million, or $27.83 per share ($ per share after giving effect to the stock split) (subject to adjustment)), were issued on September 4, 2020. ASC 815-40 provides for the remeasurement of the
52
fair value of such derivatives at each balance sheet date, with a resulting non-cash gain or loss related to the change in the fair value being recognized in the consolidated statements of operations. As a result of the recurring fair value measurement, for so long as the Creditor Warrants remain outstanding or not amended, our financial statements and results of operations may fluctuate quarterly based on factors which are outside of our control. Due to the recurring fair value measurement, we expect that we will recognize non-cash gains or losses on the Creditor Warrants each reporting period that they remain outstanding or not amended and that the amount of such gains or losses could be material. See Note 11 to our Annual Financial Statements and Note 9 to our Quarterly Financial Statements included elsewhere in this prospectus for additional information about the Creditor Warrants.
Risks Relating to Our Indebtedness
Our indebtedness could materially adversely affect our financial condition.
We have a significant amount of indebtedness. As of June 30, 2024, our total indebtedness was approximately $349.0 million, consisting of outstanding principal amount of Second Lien Term Loans under the Second Lien Credit Agreement.
Our substantial indebtedness could have important consequences, including the following:
| • | making it more difficult for us to satisfy our other obligations; |
| • | limiting our ability to obtain additional financing to fund future working capital, capital expenditures, acquisitions or other general corporate requirements; |
| • | requiring us to dedicate a substantial portion of our cash flows to debt service payments instead of other purposes, thereby reducing the amount of cash flows available for working capital, capital expenditures, acquisitions and other general corporate purposes; |
| • | increasing our vulnerability to general adverse economic and industry conditions; |
| • | limiting our flexibility in planning for and reacting to changes in the industry in which we compete; |
| • | placing us at a disadvantage compared to other, less leveraged competitors; and |
| • | increasing our cost of borrowing. |
In addition, each of the First Lien Credit Agreement and the Second Lien Credit Agreement contains restrictive covenants that limit our ability to engage in activities that may be in our long-term best interest. Our failure to comply with those covenants could result in an event of default which, if not cured or waived, could result in the acceleration of all our debt and/or the exercise of other remedies by the lenders and other secured parties thereunder. See “Management’s Discussion and Analysis of Financial Condition and Results of Operations—Liquidity and Capital Resources.”
We may not be able to generate sufficient cash to service all of our indebtedness or repay such indebtedness when due and may be forced to take other actions to satisfy our obligations under our indebtedness, such as refinancings, which may not be successful or completed on favorable terms.
Our ability to make scheduled payments on or refinance our debt obligations depends on our financial condition and operating performance, which are subject to prevailing economic and competitive conditions and to certain financial, business, legislative, regulatory and other factors beyond our control. We cannot be sure that our business will generate sufficient cash flows from operating activities, or that future borrowings will be available, to permit us to pay the principal, premium, if any, and interest on our indebtedness.
If our cash flows and capital resources are insufficient to fund our debt service obligations, we could face substantial liquidity problems and could be forced to reduce or delay investments and capital expenditures or to
53
dispose of material assets or operations, seek additional debt or equity capital or restructure or refinance our indebtedness. We may not be able to implement any such alternative measures, if necessary, on a timely basis or at all. Even if successful, we may not be able to negotiate such alternative actions on favorable terms and such actions may not be sufficient to allow us to meet our scheduled debt service obligations.
For example, the loans under the Second Lien Credit Agreement mature in March 2026. If, at such time, market conditions are materially different or our credit profile has deteriorated, the cost of refinancing our debt may be significantly higher than our indebtedness existing at that time and may require us to comply with more onerous covenants that could further restrict our business operations, or we may not be able to refinance such debt at all. Additionally, each of the First Lien Credit Agreement and the Second Lien Credit Agreement restricts, and any of our future debt instruments may restrict, our ability to dispose of assets and use the proceeds from those dispositions and may also restrict our ability to raise debt or equity capital to be used to repay other indebtedness when it becomes due. We may not be able to consummate any such dispositions or to obtain proceeds in an amount sufficient to meet any debt service obligations then due. See “Management’s Discussion and Analysis of Financial Condition and Results of Operations—Liquidity and Capital Resources—Debt Agreements.”
Any failure to meet any future debt service obligations or any inability to obtain any additional financing on terms acceptable to us or to comply therewith could have a material adverse effect on our business, financial condition and results of operations.
Despite our current level of indebtedness, we and our subsidiaries may still be able to incur substantially more debt. This could further exacerbate the risks to our financial condition described herein.
We and our subsidiaries may be able to incur significant additional indebtedness in the future. Although each of the First Lien Credit Agreement and the Second Lien Credit Agreement contains restrictions on the incurrence of additional indebtedness, these restrictions are subject to a number of qualifications and exceptions, and the additional indebtedness incurred in compliance with these restrictions could be substantial. These restrictions on the incurrence of additional indebtedness also will not prevent us from incurring obligations that do not constitute indebtedness, such as the remaining $48.5 million commitment under the MPSV construction contracts as of June 30, 2024.
The terms of the First Lien Credit Agreement and the Second Lien Credit Agreement restrict our current and future operations, including our ability to respond to changes or to take certain actions.
Each of the First Lien Credit Agreement and the Second Lien Credit Agreement contains a number of restrictive covenants that impose significant operating and financial restrictions on us and may limit our ability to engage in acts that may be in our long-term best interest. See “Management’s Discussion and Analysis of Financial Condition and Results of Operations—Liquidity and Capital Resources—Debt Agreements.” The restrictive covenants under the First Lien Credit Agreement and the Second Lien Credit Agreement include restrictions on our ability to:
| • | incur additional indebtedness and guarantee indebtedness; |
| • | pay dividends or make other distributions or repurchase or redeem our capital stock; |
| • | prepay, redeem or repurchase subordinated, junior lien and unsecured debt; |
| • | issue certain preferred stock or similar equity securities; |
| • | make loans and investments; |
| • | sell or otherwise dispose of assets or property, except in certain circumstances; |
| • | create or incur liens; |
| • | enter into transactions with affiliates; |
54
| • | enter into agreements restricting our subsidiaries’ ability to pay dividends, to enter into and perform certain intercompany debt transactions and to transfer assets to us or other subsidiaries; |
| • | permit the sum of our and our subsidiaries’ unrestricted cash and cash equivalents, determined in accordance with GAAP (including any cash and cash equivalents held in an account subject to a control agreement in favor of the secured parties under the First Lien Credit Agreement and the Second Lien Credit Agreement and any unused commitments available to be borrowed under any other permitted debt facility) to be less than $25 million as of the last day of any fiscal quarter; and |
| • | make fundamental changes in our business, corporate structure or capital structure, including, among other things, entering into mergers, acquisitions, consolidations and other business combinations. |
As a result of these restrictions, we may be:
| • | limited in how we conduct our business; |
| • | unable to raise additional debt or equity financing to operate during general economic or business downturns; or |
| • | unable to compete effectively or to take advantage of new business opportunities. These restrictions may affect our ability to grow in accordance with our strategy. |
A breach of the covenants or restrictions under the First Lien Credit Agreement or the Second Lien Credit Agreement could result in a default or an event of default. Such a default may allow the creditors to accelerate the related debt and/or exercise other remedies and may result in the acceleration of any other debt to which a cross-acceleration or cross-default provision applies. In exacerbated or prolonged circumstances, one or more of these events could result in our bankruptcy or liquidation. Our principal stockholders hold $281.2 million of the Second Lien Term Loans.
Risks Related to this Offering and Ownership of Our Common Stock
No market currently exists for our common stock, and an active, liquid trading market for our common stock may not develop, which may cause shares of our common stock to trade at a discount from the initial offering price and make it difficult to sell the shares of common stock you purchase.
Prior to this offering, there has not been a public trading market for shares of our common stock. We cannot predict the extent to which investor interest in us will lead to the development of a trading market or how active and liquid that market may become. If an active and liquid trading market does not develop or continue, you may have difficulty selling your shares of our common stock at an attractive price or at all. The initial public offering price per share of common stock will be determined by negotiations between us and the underwriters, and may not be indicative of the price at which shares of our common stock will trade in the public market after this offering. The market price of our common stock may decline below the initial offering price and you may not be able to sell your shares of our common stock at or above the price you paid in this offering, or at all.
You will incur immediate and substantial dilution.
Existing stockholders have paid substantially less per share of our common stock than the price in this offering. The initial public offering price per share of our common stock will be substantially higher than the as adjusted net tangible book value per share of outstanding common stock prior to completion of this offering. Based on our as adjusted net tangible book value as of June 30, 2024, and upon the issuance and sale of shares of our common stock by us at an initial public offering price of $ per share (which is the midpoint of the estimated offering price range shown on the cover page of this prospectus), if you purchase our common stock in this offering, you will pay more for your shares than the amounts paid by our existing stockholders for their shares and you will suffer immediate dilution of approximately $ per share. Dilution is the amount by which the offering price paid by purchasers of our common stock in this offering will exceed the as adjusted net
55
tangible book value per share of our common stock upon completion of this offering. You may experience additional dilution upon future equity issuances or upon the exercise of our outstanding Jones Act Warrants or Creditor Warrants, exercise of options to purchase our common stock or the settlement of restricted stock units granted to our employees, executive officers and directors under our 2020 Management Incentive Plan or our 2024 Omnibus Incentive Plan. See “Dilution.”
Our stock price may change significantly following this offering, and you may not be able to resell shares of our common stock at or above the price you paid or at all, and you could lose all or part of your investment as a result.
We and the underwriters will negotiate to determine the initial public offering price. You may not be able to resell your shares at or above the initial public offering price due to a number of factors such as those listed in “—Risks Relating to Our Business” and the following:
| • | results of operations that vary from the expectations of securities analysts and investors; |
| • | results of operations that vary from those of our competitors; |
| • | changes in expectations as to our future financial performance, including financial estimates and investment recommendations by securities analysts and investors; |
| • | changes in economic conditions for companies in our industry; |
| • | changes in market valuations of, or earnings and other announcements by, companies in our industry; |
| • | declines in the market prices of stocks generally, particularly those of companies in our industry; |
| • | additions or departures of key management personnel; |
| • | strategic actions by us or our competitors; |
| • | announcements by us, our competitors or our suppliers of significant contracts, price reductions, new products or technologies, acquisitions, joint marketing relationships, joint ventures, other strategic relationships or capital commitments; |
| • | dilution as a result of the exercise of our outstanding Jones Act Warrants or Creditor Warrants; |
| • | changes in preference of our customers; |
| • | changes in general economic or market conditions or trends in our industry or the economy as a whole; |
| • | changes in business or regulatory conditions; |
| • | future sales of our common stock or other securities; |
| • | investor perceptions of or the investment opportunity associated with our common stock relative to other investment alternatives; |
| • | the public’s response to press releases or other public announcements by us or third parties, including our filings with the SEC; |
| • | announcements relating to litigation or governmental investigations; |
| • | guidance, if any, that we provide to the public, any changes in this guidance or our failure to meet this guidance; |
| • | the development and sustainability of an active trading market for our stock; |
| • | changes in accounting principles; and |
| • | other events or factors, including those resulting from informational technology system failures and disruptions, natural disasters, war, acts of terrorism, pandemics or responses to these events. |
56
Furthermore, the stock market may experience extreme volatility that, in some cases, may be unrelated or disproportionate to the operating performance of particular companies. These broad market and industry fluctuations may adversely affect the market price of our common stock, regardless of our actual operating performance. In addition, price volatility may be greater if the public float and trading volume of our common stock is low.
In the past, following periods of market volatility, stockholders have instituted securities class action litigation. If we were to become involved in securities litigation, it could have a substantial cost and divert resources and the attention of executive management from our business regardless of the outcome of such litigation.
Because we have no current plans to pay cash dividends on our common stock, you may not receive any return on investment unless you sell your common stock for a price greater than that which you paid for it.
We have no current plans to pay cash dividends on our common stock. The declaration, amount and payment of any future dividends on our common stock will be at the sole discretion of our Board of Directors. Our Board of Directors may take into account general and economic conditions, our financial condition and results of operations, our available cash and current and anticipated cash needs, capital requirements, contractual, legal, tax and regulatory restrictions and implications on the payment of dividends by us to our stockholders or by our subsidiaries to us, including restrictions under the First Lien Credit Agreement and the Second Lien Credit Agreement, and such other factors as our Board of Directors may deem relevant. See “Dividend Policy.”
As a result, you may not receive any return on an investment in our common stock unless you sell our common stock for a price greater than your purchase price.
Our common stock is subject to restrictions on foreign ownership and possible required divestiture by non-U.S. citizen stockholders.
Hornbeck could lose the privilege of owning and operating vessels in the coastwise trade if non-U.S. citizens were to own or control, in the aggregate, more than 25% of common stock in Hornbeck. Such loss could have a material adverse effect on our results of operations.
Our amended and restated certificate of incorporation and our amended and restated bylaws authorize our Board of Directors to establish with respect to any class or series of capital stock of Hornbeck certain rules, policies and procedures, including procedures with respect to transfer of shares, to ensure compliance with the Jones Act. In order to provide a reasonable margin for compliance with the Jones Act, our amended and restated certificate of incorporation provides that all non-U.S. citizens in the aggregate may not own more than 21% of the outstanding shares of our common stock, with certain limited grandfathered circumstances allowing up to 24% of the outstanding shares of our common stock to be owned by non-U.S. citizens on and after the effective date of the initial public offering. Our Jones Act trading privileges are conditioned upon foreign ownership of our common stock never exceeding 25%. While we take steps to prevent foreign ownership from exceeding 25%, we do not control trading in our stock and cannot control non-compliance by a foreign purchaser of our stock resulting in our exceeding the foreign citizenship ownership limitations. Moreover, the USCG may temporarily or permanently revoke our coastwise trading privileges if we are not in compliance with the citizenship requirements, which would have a significant negative impact on our operations and financial results.
As of August 31, 2024, approximately 22.9% of the Company’s issued and outstanding common stock is owned by non-U.S. citizens and, after giving effect to this offering, the Company expects the percentage of its common stock owned by non-U.S. citizens to decrease to approximately %. Our amended and restated certificate of incorporation provides the Board of Directors with authority to take certain actions to protect our Jones Act status. These actions may include: (i) refusing to recognize any transfer (including our original issuance) that would result in ownership by non-U.S. citizens in the aggregate exceeding 21% of our issued and
57
outstanding common stock, with certain limited grandfathered circumstances allowing up to 24% of the outstanding shares of our common stock to be owned by non-U.S. citizens on and after the effective date of the initial public offering, (ii) treating any such purported transfer as void ab initio or (iii) redeeming any share of our common stock that caused the ownership by non-U.S. citizens to exceed such 21% ownership limitation, with certain limited grandfathered circumstances allowing up to 24% of the outstanding shares of our common stock to be owned by non-U.S. citizens on and after the effective date of the initial public offering. In the event the Board of Directors authorizes such a redemption, we would instruct our transfer agent to issue one Jones Act Warrant, or in certain situations, cash or interest bearing promissory notes, in respect of shares of common stock that caused ownership by non-U.S. citizens to exceed the applicable permitted limit, and such holder(s)’ interests in those shares will be terminated. Any purported issuance or transfer of shares of our common stock in violation of these ownership provisions will be ineffective to issue or transfer the common stock or any voting, dividend or other rights associated with them. The existence and enforcement of these requirements could have an adverse impact on the liquidity or market value of our equity securities in the event that U.S. citizens were unable to transfer Hornbeck shares to non-U.S. citizens. Furthermore, under certain circumstances, this ownership requirement could discourage, delay or prevent a change of control of Hornbeck.
If securities analysts do not publish research or reports about our business or if they downgrade our stock or our sector, our stock price and trading volume could decline.
The trading market for our common stock will rely in part on the research and reports that industry or financial analysts publish about us or our business. We do not control these analysts. Furthermore, if one or more of the analysts who do cover us downgrade our stock or our industry, or the stock of any of our competitors, or publish inaccurate or unfavorable research about our business, the price of our stock could decline. If one or more of these analysts stop covering us or fail to publish reports on us regularly, we could lose visibility in the market, which in turn could cause our stock price or trading volume to decline.
We will incur significantly increased costs and become subject to additional regulations and requirements as a result of becoming a public company, and our management will be required to devote substantial time to new compliance matters, which could lower our profits or make it more difficult to run our business.
As a public company, we will incur significant legal, regulatory, finance, accounting, investor relations and other expenses that we have not incurred as a private company, including costs associated with public company reporting requirements. As a result of having publicly traded common stock, we will also be required to comply with, and incur costs associated with such compliance with, the Sarbanes-Oxley Act and the Dodd-Frank Wall Street Reform and Consumer Protection Act, or the Dodd-Frank Act, as well as rules and regulations implemented by the SEC and the exchange on which we list our shares. The expenses incurred by public companies generally for reporting and corporate governance purposes have been increasing. We expect these rules and regulations to increase our legal and financial compliance costs and to make some activities more time-consuming and costly. Our management will need to devote a substantial amount of time to ensure that we comply with all of these requirements, diverting the attention of management away from revenue-producing activities. These laws and regulations also could make it more difficult or costly for us to obtain certain types of insurance, including director and officer liability insurance, and we may be forced to accept reduced policy limits and coverage or incur substantially higher costs to obtain the same or similar coverage. These laws and regulations could also make it more difficult for us to attract and retain qualified persons to serve on our Board of Directors, our board committees or as our executive officers. Furthermore, if we are unable to satisfy our obligations as a public company, we could be subject to delisting of our common stock, fines, sanctions and other regulatory action and potentially civil litigation.
58
Failure to comply with requirements to design, implement and maintain effective internal control over financial reporting could have a material adverse effect on our business and stock price.
As a privately-held company, we were not required to evaluate our internal control over financial reporting in a manner that meets the standards of publicly traded companies required by Section 404(a) of the Sarbanes-Oxley Act, or “Section 404.”
As a public company, we will have significant requirements for enhanced financial reporting and internal controls. The process of designing and implementing effective internal controls is a continuous effort that requires us to anticipate and react to changes in our business and the economic and regulatory environments and to expend significant resources to maintain a system of internal controls that is adequate to satisfy our reporting obligations as a public company. If we are unable to establish or maintain appropriate internal financial reporting controls and procedures, it could cause us to fail to meet our reporting obligations on a timely basis, result in material misstatements in our consolidated financial statements and harm our results of operations. In addition, we will be required, pursuant to Section 404, to furnish a report by management on, among other things, the effectiveness of our internal control over financial reporting in the second annual report following the completion of this offering. This assessment will need to include disclosure of any material weaknesses identified by our management in our internal control over financial reporting. The rules governing the standards that must be met for our management to assess our internal control over financial reporting are complex and require significant documentation, testing and possible remediation. Testing and maintaining internal controls may divert our management’s attention from other matters that are important to our business. In addition, our independent registered public accounting firm will be required to issue an attestation report on the effectiveness of our internal control over financial reporting in the second annual report following the completion of this offering.
In connection with the implementation of the necessary procedures and practices related to internal control over financial reporting, we may identify deficiencies that we may not be able to remediate in time to meet the deadline imposed by the Sarbanes-Oxley Act for compliance with the requirements of Section 404. In addition, we may encounter problems or delays in completing the remediation of any deficiencies identified by our independent registered public accounting firm in connection with the issuance of their attestation report.
Our testing, or the subsequent testing by our independent registered public accounting firm, may reveal deficiencies in our internal controls over financial reporting that are deemed to be material weaknesses which could result in a material misstatement of our annual or quarterly consolidated financial statements or disclosures that may not be prevented or detected.
We may not be able to conclude on an ongoing basis that we have effective internal control over financial reporting in accordance with Section 404 or our independent registered public accounting firm may not issue an unqualified opinion. If either we are unable to conclude that we have effective internal control over financial reporting or our independent registered public accounting firm is unable to provide us with an unqualified opinion, investors could lose confidence in our reported financial information, which could have a material adverse effect on the trading price of our common stock.
Future sales, or the perception of future sales, by us or our existing stockholders in the public market following this offering could cause the market price for our common stock to decline.
After this offering, the sale of shares of our common stock in the public market, or the perception that such sales could occur, including sales by our existing stockholders and holders of our Jones Act Warrants and Creditor Warrants, could harm the prevailing market price of shares of our common stock. These sales, or the possibility that these sales may occur, also might make it more difficult for us to sell equity securities in the future at a time and at a price that we deem appropriate.
Upon completion of this offering and after giving effect to the stock split, we will have a total of shares of our common stock outstanding. Additionally, shares of our common stock will be
59
issuable upon the exercise of Jones Act Warrants and shares of our common stock will be issuable upon the exercise of Creditor Warrants, with an exercise price of $0.00001 per share and $ per share, respectively, and shares of our common stock will be issuable upon exercise of outstanding options, at an average weighted exercise price of $ , or upon settlement of restricted stock units under the 2020 Management Incentive Plan. Of the outstanding shares, the shares sold in this offering (or shares if the underwriters exercise in full their option to purchase additional shares) will be freely tradable, other than certain shares sold pursuant to our directed share program that are subject to “lock up” restrictions as described under “Underwriting (Conflicts of Interest),” without restriction or further registration under the Securities Act, except that any shares held by our affiliates, as that term is defined under Rule 144 of the Securities Act, or Rule 144, including our directors, executive officers and other affiliates (including our principal stockholders), may be sold only in compliance with the limitations described in “Shares Eligible for Future Sale.”
The shares of common stock held by our principal stockholders and certain of our directors and executive officers after this offering, representing % of the total outstanding shares of our common stock following this offering, will be “restricted securities” within the meaning of Rule 144 and subject to certain restrictions on resale. Restricted securities may be sold in the public market only if they are registered under the Securities Act or are sold pursuant to an exemption from registration such as Rule 144, as described in “Shares Eligible for Future Sale.”
In connection with this offering, we, our directors and executive officers and certain holders of our outstanding common stock prior to this offering, including our principal stockholders, will sign lock-up agreements with the underwriters that will, subject to certain exceptions, restrict the disposition of, or hedging with respect to, the shares of our common stock or securities convertible into or exchangeable for shares of common stock, each held by them for 180 days following the date of this prospectus, except with the prior written consent of J.P. Morgan Securities LLC and Barclays Capital Inc. See “Underwriting (Conflicts of Interest)” for a description of these lock-up agreements. J.P. Morgan Securities LLC and Barclays Capital Inc., on behalf of the underwriters, may, in their sole discretion, release all or some portion of the shares subject to the 180-day lock-up agreements prior to the expiration of such period.
Upon the expiration of the lock-up agreements described above, all of such shares (other than shares under the 2020 Management Incentive Plan that are subject to contractual transfer restrictions) will be eligible for resale in a public market, subject, in the case of shares held by our affiliates, to volume, manner of sale and other limitations under Rule 144. We expect that our principal stockholders and their respective affiliates may be considered our affiliates based on their respective expected share ownership (consisting of approximately shares held by funds, investment vehicles or accounts managed or advised by Ares or its affiliates, shares held by Whitebox and shares held by Highbridge), as well as their board designation rights. Certain other of our stockholders may also be considered affiliates at that time.
In addition, pursuant to the Registration Rights Agreement (as defined herein), upon the completion of this offering, certain of our existing securityholders party thereto will have the right, subject to certain conditions, to require us to register the offer and sale of certain shares of our common stock owned by them (including shares of common stock issuable upon exercise of any Jones Act Warrants or Creditor Warrants owned by them) under the Securities Act. Registration of any of these shares of common stock would result in such shares becoming freely tradable without compliance with Rule 144 upon effectiveness of the registration statement. For a further description of these rights, see the section entitled “Certain Relationships and Related Party Transactions—Registration Rights Agreement.” Following completion of this offering, the outstanding shares of our common stock covered by registration rights would represent approximately % of our outstanding common stock (or %, if the underwriters exercise in full their option to purchase additional shares). Additionally, shares of our common stock issuable upon the exercise of Jones Act Warrants and shares of our common stock issuable upon the exercise of Creditor Warrants will be covered by these registration rights.
60
As soon as practicable following this offering, we intend to file one or more registration statements on Form S-8 under the Securities Act to register all shares of our common stock subject to outstanding stock options and subject to issuance upon settlement of restricted stock units the shares of our common stock subject to issuance under our 2020 Management Incentive Plan and our 2024 Omnibus Incentive Plan to be adopted in connection with this offering. Any such Form S-8 registration statements will automatically become effective upon filing. Accordingly, shares registered under such registration statements will be available for sale in the open market. We expect that the initial registration statement on Form S-8 will cover shares of our common stock.
As restrictions on resale end, or if the existing stockholders exercise their registration rights, the market price of our shares of common stock could drop significantly if the holders of these shares sell them or are perceived by the market as intending to sell them. These factors could also make it more difficult for us to raise additional funds through future offerings of our shares of common stock or other securities.
In the future, we may also issue our securities in connection with investments or acquisitions. The amount of shares of our common stock issued in connection with an investment or acquisition could constitute a material portion of our then-outstanding shares of our common stock. Any issuance of additional securities in connection with investments or acquisitions may result in additional dilution to you.
The exercise of all or any number of outstanding Jones Act Warrants or Creditor Warrants or the issuance or vesting of equity awards may dilute your ownership of shares of common stock.
Hornbeck has a number of outstanding securities that provide for the right to purchase or receive shares of common stock, including two series of warrants and certain compensatory equity awards.
As of July 31, 2024, Hornbeck had 11.4 million shares of common stock issuable upon the exercise of Jones Act Warrants and 1.6 million shares of common stock issuable upon the exercise of Creditor Warrants ( and , respectively, after giving effect to the stock split), with an exercise price of $0.00001 per share and $27.83 per share ($ per share after giving effect to the stock split), respectively. Investors could be subject to voting dilution upon the exercise of such warrants, each subject to Jones Act-related foreign ownership restrictions. With respect to compensatory equity awards, a total of 1.8 million shares ( shares after giving effect to the stock split) of our common stock have been reserved for issuance under our 2020 Management Incentive Plan as equity-based awards to Hornbeck employees, directors and certain other persons.
The grant or vesting of equity awards, including any that we may grant or assume in the future, whether under our 2020 Management Incentive Plan, our 2024 Omnibus Incentive Plan to be adopted in connection with this offering, or any other equity plan sponsored by Hornbeck, and the exercise of warrants and the subsequent issuance of shares of common stock, could have an adverse effect on the market for our common stock, including the price that an investor could obtain for their shares of common stock.
We have a high level of concentrated stock ownership.
Certain of our stockholders, including our principal stockholders, have significant influence over us as a result of their share ownership. This concentration could lead to conflicts of interest and difficulties for non-insider investors to effect corporate changes, and could adversely affect our Company’s share price. Our principal stockholders, collectively, would hold approximately % of our issued and outstanding shares of common stock upon the completion of this offering (giving effect to the exercise of our outstanding Jones Act Warrants and Creditor Warrants) and have the ability to influence all matters submitted to our stockholders for approval (including the election and removal of directors and any merger, consolidation or sale of all or substantially all of our assets). Accordingly, this concentration of ownership may have the effect of delaying, deferring or preventing a change in control of our Company, impeding a merger, consolidation, takeover or other business combination involving us or discouraging a potential acquirer from making a tender offer or otherwise
61
attempting to obtain control of us, which in turn could have a material adverse effect on the market price of our shares. The issuance of stock options and warrants could lead to greater concentration of share ownership among insiders and could lead to dilution of share ownership which could lead to depressed share prices. In addition, our principal stockholders may have different interests than investors in this offering.
Anti-takeover provisions in our organizational documents could delay or prevent a change of control.
Certain provisions of our amended and restated certificate of incorporation and amended and restated bylaws may have an anti-takeover effect and may delay, defer or prevent a merger, acquisition, tender offer, takeover attempt, or other change of control transaction that a stockholder might consider in its best interest, including those attempts that might result in a premium over the market price for the shares held by our stockholders.
These provisions will provide for, among other things:
| • | limitations on the removal of directors; |
| • | if the Appointing Persons (as defined in the amended and restated certificate of incorporation), in the aggregate, hold less than 35% of the outstanding shares of common stock, our amended and restated certificate of incorporation may only be amended by the affirmative vote of the holders of at least two-thirds of the voting power our then outstanding common stock; and |
| • | establishing advance notice and certain information requirements for nominations for election to our Board of Directors or for proposing matters that can be acted upon by stockholders at stockholder meetings. |
These anti-takeover provisions could make it more difficult for a third party to acquire us, even if the third party’s offer may be considered beneficial by many of our stockholders. As a result, our stockholders may be limited in their ability to obtain a premium for their shares in such circumstances. See “Description of Capital Stock and Warrants.”
Our Board of Directors will be authorized to issue and designate shares of our preferred stock without stockholder approval.
Our amended and restated certificate of incorporation authorizes our Board of Directors, without the approval of our stockholders, to issue shares of our preferred stock, subject to limitations prescribed by applicable law, rules and regulations and the provisions of our amended and restated certificate of incorporation, as shares of preferred stock in series, to establish from time to time the number of shares to be included in each such series and to fix the designation, powers, preferences and rights of the shares of each such series and the qualifications, limitations or restrictions thereof. The powers, preferences and rights of these series of preferred stock may be senior to or on parity with our common stock, which may reduce its value.
After the completion of this offering, our amended and restated certificate of incorporation will impose certain restrictions that may affect our ability to approve certain corporate actions.
Subject to certain conditions, under our amended and restated certificate of incorporation, for so long as our principal stockholders who maintain director nomination rights collectively own at least 30% of our Fully Diluted Securities (as defined in the amended and restated certificate of incorporation), certain corporate actions will require the prior written consent of Ares and at least one of Whitebox or Highbridge, including, among other things: changing the size of our Board of Directors, consummating a change of control transaction, acquiring or disposing of certain assets, incurring certain indebtedness, certain issuances of equity, entering into voluntary liquidation or the commencement or bankruptcy proceedings, or entering into certain transactions with related parties. Our principal stockholders may have different interests than our other stockholders and may exercise these consent rights in ways that are adverse to the interests of such other stockholders. For more information
62
about the director nomination rights, see “Management—Composition of the Board of Directors,” and for more information about the principal stockholders’ consent rights under our amended and restated certificate of incorporation, see “Description on Capital Stock and Warrants—Consent Rights.”
Our amended and restated certificate of incorporation designates the Court of Chancery of the State of Delaware as the sole and exclusive forum for certain types of actions and proceedings that may be initiated by our stockholders, which could limit our stockholders’ ability to obtain a favorable judicial forum for disputes with us or our directors, officers, employees or agents.
Our amended and restated certificate of incorporation provides that, unless we consent in writing to the selection of an alternative forum, the Court of Chancery of the State of Delaware will, to the fullest extent permitted by applicable law, be the sole and exclusive forum for (i) any derivative action or proceeding brought on our behalf, (ii) any action asserting a claim of breach of a fiduciary duty owed by any of our directors, officers, employees or agents to us or our stockholders, (iii) any action asserting a claim arising pursuant to any provision of the Delaware General Corporation Law (the “DGCL”), our amended and restated certificate of incorporation or our amended and restated bylaws, or (iv) any action asserting a claim against us that is governed by the internal affairs doctrine, in each such case subject to such Court of Chancery having personal jurisdiction over the indispensable parties named as defendants therein. If the Court of Chancery lacks subject matter jurisdiction, a federal district court of the United States of America located in the State of Delaware will be the exclusive forum for such actions.
Section 27 of the Exchange Act creates exclusive federal jurisdiction over all suits brought to enforce any duty or liability created by the Exchange Act or the rules and regulations thereunder, and Section 22 of the Securities Act creates concurrent jurisdiction for federal and state courts over all suits brought to enforce any duty or liability created by the Securities Act or the rules and regulations thereunder. There is uncertainty as to whether a court would enforce the forum selection provision with respect to such claims, and in any event, our stockholders would not be deemed to have waived our compliance with federal securities laws and the rules and regulations thereunder.
Any person or entity purchasing or otherwise acquiring any interest in shares of our capital stock will be deemed to have notice of, and consented to, the provisions of our amended and restated certificate of incorporation described in the preceding sentences. Although we believe the provision benefits us by providing increased consistency in the application of Delaware law in the types of lawsuits to which it applies, this choice of forum provision may limit a stockholder’s ability to bring a claim in a judicial forum that it finds favorable for disputes with us or our directors, officers, employees or agents, which may discourage such lawsuits against us and such persons. Additionally, the Company cannot be certain that a court will decide that these provisions are either applicable or enforceable, and if a court were to find the choice of forum provisions contained in our amended and restated certificate of incorporation to be inapplicable or unenforceable in an action, we may incur additional costs associated with resolving such action in other jurisdictions, which could harm the business, operating results and financial condition of the Company.
63
We estimate that the net proceeds to us from this offering, after deducting estimated underwriting discounts and commissions and estimated offering expenses payable by us, will be approximately $ million, assuming an initial public offering price of $ per share (which is the midpoint of the estimated offering price range shown on the cover page of this prospectus).
We intend to use the net proceeds to us from this offering for general corporate purposes.
A $1.00 increase (decrease) in the assumed initial public offering price of $ per share, based on the mid-point of the estimated offering price range set forth on the cover page of this prospectus, would increase (decrease) the net proceeds to us from this offering by approximately $ million, assuming the number of shares offered by us, as set forth on the cover page of this prospectus, remains the same and after deducting estimated underwriting discounts and commissions and estimated offering expenses payable by us. An increase (decrease) of 1,000,000 shares from the expected number of shares to be sold by us in this offering, assuming no change in the assumed initial public offering price per share, the mid-point of the estimated offering price range set forth on the cover page of this prospectus, would increase (decrease) our net proceeds from this offering by $ million. To the extent we raise more proceeds in this offering than currently estimated, we will use such proceeds for general corporate purposes. To the extent we raise less proceeds in this offering than currently estimated, we will use less proceeds for general corporate purposes.
We will not receive any proceeds from the sale of our common stock by the selling stockholders. We will, however, bear the costs associated with the sale of shares of common stock by the selling stockholders, other than underwriting discounts and commissions. For more information, see “Principal and Selling Stockholders” and “Underwriting (Conflicts of Interest).”
64
We do not currently anticipate paying any dividends on our common stock immediately following this offering and currently expect to retain all future earnings for use in the operation and expansion of our business. Following this offering and upon repayment of certain outstanding indebtedness, we may reevaluate our dividend policy. The declaration, amount and payment of any future dividends on our common stock will be at the sole discretion of our Board of Directors, which may take into account general and economic conditions, our financial condition and results of operations, our available cash and current and anticipated cash needs, capital requirements, contractual, legal, tax and regulatory restrictions and implications on the payment of dividends by us to our stockholders or by our subsidiaries to us, including restrictions under the First Lien Credit Agreement and the Second Lien Credit Agreement, and such other factors as our Board of Directors may deem relevant. If we elect to pay such dividends in the future, we may reduce or discontinue entirely the payment of such dividends at any time.
65
The following table sets forth our cash and cash equivalents and capitalization as of June 30, 2024:
| • | on an actual basis; and |
| • | on an as adjusted basis giving effect to (i) the filing and effectiveness of our amended and restated certificate of incorporation in connection with the completion of this offering and the implementation of the -for-one stock split and increase in our authorized shares of common stock to be effected pursuant thereto and (ii) the sale of shares of our common stock in this offering at the assumed initial offering price of $ per share (the midpoint of the estimated offering price range on the cover page of this prospectus), after deducting underwriting discounts, commissions and estimated offering expenses and the application of the net proceeds to us as described in “Use of Proceeds.” |
You should read the information in this table in conjunction with our Financial Statements and the notes to those Financial Statements appearing in this prospectus, as well as the information under the headings “Use of Proceeds” and “Management’s Discussion and Analysis of Financial Condition and Results of Operations.”
| As of June 30, 2024 | ||||||||
| (in thousands, except for share amounts) | Actual | As Adjusted(1) | ||||||
| Cash and cash equivalents(2) |
$ | 91,078 | $ | |||||
|
|
|
|
|
|||||
| Long-term indebtedness(3) |
||||||||
| Second Lien Term Loans |
$ | 349,001 | $ | |||||
|
|
|
|
|
|||||
| Stockholders’ equity: |
||||||||
| Common stock, including paid-in capital: par value $0.00001 per share; 50,000,000 shares authorized and 5,641,968 shares issued and outstanding, actual; shares authorized and shares issued and outstanding, as adjusted |
$ | — | $ | |||||
| Additional paid in capital |
211,389 | |||||||
| Retained earnings |
192,654 | |||||||
| Accumulated other comprehensive income |
(2,767 | ) | ||||||
|
|
|
|
|
|||||
| Total stockholders’ equity |
$ | 401,276 | $ | |||||
|
|
|
|
|
|||||
| Total capitalization |
$ | 750,277 | $ | |||||
|
|
|
|
|
|||||
| (1) | Each $1.00 increase (decrease) in the assumed initial public offering price of $ per share, based on the midpoint of the estimated offering price range set forth on the cover page of this prospectus, would increase (decrease), as applicable, cash and cash equivalents, additional paid-in-capital, total stockholders’ equity and total capitalization by approximately $ million, assuming the number of shares offered by us, as set forth on the cover page of this prospectus, remains the same and after deducting estimated underwriting discounts and commissions and estimated offering expenses payable by us. We may also increase or decrease the number of shares we are offering. An increase (decrease) of 1,000,000 shares offered by us from the expected number of shares to be sold by us in this offering, assuming no change in the assumed initial public offering price per share, the midpoint of the estimated offering price range set forth on the cover page of this prospectus, would increase (decrease), as applicable, cash and cash equivalents, additional paid-in capital, total stockholders’ equity and total capitalization by approximately $ million, after deducting estimated underwriting discounts and commissions and estimated offering expenses payable by us. |
| (2) | Does not give effect to $183.4 million remaining to be incurred in connection with the two newbuild MPSVs and the C/SOV + Flotel conversion. |
| (3) | On August 13, 2024, we entered into the First Lien Revolving Credit Facility. As of September 13, 2024, there were no Revolving Loans outstanding under the First Lien Revolving Credit Facility. |
66
The outstanding share information in the table above is based on shares of our common stock outstanding as of June 30, 2024, after giving effect to the stock split, and does not reflect:
| • | shares of common stock that may be issued upon exercise of outstanding Jones Act Warrants, at an exercise price of $0.00001 per share; |
| • | shares of common stock that may be issued upon exercise of outstanding Creditor Warrants, at an exercise price of $ per share; |
| • | shares of common stock that may be issued upon the exercise of outstanding options at an average weighted exercise price of $ or the vesting of restricted stock units issued under our 2020 Management Incentive Plan; and |
| • | shares of common stock that may be issued pursuant to future awards under our 2020 Management Incentive Plan or our 2024 Omnibus Incentive Plan to be in effect following this offering. |
67
If you invest in our common stock in this offering, your ownership interest in us will be diluted to the extent of the difference between the initial public offering price per share of our common stock and the as adjusted net tangible book value per share of our common stock after this offering. Dilution results from the fact that the per share offering price of the common stock is substantially in excess of the book value per share attributable to the shares of common stock held by existing stockholders. Because the stock split will take place prior to or concurrently with the closing of this offering, we have presented dilution in as adjusted net tangible book value per share before this offering assuming the implementation of a -for-one stock split with respect to our common stock, in order to more meaningfully present the dilutive impact on the investors in this offering.
Our as adjusted net tangible book value as of June 30, 2024 was approximately $ million, or $ per share of our common stock ($ per share after giving effect to the stock split). We calculate as adjusted net tangible book value per share by taking the amount of our total tangible assets, reduced by the amount of our total liabilities, and then dividing that amount by the total number of shares of common stock outstanding after giving effect to the stock split.
After giving effect to (i) the sale of shares of our common stock in this offering by the Company and the selling stockholders at an initial public offering price of $ per share (the midpoint of the estimated offering price range shown on the cover of this prospectus), after deducting the underwriting discounts and commissions and estimated offering expenses payable by us, (ii) the application of the net proceeds to us from this offering as set forth under “Use of Proceeds,” and (iii) the stock split, our as adjusted net tangible book value as of June 30, 2024 would have been $ million, or $ per share of our common stock. This amount represents an immediate increase in net tangible book value of $ per share to existing stockholders and an immediate and substantial dilution in net tangible book value of $ per share to investors purchasing shares in this offering at the initial public offering price.
The following table illustrates this dilution on a per share basis:
| Initial public offering price per share of common stock (the midpoint of the estimated offering price range shown on the cover page of this prospectus) |
$ | $ | ||||||
| Net tangible book value per share as of June 30, 2024 |
$ | $ | ||||||
| Increase in tangible book value per share attributable to investors in this offering |
$ | $ | ||||||
| As adjusted net tangible book value per share after this offering |
$ | $ | ||||||
| Dilution per share to investors in this offering |
$ | $ |
Dilution is determined by subtracting as adjusted net tangible book value per share of common stock after the offering from the initial public offering price per share of common stock.
The following table summarizes, as of June 30, 2024, the differences between the number of shares purchased from us, the total consideration paid to us, and the average price per share paid by existing stockholders and by new investors. As the table shows, new investors purchasing shares in this offering will pay an average price per share substantially higher than our existing stockholders paid. The table below is based on an initial public offering price of $ per share for shares purchased in this offering and excludes underwriting discounts and commissions and estimated offering expenses payable by us:
| Shares Purchased | Total Consideration |
|
||||||||||||||||||
| ($ in millions, except per share amounts) | Number | % | Amount | % | Avg/Share | |||||||||||||||
| Existing stockholders |
(1) | % | % | $ | ||||||||||||||||
| New investors in this offering |
% | % | ||||||||||||||||||
|
|
|
|
|
|
|
|
|
|
|
|||||||||||
| Total |
% | % | $ | |||||||||||||||||
|
|
|
|
|
|
|
|
|
|
|
|||||||||||
68
| (1) | Reflects shares owned by the selling stockholders that will be purchased by new investors as a result of this offering: |
| Shares Purchased | Total Consideration |
|
||||||||||||||||||
| Number | % | Amount | % | Avg/Share | ||||||||||||||||
| Selling stockholders |
% | % | ||||||||||||||||||
|
|
|
|
|
|
|
|
|
|
|
|||||||||||
If the underwriters were to fully exercise their option to purchase additional shares of our common stock, the percentage of shares of our common stock held by existing stockholders as of June 30, 2024 would be % and the percentage of shares of our common stock held by new investors would be %.
The discussion and tables above are based on shares of our common stock outstanding as of June 30, 2024, after giving effect to the stock split, and excludes million shares of common stock issuable upon exercise of the Jones Act Warrants and Creditor Warrants, with an exercise price of $0.00001 per share and $ per share, respectively, and shares of our common stock issuable upon exercise of options or settlement of restricted stock units under the 2020 Management Incentive Plan.
To the extent that outstanding Jones Act Warrants or Creditor Warrants are exercised, outstanding options or restricted stock units settle, or we grant options, restricted stock, restricted stock units or other equity-based awards to our employees, executive officers and directors in the future, or other issuances of common stock are made, there will be further dilution to new investors.
69
MANAGEMENT’S DISCUSSION AND ANALYSIS OF FINANCIAL CONDITION AND RESULTS OF OPERATIONS
The following Management’s Discussion and Analysis of Financial Condition and Results of Operations should be read in conjunction with the information contained in “Summary—Summary Financial and Other Data,” “Business,” “Risk Factors” and the Financial Statements and related notes included elsewhere in this prospectus. Unless the context otherwise requires, all references in this section to “the Company,” “Hornbeck,” “we,” “us,” or “our” refer to the business of Hornbeck Offshore Services, Inc. Additionally, unless noted otherwise, discussions surrounding our vessels are as of July 31, 2024. Such discussions also include two partially constructed Jones Act-qualified MPSV newbuilds to be completed pursuant to our settlement with the Surety, as discussed further in “Management’s Discussion and Analysis of Financial Condition and Results of Operations—Recent Developments—Resumption of MPSV Newbuild Construction,” and one OSV currently undergoing conversion into a MPSV for dual-service as either a C/SOV or flotel. Our vessels exclude four OSVs formerly owned by us that we now operate and maintain for the U.S. Navy.
During the fourth quarter of 2022, the Company reclassified certain vessels from OSVs to MPSVs and MPSVs to OSVs based on the nature of each vessel’s current operations and technical capabilities. For purposes of the following discussion and analysis, we have comparably calculated and classified prior-period amounts to conform with the current vessel classifications.
This discussion contains forward-looking statements that involve risks and uncertainties about our business and operations and reflect our plans, estimates and beliefs. Our actual results and the timing of selected events may differ materially from those anticipated in these forward-looking statements as a result of various factors, including those we describe below, under “Risk Factors” and elsewhere in this prospectus. See “Special Note Regarding Forward-Looking Statements.”
Company Overview
Hornbeck is a leading provider of marine transportation services to customers in the offshore oilfield market and diversified non-oilfield markets, including military support services, renewable energy development and other non-oilfield service offerings. Since our founding more than 27 years ago, we have focused on providing innovative, technologically advanced marine solutions to meet the evolving needs of our customers across our core geographic regions covering the United States and Latin America. Our team brings substantial industry expertise built through decades of experience and has leveraged that knowledge to amass what we believe is one of the largest, highest specification fleets of Offshore Supply Vessels (“OSVs”) and Multi-Purpose Support Vessels (“MPSVs”) in the industry. Approximately 75% of our total fleet consists of high-spec or ultra high-spec vessels, and we believe we have the number one ultra high-spec market position in the U.S., and the third largest fleet of high-spec and ultra high-spec OSVs in the world, measured by DWT capacity. We own a fleet of 75 multi-class OSVs and MPSVs, 58 of which are U.S. Jones Act-qualified vessels. Our Jones Act-qualified high-spec and ultra high-spec OSVs account for approximately 26% of the total industry supply of such vessels. We opportunistically expand our fleet within existing and/or into new, high-growth, cabotage-protected markets from time to time to enhance our fleet offerings to customers. Our mission is to be recognized as the energy industry’s marine transportation and service Company of Choice® for our customers, employees and investors through innovative, high-quality, value-added business solutions delivered with enthusiasm, integrity and professionalism with the utmost regard for the safety of individuals and the protection of the environment.
Our fleet of 60 OSVs primarily provides transportation of equipment, materials and supplies to offshore drilling rigs, production platforms, subsea construction projects and other non-oilfield applications. Increasingly, given their versatility, our OSVs are being deployed in a variety of non-oilfield applications including military support services, renewable energy development for offshore wind, humanitarian aid and disaster relief, aerospace and telecommunications. Our OSVs differ from other marine service vessels in that they provide increased cargo-carrying flexibility and capacity that can transport large quantities of deck cargoes, as well as
70
various liquid and dry bulk cargoes in below-deck tanks providing flexibility for a variety of jobs. Moreover, our OSVs are outfitted with advanced technologies, including DP capabilities, which allows each vessel to safely interface with another offshore vessel, exploration and production facility or an offshore asset by maintaining an absolute or relative station-keeping position when performing its work at sea.
Our fleet of 15 MPSVs provides commissioning and decommissioning support services, asset construction capabilities, recurring inspection, repair and maintenance services and flotel accommodations. Such vessels primarily serve the oil and gas market, with capabilities including the installation of subsea and top-side oilfield infrastructure necessary in the modern deepwater and ultra-deepwater oilfields. Further, these vessels are capable of supporting a variety of other non-oilfield offshore infrastructure projects, including the development of offshore windfarms, by providing the equipment and capabilities to support the installation and maintenance of wind turbines and platforms. Because of our ability to serve a diverse set of end markets, MPSV operations are typically less directly linked with the number of active drilling rigs in operation and therefore can be less cyclical. Our high- and ultra high-spec OSVs can be contracted alongside our MPSVs on major projects, providing operating efficiencies and pull-through revenue. Most of our MPSVs have one or more deepwater or ultra-deepwater cranes fitted on the deck, deploy one or more Remotely Operated Vehicles (“ROVs”) to support subsea work, and have an installed helideck to facilitate the on-/off-boarding of specialist service providers and personnel. MPSVs can also be outfitted as flotels to provide accommodations, offices, catering, laundry, medical, and recreational facilities to large numbers of offshore workers for the duration of a project. When configured as flotels, our MPSVs have capacities to house up to 245 workers for major installation, maintenance and overhaul projects. Included in our total MPSV fleet count are the two HOS 400 class MPSVs that are currently under construction and one of our U.S.-flagged, HOSMAX 280 class OSVs that is currently undergoing conversion into a MPSV for dual-service as either a C/SOV or flotel. Based on overall length and total lifting capacity, the two HOS 400 class MPSVs are expected to be the largest Jones Act-qualified MPSVs in the market and will have additional capabilities due to their size and sophistication. In addition to the services performed by our existing fleet of MPSVs, the two newbuild vessels will be equipped with systems that we expect will make them suitable for complex services, including light well intervention, that require larger or more versatile vessels than the fleet of MPSVs currently available in the U.S. market. Once converted, our C/SOV+Flotel MPSV will be capable of providing services to the U.S. offshore wind market both during the commissioning phase of an offshore wind farm and during its operational life. We expect the converted MPSV to be placed into active service as either a C/SOV or flotel in 2025, while the two newbuild MPSVs are now expected to be placed into active service in 2026 or possibly thereafter.
After enduring a multi-year industry downturn in addition to the COVID-19 pandemic, market conditions have continued to improve. As global economies have reopened, demand for hydrocarbons improved against a backdrop of rising geopolitical tensions, the war in Ukraine, the ongoing conflict in Israel and the surrounding region and constrained supply, mostly due to several years of low investment by our customers in deepwater and ultra-deepwater offshore exploration and production activities. During 2022, the domestic oil price peaked at $124 per barrel, representing a near 14-year high. Over the past 12 months, the price has ranged from $67.71 per barrel to $94.17 per barrel and currently resides at $78.56 per barrel as of July 31, 2024. The improved outlook for oil prices is having a positive impact on spending by our customers, which is creating improved demand for our services. This improved demand has come at a time when vessel owners have kept a significant number of vessels in stack for multiple years, intensifying the demand for active vessels. The higher cost of reactivating vessels, together with labor shortages, supply chain constraints and capital restraints affecting vessel owners dampens the prospect of large-scale reactivations of stacked vessels in the short-term. These general conditions have favorably impacted our utilization rates and our pricing. Simultaneously, however, we have experienced significant upward pressure on operating expense stemming mostly from increased wages for licensed mariners and general inflationary trends.
The U.S. GoM active floating rig count has increased since 2020 and has remained stable at about 20 rigs over the past several quarters. We expect the active rig count to remain relatively flat in the U.S. GoM through 2026. In Brazil, the rig count has risen significantly since 2020 and is expected to continue growing to
71
approximately 33 units through 2026. Brazil’s growth has drawn U.S.-flagged vessels, including some of our own, which has reduced the available vessel supply in the U.S. GoM and other markets in which we operate.
We have experienced difficulties in executing our strategic plans in Mexico since November 2023. Mexican maritime regulators have challenged our right to perform cabotage in Mexico with our fleet of 14 Mexican-flagged vessels. As a result, we took legal action in Mexico to preserve our cabotage privileges there, and a Mexican court has ordered that our cabotage privileges be reinstated. We have appealed this decision to further clarify the court’s ruling, and our cabotage privileges remain active during the pendency of the appeal. We expect the appellate process to last between one and three years. Despite these favorable court rulings, and the pendency of appeals, Mexican maritime regulators have limited our ability to object to the employment of non-Mexican flag vessels that compete with our own Mexican-flagged vessels, which is one of the privileges of a Mexican Naviera. In order to mitigate these actions, we have repositioned 9 of our 11 active Mexican-flagged vessels to international markets. Our Mexican operating subsidiary has been successful in these international activities with long-tenured Mexican crews and shore-based employees that are highly trained in our operating practices, core values and company culture.
During late 2023 and early 2024, the redeployment of our Mexican-flagged vessels had a transitory negative effect on their utilization levels. Such redeployment also adversely impacted the planned international utilization of some of our U.S.-flagged vessels. We believe that the negative effects on our financial results for the fourth quarter of 2023 and first quarter of 2024 have been mostly mitigated and we have made the adjustments necessary to operate with a smaller Mexican footprint until such time as the regulatory uncertainty there is resolved.
The current inflationary environment has affected the cost of our operations, including but not limited to increased labor, repair and maintenance, consumable supply and insurance costs, and we budgeted for an increase of approximately 10% in such costs in 2024 compared to 2023. To date, we have largely mitigated the impact on our operating margins through price escalation clauses in our customer contracts or higher pricing for our vessels operating in the spot market. If we are unable to secure price escalation clauses in our customer contracts or if market prices for our services do not increase at a rate at least commensurate with general inflation, the effects of inflation could have a materially adverse impact on our results in the future.
Recent Developments
First Lien Revolving Credit Facility
On August 13, 2024, we entered into a First Lien Revolving Credit Facility with DNB Bank ASA, New York Branch, as administrative agent, Wilmington Trust, National Association, as collateral agent, and the lenders party thereto. All capitalized terms in the description below not defined herein have the meaning assigned to them in such agreement. The current aggregate commitments for the Revolving Loans under the First Lien Revolving Credit Facility total $75 million, all of which remain undrawn. The First Lien Revolving Credit Facility also has a customary uncommitted incremental facility in an amount up to $50 million (or such greater amount as consented to by all lenders). Our ability to borrow under the First Lien Revolving Credit Facility is subject to customary conditions precedent, including no default or event of default, representations and warranties being true and correct in all material respects, and pro forma compliance with the financial covenants therein. See “—Liquidity and Capital Resources—Debt Agreements.”
Resumption of MPSV Newbuild Construction
In October 2023, we entered into a final settlement of a dispute with the Surety and Gulf Island related to the construction of two MPSV newbuilds. Pursuant to the settlement agreement, Gulf Island released all claims asserted against us and we released our claims against Gulf Island and the Surety. Further, the Surety agreed to take over and complete the construction of the two U.S.-flagged, Jones Act-qualified, HOS 400 class MPSVs at a
72
shipyard acceptable to us. In December 2023, Eastern was mutually selected by the parties and was contracted by the Surety to complete construction of the two MPSVs. We are obligated to pay only the remaining portion of the original shipyard contract price for the two MPSVs, which amounted to $53.8 million in the aggregate on the settlement date. The Surety is required to cure all defaults of Gulf Island and pay all completion costs in excess of the $53.8 million remaining original contract price, excluding any approved change orders arising after the settlement date. There is no cap on the Surety’s completion cost. As of June 30, 2024, we had paid $5.3 million to Eastern related to the completion of these two MPSVs.
Pursuant to the settlement, the Surety is contractually required to deliver both MPSVs in 2025. We were provided an updated schedule by the Surety and Eastern indicating that they currently expect a six-month shipyard delay for the delivery of the first of the two MPSVs. An updated delivery schedule has not yet been provided for the second vessel. Following physical delivery by the shipyard, we expect each vessel to undergo crane and other system installations, which we expect will make the first vessel available for commercial service in the first half of 2026, and the second vessel thereafter. In addition to the remaining $48.5 million of the original contract price as of June 30, 2024, we expect to incur an incremental $91.2 million in the aggregate for outfitting, overhead and the post-delivery discretionary enhancements, of which $63.6 million solely relates to the purchase and installation of cranes on both vessels. As of June 30, 2024, we had incurred $0.8 million of such incremental amounts, excluding capitalized interest. Once placed in service, we expect that our book carrying value for each vessel will be approximately $80.0 million, which is significantly below the expected market value of Jones Act-qualified vessels of this age, type, size and specifications.
ECO Acquisitions
In January 2024, we took delivery of the sixth and final vessel under ECO Acquisitions #2 and paid $15.3 million for the remaining 90% of the original purchase price and $0.1 million for purchase price adjustments related to discretionary enhancements completed in the shipyard by Nautical. As of June 30, 2024, we had paid an aggregate of $102.0 million for the original purchase price, including deposits, and $10.6 million in purchase price adjustments associated with discretionary enhancements, additional outfitting and post-closing modifications for the ECO Acquisitions #2 vessels. Delivery of this final vessel marks the completion of the combined 12 vessel acquisitions under the ECO Acquisitions. We expect to incur an incremental $0.2 million related to additional outfitting, discretionary enhancements and post-closing modifications for certain of these vessels during the remainder of 2024.
Mexico Cabotage Status
In the fourth quarter of 2023, maritime regulators in Mexico implemented new approaches in their oversight of Navieras that have historically had permissible levels of non-Mexican ownership, such as ours. As a result, we took legal action in Mexico to preserve our cabotage privileges there, and a Mexican court ordered that our cabotage privileges be reinstated. We have appealed this decision to further clarify the court’s ruling, and our cabotage privileges remain active during the pendency of the appeal. We expect the appellate process to last between one and three years. Despite these favorable court rulings, and the pendency of appeals, Mexican maritime regulators have limited our ability to object to the employment of non-Mexican flag vessels that compete with our own Mexican-flagged vessels, which is one of the privileges of a Mexican Naviera. Since the fourth quarter of 2023, we have moved all but two of our Mexican-flagged vessels into various non-Mexican international markets, while continuing to utilize our highly-skilled Mexican mariners and shore-based employees as part of our international services.
Performance and other Key Indicators
Vessel Count, Utilization and Dayrates
Our revenues, net income and cash flows from operating activities are largely dependent upon the activity level of our marine service vessels. In analyzing our activity level, we focus primarily on vessel count (including
73
whether vessels are active or stacked), average and effective vessel utilization, and average and effective vessel dayrates. Our activity level is largely dependent on the level of exploration, development and production activity of our oilfield customers and the demand for marine transportation services in our non-oilfield markets, all of which impact dayrates and utilization, which, in turn inform management decisions regarding vessel count and deployment. Our oilfield customers’ business activity is dependent on current and expected crude oil and natural gas prices, which fluctuate depending on expected future levels of supply and demand for crude oil and natural gas, and on estimates of the cost to find, develop and produce crude oil and natural gas reserves. Business activity for our non-oilfield customers is driven by an expanding need for specialized marine services in support of military, offshore wind and other non-oilfield applications.
The table below sets forth the average dayrates, utilization rates and effective dayrates for our owned OSVs and MPSVs and the average number and size of such vessels owned during the periods indicated. These vessels generate the majority of our revenues. Excluded from the OSV and MPSV information below is the results of operations for our shore-based port facility and vessel management services, including the four vessels formerly owned by us that we now operate and maintain for the U.S. Navy.
| Six Months Ended June 30, | Year Ended December 31, | |||||||||||||||||||
| 2024 | 2023 | 2023 | 2022 | 2021 | ||||||||||||||||
| Offshore Supply Vessels: |
||||||||||||||||||||
| Average number of OSVs(1) |
57.9 | 53.6 | 53.8 | 57.0 | 58.8 | |||||||||||||||
| Average number of active OSVs(2) |
36.9 | 31.4 | 32.2 | 26.7 | 22.2 | |||||||||||||||
| Average OSV fleet capacity (DWT)(3) |
256,552 | 232,419 | 235,514 | 229,001 | 228,256 | |||||||||||||||
| Average OSV capacity (DWT)(4) |
4,432 | 4,338 | 4,374 | 4,020 | 3,885 | |||||||||||||||
| Average OSV utilization rate(5) |
42.1 | % | 44.4 | % | 44.3 | % | 37.7 | % | 31.2 | % | ||||||||||
| Active OSV utilization rate(6) |
66.0 | % | 75.9 | % | 74.0 | % | 80.7 | % | 82.8 | % | ||||||||||
| Average OSV dayrate(7) |
$ | 41,030 | $ | 37,587 | $ | 39,297 | $ | 32,305 | $ | 19,785 | ||||||||||
| Effective OSV dayrate(8) |
$ | 17,274 | $ | 16,689 | $ | 17,409 | $ | 12,179 | $ | 6,173 | ||||||||||
| Multi-Purpose Support Vessels: |
||||||||||||||||||||
| Average number of MPSVs(1) |
12.0 | 12.0 | 12.0 | 12.0 | 12.0 | |||||||||||||||
| Average number of active MPSVs(2) |
12.0 | 11.0 | 11.2 | 10.4 | 8.9 | |||||||||||||||
| Average MPSV utilization rate(5) |
72.4 | % | 71.1 | % | 68.4 | % | 65.2 | % | 46.7 | % | ||||||||||
| Active MPSV utilization rate(6) |
72.4 | % | 77.5 | % | 73.6 | % | 75.0 | % | 63.0 | % | ||||||||||
| Average MPSV dayrate(7) |
$ | 64,130 | $ | 61,231 | $ | 62,372 | $ | 53,421 | $ | 40,245 | ||||||||||
| Effective MPSV dayrate(8) |
$ | 46,430 | $ | 43,535 | $ | 42,662 | $ | 34,830 | $ | 18,794 | ||||||||||
| (1) | Represents the weighted-average number of vessels owned during the period, adjusted to reflect date of acquisition or disposition of vessels. We owned 55 and 54 OSVs and 12 MPSVs as of December 31, 2023 and December 31, 2022, respectively. Excluded from the data as of December 31, 2023 and 2022 are four non-owned vessels that we manage for the U.S. Navy, one OSV acquired from the U.S. Department of Transportation’s Maritime Administration that is currently undergoing conversion into a MPSV for dual-service as either a C/SOV or flotel, and two partially constructed Jones Act-qualified MPSV newbuilds to be completed pursuant to our settlement with the Surety. We owned 60 and 53 OSVs and 12 MPSVs as of June 30, 2024 and June 30, 2023, respectively. Excluded from the data as of June 30, 2024 and June 30, 2023 are four non-owned vessels that we manage for the U.S. Navy, one OSV acquired from the U.S. Department of Transportation’s Maritime Administration that is currently undergoing conversion into a MPSV for dual-service as either a C/SOV or flotel and two partially constructed Jones Act-qualified MPSV newbuilds to be completed pursuant to our settlement with the Surety. Also excluded from the data as of the dates indicated are the following vessels acquired under the ECO Acquisitions that had not yet been acquired or had not yet been placed in service: (i) as of December 31, 2022, nine such vessels, (ii) as of December 31, 2023, five such vessels and (iii) as of June 30, 2023, seven such vessels. The Company also sold two and ten OSVs during 2023 and 2022, respectively. |
| (2) | In response to weak market conditions, we elected to stack certain of our OSVs and MPSVs on various dates since October 2014. The average number of active OSVs represents the weighted-average number of |
74
| vessels that were immediately available for service during each respective period, adjusted to reflect date of stacking or recommissioning of vessels. |
| (3) | Represents the weighted-average number of OSVs owned during the period multiplied by the weighted-average capacity of OSVs during the same period. |
| (4) | Represents actual capacity of the OSVs owned during the period on a weighted-average basis, adjusted to reflect date of acquisition or disposition of vessels. |
| (5) | Utilization rates are weighted-average rates based on a 365-day year. Vessels are considered utilized when they are generating revenues. |
| (6) | Active utilization rate is based on a denominator comprised only of vessel-days available for service by the active fleet, which excludes the impact of inactive or stacked vessel days. |
| (7) | Average OSV and MPSV dayrates represent weighted-average revenue per day, which includes charter hire, crewing services and net brokerage revenues, based on the number of days during the period that the OSVs and MPSVs, respectively, generated revenues. |
| (8) | Effective dayrate represents the average dayrate multiplied by the average utilization rate. |
Operating Expense
Our operating costs are primarily a function of total fleet size, the number of active vessels and areas of operations.
These costs include, but are not limited to:
| • | wages paid to vessel crews; |
| • | maintenance and repairs to vessels; |
| • | contract-specific cost of sales; |
| • | marine insurance; |
| • | materials and supplies; and |
| • | routine inspections to ensure compliance with applicable regulations and to maintain certifications for our vessels with the USCG and various classification societies. |
As of June 30, 2024, we had 18 U.S.-flagged OSVs and three foreign-flagged OSVs stacked. By removing these vessels from our active operating fleet, we significantly reduced our operating costs, including crew costs. As of June 30, 2024, our fixed operating costs were spread over 51 owned and operated vessels in active service and four vessels formerly owned by us that we now operate and maintain for the U.S. Navy.
In certain foreign markets in which we operate, we may be subject to higher operating costs compared to our domestic operations due to challenges and costs of staffing international operations, social taxes, local content requirements, and increased administration. We may not be able to recover higher international operating costs through higher dayrates charged to our customers. Therefore, when we increase our international complement of vessels, our gross margins may fluctuate depending on the foreign areas of operation and the complement of vessels operating domestically.
In addition to the operating costs described above, we incur fixed charges related to the depreciation of our fleet and amortization of costs for routine drydock inspections to ensure compliance with applicable regulations and to maintain certifications for our vessels with the USCG and various classification societies. The aggregate number of drydockings and other repairs undertaken in a given period determines the level of maintenance and repair expenses and marine inspection amortization charges. We capitalize costs incurred for drydock inspection and regulatory compliance and amortize such costs over the period between such drydockings, typically between 24 and 36 months. Applicable maritime regulations require us to drydock our vessels twice in a five-year period for inspection and routine maintenance and repair. If we undertake a disproportionately large number of
75
drydockings in a particular year, comparability of results may be affected. While we can defer required drydockings of stacked vessels, we will be required to conduct such deferred drydockings prior to such vessels returning to service, which could delay their return to active service.
The table below sets forth a breakdown of our operating expenses by type and the corresponding percent of total operating expenses (in thousands except percent of total and amounts per day):
| Three Months Ended June 30, |
Six Months Ended June 30, |
Twelve Months Ended December 31, |
||||||||||||||||||||||||||||||||||||||||||||||
| 2024 | 2023 | 2024 | 2023 | 2023 | 2022 | |||||||||||||||||||||||||||||||||||||||||||
| Operating expense |
||||||||||||||||||||||||||||||||||||||||||||||||
| Contract-related cost of sales |
$ | 5,568 | 6.2 | % | $ | 5,325 | 7.1 | % | $ | 10,748 | 5.9 | % | $ | 9,012 | 6.4 | % | $ | 20,804 | 6.8 | % | $ | 8,804 | 4.1 | % | ||||||||||||||||||||||||
| Personnel expense |
54,509 | 60.5 | % | 46,866 | 62.8 | % | 107,859 | 59.3 | % | 91,116 | 64.4 | % | 194,091 | 63.5 | % | 144,874 | 67.4 | % | ||||||||||||||||||||||||||||||
| Maintenance and repair |
17,387 | 19.3 | % | 11,549 | 15.5 | % | 36,401 | 20.0 | % | 21,293 | 15.0 | % | 46,095 | 15.1 | % | 28,750 | 13.4 | % | ||||||||||||||||||||||||||||||
| Insurance |
3,098 | 3.4 | % | 3,050 | 4.1 | % | 6,285 | 3.5 | % | 4,931 | 3.5 | % | 9,925 | 3.2 | % | 7,935 | 3.7 | % | ||||||||||||||||||||||||||||||
| Materials and supplies |
4,868 | 5.4 | % | 3,257 | 4.4 | % | 10,476 | 5.8 | % | 6,592 | 4.7 | % | 16,329 | 5.3 | % | 8,554 | 4.0 | % | ||||||||||||||||||||||||||||||
| Other |
4,723 | 5.2 | % | 4,545 | 6.1 | % | 10,049 | 5.5 | % | 8,557 | 6.0 | % | 18,219 | 6.1 | % | 15,871 | 7.4 | % | ||||||||||||||||||||||||||||||
|
|
|
|
|
|
|
|
|
|
|
|
|
|
|
|
|
|
|
|
|
|
|
|
|
|||||||||||||||||||||||||
| Total operating expense |
$ | 90,153 | 100.0 | % | $ | 74,592 | 100.0 | % | $ | 181,818 | 100.0 | % | $ | 141,501 | 100.0 | % | $ | 305,463 | 100.0 | % | $ | 214,788 | 100.0 | % | ||||||||||||||||||||||||
|
|
|
|
|
|
|
|
|
|
|
|
|
|
|
|
|
|
|
|
|
|
|
|
|
|||||||||||||||||||||||||
| Active OSV opex |
$ | 53,363 | 59.2 | % | $ | 44,293 | 59.4 | % | $ | 106,409 | 58.5 | % | $ | 83,037 | 58.7 | % | $ | 178,784 | 58.5 | % | $ | 114,702 | 53.4 | % | ||||||||||||||||||||||||
| Active MPSV opex |
26,168 | 29.0 | % | 21,134 | 28.3 | % | 52,033 | 28.6 | % | 41,436 | 29.3 | % | 84,260 | 27.6 | % | 65,927 | 30.7 | % | ||||||||||||||||||||||||||||||
| Stacked Vessel opex |
2,373 | 2.6 | % | 1,781 | 2.4 | % | 6,865 | 3.8 | % | 2,365 | 1.7 | % | 12,414 | 4.1 | % | 6,138 | 2.9 | % | ||||||||||||||||||||||||||||||
| Non-vessel opex |
8,249 | 9.2 | % | 7,384 | 9.9 | % | 16,511 | 9.1 | % | 14,663 | 10.3 | % | 30,005 | 9.8 | % | 28,021 | 13.0 | % | ||||||||||||||||||||||||||||||
|
|
|
|
|
|
|
|
|
|
|
|
|
|
|
|
|
|
|
|
|
|
|
|
|
|||||||||||||||||||||||||
| Total operating expense |
$ | 90,153 | 100.0 | % | $ | 74,592 | 100.0 | % | $ | 181,818 | 100.0 | % | $ | 141,501 | 100.0 | % | $ | 305,463 | 100.0 | % | $ | 214,788 | 100.0 | % | ||||||||||||||||||||||||
|
|
|
|
|
|
|
|
|
|
|
|
|
|
|
|
|
|
|
|
|
|
|
|
|
|||||||||||||||||||||||||
| Active OSV opex per day |
$ | 15,432 | $ | 15,354 | $ | 15,845 | $ | 14,610 | $ | 15,212 | $ | 11,770 | ||||||||||||||||||||||||||||||||||||
| Active MPSV opex per day |
$ | 23,963 | $ | 21,113 | $ | 23,825 | $ | 20,812 | $ | 20,612 | $ | 17,367 | ||||||||||||||||||||||||||||||||||||
| Stacked vessel opex per day |
$ | 1,241 | $ | 870 | $ | 1,796 | $ | 563 | $ | 1,518 | $ | 527 | ||||||||||||||||||||||||||||||||||||
| Total vessel opex per day |
$ | 12,677 | $ | 11,453 | $ | 25,988 | $ | 21,483 | $ | 11,469 | $ | 7,416 | ||||||||||||||||||||||||||||||||||||
General & Administrative (G&A) Expense
Our G&A expenses are primarily a function of the number of shoreside personnel and include, but are not limited to, base salaries, benefits and incentive compensation for shoreside employees, legal and other third-party advisor expenses, rent and other items.
76
The table below sets forth our general and administrative expenses in total, as a percentage of total revenue and per vessel day (in thousands except % of revenue and amounts per day):
| Three Months Ended June 30, | Six Months Ended June 30, | Twelve Months Ended Dec. 31 | ||||||||||||||||||||||
| 2024 | 2023 | 2024 | 2023 | 2023 | 2022 | |||||||||||||||||||
| General and administrative expense |
$ | 16,882 | $ | 15,609 | $ | 32,430 | $ | 32,366 | $ | 66,108 | $ | 58,946 | ||||||||||||
| G&A as a % of total revenues |
9.6 | % | 10.6 | % | 10.6 | % | 11.6 | % | 11.5 | % | 13.1 | % | ||||||||||||
| G&A per active vessel day |
$ | 3,710 | $ | 4,017 | $ | 3,644 | $ | 4,217 | $ | 4,173 | $ | 4,353 | ||||||||||||
| G&A per total vessel day |
$ | 2,613 | $ | 2,631 | $ | 2,549 | $ | 2,726 | $ | 2,753 | $ | 2,341 | ||||||||||||
Capital Expenditures
In addition to our operating metrics, we also focus on capital expenditures. Growth capital expenditures are expenditures undertaken by us to expand our fleet of vessels through acquisition or newbuild construction, while maintenance capital expenditures consist of deferred drydocking charges and maintenance capital improvements of existing vessels. Fluctuations in maintenance capital expenditures is primarily driven by the number of required recertification drydockings undertaken in a given period. Commercial capital expenditures represent vessel-related expenditures incurred to retrofit, convert or modify a vessel’s systems, structures or equipment to enhance functional capabilities and improve marketability or to meet certain commercial requirements. Non-vessel capital expenditures primarily relate to fixed asset additions or improvements related to our port facility, office locations, information technology, non-vessel property, plant and equipment or other shoreside support initiatives. For a more detailed description of growth, maintenance, commercial and non-vessel capital expenditures, see “—Liquidity and Capital Resources—Capital Expenditures and Related Commitments.”
The table below sets forth a breakdown of our capital expenditures by type and the corresponding vessel downtime related to deferred drydockings vessel counts and days (in thousands except as noted):
| Three Months Ended June 30, |
Six Months Ended June 30, |
Twelve Months Ended December, 31 |
||||||||||||||||||||||
| 2024 | 2023 | 2024 | 2023 | 2023 | 2022 | |||||||||||||||||||
| Capital expenditures(1) |
||||||||||||||||||||||||
| Growth capital expenditures |
$ | 6,146 | $ | 21,403 | $ | 26,313 | $ | 32,254 | $ | 128,547 | $ | 116,047 | ||||||||||||
| Maintenance capital expenditures |
15,185 | 11,543 | 36,075 | 19,198 | 37,573 | 22,872 | ||||||||||||||||||
| Commercial capital expenditures |
8,474 | 3,315 | 12,923 | 10,277 | 33,864 | 10,949 | ||||||||||||||||||
| Non-vessel capital expenditures |
— | 303 | 315 | 415 | 1,087 | 1,328 | ||||||||||||||||||
|
|
|
|
|
|
|
|
|
|
|
|
|
|||||||||||||
| Total capital expenditures |
$ | 29,805 | $ | 36,564 | $ | 75,626 | $ | 62,144 | $ | 201,071 | $ | 151,196 | ||||||||||||
|
|
|
|
|
|
|
|
|
|
|
|
|
|||||||||||||
| Drydock downtime |
||||||||||||||||||||||||
| OSVs |
||||||||||||||||||||||||
| Number of vessels commencing drydock activities |
3 | 1 | 6 | 6 | 15 | 10 | ||||||||||||||||||
| Out-of-service time for drydock activities (in days) |
72 | 187 | 188 | 298 | 608 | 333 | ||||||||||||||||||
| MPSVs |
||||||||||||||||||||||||
| Number of vessels commencing drydock activities |
1 | 2 | 4 | 2 | 5 | 4 | ||||||||||||||||||
| Out-of-service time for drydock activities (in days) |
63 | 82 | 316 | 82 | 191 | 200 | ||||||||||||||||||
| (1) | For further explanation on what these items consist of, see “—Liquidity and Capital Resources—Capital Expenditures and Related Commitments.” |
77
Reportable Segments
The Company has one reportable segment, which encompasses all aspects of its marine transportation services business. As the chief operating decision maker, our Chief Executive Officer evaluates the Company’s operating results on a consolidated basis to assess performance and allocate resources. While the Company’s vessels operate in various geographic regions and customer markets, they are centrally managed, share multiple forms of common costs, provide similar or complementary marine transportation services, are manned by crews that may move from location to location or market to market as needed, and are marketed on a portfolio basis with the goal of maximizing Adjusted EBITDA and Adjusted Free Cash Flow and generating the highest possible rate of return on invested capital without a permanent commitment to geographic region or customer market.
Results of Operations
Three Months Ended June 30, 2024 Compared to Three Months Ended June 30, 2023
Summarized financial information for the three months ended June 30, 2024 and 2023, respectively, is shown below in the following table (in thousands except % change):
| Three Months Ended June 30, |
Change | |||||||||||||||
| 2024 | 2023 | $ | % | |||||||||||||
| Revenues: |
||||||||||||||||
| Vessel revenues |
||||||||||||||||
| Domestic |
$ | 115,459 | $ | 99,776 | $ | 15,683 | 15.7 | % | ||||||||
| Foreign |
48,539 | 36,136 | 12,403 | 34.3 | ||||||||||||
|
|
|
|
|
|
|
|
|
|||||||||
| 163,998 | 135,912 | 28,086 | 20.7 | |||||||||||||
| Non-vessel revenues |
11,982 | 10,986 | 996 | 9.1 | ||||||||||||
|
|
|
|
|
|
|
|
|
|||||||||
| 175,980 | 146,898 | 29,082 | 19.8 | |||||||||||||
| Operating expenses |
90,153 | 74,592 | 15,561 | 20.9 | ||||||||||||
| Depreciation and amortization |
15,870 | 11,684 | 4,186 | 35.8 | ||||||||||||
| General and administrative expenses |
16,882 | 15,609 | 1,273 | 8.2 | ||||||||||||
| Stock-based compensation expense |
2,584 | 2,361 | 223 | 9.4 | ||||||||||||
| Terminated debt refinancing costs |
— | 3,633 | (3,633 | ) | 100.0 | |||||||||||
|
|
|
|
|
|
|
|
|
|||||||||
| 125,489 | 107,879 | 17,610 | 16.3 | |||||||||||||
|
|
|
|
|
|
|
|
|
|||||||||
| Gain on sale of assets |
27 | 2,576 | (2,549 | ) | (99.0 | ) | ||||||||||
|
|
|
|
|
|
|
|
|
|||||||||
| Operating income |
50,518 | 41,595 | 8,923 | 21.5 | ||||||||||||
| Foreign currency loss |
(537 | ) | (629 | ) | 92 | (14.6 | ) | |||||||||
| Interest expense |
(6,706 | ) | (11,123 | ) | 4,417 | 39.7 | ||||||||||
| Interest income |
1,327 | 2,614 | (1,287 | ) | (49.2 | ) | ||||||||||
| Fair value adjustment of liability-classified warrants |
(8,490 | ) | (7,947 | ) | (543 | ) | 6.8 | |||||||||
| Other income |
— | 42 | (42 | ) | (100.0 | ) | ||||||||||
| Income tax expense |
(3,014 | ) | (4,168 | ) | 1,154 | (27.7 | ) | |||||||||
|
|
|
|
|
|
|
|
|
|||||||||
| Net income |
$ | 33,098 | $ | 20,384 | $ | 12,714 | 62.4 | % | ||||||||
|
|
|
|
|
|
|
|
|
|||||||||
Revenues. Revenues for the three months ended June 30, 2024 and 2023 were $176.0 million and $146.9 million, respectively. Our weighted-average active operating fleet for the three months ended June 30, 2024 and 2023 was 50.0 and 42.7 vessels, respectively. For the three months ended June 30, 2024, we had a weighted-average of 21.0 vessels stacked compared to a weighted-average of 22.5 vessels stacked in the prior-year period.
Vessel revenues for the three months ended June 30, 2024 and 2023 were $164.0 million and $135.9 million, respectively. Vessels acquired since the first quarter of 2023 contributed $12.0 million to the
78
increase in revenue from the prior-year period, while the remaining variance was due to improved market conditions for our vessels. Revenues from our OSV fleet increased $15.0 million, or 17.6% for the three months ended June 30, 2024 compared to the prior-year period. Average OSV dayrates were $41,898 for the three months ended June 30, 2024 compared to $37,569 for the same period in 2023. Our average OSV utilization was 44.7% for the three months ended June 30, 2024 compared to 47.0% for the same period in 2023. Our OSVs incurred 72 days of aggregate downtime for regulatory drydockings and were stacked for an aggregate of 1,911 days during the three months ended June 30, 2024 compared to 187 and 1,953 days, respectively, for the same period in 2023. Excluding stacked vessel days, our active OSV utilization was 69.4% and 78.8% for the same periods, respectively. Our effective, or utilization-adjusted, OSV dayrates were $18,728 for the three months ended June 30, 2024 compared to $17,657 for the same period in 2023. Revenues from our MPSV fleet increased $13.0 million, or 25.8% for the three months ended June 30, 2024 compared to the prior-year period. Average MPSV dayrates were $70,601 for the three months ended June 30, 2024 compared to $59,933 for the three months ended June 30, 2023. Our MPSV utilization was 82.4% for the three months ended June 30, 2024 compared to 77.2% for the same period in 2023. Our MPSVs incurred 63 days of aggregate downtime for regulatory drydockings and were stacked for an aggregate of zero days during the three months ended June 30, 2024 compared to 82 and 91 days, respectively, for the same period in 2023. Excluding stacked vessel days, our active MPSV utilization was 82.4% and 84.2% during the three months ended June 30, 2024 and the same period in 2023, respectively. Our effective, or utilization-adjusted, MPSV dayrates were $58,175 for the three months ended June 30, 2024 compared to $46,268 for the same period in 2023. Domestic vessel revenues for the three months ended June 30, 2024 increased $15.7 million, or 15.7%, from the year-ago period primarily due to the addition of acquired vessels and an increase in other active vessels and improved market conditions during 2024. Foreign vessel revenues increased $12.4 million, or 34.3%, primarily due to improved market conditions for vessels operating in Brazil and other Latin American markets (excluding Mexico) during the three months ended June 30, 2024. Foreign vessel revenues for the three months ended June 30, 2024 comprised 29.6% of our total vessel revenues compared to 26.6% for the year-ago period.
Non-vessel revenues for the three months ended June 30, 2024 and 2023 were $12.0 million and $11.0 million, respectively. The 9.1% year-over-year increase in non-vessel revenues was primarily due to higher revenues earned from non-owned vessels that we manage on behalf of the U.S. Navy during the three months ended June 30, 2024.
Operating Expense. Operating expense for the three months ended June 30, 2024 and 2023 was $90.2 million and $74.6 million, respectively. Acquired vessels placed in service since the first quarter of 2023 contributed $9.8 million to the increase in operating expense, while the remaining variance was due to increases in maintenance and repair costs, mariner headcount, and local taxes on revenue for vessels operating in Brazil.
Depreciation and Amortization. Depreciation and amortization for the three months ended June 30, 2024 and 2023 was $15.9 million and $11.7 million, respectively. Depreciation increased from the prior year due to eight newly acquired vessels being placed into service subsequent to the first quarter of 2023. Amortization also increased as a result of 28 vessel recertification drydockings being completed since March 31, 2023.
General and Administrative Expense. G&A expense for the three months ended June 30, 2024 and 2023 was $16.9 million and $15.6 million, respectively. The year-over-year increase in G&A expense was primarily attributable to increases in shoreside employee headcount and wages.
Stock-Based Compensation Expense. Stock-based compensation expense for the three months ended June 30, 2024 and 2023 was $2.6 million and $2.4 million, respectively.
Terminated Debt Refinancing Costs. Terminated debt refinancing costs for the three months ended June 30, 2024 and 2023 were $0.0 million and $3.6 million, respectively. The year-over-year decrease in terminated debt refinancing costs was attributable to expenses incurred in connection with a debt refinancing process that was postponed during the second quarter of 2023.
79
Operating Income. Operating income for the three months ended June 30, 2024 and 2023 was $50.5 million and $41.6 million, respectively. Operating income increased by $8.9 million, or 21.4% for the reasons discussed above, but primarily due to improved market conditions for our vessels. Operating income as a percentage of revenues was 28.7% for the three months ended June 30, 2024 and 28.3% for the same period in 2023.
Interest Expense. Interest expense for the three months ended June 30, 2024 and 2023 was $6.7 million and $11.1 million, respectively. Interest expense decreased primarily due to the contractual conversion of our second-lien term loans to full cash-pay obligations with a lower annual interest rate of 8.25% on September 4, 2023 and the $68.7 million pay-off of the remaining principal balance of our Replacement First Lien Term Loans in August 2023.
Interest Income. Interest income for the three months ended June 30, 2024 and 2023 was $1.3 million and $2.6 million, respectively. Our average cash balance decreased to $95.5 million during the three months ended June 30, 2024 compared to $231.0 million for the same period in 2023. The average interest rate earned on our invested cash balances was 5.6% and 4.5% for the three months ended June 30, 2024 and 2023, respectively. The decrease in average cash balance was primarily due to new vessels acquired under the ECO Acquisitions and the repayment in full of our Replacement First Lien Term Loans in August 2023. The increase in the average interest rate is due to market increases in bank interest rates earned on invested cash balances.
Fair Value Adjustment of Liability-Classified Warrants. Fair value adjustment of liability-classified warrants for the three months ended June 30, 2024 and 2023 was $8.5 million and $7.9 million, respectively. Based on an updated valuation analysis for the three months ended June 30, 2024, the estimated fair value of the outstanding Creditor Warrants increased by $5.34, or 12.8%, per warrant.
Income Tax Expense. Our effective income tax expense rate was 8.3% and 17.0% for the three months ended June 30, 2024 and 2023, respectively. Our current income tax expense reflects current foreign tax liabilities and certain deferred tax liabilities that could not be offset with a reduction in the valuation allowance. Since September 4, 2020, we have offset deferred tax assets with a valuation allowance, as required in certain circumstances by GAAP, leading to volatility in our effective tax rate from period to period.
80
Six Months Ended June 30, 2024 Compared to Six Months Ended June 30, 2023
Summarized financial information for the six months ended June 30, 2024 and 2023, respectively, is shown below in the following table (in thousands except % change):
| Six Months Ended June 30, |
Change | |||||||||||||||
| 2024 | 2023 | $ | % | |||||||||||||
| Revenues: |
||||||||||||||||
| Vessel revenues |
||||||||||||||||
| Domestic |
$ | 203,601 | $ | 192,993 | $ | 10,608 | 5.5 | % | ||||||||
| Foreign |
79,606 | 63,494 | 16,112 | 25.4 | ||||||||||||
|
|
|
|
|
|
|
|
|
|||||||||
| 283,207 | 256,487 | 26,720 | 10.4 | |||||||||||||
| Non-vessel revenues |
23,569 | 21,902 | 1,667 | 7.6 | ||||||||||||
|
|
|
|
|
|
|
|
|
|||||||||
| 306,776 | 278,389 | 28,387 | 10.2 | |||||||||||||
| Operating expenses |
181,818 | 141,501 | 40,317 | 28.5 | ||||||||||||
| Depreciation and amortization |
30,256 | 22,119 | 8,137 | 36.8 | ||||||||||||
| General and administrative expenses |
32,430 | 32,366 | 64 | 0.2 | ||||||||||||
| Stock-based compensation expense |
4,423 | 15,363 | (10,940 | ) | (71.2 | ) | ||||||||||
| Terminated debt refinancing costs |
— | 3,633 | (3,633 | ) | (100.0 | ) | ||||||||||
|
|
|
|
|
|
|
|
|
|||||||||
| 248,927 | 214,982 | 33,945 | 15.8 | |||||||||||||
|
|
|
|
|
|
|
|
|
|||||||||
| Gain on sale of assets |
31 | 2,566 | (2,535 | ) | (98.8 | ) | ||||||||||
|
|
|
|
|
|
|
|
|
|||||||||
| Operating income |
57,880 | 65,973 | (8,093 | ) | (12.3 | ) | ||||||||||
| Foreign currency loss |
(757 | ) | (857 | ) | 100 | (11.7 | ) | |||||||||
| Interest expense |
(13,437 | ) | (22,972 | ) | 9,535 | (41.5 | ) | |||||||||
| Interest income |
3,007 | 4,830 | (1,823 | ) | (37.7 | ) | ||||||||||
| Fair value adjustment of liability-classified warrants |
696 | (4,533 | ) | 5,229 | >100.0 | |||||||||||
| Other income |
— | 756 | (756 | ) | (100.0 | ) | ||||||||||
| Income tax expense |
(3,163 | ) | (6,362 | ) | 3,199 | (50.3 | ) | |||||||||
|
|
|
|
|
|
|
|
|
|||||||||
| Net income |
$ | 44,226 | $ | 36,835 | $ | 7,391 | 20.1 | % | ||||||||
|
|
|
|
|
|
|
|
|
|||||||||
Revenues. Revenues for the six months ended June 30, 2024 and 2023 were $306.8 million and $278.4 million, respectively. Our weighted-average active operating fleet for the six months ended June 30, 2024 and 2023 was 48.9 and 42.4 vessels, respectively. For the six months ended June 30, 2024, we had an average of 21.0 vessels stacked compared to an average of 23.2 vessels stacked in the prior-year period.
Vessel revenues for the six months ended June 30, 2024 and 2023 were $283.2 million and $256.5 million, respectively. Vessels acquired since the December 31, 2022 contributed $20.0 million to the increase in revenue from the prior-year period, while the remaining variance was due to improved market conditions for our vessels. Revenues from our OSV fleet increased $19.9 million, or 12.3%, for the six months ended June 30, 2024 compared to the prior-year period. Average OSV dayrates were $41,030 for the six months ended June 30, 2024 compared to $37,587 for the same period in 2023. Our average OSV utilization was 42.1% for the six months ended June 30, 2024 compared to 44.4% for the same period in 2023. Our OSVs incurred 188 days of aggregate downtime for regulatory drydockings and were stacked for an aggregate of 3,822 days during the six months ended June 30, 2024 compared to 298 and 4,023 days, respectively, for the same period in 2023. Excluding stacked vessel days, our active OSV utilization was 66.0% and 75.9% for the same periods, respectively. Our effective, or utilization-adjusted, OSV dayrates were $17,274 for the six months ended June 30, 2024 compared to $16,689 for the same period in 2023. Revenues from our MPSV fleet increased $6.8 million, or 7.2%, for the six months ended June 30, 2024 compared to the prior-year period. Average MPSV dayrates were $64,130 for the six months ended June 30, 2024 compared to $61,231 for the same period in 2023. Our MPSV utilization was
81
72.4% for the six months ended June 30, 2024 compared to 71.1% for the same period in 2023. Our MPSVs incurred 316 days of aggregate downtime for regulatory drydockings and were stacked for an aggregate of zero days during the six months ended June 30, 2024 compared to 82 and 181 days, respectively, for the same period in 2023. Excluding stacked vessel days, our active MPSV utilization was 72.4% and 77.5% during the six months ended June 30, 2024 and the same period in 2023, respectively. Our effective, or utilization-adjusted, MPSV dayrates were $46,430 for the six months ended June 30, 2024 compared to $43,535 for the same period in 2023. Domestic vessel revenues increased $10.6 million, or 5.5%, from the year-ago period primarily due to the addition of acquired vessels and an increase in active vessels and improved market conditions for our vessels during the six months ended June 30, 2024. Foreign vessel revenues increased $16.1 million, or 25.4%, due to improved market conditions for vessels operating in Brazil, Trinidad and Tobago, and other Latin American markets (excluding Mexico) during the six months ended June 30, 2024. Foreign vessel revenues for the six months ended June 30, 2024 comprised 28.1% of our total vessel revenues compared to 24.8% for the prior-year period.
Non-vessel revenues for the six months ended June 30, 2024 and 2023 were $23.6 million and $21.9 million, respectively. The 7.6% year-over-year increase in non-vessel revenues was primarily due to higher revenues earned from non-owned vessels that we manage on behalf of the U.S. Navy during the six months ended June 30, 2024.
Operating Expense. Operating expense for the six months ended June 30, 2024 and 2023 was $181.8 million and $141.5 million, respectively. Vessels acquired since December 31, 2022 contributed $20.6 million to the increase in operating expense, while the remaining variance was due to increases in vessel recertifications and related maintenance and repair costs, mariner headcount, and local taxes on revenue for vessels operating in Brazil.
Depreciation and Amortization. Depreciation and amortization for the six months ended June 30, 2024 and 2023 were $30.3 million and $22.1 million, respectively. Depreciation increased from the prior year due to eight newly acquired vessels being placed into service subsequent to December 31, 2022. Amortization also increased as a result of 30 vessel recertification drydockings being completed since December 31, 2022.
General and Administrative Expense. G&A expense for the six months ended June 30, 2024 and 2023 was $32.4 million and $32.4 million, respectively.
Stock-Based Compensation Expense. Stock-based compensation expense for the six months ended June 30, 2024 and 2023 was $4.4 million and $15.4 million, respectively. The stock-based compensation expense decrease from the prior-year period was primarily attributable to certain long-term incentive grants of time-vesting restricted stock units (“RSUs”) under the 2020 Management Incentive Plan that were issued and one-half of which fully vested on the grant date in the first quarter of 2023.
Terminated Debt Refinancing Costs. Terminated debt refinancing costs for the three months ended June 30, 2024 and 2023 were $0.0 million and $3.6 million, respectively. The year-over-year decrease in terminated debt refinancing costs was attributable to expenses incurred in connection with a debt refinancing process that was postponed during the second quarter of 2023.
Operating Income. Operating income for the six months ended June 30, 2024 and 2023 was $57.9 million and $66.0 million, respectively. Operating income decreased by $8.1 million, or 12.3%, during the current-year period compared to the prior-year period for the reasons discussed above, but primarily due to an increase in active vessels combined with decreased utilization driven by increased vessel recertifications, which resulted in reduced revenues and incremental operating expense compared to the prior-year period. Operating income as a percentage of revenues was 18.9% for the six months ended June 30, 2024 and 23.7% for the same period in 2023.
82
Interest Expense. Interest expense for the six months ended June 30, 2024 and 2023 was $13.4 million and $23.0 million, respectively. Interest expense decreased primarily due to the contractual conversion of our second-lien term loans to full cash-pay obligations with a lower annual interest rate of 8.25% on September 4, 2023 and the $68.7 million pay-off of the remaining principal balance of our Replacement First Lien Term Loans in August 2023.
Interest Income. Interest income for the six months ended June 30, 2024 and 2023 was $3.0 million and $4.8 million, respectively. Our average cash balance decreased to $107.2 million during the current-year period compared to $232.8 million for the prior-year period. The average interest rate earned on our invested cash balances was 5.6% and 4.1% in the first six months ended June 30, 2024 and 2023, respectively. The decrease in average cash balance was primarily due to new vessels acquired under the ECO Acquisitions and the repayment in full of our Replacement First Lien Term Loans in August 2023. The increase in the average interest rate is due to market increases in bank interest rates earned on invested cash balances.
Fair Value Adjustment of Liability-Classified Warrants. Fair value adjustment of liability-classified warrants for the six months ended June 30, 2024 and 2023 was ($0.7) million and $4.5 million, respectively. Based on an updated valuation analysis as of June 30, 2024, the estimated fair value of the outstanding Creditor Warrants decreased year-to-date by $0.43, or 0.9%, per warrant.
Income Tax Expense. Our effective income tax expense rate was 6.7% and 14.7% for the six months ended June 30, 2024 and 2023, respectively. Our current income tax expense reflects current foreign tax liabilities and certain deferred tax liabilities that could not be offset with a reduction in the valuation allowance. Since September 4, 2020 we have offset deferred tax assets with a valuation allowance, as required in certain circumstances by GAAP, leading to volatility in our effective tax rate from period to period.
83
Year Ended December 31, 2023 Compared to Year Ended December 31, 2022
Summarized financial information for the years ended December 31, 2023 and 2021, respectively, is shown below in the following table (in thousands except % change):
| Year Ended December 31, | Change | |||||||||||||||
| 2023 | 2022 | $ | % | |||||||||||||
| Revenues: |
||||||||||||||||
| Vessel revenues |
||||||||||||||||
| Domestic |
$ | 387,952 | $ | 317,638 | $ | 70,314 | 22.1 | % | ||||||||
| Foreign |
140,828 | 88,396 | 52,432 | 59.3 | ||||||||||||
|
|
|
|
|
|
|
|
|
|||||||||
| 528,780 | 406,034 | 122,746 | 30.2 | |||||||||||||
| Non-vessel revenues |
44,669 | 45,192 | (523 | ) | (1.2 | ) | ||||||||||
|
|
|
|
|
|
|
|
|
|||||||||
| 573,449 | 451,226 | 122,223 | 27.1 | |||||||||||||
| Operating expenses |
305,463 | 214,788 | 90,675 | 42.4 | ||||||||||||
| Depreciation and amortization |
47,851 | 28,940 | 18,911 | 65.3 | ||||||||||||
| General and administrative expenses |
66,108 | 58,946 | 7,162 | 12.2 | ||||||||||||
| Stock-based compensation expense |
19,097 | 5,330 | 13,767 | >100.0 | ||||||||||||
| Terminated debt refinancing costs |
3,693 | — | 3,693 | — | ||||||||||||
|
|
|
|
|
|
|
|
|
|||||||||
| 442,212 | 308,004 | 134,208 | 43.6 | |||||||||||||
|
|
|
|
|
|
|
|
|
|||||||||
| Gain on sale of assets |
2,702 | 21,837 | (19,135 | ) | (87.6 | ) | ||||||||||
|
|
|
|
|
|
|
|
|
|||||||||
| Operating income |
133,939 | 165,059 | (31,120 | ) | (18.9 | ) | ||||||||||
| Loss on early extinguishment of debt |
(1,236 | ) | (44 | ) | (1,192 | ) | >100.0 | |||||||||
| Foreign currency loss |
(1,559 | ) | (198 | ) | (1,361 | ) | >100.0 | |||||||||
| Interest expense |
(39,802 | ) | (41,172 | ) | 1,370 | (3.3 | ) | |||||||||
| Interest income |
9,755 | 2,832 | 6,923 | >100.0 | ||||||||||||
| Fair value adjustment of liability-classified warrants |
(10,917 | ) | (41,408 | ) | 30,491 | (73.6 | ) | |||||||||
| Other income, net |
853 | 2,867 | (2,014 | ) | (70.2 | ) | ||||||||||
| Income tax expense |
(16,495 | ) | (7,174 | ) | (9,321 | ) | >100.0 | |||||||||
|
|
|
|
|
|
|
|
|
|||||||||
| Net income |
$ | 74,538 | $ | 80,762 | $ | (6,224 | ) | (7.7 | )% | |||||||
|
|
|
|
|
|
|
|
|
|||||||||
Revenues. Revenues for 2023 and 2022 were $573.4 million and $451.2 million, respectively. Our weighted-average active operating fleet for 2023 and 2022 was 43.4 and 37.1 vessels, respectively. For 2023, we had a weighted average of 22.4 vessels stacked compared to a weighted average of 31.9 vessels stacked in the prior year.
Vessel revenues for 2023 and 2022 were $528.8 million and $406.0 million, respectively. Vessels acquired in 2022 that provided their first full-year contribution to revenues in 2023 and vessels acquired in 2023 contributed $62.7 million to the year-over-year increase in revenues, while the remaining increase was primarily due to improved market conditions for our vessels. Revenues from our OSV fleet increased $88.5 million, or 34.9%, for 2023 compared to 2022. Average OSV dayrates were $39,297 for 2023 compared to $32,305 for the prior year. Our average OSV utilization was 44.3% for 2023 compared to 37.7% for 2022. Our OSVs incurred 586 days of aggregate downtime for regulatory drydockings and were stacked for an aggregate of 7,887 days during 2023 compared to 332 and 11,074 days, respectively, during 2022. Excluding stacked vessel days, our active OSV utilization was 74.0% and 80.7% for the same periods, respectively. Revenues from our MPSV fleet increased $34.2 million, or 22.4%, for 2023 compared to 2022. Average MPSV dayrates were $62,372 for 2023 compared to $53,421 for 2022. Our MPSV utilization was 68.4% for 2023 compared to 65.2% for 2022. Our MPSVs incurred 191 days of aggregate downtime for regulatory drydockings and were stacked for an aggregate of 310 days during 2023 compared to 200 and 569 days, respectively, during 2022. Excluding stacked vessel days, our active MPSV utilization was 73.6% and 75.0% during 2023 and 2022, respectively. Domestic vessel revenues increased $70.3 million, or 22.1%, from 2022 primarily due to an increase in active vessels and
84
improved market conditions for our vessels operating in the U.S. GoM. Foreign vessel revenues increased $52.4 million, or 59.3% due to improved market conditions for vessels operating in Mexico during the first nine months of 2023 and in Brazil during the full year 2023. Foreign vessel revenues for 2023 comprised 26.6% of our total vessel revenues compared to 21.8% for 2022.
Non-vessel revenues for 2023 and 2022 were $44.7 million and $45.2 million, respectively. The 1.1% year-over-year decrease in non-vessel revenues was primarily due to lower revenues earned from non-military vessel management services during 2023 compared to the prior year. Our non-vessel revenues primarily include our O&M contract with the U.S. Navy, revenues from our port facility located in Port Fourchon, Louisiana (the “HOS Port”), and other vessel management services.
Operating Expense. Operating expense for 2023 and 2022 was $305.5 million and $214.8 million, respectively. Vessels acquired in 2022 that provided their first full-year contribution to operating expense in 2023 and vessels acquired in 2023 contributed $52.1 million to the year-over-year increase in operating expense, while the remaining variance was due to increases in domestic mariner wages, vessel recertifications and related maintenance and repair costs, and contract-specific costs of sales to meet customer charter requirements, which were ultimately recovered through the agreed upon charter dayrate.
Depreciation and Amortization. Depreciation and amortization expense for 2023 and 2022 was $47.9 million and $28.9 million, respectively. Depreciation increased from the prior year due to nine newly acquired vessels being placed into service in or subsequent to the second quarter of 2022. Amortization also increased as a result of 21 vessel recertification drydockings being completed since September 30, 2022.
General and Administrative Expense. G&A expense for 2023 and 2022 was $66.1 million and $58.9 million, respectively. The year-over-year increase in G&A expense was primarily attributable to increases in shoreside employee headcount and wages and related benefits.
Stock-based Compensation Expense. Stock-based compensation expense for 2023 and 2022 was $19.1 million and $5.3 million, respectively. The stock-based compensation expense increase from the prior-year period was primarily attributable to certain new long-term incentive grants of RSUs under the 2020 Management Incentive Plan that were issued and one-half of which vested on the grant date in the first quarter of 2023.
Terminated Debt Refinancing Costs. Terminated debt refinancing costs for 2023 and 2022 were $3.7 million and $0.0 million, respectively. The terminated debt refinancing costs were attributable to costs related to a debt refinancing process that was postponed during the second quarter of 2023.
Operating Income. Operating income for 2023 and 2022 was $133.9 million and $165.1 million, respectively. Operating income decreased by $31.1 million, or 18.9% during the current-year period compared to the prior-year period for the reasons discussed above, but primarily due to the increase in operating expense from newly acquired vessels. Operating income as a percentage of revenues was 23.4% for 2023 and 36.6% for 2022. Excluding the non-recurring effect of the restricted stock grants that were issued and vested in 2023, the terminated debt refinancing costs incurred in the second quarter of 2023, and the gain on sale of assets in the current and prior-year periods, operating income as a percentage of revenue was 25.5% and 31.7% for 2023 and 2022, respectively.
Interest Expense. Interest expense for 2023 and 2022 was $39.8 million and $41.2 million, respectively. The decrease in interest expense was primarily attributable to electing to pay cash interest only in the second quarter of 2023 for the Second Lien Term Loans, which reduced our interest rate on that debt instrument from 11.5% to 10.25%. In addition, effective September 4, 2023, the Second Lien Term Loans contractually converted to full cash-pay obligations with an annual interest rate of 8.25%. The decrease in interest expense is also related to the $68.7 million payoff of the remaining principal balance of the Replacement First Lien Term Loans in August 2023.
85
Interest Income. Interest income for 2023 and 2022 was $9.8 million and $2.8 million, respectively. Our average cash balance increased to $213.2 million during 2023 compared to $167.8 million for 2022. The average interest rate earned on our invested cash balances was 4.5% and 1.7% in 2023 and 2022, respectively. The increase in average cash balance was primarily due to improved operating results and net cash proceeds received in the fourth quarter of 2022 from the delayed draw that was funded under the Replacement First Lien Term Loans. The increase in the average interest rate is due to market increases in bank interest rates on invested cash balances.
Fair Value Adjustment of Liability-Classified Warrants. Fair value adjustment of liability-classified warrants for 2023 and 2022 was $10.9 million and $41.4 million, respectively. Creditor Warrants (warrants entitling holders to purchase common stock at a strike price set at an enterprise value of $621.2 million, or $27.83 per share ($ per share after giving effect to the stock split)) were issued on September 4, 2020, and we have since recorded a quarterly mark-to-market adjustment beginning with the quarter ended December 31, 2020. Prior to the issuance of these Creditor Warrants, we did not have any issued or outstanding liability-classified warrants. Based on a valuation analysis as of December 31, 2023, the estimated fair value of the outstanding Creditor Warrants increased year-over-year by $6.85, or 16.9%, per warrant.
Income Tax Expense. Our effective income tax expense rate was 18.1% and 8.2% for 2023 and 2022, respectively. Our current income tax expense reflects our current foreign tax liabilities and certain deferred tax liabilities that could not be offset with a valuation allowance. We have offset most of our deferred tax assets with a valuation allowance, as required in certain circumstances by GAAP, leading to volatility in our effective income tax rate from period to period. The 2023 rate is higher than 2022 due to increased current foreign taxes resulting from a higher proportion of earnings in foreign jurisdictions, while the related foreign tax credits are being reserved.
Net Income. Net income for 2023 and 2022 was $74.5 million and $80.8 million, respectively. This year-over-year decrease was primarily due to an increase in operating expense combined with the net effect of the non-recurring items discussed above in Operating Income.
86
Year Ended December 31, 2022 Compared to Year Ended December 31, 2021
Summarized financial information for the years ended December 31, 2022 and 2021, respectively, is shown below in the following table (in thousands):
| Year Ended December 31, |
Change | |||||||||||||||
| 2022 | 2021 | $ | % | |||||||||||||
| Revenues: |
||||||||||||||||
| Vessel revenues |
||||||||||||||||
| Domestic |
$ | 317,638 | $ | 154,737 | $ | 162,901 | >100.0 | % | ||||||||
| Foreign |
88,396 | 59,943 | 28,453 | 47.5 | ||||||||||||
|
|
|
|
|
|
|
|
|
|||||||||
| 406,034 | 214,680 | 191,354 | 89.1 | |||||||||||||
| Non-vessel revenues |
45,192 | 41,620 | 3,572 | 8.6 | ||||||||||||
|
|
|
|
|
|
|
|
|
|||||||||
| 451,226 | 256,300 | 194,926 | 76.1 | |||||||||||||
| Operating expenses |
214,788 | 142,819 | 71,969 | 50.4 | ||||||||||||
| Depreciation and amortization |
28,940 | 18,383 | 10,557 | 57.4 | ||||||||||||
| General and administrative expenses |
58,946 | 40,632 | 18,314 | 45.1 | ||||||||||||
| Stock-based compensation expense |
5,330 | 3,372 | 1,958 | 58.1 | ||||||||||||
|
|
|
|
|
|
|
|
|
|||||||||
| 308,004 | 205,206 | 102,798 | 50.1 | |||||||||||||
|
|
|
|
|
|
|
|
|
|||||||||
| Gain on sale of assets |
21,837 | 2,679 | 19,158 | >100.0 | ||||||||||||
|
|
|
|
|
|
|
|
|
|||||||||
| Operating income |
165,059 | 53,773 | 111,286 | >100.0 | ||||||||||||
| Loss on early extinguishment of debt |
(44 | ) | — | (44 | ) | — | ||||||||||
| Foreign currency gain (loss) |
(198 | ) | (434 | ) | 236 | (54.5 | ) | |||||||||
| Interest expense |
(41,172 | ) | (35,794 | ) | (5,378 | ) | 15.0 | |||||||||
| Interest income |
2,832 | 510 | 2,322 | >100.0 | ||||||||||||
| Fair value adjustment of liability-classified warrants |
(41,408 | ) | (15,150 | ) | (26,258 | ) | >100.0 | |||||||||
| Reorganization items, net |
— | — | — | — | ||||||||||||
| Other income, net |
2,867 | 1,615 | 1,252 | 77.5 | ||||||||||||
| Income tax benefit (expense) |
(7,174 | ) | (1,533 | ) | (5,641 | ) | >100.0 | |||||||||
|
|
|
|
|
|
|
|
|
|||||||||
| Net income |
$ | 80,762 | $ | 2,987 | $ | 77,775 | >100.0 | % | ||||||||
|
|
|
|
|
|
|
|
|
|||||||||
For comparative purposes, references in the explanations below to 2022 reflect the year ended December 31, 2022. References to 2021 reflect the year ended December 31, 2021.
Revenues. Revenues for 2022 and 2021 were $451.2 million and $256.3 million, respectively. Our weighted-average active operating fleet for 2022 and 2021 was 37.1 and 31.1 vessels, respectively. For 2022, we had a weighted average of 31.9 vessels stacked compared to a weighted average of 39.7 vessels stacked in the prior year.
Vessel revenues for 2022 and 2021 were $406.0 million and $214.7 million, respectively. The increase in vessel revenues was primarily due to improved market conditions for our vessels. Revenues from our OSV fleet increased $121.0 million, or 91.4%, for 2022 compared to 2021. Average OSV dayrates were $32,305 for 2022 compared to $19,785 for the prior year. Our OSV utilization was 37.7% for 2022 compared to 31.2% for 2021. Our OSVs incurred 332 days of aggregate downtime for regulatory drydockings and were stacked for an aggregate of 11,074 days during 2022 compared to 413 and 13,360 days, respectively, during 2021. Excluding stacked vessel days, our active OSV utilization was 80.7% and 82.8% for the same periods, respectively. Revenues from our MPSV fleet increased $70.4 million, or 85.6%, for 2022 compared to 2021. Average MPSV dayrates were $53,421 for 2022 compared to $40,245 for 2021. Our MPSV utilization was 65.2% for 2022 compared to 46.7% for 2021. Our MPSVs incurred aggregate downtime of 200 days for regulatory drydockings
87
and were stacked for an aggregate of 569 days during 2022 compared to an aggregate downtime of 206 days for regulatory drydockings and being stacked for an aggregate 1,137 days, respectively, during 2021. Excluding stacked vessel days, our active MPSV utilization was 75.0% and 63.0% during 2022 and 2021, respectively. Domestic vessel revenues for 2022 increased $162.9 million, or 105%, from 2021 primarily due to improved market conditions for our vessels operating in the U.S. GoM. Foreign vessel revenues increased $28.5 million, or 47.5%, due to improved market conditions for vessels operating in Brazil, Trinidad and other Latin American markets during 2022. Foreign vessel revenues for 2022 comprised 21.8% of our total vessel revenues compared to 27.9% for 2021.
Non-vessel revenues for 2022 and 2021 were $45.2 million and $41.6 million, respectively. The year-over-year increase in non-vessel revenues was primarily due to higher revenues earned from vessel management services during 2022 compared to the prior year. Our non-vessel revenues primarily include our O&M contract with the U.S. Navy, revenues from our HOS Port facilities, and other vessel management services.
Operating Expense. Operating expenses for 2022 and 2021 were $214.8 million and $142.8 million, respectively. Operating expense increased year-over-year primarily due to increases in active vessels, mariner headcount, domestic mariner wages and benefits, and maintenance and repair costs for vessels and related equipment.
Depreciation and Amortization. Depreciation and amortization expense for 2022 and 2021 was $28.9 million and $18.4 million, respectively. Depreciation expense increased from the prior year due to newly acquired vessels being placed into service.
General and Administrative Expense. G&A expense for 2022 and 2021 was $58.9 million and $40.6 million, respectively. The year-over-year increase in G&A expense was primarily attributable to an increase in shoreside employee headcount and wages, legal costs associated with on-going litigation and costs related to the recruitment of mariners. The increase is also attributable to an advisory fee related to the acquisition of vessels from certain affiliates of ECO and additional trade name and trademark licensing fees incurred in the current year.
Stock-Based Compensation Expense. Stock-based compensation expense for 2022 and 2021 was $5.3 million and $3.4 million, respectively. The year-over-year increase in stock-based compensation expense was attributable to awards granted under the 2020 Management Incentive Plan in the second quarter of 2022, which were valued at a substantially higher stock price per share.
Gain on Sale of Assets. During 2022, we sold seven 200 class DP-1 OSVs, three 240 class DP-2 OSVs and other non-vessel assets for gross proceeds of $23.7 million, resulting in a net gain of $21.8 million. The net gain represents $20.5 million from vessel sales and $1.3 million from sales of non-vessel assets. The gain on sale of assets for 2021 represents gains of $2.2 million from vessel sales and $0.5 million from sales of non-vessel assets.
Operating Income. Operating income for 2022 and 2021 was $165.1 million and $53.8 million, respectively. Operating income increased year-over-year by $111.0 million, or 207%, during 2022 compared to 2021 for the reasons discussed above, but primarily due to improved market conditions for our vessels. Operating income as a percentage of revenues was 36.6% for 2022 compared to 21.0% for 2021.
Interest Expense. Interest expense was $41.2 million, inclusive of $30.4 million of paid-in-kind interest, for 2022 compared to $35.8 million, inclusive of $29.3 million of paid-in-kind interest, for 2021. Interest expense increased primarily due to (i) increases in the interest rates on the Replacement First Lien Term Loans and Second Lien Term Loans during 2022, (ii) higher outstanding balances on the Replacement First Lien Term Loans and Second Lien Term Loans as a result of the $37.5 million delayed draw term loans that were incurred in November 2022 and capitalized accumulated paid-in-kind interest incurred since the prior year, respectively, and (iii) the interest component of our negotiated settlement of the 2014 Mexico tax audit.
88
Interest Income. Interest income for 2022 and 2021 was $2.8 million and $0.5 million, respectively, representing a year-over-year increase of $2.3 million. Our average cash balance increased to $167.8 million during 2022 compared to $117.8 million during 2021. The average interest rate earned on our invested cash balances was 1.7% and 0.4% during 2022 and 2021, respectively. The increase in average cash balance was primarily due to improved operating results in 2022, net cash proceeds received in December 2021 from the preemptive rights offering and Replacement First Lien Term Loans, and the delayed draw funding under the Replacement First Lien Term Loans in November 2022.
Fair Value Adjustment of Liability-Classified Warrants. Fair value adjustment of liability-classified warrants for 2022 and 2021 was $41.4 million and $15.2 million, respectively. Based on a valuation analysis as of December 31, 2022, the estimated fair value of the outstanding Creditor Warrants increased year-over-year by $26.01, or 179%, per warrant.
Other Income, Net. Other income, net, for 2022 and 2021 was $2.9 million and $1.6 million, respectively. Other income increased year-over-year primarily due to $1.5 million in fees received from certain sellers’ terminations of four vessel purchase agreements.
Income Tax Expense. Our effective tax expense rate was 8.2% and 33.9% for 2022 and 2021, respectively. Our income tax expense in 2022 reflects our foreign tax liabilities as of December 31, 2022. Since September 4, 2020, we had been in a net deferred tax asset position and had offset our deferred tax benefit with a valuation allowance, as required in certain circumstances by GAAP. The 2022 period rate is lower than 2021 due to the relatively higher level of income for 2022 compared to 2021.
Net Income. Net income for 2022 and 2021 was $80.8 million and $3.0 million, respectively. This favorable variance in net income was primarily driven by improved market conditions for our vessels. Net income as a percentage of revenues was 17.9% and 1.2% for 2022 and 2021, respectively.
Non-GAAP Financial Measures
We disclose and discuss EBITDA, Adjusted EBITDA and Adjusted Free Cash Flow as non-GAAP financial measures in this prospectus. We define EBITDA as earnings (net income or loss) before interest, income taxes, depreciation and amortization. Adjusted EBITDA reflects certain adjustments to EBITDA for gains or losses on early extinguishment of debt, terminated debt refinancing costs, stock-based compensation expense and interest income. In addition, Adjusted EBITDA excludes non-cash gains or losses on the fair value adjustment of liability-classified warrants. We define Adjusted Free Cash Flow as Adjusted EBITDA less cash paid for deferred drydocking charges, cash paid for maintenance capital improvements and non-vessel capital expenditures, cash paid for interest and cash paid for (refunds of) income taxes. Our measures of EBITDA, Adjusted EBITDA and Adjusted Free Cash Flow may not be comparable to similarly titled measures presented by other companies. Other companies may calculate EBITDA, Adjusted EBITDA and Adjusted Free Cash Flow differently than we do, which may limit their usefulness as comparative measures.
We view EBITDA, Adjusted EBITDA and Adjusted Free Cash Flow primarily as liquidity measures and, as such, we believe that the GAAP financial measure most directly comparable to those measures is cash flows provided by operating activities. Because EBITDA, Adjusted EBITDA and Adjusted Free Cash Flow are not measures of financial performance calculated in accordance with GAAP, they should not be considered in isolation or as a substitute for operating income, net income or loss, cash flows provided by operating, investing and financing activities, or other income or cash flow statement data prepared in accordance with GAAP. Additionally, Adjusted Free Cash Flow does not represent the total increase or decrease in our cash balance, and it should not be inferred that the entire amount of Adjusted Free Cash Flow is available for dividends, debt or share repurchases or other discretionary expenditures, since we have non-discretionary expenditures that are not deducted from this measure.
89
EBITDA, Adjusted EBITDA and Adjusted Free Cash Flow are widely used by investors and other users of our consolidated financial statements as supplemental financial measures that, when viewed with our GAAP results and the accompanying reconciliations, we believe provide additional information that is useful to gain an understanding of the factors and trends affecting our ability to service debt, pay income taxes and fund drydocking charges, maintenance capital improvements and non-vessel capital expenditures. We also believe the disclosure of EBITDA, Adjusted EBITDA and Adjusted Free Cash Flow helps investors or lenders meaningfully evaluate and compare our cash flow generating capacity from quarter to quarter and year to year.
EBITDA, Adjusted EBITDA and Adjusted Free Cash Flow are also financial metrics used by management as supplemental internal measures for planning and forecasting overall expectations and for evaluating actual results against such expectations; for short-term cash bonus incentive compensation purposes; to compare to the EBITDA, Adjusted EBITDA and Adjusted Free Cash Flow of other companies, vessels or other assets when evaluating potential acquisitions; to assess our ability to service existing fixed charges and incur additional indebtedness; and to purchase, convert or construct additional vessels. Additionally, we have historically made certain adjustments to EBITDA to internally evaluate our performance based on the computation of ratios used in certain financial covenants of our credit agreements with various lenders, whenever applicable. Currently, our credit agreements have incurrence tests and other financial covenants, including coverage and leverage ratios. These ratios are calculated using certain adjustments to EBITDA defined by our credit agreements, which adjustments are consistent with those reflected in Adjusted EBITDA in this prospectus. In addition, we believe that, based on covenants in prior credit facilities, future debt arrangements may require compliance with certain ratios that will likely include EBITDA or Adjusted EBITDA in the computations. Adjusted EBITDA is also currently utilized in connection with the Company’s short-term cash bonus incentive compensation programs.
The following tables reconcile cash flows provided by operating activities to EBITDA, Adjusted EBITDA and Adjusted Free Cash Flow, as we define those terms, for the six months ended June 30, 2024, and 2023 and the years ended December 31, 2023, 2022, and 2021, respectively (in thousands):
| Six Months Ended June 30, |
Year Ended December 31, | |||||||||||||||||||
| (dollars in thousands) | 2024 | 2023 | 2023 | 2022 | 2021 | |||||||||||||||
| EBITDA Reconciliation to GAAP: |
||||||||||||||||||||
| Net cash flows provided by operating activities |
$ | 26,666 | $ | 62,349 | $ | 146,115 | $ | 112,967 | $ | 49,611 | ||||||||||
| Cash paid for deferred drydocking charges |
26,106 | 15,416 | 29,828 | 19,114 | 14,113 | |||||||||||||||
| Cash paid for interest |
14,556 | 15,502 | 32,970 | 8,868 | 8,467 | |||||||||||||||
| Cash paid for income taxes |
13,035 | 1,136 | 9,311 | 474 | 2,399 | |||||||||||||||
| Recovery of (provision for) credit losses |
34 | (386 | ) | (551 | ) | (257 | ) | (44 | ) | |||||||||||
| Changes in other operating assets and liabilities |
11,805 | 7,260 | (19,166 | ) | 38,995 | (516 | ) | |||||||||||||
| Stock-based compensation expense |
(4,423 | ) | (15,363 | ) | (19,097 | ) | (5,330 | ) | (3,372 | ) | ||||||||||
| Amortization of deferred contract-specific costs of sales |
(431 | ) | (489 | ) | (1,028 | ) | — | — | ||||||||||||
| Fair value adjustment of liability-classified warrants |
696 | (4,533 | ) | (10,917 | ) | (41,408 | ) | (15,150 | ) | |||||||||||
| Loss on early extinguishment of debt, net |
— | — | (1,236 | ) | (44 | ) | — | |||||||||||||
| Gain on sale and disposal of assets |
31 | 2,566 | 2,702 | 21,837 | 2,679 | |||||||||||||||
|
|
|
|
|
|
|
|
|
|
|
|||||||||||
| EBITDA |
$ | 88,075 | $ | 83,458 | $ | 168,931 | $ | 155,216 | $ | 58,187 | ||||||||||
|
|
|
|
|
|
|
|
|
|
|
|||||||||||
| Adjusted EBITDA Reconciliation to GAAP: |
||||||||||||||||||||
| Net cash flows provided by operating activities |
$ | 26,666 | $ | 62,349 | $ | 146,115 | $ | 112,967 | $ | 49,611 | ||||||||||
| Cash paid for deferred drydocking charges |
26,106 | 15,416 | 29,828 | 19,114 | 14,113 | |||||||||||||||
| Cash paid for interest |
14,556 | 15,502 | 32,970 | 8,868 | 8,467 | |||||||||||||||
| Cash paid for income taxes |
13,035 | 1,136 | 9,311 | 474 | 2,399 | |||||||||||||||
| Recovery of (provision for) credit losses |
34 | (386 | ) | (551 | ) | (257 | ) | (44 | ) | |||||||||||
| Changes in other operating assets and liabilities |
11,805 | 7,260 | (19,166 | ) | 38,995 | (516 | ) | |||||||||||||
90
| Six Months Ended June 30, |
Year Ended December 31, | |||||||||||||||||||
| (dollars in thousands) | 2024 | 2023 | 2023 | 2022 | 2021 | |||||||||||||||
| Amortization of deferred contract-specific costs of sales |
(431 | ) | (489 | ) | (1,028 | ) | — | — | ||||||||||||
| Interest income |
3,007 | 4,830 | 9,755 | 2,832 | 510 | |||||||||||||||
| Gain on sale and disposal of assets |
31 | 2,566 | 2,702 | 21,837 | 2,679 | |||||||||||||||
| Terminated debt refinancing costs |
— | 3,633 | 3,693 | — | — | |||||||||||||||
|
|
|
|
|
|
|
|
|
|
|
|||||||||||
| Adjusted EBITDA |
$ | 94,809 | $ | 111,817 | $ | 213,629 | $ | 204,830 | $ | 77,219 | ||||||||||
|
|
|
|
|
|
|
|
|
|
|
|||||||||||
| Adjusted Free Cash Flow Reconciliation to GAAP: |
||||||||||||||||||||
| Net cash flows provided by operating activities |
$ | 26,666 | $ | 62,349 | $ | 146,115 | $ | 112,967 | $ | 49,611 | ||||||||||
| Cash paid for maintenance capital improvements |
(9,969 | ) | (3,782 | ) | (7,745 | ) | (3,762 | ) | (3,826 | ) | ||||||||||
| Cash paid for non-vessel capital expenditures |
(315 | ) | (415 | ) | (1,087 | ) | (1,328 | ) | (688 | ) | ||||||||||
| Recovery of (provision for) credit losses |
34 | (386 | ) | (551 | ) | (257 | ) | (44 | ) | |||||||||||
| Changes in other operating assets and liabilities |
11,805 | 7,260 | (19,166 | ) | 38,995 | (516 | ) | |||||||||||||
| Amortization of deferred contract-specific costs of sales |
(431 | ) | (489 | ) | (1,028 | ) | — | — | ||||||||||||
| Interest income |
3,007 | 4,830 | 9,755 | 2,832 | 510 | |||||||||||||||
| Gain on sale and disposal of assets |
31 | 2,566 | 2,702 | 21,837 | 2,679 | |||||||||||||||
| Terminated debt refinancing costs |
— | 3,633 | 3,693 | — | — | |||||||||||||||
|
|
|
|
|
|
|
|
|
|
|
|||||||||||
| Adjusted Free Cash Flow |
$ | 30,828 | $ | 75,566 | $ | 132,688 | $ | 171,284 | $ | 47,726 | ||||||||||
|
|
|
|
|
|
|
|
|
|
|
|||||||||||
The following table provides the detailed components of EBITDA, Adjusted EBITDA and Adjusted Free Cash Flow as we define those terms, for the six months ended June 30, 2024 and 2023, and the years ended December 31, 2023, 2022, and 2021, respectively (in thousands):
| Six Months Ended June 30, |
Year Ended December 31, |
|||||||||||||||||||
| 2024 | 2023 | 2023 | 2022 | 2021 | ||||||||||||||||
| Components of EBITDA: |
||||||||||||||||||||
| Net income |
$ | 44,226 | $ | 36,835 | $ | 74,538 | $ | 80,762 | $ | 2,987 | ||||||||||
| Interest, net |
||||||||||||||||||||
| Interest expense |
13,437 | 22,972 | 39,802 | 41,172 | 35,794 | |||||||||||||||
| Interest income |
(3,007 | ) | (4,830 | ) | (9,755 | ) | (2,832 | ) | (510 | ) | ||||||||||
|
|
|
|
|
|
|
|
|
|
|
|||||||||||
| Total interest, net |
10,430 | 18,142 | 30,047 | 38,340 | 35,284 | |||||||||||||||
|
|
|
|
|
|
|
|
|
|
|
|||||||||||
| Income tax expense |
3,163 | 6,362 | 16,495 | 7,174 | 1,533 | |||||||||||||||
| Depreciation |
18,093 | 11,753 | 26,355 | 18,601 | 15,672 | |||||||||||||||
| Amortization |
12,163 | 10,366 | 21,496 | 10,339 | 2,711 | |||||||||||||||
|
|
|
|
|
|
|
|
|
|
|
|||||||||||
| EBITDA |
$ | 88,075 | $ | 83,458 | $ | 168,931 | $ | 155,216 | $ | 58,187 | ||||||||||
|
|
|
|
|
|
|
|
|
|
|
|||||||||||
| Loss on early extinguishment of debt, net |
$ | — | $ | — | $ | 1,236 | $ | 44 | $ | — | ||||||||||
| Stock-based compensation expense |
4,423 | 15,363 | 19,097 | 5,330 | 3,372 | |||||||||||||||
| Interest income |
3,007 | 4,830 | 9,755 | 2,832 | 510 | |||||||||||||||
| Fair value of liability-classified warrants |
(696 | ) | 4,533 | 10,917 | 41,408 | 15,150 | ||||||||||||||
| Terminated debt refinancing costs |
— | 3,633 | 3,693 | — | — | |||||||||||||||
|
|
|
|
|
|
|
|
|
|
|
|||||||||||
| Adjusted EBITDA |
$ | 94,809 | $ | 111,817 | $ | 213,629 | $ | 204,830 | $ | 77,219 | ||||||||||
|
|
|
|
|
|
|
|
|
|
|
|||||||||||
| Cash paid for deferred drydocking charges(1) |
$ | (26,106 | ) | $ | (15,416 | ) | $ | (29,828 | ) | $ | (19,114 | ) | $ | (14,113 | ) | |||||
| Cash paid for maintenance capital improvements(1) |
(9,969 | ) | (3,782 | ) | (7,745 | ) | (3,762 | ) | (3,826 | ) | ||||||||||
| Cash paid for non-vessel capital expenditures(1) |
(315 | ) | (415 | ) | (1,087 | ) | (1,328 | ) | (688 | ) | ||||||||||
| Cash paid for interest |
(14,556 | ) | (15,502 | ) | (32,970 | ) | (8,868 | ) | (8,467 | ) | ||||||||||
| Cash paid for income taxes |
(13,035 | ) | (1,136 | ) | (9,311 | ) | (474 | ) | (2,399 | ) | ||||||||||
|
|
|
|
|
|
|
|
|
|
|
|||||||||||
| Adjusted Free Cash Flow |
$ | 30,828 | $ | 75,566 | $ | 132,688 | $ | 171,284 | $ | 47,726 | ||||||||||
|
|
|
|
|
|
|
|
|
|
|
|||||||||||
91
| (1) | For additional information concerning these items, see “—Liquidity and Capital Resources—Capital Expenditures and Related Commitments.” |
Set forth below are the material limitations associated with using EBITDA, Adjusted EBITDA and Adjusted Free Cash Flow as non-GAAP financial measures compared to cash flows provided by operating activities:
| • | EBITDA, Adjusted EBITDA and Adjusted Free Cash Flow do not reflect the future capital expenditure requirements that may be necessary to replace our existing vessels upon expiration of their useful lives; |
| • | EBITDA, Adjusted EBITDA and Adjusted Free Cash Flow do not reflect the interest, future principal payments and other financing-related charges necessary to service the debt that we have incurred in acquiring and constructing our vessels; |
| • | EBITDA, Adjusted EBITDA and Adjusted Free Cash Flow do not reflect the deferred income taxes that we will eventually have to pay once we are no longer in an overall NOL carryforward position, as applicable; and |
| • | EBITDA, Adjusted EBITDA and Adjusted Free Cash Flow do not reflect changes in our net working capital position. |
Management compensates for the above-described limitations in using EBITDA, Adjusted EBITDA and Adjusted Free Cash Flow as non-GAAP financial measures by only using EBITDA, Adjusted EBITDA and Adjusted Free Cash Flow to supplement our GAAP results.
Liquidity and Capital Resources
Our capital requirements have historically been financed with cash flows from operations, proceeds from issuances of our debt and common equity securities, borrowings under our revolving and term loan agreements and cash received from the sale of assets. We require capital to fund on-going operations, remaining commitments under on-going vessel newbuild and conversion projects, vessel recertifications, discretionary capital expenditures and debt service and may require capital to fund potential future vessel construction, retrofit or conversion projects, acquisitions, dividends, equity repurchases or the retirement of debt. We believe that existing cash and cash equivalents and anticipated positive cash flows from operations will be sufficient to support working capital, maintenance, commercial and growth capital expenditures and other cash requirements for at least the next 12 months and, based on our current expectations, for the foreseeable future thereafter.
In August 2023, we elected to fully repay the $68.7 million then-outstanding principal balance of the Replacement First Lien Term Loans. As of June 30, 2024, we had $349.0 million of outstanding principal amount of Second Lien Term Loans that mature in March 2026, inclusive of accumulated paid-in-kind interest through June 30, 2024. Effective September 4, 2023, the Second Lien Term Loans contractually converted to full cash-pay obligations with an annual interest rate of 8.25% based on our prevailing Total Leverage Ratio, which was below 3.00 to 1.00.
As of August 14, 2024, we were in compliance with all applicable financial covenants under the First Lien Revolving Credit Facility. There were no revolving loan amounts outstanding under the First Lien Revolving Credit Facility as of such date and we expect such facility to remain undrawn for the foreseeable future. During the second quarter of 2024 and as of August 14, 2024, we were in compliance with all applicable financial covenants under our Second Lien Credit Agreement. We may voluntarily prepay, in whole or in part, any amount of the Second Lien Term Loans without penalty prior to maturity. As of June 30, 2024 and December 31, 2023, we had total cash and cash equivalents of $91.1 million and $120.1 million, respectively, and restricted cash of $0.8 million and $0.8 million, respectively.
Cash Flows for the Years Ended December 31, 2023, 2022, and 2021
The following summarizes our cash flows for the years ended December 31, 2023, 2022 and 2021.
92
Operating Activities. We rely primarily on cash flows from operations to provide working capital for current and future operations, to fund payroll and incentive compensation for our vessel crews and shoreside employees, to supply, repair and maintain our vessels, to service our debt obligations, to pay taxes and to insure our assets. Net cash provided by operating activities typically fluctuates according to the level of market activity and demand for our vessels for each period. Net cash provided by operating activities was $146.1 million, $113.0 million and $49.6 million for the years ended December 31, 2023, 2022 and 2021, respectively. Operating cash flows for the years ended December 31, 2023, 2022 and 2021 were favorably affected by improved market conditions for our vessels. The $33.1 million growth in net cash provided by operating activities in 2023 was primarily the result of a substantial increase in cash receipts from customers driven by a 30.2% increase in vessel revenues due to higher average dayrates and active fleet count for our OSVs and MPSVs, including the effects of recent vessel acquisitions.
Investing Activities. Net cash used in investing activities was $168.3 million, $109.2 million and $4.1 million for 2023, 2022 and 2021, respectively. Net cash used during 2023 and 2022 was primarily attributable to vessel acquisitions, partially offset by proceeds from vessel sales. Net cash used in investing activities in 2021 primarily consisted of capital improvements for active vessels, partially offset by proceeds from vessel sales.
Financing Activities. Net cash provided by (used in) financing activities was ($76.0) million, $32.9 million and $37.6 million for 2023, 2022 and 2021. Cash used in financing activities for 2023 was primarily attributable to the payoff of the remaining principal balance of the Replacement First Lien Term Loans in the third quarter of 2023. Net cash provided by financing activities for the year ended December 31, 2022 primarily resulted from the proceeds received from the delayed draw term loans that were funded under the Replacement First Lien Term Loans, partially offset by a partial repayment of the Replacement First Lien Term Loans. Net cash provided by financing activities for the year ended December 31, 2021 primarily resulted from proceeds received from the Replacement First Lien Term Loans and preemptive rights offering of equity, partially offset by the repayment of the exit first-lien term loans.
Cash Flows for the Six Months Ended June 30, 2024 and 2023
The following summarizes our cash flows for the six months ended June 30, 2024 and 2023.
Operating Activities. Net cash provided by operating activities was $26.7 million and $62.3 million for the six months ended June 30, 2024 and 2023, respectively. Operating cash flows for the first six months of 2024 were unfavorably affected by an increase in operating expense from newly acquired vessels and deferred drydocking charges from vessel recertifications.
Investing Activities. Net cash used in investing activities was $49.5 million and $44.0 million for the six months ended June 30, 2024 and 2023, respectively. Cash used during the first six months of 2024 was primarily attributable to the purchase of the final vessel delivered from ECO Acquisitions #2, costs related to the construction of the two MPSV newbuilds and maintenance capital improvements for active vessels.
Financing Activities. Net cash used in financing activities was $3.9 million and $7.0 million for the six months ended June 30, 2024 and 2023, respectively. Cash used in financing activities was primarily attributable to tax payments made by the Company for employee taxes related to shares withheld from vested and settled RSU awards.
93
Contractual Obligations
The following table and notes set forth our aggregate contractual obligations as of June 30, 2024 (in thousands):
| Total | Less than 1 Year |
1-3 Years | 3-5 Years | Thereafter | ||||||||||||||||
| Contractual Obligations |
||||||||||||||||||||
| MPSV newbuild program(1) |
$ | 48,549 | $ | 48,549 | $ | — | $ | — | $ | — | ||||||||||
| C/SOV + Flotel conversion(2) |
31,418 | 31,418 | — | — | — | |||||||||||||||
| Second Lien Term Loans(3) |
349,001 | — | 349,001 | — | — | |||||||||||||||
| Interest payments(4) |
51,267 | 29,193 | 22,074 | — | — | |||||||||||||||
| Non-cancellable leases |
38,275 | 7,775 | 7,940 | 6,865 | 15,695 | |||||||||||||||
|
|
|
|
|
|
|
|
|
|
|
|||||||||||
| Total |
$ | 518,510 | $ | 116,935 | $ | 379,015 | $ | 6,865 | $ | 15,695 | ||||||||||
|
|
|
|
|
|
|
|
|
|
|
|||||||||||
| (1) | Our MPSV newbuild program contractual obligations exclude the cost of expected cranes and ancillary equipment to be installed upon completion of the construction of the vessels by the shipyard, as we had not entered into any contractual commitments related to such costs as of June 30, 2024. The total project costs for the completion of the construction of the two MPSVs is currently expected to total $145.0 million upon completion, of which $6.1 million had been incurred as of June 30, 2024. Amounts exclude capitalized interest. |
| (2) | Our C/SOV + Flotel conversion contractual obligations include contractual milestone payments associated with the shipyard and certain purchases of owner-furnished equipment that were contracted as of June 30, 2024. The total project costs for the OSV-to-MPSV conversion is currently expected to total $77.7 million upon completion, of which $33.2 million had been incurred as of June 30, 2024. Amounts exclude capitalized interest. |
| (3) | Our Second Lien Term Loans mature on March 31, 2026 and include $76.4 million of accumulated paid-in-kind interest. |
| (4) | Effective September 4, 2023, the interest rate on the Second Lien Term Loans is variable based on our Total Leverage Ratio at each quarter-end. The amount reflected in this table is consistent with the current annual 8.25% fixed interest rate applicable to our Total Leverage Ratio as of June 30, 2024. Please see Note 8 to our consolidated financial statements for further discussion of the interest rate applicable to the Second Lien Term Loans. |
Contracted Backlog
Our total contracted backlog was $666.8 million as of July 31, 2024, which we calculate as the dayrates of contracted vessel days multiplied by the contracted days for such vessels. The contractual revenue we ultimately receive may be lower than the contracted backlog due to a number of factors, including vessel downtime or suspension of operations. The actual dayrate may be lower than the contractual operating dayrate assumed in the contracted backlog described above because a down-time (such as waiting on weather) rate, repair rate, standby rate or force majeure rate may apply under certain circumstances. In certain contracts, the dayrate may be reduced to zero if, for example, repairs extend beyond a stated period of time. Our total contracted backlog includes only firm commitments and certain contracted option periods, which are represented by signed contracts or, in some cases, other definitive agreements awaiting contract execution.
94
Debt Agreements
As of June 30, 2024, the Company had the following outstanding debt (in thousands, except effective interest rate):
| Total Debt(1) | Effective Interest Rate |
Cash Interest Payments(2) |
Payment Dates | |||||||||||||
| Second Lien Term Loans |
$ | 349,001 | 8.25 | % | $ | 7,278 | |
March 31, June 30, September 30, December 31 |
| |||||||
|
|
|
|||||||||||||||
| $ | 349,001 | |||||||||||||||
|
|
|
|||||||||||||||
| (1) | The outstanding principal balance on the Second Lien Term Loans includes accumulated paid-in-kind interest as of June 30, 2024. |
| (2) | Effective September 4, 2023, the interest rate on the Second Lien Term Loans is variable based on the Company’s Total Leverage Ratio at each quarter-end. The amount reflected in this table is consistent with the current annual 8.25% fixed interest rate applicable to the Company’s Total Leverage Ratio as of June 30, 2024. Please see Note 10 to our Annual Financial Statements and Note 8 to our Quarterly Financial Statements for further discussion of the interest rate applicable to the Second Lien Term Loans. |
First Lien Revolving Credit Facility
On August 13, 2024, we entered into a First Lien Revolving Credit Facility with DNB Bank ASA, New York Branch, as administrative agent, Wilmington Trust, National Association, as collateral agent, and the lenders party thereto. All capitalized terms in the description below not defined herein have the meaning assigned to them in such agreement. The current aggregate commitments for the Revolving Loans under the First Lien Revolving Credit Facility total $75 million, all of which remain undrawn. The First Lien Revolving Credit Facility also has a customary uncommitted incremental facility in an amount up to $50 million (or such greater amount as consented to by all lenders). Our ability to borrow under the First Lien Revolving Credit Facility is subject to customary conditions precedent, including no default or event of default, representations and warranties being true and correct in all material respects, and pro forma compliance with the financial covenants therein.
The First Lien Revolving Credit Facility will mature on the earlier of (i) the fifth anniversary of the Credit Agreement Closing Date or (ii) the date the Revolving Loans are declared due and payable following the occurrence and during the continuation of an event of default. Borrowings under the First Lien Revolving Credit Facility will be comprised of Base Rate Loans or SOFR Rate Loans, at the option of the Borrower, and accrue interest as follows: (A) for Revolving Loans that are Base Rate Loans, a rate ranging from 1.75% to 2.75% (depending on the total net leverage ratio in effect at such time) per annum, plus the greatest of, subject to a 0.00% floor: (a) the Prime Rate in effect on such day, (b) the Federal Funds Rate in effect on such day plus 0.50%, and (c) the Adjusted Term SOFR rate for a one month interest period on such day after giving effect to a floor of 0.00% per annum, plus 1.00% and (B) for Revolving Loans that are SOFR Rate Loans, a rate ranging from 2.75% to 3.75% (depending on the total net leverage ratio in effect at such time) per annum plus the Term SOFR rate, subject to a 0.00% floor, plus a credit spread adjustment of 0.10% per annum.
The First Lien Revolving Credit Facility has customary affirmative and negative covenants, including restrictions on our ability to incur additional indebtedness, incur liens, make restricted payments, make optional prepayments on junior financings, engage in transactions with affiliates and make asset sales, in each case, subject to customary exceptions and baskets. The First Lien Revolving Credit Facility is subject to financial covenants that require us to have (i) a maximum revolving credit facility net leverage ratio (measured by total loans outstanding under the First Lien Revolving Credit Facility, net of unrestricted cash and cash equivalents of up to $25.0 million) of no more than 1.00 to 1.00, (ii) minimum liquidity (measured by unrestricted cash and cash equivalents, together with undrawn commitments under the First Lien Revolving Credit Facility) of $25.0 million, (iii) a collateral
95
coverage ratio (measured by total first and second lien debt outstanding) of no less than 1.50 to 1.00 and (iv) a revolving credit facility collateral coverage ratio (measured by total debt outstanding under the First Lien Revolving Credit Facility, net of unrestricted cash and cash equivalents of up to $25.0 million) of no less than 3.00 to 1.00, in each case, tested on the Credit Agreement Closing Date, and thereafter at the end of each fiscal quarter, beginning with our first full fiscal quarter ending after the Credit Agreement Closing Date. However, failure to meet such financial covenants will not result in a default or event of default at any time when no Revolving Loans are outstanding and will instead prohibit us from borrowing any Revolving Loans under the First Lien Revolving Credit Facility until certain conditions precedent to borrowing are satisfied. Additionally, to the extent Revolving Loans are outstanding and the collateral coverage ratio or the revolving credit facility collateral coverage ratio financial covenants under the First Lien Revolving Credit Facility are not met as of the end of any fiscal quarter, we will be required to make a mandatory prepayment of the Revolving Loans in an amount such that compliance with such financial covenants would be met on a pro forma basis following such prepayment, and so long as such mandatory prepayment is made, no default or event of default will result from the breach of such financial covenants.
Second Lien Term Loans
On September 4, 2020, we entered into that certain Second Lien Credit Agreement. The initial aggregate principal amount of the initial term loans under the Second Lien Credit Agreement were $287,577,193.66.
The Second Lien Term Loans mature in March 2026 and the borrowings bear interest at a cash interest only rate or, until September 4, 2023, a cash interest plus paid-in-kind (“PIK”) rate, at the Company’s option, as follows:
| • | From September 4, 2020 and until September 4, 2022, at (i) a cash interest only rate of 9.25% per annum or (ii) a cash interest plus PIK rate, comprised of 1.00% per annum cash interest plus 9.50% per annum PIK interest; |
| • | From September 4, 2022 and until September 4, 2023, at (i) a cash interest only rate of 10.25% per annum or (ii) a cash interest plus PIK rate, comprised of 2.50% per annum cash interest plus 9.00% per annum PIK interest; and |
| • | From and after September 4, 2023, (i) if the total leverage ratio is greater than or equal to 3:00 to 1:00, then at a cash interest only rate of 10.25% per annum and (ii) if the total leverage ratio is less than 3:00 to 1:00, then at a cash interest only rate of 8.25% per annum. |
In the second quarter of 2023, we elected to stop accruing paid-in-kind interest and began cash paying the interest on the Second Lien Term Loans. Effective September 4, 2023, the Second Lien Term Loans contractually converted to full cash-pay obligations with an annual interest rate of 8.25% based on our prevailing Total Leverage Ratio, which was below 3.00 to 1.00.
As of June 30, 2024, we had $349.0 million in outstanding principal amount of Second Lien Term Loans (including accumulated PIK interest) under the Second Lien Credit Agreement. Total interest expense relating to the Second Lien Term Loans, including PIK interest, amortization and write off of debt issuance costs and unutilized commitment fees, net of capitalized interest, for the six months ended June 30, 2024 and the years ended December 31, 2023 and 2022 was $12.9 million, $26.6 million and $35.4 million, respectively.
96
Capital Expenditures and Related Commitments
The following table summarizes the costs incurred for the purposes set forth below for the six months ended June 30, 2024 and 2023, and for the years ended December 31, 2023, 2022 and 2021 (in thousands):
| Six Months Ended June 30, |
Year Ended December 31, | |||||||||||||||||||
| 2024 | 2023 | 2023 | 2022 | 2021 | ||||||||||||||||
| Capital Expenditures: |
||||||||||||||||||||
| Maintenance Capital Expenditures |
||||||||||||||||||||
| Deferred drydocking charges |
$ | 26,106 | $ | 15,416 | $ | 29,828 | $ | 19,114 | $ | 14,113 | ||||||||||
| Maintenance capital improvements |
9,969 | 3,782 | 7,745 | 3,758 | 3,826 | |||||||||||||||
|
|
|
|
|
|
|
|
|
|
|
|||||||||||
| 36,075 | 19,198 | 37,573 | 22,872 | 17,939 | ||||||||||||||||
|
|
|
|
|
|
|
|
|
|
|
|||||||||||
| Growth Capital Expenditures(1)(2) |
||||||||||||||||||||
| MPSV Newbuild Construction |
6,180 | — | — | — | — | |||||||||||||||
| ECO Acquisitions #1 |
412 | 14,450 | 27,869 | — | — | |||||||||||||||
| ECO Acquisitions #2 |
19,721 | 9,702 | 91,580 | 60,848 | — | |||||||||||||||
| MARAD acquisition |
— | 8,102 | 9,098 | 55,199 | — | |||||||||||||||
|
|
|
|
|
|
|
|
|
|
|
|||||||||||
| 26,313 | 32,254 | 128,547 | 116,047 | — | ||||||||||||||||
|
|
|
|
|
|
|
|
|
|
|
|||||||||||
| Commercial Capital Expenditures(2) |
||||||||||||||||||||
| C/SOV + Flotel Conversion |
11,032 | 1,922 | 23,737 | 577 | — | |||||||||||||||
| Other Commercial Capex |
1,891 | 8,355 | 10,127 | 10,372 | 2,755 | |||||||||||||||
|
|
|
|
|
|
|
|
|
|
|
|||||||||||
| 12,923 | 10,277 | 33,864 | 10,949 | 2,755 | ||||||||||||||||
|
|
|
|
|
|
|
|
|
|
|
|||||||||||
| Non-vessel Capital Expenditures |
315 | 415 | 1,087 | 1,328 | 688 | |||||||||||||||
|
|
|
|
|
|
|
|
|
|
|
|||||||||||
| Total |
$ | 75,626 | $ | 62,144 | $ | 201,071 | $ | 151,196 | $ | 21,382 | ||||||||||
|
|
|
|
|
|
|
|
|
|
|
|||||||||||
| (1) | Includes the purchase price of constructed or acquired vessels, plus the costs incurred to place such vessels into active service, as necessary. |
| (2) | Amounts include associated capitalized interest, as applicable. |
Growth Capital Expenditures
Growth capital expenditures are expenditures undertaken by the Company to expand our fleet of vessels through acquisition or newbuild construction. Growth capital expenditures typically include the purchase price of acquired vessels, as well as the costs incurred to ready such vessels for active service, and the construction costs of newbuild vessels, inclusive of capitalized interest.
MPSV Newbuild Construction
In October 2023, we entered into a final settlement of a dispute with the Surety and Gulf Island related to the construction of two MPSV newbuilds. Pursuant to the settlement agreement, Gulf Island released all claims asserted against us and we released our claims against Gulf Island and the Surety. Further, the Surety agreed to take over and complete the construction of the two U.S.-flagged, Jones Act-qualified, HOS 400 class MPSVs at a shipyard acceptable to us. In December 2023, Eastern was mutually selected by the parties and was contracted by the Surety to complete construction of the two MPSVs. We are obligated to pay only the remaining portion of the original shipyard contract price for the two MPSVs, which amounted to $53.8 million in the aggregate on the settlement date. The Surety is required to cure all defaults of Gulf Island and pay all completion costs in excess of the $53.8 million remaining original contract price, excluding any approved change orders arising after the settlement date. There is no cap on the Surety’s completion cost. As of June 30, 2024, we had paid $5.3 million to Eastern related to the completion of these two MPSVs.
97
Pursuant to the settlement, the Surety is contractually required to deliver both MPSVs in 2025. We were provided an updated schedule by the Surety and Eastern indicating that they currently expect a six-month shipyard delay for the delivery of the first of the two MPSVs. An updated delivery schedule has not yet been provided for the second vessel. Following physical delivery by the shipyard, we expect each vessel to undergo crane and other system installations, which we expect will make the first vessel available for commercial service in the first half of 2026, and the second vessel thereafter. In addition to the remaining $48.5 million of the original contract price as of June 30, 2024, we expect to incur an incremental $91.2 million in the aggregate for outfitting, overhead and the post-delivery discretionary enhancements, of which $63.6 million solely relates to the purchase and installation of cranes on both vessels. As of June 30, 2024, we had incurred $0.8 million of such incremental amounts, excluding capitalized interest. Once placed in service, we expect that our book carrying value for each vessel will be approximately $80.0 million, which is significantly below the expected market value of Jones Act-qualified vessels of this age, type, size and specifications.
ECO Acquisitions #1
On January 10, 2022, the Company entered into definitive vessel purchase agreements with certain affiliates of ECO to acquire up to ten high-spec, 280 class DP-2 OSVs for an aggregate price of $130.0 million. In November 2022, ECO exercised an option to terminate the vessel purchase agreements relating to the last four vessels. ECO refunded initial deposits of $1.5 million in the aggregate and paid an additional amount equal to such deposits as a termination fee. After accounting for such terminations and certain purchase price adjustments, the aggregate purchase price for the ECO Acquisitions #1 was $82.4 million. Pursuant to the purchase agreements, final payment and the transfer of ownership of each of the vessels occurred on the date of delivery and acceptance for such vessel following the completion of reactivation and regulatory drydockings by ECO. The Company took delivery of the six vessels between May 2022 and August 2023.
As of June 30, 2024, the Company had paid $82.2 million for the original purchase price and $1.7 million in purchase price adjustments associated with discretionary enhancements of the ECO Acquisitions #1 vessels, prior to the effect of the $1.5 million termination fee paid by ECO. In addition, the Company had incurred $3.9 million of costs associated with additional outfitting of the six vessels through the second quarter of 2024. The Company expects to incur an additional $0.1 million related to post-closing modifications of the sixth vessel during the remainder of 2024.
ECO Acquisitions #2
On December 22, 2022, the Company executed a controlling purchase agreement with Nautical. Pursuant to the controlling purchase agreement, the Company subsequently entered into separate, individual vessel purchase agreements to acquire six high-spec OSVs from Nautical for $17.0 million per vessel. The Nautical vessels are U.S.-flagged, Jones Act-qualified, 280 class DP-2 OSVs with cargo-carrying capacities of circa 4,750 DWT. Nautical completed regulatory drydocking and reactivation activities for each vessel prior to closing. Payment of 10% of the purchase price for each vessel was made upon arrival of such vessel to the shipyard and the remaining 90% was paid at the closing and delivery of each vessel. We took delivery of the first five vessels during 2023.
In January 2024, the Company took delivery of the sixth and final vessel under ECO Acquisitions #2 and paid $15.3 million for the remaining 90% of the original purchase price and $0.1 million for purchase price adjustments related to discretionary enhancements completed in the shipyard by Nautical. As of June 30, 2024, the Company had paid an aggregate of $102.0 million for the original purchase price, including deposits, and $10.6 million in purchase price adjustments associated with discretionary enhancements, additional outfitting, and post-closing modifications for the ECO Acquisitions #2 vessels. The Company expects to incur an incremental $0.1 million related to additional outfitting, discretionary enhancements and post-closing modifications for certain of these vessels during the remainder of 2024.
98
MARAD Acquisition
On February 4, 2022, the Company completed the acquisition of three high-spec new generation OSVs from the U.S. Department of Transportation’s Maritime Administration, or “MARAD”, for an aggregate price of $37.2 million. All three vessels are U.S.-flagged, Jones Act-qualified, 280 class DP-2 OSVs with cargo-carrying capacities of circa 4,500 DWT. Following the physical delivery of the vessels from MARAD, the Company incurred approximately $27.3 million for the reactivation and regulatory drydockings of all three vessels. In September 2022, the Company placed two of these vessels into service for immediate time charters in the U.S. GoM. The third OSV is currently undergoing conversion into a MPSV, as further discussed below under “Commercial Capital Expenditures—C/SOV + Flotel Conversion.”
Maintenance Capital Expenditures
Maintenance capital expenditures consist of deferred drydocking charges, which are capitalized to Deferred Charges on the consolidated balance sheet, and maintenance capital improvements, which are capitalized to Property, Plant and Equipment on the consolidated balance sheet.
Our vessels are required by regulation to be recertified after certain periods of time. These recertification costs are incurred while the vessel is in drydock where other routine repairs and maintenance are performed and, at times, major replacements and improvements are performed. We expense routine repairs and maintenance as they are incurred. We elect to defer and amortize recertification costs, or deferred drydocking charges, over the length of time that the recertification is expected to last, which is generally 24 to 36 months on average. Deferred drydocking charges vary year-to-year depending on the number of vessels with expiring certifications in a given year. We completed 18, 16 and 14 recertification drydockings in 2023, 2022 and 2021, respectively, and have completed 12 recertification drydockings through the six months ended June 30, 2024. We expect to complete 12 additional drydockings by December 31, 2024.
Maintenance capital improvements include major replacements of or improvements to vessel systems, structures and equipment to enhance operability or extend the vessel’s useful life. The costs of such improvements are typically capitalized and depreciated over the vessel’s remaining useful life. Variability in maintenance capital improvements year-to-year is primarily driven by the number of required recertification drydockings in a given year as the Company utilizes the downtime during the planned shipyard event as an opportunity to complete the discretionary vessel improvements.
Commercial Capital Expenditures
Commercial capital expenditures represent vessel-related expenditures incurred to retrofit, convert or modify a vessel’s systems, structures or equipment to enhance functional capabilities and improve marketability or to meet certain commercial requirements. Examples of commercial capital expenditures include the addition of cranes, ROVs, helidecks, living quarters, and other specialized vessel equipment. Recovery of the related costs are typically included in and offset, in whole or in part, by higher dayrates charged to customers in a lump sum payment or over time. Commercial capital expenditures for improvements that are intended to be permanent to the vessel are typically capitalized and depreciated over the vessel’s remaining useful life. Modifications or improvements of a temporary nature that are completed for a specific commercial contract are deferred as a direct contract cost and amortized over the term of such contract.
C/SOV + Flotel Conversion
In July 2023, the Company announced that it had contracted Eastern to convert one of its U.S.-flagged, Jones Act-qualified, HOSMAX 280 class DP-2 OSVs acquired from MARAD into a MPSV for dual-service as either a C/SOV or flotel to meet the growing demand of the U.S. offshore wind and oilfield markets. The Company has incurred $33.2 million, excluding capitalized interest, through June 30, 2024 and expects to spend an additional $44.5 million for such vessel conversion, including owner-furnished equipment, outfitting, engineering and overhead costs. We currently expect the conversion to be completed by mid-year 2025.
99
Non-Vessel Capital Expenditures
Non-vessel capital expenditures primarily relate to fixed asset additions or improvements related to our port facility, office locations, information technology, non-vessel property, plant and equipment or other shoreside support initiatives.
Critical Accounting Estimates
Our Financial Statements have been prepared in accordance with accounting principles generally accepted in the United States. In many cases, the accounting treatment of a particular transaction is specifically dictated by GAAP. In other circumstances, we are required to make estimates, judgments and assumptions that we believe are reasonable based upon available information. We base our estimates and judgments on historical experience and various other factors that we believe are reasonable based upon the information available. Actual results may differ from these estimates under different assumptions and conditions. We believe the following significant accounting policies, discussed further in the notes to our consolidated Financial Statements, involve estimates that are inherently more subjective.
Revenue Recognition. The services that are provided by the Company represent a single performance obligation under its contracts that are satisfied at a point in time or over time. Revenues are earned primarily by (1) chartering the Company’s vessels, including the operation of such vessels, (2) providing vessel management services to third party vessel owners, and (3) providing shore-based port facility services, including rental of land. Revenues associated with performance obligations satisfied over time are recognized on a daily basis throughout the contract period.
Typically, our application of ASC 606, Revenue from Contracts with Customers does not require significant judgment as the vast majority of our contracts provide a specific daily rate as the transaction price for each day of service provided for our customers’ benefit. Occasionally, we are required to apply judgment in the determination and allocation of the transaction price over the performance period of our vessel charters in circumstances when the contract contains multiple daily rates or includes a lump-sum payment from the customer for certain activities such as vessel mobilizations, demobilizations or modifications. Should our judgments and estimates regarding the transaction price, representing the amount of consideration to which we expect to be entitled for services transferred to the customer, and the performance period, representing the period over which our performance obligation will be satisfied, change during the term of a contract, it could have a material effect on our results of operations for the applicable periods. The Company has not incurred a material adjustment to revenues as a result of changes in its estimates and assumptions associated with customer contracts during the six months ended June 30, 2024 or during the years ended December 31, 2023, 2022 or 2021. Please see further discussion regarding revenues generated from contracts with customers in Note 4 to our Annual Financial Statements and our Quarterly Financial Statements, respectively.
Allowance for Doubtful Accounts. Our customers are primarily major and independent, domestic and international, oil and gas and oilfield service companies and national oil companies. Our customers are granted credit on a short-term basis and related credit risks are considered minimal. We usually do not require collateral. We provide an estimate for uncollectible accounts based primarily on management’s judgment. Management uses the relative age of receivable balances, historical losses, current economic conditions and individual evaluations of each customer to make adjustments to the allowance for doubtful accounts. Our historical losses have not been significant. However, because amounts due from individual customers can be significant, future adjustments to the allowance can be material if one or more individual customer’s balances are deemed uncollectible.
Liability-Classified Warrants. Common stock warrants are accounted for as either equity instruments or liabilities depending on the specific terms of the applicable warrant agreement. The Company’s outstanding Creditor Warrants are currently classified as liabilities pursuant to ASC 815, Derivatives and Hedging. Warrants that are classified as liabilities are recorded at their estimated fair value on a recurring basis at each balance sheet date. To estimate the fair value of the Creditor Warrants, the Company, assisted by third-party valuation advisors,
100
uses a Black-Scholes model, which utilizes the following input assumptions at the applicable valuation date: (i) the current estimated fair value of the underlying common stock based on a controlling interest equity valuation, (ii) the exercise price, (iii) the contractual expiry term, (iv) an estimated equity volatility based on the historical asset and equity volatilities of comparable publicly traded companies, (v) a term-matched risk-free rate based on the U.S. Treasury separate trading of registered interest and principal securities (STRIPS) yield, and (vi) an expected dividend yield. The Company’s third-party valuation advisors estimate the fair value of the underlying common stock using the income approach and the market approach with each equally weighted. The income approach involves the use of various judgmental assumptions including the use of prospective financial information, the weighted average cost of capital and an exit multiple. The fair value of the Creditor Warrants falls within Level 3 of the hierarchy as there is currently no active trading market and certain inputs of the Black-Scholes model are not observable or corroborated by available market data. Based on the lack of trading history of our privately-held equity, the Company currently considers the estimated fair value of its common stock to be the most critical assumption in the determination of the fair value of the Creditor Warrants. As of June 30, 2024 and December 31, 2023, every one-dollar change in the estimated fair value per share of the underlying common stock would have an approximate $1.5 million impact on the estimated fair value of the Creditor Warrants.
Changes in the estimated fair value of our liability-classified warrants are recognized as a non-cash gain or loss on the consolidated statements of operations. All outstanding warrants are reassessed each reporting period to determine whether their classification continues to be appropriate. Please see further discussion of the inputs and assumptions related to the fair value estimates of our liability-classified warrants in Note 11 to our Annual Financial Statements and Note 9 to our Quarterly Financial Statements.
Stock-Based Compensation Expense. Stock-based compensation awards are accounted for in accordance with ASC 718, Compensation – Stock Compensation, which requires all share-based payments to the Company’s employees and directors to be recognized in the consolidated financial statements based on their fair values on the grant date. The fair value of the underlying common stock is based upon a valuation of the Company’s equity developed with the assistance of third-party valuation experts using a combination of income and market approaches as of the appropriate measurement date. The Company recognizes compensation expense on a straight-line basis over the expected vesting period of stock-based awards that are ultimately expected to vest based on their estimated fair value on the grant date. Forfeitures are recognized during the period in which they actually occur. Please see further discussion regarding our stock-based compensation in Note 13 to our Annual Financial Statements and Note 10 to our Quarterly Financial Statements.
Income Taxes. We follow accounting standards for income taxes that require the use of the liability method of computing deferred income taxes. Under this method, deferred income taxes are provided for the temporary differences between the financial reporting basis and the tax basis of our assets and liabilities. Deferred tax assets and liabilities are measured using enacted tax rates expected to apply to taxable income in the years in which those temporary differences are expected to be recovered or settled. The assessment of the realization of deferred tax assets, particularly those related to NOL carryforwards and foreign tax credit, or FTC, carryforwards, is based on the weight of all available evidence, both positive and negative, including future reversals of deferred tax liabilities. Due to a cumulative three-year book loss, ASC 740 precluded us from using projected operating results in determining the realization of deferred tax assets. We are using the existing taxable temporary differences that will reverse and create taxable income in the future to determine the realizability of these NOL and FTC carryforwards. We have valuation allowances of $254.8 million and $246.4 million recorded against our deferred tax assets as of December 31, 2023 and 2022, respectively. Such valuation allowances were established because we determined that it was more likely than not such NOL and FTC carryforwards may not be fully utilized prior to their expiration. In addition, each reporting period, we assess and adjust for any significant changes to our liability for unrecognized income tax benefits. We account for any interest and penalties relating to uncertain tax positions in interest expense and G&A expense, respectively. We have made an accounting policy election to account for global intangible low-taxed income, or GILTI, in the year the tax is incurred. Please see further discussion regarding income taxes in Note 14 to our Annual Financial Statements and Note 11 to our Quarterly Financial Statements.
101
Legal Contingencies. We are involved in a variety of claims, lawsuits, investigations and proceedings, as described in Note 16 to our Annual Financial Statements. We determine whether an estimated loss from a contingency should be accrued by assessing whether a loss is deemed probable and can be reasonably estimated. We assess our potential liability by analyzing our litigation and regulatory matters using available information. We develop our views on estimated losses in consultation with outside counsel handling our defense in these matters, which involves an analysis of potential results, assuming a combination of litigation and settlement strategies. Should developments in any of these matters cause a change in our determination such that we expect an unfavorable outcome and result in the need to recognize a material accrual, or should any of these matters result in a final adverse judgment or be settled for a significant amount, they could have a material adverse effect on our results of operations in the period or periods in which such change in determination, judgment or settlement occurs.
Recertification Costs. Our vessels are required by regulation to be recertified after certain periods of time. These recertification costs are incurred while the vessel is in drydock where other routine repairs and maintenance are performed and, at times, major replacements and improvements are performed. We expense routine repairs and maintenance as they are incurred. Recertification costs can be accounted for under GAAP in one of two ways: (1) defer and amortize or (2) expense as incurred. We defer and amortize recertification costs over the length of time that the recertification is expected to last, which is generally 24 to 36 months on average. Major replacements and improvements, which extend the vessel’s useful life or increase its functional operating capability, are capitalized and depreciated over the vessel’s remaining useful life. Inherent in this process are judgments we make regarding whether the specific cost incurred is capitalizable and the period that the incurred cost will benefit. In 2023, 2022 and 2021, we incurred deferred drydocking costs totaling $29.8 million, $19.1 million and $14.1 million, respectively. For the six months ended June 30, 2024, we incurred $26.1 million in deferred drydocking costs. A change in policy from defer and amortize to expense as incurred could materially impact our results of operations in future periods.
Quantitative and Qualitative Disclosures About Market Risk
Market risk refers to the potential losses arising from changes in interest rates, foreign currency fluctuations and exchange rates, equity prices and commodity prices including the correlation among these factors and their volatility. We are primarily exposed to interest rate risk and foreign currency fluctuations and exchange risk.
Interest Rate Risk
Our Second Lien Term Loans currently bear interest at a fixed annual interest rate of 8.25% based on the Company’s Total Leverage Ratio pursuant to the Second Lien Credit Agreement, which annual interest rate will become 10.25% if the Company’s Total Leverage Ratio becomes greater than or equal to 3:00 to 1:00. Borrowings under the First Lien Revolving Credit Facility will be comprised of Base Rate Loans or SOFR Rate Loans (each as defined in the First Lien Credit Agreement), at the option of the Company, and accrue interest as follows: (A) for Revolving Loans that are Base Rate Loans, a rate ranging from 1.75% to 2.75% (depending on the total net leverage ratio in effect at such time) per annum, plus the greatest of, subject to a 0.00% floor: (a) the Prime Rate (as defined in the First Lien Credit Agreement) in effect on such day, (b) the Federal Funds Rate (as defined in the First Lien Credit Agreement) in effect on such day plus 0.50%, and (c) the Adjusted Term SOFR (as defined in the First Lien Credit Agreement) rate for a one month interest period on such day after giving effect to a floor of 0.00% per annum, plus 1.00% and (B) for Revolving Loans that are SOFR Rate Loans, a rate ranging from 2.75% to 3.75% (depending on the total net leverage ratio in effect at such time) per annum plus the Term SOFR (as defined in the First Lien Credit Agreement) rate, subject to a 0.00% floor, plus a credit spread adjustment of 0.10% per annum. Accordingly, changes in market interest rates may have a material impact on our results of operations and cash flows. See “—Liquidity and Capital Resources—Debt Agreements” above.
102
Foreign Exchange Risk
Our financial instruments that can be affected by foreign currency exchange rate fluctuations consist primarily of cash and cash equivalents, trade receivables, trade payables and intercompany debt denominated in currencies other than the U.S. dollar or the functional currency of certain of the Company’s consolidated subsidiaries. We may in the future enter into spot and forward derivative financial instruments as a hedge against foreign currency denominated assets and liabilities, currency commitments, or to lock in desired interest rates. Spot derivative financial instruments are short-term in nature and settle within two business days. The fair value of spot derivatives approximates the carrying value due to the short-term nature of these instruments, and as a result, no gains or losses are recognized. The accounting for gains or losses on forward contracts is dependent on the nature of the risk being hedged and the effectiveness of the hedge. We had no spot or forward derivative financial instruments as of June 30, 2024 or December 31, 2023.
Other
Due to our international operations, we are exposed to foreign currency exchange rate fluctuations and exchange rate risks on all charter hire contracts denominated in foreign currencies. For some of our international contracts, a portion of the revenue and local expenses may be incurred in local currencies with the result that we are at risk of changes in the exchange rates between the U.S. dollar and foreign currencies. We generally do not hedge against any foreign currency rate fluctuations associated with foreign currency contracts that arise in the normal course of business, which exposes us to the risk of exchange rate losses. To minimize the financial impact of these items we attempt to contract a significant majority of our services in U.S. dollars. In addition, we attempt to minimize the financial impact of these risks by matching the currency of our operating costs with the currency of the revenue streams when considered appropriate. We continually monitor the currency exchange risks associated with all contracts not denominated in U.S. dollars.
103
Company Overview
Hornbeck is a leading provider of marine transportation services to customers in the offshore oilfield market and diversified non-oilfield markets, including military support services, renewable energy development and other non-oilfield service offerings. Since our founding more than 27 years ago, we have focused on providing innovative, technologically advanced marine solutions to meet the evolving needs of our customers across our core geographic regions covering the United States and Latin America. Our team brings substantial industry expertise built through decades of experience and has leveraged that knowledge to amass what we believe is one of the largest, highest specification fleets of OSVs and MPSVs in the industry. Approximately 75% of our total fleet consists of high-spec or ultra high-spec vessels, and we believe we have the number one ultra high-spec market position in the U.S., and the third largest fleet of high-spec and ultra high-spec OSVs in the world, measured by DWT capacity. We own a fleet of 75 multi-class OSVs and MPSVs, 58 of which are U.S. Jones Act-qualified vessels. Our Jones Act-qualified high-spec and ultra high-spec OSVs account for approximately 26% of the total industry supply of such vessels. We opportunistically expand our fleet within existing and/or into new, high-growth, cabotage-protected markets from time to time to enhance our fleet offerings to customers. Our mission is to be recognized as the energy industry’s marine transportation and service Company of Choice® for our customers, employees and investors through innovative, high-quality, value-added business solutions delivered with enthusiasm, integrity and professionalism with the utmost regard for the safety of individuals and the protection of the environment.
Our fleet of 60 OSVs primarily provides transportation of equipment, materials and supplies to offshore drilling rigs, production platforms, subsea construction projects and other non-oilfield applications. Increasingly, given their versatility, our OSVs are being deployed in a variety of non-oilfield applications including military support services, renewable energy development for offshore wind, humanitarian aid and disaster relief, aerospace and telecommunications. Our OSVs differ from other marine service vessels in that they provide increased cargo-carrying flexibility and capacity that can transport large quantities of deck cargoes as well as various liquid and dry bulk cargoes in below-deck tanks providing flexibility for a variety of jobs. Moreover, our OSVs are outfitted with advanced technologies, including DP capabilities, which allows each vessel to safely interface with another offshore vessel, exploration and production facility or an offshore asset by maintaining an absolute or relative station-keeping position when performing its work at sea.
Our fleet of 15 MPSVs provides commissioning and decommissioning support services, asset construction capabilities, recurring inspection, repair and maintenance services and flotel accommodations. Such vessels primarily serve the oil and gas market, with capabilities including the installation of subsea and top-side oilfield infrastructure necessary in the modern deepwater and ultra-deepwater oilfields. Further, these vessels are capable of supporting a variety of other non-oilfield offshore infrastructure projects, including the development of offshore windfarms, by providing the equipment and capabilities to support the installation and maintenance of wind turbines and platforms. Because of our ability to serve a diverse set of end markets, MPSV operations are typically less directly linked with the number of active drilling rigs in operation and therefore can be less cyclical. Our high- and ultra high-spec OSVs can be contracted alongside our MPSVs on major projects, providing operating efficiencies and pull-through revenue. Most of our MPSVs have one or more deepwater or ultra-deepwater cranes fitted on the deck, deploy one or more ROVs to support subsea work, and have an installed helideck to facilitate the on-/off-boarding of specialist service providers and personnel. MPSVs can also be outfitted as flotels to provide accommodations, offices, catering, laundry, medical, and recreational facilities to large numbers of offshore workers for the duration of a project. When configured as flotels, our MPSVs have capacities to house up to 245 workers for major installation, maintenance and overhaul projects. Included in our total MPSV fleet count are the two HOS 400 class MPSVs that are currently under construction and one of our U.S.-flagged, HOSMAX 280 class OSVs that is currently undergoing conversion into a MPSV for dual-service as either a C/SOV or flotel. Based on overall length and total lifting capacity, the two HOS 400 class MPSVs are expected to be the largest Jones Act-qualified MPSVs in the market and will have additional capabilities due to their size and sophistication. In addition to the services performed by our existing fleet of MPSVs, the two newbuild vessels will be equipped with systems that we expect will make them suitable for complex services, including light well intervention, that require larger or more versatile vessels than the fleet of MPSVs currently available in the U.S. market. Once converted our C/SOV + Flotel MPSV will be capable of providing services to the U.S. offshore wind market both during the commissioning phase of an offshore wind farm and during its operational
104
life. We expect the converted MPSV to be placed into active service as either a C/SOV or flotel in 2025, while the two newbuild MPSVs are now expected to be placed into active service in 2026 or possibly thereafter.
Our ability to reconfigure or modify vessels in our fleet to meet evolving industry demands and the needs of our customers differentiates our success across maritime markets. This enables us to reconfigure stacked OSVs to service oilfield and non-oilfield service customers. As offshore activities expand in scope and become increasingly more complex, the demand for high specification, fit-for-purpose equipment and service capabilities has accelerated, creating disproportionate competitive advantages for companies able to adapt vessels and service offerings quickly to respond to changing customer needs.
With an average of over 37 years of experience in the marine transportation and service industry and having worked together at Hornbeck for over 20 years, our senior management team has the depth of experience necessary to successfully compete in the offshore vessel business. We have confidence that both our team and our strategy have been organized in a manner that best positions our Company to effectively execute in this dynamic and demanding operating environment.
Hornbeck owns and operates what we believe is one of the highest specification, most technologically advanced fleets of OSVs and MPSVs in the industry. Our fleet of 75 vessels primarily operates across our core geographic markets of the United States and Latin America. We predominantly serve our oilfield customers in the GoM, the Caribbean, Northern South America and Brazil, while our vessels primarily serve our non-oilfield customers from the East and West Coasts of the United States and in the U.S. GoM. We operate our Mexican-flagged vessels across the Caribbean and Northern South America when not operated in Mexico, as well as in other international markets, utilizing a highly-skilled workforce of Mexican mariners and shore-side support team that have been trained in our safety systems and culture. A map illustrating our active vessel locations as of July 31, 2024 is below:
105
Our Competitive Strengths
Leading presence in the United States and Latin America
Hornbeck was established in 1997 and has one of the most capable and high-spec fleets of vessels in the industry. Based on publicly-available information compiled by the Company and data provided by Spinergie, we believe that our fleet of 41 high-spec and ultra high-spec OSVs, totaling 217,140 in DWT capacity, represents 6.6% of the 3,290,183 total DWT of such vessels in the world, making Hornbeck the third largest fleet out of 163 companies that own and operate high-spec or ultra high-spec OSVs worldwide. Furthermore, we believe that our fleet of 15 U.S.-flagged ultra high-spec OSVs, totaling 91,123 in DWT capacity, represents the largest fleet of such vessels operating in the United States measured by DWT capacity. Additionally, we are one of the top operators of OSVs, based on DWT, in each of our two core geographic markets, which include 2,459,593 DWT and constitute 41.7% of the total supply of 5,847,658 DWT to such markets. Our 46 U.S.-flagged OSVs, totaling 206,767 in DWT capacity, comprise the second largest fleet of technologically advanced, OSVs qualified for work in the U.S. GoM under the Jones Act. As of July 31, 2024, our active fleet of OSVs and MPSVs consisted of (i) 20 U.S.-flagged OSVs and seven MPSVs in the U.S. GoM, (ii) five OSVs and one MPSV throughout the U.S. Atlantic, (iii) one OSV and three MPSVs in the U.S. Pacific, (iv) seven OSVs offshore Brazil, (v) one OSV offshore Argentina, (vi) four OSVs in the Caribbean and Northern South America and (vii) one OSV and one MPSV offshore Mexico. We believe that having scale in our core markets with the flexibility to transfer vessels among regions benefits our customers and provides us with operating efficiencies.
Large and diverse fleet of technologically advanced high-spec and ultra high-spec vessels
Over the past 27 years, we have assembled a multi-class fleet of 60 OSVs and 15 MPSVs. Since 2014, we have focused on expanding our line of high-spec and ultra high-spec vessels, increasing our fleet of such vessels from 41% of our fleet in 2014 to 75% of our fleet in 2024. High-spec and ultra high-spec vessels incorporate sophisticated technologies that are designed specifically to operate safely in complex and challenging environments and are equipped with specialty equipment and other features to respond to the needs of our customers through the project development and operation lifecycle of an offshore oilfield. These technologies include DP, roll reduction systems and controllable pitch thrusters, which allow our vessels to maintain a fixed position with minimal variance. Our cargo-handling systems permit high-volume transfer rates of liquid mud and dry bulk materials. In addition, we are able to outfit our vessels with specialty equipment and certain features as needed for specific projects. The greater fuel efficiency, larger cargo-carrying capacity, advanced mud-handling systems and other technical features of our high-spec and ultra high-spec vessels enhance offshore project efficiency and create a compelling value proposition for our customers. As a result of our fleet mix, in-house engineering capabilities, operations history and market strategies, we believe that we earn higher average dayrates compared to our competitors. According to industry data from Fearnley Offshore Supply, our average dayrates were 87%, 41%, and 16% higher than the global average term rates of comparably sized vessels owned by other operators in 2022, 2023, and the six months ended June 30, 2024, respectively.
Strong market position due to qualification under the Jones Act and favorable sector tailwinds
As a leader in marine transportation services to the offshore oilfield industry, we believe Hornbeck is well-positioned to capitalize on favorable industry conditions for significant growth opportunities, particularly in offshore wind development and support services to the U.S. military on the East and West Coasts of the United States. The United States has strict cabotage laws that provide insulation from most sources of foreign competition for our U.S. fleet for coastwise services. In addition, the U.S. high-spec and ultra high-spec vessel supply is highly restricted with long lead times for new construction. High newbuild costs result in unfavorable return economics for newbuilds, which is exacerbated by limited pools of available capital to make investments into new fleet construction. We believe our reputation for high-quality, safe and reliable operations, complex problem solving, operational flexibility, and world-class vessels allows Hornbeck to compete effectively for and retain qualified mariners, which positions Hornbeck for long-term sustainable growth in a tight labor market. In addition, our robust offering of services, ranging from initial construction to decommissioning, has allowed us to compete effectively and remain a trusted service provider for active offshore companies, as well as the U.S. military.
106
Successful track record of strategic vessel acquisitions
We have built our fleet through a combination of newbuilds and strategic acquisitions from other operators. Our management team’s extensive naval architecture, marine engineering and shipyard experience has enabled us to quickly integrate newly acquired vessels into our fleet and retrofit them to meet our quality standards and customer needs cost-effectively. From time to time, we consider opportunistic acquisitions of single vessels, vessel fleets, and businesses that strategically complement our existing operations to enable us to grow our business and better serve our customers. Since 2017, we have successfully completed the acquisition of 19 OSVs, 18 of which are currently operating as part of our high-spec and ultra high-spec fleet and one of which is currently undergoing conversion into a MPSV for dual-service as either a C/SOV or flotel.
Diversified service offerings and customer markets provide stability to cash flows
We have well-established relationships with leading oilfield and non-oilfield companies and the U.S. government and believe such relationships are in part maintained because of our diversified service offerings in the oilfield and non-oilfield customer markets. Our diversified service offerings allow us to pivot based on our customers’ needs and gives our customers confidence to commit to longer-term contracts for our services, which provides us with cash flow stability. Additionally, these large, integrated customers are financially stable and can better withstand economic or market downturns in a volatile market, and we believe maintaining relationships with these customers will ultimately result in better visibility to vessel utilization and greater liquidity for us in the future.
Experienced management team with proven track record
Our founder-led executive management team has an average of over 37 years of domestic and international marine transportation industry-related experience and has worked together at the Company for over 20 years. Our team is comprised of individuals with extensive, global experience with backgrounds across many diverse fields including engineering, project management, military service, finance, accounting, legal, risk management and corporate leadership. We believe that our team has successfully demonstrated its ability to grow our fleet through new construction and strategic acquisitions and to secure profitable contracts for our vessels in both favorable and unfavorable market conditions in domestic and foreign markets.
Attractive growth opportunities
Our fleet of technologically advanced high-spec and ultra high-spec vessels is increasingly being deployed to serve the accelerating needs of the U.S. Military, renewable energy, and aerospace industries. Many of these high-growth markets require U.S.-flagged Jones Act-qualified vessels, which can be custom tailored to address a broad spectrum of services. For these applications, our vessels are typically contracted for greater than three years, providing a counter-balance to cyclicality experienced in our oilfield end-markets.
Our Strategy
Leverage our geographic presence in the United States and Latin America and grow industry leading service capabilities
We have strategically chosen to focus our efforts in two core geographic markets, the United States and Latin America. While the U.S. GoM will continue to be a priority for us, in recent years we expanded our presence in each of the Mexico GoM, the East and West Coasts of the United States, the Caribbean, Northern South America and Brazil, as we anticipate long-term growth in those markets. Given the relative proximity of these markets, we are able to readily move our vessels among them and retain flexibility to relocate those vessels back to the U.S. GoM or into adjacent locations across our operating regions. We believe this allows us to conduct a more thorough on-going alternative analysis for vessel deployments among such markets and, thus, better manage our portfolio of contracts to enhance dayrates and utilization over time as contracting opportunities arise. Our Jones Act-qualified high-spec and ultra high-spec OSVs account for approximately 26% of the total
107
industry supply of such vessels. Our vessels have been adapted to operate in a range of oilfield specialty configurations, including flotel services, extended-reach well testing, seismic, deepwater and ultra-deepwater well stimulation, other enhanced oil recovery activities, high pressure pumping, deep-well mooring, ROV support, subsea construction, installation, IRM work and decommissioning services. We are also growing our diverse non-oilfield specialty services, such as military applications, offshore wind farms, oceanographic research, telecommunications, and aerospace projects.
Pursue differentiated customer offerings to optimize utilization and free cash flow generation
We seek to balance and diversify our service offerings to customers, to optimize our vessel utilization and stabilize our free cash flow generation. For example, in addition to our long-term charters in oilfield services and with military and renewable energy customers that contribute to contracted backlog and provide utilization stability, we also seek out short-term charters such as spot oilfield services that typically have higher dayrates. This contracting strategy balances our financial profile between longer-term charters and the flexibility to capture current market dayrates for a portion of our fleet. Our current contracting approach allows us to consistently perform well against our OSV peers when comparing average OSV dayrates and gross margins. The flexibility of our vessel capabilities is designed to optimize our utilization and allows us to pivot in response to market conditions and customer needs, which can lead to more stable free cash flow generation.
Apply existing, and develop new, technologies to meet our customers’ vessel needs and expand our fleet offerings
Our in-house engineering team has been instrumental in applying existing, and developing new, technologies that meet our customers’ vessel needs and provide us with the opportunity to enter new customer markets. For instance, our OSVs and MPSVs are designed to meet the higher capacity and performance needs of our oilfield clients’ increasingly complex drilling and production programs and the diverse needs of our U.S. military, renewable energy and humanitarian aid and disaster relief customers. Further, we are able to reconfigure or retrofit existing assets with existing or new technology to participate in new customer markets such as offshore wind, aerospace and telecommunications. Specifically, we are currently deploying capital to upgrade certain of our vessels to dual service capabilities to better service the oilfield services market as well as the emerging offshore wind market. We remain committed to applying existing and developing new technologies to maintain a technologically advanced fleet that will enable us to continue to provide a high level of customer service and meet the developing needs of our customers.
Focus on selective acquisitions that are strategically and financially accretive
We seek to opportunistically grow our fleet through strategic and financially accretive acquisitions. Our screening criteria focuses on expanding the depth and breadth of our fleet mix as well as diversifying service offerings in our core markets. From time to time, we consider opportunistic acquisitions of single vessels, vessel fleets, and businesses that strategically complement our existing operations to enable us to grow our business and better serve our customers. For example, we recently completed the acquisition of 12 high-spec OSVs, which we refer to as the ECO Acquisitions.
Maintain a conservative balance sheet, disciplined growth, and robust free cash flow generation through cycles
We adhere to financial principles designed to maintain a conservative balance sheet, disciplined growth, and robust free cash flow generation. Our balance sheet strategy targets less than 1.0x leverage with ample excess liquidity available to withstand industry cycles or take advantage of disciplined growth opportunities.
Our growth strategy involves a disciplined screening of opportunities for differentiated assets that create competitive advantages and is focused on returns and payback periods. Our cash flow generation abilities are centered around maintaining flexible costs and lean organizational structures that seek efficiencies through continuous operational improvement and working capital management.
108
Continued commitment to sustainability and safety
Safety is of great importance to us and offshore operators due to the environmental and regulatory sensitivity associated with offshore drilling and production activity and wind development. We believe certain of our efforts, such as adopting shipboard energy efficiency management plans, installing emission monitoring systems and pursuing other operational efficiencies, have been successful, allowing us to meet our customers’ needs while supporting our efforts to reduce our emissions of GHG. Additionally, since 2020, our focus on safely addressing operational risk has contributed to maintaining an industry-low TRIR. Our most recent 5-year average TRIR was 0.10, outperforming peer averages from the IMCA and ISOA. Further, in addition to industry standard certifications, as part of our commitment to safety and quality, we have voluntarily pursued and received certifications and classifications that we believe are not generally held by other companies in our industry. We believe that customers recognize our relentless commitment to safety, which contributes to our positive reputation and competitive advantage.
We recently placed into service a high-tech DP simulator that provides an interactive and immersive training experience for current and future mariners who serve in DPO roles on our vessels. Configured to incorporate the controls and models of the three brands of DP systems that we use on our vessels, as well as to simulate four different specific vessel types and classes within our fleet, this highly customized design affords DPOs the opportunity to train on the same or substantially similar DP systems installed on our vessels. The simulator provides us with a sophisticated training platform from which to train our mariners. Our mariners are engaged in a virtual ship-like environment that can subject them to realistic failure situations in a controlled atmosphere, thus facilitating a dynamic learning process. Our DP simulator is designed to make training more efficient, cost effective and risk free, and ultimately provide an optimum outcome for trainees and the Company. The simulator is located at our headquarters in Covington, Louisiana.
We also provide our chief shipmates and other engine-room personnel training on a land-based version of our onboard oily water separator unit, which enhances crew knowledge of a critical environmental safeguard and, we believe, fosters our culture of environmental stewardship and risk mitigation.
Description of Our Business and Fleet
The Company owns and operates OSVs, MPSVs, and a port facility in Port Fourchon, Louisiana. Its fleet of vessels provides logistics support and specialty services to the offshore oil and gas exploration and production industry, primarily in the GoM, the Caribbean, Northern South America and Brazil, as well as non-oilfield specialty services for the U.S. military and other non-oilfield service customers primarily from the East and West Coasts of the United States and in the U.S. GoM. Measured by DWT capacity, we believe the Company has the number one ultra high-spec market position in the U.S., and the third largest fleet of high-spec and ultra high-spec OSVs in the world. Hornbeck has the second largest fleet of high-spec and ultra high-spec Jones Act-qualified OSVs. Hornbeck is the largest U.S. owner of MPSVs, which fleet is comprised of both Jones Act-qualified vessels for U.S. operations, as well as foreign flag vessels for foreign operations. We believe that our reputation for safety and superior vessels, combined with our size and scale in certain core markets, enhances our ability to compete for work awarded by major oil companies, independent oil companies, national oil companies and the U.S. government, who are among our primary customers. These customers demand a high level of safety and technological advancements to meet the industry’s stringent regulatory standards and operating policies.
OSVs and MPSVs operate worldwide but are generally concentrated in relatively few offshore regions with high levels of exploration and development activity, such as the GoM, the North Sea, Southeast Asia, West Africa, Latin America and the Middle East. While there is some vessel migration between regions, key factors such as mobilization costs, vessel suitability and government statutes prohibiting non-indigenous-flagged vessels from operating in certain waters, or cabotage laws such as the Jones Act, can limit the migration of OSVs into certain markets. Because MPSVs are generally utilized for non-cargo transportation operations, they are not typically subject to cabotage laws.
109
We have been successful in deploying our vessels across the United States and Latin America, where proximity and scale allow us to compete effectively with vessels from other international markets that have significantly higher mobilization costs. In addition, because of our significant presence in the United States and Mexico, we have access to shoreside resources and regional crews that we believe give us market advantages compared to international competitors.
OSVs
OSVs are highly versatile offshore vessels that are utilized in a variety of marine operations. In addition to oilfield operations, for which OSVs were initially developed, their flexibility and utility are now recognized and employed in an array of non-oilfield service applications, which includes military, alternative energy development (including offshore wind), telecommunications, aerospace and humanitarian aid and disaster relief. OSVs differ from other vessels primarily due to their cargo-carrying flexibility and capacity. In addition to transporting large quantities of deck cargo, OSVs also have below-deck tanks and pumping systems that enable them to transport and transfer large volumes of liquid cargoes, such as cement, liquid mud, water and fuel, as well as dry bulk cargoes, including barite, cement and bentonite. OSVs have accommodations for personnel in addition to the marine crew and can therefore be used as an operating platform for a variety of offshore missions requiring specialized personnel, equipment and processing plants. High-spec and ultra high-spec OSVs are capable of interfacing with other offshore vessels and facilities through the use of DP. Driven primarily by safety concerns that prohibit vessels from physically mooring to offshore installations, DP systems have been refined over time, with the highest DP rating currently being DP-3. The number following the DP notation generally indicates the degree of redundancy built into the vessel’s systems and the range of usefulness of the vessel in various weather conditions and sea states during offshore operations. Today, most offshore customers prefer a DP-2 notation. The combination of DP technology and cargo transport and transfer capability allows OSVs to interface with other offshore facilities and vessels in a safe and efficient manner.
HOSMAX OSV and MPSV flotel servicing an offshore production facility in the U.S. GoM
110
MPSVs
MPSVs are primarily distinguished from OSVs in that they are more specialized and often significantly larger vessels that are not typically employed to transport and transfer cargo, but rather to engage in a variety of offshore and subsea construction as well as other highly specialized operations. The typical MPSV configured for subsea services is outfitted with one or more deepwater or ultra-deepwater cranes employing “active heave compensation” technology, one or more ROVs and a helideck. Our MPSVs can also be configured (in accordance with applicable regulations) to support installation, commissioning, maintenance, repairs, improvements, and decommissioning of offshore oilfield facilities and windfarms, humanitarian aid and disaster relief and military missions, by providing accommodations for over one hundred people, in addition to crew and service personnel. MPSVs can also be outfitted as flotels to provide accommodations to large numbers of offshore construction and technical personnel involved in large-scale offshore projects, such as the commissioning of a floating offshore production facility or the construction of offshore wind facilities. When in a flotel mode, the MPSV provides living quarters for third-party personnel, catering, laundry, medical services, recreational facilities and offices and has a helicopter heliport for the embarkation and disembarkation of offshore personnel. In addition, flotels are equipped with articulated gangways between the flotel and other offshore structures that allow personnel to “walk to work.” Generally, MPSVs command higher dayrates than OSVs due to their significantly larger relative size and versatility, as well as higher construction and operating costs.
Two HOS MPSVs Deployed in GoM
Our Vessels
As of July 31, 2024, we owned a fleet of 75 vessels, including two partially constructed Jones Act-qualified MPSV newbuilds to be completed pursuant to our settlement with the Surety, as discussed in “Management’s Discussion and Analysis of Financial Condition and Results of Operations—Recent Developments—Resumption of MPSV Newbuild Construction,” and one OSV currently undergoing conversion into a MPSV for dual-service as either a C/SOV or flotel but excluding four vessels formerly owned by us that are now under an O&M contract with the U.S. Navy. A sustained downturn in oil and gas activities from 2015 to late 2020, combined with a global over-supply of vessels, resulted in widespread stacking of OSVs. During this period, we elected to cold-stack our smaller, older and less technologically capable vessels and to continue operating our high-spec and
111
ultra high-spec vessels. Since 2020, we have divested 14 of these older and smaller vessels. During that same timeframe, we have acquired a total of 19 high-spec and ultra high-spec vessels. We expect that we will continue to seek charter opportunities to re-purpose our remaining 19 non-high spec vessels, 18 of which are currently stacked. Alternatively, we may also sell some of these vessels opportunistically. The net effect of these efforts to “right-size” our overall fleet complement has been a shift in the percentage of high-spec and ultra high-spec vessels from 41% to 75% since 2014.
OSV Fleet
The following table illustrates our fleet of OSVs and the nations in which they are flagged as of July 31, 2024:
| Vessel Class | U.S. | Mexico | Vanuatu | Brazil | Avg DWT | Total in Class | ||||||||
|
|
HOSFLEX 370 | 2 | — | — | — | 7,886 | 2 | |||||||
| HOSMAX 320 | 9 | 1 | — | — | 6,052 | 10 | ||||||||
| HOSMAX 310 | 3 | — | — | 1 | 5,990 | 4 | ||||||||
| HOSMAX 300 | 2 | 4 | — | — | 5,489 | 6 | ||||||||
|
|
HOSMAX 280 | 12 | 1 | 1 | — | 4,666 | 14 | |||||||
| HOS 270 | — | 2 | — | — | 3,803 | 2 | ||||||||
| HOS 265 | 3 | — | — | — | 3,677 | 3 | ||||||||
|
HOS 250 | 3 | — | — | — | 2,713 | 3 | |||||||
| HOS 240 | 12 | 2 | — | — | 2,712 | 14 | ||||||||
| HOS 200 | — | 2 | — | — | 1,729 | 2 | ||||||||
| Total Owned OSVs | 46 | 12 | 1 | 1 | — | 60(2) | ||||||||
|
USN T-AGSE | 4 | — | — | — | DP-2 | 4(3) | |||||||
| Total Operated OSVs | 50 | 12 | 1 | 1 | — | 64 | ||||||||
| (1) | Includes mid-spec vessels and low-spec vessels. |
| (2) | Includes 21 stacked vessels, comprised of two HOS 200s, 13 HOS 240s, three HOS 250s, two HOS 265s, and one HOSFLEX 370. |
| (3) | Includes four OSVs formerly owned by us and that we now operate and maintain for the U.S. Navy. |
112
MPSV Fleet
The following table illustrates our fleet of MPSVs and the nations in which they are flagged as of July 31, 2024:
| Vessel Class | U.S. | Mexico | Vanuatu | DP Class | Total in Class | |||||||||||
| HOS C/SOV+FLOTEL(1) |
1 | — | — | DP-2 | 1 | |||||||||||
| HOS FLOTEL |
1 | — | — | DP-2 | 1 | |||||||||||
| HOS 430 |
— | 1 | 1 | DP-3 | 2 | |||||||||||
| HOS 400(2) |
2 | — | — | DP-2 | 2 | |||||||||||
| HOS 310/310ES |
4 | — | — | DP-2 | 4 | |||||||||||
| HOS 265 |
— | 1 | — | DP-2 | 1 | |||||||||||
| HOS 250 |
2 | — | — | DP-2 | 2 | |||||||||||
| HOS 240 |
2 | — | — | DP-2 | 2 | |||||||||||
| Total MPSVs |
12 | 2 | 1 | 15 | ||||||||||||
| (1) | Includes one HOSMAX 280 OSV currently being converted into a MPSV for dual-service as either a C/SOV or flotel. |
| (2) | Includes two partially constructed Jones Act-qualified MPSV newbuilds to be completed pursuant to our settlement with the Surety, as discussed further in “Management’s Discussion and Analysis of Financial Condition and Results of Operations—Recent Developments—Resumption of MPSV Newbuild Construction”. |
There are a number of third-party services that consistently monitor and assess the value of vessels across the global OSV and MPSV fleets. These firms independently evaluate each vessel based on age, build specification, capabilities and recent comparable vessel sales, among other criteria, to derive a market-based estimate of current vessel value including fair market value, newbuild, or replacement, value, and liquidation value. According to one third-party provider, VesselsValueTM, our total fleet of 60 OSVs and 15 MPSVs had a fair market value of approximately $2.7 billion and a newbuild, or replacement, value of approximately $5.7 billion as of July 31, 2024, reinforcing the quality and differentiated capabilities of our vessels in today’s market.
Newbuild MPSVs
On October 9, 2023, we entered into a final settlement agreement with the Surety for two MPSVs previously under construction at Gulf Island. Pursuant to the agreement, the Surety agreed to take over and complete the construction of the two U.S.-flagged, Jones Act-qualified, HOS 400 class MPSVs at a shipyard acceptable to us. In December 2023, Eastern was contracted by the Surety to complete the construction of the two MPSVs. Pursuant to the settlement, the Surety is contractually required to deliver both MPSVs in 2025. We are obligated to pay only the remaining portion of the original shipyard contract price for the two MPSVs, which amounted to $53.8 million in the aggregate on the settlement date. The Surety is required to cure all defaults of Gulf Island and pay all completion costs in excess of the $53.8 million remaining original contract price, excluding any approved change orders subsequent to the settlement date. As of June 30, 2024, we had paid $5.3 million to Eastern related to the completion of these two MPSVs.
Pursuant to the settlement, the Surety is contractually required to deliver both MPSVs in 2025. However, in June 2024, we were provided an updated schedule by the Surety and Eastern indicating that they currently expect a six-month shipyard delay for the delivery of the first of the two MPSVs. An updated delivery schedule has not yet been provided for the second vessel. Following physical delivery by the shipyard, we expect each vessel to undergo crane and other system installations, which we expect will make the first vessel available for commercial service in the first half of 2026, and the second vessel thereafter. In addition to the remaining $48.5 million of the original contract price as of June 30, 2024, we expect to incur an incremental $91.2 million in the aggregate for outfitting, overhead and the post-delivery discretionary enhancements, of which $63.6 million solely relates to the purchase and installation of cranes on both vessels. As of June 30, 2024, the Company had incurred $0.8 million of such incremental amounts, excluding capitalized interest. Once placed in service, we expect that our book carrying value
113
for each vessel will be approximately $80.0 million, which is significantly below the expected market value of Jones Act-qualified vessels of this age, type, size and specifications.
We believe our two newbuild MPSVs will represent the newest, most technologically advanced MPSVs in the industry; in fact, our vessels will represent the only Jones Act-qualified newbuild vessels that have been delivered since 2016. We believe that the differentiated capabilities of these vessels will allow us to satisfy our customers’ more demanding projects and enable us to secure vessel dayrates at the higher end of the spectrum, further enhancing our financial margins and profitability. Upon delivery, we anticipate that both vessels will have the ability to assist in subsea construction, light well intervention, and offshore wind installation projects with the ability to also support our military end-market opportunities.
Rendering of 400’ MPSV currently under construction
114
Shore-Based Facility
We own long-term lease rights to a port facility located in Port Fourchon, Louisiana, referred to as “HOS Port.” Port Fourchon’s proximity to the deepwater and ultra-deepwater U.S. GoM provides a strategic logistical advantage for servicing drilling rigs, production facilities and other offshore installations and work sites. We also are able to stage equipment and cargos in support of such services and can also perform some of our own maintenance, outfitting and other in-the-water shipyard repair activities. Developed as a multi-use facility, Port Fourchon has historically been a land base for offshore oil support services and the Louisiana Offshore Oil Port, or LOOP. According to the Greater Lafourche Port Commission website as of July 31, 2024, Port Fourchon currently services over 95% of the Gulf of Mexico’s deepwater and ultra-deepwater energy production.
HOS Port Facility in Port Fourchon Louisiana
The HOS Port facility has approximately 10 and 11 years remaining through renewal options on the current leases for the two adjacent parcels, respectively. The combined acreage of HOS Port is approximately 60 acres with total waterfront bulkhead of nearly 3,000 linear feet. HOS Port not only supports our existing fleet and customers’ deepwater and ultra-deepwater logistics requirements, but it underscores our long-term commitment to and our long-term outlook for the deepwater and ultra-deepwater GoM.
Customer Markets and Applications
The OSV and MPSV market has expanded rapidly since the 1970s, driven initially by growing offshore oil and gas production and more recently supported by diversified non-oilfield customer markets including military support services, renewable energy development and other non-oilfield service offerings. In response to changing market conditions and customer demand, we regularly transfer vessels between our core geographic areas and adapt equipment and features of our vessels to best meet potential revenue opportunities. Each customer market has specialized service needs and vessel requirements. For the six months ended June 30, 2024, approximately 49% of our revenues were attributed to oil and gas drilling support activities. The remaining approximately 51% of our revenues were generated away from the drill bit, comprised of approximately 25% coming from oilfield specialty activities, including offshore IRM, construction and equipment installation, as well as decommissioning and plugging and abandonment work; approximately 19% coming from military support services and HADR; and approximately 7% coming from other non-oilfield support services, including offshore wind development, construction and support services. As we continue to diversify our customer markets, we expect the non-oilfield markets to contribute a greater portion of revenues in the future.
Oilfield Services
We predominantly serve our oilfield customers in the GoM, the Caribbean, Northern South America and Brazil. Our vessels provide support to offshore oil and gas exploration and production companies in two key
115
areas: (i) oilfield drilling support and (ii) oilfield specialty services. Drilling support provides services that are specifically related to offshore drilling and production activities. This includes the transportation of drilling equipment, such as wellheads and drill pipe, as well as drilling fluids and other bulk products used in the development of new exploration wells and their subsequent production activities. Oilfield specialty services support ongoing or recurring oilfield activities, such as equipment installation services, IRM, flowback, well testing, pipeline flushing, decommissioning, and worker accommodations and transportation. In combination, we offer our oilfield customers a comprehensive range of vessel types and service offerings that cover the entire value chain of offshore hydrocarbon development. Additionally, we operate a port facility located in Port Fourchon, Louisiana, where we are able to stage equipment and cargos in support of such services and can also perform some of our own maintenance, outfitting and other in-the-water shipyard repair activities.
The offshore oil and gas industry operates globally. During the last three decades, the industry has undergone significant technological change driven by the ability to explore and produce hydrocarbons in deepwater and ultra-deepwater regions utilizing floating drilling and production units. In addition to the ability to operate in very deep water, technological advances have also made it possible for hydrocarbon resources to be detected, drilled for and produced at extreme well depths, with some reaching depths of 40,000 feet. These extremely deepwater, deep-well regions are highly prolific, with some achieving production rates exceeding 100,000 barrels per day from deposits that could remain productive for decades. Developing and operating wells in these conditions requires highly specialized knowledge and equipment. In addition to contending with extreme deepwater and deep well depths, these projects present challenges involving high temperatures and pressures within reservoirs and the associated difficulties of safely bringing those resources to the surface, processing them and then transporting them to shoreside locations. Most of the known deepwater and ultra-deepwater deposits are located offshore West Africa, the eastern coast of South America—dominated by Brazil and more recently, Guyana—and the GoM. Certain of our primary markets for oilfield services are the cabotage-protected U.S. GoM, Mexico and Brazil. Today, deepwater and ultra-deepwater production accounts for approximately 90% of all offshore production in the U.S. GoM. According to the 2024 EIA Outlook, the GoM production is expected to account for approximately 14% of total forecast U.S. crude oil production in each of 2024 and 2025. While the GoM is one sea, its hydrocarbon resources are geopolitically divided between the United States and Mexico. Deepwater and ultra-deepwater drilling and production has been active for nearly three decades in the U.S. GoM. The Mexican deepwater and ultra-deepwater GoM, however, is in its early days of development, driven mostly by constitutional and regulatory changes in Mexico that only recently opened these regions to development by international companies that have the required technological and financial capability to develop these complex projects. Because some of the geologic formations are shared, Mexican deepwater and ultra-deepwater reservoirs and lease blocks are expected to prove to be as highly productive as neighboring U.S. formations.
The distance of deepwater and ultra-deepwater projects from shore, together with their water and well depths, require large amounts of bulk drilling materials and related supplies. To address the challenges of deepwater and ultra-deepwater projects for our customers, our in-house team of naval architects and marine engineers have designed, constructed and acquired various classes of proprietary vessels that maximize liquid mud and dry bulk capacities and feature larger open deck space. Moreover, larger vessels reduce the transport-related carbon intensity compared to smaller vessels since they can carry on a single voyage significantly greater amounts of materials than smaller vessels with roughly the same fuel efficiency while in transit. Our fleet of ultra high-spec OSVs equips us to more efficiently and more safely service our customers’ offshore operations by reducing the number of vessels required to execute an offshore project. With 6,100 DWT, our HOSMAX 310 and 320 vessels are the largest ultra-deepwater OSVs available in the world, with the exception of our two even larger vessels. With 8,000 DWT, our HOS Flex 370 vessels are the two largest OSVs in the world and are well-qualified to also operate as oil and chemical tankers.
Deepwater and ultra-deepwater successes have driven further innovation around the infrastructure required to produce and transport ashore the abundant resources that have been discovered. The challenges of working in deepwater and ultra-deepwater have pushed the development of technologies to place infrastructure directly onto the seafloor, as opposed to a platform that is fixed to the seafloor, which is characteristic of shallow water regions. The process of building out this subsea oilfield requires vessels to transport infrastructure to location, install infrastructure to subsea points and inspect, repair and maintain them throughout the multi-decade life of a field. When hydrocarbons
116
are brought to the surface, they are gathered from multiple subsea locations through pipelines to a single deepwater or ultra-deepwater floating “top-side” production facility. These “top-side” production facilities take years to design, engineer, transport and install, and often cost billions of dollars, representing a significant source of demand for vessel services during their installation and commissioning. More recently, deepwater and ultra-deepwater producers have capitalized on their existing deepwater and ultra-deepwater infrastructure to gain efficiencies through the use of “tie-backs.” A tie-back allows a deepwater or ultra-deepwater well to be produced without having to install a new top-side facility by “tying the well back” to a nearby existing top-side facility accessible to the new well location. Tie-backs require the installation of subsea infrastructure to connect the well to the remote “top-side” facility, which requires the services of vessels like our MPSVs.
Rendering of Subsea Oil Field Infrastructure
Demand for OSVs, as evidenced by dayrates and utilization rates, is primarily driven by offshore oil and natural gas exploration, development and production activity. Such activity is influenced by a number of factors, including the actual and forecasted price of oil and natural gas, the level of drilling permit activity, capital budgets of offshore exploration and production companies, and the repair and maintenance needs of the floating and subsurface deepwater and ultra-deepwater oilfield infrastructure.
The leading demand indicator for our OSVs is the number of active drilling rigs. Each drilling rig working on deep-well projects typically requires multiple OSVs to service it, and the number of OSVs required depends on many factors, including the type of project, the location of the rig and the size and capacity of the OSVs. During normal operating conditions, based on the historical data for the number of working OSVs and floating rigs, GoM projects typically require two to four OSVs per rig and projects in Brazil occasionally require more OSVs per rig due to longer vessel turnaround times to service drill sites resulting from greater distances and logistical challenges in this region. Typically, during the initial drilling stage, more OSVs are required to supply drilling mud, drill pipe and other materials than at later stages of the drilling cycle. In addition, generally more OSVs are required the farther a drilling rig is located from shore. Under normal weather conditions, the transit time to deepwater and ultra-deepwater drilling rigs in the GoM and Brazil can typically range from six to 24 hours for a vessel. In Brazil, transit time for a vessel to some of the newer, more remote deepwater and ultra-deepwater drilling rig locations are more appropriately measured in days, not hours. As of June 30, 2024, there were 62 floating drilling units operating in the United States and Latin America. Since 2013, that figure has ranged from 39 to 108 with an average of 61.7.
Offshore drilling is also a leading indicator for future IRM and field development activity, which is relevant to our MPSV fleet and, occasionally, some of our OSVs. However, the significant level of existing floating and subsurface infrastructure across the United States and Latin America provides ongoing and growing requirements for MPSVs, which are utilized to inspect, repair, maintain, upgrade, expand and ultimately decommission existing fields.
117
Our MPSVs are principally commissioned by our deepwater and ultra-deepwater oilfield customers for IRM activities, which includes the subsea installation of well heads, risers, jumpers, umbilicals and other equipment placed on the seafloor. MPSVs are also used in connection with the setting of pipelines, the commissioning and de-commissioning of offshore facilities, the maintenance and/or repair of subsea equipment and the intervention of such wells, well testing and flow-back operations and other sophisticated deepwater and ultra-deepwater operations.
Further, nearly all of our oilfield customers have pledged reductions in their GHG and carbon emissions across their global operations. We believe that these efforts enhance the value of their GoM operations and prospects due to its relatively low carbon intensity. According to Wood Mackenzie’s Emissions Benchmarking Tool, U.S. Gulf of Mexico Deepwater’s weighted average emissions intensity in 2023 was 8.16 tCO2e/kboe compared to a global weighted average of 20.45 tCO2e/kboe.
HOS Warland Setting Subsea Equipment
Non-Oilfield Services
Military Services (U.S. Government and Navy Support)
Since 2006, we have been a prominent, private sector service provider to the U.S. military by delivering vessels that support their readiness and security. Our military service capabilities are an accelerating component of our service portfolio and military support is an end-customer market that is of particular importance given the stability provided by the U.S. government’s desire to execute long-term service agreements with qualified private contractors.
The United States has relied on private vessel owners and operators comprising the U.S. Merchant Marine to provide vessels that support U.S. military readiness and security, as well as peacetime and wartime services. U.S. government charters of specialized vessels, including OSVs and MPSVs, has increased as government customers, particularly the United States Navy, have recognized the broad utility of these vessels. We support our government customers in two key service offerings primarily from the East and West Coasts of the United States. We developed, constructed and sold to the United States Navy four U.S. Navy vessels that provide specialized services to the Ballistic Missile Submarine fleet. Because of the mission and expertise required for the operation of these vessels, we operate and maintain these vessels for the United States Navy pursuant to an operations and management O&M contract. In addition, we own, operate and charter to the U.S. government vessels that perform a variety of other missions for the United States Navy. These missions include submarine rescue and recovery capabilities, transportation services and training drills, autonomous vessel support, subsea survey and other services. We were also awarded a contract by the United States Marine Corps to develop a prototype amphibious landing vessel for its use in the near-shore deployment of troops and vehicles in logistically remote areas around the world.
118
Most contracts for work that we perform for the United States Navy are awarded by the MSC, which is an agency within the U.S. Navy that charters vessels for all U.S. armed forces. MSC publicizes its requirements for marine services, and we typically engage in a competitive process in order to be awarded such work. Occasionally, we are awarded charters on the basis of a sole-source award if the project requires specialized services. Our current O&M contract was awarded on a sole-source basis.
Performing offshore submarine support
HOS Resolution configured into amphibious landing vessel
Renewable Energy
Renewable energy, and particularly the U.S. offshore wind market is in its early stage of development and shows potential as an emerging market for our services domestically. We expect most of the U.S. offshore wind projects to require U.S.-flagged, Jones Act-qualified vessels like ours. Offshore windfarm construction and operation requires many of the core competencies and vessel requirements developed and utilized in offshore oil and gas operations.
For instance, the use of DP technology and the ability to transfer people and equipment from a vessel to an offshore installation will be required over the life of an offshore windfarm. Offshore wind vessel requirements span three general periods. The pre-construction survey phase requires survey vessels to ascertain sea bottom, sea state and wind conditions. The construction and installation phase is the most vessel-intensive. Among the vessels required are:
| • | installation vessels that install foundations, monopiles and wind turbines; |
| • | cable-lay vessels required to install electrical transmission lines between and among units in the field and an offshore or shore-based electrical grid; |
119
| • | MPSVs and flotels necessary to provide a variety of offshore construction, monitoring and accommodation support for windfarm personnel; and |
| • | OSVs to move equipment from shore to offshore locations. |
Once an offshore windfarm is installed and operational, it requires ongoing services and maintenance provided by a C/SOV, as well as crew transfer vessels to transfer crew between shoreside locations and among offshore wind sites. While pre-construction and construction period vessels are likely to be required for shorter periods in order to execute specific development tasks, C/SOVs and crew transfer vessels are required for the life-of-farm and are typically contracted for five to ten years.
We currently provide the offshore wind industry with vessels performing subsea survey and site-clearing. We expect that our MPSVs will be utilized in offshore windfarm development, as they possess the necessary lifting, DP-capability and accommodations required for offshore construction support. C/SOVs and crew transfer vessels are required to be Jones Act-qualified to engage in the coastwise trade. We believe that given high U.S. shipyard construction costs, it is more economically feasible to utilize existing high-spec domestic vessels for the offshore wind industry. We are converting one of our U.S.-flagged, Jones Act-qualified, HOSMAX 280 DP-2 OSVs into a dual-use C/SOV + Flotel MPSV, which is expected to be delivered in 2025 and that will be eligible to provide C/SOV services to offshore wind customers. We consider the vessel to be dual-use in that it will be outfitted to also provide accommodation support services in the offshore oilfield market.
HOS Vessel Positioned in New Jersey for Wind Coring
120
Other Non-Oilfield Services
The versatility of our vessels allows us to support communities in our core geographic areas by providing other non-oilfield services, including humanitarian aid and disaster relief, and service to the aerospace and telecommunications industries. For example, our fleet can support oil spill relief, hurricane recovery, vessel salvage and a broad range of search and rescue operations by deploying vessels to high-need areas in response to natural disasters or crises and providing those affected with lifesaving supplies and equipment. Our humanitarian aid and disaster relief contracts are difficult to predict, given the unexpected and calamitous nature of these projects. Nevertheless, as our reputation, proximity, scale, past experience and fleet relevance for such assistance has grown over the years, we are typically involved in at least one such response annually.
HOS Caledonia responding to Hurricane Maria in Puerto Rico
Additionally, our vessels are equipped to support aerospace launches that call for rocket component landing and recovery capabilities.
Contracting Practices
Non-Government Customers
Our oilfield services customer charters are the product of either direct negotiation or a competitive proposal process, which evaluates vessel capability, availability and price. Our primary method of chartering in the GoM is through direct vessel negotiations with our customers on either a long-term or spot basis. In the international market, we sometimes charter vessels through local entities in order to comply with cabotage or other local requirements. Some charters are solicited by customers through international vessel brokerage firms, which earn a commission that is customarily paid by the vessel owner. Charters to customers in the wind industry and other renewable energy and non-oilfield service customers (other than the U.S. government) are generally consistent with our approach to charters in the oil and gas industry.
We have entered into master agreements with certain non-governmental customers, pursuant to which customers may place individual work orders for specific charters. These master agreements are framework agreements that generally include non-economic terms such as administrative matters and indemnification and insurance provisions. However, these master agreements do not obligate us to provide services to any customers, and do not obligate such customers to hire us for any particular project, absent agreement on specific work orders, and the key economic terms of each charter. Such terms, including the specific vessel, length of charter, operating area, termination provisions and dayrates, are set forth in these individual work orders. The charters with customers with whom we have not entered into a master agreement contain provisions that are generally consistent with the terms contained in the master agreements and individual work orders, but are entered into on an individual basis.
Our charters with these customers, whether on a long-term or spot basis, primarily govern the length of the term and the rate charged by us for a vessel. The charters have terms varying from a few days to three years (or longer in certain circumstances). The charters include a fixed dayrate for the primary term whereby for each day
121
that the vessel is under contract to the customer, we earn a fixed amount of charter hire for making the vessel available for the customer’s use, and the dayrate payable for any extension of the charter. These dayrates area based on market rates at the time of entry into each charter. However, long-term charters sometimes contain “cost pass through” provisions that permit us to increase our dayrates to be compensated for certain increased operational expenses or regulatory changes. Many of these charters require the customer to pay a substantial fee for early termination of the charter. Our charters also contain customary insurance and indemnification provisions. These indemnification provisions generally provide that the Company will indemnify the counterparty for claims for loss or for damage to property, equipment, material and supplies, claims arising from the control, removal, restoration and cleanup of all pollution or contamination, arising from or on account of pollution or contamination which originates from the Company’s vessel and other customary coverage.
U.S. Government Customers
The process for entering into charters with the U.S. government entails the applicable agency posting requests for proposals or solicitations for vessel projects and the Company bidding on chosen jobs by completing an offer responsive to such solicitations. Once finalized, the Company and the U.S. government will execute a Solicitation, Offer and Award contract which will incorporate standard forms of contract issued by the U.S. government, such as for example, a “Specialtime” form for the time chartering of vessels, or an O&M contract if the scope of work is to operate and maintain a government vessel. Similar to the work orders for many of our non-government charters, each Solicitation, Offer and Award contract contains the specific commercial terms for a vessel charter, including the fixed term (typically one to five years for government charters), dayrate and place of delivery. If the applicable agency awards the Company the charter, the vessel order is governed by the applicable form of contract related to the services provided, the FARs or the D-FARs. Certain clauses of the FARs and D-FARs are incorporated by reference into the Solicitation, Offer and Award contract or O&M Contract, as applicable, and these clauses contain requirements for managing a contract after the award, including conditions under which contracts may be terminated and customary indemnification. While the specific chartering process with the U.S. government is different from the chartering process for our other customers, the description of the general terms of our charters in the last paragraph of “—Non-Government Customers” above generally applies to our U.S. government charters as well.
Competition
The offshore support vessel industry is highly competitive. Competition primarily involves such factors as:
| • | quality, capability and age of vessels; |
| • | quality, capability and nationality of the crew members; |
| • | ability to meet the customer’s schedule and specific logistical requirements; |
| • | safety record, reputation and experience; |
| • | price; and |
| • | cabotage laws. |
The U.S. GoM, Mexico GoM and Brazil each have cabotage laws that provide us varying levels of insulation from foreign sources of competition that may be unwilling to invest capital or otherwise satisfy local ownership, crewing, tax and/or build requirements. As such, cabotage-protected markets create meaningful barriers to entry for foreign-flagged vessels. Since the fourth quarter of 2023, maritime regulators in Mexico have implemented new approaches in their oversight of Navieras that historically have had permissible levels of non-Mexican ownership, such as ours. As a result, we took legal action in Mexico to preserve our cabotage privileges there, and a Mexican court has ordered that our cabotage privileges be reinstated. We have appealed this decision to further clarify the court’s decision, and our cabotage privileges remain active during the pendency of the appeal. We expect the appellate process to last between one and three years. Despite these favorable court rulings, and the pendency of
122
appeals, Mexican maritime regulators have limited our ability to object to the employment of non-Mexican flag vessels that compete with our own Mexican-flagged vessels, which is one of the privileges of a Mexican Naviera. Since the fourth quarter of 2023, we have moved all but two of our Mexican-flagged vessels into various non-Mexican international markets to continue utilizing our highly-skilled Mexican mariners and shore-based employees as part of our international services, which we believe will result in a temporary reduction of revenue for some of those vessels.
Our high-spec OSVs are predominantly U.S.-flagged vessels, which qualify them under the Jones Act to engage in the U.S. domestic coastwise trade. The Jones Act restricts the ability of vessels that are foreign-built, foreign-owned, foreign-crewed or foreign-flagged from engaging in coastwise trade in the United States. The transportation services typically provided by OSVs constitute coastwise trade as defined by the Jones Act. See “Risk Factors” for a more detailed discussion of the Jones Act. Consequently, competition for our services in the U.S. GoM is largely restricted to other U.S. vessel owners and operators, both publicly and privately held. Internationally, our OSVs compete against other U.S. owners, as well as foreign owners and operators of OSVs. Some of our international competitors may benefit from a lower cost basis in their vessels, which are usually not constructed in U.S. shipyards, as well as from lower crewing costs and favorable tax regimes. While foreign vessel owners cannot engage in U.S. coastwise trade, some cabotage laws in other parts of the world permit temporary waivers for foreign vessels if domestic vessels are unavailable. We and other U.S. and foreign vessel owners have been able to obtain such waivers in the foreign jurisdictions in which we operate.
Many of the services provided by MPSVs do not involve the transportation of passengers or merchandise and therefore are generally not considered coastwise trade under U.S. and foreign cabotage laws. Consequently, MPSVs face competition from both foreign-flagged vessels and U.S.-flagged vessels for non-coastwise trade activities.
Competition in the MPSV industry is significantly affected by the particular capabilities of a vessel to meet the requirements of a customer’s project, as well as price. While operating in the U.S. GoM, our MPSVs are required to utilize U.S. crews while foreign-owned vessels have historically been allowed to employ non-U.S. mariners, often from nations with lower, or no, minimum wage standards. U.S. crews are often more expensive than foreign crews. Also, foreign MPSV owners may have more favorable tax regimes than ours. Consequently, prices for foreign-owned MPSVs in the GoM are often lower than prices we can charge. Finally, some potential MPSV customers are also owners of MPSVs that will compete with our vessels.
In Mexico, the cabotage laws limit the citizenship of owners and operators of Mexico-flagged vessels and limit Mexican shipping activities to companies that comply with those ownership restrictions. Foreign vessels can be flagged into the Mexican registry. Mexico-flagged vessels must be Mexican crewed. In Brazil, only vessels constructed in Brazil may be Brazil-flagged. A limited exception to be Brazilian-built requirement is for a vessel that is foreign built and whose maiden voyage is to Brazil and which pays Brazilian importation duties. Brazil-flagged vessels must also employ Brazilian crew, but the citizenship of the owners of a Brazilian shipping company is not regulated.
We continue to observe intense scrutiny by our customers on the safety and environmental management systems of vessel operators. As a consequence, we believe that deepwater and ultra-deepwater customers are increasingly biased towards companies that have demonstrated a financial and operational commitment and capacity to employ such systems. We believe this trend will, over time, make it difficult for small enterprises to compete effectively in the deepwater and ultra-deepwater OSV and MPSV markets.
Although some of our principal competitors are larger or have more extensive international operations than we do, we believe that our operating capabilities and reputation for quality and safety enable us to compete effectively in the market areas in which we operate or intend to operate. Moreover, we believe that the relatively young age and advanced features of our OSV and MPSV fleet provide us with additional competitive advantages. As of July 31, 2024, our total fleet of 60 OSVs and 15 MPSVs included two partially constructed Jones Act-qualified MPSV newbuilds to be completed pursuant to our settlement with Surety, as discussed further in “Management’s Discussion and Analysis of Financial Condition and Results of Operations—Recent
123
Developments—Resumption of MPSV Newbuild Construction,” and one OSV currently undergoing conversion into a MPSV for dual-service as either a C/SOV or flotel. At that date we operated an active OSV fleet of 39 vessels of which approximately 97% were categorized as high- or ultra high-spec. These high- and ultra high-spec vessels range in age from eight to twenty-two years with a weighted-average fleet age, based on DWT, of 12.6 years. In fact, approximately 79% of these vessels have been constructed since January 1, 2008, and 100% have DP-2 or DP-3 capabilities. Similarly, our active MPSV fleet is comprised of 12 vessels that range in age from eight to twenty-three years with 100% of those vessels possessing DP-2 or DP-3 capabilities.
Customer Dependency
Our oilfield customers are generally large, independent, integrated or nationally-owned oil or oilfield service companies. These firms are relatively few in number. The percentage of revenues attributable to a customer in any particular year depends on the level of oil and natural gas exploration, development and production activities undertaken by such customer, the availability and suitability of our vessels for the customer’s projects or products and other factors, many of which are beyond our control. Our primary government customer is the MSC, a department that is responsible for the contracting of marine vessels and services for all branches of the United States Armed Forces. For the six months ended June 30, 2024, a wholly owned subsidiary of Occidental Petroleum Company, MSC, and collectively, subsidiaries of Shell plc each accounted for 10% or more of our consolidated revenues. Our charters with Occidental Petroleum Company are pursuant to a master agreement, a pricing agreement and specific work orders, consistent with our chartering process with other customers as described in “—Contracting Practices—Non-Government Customers.” Our charters with MSC are subject to individual Solicitation, Offer and Award contracts or O&M contracts and the applicable FARs and D-FARs, consistent with our chartering process with other U.S. government customers as described in “—Contracting Practices—U.S. Government Customers.”
The specific customers accounting for over 10% of our consolidated revenues for any period typically vary from period to period over time, and the multiple separate charters with each of these customers are typically entered into on one-time or “spot” bases with no material ongoing obligations thereunder once completed. For further discussion of significant customers, see Note 18 to our Annual Financial Statements.
Government Regulation
Environmental Laws and Regulations
Our operations are subject to a variety of federal, state, local and international laws and regulations regarding the discharge of materials into the environment, environmental protection and occupational safety and health, and our business is highly dependent on the offshore oil and gas industry, which is also subject to such laws and regulations. The requirements of these laws and regulations have become more complex and stringent in recent years and may, in certain circumstances, impose strict, joint and several liability, rendering a company liable for environmental damages and remediation costs without regard to negligence or fault on the part of such party. Aside from possible liability for damages and costs, including natural resource damages, associated with releases of oil or hazardous materials into the environment, such laws and regulations may expose us to liability for the conditions caused by others or even acts of ours that were in compliance with all applicable laws and regulations at the time such acts were performed. Failure to comply with applicable environmental laws and regulations may result in the imposition of administrative, civil and criminal penalties, revocation of permits, issuance of corrective action orders and suspension or termination of our operations. Moreover, it is possible that future changes in the environmental laws, regulations or enforcement policies that impose additional or more restrictive requirements or claims for damages to persons, property, natural resources or the environment could result in substantial costs and liabilities to us and could have a material adverse effect on our financial condition, results of operations or cash flows. For example, concerns with climate change and the impact of GHG emissions have given rise to proposed legislation and regulations that could impact our operations. We believe that we are in substantial compliance with currently applicable environmental laws and regulations.
124
The Oil Pollution Act of 1990 (“OPA 90”) and regulations promulgated pursuant thereto amend and augment the oil spill provisions of the Clean Water Act and impose strict, joint and several liability and natural resource damages liability on “responsible parties” related to the prevention and/or reporting of oil spills and damages resulting from such spills in or threatening U.S. waters, including the Outer Continental Shelf or adjoining shorelines. A “responsible party” under OPA 90 is the party found to be accountable for the discharge or substantial threat of discharge of oil from a vessel or facility, which includes the owner or operator of an onshore facility, pipeline or vessel or the lessee or permittee of the area in which an offshore facility is located. OPA 90 assigns strict, joint and several liability to each responsible party for containment and oil removal costs, as well as a variety of public and private damages including the costs of responding to a release of oil, natural resource damages, damages for injury to, or economic losses resulting from, destruction of real or personal property of persons who own or lease such affected property. For any vessels, other than “tank vessels,” that are subject to OPA 90, the liability limits are currently the greater of $1,300 per gross ton or $1,076,000. A party cannot take advantage of liability limits if the spill was caused by gross negligence or willful misconduct or resulted from violation of a federal safety, construction or operating regulations. In addition, for an Outer Continental Shelf facility or a vessel carrying crude oil from a well situated on the Outer Continental Shelf, the limits apply only to liability for damages (e.g., natural resources, real or personal property, subsistence use, reserves, profits and earnings capacity, and public services damages). The owner or operator of such facility or vessel is liable for all removal costs resulting from a discharge or substantial threat of discharge without limits. If the party fails to report a spill or to cooperate fully in the cleanup, the liability limits likewise do not apply and certain defenses may not be available. Moreover, OPA 90 imposes on responsible parties the need for proof of financial responsibility to cover at least some costs in a potential spill. As required, we have provided satisfactory evidence of financial responsibility to the USCG for all of our vessels when required by law. OPA 90 does not preempt state law, and states may impose liability on responsible parties and requirements for removal beyond what is provided in OPA 90.
OPA 90 also imposes ongoing requirements on a responsible party, including preparedness and prevention of oil spills and preparation of an oil spill response plan. We have engaged the Marine Spill Response Corporation to serve as our Oil Spill Removal Organization for purposes of providing oil spill removal resources and services for our operations in U.S. waters as required by the USCG. In addition, our Tank Vessel Response Plan and Non-Tank Vessel Response Plan have been approved by the USCG.
The Clean Water Act imposes restrictions and strict controls on the discharge of pollutants into federal waters and provides for civil, criminal and administrative penalties for any unauthorized discharge of oil or other hazardous substances in reportable quantities. The Clean Water Act also imposes liability for the costs of removal and remediation of an unauthorized discharge, including the costs of restoring damaged natural resources. Many states have laws that are analogous to the Clean Water Act and also require remediation of accidental releases of petroleum or other pollutants in reportable quantities. Our OSVs routinely transport diesel fuel to offshore rigs and platforms and also carry diesel fuel for their own use. Our OSVs also transport bulk chemical materials and liquid mud used in drilling activities, which contain oil and hazardous substances. We maintain vessel response plans as required by the Clean Water Act to address potential oil, fuel and hazardous substance spills.
The Comprehensive Environmental Response, Compensation, and Liability Act of 1980, also known as “CERCLA” or the “Superfund” law, and similar laws impose liability on certain classes of persons, without regard to fault or the legality of the original conduct, who are considered to be responsible for releases of hazardous substances, pollutants and contaminants into the environment. CERCLA currently exempts crude oil from the definition of hazardous substances for purposes of the statute, but our operations may involve the use or handling of other materials that may be classified as hazardous substances, pollutants and contaminants. CERCLA assigns strict, joint and several liability to each responsible party for response costs, as well as natural resource damages. Under CERCLA, responsible parties include not only owners and operators of vessels but also any person who arranged for the disposal or treatment, or arranged with a transporter for transport for disposal or treatment, of hazardous substances, and any person who accepted hazardous substances for transport to and selected the disposal or treatment facilities. Thus, we could be held liable for releases of hazardous substances that resulted from operations
125
by third parties not under our control or for releases associated with practices performed by us or others that were standard in the industry at the time and in compliance with existing laws and regulations.
The Resource Conservation and Recovery Act regulates the management, generation, transportation, storage, treatment and disposal of onshore hazardous and non-hazardous wastes and requires states to develop programs to ensure the safe treatment, storage and disposal of wastes. States having jurisdiction over our operations also have their own laws governing the generation and management of solid and hazardous waste. We generate non-hazardous wastes and small quantities of hazardous wastes in connection with routine operations. We believe that all of the wastes that we generate are handled in material compliance with the Resource Conservation and Recovery Act and analogous laws.
On December 4, 2018, the Vessel Incidental Discharge Act was enacted, which requires the EPA to develop, through rulemaking, new national standards of performance for commercial vessel incidental discharges. In October 2020, the EPA proposed national standards of performance, and in October 2023, the EPA supplemented the proposed rulemaking, providing additional USCG data and supplemental regulatory options being considered by the EPA for discharge from ballast tanks, hulls and niche areas, and graywater systems, informed by public comments to the initial proposed rule. The final rule is expected to be published in the Federal Register in Fall of 2024, which will be followed by a USCG rulemaking process to issue enforcement regulations, with a deadline set by the Vessel Incidental Discharge Act of two years after the EPA’s final rule. In the interim, the existing vessel discharge requirements established through the 2013 Vessel General Permit under the National Pollutant Discharge Elimination System still apply. In addition, the International Maritime Organization’s, or IMO, International Convention for the Control and Management of Ships’ Ballast Water and Sediments otherwise known as the Ballast Water Management Convention, or BWMC, became effective on September 8, 2017. The BWMC has similar standards to that of the USCG and EPA ballast water regulations. These regulations require all of our existing vessels to meet certain standards pertaining to ballast water discharges. An exemption to certain compliance requirements in the U.S. is provided for vessels that operate within an isolated geographic region, as determined by the USCG and the EPA, respectively. Most of our vessels operating in the U.S. GoM are exempt from the ballast water treatment requirements. However, for non-exempt vessels, ballast water treatment equipment may be required to be utilized on the vessel. We have currently estimated the cost of compliance with either the EPA’s vessel discharge requirements or the BWMC to be approximately $250,000 per vessel that is required to be fitted with a treatment system.
The DOI issues regulations governing oil and gas operations on federal lands and waters and imposes obligations for establishing financial assurance for decommissioning activities. In 2023, the DOI finalized a new five-year offshore leasing plan for the U.S. GoM that substantially limits offshore lease sales. Legal challenges to the leasing plan could delay or suspend offshore lease auctions, adversely affecting our customers’ businesses and reducing demand for our services.
The CAA regulates the emission of air pollutants resulting from industrial activities. Between 2008 and 2015, the EPA phased-in Tier 4 emission standards for the exhaust of marine diesel engines applicable to engine manufacturers and vessel owners, including our fleet, which are equivalent to the regulations adopted in IMO amendments to the 1973 International Convention for the Prevention of Pollution of Ships, as modified by the Protocol of 1978 (or MARPOL 73/78), as discussed further below. The standards were adopted to reduce emission of particulate matter and nitrogen oxides and require vessel owners to conduct engine maintenance, periodic surveys and certification requirements for marine diesel engines. In August 2020, the EPA amended the Tier 4 emission standards to allow additional lead time for engines used in certain high-speed vessels due to manufacturing concerns and streamlined engine certification requirements to facilitate or accelerate certification of Tier 4 marine engines with high power densities. Significant costs may be incurred in the event a marine diesel engine requires replacement, and replacement engines may be required to comply with a higher emissions standard than the engine being replaced. In addition, the 2008 California Air Resources Board’s Commercial Harbor Craft Regulation requires the phase-out of older engines with engines meeting higher emissions standards by certain compliance timelines in regulated California waters, and in 2022, was amended to expand applicability to additional vessel types and require cleaner upgrades or newer
126
technology. To the extent that such current or future federal or state regulations may apply to our operations or vessels, we could be responsible for the costs associated with compliance.
IMO amendments to the International Convention for the Prevention of Pollution from Ships, 1973, or MARPOL, reduced the permitted sulfur content of any fuel oil used on board ships from 3.5% to 0.5% globally, effective January 1, 2020. While operating within designated Emission Control Areas, such as within 200 nautical miles of North America, the sulfur content limit is 0.1%. The IMO’s Anti-Fouling System Convention prohibits the use of certain coatings used to prevent the growth of marine organisms. Amendments to this Convention were adopted in June 2021 and became effective on January 1, 2023, to prohibit anti-fouling systems containing cybutryne. Our vessels are coated with approved anti-fouling paint systems and maintained in accordance with the Convention.
Present and future legislation, regulation and treaties centered on the protection of marine mammals and other ocean life may also impact our operations. For example, in the United States, regulations implemented pursuant to the Marine Mammals Protection Act, the Endangered Species Act and the National Marine Sanctuaries Act impose vessel speed restrictions, minimum marine mammal approach distances and strike reporting, and prohibit vessel entry in certain protected areas, with the same or similar regulations on the international level. Additionally, in March 2023, the United Nations Convention on the Law of the Sea proposed a draft agreement on the conservation and sustainable use of marine biological diversity of areas beyond national jurisdiction, aiming to promote the conservation and sustainable use of marine biological diversity on the high seas, which was formally adopted in June 2023, and is awaiting ratification. When formally ratified, the agreement will create a legal framework for the establishment of marine protected areas and will require environmental impact assessments for activities with the potential to impact the marine environment on the high seas. We have implemented a Marine Mammal Watch and Avoidance procedure in accordance with guidelines provided by the National Oceanic and Atmospheric Administration (“NOAA”) and comply with vessel speed restrictions and other requirements implemented by NOAA.
Climate Change
GHG emissions have increasingly become the subject of international, national, regional, state and local attention. Although no comprehensive federal climate change legislation regulating the emission of GHGs or directly imposing a price on carbon has been implemented to date in the United States, efforts have been made and continue to be made in the international community toward the adoption of international treaties or protocols that would address global climate change issues. For example, over the past decade, the IMO adopted international mandatory measures to improve ships’ energy efficiency, as well as an initial strategy on the reduction of GHG emissions from shipping and regulatory measures to implement that strategy. The IMO’s Marine Environment Protection Committee adopted a revised and strengthened set of climate goals during its 80th session in July 2023, which sets a target to reach net-zero GHG emissions from shipping by or around 2050. The Biden Administration has also indicated willingness to pursue new climate change legislation, executive actions or other regulatory initiatives to limit GHG emissions, including by rejoining the Paris Agreement treaty on climate change in 2021, issuing several executive orders to address climate change, submitting a U.S. Nationally Determined Contribution that sets a target to cut GHG emissions to 50-52 percent of 2005 levels by 2030, announcing the U.S. Methane Emissions Reduction Action Plan, and participation in the Global Methane Pledge, a pact that aims to reduce global methane emissions at least 30% below 2020 levels by 2030. Most recently, at the 28th Conference of the Parties (“COP28”), President Biden announced the EPA’s final standards to reduce methane emissions from existing oil and gas sources. Additionally, at COP28, member countries agreed to the first “global stocktake,” which calls on countries to contribute to global efforts to mitigate climate change, including a tripling of renewable energy capacity and doubling energy efficiency improvements by 2030; phasing out inefficient fossil fuel subsidies; and transitioning away from fossil fuels in energy systems. In addition, the IRA 2022 imposes the first-ever federal fee on excess methane emissions from facilities required to report their GHG emissions to the EPA, and also appropriates significant federal funding for renewable and alternative energy sources, which could increase costs and accelerate the transition to alternative fuels. In November 2022, the Federal Acquisition Regulatory Council also proposed a rule that would require companies with at least $7.5 million in annual federal contract obligations to disclose their Scope 1 and 2 GHG emissions and companies that receive at least $50 million in annual federal contracts to additionally disclose their relevant
127
Scope 3 GHG emissions, make annual disclosures aligned with the recommendations of the Task Force on Climate-related Financial Disclosures, and set science-based emissions reduction targets. Under the Biden Administration, the White House Council on Environmental Quality (“CEQ”) issued a final rule in April 2022 which included ensuring that agency analysis required under the National Environmental Policy Act (“NEPA”) captures the direct, indirect, and cumulative effects of major federal actions. Additionally, in January 2023, the CEQ released guidance to assist federal agencies in assessing the GHG emissions and climate change effects of their proposed actions under NEPA. These or other increases in federal agency attention to GHG emissions and climate change effects may impact our customers’ ability or time to receive, or increase restrictions on, offshore leases or permits. Separately, many U.S. state and local leaders as well as foreign national or multinational governments have intensified or stated their intent to intensify efforts to support international climate commitments and treaties, in addition to developing programs that are aimed at reducing GHG emissions such as by means of cap and trade programs, carbon taxes, encouraging the use of renewable energy or alternative low-carbon fuels, or imposing new climate-related reporting requirements. For example, cap and trade initiatives to limit GHG emissions have been introduced in the European Union and certain U.S. states. To the extent that these regulations may apply, we could be responsible for costs associated with complying with such regulations. Future treaty obligations, statutory or regulatory changes or new climate change legislation in the jurisdictions in which we operate could affect our costs associated with compliance. In addition, we may see indirect impacts from climate-related legislation and regulations applicable to our customers, even when not directly applicable to us. We may face costs associated with adapting to customer requirements (e.g., for emissions information, renewable fuels and technologies, engine or other equipment upgrades, or other emissions reduction measures) as our customers respond to their own climate-related compliance obligations.
Additionally, in March 2024, the SEC adopted the SEC Climate Rules. The SEC Climate Rules are currently stayed pending completion of judicial review and are widely expected to face additional legal challenges going forward. We cannot currently predict with certainty the timing and costs of implementation or any potential adverse impacts resulting from the SEC Climate Rules. However, assuming they take effect, we could incur additional operational and compliance burdens and increased costs relating to the assessment and disclosure of climate-related matters, including costs relating to establishment of additional internal controls and collecting, measuring and analyzing information related to such matters. Further, we cannot predict how any information disclosed pursuant to the rules may be used by financial institutions or investors. We may face increased litigation and enforcement risks, or limits or restrictions on our access to capital, related to disclosures made pursuant to the SEC Climate Rules.
More broadly, restrictions on GHG emissions or other climate-related international, federal, state or local legislative or regulatory enactments could have an effect in those industries that use significant amounts of petroleum products, which could potentially result in a reduction in demand for petroleum products and, consequently and indirectly, our offshore transportation and support services. While the Supreme Court’s decision in Loper Bright Enterprises v. Raimondo to overrule Chevron U.S.A. Inc. v. Natural Resources Defense Council, Inc. and end the concept of general deference to regulatory agency interpretations of laws introduces new complexity for federal agencies and administration of climate change policy and regulatory programs, many of these initiatives are expected to continue. Although we are currently unable to accurately predict the manner or extent of the effects of any such initiatives, legislation and regulatory programs enacted to address climate change or reduce emissions of GHGs could have an adverse effect on our business, financial condition and results of operations.
Furthermore, one of the asserted long-term physical effects of climate change may be an increase in the severity and frequency of adverse weather conditions, such as hurricanes, which may increase our insurance costs or risk retention, limit insurance availability or reduce the areas in which, or the number of days during which, our customers would contract for our vessels in general and in the U.S. GoM in particular. Such conditions could also cause damage to our assets. Any of these impacts, individually or in the aggregate, could materially and adversely affect our business, financial conditions and results of operations. We are currently unable to predict the manner or extent of any such effect. Our ability to mitigate the adverse physical impacts of climate change depends in part upon our disaster preparedness and response and business continuity planning. See further discussion in “Risk Factors—Our business may be subject to risks related to climate change, including physical risks such as increased adverse weather patterns and transition risks such as evolving climate change regulation, fuel conservation measures, shifting consumer preferences, technological advances and negative shifts in market perception towards
128
the oil and natural gas industry and associated businesses, any of which could result in increased operating expenses and capital costs or decreased resources and adversely affect our financial results.”
Employees
On July 31, 2024, we had 1,766 employees, including 1,461 vessel personnel and 305 corporate, administrative and management personnel. Excluded from these personnel totals are 53 third-country nationals that we contracted to serve on our vessels as of July 31, 2024. These non-U.S. mariners are typically provided by international crewing agencies. With the exception of 511 employees located in Mexico and Brazil as of July 31, 2024, none of our employees are represented by a union or employed pursuant to a collective bargaining agreement or similar arrangement. We have not experienced any strikes or work stoppages, and our management believes that we continue to experience good relations with our employees.
Geographic Areas
The table below presents revenues by geographic region(1) for the six months ended June 30, 2024 and 2023 and the years ended December 31, 2023 and 2022 (in thousands):
| Six Months Ended June 30, | Year Ended December 31, | |||||||||||||||||||||||||||||||
| 2024 | % of Total |
2023 | % of Total |
2023 | % of Total |
2022 | % of Total |
|||||||||||||||||||||||||
| United States |
$ | 227,170 | 74.1 | % | $ | 214,895 | 77.2 | % | $ | 432,621 | 75.4 | % | $ | 362,830 | 80.4 | % | ||||||||||||||||
| International(2)(3) |
79,606 | 25.9 | % | 63,494 | 22.8 | % | 140,828 | 24.6 | % | 88,396 | 19.6 | % | ||||||||||||||||||||
|
|
|
|
|
|
|
|
|
|
|
|
|
|
|
|
|
|||||||||||||||||
| $ | 306,776 | 100.0 | % | $ | 278,389 | 100.0 | % | $ | 573,449 | 100.0 | % | $ | 451,226 | 100.0 | % | |||||||||||||||||
|
|
|
|
|
|
|
|
|
|
|
|
|
|
|
|
|
|||||||||||||||||
| (1) | The Company attributes revenues to individual geographic regions based on the location where services are performed. |
| (2) | International revenues of $12.8 million and $44.6 million were attributed to services performed in Mexico for the six months ended June 30, 2024 and 2023, respectively. International revenues of $44.5 million and $17.7 million were attributed to services performed in Brazil for the six months ended June 30, 2024 and 2023, respectively. Revenues attributed to other countries were not individually material for the periods presented. |
| (3) | International revenues of $62.1 million and $41.3 million were attributed to services performed in Mexico for the years ended December 31, 2023 and 2022, respectively. Revenues attributed to other countries were not individually material for the periods presented. |
The table below presents net book value of property, plant and equipment by geographic region(1) as of June 30, 2024 and December 31, 2023 and 2022 (in thousands):
| As of June 30, 2024 |
% of Total |
As of December 31, 2023 |
% of Total |
As of December 31, 2022 |
% of Total |
|||||||||||||||||||
| United States |
$ | 548,080 | 87.7 | % | $ | 522,347 | 86.7 | % | $ | 365,769 | 81.4 | % | ||||||||||||
| International(2)(3) |
77,190 | 12.3 | % | 80,075 | 13.3 | % | 83,480 | 18.6 | % | |||||||||||||||
|
|
|
|
|
|
|
|
|
|
|
|
|
|||||||||||||
| $ | 625,270 | 100.0 | % | $ | 602,422 | 100.0 | % | $ | 449,249 | 100.0 | % | |||||||||||||
|
|
|
|
|
|
|
|
|
|
|
|
|
|||||||||||||
| (1) | Book values are attributed to geographic regions based on the country of domicile of the specific asset-owning subsidiary of the Company, not the physical operating location of the asset as of any of the dates presented. |
| (2) | International property, plant and equipment of $68.8 million was owned by certain Mexican subsidiaries of the Company as of June 30, 2024. Property, plant and equipment attributed to other countries were not individually material as of any of the dates presented. No other individual foreign location accounted for a material portion of property, plant and equipment as of any of the dates presented. |
| (3) | International property, plant and equipment of $70.6 million and $74.5 million were owned by certain Mexican subsidiaries of the Company as of December 31, 2023 and 2022, respectively. Property, plant and equipment attributed to other countries were not individually material as of any of the dates presented. |
129
Foreign Operations
Operating in foreign markets presents many political, social and economic challenges. Although we take measures to mitigate these risks, they cannot be completely eliminated. See “Risk Factors” for a further discussion of the risks of operating in foreign markets.
Reportable Segments
The Company has one reportable segment, which encompasses all aspects of its marine transportation services business. As the chief operating decision maker, our Chief Executive Officer evaluates the Company’s operating results on a consolidated basis to assess performance and allocate resources. While the Company’s vessels operate in various geographic regions and customer markets, they are centrally managed, share multiple forms of common costs, provide similar or complementary marine transportation services, are manned by crews that may move, from location to location or market to market as needed, and are marketed on a portfolio basis with the goal of maximizing Adjusted EBITDA and Adjusted Free Cash Flow and generating the highest possible rate of return on invested capital without a permanent commitment to geographic region or customer market.
Ongoing Acquisition/Investment Activities
We regularly evaluate additional acquisition opportunities and frequently engage in discussions with potential sellers. We are currently focused on pursuing acquisition opportunities that will further diversify our vessel holdings and the specialty services we offer. The timeline required to negotiate and close on any one or more acquisition opportunities is at times unpredictable and can vary greatly.
Our acquisitions may require material investments and could result in significant modifications to our capital plans, both in the aggregate amount of capital expenditures to be made and a reallocation of capital. Our acquisitions (including the ECO Acquisitions) are typically made for a purchase price which historically we have funded with a combination of borrowings, cash generated from operations and debt and/or equity issuances.
We typically do not announce a transaction until after we have executed a definitive agreement. In certain cases, in order to protect our business interests or for other reasons, we may defer public announcement of a transaction until closing or a later date. Past experience has demonstrated that discussions and negotiations regarding a potential transaction can advance or terminate in a short period of time. Moreover, the closing of any transaction for which we have entered into a definitive agreement may be subject to customary and other closing conditions, which may not ultimately be satisfied or waived. Accordingly, we can give no assurance that our current or future acquisition or investment efforts will be successful.
Seasonality
Demand for our oilfield-related offshore support services is directly affected by the levels of offshore drilling and production activity. Budgets of many of our customers are based upon a calendar year, and demand for our services has historically been stronger in the second and third calendar quarters when allocated budgets are expended by our customers and seasonal weather conditions are more favorable for offshore activities. Many other factors, such as the expiration of drilling leases and the supply of and demand for oil and natural gas, may affect this general trend in any particular year. In addition, we typically have an increase in demand for our vessels to survey and repair offshore infrastructure immediately following major hurricanes or other named storms in the U.S. GoM. Offshore wind construction projects on the U.S. East Coast are seasonal, typically occurring between April and September of each year. Servicing of existing offshore wind facilities with C/SOVs is expected to occur year-round. Our government business is unaffected by seasonality. Humanitarian assistance and disaster relief efforts have typically been more pervasive during the hurricane season.
Legal Matters
We may be party to various legal proceedings and claims from time to time in the ordinary course of our business.
130
Mexico Litigation
In the fourth quarter of 2023, maritime regulators in Mexico implemented new approaches in their oversight of Navieras that have historically had permissible levels of non-Mexican ownership, such as ours. As a result, we took legal action in Mexico to preserve our cabotage privileges there, and a Mexican court ordered that our cabotage privileges be reinstated. We have appealed this decision to further clarify the court’s ruling, and our cabotage privileges remain active during the pendency of the appeal. We expect the appellate process to last between one and three years. Despite these favorable court rulings, and the pendency of appeals, Mexican maritime regulators have limited our ability to object to the employment of non-Mexican flag vessels that compete with our own Mexican-flagged vessels, which is one of the privileges of a Mexican Naviera. Since the fourth quarter of 2023, we have moved all but two of our Mexican-flagged vessels into various non-Mexican international markets, while continuing to utilize our highly-skilled Mexican mariners and shore-based employees as part of our international services.
131
Directors and Executive Officers
The following table sets forth certain information concerning the individuals who will serve as our executive officers and directors upon the completion of this offering.
| Name |
Age | Position(s) | ||||
| Directors: |
||||||
| Todd M. Hornbeck |
56 | Chairman of the Board, President and Chief Executive Officer | ||||
| Admiral John Richardson, (USN Ret) |
64 | Lead Independent Director | ||||
| Kurt M. Cellar |
54 | Director | ||||
| Evan Behrens |
55 | Director | ||||
| Bobby Jindal |
53 | Director | ||||
| Sylvia Jo Sydow Kerrigan |
59 | Director | ||||
| James McConeghy |
30 | Director | ||||
| Jacob Mercer |
49 | Director | ||||
| L. Don Miller |
62 | Director | ||||
| Aaron Rosen |
43 | Director | ||||
| Chairman Emeritus: |
||||||
| Larry D. Hornbeck |
84 | Chairman Emeritus | ||||
| Other Executive Officers: |
||||||
| Carl G. Annessa |
67 | Executive Vice President—Military, Engineering, Repair & Maintenance | ||||
| James O. Harp, Jr. |
63 | Executive Vice President and Chief Financial Officer | ||||
| Samuel A. Giberga |
62 | Executive Vice President, General Counsel and Chief Compliance Officer & Corporate Secretary | ||||
| John S. Cook |
55 | Executive Vice President and Chief Commercial Officer | ||||
Directors
Todd M. Hornbeck is currently serving as our Chairman of the Board, President and Chief Executive Officer and founded Hornbeck in June 1997. Mr. Todd Hornbeck has served as the President and director of Hornbeck since founding the Company. Mr. Todd Hornbeck also served as Chief Operating Officer until February 2002, at which time he was appointed Chief Executive Officer. Additionally, in May 2005 he was appointed Chairman of the Board of Directors. Prior to founding Hornbeck, Mr. Todd Hornbeck was employed by the original Hornbeck Offshore Services, Inc., a NASDAQ-listed publicly traded offshore service vessel company founded by his father, Mr. Larry Hornbeck, our Chairman Emeritus, with over 105 offshore supply vessels operating worldwide, from 1991 to 1996, serving in various positions relating to business strategy and development. Following the Company’s merger with Tidewater Inc. (“Tidewater”) in March 1996, Mr. Todd Hornbeck accepted a position as Marketing Director-Gulf of Mexico with Tidewater, where his responsibilities included managing relationships and overall business development in the U.S. GoM region. He remained with Tidewater until the Company’s formation. Mr. Todd Hornbeck has served on the board of directors of the International Support Vessel Owners Association (“ISOA”), the Offshore Marine Service Association (“OMSA”) and the National Ocean Industries Association (“NOIA”). Mr. Todd Hornbeck’s extensive experience in the offshore service vessel industry, and over 25 years leading our company, positions him well to serve as our Chairman, President and Chief Executive Officer. As our founder, Mr. Todd Hornbeck brings his vision and goals for the Company to our Board of Directors. Under his leadership, we have expanded from a small private company to a large, global provider of technologically advanced offshore supply and multipurpose service vessels. The current Company carries the Hornbeck family name, uses the same horsehead logo and trademarks as the prior company and is able to benefit from long-standing working relationships with customers, vendors and Wall Street analysts, many of whom also had relationships with Messrs. Todd and Larry Hornbeck at the prior public company. Unlike other companies that are led by non-founding managers, the Company benefits from the history, entrepreneurial spirit, industry expertise and leadership of its founder.
132
Admiral John Richardson, (USN Ret) is expected to serve as our Lead Independent Director upon completion of this offering. Admiral Richardson (USN Ret) has served as an advisory director of Hornbeck since February 2023, and previously served as a director of Hornbeck from September 2020 to December 2022. Admiral Richardson (USN Ret) served 37 years in the U.S. Navy, completing his service as the Chief of Naval Operations (CNO), the top officer in the Navy. While in the Navy, Admiral Richardson (USN Ret) served in the submarine force. He commanded the attack submarine USS HONOLULU in Pearl Harbor, Hawaii, for which he was awarded the Vice Admiral James Bond Stockdale Inspirational Leadership Award. He went on to command at every level of the Navy. Admiral Richardson (USN Ret) served as the Director of Naval Reactors from 2012 until 2015, with responsibility for the full life-cycle, including regulatory responsibilities of more than 90 reactors operating around the world on nuclear-powered warships. After serving in this role, Admiral Richardson (USN Ret) served as the 31st Chief of Naval Operations from 2015 until 2019. Admiral Richardson (USN Ret) retired from the Navy in August 2019. Admiral Richardson (USN Ret) currently serves on the board of directors and as Chair of the Nuclear Oversight Committee of Constellation Energy Corporation. He also serves as director, Chair of the Special Programs Committee and a member of the Aerospace Safety and Finance Committees of the board of The Boeing Company, an aerospace company; and as director and member of the Audit and Finance and Compensation Committees of BWX Technologies, Inc., a supplier of nuclear components and fuel. Admiral Richardson (USN Ret) served as a member of the board of Exelon Corporation from 2019 through 2022. He also serves on the boards of the Center for New American Security and the Navy League of the United States. He is a senior advisor to the Johns Hopkins University Applied Physics Laboratory. Admiral Richardson (USN Ret) obtained a B.S. in physics from the U.S. Naval Academy, a master’s degree in electrical engineering from the Massachusetts Institute of Technology and Woods Hole Oceanographic Institution, and a master’s degree in national security strategy from the National War College. We believe that Admiral Richardson (USN Ret) is qualified to serve as a director because he is uniquely qualified to understand the Company’s operations, especially those in support of the United States government, and is well positioned to assist the Company in its diversification efforts.
Kurt M. Cellar has served as our Lead Independent Director since September 2020 and, upon completion of this offering, is expected to serve as a director of Hornbeck. Mr. Cellar currently serves as Lead Independent Director for American Banknote Corporation, where he serves as Chairman of both the Strategic Committee and Audit Committees. Mr. Cellar has served on the boards of more than twenty corporations over his career. In the past five years he has served as a corporate director for Six Flags Entertainment Corp (NYSE: SIX), U.S. Concrete, Inc. (NASDAQ: USCR), Guitar Center, Inc., Hawaiian Telecom, Inc. (NASDAQ: HCOM), and Home Buyers Warranty, Inc. From July 1999 until his retirement in January 2008, Mr. Cellar served as analyst, Director of Research and for the last five years as Partner and Portfolio Manager for Bay Harbour Management, LP. The firm received numerous awards including Absolute Returns Hedge Fund of the Year award in 2006. Prior to joining Bay Harbour, Mr. Cellar worked for the investment firm Remy Investors and Consultants and for the strategic consulting firm, LEK. Mr. Cellar received a B.A. in Economics/Business from the University of California, Los Angeles and a Masters of Business Administration in Finance from the Wharton School of Business at the University of Pennsylvania. Mr. Cellar is a retired Chartered Financial Analyst. We believe that Mr. Cellar is qualified to serve on our Board of Directors based on his significant financial and accounting experience as well as his public company board experience.
Evan Behrens has served as a director of Hornbeck since September 2020. Mr. Behrens currently serves as Managing Member of B Capital Advisors LLC, an investment firm. Previously, Mr. Behrens served as Senior Vice President of Business Development at SEACOR Holdings from May 2009 to May 2017. Mr. Behrens initially joined SEACOR Holdings in 2008 and managed its involvement in numerous significant investments and transactions. Prior to joining SEACOR Holdings, Mr. Behrens served as a partner at Level Global Investors and prior to that, founded and managed Infinity Point (formerly Behrens Rubinoff Capital Partners). Mr. Behrens previously served in various positions at Paribas Corporation, Odyssey Partners/Ulysses Management and SAC Capital Management. Mr. Behrens currently serves on the board of directors of Oppenheimer Holdings Inc., a multinational independent investment bank and financial services company. Previously, Mr. Behrens served as a board member of SEACOR Marine Holdings, Harte-Hanks, Inc., Continental Insurance Group, Ltd, Penford
133
Corporation, Global Marin Systems Limited, Trailer Bridge, Inc., Sidewinder Drilling LLC and Stemline Therapeutics. Mr. Behrens obtained an A.B. degree in political science from the University of Chicago. We believe that Mr. Behrens is qualified to serve as a director based on his broad experience regarding business valuations, mergers and acquisitions and investment management.
Bobby Jindal has served as a director of Hornbeck since September 2020. Since 2017, Mr. Jindal has served as an operating advisor to the Ares Private Equity Group. Mr. Jindal served as the governor of the State of Louisiana from January 2008 to January 2016. Prior to that, Mr. Jindal served as a member of the United States House of Representatives for the state of Louisiana from 2005 to 2008, as assistant Secretary for Health and Human Services for Planning and Evaluation from 2001 to 2003, as President of the University of Louisiana system from 1999 to 2001, and as Secretary of the Louisiana Department of Health and Hospitals from 1996 to 1997. Mr. Jindal currently serves as a director for U.S. Heart and Vascular and LifeMD, a public telehealth company which engages in offering a portfolio of direct-to-patient products and services. He has previously served as director of WellCare Health Plans Inc. Mr. Jindal obtained a B.S. from Brown University and a Masters of Letters in Politics from Oxford University at New College. We believe that Mr. Jindal is qualified to serve as a director because his broad financial and diplomatic experience makes him an invaluable asset as the Company delves into further diversification efforts, and the achievement of our strategic objectives.
Sylvia Jo Sydow Kerrigan has served as a director of Hornbeck since August 2022. Ms. Kerrigan currently serves as the Senior Vice President and Chief Legal Officer of Occidental Petroleum Company. She also serves on the board of directors of Diversified Energy, LLC and on the Board of Trustees for Southwestern University. She previously held various positions at Marathon Oil Corporation from 1995 to 2017, including serving as the Executive Vice President, General Counsel and Secretary and as the Chief Public Policy Officer and Chief Compliance Officer. Ms. Kerrigan worked at the United Nations Security Council’s Commission d’Indemnisation in Geneva, Switzerland from 2000 to 2002, serving as the senior legal officer responsible for arbitrating losses sustained by international oil companies following the 1990 Iraqi invasion of Kuwait. Ms. Kerrigan is past chairman of the State Bar of Texas International Law Section and a Life Fellow of the Texas Bar Foundation. She also previously served as Executive Director of the Kay Bailey Hutchinson Energy Center for Business Law and Policy at the University of Texas in Austin. Ms. Kerrigan previously served on the boards of directors of Team, Inc., Nine Point Energy and Alta Mesa Resources. We believe that Ms. Kerrigan is qualified to serve as a director because she brings to our Board of Directors significant major oil company executive experience and critical insights into the issues facing the oil and gas industry.
James McConeghy has served as a director of Hornbeck since February 2024. Mr. McConeghy is a Vice President in the Ares Credit Group, where he focuses on opportunistic credit investing. Prior to joining Ares in 2019, Mr. McConeghy was an Investment Banking Analyst at Moelis & Company from July 2017 to June 2019. Previously, Mr. McConeghy was an Associate in PricewaterhouseCoopers’s Transaction Services Group from September 2015 to June 2017. He currently serves on the boards for the parent entities of Virgin Voyages, TriMark USA and Convene. Mr. McConeghy holds a B.S. from Villanova University in Accountancy. He holds a CPA license (inactive) in the Commonwealth of Pennsylvania. Mr. McConeghy is qualified to serve as a director based on his investment and financial expertise. In addition, Mr. McConeghy provides the perspective of a significant stockholder.
Jacob Mercer has served as a director of Hornbeck since July 2023. Mr. Mercer is a Partner, Head of Special Situations and Restructuring at Whitebox. Prior to joining Whitebox in 2007, Mr. Mercer worked for Xcel Energy Inc. (NASDAQ: XEL) (“Xcel Energy”) as Assistant Treasurer and Managing Director. Before joining Xcel Energy, he was a Senior Credit Analyst and Principal at Piper Jaffray and a Research Analyst at Voyageur Asset Management. Mr. Mercer also served as a logistics officer in the United States Army. Mr. Mercer has served as a director on numerous private and public company board of directors including current roles at HC Minerals since March 2024, Malamute Energy, Inc. since 2016, and Currax Pharmaceuticals LLC since 2018. Past director roles include A.M. Castle & Co. (formerly OTC: CTAM) from 2017 to 2020, GT Advanced Technologies Inc. (formerly NASDAQ: GTAT) from 2019 to 2021, Hycroft Mining Holding Corporation (NASDAQ: HYMC), formerly Hycroft
134
Mining Corporation, from 2015 to 2020, Hi-Crush Inc. (formerly NYSE: HCR) from October 2020 to March 2024, Par Pacific Holdings (NYSE: PARR), formerly Par Petroleum Corporation, from 2012 to 2015, Platinum Energy Solutions, Inc. (formerly NYSE: FRAC) from 2013 to 2017, Piceance Energy, LLC (d/b/a Laramie Energy) from 2012 to 2015, and SAExploration Holdings, Inc. (Formerly NASDAQ: SAEX) from July 2016 to June 2019 and from February 2020 to December 2020. Mr. Mercer holds a B.A. with a double major in economics and business management from St. John’s University. He also holds the Chartered Financial Analyst (CFA) and the Certified Turnaround Professional (CTP) designations. We believe that Mr. Mercer is qualified to serve as a director based on his investment and financial expertise. In addition, Mr. Mercer provides the perspective of a significant stockholder.
L. Don Miller has served as a director of Hornbeck since February 2021. Mr. Miller is currently the Chief Financial Officer of Lake Resources NL. Prior to joining Lake Resources NL in December 2023, Mr. Miller served as President and Chief Executive Officer of Bristow Group Inc. (“Bristow”) from February 2019 to June 2020. He previously served as Senior Vice President and Chief Financial Officer of Bristow from August 2015 to February 2019. Before that he served as Bristow’s Senior Vice President, Mergers, Acquisitions and Integration from June 2015 to August 2015, its Vice President, Mergers, Acquisitions and Integration from November 2014 to June 2015 and its Vice President, Strategy and Structured Transactions from 2010 to 2014. Prior to joining Bristow, Mr. Miller worked as an independent consultant from 2008 to 2010 assisting companies in capital markets and in a financial advisory capacity. He was previously the post-petition President and Chief Executive Officer for Enron North America Corp. and Enron Power Marketing, Inc. from 2001 to 2007 and also served in senior financial positions with Enron, including Director – Finance and Vice President, Asset Marketing Group from 1998 to 2001. Mr. Miller served as a supervisory director for Franks International N.V., an energy services provider, from 2020 to 2021. His career also includes seven years in senior financial positions with Citicorp Securities, Inc. and four years as an account executive with Dean Witter Reynolds, Inc. Mr. Miller is a CFA Charterholder. We believe that Mr. Miller is qualified to serve as a director because of his extensive financial, industry and management experience.
Aaron Rosen has served as a director of Hornbeck since December 2022. Mr. Rosen is a Partner, Co-Head of Opportunistic Credit and Co-Portfolio Manager of Special Opportunities in the Ares Credit Group, where he focuses on investing across the various Ares fund platforms. Mr. Rosen serves as a member of the Ares Credit Group’s Opportunistic Credit Investment Committee and the Ares Private Equity Group’s Corporate Opportunities Investment Committee. Mr. Rosen currently serves as a director, member of the audit committee and member of the nominating, governance and sustainability committee of the board of directors of Savers Value Village, Inc., positions he has held since April 2021. He also currently serves on the boards of the parent entities of Consolidated Precision Products, TriMark USA, Virgin Voyages and WHP Global. Prior to joining Ares in 2018, Mr. Rosen was a Partner and Director of Research at Archview Investment Group, where he focused on credit and equity investments in both the U.S. and internationally. Prior to Archview, Mr. Rosen was a Vice President at Citigroup, where he was a founding member of the Citibank Global Special Situations Group focused on U.S. credit and value equity investment strategies. In addition, Mr. Rosen was a member of Citigroup’s Asset-Based Finance group, where he focused on structuring senior secured debt financings for non-investment grade corporate borrowers. Mr. Rosen holds a B.S., summa cum laude, from New York University’s Stern School of Business in Finance and Information Systems, where he received the Valedictorian Award. We believe that Mr. Rosen is qualified to serve as a director because of his extensive financial and accounting expertise. In addition, Mr. Rosen provides the perspective of a significant stockholder.
Chairman Emeritus
Larry D. Hornbeck serves as Hornbeck’s Chairman Emeritus, a role he assumed in September 2020. An executive with over 50 years of experience in the offshore supply vessel business worldwide, Mr. Larry Hornbeck was the sole founder of the original Hornbeck Offshore Services, Inc., and from its inception in 1981 until its merger with Tidewater in March 1996, Mr. Larry Hornbeck served as the Chairman of the Board, President and Chief Executive Officer of Hornbeck Offshore Services, Inc. Following the merger, Mr. Larry Hornbeck served as a director and a member of the audit committee of Tidewater from March 1996 until October 2000. From 1969 to 1980, Mr. Larry Hornbeck served as an officer in various capacities, culminating as
135
Chairman, President and Chief Executive Officer of Sealcraft Operators, Inc., a former NASDAQ-listed publicly traded offshore service vessel company operating 29 geophysical and specialty service vessels worldwide. He served on the board of directors and as chairman of the compensation committee of Costal Towing, an inland marine tug and barge company. Mr. Larry Hornbeck assisted in orchestrating the founding of the current Company and is the father of Mr. Todd M. Hornbeck, our Chairman of the Board, President and Chief Executive Officer. In addition to the leadership roles in which Mr. Larry Hornbeck has served or currently serves, he has extensive involvement in international and domestic marine industry associations. Mr. Larry Hornbeck helped form and served on the boards of several marine industry associations, including the OMSA, and the NOIA. He also served on the board of directors of the American Bureau of Shipping and the ISOA. We believe that Mr. Hornbeck is qualified to serve as Chairman Emeritus because Mr. Larry Hornbeck brings to our Board of Directors a deep understanding of the operations of a public company in the offshore service vessel industry. With his many years of experience as both Chief Executive Officer and Chairman of the board of directors of the original Hornbeck Offshore Services, Inc. and of Sealcraft Operators, Inc., Mr. Larry Hornbeck brings not only management expertise, and unique technical knowledge of offshore service vessels and their application, construction and operation, but also has longstanding relationships with customers and vendors. This, combined with his years of experience as Chairman Emeritus and his continued active involvement in the Company, make him an invaluable contributor to the Company.
Other Executive Officers
Carl G. Annessa joined Hornbeck in September 1997 and is currently serving as our Executive Vice President—Military, Engineering, Repair & Maintenance. Mr. Annessa previously served as our Chief Operating Officer from February 2002 to September 2020. Prior to February 2002, Mr. Annessa served as our Vice President of Operations beginning in September 1997. Mr. Annessa is responsible for executive oversight of the Company’s fleet operations and for oversight of design and implementation of our vessel construction and modification programs. Prior to joining Hornbeck, Mr. Annessa was employed for 17 years by Tidewater in various technical and operational management positions, including management of large fleets of offshore supply vessels in the Arabian Gulf, Caribbean and West African markets, and was responsible for the design of several of Tidewater’s vessels. Mr. Annessa was employed for two years by Avondale Shipyards, Inc. as a mechanical engineer before joining Tidewater. Mr. Annessa received a degree in naval architecture and marine engineering from the University of Michigan in 1979.
James O. Harp, Jr. joined Hornbeck in 2001 and is currently serving as our Executive Vice President and Chief Financial Officer. Mr. Harp has served as the Chief Financial Officer for Hornbeck since joining the Company. He was appointed Executive Vice President in February 2005. Prior to that time, he served as our Vice President beginning in January 2001. Before joining the Company, Mr. Harp served as Vice President in the Energy Groups of investment banking firms RBC Dominion Securities Corporation, from August 1999 to January 2001, and Jefferies & Company, Inc. from June 1997 to August 1999. During his investment banking career, Mr. Harp worked extensively with marine-related oil service companies, including Hornbeck as an investment banker in connection with the Company’s private placement of common stock in November of 2000. From July 1982 to June 1997, he held roles of increasing responsibility in the tax section of Arthur Andersen LLP, ultimately serving as a Tax Principal, and had a significant concentration of international clients in the oil service and maritime industries. Since April 1992, he has also served as Treasurer and Director of SEISCO, Inc., a privately-held seismic brokerage company that he co-founded. In June 2023, Mr. Harp was appointed President of SEISCO, Inc. Mr. Harp is an inactive certified public accountant in Louisiana.
Samuel A. Giberga joined Hornbeck in January 2004 and is currently serving as our Executive Vice President, General Counsel and Chief Compliance Officer & Corporate Secretary. Mr. Giberga has served as the General Counsel of Hornbeck since joining the Company. He was appointed Corporate Secretary in January 2021, Executive Vice President and Chief Compliance Officer in June 2011, and served as Senior Vice President beginning in February 2005. Prior to joining Hornbeck, Mr. Giberga was engaged in the private practice of law for 14 years. During his legal career, Mr. Giberga has worked extensively with marine and energy service companies in a variety of contexts with a concentration in general business, international and intellectual property matters.
136
John S. Cook is currently serving as our Executive Vice President and Chief Commercial Officer. Mr. Cook joined Hornbeck in May 2002 as our Chief Information Officer and served in that role until August 2024. He was appointed Executive Vice President and Chief Commercial Officer in February 2013, and served as a Senior Vice President beginning in May 2008. Mr. Cook was initially designated an executive officer and appointed a Vice President of the Company in February 2006. Before joining Hornbeck, Mr. Cook held roles of increasing responsibility in the business consulting section of Arthur Andersen LLP from January 1992 to May 2002, ultimately serving as a Senior Manager. During his consulting career, he assisted numerous marine and energy service companies in various business process and information technology initiatives, including strategic planning and enterprise software implementations. Mr. Cook is an inactive certified public accountant in Louisiana and is a member of the American Institute of Certified Public Accountants and the Society of Louisiana Certified Public Accountants.
Family Relationships
Mr. Todd M. Hornbeck, the Chairman of the Board, President and Chief Executive Officer of the Company, is the son of Mr. Larry Hornbeck, who serves as Hornbeck’s Chairman Emeritus and assisted in orchestrating the founding of the current Company.
Composition of the Board of Directors
Our business and affairs are managed under the direction of our Board of Directors. Upon completion of this offering, our Board of Directors will initially consist of ten directors. Thereafter, our Board of Directors will have discretion to determine the size of the Board of Directors, subject to the terms of our amended and restated certificate of incorporation. Subject to certain exceptions, newly created director positions resulting from an increase in size of the Board of Directors and vacancies may be filled by our Board of Directors. See “Description of Capital Stock and Warrants—Size of the Board of Directors and Vacancies.”
Our amended and restated certificate of incorporation will provide that following the completion of this offering, the principal stockholders managed or advised by Ares or its affiliates (the “Ares principal stockholders”) will have the right to nominate to our Board of Directors (i) two nominees for so long as the Ares principal stockholders beneficially own 20% or greater of our Fully Diluted Securities and (ii) one nominee for so long as the Ares principal stockholders beneficially own at least (i) prior to the first anniversary of the consummation of this offering, 5% of our Fully Diluted Securities and (ii) thereafter, 10% of our Fully Diluted Securities ((i) and (ii), as applicable, the “Minimum Threshold”), but less than 20% of our Fully Diluted Securities. Aaron Rosen and James McConeghy will be the initial director nominees of the Ares principal stockholders. The principal stockholders managed or advised by Highbridge or its affiliates (the “Highbridge principal stockholders”) will have the right to nominate to our Board of Directors one nominee for so long as the Highbridge principal stockholders beneficially own at least the Minimum Threshold of our Fully Diluted Securities. Sylvia Jo Sydow Kerrigan will be the initial director nominee of the Highbridge principal stockholders. The principal stockholders managed or advised by Whitebox or its affiliates (the “Whitebox principal stockholders”) will have the right to nominate to our board of directors one nominee for so long as the Whitebox principal stockholders beneficially own at least the Minimum Threshold of our Fully Diluted Securities. Jacob Mercer will be the initial director nominee of the Whitebox principal stockholders. See “Description of Capital Stock and Warrants—Director Nomination Rights.”
At all times, the composition of our Board of Directors will remain compliant with NYSE rules and the Jones Act. Such compliance includes, among other things, a requirement that no more than a minority of the number of directors necessary to constitute a quorum of the Board of Directors (or any committee thereof) be non-U.S. citizens.
Director Independence
Pursuant to the corporate governance standards of the NYSE, a director employed by us cannot be deemed an “independent director,” and each other director will qualify as “independent” only if our Board of Directors
137
affirmatively determines that he has no material relationship with us, either directly or as a partner, stockholder or officer of an organization that has a relationship with us. The fact that a director may own our capital stock is not, by itself, considered a material relationship. Based on information provided by each director concerning his or her background, employment and affiliations, our Board of Directors has affirmatively determined that each of Kurt M. Cellar, Evan Behrens, James McConeghy, Sylvia Jo Sydow Kerrigan, Bobby Jindal, Jacob Mercer, L. Don Miller, Aaron Rosen and Admiral John Richardson (USN Ret) are independent in accordance with the NYSE rules.
Lead Independent Director
Our amended and restated certificate of incorporation provides that our Board of Directors shall have a Lead Independent Director and, upon the completion of this offering, we expect that Admiral John Richardson (USN Ret.) will serve as the Lead Independent Director of our Board of Directors. Upon the completion of this offering, our Board of Directors will have adopted a written charter for the office of the Lead Independent Director which will take effect upon the completion of this offering. This charter will be posted on our website upon the completion of this offering.
Securityholders Agreement
In connection with the closing of this offering, we will amend and restate our existing securityholders agreement (the “A&R Securityholders Agreement”). Pursuant to the A&R Securityholders Agreement, the Company will agree to take all necessary action (subject to applicable law) to cause the election of each director designated by Ares, Highbridge or Whitebox in their capacities as Appointing Persons in accordance with the terms of our amended and restated certificate of incorporation. The A&R Securityholders’ Agreement will also provide that the Company will agree to take all necessary action (subject to applicable law) to cause any vacancies created by death, resignation, removal, retirement or disqualification of a director designated by an Appointing Person to be filled by such Appointing Person in accordance with the terms of our amended and restated certificate of incorporation.
Board Committees
Upon the completion of this offering, our Board of Directors will have three standing committees: an audit committee, a compensation committee and a nominating, corporate governance and sustainability committee. The composition and responsibilities of each committee following this offering are described below. Members serve on these committees until their resignation or until otherwise determined by our board.
For each committee below, the rules of the SEC and the exchange upon which we list our shares require us to have one independent committee member upon the listing of our common stock, a majority of independent committee members within 90 days of the effective date of the registration statement and all independent audit committee members within one year of the effective date of the registration statement.
Additionally, for so long as any of the principal stockholders own at least the Minimum Threshold of our Fully Diluted Securities, each such principal stockholder will have the right to designate one member of each of the compensation committee and the nominating, corporate governance and sustainability committees of the Board of Directors. The chairperson and any additional committee members shall be determined by the Board of Directors and comply with the independence requirements of the NYSE and the SEC, as applicable, as well as the citizenship requirements of the Jones Act.
Audit Committee
Upon the completion of this offering, our audit committee will consist of Kurt M. Cellar, Evan Behrens and L. Don Miller, with Mr. Cellar serving as chair. Our Board of Directors has determined that Kurt M. Cellar, Evan Behrens and L. Don Miller each satisfy the independence requirements for audit committee members under the listing standards of the NYSE and Rule 10A-3 of the Exchange Act. Mr. Miller has been determined to be an audit committee
138
“financial expert” as defined under SEC rules. All members of the audit committee are able to read and understand fundamental financial statements, are familiar with finance and accounting practices and principles and are financially literate. Our audit committee will be responsible for, among other things:
| • | selecting and hiring our independent auditors, and approving the audit and non-audit services to be performed by our independent auditors; |
| • | assisting the Board of Directors in evaluating the qualifications, performance and independence of our independent auditors; |
| • | assisting the Board of Directors in monitoring the quality and integrity of our financial statements and our accounting and financial reporting; |
| • | reviewing the adequacy and effectiveness of our internal control over financial reporting processes; |
| • | reviewing with management and our independent auditors our annual and quarterly financial statements; |
| • | establishing procedures for the receipt, retention and treatment of complaints received by us regarding accounting, internal accounting controls or auditing matters and the confidential, anonymous submission by our employees of concerns regarding questionable accounting or auditing matters; |
| • | preparing the audit committee report that the SEC requires in our annual proxy statement; and |
| • | reviewing related-party transactions. |
Upon the completion of this offering, our Board of Directors will have adopted a written charter for the audit committee which will take effect upon the completion of this offering and which satisfies the applicable rules of the SEC and the listing standards of the NYSE, including with respect to the review of related party transactions. This charter will be posted on our website upon the completion of this offering.
Compensation Committee
Upon completion of this offering, our compensation committee will consist of Bobby Jindal, James McConeghy and Sylvia Jo Sydow Kerrigan, with Mr. Jindal serving as chair. The compensation committee will be responsible for, among other things:
| • | reviewing and approving corporate goals and objectives relevant to the compensation of our chief executive officer, evaluating our chief executive officer’s performance in light of those goals and objectives, and, either as a committee or together with the other independent directors (as directed by the Board of Directors), determining and approving our chief executive officer’s compensation level based on such evaluation; |
| • | reviewing and approving, or making recommendations to the Board of Directors with respect to, the compensation of our other executive officers, including annual base salary, bonus, equity-based incentives and other benefits; |
| • | reviewing and recommending to our Board of Directors with respect to the compensation of our directors; and |
| • | reviewing and making recommendations with respect to our equity compensation plans. |
Upon the completion of this offering, our Board of Directors will have adopted a written charter for the compensation committee which will take effect upon the completion of this offering and which satisfies the applicable rules of the SEC and the listing standards of the NYSE. This charter will be posted on our website upon the completion of this offering.
Nominating, Corporate Governance and Sustainability Committee
Upon completion of this offering, we expect our nominating, corporate governance and sustainability committee will consist of Admiral John Richardson (USN Ret), Sylvia Jo Sydow Kerrigan and Evan Behrens,
139
with Admiral Richardson serving as chair. The nominating, corporate governance and sustainability committee is responsible for, among other things:
| • | assisting our Board of Directors in identifying prospective director nominees and recommending nominees to the Board of Directors; |
| • | overseeing the evaluation of the Board of Directors and management; |
| • | reviewing developments in corporate governance practices and developing and recommending a set of corporate governance guidelines; |
| • | overseeing the Company’s sustainability plan; and |
| • | recommending members for each committee of our Board of Directors. |
Upon the completion of this offering, our Board of Directors will have adopted a written charter for the nominating, corporate governance and sustainability committee which will take effect upon the completion of this offering and which satisfies the applicable rules of the SEC and the listing standards of the NYSE. This charter will be posted on our website upon the completion of this offering.
Compensation Committee Interlocks and Insider Participation
None of our executive officers serve on the Board of Directors or compensation committee of a company that has an executive officer that serves on our Board of Directors or compensation committee. No member of our Board of Directors is an executive officer of a company in which one of our executive officers serves as a member of the board of directors or compensation committee of that company.
Codes of Conduct
We have a Code of Conduct that applies to all of our officers and employees, including our principal executive officer, principal financial officer and principal accounting officer, and a Code of Business Conduct and Ethics for members of our Board of Directors, which are posted on our Internet website on the “Governance Highlights” page accessible through the “Investors” tab. Our Code of Conduct is a “code of ethics,” as defined in Item 406(b) of Regulation S-K. The information contained on, or accessible from, our website is not part of this prospectus by reference or otherwise. We will make any legally required disclosures regarding amendments to, or waivers of, provisions of our code of ethics on our website.
Corporate Governance Guidelines
Upon the completion of this offering, our Board of Directors will have established corporate governance guidelines in accordance with the corporate governance rules of the NYSE, which will be posted on our Internet website on the “Governance Highlights” page accessible through the “Investors” tab. The information contained on, or accessible from, our website is not part of this prospectus by reference or otherwise.
These corporate governance guidelines will include the definition of independence used by the Company to determine whether our directors and nominees for directors are independent, which are the same qualifications prescribed under the NYSE Listing Standards. Pursuant to these corporate governance guidelines, our non-management directors will be required to meet in separate sessions without management on a regularly scheduled basis, but no less than four times a year. Generally, these meetings may occur as an executive session without the management director in attendance in conjunction with regularly scheduled meetings of our Board of Directors throughout the year. If the non-management directors include directors that are not independent directors (as determined by our Board of Directors), the independent directors will be required to meet in at least one separate session annually that includes only the independent directors. Because the Chairman of the Board is also a member of management, the non-management directors’ and independent directors’ separate sessions will be presided over by the Lead Independent Director or, in his absence, by an independent director designated by the Lead Independent Director or elected by a majority of the independent directors.
140
Compensation Discussion and Analysis
The purpose of this compensation discussion and analysis section is to provide information about the material elements of compensation that are paid, awarded to or earned by our “named executive officers,” who consist of our principal executive officer, principal financial officer and three other most highly compensated executive officers. For our fiscal year ended December 31, 2023 (“Fiscal 2023”), our named executive officers (“NEOs”) were:
| • | Todd M. Hornbeck, Chairman of the Board, President and Chief Executive Officer; |
| • | James O. Harp, Jr., Executive Vice President and Chief Financial Officer; |
| • | Samuel A. Giberga, Executive Vice President, General Counsel and Chief Compliance Officer and Corporate Secretary; |
| • | John S. Cook, Executive Vice President and Chief Commercial Officer; and |
| • | Carl G. Annessa, Executive Vice President—Military, Engineering, Repair & Maintenance. |
Compensation Philosophy and Objectives
Upon completion of this offering, our compensation committee and our Board of Directors will review and approve the compensation of our NEOs and oversee and administer our executive compensation programs and initiatives. As we return to being a public company, we expect that the components and underlying driving factors of our executive compensation programs will continue to evolve. Accordingly, the compensation paid to our NEOs for Fiscal 2023 is not necessarily indicative of how we will compensate our NEOs after this offering.
Our executive compensation programs reflect our entrepreneurial and innovative culture and philosophy. Executives, including our NEOs, (i) are hired to devise and execute strategies that create long-term stockholder value consistent with our mission statement and core values and (ii) are appropriately rewarded for doing so.
The objectives of our executive compensation programs are to (i) attract and retain executives who possess abilities essential to the Company’s long-term competitiveness and success, (ii) support a performance-oriented environment and (iii) create a culture of ownership, allowing executives to share meaningfully with stockholders in the long-term enhancement of stockholder value. Our compensation program for executive officers rewards the following attributes:
| • | Financial Performance. We reward decision-making that is designed to achieve operating results that increase stockholder value over the long-term and that compare favorably to the operating results of our peers. |
| • | Excellence. We expect our executive officers to discharge their duties with excellence, professionalism and a high level of enthusiasm, integrity, diligence, analytical rigor, business acumen and attention to detail. |
| • | Leadership. Executives of the Company are expected to demonstrate leadership. |
| • | Teamwork. Executives are evaluated as members of a team, not merely as individuals. |
| • | Forward-Looking Focus. We believe executives need to focus not only on our short-term performance, but also on our long-term future. Accordingly, we compensate our executives in a manner that incentivizes them to manage our business in a way that enables us to meet our long-range objectives, as well as our short-term goals. |
| • | Loyalty. We promote a culture of ownership throughout the Company and reward employees, including our NEOs, who remain dedicated to the Company over the long-term with equity ownership opportunities, as well as other forms of long-term compensation. |
141
| • | Prudent Operating Practices. The Company expects executive decision-making that promotes safe, effective, compliant and prudent work practices. |
In addition to the factors above, we consider other factors in establishing compensation, such as our financial condition and available resources and the competition for the services of our executives, each as of the time of the applicable compensation decision. We consider the competitive market for corresponding positions within comparable geographic areas and companies of similar size and stage of development operating in our industry or in other industries that are relevant to us.
Compensation Committee Procedures
The compensation committee considers Company information, historical compensation information about each executive officer and data derived from market sources, including data regarding peer companies and current industry conditions, as points of reference for the appropriate mix of compensation elements.
The Role of the Compensation Committee. Our compensation committee is comprised solely of directors who (i) meet the independence requirements of Section 303A of the NYSE Listed Company Manual and the provisions of Section 952 of the Dodd-Frank Act and any rules or regulations promulgated thereunder and (ii) qualify as “Non-Employee Directors” under Rule 16b-3 of the Exchange Act.
The compensation committee is responsible for (i) establishing and administering an overall compensation program for our executive officers and approving all compensation for our executive officers, (ii) establishing and administering the Company’s policies governing annual cash compensation and equity incentive awards for employees other than our executive officers and (iii) ensuring that the administration of the Company’s incentive compensation and certain employee benefit plans is delegated appropriately in accordance with the applicable governing documents. The compensation committee meets multiple times each year to analyze and discuss the Company’s compensation plans, proposals and other compensation-related issues. From time to time, it also engages in informal sessions with and without executive management. These sessions usually coincide with the Company’s annual budget process. At the regular meeting of the compensation committee in the first quarter of each year, the compensation committee determines and approves the award, if any, of prior year cash incentive compensation. In addition, typically during the fourth quarter, the compensation committee determines the following year’s annual compensation for our executive officers, including the establishment of base salaries, determination of any potential cash incentive compensation targets and participation levels of each NEO and approval of long-term incentive awards under the Company’s 2020 Management Incentive Plan. The compensation awards approved by the compensation committee are part of the annual budget approved by the Board of Directors, which is typically approved at the same time. When appropriate, the compensation committee recommends compensation or benefit policies or plans (or amendments to existing policies or plans) and amendments to employment agreements with our executive officers to the full Board of Directors. The Chief Executive Officer reviews the performance of the other executive officers and recommends to the compensation committee the base salary, cash incentive compensation, equity incentive compensation and other benefits for such executive officers. The compensation committee considers the Chief Executive Officer’s recommendations when establishing the base salary, cash incentive compensation, equity incentive compensation and other benefits for the other executive officers.
Compensation Consultant. The compensation committee has the authority to directly engage independent consultants. In late 2021, the compensation committee evaluated several independent consultants and engaged Lyons Benenson & Co. (“LB&Co.”) to perform a full compensation review and analysis for the fiscal year ended December 31, 2022 (“Fiscal 2022”). As part of their review, LB&Co. provided advice on the compensation strategy and program design, compared the Company’s compensation programs with those of other companies and reviewed and recommended an updated peer group. LB&Co. was again retained to review and make recommendations concerning compensation for Fiscal 2023. As discussed below in the section titled “Go-Forward Compensation Arrangements—Compensation Consultant and Peer Group,” the compensation
142
committee more recently retained Frederic W. Cook & Co., Inc. (“FW Cook”) to advise the Company on compensation as the Company prepared for a public offering.
Benchmarks. We compete with other companies for executive talent. In doing so, we consider prevailing executive compensation trends in order to establish whether our compensation is appropriate, competitive and in-line with our overall executive compensation philosophy and objectives. The compensation committee considers competitive market data, including compensation levels and other information derived from: (i) public filings of publicly traded energy service companies identified by compensation consultants, other advisors or the compensation committee as having sufficiently similar operating characteristics with the Company so as to provide a source of meaningful comparison, or our “Industry Peer Group”; (ii) public filings of publicly traded marine service companies that are our direct competitors; and (iii) published survey information for the energy industry, as well as the broader commercial industry, when appropriate. Our competitive market is not comprised strictly of vessel owners, because the competition we face for certain executive talent is not limited to marine companies, and we believe that the number of such companies represents too small of a sample size for a reasonable comparison. Generally, the compensation committee considers how the compensation of our executives compares with the individual elements of, as well as the total direct compensation of, the NEOs of the groups described above.
In November of 2021, at the compensation committee’s request, LB&Co. identified and selected a peer group that was representative of the competitive compensation landscape and the marketplace for executive talent. The Industry Peer Group was again reviewed in November of 2022, and no changes were recommended. The companies that are included in the Company’s public company Industry Peer Group consist of the following:
Industry Peer Group Used to Benchmark 2021 - 2023 Executive Compensation
Bristow Group Inc. (VTOL)
Dril-Quip, Inc. (DRQ)
Forum Energy Technologies, Inc. (FET)
Great Lakes Dredge & Dock Corporation (GLDD)
Helix Energy Solutions Group, Inc. (HLX)
Kirby Corporation (KEX)
Newpark Resources, Inc. (NR)
Oceaneering International, Inc. (OII)
Oil States International, Inc. (OIS)
SEACOR Marine Holdings Inc. (SMHI)
TETRA Technologies, Inc. (TTI)
Tidewater Inc. (TDW)
Role of Executive Management in the Compensation Process. The compensation committee works with executive management with respect to the practical aspects of the design and execution of our executive compensation programs. Because our executive officers’ cash compensation is derived, in part, from the Company’s annual operating performance, the annual budget process is a key component of the process by which compensation is determined. The Chief Executive Officer and other members of management also evaluate comparative data of the Industry Peer Group and the broader commercial industry in order to compare proposed compensation against those offered by such peer companies and provide such information to the compensation committee. Following proposals made by executive management, including the Chief Executive Officer’s recommendations regarding the other NEOs, the compensation committee engages in one or more discussion sessions, with and without executive management, in order to make a final determination of compensation for the NEOs.
Incentive Cash Compensation Metrics. The Company’s performance measures for incentive cash compensation generally consist of Adjusted EBITDA, relative safety performance and a discretionary component
143
tied to the Company’s achievement of certain strategic objectives set by management and the Board of Directors. Adjusted EBITDA has historically been our most heavily weighted objective component because of the prominence that Adjusted EBITDA has in several facets of the Company’s operations. For instance, we disclose and discuss Adjusted EBITDA as a non-GAAP financial measure in our quarterly reports and conference calls with our financial constituents. Additionally, Adjusted EBITDA is used by management (i) as a supplemental internal measure for planning and forecasting overall expectations and for evaluating actual results against such expectations; (ii) when evaluating potential acquisition targets, whereby management compares our Adjusted EBITDA to that of the potential acquisition target; and (iii) to assess our ability to service existing fixed charges and incur additional indebtedness. The compensation committee may make certain adjustments to Adjusted EBITDA, including adjustments for gains or losses on early extinguishment of debt, asset sales, acquisitions, conversions or other investments funded by debt or new capital, growth resulting from investments funded with unreturned capital and other non-cash or non-recurring items, in years in which they have relevance to our compensation analysis and/or are unpredictable for budgeting purposes. In setting the Adjusted EBITDA target used as a component of our cash incentive compensation, the compensation committee historically set the Adjusted EBITDA target based on expected performance for the year considering industry conditions, competitor performance and expectations of the Board of Directors. This approach historically resulted in Adjusted EBITDA targets that were designed to incentivize management to perform at demanding levels. The Company has not historically changed the Adjusted EBITDA target for cash incentive compensation for a given year, other than, on occasion, to adjust for significant acquisitions, dispositions or financings that had occurred after, and were unanticipated at the time when, the Adjusted EBITDA target was originally set.
The safety component is evaluated by comparing the total recordable incident rate (also known as “TRIR”) with various industry benchmarks and our own prior safety performance. When selecting service providers, we know that our customers make decisions based on the safety performance of the provider. Therefore, we believe that by using a safety component in our objective performance measures, we will not only reinforce the culture of safety within our Company, which benefits our employees, but also should optimize revenue and improve our long-term performance sustainability.
We believe that these metrics incentivize management to strive for operating results that increase stockholder value, while reaffirming our commitment to operating our business at the highest levels of safety and with the utmost care and protection of the environment.
Elements of Compensation
Our current executive compensation program, which was set by our compensation committee, consists of the following components:
| • | base salary; |
| • | annual cash incentive awards linked to our overall performance; |
| • | periodic grants of long-term equity-based compensation, such as time- or performance-based restricted stock units or options; |
| • | other executive benefits and perquisites; and |
| • | employment agreements, which contain termination and change of control benefits. |
We combine these elements in order to formulate compensation packages that provide competitive pay, reward the achievement of financial, operational and strategic objectives and align the interests of our executive officers and other senior personnel with those of our stockholders.
Pay Mix
The various components of our executive compensation program are related (but distinct) and are designed to emphasize “pay for performance,” with a significant portion of total compensation reflecting a risk aspect tied
144
to achieving our long-term and short-term financial and strategic goals. Our compensation philosophy is designed to foster entrepreneurship at all levels of the organization and is focused on employee value and retention by making long-term, equity-based incentive opportunities a substantial component of our executive compensation. The appropriate level for each compensation component is based in part, but not exclusively, on internal equity and consistency, experience and responsibilities, as well as other relevant considerations, such as rewarding extraordinary performance and leadership qualities. When allocating compensation between long-term and currently paid out compensation, between cash and non-cash compensation or among different forms of non-cash compensation, we have focused on structuring overall compensation packages that serve the goals described above.
Base Salary
We pay a base salary to each of our executive officers in order to compensate them for their day-to-day services rendered to us over the course of each year. Each NEO’s base salary was contractually established pursuant to his Amended and Restated Employment Agreement, dated September 4, 2020 (each, an “EA”). Our compensation committee reviews base salaries annually, and each NEO’s may be increased, but not decreased (given the terms of each NEO’s EA), from the contracted amount. In performing its annual review, the compensation committee considers the scope of the NEO’s job responsibilities, the NEO’s unique skill sets and experience and individual contributions, market conditions, the NEO’s current compensation as compared to that provided by peer and competitor companies, including the Industry Peer Group, and the Company’s annual financial budget. In addition, the compensation committee considers the overall performance of the Company and the recommendations of the Chief Executive Officer concerning the compensation of the NEOs other than himself. For the Fiscal 2022 compensation season, the compensation committee engaged LB&Co. as its compensation consultant, and consistent with the recommendation of LB&Co., the compensation committee approved an increase in the base salary of each of the NEOs for Fiscal 2022, which remained unchanged for Fiscal 2023.
With respect to all of our NEOs (other than our Chief Executive Officer), our compensation committee determined to establish base salaries that are equal for each, given their shared level of seniority and experience, as well as the multiple roles each has played in the management of our business. This approach could change in the future. The equalized pay for our most senior executives also enhances our core values of teamwork. The base salaries paid to our NEOs in Fiscal 2023, Fiscal 2022 and the fiscal year ended December 31, 2021 (“Fiscal 2021”) are set forth in the Summary Compensation Table below.
Bonus
We utilize non-equity incentive compensation, also referred to herein as “cash incentive compensation,” in order to reward the achievement of specific results each year and the relative out-performance of our peers for the applicable measurement period. Each NEO’s EA provides for the payment of cash incentive compensation to the extent earned based on performance, as measured against reasonably obtainable objective performance criteria determined by the compensation committee, after consultation with the Chief Executive Officer, no later than 90 days following the commencement of the applicable fiscal year. Each NEO’s EA also provides for a target cash incentive compensation opportunity for each fiscal year equal to 100% of the NEO’s annualized base salary for the fiscal year (the “Target Bonus”). Each NEO’s actual cash incentive compensation for the relevant fiscal year will equal a percentage of the Target Bonus, determined as follows:
| • | 50% of the Target Bonus, if threshold levels of performance for that fiscal year are achieved; |
| • | 100% of the Target Bonus, if target levels of performance for that fiscal year are achieved; |
| • | 200% of the Target Bonus, if maximum levels of performance for that fiscal year are achieved; and |
| • | A percentage of the Target Bonus determined in accordance with the plan established by the compensation committee as described below, if achieved performance for the fiscal year is in between threshold, target and maximum levels of performance. |
145
In Fiscal 2021, the Company’s compensation program called for the award of cash incentive compensation based on relative achievement of two components: (i) Adjusted EBITDA (weighted 90%) and (ii) TRIR (weighted 10%). In Fiscal 2022 and Fiscal 2023, in an effort to motivate management to continue to make decisions that advance the Company’s strategic objectives, the compensation committee reduced the Adjusted EBITDA weighting to 80%, maintained the TRIR weighting at 10% and introduced a 10% weighted Strategic Plan component based upon the Board of Directors’ year-end assessment of various qualitative and quantitative factors that it deems relevant, in its sole discretion, to determine progress made by the Company toward achieving objectives set forth in the Company’s 2021-2023 Strategic Plan. The compensation committee annually revisits whether to change the vesting criteria or otherwise adjust the weighting of the Adjusted EBITDA, TRIR and discretionary Strategic Plan components. We refer to each of the Adjusted EBITDA, TRIR and discretionary Strategic Plan component weighting percentages herein as an “Applicable Percentage.”
The TRIR target uses annual industry safety benchmarks of IADC, ISOA and IMCA. Previously, we included the safety benchmark of OMSA; however, OMSA has discontinued publicizing its benchmark, so we no longer use OMSA as one of our safety benchmarks. Because the Company has usually outperformed these industry safety benchmarks and in an effort to place an even greater emphasis on the preservation of our executive team’s focus on efficient, safe and environmentally sound operations, the maximum safety level is set at 10% better than the average of the three-best annual TRIRs achieved by the Company in the most recent ten years. This results in a more difficult standard of TRIR necessary to achieve the maximum potential vesting for that factor.
The following table sets forth, for Fiscal 2023, the threshold, target and maximum goals for each of the non-discretionary components and their Applicable Percentages. Achievement of a performance level in between “threshold” and “target” levels or “target” and “maximum” levels, as applicable, results in a payout of cash incentive compensation equal to (i) a percentage of base salary determined using straight-line interpolation, multiplied by (ii) the Applicable Percentage.
| Component |
Applicable Percentage |
Threshold Goal |
Threshold Payout Attributable to Component |
Target Goal |
Target Payout Attributable to Component |
Maximum Goal 200% of Base |
Maximum Payout Attributable to Component | |||||||
| Adjusted EBITDA | 80% | 50% of the Adjusted EBITDA Target | 40% of Base Salary |
100% of the Adjusted EBITDA Target | 80% of Base Salary |
200% of the Adjusted EBITDA Target | 160% of Base Salary | |||||||
| TRIR | 10% | TRIR less than the lowest average of all three annual safety benchmarks for any year falling within the most recent three years compiled by IADC, ISOA and IMCA | 5% of Base Salary |
TRIR less than the lowest of any one of the three annual safety benchmarks for any year falling within the most recent three years compiled by IADC, ISOA and IMCA. | 10% of Base Salary |
TRIR at least 10% less than the Company’s three best annual TRIRs achieved in the last ten years | 20% of Base Salary | |||||||
A discussion concerning our use of TRIR in connection with compensation-related matters is found in the section captioned “Compensation Committee Procedures.”
For Fiscal 2023, the compensation committee decided that the Company’s Adjusted EBITDA for purposes of the cash incentive compensation calculations would exclude incremental EBITDA from growth capital, asset sales and any mergers and acquisitions that increased gross debt or resulted in more equity being issued, which would be addressed through alternative compensatory measures, including, but not limited to, special, event-driven bonuses and/or the Strategic Plan component. With these adjustments, for Fiscal 2023, the Company’s
146
Adjusted EBITDA was $222.8 million, which would have entitled each of the NEOs to receive a cash incentive compensation payout (in respect of the Adjusted EBITDA vesting criteria and based on the Applicable Percentage) equal to 58% of base salary (i.e., 73% of Base Salary x the Applicable Percentage of 80%). At the end of Fiscal 2023, in determining the final payout under the Adjusted EBITDA component, the compensation committee exercised its discretion to make additional adjustments to the Company’s Adjusted EBITDA for purpose of the cash incentive compensation, consistent with the compensation committee’s historical approach of making adjustments only in certain limited situations, including adjustments related to items that were unanticipated at the time when the Adjusted EBITDA target was originally set. These adjustments were primarily in respect of certain beneficial, un-budgeted vessel activity in Fiscal 2023. Specifically, in Fiscal 2023, as a result of a change in external market conditions, management accelerated the un-budgeted regulatory drydocking of six vessels to Fiscal 2023 from Fiscal 2024 and effected the un-budgeted reactivation of a vessel, in each case, for the benefit of the Company despite such action having an adverse effect on each NEO’s cash incentive compensation due to not being anticipated or budgeted for Fiscal 2023 when the Adjusted EBITDA target was originally set. As such, the compensation committee recalculated the Adjusted EBITDA target as though such expenditures had been budgeted for Fiscal 2023. In addition, the compensation committee considered the effect of certain unforeseen challenges that the Company faced in Mexico at the end of Fiscal 2023, which materially impacted contracted revenue, as being beyond management’s control, thus justifying an additional adjustment to the Adjusted EBITDA target. Following these adjustments, each of the NEOs was entitled to receive a cash incentive compensation payout (in respect of the Adjusted EBITDA vesting criteria and based on the Applicable Percentage) equal to 79% of base salary (i.e., 99% of Base Salary x the Applicable Percentage of 80%).
The TRIR was 0.09, which entitled each of the NEOs to receive cash incentive compensation (in respect of the TRIR vesting criteria and based on the Applicable Percentage) equal to 19% of base salary (i.e., 190% of Base Salary x the Applicable Percentage of 10%).
The Strategic Plan component of cash incentive compensation, comprising 10% of the aggregate potential cash incentive compensation that can be earned, is awarded based upon the Board of Directors’ year-end assessment of various qualitative and quantitative factors that it deems relevant, in its sole discretion, to determine progress made by the Company toward achieving objectives set forth in the Company’s Fiscal 2021-2023 Strategic Plan. For Fiscal 2023 performance, the compensation committee considered the continued progress toward the Company’s goals of right-sizing the fleet, the Company’s continued successful capitalization on oilfield recovery, the Company’s continued progress toward diversification of its core revenue stream, the successful activation of the ECO fleet and the significant time, effort and resources devoted to various projects aimed at increasing the Company’s scale and asset base necessary to position the Company for a public offering. Based on these factors, the compensation committee elected to award each NEO cash incentive compensation (in respect of the Strategic Plan component and based on the Applicable Percentage) equal to 20% of base salary (i.e., 200% of Base Salary x the Applicable Percentage of 10%), resulting in a combined weighted-average cash incentive compensation payout equal to 118% of base salary to each NEO for Fiscal 2023.
In extraordinary circumstances, the compensation committee can award event-driven or accomplishment-specific bonuses to the NEOs, which would be independent of the cash incentive compensation derived under the formulaic approach. In Fiscal 2023, the Company successfully resolved our litigation with Gulf Island (the “GIFI litigation”), which was a key accomplishment of management in Fiscal 2023 that benefited the Company. The compensation committee awarded a one-time accomplishment-specific bonus of $500,000 that was shared among the NEOs for the successful resolution of the GIFI litigation (the “One-Time GIFI Litigation Bonus”).
Combined, the formulaic and accomplishment-specific bonuses resulted in an aggregate bonus payout equal to 139% of the collective NEO base salaries.
Long-Term Equity-Based Compensation
We believe that the interests of our stockholders are best served when a meaningful portion of executive and management compensation is tied to equity ownership. On September 4, 2020, upon emergence from
147
restructuring, we adopted the 2020 Management Incentive Plan (the “2020 Management Incentive Plan”). Under the 2020 Management Incentive Plan, the compensation committee is authorized to grant stock options, stock appreciation rights, time-vesting restricted stock units (“RSUs”), performance-vesting restricted stock units (“PSUs”) and other equity-based awards. The Company has historically used a combination of stock options, RSUs and PSUs as a means to incentivize long-term employment and performance and to align individual compensation with the objective of building stockholder value. The Company uses equity incentive compensation, with vesting based on time, performance or both, as a means of encouraging a “culture of ownership” among employees, including our NEOs. The compensation committee believes that by using equity-based forms of incentive compensation, the interests of the Company’s stockholders and the Company’s management employees remain aligned over the long-term. The compensation committee exercises discretion in determining the number and type of equity awards to be granted to our executive officers, including our NEOs, as long-term incentive compensation. In exercising its discretion, the compensation committee considers a number of factors, including individual responsibilities, industry conditions, competitive market data and individual and Company performance. Subject to the express provisions of the 2020 Management Incentive Plan and direction from the Board of Directors, the compensation committee is authorized, among other things, (i) to select the executive officers to whom equity awards will be granted; (ii) to determine the type, size, terms and conditions of equity awards to executive officers, including vesting provisions and whether such equity awards will be time or performance-based; and (iii) to establish the terms for treatment of equity awards upon an executive officer’s termination of employment.
In March of 2023, we granted RSUs to each of our NEOs. We did not grant any PSUs to any of our NEOs in Fiscal 2023. The RSUs are subject to time-based vesting conditions only. One-half of the RSU award vested and was settled immediately on the grant date, and the remainder vested and became settleable (or will vest and become settleable, as applicable) in three equal tranches on February 15th of each of 2024, 2025 and 2026, subject to the NEO’s continued service through the applicable vesting date (except in the case of an NEO’s qualifying termination (i.e., a termination without “cause” or for “good reason” (each, as defined in the 2020 Management Incentive Plan)) occurring prior to the end of the vesting period, in which case the NEO will be entitled to vest in the next tranche of his RSUs). Notwithstanding the foregoing, all of an NEO’s unvested RSUs will vest upon the consummation of a Change of Control, subject to his continued service through the date of such Change of Control.
Each RSU granted to our NEOs has a right to be credited with dividends paid in respect of one share of our common stock (“Dividend Equivalents”). Dividend Equivalents credited to an NEO’s respective account and attributable to any particular RSU (and earnings thereon, if applicable) will be distributed to such NEO upon settlement of such RSU, as applicable, and if such RSU is forfeited, such NEO shall have no right to such Dividend Equivalents. For the avoidance of doubt, any Dividend Equivalents paid in respect of an RSU will be subject to the same vesting conditions as apply to the underlying award. Any payments made pursuant to the Dividend Equivalents will be paid in either cash or, to the extent such rights are paid in shares of our common stock, shares of our common stock. No dividends have been declared by the Company.
In Fiscal 2023, we granted time-based RSUs to our NEOs as set forth below.
| Executive |
Fiscal 2023 RSUs | |||
| Todd M. Hornbeck |
112,826 | |||
| James O. Harp, Jr. |
47,012 | |||
| Samuel A. Giberga |
47,011 | |||
| John S. Cook |
47,011 | |||
| Carl G. Annessa |
47,012 | |||
Other Executive Benefits and Perquisites
We provide our NEOs and our other employees with certain perquisites and other personal benefits as part of providing a competitive executive compensation program and for employee retention. We do not gross-up our
148
NEOs or our other employees for taxes payable in respect of their perquisites received. The following table generally identifies the Company’s benefit plans and identifies those employees who may be eligible to participate. The NEOs participate in the following benefit plans in the same manner that our employees do, except where noted below:
| Benefit Plan |
Executive Officers (including NEOs) |
Certain Managers | Full-Time Employees | |||
| Medical Insurance(1) |
X | X | X | |||
| Dental Insurance(1) |
X | X | X | |||
| Vision Insurance(1) |
X | X | X | |||
| Employee Assistance Plan |
X | X | X | |||
| Life and Disability Insurance(2) |
X | X | X | |||
| Flexible Spending Accounts |
X | X | X | |||
| 401(k) Plan |
X | X | X |
| (1) | In Fiscal 2023, each of our NEOs had a supplemental medical insurance policy that pays for all of the NEO’s eligible out-of-pocket medical, dental and vision expenses. |
| (2) | The NEOs, the Company’s Vice Presidents and certain other officers have Company-paid basic life and accidental death and dismemberment insurance in an amount equal to 1.5 times their base salary, up to $300,000. All other employees have Company-paid basic life and accidental death and dismemberment insurance in an amount equal to 1.5 times their base salary, up to $100,000. In addition, the NEOs, the Company’s Vice Presidents and certain other officers are eligible to receive disability benefits as long as they are disabled from performing their own occupation. For all other employees, they are entitled to disability benefits for up to 36 months, if they are disabled from performing their own occupation, and in order to be entitled to disability benefits after 36 months, they must be unable to work in any occupation. |
The Company believes it should provide limited perquisites for its executive officers. As a result, the Company has historically provided nominal perquisites. The following table generally illustrates the perquisites we do (and do not) provide and identifies those employees who may be eligible to receive them:
| Type of Perquisite |
Executive Officers (including NEOs) |
Certain Managers | Certain Full-Time Employees | |||
| Company Vehicle |
X | Not offered | X | |||
| Vehicle Allowance |
Not offered | X | X | |||
| Use of Company Aircraft |
X(1) | Not offered | Not offered | |||
| Supplemental Medical Insurance |
X | Not offered | Not offered | |||
| Country Club Memberships |
Not offered | Not offered | Not offered | |||
| Dwellings for Personal Use |
Not offered | Not offered | Not offered | |||
| Security Services |
Not offered | Not offered | Not offered | |||
| Supplemental Executive Retirement Program (SERP) |
Not offered | Not offered | Not offered | |||
| Deferred Compensation Plan Matching Contribution |
Not offered(2) | Not offered | Not offered |
| (1) | The Company intends to adopt a corporate aircraft use policy establishing parameters for executive use of corporate aircraft and related tax and SEC perquisite disclosure implications. Among other things, the Company intends that, under the policy, personal use of private aircraft by the Company’s Chief Executive Officer will be limited to a certain dollar value or number of hours and any excess personal use must be approved by the Company’s Lead Independent Director. Under the policy, any use of corporate aircraft for purposes that are not integrally and directly related to the performance of an executive’s job duties (including but not limited to personal use), will be appropriately disclosed as a perquisite in accordance with SEC regulations and guidance. Additional information with respect to the Chief Executive Officer’s corporate aircraft use is provided in the footnotes to the Summary Compensation Table. |
149
| (2) | A Deferred Compensation Plan was adopted by the Board of Directors in 2007. However, no matching provision has been authorized under the Deferred Compensation Plan, and, to date, no NEO has availed himself of participation therein. |
Employment Agreements and Severance Benefits
We believe that a strong, experienced management team is essential to the best interests of the Company and our shareholders. As noted above, we have entered into EAs with the NEOs in order to, among other things, minimize employment security concerns, including those arising in the course of negotiating and completing a significant transaction. The EAs provide for severance benefits, which are payable only if the NEO is terminated by the Company without “cause” or the NEO resigns for “good reason,” in each case, whether or not in connection with a change of control; these benefits are enumerated and quantified in the section captioned “Potential Payments Upon Termination or Change of Control.”
Section 162(m)
Section 162(m) of the Internal Revenue Code limits us to a deduction for federal income tax purposes of no more than $1 million of compensation paid to certain executive officers in a taxable year. Although we are mindful of the benefits of tax deductibility when determining executive compensation, we may approve compensation that will not be fully-deductible in order to ensure competitive levels of total compensation for our executive officers.
Section 409A Considerations
Another section of the Code, Section 409A, affects the manner in which deferred compensation opportunities are offered to our employees, because Section 409A requires, among other things, that “non-qualified deferred compensation” be structured in a manner that limits employees’ abilities to accelerate or further defer certain kinds of deferred compensation. We intend to operate our existing compensation arrangements that are covered by Section 409A in accordance with the applicable rules thereunder, and we will continue to review and amend our compensation arrangements where necessary to comply with Section 409A.
Section 280G
With respect to certain payments made or benefits provided to executives in connection with a change in control of a corporation that constitute “parachute payments” (as defined in Code Section 280G), Code Section 280G disallows a tax deduction for the payor with respect to, and Code Section 4999 imposes a 20% excise tax on the individual receiving, any such “parachute payments” that constitute “excess parachute payments” (as defined in Code Section 280G). Generally, such payments and benefits are in the nature of compensation that is linked to or triggered by a change in control and may include, but are not limited to, bonus payments, severance payments and accelerated vesting and payouts in respect of awards under long-term incentive plans, including equity-based compensation. None of our NEOs is entitled to any gross-up with respect to any excise taxes that may be imposed under Code Section 4999, and as noted in the “Narrative Description to the Summary Compensation Table” and the “Grants of Plan-Based Awards Table for the 2023 Fiscal Year,” each NEO’s EA provides for a “best-net” cutback.
Post Year-End Actions Affecting Compensation
As discussed above, in March of each year, the compensation committee determines the cash incentive compensation and/or bonuses for the NEOs for services provided during the previous fiscal year. The compensation committee also determines equity incentive compensation awards for the NEOs, taking into account services provided during the previous fiscal year and the intended incentive for long-term employment and performance. All budgeted annual base salaries, equity incentive awards, potential cash incentive awards and performance targets related thereto, which are applicable to the NEOs, are addressed by the Board of Directors in its final approval of the Company’s annual budget.
150
Compensation Risk Assessment
Once a publicly traded company, we will be subject to SEC rules regarding risk assessment. Those rules require a publicly traded company to determine whether any of its existing incentive compensation plans, programs or arrangements create risks that are reasonably likely to have a material adverse effect on the Company. We do not believe that any of our incentive compensation plans, programs or arrangements create risks that are reasonably likely to have a material adverse effect on the Company.
Summary Compensation Table
The table below sets forth the annual compensation awarded to or earned by our NEOs for Fiscal 2023, Fiscal 2022 and Fiscal 2021.
| Name and Principal |
Year | Salary ($)(1) |
Bonus ($)(2) |
Stock Awards ($)(3) |
Non-Equity Incentive Plan Compensation ($)(4) |
All Other Compensation ($)(5) |
Total ($) |
|||||||||||||||||||||
| Todd M. Hornbeck |
2023 | 750,000 | 100,000 | 6,054,243 | 885,000 | 66,242 | 7,855,485 | |||||||||||||||||||||
| Chairman, President & Chief Executive Officer |
2022 | 750,000 | — | 3,868,245 | 1,455,000 | 69,916 | 6,143,162 | |||||||||||||||||||||
| 2021 | 637,500 | — | — | 1,275,000 | 40,007 | 1,952,507 | ||||||||||||||||||||||
| James O. Harp, Jr. |
2023 | 400,000 | 100,000 | 2,522,664 | 472,000 | 52,173 | 3,546,837 | |||||||||||||||||||||
| EVP & Chief Financial Officer |
2022 | 400,000 | — | 1,611,762 | 776,000 | 46,445 | 2,834,207 | |||||||||||||||||||||
| 2021 | 360,000 | — | — | 720,000 | 30,786 | 1,110,786 | ||||||||||||||||||||||
| Samuel A. Giberga |
2023 | 400,000 | 100,000 | 2,522,610 | 472,000 | 50,518 | 3,545,128 | |||||||||||||||||||||
| EVP, General Counsel, Chief Compliance Officer & Corporate Secretary |
2022 | 400,000 | — | 1,611,762 | 776,000 | 44,751 | 2,832,513 | |||||||||||||||||||||
| 2021 | 305,000 | — | — | 610,000 | 34,065 | 949,065 | ||||||||||||||||||||||
|
|
|
|
||||||||||||||||||||||||||
| John S. Cook |
2023 | 400,000 | 100,000 | 2,522,610 | 472,000 | 53,935 | 3,548,545 | |||||||||||||||||||||
| EVP & Chief Commercial Officer(6) |
2022 | 400,000 | — | 1,611,762 | 776,000 | 44,106 | 2,831,868 | |||||||||||||||||||||
| 2021 | 320,000 | — | — | 640,000 | 32,694 | 992,694 | ||||||||||||||||||||||
| Carl G. Annessa |
2023 | 400,000 | 100,000 | 2,522,664 | 472,000 | 52,073 | 3,546,737 | |||||||||||||||||||||
| EVP—Military, Engineering, Repair & Maintenance |
2022 | 400,000 | — | 1,611,762 | 776,000 | 44,623 | 2,832,385 | |||||||||||||||||||||
| 2021 | 320,000 | — | — | 640,000 | 32,029 | 992,029 | ||||||||||||||||||||||
| (1) | The amounts in this column reflect the actual base salaries earned by our NEOs for Fiscal 2023, Fiscal 2022 and Fiscal 2021. |
| (2) | The amounts in this column reflect the One-Time GIFI Litigation Bonus, which is described above in the section titled “Pay Mix—Bonus.” |
| (3) | The amounts in this column reflect the grant date fair values (computed in accordance with FASB ASC Topic 718) of the RSU and PSU awards granted to the NEOs in Fiscal 2023 and Fiscal 2022. See Note 13 to our Annual Financial Statements included elsewhere in this prospectus for the assumptions used in calculating the grant date fair values. For the RSUs, the amounts reported in this column reflect the aggregate grant date fair value computed in accordance with ASC Topic 718. For the PSUs, the amounts reported in this column reflect the aggregate grant date fair value computed in accordance with ASC Topic 718, and assumes that the maximum number of the PSUs vest and participate in distributions. |
| (4) | The amounts in this column reflect bonuses paid to our NEOs for Fiscal 2023, Fiscal 2022 and Fiscal 2021 performance, pursuant to the terms of the annual cash incentive compensation opportunities set forth in their respective employment agreements and the Company’s cash incentive compensation program in effect for Fiscal 2023, Fiscal 2022 and Fiscal 2021, respectively. The Company’s cash incentive compensation program is described above in the section titled “Pay Mix—Bonus.” |
151
| (5) | The amounts in this column reflect the following amounts paid to our NEOs for Fiscal 2023: (i) employer-paid automobile lease, fuel and insurance expenses, which total $9,716, $19,447, $17,792, $21,208 and $18,939 for each of Messrs. Hornbeck, Harp, Giberga, Cook and Annessa, respectively, (ii) employer-paid term life insurance policy expenses for each NEO, (iii) employer-paid supplemental health insurance policy expenses in the amount of $17,904 for Mr. Annessa and $17,496 for each of the other NEOs, (iv) 401(k) matching contributions, which total $14,850 for each of our NEOs and (v) use of the Company’s aircraft for Mr. Hornbeck of $23,800. For the aircraft use, the value shown is the incremental cost to the Company for such use, which is calculated based on a contracted hourly rate billed to the Company per hour of operation. Fixed costs that do not change based on usage are not included. We do not provide tax gross-ups related to the use of the Company’s aircraft. |
| (6) | In August 2024, Mr. Cook’s title was changed from EVP, Chief Commercial Officer & Chief Information Officer to EVP & Chief Commercial Officer. |
Grants of Plan-Based Awards for the 2023 Fiscal Year
The following table summarizes the non-equity incentive plan awards and equity incentive plan awards granted to our NEOs during Fiscal 2023. All numbers have been rounded to the nearest whole dollar or unit.
| Estimated Future Payouts Under Non-Equity Incentive Plan Awards(1) |
All Other Stock Awards(2) (#) |
Grant Date Fair Value of Stock and Option Awards(3) ($) |
||||||||||||||||||||||
| Name |
Grant Date |
Threshold ($) |
Target ($) |
Maximum ($) |
||||||||||||||||||||
| Todd M. Hornbeck |
3/20/2023 | 375,000 | 750,000 | 1,500,000 | ||||||||||||||||||||
| 3/23/2023 | 112,826 | 6,054,243 | ||||||||||||||||||||||
| James O. Harp, Jr. |
3/20/2023 | 200,000 | 400,000 | 800,000 | ||||||||||||||||||||
| 3/23/2023 | 47,012 | 2,522,664 | ||||||||||||||||||||||
| Samuel A. Giberga |
3/20/2023 | 200,000 | 400,000 | 800,000 | ||||||||||||||||||||
| 3/23/2023 | 47,011 | 2,522,610 | ||||||||||||||||||||||
| John S. Cook |
3/20/2023 | 200,000 | 400,000 | 800,000 | ||||||||||||||||||||
| 3/23/2023 | 47,011 | 2,522,610 | ||||||||||||||||||||||
| Carl G. Annessa |
3/20/2023 | 200,000 | 400,000 | 800,000 | ||||||||||||||||||||
| 3/23/2023 | 47,012 | 2,522,664 | ||||||||||||||||||||||
| (1) | For Fiscal 2023, each NEO was eligible to receive non-equity incentive plan compensation based on the achievement of objective performance goals (for the EBITDA and TRIR components) and the discretion of the compensation committee (for the Strategic Plan component only). The amount actually paid to each NEO in respect of Fiscal 2023 pursuant to these criteria is reflected in the “Summary Compensation Table” under the heading “Non-Equity Incentive Plan Compensation.” |
| (2) | The amounts in this column reflect the RSUs granted to our NEOs pursuant to the 2020 Management Incentive Plan in Fiscal 2023. All RSUs granted in Fiscal 2023 were subject to time-vesting conditions only. |
| (3) | For the RSUs granted in Fiscal 2023, the total dollar amounts in this column equal the product of (i) the number of RSUs indicated in the “All Other Stock Awards” column, multiplied by (ii) the fair value of our common stock as of the grant date ($53.66 per share), determined in accordance with FASB ASC Topic 718. |
Narrative Description to the Summary Compensation Table and the Grants of Plan-Based Awards Table for the 2023 Fiscal Year
Amended and Restated Employment Agreements
As noted above, each of our NEOs is a party to an EA that provides for such NEO’s initial annual base salary, target annual cash incentive compensation opportunity, certain severance benefits (as described in detail
152
in the section titled “Potential Payments upon Termination or Change of Control”), entitlement to reimbursement of reasonable business expenses and eligibility to participate in our benefit plans generally.
At the end of Fiscal 2023, Mr. Hornbeck’s annualized base salary was $750,000, and each of the other NEOs had an annualized base salary of $400,000, and each of the NEOs (including Mr. Hornbeck) had a target annual cash incentive compensation opportunity equal to 100% of his annualized base salary. As previously noted, the various components of our executive compensation program are related but distinct and are designed to emphasize “pay for performance,” with a significant portion of total compensation reflecting a risk aspect tied to achieving our long-term and short-term financial and strategic goals. For Fiscal 2023, each NEO’s annual base salary represents approximately 11.3% or less of the NEO’s total compensation, and each NEO’s annual cash incentive compensation represents approximately 16.1% or less of the NEO’s total compensation.
The EAs subject the NEOs to the following restrictive covenants: (i) perpetual confidentiality, (ii) employment term and 2-year post-employment (A) non-competition and (B) employee and individual service provider (with a 6-month lookback) non-solicitation and no hire, (iii) mutual non-disparagement and (iv) assignment of inventions. The EAs also contain a Section 280G “best-net” cutback, which provides that any payments and/or benefits that constitute “parachute payments” (as defined under Section 280G of the Code) will be reduced to the extent necessary to avoid the imposition any excise tax under Section 4999 of the Code, but only to the extent that the reduction results in the NEO receiving a greater amount (on an after-tax basis) than the NEO would receive absent such reduction.
Grant of Equity Incentive Awards
In Fiscal 2023 and under the 2020 Management Incentive Plan (as described above), Mr. Hornbeck was granted 112,826 RSUs. Each of Messrs. Harp and Annessa were granted 47,012 RSUs and each of Messrs. Giberga and Cook were granted 47,011 RSUs. These equity incentive awards are described in more detail above in the section titled “Long-Term Equity-Based Compensation.”
Outstanding Equity Awards at 2023 Fiscal Year-End
The following table provides information on the stock option and stock award holdings of our NEOs as of the end of Fiscal 2023. This table includes unexercised stock options and unvested RSUs and PSUs. The vesting dates for each award are shown in the accompanying footnotes. The market value of the stock awards was determined using a price per share of $67.23, which is the fair market value of a share of our common stock as of December 31, 2023, as determined based on the independent valuation report prepared on our behalf, dated January 31, 2024.
153
| Stock Awards | ||||||||||||||||||||||||||||
| Name |
Equity Incentive Plan Awards: Number of Securities Underlying Unexercised Unearned Options (#)(1) |
Option Exercise Price ($) |
Option Expiration Date |
Number of Unearned Shares, Units or Other Rights That Have Not Vested (#) |
Market or Payout Value of Unearned Shares, Units or Other Rights That Have Not Vested ($)(5) |
Equity Incentive Plan Awards: Number of Unearned Shares, Units or Other Rights That Have Not Vested (#) |
Equity Incentive Plan Awards: Market or Payout Value of Unearned Shares, Units or Other Rights That Have Not Vested ($)(5) |
|||||||||||||||||||||
| Todd M. Hornbeck |
125,388 | 10.00 | 9/4/2030 | |||||||||||||||||||||||||
| 37,510 | (2) | 2,521,797 | ||||||||||||||||||||||||||
| 56,413 | (3) | 3,792,646 | ||||||||||||||||||||||||||
| 33,758 | (4) | 2,269,550 | ||||||||||||||||||||||||||
| James O. Harp, Jr. |
52,245 | 10.00 | 9/4/2030 | |||||||||||||||||||||||||
| 15,629 | (2) | 1,050,738 | ||||||||||||||||||||||||||
| 23,506 | (3) | 1,580,308 | ||||||||||||||||||||||||||
| 14,066 | (4) | 945,657 | ||||||||||||||||||||||||||
| Samuel A. Giberga |
52,245 | 10.00 | 9/4/2030 | |||||||||||||||||||||||||
| 15,629 | (2) | 1,050,738 | ||||||||||||||||||||||||||
| 23,506 | (3) | 1,580,308 | ||||||||||||||||||||||||||
| 14,066 | (4) | 945,657 | ||||||||||||||||||||||||||
| John S. Cook |
52,245 | 10.00 | 9/4/2030 | |||||||||||||||||||||||||
| 15,629 | (2) | 1,050,738 | ||||||||||||||||||||||||||
| 23,505 | (3) | 1,580,241 | ||||||||||||||||||||||||||
| 14,066 | (4) | 945,657 | ||||||||||||||||||||||||||
| Carl G. Annessa |
52,245 | 10.00 | 9/4/2030 | |||||||||||||||||||||||||
| 15,629 | (2) | 1,050,738 | ||||||||||||||||||||||||||
| 23,506 | (3) | 1,580,308 | ||||||||||||||||||||||||||
| 14,066 | (4) | 945,657 | ||||||||||||||||||||||||||
| (1) | On September 4, 2020, each of our NEOs received an award of stock options that is comprised of three equal tranches, with each tranche subject to both time-vesting and performance-vesting conditions. The stock options time-vested ratably on each of the first three anniversaries of June 19, 2020, subject to the NEO’s continued employment through the applicable vesting date. The stock options performance-vest based on the achievement of specified total enterprise value (“TEV”) levels, such that the NEO will only performance-vest if and when (i) a “change of control” (as defined in the 2020 Management Incentive Plan), an initial public offering or September 4, 2027 occurs and (ii) the implied TEV as of such time equals or exceeds the specified TEV threshold for such tranche. |
| (2) | On June 9, 2022, each of our NEOs received an award of RSUs, all of which are subject to time-based vesting conditions. The first one-third tranche vested and was settled on February 15, 2023. The remainder of the award vested and became settleable (or will vest and become settleable, as applicable) in equal tranches on February 15th of 2024 and 2025, subject to the NEO’s continued service through the applicable vesting date (except in the case of the NEO’s “qualifying termination” occurring prior to the end of the vesting period, in which case the NEO will be entitled to vest in the next tranche of his RSUs that is scheduled to vest on the next vesting date). Notwithstanding the foregoing, all of an NEO’s unvested RSUs will fully vest upon the consummation of a “change of control,” subject to the NEO’s continued service through the date of such “change of control.” |
| (3) | As previously described in greater detail in the sections titled “Grants of Plan-Based Awards for the 2023 Fiscal Year” and “Long-Term Equity Based Compensation,” on March 23, 2023, each of our NEOs received an award of RSUs, all of which are subject to time-based vesting conditions only. The first one-half of the award vested and was settled immediately on the grant date. The remainder of the award vested and became |
154
| settleable (or will vest and become settleable, as applicable) in three equal tranches on February 15th of each of 2024, 2025 and 2026, subject to the NEO’s continued service through the applicable vesting date except in the case of the NEO’s “qualifying termination” occurring prior to the end of the vesting period, in which case the NEO will be entitled to vest in the next tranche of his RSUs that is scheduled to vest on the next vesting date). Notwithstanding the foregoing, all of an NEO’s unvested RSUs will fully vest upon the consummation of a “change of control,” subject to the NEO’s continued service through the date of such “change of control.” |
| (4) | On June 9, 2022, each of our NEOs received an award of PSUs subject to both time-based and performance-based vesting conditions and the amounts reported assume the maximum number of PSUs would vest. |
| (5) | Calculated by multiplying (i) the number of shares of our common stock underlying the unvested portion of the RSU or PSU award, as applicable, by (ii) the fair market value of our common stock as of December 31, 2023, which was $67.23. |
Option Exercises and Stock Vested in the 2023 Fiscal Year
The following table provides information, on an aggregate basis, about our NEOs’ stock awards that vested during Fiscal 2023. None of our NEOs exercised stock options in Fiscal 2023.
| Stock Awards | ||||||||
| Name |
Number of Shares Acquired on Vesting (#)(1) |
Value Realized on Vesting ($)(2) |
||||||
| Todd M. Hornbeck |
145,899 | 8,246,966 | ||||||
| James O. Harp, Jr. |
60,792 | 3,436,278 | ||||||
| Samuel A. Giberga |
60,791 | 3,436,225 | ||||||
| John S. Cook |
60,792 | 3,436,278 | ||||||
| Carl G. Annessa |
60,792 | 3,436,278 | ||||||
| (1) | The amounts reported in this column represent (i) the RSUs that were granted to each NEO on March 23, 2023, of which 50% vested and was settled on the grant date, (ii) the RSUs that were granted to each NEO on June 9, 2022, of which 33.33% vested and was settled on February 15, 2023 and (iii) the RSUs that were granted to each NEO on September 4, 2020, of which 33.33% vested on June 19, 2023. For further information regarding such RSUs that vested during Fiscal 2023 for each of the NEOs, see the below section titled “Non-Qualified Deferred Compensation.” |
| (2) | The value realized on vesting was calculated by multiplying (i) the number of RSUs that vested in February 2023 and March 2023 by the fair market value of a share of our common stock as of March 23, 2023 (i.e., $53.66) and (ii) the number of RSUs that vested in June of 2023 by the fair market value of a share of our common stock as of June 30, 2023 (i.e., $59.57). None of the RSUs granted on September 4, 2020 will settle until the earlier to occur of a “change of control” and September 4, 2027. |
Non-Qualified Deferred Compensation
The following table provides information, on an aggregate basis, about our NEOs’ vested RSUs for which settlement was deferred during Fiscal 2023, Fiscal 2022 and Fiscal 2021.
| Name |
Registrant Contributions in Last FY(1) ($) |
Aggregate Balance at Last FYE(2) ($) |
||||||
| Todd M. Hornbeck |
$ | 4,755,312 | $ | 14,265,870 | ||||
| James O. Harp, Jr. |
$ | 1,981,403 | $ | 5,944,140 | ||||
| Samuel A. Giberga |
$ | 1,981,403 | $ | 5,944,140 | ||||
| John S. Cook |
$ | 1,981,403 | $ | 5,944,140 | ||||
| Carl G. Annessa |
$ | 1,981,403 | $ | 5,944,140 | ||||
155
| (1) | The amounts reported in this column represent the aggregate dollar value of the vested RSUs for which the settlement during Fiscal 2023 was deferred pursuant to the terms of the 2020 Management Incentive Plan. In the case of each NEO, these RSUs were granted on September 4, 2020 and vested on June 19, 2023, but settlement was subsequently deferred (i.e., 70,732 RSUs of Mr. Hornbeck were deferred, and 29,472 RSUs of each other NEO were deferred). For each NEO, the reported amount was calculated by multiplying (i) the number of RSUs that vested and were deferred during Fiscal 2023, by (ii) the fair market value of a share of our common stock as of December 31, 2023 (i.e., $67.23). |
| (2) | The aggregate balance was calculated by multiplying (i) the aggregate number of RSUs that vested and was deferred during Fiscal 2023, Fiscal 2022 and Fiscal 2021, by (ii) the fair market value of a share of our common stock as of December 31, 2023 (i.e., $67.23). None of these RSUs will be settled until the earlier to occur of a “change of control” and September 4, 2027. Upon such settlement, amounts in this column will reflect any dividend equivalents that were previously accrued during the prior periods and be net of any vested RSUs that are used to satisfy any tax withholding obligations. |
Potential Payments Upon Termination or a Change of Control
In this section, we describe payments and benefits that may be made to our NEOs upon the occurrence of certain terminations of employment and/or a change of control, assuming that such event occurred on the last day of Fiscal 2023. We note that this offering would not result in any payments or benefits to our NEOs or acceleration of equity awards to our NEOs, but upon this offering, the performance vesting of the outstanding performance-based stock options and PSUs held by our NEOs will be measured based on our achievement of specified TEV levels.
Payments upon Termination of Employment due to Death or Disability
The EAs provide that upon a termination of the NEO’s employment due to the NEO’s death or “disability” (as defined therein), the NEO will receive the following severance benefits: (i) a pro-rata annual bonus, based on actual performance for the year in which the termination occurs, and (ii) reimbursement for the employer portion of the NEO’s COBRA premiums for 12 months.
Each NEO’s outstanding stock options that have time-vested as of such NEO’s termination due to death or “disability” will remain outstanding and eligible to performance-vest to the extent the applicable performance conditions are actually achieved.
Payments upon a Termination of Employment without Cause or for Good Reason
The EAs provide that upon a termination of the NEO’s employment by the Company without “cause” (including due to the Company’s non-renewal of the employment term) or by the NEO for “good reason” (each as defined therein and summarized below, and each such termination, a “Qualifying Termination”), subject to the NEO’s execution and non-revocation of a release of claims in favor of the Company, the NEO will receive the following severance benefits (the “Severance Benefits”): (i) 2 times (or, for Mr. Hornbeck only, 2.5 times) the sum of the NEO’s base salary and target bonus, payable over the 24-month period following termination; (ii) a pro-rata annual bonus (the “Pro-Rata Annual Bonus”), based on actual performance for the fiscal year in which the termination occurs, provided, that such termination occurs at least half way through the applicable fiscal year; and (iii) reimbursement for the employer portion of the COBRA premiums for 24 months (or, for Mr. Hornbeck only, 30 months, provided that such amount shall still be payable over the 24-month period following termination); provided, that, if the Qualifying Termination occurs within the 2-year period following (or within the 6-month period preceding) a “change of control,” then the (x) Severance Benefits will be payable in a lump sum to the NEO on or about the 60th day following such “change of control” and (y) Pro-Rata Annual Bonus will be determined based on deemed achievement of target performance for the fiscal year in which the termination occurs regardless of when the termination occurs during such fiscal year.
156
Additionally, upon a Qualifying Termination, each NEO will (i) vest in the tranche of RSUs next scheduled to vest following such Qualifying Termination, if any; (ii) time-vest in the tranche of stock options next scheduled to time-vest following such Qualifying Termination, if any; and (iii) be entitled to, with respect to any stock options that have time-vested as of the Qualifying Termination date (after accounting for the acceleration set forth in clause (ii)), have such time-vested stock options remain outstanding and eligible to performance-vest to the extent the applicable performance conditions are actually achieved.
The EAs define “cause” as any of the NEO’s: (i) conviction of either (A) a felony involving moral turpitude or (B) any crime in connection with the NEO’s employment that causes the Company and each of its subsidiaries and affiliates (collectively, the “Company Group”) a substantial detriment (in each case, excluding traffic offenses); (ii) actions or inactions that clearly are contrary to the best interests of the Company Group and the express directives of our Board of Directors; provided, that, such actions or inactions by the NEO cause the Company Group a substantial detriment or could reasonably be expected to cause a substantial detriment to the Company Group as determined by our Board of Directors in good faith; (iii) willful failure to take actions permitted by law and necessary to implement policies of our Board of Directors that our Board of Directors has communicated to the NEO in writing; provided, that, such policies that are reflected in minutes of our Board of Directors meeting attended in its entirety by the NEO shall be deemed communicated to the NEO to the extent the NEO received a copy of such minutes from the secretary or the general counsel of the Company promptly following approval by our Board of Directors; (iv) continued failure to attend to the NEO’s material duties as an executive officer of the Company Group following the NEO’s receipt of written notice from our Board of Directors of such failure; provided, that, such failure by the NEO causes the Company Group a substantial detriment or could reasonably be expected to cause a substantial detriment to the Company Group as determined by our Board of Directors in good faith; (v) commission of an act of fraud or material act of dishonesty or misappropriation involving the Company Group; (vi) willful violation of law or gross negligence that is substantially detrimental to the Company; (vii) material breach or material violation of the EA or any other written agreement with a member of the Company Group, or any material violation of any written policy of the Company Group; provided, that, such material breach or material violation by the NEO causes the Company Group a substantial detriment or could reasonably be expected to cause a substantial detriment to the Company Group as determined by our Board of Directors in good faith; or (viii) habitual use of illicit drugs or habitual abuse of alcohol that, in the reasonable good faith opinion of our Board of Directors, renders the NEO unfit to serve as an officer of the Company Group. If any determination of habitual use or substantial dependence under clause (viii) is disputed by the NEO, the Company and the NEO agree to abide by the decision of a panel of 3 physicians appointed in the manner specified in the applicable EA. For purposes of this “cause” definition, no action or inaction will be considered “willful” or constitute “gross negligence,” if the NEO had a reasonable, good faith belief that such action or inaction was in the best interests of the Company Group. Anything in the EA to the contrary notwithstanding, the NEO shall not be terminated for “cause” under the EA, unless (A) written notice stating the basis for the termination is provided to the NEO, and (B) with the exception of the NEO’s conviction of either a felony involving moral turpitude or any crime in connection with the NEO’s employment that causes the Company Group a substantial detriment (in each case, excluding traffic offenses), the NEO is given 10 business days to cure the neglect or conduct that is the basis of such claim, to the extent curable.
The EAs define “good reason” as, unless otherwise agreed to in writing by the NEO, (i) any material diminution in the NEO’s titles, duties, responsibilities, status or authorities with the Company or any of its material operating subsidiaries; (ii) a material reduction in the NEO’s base salary or target bonus; (iii) a relocation of the NEO’s primary place of employment to a location more than 35 miles farther from the NEO’s primary residence than the current location of the Company’s offices in Louisiana as of June 19, 2020; or (iv) a material breach by the Company of the EA or any other agreement between the Company and the NEO. In order to invoke a termination for “good reason,” (A) the NEO must provide written notice within 45 days of the NEO becoming aware of the occurrence of any event of “good reason”; (B) the Company must fail to cure such event within 30 days of the giving of such notice; and (C) the NEO must terminate employment within 45 days following the expiration of the Company’s cure period.
157
Payments upon a Change of Control
Upon a “change of control,” (i) 100% of the NEO’s then-unvested RSUs will accelerate and vest; (ii) the time-vesting condition of the NEO’s then-unvested stock options will be deemed fully satisfied; and (iii) the NEO’s then-unvested PSUs will vest only if the applicable performance hurdles are achieved in connection with such change of control. Upon a “Qualifying Termination” (as described above) in connection with a change of control, each NEO shall be entitled to the Severance Benefits described above in the section titled “—Payments upon a Termination of Employment without Cause or for Good Reason,” except that the NEO shall be entitled to the Pro-Rata Annual Bonus regardless if such termination occurs prior to the midpoint of the fiscal year and shall be based on target performance and all amounts shall be paid in a lump sum.
The table sets forth the estimated payments and benefits payable upon the occurrence of the events described in this section. In estimating the value of such payments, the table assumes that (i) the NEO’s employment was terminated and/or a “change of control” occurred, in each case on December 31, 2023; (ii) each NEO’s compensation rates were the same as in effect on December 31, 2023; and (iii) the market value of the stock awards is based on the closing market price of our common stock as of December 31, 2023, which was $67.23.
| Officer |
Type of Payment |
Termination Without Cause or for Good Reason ($) |
Termination Due to Death ($) |
Termination Due to Disability ($) |
Occurrence of a Change of Control |
|||||||||||||
| Todd M. Hornbeck |
Cash Severance | 3,750,000 | — | — | ||||||||||||||
| Stock Award Vesting(2) | 2,525,092 | — | — | 13,413,977 | ||||||||||||||
| Pro-Rata Annual Bonus(1) | 750,000 | 750,000 | 750,000 | |||||||||||||||
| Health and Welfare Benefits | 187,143 | 350,508 | 75,961 | |||||||||||||||
| Total | 7,212,234 | 1,100,508 | 825,961 | 13,413,977 | ||||||||||||||
| James O. Harp, Jr. |
Cash Severance | 1,600,000 | — | — | — | |||||||||||||
| Stock Award Vesting(2) | 1,052,082 | — | — | 6,566,685 | ||||||||||||||
| Pro-Rata Annual Bonus(1) | 400,000 | 400,000 | 400,000 | — | ||||||||||||||
| Health and Welfare Benefits | 159,053 | 338,724 | 80,631 | — | ||||||||||||||
| Total | 3,211,135 | 738,724 | 480,631 | 6,566,685 | ||||||||||||||
| Samuel A. Giberga |
Cash Severance | 1,600,000 | — | — | — | |||||||||||||
| Stock Award Vesting(2) | 1,052,082 | — | — | 6,566,685 | ||||||||||||||
| Pro-Rata Annual Bonus(1) | 400,000 | 400,000 | 400,000 | — | ||||||||||||||
| Health and Welfare Benefits | 155,470 | 338,881 | 78,839 | — | ||||||||||||||
| Total | 3,207,553 | 738,881 | 478,839 | 6,566,685 | ||||||||||||||
| John S. Cook |
Cash Severance | 1,600,000 | — | — | — | |||||||||||||
| Stock Award Vesting(2) | 1,052,082 | — | — | 6,566,617 | ||||||||||||||
| Pro-Rata Annual Bonus(1) | 400,000 | 400,000 | 400,000 | — | ||||||||||||||
| Health and Welfare Benefits | 147,355 | 338,811 | 74,782 | — | ||||||||||||||
| Total | 3,199,438 | 738,811 | 474,782 | 6,566,617 | ||||||||||||||
| Carl G. Annessa |
Cash Severance | 1,600,000 | — | — | — | |||||||||||||
| Stock Award Vesting(2) | 1,052,082 | — | — | 6,566,685 | ||||||||||||||
| Pro-Rata Annual Bonus(1) | 400,000 | 400,000 | 400,000 | — | ||||||||||||||
| Health and Welfare Benefits | 146,931 | 329,913 | 74,569 | — | ||||||||||||||
| Total | 3,199,013 | 729,913 | 474,569 | 6,566,685 | ||||||||||||||
| (1) | The Pro-Rata Annual Bonus amounts set forth above are based on deemed achievement of all performance criteria at target levels. Given that we assume payout of the Pro-Rata Annual Bonus at target levels, the total severance amount reported in this table under the “Termination Without Cause or for Good Reason” column would be the same if such termination occurred in connection with a change of control. |
158
| (2) | The Stock Award Vesting amounts set forth do not include the value of RSUs that had previously vested, but such vested RSUs would be settled upon a change of control. The value of RSUs previously vested are as follows: $16,088,625 for Mr. Hornbeck and $6,703,625 for each of the other NEOs. All equity awards, including RSUs, were granted from the reserve under the 2020 Management Incentive Plan (“MIP Reserve”), which initially allocated 2,198,044 shares of common stock of the Company for issuance thereunder, of which 2,063,111 and 135,033 of such total shares were reserved for MIP participants and non-employee directors, respectively, and would have been paid to the MIP participants upon a change of control. The Stock Award Vesting amounts assume none of the remaining MIP Reserve would be granted to any of our NEOs at the time of a change of control. |
Director Compensation
The table below sets forth the annual compensation awarded to or earned by certain of our non-employee directors for Fiscal 2023. Todd M. Hornbeck (our Chairman, President and Chief Executive Officer), Scott Graves, Jacob Mercer, Aaron Rosen and Larry Hornbeck (our Chairman Emeritus) did not receive any compensation for serving on our Board of Directors.
| Name |
Fees Earned or Paid in Cash ($) |
Stock Awards ($) |
Total ($)(1) |
|||||||||
| Kurt M. Cellar |
103,635 | 192,264 | 295,899 | (2) | ||||||||
| Evan B. Behrens |
66,125 | 158,619 | 224,744 | (3) | ||||||||
| Piyush “Bobby” Jindal |
83,000 | 158,619 | 241,619 | (4) | ||||||||
| John Richardson |
65,500 | 158,619 | 224,119 | (5) | ||||||||
| Lloyd Donelson Miller |
66,135 | 158,619 | 224,754 | (6) | ||||||||
| Sylvia Jo Sydow Kerrigan |
63,625 | 158,619 | 222,244 | (7) | ||||||||
| (1) | As of December 31, 2023, all equity awards issued to our directors in our fiscal year ending December 31, 2020 and in Fiscal 2021 had vested in full, and such equity awards will settle upon the earlier of September 4, 2027 and a “change of control.” No equity awards were issued to our directors in Fiscal 2022. On March 23, 2023, equity awards were issued to our directors. One-half of these awards vested and was settled on the grant date. The remaining one-half vested and became settleable on February 15, 2024. For the RSUs granted in Fiscal 2023, the total dollar amounts in this column equal the product of (i) the number of RSUs granted multiplied by (ii) the fair value of our common stock as of the grant date ($53.66 per share), determined in accordance with FASB ASC Topic 718. |
| (2) | For Mr. Cellar, this amount represents the sum of the annual cash retainers due for his service as: (i) a non-employee director ($50,500), (ii) the chairperson of the audit committee ($20,000), (iii) co-chairperson of the M&A/Finance committee ($8,135), (iv) the lead independent director ($25,000) and (v) the value of 3,583 RSUs granted in Fiscal 2023 ($192,264). |
| (3) | For Mr. Behrens, this amount represents the sum of the annual cash retainers due for his service as: (i) a non-employee director ($50,500), (ii) a member of the audit committee ($10,000), (iii) a member of the M&A/Finance committee ($5,625) and (iv) the value of 2,956 RSUs granted in Fiscal 2023 ($158,619), 35% of which Mr. Behrens elected to have settled in cash. |
| (4) | For Mr. Jindal, this amount represents the sum of the annual cash retainers due for his service as: (i) a non-employee director ($50,500), (ii) the chairperson of the compensation committee ($15,000), (iii) a member of the audit committee ($10,000), (iv) a member of the business diversification/government contracting committee ($7,500) and (v) the value of 2,956 RSUs granted in Fiscal 2023 ($158,619). |
| (5) | For Mr. Richardson, this amount represents the sum of the annual cash retainers due for his service as: (i) a non-employee director ($50,500), (ii) the chairperson of the business diversification/government contracting committee ($15,000) and (iii) the value of 2,956 RSUs granted in Fiscal 2023 ($158,619), 35% of which Mr. Richardson elected to have settled in cash. |
159
| (6) | For Mr. Miller, this amount represents the sum of the annual cash retainers due for his service as: (i) a non-employee director ($50,500), (ii) a member of the compensation committee ($7,500), (iii) co-chairperson of the M&A/Finance committee ($8,135) and (iv) the value of 2,956 RSUs granted in Fiscal 2023 ($158,619). |
| (7) | For Ms. Kerrigan, this amount represents the sum of the annual cash retainers due for her service as: (i) a non-employee director ($50,500), (ii) a member of the compensation committee ($5,625), (iii) a member of the business diversification/government contracting committee ($7,500) and (iv) the value of 2,956 RSUs granted in Fiscal 2023 ($158,619). |
Go-Forward Compensation Arrangements
In connection with this offering, we expect to (1) adopt a new omnibus incentive plan (the “Omnibus Plan”), (2) grant non-qualified stock options (“NQSOs”) and RSUs under the Omnibus Plan to certain of our employees, including our NEOs, (3) amend and restate the EAs with our NEOs, and (4) adopt a new non-employee director compensation policy. Each of these expected actions, as well as our compensation committee’s retention of a compensation consultant to advise with respect to this offering and these actions, are described below.
Compensation Consultant and Peer Group
In anticipation of a public offering, in late 2023, the compensation committee retained an outside compensation consultant, FW Cook, to review and make recommendations concerning compensation in connection with a public offering and for the fiscal year ending 2024. In December 2023, at the compensation committee’s request, FW Cook reviewed our public company Industry Peer Group and recommended removing Forum Energy Technologies, Inc. and Oil States International, Inc. and adding Cactus, Inc., Diamond Offshore Drilling, Inc. and Valaris Limited. The compensation committee approved this new peer group, which was used to benchmark executive compensation for the fiscal year ending 2024 and in connection with this offering, and consists of the following:
Industry Peer Group Used to Benchmark Executive Compensation
for Fiscal Year 2024 and in Connection with this Offering
Bristow Group Inc. (VTOL)
Cactus, Inc. (WHD)
Diamond Offshore Drilling, Inc. (DO)
Dril-Quip, Inc. (DRQ)
Great Lakes Dredge & Dock Corporation (GLDD)
Helix Energy Solutions Group, Inc. (HLX)
Kirby Corporation (KEX)
Newpark Resources, Inc. (NR)
Oceaneering International, Inc. (OII)
SEACOR Marine Holdings Inc. (SMHI)
TETRA Technologies, Inc. (TTI)
Tidewater Inc. (TDW)
Valaris Limited (VAL)
2024 Omnibus Incentive Plan
In order to incentivize our employees, consultants and non-employee directors following the completion of this offering, we anticipate that our Board of Directors will adopt the Omnibus Plan for employees, consultants and non-employee directors prior to the completion of this offering. Our NEOs will be eligible to participate in the Omnibus Plan, which we expect will become effective upon the consummation of this offering. We anticipate that the Omnibus Plan will provide for the grant of stock options (in the form of either NQSOs or incentive stock options (“ISOs”)), stock appreciation rights (“SARs”), restricted stock, RSUs, performance awards, other stock-
160
based awards, cash awards and substitute awards intended to align the interests of participants with those of our stockholders.
Securities Offered. Subject to adjustment in the event of certain transactions or changes of capitalization in accordance with the Omnibus Plan, a total of shares of common stock have been initially reserved for issuance pursuant to awards under the Omnibus Plan. The total number of shares of common stock reserved for issuance under the Omnibus Plan will be increased on January 1 of each calendar year beginning in 2025, and ending and including January 1, 2034, by the lesser of (i) 2.5% of the total number of shares of common stock outstanding on each December 31 of the immediately preceding calendar year or (ii) such smaller number of shares of common stock determined by our Board of Directors. No more than shares of common stock under the Omnibus Plan may be issued pursuant to ISOs. Shares of common stock subject to an award under the Omnibus Plan will again be made available for issuance or delivery if such shares of common stock are (i) delivered, withheld or surrendered in payment of the exercise or purchase price of an award, (ii) delivered, withheld, or surrendered to satisfy any tax withholding obligation or (iii) subject to an award that expires or is canceled, forfeited, or terminated without issuance of the full number of shares of common stock to which the award related.
Administration. The Omnibus Plan will be administered by the compensation committee of our Board of Directors. The compensation committee will have broad discretion to administer the Omnibus Plan, including the power to determine the eligible individuals to whom awards will be granted, the number and type of awards to be granted and the terms and conditions of awards. The compensation committee may also accelerate the vesting or exercise of any award and make all other determinations and take all other actions necessary or advisable for the administration of the Omnibus Plan.
Eligibility. Employees and consultants of the Company and its affiliates, and non-employee directors of the Company are eligible to receive awards under the Omnibus Plan.
Non-Employee Director Compensation Limits. Under the Omnibus Plan, in a calendar year, a non-employee director may not be granted awards for such individual’s service on our Board of Directors that, taken together with any cash fees paid to such non-employee director during such calendar year for such individual’s service on our Board of Directors, have a value in excess of $750,000 (calculating the value of any such awards based on the grant date fair value of such awards for financial reporting purposes); provided, that (i) the compensation committee may make exceptions to this limit, except that the non-employee director receiving such additional compensation may not participate in the decision to award such compensation or in other contemporaneous decisions involving compensation for non-employee directors and (ii) for any calendar year in which a non-employee director (a) first commences service on our Board of Directors, (b) serves on a special committee of our Board of Directors, or (c) serves as lead director or non-executive chair of our Board of Directors, such limit shall be increased to $1,000,000. This limit does not apply to awards or other compensation, if any, provided to a non-employee director during any period in which the individual was an employee or otherwise providing services to the Company or its affiliates in another capacity.
Types of Awards.
Options. We may grant options to eligible persons, except that ISOs may only be granted to persons who are our employees or employees of one of our subsidiaries, in accordance with Section 422 of the Code. The exercise price of an option cannot be less than 100% of the fair market value of a share of common stock on the date on which the option is granted and the option must not be exercisable for longer than 10 years following the date of grant. However, in the case of an ISO granted to an individual who owns (or is deemed to own) at least 10% of the total combined voting power of all classes of our equity securities, the exercise price of the option must be at least 110% of the fair market value of a share of common stock on the date of grant and the option must not be exercisable more than five years from the date of grant.
161
SARs. A SAR is the right to receive an amount equal to the excess of the fair market value of one share of common stock on the date of exercise over the grant price of the SAR. The grant price of a SAR cannot be less than 100% of the fair market value of a share of common stock on the date on which the SAR is granted. The term of a SAR may not exceed 10 years. SARs may be granted in connection with, or independent of, other awards. The compensation committee will have the discretion to determine other terms and conditions of a SAR award.
Restricted Stock Awards. A restricted stock award is a grant of shares of common stock subject to restrictions on transferability and risk of forfeiture imposed by the compensation committee. Unless otherwise determined by the compensation committee and specified in the applicable award agreement, the holder of a restricted stock award will have rights as a stockholder, including the right to vote the shares of common stock subject to the restricted stock award or to receive dividends on the shares of common stock subject to the restricted stock award during the restriction period. The compensation committee may determine on what terms and conditions the participant will be entitled to dividends payable on the shares of restricted stock.
Restricted Stock Units. An RSU is a right to receive cash, shares of common stock or a combination of cash and shares of common stock at the end of a specified period equal to the fair market value of one share of common stock on the date of vesting. RSUs may be subject to restrictions, including a risk of forfeiture, imposed by the compensation committee. The compensation committee may determine that a grant of RSUs will provide a participant a right to receive dividend equivalents, which entitles the participant to receive the equivalent value (in cash or shares of common stock) of dividends paid on the underlying shares of common stock. Dividend equivalents may be paid currently or credited to an account, settled in cash or shares, and may be subject to the same restrictions as the RSUs with respect to which the dividend equivalents are granted.
Performance Awards. A performance award is an award that vests and/or becomes exercisable or distributable subject to the achievement of certain performance goals during a specified performance period, as established by the compensation committee. Performance awards may be granted alone or in addition to other awards under the Omnibus Plan, and may be paid in cash, shares of common stock, other property or any combination thereof, in the sole discretion of the compensation committee.
Other Share-Based Awards. Other share-based awards are awards denominated or payable in, valued in whole or in part by reference to, or otherwise based on or related to, the value of shares of common stock.
Cash Awards. Cash awards may be granted on a free-standing basis or as an element of, a supplement to, or in lieu of any other award and will be subject to such terms and conditions, including vesting conditions as determined by the compensation committee.
Substitute Awards. Awards may be granted under the Omnibus Plan in substitution for similar awards held for individuals who become participants as a result of a merger, consolidation or acquisition of another entity by or with the Company or one of our affiliates.
Certain Transactions. If any change is made to our capitalization, such as a stock split, stock combination, stock dividend, exchange of stock or other recapitalization, merger or otherwise, which results in an increase or decrease in the number of our outstanding shares of common stock, appropriate adjustments will be made by the compensation committee to (i) the shares of common stock subject to an outstanding award under the Omnibus Plan and (ii) the respective exercise price of such award. The compensation committee will also have the discretion to make certain adjustments to awards in the event of a change in control of the Company, such as the assumption or substitution of outstanding awards, the purchase of any outstanding awards in cash based on the applicable change in control price, the ability for participants to exercise any outstanding stock options, SARs or other stock-based awards upon the change in control (and if not exercised such awards will be terminated), and the acceleration of vesting or exercisability of any outstanding awards.
162
Clawback. All awards, amounts, or benefits received or outstanding under the Omnibus Plan will be subject to clawback, cancellation, recoupment, rescission, payback, reduction, or other similar action in accordance with any Company clawback or similar policy or any applicable law related to such actions.
Plan Amendment and Termination. Our Board of Directors or the compensation committee may amend, in whole or in part, any or all of the provisions of the Omnibus Plan, or suspend or terminate it entirely, retroactively or otherwise, provided that the rights of a participant with respect to awards granted prior to such amendment, suspension, or termination may not be materially impaired without the consent of such participant. Without stockholder approval, no amendment may be made that would (i) increase the aggregate number of shares of common stock that may be issued under the Omnibus Plan or (ii) change the classification of individuals eligible to receive awards under the Omnibus Plan. The Omnibus Plan will remain in effect for a period of ten years (unless earlier terminated by our Board of Directors).
IPO Equity Grants
In connection with this offering, we expect to grant NQSOs and RSUs under the Omnibus Plan to certain of our employees, including our NEOs, with respect to a total of approximately shares of our common stock (calculated using the midpoint of the estimated offering price range shown on the cover page of this prospectus).
It is anticipated that the awards granted to our employees, including our NEOs, will be comprised (i) 50% of NQSOs and (ii) 50% of RSUs, each of which will vest ratably over a five-year period, in each case, subject to the employee’s continued employment through the applicable vesting date.
Amended & Restated Employment Agreements
We expect to enter into amended and restated employment agreements (each, an “A&R EA”) with each of our NEOs that will become effective upon the consummation of this offering. We expect that the terms of each A&R EA will be materially the same as the NEOs’ current EAs, except for the amended terms described below.
Initial Term. The initial term will end on December 31, 2027.
CEO Board Service. For Mr. Hornbeck only, so long as he serves as our Chief Executive Officer, he will continue to serve as a member of our Board of Directors until his seat is first scheduled for election, following which we will nominate him for election as a member of our Board of Directors at each shareholders’ meeting occurring during the term of his employment and use best efforts to have him elected. Mr. Hornbeck will also serve as Chairman of our Board of Directors through the second anniversary of the consummation of this offering (or, if earlier, his resignation or removal as either our Chief Executive Officer or a member of our Board of Directors).
Pro-Rata Bonus Upon Qualifying Termination. Each NEO will receive a pro-rata bonus upon a Qualifying Termination regardless of when in the applicable fiscal year the Qualifying Termination occurs.
Severance Multiplier for CIC Qualifying Termination. The severance multiplier for a Qualifying Termination in connection with a change of control will be fixed at 2.5x for Mr. Hornbeck and 2.0x for each of our other NEOs.
Automobile Benefits for CIC Qualifying Termination. For Mr. Hornbeck only, upon a Qualifying Termination in connection with a change of control, he will be eligible to continue to receive automobile benefits until the earlier of (i) his death and (ii) the 30-month anniversary of such termination.
Lapse of Transfer Restrictions on MIP Options and PSUs. Notwithstanding the terms of the 2020 Management Incentive Plan or the award agreements or transfer restriction agreements thereunder (the “MIP
163
Documents”), any transfer restrictions in the MIP Documents with respect to shares of our common stock issued in respect of options or PSUs granted under the 2020 Management Incentive Plan will terminate in accordance with the following schedule (to the extent not earlier terminated in accordance with their terms): (i) upon the consummation of this offering, the transfer restrictions will terminate with respect to 50% of each NEOs’ outstanding stock options and PSUs that, in each case, are or become vested as of such time, (ii) upon the one-year anniversary of the consummation of this offering, the transfer restrictions will terminate with respect to 100% of each NEOs’ outstanding stock options and PSUs that, in each case, are or become vested as of such time, and (iii) upon the applicable vesting date for each NEO’s outstanding stock options and PSUs that vest following the one-year anniversary of the consummation of this offering, the transfer restrictions will terminate immediately upon such applicable vesting date. For clarity, the lapse of the transfer restrictions in the MIP Documents will not affect the transfer restrictions that the NEOs will become subject to pursuant to any lock-up agreements that they enter into with the underwriters.
Non-Employee Director Compensation Policy
In connection with this offering, we expect to adopt a non-employee director compensation policy to govern compensation paid to our non-employee directors. The non-employee director compensation policy will be designed to provide competitive compensation necessary to attract and retain high quality non-employee directors. We expect to continue to pay a combination of cash retainers and equity awards to each of our non-employee directors (other than those designated, nominated or appointed by or on behalf of our principal stockholders or those serving in an emeritus position, in each case, unless otherwise determined by our Board of Directors) for his or her services on our Board of Directors. We also expect to provide each non-employee director with reimbursement for reasonable travel and miscellaneous expenses incurred in attending meetings and activities of our Board of Directors and its committees.
164
PRINCIPAL AND SELLING STOCKHOLDERS
The following table sets forth the beneficial ownership of our common stock as of August 31, 2024, after giving effect to the stock split, that, upon the consummation of this offering, and assuming the underwriters do not exercise their option to purchase additional common stock, will be owned by:
| • | each person known to us to beneficially own more than 5% of any class of our outstanding voting securities; |
| • | each director and named executive officer; |
| • | all of our directors and executive officers as a group; and |
| • | each selling stockholder. |
A person is a “beneficial owner” of a security if that person has or shares “voting power,” which includes the power to vote or to direct the voting of the security, or “investment power,” which includes the power to dispose of or to direct the disposition of the security or has the right to acquire such powers within 60 days.
To our knowledge, unless otherwise noted in the footnotes to the following table, and subject to applicable community property laws, the persons named in the table have sole voting and investment power with respect to their beneficially owned common stock.
Securities subject to option grants and restricted stock unit awards that have vested or will vest, and settled, or will settle, within 60 days are deemed outstanding for calculating the percentage ownership of the person holding the options, but are not deemed outstanding for calculating the percentage ownership of any other person.
The table below excludes any purchases that may be made in this offering through our directed share program or otherwise in this offering. See “Underwriting (Conflicts of Interest) — Directed Share Program.”
Except as otherwise indicated in the footnotes below, the address of each beneficial owner is c/o Hornbeck Offshore Services, Inc., 103 Northpark Boulevard, Suite 300, Covington, Louisiana 70433.
| Shares Beneficially Owned | ||||||||||||||||
| Prior to the Offering | After the Offering | |||||||||||||||
| Name of Beneficial Owner | Amount of Beneficial Ownership |
Percentage of Total(1) |
Amount of Beneficial Ownership |
Percentage of Total(1) |
||||||||||||
| Greater than 5% Stockholders: |
||||||||||||||||
| Funds, investment vehicles or accounts managed or advised by Ares or its affiliates(2) |
41.85% | % | ||||||||||||||
| Entities affiliated with Whitebox(3) |
22.39% | % | ||||||||||||||
| Entities affiliated with Highbridge(4) |
10.61% | % | ||||||||||||||
| Entities affiliated with Merced(5) |
7.03% | % | ||||||||||||||
| Named Executive Officers, Directors and Director Nominees(6): |
||||||||||||||||
| Todd M. Hornbeck(7) |
3.04% | % | ||||||||||||||
| Carl G. Annessa(8) |
* | % | ||||||||||||||
| James O. Harp, Jr.(9) |
* | % | ||||||||||||||
| Samuel A. Giberga(10) |
* | % | ||||||||||||||
| John S. Cook(11) |
* | % | ||||||||||||||
| Kurt M. Cellar(12) |
* | % | ||||||||||||||
| Evan Behrens(13) |
* | % | ||||||||||||||
| Bobby Jindal(14) |
* | % | ||||||||||||||
| Sylvia Jo Sydow Kerrigan |
* | % | ||||||||||||||
| Jacob Mercer |
— | * | % | |||||||||||||
| L. Don Miller(15) |
* | % | ||||||||||||||
| Aaron Rosen |
— | * | % | |||||||||||||
| James McConeghy |
— | * | % | |||||||||||||
| Admiral John Richardson (USN Ret)(16) |
* | % | ||||||||||||||
| All directors and executive officers as a group (14 persons)(17) |
7.94% | % | ||||||||||||||
165
| * | Less than one percent. |
| (1) | Includes shares of common stock underlying all Jones Act Warrants and Creditor Warrants owned by such person. The warrants are immediately exercisable but are subject to certain citizenship rules and limitations on exercise, sale, transfer or other disposition. |
| (2) | Includes: (a) (i) shares of common stock held of record by ASSF IV HOS AIV 1, L.P., (ii) shares of common stock and shares of common stock issuable upon the exercise of Jones Act Warrants held of record by ASSF IV HOS AIV 2, L.P., (iii) shares of common stock and shares of common stock issuable upon the exercise of Jones Act Warrants held of record by ASSF IV AIV B, L.P. and (iv) shares of common stock, shares of common stock issuable upon the exercise of Jones Act Warrants and shares of common stock issuable upon the exercise of Creditor Warrants held of record by ASSF IV AIV B Holdings III, L.P. (the entities referred to in clause (a) collectively, the “Ares SSF Holders”); (b) (i) shares of common stock held of record by ASOF HOS AIV 1, L.P., (ii) shares of common stock and shares of common stock issuable upon the exercise of Jones Act Warrants held of record by ASOF HOS AIV 2, L.P., (iii) shares of common stock, shares of common stock issuable upon the exercise of Jones Act Warrants and shares of common stock issuable upon the exercise of Creditor Warrants held of record by ASOF Holdings I, L.P., (iv) shares of common stock and shares of common stock issuable upon the exercise of Jones Act Warrants held of record by and ASOF II Holdings I, L.P. and (v) shares of common stock and shares of common stock issuable upon the exercise of Jones Act Warrants held of record by ASOF II A (DE) Holdings I, L.P. (the entities referred to in clause (b) collectively, the “Ares SOF Holders”); and (c) shares of common stock, shares of common stock issuable upon the exercise of Jones Act Warrants and shares of common stock issuable upon the exercise of Creditor Warrants held of record by two accounts managed or subadvised by Ares Management LLC with respect to which the Ares Entities (as defined below) may be deemed to have shared voting or dispositive power with the owner of such account (the “Managed Accounts” and, such shares, the “Managed Shares”). The Ares SSF Holders, the Ares SOF Holders and the Managed Accounts are collectively referred to as the “Holders”). The Ares Entities disclaim beneficial ownership of the Managed Shares for purposes of Section 16 and this registration statement shall not be deemed an admission that any of the Ares Entities are the beneficial owner of the Managed Shares for purposes of Section 16 or for any other purpose. |
| Ares Partners Holdco LLC (“Ares Partners”) is the sole member of each of Ares Voting LLC and Ares Management GP LLC, which are respectively the holders of the Class B and Class C common stock of Ares Management Corporation (“Ares Management”), which common stock allows them, collectively, to generally have the majority of the votes on any matter submitted to the stockholders of Ares Management if certain conditions are met. Ares Management is the sole member of Ares Holdco LLC, which is the general partner of Ares Management Holdings L.P., which is the sole member of Ares Management LLC, which is (x) the general partner of ASSF Operating Manager IV, L.P., which is the manager of each of the Ares SSF Holders, (y) the sole member of ASOF Investment Management LLC, which is the manager of each of the Ares SOF Holders (we refer to all of the foregoing entities collectively as the Ares Entities) and (z) the investment manager or investment subadvisor of each of the Managed Accounts. |
| Accordingly, each of the Ares Entities may be deemed to share beneficial ownership of the securities held of record by the Holders, but each disclaims any such beneficial ownership of securities not held of record by them. |
| Ares Partners is managed by a board of managers, which is composed of Michael J Arougheti, Ryan Berry, R. Kipp deVeer, David B. Kaplan, Antony P. Ressler and Bennett Rosenthal (collectively, the “Ares Board Members”). Mr. Ressler generally has veto authority over Ares Board Members’ decisions. Each of these individuals disclaims beneficial ownership of the securities that may be deemed to be beneficially owned by Ares Partners. The address for each of the Ares Entities is 1800 Avenue of the Stars, Suite 1400, Los Angeles, CA 90067. |
166
| (3) | Included in the total number of shares shown as beneficially owned are shares of common stock, shares issuable upon the exercise of Jones Act Warrants and shares issuable upon exercise of Creditor Warrants. Whitebox is the investment manager of its affiliated entities (each, a “Whitebox Entity” and collectively, the “Whitebox Entities”) that own shares of our common stock and has voting and disposition control over the shares of common stock owned by the Whitebox Entities. Whitebox Advisors LLC is owned by the following members: Robert Vogel, Jacob Mercer, Nick Stukas, Brian Lutz, Paul Roos, Simon Waxley and Blue Owl GP Stakes II (A), LP, a non-voting member, and such individuals and entity disclaim beneficial ownership of the securities described in the table above held by the Whitebox Entities, except to the extent of his or its direct or indirect economic interest in Whitebox Advisors LLC or the selling shareholders. The address of the business office of each Whitebox Entity and Whitebox Advisors LLC is 3033 Excelsior Blvd., Suite 500, Minneapolis, MN 55416. |
| (4) | Included in the total number of shares shown as beneficially owned are shares of common stock and shares issuable upon the exercise of Jones Act Warrants. Highbridge Capital Management, LLC is the trading manager of certain entities (collectively, the “Highbridge Entities”) that own shares. The Highbridge Entities disclaim beneficial ownership over these shares. The address of Highbridge Capital Management, LLC is 277 Park Avenue, 23rd Floor, New York, NY 10172, and the address of the Highbridge Entities is c/o Maples Corporate Services Limited, #309 Ugland House, South Church Street, George Town, Grand Cayman KY1-1104, Cayman Islands. |
| (5) | Included in the total number of shares shown as beneficially owned are shares of common stock and shares issuable upon exercise of Creditor Warrants. Merced Capital, L.P. (“Merced”) is the general partner of and/or investment adviser to certain entities (collectively, the “Merced Entities”) that directly hold shares of our common stock and Creditor Warrants. Merced is managed by Series E of Merced Capital Partners, LLC (“Merced Capital Partners”), a series of a Delaware limited liability company. David A. Ericson, Vincent C. Vertin, and Stuart B. Brown collectively have voting control over the interests in Merced Capital Partners. In such capacities, each of Merced, Merced Capital Partners, Mr. Ericson, Mr. Vertin, and Mr. Brown may be deemed to share voting and investment control over the shares of common stock reported in the table; however, each of Mr. Ericson, Mr. Vertin, and Mr. Brown disclaim beneficial ownership of the shares of common stock reported in the table. The business address for Merced, Merced Capital Partners, Mr. Ericson, Mr. Vertin, Mr. Brown, and each of the Merced Entities is 701 Carlson Parkway, Suite 1110, Minnetonka, MN, 55305. |
| (6) | The number of shares reported includes shares covered by options and restricted stock units that are exercisable or may be settled within 60 days. |
| (7) | Included in the total number of shares shown as beneficially owned are shares of common stock, shares of common stock under vested but unsettled RSUs and shares of common stock under stock options or PSUs that may vest in the event of a “change of control” (as defined in the 2020 Management Incentive Plan) or an initial public offering if certain performance criteria are met. |
| (8) | Included in the total number of shares shown as beneficially owned are shares of common stock, shares of common stock under vested but unsettled RSUs and shares of common stock under stock options or PSUs that may vest in the event of a change of control or an initial public offering if certain performance criteria are met. |
| (9) | Included in the total number of shares shown as beneficially owned are shares of common stock, shares of common stock under vested but unsettled RSUs and shares of common stock under stock options or PSUs that may vest in the event of a change of control or an initial public offering if certain performance criteria are met. |
| (10) | Included in the total number of shares shown as beneficially owned are shares of common stock, shares of common stock under vested but unsettled RSUs and shares of common stock under stock options or PSUs that may vest in the event of a change of control or an initial public offering if certain performance criteria are met. |
| (11) | Included in the total number of shares shown as beneficially owned are shares of common stock, shares of common stock under vested but unsettled RSUs and shares of common stock |
167
| under stock options or PSUs that may vest in the event of a change of control or an initial public offering if certain performance criteria are met. |
| (12) | Included in the total number of shares shown as beneficially owned are shares of common stock and shares of common stock under vested but unsettled RSUs. |
| (13) | Included in the total number of shares shown as beneficially owned are shares of common stock and shares of common stock under vested but unsettled RSUs. |
| (14) | Included in the total number of shares shown as beneficially owned are shares of common stock and shares of common stock under vested but unsettled RSUs. |
| (15) | Included in the total number of shares shown as beneficially owned are shares of common stock and shares of common stock under vested but unsettled RSUs. |
| (16) | Included in the total number of shares shown as beneficially owned are shares of common stock and shares of common stock under vested but unsettled RSUs. |
| (17) | Included in the total number of shares shown as beneficially owned are shares of common stock, shares of common stock under vested but unsettled RSUs and shares of common stock under stock options or PSUs that may vest in the event of a change of control or an initial public offering if certain performance criteria are met. |
168
CERTAIN RELATIONSHIPS AND RELATED PARTY TRANSACTIONS
The following is a discussion of transactions between the Company and its executive officers, directors and stockholders beneficially owning more than 5% of our common stock. We believe that the terms of each of these transactions are at least as favorable as could have been obtained in similar transactions with unaffiliated third parties.
The Company has entered into a separate indemnity agreement with each of its officers and directors that provides, among other things, that the Company will indemnify such director, under the circumstances and to the extent provided in the agreement, for expenses, damages, judgments, fines and settlements he or she may be required to pay in actions or proceedings which he or she is or may be made a party by reason of his or her position as an executive officer or director of the Company, and otherwise to the fullest extent permitted under Delaware law and the Company’s amended and restated bylaws. These agreements are in addition to the indemnification provided to the Company’s officers and directors under its amended and restated bylaws and in accordance with Delaware law.
For the past 27 years, Larry D. Hornbeck’s family has personally supported the development of the Company by hosting numerous events at the Hornbeck Family Ranch (the “Ranch”), located in Houston County, Texas, including constructing at their own expense a hunting lodge and related facilities and providing access to 4,700 acres adjoining the lodge and related facilities. The Ranch and related facilities have been used for functions intended to foster client and vendor relations, management retreats, Board meetings and special Company promotional events. The Ranch also plays a vital role in the Company’s business continuity plan in the event our corporate headquarters is impacted by a natural disaster. Until December 31, 2005, these facilities were used by the Company without charge. The Company has determined that the use of the Ranch in the past and going forward has been and is beneficial to the Company’s business. On September 4, 2020, the Company entered into an Amended and Restated Facilities Use Agreement and implemented the Second Amended and Restated Indemnification Agreement (the “Indemnification Agreement”) with Larry D. Hornbeck, as well as certain other indemnitees, regarding the Ranch.
The Indemnification Agreement provides for indemnification by the Company of Larry D. Hornbeck, as well as certain other indemnitees, including the Company’s Chairman, President and Chief Executive Officer, Todd M. Hornbeck, for any claims, demands, causes of action and damages that may arise out of the Company’s use of the Ranch and related facilities and premises. The Indemnification Agreement also provides that the Company shall secure and maintain insurance coverage of the types and amounts sufficient to provide adequate protection against the liabilities that may arise under the Indemnification Agreement. The Indemnification Agreement was acknowledged by the independent members of the Board of Directors on September 9, 2020.
The agreements govern the Company’s use of the Ranch and related facilities. The Facilities Use Agreement will remain in effect until December 31, 2024 unless it is terminated or extended by its terms. The Facilities Use Agreement automatically renews on an annual basis unless either party provides the other party 30 days written notice of termination. The Facilities Use Agreement also provides that the Company will pay Mr. Larry Hornbeck an annual use fee for the Company’s use of the facilities and provides for an operating budget to reimburse Mr. Larry Hornbeck for certain variable costs related to the Company’s use of the Ranch facilities and to replenish expendable goods used by Company invitees to the facilities. For 2022, the operating budget set by the Board was $325,000, inclusive of an annual use fee of $75,000. In the fall of 2022, in light of relaxed COVID-19 restrictions and market recovery, the Company fully reopened the lodge facilities, and the audit committee and the Board adjusted the operating budget to $415,000, inclusive of an annual use fee of $112,500. For 2023, the operating budget was set at $452,500, inclusive of an annual use fee of $150,000. For 2024, the operating budget was set at $450,000, inclusive of an annual use fee of $150,000.
In 2006, Larry D. Hornbeck transferred ownership of the land on which the Ranch is located to a family limited partnership in which trusts on behalf of the children of Todd M. Hornbeck and Troy A. Hornbeck are the
169
limited partners. The general partner of the family limited partnership is controlled by Todd M. Hornbeck and Troy A. Hornbeck. The family limited partnership has entered into a long-term lease of the property to Larry Hornbeck and acknowledged and agreed to the Company’s use of the Ranch and related facilities under the Facilities Use Agreement and the Indemnification Agreement.
The Company has provided, and may, from time to time in the future at its own expense and with Mr. Larry Hornbeck’s prior approval, provide additional amenities for its representatives and invitees. Certain of these amenities may, by their nature, remain with the property should the Company ever cease to use the Ranch. In approving the Facilities Use Agreement and establishing the use fee amount, the audit committee and independent members of the Board considered the costs of comparable third-party facilities and determined that the combined facilities use fee and anticipated reimbursement of variable costs were substantially lower than costs for the use of such comparable facilities.
Mr. Larry Hornbeck has also agreed, among other things, to make himself available to the Company, the Chief Executive Officer of the Company, the Board of Directors or any committee of the Board of Directors to assist in the assessment of potential targets for acquisitions, to travel for Company projects, to attend industry meetings and to aid in other ways, in exchange for consideration of $20,333 per month paid as consulting fees pursuant to a consulting agreement dated as of September 4, 2020. This consulting agreement automatically renews on an annual basis unless either party provides the other party 30 days written notice of termination.
On October 1, 2022, Ms. Kerrigan assumed an officer role with an existing Hornbeck customer. For the six months ended June 30, 2024 and the year ended December 31, 2023, the Company generated $45.8 and $111.9 million of revenues from contracts with such customer, respectively, which accounted for approximately 14.9% and 20% of the Company’s total revenues, respectively. The Company had outstanding accounts receivable from this customer totaling $10.7 million and $8.0 million as of June 30, 2024 and December 31, 2023, respectively.
Third and Fourth Amended and Restated License Agreement
Pursuant to the Third A&R License Agreement, the Company is required to make an annual payment to HFR of $1.0 million for use of the Hornbeck Brands. An additional fee is due upon the Company achieving certain EBITDA thresholds. The Company made payments of $2.0 million and $1.0 million to HFR in 2023 and 2022, respectively, for licensing fees associated with the use of the Hornbeck Brands. Upon closing of this offering, the Company will have entered into a Fourth Amended and Restated Trade Name and Trademark License Agreement (the “Fourth A&R License Agreement”) that eliminates the ongoing annual $1 million fee and EBITDA bonus in exchange for a single one-time payment of $10 million paid to HFR. The license will be for ten years and renewable for an additional ten years for a payment of $10 million (adjusted for inflation over the first ten-year term). For additional details and risks associated with the Fourth A&R License Agreement, see “Risk Factors—We do not own the Hornbeck Brands, but may use the Hornbeck Brands pursuant to the terms of a license granted by HFR, and our business may be materially harmed if we breach our license agreement or it is terminated.”
Amended and Restated Securityholders’ Agreement
Pursuant to the A&R Securityholders Agreement, we will agree to take all necessary action (subject to applicable law) to cause the election of each director designated by Ares, Highbridge or Whitebox in their capacities as Appointing Persons in accordance with the terms of our amended and restated certificate of incorporation. The A&R Securityholders’ Agreement also provides that we will agree to take all necessary action (subject to applicable law) to cause any vacancies created by death, resignation, removal, retirement or disqualification of a director designated by an Appointing Person to be filled by such Appointing Person in accordance with the terms of our amended and restated certificate of incorporation. The A&R Securityholders Agreement will also provide our principal stockholders with certain information rights, including certain limited
170
access to our books, records and accounts and the ability to share such information with our principal stockholders, for so long as such holder owns at least the Minimum Threshold of our Fully Diluted Securities.
Registration Rights Agreement
In connection with the closing of this offering, we will enter into a registration rights agreement (the “Registration Rights Agreement”) with our principal stockholders granting them certain registration rights. Specifically, we will agree to register the sale of shares of our common stock owned by, or issuable upon exercise of the Jones Act Warrants and Creditor Warrants owned by, such principal stockholders under certain circumstances, and to provide such principal stockholders with certain customary demand and “piggyback” rights. These registration rights will be subject to certain conditions and limitations. We will generally be obligated to pay all registration expenses in connection with these registration obligations, regardless of whether a registration statement is filed or becomes effective.
Directed Share Program
At our request, the underwriters have reserved up to 5% of the shares of common stock offered by this prospectus for sale, at the initial public offering price to certain individuals through a directed share program, including our directors, officers, employees and other persons identified by the Company. The number of shares of our common stock available for sale to the general public will be reduced to the extent these individuals purchase such reserved shares. Any reserved shares that are not so purchased will be offered by the underwriters to the general public on the same basis as the other shares offered by this prospectus. Participants in the directed share program will not be subject to the terms of any lock-up agreement with respect to any shares purchased through the directed share program, except in the case of shares purchased by any of our directors or officers, and our existing significant stockholders. J.P. Morgan Securities LLC will administer our directed share program. We have agreed to indemnify J.P. Morgan Securities LLC in connection with the directed share program, including for the failure of any participant to pay for its shares. Other than the underwriting discount set forth on the cover page of this prospectus, the underwriters will not be entitled to any commission with respect to shares of our common stock sold pursuant to the directed share program. See “Underwriting (Conflicts of Interest)—Directed Share Program.”
Review, Approval or Ratification of Transactions with Related Persons.
We review any transaction in which the Company, a subsidiary of the Company, or our directors, executive officers or their immediate family members or any nominee for director or a holder of more than 5% of any class of our voting security are a participant and the amount of the transaction exceeds $120,000. Our General Counsel and Secretary is primarily responsible for the development and implementation of processes and controls to obtain information from directors and officers with respect to a related party transaction, including information provided to management in the annual director and officer questionnaires. The Company’s practice when such matters have been disclosed has been to refer the matter for consideration and final determination by the audit committee or the independent directors of the Board of Directors, or both, which have considered the fairness of the transaction to the Company, as well as other factors bearing upon its appropriateness. In all such matters, any director having a conflicting interest abstains from voting on the matters.
171
DESCRIPTION OF CAPITAL STOCK AND WARRANTS
The following is a description of the material terms of, and is qualified in its entirety by, our amended and restated certificate of incorporation, our amended and restated bylaws, the A&R Securityholders Agreement, each of which will be in effect upon the consummation of this offering, the Jones Act Warrant Agreement (as defined below) and the Creditor Warrant Agreement (as defined below), all of which are filed as exhibits to the registration statement of which this prospectus is a part.
General
Upon completion of this offering and after giving effect to the stock split, our authorized capital stock of will consist of shares of common stock, par value $0.00001 per share, of which shares will be issued and outstanding, and shares of preferred stock, par value $0.00001 per share, of which no shares will be issued and outstanding.
Common Stock
Voting Rights. Following this offering, we will have one outstanding class of stock, our common stock, and all voting rights will be vested in the holders of our common stock. On all matters subject to a vote of stockholders, stockholders will be entitled to one vote for each share of common stock owned. Stockholders will not have cumulative voting rights with respect to the election of directors.
Dividend Rights. Holders of common stock will be entitled to receive dividends, if any, in the amounts and at the times declared by the Board of Directors.
Liquidation Rights. Upon our liquidation, dissolution or winding-up, the assets legally available for distribution to our stockholders would be distributable ratably among the holders of our common stock and any participating preferred stock outstanding at that time after payment of liquidation preferences, if any, on any outstanding shares of preferred stock and payment of claims of creditors.
Assessment and Redemption. All shares of common stock that will be outstanding at the time of the completion of the offering will be validly issued, fully paid and nonassessable. There will be no provision for any voluntary redemption of common stock.
Preemptive Rights. Upon the completion of this offering, holders of our common stock will not have any preemptive right to subscribe to an additional issue of its common stock or to any security convertible into such stock.
Limitations on Ownership by Non-U.S. Citizens. We own and operate U.S.-flag vessels in the U.S. coastwise trade. Accordingly, we are subject to the Jones Act, which, subject to limited exceptions, restricts maritime transportation of merchandise between points in the United States (known as marine cabotage services or coastwise trade) to vessels built in the United States, registered under the U.S. flag, crewed by U.S. citizens or lawful permanent residents, and owned and operated by U.S. citizens within the meaning of the Jones Act. Under the Jones Act, at least 75% of our outstanding shares of each class or series of the capital stock must be owned and controlled by U.S. citizens. In order to ensure compliance with the Jones Act coastwise citizenship requirement that at least 75% of our outstanding common stock is owned by U.S. citizens, our amended and restated certificate of incorporation restricts ownership of the shares of our outstanding common stock by non-U.S. citizens in the aggregate to not more than 21%, with certain limited grandfathered circumstances allowing up to 24% of the outstanding shares of our common stock to be owned by non-U.S. citizens on and after the effective date of the initial public offering. As of August 31, 2024, approximately 22.9% of the Company’s issued and outstanding common stock is owned by non-U.S. citizens and, after giving effect to this offering, the Company expects the percentage of its common stock owned by non-U.S. citizens to decrease to approximately %. Our amended and restated certificate of incorporation further prohibits the acquisition of shares by a non-U.S. citizen where (i) such acquisition would cause the aggregate number of shares held by all non-U.S. citizens to exceed 21% of our issued and outstanding common stock and (ii) such acquisition would cause the
172
aggregate number of shares held by any individual non-U.S. citizen to exceed 4.9% of our issued and outstanding common stock. Our amended and restated certificate of incorporation further provides the Board of Directors with authority to redeem any share of common stock that is owned by non-U.S. citizens that would result in ownership by non-U.S. citizens in the aggregate in excess of 21% of our issued and outstanding common stock, with certain limited grandfathered circumstances allowing up to 24% of the outstanding shares of our common stock to be owned by non-U.S. citizens on and after the effective date of the initial public offering. In the event the Board of Directors authorizes such a redemption, we would instruct our transfer agent to issue one Jones Act Warrant, or in certain situations, cash or interest bearing promissory notes, in respect of shares of common stock that caused ownership by non-U.S. citizens to exceed the applicable permitted limit, and such holder(s)’ interests in those shares will be terminated. Our amended and restated certificate of incorporation further provides that we may require beneficial owners of our common stock to confirm their citizenship from time to time through written statement or affidavit and could, in the discretion of the Board of Directors, suspend the voting rights of such beneficial owner, pay into an escrow account dividends or other distributions (upon liquidation or otherwise) with respect to such shares held by such beneficial owner and restrict, prohibit or void the transfer of such shares and refuse to register such shares of common stock held by such beneficial owner until confirmation of its citizenship status is received.
Warrants
In addition, following this offering, we will have two series of outstanding warrants: (i) warrants issued to certain creditors of the Company in settlement of certain prepetition liabilities in connection with the consummation of the Chapter 11 Cases (the “Creditor Warrants”) and (ii) warrants issued to certain non-U.S. citizens in settlement of certain prepetition liabilities in connection with the consummation of the Chapter 11 Cases (the “Jones Act Warrants” and together with the Creditor Warrants, the “Warrants”).
The Creditor Warrants have seven-year terms and are exercisable through September 4, 2027. Each Creditor Warrant represents the right to purchase one share of common stock, par value $0.00001 per share, at an exercise price of $27.83 per share ($ per share after giving effect to the stock split), subject to certain adjustments as provided in the Creditor Warrant Agreement, dated as of September 4, 2020 (the “Creditor Warrant Agreement”) pursuant to which such warrants were issued. All unexercised Creditor Warrants will expire, and the rights of the holders of Creditor Warrants to purchase shares of common stock will terminate on the first to occur of (i) the close of business on September 4, 2027, or (ii) upon their earlier exercise or settlement in accordance with the terms of the Creditor Warrant Agreement.
Following this offering and after giving effect to the stock split, there will be outstanding Creditor Warrants to purchase up to shares of common stock.
The Jones Act Warrants have a perpetual term and are exercisable until the date on which no Jones Act Warrants remain outstanding. Each Jones Act Warrant represents the right to purchase one share of common stock, par value $0.00001 per share, for an exercise price of $0.00001 per share, subject to certain adjustments as provided in, and all other terms and conditions of, the Jones Act Warrant Agreement, dated as of September 4, 2020 (the “Jones Act Warrant Agreement”), pursuant to which such warrants were issued, including the limitations on foreign ownership as set forth in our amended and restated certificate of incorporation that are intended to assist us in complying with the Jones Act.
Following this offering and after giving effect to the stock split, assuming no issuance or exercise of additional Jones Act Warrants, there will be outstanding Jones Act Warrants to purchase up to shares of common stock.
Preferred Stock
Our Board of Directors is authorized to issue up to shares of our preferred stock in one or more series, to establish from time to time the number of shares to be included in each series, to fix the designation,
173
powers, preferences and rights of the shares of each series and any qualifications, limitations or restrictions thereof, in each case without further action by our stockholders. Subject to the terms of any series of preferred stock so designated, our Board of Directors will also be authorized to increase or decrease the number of shares of any series of preferred stock, but not below the number of shares of that series then outstanding. Our Board of Directors will be able to authorize the issuance of preferred stock with voting or conversion or other rights that could adversely affect the voting power or other rights of the holders of our common stock. The issuance of preferred stock, while providing flexibility in connection with possible acquisitions and other corporate purposes, could, among other things, have the effect of delaying, deferring or preventing a change in our control and could adversely affect the market price of our common stock and the voting and other rights of the holders of our common stock. We have no current plan to issue any shares of preferred stock in the foreseeable future.
Indemnification and Limitations on Liability of Directors and Officers
As permitted by the DGCL, our amended and restated certificate of incorporation contains provisions that eliminate the personal liability of our directors and officers to us and our stockholders to the fullest extent permitted by the DGCL. However, these provisions do not limit or eliminate the rights of us or any stockholder to seek an injunction or any other non-monetary relief in the event of a breach of a director or officer’s fiduciary duty and do not limit or eliminate the liability of directors under the federal securities laws.
In addition, our amended and restated certificate of incorporation provides that, to the fullest extent authorized or permitted by the DGCL, as now in effect or as amended, we will indemnify any person who was or is a party or is threatened to be made a party to or is otherwise involved (including involvement, without limitation, as a witness) in any actual or threatened action, suit or proceeding by reason of the fact that such person is or was our director, advisory director, board observer or officer, or by reason of the fact that our director, advisory director, board observer or officer is or was serving, at our request, as a director, advisory director, board observer, officer, employee or agent of another corporation or of a partnership, joint venture, trust or other enterprise, including service with respect to employee benefit plans. We will indemnify such persons against expenses, liabilities, and loss (including attorneys’ fees and related disbursements, judgments, fines, excise taxes or penalties under the Employee Retirement Income Security Act of 1974, penalties and amounts paid in settlement) reasonably incurred or suffered in connection with such action. Our amended and restated certificate of incorporation further provides that we shall only be required to indemnify a person potentially eligible for indemnification (as specified above) in connection with a proceeding commenced by such person if the commencement of such proceeding (or part thereof) by the person was authorized by the Board of Directors.
The DGCL permits us to purchase and maintain insurance on behalf of any person who is such a director or officer for acts committed or omissions in their capacities as such directors or officers. We currently hold and intend to maintain such liability insurance.
Anti-Takeover Provisions
Certain provisions of the DGCL, and our amended and restated certificate of incorporation and bylaws may have an anti-takeover effect and may delay, defer or prevent a merger, acquisition, tender offer, takeover attempt or other change of control transaction or other attempts to influence or replace our incumbent directors and officers. These provisions are summarized below.
Section 203 of the DGCL. We have opted out of Section 203 of the DGCL. This statute prevents certain Delaware corporations, under certain circumstances, from engaging in a “business combination” with any interested shareholder for a period of three years following the date that the shareholder became an interested shareholder, with certain exceptions. We have opted out of the provisions of Section 203 of the DGCL because we believe this statute could prohibit or delay mergers or other change in control attempts, and thus may discourage attempts to acquire us.
174
Authorized but Unissued Shares of Common Stock
Our amended and restated certificate of incorporation authorizes the Board of Directors to issue authorized but unissued shares of common stock.
Undesignated Preferred Stock
Our amended and restated certificate of incorporation provides the Board of Directors with the authority to determine and fix the powers, preferences, rights, qualifications, limitations and restrictions of shares of preferred stock issued by the Board of Directors.
Director Nomination Rights
Our amended and restated certificate of incorporation will provide that following the completion of this offering, the Ares principal stockholders will have the right to nominate to our Board of Directors (i) two nominees for so long as the Ares principal stockholders beneficially own 20% or greater of our Fully Diluted Securities and (ii) one nominee for so long as the Ares principal stockholders beneficially own at least the Minimum Threshold of our Fully Diluted Securities, but less than 20% of our Fully Diluted Securities. Aaron Rosen and James McConeghy will be the initial director nominees of the Ares principal stockholders. The Highbridge principal stockholders will have the right to nominate to our Board of Directors one nominee for so long as the Highbridge principal stockholders beneficially own at least the Minimum Threshold of our Fully Diluted Securities. Sylvia Jo Sydow Kerrigan will be the initial director nominee of the Highbridge principal stockholders. The Whitebox principal stockholders will have the right to nominate to our Board of Directors one nominee for so long as the Whitebox principal stockholders beneficially own at least the Minimum Threshold of our Fully Diluted Securities. Jacob Mercer will be the initial director nominee of the Whitebox principal stockholders. Further, for so long as any Appointing Person beneficially owns at least the Minimum Threshold of our Fully Diluted Securities, subject to applicable law and NYSE rules, such Appointing Person shall have the right to designate one director to serve on each of the compensation and the nominating, corporate governance and sustainability committees of our Board of Directors.
Consent Rights
Subject to certain exceptions, for so long as the principal stockholders who retain director nomination rights collectively own at least 30% of the Fully Diluted Securities, the following actions will require the prior written consent of Ares and at least one of Highbridge or Whitebox:
| • | Merging or consolidating with or into any other entity, or transferring all or substantially all of our assets, taken as a whole, to another entity, or undertaking any transaction that would constitute a “Change of Control” as defined in the Company’s debt agreements; |
| • | Acquiring or disposing of assets, in a single transaction or a series of related transactions, or entering into joint ventures, investments into an unrelated party or contracts (other than charter agreements consistent with past practice), in each case with a value in excess of the greater of (i) thirty percent of the total assets of the Company and its subsidiaries consolidated as of the end of the most recently completed fiscal year and (ii) $30 million; |
| • | Incurring indebtedness in a single transaction or a series of related transactions in an aggregate principal amount that both (i) causes the Company’s ratio of debt to EBITDA to exceed 3:1 and (ii) exceeds $50 million; |
| • | Appointing, removing, terminating, hiring or designating the Chief Executive Officer of the Company; |
| • | Issuing the equity of the Company or any of its subsidiaries other than pursuant to an equity compensation plan approved by the stockholders or a majority of the directors nominated by the Appointing Persons; |
175
| • | Entering into any transactions, agreements, arrangements or payments with any Appointing Person or any other person who, together with its affiliates, owns greater than or equal to 10% of the common stock then outstanding that are material or involve aggregate payments or receipts in excess of $250,000; |
| • | Commencing any liquidation, dissolution or voluntary bankruptcy, administration, recapitalization or reorganization; |
| • | Increasing or decreasing the size of the Board of Directors; and |
| • | Entering into any agreement to do any of the foregoing. |
For so long as any of the principal stockholders own any Fully Diluted Securities, each of the following actions shall require the prior written consent of such principal stockholder: (i) any amendment, waiver or other modification of the A&R Securityholders Agreement or any other stockholders’ agreement with respect to the shares of common stock to which such principal stockholder is a party; and (ii) any amendment of our amended and restated certificate of incorporation or amended and restated certificate bylaws that adversely affects any personal right of such principal stockholder thereunder in any material respect or disproportionately and adversely affects such principal stockholder thereunder in any material respect.
Requirements for Advance Notification of Stockholder Nominations and Proposals
Our amended and restated bylaws provide advance notice procedures for stockholders to nominate candidates for election as directors at our annual and special meetings of stockholders and for stockholders seeking to bring business before its annual meeting of stockholders. Our amended and restated bylaws also specify certain requirements regarding the form and content of a stockholder’s notice.
Amendments of the Amended and Restated Certificate of Incorporation or Bylaws
At any time after the date that the Appointing Persons cease to collectively own at least 35% of our outstanding common stock (the “Trigger Date”), the amendment of certain customary provisions of our amended and restated certificate of incorporation will require the approval of at least two-thirds of the voting power of our outstanding common stock. Subject to the consent rights described above, the Board of Directors may amend our amended and restated bylaws without stockholder approval, and the stockholders may amend our amended and restated bylaws by the affirmative vote of a majority of the voting power of our outstanding common stock; provided, however, that after the Trigger Date, the stockholders may amend our amended and restated bylaws only upon the affirmative vote of two-thirds of the voting power of our outstanding common stock.
Size of the Board of Directors and Vacancies
Our amended and restated certificate of incorporation provides that the Board of Directors consist of not less than seven members and not more than eleven members, and shall initially consist of ten members upon completion of this offering. Subject to the foregoing, the number of members may be fixed a resolution adopted by a majority of the Board of Directors from time to time.
Subject to the rights granted to the holders of any one or more series of preferred stock then outstanding, and unless otherwise required by law, any vacancies on the Board of Directors, and any newly created directorships resulting from any increase in the authorized number of directors, will be filled only by the affirmative vote of a majority of the directors then in office, even if less than a quorum, or by a sole remaining director, in each case, in the manner permitted by the A&R Securityholders Agreement and our amended and restated certificate of incorporation and subject to the rights of the Appointing Persons set forth in the A&R Securityholders Agreement and our amended and restated certificate of incorporation. Notwithstanding the foregoing, our amended and restated certificate of incorporation provides that if at any time the Chief Executive
176
Officer of the Company is removed, resigns or is otherwise replaced, then such person shall automatically, and without any action by the Board of Directors or the stockholders of the Company, cease to be a director, and such vacancy shall be reserved for and filled by the successor Chief Executive Officer.
Removal of Directors
Directors may be removed with or without cause by the affirmative vote of at least a majority of the voting power of our outstanding common stock. Each Appointing Person will have the right to remove without cause any director that is an employee of such Appointing Person and that was designated by such Appointing Person.
Limitations on Ownership by Non-U.S. Citizens
Because we own and operate U.S.-flag vessels in the U.S. coastwise trade, we are subject to the Jones Act, which, subject to limited exceptions, restricts maritime transportation of merchandise between points in the United States (known as marine cabotage services or coastwise trade) to vessels built in the United States, registered under the U.S. flag, crewed by U.S. citizens or lawful permanent residents, and owned and operated by U.S. citizens within the meaning of the Jones Act. Under the Jones Act, at least 75% of our outstanding shares of each class or series of the capital stock must be owned and controlled by U.S. citizens. In order to ensure compliance with the Jones Act coastwise citizenship requirement that at least 75% of our outstanding common stock is owned by U.S. citizens, our amended and restated certificate of incorporation restricts ownership of the shares of its outstanding common stock by non-U.S. citizens in the aggregate to not more than 21%, with certain limited grandfathered circumstances allowing up to 24% of the outstanding shares of our common stock to be owned by non-U.S. citizens on and after the effective date of the initial public offering. As of August 31, 2024, approximately 22.9% of the Company’s issued and outstanding common stock is owned by non-U.S. citizens and, after giving effect to this offering, the Company expects the percentage of its common stock owned by non-U.S. citizens to decrease to approximately %. Our amended and restated certificate of incorporation further prohibits the acquisition of shares by a non-U.S. citizen where (i) such acquisition would cause the aggregate number of shares held by all non-U.S. citizens to exceed 21% of our issued and outstanding common stock and (ii) such acquisition would cause the aggregate number of shares held by any individual non-U.S. citizen to exceed 4.9% of our issued and outstanding common stock. Our amended and restated certificate of incorporation further provides the Board of Directors with authority to redeem any share of common stock that is owned by non-U.S. citizens that would result in ownership by non-U.S. citizens in the aggregate in excess of 21% of our issued and outstanding common stock, with certain limited grandfathered circumstances allowing up to 24% of the outstanding shares of our common stock to be owned by non-U.S. citizens on and after the effective date of the initial public offering. In the event the Board of Directors authorizes such a redemption, we would instruct our transfer agent to issue one Jones Act Warrant, or in certain situations, cash or interest bearing promissory notes, in respect of shares of common stock that caused ownership by non-U.S. citizens to exceed the applicable permitted limit, and such holder(s)’ interests in those shares will be terminated. Our amended and restated certificate of incorporation also provides that we may require beneficial owners of our common stock to confirm their citizenship from time to time through written statement or affidavit and could, in the discretion of the Board of Directors, suspend the voting rights of such beneficial owner, pay into an escrow account dividends or other distributions (upon liquidation or otherwise) with respect to such shares held by such beneficial owner and restrict, prohibit or void the transfer of such shares and refuse to register such shares of common stock held by such beneficial owner until confirmation of its citizenship status is received.
Exclusive Forum
Our amended and restated certificate of incorporation provides that, unless we consent to the selection of an alternative forum, the Court of Chancery of the State of Delaware will, to the fullest extent permitted by applicable law, be the sole and exclusive forum for: (i) any derivative action or proceeding brought on our behalf, (ii) any action asserting a claim of breach of a fiduciary duty owed by any of our directors, officers, employees or agents to us or our stockholders, (iii) any action asserting a claim arising pursuant to any provision of the DGCL, our amended and restated certificate of incorporation or our amended and restated bylaws, or (iv) any action
177
asserting a claim against us that is governed by the internal affairs doctrine, in each such case subject to such Court of Chancery having personal jurisdiction over the indispensable parties named as defendants therein. If the Court of Chancery lacks subject matter jurisdiction, a federal district court of the United States of America located in the State of Delaware will be the exclusive forum for such actions.
Section 27 of the Exchange Act creates exclusive federal jurisdiction over all suits brought to enforce any duty or liability created by the Exchange Act or the rules and regulations thereunder, and Section 22 of the Securities Act creates concurrent jurisdiction for federal and state courts over all suits brought to enforce any duty or liability created by the Securities Act or the rules and regulations thereunder. There is uncertainty as to whether a court would enforce the forum selection provision with respect to such claims, and in any event, our stockholders would not be deemed to have waived our compliance with federal securities laws and the rules and regulations thereunder.
Registration Rights
For a description of registration rights relating to our common stock (or shares of our common stock issuable upon the exercise of our Jones Act Warrants or Creditor Warrants), see “Certain Relationships and Related Party Transactions—Registration Rights Agreement.”
Transfer Agent and Registrar
The transfer agent and registrar for our common stock is Computershare Trust Company, N.A.
Listing
We have applied to have our common stock approved for listing on the NYSE under the symbol “HOS.”
178
SHARES ELIGIBLE FOR FUTURE SALE
Upon completion of this offering and after giving effect to the stock split, we will have a total of shares of our common stock outstanding. Additionally, shares of our common stock will be issuable upon the exercise of Jones Act Warrants and shares of our common stock will be issuable upon the exercise of Creditor Warrants, with an exercise price of $0.00001 per share and $ per share, respectively, and options to purchase an aggregate of approximately shares of our common stock will be outstanding as of the consummation of this offering and shares of our common stock will be reserved for issuance upon settlement of restricted stock units outstanding as of the consummation of this offering. In addition, shares of our common stock will be authorized and reserved for issuance in relation to potential future awards under our 2020 Management Incentive Plan and our 2024 Omnibus Incentive Plan to be adopted in connection with this offering. Of the outstanding shares of common stock, the shares sold in this offering (or shares if the underwriters exercise in full their option to purchase additional shares) will be freely tradable, other than certain shares sold pursuant to our directed share program that are subject to “lock up” restrictions as described under “Underwriting (Conflicts of Interest),” without restriction or further registration under the Securities Act, except that any shares held by our affiliates, as that term is defined under Rule 144 of the Securities Act, or Rule 144, including our directors, executive officers and other affiliates (including our principal stockholders), may be sold only in compliance with the limitations described below. of the remaining shares of common stock that we will have outstanding upon completion of this offering that were not sold in this offering, as well as the Jones Act Warrants and the Creditor Warrants, were issued under Section 1145 of the U.S. Bankruptcy Code in connection with our emergence from Chapter 11 bankruptcy protection. Such shares of common stock (along with the shares of common stock issuable upon exercise of the Jones Act Warrants and the Creditor Warrants) were deemed (or will be deemed, in the case of shares underlying warrants) to have been issued in a public offering and may be resold as freely tradeable securities under the Securities Act, except for such shares held by our affiliates, or holders deemed to be “underwriters” as that term is defined in Section 1145(b) of the U.S. Bankruptcy Code, and except as subject to the limitations described below.
The shares of common stock (after giving effect to the stock split) held by our principal stockholders and certain of our directors and executive officers after this offering, representing % of the total outstanding shares of our common stock following this offering, will be “restricted securities” within the meaning of Rule 144 and 701 under the Securities Act, which are subject to certain restrictions on resale. Restricted securities may be sold in the public market only if they are registered under the Securities Act or are sold pursuant to an exemption from registration such as Rule 144 and Rule 701, as described below.
Prior to this offering, there has not been a public market for our common stock, and we cannot predict what effect, if any, market sales of shares of common stock or the availability of shares of common stock for sale will have on the market price of our common stock prevailing from time to time. Nevertheless, sales of substantial amounts of common stock, including shares issued upon the exercise of outstanding options and warrants or settlement of restricted stock units, in the public market, or the perception that such sales could occur, could materially and adversely affect the market price of our common stock and could impair our future ability to raise capital through the sale of our equity or equity-related securities at a time and price that we deem appropriate. See “Risk Factors—Risks Related to this Offering and Ownership of Our Common Stock—Future sales, or the perception of future sales, by us or our existing stockholders in the public market following this offering could cause the market price for our common stock to decline.”
Rule 144
In general, under Rule 144, as currently in effect, once we have been subject to public company reporting requirements for at least 90 days, a person (or persons whose shares are aggregated) who is not deemed to be or have been one of our affiliates for purposes of the Securities Act at any time during 90 days preceding a sale and who has beneficially owned the shares proposed to be sold for at least six months, including the holding period of
179
any prior owner other than an affiliate, is entitled to sell such shares without complying with the manner of sale, volume limitation or notice provisions of Rule 144, subject to compliance with the public information requirements of Rule 144. If such a person has beneficially owned the shares proposed to be sold for at least one year, including the holding period of a prior owner other than an affiliate, then such person is entitled to sell such shares without complying with any of the requirements of Rule 144.
In general, under Rule 144, as currently in effect, our affiliates or persons selling shares of our common stock on behalf of our affiliates, who have met the six month holding period for beneficial ownership of “restricted shares” of our common stock, are entitled to sell upon the expiration of the lock-up agreements described below, within any three-month period beginning 90 days after the date of this prospectus, a number of shares that does not exceed the greater of:
| • | 1% of the number of shares of our common stock then outstanding, which will equal approximately shares immediately after this offering; or |
| • | the average reported weekly trading volume of our common stock on the NYSE during the four calendar weeks preceding the filing of a notice on Form 144 with respect to such sale. |
Sales under Rule 144 by our affiliates or persons selling shares on behalf of our affiliates are also subject to certain manner of sale provisions and notice requirements and to the availability of current public information about us. The sale of these shares, or the perception that sales will be made, could adversely affect the price of our common stock after this offering because a great supply of shares would be, or would be perceived to be, available for sale in the public market.
Rule 701
In general, under Rule 701 as currently in effect, any of our employees, directors, officers, consultants or advisors who received shares from us in connection with a compensatory stock or option plan or other written agreement, including our 2020 Management Incentive Plan and our 2024 Omnibus Incentive Plan to be adopted in connection with this offering, before the effective date of this offering are entitled to sell such shares 90 days after the effective date of this offering in reliance on Rule 144, in the case of affiliates, without having to comply with the holding period requirements of Rule 144 and, in the case of non-affiliates, without having to comply with the public information, holding period, volume limitation or notice filing requirements of Rule 144.
Lock-Up Agreements
In connection with this offering, we, our directors and executive officers and certain holders of our outstanding common stock, including our principal stockholders, prior to this offering, including the selling stockholders, will sign lock-up agreements with the underwriters that will, subject to certain exceptions, restrict the disposition of, or hedging with respect to, the shares of our common stock or securities convertible into or exchangeable for shares of our common stock, each held by them (including any shares purchased by them pursuant to the directed share program), during the period ending 180 days after the date of this prospectus, except with the prior written consent of J.P. Morgan Securities LLC and Barclays Capital Inc. See “Underwriting (Conflicts of Interest)” for a description of these lock-up agreements.
Registration Rights
For a description of registration rights relating to our common stock (or shares of our common stock issuable upon the exercise of our Jones Act Warrants or Creditor Warrants), see “Certain Relationships and Related Party Transactions—Registration Rights Agreement.”
Registration Statement on Form S-8
We intend to file one or more registration statements on Form S-8 under the Securities Act to register all of the shares of common stock subject to outstanding stock options and the shares of common stock subject to
180
issuance under our 2020 Management Incentive Plan and our 2024 Omnibus Incentive Plan to be adopted in connection with this offering. We expect to file these registration statements as promptly as possible after the completion of this offering. Any such Form S-8 registration statements will automatically become effective upon filing. Accordingly, shares registered under such registration statements will be available for sale in the open market. We expect that the initial registration statement on Form S-8 relating to the outstanding options, restricted stock, restricted stock units and performance stock units issued under our 2020 Management Incentive Plan and our 2024 Omnibus Incentive Plan will cover shares.
181
MATERIAL U.S. FEDERAL INCOME TAX
CONSIDERATIONS FOR NON-U.S. HOLDERS
The following is a summary of the material U.S. federal income tax considerations related to the purchase, ownership and disposition of our common stock by a non-U.S. holder (as defined below) that acquired such common stock pursuant to this offering and holds our common stock as a “capital asset” within the meaning of Section 1221 of the Code (generally property held for investment). This summary is based on the provisions of the Code, U.S. Department of Treasury regulations promulgated thereunder (“Treasury Regulations”), administrative rulings and pronouncements and judicial decisions, all as in effect on the date hereof, and all of which are subject to change and differing interpretations, possibly with retroactive effect. A change in law may alter the tax considerations that we describe in this summary. We have not sought and do not intend to seek any ruling from the Internal Revenue Service (“IRS”) with respect to the statements made and the conclusions reached in the following summary, and there can be no assurance that the IRS or a court will agree with such statements and conclusions.
This summary does not address all aspects of U.S. federal income taxation that may be relevant to non-U.S. holders in light of their personal circumstances. In addition, this summary does not address the Medicare tax on certain investment income, U.S. federal estate or gift tax laws, any state, local or non-U.S. tax laws or any tax treaties. This summary also does not address tax considerations applicable to investors that may be subject to special treatment under the U.S. federal income tax laws, such as:
| • | banks, insurance companies or other financial institutions; |
| • | tax-exempt or governmental organizations; |
| • | “qualified foreign pension funds” as defined in Section 897(l)(2) of the Code (or any entities all of the interests of which are held by a qualified foreign pension fund); |
| • | dealers in securities or foreign currencies; |
| • | persons whose functional currency is not the U.S. dollar; |
| • | “controlled foreign corporations,” “passive foreign investment companies” and corporations that accumulate earnings to avoid U.S. federal income tax; |
| • | traders in securities that use the mark-to-market method of accounting for U.S. federal income tax purposes; |
| • | persons subject to the alternative minimum tax; |
| • | entities or other arrangements treated as a partnership or pass-through entity for U.S. federal income tax purposes or holders of interests therein; |
| • | persons deemed to sell our common stock under the constructive sale provisions of the Code; |
| • | persons that acquired our common stock through the exercise of employee stock options or otherwise as compensation or through a tax-qualified retirement plan; |
| • | certain former citizens or long-term residents of the United States; and |
| • | persons that hold our common stock as part of a straddle, appreciated financial position, synthetic security, hedge, conversion transaction or other integrated investment or risk reduction transaction. |
PROSPECTIVE INVESTORS ARE ENCOURAGED TO CONSULT THEIR TAX ADVISORS WITH RESPECT TO THE APPLICATION OF THE U.S. FEDERAL INCOME TAX LAWS (INCLUDING ANY POTENTIAL CHANGES THERETO) TO THEIR PARTICULAR SITUATION, AS WELL AS ANY TAX CONSEQUENCES OF THE PURCHASE, OWNERSHIP AND DISPOSITION OF OUR COMMON STOCK ARISING UNDER ANY OTHER TAX LAWS, INCLUDING THE U.S. FEDERAL ESTATE OR GIFT TAX
182
LAWS OR UNDER THE LAWS OF ANY U.S. STATE OR LOCAL, NON-U.S. OR OTHER TAXING JURISDICTION OR UNDER ANY APPLICABLE INCOME TAX TREATY.
Non-U.S. Holder Defined
For purposes of this discussion, a “non-U.S. holder” is a beneficial owner of our common stock that is not for U.S. federal income tax purposes a partnership (or a partner therein) or any of the following:
| • | an individual who is a citizen or resident of the United States; |
| • | a corporation (or other entity treated as a corporation for U.S. federal income tax purposes) created or organized in or under the laws of the United States, any state thereof or the District of Columbia; |
| • | an estate the income of which is subject to U.S. federal income tax regardless of its source; or |
| • | a trust (i) the administration of which is subject to the primary supervision of a U.S. court and which has one or more United States persons (within the meaning of Section 7701(a)(30) of the Code, a “United States person”) who have the authority to control all substantial decisions of the trust or (ii) which has made a valid election under applicable Treasury Regulations to be treated as a United States person. |
If a partnership (including an entity or arrangement treated as a partnership for U.S. federal income tax purposes) holds our common stock, the tax treatment of a partner in the partnership generally will depend upon the status of the partner, upon the activities of the partnership and upon certain determinations made at the partner level. Accordingly, we urge partners in partnerships (including entities or arrangements treated as partnerships for U.S. federal income tax purposes) considering the purchase of our common stock to consult their tax advisors regarding the U.S. federal income tax considerations of the purchase, ownership and disposition of our common stock by such partnership.
Distributions
As described in the section entitled “Dividend Policy,” while we do not currently anticipate paying dividends, depending on factors deemed relevant by our Board of Directors, following completion of this offering, our Board of Directors may elect to declare dividends on our common stock. If we do make distributions of cash or other property (other than certain stock distributions) on our common stock, those distributions will constitute dividends for U.S. federal income tax purposes to the extent paid from our current or accumulated earnings and profits, as determined under U.S. federal income tax principles. To the extent those distributions exceed our current and accumulated earnings and profits, the distributions will instead be treated as a non-taxable return of capital to the extent of the non-U.S. holder’s tax basis in our common stock (and will reduce such tax basis, until such basis equals zero) and thereafter as capital gain from the sale or exchange of such common stock. See “—Gain on Disposition of Common Stock.”
Subject to the withholding requirements under FATCA (as defined below) and with respect to effectively connected dividends, each of which is discussed below, any distribution made to a non-U.S. holder on our common stock generally will be subject to U.S. federal withholding tax at a rate of 30% of the gross amount of the distribution unless an applicable income tax treaty provides for a lower rate. To receive the benefit of a reduced treaty rate, a non-U.S. holder must timely provide the applicable withholding agent with a properly executed IRS Form W-8BEN or IRS Form W-8BEN-E (or other applicable or successor form) certifying qualification for the reduced rate. A non-U.S. holder that does not timely furnish the required documentation, but that qualifies for a reduced treaty rate, may obtain a refund of any excess amounts withheld by timely filing an appropriate claim for refund with the IRS. Non-U.S. holders are urged to consult their tax advisors regarding their entitlement to benefits under any applicable income tax treaty.
Dividends paid to a non-U.S. holder that are effectively connected with a trade or business conducted by the non-U.S. holder in the United States (and, if required by an applicable income tax treaty, are treated as
183
attributable to a permanent establishment maintained by the non-U.S. holder in the United States) generally will be taxed on a net income basis at the rates and in the manner generally applicable to United States persons. Such effectively connected dividends will not be subject to U.S. federal withholding tax (including backup withholding discussed below) if the non-U.S. holder satisfies certain certification requirements by providing the applicable withholding agent with a properly executed IRS Form W-8ECI certifying eligibility for exemption. If the non-U.S. holder is a corporation for U.S. federal income tax purposes, it may also be subject to a branch profits tax (at a 30% rate or such lower rate as specified by an applicable income tax treaty) on its effectively connected earnings and profits (as adjusted for certain items), which will include effectively connected dividends.
Gain on Disposition of Common Stock
Subject to the discussions below under “—Backup Withholding and Information Reporting” and “—Additional Withholding Requirements under FATCA,” a non-U.S. holder generally will not be subject to U.S. federal income or withholding tax on any gain realized upon the sale or other taxable disposition of our common stock unless:
| • | the non-U.S. holder is an individual who is present in the United States for a period or periods aggregating 183 days or more during the calendar year in which the sale or disposition occurs and certain other conditions are met; |
| • | the gain is effectively connected with a trade or business conducted by the non-U.S. holder in the United States (and, if required by an applicable income tax treaty, is attributable to a permanent establishment maintained by the non-U.S. holder in the United States); or |
| • | our common stock constitutes a United States real property interest by reason of our status as a United States real property holding corporation (“USRPHC”) for U.S. federal income tax purposes and as a result such gain is treated as effectively connected with a trade or business conducted by the non-U.S. holder in the United States. |
A non-U.S. holder described in the first bullet point above will be subject to U.S. federal income tax at a rate of 30% (or such lower rate as specified by an applicable income tax treaty) on the amount of such gain, which generally may be offset by U.S. source capital losses, provided the non-U.S. holder has timely filed U.S. federal income tax returns with respect to such losses.
A non-U.S. holder whose gain is described in the second bullet point above or, subject to the exceptions described in the next paragraph, the third bullet point above, generally will be taxed on a net income basis at the rates and in the manner generally applicable to United States persons unless an applicable income tax treaty provides otherwise. If the non-U.S. holder is a corporation for U.S. federal income tax purposes whose gain is described in the second bullet point above, then such gain would also be included in its effectively connected earnings and profits (as adjusted for certain items), which may be subject to a branch profits tax (at a 30% rate or such lower rate as specified by an applicable income tax treaty).
With regard to the third bullet point above, generally, a corporation is a USRPHC if the fair market value of its United States real property interests equals or exceeds 50% of the sum of the fair market value of its worldwide real property interests and its other assets used or held for use in a trade or business. We believe that we currently are not, and do not expect to become, a USRPHC for U.S. federal income tax purposes. However, if we are classified as a USRPHC or become a USRPHC in the future, as long as our common stock is and continues to be “regularly traded on an established securities market” (within the meaning of the Treasury Regulations), only a non-U.S. holder that actually or constructively owns, or owned at any time during the shorter of the five-year period ending on the date of the disposition or the non-U.S. holder’s holding period for the common stock, more than 5% of our common stock will be treated as disposing of a U.S. real property interest and will be taxable on gain realized on the disposition of our common stock as a result of our status as a
184
USRPHC. If we are classified as a USRPHC or become a USRPHC in the future, and our common stock were not considered to be regularly traded on an established securities market, such non-U.S. holder (regardless of the percentage of stock owned) would be treated as disposing of a U.S. real property interest and would be subject to U.S. federal income tax on a taxable disposition of our common stock (as described in the preceding paragraph), and a 15% withholding tax would apply to the gross proceeds from such disposition (and to any distributions treated as a non-taxable return of capital or capital gain from the sale or exchange of such common stock as described above under “—Distributions”).
NON-U.S. HOLDERS SHOULD CONSULT THEIR TAX ADVISORS WITH RESPECT TO THE APPLICATION OF THE FOREGOING RULES TO THEIR PURCHASE, OWNERSHIP AND DISPOSITION OF OUR COMMON STOCK.
Backup Withholding and Information Reporting
Any dividends paid to a non-U.S. holder must be reported annually to the IRS and to the non-U.S. holder. Copies of these information returns may be made available to the tax authorities in the country in which the non-U.S. holder resides or is established. Payments of dividends to a non-U.S. holder generally will not be subject to backup withholding if the non-U.S. holder establishes an exemption by properly certifying its non-U.S. status on an IRS Form W-8BEN or IRS Form W-8BEN-E (or other applicable or successor form).
Payments of the proceeds from a sale or other disposition by a non-U.S. holder of our common stock effected by or through a U.S. office of a broker generally will be subject to information reporting and backup withholding (at the applicable rate, which is currently 24%) unless the non-U.S. holder establishes an exemption by properly certifying its non-U.S. status on an IRS Form W-8BEN or IRS Form W-8BEN-E (or other applicable or successor form) and certain other conditions are met. Information reporting and backup withholding generally will not apply to any payment of the proceeds from a sale or other disposition of our common stock effected outside the United States by a non-U.S. office of a broker. However, unless such broker has documentary evidence in its records that the non-U.S. holder is not a United States person and certain other conditions are met, or the non-U.S. holder otherwise establishes an exemption, information reporting will apply to a payment of the proceeds of the disposition of our common stock effected outside the United States by such a broker if it has certain relationships within the United States.
Backup withholding is not an additional tax. Rather, the U.S. federal income tax liability (if any) of persons subject to backup withholding will be reduced by the amount of tax withheld. If backup withholding results in an overpayment of taxes, a refund may be obtained, provided that the required information is timely furnished to the IRS.
Additional Withholding Requirements under FATCA
Sections 1471 through 1474 of the Code, and the Treasury Regulations and administrative guidance issued thereunder (“FATCA”), impose a 30% withholding tax on any dividends paid on our common stock if paid to a “foreign financial institution” or a “non-financial foreign entity” (each as defined in the Code) (including, in some cases, when such foreign financial institution or non-financial foreign entity is acting as an intermediary), unless (i) in the case of a foreign financial institution, such institution enters into an agreement with the U.S. government to withhold on certain payments, and to collect and provide to the U.S. tax authorities substantial information regarding U.S. account holders of such institution (which includes certain equity and debt holders of such institution, as well as certain account holders that are non-U.S. entities with U.S. owners), (ii) in the case of a non-financial foreign entity, such entity certifies that it does not have any “substantial United States owners” (as defined in the Code) or timely provides the applicable withholding agent with a certification identifying the direct and indirect substantial United States owners of the entity (in either case, generally on an IRS Form W-8BEN-E), or (iii) the foreign financial institution or non-financial foreign entity otherwise qualifies for an exemption from these rules and provides appropriate documentation (such as an IRS Form W-8BEN-E). Foreign
185
financial institutions located in jurisdictions that have an intergovernmental agreement with the United States governing these rules may be subject to different rules. Under certain circumstances, a non-U.S. holder might be eligible for refunds or credits of such taxes. Non-U.S. holders are encouraged to consult their own tax advisors regarding the effects of FATCA on an investment in our common stock.
Although FATCA withholding could apply to gross proceeds on the disposition of our common stock, the U.S. Treasury released proposed Treasury Regulations (the “Proposed Regulations”) the preamble to which specifies that taxpayers may rely on them pending finalization. The Proposed Regulations eliminate FATCA withholding on the gross proceeds from a sale or other disposition of our common stock. There can be no assurance that the Proposed Regulations will be finalized in their present form.
INVESTORS CONSIDERING THE PURCHASE OF OUR COMMON STOCK ARE URGED TO CONSULT THEIR OWN TAX ADVISORS REGARDING THE APPLICATION OF THE U.S. FEDERAL INCOME TAX LAWS (INCLUDING ANY POTENTIAL CHANGES THERETO) TO THEIR PARTICULAR SITUATIONS AND THE APPLICABILITY AND EFFECT OF ANY OTHER TAX LAWS, INCLUDING U.S. FEDERAL ESTATE AND GIFT TAX LAWS AND ANY U.S. STATE OR LOCAL OR NON-U.S. TAX LAWS AND TAX TREATIES.
186
UNDERWRITING (CONFLICTS OF INTEREST)
We and the selling stockholders are offering the shares of common stock described in this prospectus through a number of underwriters. J.P. Morgan Securities LLC and Barclays Capital Inc. are acting as joint book-running managers of the offering and as representatives of the underwriters. We and the selling stockholders have entered into an underwriting agreement with the underwriters. Subject to the terms and conditions of the underwriting agreement, we and the selling stockholders have agreed to sell to the underwriters, and each underwriter has severally agreed to purchase, at the public offering price less the underwriting discounts and commissions set forth on the cover page of this prospectus, the number of shares of common stock listed next to its name in the following table:
| Name |
Number of Shares |
|||
| J.P. Morgan Securities LLC |
||||
| Barclays Capital Inc. |
||||
| Goldman Sachs & Co. LLC |
||||
| DNB Markets, Inc. |
||||
| Piper Sandler & Co. |
||||
| Guggenheim Securities, LLC |
||||
| Raymond James & Associates, Inc. |
||||
| BTIG, LLC |
||||
| Johnson Rice & Company L.L.C. |
||||
| PEP Advisory LLC |
||||
| Seaport Global Securities LLC |
||||
| Academy Securities, Inc. |
||||
| Drexel Hamilton, LLC |
||||
|
|
|
|||
| Total |
||||
|
|
|
|||
The underwriters are committed to purchase all the shares of common stock offered by us and the selling stockholders if they purchase any shares. The underwriting agreement also provides that if an underwriter defaults, the purchase commitments of non-defaulting underwriters may also be increased or the offering may be terminated.
The underwriters propose to offer the shares of common stock directly to the public at the initial public offering price set forth on the cover page of this prospectus and to certain dealers at that price less a concession not in excess of $ per share. Any such dealers may resell shares to certain other brokers or dealers at a discount of up to $ per share from the initial public offering price. After the initial offering of the shares to the public, if all of the shares of common stock are not sold at the initial public offering price, the underwriters may change the offering price and the other selling terms.
The underwriters have options to buy up to additional shares of common stock from the selling stockholders to cover sales of shares by the underwriters which exceed the number of shares specified in the table above. The underwriters have 30 days from the date of this prospectus to exercise these options to purchase additional shares. If any shares are purchased with these options to purchase additional shares, the underwriters will purchase shares in approximately the same proportion as shown in the table above. If any additional shares of common stock are purchased, the underwriters will offer the additional shares on the same terms as those on which the shares are being offered.
The underwriting fee is equal to the public offering price per share of common stock less the amount paid by the underwriters to us and the selling stockholders per share of common stock. The underwriting fee is $ per share. The following table shows the per share and total underwriting discounts and commissions
187
to be paid to the underwriters assuming both no exercise and full exercise of the underwriters’ option to purchase additional shares.
| Without option to purchase additional shares exercise |
With full option to purchase additional shares exercise |
|||||||
| Per Share |
$ | $ | ||||||
| Total |
$ | $ | ||||||
We and the selling stockholders estimate that the total expenses of this offering, including registration, filing and listing fees, printing fees and legal and accounting expenses, but excluding the underwriting discounts and commissions, will be approximately $ . We have also agreed to reimburse the underwriters for certain of their expenses in connection with this offering in an amount up to $ .
A prospectus in electronic format may be made available on the web sites maintained by one or more underwriters, or selling group members, if any, participating in the offering. The underwriters may agree to allocate a number of shares to underwriters and selling group members for sale to their online brokerage account holders. Internet distributions will be allocated by the representatives to underwriters and selling group members that may make Internet distributions on the same basis as other allocations.
Other than the prospectus in electronic format, the information on any underwriter’s or selling group member’s web site and any information contained in any other web site maintained by an underwriter or selling group member is not part of the prospectus or the registration statement of which this prospectus forms a part, has not been approved and/or endorsed by us or any underwriter or selling group member in its capacity as underwriter or selling group member and should not be relied upon by investors.
We have agreed that we will not (i) offer, pledge, sell, contract to sell, sell any option or contract to purchase, purchase any option or contract to sell, grant any option, right or warrant to purchase, lend or otherwise transfer or dispose of, directly or indirectly, or submit to, or file with, the SEC a registration statement under the Securities Act relating to, any shares of our common stock or securities convertible into or exercisable or exchangeable for any shares of our common stock, or publicly disclose the intention to make any of the foregoing, or (ii) enter into any swap or other arrangement that transfers, in whole or in part, any of the economic consequences associated with the ownership of any shares of common stock or any such other securities (regardless of whether any of these transactions are to be settled by the delivery of shares of common stock or such other securities, in cash or otherwise), in each case without the prior written consent of J.P. Morgan Securities LLC and Barclays Capital Inc. for a period of one hundred eighty (180) days after the date of this prospectus, other than the shares of our common stock to be sold in this offering.
The restrictions on our actions, as described above, do not apply to certain transactions, including (i) the offer, issuance, sale and disposition of the shares of our common stock under the underwriting agreement, (ii) the issuance of shares of common stock or securities convertible into or exercisable for shares of our common stock pursuant to the conversion or exchange of convertible or exchangeable securities, warrants or options (including net exercise) or the settlement of RSUs or PSUs (including net settlement), in each case outstanding on the date of the underwriting agreement and described in this prospectus; (iii) grants of stock options, stock awards, restricted stock, RSUs, PSUs or other equity awards and the issuance of shares of our common stock or securities convertible into or exercisable or exchangeable for shares of our common stock (whether upon the exercise of stock options or otherwise) to our employees, officers, directors, advisors, or consultants pursuant to the terms of an equity compensation plan in effect as of the closing of this offering and described in this prospectus, provided that any such recipient who is an executive officer or director of ours enters into a lock-up agreement with the underwriters; (iv) the issuance of up to 10% of the outstanding shares of our common stock, or securities convertible into, exercisable for, or which are otherwise exchangeable for, our common stock, immediately
188
following the closing of this offering, in acquisitions or other similar strategic transactions, provided that such recipients enter into a lock-up agreement with the underwriters; (v) the facilitation of the establishment of a trading plan pursuant to Rule 10b5-1 under the Exchange Act, provided that such plan does not provide for the transfer of Common Stock during the one hundred eighty (180)-day restricted period; (vi) our filing of any registration statement on Form S-8 relating to securities granted or to be granted pursuant to any plan in effect on the date of the underwriting agreement and described in this prospectus or any assumed benefit plan pursuant to an acquisition or similar strategic transaction; or (vii) submission to the SEC of a draft registration statement under the Securities Act on a confidential basis pursuant to the rules of the SEC, provided that with respect to this clause (viii), (a) no public filing with the SEC or any other public announcement may be made during the one hundred eighty (180)-day restricted period in relation to such registration, (b) J.P. Morgan Securities LLC and Barclays Capital Inc. must have received prior written consent from the Company of such submission with the SEC during the one hundred eighty (180)-day restricted period at least seven (7) business days prior to such submission, and (c) no securities of the Company may be sold, distributed or exchanged prior to the expiration of the one hundred eighty (180)-day restricted period.
Our directors and executive officers, the selling stockholders and substantially all of our stockholders holding in the aggregate approximately 95% of the outstanding shares of our common stock (such persons, the “lock-up parties”) have entered into lock-up agreements with the underwriters prior to the commencement of this offering pursuant to which each lock-up party, with limited exceptions, for a period of 180 days after the date of this prospectus (such period, the “restricted period”), may not (and may not cause any of their direct or indirect affiliates to), without the prior written consent of J.P. Morgan Securities LLC and Barclays Capital Inc., (1) offer, pledge, sell, contract to sell, sell any option or contract to purchase, purchase any option or contract to sell, grant any option, right or warrant to purchase, lend or otherwise transfer or dispose of, directly or indirectly, any shares of our common stock or any securities convertible into or exercisable or exchangeable for our common stock (including, without limitation, common stock or such other securities which may be deemed to be beneficially owned by such lock-up parties in accordance with the rules and regulations of the SEC and securities which may be issued upon exercise of a stock option or warrant (collectively with the common stock, the “lock-up securities”)), (2) enter into any hedging, swap or other agreement or transaction that transfers, in whole or in part, any of the economic consequences of ownership of the lock-up securities, whether any such transaction described in clause (1) or (2) above is to be settled by delivery of lock-up securities, in cash or otherwise, (3) make any demand for, or exercise any right with respect to, the registration of any lock-up securities, or (4) publicly disclose the intention to do any of the foregoing. Such persons or entities have further acknowledged that these undertakings preclude them from engaging in any hedging or other transactions or arrangements (including, without limitation, any short sale or the purchase or sale of, or entry into, any put or call option, or combination thereof, forward, swap or any other derivative transaction or instrument, however described or defined) designed or intended, or which could reasonably be expected to lead to or result in, a sale or disposition or transfer (by any person or entity, whether or not a signatory to such agreement) of any economic consequences of ownership, in whole or in part, directly or indirectly, of any lock-up securities, whether any such transaction or arrangement (or instrument provided for thereunder) would be settled by delivery of lock-up securities, in cash or otherwise.
The restrictions described in the immediately preceding paragraph and contained in the lock-up agreements between the underwriters and the lock-up parties do not apply, subject in certain cases to various conditions, to certain transactions, including (a) transfers of lock-up securities: (i) as bona fide gifts, charitable contributions or for bona fide estate planning purposes, (ii) by will or intestacy, (iii) to any trust for the direct or indirect benefit of the lock-up party or any immediate family member or, if the lock-up party is a trust, to a trustor or beneficiary of the trust or to the estate of a beneficiary of such trust, (iv) to a partnership, limited liability company or other entity of which the lock-up party and its immediate family members are the legal and beneficial owner of all of the outstanding equity securities or similar interests, (v) to a nominee or custodian of a person or entity to whom a disposition or transfer would be permissible under clauses (i) through (iv), (vi) in the case of a corporation, partnership, limited liability company, trust or other business entity, (A) to another corporation, partnership, limited liability company, trust or other business entity that is an affiliate of the lock-up party, or to any investment fund, vehicle, account, portion of a fund, vehicle or account or other entity controlling, controlled by,
189
managing or managed by or under common control with the lock-up party or its affiliates (including, for the avoidance of doubt, where the lock-up party is a partnership, to its general partner or a successor partnership or fund, vehicle, accounts or portions of funds, vehicles or accounts or any other funds, managed by such partnership) or (B) as part of a distribution to partners, members. stockholders or other equityholders of the lock-up party; (vii) by operation of law, (viii) to us from an employee upon death, disability or termination of employment of such employee, (ix) as part of a sale of lock-up securities acquired in open market transactions after the completion of this offering, (x) to us in connection with the vesting, settlement or exercise of RSUs, PSUs, options, warrants or other rights to purchase shares of our common stock (including “net” or “cashless” exercise), including for the payment of exercise price and tax and remittance payments, or (xi) pursuant to a bona fide third-party tender offer, merger, consolidation or other similar transaction approved by our Board of Directors and made to all shareholders involving a change in control, provided that if such transaction is not completed, all such lock-up securities would remain subject to the restrictions in the immediately preceding paragraph; (b) exercise of the outstanding options, settlement of RSUs or other equity awards granted pursuant to plans described in this prospectus or the exercise of warrants, provided that any lock-up securities received upon such exercise, vesting or settlement would be subject to restrictions similar to those in the immediately preceding paragraph; (c) the conversion of outstanding preferred stock, warrants to acquire preferred stock, or convertible securities into shares of our common stock or warrants to acquire shares of our common stock, provided that any common stock or warrant received upon such conversion would be subject to restrictions similar to those in the immediately preceding paragraph; (d) the establishment by lock-up parties of trading plans under Rule 10b5-1 under the Exchange Act, provided that such plan does not provide for the transfer of lock-up securities during the restricted period (other than for the payment of exercise price and tax remittance payments due as a result of the vesting, settlement, or exercise of restricted stock units, performance stock units, options, warrants or rights); and (e) the sale of our common stock pursuant to the terms of the underwriting agreement.
J.P. Morgan Securities LLC and Barclays Capital Inc., in their sole discretion, may release the securities subject to any of the lock-up agreements with the underwriters described above, in whole or in part at any time.
We and the selling stockholders have agreed to indemnify the underwriters against certain liabilities, including liabilities under the Securities Act.
We have applied to have our common stock approved for listing on the NYSE under the symbol “HOS”.
In connection with this offering, the underwriters may engage in stabilizing transactions, which involves making bids for, purchasing and selling shares of common stock in the open market for the purpose of preventing or retarding a decline in the market price of the common stock while this offering is in progress. These stabilizing transactions may include making short sales of common stock, which involves the sale by the underwriters of a greater number of shares of common stock than they are required to purchase in this offering, and purchasing shares of common stock on the open market to cover positions created by short sales. Short sales may be “covered” shorts, which are short positions in an amount not greater than the underwriters’ option to purchase additional shares referred to above, or may be “naked” shorts, which are short positions in excess of that amount. The underwriters may close out any covered short position either by exercising their option to purchase additional shares, in whole or in part, or by purchasing shares in the open market. In making this determination, the underwriters will consider, among other things, the price of shares available for purchase in the open market compared to the price at which the underwriters may purchase shares through the option to purchase additional shares. A naked short position is more likely to be created if the underwriters are concerned that there may be downward pressure on the price of the common stock in the open market that could adversely affect investors who purchase in this offering. To the extent that the underwriters create a naked short position, they will purchase shares in the open market to cover the position.
The underwriters have advised us that, pursuant to Regulation M of the Securities Act, they may also engage in other activities that stabilize, maintain or otherwise affect the price of the common stock, including the imposition of penalty bids. This means that if the representatives of the underwriters purchase common stock in
190
the open market in stabilizing transactions or to cover short sales, the representatives can require the underwriters that sold those shares as part of this offering to repay the underwriting discount received by them.
These activities may have the effect of raising or maintaining the market price of the common stock or preventing or retarding a decline in the market price of the common stock, and, as a result, the price of the common stock may be higher than the price that otherwise might exist in the open market. If the underwriters commence these activities, they may discontinue them at any time. The underwriters may carry out these transactions on the NYSE, in the over-the-counter market or otherwise.
Our prior class of common stock was delisted in July 2020, and 4,366,348 shares of our new common stock were issued in connection with the consummation of the Chapter 11 Cases on September 4, 2020. As a result, since July 2020, there has been no public market for our common stock. The initial public offering price will be determined by negotiations between us and the representatives of the underwriters. In determining the initial public offering price, we and the representatives of the underwriters expect to consider a number of factors including:
| • | the information set forth in this prospectus and otherwise available to the representatives; |
| • | our prospects and the history and prospects for the industry in which we compete; |
| • | an assessment of our management; |
| • | our prospects for future earnings; |
| • | the general condition of the securities markets at the time of this offering; |
| • | the recent market prices of, and demand for, publicly traded common stock of generally comparable companies; and |
| • | other factors deemed relevant by the underwriters and us. |
Neither we nor the underwriters can assure investors that an active trading market will develop for our shares of common stock, or that the shares will trade in the public market at or above the initial public offering price.
Certain of the underwriters and their affiliates have provided in the past to us and our affiliates and may provide from time to time in the future certain commercial banking, financial advisory, consulting, investment banking and other services for us and such affiliates in the ordinary course of their business, for which they have received and may continue to receive customary fees and commissions. In addition, certain of the underwriters and their affiliates are, or may become, lenders under the First Lien Revolving Credit Facility, for which such underwriters and their affiliates have received customary fees. In addition, from time to time, certain of the underwriters and their affiliates may effect transactions for their own account or the account of customers, and hold on behalf of themselves or their customers, long or short positions in our debt or equity securities or loans, and may do so in the future.
Conflict of Interest
Highbridge is an indirect subsidiary of J.P. Morgan Chase & Co. and, prior to this offering, beneficially owns more than 10% of our common stock on a fully diluted basis (including both shares of common stock and shares issuable upon the exercise of Jones Act Warrants and Creditor Warrants). Highbridge is a selling stockholder in this offering and, as such, may receive more than 5% of the net proceeds of this offering.
Because of this relationship, J.P. Morgan Securities LLC is deemed to have a “conflict of interest” under FINRA Rule 5121. Accordingly, this offering is being conducted in accordance with the applicable provisions of FINRA Rule 5121, including the requirement that a “qualified independent underwriter” participate in the
191
preparation of the prospectus and exercise the usual standards of due diligence in connection with such participation. Barclays Capital Inc. has agreed to serve as the qualified independent underwriter for this offering and will not receive any additional fees for serving in that capacity. We have agreed to indemnify Barclays Capital Inc. against any liabilities arising in connection with its role as a qualified independent underwriter, including liabilities under the Securities Act. Additionally, in accordance with FINRA Rule 5121(c), no sales of the shares in this offering will be made to any discretionary account over which J.P. Morgan Securities LLC exercises discretion without the prior specific written approval of the account holder.
Directed Share Program
At our request, the underwriters have reserved up to 5% of the shares offered by this prospectus for sale, at the initial public offering price, to certain individuals through a directed share program, including our directors, officers, employees and certain other individuals identified by us. The sales will be made at our direction by J.P. Morgan Securities LLC and its affiliates. The number of shares of our common stock available for sale to the general public in this offering will be reduced to the extent that such persons purchase such reserved shares. Any reserved shares not so purchased will be offered by the underwriters to the general public on the same terms as the other shares of common stock offered by this prospectus. We have agreed to indemnify the underwriters against certain liabilities and expenses, including liabilities under the Securities Act, in connection with the sales of the shares reserved for the directed share program.
Shares purchased through the directed share program will not be subject to a lock-up restriction, except in the case of shares purchased by any of our directors and officers, which shares will be subject to a 180-day lock-up restriction (as described above).
Jones Act
Because we own and operate U.S.-flagged vessels in the U.S. coastwise trade, the Jones Act requires that at least 75% of the outstanding shares of each class or series of the capital stock of the Company must be owned and controlled by U.S. citizens. If we do not continue to comply with such requirements, we would be prohibited from operating our U.S.-flagged vessels in the U.S. coastwise trade and may incur severe penalties, such as fines and/or forfeiture of such vessels and/or permanent loss of U.S. coastwise trading privileges for such vessels. As a result, we have restricted participation in this offering to U.S. citizens as defined under the Jones Act. As of August 31, 2024, approximately 22.9% of the Company’s issued and outstanding common stock is owned by non-U.S. citizens and, after giving effect to this offering, the Company expects the percentage of its common stock owned by non-U.S. citizens to decrease to approximately %.
In order to ensure compliance with the U.S. citizenship and cabotage laws principally contained in the Jones Act, sales in the offering will be limited so that shares will only be allocated to U.S. citizens (as determined in accordance with the Jones Act). A “U.S. citizen” for purposes of the Jones Act includes the following:
| • | If the investor is an individual, the investor is deemed a citizen of the United States (for Jones Act purposes) if the investor is native-born, naturalized, or a derivative citizen of the United States, or otherwise qualifies as a United States citizen. |
| • | If the investor is a partnership, limited liability company or limited partnership, the entity is deemed a citizen of the United States (for Jones Act purposes) if the investor: (a) is organized under the laws of the United States or a State, (b) each general partner or manager is a citizen of the United States and (c) is not less than 75.0% of the interest and voting power of the partnership, limited liability company or limited partnership is ultimately held by citizens of the United States free of any voting trust, fiduciary arrangement or other agreement, arrangement or understanding whereby non-citizens may directly or indirectly assert control. |
| • | If the investor is a corporation, the investor is deemed a citizen of the United States (for Jones Act purposes) if: (a) the investor is organized under the laws of the United States or a State, (b) each of its |
192
| president or other chief executive and the chairman of its board of directors is a citizen of the United States, (c) the investor is no more than a minority of the number of its directors necessary to constitute a quorum for the transaction of business are non-citizens of the United States and (d) not less than 75.0% of the shares (beneficially and of record) are owned by citizens of the United States, and free of any voting trust, fiduciary arrangement or other agreement, arrangement or understanding whereby non-citizens may directly or indirectly assert control. |
| • | Where the investor is an entity (and not an individual), the requirement that at least 75.0% of the interests and voting power be owned and controlled by U.S. citizens extends up through the various tiers to all levels of direct and indirect ownership in the entity. Accordingly, each entity in the chain of ownership, at each tier of ownership, of the underlying entity must meet the definition of citizen of the United States (for Jones Act purposes) applicable to such entity. |
Our amended and restated certificate of incorporation further provides the Board of Directors with authority to take certain actions to protect our Jones Act status. These actions may include: (i) refusing to recognize any transfer (including our original issuance) that would result in ownership by non-U.S. citizens in the aggregate exceeding 21% of our issued and outstanding common stock, with certain limited grandfathered circumstances allowing up to 24% of the outstanding shares of our common stock to be owned by non-U.S. citizens on and after the effective date of the initial public offering, (ii) treating any such purported transfer as void ab initio or (iii) redeeming any share of our common stock that caused the ownership by non-U.S. citizens to exceed such 21% ownership limitation, with certain limited grandfathered circumstances allowing up to 24% of the outstanding shares of our common stock to be owned by non-U.S. citizens on and after the effective date of the initial public offering. In the event the Board of Directors authorizes such a redemption, we would instruct our transfer agent to issue one Jones Act Warrant, or in certain situations, cash or interest bearing promissory notes, in respect of shares of common stock that caused ownership by non-U.S. citizens to exceed the applicable permitted limit, and such holder(s)’ interests in those shares will be terminated. For a description of the Jones Act citizenship restrictions and redemption procedures, see “Description of Capital Stock and Warrants—Limitations on Ownership by Non-U.S. Citizens.”
193
The validity of the shares of common stock offered by this prospectus will be passed upon for us by Kirkland & Ellis LLP, Houston, Texas. Certain legal matters relating to this offering will be passed upon for the underwriters by Vinson & Elkins LLP, Houston, Texas.
The consolidated financial statements of Hornbeck Offshore Services, Inc. at December 31, 2023 and 2022, and for each of the three years in the period ended December 31, 2023, appearing in this prospectus or the registration statement of which this prospectus forms a part have been audited by Ernst & Young LLP, independent registered public accounting firm, as set forth in their report thereon appearing elsewhere herein, and are included in reliance upon such report given on the authority of such firm as experts in accounting and auditing.
With respect to the unaudited consolidated interim financial information of Hornbeck Offshore Services, Inc. as of June 30, 2024 and for the three-month and six-month periods ended June 30, 2024 and June 30, 2023, appearing in this prospectus or the registration statement of which this prospectus forms a part, Ernst & Young LLP reported that they have applied limited procedures in accordance with professional standards for a review of such information. However, their separate report dated August 14, 2024 appearing elsewhere herein states that they did not audit and they do not express an opinion on that interim financial information. Accordingly, the degree of reliance on their report on such information should be restricted in light of the limited nature of the review procedures applied. Ernst & Young LLP is not subject to the liability provisions of Section 11 of the Securities Act for their report on the unaudited interim financial information because that report is not a “report” or a “part” of the registration statement of which this prospectus forms a part prepared or certified by Ernst & Young LLP within the meaning of Sections 7 and 11 of the Securities Act.
WHERE YOU CAN FIND MORE INFORMATION
We have filed with the SEC a registration statement on Form S-1 under the Securities Act with respect to the common stock offered in this prospectus. This prospectus, filed as part of the registration statement, does not contain all of the information set forth in the registration statement and its exhibits and schedules, portions of which have been omitted as permitted by the rules and regulations of the SEC. For further information about us and our common stock, we refer you to the registration statement and to its exhibits and schedules. Statements in this prospectus about the contents of any contract, agreement or other document are not necessarily complete and, in each instance, we refer you to the copy of such contract, agreement or document filed as an exhibit to the registration statement, with each such statement being qualified in all respects by reference to the document to which it refers.
The SEC maintains a website that contains reports, proxy statements and other information about companies like us, who file electronically with the SEC. The address of that website is http://www.sec.gov. This reference to the SEC’s website is an inactive textual reference only and is not a hyperlink.
Upon the effectiveness of the registration statement, we will be subject to the reporting, proxy and information requirements of the Exchange Act and will be required to file periodic reports, proxy statements and other information with the SEC. These periodic reports, proxy statements and other information will be available on the website of the SEC referred to above, as well as on our website, www.hornbeckoffshore.com. This reference to our website is an inactive textual reference only and is not a hyperlink. The contents of, or other information accessible through, our website are not part of this prospectus or the registration statement of which this prospectus forms a part, and you should not consider the contents of our website in making an investment
194
decision with respect to our common stock. We will furnish our stockholders with annual reports containing audited financial statements and quarterly reports containing unaudited interim financial statements for each of the first three quarters of each year.
195
F-1
Review Report of Independent Registered Public Accounting Firm
To the Stockholders and the Board of Directors of Hornbeck Offshore Services, Inc.
Results of Review of Interim Financial Statements
We have reviewed the accompanying consolidated balance sheet of Hornbeck Offshore Services, Inc. and Subsidiaries (the Company) as of June 30, 2024, the related consolidated statements of operations, comprehensive income and changes in stockholders’ equity for the three-month and six-month periods ended June 30, 2024 and 2023, and cash flows for the six-month periods ended June 30, 2024 and 2023, and the related notes (collectively referred to as the “consolidated interim financial statements”). Based on our reviews, we are not aware of any material modifications that should be made to the consolidated interim financial statements for them to be in conformity with U.S. generally accepted accounting principles.
We have previously audited, in accordance with the standards of the Public Company Accounting Oversight Board (United States) (PCAOB) and in accordance with auditing standards generally accepted in the United States of America (GAAS), the consolidated balance sheet of the Company as of December 31, 2023, and the related consolidated statements of operations, comprehensive income, changes in stockholders’ equity and cash flows for the year then ended, and the related notes (not presented herein); and in our report dated March 14, 2024, we expressed an unqualified audit opinion on those consolidated financial statements. In our opinion, the information set forth in the accompanying consolidated balance sheet as of December 31, 2023, is fairly stated, in all material respects, in relation to the consolidated balance sheet from which it has been derived.
Basis for Review Results
These financial statements are the responsibility of the Company’s management. We are a public accounting firm registered with the PCAOB and are required to be independent with respect to the Company in accordance with the U.S. federal securities laws and the applicable rules and regulations of the SEC and the PCAOB. We conducted our review in accordance with the standards of the PCAOB and in accordance with GAAS applicable to reviews of interim financial information. A review of interim financial information consists principally of applying analytical procedures and making inquiries of persons responsible for financial and accounting matters. It is substantially less in scope than an audit conducted in accordance with the standards of the PCAOB and GAAS, the objective of which is the expression of an opinion regarding the financial statements taken as a whole. Accordingly, we do not express such an opinion.
/s/ Ernst & Young LLP
New Orleans, Louisiana
August 14, 2024
F-2
HORNBECK OFFSHORE SERVICES, INC. AND SUBSIDIARIES
CONSOLIDATED BALANCE SHEETS
(in thousands, except per share data)
| June 30, 2024 |
December 31, 2023 |
|||||||
| (Unaudited) | (Audited) | |||||||
| ASSETS |
||||||||
| Current assets: |
||||||||
| Cash and cash equivalents |
$ | 91,078 | $ | 120,055 | ||||
| Accounts receivable, net of allowance for credit losses of $6,273 and $6,307, respectively |
142,738 | 126,438 | ||||||
| Prepaid expenses |
11,635 | 4,870 | ||||||
| Taxes receivable |
16,072 | 7,961 | ||||||
| Other current assets |
11,276 | 11,500 | ||||||
|
|
|
|
|
|||||
| Total current assets |
272,799 | 270,824 | ||||||
| Property, plant and equipment, net |
625,270 | 602,422 | ||||||
| Restricted cash |
765 | 765 | ||||||
| Deferred charges, net |
62,758 | 48,336 | ||||||
| Operating lease right-of-use assets |
24,260 | 22,905 | ||||||
| Finance lease right-of-use assets |
960 | 827 | ||||||
| Other assets |
440 | 440 | ||||||
|
|
|
|
|
|||||
| Total assets |
$ | 987,252 | $ | 946,519 | ||||
|
|
|
|
|
|||||
| LIABILITIES AND STOCKHOLDERS’ EQUITY |
||||||||
| Current liabilities: |
||||||||
| Accounts payable |
$ | 63,257 | $ | 76,484 | ||||
| Accrued interest |
5,357 | 5,357 | ||||||
| Accrued payroll and benefits |
22,224 | 26,511 | ||||||
| Operating lease liabilities |
6,961 | 5,096 | ||||||
| Finance lease liabilities |
399 | 342 | ||||||
| Accrued taxes payable |
15,558 | 12,328 | ||||||
| Deferred revenue |
12,334 | 2,822 | ||||||
| Other current liabilities |
6,827 | 1,475 | ||||||
|
|
|
|
|
|||||
| Total current liabilities |
132,917 | 130,415 | ||||||
| Long-term debt |
349,001 | 349,001 | ||||||
| Deferred tax liabilities, net |
1,332 | 1,996 | ||||||
| Liability-classified warrants |
74,779 | 75,475 | ||||||
| Operating lease liabilities |
19,931 | 20,309 | ||||||
| Finance lease liabilities |
419 | 351 | ||||||
| Other long-term liabilities |
7,597 | 7,679 | ||||||
|
|
|
|
|
|||||
| Total long-term liabilities |
453,059 | 454,811 | ||||||
|
|
|
|
|
|||||
| Total liabilities |
585,976 | 585,226 | ||||||
|
|
|
|
|
|||||
| Stockholders’ equity: |
||||||||
| Common stock: $0.00001 par value; 50,000 shares authorized; 5,642 and 5,554 shares issued and outstanding, respectively |
— | — | ||||||
| Additional paid-in capital |
211,389 | 210,776 | ||||||
| Retained earnings |
192,654 | 148,428 | ||||||
| Accumulated other comprehensive income (loss) |
(2,767 | ) | 2,089 | |||||
|
|
|
|
|
|||||
| Total stockholders’ equity |
401,276 | 361,293 | ||||||
|
|
|
|
|
|||||
| Total liabilities and stockholders’ equity |
$ | 987,252 | $ | 946,519 | ||||
|
|
|
|
|
|||||
F-3
HORNBECK OFFSHORE SERVICES, INC. AND SUBSIDIARIES
CONSOLIDATED STATEMENTS OF OPERATIONS
(in thousands, except per share data)
| Three Months Ended June 30, |
Six Months Ended June 30, |
|||||||||||||||
| 2024 | 2023 | 2024 | 2023 | |||||||||||||
| (Unaudited) | (Unaudited) | |||||||||||||||
| Revenues: |
||||||||||||||||
| Vessel revenues |
$ | 163,998 | $ | 135,912 | $ | 283,207 | $ | 256,487 | ||||||||
| Non-vessel revenues |
11,982 | 10,986 | 23,569 | 21,902 | ||||||||||||
|
|
|
|
|
|
|
|
|
|||||||||
| 175,980 | 146,898 | 306,776 | 278,389 | |||||||||||||
| Costs and expenses: |
||||||||||||||||
| Operating expense |
90,153 | 74,592 | 181,818 | 141,501 | ||||||||||||
| Depreciation expense |
9,507 | 6,029 | 18,093 | 11,753 | ||||||||||||
| Amortization expense |
6,363 | 5,655 | 12,163 | 10,366 | ||||||||||||
| General and administrative expense |
16,882 | 15,609 | 32,430 | 32,366 | ||||||||||||
| Stock-based compensation expense |
2,584 | 2,361 | 4,423 | 15,363 | ||||||||||||
| Terminated debt refinancing costs |
— | 3,633 | — | 3,633 | ||||||||||||
|
|
|
|
|
|
|
|
|
|||||||||
| 125,489 | 107,879 | 248,927 | 214,982 | |||||||||||||
|
|
|
|
|
|
|
|
|
|||||||||
| Gain on sale of assets |
27 | 2,576 | 31 | 2,566 | ||||||||||||
|
|
|
|
|
|
|
|
|
|||||||||
| Operating income |
50,518 | 41,595 | 57,880 | 65,973 | ||||||||||||
| Interest expense |
6,706 | 11,123 | 13,437 | 22,972 | ||||||||||||
| Interest income |
(1,327 | ) | (2,614 | ) | (3,007 | ) | (4,830 | ) | ||||||||
|
|
|
|
|
|
|
|
|
|||||||||
| Net interest expense |
5,379 | 8,509 | 10,430 | 18,142 | ||||||||||||
|
|
|
|
|
|
|
|
|
|||||||||
| 45,139 | 33,086 | 47,450 | 47,831 | |||||||||||||
|
|
|
|
|
|
|
|
|
|||||||||
| Other income (expense): |
||||||||||||||||
| Foreign currency loss |
(537 | ) | (629 | ) | (757 | ) | (857 | ) | ||||||||
| Fair value adjustment of liability-classified warrants |
(8,490 | ) | (7,947 | ) | 696 | (4,533 | ) | |||||||||
| Other income |
— | 42 | — | 756 | ||||||||||||
|
|
|
|
|
|
|
|
|
|||||||||
| (9,027 | ) | (8,534 | ) | (61 | ) | (4,634 | ) | |||||||||
|
|
|
|
|
|
|
|
|
|||||||||
| Income before income taxes |
36,112 | 24,552 | 47,389 | 43,197 | ||||||||||||
| Income tax expense |
3,014 | 4,168 | 3,163 | 6,362 | ||||||||||||
|
|
|
|
|
|
|
|
|
|||||||||
| Net income |
$ | 33,098 | $ | 20,384 | $ | 44,226 | $ | 36,835 | ||||||||
|
|
|
|
|
|
|
|
|
|||||||||
| Basic earnings per common share |
$ | 1.94 | $ | 1.20 | $ | 2.59 | $ | 2.17 | ||||||||
|
|
|
|
|
|
|
|
|
|||||||||
| Diluted earnings per common share |
$ | 1.71 | $ | 1.07 | $ | 2.29 | $ | 1.94 | ||||||||
|
|
|
|
|
|
|
|
|
|||||||||
F-4
HORNBECK OFFSHORE SERVICES, INC. AND SUBSIDIARIES
CONSOLIDATED STATEMENTS OF COMPREHENSIVE INCOME
(in thousands)
| Three Months Ended June 30, |
Six Months Ended June 30, |
|||||||||||||||
| 2024 | 2023 | 2024 | 2023 | |||||||||||||
| (Unaudited) | (Unaudited) | |||||||||||||||
| Net income |
$ | 33,098 | $ | 20,384 | $ | 44,226 | $ | 36,835 | ||||||||
| Other comprehensive income: |
||||||||||||||||
| Foreign currency translation income (loss), net |
(3,899 | ) | 1,321 | (4,856 | ) | 2,222 | ||||||||||
|
|
|
|
|
|
|
|
|
|||||||||
| Total comprehensive income |
$ | 29,199 | $ | 21,705 | $ | 39,370 | $ | 39,057 | ||||||||
|
|
|
|
|
|
|
|
|
|||||||||
F-5
HORNBECK OFFSHORE SERVICES, INC. AND SUBSIDIARIES
CONSOLIDATED STATEMENTS OF CHANGES IN STOCKHOLDERS’ EQUITY
(in thousands)
| Three Months Ended June 30, 2024 | ||||||||||||||||||||||||
| (Unaudited) | ||||||||||||||||||||||||
| Common Stock | Additional Paid-In Capital |
Retained Earnings |
Accumulated Other Comprehensive Income (Loss) |
Total Stockholders Equity |
||||||||||||||||||||
| Shares | Amount | |||||||||||||||||||||||
| Balance at April 1, 2024 (1) |
16,931 | $ | — | $ | 212,631 | $ | 159,556 | $ | 1,132 | $ | 373,319 | |||||||||||||
| Issuance of common stock and warrants |
88 | — | 130 | — | — | 130 | ||||||||||||||||||
| Stock-based compensation expense |
— | — | 2,344 | — | — | 2,344 | ||||||||||||||||||
| Shares withheld for employee withholding taxes |
— | — | (3,716 | ) | — | — | (3,716 | ) | ||||||||||||||||
| Net income |
— | — | — | 33,098 | — | 33,098 | ||||||||||||||||||
| Foreign currency translation loss, net |
— | — | — | — | (3,899 | ) | (3,899 | ) | ||||||||||||||||
|
|
|
|
|
|
|
|
|
|
|
|
|
|||||||||||||
| Balance at June 30, 2024 (2) |
17,019 | $ | — | $ | 211,389 | $ | 192,654 | $ | (2,767 | ) | $ | 401,276 | ||||||||||||
|
|
|
|
|
|
|
|
|
|
|
|
|
|||||||||||||
| Six Months Ended June 30, 2024 | ||||||||||||||||||||||||
| (Unaudited) | ||||||||||||||||||||||||
| Common Stock | Additional Paid-In Capital |
Retained Earnings |
Accumulated Other Comprehensive Income (Loss) |
Total Stockholders Equity |
||||||||||||||||||||
| Shares | Amount | |||||||||||||||||||||||
| Balance at January 1, 2024 (1) |
16,931 | $ | — | $ | 210,776 | $ | 148,428 | $ | 2,089 | $ | 361,293 | |||||||||||||
| Issuance of common stock and warrants |
88 | — | 130 | — | — | 130 | ||||||||||||||||||
| Stock-based compensation expense |
— | — | 4,199 | — | — | 4,199 | ||||||||||||||||||
| Shares withheld for employee withholding taxes |
— | — | (3,716 | ) | — | — | (3,716 | ) | ||||||||||||||||
| Net income |
— | — | — | 44,226 | — | 44,226 | ||||||||||||||||||
| Foreign currency translation loss, net |
— | — | — | — | (4,856 | ) | (4,856 | ) | ||||||||||||||||
|
|
|
|
|
|
|
|
|
|
|
|
|
|||||||||||||
| Balance at June 30, 2024 (2) |
17,019 | $ | — | $ | 211,389 | $ | 192,654 | $ | (2,767 | ) | $ | 401,276 | ||||||||||||
|
|
|
|
|
|
|
|
|
|
|
|
|
|||||||||||||
| Three Months Ended June 30, 2023 | ||||||||||||||||||||||||
| (Unaudited) | ||||||||||||||||||||||||
| Common Stock | Additional Paid-In Capital |
Retained Earnings |
Accumulated Other Comprehensive Income (Loss) |
Total Stockholders Equity |
||||||||||||||||||||
| Shares | Amount | |||||||||||||||||||||||
| Balance at April 1, 2023 (1) |
16,931 | $ | — | $ | 208,927 | $ | 90,341 | $ | 837 | $ | 300,105 | |||||||||||||
| Stock-based compensation expense |
— | — | 2,116 | — | — | 2,116 | ||||||||||||||||||
| Shares withheld for employee withholding taxes |
— | — | (3,834 | ) | — | — | (3,834 | ) | ||||||||||||||||
| Net income |
— | — | — | 20,384 | — | 20,384 | ||||||||||||||||||
| Foreign currency translation income, net |
— | — | — | — | 1,321 | 1,321 | ||||||||||||||||||
|
|
|
|
|
|
|
|
|
|
|
|
|
|||||||||||||
| Balance at June 30, 2023 (1) |
16,931 | $ | — | $ | 207,209 | $ | 110,725 | $ | 2,158 | $ | 320,092 | |||||||||||||
|
|
|
|
|
|
|
|
|
|
|
|
|
|||||||||||||
F-6
HORNBECK OFFSHORE SERVICES, INC. AND SUBSIDIARIES
CONSOLIDATED STATEMENTS OF CHANGES IN STOCKHOLDERS’ EQUITY
(in thousands)
| Six Months Ended June 30, 2023 | ||||||||||||||||||||||||
| (Unaudited) | ||||||||||||||||||||||||
| Common Stock | Additional Paid-In Capital |
Retained Earnings |
Accumulated Other Comprehensive Income (Loss) |
Total Stockholders Equity |
||||||||||||||||||||
| Shares | Amount | |||||||||||||||||||||||
| Balance at January 1, 2023 (3) |
16,763 | $ | — | $ | 197,006 | $ | 73,890 | $ | (64 | ) | $ | 270,832 | ||||||||||||
| Issuance of common stock and warrants |
168 | — | — | — | — | — | ||||||||||||||||||
| Stock-based compensation expense |
— | — | 15,118 | — | — | 15,118 | ||||||||||||||||||
| Shares withheld for employee withholding taxes |
— | — | (4,915 | ) | — | — | (4,915 | ) | ||||||||||||||||
| Net income |
— | — | — | 36,835 | — | 36,835 | ||||||||||||||||||
| Foreign currency translation income, net |
— | — | — | — | 2,222 | 2,222 | ||||||||||||||||||
|
|
|
|
|
|
|
|
|
|
|
|
|
|||||||||||||
| Balance at June 30, 2023 (1) |
16,931 | $ | — | $ | 207,209 | $ | 110,725 | $ | 2,158 | $ | 320,092 | |||||||||||||
|
|
|
|
|
|
|
|
|
|
|
|
|
|||||||||||||
| (1) | Reflects 5,554 shares of common stock and 11,377 Jones Act Warrants issued and outstanding. |
| (2) | Reflects 5,642 shares of common stock and 11,377 Jones Act Warrants issued and outstanding. |
| (3) | Reflects 5,386 shares of common stock and 11,377 Jones Act Warrants issued and outstanding. |
F-7
HORNBECK OFFSHORE SERVICES, INC. AND SUBSIDIARIES
CONSOLIDATED STATEMENTS OF CASH FLOWS
(in thousands)
| Six Months Ended June 30, |
||||||||
| 2024 | 2023 | |||||||
| (Unaudited) | ||||||||
| CASH FLOWS FROM OPERATING ACTIVITIES: |
||||||||
| Net income |
$ | 44,226 | $ | 36,835 | ||||
| Adjustments to reconcile net income to net cash provided by operating activities: |
||||||||
| Depreciation |
18,093 | 11,753 | ||||||
| Amortization |
12,163 | 10,366 | ||||||
| Stock-based compensation expense |
4,423 | 15,363 | ||||||
| Provision for (recovery of) credit losses |
(34 | ) | 386 | |||||
| Deferred tax expense (benefit) |
(110 | ) | 1,965 | |||||
| Amortization of deferred financing costs |
— | 283 | ||||||
| Amortization of deferred contract-specific costs of sales |
431 | 489 | ||||||
| Accumulated paid-in-kind interest |
— | 7,763 | ||||||
| Mark-to-market adjustment of creditor warrants |
(696 | ) | 4,533 | |||||
| Gain on sale of assets |
(31 | ) | (2,566 | ) | ||||
| Changes in operating assets and liabilities: |
||||||||
| Accounts receivable |
(19,153 | ) | (21,295 | ) | ||||
| Other current and long-term assets |
(17,750 | ) | (3,374 | ) | ||||
| Deferred drydocking charges |
(26,106 | ) | (15,416 | ) | ||||
| Accounts payable |
(4,402 | ) | 1,781 | |||||
| Accrued liabilities and other liabilities |
15,612 | 13,657 | ||||||
| Accrued interest |
— | (174 | ) | |||||
|
|
|
|
|
|||||
| Net cash provided by operating activities |
26,666 | 62,349 | ||||||
|
|
|
|
|
|||||
| CASH FLOWS FROM INVESTING ACTIVITIES: |
||||||||
| Maintenance capital improvements |
(9,969 | ) | (3,782 | ) | ||||
| Growth capital expenditures |
(26,313 | ) | (32,254 | ) | ||||
| Commercial capital expenditures |
(12,923 | ) | (10,277 | ) | ||||
| Non-vessel capital expenditures |
(315 | ) | (415 | ) | ||||
| Net proceeds from sale of assets |
38 | 2,756 | ||||||
|
|
|
|
|
|||||
| Net cash used in investing activities |
(49,482 | ) | (43,972 | ) | ||||
|
|
|
|
|
|||||
| CASH FLOWS FROM FINANCING ACTIVITIES: |
||||||||
| Repayment of first-lien term loans |
— | (1,870 | ) | |||||
| Cash paid in lieu of shares |
(70 | ) | (54 | ) | ||||
| Cash paid for withholding taxes on net share settlements |
(3,716 | ) | (4,915 | ) | ||||
| Principal payments under finance lease obligations |
(156 | ) | (139 | ) | ||||
|
|
|
|
|
|||||
| Net cash used in financing activities |
(3,942 | ) | (6,978 | ) | ||||
|
|
|
|
|
|||||
| Effects of foreign currency exchange rate changes on cash |
(2,219 | ) | 1,494 | |||||
|
|
|
|
|
|||||
| Net increase (decrease) in cash, cash equivalents and restricted cash |
(28,977 | ) | 12,893 | |||||
|
|
|
|
|
|||||
| Cash, cash equivalents and restricted cash at beginning of period |
120,820 | 217,651 | ||||||
|
|
|
|
|
|||||
| Cash, cash equivalents and restricted cash at end of period |
$ | 91,843 | $ | 230,544 | ||||
|
|
|
|
|
|||||
| SUPPLEMENTAL DISCLOSURES OF CASH FLOW ACTIVITIES: |
||||||||
| Cash paid for interest |
$ | 14,556 | $ | 15,502 | ||||
|
|
|
|
|
|||||
| Cash paid for income taxes, net of refunds |
$ | 13,035 | $ | 1,136 | ||||
|
|
|
|
|
|||||
F-8
HORNBECK OFFSHORE SERVICES, INC. AND SUBSIDIARIES
NOTES TO CONSOLIDATED FINANCIAL STATEMENTS
(unaudited)
1. Basis of Presentation
The accompanying unaudited consolidated financial statements reflect the financial position, results of operations, comprehensive income, cash flows, and changes in stockholders’ equity of Hornbeck Offshore Services, Inc., a Delaware corporation, and its consolidated subsidiaries, collectively referred to as “Hornbeck”, “Company,” “we,” “us,” or “our”.
The accompanying unaudited consolidated financial statements have been prepared in accordance with United States (U.S.) generally accepted accounting principles (GAAP) for interim financial information. Accordingly, certain information and footnote disclosures normally included in our annual financial statements have been condensed or omitted. These unaudited consolidated financial statements should be read in conjunction with our audited consolidated financial statements and notes thereto as of and for the year ended December 31, 2023. In the opinion of management, the accompanying financial information reflects all normal recurring adjustments necessary to fairly state our results of operations, financial position and cash flows for the periods presented and are not indicative of the results that may be expected for a full year.
Our financial statements have been prepared on a consolidated basis. Under this basis of presentation, our financial statements consolidate all subsidiaries (entities in which we have a controlling financial interest), and all intercompany accounts and transactions have been eliminated.
2. Recent Accounting Pronouncements
The following table provides a brief description of recent accounting pronouncements that could have a material effect on the Company’s financial statements:
| Standard |
Description |
Date of Adoption |
Effect on the financial | |||
| Standards that have been adopted: | ||||||
| ASU No. 2023-07, Segment Reporting (Topic 280): Improvements to Reportable Segment Disclosures | The amendments in this update improve reportable segment disclosure requirements, primarily related to significant segment expenses. In addition, the amendments enhance interim disclosures, clarify circumstances in which an entity can disclose multiple segment measures of profit or loss, provide new disclosure requirements for entities with a single reportable segment, and contain other related disclosure requirements. Retrospective application is required. | Effective for fiscal years beginning after December 15, 2023, and interim periods within fiscal years beginning after December 15, 2024. Early adoption is permitted. | The Company adopted the annual reporting requirements under ASU No. 2023-07 on January 1, 2024 and will implement the interim disclosure requirements in fiscal year 2025. This adoption had no material impact on its consolidated financial statements. | |||
F-9
| Standard |
Description |
Date of Adoption |
Effect on the financial | |||
| Standards that have not been adopted: | ||||||
| ASU No. 2023-05, Business Combinations—Joint Venture Formations (Subtopic 805-60): Recognition and Initial Measurement | This standard requires a joint venture to initially measure all contributions received upon its formation at fair value. ASU No. 2023-05 requires prospective application for all newly-formed joint venture entities with a formation date on or after January 1, 2025. Joint ventures formed prior to the adoption date may elect to apply the guidance retrospectively back to their original formation date. Early adoption is permitted. | January 1, 2025 | The Company will adopt ASU No. 2023-05 on January 1, 2025 and elect to apply the standard prospectively. The Company does not believe implementation will have a material impact on its consolidated financial statements. | |||
| ASU No. 2023-09, Income Taxes (Topic 740): Improvements to Income Tax Disclosures | This standard requires disaggregated information about a reporting entity’s effective tax rate reconciliation, as well as information on income taxes paid. ASU No. 2023-09 requires prospective application with the option to apply the standard retrospectively. Early adoption is permitted. | January 1, 2026 | The Company will adopt ASU No. 2023-09 on January 1, 2026 and elect to apply the standard prospectively. The Company does not believe that the implementation of this guidance will have a material impact on its consolidated financial statements. | |||
3. Allowance for Credit Losses
Customers are primarily major and independent, domestic and international, oil and oilfield service companies, as well as national oil companies, the U.S. military and offshore wind companies. The Company’s customers are granted credit on a short-term basis and related credit risks are considered minimal. The Company usually does not require collateral, but does occasionally require letters of credit or payment-in-advance if undue credit risk is determined to exist with a particular contract or customer. The Company provides an estimate for credit losses based primarily on management’s judgment using the relative age of customer balances, historical losses, current economic conditions and individual evaluations of each customer to record an allowance for credit losses. Direct write-offs of receivables only occur when amounts are deemed uncollectible and all options for collection have been exhausted.
Activity in the allowance for credit losses is as follows (in thousands):
| Three Months Ended June 30, |
||||||||
| 2024 | 2023 | |||||||
| Balance at April 1 |
$ | 6,207 | $ | 5,830 | ||||
| Current period provision for credit losses |
66 | 342 | ||||||
| Write-offs |
— | — | ||||||
|
|
|
|
|
|||||
| Balance at June 30 |
$ | 6,273 | $ | 6,172 | ||||
|
|
|
|
|
|||||
F-10
| Six Months Ended June 30, |
||||||||
| 2024 | 2023 | |||||||
| Balance at January 1 |
$ | 6,307 | $ | 5,786 | ||||
| Current period provision for (recovery of) credit losses |
(34 | ) | 386 | |||||
| Write-offs |
— | — | ||||||
|
|
|
|
|
|||||
| Balance at June 30 |
$ | 6,273 | $ | 6,172 | ||||
|
|
|
|
|
|||||
4. Revenues from Contracts with Customers
As of June 30, 2024, the Company had certain remaining performance obligations representing contracted vessel revenue for which work had not been performed and such contracts had an original expected duration of more than one year. As of June 30, 2024, the aggregate amount of the transaction price allocated to remaining performance obligations for such contracts totaled $110.6 million, of which $44.3 million is expected to be fully recognized in 2024, $47.8 million in 2025 and $18.5 million in 2026. These amounts are a result of multi-year vessel charters that commenced in either 2022, 2023 or 2024.
As of June 30, 2024, we had $12.3 million of deferred revenue included in current liabilities related to unsatisfied performance obligations that will be recognized during the remainder of 2024 and 2025.
Disaggregation of Revenues
The Company recognized revenues as follows (in thousands):
| Three Months Ended June 30, |
Six Months Ended June 30, |
|||||||||||||||
| 2024 | 2023 | 2024 | 2023 | |||||||||||||
| Vessel revenues |
$ | 163,998 | $ | 135,912 | $ | 283,207 | $ | 256,487 | ||||||||
| Vessel management revenues |
11,262 | 10,609 | 22,454 | 21,097 | ||||||||||||
| Shore-based facility revenues |
720 | 377 | 1,115 | 805 | ||||||||||||
|
|
|
|
|
|
|
|
|
|||||||||
| $ | 175,980 | $ | 146,898 | $ | 306,776 | $ | 278,389 | |||||||||
|
|
|
|
|
|
|
|
|
|||||||||
Revenues by geographic region (1) were as follows (in thousands):
| Three Months Ended June 30, | Six Months Ended June 30, | |||||||||||||||||||||||||||||||
| 2024 | % of Total |
2023 | % of Total |
2024 | % of Total |
2023 | % of Total |
|||||||||||||||||||||||||
| United States |
$ | 127,441 | 72.4 | % | $ | 110,762 | 75.4 | % | $ | 227,170 | 74.1 | % | $ | 214,895 | 77.2 | % | ||||||||||||||||
| International (2)(3) |
48,539 | 27.6 | % | 36,136 | 24.6 | % | 79,606 | 25.9 | % | 63,494 | 22.8 | % | ||||||||||||||||||||
|
|
|
|
|
|
|
|
|
|
|
|
|
|
|
|
|
|||||||||||||||||
| $ | 175,980 | 100.0 | % | $ | 146,898 | 100.0 | % | $ | 306,776 | 100.0 | % | $ | 278,389 | 100.0 | % | |||||||||||||||||
|
|
|
|
|
|
|
|
|
|
|
|
|
|
|
|
|
|||||||||||||||||
| (1) | The Company attributes revenues to individual geographic regions based on the location where services are performed. |
| (2) | International revenues of $6.7 million and $24.4 million were attributed to services performed in Mexico, and international revenues of $23.9 million and $10.6 million were attributed to services performed in Brazil for the three months ended June 30, 2024 and 2023, respectively. Revenues attributed to other countries were not individually material for the periods presented. |
| (3) | International revenues of $12.8 million and $44.6 million were attributed to services performed in Mexico, and international revenues of $44.5 million and $17.7 million were attributed to services performed in Brazil for the six months ended June 30, 2024 and 2023, respectively. Revenues attributed to other countries were not individually material for the periods presented. |
F-11
Major Customers
Revenues from the following customers represented 10% or more of consolidated revenues:
| Three Months Ended June 30, |
Six Months Ended June 30, |
|||||||||||||||
| 2024 | 2023 | 2024 | 2023 | |||||||||||||
| Customer A |
16 | % | n/a | (1) | 15 | % | n/a | (1) | ||||||||
| Customer B |
14 | % | 20 | % | 15 | % | 21 | % | ||||||||
| Customer C |
14 | % | 14 | % | 16 | % | 16 | % | ||||||||
| (1) | Customer represented less than 10% of consolidated revenues in such period. |
5. Earnings Per Share
Basic earnings per common share was calculated by dividing net income by the weighted-average number of common shares and Jones Act Warrants outstanding during the period. Diluted earnings per common share was calculated by dividing net income by the weighted-average number of common shares and Jones Act Warrants outstanding during the period plus the effect of dilutive Creditor Warrants, dilutive stock options and restricted stock unit awards. Weighted-average number of common shares outstanding was calculated by using the sum of the shares and Jones Act Warrants determined on a daily basis divided by the number of days in the period.
The table below reconciles the Company’s earnings per share (in thousands, except for per share data):
| Three Months Ended June 30, |
Six Months Ended June 30, |
|||||||||||||||
| 2024 | 2023 | 2024 | 2023 | |||||||||||||
| Net income |
$ | 33,098 | $ | 20,384 | $ | 44,226 | $ | 36,835 | ||||||||
|
|
|
|
|
|
|
|
|
|||||||||
| Weighted-average number of shares of common stock outstanding (1)(2) |
17,099 | 17,036 | 17,068 | 16,971 | ||||||||||||
| Add: Net effect of dilutive stock options, restricted stock units, and Creditor Warrants (3)(4)(5) |
2,194 | 2,083 | 2,215 | 2,045 | ||||||||||||
|
|
|
|
|
|
|
|
|
|||||||||
| Weighted-average number of dilutive shares of common stock outstanding |
19,293 | 19,119 | 19,283 | 19,016 | ||||||||||||
|
|
|
|
|
|
|
|
|
|||||||||
| Earnings per common share: |
||||||||||||||||
| Basic earnings per common share |
$ | 1.94 | $ | 1.20 | $ | 2.59 | $ | 2.17 | ||||||||
|
|
|
|
|
|
|
|
|
|||||||||
| Diluted earnings per common share |
$ | 1.71 | $ | 1.07 | $ | 2.29 | $ | 1.94 | ||||||||
|
|
|
|
|
|
|
|
|
|||||||||
| (1) | The Company included 11,377 Jones Act Warrants in the weighted-average number of shares of common stock outstanding for the three and six months ended June 30, 2024 and 2023, which represents the weighted-average number of Jones Act Warrants existing at each period-end. |
| (2) | Includes 105 and 105 fully vested, equity-settled restricted stock units that will be settled on the earlier of the occurrence of a contractually-designated event and the passage of a certain period of time for the three and six month periods ended June 30, 2024 and 2023, respectively. |
| (3) | Includes 171 and 163 unvested restricted stock units and 619 and 619 contingently-exercisable vested restricted stock units in the weighted average calculation for the three and six months ended June 30, 2024, respectively, and 165 and 146 unvested restricted stock units and 615 and 610 contingently-exercisable, vested restricted stock units in the weighted average calculation for the three and six months ended June 30, 2023, respectively. |
F-12
| (4) | Includes 490 and 493 dilutive unvested stock options granted under the MIP in the weighted-average calculation for the three and six months ended June 30, 2024, respectively, and 469 and 467 dilutive unvested stock options granted under the MIP in the weighted-average calculation for the three and six months ended June 30 2023, respectively. Dilutive unvested stock options issued by the Company are expected to fluctuate from quarter to quarter depending on the Company’s performance compared to a predetermined set of performance criteria. |
| (5) | Includes 914 and 940 of in-the-money, liability-classified Creditor Warrants in the weighted-average calculation for the three and six months ended June 30, 2024, respectively, and 834 and 822 of in-the-money, liability-classified Creditor Warrants in the weighted-average calculation for the three and six months ended June 30, 2023, respectively. |
6. Deferred Charges
The Company’s vessels are required by regulation to be recertified after certain periods of time. The Company defers the drydocking costs incurred due to regulatory marine inspections and amortizes the costs on a straight-line basis over the period to be benefited from such expenditures (typically between 24 and 36 months).
The amounts reported for deferred charges on the consolidated balance sheets as of June 30, 2024 and December 31, 2023, include costs associated with ongoing drydockings. Included in such capital costs are accruals for vendor costs incurred but not yet invoiced and paid. These accrual amounts totaling $12.9 million and $13.5 million as of June 30, 2024 and December 31, 2023, respectively, are excluded from cash flows from operating activities on the consolidated statement of cash flows as non-cash items for the periods presented.
7. Property, Plant and Equipment
Property, plant and equipment consisted of the following (in thousands):
| June 30, 2024 |
December 31, 2023 |
|||||||
| Offshore supply vessels and multi-purpose support vessels |
$ | 604,002 | $ | 510,882 | ||||
| Non-vessel related property, plant and equipment |
25,492 | 19,533 | ||||||
| Less: Accumulated depreciation |
(83,909 | ) | (65,890 | ) | ||||
|
|
|
|
|
|||||
| 545,585 | 464,525 | |||||||
|
|
|
|
|
|||||
| Construction in progress (1) |
79,685 | 137,897 | ||||||
|
|
|
|
|
|||||
| $ | 625,270 | $ | 602,422 | |||||
|
|
|
|
|
|||||
| (1) | Includes $10.3 million and $17.6 million of accrued accounts payable as of June 30, 2024 and December 31, 2023, respectively. These amounts were excluded from the consolidated statement of cash flows as non-cash items for the respective periods. |
The table below presents net book value of property, plant and equipment by geographic regions(1) (in thousands):
| June 30, 2024 |
% of Total | December 31, 2023 |
% of Total | |||||||||||||
| United States |
$ | 548,080 | 87.7 | % | $ | 522,347 | 86.7 | % | ||||||||
| International (2) |
77,190 | 12.3 | % | 80,075 | 13.3 | % | ||||||||||
|
|
|
|
|
|
|
|
|
|||||||||
| $ | 625,270 | 100.0 | % | $ | 602,422 | 100.0 | % | |||||||||
|
|
|
|
|
|
|
|
|
|||||||||
| (1) | Book values are attributed to geographic regions based on the country of domicile of the specific asset-owning subsidiary of the Company, not the physical operating location of the asset as of any of the dates presented. |
F-13
| (2) | International property, plant and equipment of $68.8 million and $70.6 million were owned by certain Mexican subsidiaries of the Company as of June 30, 2024 and December 31, 2023, respectively. Property, plant and equipment attributed to other countries were not individually material as of any of the dates presented. |
8. Long-Term Debt
As of the dates indicated below, the Company had the following outstanding long-term debt (in thousands):
| June 30, 2024 |
December 31, 2023 |
|||||||
| Second Lien Term Loans due 2026 (including accumulated paid-in-kind interest) |
$ | 349,001 | $ | 349,001 | ||||
In June 2023, we elected to stop accruing paid-in-kind interest and began cash paying the interest on the Second Lien Term Loans. Effective September 4, 2023, the Second Lien Term Loans contractually converted to full cash-pay obligations with an annual fixed interest rate of 8.25% based on our prevailing total leverage ratio, which was below 3.00 to 1.00.
The table below summarizes the Company’s cash interest payments (in thousands):
| Cash Interest Payments (1) |
Payment Dates | |||||||
| Second Lien Term Loans due 2026 |
$ | 7,278 | March 31, June 30, September 30, December 31 | |||||
| (1) | The interest rate on the Second Lien Term Loans is variable at 8.25% or 10.25% per annum based on the Company’s total leverage ratio on a quarterly basis. The amount reflected in this table is consistent with the current 8.25% interest rate applicable to the Company’s current total leverage ratio. |
As of June 30, 2024, certain lenders of the Second Lien Term Loans were considered related parties due to their ownership of Jones Act Warrants and/or shares of common stock of the Company.
9. Liability-Classified Warrants
The Company’s outstanding Creditor Warrants are currently classified as liabilities pursuant to ASC 815, Derivatives and Hedging. Warrants that are classified as liabilities are recorded at their estimated fair value on a recurring basis at each balance sheet date. To estimate the fair value of the Creditor Warrants, the Company, assisted by third-party valuation advisors, uses a Black-Scholes model, which utilizes the following input assumptions at the applicable valuation date: (i) the current estimated fair value of the underlying common stock based on a controlling interest equity valuation, (ii) the exercise price, (iii) the contractual expiry term, (iv) an estimated equity volatility based on the historical asset and equity volatilities of comparable publicly traded companies, (v) a term-matched risk-free rate based on the U.S. Treasury separate trading of registered interest and principal securities (STRIPS) yield, and (vi) an expected dividend yield. The Company’s third-party valuation advisors estimate the fair value of the underlying common stock using the income approach and the market approach with each equally weighted. The income approach involves the use of various judgmental assumptions including the use of prospective financial information, the weighted average cost of capital and an exit multiple. The fair value of the Creditor Warrants falls within Level 3 of the hierarchy, as there is currently no active trading market and certain inputs of the Black-Scholes model are not observable or corroborated by available market data. Based on the lack of trading history of our privately-held equity, the Company currently considers the estimated fair value of its common stock to be the most critical assumption in the determination of the fair value of the Creditor Warrants. As of June 30, 2024, every one-dollar change in the estimated fair value per share of the underlying common stock would have an approximate $1.5 million impact on the estimated fair value of the Creditor Warrants.
F-14
There were no exercises of Creditor Warrants during the three and six months ended June 30, 2024 and 2023. The estimated fair value of the Creditor Warrants was determined to be $74.8 million, or $46.97 per warrant, as of June 30, 2024, representing an increase in value since their original issuance on September 4, 2020 of approximately $66.6 million, or $41.81 per warrant.
The inputs to the Black-Scholes model utilized for the valuation of the Creditor Warrants at June 30, 2024 and December 31, 2023 were as follows:
| June 30, 2024 |
December 31, 2023 |
|||||||
| Fair value per share of the underlying common stock |
$ | 68.39 | $ | 67.23 | ||||
| Warrant exercise price |
$ | 27.83 | $ | 27.83 | ||||
| Remaining contractual term (years) |
3.18 | 3.68 | ||||||
| Expected volatility |
55 | % | 60 | % | ||||
| Risk-free rate |
4.45 | % | 3.91 | % | ||||
| Expected dividend yield |
0 | % | 0 | % | ||||
10. Stock-Based Compensation
The Company’s 2020 Management Incentive Plan, or MIP, provides for the issuance of a maximum of 2.2 million shares of common stock for the Company to grant as incentive awards in the form of stock options, stock appreciation rights, restricted stock units, restricted stock and other stock-based and cash-based awards to certain eligible individuals. As of June 30, 2024, there were 2.1 million shares reserved for issuance related to granted awards and 0.1 million shares available for future grants to eligible individuals under the MIP.
The financial impact of stock-based compensation expense related to the MIP on the Company’s operating results is reflected in the table below (in thousands, except for per share data):
| Three Months Ended June 30, |
Six Months Ended June 30, |
|||||||||||||||
| 2024 | 2023 | 2024 | 2023 | |||||||||||||
| Income before taxes |
$ | 2,584 | $ | 2,361 | $ | 4,423 | $ | 15,363 | ||||||||
|
|
|
|
|
|
|
|
|
|||||||||
| Net income |
$ | 2,368 | $ | 1,960 | $ | 4,128 | $ | 13,100 | ||||||||
|
|
|
|
|
|
|
|
|
|||||||||
| Earnings per common share: |
||||||||||||||||
| Basic |
$ | 0.14 | $ | 0.12 | $ | 0.24 | $ | 0.77 | ||||||||
|
|
|
|
|
|
|
|
|
|||||||||
| Diluted |
$ | 0.12 | $ | 0.10 | $ | 0.21 | $ | 0.69 | ||||||||
|
|
|
|
|
|
|
|
|
|||||||||
In April 2024, the Company issued certain restricted stock unit awards pursuant to the MIP of which 50% immediately vested and settled upon issuance while the remaining 50% vests one year following the grant date. The Company recorded $0.3 million of stock-based compensation expense in 2024 related to the portion of the awards that immediately vested and settled upon issuance.
In March 2023, the Company issued certain restricted stock unit awards pursuant to the MIP of which 50% immediately vested and settled upon issuance while the remaining 50% vests ratably over the three-year period following the grant date. The Company recorded $10.6 million of stock-based compensation expense in 2023 related to the portion of the awards that immediately vested and settled upon issuance.
The Company recorded $0.2 million and $0.2 million of stock-based compensation expense related to restricted stock awards redeemable in cash to other accrued liabilities on the consolidated balance sheet during the six months ended June 30, 2024 and 2023, respectively.
F-15
11. Income Taxes
The Company’s effective income tax expense rate for the six months ended June 30, 2024 and 2023 was 6.7% and 14.7%, respectively. The Company’s current income tax expense reflects its current foreign tax liabilities and certain deferred tax liabilities that could not be offset with a reduction in the valuation allowance. The Company’s effective tax rate differs from the federal statutory rate primarily due to foreign taxes and the reversal of valuation allowance for certain deferred tax assets.
The Company is no longer subject to tax audits being initiated by U.S. federal, state, local or foreign taxing authorities for years prior to 2020. The Company has ongoing examinations by various foreign tax authorities, but does not believe that the results of these examinations will have a material adverse effect on the Company’s financial position or results of operations. Please see Note 12 below for further discussion regarding the relevant ongoing foreign tax examinations.
12. Commitments and Contingencies
Vessel Construction
In October 2023, the Company entered into a final settlement of a dispute with Zurich American Insurance Company and Fidelity & Deposit Company of Maryland, together the Surety, and Gulf Island Shipyards, LLC, or Gulf Island, related to the construction of two MPSV newbuilds. Pursuant to the settlement agreement, Gulf Island released all claims asserted against the Company and the Company released its claims against Gulf Island and the Surety. Further, the Surety agreed to take over and complete the construction of the two U.S.-flagged, Jones Act-qualified, HOS 400 class MPSVs at a shipyard acceptable to the Company. In December 2023, Eastern Shipbuilding Group, Inc., or Eastern, was mutually selected by the parties and contracted by the Surety to complete the construction of the two MPSVs. The Company is obligated to pay only the remaining portion of the original shipyard contract price for the two MPSVs, which amounted to $53.8 million in the aggregate on the settlement date. The Surety is required to cure all defaults of Gulf Island and pay all completion costs in excess of the $53.8 million remaining original contract price, excluding any approved change orders arising after the settlement date. There is no cap on the Surety’s completion costs. As of June 30, 2024, the Company had paid $5.3 million to Eastern related to the completion of these two MPSVs.
Pursuant to the settlement, the Surety is contractually required to deliver both MPSVs in 2025. However, in June 2024, the Company was provided an updated schedule by the Surety and Eastern indicating that they currently expect a six-month shipyard delay for the first of the two MPSVs. An updated delivery schedule has not yet been provided for the second vessel. Following physical delivery by Eastern, the Company expects each vessel to undergo crane and other system installations, which will make the first vessel available for commercial service in the first half of 2026 and the second vessel thereafter. The Company expects to incur an additional $91.2 million in the aggregate for outfitting, overhead and the post-delivery discretionary enhancements, of which $63.6 million solely relates to the purchase and installation of the cranes. As of June 30, 2024, the Company had incurred $0.8 million of such amounts.
Contingencies
In the normal course of its business, the Company becomes involved in various claims and legal proceedings in which monetary damages are sought. It is management’s opinion that the Company’s liability, if any, under such claims or proceedings would not materially affect the Company’s financial position or results of operations. The Company insures against losses relating to its vessels, pollution and third party liabilities, including claims by employees under Section 33 of the Merchant Marine Act of 1920. Third party liabilities and pollution claims that relate to vessel operations are covered by the Company’s entry in a mutual protection and indemnity association, or P&I Club, as well as by marine liability policies in excess of the P&I Club’s coverage. The Company provides reserves for any individual claim deductibles for which the Company remains responsible by using an estimation process that considers Company-specific and industry data, as well as
F-16
management’s experience, assumptions and consultation with outside counsel. As additional information becomes available, the Company will assess the potential liability related to its pending claims and revise its estimates. Although historically revisions to such estimates have not been material, changes in estimates of the potential liability could materially impact the Company’s results of operations, financial position or cash flows. The Company had accrued $0.8 million and $0.5 million for potential insurance deductibles or losses associated with such claims as of June 30, 2024 and December 31, 2023, respectively.
Mexico Tax Audits
The Company is subject to audit by various Mexican statutory bodies, including the Mexican tax authorities, or SAT. In recent years, SAT has initiated several audits of the Company’s Mexican subsidiaries for tax years between 2014 and 2021. In November 2018, SAT commenced an audit of a Mexican subsidiary’s 2015 tax return and asserted certain positions that disallowed a significant portion of the Company’s deductible expenses, which resulted in additional taxes, interest and penalties being assessed. As a result, the Company engaged in non-binding mediation proceedings, which concluded in 2021 without resolution. In April 2022, the Company received an official assessment from SAT and initiated an appeal process in June 2022 through the Mexican tax judicial system. As of June 30, 2024, the Company had accrued a liability totaling $2.6 million for potential losses from additional taxes, interest and penalties resulting from this assessment based upon estimates developed in collaboration with its Mexican tax advisors for the ongoing 2015 audit and appeal. The Company believes it has properly applied the applicable tax laws and has reasonably supported its positions. The ultimate impact resulting from the 2015 tax assessment and appeal process and other ongoing tax audits may materially differ from the current estimates. The Company will continue to update its estimates related to these pending proceedings as new information warrants.
Brazil Importation Tax Assessment
In April 2021, the Company received notification from the Brazilian tax authorities of an importation tax assessment against the HOS Achiever with respect to the vessel’s services contract in Brazil from February 2019 to January 2020. At the time of the HOS Achiever’s importation, the Company was granted a statutorily available tax exemption based on the vessel’s functional capabilities and intended use under the services contract. The tax authorities are now asserting that the HOS Achiever does not qualify for the applicable exemption. The Company believes the HOS Achiever does, in fact, meet the criteria set forth under the applicable law and intends to defend its position in a Brazilian court. While the final outcome of this assessment is uncertain and could possibly result in the payment and loss of an estimated $6.0 million to $10.0 million in related importation taxes and penalties, the Company believes there is a high likelihood that its position will prevail and the exemption will be granted in accordance with the law. Furthermore, the Company believes that any amounts that may become due in connection with this matter should be recoverable from its customer under the terms of the vessel’s services contract.
13. Reportable Segments
The Company has one reportable segment, which encompasses all aspects of its marine transportation services business. As the chief operating decision maker, the Company’s Chief Executive Officer evaluates operating results on a consolidated basis to assess performance and allocate resources. While the Company’s vessels operate in various geographic regions and customer markets, they are centrally managed, share multiple forms of common costs, provide similar or complementary marine transportation services, are manned by crews that may move from location to location or market to market as needed, and are marketed on a portfolio basis with the goal of maximizing Adjusted EBITDA and Adjusted Free Cash Flow and generating the highest possible rate of return on invested capital without a permanent commitment to any particular geographic region or customer market.
F-17
14. Related Party Transactions
Pursuant to the terms of the Trade Name and Trademark License Agreement entered into by and between the Company and HFR, LLC, the Company made payments of $1.5 million during each of the six months ended June 30, 2024 and 2023, respectively, for licensing fees associated with the use of Hornbeck trade names, trademarks, and related logos. HFR, LLC is a Texas Limited Liability Company owned by Todd M. Hornbeck and Troy A. Hornbeck. Todd M. Hornbeck serves as the Company’s Chairman of the Board of Directors, President and Chief Executive Officer. Troy A. Hornbeck is the brother of Todd M. Hornbeck and serves as the Company’s Purchasing Director. As of June 30, 2024 and December 31, 2023, the Company had accrued amounts payable to HFR, LLC totaling $0.8 million and $1.3 million, respectively.
On October 1, 2022, a member of the Company’s Board of Directors, assumed an officer role with an existing Hornbeck customer. For the six months ended June 30, 2024 and 2023, the Company generated $45.8 million, or 14.9%, and $59.8 million, or 21.5%, of revenues, respectively, from contracts with such customer. The Company had outstanding accounts receivable from this customer totaling $10.7 million and $8.0 million as of June 30, 2024 and December 31, 2023, respectively.
15. Subsequent Events
The Company has evaluated subsequent events through August 14, 2024, which represents the date its financial statements were available to be issued and determined that all materially relevant information known through this date was appropriately addressed within the consolidated financial statements and notes herein except for the following:
First Lien Revolving Credit Facility
On August 13, 2024, the Company entered into a first lien revolving credit facility pursuant to that certain Credit Agreement with DNB Bank ASA, New York Branch, as administrative agent, Wilmington Trust, National Association, as collateral agent, and the lenders party thereto, or the First Lien Revolving Credit Facility. The current aggregate revolving loan commitments under the new First Lien Revolving Credit Facility total $75 million. The First Lien Revolving Credit Facility also has a customary uncommitted incremental facility in an amount up to $50 million, plus additional amounts if consented to by all lenders. As of August 14, 2024, there were no revolving loan amounts outstanding under the First Lien Revolving Credit Facility.
F-18
Report of Independent Registered Public Accounting Firm
To the Stockholders and the Board of Directors of Hornbeck Offshore Services, Inc.
Opinion on the Financial Statements
We have audited the accompanying consolidated balance sheets of Hornbeck Offshore Services, Inc. and subsidiaries (the Company) as of December 31, 2023 and 2022, the related consolidated statements of operations, comprehensive income, changes in stockholders’ equity and cash flows for each of the three years in the period ended December 31, 2023 and the related notes (collectively referred to as the “consolidated financial statements”). In our opinion, the consolidated financial statements present fairly, in all material respects, the financial position of the Company at December 31, 2023 and 2022, and the results of its operations and its cash flows for each of the three years in the period ended December 31, 2023, in conformity with U.S. generally accepted accounting principles.
Basis for Opinion
These financial statements are the responsibility of the Company’s management. Our responsibility is to express an opinion on the Company’s financial statements based on our audits. We are a public accounting firm registered with the Public Company Accounting Oversight Board (United States) (PCAOB) and are required to be independent with respect to the Company in accordance with the U.S. federal securities laws and the applicable rules and regulations of the Securities and Exchange Commission and the PCAOB.
We conducted our audits in accordance with the standards of the PCAOB and in accordance with auditing standards generally accepted in the United States of America. Those standards require that we plan and perform the audit to obtain reasonable assurance about whether the financial statements are free of material misstatement, whether due to error or fraud. The Company is not required to have, nor were we engaged to perform, an audit of its internal control over financial reporting. As part of our audits, we are required to obtain an understanding of internal control over financial reporting but not for the purpose of expressing an opinion on the effectiveness of the Company’s internal control over financial reporting. Accordingly, we express no such opinion.
Our audits included performing procedures to assess the risks of material misstatement of the financial statements, whether due to error or fraud, and performing procedures that respond to those risks. Such procedures included examining, on a test basis, evidence regarding the amounts and disclosures in the financial statements. Our audits also included evaluating the accounting principles used and significant estimates made by management, as well as evaluating the overall presentation of the financial statements. We believe that our audits provide a reasonable basis for our opinion.
Critical Audit Matter
The critical audit matter communicated below is a matter arising from the current period audit of the financial statements that was communicated or required to be communicated to the audit committee and that: (1) relates to accounts or disclosures that are material to the financial statements and (2) involved our especially challenging, subjective or complex judgments. The communication of the critical audit matter does not alter in any way our opinion on the consolidated financial statements, taken as a whole, and we are not, by communicating the critical audit matter below, providing a separate opinion on the critical audit matter or on the account or disclosure to which it relates.
F-19
| Fair Value of the Creditor Warrants | ||
| Description of the Matter | As described in Note 11 to the consolidated financial statements, the Company issued 1.6 million Creditor Warrants upon emergence from voluntary reorganization under Chapter 11. The Creditor Warrants estimated fair value was $75.5 million as of December 31, 2023 and was recorded as a non-current liability on the consolidated balance sheets. The Company utilizes a Black-Scholes model to estimate the fair value of the Creditor Warrants, which uses inputs including the current estimated fair value of the underlying common stock, the exercise price, the contractual expiry term, an estimated equity volatility, a term-match risk-free rate and an expected dividend yield.
Auditing management’s fair value estimate of the Creditor Warrants was complex and highly judgmental due to the estimation required to determine the fair value of the Creditor Warrants. In particular, the current estimated fair value of the underlying common stock involves a high degree of subjectivity including the use of prospective financial information, weighted average cost of capital, and an exit multiple. | |
| How We Addressed the Matter in Our Audit | To test the estimated fair value of the Creditor Warrants, we performed audit procedures that included, among others, assessing methodologies and testing the significant assumptions used in estimating the fair value of the underlying common stock, and testing the underlying data used by the Company in its analysis. For example, we compared the prospective financial information used by management in estimating the fair value of the underlying common stock to current industry and economic trends and other relevant factors, such as the Company’s historical financial results. We also assessed the historical accuracy of management’s prospective financial information. We involved our valuation specialists to assist in our evaluation of the methodology applied by the Company and the significant assumptions used in estimating the fair value of the underlying common stock, which is used to estimate the fair value of the Creditor Warrants. | |
/s/ Ernst & Young LLP
We have served as the Company’s auditors since 2002.
New Orleans, Louisiana
March 14, 2024
F-20
HORNBECK OFFSHORE SERVICES, INC. AND SUBSIDIARIES
CONSOLIDATED BALANCE SHEETS
(In thousands)
| December 31, 2023 |
December 31, 2022 |
|||||||
| ASSETS |
||||||||
| Current assets: |
||||||||
| Cash and cash equivalents |
$ | 120,055 | $ | 217,303 | ||||
| Accounts receivable, net of allowance for doubtful accounts of $6,307 and $5,786, respectively |
126,438 | 117,621 | ||||||
| Prepaid expenses |
4,870 | 4,190 | ||||||
| Assets held for sale |
— | 146 | ||||||
| Taxes receivable |
7,961 | 5,956 | ||||||
| Other current assets |
11,500 | 12,717 | ||||||
|
|
|
|
|
|||||
| Total current assets |
270,824 | 357,933 | ||||||
| Property, plant and equipment, net |
602,422 | 449,249 | ||||||
| Restricted cash |
765 | 348 | ||||||
| Deferred charges, net |
48,336 | 26,778 | ||||||
| Operating lease right-of-use-assets |
22,905 | 24,634 | ||||||
| Finance lease right-of-use assets |
827 | 934 | ||||||
| Other assets |
440 | 344 | ||||||
|
|
|
|
|
|||||
| Total assets |
$ | 946,519 | $ | 860,220 | ||||
|
|
|
|
|
|||||
| LIABILITIES AND STOCKHOLDERS’ EQUITY |
||||||||
| Current liabilities: |
||||||||
| Accounts payable |
$ | 76,484 | $ | 42,975 | ||||
| Accrued interest |
5,357 | 5,517 | ||||||
| Accrued payroll and benefits |
26,511 | 19,447 | ||||||
| Operating lease liabilities |
5,096 | 6,607 | ||||||
| Finance lease liabilities |
342 | 286 | ||||||
| Accrued taxes payable |
12,328 | 8,087 | ||||||
| Deferred revenue |
2,822 | 3,416 | ||||||
| Other accrued liabilities |
1,475 | 1,868 | ||||||
|
|
|
|
|
|||||
| Total current liabilities |
130,415 | 88,203 | ||||||
| Long-term debt, net of original discount of $0 and $1,090, and deferred financing costs of $0 and $495 |
349,001 | 410,258 | ||||||
| Deferred tax liabilities, net |
1,996 | 103 | ||||||
| Liability-classified warrants |
75,475 | 64,558 | ||||||
| Operating lease liabilities |
20,309 | 20,100 | ||||||
| Finance lease liabilities |
351 | 475 | ||||||
| Other long-term liabilities |
7,679 | 5,691 | ||||||
|
|
|
|
|
|||||
| Total liabilities |
585,226 | 589,388 | ||||||
|
|
|
|
|
|||||
| Stockholders’ equity: |
||||||||
| Common stock: $0.00001 par value; 50,000 shares authorized; 5,554 and 5,386 shares issued and outstanding, respectively |
— | — | ||||||
| Additional paid-in capital |
210,776 | 197,006 | ||||||
| Retained earnings |
148,428 | 73,890 | ||||||
| Accumulated other comprehensive income (loss) |
2,089 | (64 | ) | |||||
|
|
|
|
|
|||||
| Total stockholders’ equity |
361,293 | 270,832 | ||||||
|
|
|
|
|
|||||
| Total liabilities and stockholders’ equity |
$ | 946,519 | $ | 860,220 | ||||
|
|
|
|
|
|||||
The accompanying notes are an integral part of these consolidated financial statements.
F-21
HORNBECK OFFSHORE SERVICES, INC. AND SUBSIDIARIES
CONSOLIDATED STATEMENTS OF OPERATIONS
(In thousands, except per share data)
| Year ended December 31, | ||||||||||||
| 2023 | 2022 | 2021 | ||||||||||
| Revenues: |
||||||||||||
| Vessel revenues |
$ | 528,780 | $ | 406,034 | $ | 214,680 | ||||||
| Non-vessel revenues |
44,669 | 45,192 | 41,620 | |||||||||
|
|
|
|
|
|
|
|||||||
| 573,449 | 451,226 | 256,300 | ||||||||||
| Costs and expenses: |
||||||||||||
| Operating expense |
305,463 | 214,788 | 142,819 | |||||||||
| Depreciation expense |
26,355 | 18,601 | 15,672 | |||||||||
| Amortization expense |
21,496 | 10,339 | 2,711 | |||||||||
| General and administrative expense |
66,108 | 58,946 | 40,632 | |||||||||
| Stock-based compensation expense |
19,097 | 5,330 | 3,372 | |||||||||
| Terminated debt refinancing costs |
3,693 | — | — | |||||||||
|
|
|
|
|
|
|
|||||||
| 442,212 | 308,004 | 205,206 | ||||||||||
|
|
|
|
|
|
|
|||||||
| Gain on sale of assets |
2,702 | 21,837 | 2,679 | |||||||||
|
|
|
|
|
|
|
|||||||
| Operating income |
133,939 | 165,059 | 53,773 | |||||||||
| Interest expense |
39,802 | 41,172 | 35,794 | |||||||||
| Interest income |
(9,755 | ) | (2,832 | ) | (510 | ) | ||||||
|
|
|
|
|
|
|
|||||||
| Net interest expense |
30,047 | 38,340 | 35,284 | |||||||||
|
|
|
|
|
|
|
|||||||
| 103,892 | 126,719 | 18,489 | ||||||||||
| Other income (expense): |
||||||||||||
| Loss on early extinguishment of debt |
(1,236 | ) | (44 | ) | — | |||||||
| Foreign currency loss |
(1,559 | ) | (198 | ) | (434 | ) | ||||||
| Fair value adjustment of liability-classified warrants |
(10,917 | ) | (41,408 | ) | (15,150 | ) | ||||||
| Other income |
853 | 2,867 | 1,615 | |||||||||
|
|
|
|
|
|
|
|||||||
| (12,859 | ) | (38,783 | ) | (13,969 | ) | |||||||
|
|
|
|
|
|
|
|||||||
| Income before income taxes |
91,033 | 87,936 | 4,520 | |||||||||
| Income tax expense |
16,495 | 7,174 | 1,533 | |||||||||
|
|
|
|
|
|
|
|||||||
| Net income |
$ | 74,538 | $ | 80,762 | $ | 2,987 | ||||||
|
|
|
|
|
|
|
|||||||
| Earnings per share: |
||||||||||||
| Basic earnings per common share |
$ | 4.38 | $ | 4.80 | $ | 0.20 | ||||||
|
|
|
|
|
|
|
|||||||
| Diluted earnings per common share |
$ | 3.89 | $ | 4.39 | $ | 0.19 | ||||||
|
|
|
|
|
|
|
|||||||
| Weighted-average basic shares outstanding |
17,004 | 16,829 | 14,980 | |||||||||
|
|
|
|
|
|
|
|||||||
| Weighted-average diluted shares outstanding |
19,157 | 18,394 | 15,497 | |||||||||
|
|
|
|
|
|
|
|||||||
The accompanying notes are an integral part of these consolidated financial statements.
F-22
HORNBECK OFFSHORE SERVICES, INC. AND SUBSIDIARIES
CONSOLIDATED STATEMENTS OF COMPREHENSIVE INCOME
(In thousands)
| Year ended December 31, | ||||||||||||
| 2023 | 2022 | 2021 | ||||||||||
| Net income |
$ | 74,538 | $ | 80,762 | $ | 2,987 | ||||||
| Other comprehensive income (loss): |
||||||||||||
| Foreign currency translation income (loss), net |
2,153 | 867 | (1,217 | ) | ||||||||
|
|
|
|
|
|
|
|||||||
| Total comprehensive income |
$ | 76,691 | $ | 81,629 | $ | 1,770 | ||||||
|
|
|
|
|
|
|
|||||||
The accompanying notes are an integral part of these consolidated financial statements.
F-23
HORNBECK OFFSHORE SERVICES, INC. AND SUBSIDIARIES
CONSOLIDATED STATEMENTS OF CHANGES IN STOCKHOLDERS’ EQUITY
(In thousands)
| Additional Paid-In Capital |
Retained Earnings (Deficit) |
Accumulated Other Comprehensive Income (Loss) |
Total Stockholders Equity |
|||||||||||||||||||||
| Common Stock | ||||||||||||||||||||||||
| Shares | Amount | |||||||||||||||||||||||
| Balance at January 1, 2021 |
14,911 | $ | — | $ | 152,223 | $ | (9,859 | ) | $ | 286 | $ | 142,650 | ||||||||||||
| Issuance of common stock and warrants (1) |
1,852 | — | 36,081 | — | — | 36,081 | ||||||||||||||||||
| Stock-based compensation expense |
— | — | 3,372 | — | — | 3,372 | ||||||||||||||||||
| Net income |
— | — | — | 2,987 | — | 2,987 | ||||||||||||||||||
| Foreign currency translation loss, net |
— | — | — | — | (1,217 | ) | (1,217 | ) | ||||||||||||||||
|
|
|
|
|
|
|
|
|
|
|
|
|
|||||||||||||
| Balance at December 31, 2021 (2) |
16,763 | $ | — | $ | 191,676 | $ | (6,872 | ) | $ | (931 | ) | $ | 183,873 | |||||||||||
|
|
|
|
|
|
|
|
|
|
|
|
|
|||||||||||||
| Stock-based compensation expense |
— | — | 5,330 | — | — | 5,330 | ||||||||||||||||||
| Net income |
— | — | — | 80,762 | — | 80,762 | ||||||||||||||||||
| Foreign currency translation income, net |
— | — | — | — | 867 | 867 | ||||||||||||||||||
|
|
|
|
|
|
|
|
|
|
|
|
|
|||||||||||||
| Balance at December 31, 2022 (3) |
16,763 | $ | — | $ | 197,006 | $ | 73,890 | $ | (64 | ) | $ | 270,832 | ||||||||||||
|
|
|
|
|
|
|
|
|
|
|
|
|
|||||||||||||
| Issuance of common stock |
168 | — | — | — | — | — | ||||||||||||||||||
| Stock-based compensation expense |
— | — | 18,828 | — | — | 18,828 | ||||||||||||||||||
| Shares withheld for employee withholding taxes |
— | — | (5,058 | ) | — | — | (5,058 | ) | ||||||||||||||||
| Net income |
— | — | — | 74,538 | — | 74,538 | ||||||||||||||||||
| Foreign currency translation income, net |
— | — | — | — | 2,153 | 2,153 | ||||||||||||||||||
|
|
|
|
|
|
|
|
|
|
|
|
|
|||||||||||||
| Balance at December 31, 2023 (4) |
16,931 | $ | — | $ | 210,776 | $ | 148,428 | $ | 2,089 | $ | 361,293 | |||||||||||||
|
|
|
|
|
|
|
|
|
|
|
|
|
|||||||||||||
| (1) | Consists of 183 shares of common stock and 1,568 Jones Act Warrants issued through a preemptive rights offering and 101 shares of common stock issued under the Stock Purchase Plan, net of issuance costs, in 2021. See Note 12 to these consolidated financial statements for further information regarding the preemptive rights offering and the Stock Purchase Plan. |
| (2) | Reflects 4,652 shares of common stock and 12,111 Jones Act Warrants issued and outstanding as of December 31, 2021. |
| (3) | Reflects 5,386 shares of common stock and 11,377 Jones Act Warrants issued and outstanding as of December 31, 2022. |
| (4) | Reflects 5,554 shares of common stock and 11,377 Jones Act Warrants issued and outstanding as of December 31, 2023. |
The accompanying notes are an integral part of these consolidated financial statements.
F-24
HORNBECK OFFSHORE SERVICES, INC. AND SUBSIDIARIES
CONSOLIDATED STATEMENTS OF CASH FLOWS
(In thousands)
| Year ended December 31, | ||||||||||||
| 2023 | 2022 | 2021 | ||||||||||
| CASH FLOWS FROM OPERATING ACTIVITIES: |
||||||||||||
| Net income |
$ | 74,538 | $ | 80,762 | $ | 2,987 | ||||||
| Adjustments to reconcile net income to net cash provided by operating |
||||||||||||
| Depreciation |
26,355 | 18,601 | 15,672 | |||||||||
| Amortization |
21,496 | 10,339 | 2,711 | |||||||||
| Stock-based compensation expense |
19,097 | 5,330 | 3,372 | |||||||||
| Loss on early extinguishment of debt |
1,236 | 44 | — | |||||||||
| Provision for credit losses |
551 | 257 | 44 | |||||||||
| Deferred tax expense |
1,340 | 55 | 14 | |||||||||
| Amortization of deferred financing costs |
383 | 572 | 26 | |||||||||
| Amortization of deferred contract-specific costs |
1,028 | — | — | |||||||||
| Accumulated paid-in-kind interest |
7,763 | 30,407 | 29,250 | |||||||||
| Mark-to-market adjustment of creditor warrants |
10,917 | 41,408 | 15,150 | |||||||||
| Gain on sale of assets |
(2,702 | ) | (21,837 | ) | (2,608 | ) | ||||||
| Changes in operating assets and liabilities: |
||||||||||||
| Accounts receivable |
(8,553 | ) | (45,467 | ) | (20,186 | ) | ||||||
| Other current and long-term assets |
(3,550 | ) | (11,454 | ) | 6,877 | |||||||
| Deferred drydocking charges |
(29,828 | ) | (19,114 | ) | (14,113 | ) | ||||||
| Accounts payable |
15,385 | 8,303 | 10,050 | |||||||||
| Accrued liabilities and other liabilities |
10,819 | 14,540 | 3,408 | |||||||||
| Accrued interest |
(160 | ) | 221 | (3,043 | ) | |||||||
|
|
|
|
|
|
|
|||||||
| Net cash provided by operating activities |
146,115 | 112,967 | 49,611 | |||||||||
| CASH FLOWS FROM INVESTING ACTIVITIES: |
||||||||||||
| Acquisition of offshore supply vessels |
(128,547 | ) | (116,047 | ) | — | |||||||
| Net proceeds from sale of assets |
2,898 | 22,925 | 3,145 | |||||||||
| Vessel capital expenditures |
(41,609 | ) | (14,707 | ) | (6,581 | ) | ||||||
| Non-vessel capital expenditures |
(1,087 | ) | (1,328 | ) | (688 | ) | ||||||
|
|
|
|
|
|
|
|||||||
| Net cash used in investing activities |
(168,345 | ) | (109,157 | ) | (4,124 | ) | ||||||
| CASH FLOWS FROM FINANCING ACTIVITIES: |
||||||||||||
| Proceeds from Replacement First Lien Term Loans |
— | 37,500 | 36,750 | |||||||||
| Fees for repayment of Replacement First Lien Term Loans |
(34 | ) | — | — | ||||||||
| Principal payments under finance lease obligations |
(287 | ) | (200 | ) | (96 | ) | ||||||
| Repayment of first-lien term loans |
(70,605 | ) | (4,436 | ) | (18,655 | ) | ||||||
| Deferred financing costs |
— | 11 | (1,456 | ) | ||||||||
| Cash paid in lieu of shares |
(54 | ) | — | — | ||||||||
| Shares withheld for employee withholding taxes |
(5,058 | ) | — | — | ||||||||
| Rights offering proceeds from equity issued |
— | — | 20,000 | |||||||||
| Rights offering costs |
— | — | (934 | ) | ||||||||
| Net cash proceeds from other equity issued |
— | — | 2,015 | |||||||||
|
|
|
|
|
|
|
|||||||
| Net cash provided by (used in) financing activities |
(76,038 | ) | 32,875 | 37,624 | ||||||||
|
|
|
|
|
|
|
|||||||
| Effects of exchange rate changes on cash |
1,437 | 196 | (463 | ) | ||||||||
|
|
|
|
|
|
|
|||||||
| Net increase (decrease) in cash, cash equivalents and restricted cash |
(96,831 | ) | 36,881 | 82,648 | ||||||||
| Cash, cash equivalents and restricted cash at beginning of period |
217,651 | 180,770 | 98,122 | |||||||||
|
|
|
|
|
|
|
|||||||
| Cash, cash equivalents and restricted cash at end of period |
$ | 120,820 | $ | 217,651 | $ | 180,770 | ||||||
|
|
|
|
|
|
|
|||||||
| SUPPLEMENTAL DISCLOSURES OF CASH FLOW ACTIVITIES: |
||||||||||||
| Cash paid for interest |
$ | 32,970 | $ | 8,868 | $ | 8,467 | ||||||
| Cash paid for income taxes, net of refunds |
$ | 9,311 | $ | 474 | $ | 2,399 | ||||||
The accompanying notes are an integral part of these consolidated financial statements.
F-25
HORNBECK OFFSHORE SERVICES, INC. AND SUBSIDIARIES
Notes to Consolidated Financial Statements
1. Organization
Nature of Operations and Basis of Presentation
Hornbeck Offshore Services, Inc., or the Company, was incorporated in the state of Delaware in 1997. The Company, through its subsidiaries, operates offshore supply vessels, or OSVs, multi-purpose support vessels, or MPSVs, and a shore-base facility to provide marine transportation, logistics support and specialty services to customers in the offshore oil and gas exploration industry, primarily in the U.S. Gulf of Mexico, or the GoM, Latin America and select international markets, as well as diversified non-oilfield markets, including military support services, renewable energy development and other non-oilfield service offerings in various markets. The consolidated financial statements include the accounts of Hornbeck Offshore Services, Inc. and its subsidiaries. All significant intercompany accounts and transactions have been eliminated. Certain reclassifications have been made to prior-year results to conform to current-year presentation.
2. Summary of Significant Accounting Policies
Revenue Recognition
The services that are provided by the Company represent a single performance obligation under its contracts that are satisfied at a point in time or over time. Revenues are earned primarily by (i) chartering the Company’s vessels, including the operation of such vessels, (ii) providing vessel management services to third-party vessel owners, and (iii) providing shore-based port facility services, including rental of land. Revenues associated with performance obligations satisfied over time are recognized on a daily basis throughout the contract period.
Cash and Cash Equivalents
Cash and cash equivalents consist of all highly liquid investments in money market funds, deposits and investments available for current use with an initial maturity of three months or less.
Restricted Cash
The Company considers cash as restricted when there are contractual agreements that govern the use or withdrawal of the funds.
Accounts Receivable
Accounts receivable consists of trade receivables, net of reserves, and amounts to be rebilled to customers.
Concentration of Credit Risk
Customers are primarily major and independent, domestic and international, oil and oilfield service companies, as well as national oil companies, the U.S. military and offshore wind companies. The Company’s customers are granted credit on a short-term basis and related credit risks are considered minimal. The Company usually does not require collateral, but does occasionally require letters of credit or payment-in-advance if undue credit risk is determined to exist with a particular contract or customer. The Company provides an estimate for uncollectible accounts based primarily on management’s judgment using the relative age of customer balances, historical losses, current economic conditions and individual evaluations of each customer to record an allowance for doubtful accounts.
F-26
Activity in the allowance for doubtful accounts was as follows (in thousands):
| December 31, | ||||||||||||
| 2023 | 2022 | 2021 | ||||||||||
| Balance, beginning of year |
$ | 5,786 | $ | 5,530 | $ | 7,643 | ||||||
| Current period provision for credit losses |
551 | 256 | (2,107 | ) | ||||||||
| Write-offs |
(30 | ) | — | (6 | ) | |||||||
|
|
|
|
|
|
|
|||||||
| Balance, end of year |
$ | 6,307 | $ | 5,786 | $ | 5,530 | ||||||
|
|
|
|
|
|
|
|||||||
Property, Plant and Equipment
Property, plant and equipment is recorded at cost. However, upon adoption of fresh-start accounting effective September 4, 2020, the Company’s property, plant and equipment recorded as of that date was adjusted to its estimated fair market value in accordance with ASC 852, Reorganizations. Depreciation and amortization of equipment and leasehold improvements are computed using the straight-line method based on the estimated useful lives and estimated salvage values of the related assets. Major modifications and improvements that extend the useful life or functional operating capability of a vessel are capitalized and amortized over the remaining useful life of the vessel. Estimated useful lives and salvage values are reassessed when there are relevant indications that the original estimates may no longer be appropriate. Gains and losses from retirements or other dispositions are recognized as incurred.
The estimated useful lives by classification are as follows:
| Offshore supply vessels |
25 years | |||
| Multi-purpose support vessels |
25 years | |||
| Non-vessel property, plant and equipment |
3-15 years |
Deferred Charges
The Company’s vessels are required by regulation to be recertified after certain periods of time. The Company defers the drydocking costs incurred due to regulatory marine inspections and amortizes the costs on a straight-line basis over the period to be benefited from such expenditures (typically between 24 and 36 months).
Mobilization Costs
The Company occasionally incurs mobilization costs to prepare its vessels and/or transit them to and from certain regions in order to obtain and fulfill vessel charter contracts. These contract-specific costs are typically expensed as incurred, but may in certain circumstances be deferred and amortized over the contract term dependent upon criteria set forth in ASC 606, Revenue from Contracts with Customers, and ASC 340, Other Assets and Deferred Costs.
Stock-Based Compensation
Stock-based compensation awards are accounted for in accordance with ASC 718, Compensation – Stock Compensation, which requires all share-based payments to the Company’s employees and directors to be recognized in the consolidated financial statements based on their fair values on the grant date. The fair value of the underlying common stock is based upon a valuation of the Company’s equity developed with the assistance of third-party valuation experts using a combination of income and market approaches as of the appropriate measurement date. The Company recognizes compensation expense on a straight-line basis over the expected vesting period of stock-based awards that are ultimately expected to vest based on their estimated fair value on the grant date. Forfeitures are recognized during the period in which they actually occur.
F-27
Income Taxes
Deferred tax assets and liabilities are recognized for the future tax consequences attributable to differences between the financial statement carrying amounts of existing assets and liabilities and their respective tax bases. Deferred tax assets and liabilities are measured using currently enacted tax rates. The effect on deferred tax assets and liabilities of a statutory change in tax rates is recognized in income in the period that includes the enactment date. The provision for income taxes includes provisions for federal, state and foreign income taxes. Interest and penalties relating to uncertain tax positions are recorded as interest expense and general and administrative expenses, respectively. In addition, the Company provides a valuation allowance for deferred tax assets if it is more likely than not that such items will either expire before the Company is able to realize the benefit or the future deductibility is uncertain.The Company established valuation allowances of $264.6 million and $246.4 million against its deferred tax assets as of December 31, 2023 and 2022, respectively.
The Company has made an accounting policy election to account for global intangible low-taxed income, or GILTI, in the year the tax is incurred.
Use of Estimates
The preparation of financial statements in conformity with United States generally accepted accounting principles requires management to make estimates and assumptions that affect the amounts reported in the consolidated financial statements and accompanying notes. Actual results could differ from those estimates.
Legal Liabilities
In the ordinary course of business, the Company may become party to lawsuits, administrative proceedings, or governmental investigations. These matters may involve large or unspecified damages or penalties that may be sought from the Company and may require years to resolve. The Company records a liability related to a loss contingency for such legal matters in accrued liabilities if the Company determines the loss to be both probable and estimable. The liability is recorded for an amount that is management’s best estimate of the loss, or when a best estimate cannot be made, the minimum loss amount of a range of possible outcomes. Significant judgment is required in estimating such liabilities, the results of which can vary significantly from the actual outcomes of lawsuits, administrative proceedings or governmental investigations.
Foreign Currency Transaction Gains and Losses
Foreign currency transaction gains and losses are recorded in the period incurred except for advances to and investments in foreign subsidiaries. Foreign currency gains and losses related to advances to or investments in foreign operations are accounted for as a foreign currency translation adjustment and recorded as other comprehensive income (loss). The balance in accumulated other comprehensive income (loss) as of December 31, 2023 and 2022 relates primarily to the Company’s long-term investments in its foreign subsidiaries.
Warrants
Common stock warrants are accounted for as either equity instruments or liabilities depending on the specific terms of the applicable warrant agreement. Warrants that are classified as liabilities are recorded at their estimated fair value on a recurring basis at each balance sheet date. Changes in the estimated fair value of such warrants are recognized as a non-cash gain or loss on the consolidated statements of operations. All outstanding warrants are reassessed each reporting period to determine whether their classification continues to be appropriate.
F-28
Fair Value of Financial Instruments
The Company evaluates its financial assets and liabilities subject to fair value measurements on a recurring basis to determine the appropriate level in which to classify them for each reporting period pursuant to ASC 820, Fair Value Measurements. Each applicable asset and liability carried at fair value is required to be classified into one of the following categories:
| • | Level 1: Quoted market prices in active markets for identical assets or liabilities |
| • | Level 2: Observable market-based inputs or observable inputs that are corroborated by market data |
| • | Level 3: Unobservable inputs that are not corroborated by market data |
Fair value is calculated based on assumptions that market participants would use in pricing assets and liabilities. Significant judgments are required in the determination of these assumptions.
Leases
The Company determines if an agreement is a lease or contains a lease at inception. The lease term for accounting purposes may include options to extend or terminate the lease when it is reasonably certain that the Company will exercise the option. Right-of-use assets and the corresponding lease liabilities are recorded at the commencement date based on the present value of lease payments over the expected lease term. The Company uses its incremental borrowing rate, which would be the rate incurred to borrow on a collateralized basis over a similar term in a similar economic environment, to calculate the present value of lease payments for its operating leases. The Company uses the rate implicit in the lease for its finance leases.
The Company is obligated under certain operating leases for shore-based facilities, office space, temporary housing and equipment. The Company is obligated under finance leases for vehicles. Such leases will often include options to extend the lease and the Company will include option periods that, on commencement date, it is reasonably likely that it will exercise. Some leases may require variable lease payments such as real estate taxes and maintenance expenses. These costs are expensed in the period in which they are incurred. The Company’s finance leases contain residual value guarantees, which may require additional payments at the end of the lease term if the net book value of the vehicle is less than the greater of the wholesale value of such vehicle or 20% of the delivered price of the vehicle.
For leases with a term of 12 months or less, the Company has made a policy election in which the right-of-use asset and lease liability will not be recognized on its balance sheet.
Reportable Segments
The Company has one reportable segment, which encompasses all aspects of its marine transportation services business. As the chief operating decision maker, our Chief Executive Officer evaluates the Company’s operating results on a consolidated basis to assess performance and allocate resources. While the Company’s vessels operate in various geographic regions and customer markets, they are centrally managed, share multiple forms of common costs, provide similar or complementary marine transportation services, are manned by crews that may move from location to location or market to market as needed, and are marketed on a portfolio basis with the goal of maximizing Adjusted EBITDA and Adjusted Free Cash Flow and generating the highest possible rate of return on invested capital without a permanent commitment of particular assets to geographic region or customer market.
F-29
3. Recent Accounting Pronouncements
The following table provides a brief description of recent accounting pronouncements that could have a material effect on the Company’s consolidated financial statements:
| Standard |
Description |
Date of Adoption |
Effect on the financial | |||
| Standards that have been adopted: | ||||||
| ASU No. 2016-13, Financial Instruments—Credit Losses (Topic 326): Measurement of Credit Losses on Financial Instruments | This standard requires measurement and recognition of expected credit losses for financial assets held. ASU No. 2016-13 requires modified retrospective application. Early adoption is permitted. | January 1, 2023 | The Company adopted ASU No. 2016-13 on January 1, 2023. This adoption had no material impact on its consolidated financial statements. | |||
| ASU No. 2020-04, Reference Rate Reform (Topic 848), Facilitation of the Effects of Reference Rate Reform on Financial Reporting | The amendments in this update provide optional expedients and exceptions for applying generally accepted accounting principles (GAAP) to contracts, hedging relationships, and other transactions affected by the reference rate reform if certain criteria are met. | Effective upon issuance (March 12, 2020) and generally can be adopted at the reporting entity’s election through December 31, 2024. | The Company adopted ASU No. 2020-04 on July 27, 2023. This adoption had no material impact on its consolidated financial statements. | |||
| ASU No. 2022-06, Reference Rate Reform (Topic 848): Deferral of the Sunset Date of Topic 848 | The amendments in this update defer the sunset date of Topic 848 from December 31, 2022, to December 31, 2024. | Effective upon issuance (December 21, 2022) through December 31, 2024. | The Company adopted ASU No. 2022-06 on January 1, 2023. This adoption had no material impact on its consolidated financial statements. | |||
| Standards that have not been adopted: | ||||||
| ASU No. 2023-05, Business Combinations—Joint Venture Formations (Subtopic 805-60): Recognition and Initial Measurement | This standard requires a joint venture to initially measure all contributions received upon its formation at fair value. ASU No. 2023-05 requires prospective application for all newly-formed joint venture entities with a formation date on or after January 1, 2025. Joint ventures formed prior to the adoption date may elect to apply the guidance retrospectively back to their original formation date. Early adoption is permitted. | January 1, 2025 | The Company will adopt ASU No. 2023-05 on January 1, 2025 and elect to apply the standard prospectively. The Company does not believe that the implementation of this guidance will have a material impact on its consolidated financial statements. | |||
F-30
| Standard |
Description |
Date of Adoption |
Effect on the financial and other significant matters | |||
| ASU No. 2023-07, Segment Reporting (Topic 280): Improvements to Reportable Segment Disclosures | The amendments in this update improve reportable segment disclosure requirements, primarily through enhanced disclosures about significant segment expenses. In addition, the amendments enhance interim disclosure requirements, clarify circumstances in which an entity can disclose multiple segment measures of profit or loss, provide new segment disclosure requirements for entities with a single reportable segment, and contain other disclosure requirements. ASU No. 2023-07 requires retrospective application. | Effective for fiscal years beginning after December 15, 2023, and interim periods within fiscal years beginning after December 15, 2024. Early adoption is permitted. | The Company adopted ASU No. 2023-07 on January 1, 2024. This adoption had no material impact on its consolidated financial statements. | |||
| ASU No. 2023-09, Income Taxes (Topic 740): Improvements to Income Tax Disclosures | This standard requires disaggregated information about a reporting entity’s effective tax rate reconciliation as well as information on income taxes paid. ASU No. 2023-09 requires prospective application with the option to apply the standard retrospectively. Early adoption is permitted. |
January 1, 2026 |
The Company will adopt ASU No. 2023-09 on January 1, 2026 and elect to apply the standard prospectively. The Company does not believe that the implementation of this guidance will have a material impact on its consolidated financial statements. | |||
4. Revenues from Contracts with Customers
The services that are provided by the Company represent a single performance obligation under its contracts that are satisfied at a point in time or over time. Revenues are earned primarily by (i) chartering the Company’s vessels, including the operation of such vessels, (ii) providing vessel management services to third-party vessel owners, and (iii) providing shore-based port facility services, including rental of land. The services generating these revenue streams are provided to customers based on contracts that include fixed or determinable prices and do not generally include right of return or other significant post-delivery obligations. The Company’s vessel revenues, vessel management revenues and port facility revenues are recognized either at a point in time or over the passage of time when the customer has received or is receiving the benefit from the applicable service. Revenues are recognized when the performance obligations are satisfied in accordance with contractual terms and in an amount that reflects the consideration that the Company expects to be entitled to in exchange for the services rendered or rentals provided. Revenues are recognized net of any taxes collected from customers, which are subsequently remitted to governmental authorities. Invoices are typically billed to customers on a monthly basis, and payment terms on customer invoices typically range 30 to 60 days.
F-31
A performance obligation under contracts with the Company’s customers to render services is the unit of account under ASC 606, Revenue from Contracts with Customers. The Company accounts for services rendered separately if they are distinct and the service is separately identifiable from other items provided to a customer and if a customer can benefit from the services rendered provided on its own or with other resources that are readily available to the customer. A contract’s transaction price is allocated to each distinct performance obligation and recognized as revenue when, or as, the performance obligation is satisfied.
As of December 31, 2023, the Company had certain remaining performance obligations representing contracted vessel revenue for which work had not been performed and such contracts had an original expected duration of more than one year. As of December 31, 2023, the aggregate amount of the transaction price allocated to remaining performance obligations for such contracts totaled $92.2 million, of which $76.2 million is expected to be fully recognized in 2024 and $16.0 million in 2025. These amounts are a result of multi-year vessel charters that commenced in 2022 and 2023.
As of December 31, 2023, we had $2.8 million and $0.8 million of deferred revenue included in current liabilities and other long-term liabilities, respectively, related to unsatisfied performance obligations that will be recognized during 2024 and 2025.
Disaggregation of Revenues
The Company recognized revenues as follows (in thousands):
| Year Ended December 31, | ||||||||||||
| 2023 | 2022 | 2021 | ||||||||||
| Vessel revenues |
$ | 528,780 | $ | 406,034 | $ | 214,680 | ||||||
| Vessel management revenues |
43,128 | 42,893 | 39,177 | |||||||||
| Shore-based facility revenues |
1,541 | 2,299 | 2,443 | |||||||||
|
|
|
|
|
|
|
|||||||
| $ | 573,449 | $ | 451,226 | $ | 256,300 | |||||||
|
|
|
|
|
|
|
|||||||
Revenues by geographic region(1) were as follows (in thousands):
| Year Ended December 31, | ||||||||||||||||||||||||
| 2023 | % of Total | 2022 | % of Total | 2021 | % of Total | |||||||||||||||||||
| United States |
$ | 432,621 | 75.4 | % | $ | 362,830 | 80.4 | % | $ | 196,357 | 76.6 | % | ||||||||||||
| International(2) |
140,828 | 24.6 | % | 88,396 | 19.6 | % | 59,943 | 23.4 | % | |||||||||||||||
|
|
|
|
|
|
|
|
|
|
|
|
|
|||||||||||||
| $ | 573,449 | 100.0 | % | $ | 451,226 | 100.0 | % | $ | 256,300 | 100.0 | % | |||||||||||||
|
|
|
|
|
|
|
|
|
|
|
|
|
|||||||||||||
| (1) | The Company attributes revenues to individual geographic regions based on the location where services are performed. |
| (2) | International revenues of $62.1 million, $41.3 million and $40.7 million were attributed to services performed in Mexico for the years ended December 31, 2023, 2022 and 2021, respectively. International revenues of $53.2 million, $15.4 million and $8.7 million were attributed to services performed in Brazil for the years ended December 31, 2023, 2022 and 2021, respectively. Revenues attributed to other countries were not individually material for the periods presented. |
5. Earnings Per Share
Basic earnings per common share was calculated by dividing net income by the weighted-average number of common shares and Jones Act Warrants outstanding during the period. Diluted earnings per common share was calculated by dividing net income by the weighted-average number of common shares and Jones Act
F-32
Warrants outstanding during the period plus the effect of dilutive Creditor Warrants, dilutive stock options and restricted stock unit awards. Weighted-average number of common shares outstanding was calculated by using the sum of the shares and Jones Act Warrants determined on a daily basis divided by the number of days in the period. The table below reconciles the Company’s earnings per share (in thousands, except for per share data):
| Year Ended December 31, | ||||||||||||
| 2023 | 2022 | 2021 | ||||||||||
| Net income |
$ | 74,538 | $ | 80,762 | $ | 2,987 | ||||||
| Weighted-average number of shares of common |
17,004 | 16,829 | 14,980 | |||||||||
| Add: Net effect of dilutive stock options, restricted |
2,153 | 1,565 | 517 | |||||||||
|
|
|
|
|
|
|
|||||||
| Weighted-average number of dilutive shares of |
19,157 | 18,394 | 15,497 | |||||||||
|
|
|
|
|
|
|
|||||||
| Earnings per common share: |
||||||||||||
| Basic earnings per common share |
$ | 4.38 | $ | 4.80 | $ | 0.20 | ||||||
|
|
|
|
|
|
|
|||||||
| Diluted earnings per common share |
$ | 3.89 | $ | 4.39 | $ | 0.19 | ||||||
|
|
|
|
|
|
|
|||||||
| (1) | The Company included 11,377, 11,488 and 10,588 Jones Act Warrants in the weighted-average number of shares of common stock outstanding for the years ended December 31, 2023, 2022 and 2021, respectively, which represents the weighted-average number of Jones Act Warrants existing at each period-end. See Note 12 to these consolidated financial statements for further information regarding the Jones Act Warrants. |
| (2) | Includes 105, 105 and 53 fully vested, equity-settled restricted stock units that will be settled on the earlier of the occurrence of a contractually-designated event and the passage of a certain period of time for the years ended December 31, 2023, 2022 and 2021, respectively. See Note 13 to these consolidated financial statements for further information regarding the equity-settled restricted stock units granted under the MIP. |
| (3) | Includes 196, 254 and 257 unvested restricted stock units and 611, 380 and 128 vested restricted stock units that will be settled on the earlier of the occurrence of a contractually-designated event and the passage of a certain period of time, subject to certain employment requirements of the grantee, for the years ended December 31, 2023, 2022 and 2021, respectively. See Note 13 to these consolidated financial statements for further information regarding the equity-settled restricted stock units granted under the MIP. |
| (4) | Includes 476, 403 and 83 dilutive unvested stock options granted under the MIP in the weighted-average calculation for the years ended December 31, 2023, 2022 and 2021, respectively. Dilutive unvested stock options issued by the Company are expected to fluctuate from quarter to quarter depending on the Company’s performance compared to a predetermined set of performance criteria. See Note 13 to these consolidated financial statements for further information regarding the Company’s stock options granted under the MIP. |
| (5) | Includes 870 and 488 of in-the-money, liability-classified Creditor Warrants in the weighted-average calculation for the years ended December 31, 2023 and 2022, respectively. Excludes 1,592 of out-of-the-money, liability-classified Creditor Warrants for the year ended December 31, 2021. See Note 11 to these consolidated financial statements for further information regarding the Creditor Warrants. |
6. Defined Contribution Plan
The Company offers a 401(k) plan to all full-time employees. Employees must be at least eighteen years of age and are eligible to participate the first of the month following their date of hire. Participants may elect to defer up to 60% of their compensation, subject to certain statutorily established limits. The Company may elect to make annual matching and profit sharing contributions to the 401(k) plan. In response to weak market conditions at the advent of the offshore industry downturn that began in October 2014, the Company ceased matching contributions to the 401(k) plan and did not match any contributions in 2015 through 2019 and then
F-33
again in 2021. Effective January 1, 2022, the Company reinstated a discretionary match of employee contributions to the 401(k) plan. During the years ended December 31, 2023 and 2022, the Company made contributions to the 401(k) plan of approximately $5.6 million and $2.6 million, respectively.
7. Property, Plant and Equipment
Property, plant and equipment consisted of the following (in thousands):
| December 31, | ||||||||
| 2023 | 2022 | |||||||
| Offshore supply vessels and multi-purpose support vessels |
$ | 510,882 | $ | 437,561 | ||||
| Non-vessel related property, plant and equipment |
19,533 | 15,964 | ||||||
| Less: Accumulated depreciation |
(65,890 | ) | (39,842 | ) | ||||
|
|
|
|
|
|||||
| 464,525 | 413,683 | |||||||
|
|
|
|
|
|||||
| Construction in progress (1) |
137,897 | 35,566 | ||||||
|
|
|
|
|
|||||
| $ | 602,422 | $ | 449,249 | |||||
|
|
|
|
|
|||||
| (1) | Includes $17.6 million and $7.7 million of accrued accounts payable as of December 31, 2023 and 2022, respectively. These amounts were excluded from the statement of cash flows as non-cash items for the respective periods. |
The following table presents the net book value of property, plant and equipment by geographic region(1) (in thousands):
| As of December 31, | ||||||||||||||||
| 2023 | % of Total | 2022 | % of Total | |||||||||||||
| United States |
$ | 522,347 | 86.7 | % | $ | 365,769 | 81.4 | % | ||||||||
| International(2) |
80,075 | 13.3 | % | 83,480 | 18.6 | % | ||||||||||
|
|
|
|
|
|
|
|
|
|||||||||
| $ | 602,422 | 100.0 | % | $ | 449,249 | 100.0 | % | |||||||||
|
|
|
|
|
|
|
|
|
|||||||||
| (1) | Book values are attributed to geographic regions based on the country of domicile of the specific asset-owning subsidiary of the Company, not the physical operating location of the asset as of any of the dates presented. |
| (2) | International property, plant and equipment of $70.6 million and $74.5 million were owned by certain Mexican subsidiaries of the Company as of December 31, 2023 and 2022, respectively. Property, plant and equipment attributed to other countries were not individually material as of any of the dates presented. No other individual foreign location accounted for a material portion of property, plant and equipment as of any of the dates presented. |
Vessel Construction
During the first quarter of 2018, the Company notified Gulf Island Shipyards, LLC, or Gulf Island, the shipyard that was constructing the remaining two vessels in the Company’s fifth OSV newbuild program, that it was terminating the construction contracts for such vessels based on the shipyard’s statements that it would be more than one year late in the delivery of the vessels, among other reasons. On October 2, 2018, Gulf Island filed suit against the Company in the 22nd Judicial District Court for the Parish of St. Tammany in the State of Louisiana, claiming that the Company’s termination was improper. In October 2023, the Company entered into a final settlement agreement with Zurich American Insurance Company and Fidelity & Deposit Company of Maryland, together the Surety, and Gulf Island. Pursuant to the settlement agreement, the Surety agreed to take
F-34
over and complete the construction of the two U.S.-flagged, Jones Act-qualified, HOS 400 class MPSVs at a shipyard acceptable to the Company. Gulf Island released all claims asserted against the Company and the Company released its claims against Gulf Island and the Surety. The Company is obligated to pay only the remaining portion of the original shipyard contract price for the two MPSVs, which amounts to $53.8 million in the aggregate. The Surety is required to cure all defaults of Gulf Island and pay all completion costs in excess of the $53.8 million remaining contract price, excluding approved change orders. In addition, the Company is currently exploring discretionary post-delivery enhancements to add, among other things, secondary cranes to both vessels. On December 20, 2023, Eastern Shipbuilding Group, Inc. was contracted by the Surety to complete the construction of the two MPSVs. Pursuant to the settlement, the Surety is required to deliver both MPSVs in 2025.
8. Assets Held for Sale
Pursuant to ASC 360, Property, Plant, and Equipment, the Company considers an asset to be held for sale when all of the following criteria are met: (i) management commits to a plan to sell the asset, (ii) the asset is available for immediate sale in its present condition, (iii) actions required to complete the sale of the asset have been initiated, (iv) the sale of the asset is probable and the sale is expected to be completed within one year, (v) the asset is being actively marketed for sale at a price that is reasonable given its current fair value, and (vi) it is unlikely that the plan to sell will be significantly modified or withdrawn.
Upon designation as held for sale, an asset is recorded at the lower of its carrying value or estimated fair value, less estimated costs to sell, as of the reporting date. If at any time the above criteria are no longer met, subject to certain exceptions, the asset previously classified as held for sale is reclassified as held and used and measured individually at the lower of: (i) the carrying amount before being classified as held for sale, adjusted for any depreciation expense that would have been recognized had the asset been continuously classified as held and used, or (ii) the fair value at the date of the subsequent decision to not sell.
The Board of Directors previously approved a plan to scrap or sell certain low-spec and mid-spec vessels. The Company sold all but two such vessels during 2021, 2022 and 2023 for net gains of $2.2 million, $20.5 million, and $0.8 million, respectively. The Company consummated the sale of four low-spec vessels for net proceeds totaling $2.7 million in 2021, seven low-spec and three mid-spec vessels for net proceeds totaling $21.5 million in 2022 and two low-spec vessels for net proceeds totaling $1.0 million in 2023. In 2021, 2022, and 2023, the Company also sold certain non-vessel assets for proceeds of $0.5 million, $1.3 million, and $2.0 million, at net gains of $0.5 million, $1.3 million, $1.9 million, respectively.
As of December 31, 2022, the Company had two vessels that met all of the held-for-sale criteria and were included in assets held for sale on the consolidated balance sheet at an aggregate carrying value of $0.1 million, which represented their estimated net scrap value. Based on current assessments, the Company did not have any vessels that met the held-for-sale criteria as of December 31, 2023.
9. Vessel Acquisitions
ECO Acquisitions #1
On January 10, 2022, the Company entered into definitive vessel purchase agreements with certain affiliates of Edison Chouest Offshore, or collectively ECO, to acquire up to ten high-spec, 280 class DP-2 OSVs for an aggregate price of $130.0 million. In November 2022, ECO exercised an option to terminate the vessel purchase agreements relating to the last four vessels. ECO refunded initial deposits of $1.5 million in the aggregate and paid an additional amount equal to such deposits as a termination fee. After accounting for such terminations and certain purchase price adjustments, the aggregate purchase price for ECO Acquisitions #1 was $82.4 million. Pursuant to the purchase agreements, final payment and the transfer of ownership of each of the vessels occurred on the date of delivery and acceptance for such vessel following the completion of reactivation and regulatory drydockings by ECO. The Company took delivery of the six vessels between May 2022 and August 2023.
F-35
As of December 31, 2023, the Company had paid $82.2 million for the original purchase price and $1.7 million in purchase price adjustments associated with discretionary enhancements of the ECO Acquisitions #1 vessels, prior to the $1.5 million termination fee paid by ECO. In addition, the Company had incurred $4.8 million of costs associated with additional outfitting of the six vessels through the fourth quarter of 2023. The Company expects to incur an additional $0.1 million related to post-closing modifications of the sixth vessel during the first quarter of 2024.
MARAD Acquisition and SOV/Flotel Conversion
On February 4, 2022, the Company completed the acquisition of three high-spec new generation OSVs from the U.S. Department of Transportation’s Maritime Administration, or MARAD, for an aggregate price of $37.2 million. All three vessels are U.S.-flagged, Jones Act-qualified, 280 class DP-2 OSVs with cargo-carrying capacities of circa 4,500 DWT. In September 2022, the Company placed two of these vessels into service for immediate time charters in the U.S. GoM. Since taking physical delivery of the vessels from MARAD, the Company has incurred approximately $27.1 million for the reactivation and regulatory drydockings of all three vessels. The Company has also incurred $23.5 million, excluding capitalized interest, associated with the conversion of the third vessel into a dual-use SOV/flotel to support the domestic offshore wind and oilfield markets. The Company currently expects to spend an additional $54.2 million toward the SOV/flotel conversion of the third vessel, which is expected to be completed by mid-year 2025.
ECO Acquisitions #2
On December 22, 2022, the Company executed a controlling purchase agreement with Nautical Solutions, L.L.C., or Nautical, an ECO affiliate. Pursuant to the controlling purchase agreement, the Company subsequently entered into separate, individual vessel purchase agreements to acquire six high-spec, 280 class DP-2 OSVs from Nautical for $17.0 million per vessel. Nautical completed regulatory drydocking and reactivation activities for each vessel prior to closing. Payment of 10% of the purchase price for each vessel was made upon arrival of such vessel to the shipyard and the remaining 90% was paid at the closing and delivery of each vessel. The Company took delivery of the first five vessels during 2023.
As of December 31, 2023, the Company had paid $86.7 million, including deposits, of the original purchase price and $0.8 million in purchase price adjustments associated with discretionary enhancements for the ECO Acquisitions #2 vessels. In addition, the Company had incurred $4.1 million of costs associated with additional outfitting of the six vessels through the fourth quarter of 2023.
In January 2024, the Company took delivery of the sixth vessel and paid $15.3 million for the remaining 90% of the original purchase price and $0.1 million for purchase price adjustments related to discretionary enhancements. The Company expects to incur an additional $4.4 million related to additional outfitting, discretionary enhancements and post-closing modifications of these vessels during the first quarter of 2024 for these acquired vessels.
The Company has determined that substantially all of the fair value of the assets acquired from ECO, MARAD and Nautical are concentrated in a group of similar identifiable assets and therefore, will account for such transactions as asset acquisitions under ASU 2017-01. The Company did not acquire any contracts, employees, business systems, trade names or trademarks in connection with these acquisitions.
F-36
10. Long-Term Debt
As of the dates indicated below, the Company had the following outstanding long-term debt (in thousands):
| December 31, | ||||||||
| 2023 | 2022 | |||||||
| Replacement First Lien Term Loans due 2025, net of original issue discount of $0 and $1,090 and deferred financing costs of $0 and $495 |
$ | — | $ | 69,020 | ||||
| Second Lien Term Loans due 2026 (including |
349,001 | 341,238 | ||||||
|
|
|
|
|
|||||
| $ | 349,001 | $ | 410,258 | |||||
|
|
|
|
|
|||||
The table below summarizes the Company’s cash interest payments (in thousands) based on the most recent payment amount:
| Cash Interest Payments (1) |
Payment Dates | |||||||
| Second Lien Term Loans due 2026 |
$ | 7,278 | |
March 31, June 30, September 30, December 31 |
| |||
| (1) | The interest rate on the Second Lien Term Loans is variable at either 8.25% or 10.25% per annum based on the Company’s total leverage ratio on a quarterly basis. The amount reflected in this table is consistent with the interest applicable to the Company’s total leverage ratio for the quarter ended December 31, 2023. |
The Company incurred $41.0 million of interest related to debt instruments in 2023 of which $1.5 million related to certain capital projects was capitalized to the consolidated balance sheet as of December 31, 2023. In 2022 and 2021, the Company incurred $40.1 million and $34.7 million of interest related to debt instruments, respectively, but recorded no capitalized interest during such years.
Annual maturities of debt during each year ending December 31, are as follows (in thousands):
| 2024 |
$ | — | ||
| 2025 |
— | |||
| 2026 |
349,001 | |||
| 2027 |
— | |||
| 2028 |
— | |||
| Thereafter |
— | |||
|
|
|
|||
| $ | 349,001 | |||
|
|
|
Second Lien Term Loans
The Second Lien Credit Agreement, as subsequently amended, was entered into by and among the Company, as Parent Borrower, Hornbeck Offshore Services. LLC, or HOS, as Co-Borrower, the prepetition first-lien term lenders, and Wilmington Trust, National Association, as Administrative Agent and Collateral Agent for the lenders, resulting in $287.6 million of Second Lien Term Loans initially outstanding as of September 4, 2020. The Second Lien Term Loans will mature on March 31, 2026. The Company may voluntarily prepay, in whole or in part, any amounts due under the Second Lien Credit Agreement without penalty prior to maturity. The Second Lien Term Loans are guaranteed by certain of the Company’s domestic and foreign subsidiaries and are secured by a security interest in, and lien on, substantially all of the Company’s property (whether tangible, intangible, real, personal or mixed). The Second Lien Credit Agreement continues to permit the Company to incur up to
F-37
$75 million of first lien senior secured debt that would be senior in priority to the Second Lien Term Loans, subject to certain terms and conditions set forth in the Second Lien Credit Agreement. Until such time as any future first lien senior secured debt is entered into by the Company, the Second Lien Term Loans are effectively first lien senior secured in priority. The credit agreement contains customary representations and warranties, covenants and events of default, and one maintenance covenant, which is a $25 million minimum liquidity requirement.
For the time periods set forth below, borrowings accrued or accrue interest at a cash rate or cash plus paid-in-kind (PIK) rate, at the Company’s option, but in no event to exceed the highest lawful rate:
| Time Period |
Cash Interest Only |
Cash Interest and PIK Interest | ||
| From September 4, 2020 until September 4, 2022 | 9.25% per annum | 1.00% per annum cash interest plus 9.50% per annum PIK interest | ||
| From the September 4, 2022 until September 4, 2023 | 10.25% per annum | 2.50% per annum cash interest plus 9.00% per annum PIK interest | ||
| From and after September 4, 2023 | If the Total Leverage Ratio is greater than or equal to 3.00:1.00, 10.25% per annum | PIK option not available | ||
| If the Total Leverage Ratio is less than 3.00:1.00, 8.25% per annum | PIK option not available | |||
The outstanding balance of Second Lien Term Loans increased by $7.8 million, $30.4 million and $29.3 million as a result of accumulated PIK interest incurred during 2023, 2022 and 2021, respectively. This increase in Second Lien Term Loans was reduced by $15.0 million in 2021 in connection with the preemptive rights offering of equity discussed below.
On December 22, 2021, the Company concluded a preemptive rights offering of equity to certain eligible stockholders and Jones Act Warrant holders. As a result, certain related party lenders converted $15.0 million in the aggregate principal amount of the Second Lien Term Loans in lieu of cash payments to acquire a total of 750,000 shares of common stock and Jones Act Warrants at a purchase price of $20.00 per share or warrant. See Note 12 to these consolidated financial statements for further information regarding the preemptive rights offering.
In June 2023, the Company elected to stop accruing PIK interest and began paying the full amount of interest in cash on the Second Lien Term Loans. Effective September 4, 2023, the PIK option on the Second Lien Term Loans is no longer available and interest payments have converted to full cash-pay obligations with an annual interest rate of 8.25% or 10.25% depending on the prevailing Total Leverage Ratio. As of December 31, 2023, the Total Leverage Ratio remains below 3.0, resulting in the applicable lower annual interest rate of 8.25%. The carrying value of the Company’s Second Lien Term Loans approximates their fair value (a level 2 measurement).
As of December 31, 2023, certain lenders of the Second Lien Term Loans were considered related parties due to their ownership of Jones Act Warrants and/or shares of common stock.
Replacement First Lien Term Loans
On September 4, 2020, the Company entered into that certain first lien term loan credit agreement (as amended and restated pursuant to that certain Amendment No. 1 to First Lien Credit Agreement and Amendment
F-38
No. 1 to the Effective Date Junior Lien Intercreditor Agreement, dated December 22, 2021, as further amended pursuant to that certain First Amendment to Restated First Lien Credit Agreement, dated June 6, 2022, as further amended pursuant to that certain Interest Rate Replacement Index Agreement and Second Amendment to First Lien Credit Agreement, dated July 27, 2023), or the First Lien Credit Agreement, with Hornbeck Offshore Services, LLC, as co-borrower, Wilmington Trust, National Association, as administrative agent and collateral agent, and the lenders from time to time party thereto. The initial aggregate principal amount of the initial term loans under the First Lien Credit Agreement, or the Existing Initial Term Loans, was $18.7 million. In connection with the First Lien Credit Agreement, certain lenders agreed to make additional first lien term loans in an aggregate principal amount of $37.5 million and delayed draw term loans in an aggregate principal amount of $37.5 million, or together the Replacement First Lien Term Loans, the proceeds of which were applied to, among other things, repay in full the outstanding principal amount of the Existing Initial Term Loans. Pursuant to ASC 470-50, Debt – Modification and Extinguishments, the repayment of the Existing Initial Terms Loans qualified as a debt extinguishment and was accounted for accordingly.
On August 31, 2023, the Company repaid the full $68.7 million then-outstanding principal balance of the Replacement First Lien Term Loans and terminated the obligations and commitments under the First Lien Credit Agreement. As a result, the Company incurred a $1.2 million loss on early extinguishment of debt; most of which related to the write-off of deferred issuance costs and original issue discount.
Postponed Debt Refinancing
In the second quarter of 2023, the Company postponed plans to refinance all of its then-existing debt. As a result, the Company recorded a non-recurring charge of $3.7 million for expenses incurred in connection with the terminated process as a refinancing did not occur within 90 days of the postponement date. Pursuant to ASC 340, Other Assets and Deferred Costs, costs associated with a postponed or terminated offering of debt or equity securities must be expensed if the offering is not completed or expected to be completed within 90 days of the postponement.
11. Liability-Classified Warrants
Jones Act Warrants
On September 4, 2020, the Company entered into the Jones Act Warrant Agreement, pursuant to which the Company issued 10.5 million Jones Act Warrants. Upon issuance, the Jones Act Warrants were classified as liabilities due to certain anti-dilution provisions in the Jones Act Warrant Agreement, which indexed the warrants to other equity-linked instruments. On December 31, 2020, the Jones Act Warrant Agreement was amended to remove those provisions. As a result, the Jones Act Warrants were reclassified to equity as of December 31, 2020. See Note 12 for further information regarding the Jones Act Warrants.
Creditor Warrants
On September 4, 2020, the Company entered into the Creditor Warrant Agreement, pursuant to which the Company issued 1.6 million Creditor Warrants. The Creditor Warrants are exercisable at $27.83 per share, which was based on an enterprise value of $621.2 million, for seven years from September 4, 2020 for: (i) one share of common stock, or up to 1.6 million shares in the aggregate, or (ii) one Jones Act Warrant if the holder cannot establish, at the time of exercise, that it is a U.S. Citizen and conversion of the Creditor Warrant would result in a violation of the Jones Act.
The Creditor Warrants are freely tradable and are not subject to any restrictions on transfer that are not also applicable to the Company’s common stock. The warrant holders are not entitled to any of the rights of the Company’s stockholders, including the right to vote, receive dividends, or receive notice of, or attend, meetings or any other proceeding of the stockholders. In the event of a reorganization, reclassification, merger, sale of all or substantially all of the Company’s assets, or similar transaction, each warrant shall be, immediately after such event, exercisable for the shares or other securities the warrant holder would have been entitled to had the warrant been exercised prior to the event.
F-39
In order to prevent dilution of the rights granted to the Creditor Warrants and to provide the warrant holders certain additional rights, shares obtainable upon exercise of the Creditor Warrants are subject to a proportionate adjustment in the event the Company executes any of the following actions:
| • | Issues shares of common stock, options or convertible securities for an amount per share below the then-current market price; |
| • | Repurchases shares of common stock above the then-current market price; |
| • | Effects a subdivision of the outstanding shares of common stock into a greater number of shares; |
| • | Effects a combination of the outstanding shares of common stock into a smaller number of shares; or |
| • | Issues a dividend or distribution in shares of common stock, cash or property to stockholders. |
In the event of an adjustment to the number of shares pursuant to the above, the exercise price of the Creditor Warrants will be adjusted by a proportionate amount. Furthermore, if the terms of any option or convertible security: (i) that resulted in an adjustment pursuant to the first bulleted item above are revised, the number of shares issuable upon exercise of the Creditor Warrants will be readjusted to the number of shares that would have been obtainable had such revised terms been in effect upon the original issuance date of such option or convertible security; (ii) that did not result in an adjustment pursuant to the first bulleted item above are revised such that the consideration per share is less than the then-current market price of common stock, the number of shares issuable upon exercise of the Creditor Warrants will be adjusted to the number of shares that would have been obtainable had such revised terms been in effect upon the original issuance date of such option or convertible security. Based on the above anti-dilution provisions, the Creditor Warrants are classified as liabilities pursuant to ASC 815, Derivatives and Hedging, as of December 31, 2023 and 2022.
There were no exercises of Creditor Warrants during the years ended December 31, 2023, 2022 and 2021.
The following table reflects the Creditor Warrants measured at fair value on a recurring basis as of December 31, 2023 and 2022 (in thousands):
| December 31, 2023 | ||||||||||||||||
| Level 1 | Level 2 | Level 3 | Total | |||||||||||||
| Liability-classified warrants |
$ | — | $ | — | $ | 75,475 | $ | 75,475 | ||||||||
|
|
|
|
|
|
|
|
|
|||||||||
| Liabilities at fair value |
$ | — | $ | — | $ | 75,475 | $ | 75,475 | ||||||||
|
|
|
|
|
|
|
|
|
|||||||||
| December 31, 2022 | ||||||||||||||||
| Level 1 | Level 2 | Level 3 | Total | |||||||||||||
| Liability-classified warrants |
$ | — | $ | — | $ | 64,558 | $ | 64,558 | ||||||||
|
|
|
|
|
|
|
|
|
|||||||||
| Liabilities at fair value |
$ | — | $ | — | $ | 64,558 | $ | 64,558 | ||||||||
|
|
|
|
|
|
|
|
|
|||||||||
To estimate the fair value of the Creditor Warrants, the Company uses a Black-Scholes model, which utilizes the following input assumptions at the applicable valuation date: (i) the current estimated fair value of the underlying common stock based on a controlling interest equity valuation, (ii) the exercise price, (iii) the contractual expiry term, (iv) an estimated equity volatility based on the historical asset and equity volatilities of comparable publicly traded companies, (v) a term-matched risk-free rate based on the U.S. Treasury separate trading of registered interest and principal securities (STRIPS) yield, and (vi) an expected dividend yield. The Company, assisted by third-party valuation experts, estimated the fair value of the underlying common stock using the income approach and the market approach with each equally weighted. The income approach involved the use of various judgmental assumptions including the use of prospective financial information, the weighted-average cost of capital and an exit multiple. The fair value of the Creditor Warrants falls within Level 3 of the hierarchy as there is currently no active trading market and certain inputs of the Black-Scholes model are not observable or corroborated by available market data.
F-40
The inputs to the Black-Scholes model utilized for the valuation of the Creditor Warrants at December 31, 2023 and 2022 are as follows:
| December 31, | ||||||||
| 2023 | 2022 | |||||||
| Fair value per share of the underlying common stock |
$ | 67.23 | $ | 55.53 | ||||
| Warrant exercise price |
27.83 | 27.83 | ||||||
| Remaining contractual term (years) |
3.68 | 4.68 | ||||||
| Expected volatility |
60 | % | 70 | % | ||||
| Risk-free rate |
3.91 | % | 3.95 | % | ||||
| Expected dividend yield |
0 | % | 0 | % | ||||
The estimated fair value of the Creditor Warrants was determined to be $75.5 million, or $47.40 per warrant, as of December 31, 2023, representing an increase in value since their original issuance on September 4, 2020 of approximately $67.3 million, or $42.24 per warrant.
The following table summarizes the change in fair value of the liability-classified warrants for the years ended December 31, 2023, 2022 and 2021 (in thousands):
| December 31, | ||||||||||||
| 2023 | 2022 | 2021 | ||||||||||
| Beginning balance |
$ | 64,558 | $ | 23,150 | $ | 7,794 | ||||||
| Issuances |
— | — | 206 | |||||||||
| Revaluations included in earnings, net |
10,917 | 41,408 | 15,150 | |||||||||
| Exercises |
— | — | — | |||||||||
| Forfeitures/expirations |
— | — | — | |||||||||
|
|
|
|
|
|
|
|||||||
| Ending balance |
$ | 75,475 | $ | 64,558 | $ | 23,150 | ||||||
|
|
|
|
|
|
|
|||||||
12. Stockholders’ Equity
Common Stock
The Company is authorized to issue up to 50,000,000 shares of common stock, $0.00001 par value per share. As of December 31, 2023 and 2022, the Company had issued and outstanding common shares totaling 5.6 million and 5.4 million, respectively.
Preemptive Rights Offering
On December 22, 2021, the Company concluded a preemptive rights offering of equity to certain eligible stockholders and Jones Act Warrant holders. As a result, the Company received gross cash proceeds of $20.0 million and converted $15.0 million in the aggregate principal amount of the Second Lien Term Loans in lieu of cash for the issuance of 182,987 shares of common stock and 1.6 million Jones Act Warrants at a purchase price of $20.00 per share or warrant. The Company incurred $0.9 million in direct incremental issuance costs that were recorded as a reduction of additional paid-in capital.
Stock Purchase Plan
On November 29, 2021, the Company established the Stock Purchase Plan, or SPP, to promote investment in the Company by directors and executives and to advance the interests of the Company and its stockholders by attracting, retaining and motivating key personnel. Concurrent with the closing of the preemptive rights offering on December 22, 2021, the Company issued 100,745 shares of common stock under the SPP for gross cash proceeds of $2.0 million.
F-41
Jones Act Warrants
The Jones Act, which applies to companies that engage in U.S. coastwise trade, requires that, among other things, the aggregate ownership of common stock by non-U.S. citizens be not more than 25% of the Company’s outstanding common stock. On September 4, 2020, in order to comply with the Jones Act, the Company entered into the Jones Act Warrant Agreement, pursuant to which the Company issued 10.5 million Jones Act Warrants to eligible non-U.S. citizens in settlement of certain prepetition liabilities and in connection with an equity rights offering. As part of a preemptive rights offering, the Company issued an additional 1.6 million Jones Act Warrants on December 22, 2021. As of December 31, 2023, holders of the Jones Act Warrants are entitled to acquire up to 11.4 million shares of common stock in the aggregate at an exercise price of $0.00001 per share, subject to the U.S. citizen determination procedures and adjustment as described in the Jones Act Warrant Agreement. There were no exercises of Jones Act Warrants during the year ended December 31, 2023 and 734,340 of such exercises during the year ended December 31, 2022.
On December 31, 2020, the Jones Act Warrant Agreement was amended to remove certain anti-dilution provisions. As a result, the Jones Act Warrants are effectively indexed to the Company’s common stock and are thus classified as stockholders’ equity at their fair value on the date of the amendment for then-outstanding warrants or on the date of issuance for all subsequent issuances, which totaled $131.5 million as of December 31, 2023 and 2022.
13. Stock-Based Compensation
Incentive Compensation Plan
The Company’s 2020 Management Incentive Plan, or MIP, provides for the issuance of a maximum of 2.2 million shares of common stock for the Company to grant as incentive awards in the form of stock options, stock appreciation rights, restricted stock units, restricted stock and other stock-based and cash-based awards to certain eligible individuals. As of December 31, 2023, there were 2.1 million shares reserved for issuance related to granted awards and 0.1 million shares available for future grants to eligible individuals under the MIP.
The financial impact of stock-based compensation expense related to the MIP on its operating results is reflected in the table below (in thousands, except for per share data):
| Year Ended December 31, | ||||||||||||
| 2023 | 2022 | 2021 | ||||||||||
| Income before taxes |
$ | 19,097 | $ | 5,330 | $ | 3,372 | ||||||
|
|
|
|
|
|
|
|||||||
| Net income |
$ | 15,637 | $ | 4,895 | $ | 2,228 | ||||||
|
|
|
|
|
|
|
|||||||
| Earnings per common share: |
||||||||||||
| Basic |
$ | 0.92 | $ | 0.29 | $ | 0.15 | ||||||
|
|
|
|
|
|
|
|||||||
| Diluted |
$ | 0.82 | $ | 0.27 | $ | 0.14 | ||||||
|
|
|
|
|
|
|
|||||||
Restricted Stock Units
The MIP allows the Company to issue restricted stock units with either time-based or market-based vesting provisions. As of December 31, 2023, the Company had granted both types of restricted stock unit awards. The time-based restricted stock unit awards that were granted generally vest over a three-year period for employees and a one-year period for directors. Compensation expense related to time-based restricted stock unit awards, which is amortized over the applicable one- to three-year vesting period, is determined based on the fair value of the Company’s common stock on the date of grant applied to the total shares that are expected to fully vest. The market-based restricted stock unit awards that were granted vest based on the Company’s achievement of certain levels of total enterprise value as of the applicable vesting date. These market-based conditions will be measured
F-42
at the earliest to occur of (a) September 4, 2027, the seventh anniversary of the grant date, (b) an initial public offering of the Company’s common stock, and (c) a change in control of the Company, in accordance with the MIP and the underlying grant agreement. The actual number of shares that could be received by an award recipient upon settlement can range from 0% to 100% of the award depending on the actual level of total enterprise value attained by the Company on the applicable measurement date. Compensation expense related to market-based restricted stock unit awards is recognized over the period the restrictions lapse based on the fair value of the awards on the grant date applied to the shares that are expected to vest. The outstanding market-based awards are currently being amortized over an approximate five-year period that commenced on their grant date in June 2022.
The Company utilizes the Black-Scholes model to determine the fair value of the market-based restricted stock units. The Black-Scholes model is affected by the fair value of the Company’s common stock, the market-based vesting thresholds, and certain other assumptions, including contractual term, volatility, risk-free interest rate and expected dividends. The Company does not have a history of market prices of its privately-held common stock, and as such volatility is estimated using historical volatilities of similar public entities. The risk-free interest rate assumption is based on observed interest rates appropriate for the terms of the awards. The dividend yield assumption is based on the Company’s history and current expectation of paying no dividends.
As of December 31, 2023, the Company has unamortized stock-based compensation expense of $13.2 million related to the time-based and market-based restricted stock units, which will be recognized on a straight-line basis over the remaining weighted-average vesting period, or 1.8 years. The Company has recorded approximately $18.7 million, $5.0 million and $3.0 million of non-cash incentive compensation expense for the years ended December 31, 2023, 2022 and 2021, respectively, associated with restricted stock unit awards. In 2023, $0.3 million of stock-based compensation expense related to restricted stock awards redeemable in cash was recorded to other accrued liabilities on the consolidated balance sheet.
The following table summarizes the Company’s restricted stock unit awards activity during the year ended December 31, 2023 (in thousands, except per share data):
| Number of Shares | Weighted Avg. Fair Value Per Share |
|||||||
| Restricted stock unit awards as of January 1, 2023 |
1,065 | $ | 18.80 | |||||
| Granted during the period |
393 | 53.90 | ||||||
| Cancellations during the period |
— | — | ||||||
| Vested and settled during the period |
(265 | ) | 51.08 | |||||
|
|
|
|||||||
| Outstanding, as of December 31, 2023 |
1,193 | $ | 23.20 | |||||
|
|
|
|||||||
The following table summarizes the Company’s restricted stock unit awards activity during the year ended December 31, 2022 (in thousands, except per share data):
| Number of Shares | Weighted Avg. Fair Value Per Share |
|||||||
| Restricted stock unit awards as of January 1, 2022 |
724 | $ | 10.11 | |||||
| Granted during the period (1) |
341 | 37.24 | ||||||
| Cancellations during the period |
— | — | ||||||
| Vested and settled during the period |
— | — | ||||||
|
|
|
|||||||
| Outstanding, as of December 31, 2022 |
1,065 | $ | 18.80 | |||||
|
|
|
|||||||
| (1) | Comprised of 205 shares at a fair value of $42.97 per share and three tranches of 136 shares, in the aggregate, at a weighted- average fair value of $28.56 per share granted on June 9, 2022. |
F-43
Stock Options
The Company is authorized to grant stock options under the MIP that have an exercise price no less than 100% of the fair market value of the Company’s common stock on the date of grant and expire ten years after the date of grant. The Company has granted stock options that are subject to both time-based and market-based vesting provisions. The outstanding stock options were subject to a three-year time-vest condition that commenced on their grant date in September 2020. The market-based vesting provision requires the Company to achieve certain levels of total enterprise value and will be measured at the earliest to occur of (a) September 4, 2027, the seventh anniversary of the grant date, (b) an initial public offering of the Company’s common stock, and (c) a change in control of the Company, in accordance with the MIP and the underlying grant agreement. The actual number of stock options that could be received by an award recipient can range from 0% to 100% of the award depending on the actual level of total enterprise value attained by the Company on the applicable measurement date. Vesting is generally subject to the grantee’s continued employment through the applicable vesting date.
The Company utilizes the Black-Scholes model to determine the fair value of the stock options. The Black-Scholes model is affected by the fair value of the Company’s common stock, the time-based or market-based vesting thresholds, and certain other assumptions, including contractual term, volatility, risk-free interest rate and expected dividends. The Company does not have a history of market prices of its privately-held common stock, and as such volatility is estimated using historical volatilities of similar public entities. The risk-free interest rate assumption is based on observed interest rates appropriate for the terms of the awards. The dividend yield assumption is based on the Company’s history and current expectation of paying no dividends.
As of December 31, 2023, the Company has unamortized stock-based compensation expense of $1.3 million related to such stock options, which will be recognized on a straight-line basis over the remaining vesting period, or 3.5 years. The Company has recorded approximately $0.4 million of non-cash incentive compensation expense for each of the years ended December 31, 2023, 2022 and 2021, associated with stock options.
The following table represents the Company’s stock option activity for the year ended December 31, 2023 (in thousands, except per share data and years):
| Number of Shares |
Weighted Average Exercise Price |
Weighted- Average Remaining Contractual Term (years) |
Aggregate Intrinsic Value |
|||||||||||||
| Stock options outstanding at January 1, 2023 |
598 | $ | 10.00 | 7.7 | $ | 27,227 | ||||||||||
| Grants |
— | — | — | — | ||||||||||||
| Exercised |
— | — | — | — | ||||||||||||
| Forfeited or expired |
— | — | n/a | n/a | ||||||||||||
|
|
|
|||||||||||||||
| Stock options outstanding at December 31, 2023 |
598 | $ | 10.00 | 6.7 | $ | 34,224 | ||||||||||
|
|
|
|||||||||||||||
| Exercisable stock options outstanding at December 31, 2023 |
— | $ | — | — | $ | — | ||||||||||
|
|
|
|||||||||||||||
F-44
The following table represents the Company’s stock option activity for the year ended December 31, 2022 (in thousands, except per share data and years):
| Number of Shares |
Weighted Average Exercise Price |
Weighted- Average Remaining Contractual Term (years) |
Aggregate Intrinsic Value |
|||||||||||||
| Stock options outstanding at January 1, 2022 |
598 | $ | 10.00 | 8.7 | $ | 8,821 | ||||||||||
| Grants |
— | — | — | — | ||||||||||||
| Exercised |
— | — | — | — | ||||||||||||
| Forfeited or expired |
— | — | n/a | n/a | ||||||||||||
|
|
|
|||||||||||||||
| Stock options outstanding at December 31, 2022 |
598 | $ | 10.00 | 7.7 | $ | 27,227 | ||||||||||
|
|
|
|||||||||||||||
| Exercisable stock options outstanding at December 31, 2022 |
— | $ | — | — | $ | — | ||||||||||
|
|
|
|||||||||||||||
| 14. | Income Taxes |
The net long-term deferred tax liabilities in the accompanying consolidated balance sheets include the following components (in thousands):
| Year Ended December 31, | ||||||||
| 2023 | 2022 | |||||||
| Deferred tax liabilities: |
||||||||
| Deferred charges and other liabilities |
$ | 8,081 | $ | 1,117 | ||||
|
|
|
|
|
|||||
| Total deferred tax liabilities |
8,081 | 1,117 | ||||||
| Deferred tax assets: |
||||||||
| Fixed assets |
(13,572 | ) | (73,122 | ) | ||||
| Net operating loss carryforwards |
(93,865 | ) | (87,959 | ) | ||||
| Allowance for doubtful accounts |
(1,818 | ) | (798 | ) | ||||
| Stock-based compensation expense |
(3,577 | ) | (2,316 | ) | ||||
| Tax original issue discount and restructuring costs |
(7,396 | ) | (10,037 | ) | ||||
| Right-of-use liability |
(69,397 | ) | (23,063 | ) | ||||
| Foreign tax credit carryforward |
(31,423 | ) | (17,126 | ) | ||||
| Interest expense limitation |
(34,882 | ) | (26,426 | ) | ||||
| Other |
(14,751 | ) | (6,562 | ) | ||||
|
|
|
|
|
|||||
| Total deferred tax assets |
(270,681 | ) | (247,409 | ) | ||||
| Valuation allowance |
264,596 | 246,395 | ||||||
|
|
|
|
|
|||||
| Total deferred tax liabilities, net |
$ | 1,996 | $ | 103 | ||||
|
|
|
|
|
|||||
F-45
The components of the income tax expense (benefit) in the accompanying consolidated statements of operations were as follows (in thousands):
| Year Ended December 31, | ||||||||||||
| 2023 | 2022 | 2021 | ||||||||||
| Current tax expense (benefit): |
||||||||||||
| U.S.—federal and state |
$ | 33 | $ | — | $ | — | ||||||
| Foreign |
15,122 | 7,119 | 1,519 | |||||||||
|
|
|
|
|
|
|
|||||||
| Current tax expense (benefit) |
15,155 | 7,119 | 1,519 | |||||||||
| Deferred tax expense (benefit): |
||||||||||||
| U.S.—federal and state |
1,340 | 55 | 14 | |||||||||
| Foreign |
— | — | — | |||||||||
|
|
|
|
|
|
|
|||||||
| Deferred tax expense (benefit) |
1,340 | 55 | 14 | |||||||||
|
|
|
|
|
|
|
|||||||
| Total tax expense (benefit) |
$ | 16,495 | $ | 7,174 | $ | 1,533 | ||||||
|
|
|
|
|
|
|
|||||||
Income (loss) from operations before income taxes, based on jurisdiction earned, was as follows (in thousands):
| For The Year Ended December 31, | ||||||||||||
| 2023 | 2022 | 2021 | ||||||||||
| U.S. |
$ | 65,022 | $ | 73,563 | $ | 6,707 | ||||||
| Foreign |
26,011 | 14,373 | (2,187 | ) | ||||||||
|
|
|
|
|
|
|
|||||||
| Total income from operations before income taxes |
$ | 91,033 | $ | 87,936 | $ | 4,520 | ||||||
|
|
|
|
|
|
|
|||||||
As of December 31, 2023, the Company had net operating loss carryforwards, or NOLs, which can only be utilized if the Company generates taxable income in the respective tax jurisdiction prior to their expiration. The following table represents the Company’s NOLs (in thousands):
| Jurisdiction | December 31, 2023 | Expiration Years | ||||||
| United States—federal (1) |
$ | 264,819 | None | |||||
| U.S. states |
79,826 | None | ||||||
| Mexico |
52,308 | 2027-2033 | ||||||
| Brazil (2) |
13,767 | None | ||||||
| Trinidad |
39,646 | None | ||||||
| (1) | This total includes $5.9 million of NOLs that expire between 2031 and 2033. |
| (2) | NOLs in Brazil can only be used to offset up to 30% of taxable income each year. |
The Company also has foreign tax credit carryforwards of approximately $30.0 million, which if not utilized will expire in 2024 through 2033.
IRC Sections 382 and 383 provide an annual limitation with respect to the ability of a corporation to utilize its tax attributes against future U.S. taxable income in the event of a change in ownership of more than 50%. The Company had a change in ownership during 2020 for purposes of IRC Sections 382 and 383, causing an annual limitation to apply to $66.5 million of U.S. federal NOLs. These federal NOLs, as well as other tax attributes such as U.S. state NOLs or foreign tax credit carryforwards, could expire if unused due to the applicable annual limitations.
In recording a valuation allowance with respect to such NOLs and foreign tax credits, the Company assessed the favorable and unfavorable evidence to estimate whether sufficient future taxable income will be generated to
F-46
permit use of the existing deferred tax assets. A significant piece of the unfavorable evidence evaluated during the fourth quarter of 2022 was the cumulative pre-tax loss that was incurred over the three-year period ended December 31, 2022. Such objective evidence limits the ability to consider other subjective evidence, such as the Company’s projections of future earnings. As of December 31, 2023, the Company is no longer in a cumulative pre-tax loss position. However, the Company has concluded that it is proper to provide valuation allowances against most of its deferred tax assets, as significant unfavorable evidence currently outweighs positive evidence. Positive evidence of an improving market and increasing dayrates currently does not outweigh unfavorable evidence such as the Section 382 and 383 limitations on tax attributes, possible tax legislation allowing for accelerated tax deductions and potential incremental tax losses, entering new markets with increased operational risks, and the inherent volatility and unpredictability of taxable income forecasts associated with the oil and gas industry. As of December 31, 2023 and 2022, the Company had valuation allowances of $264.6 million and $246.4 million, respectively.
The Company is no longer subject to tax audits by federal, state or local taxing authorities for years prior to 2019. The Company has ongoing examinations by various foreign tax authorities, but does not believe that the results of these examinations will have a material adverse effect on the Company’s financial position or results of operations.
The following table reconciles the difference between the Company’s income tax provision calculated at the federal statutory rate of 21% and the actual income tax provision (in thousands):
| For The Year Ended December 31, | ||||||||||||
| 2023 | 2022 | 2021 | ||||||||||
| U.S. federal statutory rate |
$ | 19,117 | $ | 18,466 | $ | 950 | ||||||
| U.S. state taxes, net |
1,548 | 1,495 | 45 | |||||||||
| Non-deductible expense |
3,137 | 9,570 | 3,512 | |||||||||
| Change in valuation allowance |
(5,852 | ) | (23,357 | ) | 3,275 | |||||||
| Remeasurement of deferred taxes |
— | (757 | ) | (1,731 | ) | |||||||
| Return to accrual |
(464 | ) | 256 | (4,368 | ) | |||||||
| Uncertain tax positions |
(189 | ) | 571 | (61 | ) | |||||||
| Foreign taxes and other |
(802 | ) | 930 | (89 | ) | |||||||
|
|
|
|
|
|
|
|||||||
| $ | 16,495 | $ | 7,174 | $ | 1,533 | |||||||
|
|
|
|
|
|
|
|||||||
The Company records U.S. federal and state deferred taxes using a blended tax rate of 22.7%. During 2021, the Company recorded a $1.7 million deferred tax benefit due to a Louisiana law change that disallows a state deduction for federal income taxes. During 2022, the Company revalued its Louisiana net operating losses to reflect new tax rates effective for 2022.
A reconciliation of the beginning and ending amount of all unrecognized tax benefits and the liability for uncertain tax positions, excluding related penalties and interest(1), are as follows (in thousands):
| Balance at December 31, 2021 |
$ | 1,027 | ||
| Additions based on tax positions related to the current year |
571 | |||
| Reductions, net based on tax positions related to a prior year |
(68 | ) | ||
|
|
|
|||
| Balance at December 31, 2022 |
1,530 | |||
| Reductions, net based on tax positions related to a prior year |
(189 | ) | ||
|
|
|
|||
| Balance at December 31, 2023 |
$ | 1,341 | ||
|
|
|
| (1) | Penalties and interest of $0.5 million and $1.2 million were recorded in the consolidated statements of operations for uncertain tax positions for the years ended December 31, 2023 and 2021, respectively. There |
F-47
| were no such amounts recorded in 2022. As of December 31, 2023 and 2022, the cumulative amount of penalties and interest related to uncertain tax positions reflected in the consolidated balance sheets totaled $1.7 million and $1.2 million, respectively. |
15. Leases
Lease expenses for operating leases are recorded in general and administrative and operating expenses. Lease expenses for finance leases are recorded in amortization and interest expense. Total lease expenses incurred for operating and finance leases were as follows (in thousands):
| Year Ended December 31, | ||||||||||||
| 2023 | 2022 | 2021 | ||||||||||
| Finance lease expense: |
||||||||||||
| Amortization of right-of-use assets |
$ | 372 | $ | 274 | $ | 131 | ||||||
| Interest on lease liabilities |
45 | 32 | 16 | |||||||||
| Operating lease expense |
7,241 | 3,591 | 3,118 | |||||||||
| Short-term lease expense |
2,869 | 843 | 838 | |||||||||
|
|
|
|
|
|
|
|||||||
| Total lease expense |
$ | 10,527 | $ | 4,740 | $ | 4,103 | ||||||
|
|
|
|
|
|
|
|||||||
Cash paid for amounts included in the measurement of lease liabilities was as follows (in thousands):
| Year Ended December 31, | ||||||||||||
| 2023 | 2022 | 2021 | ||||||||||
| Operating cash flows from operating leases |
$ | 7,012 | $ | 3,042 | $ | 2,679 | ||||||
| Operating cash flows from financing leases |
45 | 40 | 202 | |||||||||
| Financing cash flows from financing leases |
287 | 200 | 96 | |||||||||
Annual maturities of operating and finance lease liabilities under non-cancelable leases with terms in excess of one year, during each year ending December 31, are as follows (in thousands):
| Operating | Finance | |||||||
| 2024 |
$ | 5,309 | $ | 354 | ||||
| 2025 |
3,424 | 247 | ||||||
| 2026 |
3,474 | 127 | ||||||
| 2027 |
3,365 | 28 | ||||||
| 2028 |
3,298 | — | ||||||
| Thereafter |
17,457 | — | ||||||
|
|
|
|
|
|||||
| Total lease payments |
36,327 | 756 | ||||||
| Less: imputed interest |
10,922 | 63 | ||||||
|
|
|
|
|
|||||
| Total lease liabilities |
$ | 25,405 | $ | 693 | ||||
|
|
|
|
|
|||||
| Weighted-average remaining lease term (in years) |
8.65 | 2.36 | ||||||
| Weighted-average discount rate |
8.4 | % | 6.4 | % | ||||
16. Commitments and Contingencies
Vessel Construction
In October 2023, the Company entered into a final settlement agreement with Zurich American Insurance Company and Fidelity & Deposit Company of Maryland, together the Surety, and Gulf Island. Pursuant to the settlement agreement, the Surety agreed to take over and complete the construction of the two U.S.-flagged,
F-48
Jones Act-qualified, HOS 400 class MPSVs at a shipyard acceptable to the Company. Gulf Island released all claims asserted against the Company and the Company released its claims against Gulf Island and the Surety. The Company is obligated to pay only the remaining portion of the original shipyard contract price for the two MPSVs, which amounts to $53.8 million in the aggregate. The Surety is required to cure all defaults of Gulf Island and pay all completion costs in excess of the $53.8 million remaining contract price, excluding approved change orders. In addition, the Company is currently exploring discretionary post-delivery enhancements to add, among other things, secondary cranes to both vessels. On December 20, 2023, Eastern Shipbuilding Group, Inc. was contracted by the Surety to complete the construction of the two MPSVs. Pursuant to the settlement, the Surety is required to deliver both MPSVs in 2025.
Contingencies
In the normal course of its business, the Company becomes involved in various claims and legal proceedings in which monetary damages are sought. It is management’s opinion that the Company’s liability, if any, under such claims or proceedings would not materially affect the Company’s financial position or results of operations. The Company insures against losses relating to its vessels, pollution and third party liabilities, including claims by employees under Section 33 of the Merchant Marine Act of 1920. Third party liabilities and pollution claims that relate to vessel operations are covered by the Company’s entry in a mutual protection and indemnity association, or P&I Club, as well as by marine liability policies in excess of the P&I Club’s coverage. The Company provides reserves for any individual claim deductibles for which the Company remains responsible by using an estimation process that considers Company-specific and industry data, as well as management’s experience, assumptions and consultation with outside counsel. As additional information becomes available, the Company will assess the potential liability related to its pending claims and revise its estimates. Although historically revisions to such estimates have not been material, changes in estimates of the potential liability could materially impact the Company’s results of operations, financial position or cash flows. The Company had accrued $0.5 million and $0.8 million for potential insurance deductibles or losses associated with such claims as of December 31, 2023 and 2022, respectively.
Mexico Tax Audits
The Company is subject to audit by various Mexican statutory bodies, including the Mexican tax authorities, or SAT. In November 2018, SAT commenced an audit of a Mexican subsidiary’s 2015 tax return and asserted certain positions that disallowed a significant portion of the Company’s deductible expenses, which resulted in additional taxes, interest and penalties being assessed. As a result, the Company engaged in non-binding mediation proceedings, which concluded in 2021 without resolution. In April 2022, the Company received an official assessment from SAT and initiated an appeal process in June 2022 through the Mexican tax judicial system. As of December 31, 2023, the Company accrued a liability totaling $2.9 million for potential losses from additional taxes, interest and penalties resulting from this assessment based upon estimates developed in collaboration with its Mexican tax advisors for the ongoing 2015 audit and appeal. The Company believes it has properly applied the applicable tax laws and has reasonably supported its positions. The ultimate impact resulting from the 2015 tax assessment and appeal process may materially differ from the current estimates. The Company will continue to update its estimates as new information warrants.
Brazil Importation Tax Assessment
In April 2021, the Company received notification from the Brazilian tax authorities of an importation tax assessment against the HOS Achiever with respect to the vessel’s services contract in Brazil from February 2019 to January 2020. At the time of the HOS Achiever’s importation, the Company was granted a statutorily available tax exemption based on the vessel’s functional capabilities and intended use under the services contract. The tax authorities are now asserting that the HOS Achiever does not qualify for the applicable exemption. The Company believes the HOS Achiever does, in fact, meet the criteria set forth under the applicable law and intends to defend its position in Brazilian court. While the final outcome of this assessment is uncertain and could possibly result in
F-49
the payment and loss of an estimated $6.0 million to $10.0 million in related importation taxes and penalties, the Company believes there is a high likelihood that its position will prevail and the exemption will be granted in accordance with the law. Furthermore, the Company believes that any amounts that may become due in connection with this matter should be recoverable from its customer under the terms of the vessel’s services contract.
17. Major Customers
In the years ended December 31, 2023, 2022, and 2021, revenues from the following customers represented 10% or more of consolidated revenues:
| Year Ended December 31, |
||||||||||||
| 2023 | 2022 | 2021 | ||||||||||
| Customer A |
20 | % | 16 | % | |
n/a |
(1) | |||||
| Customer B |
16 | % | 15 | % | 21 | % | ||||||
| (1) | Customer represented less than 10% of consolidated revenues in such year. |
18. Employment Agreements
The Company is party to employment agreements with certain members of its executive management team. These agreements include, among other things, contractually stated base salaries and a structured cash short-term incentive compensation program dependent upon performance against reasonably obtainable objective performance criteria established by the Compensation Committee. In the event such a member of the executive management team is terminated due to certain events as defined in such officer’s agreement, the executive will receive (i) the executive’s accrued base salary through the date of the executive’s termination, (ii) payment in lieu of any earned, but unused, vacation, and (iii) reimbursement of the executive’s expenses in accordance with the Company’s reimbursement policy as in effect from time to time. In addition, the executive may receive cash severance depending on the timing and circumstances of the termination. The current term of these employment agreements expires on September 4, 2024 and automatically extends each year thereafter on September 4th for an additional year.
19. Related Parties
Pursuant to the terms of the Trade Name and Trademark License Agreement entered into by and between the Company and HFR, LLC, the Company made payments of $2.0 million and $1.0 million in 2023 and 2022, respectively, for licensing fees associated with the use of Hornbeck trade names, trademarks, and related logos. HFR, LLC is a Texas Limited Liability Company owned by Todd M. Hornbeck and Troy A. Hornbeck. Todd M. Hornbeck serves as the Company’s Chairman of the Board of Directors, President and Chief Executive Officer. Troy A. Hornbeck is the brother of Todd M. Hornbeck and serves as the Company’s Purchasing Director. As of December 31, 2023 and 2022, the Company had accrued amounts payable to HFR, LLC totaling $1.3 million and $1.3 million, respectively.
On October 1, 2022, a member of the Company’s Board of Directors, assumed an officer role with an existing Hornbeck customer. For the years ended December 31, 2023 and 2022, the Company generated $111.9 million and $74.0 million of revenues, respectively, from contracts with such customer, which accounted for approximately 20% and 16% of the Company’s total revenues, respectively. The Company had outstanding trade accounts receivable from this customer totaling $8.0 million and $12.3 million as of December 31, 2023 and 2022, respectively.
20. Subsequent Events
The Company has evaluated subsequent events through March 14, 2024, which represents the date its financial statements were available to be issued and determined that all materially relevant information known through this date was appropriately addressed within the financial statements and notes herein.
F-50
Shares
Hornbeck Offshore Services, Inc.
Common Stock
Prospectus
, 2024
J.P. Morgan
Barclays
Goldman Sachs
DNB Markets
Piper Sandler
Guggenheim Securities
Raymond James
BTIG
Johnson Rice & Company
Pickering Energy Partners
Seaport Global Securities
Academy Securities
Drexel Hamilton
PART II
INFORMATION NOT REQUIRED IN PROSPECTUS
Item 13. Other Expenses of Issuance and Distribution.
The following table sets forth the expenses payable by Hornbeck Offshore Services, Inc. expected to be incurred in connection with the issuance and distribution of common stock being registered hereby (other than underwriting discounts and commissions). All of such expenses are estimates, except for the Securities and Exchange Commission, or the SEC, registration fee, the Financial Industry Regulatory Authority, or FINRA, filing fee and listing fee.
| SEC registration fee |
* | |||
| FINRA filing fee |
* | |||
| Listing fee |
* | |||
| Printing fees and expenses |
* | |||
| Legal fees and expenses |
* | |||
| Blue sky fees and expenses |
* | |||
| Registrar and transfer agent fees |
* | |||
| Accounting fees and expenses |
* | |||
| Miscellaneous expenses |
* | |||
|
|
|
|||
| Total |
$ * | |||
|
|
|
| * | To be completed by amendment. |
Item 14. Indemnification of Directors and Officers.
Section 145 of the DGCL provides that a corporation may indemnify directors and officers as well as other employees and individuals against expenses (including attorneys’ fees), judgments, fines and amounts paid in settlement in connection with any threatened, pending or completed action, suit or proceeding, whether civil, criminal, administrative or investigative, in which such person is made a party by reason of the fact that the person is or was a director, officer, employee or agent of the corporation (other than an action by or in the right of the corporation—a “derivative action”), if such person acted in good faith and in a manner such person reasonably believed to be in or not opposed to the best interests of the corporation and, with respect to any criminal action or proceeding, had no reasonable cause to believe such person’s conduct was unlawful. A similar standard is applicable in the case of derivative actions, except that indemnification only extends to expenses (including attorneys’ fees) incurred in connection with the defense or settlement of such action, and the statute requires court approval before there can be any indemnification where the person seeking indemnification has been found liable to the corporation. The statute provides that it is not exclusive of other indemnification that may be granted by a corporation’s bylaws, disinterested director vote, stockholder vote, agreement or otherwise.
Our amended and restated certificate of incorporation provides that no director or officer shall be liable to us or our stockholders for monetary damages for breach of fiduciary duty as a director or officer, as applicable, except to the extent such exemption from liability or limitation on liability is not permitted under the DGCL, as now in effect or as amended. Currently, Section 102(b)(7) of the DGCL requires that liability be imposed for the following:
| • | any breach of the director’s or officer’s duty of loyalty to our company or our stockholders; |
| • | any act or omission not in good faith or which involved intentional misconduct or a knowing violation of law; |
| • | unlawful payments of dividends or unlawful stock repurchases or redemptions as provided in Section 174 of the DGCL; |
| • | any transaction from which the director or officer derived an improper personal benefit; |
| • | with respect to the officer, any derivative action. |
II-1
Our amended and restated charter provides that, to the fullest extent authorized or permitted by the DGCL, as now in effect or as amended, we will indemnify any person who was or is a party or is threatened to be made a party to or is otherwise involved (including involvement, without limitation, as a witness) in any actual or threatened action, suit or proceeding by reason of the fact that such person is or was our director, advisory director, board observer or officer, or by reason of the fact that our director, advisory director, board observer or officer is or was serving, at our request, as a director, advisory director, board observer, officer, employee or agent of another corporation or of a partnership, joint venture, trust or other enterprise, including service with respect to employee benefit plans. We will indemnify such persons against expenses, liabilities, and loss (including attorneys’ fees and related disbursements, judgments, fines, excise taxes or penalties under the Employee Retirement Income Security Act of 1974, penalties and amounts paid in settlement) reasonably incurred or suffered in connection with such action.
We have obtained policies that insure our directors and officers and those of our subsidiaries against certain liabilities they may incur in their capacity as directors and officers. Under these policies, the insurer, on our behalf, may also pay amounts for which we have granted indemnification to the directors or officers.
The underwriting agreement provides for indemnification by the underwriters of us and our officers and directors, and by us of the underwriters, for certain liabilities arising under the Securities Act or otherwise in connection with this offering.
Item 15. Recent Sales of Unregistered Securities.
Service-Related Issuances
The Company has issued 255,925 shares of common stock pursuant to the 2020 Management Incentive Plan. Additionally, since the Chapter 11 Cases, and prior to March 23, 2023, the Company has granted 597,804 stock options and 1,065,254 restricted stock units pursuant to the 2020 Management Incentive Plan.
Further, (i) on March 23, 2023, the Board of Directors granted certain employees and directors additional restricted stock unit awards pursuant to the 2020 Management Incentive Plan, of which 196,704 shares of common stock vested immediately and an additional 196,703 shares will vest pursuant to the terms of the respective award agreements, and (ii) on April 1, 2024 the Board of Directors granted certain directors additional restricted stock unit awards pursuant to the 2020 Management Incentive Plan, of which 5,590 shares of common stock vested immediately and an additional 5,585 shares will vest pursuant to the terms of the respective award agreements. These shares will net-settle within 60 days of the date of vesting.
The foregoing issuances were exempt from registration under Section 4(a)(2) of the Securities Act.
Additional Issuances of Securities
On December 22, 2021, the Company issued 283,732 shares of common stock and 1,567,013 Jones Act Warrants in a preemptive rights offering relating to the conversion of $15 million of outstanding indebtedness on December 22, 2021. Concurrent with the closing of the preemptive rights offering on December 22, 2021, the Company issued 100,745 shares of common stock under a Stock Purchase Plan that was established on November 29, 2021 for gross cash proceeds of $2.0 million.
The foregoing issuances were exempt from registration under Section 1145 of the Bankruptcy Code or Section 4(a)(2) of the Securities Act.
II-2
Item 16. Exhibits and Financial Statement Schedules.
II-3
| * | Previously filed. |
| ** | To be included by amendment. |
| † | Compensatory plan or arrangement. |
II-4
| ^ | Certain of the exhibits or schedules to this Exhibit have been omitted in accordance with Regulation S-K Item 601(a)(5). The registrant agrees to furnish a copy of all omitted exhibits and schedules to the Securities and Exchange Commission upon its request. |
No financial statement schedules are provided because the information called for is not applicable or is shown in the financial statements or notes.
Item 17. Undertakings.
The undersigned registrant hereby undertakes to provide to the underwriters at the closing specified in the underwriting agreement, certificates in such denominations and registered in such names as required by the underwriters to permit prompt delivery to each purchaser.
Insofar as indemnification for liabilities arising under the Securities Act may be permitted to directors, officers and controlling persons of the registrant pursuant to the foregoing provisions, or otherwise, the registrant has been advised that in the opinion of the Securities and Exchange Commission such indemnification is against public policy as expressed in the Securities Act and is, therefore, unenforceable. In the event that a claim for indemnification against such liabilities (other than the payment by the registrant of expenses incurred or paid by a director, officer or controlling person of the registrant in the successful defense of any action, suit or proceeding) is asserted by such director, officer or controlling person in connection with the securities being registered, the registrant will, unless in the opinion of its counsel the matter has been settled by controlling precedent, submit to a court of appropriate jurisdiction the question whether such indemnification by it is against public policy as expressed in the Securities Act and will be governed by the final adjudication of such issue.
The undersigned registrant hereby undertakes that:
| (i) | For purposes of determining any liability under the Securities Act, the information omitted from the form of prospectus filed as part of this registration statement in reliance upon Rule 430A and contained in a form of prospectus filed by the registrant pursuant to Rule 424(b)(1) or (4) or 497(h) under the Securities Act shall be deemed to be part of this registration statement as of the time it was declared effective; and |
| (ii) | For the purpose of determining any liability under the Securities Act, each post-effective amendment that contains a form of prospectus shall be deemed to be a new registration statement relating to the securities offered therein, and the offering of such securities at that time shall be deemed to be the initial bona fide offering thereof. |
II-5
Pursuant to the requirements of the Securities Act of 1933, as amended, the registrant has duly caused this registration statement to be signed on its behalf by the undersigned, thereunto duly authorized, in St. Tammany Parish, Louisiana, on September 20, 2024.
| HORNBECK OFFSHORE SERVICES, INC. | ||
| By: |
/s/ Todd M. Hornbeck | |
| Name: Todd M. Hornbeck | ||
| Title: Chairman of the Board, President and Chief Executive Officer | ||
Pursuant to the requirements of the Securities Act of 1933, as amended, this registration statement and power of attorney have been signed by the following persons in the capacities indicated on September 20, 2024.
| Signature |
Capacity | |
| /s/ Todd M. Hornbeck Todd M. Hornbeck |
Chairman of the Board, President and Chief Executive Officer (Principal Executive Officer) | |
| * James O. Harp, Jr |
Executive Vice President and Chief Financial Officer (Principal Financial and Accounting Officer) | |
| * Kurt M. Cellar |
Lead Independent Director | |
| * Evan Behrens |
Director | |
| * Bobby Jindal |
Director | |
| * Sylvia Jo Sydow Kerrigan |
Director | |
| * James McConeghy |
Director | |
| * Jacob Mercer |
Director | |
| * L. Don Miller |
Director | |
| * Aaron Rosen |
Director | |
| *By: |
/s/ Todd M. Hornbeck | |
| Todd M. Hornbeck | ||
| Attorney-in-fact |
II-6