Exhibit 15.2
gsk do more feel better live longer Annual Report
Exhibit 15.2
gsk do more feel better live longer Annual Report
We are a science-led global healthcare company
| 2020 performance summary | |||||||||||||||||||
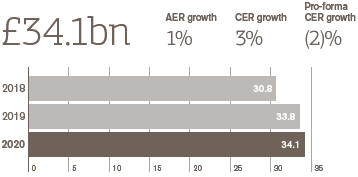
| £34.1bn | AER | +1% | £9.7bn | AER | +11% | ||||||||||||||
| Group turnover | CER | +3% | New and specialty medicines | CER | +12% | ||||||||||||||
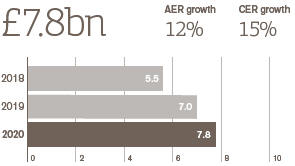
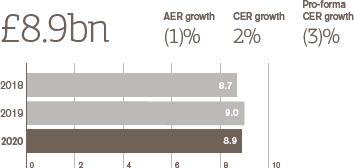
| £7.8bn | AER | +12% | £8.9bn | AER | - 1% | ||||||||||||||
| Total operating profit | CER | +15% | Adjusted operating profit | CER | +2% | ||||||||||||||
| 115.5p | AER | +23% | 115.9p | AER | - 6% | ||||||||||||||
| Total earnings per share | CER | +26% | Adjusted earnings per share | CER | - 4% | ||||||||||||||
| 9 | 80p | 1st | 2nd | ||||||||||||||||
| major pipeline approvals |
Dividend | in the Access to Medicine Index |
in the pharmaceutical industry for Dow Jones Sustainability Index | ||||||||||||||||
| Contents | ||||||||||||||
| Strategic report | ||||||||||||||
|
|
|
|
||||||||||||
| 01 | 86 | |||||||||||||
| 03 | 87 | |||||||||||||
| 04 | 90 | 238 | ||||||||||||
| 06 | The Board’s approach to engagement | 91 | ||||||||||||
| 09 | 94 | Investor information |
||||||||||||
| 10 | 96 | 244 | ||||||||||||
| 11 | 97 | 249 | ||||||||||||
| 12 | 108 | 255 | ||||||||||||
| 16 | 109 | |||||||||||||
| 18 | 258 | |||||||||||||
| 28 | Remuneration report |
261 | ||||||||||||
| 33 | 112 | 276 | ||||||||||||
| 43 | 114 | 278 | ||||||||||||
| 50 | 133 | 279 | ||||||||||||
| 279 | ||||||||||||||
| Corporate Governance |
Financial statements |
280 | ||||||||||||
| 78 | 282 | |||||||||||||
| 80 | 140 | 284 | ||||||||||||
| 83 | 142 | 287 | ||||||||||||
| 85 | 154 | 299 | ||||||||||||
| 158 | ||||||||||||||
Cautionary statement
See the inside back cover of this document for the cautionary statement regarding forward-looking statements.
Non-IFRS measures
We use a number of adjusted, non-IFRS, measures to report the performance of our business. Total reported results represent the Group’s overall performance under IFRS. Adjusted results, pro-forma growth rates and other non-IFRS measures may be considered in addition to, but not as a substitute for or superior to, information presented in accordance with IFRS. Adjusted results and other non-IFRS measures are defined on pages 51 to 53 and reconciliations to the nearest IFRS measures are on pages 64 and 68.
|
Strategic report
| ||
|
Governance and remuneration
| ||
|
Financial statements
| ||
|
Investor information
|
Every day, we help improve the health of millions of people around the
world by discovering, developing and manufacturing innovative medicines,
vaccines and consumer healthcare products.
GSK Annual Report 2020 01
|
|
||
|
|
Our business model continued
Preparing for the future
Capital allocation

02 GSK Annual Report 2020
|
Strategic report
| ||
|
Governance and remuneration
| ||
|
Financial statements
| ||
|
Investor information
|
CEO’s statement continued
GSK Annual Report 2020 05
|
Strategic report
| ||
|
Governance and remuneration
| ||
|
Financial statements
| ||
|
Investor information
|
Financial performance continued
Total and Adjusted results
| Adjusting items | Total results £m |
Intangible asset amortisation £m |
Intangible asset impairment £m |
Major restructuring £m |
Transaction- £m |
Divestments, significant legal and other items £m |
Separation £m |
Adjusted results £m |
||||||||||||||||||||||||
| Turnover |
34,099 | 34,099 | ||||||||||||||||||||||||||||||
| Cost of sales |
(11,704 | ) | 699 | 31 | 667 | 116 | (10,191 | ) | ||||||||||||||||||||||||
| Gross profit |
22,395 | 699 | 31 | 667 | 116 | 23,908 | ||||||||||||||||||||||||||
| Selling, general and administration |
(11,456 | ) | 1 | 18 | 659 | (23 | ) | 16 | 68 | (10,717 | ) | |||||||||||||||||||||
| Research and development |
(5,098 | ) | 75 | 214 | 206 | (4,603 | ) | |||||||||||||||||||||||||
| Royalty income |
318 | 318 | ||||||||||||||||||||||||||||||
| Other operating income/(expense) |
1,624 | 1,215 | (2,839 | ) | – | |||||||||||||||||||||||||||
| Operating profit |
7,783 | 775 | 263 | 1,532 | 1,308 | (2,823 | ) | 68 | 8,906 | |||||||||||||||||||||||
| Net finance costs |
(848 | ) | 2 | 2 | (844 | ) | ||||||||||||||||||||||||||
| Share of after-tax profits of associates and joint ventures |
33 | 33 | ||||||||||||||||||||||||||||||
| Profit before taxation |
6,968 | 775 | 263 | 1,534 | 1,308 | (2,821 | ) | 68 | 8,095 | |||||||||||||||||||||||
| Taxation |
(580 | ) | (150 | ) | (47 | ) | (292 | ) | (229 | ) | 17 | (14 | ) | (1,295 | ) | |||||||||||||||||
| Tax rate |
8.3 | % | 16.0 | % | ||||||||||||||||||||||||||||
| Profit after taxation |
6,388 | 625 | 216 | 1,242 | 1,079 | (2,804 | ) | 54 | 6,800 | |||||||||||||||||||||||
| Profit attributable to non-controlling interests |
639 | 392 | 1,031 | |||||||||||||||||||||||||||||
| Profit attributable to shareholders |
5,749 | 625 | 216 | 1,242 | 687 | (2,804 | ) | 54 | 5,769 | |||||||||||||||||||||||
| Earnings per share |
115.5 | p | 12.6 | p | 4.4 | p | 25.0 | p | 13.8 | p | (56.5) | p | 1.1 | p | 115.9 | p | ||||||||||||||||
GSK Annual Report 2020 07
|
|
||
|
|
Financial performance continued
Adjusted results
| 2020 | 2019 | |||||||||||||||||||||||||||
| £m | % of turnover |
£m | % of turnover |
£% | Growth CER% |
Pro-forma growth CER% |
||||||||||||||||||||||
| Turnover |
34,099 | 100 | 33,754 | 100 | 1 | 3 | (2 | ) | ||||||||||||||||||||
| Cost of sales |
(10,191 | ) | (29.9 | ) | (10,079 | ) | (29.9 | ) | 1 | 2 | (3 | ) | ||||||||||||||||
| Gross profit |
23,908 | 70.1 | 23,675 | 70.1 | 1 | 3 | (1 | ) | ||||||||||||||||||||
| Selling, general and administration |
(10,717 | ) | (31.4 | ) | (10,715 | ) | (31.7 | ) | – | 2 | (3 | ) | ||||||||||||||||
| Research and development |
(4,603 | ) | (13.5 | ) | (4,339 | ) | (12.9 | ) | 6 | 7 | 6 | |||||||||||||||||
| Royalty income |
318 | 0.9 | 351 | 1.1 | (9 | ) | (9 | ) | (9 | ) | ||||||||||||||||||
| Operating profit |
8,906 | 26.1 | 8,972 | 26.6 | (1 | ) | 2 | (3 | ) | |||||||||||||||||||
| Net finance costs |
(844 | ) | (810 | ) | ||||||||||||||||||||||||
| Share of after-tax profits of associates and joint ventures |
33 | 74 | ||||||||||||||||||||||||||
| Profit before taxation |
8,095 | 8,236 | (2 | ) | 1 | |||||||||||||||||||||||
| Taxation |
(1,295 | ) | (1,318 | ) | ||||||||||||||||||||||||
| Tax rate |
16.0 | % | 16.0 | % | ||||||||||||||||||||||||
| Profit after taxation |
6,800 | 6,918 | (2 | ) | 1 | |||||||||||||||||||||||
| Profit attributable to non-controlling interests |
1,031 | 787 | ||||||||||||||||||||||||||
| Profit attributable to shareholders |
5,769 | 6,131 | ||||||||||||||||||||||||||
| Earnings per share |
115.9 | p | 123.9 | p | (6 | ) | (4 | ) | ||||||||||||||||||||
08 GSK Annual Report 2020
|
Strategic report
| ||
|
Governance and remuneration
| ||
|
Financial statements
| ||
|
Investor information
|
We believe GSK’s long-term priorities will create lasting value for our patients,
consumers and shareholders. In 2020, despite a very challenging operating
environment, we delivered a resilient performance and our strategic objectives
remain on track.
|
Innovation |
Performance |
Trust | ||||||
|
We invest in scientific and technical excellence to develop and launch a pipeline of new products that meet the needs of our patients, payers and consumers. |
We deliver growth by investing effectively in our business, developing our people and executing competitively. |
We are a responsible company. We commit to use our science and technology to address health needs, make our products affordable and available and be a modern employer.
| ||||||
|
2020 objectives |
2020 objectives |
2020 objectives | ||||||
| – Deliver Innovation sales with excellent commercial, R&D and supply chain execution
– Further accelerate and strengthen pipeline with six potential approvals expected
|
– Prioritise spending to deliver growth and return on investment
– Successful Consumer Healthcare JV integration, including driving growth and delivering synergies
– Deliver further capability building in specialty Pharmaceuticals
– Deliver two-year programme to prepare GSK for separation into two new companies
|
– Continue to deliver on-time, in-full supply of our products
– Build reputation with a focus on Innovation
– Deliver progress on Trust commitments
| ||||||
|
Progress |
Progress |
Progress | ||||||
| – Strong performance from new innovations including Shingrix, Trelegy, Juluca, Dovato and Zejula
– Nine major regulatory approvals, including in HIV, Oncology and Respiratory
– Extended indications across portfolio, including for Shingrix, Bexsero, Trelegy Ellipta and Benlysta
– Accelerated pipeline with nine pivotal study starts and now have over 20 assets in late-stage development
– Established multiple partnerships to develop COVID-19 solutions, including with CureVac to develop next generation mRNA COVID vaccines and Vir Biotechnology for therapeutic antibody treatments
– Strengthened capabilities with more than 20 business development deals
– 28 first-market launches for Consumer Healthcare
|
– Strong sales performance from key growth drivers in HIV, Respiratory, Oncology and Consumer Healthcare, reflecting our resource focus on therapy areas, markets and brands with greatest potential
– Advanced Consumer Healthcare integration; on track for £500 million annual cost savings by 2022 and £1.1 billion divestment proceeds achieved
– Advanced specialty medicine capabilities with over 500 new hires in Oncology
– Programme to separate GSK into two leading businesses remains on track |
– Sector leading positions in ESG indices including 1st in the Access to Medicine Index
– Despite the pandemic, we have been able to maintain the supply of our pharmaceutical, vaccine and consumer healthcare products and continue manufacturing without significant disruption
– FDA and EMA approved paediatric dolutegravir
– Joined global efforts to develop COVID-19 solutions and supported partners
– Set ambitious new environmental sustainability goals in climate and nature
– Introduced all-employee mandatory inclusion and diversity training
| ||||||
|
2021 priority objectives |
2021 priority objectives |
2021 priority objectives | ||||||
|
– Deliver Innovation sales with excellent commercial, R&D and supply chain execution in Oncology, HIV and Vaccines
– Accelerate and strengthen pipeline with robust commercial input, including business development |
– Continue to prioritise spending to deliver growth and return on investment
– Continue to deliver two-year programme to prepare GSK for separation into two new leading companies
– Build a stronger, more diverse workforce for two new leading companies
|
– Continue to deliver on-time, in-full supply of our products
– Improve manager capability to motivate, focus, develop and care for people
– Continue to deliver progress on Trust commitments
| ||||||
|
Culture As we move towards the creation of two new leading companies, we continue to focus on being more performance driven, while remaining firmly purpose led and values based. We track our cultural change with a range of indicators and the Board receives regular updates. See pages 90 and 102.
| ||||||||
|
Principal risks
| ||||||||
| Our principal risks are: patient safety; product quality; financial controls and reporting; anti-bribery and corruption; commercial practices and pricing; non-promotional engagement; privacy; research practices; environment, health and safety; environmental sustainability; information security; supply continuity; and transformation. Our risk management framework is designed to support our long-term priorities. See pages 43 to 45 and 261 to 275. | ||||||||
GSK Annual Report 2020 09
|
Strategic report
| ||
|
Governance and remuneration
| ||
|
Financial statements
| ||
|
Investor information
|
We track progress against our long-term priorities with ten operating key
performance indicators. These measure our performance at a Group level
and across our three businesses.
| Innovation | 2020 | 2019 | 2018 | |||||||||
| Innovation sales
|
||||||||||||
| Pharmaceuticals and Vaccines – sales of products launched in the last five years |
|
£4.1bn
|
|
|
£3.0bna
|
|
|
£1.1bna
|
| |||
| Consumer Healthcare – sales from products which are new to a market in the last three years as a % of total sales |
|
11%
|
|
|
12%
|
|
|
11%
|
| |||
|
Pipeline value and progress – the value of products in our pipeline and R&D milestones achieved |
|
n/r
|
|
|
n/r
|
|
|
n/r
|
| |||
| Performance | 2020 | 2019 | 2018 | |||||||||
| Group turnover
|
£34.1bn | £33.8bn | £30.8bn | |||||||||
| Profit
|
||||||||||||
| Total operating profit – up 12% AER, 15% CER
|
£7.8bn | £7.0bn | £5.5bn | |||||||||
| Adjusted operating profit – down 1% AER, up 2% CER
|
£8.9bn | £9.0bn | £8.7bn | |||||||||
| Total operating margin
|
22.8% | 20.6% | 17.8% | |||||||||
| Adjusted operating margin
|
26.1% | 26.6% | 28.4% | |||||||||
|
Free cash flow
|
£5.4bn | £5.1bn | £5.7bn | |||||||||
| Market share – our market share in relation to our competitors |
n/r | n/r | n/r | |||||||||
| Top talent and succession plans for key roles – our most talented employees in key roles with succession plans in place | n/r | n/r | n/r | |||||||||
| Trust | 2020 | 2019 | 2018 | |||||||||
| Employee feedback – employee engagement scores from our global employee survey |
|
84%
|
|
|
78%
|
|
|
78%
|
| |||
| Supply service level – percentage of orders delivered on-time, in-full |
|
n/r
|
|
|
n/r
|
|
|
n/r
|
| |||
| Corporate reputation – reputation index among stakeholders and informed public measured globally and in top 13 markets |
|
n/r
|
|
|
n/r
|
|
|
n/r
|
| |||

|
Linked to Executive LTI awards and bonus, see pages 113, 119 and 121. |
| a | Comparative information reflects sales of those products that meet the definition for 2020. |
| n/r | Not reported externally due to commercial sensitivities. |
GSK Annual Report 2020 11
|
|
||
|
|
We are operating in a dynamic environment, shaped by fast-changing
and interdependent global trends, many of which were accelerated
by the COVID-19 pandemic. We continue to respond to this changing
environment by advancing our strategy and long-term priorities.
12 GSK Annual Report 2020
|
Strategic report
| ||
|
Governance and remuneration
| ||
|
Financial statements
| ||
|
Investor information
|
Industry trends continued
GSK Annual Report 2020 13
|
|
||
|
|
Industry trends continued
14 GSK Annual Report 2020
|
Strategic report
| ||
|
Governance and remuneration
| ||
|
Financial statements
| ||
|
Investor information
|
Industry trends continued
GSK Annual Report 2020 15
|
|
||
|
|
Engaging and building trust with the broad range of stakeholders that
interact with, or are impacted by, our business is key to delivering our
strategy and ensuring our success over the long term.
Our approach to enable management and the Board to understand and consider stakeholder views as part of their oversight and decision making is explained in our section 172 statement, set out in full on page 108 and incorporated by reference into this Strategic report. On this page we summarise our key stakeholder groups, how we engage with them, the issues that matter most to them and what we are doing in response.
| Patients and consumers |
Insights from patients and consumers enable us to develop products that better meet their needs.
How we engage
– Advisory boards, disease-specific patient panels and Patient Advocacy Leaders Summits to provide patient insights
– Engagement and support for patient groups (disclosed on GSK.com), and initiatives that empower patients to get involved in medicine development
– Market research including consumer sensory labs |
What matters
– Differentiated product innovation based on patient and consumer needs
– Access to a reliable supply of high-quality, safe products
– Pricing of healthcare products, particularly out-of-pocket expenses
What we are doing
– Strengthening our pipeline of innovative products
– Maintaining high standards for product quality and safety
– Continuing to take a value-based approach to pricing to balance reward for innovation with access and affordability
| ||
| Investors |
We maintain regular and constructive dialogue with investors to communicate our strategy and performance in order to promote investor confidence and ensure our continued access to capital.
How we engage
– Ongoing communications including the AGM, quarterly results calls, in-person and virtual roadshows and detailed company information online
– One-to-one meetings between Board members, senior executives and institutional investors
– Biennial investors and analysts perception study
|
What matters
– Financial performance and commercial success
– Understanding how our R&D strategy is successfully developing our pipeline
– The increasing importance of good management of ESG issues
What we are doing
– Good financial performance and transparent reporting
– Business and R&D updates and events on key pipeline milestones
– Increasing our engagement on ESG matters | ||
| Healthcare |
We work with healthcare professionals (HCPs) and medical experts to understand patient needs and to ensure our products are being administered in the right way.
How we engage
– Scientific dialogue to increase understanding of disease management and patient experience
– Providing high-quality, balanced information about our medicines and vaccines
– Collaborating on clinical trials and research |
What matters
– Access to product and scientific information
– Responsible sales and marketing practices
– Safety, efficacy and differentiated innovation
What we are doing
– Increasing the use of digital channels to deliver a more personalised and effective sharing of information to HCPs
– Ensuring we attract and retain the best talent while upholding responsible sales and marketing standards
– Using HCP insights on disease management and patient experience to inform the development of our medicines
| ||
| R&D partners and academia |
We partner with scientific institutions, national health systems, business partners and academia to help ensure we develop differentiated healthcare products.
How we engage
– Collaborating with outstanding scientists from organisations across the globe
– Establishing joint ventures to strengthen innovation and efficiency
– Working with academic institutions to accelerate discovery and development of new medicines |
What matters
– Finding the right partner to accelerate a potential medicine or vaccine to approval to reach patients
– Pushing the science as far as it can go to advance human health
– Dissemination and advancement of scientific knowledge
What we are doing
– Working with world-leading experts at biotechs, universities and other scientific institutions to improve drug discovery and increase the productivity of our R&D pipeline
– Collaborating with partners such as with CureVac on mRNA technology and Vir Biotechnology for new antibody therapies; and expanding genetic and genomics collaborations such as with the Broad Institute
| ||
16 GSK Annual Report 2020
|
Strategic report
| ||
|
Governance and remuneration
| ||
|
Financial statements
| ||
|
Investor information
|
Stakeholder engagement continued
| Governments and regulators |
We work with governments and regulators to advocate for policies that encourage innovation, promote efficient management of healthcare spending and give patients the support they need.
How we engage
– Meeting with regulatory bodies throughout the development process to ensure high-quality and safe new products
– Engaging with government health agencies to demonstrate the value of our products for patients and economies
– Working with governments to protect and strengthen the right operating environment for life sciences innovation and launches
– Participating in international efforts to address global health threats, such as the COVID-19 pandemic |
What matters
– Investment in innovation and life sciences
– Scientific funding and collaboration
– Medicines pricing and reimbursement
– Public health threats – COVID-19 and antimicrobial resistance (AMR)
– Investment in preventive health and strengthening health systems
What we are doing
– Working with UK and EU policymakers to ensure post-Brexit there remains a sustained flow of goods, investment capital and talent for life sciences innovation
– Engaging in US policy pricing/reimbursement debates and, with phRMA, commenting on legislative proposals for healthcare reform
– Partnering across industry and governments to tackle AMR
– Engaging with governments, including the US, UK, EU and Canada, regarding production and procurement of COVID-19 vaccines
| ||
| NGOs and multilateral organisations |
We work with partners to improve access to healthcare services and our products, and to advocate for the policy environment in which we can be successful.
How we engage
– Working with non-governmental organisations (NGOs) and partners to research and develop products to address global health challenges
– Collaborating with NGOs and generic manufacturers to sustainably supply our products to developing countries
– Partnering to strengthen health systems in developing countries and drive progress on global health priorities |
What matters
– Access to medicines and vaccines
– UN SDGs and WHO targets for specific disease areas
– Universal health coverage and the future of health systems
– Financing for global health, including COVID-19 solutions
What we are doing
– Focusing on our unique role as a global health partner to develop products where we have scientific expertise
– Partnering with organisations that have complementary capabilities and reach to create sustainable models that share risk, including our partnership with Gavi to support access to vaccines in low and lower middle-income countries
– Leveraging our community investment programmes to support our scientific expertise and deliver greater impact for patients
| ||
| Suppliers |
We work with thousands of suppliers, large and small, who provide goods and services that support us in delivering a reliable supply of high-quality, safe products for our patients and consumers.
How we engage
– Regular direct engagement with suppliers to ensure they support GSK’s strategies and targets
– Engaging with suppliers through our Third-Party Oversight programme and by conducting in-depth audits
– Participating in forums such as the Pharmaceutical Supply Chain Initiative and the Consumer Goods Forum to improve supply chain sustainability |
What matters
– Prompt payment for smaller suppliers
– Understanding GSK policies to ensure compliance
– Opportunities to innovate and grow the relationship
What we are doing
– Engaging with our suppliers throughout the COVID-19 pandemic to understand their operating and financial status, and offering support if necessary
– Engaging with suppliers to develop improvement plans and track progress when we identify areas for improvement
– Providing proactive support through our third-party EH&S team in countries where our priority suppliers are located
| ||
| Employees |
We involve and listen to employees to help us maintain strong employee engagement and retain talented people.
How we engage
– Regular ‘Let’s Talk’ and ‘Let’s Listen’ events with the Corporate Executive Team and other senior leaders
– Facilitating dialogue and collaboration through our internal communications platform
– Through Works Councils, Employee Forums and Employee Resource Groups
– Global all-employee survey and One80 Survey for employees to provide feedback on line managers |
What matters
– Our purpose and being able to see the difference we make
– Having a great line manager
– Feeling understood and valued
– Being part of an inclusive and diverse workplace
What we are doing
– Delivering more frequent, authentic communications during the pandemic
– Clarifying our expectations of managers to motivate, focus, care for and develop our employees
– Supporting employee safety, mental wellbeing and enabling work-life balance
– Expanded our I&D commitments by setting aspirational targets to improve ethnic and gender diversity in leadership
| ||
GSK Annual Report 2020 17
|
|
||
|
|
2020 was a year of significant progress for R&D. Across our biopharma portfolio, we achieved a substantial number of new launches, regulatory filings and late-stage research milestones. In Consumer Healthcare, we delivered first market launches of new innovations across all categories.
|
Progress
|
||||
|
– Strengthened the biopharma
– Accelerated the portfolio with
– Over 20 assets in late-stage
|
– Fast tracked COVID-19 solutions,
– Started phase III trials for our RSV
– Launched first clinical trial of an |
– Invested significantly in strategic
– Consumer Healthcare had 28
|
Pharmaceuticals and Vaccines
18 GSK Annual Report 2020
|
Strategic report
| ||
|
Governance and remuneration
| ||
|
Financial statements
| ||
|
Investor information
|
Innovation continued
GSK Annual Report 2020 19
|
|
||
|
|
Innovation continued
1 Internal data
20 GSK Annual Report 2020
|
Strategic report
| ||
|
Governance and remuneration
| ||
|
Financial statements
| ||
|
Investor information
|
Innovation continued
GSK Annual Report 2020 21
|
|
||
|
|
Innovation continued
22 GSK Annual Report 2020
|
Strategic report
| ||
|
Governance and remuneration
| ||
|
Financial statements
| ||
|
Investor information
|
Innovation continued
GSK Annual Report 2020 23
|
|
||
|
|
Innovation continued
24 GSK Annual Report 2020
|
Strategic report
| ||
|
Governance and remuneration
| ||
|
Financial statements
| ||
|
Investor information
|
Innovation continued
GSK Annual Report 2020 25
|
|
||
|
|
Innovation continued
Pipeline overview
We have 59 assets in development, of which over 20 are late-stage.
|
Pivotal (phase II/III/registration)
|
||||
| Benlysta + rituximab SLE | letetresgene-autoleuceI1 (3377794, NY-ES0-1 TCR) SS2 | |||
|
|
| |||
| cabotegravir LA HIV PrEP | 41821361 (VIR-7831) COVID-19 | |||
|
|
| |||
| daprodustat (HIF-PHI) anaemia | 35112941 (LA anti-IL5 antagonist) asthma | |||
|
|
| |||
| Nucala COPD/nasal polyps | Shingrix immuno-compromised vaccine1 | |||
|
|
| |||
| Blenrep1 (BCMA ADC) multiple myeloma7 | Bexsero infants vaccine (US) | |||
|
|
| |||
| Zejula1 (PARP inhibitor) ovarian and lung cancer2 | MMR vaccine (US) | |||
|
|
| |||
| dostarlimab1 (PD-1 antagonist) dMMR/MSI-H EC | Rotarix liquid vaccine (US) | |||
|
|
| |||
| bintrafusp alfa1 (TGFß trap/anti-PDL1) BTC2 | MenABCWY vaccine | |||
|
|
| |||
| otilimab1 (3196165, aGM-CSF inhibitor) RA2,6 | RSV maternal vaccine1 | |||
|
|
| |||
| gepotidacin1 (2140944) uUTI and GC | COVID-19 (Medicago) vaccine1,3 | |||
|
|
| |||
| feladilimab1 (3359609 ICOS receptor agonist) HNSCC2,4 | RSV older adults vaccine1 | |||
|
Proof of concept (phase Ib/II)
|
||||
| 3640254 (maturation inhibitor) HIV | Menveo liquid vaccine | |||
|
|
| |||
| 32288361 (HBV ASO) HBV | RSV paediatric vaccine | |||
|
|
| |||
| linerixibat (IBATi) cholestatic pruritus in PBC | Therapeutic HBV vaccine1,5 | |||
|
|
| |||
| 33265951 (PRMT5 inhibitor) cancer | Malaria1 (fractional dose) vaccine | |||
|
|
| |||
| cobolimab1 (TSR-022, TIM-3 antagonist) NSCLC | Shigella vaccine1 | |||
|
|
| |||
| 30366561 (leucyl t-RNA inhibitor) TB | COVID-19 (Sanofi) vaccine1,3 | |||
|
|
| |||
| 40743861 (TSR-033, LAG3 antagonist) cancer | ||||
|
First time in human/POM (phase I/Ib)
|
||||
| 38582791 (CCL 17 inhibitor) OA pain | 39019611 (CD8/NYESO TCR) cancer | |||
|
|
| |||
| 3745417 (STING agonist) cancer | 38450971 (TGFbR2/NYESO TCR) cancer | |||
|
|
| |||
| 34391711 (hPGD2 synthase inhibitor) DMD | 34942451 (proteosome inhibitor) visceral leishmaniasis | |||
|
|
| |||
| 31868991 (CRK-12 inhibitor) visceral leishmaniasis | 39153931 (TG2 inhibitor) celiac disease | |||
|
|
| |||
| 38101091 (broadly neutralising antibody) HIV | 25562861 (Mtb inhibitor) TB | |||
|
|
| |||
| 33687151 (Type 1 PRMT inhibitor) cancer | 37290981 (ethionamide booster) TB | |||
|
|
| |||
| 27987451 (TRPV4 blocker) DME | 41821371 (VIR-7832) COVID-19 | |||
|
|
| |||
| 60976081 (CD96) cancer | C. difficile vaccine1 | |||
|
|
| |||
| 2982772 (RIP1-k) psoriasis | SAM (rabies model) vaccine | |||
|
|
| |||
| 38823471 (FimH antagonist) uUTI | S. aureus vaccine1 | |||
|
|
| |||
| 3739937 (maturation inhibitor) HIV | COVID-19 (SK Bioscience) vaccine1,3,5 | |||
|
|
| |||
| 3923868 (Pl4kß inhibitor) viral COPD exacerbations | SAM (COVID-19 model) vaccine |
Only the most advanced indications are shown for each asset.
26 GSK Annual Report 2020
|
Strategic report
| ||
|
Governance and remuneration
| ||
|
Financial statements
| ||
|
Investor information
|
Innovation continued
Consumer Healthcare
| 1 | Based on Nicholas Hall’s DB6 Global OTC database 2019 (on the basis of consumption at manufacturers’ price) |
GSK Annual Report 2020 27
|
|
||
|
|
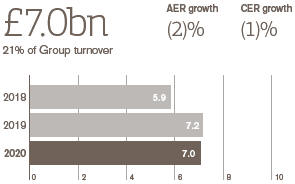
We delivered our guidance for the year, offsetting the significant impact of COVID-19 on adult vaccinations, with strong sales performance from key growth drivers in HIV, Respiratory, Oncology and Consumer Healthcare, and effective cost control.
|
Pharmaceuticals |
Vaccines |
Consumer Healthcare | ||
|
|
|
| ||
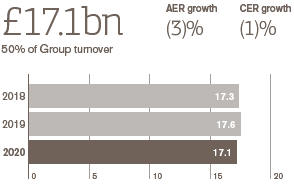
| – Total 2020 turnover £17 billion, -3% AER, -1% CER
– Sales of new and specialty pharmaceuticals £9.7 billion +11% AER, +12% CER
– Strong commercial execution of key growth products, including launches in HIV, Oncology and Respiratory
– Accelerated digital capabilities, supporting enhanced HCP engagement and strong supply performance despite disruption from COVID-19 pandemic
|
– Total 2020 turnover £7 billion, -2% AER, -1% CER. COVID-19 adversely impacted adult vaccination in particular
– Shingrix launched to new, self-pay markets China, Belgium, the Netherlands, Japan and Sweden. Strong performance in Europe, reflecting robust demand in Germany
– Further strengthened Bexsero’s profile with compelling real-world evidence in multiple settings
– Strong flu sales across all regions
– Overall strong supply performance
|
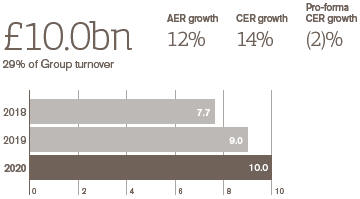
– Total 2020 turnover £10 billion +12% AER, +14% CER (pro-forma -2% CER, +4% CER excluding brands divested/under review)
– Strong progress on joint venture integration
– Exceeded target of raising £1 billion through non-core brand divestments
– On track to deliver synergies of £500 million annual cost savings by 2022
|
Pharmaceuticals
| 1 | New and Specialty products comprises Pharmaceuticals excluding Established Pharmaceuticals |
28 GSK Annual Report 2020
|
Strategic report
| ||
|
Governance and remuneration
| ||
|
Financial statements
| ||
|
Investor information
|
Performance continued
GSK Annual Report 2020 29
|
|
||
|
|
Performance continued
Vaccines
1 Internal data
30 GSK Annual Report 2020
|
Strategic report
| ||
|
Governance and remuneration
| ||
|
Financial statements
| ||
|
Investor information
|
Performance continued
Consumer Healthcare
GSK Annual Report 2020 31
|
|
||
|
|
Performance continued
32 GSK Annual Report 2020
|
Strategic report
| ||
|
Governance and remuneration
| ||
|
Financial statements
| ||
|
Investor information
|
Trust is one of our three long-term priorities and is crucial to our purpose,
enabling us to add value for our shareholders and society.
|
Progress
| ||||||||||||||||||
|
– Committed to ambitious new environmental sustainability goals: net zero impact on climate and net positive impact on nature by 2030
– Strong performance against our ESG benchmarks
– Licensed our TB candidate vaccine to the Bill and Melinda Gates Medical Research Institute for continued development |
– Partnered to launch the $1 billion AMR Action Fund aiming to bring two to four novel antibiotics to patients by 2030
– FDA and EMA approved an age-appropriate formulation of Tivicay, for children living with HIV weighing at least 3kg and from four weeks of age
– Set new aspirational targets for gender and for race and ethnicity, to improve representation at VP level and above, and introduced mandatory inclusion and diversity training for all employees
|
– Formed partnerships to better prepare for future pandemics and ensure access to future COVID-19 treatments and vaccines. Including through the Trinity Challenge, our industry commitment with the Bill and Melinda Gates Foundation and our engagement with the COVAX facility
– Record response (85%) to our employee survey, with engagement score of 84% (up 6%) |
||||||||||||||||
GSK Annual Report 2020 33
|
|
||
|
|
Trust continued
Science and technology
34 GSK Annual Report 2020
|
Strategic report
| ||
|
Governance and remuneration
| ||
|
Financial statements
| ||
|
Investor information
|
Trust continued
Affordability and availability
GSK Annual Report 2020 35
|
|
||
|
|
Trust continued
Modern employer
36 GSK Annual Report 2020
|
Strategic report
| ||
|
Governance and remuneration
| ||
|
Financial statements
| ||
|
Investor information
|
Trust continued
GSK Annual Report 2020 37
|
|
||
|
|
Trust continued
38 GSK Annual Report 2020
|
Strategic report
| ||
|
Governance and remuneration
| ||
|
Financial statements
| ||
|
Investor information
|
Trust continued
Responsible business
GSK Annual Report 2020 39
|
|
||
|
|
Trust continued
40 GSK Annual Report 2020
|
Strategic report
| ||
|
Governance and remuneration
| ||
|
Financial statements
| ||
|
Investor information
|
Trust continued
GSK Annual Report 2020 41
|
|
||
|
|
Trust continued
42 GSK Annual Report 2020
|
Strategic report
| ||
|
Governance and remuneration
| ||
|
Financial statements
| ||
|
Investor information
|
GSK has a well-embedded risk management framework, which is reviewed continually. Board committees provide oversight of the framework, assisted
by the Risk Oversight and Compliance Council.
GSK Annual Report 2020 43
|
|
||
|
|
Risk management continued
|
Risk |
Assessment and mitigation activities | |||
|
| ||||
| Patient safety |

|
The macro risk level is unchanged and remains challenging as politicisation of drug and vaccine safety and efficacy in the context of COVID-19 could provoke distrust and alter public reporting. Restrictive privacy regulations, that impact how we manage safety data, create further complications. | ||
|
|
GSK’s exposure is also unchanged. While operational risk has stabilised through embedding of pharmacovigilance organisational efficiencies, this is offset by challenges accompanying fast-paced development of medicines and vaccines for COVID-19. To mitigate these and other risks, we apply our well-established safety governance and risk management framework to ensure we are safeguarding patients throughout the lifecycle of all GSK products. | |||
|
| ||||
| Product quality |
|
The macro risk remains the same despite concerns of potential drug shortages associated with COVID-19, the ongoing evaluation of products for the presence of nitrosamines and the increased focus on data integrity requirements. | ||
|
|
GSK’s exposure remains unchanged with quality oversight processes in place to monitor and maintain a strong compliance profile throughout the pandemic. Governance and control strategies have been developed and deployed for the timely completion of our nitrosamine assessments. We have continued to invest in technology and digital platforms to further strengthen our controls around good data management practices. | |||
|
| ||||
| Financial controls and reporting |

|
The macro risk level has increased, with the external environment remaining challenging due to political uncertainty and increasing societal expectations of the role of the auditor. There are increased fraud attempts and challenging financial markets, informed mainly by the COVID-19 pandemic and evolving political responses. | ||
|
|
GSK’s risk exposure has remained stable due to the resilience and focus of personnel. We continue to implement transformational programmes, leverage technology, centralise processes, strengthen controls and maintain effective tax and treasury strategies. | |||
|
| ||||
| Anti-bribery and corruption (ABAC) |
|
The macro risk level for bribery and corruption increased as we continued to see legal frameworks similar to those in the UK and US develop elsewhere; more rigorous standards aided by improved technology; increased enforcement with focus on third-party intermediaries; and the impact of COVID-19 on businesses. | ||
|
|
GSK’s ABAC risk exposure has maintained as we continue to improve our ABAC programme to ensure appropriate controls, training, capability building, awareness raising, strong monitoring and use of data analytics. We continue to understand and assess our risk exposure to money laundering and wider corruption to mitigate any existing risk. | |||
|
| ||||
| Commercial practices and pricing |
|
COVID-19 has increased the macro-level risk on the industry go-to-market model, boosting the importance of different channel activities (e.g. internet based) for consumers, promoting, connecting and commercialising. There is also an increased risk of downward price pressure due to international reference pricing, aggressive healthcare budget controls and tighter reimbursement. | ||
|
|
GSK’s risk exposure level remains stable due to our mature and robust control environment. We continue to evolve our commercial practices. We have invested in new technologies that support virtual customer engagement. We maintain proportionate controls, training and monitoring for employees that engage with healthcare organisations and professionals. In Consumer Healthcare, improvements in our digital sales and marketing control framework are mitigating emerging risks. | |||
|
| ||||
| Non-promotional engagement |
|
The macro environment for non-promotional activities and scientific engagement with HCPs and patients is stable. This is despite being impacted by the complexity and dynamic nature of disease areas and treatments, the increasing diversity of engagement platforms, and a significant increase in virtual engagements since the pandemic. | ||
|
|
GSK’s exposure has not increased. We further modernised and adapted our practices and applied our internal principles and policies, designed to mitigate risk, to this rapidly evolving environment. We evolved employee training so that our people understand the risk associated with non-promotional activities and conduct them in compliance with GSK’s values and policies, local laws and regulations. | |||
|
| ||||
44 GSK Annual Report 2020
|
Strategic report
| ||
|
Governance and remuneration
| ||
|
Financial statements
| ||
|
Investor information
|
Risk management continued
| Risk | Assessment and mitigation activities | |||
|
| ||||
| Privacy |
|
The macro risk continues to increase, with priority GSK markets such as the US, China and India instituting new – or enforcing existing – privacy laws, and court rulings invalidating privacy mechanisms that international companies had relied on, including the EU-US Privacy Shield. COVID-19 has further highlighted the fragmented nature of the regulatory environment. | ||
|
|
GSK’s exposure remains unchanged, due to our continued efforts to embed our privacy framework in our markets, the evolution of risk mitigation in the business, and the advancing of our privacy strategy from a centrally-driven, mitigation approach to one where the business proactively embeds privacy by design standards. | |||
|
| ||||
| Research practices |
|
The macro risk level has increased due to COVID-19. The pandemic has created continuity challenges for R&D, particularly human subject research, where disruption to global clinical trial programmes has introduced additional risks. | ||
|
|
GSK’s exposure remains unchanged. We are offsetting external impacts of the pandemic by risk mitigation actions to embed and monitor additional business continuity measures and controls. Ongoing and planned work to further enhance and monitor our culture of quality is continuing. | |||
|
| ||||
| Environment, health and safety (EHS) |
|
The macro risk level has increased. Although regulators and stakeholders’ expectations are broadly the same, new regulations to control the spread of COVID-19 in the workplace have added significant complexity to how we comply with existing EHS regulations. | ||
|
|
GSK’s risk exposure has increased, due both to our adjustment of work practices to enable COVID-19 control measures and because of our transition to a period of significant organisational change. Both factors require us to refocus on applying EHS fundamentals. | |||
|
| ||||
| Environmental sustainability |
|
The macro risk level increased as investors, regulators and other stakeholders increasingly expect companies to understand and reduce the environmental impacts across their value chain and mitigate the impacts climate change could have on their operations and supply chains. | ||
|
|
GSK’s risk exposure is unchanged. We set ambitious new environmental sustainability targets in 2020 and have implemented detailed water resilience assessments, increased our Task Force on Climate-related Financial Disclosures (TCFD) analysis and continued to monitor trends in physical, reputational and regulatory risks from climate change impacts. | |||
|
| ||||
| Information security |
|
The macro risk level continues to rise, as large multinationals increase their digital footprints and threats from hackers become ever more sophisticated. During the year COVID-19 also added to a measurable increase in threats targeting the healthcare industry. | ||
|
|
GSK’s risk exposure has increased. GSK’s cybersecurity programme continues a rapid improvement of controls to increase cyber threat intelligence capabilities and protect critical information and systems including operational technology and networks. While GSK continues to strengthen cybersecurity and information protection capabilities, the targeting of pharmaceutical and vaccine intellectual property leveraging cybersecurity, as well as third party service availability as a means of disruption, has intensified. | |||
|
| ||||
| Supply continuity |
|
The macro risk level remains high due to the ongoing impact of the COVID-19 pandemic on product supply. The potential for increasing protectionism between countries and Brexit uncertainties also continues. | ||
|
|
GSK’s risk exposure has increased. There is an elevated risk of supply issues of bioscience materials such as glass vials and filters. This is an industry-wide concern arising from the rapid ramp up of COVID-19 vaccines and therapeutics driving increased demand for components. | |||
|
| ||||
| Transformation |
|
The macro risk level is increasing due to COVID-19 having introduced uncertainty into the external global environment and necessitating temporary measures in certain countries to protect employment. | ||
|
|
GSK’s risk exposure level remains unchanged. Our transformation and separation projects have progressed as planned throughout 2020, with workforce engagement being a priority. | |||
|
| ||||
GSK Annual Report 2020 45
|
|
||
|
|
Risk management continued
Climate-related financial disclosure
| 1 | Scenarios are based on IPPC Representative Concentration Pathways 2.6, 4.5 and 8.5, the IEA World Energy Outlook 2018 New Policy Scenario, Current Policy Scenario and Sustainable Development Scenario; and data sets from WWF and WRI for water stress and flood risk modelling |
46 GSK Annual Report 2020
|
Strategic report
| ||
|
Governance and remuneration
| ||
|
Financial statements
| ||
|
Investor information
|
Risk management continued
GSK Annual Report 2020 47
|
|
||
|
|
Risk management continued
Viability statement
48 GSK Annual Report 2020
|
Strategic report
| ||
|
Governance and remuneration
| ||
|
Financial statements
| ||
|
Investor information
|
Risk management continued
Impact of Brexit
Non-financial information statement
The following aligns to the non-financial reporting requirements contained in sections 414CA and 414CB of the Companies Act 2006.
GSK Annual Report 2020 49
|
Strategic report
| ||
|
Governance and remuneration
| ||
|
Financial statements
| ||
|
Investor information
|
Group financial review
Reporting framework
GSK Annual Report 2020 51
|
|
||
|
|
Group financial review continued
Reporting framework continued
Historical record of Adjusting items
The reconciliations between Total and Adjusted operating profit over the last five years can be summarised as follows:
|
2020 £m |
2019 £m |
2018 £m |
2017 £m |
2016 £m |
||||||||||||||||
| Total operating profit |
7,783 | 6,961 | 5,483 | 4,087 | 2,598 | |||||||||||||||
| Intangible asset amortisation |
775 | 777 | 580 | 591 | 588 | |||||||||||||||
| Intangible asset impairment |
263 | 83 | 116 | 688 | 20 | |||||||||||||||
| Major restructuring |
1,532 | 1,105 | 809 | 1,056 | 970 | |||||||||||||||
| Transaction-related items |
1,308 | 345 | 1,977 | 1,599 | 3,919 | |||||||||||||||
| Divestments, significant legal and other items |
(2,823 | ) | (299 | ) | (220 | ) | (119 | ) | (424 | ) | ||||||||||
| Separation costs |
68 | – | – | – | – | |||||||||||||||
| US tax reform |
– | – | – | 666 | – | |||||||||||||||
| Adjusted operating profit |
8,906 | 8,972 | 8,745 | 8,568 | 7,671 | |||||||||||||||
| The analysis of the impact of transaction-related items on operating profit for each of the last five years is as follows: |
| |||||||||||||||||||
| 2020 £m |
2019 £m |
2018 £m |
2017 £m |
2016 £m |
||||||||||||||||
| Novartis Consumer Healthcare Joint Venture put option |
– | – | 658 | 986 | 1,133 | |||||||||||||||
| Contingent consideration on former Shionogi-ViiV Healthcare JV (including Shionogi preferential dividends) |
1,114 | 31 | 1,188 | 556 | 2,162 | |||||||||||||||
| ViiV Healthcare put options and Pfizer preferential dividends |
(52) | (234 | ) | (58 | ) | (126 | ) | 577 | ||||||||||||
| Contingent consideration on former Novartis Vaccines business |
172 | 76 | 58 | 101 | 69 | |||||||||||||||
| Release of fair value uplift on acquired Pfizer inventory |
91 | 366 | – | – | – | |||||||||||||||
| Other adjustments |
(17) | 106 | 131 | 82 | (22 | ) | ||||||||||||||
| Transaction-related items |
1,308 | 345 | 1,977 | 1,599 | 3,919 | |||||||||||||||
Full reconciliations between Total and Adjusted results for 2016–2020 are set out on pages 252 to 254. Further explanations on the Adjusting items for 2020 are reported on page 64.
52 GSK Annual Report 2020
|
Strategic report
| ||
|
Governance and remuneration
| ||
|
Financial statements
| ||
|
Investor information
|
Group financial review continued
Reporting framework continued
GSK Annual Report 2020 53
|
|
||
|
|
Group financial review continued
Our approach to tax
54 GSK Annual Report 2020
|
Strategic report
| ||
|
Governance and remuneration
| ||
|
Financial statements
| ||
|
Investor information
|
Group financial review continued
Financial performance
GSK Annual Report 2020 55
|
|
||
|
|
Group financial review continued
Financial performance continued
56 GSK Annual Report 2020
|
Strategic report
| ||
|
Governance and remuneration
| ||
|
Financial statements
| ||
|
Investor information
|
Group financial review continued
Financial performance continued
GSK Annual Report 2020 57
|
|
||
|
|
Group financial review continued
Financial performance continued
58 GSK Annual Report 2020
|
Strategic report
| ||
|
Governance and remuneration
| ||
|
Financial statements
| ||
|
Investor information
|
Group financial review continued
Financial performance continued
GSK Annual Report 2020 59
|
|
||
|
|
Group financial review continued
Financial performance continued
60 GSK Annual Report 2020
|
Strategic report
| ||
|
Governance and remuneration
| ||
|
Financial statements
| ||
|
Investor information
|
Group financial review continued
Financial performance continued
GSK Annual Report 2020 61
|
|
||
|
|
Group financial review continued
Financial performance continued
62 GSK Annual Report 2020
|
Strategic report
| ||
|
Governance and remuneration
| ||
|
Financial statements
| ||
|
Investor information
|
Group financial review continued
Financial performance continued
GSK Annual Report 2020 63
|
|
||
|
|
Group financial review continued
Adjusting items
| Adjusted results reconciliation 31 December 2020 |
Total results £m |
Intangible asset amortisation £m |
Intangible asset impairment £m |
Major restructuring £m |
Transaction- £m |
Divestments, significant legal and other items £m |
Separation £m |
Adjusted results £m |
||||||||||||||||||||||||
| Turnover |
34,099 | 34,099 | ||||||||||||||||||||||||||||||
| Cost of sales |
(11,704 | ) | 699 | 31 | 667 | 116 | (10,191 | ) | ||||||||||||||||||||||||
| Gross profit |
22,395 | 699 | 31 | 667 | 116 | 23,908 | ||||||||||||||||||||||||||
| Selling, general and administration |
(11,456 | ) | 1 | 18 | 659 | (23 | ) | 16 | 68 | (10,717 | ) | |||||||||||||||||||||
| Research and development |
(5,098 | ) | 75 | 214 | 206 | (4,603 | ) | |||||||||||||||||||||||||
| Royalty income |
318 | 318 | ||||||||||||||||||||||||||||||
| Other operating (expense)/income |
1,624 | 1,215 | (2,839 | ) | – | |||||||||||||||||||||||||||
| Operating profit |
7,783 | 775 | 263 | 1,532 | 1,308 | (2,823 | ) | 68 | 8,906 | |||||||||||||||||||||||
| Net finance costs |
(848 | ) | 2 | 2 | (844 | ) | ||||||||||||||||||||||||||
| Share of after-tax profits of associates and joint ventures |
33 | 33 | ||||||||||||||||||||||||||||||
| Profit before taxation |
6,968 | 775 | 263 | 1,534 | 1,308 | (2,821 | ) | 68 | 8,095 | |||||||||||||||||||||||
| Taxation |
(580 | ) | (150 | ) | (47 | ) | (292 | ) | (229 | ) | 17 | (14 | ) | (1,295 | ) | |||||||||||||||||
| Tax rate |
8.3% | 16.0% | ||||||||||||||||||||||||||||||
| Profit after taxation |
6,388 | 625 | 216 | 1,242 | 1,079 | (2,804 | ) | 54 | 6,800 | |||||||||||||||||||||||
| Profit attributable to non-controlling interests |
639 | 392 | 1,031 | |||||||||||||||||||||||||||||
| Profit attributable to shareholders |
5,749 | 625 | 216 | 1,242 | 687 | (2,804 | ) | 54 | 5,769 | |||||||||||||||||||||||
| Earnings per share |
115.5p | 12.6p | 4.4p | 25.0p | 13.8p | (56.5)p | 1.1p | 115.9p | ||||||||||||||||||||||||
| Weighted average number of shares (millions) |
4,976 | 4,976 | ||||||||||||||||||||||||||||||
| Adjusted results reconciliation 31 December 2019 |
Total results £m |
Intangible asset amortisation £m |
Intangible asset impairment £m |
Major restructuring £m |
Transaction- £m |
Divestments, significant legal and other items £m |
Adjusted results £m |
|||||||||||||||||||||||||
| Turnover |
33,754 | 33,754 | ||||||||||||||||||||||||||||||
| Cost of sales |
(11,863 | ) | 713 | 30 | 658 | 383 | (10,079 | ) | ||||||||||||||||||||||||
| Gross profit |
21,891 | 713 | 30 | 658 | 383 | 23,675 | ||||||||||||||||||||||||||
| Selling, general and administration |
(11,402 | ) | 4 | 332 | 104 | 247 | (10,715 | ) | ||||||||||||||||||||||||
| Research and development |
(4,568 | ) | 64 | 49 | 114 | 2 | (4,339 | ) | ||||||||||||||||||||||||
| Royalty income |
351 | 351 | ||||||||||||||||||||||||||||||
| Other operating (expense)/income |
689 | 1 | (142 | ) | (548 | ) | – | |||||||||||||||||||||||||
| Operating profit |
6,961 | 777 | 83 | 1,105 | 345 | (299 | ) | 8,972 | ||||||||||||||||||||||||
| Net finance costs |
(814 | ) | 5 | (1 | ) | (810 | ) | |||||||||||||||||||||||||
| Share of after-tax profits of associates and joint ventures |
74 | 74 | ||||||||||||||||||||||||||||||
| Profit before taxation |
6,221 | 777 | 83 | 1,110 | 345 | (300 | ) | 8,236 | ||||||||||||||||||||||||
| Taxation |
(953 | ) | (156 | ) | (17 | ) | (208 | ) | (124 | ) | 140 | (1,318 | ) | |||||||||||||||||||
| Tax rate |
15.3% | 16.0% | ||||||||||||||||||||||||||||||
| Profit after taxation |
5,268 | 621 | 66 | 902 | 221 | (160 | ) | 6,918 | ||||||||||||||||||||||||
| Profit attributable to non-controlling interests |
623 | 164 | 787 | |||||||||||||||||||||||||||||
| Profit attributable to shareholders |
4,645 | 621 | 66 | 902 | 57 | (160 | ) | 6,131 | ||||||||||||||||||||||||
| Earnings per share |
93.9p | 12.6p | 1.3p | 18.2p | 1.2p | (3.3)p | 123.9p | |||||||||||||||||||||||||
| Weighted average number of shares (millions) |
4,947 | 4,947 | ||||||||||||||||||||||||||||||
64 GSK Annual Report 2020
|
Strategic report
| ||
|
Governance and remuneration
| ||
|
Financial statements
| ||
|
Investor information
|
Group financial review continued
Adjusting items continued
GSK Annual Report 2020 65
|
|
||
|
|
Group financial review continued
Adjusting items continued
66 GSK Annual Report 2020
|
Strategic report
| ||
|
Governance and remuneration
| ||
|
Financial statements
| ||
|
Investor information
|
Group financial review continued
Adjusting items continued
GSK Annual Report 2020 67
|
|
||
|
|
Group financial review continued
Cash generation and conversion
68 GSK Annual Report 2020
|
Strategic report
| ||
|
Governance and remuneration
| ||
|
Financial statements
| ||
|
Investor information
|
Group financial review continued
Financial position and resources
GSK Annual Report 2020 69
|
|
||
|
|
Group financial review continued
Financial position and resources continued
70 GSK Annual Report 2020
|
Strategic report
| ||
|
Governance and remuneration
| ||
|
Financial statements
| ||
|
Investor information
|
Group financial review continued
Financial position and resources continued
Maturity profile of bond debt
GSK Annual Report 2020 71
|
|
||
|
|
Group financial review continued
Financial position and resources continued
72 GSK Annual Report 2020
|
Strategic report
| ||
|
Governance and remuneration
| ||
|
Financial statements
| ||
|
Investor information
|
Group financial review continued
Financial position and resources continued
GSK Annual Report 2020 73
|
|
||
|
|
Group financial review continued
Treasury policies
74 GSK Annual Report 2020
|
Strategic report
| ||
|
Governance and remuneration
| ||
|
Financial statements
| ||
|
Investor information
|
Group financial review continued
Critical accounting policies
GSK Annual Report 2020 75
|
|
||
|
|
Group financial review continued
Critical accounting policies continued
Strategic report
The Strategic report was approved by the Board of Directors on
8 March 2021
Iain Mackay
Chief Financial Officer
8 March 2021
76 GSK Annual Report 2020
|
Strategic report
| ||
|
Governance and remuneration
| ||
|
Financial statements
| ||
|
Investor information
|
Corporate Governance
| In this section |
|
|||||||||||
| Chairman’s Governance statement | 78 | |||||||||||
| The Board |
80 | |||||||||||
| Corporate Executive Team
|
|
83
|
|
|||||||||
| Board architecture
|
|
85
|
|
|||||||||
| Board roles and responsibilities
|
|
86
|
|
|||||||||
| Board activity and principal decisions | 87 | |||||||||||
| Our purpose, values and culture
|
|
90
|
|
|||||||||
| The Board’s approach to engagement | 91 | |||||||||||
| Board performance
|
|
94
|
|
|||||||||
| Board Committee information | 96 | |||||||||||
| Our Board Committee reports | 97 | |||||||||||
| Section 172 statement | 108 | |||||||||||
| Directors’ report |
109 | |||||||||||
| GSK Annual Report 2020 77 | ||||||||||||
|
Strategic report
| ||
|
Governance and remuneration
| ||
|
Financial statements
| ||
|
Investor information
|
GSK Annual Report 2020 79
|
|
||
|
|
|
Board composition
|
Board diversity
|
International experience
|
||||||||||||||||||||||
|
Composition |
|
Gender |
|
|||||||||||||||||||||
| Executive | 25% | Male | 58% | Global | 92% | |||||||||||||||||||
| Non-Executive | 75% | Female | 42% | US | 100% | |||||||||||||||||||
| Tenure Non-Executive |
|
Ethnicity |
Europe | 92% | ||||||||||||||||||||
| Up to 3 years | 22% | Black, Asian and minority ethnic | 8% | EMAP | 83% | |||||||||||||||||||
| 3-6 years | 45% | White | 92% | |||||||||||||||||||||
| 6-9 years | 22% | |||||||||||||||||||||||
| 9-10 years | 11% |
 See more information on page 106
 |
||||||||||||||||||||||
|
Sir Jonathan Symonds, CBE Non-Executive Chairman
Age: 62 Nationality: British Appointed: 1 September 2019
|
Skills and experience Jon has extensive international financial, life sciences and governance experience.
Jon served as an Independent Non-Executive Director of HSBC Holdings plc from April 2014, and as Deputy Group Chairman from August 2018, until his retirement from the Board in February 2020. He was previously Chairman of HSBC Bank plc, Chief Financial Officer of Novartis AG, Partner and Managing Director of Goldman Sachs, Chief Financial Officer of AstraZeneca plc, and a Partner at KPMG. His governance experience includes roles as Non-Executive Director and Chair of the Audit Committees of Diageo plc and QinetiQ Group plc and Non-Executive Chair of Proteus Digital Health Inc.
Jon is a Fellow of the Institute of Chartered Accountants in England and Wales.
External appointments Non-Executive Director, Rubius Therapeutics, Inc; Non-Executive Director, Genomics England Limited having previously served as its Chairman; Member, European Round Table for Industry.
| |
|
Dame Emma Walmsley Chief Executive Officer
Age: 51 Nationality: British Appointed: 1 January 2017 Chief Executive Officer from 1 April 2017 |
Skills and experience Prior to her appointment as GSK’s CEO, Emma was the CEO of GSK Consumer Healthcare, a Joint Venture between GSK and Novartis, from its creation in March 2015. Emma joined GSK in 2010 from L’Oreal, having worked for 17 years in a variety of roles in Paris, London, New York and Shanghai. Emma was previously a Non-Executive Director of Diageo plc.
Emma holds an MA in Classics and Modern Languages from Oxford University.
External appointments Independent director, Microsoft, Inc; Honorary Fellow, Royal Society of Chemistry.
| |
|
Iain Mackay Chief Financial Officer
Age: 59 Nationality: British Appointed: 14 January 2019 Chief Financial Officer from 1 April 2019 |
Skills and experience Prior to joining GSK, Iain was Group Finance Director at HSBC Holdings plc, a position he held for eight years. A chartered accountant, Iain has worked in Asia, the US and Europe and before HSBC was at General Electric, Schlumberger Dowell and Price Waterhouse. Iain was previously a Trustee of the British Heart Foundation and Chair of its Audit and Risk Committee.
Iain holds an MA in Business Studies and Accounting and holds an Honorary Doctorate from Aberdeen University in Scotland.
Iain is a member of the Institute of Chartered Accountants of Scotland.
External appointments Member, Court of the University of Aberdeen and Chair of its Remuneration Committee; Member, The 100 Group and Chair of its Financial Reporting Committee.
| |
|
Dr Hal Barron Chief Scientific Officer and President, R&D
Age: 58 Nationality: American Appointed: 1 January 2018 Chief Scientific Officer and President, R&D from 1 April 2018 |
Skills and experience Prior to joining GSK, Hal was President, R&D at Calico LLC (California Life Company), an Alphabet- funded company that uses advanced technologies to increase understanding of lifespan biology. Prior to this, Hal was Executive Vice President, Head of Global Product Development, and Chief Medical Officer of Roche, responsible for all the products in the combined portfolio of Roche and Genentech. At Genentech, he was Senior Vice President of Development and Chief Medical Officer. Hal was a Non-Executive Director and Chair of the Science & Technology Committee at Juno Therapeutics, Inc until March 2018, when it was acquired by Celgene Corporation.
External appointments Associate Adjunct Professor, Epidemiology & Biostatistics, University of California, San Francisco; Non-Executive Board Director, GRAIL, Inc, an early cancer detection healthcare company; Advisory Board Member, Verily Life Sciences LLC, a subsidiary of Alphabet, Inc.
|
Key
 Committee Chair
 Nominations & Corporate Governance
 Audit & Risk
 Remuneration
 Science
 Corporate Responsibility
 Transformation & Separation
80 GSK Annual Report 2020
|
Strategic report
| ||
|
Governance and remuneration
| ||
|
Financial statements
| ||
|
Investor information
|
The Board continued
|
Charles Bancroft Independent Non-Executive Director
Age: 61 Nationality: American Appointed: 1 May 2020
|
Skills and experience Charlie has a wealth of financial and management experience in global biopharma.
Charlie retired from a successful career at Bristol Myers Squibb (BMS) in March 2020 where he held a number of leadership roles in commercial, strategy and finance. Beginning his career at BMS in 1984, he held positions of increasing responsibility within the finance organisation and had commercial operational responsibility for Latin America, Middle East, Africa, Canada, Japan and several Pacific Rim countries. He was appointed Chief Financial Officer in 2010, Chief Financial Officer and Executive Vice President, Global Business Operations in 2016 and Executive Vice President and Head of Integration and Strategy & Business Development in 2019. Charlie successfully steered BMS through a period of strategic transformation, including its recent $74bn acquisition of Celgene. Charlie also served as a member of the Board of Colgate-Palmolive Company from 2017 until March 2020.
External appointments Board Member, Kodiak Sciences Inc; Board Member, BioVector Inc; Advisory Board Member, Drexel University’s LeBow College of Business.
The Board determined that Charlie has recent and relevant financial experience and agreed that he has the appropriate qualifications and background to be an audit committee financial expert.
| |
|
Manvinder Singh (Vindi) Banga Senior Independent Non-Executive Director
Age: 66 Nationality: British Appointed: 1 September 2015 Senior Independent Non-Executive Director from 5 May 2016
|
Skills and experience Vindi has many years of commercial experience and a track record of delivering outstanding performance in highly competitive global consumer-focused businesses.
Prior to joining GSK, Vindi spent 33 years at Unilever plc, where his last role (amongst several senior positions) was President of the Global Foods, Home and Personal Care businesses, and a member of the Unilever Executive Board. Vindi sat on the Prime Minister of India’s Council of Trade & Industry from 2004 to 2014 and was on the Board of Governors of the Indian Institute of Management (IIM), Ahmedabad. Vindi is also the recipient of the Padma Bhushan, one of India’s highest civilian honours. Vindi has been a Non-Executive Director of the Confederation of British Industry (CBI) and Thomson Reuters Corp, Chairman of the Supervisory Board of Mauser Group, Chairman of Kalle GmbH and Senior Independent Director of Marks & Spencer Group plc.
External appointments Partner, Clayton Dubilier & Rice; Director, High Ridge Brands Co; Non-Executive Director, The Economist Newspaper Limited; Member, Holdingham International Advisory Board; Board Member, International Chamber of Commerce United Kingdom; Member, Governing Board of the Indian School of Business, Hyderabad; Member, Global Leadership Council of Saïd Business School, Oxford; Member, Indo UK CEO Forum; Chair of the Board of Trustees, Marie Curie.
| |
|
Dr Vivienne Cox, CBE Independent Non-Executive Director & Workforce Engagement Director
Age: 61 Nationality: British Appointed: 1 July 2016
|
Skills and experience Vivienne has wide experience of business gained in the energy, natural resources and publishing sectors. She also has a deep understanding of regulatory organisations and government.
Vivienne worked for BP plc for 28 years, in Britain and Continental Europe, in posts including Executive Vice President and Chief Executive of BP’s gas, power and renewable business and its alternative energy unit. Vivienne was previously a Non-Executive Director of BG Group plc and Rio Tinto plc and the Lead Independent Director at the UK Government’s Department for International Development. Vivienne was appointed Commander of the Order of the British Empire in the 2016 New Year Honours for services to the UK Economy and Sustainability.
External appointments Senior Independent Director, Pearson plc; Chairman of the Supervisory Board, Vallourec; Non- Executive Director, Stena AB; Advisory Board Member, African Leadership Institute; Vice President, Energy Institute; Advisory Board Member, Montrose Associates; Chair, Rosalind Franklin Institute; Vice Chair, Saïd Business School, Oxford and member of its Global Leadership Council; Patron, Hospice of St Francis.
| |
|
Lynn Elsenhans Independent Non-Executive Director
Age: 64 Nationality: American Appointed: 1 July 2012
|
Skills and experience Lynn has a wealth of experience running a global business and significant knowledge of the global markets in which GSK operates.
Lynn served as Chair, President and Chief Executive Officer of Sunoco Inc from 2009 to 2012. Prior to joining Sunoco in 2008 as President and Chief Executive Officer, Lynn worked for Royal Dutch Shell, which she joined in 1980, and where she held a number of senior roles, including Executive Vice President, Global Manufacturing from 2005 to 2008. Lynn was previously a Non-Executive Director of the First Tee of Greater Houston, Flowserve Corporation and the Texas Medical Center, and a Trustee of the United Way of Greater Houston.
External appointments Non-Executive Director and Chair of the Governance and Corporate Responsibility Committee, Baker Hughes Company; Board Director and Chair of the Audit Committee, Saudi Aramco; Advisory Board Member, Johns Hopkins University, Whiting School of Engineering; Member, Audit Committee Leadership Network.
|
Key
Committee Chair
Nominations & Corporate Governance
Audit & Risk
Remuneration
Science
Corporate Responsibility
Transformation & Separation
GSK Annual Report 2020 81
|
|
||
|
|
The Board continued
|
Dr Laurie Glimcher Independent Non-Executive Director and Scientific & Medical Expert
Age: 69 Nationality: American Appointed: 1 September 2017
|
Skills and experience Laurie brings scientific and public health expertise to the Board’s deliberations, and a wealth of global, publicly listed pharmaceutical business experience.
In addition to a number of senior leadership positions held at both Harvard Medical School and Harvard School of Public Health, Laurie has also served as Stephen and Suzanne Weiss Dean and Professor of Medicine at Weill Cornell Medical College and as an Attending Physician at the New York Presbyterian Hospital/Weill Cornell Medical Center. Laurie stepped down from the Board of Bristol-Myers Squibb (BMS) in 2017 after serving for 20 years on its Board. Laurie was previously a Non-Executive Director of the Waters Corporation and co-founder and Chair of the Scientific Advisory Board of Quentis Therapeutics Inc.
External appointments Professor of Medicine, Harvard Medical School; CEO, President and Attending Physician, Dana-Farber Cancer Institute.
Member, US National Academy of Sciences and the National Academy of Medicine; Member, Scientific Steering Committee of the Parker Institute for Cancer Immunotherapy; Independent Director, Analog Devices Inc; Member, Scientific Advisory Boards of Repare Therapeutics Inc, Abpro Therapeutics and Kaleido Biosciences Inc.
| |
|
Dr Jesse Goodman Independent Non-Executive Director and Scientific & Medical Expert
Age: 69 Nationality: American Appointed: 1 January 2016
|
Skills and experience Jesse brings scientific and public health expertise to the Board’s deliberations. He has a wealth of experience spanning science, medicine, vaccines, regulation and public health, and has a proven record in addressing pressing public health needs from both the academic and federal sectors.
Jesse previously served in senior leadership positions at the US Food and Drug Administration (FDA), including most recently as the FDA’s Chief Scientist and previously as Deputy Commissioner for Science and Public Health and as Director of the Center for Biologics Evaluation and Research (CBER).
Jesse played a leadership role in developing the FDA’s Regulatory Science and Medical Countermeasures Initiatives and has worked collaboratively with industry, academia, government and global public health and regulatory partners to prepare for and respond to major public health threats, including emerging infectious diseases, disasters and terrorism. He led the FDA’s response to West Nile Virus and to the 2009 H1N1 influenza pandemic and served on the Senior Leadership Team for the 2010 White House Medical Countermeasure Review. Jesse was previously a member of both the Scientific Advisory Committee and the Regulatory and Legal Working Group of the Coalition for Epidemic Preparedness Innovations (CEPI).
External appointments Professor of Medicine and Attending Physician, Infectious Diseases, Georgetown University and directs the Georgetown University Center on Medical Product Access, Safety and Stewardship (COMPASS); Board Member (formerly President), United States Pharmacopeia (USP); Board Member, Scientific Counselors for Infectious Diseases, Centers for Disease Control and Prevention (CDC); Board Member, Intellia Therapeutics Inc; Member, US National Academy of Medicine.
| |
|
Judy Lewent Independent Non-Executive Director
Age: 72 Nationality: American Appointed: 1 April 2011
|
Skills and experience Judy has extensive knowledge of the global pharmaceutical industry and of corporate finance.
Judy joined Merck & Co in 1980 and served as its Chief Financial Officer from 1990 to 2007 when she retired. Judy served as a Non-Executive Director of Dell Inc, Quaker Oats Company and Motorola Inc, and held Non-Executive Directorships at Purdue Pharma Inc, Napp Pharmaceutical Holdings Limited and certain Mundipharma International Limited companies until 2014.
External appointments Non-Executive Director, Thermo Fisher Scientific Inc; Non-Executive Director, Motorola Solutions Inc; Trustee, Rockefeller Family Trust; Life member, Massachusetts Institute of Technology Corporation; Member, American Academy of Arts and Sciences; Business Advisory Board Member, twoXAR; Advisory Board Member, 4D Path Inc.
The Board determined that Judy has recent and relevant financial experience, and agreed that she has the appropriate qualifications and background to be an audit committee financial expert.
| |
|
Urs Rohner Independent Non-Executive Director
Age: 61 Nationality: Swiss Appointed: 1 January 2015
|
Skills and experience Urs has a broad business and legal background and extensive senior level experience at multinational companies.
Urs has served as Chairman on a number of Boards, most recently for Credit Suisse. Prior to joining Credit Suisse in 2004, Urs served as Chairman of the Executive Board and CEO of ProSieben and ProSiebenSat.1 Media AG. This followed a number of years in private practice at major law firms in Switzerland and the US, having been admitted to the bars of the canton of Zurich in Switzerland in 1986 and the state of New York in the US in 1990.
External appointments Chairman of the Board and of the Governance and Nominations Committee, Credit Suisse Group AG; Chairman and member of the Board of Trustees, Credit Suisse Research Institute and Credit Suisse Foundation; Vice-Chairman of the Governing Board, Swiss Bankers Association.
|
Key
Committee Chair
Nominations & Corporate Governance
Audit & Risk
Remuneration
Science
Corporate Responsibility
Transformation & Separation
82 GSK Annual Report 2020
|
Strategic report
| ||
|
Governance and remuneration
| ||
|
Financial statements
| ||
|
Investor information
|
| Skills and experience | ||
| Dr Hal Barron Chief Scientific Officer |
Hal joined GSK and the CET in 2018. See Board biographies on pages 80 to 82. | |
| Roger Connor President, Global Vaccines |
Roger joined the CET in 2013. He was appointed President of GSK Global Vaccines in 2018. In addition to leadership of the Vaccines business, he is responsible for GSK’s global procurement organisation. Roger is also a member of the Gavi board, the Vaccine Alliance, where he represents the International Federation of Pharmaceutical Manufacturers & Associations (IFPMA) constituency. Previously, he was President, Global Manufacturing & Supply and, before that, Vice President, Office of the CEO and Corporate Strategy. Roger joined GSK in 1998 from AstraZeneca. Roger holds a degree in Mechanical and Manufacturing Engineering from Queen’s University, Belfast and a Master’s in Manufacturing Leadership from Cambridge University. He is a Chartered Accountant. | |
| Diana Conrad Senior Vice President, Human Resources (HR) |
Diana was appointed Senior Vice President, Human Resources (HR) and member of the CET in April 2019. She was previously Senior Vice President, HR, Pharmaceuticals R&D from 2016 where she played a key strategic role as leader of the R&D people and culture agenda to support its transformation. | |
| Diana joined GSK Canada’s HR team in 2000 where she held several roles of increasing responsibility before becoming Senior Vice President, HR for Consumer Healthcare in 2009. | ||
| Prior to joining GSK, she held HR roles in companies including GE Capital, Gennum Corporation and Zenon Environmental Laboratories. Diana has an Honours Bachelor of Arts from McMaster University in Canada. | ||
| James Ford Senior Vice President |
James joined the CET in 2018, when he was appointed Senior Vice President and General Counsel. He joined GSK in 1995 and has served as General Counsel Consumer Healthcare, General Counsel Global Pharmaceuticals, Vice President of Corporate Legal and was Acting Head of Global Ethics and Compliance. Prior to GSK, James was a solicitor at Clifford Chance and DLA. He holds a law degree from University of East Anglia and a Diploma in Competition Law from Kings College. He is qualified as a solicitor in England and Wales and is an attorney at the New York State Bar. James is based in London but has practised law and lived in the US, Singapore and Hong Kong. James is co-chair of the US based Civil Justice Reform Group and a director of the European General Counsel Association. | |
| Nick Hirons Senior Vice President, Global Ethics and Compliance |
Nick was appointed to the CET in 2014 as Senior Vice President, Global Ethics and Compliance, responsible for compliance, risk management, corporate security and investigations. Nick joined GSK in 1994 as an International Auditor. He was later Head of Audit & Assurance, where he combined five audit functions into an independent team with a common risk-based methodology. In 2013, Nick relocated to China to establish a governance model for our China business and created a consistent approach to compliance. Nick is a fellow of the Chartered Institute of Management Accountants. | |
| Sally Jackson Senior Vice President, Global Communications and CEO Office |
Sally joined the CET in March 2019 as Senior Vice President, Global Communications and CEO Office. She is responsible for communications and government affairs for our three global businesses and in the markets, as well as employee engagement across the Group. She is also the CEO’s Chief of Staff. Prior to this Sally was Senior Vice President Office of the CEO and CFO and she previously served as Head of Investor Relations. She joined GSK in 2001. Sally holds a degree in Natural Sciences from the University of Cambridge. | |
| Iain Mackay Chief Financial Officer |
Iain joined GSK and the CET in 2019. See Board biographies on page pages 80 to 82. | |
| Brian McNamara CEO, GSK Consumer Healthcare |
Brian joined the CET in 2016, when he was appointed CEO, GSK Consumer Healthcare. He joined GSK in 2015 as Head of Europe and Americas for GSK Consumer Healthcare, following the creation of the previous Joint Venture between GSK and Novartis. Previously, he was head of Novartis’ OTC division. Brian began his career at Procter and Gamble. | |
| Brian is a Board member of the Consumer Goods Forum and former Chairman and Board member of the Global Self-Care Federation (GSCF). He earned an undergraduate degree in Electrical Engineering from Union College in New York and an MBA in Finance from the University of Cincinnati. | ||
GSK Annual Report 2020 83
|
|
||
|
|
Corporate Executive Team continued
| Skills and experience | ||
| Luke Miels President, Global Pharmaceuticals |
Luke joined GSK and the CET in 2017 as President, Global Pharmaceuticals, responsible for our commercial portfolio of medicines and vaccines. Luke also co-chairs the Portfolio Investment Board with Hal. | |
| He previously worked for AstraZeneca as Executive Vice President of their European business and, prior to that, was Executive Vice President of Global Product and Portfolio Strategy, Global Medical Affairs and Corporate Affairs. Before that, he was head of Asia for Roche based in Shanghai and then Singapore. Prior to that he held roles of increasing seniority at Roche and Sanofi-Aventis in the US, Europe and Asia. | ||
| Luke holds a Bachelor of Science degree in Biology from Flinders University in Adelaide and an MBA from the Macquarie University, Sydney. | ||
| David Redfern Chief Strategy Officer |
David joined the CET as Chief Strategy Officer in 2008 and is responsible for corporate development and strategic planning. Previously, he was Senior Vice President, Northern Europe with responsibility for GSK’s pharmaceutical businesses in that region and, before that, he was Senior Vice President for Central and Eastern Europe. He joined GSK in 1994. David was appointed Chairman of the Board of ViiV Healthcare Limited in 2011 and a Non-Executive Director of the Aspen Pharmacare Holdings Limited Board in 2015. | |
| He has a Bachelor of Science degree from Bristol University and is a Chartered Accountant. | ||
| Regis Simard President, Pharmaceuticals Supply Chain |
Regis joined the CET in 2018, when he became President, Pharmaceuticals Supply Chain. He is responsible for the manufacturing and supply of GSK’s pharmaceutical products. He also leads Quality and Environment, Health, Safety and Sustainability at a corporate level. Regis joined GSK in 2005 as a Site Director in France, rising to become Senior Vice President of Global Pharmaceuticals Manufacturing before his current role. Previously, he held senior positions at Sony, Konica Minolta and Tyco Healthcare. He is a member of the Board for ViiV Healthcare. | |
| He is a mechanical engineer and holds an MBA. | ||
| Karenann Terrell Chief Digital & Technology Officer |
Karenann joined GSK and the CET in 2017 as Chief Digital & Technology Officer, responsible for our technology, digital, data and analytics strategy. Previously, she worked for Walmart as Chief Information Officer. Prior to this, she was at Baxter International, where she was Chief Information Officer, and before that Daimler Chrysler Corporation. Karenann be gan her career at General Motors. In 2017 she became a Non-Executive Director of Pluralsight LLC. | |
| She earned graduate and post-graduate degrees in Electrical Engineering from Kettering and Purdue Universities respectively. | ||
| Phil Thomson President, Global Affairs |
Phil joined the CET in 2011. He was appointed President, Global Affairs in 2017, with responsibility for the Group’s strategic approach to reputation, policy development, stakeholder engagement, and Global Health. Previously, Phil was Senior Vice President, Communications and Government Affairs. | |
| Phil is Chairman of The Whitehall & Industry Group and a Board member of the China–Britain Business Council. | ||
| He earned his degree in English, History and Russian Studies from Durham University. | ||
| Emma Walmsley Chief Executive Officer |
Emma joined GSK in 2010 and the CET in 2011. See Board biographies on pages 80 to 82. | |
| Deborah Waterhouse CEO, ViiV Healthcare |
Deborah was appointed to the CET in January 2020. She became Chief Executive Officer of ViiV Healthcare in April 2017. | |
| Deborah joined GSK in 1996 and was most recently the Senior Vice President of Primary Care within the company’s US business, prior to which she led the US Vaccines business. She has a strong track record of performance in both specialty and primary care. Deborah led the HIV business in the UK before heading the HIV Centre of Excellence for Pharma Europe and held international roles as General Manager of Australia and New Zealand and Senior Vice President for Central and Eastern Europe. | ||
84 GSK Annual Report 2020
|
Strategic report
| ||
|
Governance and remuneration
| ||
|
Financial statements
| ||
|
Investor information
|
In 2020, we enhanced our corporate governance framework to further improve the effectiveness of the Board and the way it works, and to support the Corporate Executive Team (CET) in delivering the transformation of our biopharma business and the planned separation of Consumer Healthcare.
GSK’s internal control and risk management arrangements, described on pages 98 and 99 and 43 to 49, are an integral part of our corporate governance framework.
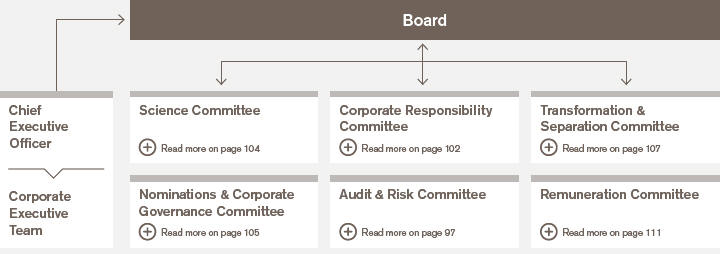
|
|
See page 96 for more about the roles and membership of each Board Committee. |
Attendance at scheduled Board and Committee meetings during 2020
| Board | Nominations & Corporate Governance |
Audit & Risk | Remuneration | Science | Corporate Responsibility |
Transformation & Separation | ||||||||||||||||||||||
|
|
||||||||||||||||||||||||||||
| Total number of scheduled meetings |
6 | 5 | 6 | 5 | 3 | 4 | 4 | |||||||||||||||||||||
|
|
|
|
|
|
|
|
|
|
|
|
|
|
|
|
|
|
|
|
|
|
| |||||||
| Members |
Attended | Attended | Attended | Attended | Attended | Attended | Attended | |||||||||||||||||||||
|
|
|
|
|
|
|
|
|
|
|
|
|
|
|
|
|
|
|
|
|
|
| |||||||
| Sir Jonathan Symonds |
6 | 5 | 4 | |||||||||||||||||||||||||
|
|
|
|
|
|
|
|
|
|
|
|
|
|
|
|
|
|
|
|
|
|
| |||||||
| Emma Walmsley |
6 | |||||||||||||||||||||||||||
|
|
|
|
|
|
|
|
|
|
|
|
|
|
|
|
|
|
|
|
|
|
| |||||||
| Iain Mackay |
6 | |||||||||||||||||||||||||||
|
|
|
|
|
|
|
|
|
|
|
|
|
|
|
|
|
|
|
|
|
|
| |||||||
| Dr Hal Barron |
6 | |||||||||||||||||||||||||||
|
|
|
|
|
|
|
|
|
|
|
|
|
|
|
|
|
|
|
|
|
|
| |||||||
| Charles Bancroft* |
4 (4) | 4 (4) | 4 | |||||||||||||||||||||||||
|
|
|
|
|
|
|
|
|
|
|
|
|
|
|
|
|
|
|
|
|
|
| |||||||
| Vindi Banga |
6 | 5 | 6 | 5 | 4 | |||||||||||||||||||||||
|
|
|
|
|
|
|
|
|
|
|
|
|
|
|
|
|
|
|
|
|
|
| |||||||
| Dr Vivienne Cox |
6 | 5 | 4 | 3 | ||||||||||||||||||||||||
|
|
|
|
|
|
|
|
|
|
|
|
|
|
|
|
|
|
|
|
|
|
| |||||||
| Lynn Elsenhans |
6 | 4 | 6 | 4 | 4 | |||||||||||||||||||||||
|
|
|
|
|
|
|
|
|
|
|
|
|
|
|
|
|
|
|
|
|
|
| |||||||
| Dr Laurie Glimcher |
6 | 6 | 3 | |||||||||||||||||||||||||
|
|
|
|
|
|
|
|
|
|
|
|
|
|
|
|
|
|
|
|
|
|
| |||||||
| Dr Jesse Goodman |
6 | 3 | 4 | |||||||||||||||||||||||||
|
|
|
|
|
|
|
|
|
|
|
|
|
|
|
|
|
|
|
|
|
|
| |||||||
| Judy Lewent |
6 | 5 | 6 | 5 | 3 | 4 | ||||||||||||||||||||||
|
|
|
|
|
|
|
|
|
|
|
|
|
|
|
|
|
|
|
|
|
|
| |||||||
| Urs Rohner |
6 | 5 | 5 | 4 | ||||||||||||||||||||||||
|
|
|
|
|
|
|
|
|
|
|
|
|
|
|
|
|
|
|
|
|
|
| |||||||
| Number of ad-hoc meetings |
21 | 6 | 5 | 4 | ||||||||||||||||||||||||
|
|
|
|
|
|
|
|
|
|
|
|
|
|
|
|
|
|
|
|
|
|
| |||||||
| * | For Charles Bancroft, who joined the Board and the Audit & Risk Committee on 1 May 2020, the numbers in brackets denote the number of meetings he was eligible to attend. |
GSK Annual Report 2020 85
|
|
||
|
|
Board roles and responsibilities
|
Leadership
|
Independent oversight and rigorous challenge
| |
|
Chairman Jonathan Symonds
– Leads and manages the business of the Board – Provides direction and focus – Ensures clear structure for effective operation of the Board and its Committees – Sets Board agenda and ensures sufficient time is allocated to promote effective debate to support sound decision making – Ensures the Board receives accurate, timely and clear information – Meets with each Non-Executive Director on an annual basis to discuss individual contributions and performance, together with training and development needs – Shares peer feedback that is provided as part of the Board evaluation process – Meets regularly with all the Non-Executive Directors independently of the Executive Directors – Maintains a dialogue with shareholders on the governance of the company. .
Chief Executive Officer Emma Walmsley – Responsible for the management of the Group and its three businesses – Develops the Group’s strategic direction for consideration and approval by the Board – Implements the agreed strategy – Is supported by members of the CET – Maintains a continual and active dialogue with shareholders in respect of the company’s performance. .
|
Non-Executive Directors
– Provide a strong independent element to the Board – Constructively support and challenge management and scrutinise their performance in meeting agreed deliverables – Shape proposals on strategy and offer specialist advice to management – Each has a letter of appointment setting out the terms and conditions of their directorship – Devote such time as is necessary to the proper performance of their duties – Are expected to attend all meetings as required.
Independence statement The Board considers all of its Non-Executive Directors who are identified on pages 81 and 82 to be independent after being assessed against the circumstances set out in Provision 10 of the 2018 Code. The reviews of the continuing independence and commitment of both Judy Lewent, who has served on the Board for more than nine years, and Lynn Elsenhans, who will after 1 July 2021 have served on the Board for more than nine years, are described on pages 105 and 106.
Senior Independent Director Vindi Banga
– Acts as a sounding board for the Chairman and a trusted intermediary for other Directors – Together with the Non-Executive Directors, leads the annual review of the Chairman’s performance, taking into account views of the Executive Directors – Discusses the results of the Chairman’s effectiveness review with the Chairman – Leads the search and appointment process and makes the recommendation to the Board for a new Chairman – Acts as an additional point of contact for shareholders, maintains an understanding of the issues and concerns of major shareholders through briefings from the Company Secretary and Investor Relations.
| |

|
86 GSK Annual Report 2020
|
Strategic report
| ||
|
Governance and remuneration
| ||
|
Financial statements
| ||
|
Investor information
|
Board activity and principal decisions
The Board discharges its responsibilities through an annual programme of meetings. Papers and presentations to the Board (and its Committees) focus its oversight of performance and the driving of the company’s strategic direction. They are designed to either:
| – | Facilitate effective decision making, being categorised for ‘awareness’, ‘input’ and/or ‘decision’, or |
| – | Aid the Board’s oversight of the business, being for ‘awareness’ only. |
Items of business considered ‘mission critical’ to GSK’s long-term success are highlighted below.
| Areas of focus in 2020 | Long-term priorities link | |||||||||||
| Strategy | The Board’s oversight of the execution of our strategy included: | |||||||||||
|
| ||||||||||||
| MC |
– | Receiving and discussing reports from Pharmaceuticals, Vaccines and Consumer Healthcare |

|

|

|

| ||||||
|
| ||||||||||||
| MC |
– | Holding a joint Board and CET strategy day to discuss plans for the two successor businesses up to and beyond separation |
|
|
|
| ||||||
|
| ||||||||||||
| – | Receiving quarterly reports from the Chief Executive Officer (CEO), Chief Financial Officer (CFO) and Chief Scientific Officer (CSO) |
|
|
|
| |||||||
|
| ||||||||||||
| MC |
– | Discussing and scrutinising ‘Future Ready’ plans for transforming Biopharma and Consumer Healthcare |
|
|
|
|||||||
|
| ||||||||||||
| MC |
– | Scrutinising and approving major collaborations with third parties to develop vaccines and treatments for COVID-19 |
|
|
|
|||||||
|
| ||||||||||||
| MC |
– | Approving business development transactions and strategic partnerships with third parties, including the mRNA technology collaboration with CureVac following a review of Vaccines technology |
|
|
|
|||||||
|
| ||||||||||||
| – | Reviewing and approving divestment of non-strategic Consumer Healthcare brands |
|
|
|||||||||
|
| ||||||||||||
| Performance | The Board’s focus on performance included: | |||||||||||
|
| ||||||||||||
| – | Evaluating the CEO’s 2019 performance, and setting 2020 objectives |
|
|
|
| |||||||
|
| ||||||||||||
| MC |
– | Setting the annual budget and plan, and the forward-looking three-year forecast |
|
|
||||||||
|
| ||||||||||||
| – | Annual talent and succession plan review |
|
|
|
| |||||||
|
| ||||||||||||
| – | Scrutinising the Group’s financial performance |
|
|
|||||||||
|
| ||||||||||||
| – | Reviewing the risks and impacts of COVID-19 on the Group’s business and performance |
|
|
|
| |||||||
|
| ||||||||||||
| – | Reviewing the quarterly financial results, dividend proposal, earnings guidance, investor materials and results announcements |
|
|
|||||||||
|
| ||||||||||||
| – | Confirming the viability and going concern statements |
|
|
|||||||||
|
| ||||||||||||
| – | Approval of the statutory accounts |
|
|
|||||||||
|
| ||||||||||||
| Science | The Board’s focus on science included: | |||||||||||
|
| ||||||||||||
| – | Briefings on the key elements of R&D strategy: |
|
||||||||||
|
| ||||||||||||
| MC |
– | Review of R&D Science x Technology x Culture strategy |
|
|||||||||
|
| ||||||||||||
| MC |
– | Receiving updates on the progress of key R&D assets, including the impact of COVID-19 |
|
|
||||||||
|
| ||||||||||||
| MC |
– | Receiving and approving if appropriate, a number of business development transactions to further strengthen the pipeline |
|
|||||||||
|
| ||||||||||||
| Governance | The Board’s focus on governance included: | |||||||||||
| – | Receiving reports from its Committees |
|
||||||||||
|
| ||||||||||||
| – | Receiving reports from the external auditor |
|
|
|||||||||
|
| ||||||||||||
| – | Approving the appointment of a new Non-Executive Director, audit committee financial expert and successor Audit & Risk Committee Chair |
|
|
|
||||||||
|
| ||||||||||||
| – | Establishing a new Committee to focus on Transformation & Separation |
|
||||||||||
|
| ||||||||||||
| – | Approving the 2019 Annual Report and Form 20-F |
|
||||||||||
|
| ||||||||||||
| – | Receiving reports on corporate governance and regulatory developments and the Company Secretary’s report |
|
||||||||||
|
| ||||||||||||
| – | Considering conclusions and agreeing actions from the Board’s external evaluation |
|
|
|||||||||
|
| ||||||||||||
| MC |
– | Setting the Board’s 2020-2022 priorities |
|
|
|
| ||||||
|
| ||||||||||||
| – | Reviewing our modern slavery statement and gender pay gap positioning |
|
||||||||||
|
| ||||||||||||
| MC |
– | Annual review of the Board’s Enterprise Risk Responsibility Framework and Enterprise-wide Risks |
|
|||||||||
|
| ||||||||||||
| Cultural transformation | – | Receiving updates on cultural transformation progress |
|
|
|
| ||||||
|
| ||||||||||||
| Our stakeholders | The Board’s consideration for stakeholder impacts included: | |||||||||||
|
| ||||||||||||
| – | Reviewing the Board’s governance architecture |
|
|
|
| |||||||
|
| ||||||||||||
| – | Considering reports from the Workforce Engagement Director |
|
|
|
| |||||||
|
| ||||||||||||
| – | Discussing reports on annual employee survey results |
|
|
|
| |||||||
|
| ||||||||||||
| – | Reviewing stakeholder perception research |
|
|
|
| |||||||
|
| ||||||||||||
Mission critical items MC Link to long-term
priorities:
Innovation
Performance
Trust
Culture
GSK Annual Report 2020 87
|
|
||
|
|
Board activity and principal decisions continued
Board members consider the interests of GSK’s key stakeholders and how their decisions could potentially affect them. Papers considered by the Board and its Committees seek to highlight relevant stakeholder impacts of proposals under consideration – whether positive or negative – in support of this duty and the decision-making process.
Selected examples of 2020’s principal decisions, and how the Board considered stakeholder perspectives, are set out below:
| Decisions | How Board/Committee regarded stakeholder interests |
Stakeholder groups, and other section 172 duties considered |
Principal decision made by our Board/Committees | |||
| Business development, collaborations and deals (including COVID-19) |
The Science Committee and the Board reviewed several business development opportunities and COVID-19 collaborations. Those leading to concluded transactions included:
– A strategic collaboration with CureVac to access its mRNA platform capability to supplement GSK’s SAM technology following a review of Vaccines technology
– A TB consortium collaboration to develop a novel treatment for TB
– A partnership with IDEAYA Biosciences in synthetic lethality, an emerging field in precision medicine oncology
– A collaboration with Vir Biotechnology, to identify potential COVID-19 treatment options
– Partnerships with Sanofi, Medicago and Clover for three potential COVID-19 vaccines using different technologies
These arrangements were considered in the context of their potential to help GSK deliver transformational medicines to patients |
Stakeholders: Patients, consumers, employees and investors
Other s172 duties: Our long-term results, workforce and business relationships |
The Science Committee considered the scientific merits of these business development opportunities prior to the Board’s review and approval | |||
| Commercial model changes in China and other selected markets |
The Audit & Risk Committee (ARC) considered, and recommended to the Board, changes in our healthcare professionals (HCP) engagement and sales force incentive (SFI) programme in China and other selected markets. This reflected the growing shift in GSK’s portfolio to innovative Specialty Care products and our aim to increase competitiveness and build further on the initial phased roll out of the new SFI programme in 2019
It examined these changes as a means of:
– Attracting and retaining the best sales force talent in China
– Increasing the sales force’s accountability and performance focus – Enhancing the quality of our dialogue with HCPs in China
– Helping us to serve patients better
The ARC agreed robust governance arrangements to underpin these changes, including real-time monitoring and advanced data analytics. These uphold our ethical and values-led approach to HCP engagement |
Stakeholders: HCPs, other medical experts, employees, investors, governments, regulators, patients and consumers
A Non-Executive Director briefing workshop was held as part of the ARC review process. This enabled the Board to meet the China Pharmaceuticals Leadership Team and discuss the country’s commercial policy, risk management and compliance culture
Other s172 duties: Our long-term results, workforce, business relationships and reputation |
The ARC recommended these limited SFI programme changes to the Board for approval
To safeguard key stakeholder interests, the new programme is being implemented in controlled phases across markets. A review of the robustness of the programme’s governance arrangements was presented to the ARC at the end of 2020 | |||
88 GSK Annual Report 2020
|
Strategic report
| ||
|
Governance and remuneration
| ||
|
Financial statements
| ||
|
Investor information
|
Board activity and principal decisions continued
| Decisions | How Board/Committee has had regard to stakeholder interests |
Stakeholder groups and other section 172 duties considered |
Principal decision made by the Board/Committees | |||
| COVID-19 solutions and pandemic preparedness investment | The Corporate Responsibility Committee: | Stakeholders: HCPs, other medical experts, employees, investors, governments, regulators, non- governmental organisations, multilateral organisations, patients and consumers |
The Committee recommended, and the Board approved, the proposals because they fully aligned with our purpose, strategy and areas of business focus | |||
| – Considered GSK’s approach to COVID-19 solutions with our vaccines, adjuvant, and therapeutics pricing, supply, and allocation | ||||||
| – Agreed the proposal to commit profits from the sales of COVID-19 vaccines during the pandemic to investment in pandemic preparedness |
||||||
| The Committee was pleased to agree GSK’s COVID-19 solutions’ approach and principles: working in partnership, taking a global approach, committing to access, and supporting future pandemic preparedness. This approach seeks to strike a balance between generating economic return by rewarding innovation and investing in our business, while acting responsibly towards our key stakeholders in supporting the global response to the pandemic | ||||||
| New environmental sustainability goals | The Corporate Responsibility Committee received and considered a proposal to review and develop our existing environmental sustainability targets
These ambitious new targets firmly aligned to expectations on environmental sustainability across our key stakeholder groups, with a focus on climate change and damage to nature
The Committee agreed that addressing this expectation would positively impact GSK’s reputation, employee engagement and equity position, and mitigate our exposure to financial and supply chain risk |
Stakeholders: Investors, employees, governments, regulators, non-governmental organisations and multilateral organisations
Others 172 duties: Our long-term results, workforce, business relationships, community, environment and reputation |
The Committee recommended, and the Board agreed, this step-change in the scale and pace of addressing our impact on the environment by committing to a goal of net zero impact on climate and a positive impact on nature across our value chain by 2030
This will contribute to protecting and restoring a healthy planet to improve people’s health. By linking these goals to actions to remove carbon, improve biodiversity and restore local water basins, we will demonstrate a ‘nature positive’ approach, by giving back more than we take | |||
| Inclusion and diversity | The Corporate Responsibility Committee received and considered a proposal:
– For greater transparency of employee race and ethnicity data and aspirations in 2021. This supports our aspiration to increase the percentage of our leaders who identify as ethnically diverse
– To further increase our global gender aspiration
The Committee noted that:
– Our strategic commitment to being a modern employer was a key component of the Trust priority, with a strong employee experience being critical to attracting and retaining key talent to deliver our Innovation, Performance and Trust priorities underpinned by culture
– As part of our broader efforts in the area of race, ethnicity and gender this proposal was consistent with:
– Our approach to inclusion and diversity (I&D), which focuses on ensuring our workforce reflects communities in which we work and hire
– Disclosing gender diversity data and aspiration setting globally |
Stakeholders: Investors, employees, governments, regulators, non-governmental organisations and multilateral organisations
Others 172 duties: Our long-term results, workforce, business relationships, community, environment and reputation |
The Committee supported the proposal and the Board agreed to:
– Report employee race and ethnicity data in the 2020 Annual Report, accompanied by our headline aspirational statement
– More detailed external disclosure of US and UK data and specific aspirational targets for delivery by the end of 2025
– Increase our global gender aspiration for VP and above roles to 45%, or higher, by the end of 2025 | |||
GSK Annual Report 2020 89
|
|
||
|
|
The Board’s approach to engagement continued
Workforce Engagement Director
92 GSK Annual Report 2020
|
Strategic report
| ||
|
Governance and remuneration
| ||
|
Financial statements
| ||
|
Investor information
|
The Board’s approach to engagement continued
GSK Annual Report 2020 93
|
Strategic report
| ||
|
Governance and remuneration
| ||
|
Financial statements
| ||
|
Investor information
|
Board performance continued
Progress on 2019 Board evaluation
Progress against the conclusions of the 2019 Board evaluation review is set out below.
| Areas of focus for 2020 | Progress/Achievements | |
| Meetings and organisation To improve the balance between presentation and discussion to create more time for debate |
Board and Committee presentations are organised around a brief summary of the key issues and questions to be addressed, so the majority of the allotted time is given over to Q&As, discussion and decisions | |
| Board dynamics and individual contributions To facilitate even greater individual contributions by creating more discussion time |
Board and Committee agendas, papers and presentations have been further evolved and organised to allow more time for Board members to provide insights and perspectives on matters critical to Board priorities | |
| Committees To review the remit and attendees at the Board’s Committee meetings to ensure they are fit for purpose for 2020 and beyond |
Board Committee terms of reference were updated and a new Transformation & Separation Committee was established by the Board in March 2020 | |
| Risk To agree which Board Committee will ensure deeper oversight and review of each of the Group’s enterprise risks |
This exercise was completed by the Board. The terms of reference of the relevant Board Committee were updated to reflect the agreed reallocation of enterprise risk oversight responsibilities | |
| Strategy and performance To conduct deep dives into the key strategic areas and ensure a focus on supporting management to execute the agreed strategy |
Board and Committee agendas have been organised to emphasise and allocate time for discussing ‘mission critical’ input and decision papers, to reinforce the focus on strategic execution | |
| Board knowledge To deepen the Board’s knowledge and understanding of the latest scientific developments |
The Board benefitted from greater insight into GSK’s R&D strategy from several R&D science theme deep dives during the year, specifically human genetics, COVID-19 vaccines, mRNA technology and AI and ML | |
| Stakeholders Within the business, the Board should continue to focus on the key areas of focus for the CET, namely: strengthening the R&D pipeline, growth, transformation and delivery of GSK’s Trust business priority |
The Board is aligned with the CET on delivering these mission critical items for the benefit of all our key stakeholders | |
| Externally, it should maintain strong relationships and communication with shareholders and other key stakeholders to seek their input and keep them well informed on progress | For more information on this continuing area of focus, see page 16 | |
| Succession planning To complete the appointment of the Audit & Risk Committee (ARC) Chair’s successor |
Charles Bancroft joined the Board and the ARC on 1 May 2020. He will succeed Judy Lewent as ARC Chair in March 2021, after this Annual Report is published | |
| Governance To build further on GSK’s commitment to environmental, social and governance (ESG) matters |
The Board approved, and the company announced, ambitious new environmental sustainability goals: to have a net zero impact on climate and a net positive impact on nature by 2030 | |
| A search has been undertaken to seek a successor to Lynn Elsenhans, as Chair of the Corporate Responsibility Committee, Lynn has agreed to serve for another year until she retires from the Board in May 2022. See page 105 for further details | ||
GSK Annual Report 2020 95
|
|
||
|
|
Each Board committee has written terms of reference which have been approved by the Board and are reviewed at least annually to ensure that they comply with the latest legal and regulatory requirements and reflect best practice developments. The following is a summary of the role of each Committee and lists its membership. The current full terms of reference of each Board Committee are available on gsk.com. The number of Committee meetings and Committee members’ attendance are described on page 85.
Details of Committee members’ skills and experience are included in their biographies under ‘The Board’ on pages 81 to 82. In accordance with the FRC’s 2018 Code, the Board has determined that Judy Lewent and Charles Bancroft have recent and relevant financial experience. It has also agreed that they both have the appropriate qualifications and background to be audit committee financial experts as defined by the Sarbanes-Oxley Act of 2002, and has determined that they are independent within the meaning of the Securities Exchange Act of 1934, as amended.
| Board Committee | Role | Membership comprises | Board committee report on page | |||
| Audit & Risk | Reviews the financial reporting process, the integrity of the company’s financial statements, the external and internal audit process, the system of internal control and the identification and management of risks, and the company’s process for monitoring compliance with laws, regulations and ethical codes of practice | Judy Lewent (Chair) Charles Bancroft (from 1 May 2020) Vindi Banga Lynn Elsenhans Dr Laurie Glimcher |
97-102 | |||
| Initiates audit tenders, the selection and appointment of the external auditor, setting their remuneration and exercising oversight of their work | ||||||
| Corporate Responsibility | Considers GSK’s Trust priority and oversight of progress against the associated Trust commitments which reflect the most important issues for responsible and sustainable business growth. It has oversight of the views and interests of our internal and external stakeholders and reviews issues that have the potential for serious impact upon GSK’s business and reputation | Lynn Elsenhans (Chair) Dr Vivienne Cox Dr Jesse Goodman |
102-103 | |||
| Science | Supports the Board in its understanding of the key strategic themes, upon which the company’s R&D strategy is based, and of any external transactions, by performing in depth reviews of the underlying scientific assumptions to give the Board technical assurance. It also undertakes more in depth risk oversight of R&D related risks | Dr Jesse Goodman (Chair) Dr Laurie Glimcher Judy Lewent |
104-105 | |||
| Nominations & Corporate Governance | Reviews the structure, size and composition of the Board, the appointment of members to Board committees and the appointment of Corporate Officers and makes recommendations to the Board as appropriate. It plans and assesses orderly succession for Executive and Non-Executive directors and reviews management’s Succession Plan to ensure its adequacy | Sir Jonathan Symonds (Chair) Vindi Banga Lynn Elsenhans Judy Lewent Urs Rohner |
105-106 | |||
| Is responsible for reporting to the Board, overseeing and monitoring corporate governance arrangements and for making recommendations to the Board to ensure the company’s standards and arrangements are consistence with existing corporate governance standards and emerging best practice. It also reviews the company’s conflicts of interest | ||||||
| Transformation & Separation (Established on 12 March 2020) |
Advises and assists the Board on the transformation and separation of the company and oversees the associated risks in separating the Group into Biopharma and Consumer Healthcare companies | Sir Jonathan Symonds (Chair) Charles Bancroft Vindi Banga Dr Vivienne Cox Lynn Elsenhans Judy Lewent Urs Rohner |
107 | |||
| Remuneration | Sets the company’s remuneration policy having regard to GSK’s workforce remuneration so that GSK is able to recruit, retain and motivate its executives
The Remuneration policy is regularly reviewed to ensure that it is consistent with the company’s scale and scope of operations, supports the business strategy and growth plans, is aligned to the wider workforce and helps drive the creation of shareholder value
(The Chairman and the CEO are responsible for evaluating and making recommendations to the Board on the remuneration of Non-Executive Directors) |
Urs Rohner (Chair) Vindi Banga Dr Vivienne Cox Judy Lewent |
111-138 | |||
96 GSK Annual Report 2020
|
|
||
|
|
Our Board Committee reports continued
98 GSK Annual Report 2020
|
Strategic report
| ||
|
Governance and remuneration
| ||
|
Financial statements
| ||
|
Investor information
|
Our Board Committee reports continued
GSK Annual Report 2020 99
|
|
||
|
|
Our Board Committee reports continued
Significant issues relating to the financial statements
In considering GSK’s quarterly financial results announcements and the financial results in the 2020 Annual Report, the Committee reviewed the significant issues and management judgements in determining those results. It reviewed management papers setting out the key areas of risk, actions taken to quantify the effects of the relevant issues, and judgements made by management on the appropriate accounting required to address those issues in the financial statements.
The significant issues considered in relation to the financial statements for the year ended 31 December 2020 are set out in the following table, with a summary of the financial outcomes where appropriate. The Committee and the external auditor have discussed the significant issues addressed by the Committee during the year and the areas of particular audit focus, as described in the Independent Auditor’s Report on pages 142 to 153.
| Significant issues considered by the Committee in relation to the financial statements |
How the issue was addressed by the Committee | |
| Going concern basis for the preparation of the financial statements | The Committee considered the outcome of management’s half-yearly and year end reviews of current and forecast net debt positions and the various financing facilities and options available to the Group. The Committee also considered management’s review of the current and longer-term impacts of the COVID-19 pandemic, at the outbreak of the pandemic and at the year end. Following consideration of these assessments, which included stress testing and viability scenarios, sources of liquidity and funding, forecasts and estimates, the Committee confirmed that the application of the going concern basis for the preparation of the financial statements continued to be appropriate. | |
| Revenue recognition, including returns and rebates (RAR) accruals | The Committee reviewed management’s approach to the timing of recognition of revenue and accruals for customer returns and rebates. The US Pharmaceuticals and Vaccines accrual for returns and rebates was £4.7 billion at 31 December 2020 and the Committee reviewed the basis on which the accrual had been made and concurred with management’s judgements on the amounts involved. A fuller description of the process operated in the US Pharmaceuticals and Vaccines business in determining the level of accrual necessary is set out in ‘Critical accounting policies’ on page 75. | |
| Provisions for legal matters, including investigations into the Group’s commercial practices | The Committee received detailed reports on actual and potential litigation from both internal and external legal counsel, together with a number of detailed updates on investigations into the Group’s commercial practices. Management outlined the levels of provision and corresponding disclosure considered necessary in respect of potential adverse litigation outcomes and also those areas where it was not yet possible to determine if a provision was necessary, or its amount. At 31 December 2020, the provision for legal matters was £0.3 billion, as set out in Note 31 to the financial statements, ‘Other provisions’. | |
| Provisions for uncertain tax positions | The Committee considered current tax disputes and areas of potential risk and concurred with management’s judgement on the levels of tax contingencies required. At 31 December 2020, a tax payable liability of £0.7 billion, including provisions for uncertain tax positions, was recognised on the Group’s balance sheet. | |
| Impairments of intangible assets | The Committee reviewed management’s process for reviewing and testing goodwill and other intangible assets for potential impairment. The Committee accepted management’s judgements on the intangible assets that required writing down and the resulting impairment charge of £293 million in 2020. See Note 20 to the financial statements, ‘Other intangible assets’ for more details. | |
| Valuation of contingent consideration in relation to ViiV Healthcare | The Committee considered management’s judgement that it was necessary to increase the liability to pay contingent consideration as a result of increases in sales forecasts as well as the unwind of the discount and updated exchange rate assumptions. After cash payments of nearly £0.9 billion in the year, at 31 December 2020, the Groups’ Balance sheet included a contingent consideration liability of £5.4 billion in relation to ViiV Healthcare. See Note 32 to the financial statements, ‘Contingent consideration liabilities’ for more details. | |
| ViiV Healthcare put option | The Committee reviewed and agreed the accounting for the Pfizer put option and concurred with management’s judgement on the valuation of the put option of £1.0 billion at 31 December 2020. | |
100 GSK Annual Report 2020
|
Strategic report
| ||
|
Governance and remuneration
| ||
|
Financial statements
| ||
|
Investor information
|
Our Board Committee reports continued
GSK Annual Report 2020 101
|
|
||
|
|
Our Board Committee reports continued
102 GSK Annual Report 2020
|
Strategic report
| ||
|
Governance and remuneration
| ||
|
Financial statements
| ||
|
Investor information
|
Our Board Committee reports continued
GSK Annual Report 2020 103
|
|
||
|
|
Our Board Committee reports continued
104 GSK Annual Report 2020
|
Strategic report
| ||
|
Governance and remuneration
| ||
|
Financial statements
| ||
|
Investor information
|
Our Board Committee reports continued
GSK Annual Report 2020 105
|
|
||
|
|
Our Board Committee reports continued
106 GSK Annual Report 2020
|
Strategic report
| ||
|
Governance and remuneration
| ||
|
Financial statements
| ||
|
Investor information
|
Our Board Committee reports continued
GSK Annual Report 2020 107
|
|
||
|
|
| The Board has had regard to the following matters: | ||||
| (a) Long-term results The likely consequences of any decision in the long
Strategic report: Our business model (page 01) Chairman’s statement (page 03) CEO’s statement (page 04) Capital allocation (page 02) Key performance indicators (page 11) Risk management (page 43) Viability statement (page 48)
Corporate Governance report: Board activity and principal decisions (page 87) Our purpose, values and culture (page 90) The Board’s approach to engagement (page 91) Audit & Risk Committee report (page 97) |
(b) Our workforce The interests of the Group’s employees
Strategic report: Our business model (page 01) Our culture (page 10) Modern employer (page 36) Stakeholder engagement (page16)
Corporate Governance report: Board activity and principal decisions (page 87) Our purpose, values and culture (page 90) The Board’s approach to engagement (page 91) Audit & Risk Committee report (page 97) Nominations & Corporate Governance Committee
Remuneration report: Remuneration Committee Chair’s statement Directors’ pay in a wider setting (page 122)
GSK.com: Gender pay gap report |
(c) Our business relationships The importance of developing the Group’s
Strategic report: Our business model (page 01) Industry trends (page 12) Stakeholder engagement (page 16) Innovation (page 18) Performance (page 28) COVID-19 solutions (page 24) Reliable supply (page 39) Working with third parties (page 40) Risk management (page 43)
Corporate Governance report: Board activity and principal decisions (page 87) The Board’s approach to engagement (page 91) Audit & Risk Committee report (page 97) Corporate Responsibility Committee
report | ||
| (d) The community and our environment The impact of the Group’s operations on the
Strategic report: Trust section including: Environment (page 41) Environment, Health and Safety, and Environmental Climate-related financial disclosure (page 46)
Corporate Governance report: Corporate Responsibility Committee report (page 102)
GSK.com: Responsibility reports and data |
(e) Our reputation Our desire to maintain our reputation for high
Strategic report: Our culture (page 10) Trust (page 33) Ethics and values (page 39) Human rights (page 40) Reporting and investigating concerns (page 39) Anti-bribery and corruption risk (pages 44 and 265) Non-financial information statement (page 49) Our approach to tax (page 54)
Corporate Governance report: Corporate Responsibility Committee report (page 102)
GSK.com: Modern slavery statement |
(f) Fairness between our shareholders Our aim to act fairly as between members of the
Corporate Governance report: The Board’s approach to engagement (page 91) Investor information (page 244) | ||
108 GSK Annual Report 2020
|
|
||
|
|
Directors Report continued
110 GSK Annual Report 2020
|
Strategic report
| ||
|
Governance and remuneration
| ||
|
Financial statements
| ||
|
Investor information
|
Remuneration
|
In this section
|
||||||||
| Chairman’s annual statement |
112 | |||||||
| Annual report on remuneration |
114 | |||||||
| 2020 Remuneration policy summary |
133 | |||||||
| GSK Annual Report 2020 111 | ||||||||
|
|
||||||||
|
Strategic report
| ||
|
Governance and remuneration
| ||
|
Financial statements
| ||
|
Investor information
|
GSK Annual Report 2020 113
2020 at a glance
| 2020 Total Remuneration
| ||||
|
The following shows the composition of total remuneration paid to Executive Directors in office at 31 December 2020, in respect of 2020 and 2019.
| ||||
| Emma Walmsely | lain Mackey(1)
|
Dr Hal Barron | ||
|
| ||||
|
| ||||
|
Pay for performance
| ||
|
2020 Annual bonus: financial performance
|
2018 LTI outcome: performance period ended 31 December 2020
| |
|
|
| |
|
Executive Directors’ shareholdings (audited)
| ||||||
| To align the interests of Executive Directors with those of shareholders, they are required to build and maintain significant holdings of shares in GSK over time. Executive Directors are required to continue to satisfy these Share Ownership Requirements (SOR) by holding 100% of their SOR for the first 12 months after leaving GSK and not less than 50% of their SOR for months 13-24 after leaving GSK. | Share ownership vs SOR (multiples of base salary)
| |||||
| Executive Directors and CET | SOR % of salary | |||||
|
| ||||||
| CEO | 650 | |||||
|
| ||||||
| Other Executive Directors | 300 | |||||
|
| ||||||
| Other Corporate Executive Team members | 200 | |||||
|
| ||||||
114 GSK Annual Report 2020
|
Strategic report
| ||
|
Governance and remuneration
| ||
|
Financial statements
| ||
|
Investor information
|
Annual report on remuneration continued
2020 Total remuneration (audited)
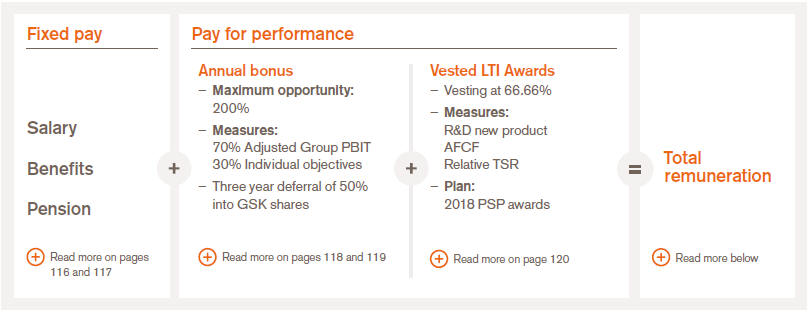
2020 Total remuneration (audited)
| Emma Walmsley | Iain Mackay(4) | Dr Hal Barron | ||||||||||||||||||||||||||||
| 2020 £000 |
2019 £000 |
2020 £000 |
2019 £000 |
2020 $000 |
2019 $000 |
|||||||||||||||||||||||||
| Fixed pay |
||||||||||||||||||||||||||||||
| Salary |
1,199 | 1,110 | 871 | 825 | 1,786 | 1,743 | ||||||||||||||||||||||||
| Benefits |
141 | 192 | 155 | 139 | 58 | 659 | ||||||||||||||||||||||||
| Pension |
|
245 | 220 | 175 | 171 | 1,247 | 1,259 | |||||||||||||||||||||||
| Total fixed pay |
1,585 | 1,522 | 1,201 | 1,135 | 3,091 | 3,661 | ||||||||||||||||||||||||
| Pay for performance |
||||||||||||||||||||||||||||||
| Annual bonus(1) |
1,169 | 1,754 | 810 | 1,185 | 1,741 | 2,675 | ||||||||||||||||||||||||
| Vesting of LTI awards: |
||||||||||||||||||||||||||||||
| DABP matching awards |
– | 412 | – | – | – | – | ||||||||||||||||||||||||
| PSP(2) |
4,277 | 4,396 | – | – | 6,387 | – | ||||||||||||||||||||||||
| Total pay for performance(3) |
5,446 | 6,562 | 810 | 1,185 | 8,128 | 2,675 | ||||||||||||||||||||||||
| Total remuneration |
£ | 7,031 | £ | 8,084 | £ | 2,011 | £ | 2,320 | $ | 11,219 | $ | 6,336 | ||||||||||||||||||
Notes:
| (1) | Details of the mandatory bonus deferrals in 2020 and 2021 under the Deferred Annual Bonus Plan (DABP) are set out on page 130. (Matching awards ceased from 2018 and are no longer granted under the DABP). |
| (2) | Emma Walmsley’s 2017 PSP vested in July 2020 at a closing price of £15.83. At the time of the 2019 Annual Report the PSP figure used was based upon the average share price during the three month period to 31 December 2019 (£17.28), therefore the published figure last year was £4,671,000. |
| (3) | The Committee may in specific circumstances, and in line with stated principles, apply clawback/malus, as it determines appropriate. Following due consideration by the Committee, there has been no recovery of sums paid (clawback) or reduction of outstanding awards or vesting levels (malus) applied during 2020 in respect of any of the Executive Directors. |
| (4) | Appointed with effect from 14 January 2019. |
GSK Annual Report 2020 115
|
|
||
|
|
Annual report on remuneration continued
2020 Total remuneration (audited) continued
The following sections provide details of each element of 2020 ‘Total remuneration’, including how the Committee implemented the approved Remuneration policy during the year.
Fixed pay (audited)
116 GSK Annual Report 2020
|
Strategic report
| ||
|
Governance and remuneration
| ||
|
Financial statements
| ||
|
Investor information
|
Annual report on remuneration continued
Fixed pay (audited) continued
Pensions
Please see details of changes to pensions policy and its implementation on page 126. In addition, the Committee has determined that all current and future UK and US Executive Directors will have their pension arrangements aligned to the wider UK and US workforce, as appropriate, by 1 January 2023.
| Executive Director | Member since | Pension arrangements in 2020 | ||
| Emma Walmsley | 2010 | Pension contributions of 20% of base salary and matching contributions as follows: | ||
| lain Mackay | 2019 |
– from 1 January 2020 to 31 March 2020 based on the first £33,333 of salary(1) (2); and | ||
| – from 1 April 2020 to 31 December 2020 based on the first £13,333 of salary(1) (2); | ||||
| with a cash supplement of 20% of base salary in lieu of pension on salary in excess of those figures. | ||||
| Dr Hal Barron | 2018 | The CSO is a member of the 401(k) plan open to all US employees and the Executive Supplemental Savings Plan (ESSP), a savings scheme open to US executives to accrue benefits above the 401(k) plan limits. | ||
| He receives a combined contribution rate under the 401(k) and ESSP plans of 6% (2% core contributions plus a match of up to 4%) of total base salary and bonus, less the bonus deferred under the DABP. | ||||
| He is also a member of the US Cash Balance and the Supplemental Cash Balance pension plans, under which GSK makes annual contributions of 38% of base salary, in line with other US senior executives and members of GSK’s CET.
| ||||
| (1) | As a member of the defined contribution plan, Emma Walmsley and Iain Mackay are eligible to receive a matching award of up to 5% on the first £33,333 of their salaries from 1 January 2020 to 31 March 2020 and on the first £13,333 of their salaries from 1 April 2020 to 31 December 2020, in accordance with the terms of the plan. |
| (2) | Emma Walmsley and Iain Mackay receive cash payments in lieu of pension of 20% of base salary in excess of £33,333 from 1 January 2020 to 31 March 2020 and cash payments in lieu of pension of 20% of base salary in excess of £13,333 from 1 April 2020 to 31 December 2020, in line with GSK’s defined contribution pension plan rates. |
The following table shows the breakdown of the pension values set out on page 115. The pension remuneration figures have been calculated in accordance with the methodology set out in The Large and Medium-sized Companies and Group (Accounts and Reports) (Amendment) Regulations 2008 (Remuneration regulations).
| Emma Walmsley
|
Iain Mackay
|
Dr Hal Barron
|
||||||||||||||||||||||||||||||||||
| Pension remuneration values | 2020 £000 |
2019 £000 |
2020 £000 |
2019 £000 |
2020 $000 |
2019 $000 |
||||||||||||||||||||||||||||||
|
|
|
|
|
|
||||||||||||||||||||||||||||||||
| UK defined contribution |
5 | 8 | 5 | 8 | – | – | ||||||||||||||||||||||||||||||
| US defined benefit |
– | – | – | – | 1,059 | 1,069 | ||||||||||||||||||||||||||||||
| Employer cash contributions |
240 | 212 | 170 | 163 | 188 | 190 | ||||||||||||||||||||||||||||||
| Total pension remuneration value |
245 | 220 | 175 | 171 | 1,247 | 1,259 | ||||||||||||||||||||||||||||||
Further details regarding the 2020 pension values for Dr Hal Barron are set out in the table below. The pensions figures disclosed for Dr Hal Barron, who is a member of the US style defined benefit plans, are in accordance with paragraph 10.e.ii of Schedule 8 of the Remuneration regulations.
The table shows the accrued benefit (ie the annual pension accrued to date). In accordance with the regulations, the pension remuneration in 2020 was calculated as the increase in the accrued benefit, adjusted for inflation and multiplied by 20 to reflect the fact that the benefit will be received for a number of years. The normal retirement age under the Cash Balance Pension Plan is age 65. There is no additional benefit for retiring early.
| Accrued pension | Pension remuneration |
|||||||||||
|
|
|
|||||||||||
| Dr Hal Barron pension values | 31 December 2020 $000 |
31 December 2019 $000 |
value for 2020 $000 |
|||||||||
|
|
|
|
||||||||||
| US – Funded |
2 | 1 | 20 | |||||||||
|
|
|
|
||||||||||
| US – Unfunded |
158 | 106 | 1,039 | |||||||||
|
|
|
|
||||||||||
| Total |
160 | 107 | 1,059 | |||||||||
|
|
|
|
||||||||||
GSK Annual Report 2020 117
|
|
||
|
|
Annual report on remuneration continued
Pay for performance (audited)
Annual bonus

2020 performance against targets
For 2020, the performance measures and weightings were as follows:
| Weighting | 2020 Adjusted Group PBIT performance | |||||||||||||||
|
|
|
|||||||||||||||
| Performance measure | Executive Directors | 2020 target | Outcome | Positioning against target |
||||||||||||
|
|
||||||||||||||||
| Adjusted Group PBIT |
70% | £8,465m | £8,271m | 98% | ||||||||||||
|
|
||||||||||||||||
| Individual objectives |
30% | |||||||||||||||
|
|
||||||||||||||||
Threshold and maximum performance targets were set at 95% and 105% of target respectively.
The Adjusted Group PBIT target and outcome for the purposes of the Annual bonus calculation differ from Adjusted Group PBIT disclosed elsewhere in this Annual Report, primarily because both the target and outcome numbers are calculated by applying GSK’s budget exchange rates and not actual exchange rates.
The following table shows actual bonuses earned compared to the bonus opportunity for 2020:
| 2020 bonus opportunity | 2020 bonus outcome | |||||||||||||||||||||||||||
|
|
|
|||||||||||||||||||||||||||
| Bonus | Target (% of salary) |
Maximum (% of salary) |
2020 Base salary |
Financial performance (% of salary) |
Individual objectives (% of salary) |
Total 2020 bonus (% of salary) |
Total 2020 bonus 000 |
|||||||||||||||||||||
|
|
||||||||||||||||||||||||||||
| Emma Walmsley |
£1,199,176 | 55.5 | 97.5 | £1,169 | ||||||||||||||||||||||||
|
|
|
|
|
|||||||||||||||||||||||||
| Iain Mackay |
100 | 200 | £871,250 | 42 | 51 | 93 | £810 | |||||||||||||||||||||
|
|
|
|
|
|||||||||||||||||||||||||
| Dr Hal Barron |
$1,786,060 | 55.5 | 97.5 | $1,741 | ||||||||||||||||||||||||
|
|
||||||||||||||||||||||||||||
The table below provides more detail on delivery against Adjusted Group PBIT:
| Financial performance
|
| – | Strong financial leadership of the Group in a challenging year |
| – | Delivered full year reported Group sales of £34bn (+1% AER, +3% CER), with Vaccines sales impacted by lower US adult vaccination volumes through COVID-19 disruption and partially offset by growth drivers in Respiratory and HIV |
| – | Adjusted Group PBIT of £8,939m below target driven by lower sales but delivery supported by effective cost control |
| – | Adjusted EPS of 115.9p (-6% AER, -4% CER) in line with guidance, delivery supported by effective cost control |
118 GSK Annual Report 2020
|
Strategic report
| ||
|
Governance and remuneration
| ||
|
Financial statements
| ||
|
Investor information
|
Annual report on remuneration continued
Pay for performance (audited) continued
The following table summarises performance against the scorecard of individual objectives agreed by the Committee for each Executive Director, in addition to their contribution to the financial performance for 2020:
Individual objectives
| Emma Walmsley | ||||
| – Continued focus and progress against long-term IPT priorities – Robust and agile commercial execution in exceptional circumstances; Pharmaceuticals and Vaccines sales £24.1bn, Consumer Healthcare £10bn. Strong growth from new and specialty Pharmaceuticals £9.7bn (+11% AER, +12% CER). Shingrix £2bn (+10% AER, +11% CER) despite impact of COVID-19 disruption. 28 first-market launches for Consumer Healthcare – Significant progress in strengthening and advancing a sustainable pipeline of transformational Pharmaceuticals and Vaccines, with 9 major approvals, 9 pivotal study starts and over 20 late-stage assets in development – COVID-19 solutions including global partnerships for first-and second-generation vaccines and therapeutics, and providing expertise and donations to support local response – Transformation and separation plans on track to deliver two new competitive companies in 2022. Consumer Healthcare JV with Pfizer commercial integration delivered and remaining programme on track
|
– Supply chain reliability during severe disruption and continued network simplification – Sustained progress and leadership in ESG and Global Health. New environmental sustainability commitments in climate and nature launched, expanded plans to accelerate our progress on Inclusion & Diversity, and continued top quartile recognition in external ESG ratings, including 1st place in Access to Medicines Index and 2nd place in Dow Jones Sustainability Index – New leadership accountabilities and training. 13% new in role for our top 125 enterprise key roles, 38% women at Senior Vice President and Vice President level, with aspiration set for race and ethnicity representation in the US & UK – Progress towards a Purpose and Performance culture accelerated through COVID-19 and reflected in highest employee engagement rates recorded to date. Continued focus on values and expectations through disruption and remote working, and launch of new flexible working approach – Key leadership role in preparation for separation into two new competitive companies
| |||
| lain Mackay | ||||
| – Strong financial leadership of the Group in challenging year
– Delivered full year reported Group sales of £34bn (+1% AER, +3% CER), with Vaccines sales impacted by lower US adult vaccination volumes through COVID-19 disruption and partially offset by growth drivers in Respiratory and HIV |
– Adjusted EPS of 115.9p (-6% AER, -4% CER) in line with guidance, delivery supported by effective cost control – Key leadership role in preparation for separation into two new competitive companies – Strong oversight across Finance and Tech during transformation and through extreme COVID-19 disruption
| |||
| Dr Hal Barron | ||||
| – R&D strategy further strengthened and advancement of pipeline: with 40 potential new medicines and 17 vaccine candidates, 9 major product approvals and 9 pivotal study starts. Over 20 significant business development deals executed to augment the pipeline, including: Vir Biotechnology, CureVac, Surface Oncology, The Broad Institute and Adrestia
– Over 70% of research targets genetically validated, more than 30 targets identified from our 23&Me collaboration and the 1st jointly identified target in clinical development
– Advanced technology capability build continues with new London AI hub opened, UK Functional Genomics network, NVIDIA collaboration and key external hires in AI and ML. New talent in 18% of key R&D roles (79% external hires)
|
– Significant progress towards one Biopharma, with “One Development” organisation implemented and strong foundation for single approach to governance and capital allocation
– Employee confidence in pipeline up +8% and strong engagement across R&D organisation at 83%
– Continuing to build GSK’s reputation for Innovation and external pipeline perception through significant engagement on major platforms, with media and investors | |||
| Malus and clawback policy For details of our policy on malus and clawback, please refer to the company’s Remuneration policy report on page 144 of the 2019 Annual Report, available on GSK.com.
The Committee reviews and discloses whether it (or the Recoupment Committee) has exercised malus or clawback.
Disclosure is only made when the matter has been the subject of public reports of misconduct, where it has been fully resolved, where it is legally permissible to disclose and where it can be made without unduly prejudicing the company and therefore shareholders. |
In line with these disclosure guidelines, neither the Committee (nor the Recoupment Committee) exercised malus or clawback during 2020.
Other policies For details of our existing policies on recruitment remuneration, loss of office and termination payments, please refer to the 2020 Remuneration policy report on pages 141 to 150 of the 2019 Annual Report, available on gsk.com. | |||
GSK Annual Report 2020 119
|
|
||
|
|
Annual report on remuneration continued
Pay for performance (audited) continued
Value earned from long-term incentives (LTIs)
The following tables set out the performance achieved against the targets set for the company’s LTI plans and also includes an update on performance of outstanding awards.
In line with the Committee’s agreed principles, for each measure applicable to the LTI awards, actual performance against the targets is reviewed and adjustments made as appropriate to ensure that the vesting outcome reflects genuine underlying business performance and that results are being delivered in line with our Trust business priority.
2018 PSP awards with a performance period ended 31 December 2020
The Committee reviewed the performance of the PSP awards granted to Executive Directors against the targets set. The Adjusted free cash flow (AFCF) target was revised in line with the disclosure on page 125 of the 2019 Annual Report. It has been further restated to take account of the revised phasing of the Future Ready programme restructuring cash payments and separation costs based on detailed programme and separation planning undertaken in 2020. As a result the target has been increased by £0.39bn to £10.95bn.
For 2020, the 2018 PSP was valued based on the closing share price on 11 February 2021 of £12.55 and the closing ADS price of $35.32. Of the vested amounts for the CEO and CSO, none is attributable to share price appreciation over the performance period. The Committee did not exercise any discretion in relation to the vesting of the awards or share price changes.
The performance achieved in the three years to 31 December 2020 and the vesting levels are set out in the table below.
| Outcome and vesting level | ||||||||||||||||||||||||
| Performance measures and relative weighting |
Performance targets | Outcome | % of maximum |
% of award |
||||||||||||||||||||
| R&D new product performance (1/3rd) |
R&D new product sales performance measures aggregate three-year sales for new products launched in the three-year performance period and the preceding two years, i.e. 2016-20. |
£7.34bn | 100 | 33.33 | ||||||||||||||||||||
| Target | % vesting | |||||||||||||||||||||||
|
|
||||||||||||||||||||||||
| Maximum | £4.39bn | 100% | ||||||||||||||||||||||
| £3.99bn | 75% | |||||||||||||||||||||||
| £3.79bn | 50% | |||||||||||||||||||||||
| Threshold | £3.59bn | 25% | ||||||||||||||||||||||
|
|
||||||||||||||||||||||||
| Adjusted free cash flow performance (1/3rd) |
In line with the company’s agreed principles, the AFCF figures included adjustments for a number of material distorting items, including legal settlements, exchange rate movements and special pension contributions. |
£15.64bn | 100 | 33.33 | ||||||||||||||||||||
| Original target |
Revised target(1) |
% vesting | ||||||||||||||||||||||
|
|
||||||||||||||||||||||||
| Maximum | £13.89bn | £12.60bn | 100% | |||||||||||||||||||||
| £13.29bn | £12.05bn | 75% | ||||||||||||||||||||||
| £12.08bn | £10.95bn | 50% | ||||||||||||||||||||||
| Threshold | £11.72bn | £10.63bn | 25% | |||||||||||||||||||||
|
|
||||||||||||||||||||||||
| (1) The revised target has been further adjusted since the 2019 Annual Report as noted above. |
|
|||||||||||||||||||||||
| Relative TSR performance (1/3rd) |
TSR ranking within comparator group(2) | % vesting | Ranked 9th | 0 | 0 | |||||||||||||||||||
|
|
||||||||||||||||||||||||
| Maximum | 1st, 2nd, 3rd | 100% | ||||||||||||||||||||||
| 4th | 72% | |||||||||||||||||||||||
| 5th | 44% | |||||||||||||||||||||||
| Threshold(3) | Median | 30% | ||||||||||||||||||||||
| 6th to 10th | 0% | |||||||||||||||||||||||
|
|
||||||||||||||||||||||||
| (2) TSR comparator group: AstraZeneca, Bristol-Myers Squibb, Eli Lilly, GSK, Johnson & Johnson, Merck & Co, Novartis, Pfizer, Roche Holdings and Sanofi |
|
|||||||||||||||||||||||
| (3) The vesting schedule is based on delivering 30% vesting for median performance. In a comparator group of ten companies, median falls between two companies. |
|
|||||||||||||||||||||||
| Total vesting in respect of 2018 awards | 66.66 | % | ||||||||||||||||||||||
120 GSK Annual Report 2020
|
Strategic report
| ||
|
Governance and remuneration
| ||
|
Financial statements
| ||
|
Investor information
|
Annual report on remuneration continued
Pay for performance (audited) continued
Update on performance of ongoing LTI awards
The Committee also reviewed the performance of the PSP awards granted to Executive Directors in 2019 and 2020.
The following charts provide an estimate of the vesting levels taking into account performance to 31 December 2020. Actual vesting levels will only be determined based on performance over the full three-year performance periods. The indications below should therefore not be regarded as predictions of the final vesting levels. The AFCF threshold and associated vesting scales for the 2019 and 2020 PSP awards have been adjusted. The net overall impact is an increase of £0.19bn to £10.93bn for the 2019 award and a decrease of £0.37bn to £9.62bn for the 2020 award.
These adjustments are to take account of the following items: revised phasing of the Future Ready programme restructuring cash payments and separation costs based on detailed programme and separation planning undertaken in 2020, revised timing of Future Ready programme divestments, cancellation of one of the Future Ready programme divestments.
There are no changes to the targets set for the R&D new product, Innovation sales (previously named R&D new product) or the relative TSR performance measures for the 2019 and 2020 awards.
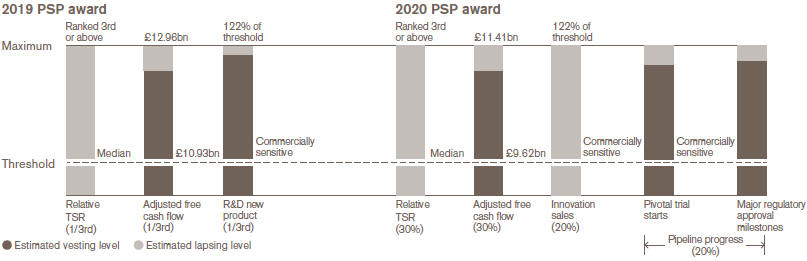
For threshold performance 25% of each award will vest in respect of each performance measure. Individual 2019 LTI award levels appear on page 126 of the 2019 Annual Report. They are set out below for the 2020 LTI awards.
Historical vesting for LTI plans
| Vesting% | ||||||||||||||||||||||||
| Year of grant |
Relative TSR | Adjusted free cash flow |
R&D new product |
Business diversification |
Lapsed % |
Total vested % |
||||||||||||||||||
| 2010 |
9 | 16 | 75 | 25 | ||||||||||||||||||||
| 2011 |
0 | 13 | 16 | 11 | 60 | 40 | ||||||||||||||||||
| 2012 |
0 | 0 | 7 | 7 | 86 | 14 | ||||||||||||||||||
| 2013 |
0 | 0 | 21 | 17 | 62 | 38 | ||||||||||||||||||
| 2014 |
0 | 0 | 33 | 67 | 33 | |||||||||||||||||||
| 2015 |
15 | 21 | 33 | 31 | 69 | |||||||||||||||||||
| 2016 |
0 | 26 | 33 | 41 | 59 | |||||||||||||||||||
| 2017 |
0 | 33 | 33 | 33 | 67 | |||||||||||||||||||
| 2018 |
0 | 33 | 33 | 33 | 67 | |||||||||||||||||||
For the DABP, the 2010 awards were only subject to TSR performance and from 2011 awards were subject to the same performance measures as PSP awards.
2020 LTI awards
The 2020 DABP awards (in respect of the deferral of 2019 bonus) and the 2020 PSP awards are shown in the table below.
| 2020 DABP awards | 2020 PSP awards | |||||||||||||||||||||||||
| 2019 % of total bonus deferred |
Number of shares |
Face value of award(1) |
Award level as % of base salary |
Number of shares |
Face value of award(2)(3) |
|||||||||||||||||||||
| Emma Walmsley |
52,169 shares | £ | 0.877m | 575% | 410,090 shares | £ | 6.9m | |||||||||||||||||||
| Iain Mackay |
50% | 35,223 shares | £ | 0.592m | 400% | 207,267 shares | £ | 3.5m | ||||||||||||||||||
| Dr Hal Barron |
30,547 ADS | $ | 1.337m | 500% | 203,981 ADS | $ | 8.9m | |||||||||||||||||||
| (1) | The face values of the DABP awards have been calculated based on a share price of £16.81 and an ADS price of $43.78, being the closing prices on 13 February 2020 (the day before grant). These are nil-cost options for the UK Executive Directors and restricted shares for the US Executive Director. No performance conditions are attached to the DABP awards, as they reflect the mandatory deferrals in respect of the 2019 annual bonus earned. |
| (2) | The face values of the PSP awards have been calculated based on a share price of £16.81, and an ADS price of $43.78, being the closing prices on 13 February 2020 (the day before grant). These are conditional shares, based on the performance measures outlined above. |
| (3) | The performance period for the 2020 PSP awards is from 1 January 2020 to 31 December 2022. |
GSK Annual Report 2020 121
|
|
||
|
|
Annual report on remuneration continued
Directors’ pay in a wider setting
Internal context
| In setting executive pay it is important that the Committee and I do so with a good understanding of wider workforce pay. To that end on an annual basis I meet with our Human Resources Business Leaders (HRBLs) of Global Support Functions, Pharmaceuticals, ViiV Healthcare, Vaccines and Consumer Healthcare to understand perspectives on pay and GSK’s remuneration package for the wider workforce.
When I met with the HRBLs this year, we discussed the current enterprise-wide themes for employees for the wider group, namely:
– Attract, recruit and retain key talent to support an ambitious business agenda and working towards separation of the Biopharma and Consumer Healthcare businesses
– Inclusion and diversity
– Pay reviews, including delivery of fair pay and setting appropriate salary budgets
– Pensions changes being undertaken in the US and those proposed in the UK and under consultation.
We also discussed how different pay levels/cultures in different markets and moving key talent between markets was handled.
Finally, Dr Vivienne Cox, our Workforce Engagement Director, is a valued member of the Committee and continues to bring employee perspectives into the Committee’s discussions.
Urs Rohner Remuneration Committee Chair
|
Remuneration structure for employees
| Element | Wider workforce pay | Comparison with Executive Director and CET pay | ||
| Salary | – The market competitiveness of salaries across the company is assessed at a local market level. The competitiveness of roles, which is measured against the external market and internal peers, is kept under regular review |
– For our Executive Directors and for the CET, ordinarily increases in base salaries are in line with the average of the wider employee population unless there is a change in scope of the individual’s role, responsibilities or experience | ||
| Pensions and benefits | – The company seeks to provide an appropriate pensions and benefits package that is aligned to competitive market practices in those countries in which the company operates and our employees are based |
– Our Executive Directors and the CET are eligible to receive benefits broadly in line with the policy for our other employees, which may vary by location – Pension arrangements are structured in accordance with where our Executive Director or CET member is expected to retire. Current and future UK and US Executive Directors will have their pension arrangements aligned to the wider UK and US workforce by 1 January 2023 | ||
| Annual bonus | – With the exception of our sales force, who participate in separate arrangements, our wider workforce participates in a plan based on performance against four business and financial measures (three measures for Consumer Healthcare). This is structured to reflect the priorities of the specific business area – This plan is designed to reward our employees’ collective contribution to business achievement. Separate mechanisms are in place to recognise outstanding individual performance or to address under-performance |
– Our Executive Directors and the CET participate in a plan based on an assessment of a combination of stretching financial / business and personal objectives – Our Executive Directors are required to defer 50% – and the CET 25% – of any bonus earned into shares or ADSs as appropriate for three years – Clawback and/or malus provisions apply | ||
| LTI plans | – Our employees at Senior Vice President (SVP) and Vice President (VP) level participate in the same PSP as our Executive Directors and the CET with the same performance targets and periods – Clawback and/or malus provisions apply – Our SVP and VP employees, together with Directors and Managers below the CET, receive annual Share Value Plan awards of restricted shares |
– Our Executive Directors and the CET are granted annual PSP awards with the same performance targets and periods – Our Executive Directors are required to hold vested awards for an additional two-year period – Clawback and/or malus provisions apply – Our Executive Directors and the CET do not receive Share Value Plan awards following appointment |
122 GSK Annual Report 2020
|
Strategic report
| ||
|
Governance and remuneration
| ||
|
Financial statements
| ||
|
Investor information
|
Annual report on remuneration continued
Directors’ pay in a wider setting continued
GSK Annual Report 2020 123
|
|
||
|
|
Annual report on remuneration continued
Directors’ pay in a wider setting continued
124 GSK Annual Report 2020
|
Strategic report
| ||
|
Governance and remuneration
| ||
|
Financial statements
| ||
|
Investor information
|
Annual report on remuneration continued
Directors’ pay in a wider setting continued
External context
Comparator groups for pay and relative TSR
The Committee used two pay comparator groups when considering executive pay for 2020. The Global pharmaceutical comparator group is also used to measure relative TSR performance. The primary groups used for each Executive Director were as follows:
| European cross-industry comparator group | Global pharmaceutical comparator group | |||||||||||
| Emma Walmsley Iain Mackay |
Roche Holding AG Novartis LVMH Anheuser-Busch Inbev Unilever SAP L’Oreal Novo Nordisk A/S Airbus |
Linde Sanofi AstraZeneca Diageo Siemens Christian Dior Inditex BAT Volkswagen |
Deutsche Telekom Kering Heineken BASF Vinci Adidas Bayer Safran Reckitt Benckiser |
Dr Hal Barron | France Sanofi Switzerland Novartis Roche Holdings UK AstraZeneca |
US AbbVie(1) Amgen(1) Bristol-Myers Squibb Eli Lilly Johnson & Johnson Merck & Co Pfizer | ||||||
| (1) | AbbVie and Amgen are included for remuneration benchmarking, but are not included in the relative TSR comparator group. |
GSK Annual Report 2020 125
|
|
||
|
|
Annual report on remuneration continued
Implementation of Remuneration policy for 2021
126 GSK Annual Report 2020
|
Strategic report
| ||
|
Governance and remuneration
| ||
|
Financial statements
| ||
|
Investor information
|
Annual report on remuneration continued
Implementation of Remuneration policy for 2021 continued
GSK Annual Report 2020 127
|
|
||
|
|
Annual report on remuneration continued
Remuneration governance
128 GSK Annual Report 2020
|
Strategic report
| ||
|
Governance and remuneration
| ||
|
Financial statements
| ||
|
Investor information
|
Annual report on remuneration continued
Non-Executive Directors’ fees
Non-Executive Directors will continue to be required to invest at least 25% of their total net fees in GSK shares or ADS.
Implementation of Non-Executive Directors’ policy in 2020
Following a review and engagement with shareholders, Non-Executive Directors’ standard fees and fees payable to the Senior Independent Director and other Committee Chairs (including the Remuneration, Corporate Responsibility and Science Committees) were last increased with effect from 1 January 2020.
As part of shareholder approval of the 2020 Remuneration policy:
| – | a supplemental fee was introduced with effect from 1 January 2020, payable to the Workforce Engagement Director; and |
| – | payment to a Non-Executive Director of up to the amount paid to a Committee Chair for undertaking additional duties in exceptional or unforeseen circumstances requiring a significant additional time commitment was authorised. |
No changes were made to the fees payable to the Chair of the Audit & Risk Committee or Scientific & Medical Experts. We do not expect to make any other increases to the fees payable to Non-Executive Directors during the new policy period. The increases described above reflect the time commitments of these roles.
2020 Total fees (audited)
The audited table below sets out the value of fees and benefits received by the Non-Executive Directors in the form of cash and shares or ADS. Further details of the Non-Executive Directors’ share allocation plan are set out on page 131. Non-Executive Directors’ fees that are paid in a currency other than Sterling are converted using an average exchange rate that is reviewed from time to time. The average exchange rates were updated in 2020. Benefits comprise the grossed up cash value of travel and subsistence costs incurred in the normal course of business, in relation to attendance at Board and Committee meetings. For overseas-based Directors, this includes travel to meetings in the UK.
| 2020 | 2019 | |||||||||||||||||||||||||||||||
| Non-Executive Directors’ emoluments (000) (audited) |
Fixed fees | Fixed fees | ||||||||||||||||||||||||||||||
| Cash | Shares/ADS | Benefits | Total pay | Cash | Shares/ADS | Benefits | Total pay | |||||||||||||||||||||||||
| Sir Jonathan Symonds |
£525 | £175 | £2 | £702 | £174 | £58 | £2 | £234 | ||||||||||||||||||||||||
| Vindi Banga |
£114 | £38 | £2 | £154 | £92 | £31 | £4 | £127 | ||||||||||||||||||||||||
| Charles Bancroft |
– | $82 | – | $82 | – | – | – | – | ||||||||||||||||||||||||
| Dr Vivienne Cox |
£107 | £36 | £2 | £145 | £69 | £23 | £8 | £100 | ||||||||||||||||||||||||
| Lynn Elsenhans |
$93 | $100 | $20 | $213 | $24 | $196 | $75 | $295 | ||||||||||||||||||||||||
| Dr Laurie Glimcher |
– | $180 | $34 | $214 | – | $220 | $76 | $296 | ||||||||||||||||||||||||
| Dr Jesse Goodman |
$174 | $58 | $23 | $255 | $199 | $66 | $66 | $331 | ||||||||||||||||||||||||
| Judy Lewent |
$183 | $61 | $12 | $256 | $222 | $74 | $82 | $378 | ||||||||||||||||||||||||
| Urs Rohner |
£107 | £36 | £4 | £147 | £92 | £31 | £13 | £136 | ||||||||||||||||||||||||
GSK Annual Report 2020 129
|
|
||
|
|
Annual report on remuneration continued
Directors’ interests in shares (audited)
Executive Directors’ interests in shares
The interests of the Executive Directors of the company in office during 2020 and their persons closely associated (PCA) are shown in the table below:
| As at 31 December 2020 | ||||||||||||||||||||||||||||||||||||
| Unvested share plan interests | ||||||||||||||||||||||||||||||||||||
| Total directors’ interests as at | Beneficial interests |
Not subject to performance | Subject to performance |
|||||||||||||||||||||||||||||||||
| 3 March 2021(1) | 31 December 2020(1) | Shares/ADS(2) | Shares/ADS(3,6) | Options(4,7) | Shares/ADS(5) | |||||||||||||||||||||||||||||||
| Shares |
||||||||||||||||||||||||||||||||||||
| Emma Walmsley |
1,150,620 | 787,639 | 316,761 | 281,324 | 189,554 | 1,372,409 | ||||||||||||||||||||||||||||||
| Iain Mackay |
68,879 | 36,655 | – | – | 36,655 | 461,587 | ||||||||||||||||||||||||||||||
| ADS |
||||||||||||||||||||||||||||||||||||
| Dr Hal Barron |
359,809 | 232,193 | 160,001 | 72,192 | – | 716,327 | ||||||||||||||||||||||||||||||
| 1) | Total directors’ interests include beneficial interests and unvested share plan interests not subject to performance. The balance as at 3 March 2021 includes shares/ADS awarded in 2018 under the Performance Share Plan (PSP) and the Deferred Annual Bonus Plan (DABP) which vested in February and March 2021 respectively less those sold to satisfy tax liabilities on the vested amounts. Executive Directors’ shareholdings versus their SOR are outlined on page 127. |
| 2) | Beneficial interests include shares/ADS held by the Executive Directors and their PCAs. For Emma Walmsley, this includes 2,044 shares purchased through the GlaxoSmithKline Share Reward Plan. Iain Mackay does not currently participate in the Share Reward Plan. As a US employee, Dr Hal Barron is not eligible to participate in the Share Reward Plan which is only open to UK employees. Dr Barron’s beneficial interests include ADS and notional ADS held by way of his investments in the GSK 401(k) plan and the Executive Supplemental Savings Plan (ESSP). During the year, Dr Barron re-allocated his funds in both plans to the GSK Stock Fund. Further details on Dr Barron’s membership of the plans can be found on page 117. |
| 3) | Unvested shares/ADS not subject to performance represent PSP shares which have vested but are subject to an additional two-year holding period for Emma Walmsley. Unvested ADS not subject to performance for Dr Barron represent bonus deferrals (as described in note 6 below). |
| 4) | Unvested options not subject to performance represent bonus deferrals under the DABP which are awarded as nil-cost options (as described in note 6 below). This figure excludes the 744 Share Save options held by Emma Walmsley. |
| 5) | Unvested shares/ADS subject to performance represent unvested PSP awards. |
| 6) | DABP: The table below shows bonus deferrals and subsequent reinvestment of dividends under the DABP. The amounts represent the gross shares/ADS balances prior to the sale of any shares/ADS to satisfy tax liabilities on vesting. |
| Deferred Annual Bonus Plan (Bonus deferrals) | 3 March 2021 | 31 December 2020 | 1 January 2020 | |||||||||
| Shares |
||||||||||||
| Emma Walmsley |
169,201 | 189,554 | 165,445 | |||||||||
| Iain Mackay |
68,879 | 36,655 | – | |||||||||
| ADS |
||||||||||||
| Dr Hal Barron |
97,509 | 72,192 | 38,499 | |||||||||
As UK employees, bonus deferrals under the DABP are granted as nil-cost options to Emma Walmsley and Iain Mackay and the following table sets out details of nil-cost options exercised. There are no outstanding DABP matching awards following this exercise.
| DABP | Date of grant | Number of shares under option |
Date of exercise |
Grant price | Market price at exercise |
Gain on exercise (000) |
||||||||||||||||||
| Emma Walmsley |
||||||||||||||||||||||||
| Deferral award |
15.02.17 | 37,221 | 17.02.20 | £0.00 | £16.61 | £618 | ||||||||||||||||||
| Matching award |
15.02.17 | 24,815 | 17.02.20 | £0.00 | £16.61 | £412 | ||||||||||||||||||
In respect of nil-cost options awarded in 2017 under the DABP, the bonus which is deferred by the Executive Director was recorded as remuneration (under Annual bonus) in the Total remuneration table in respect of 2016. Number of shares under option includes the initial award amount together with reinvested dividends accrued to the date of exercise.
For the matching element of the DABP awarded in 2017, the remuneration of the Executive Director was recorded in the Total remuneration table in respect of 2019 (the year that the performance period ended). The Remuneration Committee granted the last matching award in 2017.
130 GSK Annual Report 2020
|
Strategic report
| ||
|
Governance and remuneration
| ||
|
Financial statements
| ||
|
Investor information
|
Annual report on remuneration continued
Directors’ interests in shares (audited) continued
Non-Executive Directors’ interests in shares
The interests of the Non-Executive Directors of the company in office during 2020 and their persons closely associated (PCA) are shown in the table below:
| Share allocation plan for Non-Executive Directors | ||||||||||||||||||||||||||||||||
| Total directors’ interests as at(1) | Number of shares/ADS | |||||||||||||||||||||||||||||||
| Beneficial | Dividends | Elected & | ||||||||||||||||||||||||||||||
| 31 December | interests at 31 | reinvested after | 31 December | allocated during | ||||||||||||||||||||||||||||
| 3 March 2021 | 2020 | December 2020(2) | year end | 2020 | the year(3) | 1 January 2020 | ||||||||||||||||||||||||||
| Shares |
||||||||||||||||||||||||||||||||
| Sir Jonathan Symonds |
51,246 | 47,608 | 35,757 | 423 | 11,851 | 11,017 | 834 | |||||||||||||||||||||||||
| Vindi Banga |
101,940 | 99,693 | 71,800 | 1,581 | 27,893 | 3,345 | 24,548 | |||||||||||||||||||||||||
| Dr Vivienne Cox |
8,190 | 7,203 | – | 366 | 7,203 | 2,264 | 4,939 | |||||||||||||||||||||||||
| Urs Rohner |
14,069 | 12,754 | – | 695 | 12,754 | 2,583 | 10,171 | |||||||||||||||||||||||||
| ADS |
||||||||||||||||||||||||||||||||
| Charles Bancroft |
2,211 | 1,367 | – | 26 | 1,367 | 1,367 | – | |||||||||||||||||||||||||
| Lynn Elsenhans |
43,863 | 41,135 | 1,000 | 2,147 | 40,135 | 4,506 | 35,629 | |||||||||||||||||||||||||
| Dr Laurie Glimcher |
18,503 | 16,614 | – | 813 | 16,614 | 5,122 | 11,492 | |||||||||||||||||||||||||
| Dr Jesse Goodman |
8,853 | 8,086 | – | 412 | 8,086 | 1,734 | 6,352 | |||||||||||||||||||||||||
| Judy Lewent |
30,437 | 29,058 | 10,166 | 1,003 | 18,892 | 2,278 | 16,614 | |||||||||||||||||||||||||
| 1) | Total directors’ interests include beneficial interests and any shares/ADS received as all or part of their fees under the Non-Executive Directors’ share allocation plan. Dividends received on shares/ADS under the plan during the year and in January 2021 were converted into shares/ADS as at 3 February 2021. |
| 2) | Beneficial interests includes shares/ADS held by the Non-Executive Directors and their PCAs. |
| 3) | Shares/ADS allocated during the year under the Non-Executive Directors’ share allocation plan includes dividends reinvested during the year. |
Directors and Senior Management
Further information is provided on compensation and interests of Directors and Senior Management as a group (the group). For this purpose, the group is defined as the Executive and Non-Executive Directors, other members of the CET and the Company Secretary. For the financial year 2020, the following table sets out aggregate remuneration for the group for the periods during which they served in that capacity.
| Remuneration for 2020 | £ | |||
| Total compensation paid |
23,279,531 | |||
| Aggregate increase in accrued pension benefits (net of inflation) |
105,252 | |||
| Aggregate payments to defined contribution schemes | 1,280,970 | |||
During 2020, members of the group were awarded shares and ADS under the company’s various LTI plans, as set out in the table below. To align the interests of Senior Management with those of shareholders, Executive Directors and CET members are required to build and maintain significant holdings of shares in GSK over time. CET members are required to hold shares to an equivalent multiple of two times their base salary, and must continue to satisfy these share ownership requirements for a minimum of 12 months after leaving GSK.
| Awards | Dividend reinvestment awards | |||||||||||||||||||
| Awarded during 2020 | Shares | ADS | Shares | ADS | ||||||||||||||||
| Deferred Annual Bonus Plan (matching awards) |
– | – | 956 | 99 | ||||||||||||||||
| Performance Share Plan |
1,682,807 | 377,238 | 240,354 | 64,739 | ||||||||||||||||
| Deferred Investment Awards(1,2) |
– | – | – | – | ||||||||||||||||
| Share Value Plan(2) |
16,380 | – | – | – | ||||||||||||||||
| 1) | Notional shares and ADS. |
| 2) | Executive Directors are not eligible to receive Deferred Investment Awards or participate in the Share Value Plan. |
GSK Annual Report 2020 131
Annual report on remuneration continued
Directors and Senior Management continued
At 3 March 2021, the group and their PCAs had the following interests in shares and ADS of the company. Interests awarded under the various LTI plans are described in Note 44 to the financial statements, ‘Employee share schemes’ on page 231.
| Interests at 3 March 2021 | Shares | ADS | ||||||
| Owned |
2,031,335 | 467,144 | ||||||
| Unexercised options |
8,030 | – | ||||||
| Deferred Annual Bonus Plan |
484,413 | 140,738 | ||||||
| Performance Share Plan |
6,310,974 | 1,480,220 | ||||||
| Deferred Investment Awards(1,2) |
374,964 | – | ||||||
| Share Value Plan(2) | 49,560 | – | ||||||
| (1) | Notional shares. |
| (2) | Executive Directors are not eligible to receive Deferred Investment Awards or participate in the Share Value Plan. |
Fees in respect of Executive Directors’ external appointments
CEO
Emma Walmsley is an independent non-executive director of Microsoft Corporation. During 2020, she received $325,000, of which $125,123 was delivered as cash and $199,877 as stock options under the Microsoft Corporation’s Deferred Compensation Plan for its non-employee directors.
CSO
Dr Hal Barron is a non-executive director of GRAIL Inc (a private company). During 2020, he earned $40,000 in fees.
Payments to past Directors (audited)
Sir Andrew Witty and Dr Moncef Slaoui left the Board on 31 March 2017 by mutual agreement. Dr Patrick Vallance and Simon Dingemans left the Board on 31 March 2018 and 8 May 2019 as voluntary leavers. The vesting of the DABP awards is governed by the Remuneration policy prevailing at the time each past Director left the Board. The table below reflects the value of the deferred bonuses and accrued dividends to the point of release.
Sir Andrew Witty
| Date of vesting | Number of shares vested | |||
| 2017 DABP |
17 February 2020 | 40,031 | ||
| Dr Moncef Slaoui | ||||
| Date of vesting | Number of ADS vested | |||
| 2017 DABP |
18 February 2020 | 12,498 | ||
| Dr Patrick Vallance | ||||
| Date of vesting | Number of shares vested | |||
| 2017 DABP |
17 February 2020 | 25,200 | ||
| 2018 DABP |
1 March 2021 | 50,301 | ||
| Simon Dingemans(1) | ||||
| Date of vesting | Number of shares vested | |||
| 2017 DABP |
9 May 2020 | 34,314 | ||
| 2018 DABP |
1 March 2021 | 48,628 | ||
| 1) | Mr Simon Dingemans’ 2017 DABP award vested in May 2020 in accordance with the delayed vesting terms of the Recoupment Policy. |
Other benefits: the grossed up costs predominantly for Simon Dingemans’ post-employment home security were £6,243.
Payments for loss of office (audited)
No loss of office payments were made in 2020 or 2019.
132 GSK Annual Report 2020
|
Strategic report
| ||
|
Governance and remuneration
| ||
|
Financial statements
| ||
|
Investor information
|
2020 Remuneration policy summary
The company’s Remuneration policy was approved on 6 May 2020 at GSK’s Annual General Meeting and has operated as intended since its approval. The full policy is available at gsk.com in the Investors section.
Executive Director remuneration policy
| Salary | To provide a core reward for the role. Set at a level appropriate to secure and retain high calibre individuals needed to deliver the Group’s strategic priorities.
|
| Benefits | Levels are set to recruit and retain high calibre individuals to execute the business strategy.
| |
GSK Annual Report 2020 133
|
|
||
|
|
2020 Remuneration policy summary continued
Executive Director remuneration policy continued
| Pension
|
Pension arrangements provide a competitive level of retirement income.
|
| Annual bonus | To incentivise and recognise execution of the business strategy on an annual basis. Rewards the achievement of stretching annual financial and strategic business targets and delivery of personal objectives.
|
134 GSK Annual Report 2020
|
Strategic report
| ||
|
Governance and remuneration
| ||
|
Financial statements
| ||
|
Investor information
|
2020 Remuneration policy summary continued
Executive Director remuneration policy continued
Selection of annual bonus measures
| Performance Share Plan (PSP) |
To incentivise and recognise delivery of the longer term business priorities, financial growth and increases in shareholder value compared to other pharmaceutical companies. In addition, to provide alignment with shareholder interests, a retention element, to encourage long-term shareholding and discourage excessive risk taking.
|
|
Share Ownership Requirements |
||||||
| To align the interests of Executive Directors with those of shareholders, they are required to build and maintain significant holdings of shares in GSK over time. The requirements for each Executive Director are as follows: |
As a minimum, Executive Directors are required to maintain 100% of their share ownership requirements to the end of the first year following retirement from the company and 50% to the end of the second year. | |||||
| % salary
|
||||||
|
|
||||||
| CEO | 650 | |||||
|
|
||||||
| Other Executive Directors | 300 | |||||
|
|
||||||
For details of our policy on clawback/malus, recruitment remuneration, loss of office and termination payments, please refer to the full 2020 Remuneration policy report on pages 140 to 149 of the 2019 Annual Report, available at gsk.com in the Investors section.
GSK Annual Report 2020 135
|
|
||
|
|
2020 Remuneration policy summary continued
Scenarios for future total remuneration
136 GSK Annual Report 2020
|
Strategic report
| ||
|
Governance and remuneration
| ||
|
Financial statements
| ||
|
Investor information
|
2020 Remuneration policy summary continued
Non-Executive Director remuneration policy 2020
The company’s remuneration policy report was approved on Wednesday 6 May 2020 at GSK’s Annual General Meeting. The full policy is available in the Investor section of gsk.com. The following is a summary of this policy.
|
Non-Executive Directors’ fees
| ||||
| Element
|
Purpose and link to strategy
|
Operation
| ||
| Chairman’s fees |
To provide an inclusive flat rate fee that is competitive with those paid by other companies of equivalent size and complexity subject to the limits contained in GSK’s Articles of Association. | There is no formal maximum. However, fees are reviewed annually and set by reference to a review of the Chairman’s performance and independently sourced market data.
The Committee is responsible for evaluating and making recommendations to the Board on the fees payable to the Chairman. The Chairman does not participate in discussions in respect of his fees. | ||
| Fees are paid in cash. The Chairman is required to invest at least 25% of his total net fees in shares or ADS of the company.
| ||||
| Basic fees |
As above | There is no formal maximum. As with the Chairman, fees are reviewed annually and set by reference to independently sourced data. | ||
| The Chairman and CEO are responsible for evaluating and making recommendations to the Board on the fees payable to the company’s Non-Executive Directors. | ||||
| Fees are paid in cash. Directors are required to invest at least 25% of their total net fees in shares or ADS of the company. The shares or ADS are delivered or released following retirement from the Board.
| ||||
| Supplemental fees |
To compensate Non-Executive Directors (other than the Chairman) for taking on additional Board responsibilities or undertaking intercontinental travel. | Additional fees for the Senior Independent Director, Committee Chairs, Scientific and Medical Experts, the Workforce Engagement Director role and intercontinental travel.
The company has the authority to pay an additional fee, up to the equivalent of the Committee Chair supplement (£40,000 with effect from 1 January 2020) to a Non-Executive Director, should the company require significant additional time commitment in exceptional or unforeseen circumstances.
| ||
| Benefits | To facilitate execution of responsibilities and duties required by the role. | Travel and subsistence costs for Non-Executive Directors are incurred in the normal course of business in relation to meetings on Board and Committee matters and other GSK-hosted events. For overseas-based Non-Executive Directors, this includes travel to meetings in the UK. In the event it is necessary for business purposes, whilst not normal practice, Non-Executive Directors may be accompanied by their spouse or partner to these meetings or events. The costs associated with the above are all met by the company and, in some instances, they are deemed to be taxable and therefore treated as benefits for the Non-Executive Director. | ||
|
Approach to recruitment remuneration
|
||||
|
Loss of office
|
The Chairman and other Non-Executive Directors are not entitled to receive any payments in respect of fees for loss of office when they retire or step down from the Board.
GSK Annual Report 2020 137
|
|
||
|
|
2020 Remuneration policy summary continued
Operation and scope of Remuneration policy
Basis of preparation
138 GSK Annual Report 2020
|
Strategic report | ||
|
Governance and remuneration
| ||
|
Financial statements
| ||
|
Investor information
|
Financial
statements
|
In this section
|
||||||||||
| Directors’ statement of responsibilities |
140 | |||||||||
| Independent Auditor’s report |
142 | |||||||||
| Financial statements |
154 | |||||||||
| Notes to the financial statements |
158 | |||||||||
| Financial statements of GlaxoSmithKline plc prepared under UK GAAP |
238 | |||||||||
| GSK Annual Report 2020 139
| ||||||||||
|
Strategic report
| ||
|
Governance and remuneration
| ||
|
Financial statements
| ||
|
Investor information
|
Directors’ statement of responsibilities continued
GSK Annual Report 2020 141
|
Strategic report
| ||
|
Governance and remuneration
| ||
|
Financial statements
| ||
|
Investor information
|
This page is intentionally left blank
GSK Annual Report 2020 143
|
|
||
|
|
This page is intentionally left blank
144 GSK Annual Report 2020
|
Strategic report
| ||
|
Governance and remuneration
| ||
|
Financial statements
| ||
|
Investor information
|
This page is intentionally left blank
GSK Annual Report 2020 145
|
|
||
|
|
This page is intentionally left blank
146 GSK Annual Report 2020
|
Strategic report
| ||
|
Governance and remuneration
| ||
|
Financial statements
| ||
|
Investor information
|
This page is intentionally left blank
GSK Annual Report 2020 147
|
|
||
|
|
This page is intentionally left blank
148 GSK Annual Report 2020
|
Strategic report
| ||
|
Governance and remuneration
| ||
|
Financial statements
| ||
|
Investor information
|
This page is intentionally left blank
GSK Annual Report 2020 149
|
|
||
|
|
This page is intentionally left blank
150 GSK Annual Report 2020
|
Strategic report
| ||
|
Governance and remuneration
| ||
|
Financial statements
| ||
|
Investor information
|
This page is intentionally left blank
GSK Annual Report 2020 151
|
|
||
|
|
This page is intentionally left blank
152 GSK Annual Report 2020
|
Strategic report
| ||
|
Governance and remuneration
| ||
|
Financial statements
| ||
|
Investor information
|
This page is intentionally left blank
GSK Annual Report 2020 153
|
|
||
|
|
for the year ended 31 December 2020
| 2020 | 2019 | 2018 | ||||||||||||||
| Notes | £m | £m | £m | |||||||||||||
| Turnover |
6 | 34,099 | 33,754 | 30,821 | ||||||||||||
| Cost of sales |
(11,704) | (11,863) | (10,241) | |||||||||||||
| Gross profit |
22,395 | 21,891 | 20,580 | |||||||||||||
| Selling, general and administration |
(11,456) | (11,402) | (9,915) | |||||||||||||
| Research and development |
(5,098) | (4,568) | (3,893) | |||||||||||||
| Royalty income |
318 | 351 | 299 | |||||||||||||
| Other operating income/(expense) |
7 | 1,624 | 689 | (1,588) | ||||||||||||
| Operating profit |
8 | 7,783 | 6,961 | 5,483 | ||||||||||||
| Finance income |
11 | 44 | 98 | 81 | ||||||||||||
| Finance expense |
12 | (892) | (912) | (798) | ||||||||||||
| Profit on disposal of interest in associates |
– | – | 3 | |||||||||||||
| Share of after tax profits of associates and joint ventures |
13 | 33 | 74 | 31 | ||||||||||||
| Profit before taxation |
6,968 | 6,221 | 4,800 | |||||||||||||
| Taxation |
14 | (580) | (953) | (754) | ||||||||||||
| Profit after taxation for the year |
6,388 | 5,268 | 4,046 | |||||||||||||
| Profit attributable to non-controlling interests |
639 | 623 | 423 | |||||||||||||
| Profit attributable to shareholders |
5,749 | 4,645 | 3,623 | |||||||||||||
| 6,388 | 5,268 | 4,046 | ||||||||||||||
| Basic earnings per share (pence) |
15 | 115.5p | 93.9p | 73.7p | ||||||||||||
| Diluted earnings per share (pence) |
15 | 114.1p | 92.6p | 72.9p | ||||||||||||
| Consolidated statement of comprehensive income |
| |||||||||||||||
| for the year ended 31 December 2020 |
| |||||||||||||||
| 2020 | 2019 | 2018 | ||||||||||||||
| £m | £m | £m | ||||||||||||||
| Profit for the year | 6,388 | 5,268 | 4,046 | |||||||||||||
| Other comprehensive income/(expense) for the year | ||||||||||||||||
| Items that may be subsequently reclassified to income statement: | ||||||||||||||||
| Exchange movements on overseas net assets and net investment hedges | 37 |
(59) | (832) | (480) | ||||||||||||
| Reclassification of exchange movements on liquidation or disposal of overseas subsidiaries | 37 |
36 | (75) | – | ||||||||||||
| Fair value movements on cash flow hedges | (19) | (20) | 140 | |||||||||||||
| Tax on fair value movements on cash flow hedges | (18) | 16 | (22) | |||||||||||||
| Reclassification of cash flow hedges to income statement | 54 | 3 | (175) | |||||||||||||
| Deferred tax reversed on reclassification of cash flow hedges | – | – | 20 | |||||||||||||
| (6) | (908) | (517) | ||||||||||||||
| Items that will not be reclassified to income statement: | ||||||||||||||||
| Exchange movements on overseas net assets of non-controlling interests | 37 |
(34) | (75) | (1) | ||||||||||||
| Fair value movements on equity investments | 1,348 | 372 | 180 | |||||||||||||
| Tax on fair value movements on equity investments | (220) | (95) | 10 | |||||||||||||
| Remeasurement (losses)/gains on defined benefit plans | (187) | (1,050) | 728 | |||||||||||||
| Tax on remeasurement of defined benefit plans | 69 | 189 | (146) | |||||||||||||
| 976 | (659) | 771 | ||||||||||||||
| Other comprehensive income/(expense) for the year | 37 |
970 | (1,567) | 254 | ||||||||||||
| Total comprehensive income for the year | 7,358 | 3,701 | 4,300 | |||||||||||||
| Total comprehensive income for the year attributable to: | ||||||||||||||||
| Shareholders | 6,753 | 3,153 | 3,878 | |||||||||||||
| Non-controlling interests | 605 | 548 | 422 | |||||||||||||
| Total comprehensive income for the year | 7,358 | 3,701 | 4,300 | |||||||||||||
154 GSK Annual Report 2020
|
Strategic report
| ||
|
Governance and remuneration
| ||
|
Financial statements
| ||
|
Investor information
|
Consolidated balance sheet
as at 31 December 2020
| Notes | 2020 £m |
2019 £m |
||||||||||
| Non-current assets |
||||||||||||
| Property, plant and equipment |
17 | 10,176 | 10,348 | |||||||||
| Right of use assets |
18 | 830 | 966 | |||||||||
| Goodwill |
19 | 10,597 | 10,562 | |||||||||
| Other intangible assets |
20 | 29,824 | 30,955 | |||||||||
| Investments in associates and joint ventures |
21 | 364 | 314 | |||||||||
| Other investments |
22 | 3,060 | 1,837 | |||||||||
| Deferred tax assets |
14 | 4,287 | 4,096 | |||||||||
| Derivative financial instruments |
43 | 5 | 103 | |||||||||
| Other non-current assets |
23 | 1,041 | 1,020 | |||||||||
| Total non-current assets |
60,184 | 60,201 | ||||||||||
| Current assets |
||||||||||||
| Inventories |
24 | 5,996 | 5,947 | |||||||||
| Current tax recoverable |
14 | 671 | 262 | |||||||||
| Trade and other receivables |
25 | 6,952 | 7,202 | |||||||||
| Derivative financial instruments |
43 | 152 | 421 | |||||||||
| Liquid investments |
29 | 78 | 79 | |||||||||
| Cash and cash equivalents |
26 | 6,292 | 4,707 | |||||||||
| Assets held for sale |
27 | 106 | 873 | |||||||||
| Total current assets |
20,247 | 19,491 | ||||||||||
| Total assets |
80,431 | 79,692 | ||||||||||
| Current liabilities |
||||||||||||
| Short-term borrowings |
29 | (3,725 | ) | (6,918 | ) | |||||||
| Contingent consideration liabilities |
32 | (765 | ) | (755 | ) | |||||||
| Trade and other payables |
28 | (15,840 | ) | (14,939 | ) | |||||||
| Derivative financial instruments |
43 | (221 | ) | (188 | ) | |||||||
| Current tax payable |
14 | (545 | ) | (629 | ) | |||||||
| Short-term provisions |
31 | (1,052 | ) | (621 | ) | |||||||
| Total current liabilities |
(22,148 | ) | (24,050 | ) | ||||||||
| Non-current liabilities |
||||||||||||
| Long-term borrowings |
29 | (23,425 | ) | (23,590 | ) | |||||||
| Corporation tax payable |
14 | (176 | ) | (189 | ) | |||||||
| Deferred tax liabilities |
14 | (3,600 | ) | (3,810 | ) | |||||||
| Pensions and other post-employment benefits |
30 | (3,650 | ) | (3,457 | ) | |||||||
| Other provisions |
31 | (707 | ) | (670 | ) | |||||||
| Derivative financial instruments |
43 | (10 | ) | (1 | ) | |||||||
| Contingent consideration liabilities |
32 | (5,104 | ) | (4,724 | ) | |||||||
| Other non-current liabilities |
33 | (803 | ) | (844 | ) | |||||||
| Total non-current liabilities |
(37,475 | ) | (37,285 | ) | ||||||||
| Total liabilities |
(59,623 | ) | (61,335 | ) | ||||||||
| Net assets |
20,808 | 18,357 | ||||||||||
| Equity |
||||||||||||
| Share capital |
36 | 1,346 | 1,346 | |||||||||
| Share premium account |
36 | 3,281 | 3,174 | |||||||||
| Retained earnings |
37 | 6,755 | 4,530 | |||||||||
| Other reserves |
37 | 3,205 | 2,355 | |||||||||
| Shareholders’ equity |
14,587 | 11,405 | ||||||||||
| Non-controlling interests |
6,221 | 6,952 | ||||||||||
| Total equity |
20,808 | 18,357 | ||||||||||
The financial statements on pages 154 to 237 were approved by the Board on 8 March 2021 and signed on its behalf by
Sir Jonathan Symonds
Chairman
GSK Annual Report 2020 155
|
|
||
|
|
Consolidated statement of changes in equity
for the year ended 31 December 2020
| Shareholders’ equity | ||||||||||||||||||||||||||||
| Share capital £m |
Share premium £m |
Retained earnings £m |
Other reserves* £m |
Total £m |
Non-controlling £m |
Total equity £m |
||||||||||||||||||||||
| At 31 December 2017 |
1,343 | 3,019 | (6,477 | ) | 2,047 | (68 | ) | 3,557 | 3,489 | |||||||||||||||||||
| Implementation of IFRS 15 |
– | – | (4 | ) | – | (4 | ) | – | (4 | ) | ||||||||||||||||||
| Implementation of IFRS 9 |
– | – | 277 | (288 | ) | (11 | ) | – | (11 | ) | ||||||||||||||||||
| At 31 December 2017, as adjusted |
1,343 | 3,019 | (6,204 | ) | 1,759 | (83 | ) | 3,557 | 3,474 | |||||||||||||||||||
| Profit for the year |
– | – | 3,623 | – | 3,623 | 423 | 4,046 | |||||||||||||||||||||
| Other comprehensive income for the year |
– | – | 124 | 131 | 255 | (1 | ) | 254 | ||||||||||||||||||||
| Total comprehensive income for the year |
– | – | 3,747 | 131 | 3,878 | 422 | 4,300 | |||||||||||||||||||||
| Distributions to non-controlling interests |
– | – | – | – | – | (570 | ) | (570 | ) | |||||||||||||||||||
| Contribution from non-controlling interests |
– | – | – | – | – | 21 | 21 | |||||||||||||||||||||
| Derecognition of non-controlling interests in Consumer Healthcare Joint Venture |
– | – | 4,056 | – | 4,056 | (4,118 | ) | (62 | ) | |||||||||||||||||||
| Dividends to shareholders |
– | – | (3,927 | ) | – | (3,927 | ) | – | (3,927 | ) | ||||||||||||||||||
| Realised profits on disposal of equity investments |
– | – | 56 | (56 | ) | – | – | – | ||||||||||||||||||||
| Share of associates and joint ventures realised profits on disposal of equity investments |
– | – | 38 | (38 | ) | – | – | – | ||||||||||||||||||||
| Shares issued |
2 | 72 | – | – | 74 | – | 74 | |||||||||||||||||||||
| Write-down of shares held by ESOP Trusts |
– | – | (265 | ) | 265 | – | – | – | ||||||||||||||||||||
| Share-based incentive plans |
– | – | 360 | – | 360 | – | 360 | |||||||||||||||||||||
| Tax on share-based incentive plans |
– | – | 2 | – | 2 | – | 2 | |||||||||||||||||||||
| At 31 December 2018, as reported |
1,345 | 3,091 | (2,137 | ) | 2,061 | 4,360 | (688 | ) | 3,672 | |||||||||||||||||||
| Adjustment to non-controlling interest |
– | – | (579 | ) | – | (579 | ) | 579 | – | |||||||||||||||||||
| At 31 December 2018, as revised |
1,345 | 3,091 | (2,716 | ) | 2,061 | 3,781 | (109 | ) | 3,672 | |||||||||||||||||||
| Implementation of IFRS 16 |
– | – | (93 | ) | – | (93 | ) | – | (93 | ) | ||||||||||||||||||
| At 31 December 2018, as adjusted |
1,345 | 3,091 | (2,809 | ) | 2,061 | 3,688 | (109 | ) | 3,579 | |||||||||||||||||||
| Profit for the year |
– | – | 4,645 | – | 4,645 | 623 | 5,268 | |||||||||||||||||||||
| Other comprehensive income for the year |
– | – | (1,766 | ) | 274 | (1,492 | ) | (75 | ) | (1,567 | ) | |||||||||||||||||
| Total comprehensive income for the year |
– | – | 2,879 | 274 | 3,153 | 548 | 3,701 | |||||||||||||||||||||
| Distributions to non-controlling interests |
– | – | – | – | – | (364 | ) | (364 | ) | |||||||||||||||||||
| Changes in non-controlling interests |
– | – | – | – | – | (10 | ) | (10 | ) | |||||||||||||||||||
| Dividends to shareholders |
– | – | (3,953 | ) | – | (3,953 | ) | – | (3,953 | ) | ||||||||||||||||||
| Recognition of interest in Consumer Healthcare JV |
– | – | 8,082 | – | 8,082 | 6,887 | 14,969 | |||||||||||||||||||||
| Realised losses on disposal of equity investments |
– | – | (4 | ) | 4 | – | – | – | ||||||||||||||||||||
| Shares issued |
1 | 50 | – | – | 51 | – | 51 | |||||||||||||||||||||
| Shares acquired by ESOP Trusts |
– | 33 | 295 | (328 | ) | – | – | – | ||||||||||||||||||||
| Write-down of shares held by ESOP Trusts |
– | – | (344 | ) | 344 | – | – | – | ||||||||||||||||||||
| Share-based incentive plans |
– | – | 365 | – | 365 | – | 365 | |||||||||||||||||||||
| Tax on share-based incentive plans |
– | – | 19 | – | 19 | – | 19 | |||||||||||||||||||||
| At 31 December 2019 |
1,346 | 3,174 | 4,530 | 2,355 | 11,405 | 6,952 | 18,357 | |||||||||||||||||||||
| Profit for the year |
– | – | 5,749 | – | 5,749 | 639 | 6,388 | |||||||||||||||||||||
| Other comprehensive (expense)/income for the year |
– | – | (133 | ) | 1,137 | 1,004 | (34 | ) | 970 | |||||||||||||||||||
| Total comprehensive income for the year |
– | – | 5,616 | 1,137 | 6,753 | 605 | 7,358 | |||||||||||||||||||||
| Distributions to non-controlling interests |
– | – | – | – | – | (1,208 | ) | (1,208 | ) | |||||||||||||||||||
| Contributions from non-controlling interests |
– | – | – | – | – | 3 | 3 | |||||||||||||||||||||
| Changes in non-controlling interests |
– | – | – | – | – | (131 | ) | (131 | ) | |||||||||||||||||||
| Dividends to shareholders |
– | – | (3,977 | ) | – | (3,977 | ) | – | (3,977 | ) | ||||||||||||||||||
| Realised profits on disposal of equity investments |
– | – | 163 | (163 | ) | – | – | – | ||||||||||||||||||||
| Share of associates and joint ventures realised profits on disposal of equity investments |
– | – | 44 | (44 | ) | – | – | – | ||||||||||||||||||||
| Shares issued |
– | 29 | – | – | 29 | – | 29 | |||||||||||||||||||||
| Shares acquired by ESOP Trusts |
– | 78 | 531 | (609 | ) | – | – | – | ||||||||||||||||||||
| Write-down of shares held by ESOP Trusts |
– | – | (529 | ) | 529 | – | – | – | ||||||||||||||||||||
| Share-based incentive plans |
– | – | 381 | – | 381 | – | 381 | |||||||||||||||||||||
| Tax on share-based incentive plans |
– | – | (4 | ) | – | (4 | ) | – | (4 | ) | ||||||||||||||||||
| At 31 December 2020 |
1,346 | 3,281 | 6,755 | 3,205 | 14,587 | 6,221 | 20,808 | |||||||||||||||||||||
| * | an analysis of Other reserves is presented as part of Note 37 ‘Movements in equity’. |
156 GSK Annual Report 2020
|
Strategic report
| ||
|
Governance and remuneration
| ||
|
Financial statements
| ||
|
Investor information
|
Consolidated cash flow statement
for the year ended 31 December 2020
| Notes | 2020 £m | 2019 £m | 2018 £m | |||||||||||||
| Cash flow from operating activities |
||||||||||||||||
| Profit after taxation for the year |
6,388 | 5,268 | 4,046 | |||||||||||||
| Adjustments reconciling profit after tax to operating cash flows |
41 | 3,708 | 4,264 | 5,701 | ||||||||||||
| Cash generated from operations |
10,096 | 9,532 | 9,747 | |||||||||||||
| Taxation paid |
(1,655 | ) | (1,512 | ) | (1,326 | ) | ||||||||||
| Net cash inflow from operating activities |
8,441 | 8,020 | 8,421 | |||||||||||||
| Cash flow from investing activities |
||||||||||||||||
| Purchase of property, plant and equipment |
(1,226 | ) | (1,265 | ) | (1,344 | ) | ||||||||||
| Proceeds from sale of property, plant and equipment |
68 | 95 | 168 | |||||||||||||
| Purchase of intangible assets |
(1,013 | ) | (898 | ) | (452 | ) | ||||||||||
| Proceeds from sale of intangible assets |
1,255 | 404 | 256 | |||||||||||||
| Purchase of equity investments |
(411 | ) | (258 | ) | (309 | ) | ||||||||||
| Proceeds from sale of equity investments |
3,269 | 69 | 151 | |||||||||||||
| Contingent consideration paid |
(120 | ) | (113 | ) | (153 | ) | ||||||||||
| Purchase of businesses, net of cash acquired |
40 | 15 | (3,571 | ) | – | |||||||||||
| Disposal of businesses |
40 | 259 | 104 | 26 | ||||||||||||
| Investments in associates and joint ventures |
40 | (4 | ) | (11 | ) | (10 | ) | |||||||||
| Proceeds from disposal of interests in associates |
40 | – | – | 3 | ||||||||||||
| (Increase)/decrease in liquid investments |
(1 | ) | 1 | – | ||||||||||||
| Interest received |
39 | 82 | 72 | |||||||||||||
| Dividends from associates, joint ventures and equity investments |
31 | 7 | 39 | |||||||||||||
| Net cash inflow/(outflow) from investing activities |
2,161 | (5,354 | ) | (1,553 | ) | |||||||||||
| Cash flow from financing activities |
||||||||||||||||
| Issue of share capital |
36 | 29 | 51 | 74 | ||||||||||||
| Purchase of non-controlling interests |
– | (7 | ) | (9,320 | ) | |||||||||||
| Increase in long-term loans |
3,298 | 4,794 | 10,138 | |||||||||||||
| Repayment of short-term Notes |
(3,738 | ) | (4,160 | ) | (2,067 | ) | ||||||||||
| (Repayment of)/increase in other short-term loans |
(3,567 | ) | 3,095 | 81 | ||||||||||||
| Repayment of lease liabilities |
(227 | ) | (214 | ) | (28 | ) | ||||||||||
| Interest paid |
(864 | ) | (895 | ) | (766 | ) | ||||||||||
| Dividends paid to shareholders |
(3,977 | ) | (3,953 | ) | (3,927 | ) | ||||||||||
| Distributions to non-controlling interests |
(1,208 | ) | (364 | ) | (570 | ) | ||||||||||
| Contributions from non-controlling interests |
3 | – | 21 | |||||||||||||
| Other financing cash flows |
119 | (187 | ) | (25 | ) | |||||||||||
| Net cash outflow from financing activities |
(10,132 | ) | (1,840 | ) | (6,389 | ) | ||||||||||
|
|
||||||||||||||||
| Increase in cash and bank overdrafts |
42 | 470 | 826 | 479 | ||||||||||||
| Cash and bank overdrafts at beginning of year |
4,831 | 4,087 | 3,600 | |||||||||||||
| Exchange adjustments |
(39 | ) | (82 | ) | 8 | |||||||||||
| Increase in cash and bank overdrafts |
470 | 826 | 479 | |||||||||||||
| Cash and bank overdrafts at end of year |
5,262 | 4,831 | 4,087 | |||||||||||||
| Cash and bank overdrafts at end of year comprise: |
||||||||||||||||
| Cash and cash equivalents |
6,292 | 4,707 | 3,874 | |||||||||||||
| Cash and cash equivalents reported in assets held for sale |
– | 507 | 485 | |||||||||||||
| 6,292 | 5,214 | 4,359 | ||||||||||||||
| Overdrafts |
(1,030 | ) | (383 | ) | (272 | ) | ||||||||||
| 5,262 | 4,831 | 4,087 | ||||||||||||||
GSK Annual Report 2020 157
|
Strategic report
| ||
|
Governance and remuneration
| ||
|
Financial statements
| ||
|
Investor information
|
Notes to the financial statements continued
2. Accounting principles and policies continued
GSK Annual Report 2020 159
|
|
||
|
|
Notes to the financial statements continued
2. Accounting principles and policies continued
160 GSK Annual Report 2020
|
Strategic report
| ||
|
Governance and remuneration
| ||
|
Financial statements
| ||
|
Investor information
|
Notes to the financial statements continued
2. Accounting principles and policies continued
GSK Annual Report 2020 161
|
|
||
|
|
Notes to the financial statements continued
2. Accounting principles and policies continued
162 GSK Annual Report 2020
|
Strategic report
| ||
|
Governance and remuneration
| ||
|
Financial statements
| ||
|
Investor information
|
Notes to the financial statements continued
2. Accounting principles and policies continued
3. Key accounting judgements and estimates
GSK Annual Report 2020 163
|
|
||
|
|
Notes to the financial statements continued
3. Key accounting judgements and estimates continued
164 GSK Annual Report 2020
|
Strategic report
| ||
|
Governance and remuneration
| ||
|
Financial statements
| ||
|
Investor information
|
Notes to the financial statements continued
3. Key accounting judgements and estimates continued
4. New accounting requirements
GSK Annual Report 2020 165
|
|
||
|
|
Notes to the financial statements continued
5. Exchange rates
The Group uses the average of exchange rates prevailing during the period to translate the results and cash flows of overseas subsidiaries, joint ventures and associates into Sterling and period end rates to translate the net assets of those entities. The currencies which most influence these translations and the relevant exchange rates were:
6. Turnover and segment information
Operating segments are reported based on the financial information provided to the Chief Executive Officer and the responsibilities of the Corporate Executive Team (CET). GSK reports results under four segments: Pharmaceuticals; Pharmaceuticals R&D; Vaccines and Consumer Healthcare, and individual members of the CET are responsible for each segment.
The Group’s management reporting process allocates intra-Group profit on a product sale to the market in which that sale is recorded, and the profit analyses below have been presented on that basis.
Corporate and other unallocated turnover and costs includes the results of certain Consumer Healthcare products which are being held for sale in a number of markets in order to meet anti-trust approval requirements, together with the costs of corporate functions.
Revenue recognised in the year from performance obligations satisfied in previous periods totalled £1,207 million (2019 – £793 million) and included £649 million (2019 – £451 million) impacting turnover arising from changes to prior year estimates of RAR (returns and rebates) accruals, £238 million (2019 – £15 million) of milestone income and £320 million (2019 – £328 million) of royalty income recognised in the current year.
| Turnover by segment | 2020 £m |
2019 £m |
2018 £m |
|||||||||
| Pharmaceuticals |
17,056 | 17,554 | 17,269 | |||||||||
| Vaccines |
6,982 | 7,157 | 5,894 | |||||||||
| Consumer Healthcare |
10,033 | 8,995 | 7,658 | |||||||||
| Segment turnover |
34,071 | 33,706 | 30,821 | |||||||||
| Corporate and other unallocated turnover |
28 | 48 | – | |||||||||
| 34,099 | 33,754 | 30,821 | ||||||||||
| Pharmaceuticals turnover by therapeutic area | 2020 £m |
2019 £m |
2018 £m |
|||||||||
| Respiratory |
3,749 | 3,081 | 2,612 | |||||||||
| HIV |
4,876 | 4,854 | 4,722 | |||||||||
|
Immuno-inflammation |
727 | 613 | 472 | |||||||||
| Oncology |
372 | 230 | – | |||||||||
| Established Pharmaceuticals |
7,332 | 8,776 | 9,463 | |||||||||
| 17,056 | 17,554 | 17,269 | ||||||||||
| Vaccines turnover by category | 2020 £m |
2019 £m |
2018 £m |
|||||||||
| Meningitis |
1,029 | 1,018 | 881 | |||||||||
| Influenza |
733 | 541 | 523 | |||||||||
| Shingles |
1,989 | 1,810 | 784 | |||||||||
| Established Vaccines |
3,231 | 3,788 | 3,706 | |||||||||
| 6,982 | 7,157 | 5,894 | ||||||||||
166 GSK Annual Report 2020
|
Strategic report
| ||
|
Governance and remuneration
| ||
|
Financial statements
| ||
|
Investor information
|
Notes to the financial statements continued
6. Turnover and segment information continued
During 2020, the US operations of the Pharmaceuticals and Vaccines businesses made sales to three wholesalers of approximately £2,928 million (2019 – £2,835 million, 2018 – £2,709 million), £3,085 million (2019 – £3,146 million, 2018 – £2,962 million) and £2,795 million (2019 – £2,820 million, 2018 – £2,656 million) respectively, after allocating final-customer discounts to the wholesalers.
GSK has reviewed the presentation of its Consumer Healthcare products and from 1 January 2020 has adopted a revised and more detailed disclosure of category sales closely aligned to consumer healthcare industry standard definitions. Comparative information has been revised onto a consistent basis.
| Consumer Healthcare turnover by category | 2020 £m |
2019 (revised) £m |
2018 (revised) £m |
|||||||||
| Oral health |
2,753 | 2,673 | 2,496 | |||||||||
| Pain relief |
2,219 | 1,781 | 1,440 | |||||||||
| Vitamins, minerals and supplements |
1,506 | 611 | 103 | |||||||||
| Respiratory health |
1,209 | 1,186 | 1,085 | |||||||||
| Digestive health and other |
1,824 | 1,646 | 1,435 | |||||||||
| 9,511 | 7,897 | 6,559 | ||||||||||
| Brands divested/under review |
522 | 1,098 | 1,099 | |||||||||
| 10,033 | 8,995 | 7,658 | ||||||||||
| Segment profit | 2020 £m |
2019 £m |
2018 £m |
|||||||||
| Pharmaceuticals |
7,723 | 7,964 | 8,420 | |||||||||
| Pharmaceuticals R&D |
(3,538 | ) | (3,369 | ) | (2,676 | ) | ||||||
| Pharmaceuticals, including R&D |
4,185 | 4,595 | 5,744 | |||||||||
| Vaccines |
2,713 | 2,966 | 1,943 | |||||||||
| Consumer Healthcare |
2,213 | 1,874 | 1,517 | |||||||||
| Segment profit |
9,111 | 9,435 | 9,204 | |||||||||
| Corporate and other unallocated costs |
(205 | ) | (463 | ) | (459 | ) | ||||||
| Other reconciling items between segment profit and operating profit |
(1,123 | ) | (2,011 | ) | (3,262 | ) | ||||||
| Operating profit |
7,783 | 6,961 | 5,483 | |||||||||
| Finance income |
44 | 98 | 81 | |||||||||
| Finance costs |
(892 | ) | (912 | ) | (798 | ) | ||||||
| Profit on disposal of interest in associates |
– | – | 3 | |||||||||
| Share of after-tax profits of associates and joint ventures |
33 | 74 | 31 | |||||||||
| Profit before taxation |
6,968 | 6,221 | 4,800 | |||||||||
| Taxation |
(580 | ) | (953 | ) | (754 | ) | ||||||
| Profit after taxation for the year |
6,388 | 5,268 | 4,046 | |||||||||
Other reconciling items between segment profit and operating profit comprise items not specifically allocated to segment profit. These include impairment and amortisation of intangible assets; major restructuring costs, which include impairments of tangible assets and computer software; transaction-related adjustments related to significant acquisitions; proceeds and costs of disposals of associates, products and businesses, significant legal charges and expenses on the settlement of litigation and government investigations, other operating income other than royalty income and other items, and separation costs.
| Depreciation and amortisation by segment |
2020 £m |
2019 £m |
2018 £m |
|||||||||
| Pharmaceuticals |
557 | 606 | 506 | |||||||||
| Pharmaceuticals R&D |
298 | 230 | 123 | |||||||||
| Pharmaceuticals, including R&D |
855 | 836 | 629 | |||||||||
| Vaccines |
404 | 418 | 395 | |||||||||
| Consumer Healthcare |
235 | 224 | 146 | |||||||||
| Segment depreciation and amortisation |
1,494 | 1,478 | 1,170 | |||||||||
| Corporate and other unallocated depreciation and amortisation |
82 | 79 | 106 | |||||||||
| Other reconciling items
between segment depreciation and amortisation and |
775 | 777 | 580 | |||||||||
| Total depreciation and amortisation |
2,351 | 2,334 | 1,856 | |||||||||
GSK Annual Report 2020 167
|
|
||
|
|
Notes to the financial statements continued
6. Turnover and segment information continued
| PP&E, intangible asset and goodwill impairment by segment | 2020 £m |
2019 £m |
2018 £m |
|||||||||
| Pharmaceuticals |
38 | 137 | 51 | |||||||||
| Pharmaceuticals R&D |
37 | 16 | 15 | |||||||||
| Pharmaceuticals, including R&D |
75 | 153 | 66 | |||||||||
| Vaccines |
49 | 33 | 5 | |||||||||
| Consumer Healthcare |
5 | – | 4 | |||||||||
| Segment impairment |
129 | 186 | 75 | |||||||||
| Corporate and other unallocated impairment |
5 | 19 | 14 | |||||||||
| Other reconciling items between segment impairment and total impairment |
680 | 621 | 261 | |||||||||
| Total impairment |
814 | 826 | 350 | |||||||||
| PP&E and intangible asset impairment reversals by segment | ||||||||||||
| Pharmaceuticals |
(12 | ) | (6 | ) | (4 | ) | ||||||
| Pharmaceuticals R&D |
(4 | ) | – | (1 | ) | |||||||
| Pharmaceuticals, including R&D |
(16 | ) | (6 | ) | (5 | ) | ||||||
| Vaccines |
(2 | ) | (1 | ) | – | |||||||
| Consumer Healthcare |
– | – | – | |||||||||
| Segment impairment reversals |
(18 | ) | (7 | ) | (5 | ) | ||||||
| Corporate and other unallocated impairment reversals |
(1 | ) | (3 | ) | – | |||||||
| Other reconciling items between segment impairment reversals and total impairment reversals |
(53 | ) | (15 | ) | (8 | ) | ||||||
| Total impairment reversals |
(72 | ) | (25 | ) | (13 | ) | ||||||
| Net operating assets by segment | 2020 £m |
2019 £m |
||||||||||
| Pharmaceuticals |
789 | 1,722 | ||||||||||
| Pharmaceuticals R&D |
3,345 | 4,503 | ||||||||||
| Pharmaceuticals, including R&D |
4,134 | 6,225 | ||||||||||
| Vaccines |
8,995 | 8,828 | ||||||||||
| Consumer Healthcare |
25,176 | 26,328 | ||||||||||
| Segment net operating assets |
38,305 | 41,381 | ||||||||||
| Corporate and other unallocated net operating assets |
2,250 | 1,446 | ||||||||||
| Net operating assets |
40,555 | 42,827 | ||||||||||
| Net debt |
(20,780 | ) | (25,215 | ) | ||||||||
| Investments in associates and joint ventures |
364 | 314 | ||||||||||
| Derivative financial instruments |
(74 | ) | 335 | |||||||||
| Current and deferred taxation |
637 | (270 | ) | |||||||||
| Assets held for sale (excluding cash and cash equivalents) |
106 | 366 | ||||||||||
| Net assets |
20,808 | 18,357 | ||||||||||
The Pharmaceuticals segment includes the Shionogi-ViiV Healthcare contingent consideration liability of £5,359 million (2019 – £5,103 million) and the Pfizer put option of £960 million (2019 – £1,011 million).
168 GSK Annual Report 2020
|
Strategic report
| ||
|
Governance and remuneration
| ||
|
Financial statements
| ||
|
Investor information
|
Notes to the financial statements continued
6. Turnover and segment information continued
Geographical information
The UK is regarded as being the Group’s country of domicile.
| Turnover by location of customer | 2020 £m |
2019 £m |
2018 £m |
|||||||||
| UK |
980 | 942 | 923 | |||||||||
| US |
14,556 | 13,890 | 11,982 | |||||||||
| Rest of World |
18,563 | 18,922 | 17,916 | |||||||||
| External turnover |
34,099 | 33,754 | 30,821 | |||||||||
| Non-current assets by location of subsidiary | 2020 £m |
2019 £m |
||||||||||
| UK |
6,279 | 6,116 | ||||||||||
| US |
17,899 | 19,483 | ||||||||||
| Rest of World |
27,712 | 27,696 | ||||||||||
| Non-current assets |
51,890 | 53,295 | ||||||||||
Non-current assets by location excludes amounts relating to other investments, deferred tax assets, derivative financial instruments, pension assets, amounts receivable under insurance contracts and certain other non-current receivables.
7. Other operating income/(expense)
| 2020 £m |
2019 £m |
2018 £m |
||||||||||
| Fair value remeasurements of equity investments |
(6 | ) | (14 | ) | 20 | |||||||
| Disposal of businesses and assets |
2,779 | 541 | 258 | |||||||||
| Fair value remeasurements on contingent consideration recognised in business combinations |
(1,286 | ) | (92 | ) | (1,252 | ) | ||||||
| Remeasurement of ViiV Healthcare put option liabilities and preferential dividends |
52 | 234 | 58 | |||||||||
| Remeasurement of Consumer Healthcare put option liability |
– | – | (658 | ) | ||||||||
| Fair value adjustments on derivative financial instruments |
20 | – | (3 | ) | ||||||||
| Other income/(expense) |
65 | 20 | (11 | ) | ||||||||
| 1,624 | 689 | (1,588 | ) | |||||||||
Disposal of businesses and assets in 2020 included a net profit on disposal of the Horlicks and other Consumer Healthcare nutritional brands and two subsidiaries in India and Bangladesh of £2,815 million, which reflected reversal of £240 million of embedded derivative gains on the value of the shares taken in prior years. This was partly offset by the related £476 million loss on the shares in Hindustan Unilever Limited, including fair value remeasurement losses between their acquisition as consideration for the divestment of GSK Consumer Healthcare Limited in India and their subsequent disposal. Other operating income also included an increase in profit and milestone income from a number of asset disposals.
In 2019, there was a profit on disposal of rabies and tick-borne encephalitis vaccines of £306 million and a gain arising from the increase in value of the shares in Hindustan Unilever Limited subsequently received in 2020 of £143 million including fair value movements on related derivatives.
Fair value remeasurements on contingent consideration recognised in business combinations included £1,114 million related to the acquisition of the former Shionogi-ViiV Healthcare joint venture and £172 million related to the Vaccines acquisition from Novartis, together with fair value movements on related hedging contracts.
GSK Annual Report 2020 169
|
|
||
|
|
Notes to the financial statements continued
8. Operating profit
| The following items have been included in operating profit: | 2020 £m |
2019 £m |
2018 £m |
|||||||||
| Employee costs (Note 9) |
10,249 | 9,855 | 9,440 | |||||||||
| Advertising |
1,777 | 1,567 | 1,376 | |||||||||
| Distribution costs |
408 | 393 | 389 | |||||||||
| Depreciation of property, plant and equipment |
989 | 1,017 | 954 | |||||||||
| Impairment of property, plant and equipment, net of reversals |
443 | 669 | 203 | |||||||||
| Depreciation of right of use assets |
225 | 214 | ||||||||||
| Impairment of right of use assets |
3 | 2 | ||||||||||
| Amortisation of intangible assets |
1,137 | 1,103 | 902 | |||||||||
| Impairment of intangible assets, net of reversals |
257 | 126 | 134 | |||||||||
| Impairment of property, plant and equipment held for sale, net of reversals |
3 | – | 7 | |||||||||
| Impairment of intangible assets held for sale, net of reversals |
20 | 1 | – | |||||||||
| Impairment of goodwill allocated to a disposal group, net of reversals |
16 | 4 | – | |||||||||
| Net foreign exchange losses/(gains) |
110 | (37 | ) | 81 | ||||||||
| Inventories: |
||||||||||||
| Cost of inventories included in cost of sales |
9,480 | 9,482 | 8,713 | |||||||||
| Write-down of inventories |
699 | 578 | 695 | |||||||||
| Reversal of prior year write-down of inventories |
(274 | ) | (230 | ) | (302 | ) | ||||||
| Short-term lease charge |
11 | 12 | ||||||||||
| Low-value lease charge |
5 | 4 | ||||||||||
| Variable lease payments |
11 | 13 | ||||||||||
| Operating lease rentals: |
||||||||||||
| Minimum lease payments |
188 | |||||||||||
| Contingent rents |
12 | |||||||||||
| Sub-lease payments |
5 | |||||||||||
| Fees payable to the company’s auditor and its associates in relation to the Group (see below) |
29.9 | 30.4 | 29.8 | |||||||||
The reversals of prior year write-downs of inventories principally arise from the reassessment of usage or demand expectations prior to inventory expiration.
Net foreign exchange gains include a net loss of £36 million (2019 – £75 million gain; 2018 – £nil) arising on the reclassification of exchange on liquidation or disposal of overseas subsidiaries.
Included within operating profit are Major restructuring charges of £1,532 million (2019 – £1,105 million; 2018 – £809 million), see Note 10, ‘Major restructuring costs’.
| Fees payable to the company’s auditor and its associates: | 2020 £m |
2019 £m |
2018 £m |
|||||||||
| Audit of parent company and consolidated financial statements including attestation under s.404 of Sarbanes-Oxley Act 2002 |
13.8 | 15.6 | 13.3 | |||||||||
| Audit of the company’s subsidiaries |
14.5 | 13.5 | 12.9 | |||||||||
| Total audit services |
28.3 | 29.1 | 26.2 | |||||||||
| Taxation compliance |
– | – | 0.1 | |||||||||
| Audit related and other assurance services |
1.6 | 1.2 | 3.0 | |||||||||
| All other services |
– | 0.1 | 0.5 | |||||||||
| Total audit-related and non-audit services |
1.6 | 1.3 | 3.6 | |||||||||
| 29.9 | 30.4 | 29.8 | ||||||||||
The other assurance services provided by the auditor related to agreed upon procedures and other assurance services outside of statutory audit requirements. In addition to the above, fees paid to the auditor in respect of the GSK pension schemes were:
| 2020 £m |
2019 £m |
2018 £m |
||||||||||
| Audit |
0.2 | 0.2 | 0.3 | |||||||||
| Other services |
– | – | – | |||||||||
Fees of £0.2 million (2019 – £0.8 million, 2018 – £nil) were also paid to other auditors in respect of audits of certain of the company’s subsidiaries acquired during the year.
170 GSK Annual Report 2020
|
Strategic report
| ||
|
Governance and remuneration
| ||
|
Financial statements
| ||
|
Investor information
|
Notes to the financial statements continued
9. Employee costs
| 2020 £m |
2019 £m |
2018 £m |
||||||||||
| Wages and salaries |
7,802 | 7,583 | 7,203 | |||||||||
| Social security costs |
917 | 852 | 795 | |||||||||
| Pension and other post-employment costs, including augmentations (Note 30) |
519 | 560 | 586 | |||||||||
| Cost of share-based incentive plans |
393 | 432 | 393 | |||||||||
| Severance and other costs from integration and restructuring activities |
618 | 428 | 463 | |||||||||
| 10,249 | 9,855 | 9,440 | ||||||||||
The increase in wages and salaries included the impact of movements in exchange rates. The Group provides benefits to employees, commensurate with local practice in individual countries, including, in some markets, healthcare insurance, subsidised car schemes and personal life assurance.
The cost of share-based incentive plans is analysed as follows:
| 2020 £m |
2019 £m |
2018 £m |
||||||||||
| Share Value Plan |
313 | 302 | 304 | |||||||||
| Performance Share Plan |
64 | 58 | 49 | |||||||||
| Share option plans |
4 | 4 | 4 | |||||||||
| Cash settled and other plans |
12 | 68 | 36 | |||||||||
| 393 | 432 | 393 | ||||||||||
The average monthly number of persons employed by the Group (including Directors) during the year was:
| 2020 Number |
2019 Number |
2018 Number |
||||||||||
| Manufacturing |
34,898 | 36,653 | 37,296 | |||||||||
| Selling, general and administration |
49,162 | 48,535 | 47,887 | |||||||||
| Research and development |
11,824 | 12,026 | 11,668 | |||||||||
| 95,884 | 97,214 | 96,851 | ||||||||||
The average monthly number of Group employees excludes temporary and contract staff. The numbers of Group employees at the end of each financial year are given in the financial record on page 251.
The compensation of the Directors and Senior Management (members of the CET) in aggregate, was as follows:
| 2020 £m |
2019 £m |
2018 £m |
||||||||||
| Wages and salaries |
23 | 28 | 29 | |||||||||
| Social security costs |
4 | 4 | 3 | |||||||||
| Pension and other post-employment costs |
3 | 3 | 3 | |||||||||
| Cost of share-based incentive plans |
25 | 27 | 20 | |||||||||
| 55 | 62 | 55 | ||||||||||
Further information on the remuneration of the Directors is given in the sections of the annual report on remuneration labelled as audited within pages 112 to 138.
GSK Annual Report 2020 171
|
|
||
|
|
Notes to the financial statements continued
10. Major restructuring costs
Within the Pharmaceuticals sector, the highly regulated manufacturing operations and supply chains and long lifecycle of the business mean that restructuring programmes, particularly those that involve the rationalisation or closure of manufacturing or R&D sites, are likely to take several years to complete.
Major restructuring costs are those related to specific Board-approved Major restructuring programmes, including integration costs following material acquisitions, which are structural and are of a significant scale where the costs of individual or related projects exceed £25 million.
The existing Combined restructuring and integration programme incorporates the previous Major Change programme, the Pharmaceuticals restructuring programme and the restructuring and integration programme following the Novartis transaction in 2015. This programme is now substantially complete. In July 2018, the Board-approved a Major restructuring programme, designed to significantly improve the competitiveness and efficiency of the Group’s cost base with savings delivered primarily through supply chain optimisation and reductions in administrative costs. In February 2019, the Board approved a Major restructuring plan to generate synergies from the integration of the Pfizer consumer healthcare business into GSK’s Consumer Healthcare business. In January 2020, the Board approved a two-year Separation Preparation programme to prepare for the separation of GSK into two companies.
The total restructuring costs of £1,532 million in 2020 were incurred in the following areas:
| – | Restructuring costs to prepare for separation of GSK into two companies |
| – | Restructuring following the integration of the Pfizer consumer healthcare business into GSK Consumer Healthcare |
| – | Continued implementation of the restructuring programme that started in July 2018, to simplify the operating models and improve resource allocation of the Pharmaceutical and Consumer Healthcare supply chains |
| – | Continued transformation of central functions, including GSK technology platforms and interfaces, to deliver greater digital synergies, simplification of applications and staff reductions. |
The analysis of the costs charged to operating profit under these programmes was as follows:
| 2020 £m |
2019 £m |
2018 £m |
||||||||||
| Increase in provision for Major restructuring programmes (see Note 31) |
746 | 345 | 450 | |||||||||
| Amount of provision reversed unused (see Note 31) |
(96 | ) | (148 | ) | (99 | ) | ||||||
| Impairment losses recognised |
361 | 521 | 130 | |||||||||
| Other non-cash charges |
104 | 99 | 72 | |||||||||
| Other cash costs |
417 | 288 | 256 | |||||||||
| 1,532 | 1,105 | 809 | ||||||||||
Provision reversals of £96 million (2019 – £148 million, 2018 – £99 million) reflected provision releases mainly for the Combined restructuring and integration programme. Asset impairments of £361 million and other non-cash charges of £104 million principally comprised fixed asset write-downs of manufacturing facilities and accelerated depreciation where asset lives have been shortened in the supply chain manufacturing network as a result of the Major restructuring programmes. All other charges have been or will be settled in cash and include site closure costs, consultancy and project management costs.
The analysis of Major restructuring charges by programme was as follows:
| 2020 | ||||||||||||
| Cash £m |
Non-cash £m |
Total £m |
||||||||||
| Separation Preparation programme |
625 | 216 | 841 | |||||||||
| Consumer Healthcare Joint Venture integration programme |
298 | 28 | 326 | |||||||||
| 2018 Major restructuring programme (including Tesaro) |
105 | 210 | 315 | |||||||||
| Combined restructuring and integration programme |
39 | 11 | 50 | |||||||||
| 1,067 | 465 | 1,532 | ||||||||||
| 2019 | ||||||||||||
| Cash £m |
Non-cash £m |
Total £m |
||||||||||
| Consumer Healthcare Joint Venture integration programme |
248 | 4 | 252 | |||||||||
| 2018 Major restructuring programme (including Tesaro) |
227 | 572 | 799 | |||||||||
| Combined restructuring and integration programme |
10 | 44 | 54 | |||||||||
| 485 | 620 | 1,105 | ||||||||||
172 GSK Annual Report 2020
|
Strategic report
| ||
|
Governance and remuneration
| ||
|
Financial statements
| ||
|
Investor information
|
Notes to the financial statements continued
10. Major restructuring costs continued
The analysis of Major restructuring charges by income statement line was as follows:
| 2020 £m |
2019 £m |
2018 £m |
||||||||||
| Cost of sales |
667 | 658 | 443 | |||||||||
| Selling, general and administration |
659 | 332 | 315 | |||||||||
| Research and development |
206 | 114 | 49 | |||||||||
| Other operating expense |
– | 1 | 2 | |||||||||
| 1,532 | 1,105 | 809 | ||||||||||
11. Finance income
| 2020 £m |
2019 £m |
2018 £m |
||||||||||
| Finance income arising from: |
||||||||||||
| Financial assets measured at amortised cost |
29 | 69 | 73 | |||||||||
| Financial assets measured at fair value through profit or loss |
10 | 10 | 1 | |||||||||
| Net gains arising from the forward element of forward contracts in net investment hedge relationships |
5 | 19 | 7 | |||||||||
| 44 | 98 | 81 | ||||||||||
12. Finance expense
| 2020 £m |
2019 £m |
2018 £m |
||||||||||
| Finance expense arising on: |
||||||||||||
| Financial liabilities at amortised cost |
(813 | ) | (832 | ) | (677 | ) | ||||||
| Derivatives at fair value through profit or loss |
(7 | ) | (6 | ) | (38 | ) | ||||||
| Net losses arising from: |
||||||||||||
| Financial instruments mandatorily measured at fair value through profit or loss |
353 | (425 | ) | 55 | ||||||||
| Retranslation of loans |
(357 | ) | 424 | (52 | ) | |||||||
| Reclassification of hedges from other comprehensive income |
(2 | ) | (2 | ) | (2 | ) | ||||||
| Unwinding of discounts on provisions |
(3 | ) | (8 | ) | (15 | ) | ||||||
| Finance expense arising on lease liabilities |
(40 | ) | (39 | ) | (2 | ) | ||||||
| Other finance expense |
(23 | ) | (24 | ) | (67 | ) | ||||||
| (892 | ) | (912 | ) | (798 | ) | |||||||
Finance expense arising on derivatives at fair value through profit or loss relates to swap interest expense. The 2018 figure in finance expense arising on lease liabilities related to interest arising on finance leases under the previous leasing standard, IAS 17, which was originally reported in ‘Other finance expense’. In 2018, other finance expense included a £39 million charge for interest relating to historical income tax settlements.
GSK Annual Report 2020 173
|
|
||
|
|
Notes to the financial statements continued
13. Associates and joint ventures
The Group’s share of after-tax profits and losses of associates and joint ventures is set out below:
| 2020 £m |
2019 £m |
2018 £m |
||||||||||
| Share of after-tax profits of associates |
33 | 85 | 28 | |||||||||
| Share of after-tax (losses)/profits of joint ventures |
– | (11 | ) | 3 | ||||||||
| 33 | 74 | 31 | ||||||||||
At 31 December 2020, the Group held one significant associate, Innoviva, Inc.
Summarised income statement information in respect of Innoviva is set out below. The Group’s 2020 share of after-tax profits of associates and other comprehensive income includes a profit of £41 million and other comprehensive income of £nil in respect of Innoviva.
The results of Innoviva included in the summarised income statement information below represent the estimated earnings of Innoviva in the relevant periods, based on publicly available information at the balance sheet date. Innoviva’s turnover arises from royalty income from GSK in relation to Relvar/Breo Ellipta, Anoro Ellipta and Trelegy Ellipta sales.
| 2020 £m |
2019 £m |
2018 £m |
||||||||||
| Turnover |
253 | 193 | 183 | |||||||||
| Profit after taxation |
174 | 116 | 134 | |||||||||
| Total comprehensive income |
174 | 116 | 134 | |||||||||
Aggregated financial information in respect of GSK’s share of other associated undertakings and joint ventures is set out below:
| 2020 £m |
2019 £m |
2018 £m |
||||||||||
| Share of turnover |
– | 32 | 242 | |||||||||
| Share of after-tax losses |
(8 | ) | (5 | ) | (2 | ) | ||||||
| Share of other comprehensive income |
53 | 1 | – | |||||||||
| Share of total comprehensive income/(expense) |
45 | (5 | ) | (2 | ) | |||||||
The Group’s sales to associates and joint ventures were £nil in 2020 (2019 – £11 million; 2018 – £43 million).
174 GSK Annual Report 2020
|
Strategic report
| ||
|
Governance and remuneration
| ||
|
Financial statements
| ||
|
Investor information
|
Notes to the financial statements continued
14. Taxation
The Group’s tax charge is the sum of the total current and deferred tax expense.
| Taxation charge based on profits for the year | 2020 £m |
2019 £m |
2018 £m |
|||||||||
| UK current year charge |
30 | 149 | 234 | |||||||||
| Rest of World current year charge |
1,177 | 1,407 | 1,426 | |||||||||
| Charge/(credit) in respect of prior periods |
66 | (420 | ) | (492 | ) | |||||||
| Current taxation |
1,273 | 1,136 | 1,168 | |||||||||
| Deferred taxation |
(693 | ) | (183 | ) | (414 | ) | ||||||
| 580 | 953 | 754 | ||||||||||
In 2020, GSK made payments of £235 million in UK corporation tax to HMRC. These amounts are for UK corporation tax only, and do not include the various other business taxes borne in the UK by GSK each year.
The deferred tax credit in 2020 reflected the origination of current year expenses where offset against taxable profits in future periods is probable. This relates primarily to the unwind of deferred tax liabilities on intangible assets, the recognition of current year tax losses and the reversal of other temporary differences. In 2018, this also included an uplift in the tax carrying value of certain Consumer Healthcare brands as a result of the acquisition of Novartis’ interest in the former Consumer Healthcare joint venture.
Significant prior year credits in 2019 and 2018 reflected the impact of the settlement of a number of open issues with tax authorities in each period.
The following table reconciles the tax charge calculated at the UK statutory rate on the Group profit before tax with the actual tax charge for the year.
| Reconciliation of taxation on Group profits | 2020 £m |
2020 % |
2019 £m |
2019 % |
2018 £m |
2018 % |
||||||||||||||||||
| Profit before tax |
6,968 | 6,221 | 4,800 | |||||||||||||||||||||
| UK statutory rate of taxation |
1,324 | 19.0 | 1,182 | 19.0 | 912 | 19.0 | ||||||||||||||||||
| Differences in overseas taxation rates |
552 | 7.9 | 667 | 10.7 | 635 | 13.2 | ||||||||||||||||||
| Benefit of intellectual property incentives |
(586 | ) | (8.4 | ) | (691 | ) | (11.1 | ) | (482 | ) | (10.0 | ) | ||||||||||||
| R&D credits |
(105 | ) | (1.5 | ) | (119 | ) | (1.9 | ) | (73 | ) | (1.5 | ) | ||||||||||||
| Fair value remeasurement of non-taxable put options |
(3 | ) | (0.0 | ) | (45 | ) | (0.7 | ) | 221 | 4.6 | ||||||||||||||
| Tax losses where no benefit is recognised |
18 | 0.3 | 15 | 0.2 | 24 | 0.5 | ||||||||||||||||||
| Permanent differences on disposals and acquisitions |
(338 | ) | (4.9 | ) | 68 | 1.1 | (7 | ) | (0.1 | ) | ||||||||||||||
| Other permanent differences |
98 | 1.4 | 119 | 1.9 | 53 | 1.1 | ||||||||||||||||||
| Re-assessments of prior year estimates |
(228 | ) | (3.3 | ) | (364 | ) | (5.9 | ) | (436 | ) | (9.1 | ) | ||||||||||||
| Changes in tax rates |
(152 | ) | (2.2 | ) | 121 | 2.0 | (93 | ) | (1.9 | ) | ||||||||||||||
| Tax charge/tax rate |
580 | 8.3 | 953 | 15.3 | 754 | 15.7 | ||||||||||||||||||
GSK has a substantial business presence in many countries around the globe. The impact of differences in overseas taxation rates arose from profits being earned in countries with tax rates higher than the UK statutory rate, the most significant of which in 2020 were the US, Belgium, Germany, India and Japan. The adverse impact was partly offset by the benefit of intellectual property incentives such as the UK Patent Box and Belgian Patent Income Deduction regimes, which provide a reduced rate of corporation tax on profits earned from qualifying patents. We claim these incentives in the manner intended by the relevant statutory or regulatory framework.
In 2020, ‘Changes in tax rates’ included credits in relation to the UK, where a reduction in the corporation tax rate from 19% to 17% was cancelled, and India, where the tax treatment of dividends changed with effect from 1 April 2020. The UK credit in 2020 partly reversed the expense in 2019 where a future benefit was provided at the formerly enacted corporation tax rate of 17%.
Permanent differences on disposals and acquisitions in 2020 reflects the tax impact of the disposal of Horlicks and other Consumer Healthcare brands to Unilever and subsequent disposal of shares received in Hindustan Unilever.
The Group’s 2020 tax rate of 8.3% has also been influenced by the reassessment of open issues with tax authorities in various jurisdictions. The re-assessment of prior year estimates includes both current and deferred tax.
Future tax charges, and therefore our effective tax rate, may be affected by factors such as acquisitions, disposals, restructurings, the location of R&D activity, tax regime reforms and resolution of open matters as we continue to bring our tax affairs up to date around the world.
GSK Annual Report 2020 175
|
|
||
|
|
Notes to the financial statements continued
14. Taxation continued
| Tax on items charged to equity and statement of comprehensive income | 2020 £m |
2019 £m |
2018 £m |
|||||||||
| Current taxation |
||||||||||||
| Share-based payments |
(14 | ) | 1 | – | ||||||||
| Defined benefit plans |
(18 | ) | 16 | (2 | ) | |||||||
| Fair value movements on cash flow hedges |
12 | – | – | |||||||||
| Fair value movements on equity investments |
89 | – | – | |||||||||
| 69 | 17 | (2 | ) | |||||||||
| Deferred taxation |
||||||||||||
| Share-based payments |
18 | 18 | 2 | |||||||||
| Defined benefit plans |
(51 | ) | 173 | (144 | ) | |||||||
| Fair value movements on cash flow hedges |
6 | 16 | (2 | ) | ||||||||
| Fair value movements on equity investments |
131 | (95 | ) | 10 | ||||||||
| 104 | 112 | (134 | ) | |||||||||
| Total credit/(charge) to equity and statement of comprehensive income |
173 | 129 | (136 | ) | ||||||||
All of the above items have been charged to the statement of comprehensive income except for tax on share-based payments.
Issues relating to taxation
The integrated nature of the Group’s worldwide operations involves significant investment in research and strategic manufacture at a limited number of locations, with consequential cross-border supply routes into numerous end-markets. In line with current OECD guidelines we base our transfer pricing policy on the ‘arm’s length’ principle. However, different tax authorities may seek to attribute further profit to activities being undertaken in their jurisdiction potentially resulting in double taxation. The Group also has open items in several jurisdictions concerning such matters as the deductibility of particular expenses and the tax treatment of certain business transactions. GSK applies a risk based approach to determine the transactions most likely to be subject to challenge and the probability that the Group would be able to obtain compensatory adjustments under international tax treaties.
The calculation of the Group’s total tax charge therefore necessarily involves a degree of estimation and judgement in respect of certain items whose tax treatment cannot be finally determined until resolution has been reached with the relevant tax authority or, as appropriate, through a formal legal process. At 31 December 2020 the Group had recognised provisions of £856 million in respect of such uncertain tax positions (2019 – £933 million). The decrease in recognised provisions during 2020 was driven by the reassessment of estimates and the utilisation of provisions for uncertain tax positions following the settlement of a number of open issues with tax authorities in various jurisdictions. Whilst the ultimate liability for such matters may vary from the amounts provided and is dependent upon the outcome of agreements with the relevant tax authorities, or litigation where appropriate, the Group continues to believe that it has made appropriate provision for periods which are open and not yet agreed by the tax authorities.
A provision for deferred tax liabilities of £150 million as at 31 December 2020 (2019 – £198 million) has been made in respect of taxation that would be payable on the remittance of profits by certain overseas subsidiaries. Whilst the aggregate amount of unremitted profits at the balance sheet date was approximately £17 billion (2019 – £19 billion), the majority of these unremitted profits would not be subject to tax (including withholding tax) on repatriation, as UK legislation relating to company distributions provides for exemption from tax for most overseas profits, subject to certain exceptions. Deferred tax is not provided on temporary differences of £974 million (2019 – £326 million) arising on unremitted profits as management has the ability to control any future reversal and does not consider such a reversal to be probable.
Continued focus on tax reform is expected in 2021 and future years driven by the OECD’s project to address the tax challenges arising from the digitalisation of the economy. This may result in significant changes to established tax principles and an increase in tax authority disputes. In turn, this could adversely affect GSK’s effective tax rate or could result in higher cash tax liabilities.
176 GSK Annual Report 2020
|
Strategic report
| ||
|
Governance and remuneration
| ||
|
Financial statements
| ||
|
Investor information
|
Notes to the financial statements continued
14. Taxation continued
Movement in deferred tax assets and liabilities
| Accelerated capital allowances £m |
Intangible assets £m |
Contingent £m |
Intra-Group profit £m |
Pensions & other post employment benefits £m |
Tax losses £m |
Share option and award schemes £m |
Other net temporary differences £m |
Total £m |
||||||||||||||||||||||||||||
| At 1 January 2019 |
(295 | ) | (959 | ) | 834 | 1,029 | 694 | 447 | 71 | 950 | 2,771 | |||||||||||||||||||||||||
| Exchange adjustments |
17 | 88 | – | (8 | ) | (40 | ) | (8 | ) | (1 | ) | 55 | 103 | |||||||||||||||||||||||
| Credit/(charge) to income statement |
35 | (204 | ) | (77 | ) | 59 | 9 | 225 | (7 | ) | 143 | 183 | ||||||||||||||||||||||||
| Credit/(charge) to statement of comprehensive income and equity |
– | – | – | – | 186 | – | 18 | (92 | ) | 112 | ||||||||||||||||||||||||||
| Acquisitions and disposals |
1 | (3,117 | ) | – | 40 | 15 | 278 | – | (60 | ) | (2,843 | ) | ||||||||||||||||||||||||
| R&D credits utilisation |
– | – | – | – | – | – | – | (40 | ) | (40 | ) | |||||||||||||||||||||||||
| At 31 December 2019 |
(242 | ) | (4,192 | ) | 757 | 1,120 | 864 | 942 | 81 | 956 | 286 | |||||||||||||||||||||||||
| Exchange adjustments |
(9 | ) | 41 | – | (29 | ) | 4 | (2 | ) | (3 | ) | (57 | ) | (55 | ) | |||||||||||||||||||||
| (Charge)/credit to income statement |
(45 | ) | 194 | 86 | (67 | ) | (44 | ) | 120 | (5 | ) | 454 | 693 | |||||||||||||||||||||||
| Credit/(charge) to statement of comprehensive income and equity |
– | – | – | – | 50 | – | (13 | ) | (141 | ) | (104 | ) | ||||||||||||||||||||||||
| Acquisitions and disposals |
– | (25 | ) | – | – | – | – | – | – | (25 | ) | |||||||||||||||||||||||||
| R&D credits utilisation |
– | – | – | – | – | – | – | (108 | ) | (108 | ) | |||||||||||||||||||||||||
| At 31 December 2020 |
(296 | ) | (3,982 | ) | 843 | 1,024 | 874 | 1,060 | 60 | 1,104 | 687 | |||||||||||||||||||||||||
Deferred tax liabilities provided in relation to intangible assets predominately relate to temporary differences arising on assets and liabilities acquired as part of historic business combinations. Acquisitions and disposals in 2019 includes deferred tax liabilities of £2,591 million related to the Pfizer consumer healthcare business acquisition and £252 million related to the Tesaro acquisition.
The Group continues to recognise deferred tax assets on future obligations in respect of contingent consideration amounts payable to minority shareholders. These payments are tax deductible at the point in time at which payment is made.
A deferred tax asset is recognised on intra-Group profits arising on inter-company inventory which are eliminated within the consolidated accounts. As intra-Group profits are not eliminated from the individual entities’ tax returns a temporary difference arises that will reverse at the point in time inventory is sold externally.
The deferred tax asset of £1,060 million (2019 – £942 million) recognised on tax losses relates to trading losses. Such deferred tax assets are only recognised where it is probable that future taxable profit will be available to utilise losses, as supported by product level forecasts. Other net temporary differences included accrued expenses for which a tax deduction is only available on a paid basis.
Deferred tax asset and liabilities are recognised on the balance sheet as follows:
| 2020 £m |
2019 £m |
|||||||
| Deferred tax assets |
4,287 | 4,096 | ||||||
| Deferred tax liabilities |
(3,600 | ) | (3,810 | ) | ||||
| 687 | 286 | |||||||
| 2020 | 2019 | |||||||||||||||
| Unrecognised tax losses |
Tax losses |
Unrecognised deferred tax asset £m |
Tax losses £m |
Unrecognised deferred tax asset £m |
||||||||||||
| Trading losses expiring: |
||||||||||||||||
| Within 10 years |
962 | 181 | 556 | 117 | ||||||||||||
| More than 10 years |
414 | 51 | 838 | 108 | ||||||||||||
| Available indefinitely |
265 | 47 | 159 | 27 | ||||||||||||
| At 31 December |
1,641 | 279 | 1,553 | 252 | ||||||||||||
| Capital losses expiring: |
||||||||||||||||
| Available indefinitely |
2,287 | 419 | 2,148 | 355 | ||||||||||||
| At 31 December |
2,287 | 419 | 2,148 | 355 | ||||||||||||
GSK Annual Report 2020 177
|
|
||
|
|
Notes to the financial statements continued
15. Earnings per share
| 2020 pence |
2019 pence |
2018 pence |
||||||||||
| Basic earnings per share |
115.5 | 93.9 | 73.7 | |||||||||
| Diluted earnings per share |
114.1 | 92.6 | 72.9 | |||||||||
Basic earnings per share has been calculated by dividing the profit attributable to shareholders by the weighted average number of shares in issue during the period after deducting shares held by the ESOP Trusts and Treasury shares. The trustees have waived their rights to dividends on the shares held by the ESOP Trusts.
Diluted earnings per share has been calculated after adjusting the weighted average number of shares used in the basic calculation to assume the conversion of all potentially dilutive shares. A potentially dilutive share forms part of the employee share schemes where its exercise price is below the average market price of GSK shares during the period and any performance conditions attaching to the scheme have been met at the balance sheet date.
The numbers of shares used in calculating basic and diluted earnings per share are reconciled below.
| Weighted average number of shares in issue | 2020 millions |
2019 millions |
2018 millions |
|||||||||
| Basic |
4,976 | 4,947 | 4,914 | |||||||||
| Dilution for share options and awards |
62 | 69 | 57 | |||||||||
|
Diluted |
5,038 | 5,016 | 4,971 | |||||||||
16. Dividends
| 2020 | 2019 | 2018 | ||||||||||||||||||||||||||||
| Paid/payable | Dividend per share (pence) |
Total dividend £m |
Paid | Dividend per share (pence) |
Total dividend £m |
Paid | Dividend per share (pence) |
Total dividend £m |
||||||||||||||||||||||
| First interim |
9 July 2020 | 19 | 946 | 11 July 2019 | 19 | 940 | 12 July 2018 | 19 | 934 | |||||||||||||||||||||
| Second interim |
8 October 2020 | 19 | 946 | 10 October 2019 | 19 | 941 | 11 October 2018 | 19 | 934 | |||||||||||||||||||||
| Third interim |
14 January 2021 | 19 | 946 | 9 January 2020 | 19 | 941 | 10 January 2019 | 19 | 935 | |||||||||||||||||||||
| Fourth interim |
8 April 2021 | 23 | 1,146 | 9 April 2020 | 23 | 1,144 | 11 April 2019 | 23 | 1,137 | |||||||||||||||||||||
| Total |
80 | 3,984 | 80 | 3,966 | 80 | 3,940 | ||||||||||||||||||||||||
Under IFRS, interim dividends are only recognised in the financial statements when paid and not when declared. GSK normally pays a dividend two quarters after the quarter to which it relates and one quarter after it is declared. The 2020 financial statements recognise those dividends paid in 2020, namely the third and fourth interim dividends for 2019, and the first and second interim dividends for 2020.
The amounts recognised in each year were as follows:
| 2020 £m |
2019 £m |
2018 £m |
||||||||||
| Dividends to shareholders |
3,977 | 3,953 | 3,927 | |||||||||
178 GSK Annual Report 2020
|
Strategic report
| ||
|
Governance and remuneration
| ||
|
Financial statements
| ||
|
Investor information
|
Notes to the financial statements continued
17. Property, plant and equipment
| Land and buildings £m |
Plant, equipment and vehicles £m |
Assets in construction £m |
Total £m |
|||||||||||||
| Cost at 31 December 2018 |
7,811 | 12,537 | 2,140 | 22,488 | ||||||||||||
| Implementation of IFRS 16 |
(64 | ) | (106 | ) | – | (170 | ) | |||||||||
| At 31 December 2018, as adjusted |
7,747 | 12,431 | 2,140 | 22,318 | ||||||||||||
| Exchange adjustments |
(254 | ) | (381 | ) | (70 | ) | (705 | ) | ||||||||
| Additions through business combinations |
149 | 177 | 34 | 360 | ||||||||||||
| Other additions |
42 | 154 | 1,084 | 1,280 | ||||||||||||
| Capitalised borrowing costs |
– | – | 25 | 25 | ||||||||||||
| Disposals and write-offs |
(34 | ) | (528 | ) | (11 | ) | (573 | ) | ||||||||
| Reclassifications |
243 | 919 | (1,231 | ) | (69 | ) | ||||||||||
| Transfer to assets held for sale |
(261 | ) | (711 | ) | (65 | ) | (1,037 | ) | ||||||||
| Cost at 31 December 2019 |
7,632 | 12,061 | 1,906 | 21,599 | ||||||||||||
| Exchange adjustments |
106 | 121 | 10 | 237 | ||||||||||||
| Additions through business combinations |
– | 5 | – | 5 | ||||||||||||
| Other additions |
29 | 147 | 1,052 | 1,228 | ||||||||||||
| Capitalised borrowing costs |
– | – | 15 | 15 | ||||||||||||
| Disposals and write-offs |
(336 | ) | (875 | ) | (29 | ) | (1,240 | ) | ||||||||
| Reclassifications |
189 | 840 | (1,058 | ) | (29 | ) | ||||||||||
| Transfer to assets held for sale |
(132 | ) | (194 | ) | (6 | ) | (332 | ) | ||||||||
| Cost at 31 December 2020 |
7,488 | 12,105 | 1,890 | 21,483 | ||||||||||||
| Depreciation at 31 December 2018 |
(3,233 | ) | (7,534 | ) | – | (10,767 | ) | |||||||||
| Implementation of IFRS 16 |
30 | 42 | – | 72 | ||||||||||||
| At 31 December 2018, as adjusted |
(3,203 | ) | (7,492 | ) | – | (10,695 | ) | |||||||||
| Exchange adjustments |
74 | 196 | – | 270 | ||||||||||||
| Charge for the year |
(265 | ) | (752 | ) | – | (1,017 | ) | |||||||||
| Disposals and write-offs |
19 | 380 | – | 399 | ||||||||||||
| Transfer to assets held for sale |
159 | 477 | – | 636 | ||||||||||||
| Depreciation at 31 December 2019 |
(3,216 | ) | (7,191 | ) | – | (10,407 | ) | |||||||||
| Exchange adjustments |
(49 | ) | (77 | ) | – | (126 | ) | |||||||||
| Charge for the year |
(271 | ) | (718 | ) | – | (989 | ) | |||||||||
| Disposals and write-offs |
154 | 716 | – | 870 | ||||||||||||
| Transfer to assets held for sale |
72 | 130 | – | 202 | ||||||||||||
| Depreciation at 31 December 2020 |
(3,310 | ) | (7,140 | ) | – | (10,450 | ) | |||||||||
| Impairment at 31 December 2018 |
(174 | ) | (421 | ) | (68 | ) | (663 | ) | ||||||||
| Implementation of IFRS 16 |
– | – | – | – | ||||||||||||
| At 31 December 2018, as adjusted |
(174 | ) | (421 | ) | (68 | ) | (663 | ) | ||||||||
| Exchange adjustments |
13 | 11 | 6 | 30 | ||||||||||||
| Disposals and write-offs |
2 | 77 | 36 | 115 | ||||||||||||
| Impairment losses |
(312 | ) | (329 | ) | (38 | ) | (679 | ) | ||||||||
| Reversal of impairments |
2 | 8 | – | 10 | ||||||||||||
| Transfer to assets held for sale |
90 | 209 | 44 | 343 | ||||||||||||
| Impairment at 31 December 2019 |
(379 | ) | (445 | ) | (20 | ) | (844 | ) | ||||||||
| Exchange adjustments |
(6 | ) | – | 1 | (5 | ) | ||||||||||
| Disposals and write-offs |
190 | 124 | 16 | 330 | ||||||||||||
| Impairment losses |
(147 | ) | (303 | ) | (27 | ) | (477 | ) | ||||||||
| Reversal of impairments |
13 | 18 | 3 | 34 | ||||||||||||
| Transfer to assets held for sale |
49 | 55 | 1 | 105 | ||||||||||||
| Impairment at 31 December 2020 |
(280 | ) | (551 | ) | (26 | ) | (857 | ) | ||||||||
| Total depreciation and impairment at 31 December 2019 |
(3,595 | ) | (7,636 | ) | (20 | ) | (11,251 | ) | ||||||||
| Total depreciation and impairment at 31 December 2020 |
(3,590 | ) | (7,691 | ) | (26 | ) | (11,307 | ) | ||||||||
| Net book value at 1 January 2019 |
4,404 | 4,582 | 2,072 | 11,058 | ||||||||||||
| Net book value at 31 December 2019 |
4,037 | 4,425 | 1,886 | 10,348 | ||||||||||||
| Net book value at 31 December 2020 |
3,898 | 4,414 | 1,864 | 10,176 | ||||||||||||
GSK Annual Report 2020 179
|
|
||
|
|
Notes to the financial statements continued
17. Property, plant and equipment continued
The weighted average interest rate for capitalised borrowing costs in the year was 3% (2019 – 3%). Disposals and write-offs in the year included a number of assets with nil net book value that are no longer in use in the business.
The impairment losses principally arose from decisions to rationalise facilities and were calculated based on fair value less costs of disposal. The fair value less costs of disposal valuation methodology uses significant inputs which are not based on observable market data, and therefore this valuation technique is classified as level 3 of the fair value hierarchy. These calculations determine the net present value of the projected risk-adjusted, post-tax cash flows of the relevant asset or cash generating unit, applying a discount rate of the Group post-tax weighted average cost of capital (WACC) of 7%, adjusted where appropriate for specific segment, country and currency risk.
Assets that continue to be used by the Group are generally assessed as part of their associated cash generating unit on a value in use basis. For value in use calculations, the post-tax cash flows do not include the impact of future uncommitted restructuring plans or improvements. Where an impairment is indicated and a pre-tax cash flow calculation is expected to give a materially different result, the test would be reperformed using pre-tax cash flows and a pre-tax discount rate. The Group WACC is equivalent to a pre-tax discount rate of approximately 9%.
The net impairment losses have been charged to cost of sales: £398 million (2019 – £624 million), R&D: £3 million (2019 – £1 million) and SG&A: £42 million (2019 – £44 million), and included £343 million (2019 – £502 million) arising from the Major restructuring programmes.
Reversals of impairment arose from subsequent reviews of the impaired assets where the conditions which gave rise to the original impairments were deemed no longer to apply. All of the reversals have been credited to cost of sales.
During 2020, £29 million (2019 – £69 million) of computer software was reclassified from assets in construction to intangible assets on becoming ready for use.
18. Right of use assets
| Land and buildings £m |
Plant and equipment £m |
Vehicles £m |
Total £m |
|||||||||||||
| Net book value at 1 January 2019 |
907 | 27 | 137 | 1,071 | ||||||||||||
| Exchange adjustments |
(28 | ) | (2 | ) | (6 | ) | (36 | ) | ||||||||
| Additions through business combinations |
66 | 11 | 2 | 79 | ||||||||||||
| Other additions |
60 | 1 | 71 | 132 | ||||||||||||
| Depreciation |
(145 | ) | (8 | ) | (61 | ) | (214 | ) | ||||||||
| Disposals |
(37 | ) | (20 | ) | (7 | ) | (64 | ) | ||||||||
| Impairments |
(2 | ) | – | – | (2 | ) | ||||||||||
|
Reclassifications |
– | 13 | (13 | ) | – | |||||||||||
| Net book value at 31 December 2019 |
821 | 22 | 123 | 966 | ||||||||||||
| Exchange adjustments |
(11 | ) | 1 | 1 | (9 | ) | ||||||||||
| Other additions |
119 | 2 | 66 | 187 | ||||||||||||
| Depreciation |
(152 | ) | (5 | ) | (68 | ) | (225 | ) | ||||||||
| Disposals |
(73 | ) | (2 | ) | (9 | ) | (84 | ) | ||||||||
| Impairments |
(3 | ) | – | – | (3 | ) | ||||||||||
|
Reclassifications |
(2 | ) | – | – | (2 | ) | ||||||||||
| Net book value at 31 December 2020 |
699 | 18 | 113 | 830 | ||||||||||||
The total cash outflow for leases amounted to £227 million. There were no significant lease commitments for leases not commenced at year-end.
An analysis of lease liabilities is set out in Note 29, ‘Net debt’.
180 GSK Annual Report 2020
|
Strategic report
| ||
|
Governance and remuneration
| ||
|
Financial statements
| ||
|
Investor information
|
Notes to the financial statements continued
19. Goodwill
| 2020 £m |
2019 £m |
|||||||
| Cost at 1 January |
10,562 | 5,789 | ||||||
| Exchange adjustments |
(54 | ) | (277 | ) | ||||
| Additions through business combinations (Note 40) |
124 | 5,023 | ||||||
| Transfer (to)/from assets held for sale |
(35 | ) | 27 | |||||
| Cost at 31 December |
10,597 | 10,562 | ||||||
| Net book value at 1 January |
10,562 | 5,789 | ||||||
| Net book value at 31 December |
10,597 | 10,562 | ||||||
| Goodwill is allocated to the Group’s segments as follows: |
||||||||
| 2020 £m |
2019 £m |
|||||||
| Pharmaceuticals |
4,245 | 4,316 | ||||||
| Vaccines |
1,295 | 1,280 | ||||||
| Consumer Healthcare |
5,057 | 4,966 | ||||||
| Net book value at 31 December |
10,597 | 10,562 | ||||||
The recoverable amounts of the cash generating units are assessed using a fair value less costs of disposal model. Fair value less costs of disposal is calculated using a discounted cash flow approach, with a post-tax discount rate applied to the projected risk-adjusted post-tax cash flows and terminal value.
The discount rate used is based on the Group WACC of 7%, as most cash generating units have integrated operations across large parts of the Group. The discount rate is adjusted where appropriate for specific segment, country and currency risks. The valuation methodology uses significant inputs which are not based on observable market data, therefore this valuation technique is classified as level 3 in the fair value hierarchy.
Details relating to the discounted cash flow models used in the impairment tests of the Pharmaceuticals, Vaccines and Consumer Healthcare cash generating units are as follows:
| Valuation basis | Fair value less costs of disposal | |||||||||
| Key assumptions | Sales growth rates |
| ||||||||
| Profit margins |
| |||||||||
| Terminal growth rate |
| |||||||||
| Discount rate |
| |||||||||
| Taxation rate |
| |||||||||
| Determination of assumptions | Growth rates are internal forecasts based on both internal and external market information. |
| ||||||||
| Margins reflect past experience, adjusted for expected changes. |
| |||||||||
| Terminal growth rates based on management’s estimate of future long-term average growth rates. |
| |||||||||
| Discount rates based on Group WACC, adjusted where appropriate. |
| |||||||||
| Taxation rates based on appropriate rates for each region. |
| |||||||||
| Period of specific projected cash flows | Five years |
| ||||||||
| Terminal growth rate and discount rate |
|
Terminal growth rate | Discount rate | |||||||
| Pharmaceuticals | 1% p.a. | 7.5% | ||||||||
| Vaccines | 1% p.a. | 7.5% | ||||||||
| Consumer Healthcare | 2% p.a. | 6% | ||||||||
The terminal growth rates do not exceed the long-term projected growth rates for the relevant markets, reflect the impact of future generic competition and take account of new product launches.
Goodwill is monitored for impairment at the segmental level. In each case the valuations indicated sufficient headroom such that a reasonably possible change to key assumptions is unlikely to result in an impairment of the related goodwill.
The Consumer Healthcare cash generating unit also comprises a collection of smaller cash generating units including brands with indefinite lives with a carrying value of £18.4 billion (2019 – £19.6 billion).
Details of indefinite life brands are given in Note 20, ‘Other intangible assets’.
GSK Annual Report 2020 181
|
|
||
|
|
Notes to the financial statements continued
20. Other intangible assets
| Computer software £m |
Licences, patents, amortised brands etc. £m |
Indefinite life brands £m |
Total £m |
|||||||||||||
| Cost at 1 January 2019 |
2,365 | 16,166 | 9,056 | 27,587 | ||||||||||||
| Exchange adjustments |
(37 | ) | (418 | ) | (1,037 | ) | (1,492 | ) | ||||||||
| Capitalised development costs |
– | 239 | – | 239 | ||||||||||||
| Capitalised borrowing costs |
1 | – | – | 1 | ||||||||||||
| Additions through business combinations |
31 | 3,091 | 12,357 | 15,479 | ||||||||||||
| Other additions |
197 | 465 | – | 662 | ||||||||||||
| Disposals and asset write-offs |
(235 | ) | (7 | ) | – | (242 | ) | |||||||||
| Transfer to assets held for sale |
(7 | ) | (62 | ) | (227 | ) | (296 | ) | ||||||||
|
Reclassifications |
82 | 242 | (255 | ) | 69 | |||||||||||
| Cost at 31 December 2019 |
2,397 | 19,716 | 19,894 | 42,007 | ||||||||||||
| Exchange adjustments |
(1 | ) | (7 | ) | (74 | ) | (82 | ) | ||||||||
| Capitalised development costs |
– | 313 | – | 313 | ||||||||||||
| Additions through business combinations |
2 | – | – | 2 | ||||||||||||
| Other additions |
240 | 494 | – | 734 | ||||||||||||
| Disposals and asset write-offs |
(260 | ) | (20 | ) | – | (280 | ) | |||||||||
| Transfer to assets held for sale |
(4 | ) | (246 | ) | (635 | ) | (885 | ) | ||||||||
|
Reclassifications |
29 | 572 | (572 | ) | 29 | |||||||||||
| Cost at 31 December 2020 |
2,403 | 20,822 | 18,613 | 41,838 | ||||||||||||
|
Amortisation at 1 January 2019 |
(1,307 | ) | (6,413 | ) | – | (7,720 | ) | |||||||||
| Exchange adjustments |
19 | 123 | – | 142 | ||||||||||||
| Charge for the year |
(233 | ) | (870 | ) | – | (1,103 | ) | |||||||||
| Disposals and asset write-offs |
215 | 4 | – | 219 | ||||||||||||
| Transfer to assets held for sale |
4 | 42 | – | 46 | ||||||||||||
| Amortisation at 31 December 2019 |
(1,302 | ) | (7,114 | ) | – | (8,416 | ) | |||||||||
| Exchange adjustments |
(3 | ) | 28 | – | 25 | |||||||||||
| Charge for the year |
(241 | ) | (896 | ) | – | (1,137 | ) | |||||||||
| Disposals and asset write-offs |
221 | 8 | – | 229 | ||||||||||||
| Transfer to assets held for sale |
3 | 42 | – | 45 | ||||||||||||
| Amortisation at 31 December 2020 |
(1,322 | ) | (7,932 | ) | – | (9,254 | ) | |||||||||
|
Impairment at 1 January 2019 |
(12 | ) | (2,329 | ) | (324 | ) | (2,665 | ) | ||||||||
| Exchange adjustments |
3 | 70 | – | 73 | ||||||||||||
| Impairment losses |
(49 | ) | (84 | ) | (3 | ) | (136 | ) | ||||||||
| Reversal of impairments |
– | 10 | – | 10 | ||||||||||||
| Disposals and asset write-offs |
19 | 3 | – | 22 | ||||||||||||
| Transfer to assets held for sale |
2 | 5 | 53 | 60 | ||||||||||||
| Impairment at 31 December 2019 |
(37 | ) | (2,325 | ) | (274 | ) | (2,636 | ) | ||||||||
| Exchange adjustments |
– | 39 | 1 | 40 | ||||||||||||
| Impairment losses |
(29 | ) | (255 | ) | (11 | ) | (295 | ) | ||||||||
| Reversal of impairments |
– | 38 | – | 38 | ||||||||||||
| Disposals and asset write-offs |
38 | – | – | 38 | ||||||||||||
| Transfer to assets held for sale |
– | 55 | – | 55 | ||||||||||||
|
Reclassification |
– | (39 | ) | 39 | – | |||||||||||
| Impairment at 31 December 2020 |
(28 | ) | (2,487 | ) | (245 | ) | (2,760 | ) | ||||||||
|
Total amortisation and impairment at 31 December 2019 |
(1,339 | ) | (9,439 | ) | (274 | ) | (11,052 | ) | ||||||||
| Total amortisation and impairment at 31 December 2020 |
(1,350 | ) | (10,419 | ) | (245 | ) | (12,014 | ) | ||||||||
| Net book value at 1 January 2019 |
1,046 | 7,424 | 8,732 | 17,202 | ||||||||||||
| Net book value at 31 December 2019 |
1,058 | 10,277 | 19,620 | 30,955 | ||||||||||||
| Net book value at 31 December 2020 |
1,053 | 10,403 | 18,368 | 29,824 | ||||||||||||
The weighted average interest rate for capitalised borrowing costs in the year was 3% (2019 – 3%).
The net book value of computer software included £612 million (2019 – £560 million) of internally generated costs.
The carrying value at 31 December 2020 of intangible assets, for which impairments have been charged or reversed in the year, following those impairments or reversals, was £272 million (2019 – £175 million).
The patent expiry dates of the Group’s most significant assets, where relevant, are set out on pages 258 and 259.
182 GSK Annual Report 2020
|
Strategic report
| ||
|
Governance and remuneration
| ||
|
Financial statements
| ||
|
Investor information
|
Notes to the financial statements continued
20. Other intangible assets continued
Amortisation and impairment losses, net of reversals, have been charged in the income statement as follows:
| Amortisation | Net impairment losses | |||||||||||||||
|
2020 |
2019 |
2020 |
2019 |
|||||||||||||
| Cost of sales |
779 | 781 | 21 | 34 | ||||||||||||
| Selling, general and administration |
167 | 163 | 17 | 43 | ||||||||||||
| Research and development |
191 | 159 | 219 | 49 | ||||||||||||
| 1,137 | 1,103 | 257 | 126 | |||||||||||||
Licences, patents, amortised brands etc. includes a large number of acquired licences, patents, know-how agreements and marketing rights, which are either marketed or in use, or still in development. Note 40, ‘Acquisitions and disposals’ gives details of additions through business combinations in the year. The book values of the largest individual items are as follows:
| 2020 £m |
2019 £m |
|||||||
| Tesaro Assets |
2,669 | 2,878 | ||||||
| Meningitis portfolio |
2,114 | 2,139 | ||||||
| Dolutegravir |
1,177 | 1,280 | ||||||
| Benlysta |
745 | 834 | ||||||
| Lamisil |
275 | – | ||||||
| Merck Assets |
264 | 264 | ||||||
| BMS Assets |
239 | 286 | ||||||
| Fluarix/FluLaval |
219 | 237 | ||||||
| Okairos |
205 | 175 | ||||||
| Stiefel trade name |
180 | 204 | ||||||
| Others |
2,316 | 1,980 | ||||||
| 10,403 | 10,277 | |||||||
Tesaro assets comprise Zejula, the currently marketed monotherapy, as well as combination therapies. The Meningitis portfolio includes Menveo, Bexsero, Men ABCWY and Menjugate. Lamisil has been moved into licences, patents, amortised brands etc. following the decision to start amortisation during 2020. GSK has divested the Breathe Right brand during the year.
Indefinite life brands comprise a portfolio of Consumer Healthcare products primarily acquired with the acquisitions of Sterling Winthrop, Inc. in 1994, Block Drug Company, Inc. in 2001, CNS, Inc. in 2006, the Novartis consumer healthcare business in 2015 and the Pfizer consumer healthcare business in 2019. The book values of the major brands are as follows:
| 2020 £m |
2019 £m |
|||||||
| Advil |
3,349 | 3,408 | ||||||
| Voltaren |
2,725 | 2,725 | ||||||
| Centrum |
1,824 | 1,808 | ||||||
| Caltrate |
1,678 | 1,648 | ||||||
| Otrivin |
1,385 | 1,385 | ||||||
| Preparation H |
1,139 | 1,171 | ||||||
| Robitussin |
1,111 | 1,138 | ||||||
| Nexium |
668 | 682 | ||||||
| Fenistil |
598 | 598 | ||||||
| Chapstick |
512 | 523 | ||||||
|
Emergen-C |
433 | 447 | ||||||
| Theraflu |
433 | 438 | ||||||
| Panadol |
396 | 397 | ||||||
| Lamisil |
– | 291 | ||||||
| Sensodyne |
270 | 270 | ||||||
| Breathe Right |
– | 251 | ||||||
| Others |
1,847 | 2,440 | ||||||
| 18,368 | 19,620 | |||||||
GSK Annual Report 2020 183
|
|
||
|
|
Notes to the financial statements continued
20. Other intangible assets continued
Each of these brands is considered to have an indefinite life, given the strength and durability of the brand and the level of marketing support. The brands are in relatively similar stable and profitable market sectors, with similar risk profiles, and their size, diversification and market shares mean that the risk of market-related factors causing a reduction in the lives of the brands is considered to be relatively low. The Group is not aware of any material legal, regulatory, contractual, competitive, economic or other factors which could limit their useful lives. Accordingly, they are not amortised.
Each brand is tested annually for impairment and other amortised intangible assets are tested when indicators of impairment arise. This testing applies a fair value less costs of disposal methodology, generally using post-tax cash flow forecasts with a terminal value calculation and a discount rate equal to the Group post-tax WACC of 7%, adjusted where appropriate for specific segment, country and currency risks. This valuation methodology uses significant inputs which are not based on observable market data, and therefore this valuation technique is classified as level 3 of the fair value hierarchy. The main assumptions include future sales price and volume growth, product contribution, the future expenditure required to maintain the product’s marketability and registration in the relevant jurisdictions and exchange rates. These assumptions are based on past experience and are reviewed as part of management’s budgeting and strategic planning cycle for changes in market conditions and sales erosion through competition. The terminal growth rates applied of between -3% and 3% are management’s estimates of future long-term average growth rates of the relevant markets. In each case the valuations indicate sufficient headroom such that a reasonably possible change to key assumptions is unlikely to result in an impairment of these intangible assets.
21. Investments in associates and joint ventures
| Joint ventures £m |
Associates £m |
2020 £m |
Joint ventures £m |
Associates £m |
2019 Total £m |
|||||||||||||||||||
| At 1 January |
15 | 299 | 314 | 19 | 217 | 236 | ||||||||||||||||||
| Exchange adjustments |
– | (9 | ) | (9 | ) | (1 | ) | (9 | ) | (10 | ) | |||||||||||||
| Additions |
– | 4 | 4 | 16 | 11 | 27 | ||||||||||||||||||
| Disposals |
– | – | – | (1 | ) | – | (1 | ) | ||||||||||||||||
| Distributions received |
– | (31 | ) | (31 | ) | – | (7 | ) | (7 | ) | ||||||||||||||
| Net fair value movements through Other comprehensive income |
– | 53 | 53 | – | – | – | ||||||||||||||||||
| Other movements |
– | – | – | (7 | ) | 2 | (5 | ) | ||||||||||||||||
| Profit/(loss) after tax recognised in the consolidated income statement |
– | 33 | 33 | (11 | ) | 85 | 74 | |||||||||||||||||
| At 31 December |
15 | 349 | 364 | 15 | 299 | 314 | ||||||||||||||||||
The Group held one significant associate at 31 December 2020, Innoviva, Inc. At 31 December 2020, the Group owned 32 million shares or 31.6% of Innoviva, which is a biopharmaceutical company listed on NASDAQ. Innoviva partnered with GSK in the development of the long acting beta agonist, vilanterol, and currently receives royalty income from sales of products that contain this component, namely Relvar/Breo Ellipta and Anoro Ellipta. It also has a 15% economic interest in royalties paid by GSK on sales of Trelegy Ellipta. The remaining 85% of the economic interest in these royalties is held by Theravance Biopharma Inc., in which the Group holds 15% of the common stock. The investment in Innoviva had a market value of £291 million at 31 December 2020 (2019 – £343 million).
Summarised balance sheet information, based on information published post the balance sheet date, in respect of Innoviva is set out below:
| At 31 December 2020 £m |
At 31 December 2019 £m |
|||||||
| Non-current assets |
482 | 222 | ||||||
| Current assets |
251 | 326 | ||||||
| Current liabilities |
(4 | ) | (4 | ) | ||||
| Non-current liabilities |
(283 | ) | (286 | ) | ||||
| Net assets |
446 | 258 | ||||||
| The carrying value of the Group’s investment in Innoviva is analysed as follows: | ||||||||
| 2020 £m |
2019 £m |
|||||||
| Interest in net assets of associate |
141 | 82 | ||||||
| Goodwill |
85 | 88 | ||||||
| Fair value and other adjustments |
65 | 91 | ||||||
| Carrying value at 31 December |
291 | 261 | ||||||
184 GSK Annual Report 2020
|
Strategic report
| ||
|
Governance and remuneration
| ||
|
Financial statements
| ||
|
Investor information
|
Notes to the financial statements continued
22. Other investments
| Investments designated as measured at FVTOCI £m |
Investments measured at FVTPL £m |
2020 £m |
Investments designated as measured at FVTOCI £m |
Investments measured at FVTPL £m |
2019 £m |
|||||||||||||||||||
| At 1 January |
1,781 | 56 | 1,837 | 1,250 | 72 | 1,322 | ||||||||||||||||||
| Additions |
409 | 3,205 | 3,614 | 274 | 3 | 277 | ||||||||||||||||||
| Net fair value movements through Other comprehensive income |
1,318 | – | 1,318 | 314 | – | 314 | ||||||||||||||||||
| Net fair value movements through profit or loss |
– | (438 | ) | (438 | ) | – | (14 | ) | (14 | ) | ||||||||||||||
| Disposals and settlements |
(569 | ) | (2,702 | ) | (3,271 | ) | (57 | ) | (5 | ) | (62 | ) | ||||||||||||
| At 31 December |
2,939 | 121 | 3,060 | 1,781 | 56 | 1,837 | ||||||||||||||||||
Other investments comprise non-current equity investments which are recorded at fair value at each balance sheet date. For investments traded in an active market, the fair value is determined by reference to the relevant stock exchange quoted bid price. For other investments, the fair value is estimated by management with reference to relevant available information, including the current market value of similar instruments, recent financing rounds and discounted cash flows of the underlying net assets. Net fair value movements include the impact of exchange (losses of £91 million through Other comprehensive income and £nil through profit or loss) (2019 – losses of £66 million and £2 million respectively). Other investments include listed investments of £2,281 million (2019 – £1,128 million).
GSK has elected to designate the majority of its equity investments as measured at fair value through other comprehensive income (FVTOCI). The most significant of these investments held at 31 December 2020 were in CureVac AG in which the Group holds 8.4% of the common stock, Crispr Therapeutics AG in which the Group holds 4.6%, Lyell Immunopharma, Inc. in which the Group holds 11.7%, 23andMe, Inc. in which the Group holds 12.4% and Turning Point Therapeutics, Inc. in which the Group holds 4.7%. These investments had a fair value at 31 December 2020 of £887 million, £361 million (2019 – £148 million), £261 million (2019 – £155 million), £220 million (2019 – £227 million) and £201 million (2019 – £102 million) respectively. The other investments include equity stakes in companies with which GSK has research collaborations and in companies which provide access to biotechnology developments of potential interest. In June 2020, GSK issued US$ US notes which are exchangeable at the option of the note holders at any time until maturity of the notes in June 2023 for shares held by GSK in Theravance Biopharma, Inc. Upon exchange of the notes, GSK expects to deliver the shares but may, at its option under certain circumstances, deliver cash or a combination of Theravance Biopharma shares and cash. The Theravance Biopharma shares are measured at FVTOCI and had a fair value at 31 December 2020 of £126 million.
On disposal of equity investments measured at FVTOCI, the accumulated fair value movements are reclassified from the fair value reserve to retained earnings. Investments with a fair value of £569 million (2019 – £57 million) were disposed of during the year. The cumulative gain on these investments after tax was £163 million (2019 – £4 million).
Certain other investments, such as investments in funds with limited lives and investments acquired with an intention to sell, are measured at fair value through profit or loss (FVTPL). Additions and disposals of investments measured at FVTPL in 2020 include the acquisition of shares in Hindustan Unilever Limited on the merger of GSK’s Indian listed Consumer Healthcare entity with Hindustan Unilever and the subsequent divestment of those shares.
23. Other non-current assets
| 2020 £m |
2019 £m |
|||||||
| Amounts receivable under insurance contracts |
756 | 743 | ||||||
| Pension schemes in surplus |
183 | 127 | ||||||
| Other receivables |
102 | 150 | ||||||
| 1,041 | 1,020 | |||||||
Amounts receivable under insurance contacts are held at cash surrender value with movements through profit or loss.
Within the other receivables of £102 million (2019 – £150 million), £67 million (2019 – £120 million) is classified as financial assets of which £30 million (2019 – £44 million) is classified as fair value through profit or loss. On the remaining balance of £37 million (2019 – £76 million), the expected credit loss allowance was immaterial at 31 December 2020 and 2019.
GSK Annual Report 2020 185
|
|
||
|
|
Notes to the financial statements continued
24. Inventories
| 2020 £m |
2019 £m |
|||||||
| Raw materials and consumables |
1,170 | 1,195 | ||||||
| Work in progress |
2,395 | 2,505 | ||||||
| Finished goods |
2,431 | 2,247 | ||||||
| 5,996 | 5,947 | |||||||
25. Trade and other receivables
| 2020 £m |
2019 £m |
|||||||
| Trade receivables, net of loss allowance |
5,549 | 5,487 | ||||||
| Accrued income |
13 | 7 | ||||||
| Other prepayments |
359 | 316 | ||||||
| Interest receivable |
3 | 3 | ||||||
| Employee loans and advances |
11 | 13 | ||||||
| Other receivables |
1,017 | 1,376 | ||||||
| 6,952 | 7,202 | |||||||
Trade receivables included £nil (2019 – £nil) due from associates and joint ventures. Other receivables included £nil (2019 – £nil) due from associates and joint ventures.
| Loss allowance | 2020 £m |
2019 £m |
||||||
| At 1 January |
130 | 128 | ||||||
| Exchange adjustments |
(4 | ) | (3 | ) | ||||
| Charge for the year |
41 | 16 | ||||||
| Subsequent recoveries of amounts provided for |
(8 | ) | (5 | ) | ||||
| Utilised |
(8 | ) | (6 | ) | ||||
| At 31 December |
151 | 130 | ||||||
Of the total trade receivables balance, £50 million (2019 – £110 million) was considered credit impaired, against which an £20 million (2019 – £11 million) expected credit loss allowance has been applied. No amount was purchased or originated credit impaired.
Within the other receivables of £1,017 million (2019 – £1,376 million), £402 million (2019 – £707 million) was classified as financial assets of which £nil (2019 – £nil) was classified as fair value through profit and loss. On the remaining balance of £402 million (2019 – £707 million), an expected credit loss allowance of £6 million (2019 – £8 million) was recognised at
31 December 2020 with no charge reported in profit or loss during the year.
For more discussion on credit risk practices, please refer to Note 43.
186 GSK Annual Report 2020
|
Strategic report
| ||
|
Governance and remuneration
| ||
|
Financial statements
| ||
|
Investor information
|
Notes to the financial statements continued
26. Cash and cash equivalents
| 2020 £m |
2019 £m |
|||||||
| Cash at bank and in hand |
1,762 | 795 | ||||||
| Short-term deposits |
4,530 | 3,912 | ||||||
| 6,292 | 4,707 | |||||||
In addition, £nil (2019 – £507 million) of cash and cash equivalents has been reported in Assets held for sale, see Note 27, ‘Assets held for sale’.
Cash and cash equivalents included £0.2 billion (2019 – £0.2 billion) not available for general use due to restrictions applying in the subsidiaries where it is held. Restrictions include exchange controls and taxes on repatriation.
27. Assets held for sale
| 2020 £m |
2019 £m |
|||||||
| Property, plant and equipment |
25 | 80 | ||||||
| Right of use assets |
– | 7 | ||||||
| Lease liabilities |
– | (7 | ) | |||||
| Goodwill |
– | 124 | ||||||
| Other intangibles |
62 | 175 | ||||||
| Inventory |
19 | 109 | ||||||
| Cash and cash equivalents |
– | 507 | ||||||
| Other |
– | (122 | ) | |||||
| 106 | 873 | |||||||
Non-current assets and disposal groups are transferred to Assets held for sale when it is expected that their carrying amounts will be recovered principally through disposal and a sale is considered highly probable. They are held at the lower of carrying amount and fair value less costs to sell.
Included within Assets held for sale is inventory written down to fair value less costs to sell of £19 million (2019 – £109 million). The valuation methodology used significant inputs which were not based on observable market data and therefore this valuation is classified as level 3 in the fair value hierarchy.
Intangible assets of £785 million were transferred from Other intangibles during the year. The intangible assets held for sale remaining at 31 December 2020 of £62 million is after impairments, exchange movements and assets divested during the year.
Assets held for sale at 31 December 2019 primarily comprised the disposal group for ThermaCare, which had been acquired from Pfizer in 2019 as part of its consumer healthcare business and was to be divested to meet anti-trust requirements, and the disposal group for Horlicks and other Consumer Healthcare nutritional products in India and a number of other countries. The divestments of both of these disposal groups were completed in 2020.
GSK Annual Report 2020 187
|
|
||
|
|
Notes to the financial statements continued
28. Trade and other payables
|
2020 £m |
2019 £m |
|||||||
| Trade payables |
4,357 | 4,144 | ||||||
| Wages and salaries |
1,367 | 1,470 | ||||||
| Social security |
159 | 164 | ||||||
| ViiV Healthcare put option |
960 | 1,011 | ||||||
| Other payables |
409 | 515 | ||||||
| Deferred income |
361 | 158 | ||||||
| Customer return and rebate accruals |
5,775 | 5,108 | ||||||
| Other accruals |
2,452 | 2,369 | ||||||
| 15,840 | 14,939 | |||||||
Trade and other payables included £65 million (2019 – £63 million) due to associates and joint ventures. The Group provides limited supplier financing arrangements to certain customers. The amounts involved at 31 December 2020 were not material.
Revenue recognised in the year that was included in deferred income at 1 January 2020 was £33 million (2019 – £72 million).
Customer return and rebate accruals are provided for by the Group at the point of sale in respect of the estimated rebates, discounts or allowances payable to customers, and included £4,686 million (2019 – £4,200 million) in respect of US Pharmaceuticals and Vaccines, as more fully described in the Group financial review on page 75. Accruals are made at the time of sale but the actual amounts paid are based on claims made some time after the initial recognition of the sale. As the amounts are estimated, they may not fully reflect the final outcome and are subject to change dependent upon, amongst other things, the types of buying group and product sales mix. The level of accrual is reviewed and adjusted quarterly in light of historical experience of actual amounts paid and any changes in arrangements. Future events could cause the assumptions on which the accruals are based to change, which could affect the future results of the Group.
Pfizer’s put option over its shareholding in ViiV Healthcare is currently exercisable. Pfizer may request an IPO of ViiV Healthcare at any time and if either GSK does not consent to such IPO or an offering is not completed within nine months, Pfizer could require GSK to acquire its shareholding. The amount of the liability for this put option, which is held on the gross redemption basis, is derived from an internal valuation of the ViiV Healthcare business, utilising both discounted forecast future cash flow and multiples-based methodologies.
The table below shows on an indicative basis the income statement and balance sheet sensitivity of the Pfizer put option to reasonably possible changes in key assumptions.
| Increase/(decrease) in financial liability and loss/(gain) in Income statement |
2020 £m |
2019 £m |
||||||
| 10% increase in sales forecasts |
117 | 119 | ||||||
| 10% decrease in sales forecasts |
(116 | ) | (118 | ) | ||||
| 10 cent appreciation of US Dollar |
52 | 58 | ||||||
| 10 cent depreciation of US Dollar |
(45 | ) | (49 | ) | ||||
| 10 cent appreciation of Euro |
42 | 37 | ||||||
| 10 cent depreciation of Euro |
(34 | ) | (31 | ) | ||||
An explanation of the accounting for ViiV Healthcare is set out on page 52.
188 GSK Annual Report 2020
|
Strategic report
| ||
|
Governance and remuneration
| ||
|
Financial statements
| ||
|
Investor information
|
Notes to the financial statements continued
29. Net debt
| Listing exchange | 2020 £m |
2019 £m |
||||||||
| Current assets: |
||||||||||
| Liquid investments |
78 | 79 | ||||||||
| Cash and cash equivalents |
6,292 | 4,707 | ||||||||
| Cash and cash equivalents reported in Assets held for sale |
– | 507 | ||||||||
| 6,370 | 5,293 | |||||||||
| Short-term borrowings: |
||||||||||
| Commercial paper |
(17 | ) | (3,586 | ) | ||||||
| Bank loans, overdrafts and other |
(1,128 | ) | (434 | ) | ||||||
| Drawn bank facility |
– | (1,000 | ) | |||||||
| EURIBOR +0.20% € Euro Medium Term Note 2020 |
London Stock Exchange | – | (638 | ) | ||||||
| 0.000% € Euro Medium Term Note 2020 |
London Stock Exchange | – | (1,020 | ) | ||||||
| LIBOR +0.35% US$ US Medium Term Note 2021 |
New York Stock Exchange | (549 | ) | – | ||||||
| EURIBOR +60% € Euro Medium Term Note 2021 |
London Stock Exchange | (1,351 | ) | – | ||||||
| 0.000% € Euro Medium Term Note 2021 |
London Stock Exchange | (450 | ) | – | ||||||
| Lease liabilities |
(230 | ) | (240 | ) | ||||||
| (3,725 | ) | (6,918 | ) | |||||||
| Long-term borrowings: |
||||||||||
| 3.125% US$ US Medium Term Note 2021 |
New York Stock Exchange | – | (944 | ) | ||||||
| LIBOR +0.35% US$ US Medium Term Note 2021 |
New York Stock Exchange | – | (567 | ) | ||||||
| EURIBOR +0.60% € Euro Medium Term Note 2021 |
London Stock Exchange | – | (1,281 | ) | ||||||
| 0.000% € Euro Medium Term Note 2021 |
London Stock Exchange | – | (426 | ) | ||||||
| 2.850% US$ US Medium Term Note 2022 |
New York Stock Exchange | (1,463 | ) | (1,509 | ) | |||||
| 2.875% US$ US Medium Term Note 2022 |
New York Stock Exchange | (1,097 | ) | (1,132 | ) | |||||
| 2.800% US$ US Medium Term Note 2023 |
New York Stock Exchange | (913 | ) | (941 | ) | |||||
| 0.125% € Euro Medium Term Note 2023 |
London Stock Exchange | (673 | ) | – | ||||||
| Exchangeable US$ US Medium Term Note 2023 |
New York Stock Exchange | (199 | ) | – | ||||||
| 3.375% US$ US Medium Term Note 2023 |
New York Stock Exchange | (912 | ) | (941 | ) | |||||
| 0.000% € Euro Medium Term Note 2023 |
London Stock Exchange | (450 | ) | (425 | ) | |||||
| 0.534% US$ US Medium Term Note 2023 |
New York Stock Exchange | (913 | ) | – | ||||||
| 3.000% US$ US Medium Term Note 2024 |
New York Stock Exchange | (728 | ) | (751 | ) | |||||
| 1.375% € Euro Medium Term Note 2024 |
London Stock Exchange | (894 | ) | (844 | ) | |||||
| 4.000% € Euro Medium Term Note 2025 |
London Stock Exchange | (670 | ) | (633 | ) | |||||
| 3.625% US$ US Medium Term Note 2025 |
New York Stock Exchange | (728 | ) | (751 | ) | |||||
| 1.000% € Euro Medium Term Note 2026 |
London Stock Exchange | (628 | ) | (593 | ) | |||||
| 1.250% € Euro Medium Term Note 2026 |
London Stock Exchange | (896 | ) | (846 | ) | |||||
| 3.375% £ Euro Medium Term Note 2027 |
London Stock Exchange | (595 | ) | (594 | ) | |||||
| 1.250% £ Euro Medium Term Note 2028 |
London Stock Exchange | (742 | ) | – | ||||||
| 3.875% US$ US Medium Term Note 2028 |
New York Stock Exchange | (1,278 | ) | (1,319 | ) | |||||
| 3.375% US$ US Medium Term Note 2029 |
New York Stock Exchange | (723 | ) | (746 | ) | |||||
| 1.375% € Euro Medium Term Note 2029 |
London Stock Exchange | (447 | ) | (422 | ) | |||||
| 1.750% € Euro Medium Term Note 2030 |
London Stock Exchange | (672 | ) | (635 | ) | |||||
| 5.250% £ Euro Medium Term Note 2033 |
London Stock Exchange | (983 | ) | (983 | ) | |||||
| 5.375% US$ US Medium Term Note 2034 |
New York Stock Exchange | (363 | ) | (375 | ) | |||||
| 1.625% £ Euro Medium Term Note 2035 |
London Stock Exchange | (743 | ) | – | ||||||
| 6.375% US$ US Medium Term Note 2038 |
New York Stock Exchange | (1,996 | ) | (2,061 | ) | |||||
| 6.375% £ Euro Medium Term Note 2039 |
London Stock Exchange | (695 | ) | (694 | ) | |||||
| 5.250% £ Euro Medium Term Note 2042 |
London Stock Exchange | (987 | ) | (987 | ) | |||||
| 4.200% US$ US Medium Term Note 2043 |
New York Stock Exchange | (359 | ) | (371 | ) | |||||
| 4.250% £ Euro Medium Term Note 2045 |
London Stock Exchange | (789 | ) | (789 | ) | |||||
| Other long-term borrowings |
(2 | ) | (20 | ) | ||||||
| Lease liabilities |
(887 | ) | (1,010 | ) | ||||||
| (23,425 | ) | (23,590 | ) | |||||||
| Net debt |
(20,780 | ) | (25,215 | ) | ||||||
GSK Annual Report 2020 189
|
|
||
|
|
Notes to the financial statements continued
29. Net debt continued
Current assets
Liquid investments are classified as financial assets at amortised cost. At 31 December 2020, they included US Treasury Notes and other government bonds. The effective interest rate on liquid investments at 31 December 2020 was approximately 1.1% (2019 – approximately 1.1%). Liquid investment balances at 31 December 2020 earning interest at floating rates amount to £78 million (2019 – £1 million). Liquid investment balances at 31 December 2020 earning interest at fixed rates amount to £nil (2019 – £78 million).
Balances reported within cash and cash equivalents have an original maturity of three months or less. The effective interest rate on cash and cash equivalents at 31 December 2020 was approximately 0.3% (2019 – approximately 1.6%). Cash and cash equivalents at 31 December 2020 earning interest at floating and fixed rates amounted to £6,100 million and £9 million respectively (2019 – £5,039 million and £10 million) and non-interest bearing holdings amounted to £183 million (2019 – £164 million).
GSK’s policy regarding the credit quality of cash and cash equivalents is set out in Note 43, ‘Financial instruments and related disclosures’.
Short-term borrowings
GSK has a $10 billion (£7.3 billion) US commercial paper programme, of which $25 million (£17 million) was in issue at 31 December 2020 (2019 – $4.8 billion (£3.6 billion)). GSK has a £5 billion Euro commercial paper programme newly established in 2020, of which £nil was in issue at 31 December 2020. GSK has a £1.9 billion three-year committed facility and $2.5 billion (£1.8 billion) under a 364 day committed facility. The three year committed facility was agreed in September 2019 and was extended by one year to 2023 in September 2020. The 364-day committed facility was agreed in September 2020. These facilities were undrawn at 31 December 2020.
The weighted average interest rate on commercial paper borrowings at 31 December 2020 was 2.4% (2019 – 1.8%).
The weighted average interest rate on current bank loans and overdrafts at 31 December 2020 was 5.8% (2019 – 4.6%).
The average effective pre-swap interest rate of notes classified as short-term at 31 December 2020 was 0.0% (2019 – 0.0%). The 0.0% rate reflects the upcoming maturities of a LIBOR +0.35% coupon note in May 2021, and both a zero coupon and a EURIBOR +0.60% note in September 2021.
Long-term borrowings
At the year-end, GSK had long-term borrowings of £23.4 billion (2019 – £23.6 billion), of which £12.9 billion (2019 – £13.3 billion) fell due in more than five years. The average effective pre-swap interest rate of all notes in issue at 31 December 2020 was approximately 3.6% (2019 – approximately 3.8%).
Long-term borrowings repayable after five years carry interest at effective rates between 1.0% and 6.8%, with repayment dates ranging from 2026 to 2045.
Pledged assets
The Group held pledged investments in US Treasury Notes with a par value of $50 million (£37 million), (2019 – $50 million (£38 million)) as security against irrevocable letters of credit issued on the Group’s behalf in respect of the Group’s self-insurance activity. Provisions in respect of self-insurance are included within the provisions for legal and other disputes discussed in Note 31, ‘Other provisions’.
Lease liabilities
The maturity analysis of discounted lease liabilities recognised on the Group balance sheet is as follows:
| 2020 £m |
2019 £m |
|||||||
| Rental payments due within one year |
230 | 240 | ||||||
| Rental payments due between one and two years |
207 | 227 | ||||||
| Rental payments due between two and three years |
126 | 119 | ||||||
| Rental payments due between three and four years |
96 | 105 | ||||||
| Rental payments due between four and five years |
86 | 93 | ||||||
| Rental payments due after five years |
372 | 466 | ||||||
| Total lease liabilities |
1,117 | 1,250 | ||||||
190 GSK Annual Report 2020
|
Strategic report
| ||
|
Governance and remuneration
| ||
|
Financial statements
| ||
|
Investor information
|
Notes to the financial statements continued
30. Pensions and other post-employment benefits
| Pension and other post-employment costs | 2020 £m |
2019 £m |
2018 £m |
|||||||||
| UK pension schemes |
255 | 181 | 246 | |||||||||
| US pension schemes |
62 | 120 | 100 | |||||||||
| Other overseas pension schemes |
189 | 185 | 190 | |||||||||
| Unfunded post-retirement healthcare schemes |
13 | 74 | 50 | |||||||||
| 519 | 560 | 586 | ||||||||||
| Analysed as: |
||||||||||||
| Funded defined benefit/hybrid pension schemes |
341 | 300 | 369 | |||||||||
| Unfunded defined benefit pension schemes |
32 | 41 | 43 | |||||||||
| Unfunded post-retirement healthcare schemes |
13 | 74 | 50 | |||||||||
| Defined benefit schemes |
386 | 415 | 462 | |||||||||
| Defined contribution pension schemes |
133 | 145 | 124 | |||||||||
| 519 | 560 | 586 | ||||||||||
The costs of the defined benefit pension and post-retirement healthcare schemes are charged in the income statement as follows:
| 2020 £m |
2019 £m |
2018 £m |
||||||||||
| Cost of sales |
143 | 149 | 160 | |||||||||
| Selling, general and administration |
185 | 195 | 228 | |||||||||
| Research and development |
59 | 71 | 74 | |||||||||
| 387 | 415 | 462 | ||||||||||
GSK entities operate pension arrangements which cover the Group’s material obligations to provide pensions to retired employees. These arrangements have been developed in accordance with local practices in the countries concerned. Pension benefits can be provided by state schemes; by defined contribution schemes, whereby retirement benefits are determined by the value of funds arising from contributions paid in respect of each employee; or by defined benefit schemes, whereby retirement benefits are based on employee pensionable remuneration and length of service.
Pension costs of defined benefit schemes for accounting purposes have been calculated using the projected unit credit method. In certain countries pension benefits are provided on an unfunded basis, some administered by trustee companies. Formal, independent, actuarial valuations of the Group’s main plans are undertaken regularly, normally at least every three years.
Remeasurement movements in the year are recognised through the statement of comprehensive income. Discount rates are derived from AA rated corporate bond yields except in countries where there is no deep market in corporate bonds where government bond yields are used. Discount rates are selected to reflect the term of the expected benefit payments. Projected inflation rate and pension increases are long-term predictions based on the yield gap between long-term index-linked and fixed interest Gilts. In the UK, mortality rates are determined by adjusting the SAPS S2 standard mortality tables to reflect recent scheme experience. These rates are then projected to reflect improvements in life expectancy in line with the CMI 2019 projections with a long-term rate of improvement of 1.25% per year for both males and females. In the US, mortality rates are calculated using the PRI-2012 white collar table adjusted to reflect recent experience. These rates are projected using MP-2020 to allow for future improvements in life expectancy.
GSK Annual Report 2020 191
|
|
||
|
|
Notes to the financial statements continued
30. Pensions and other post-employment benefits continued
The average life expectancy assumed now for an individual at the age of 60 and projected to apply in 2040 for an individual then at the age of 60 is as follows:
| UK | US | |||||||||||||||
| Male Years |
Female Years |
Male Years |
Female Years |
|||||||||||||
| Current |
27.4 | 29.0 | 26.8 | 28.2 | ||||||||||||
|
Projected for 2040 |
28.8 | 30.5 | 28.4 | 29.7 | ||||||||||||
The assets of funded schemes are generally held in separately administered trusts, either as specific assets or as a proportion of a general fund, or are insurance contracts. Assets are invested in different classes in order to maintain a balance between risk and return. Investments are diversified to limit the financial effect of the failure of any individual investment. The physical asset allocation strategy for three of the four UK plans has been adjusted from 45% in return-seeking assets and 55% in liability-matching assets to 42.5% in return-seeking assets and 57.5% in liability-matching assets. During 2019, a buy-in insurance contract was purchased to cover substantially all of the obligations of the other UK plan. At 31 December 2020, the value of the insurance contract was £620 million (2019 – £607 million). The asset allocation of the US plans is currently set at 25% return-seeking assets and 75% liability-matching assets.
The pension plans are exposed to risk that arises because the estimated market value of the plans’ assets might decline, the investment returns might reduce, or the estimated value of the plans’ liabilities might increase.
In line with the agreed mix of return-seeking assets to generate future returns and liability-matching assets to better match future pension obligations, the Group has defined an overall long-term investment strategy for the plans, with investments across a broad range of assets. The main market risks within the asset and hedging portfolio are against credit risk, interest rates, long-term inflation, equities, property, currency and bank counterparty risk.
The plan liabilities are a series of future cash flows with relatively long duration. On an IAS 19 basis, these cash flows are sensitive to changes in the expected long-term inflation rate and the discount rate (AA corporate bond yield curve) where an increase in long-term inflation corresponds with an increase in the liabilities, and an increase in the discount rate corresponds with a decrease in the liabilities.
The interest rate risk and credit rate risk in the US are partially hedged. The targets are based on an accounting measure of the plan liabilities.
For the UK plans, there is an interest rate and inflation hedging strategy in place. The targets are based on an economic measure of the plan liabilities. Furthermore, the plans also currently hedge a portion of their equity exposure with a staggered maturity profile.
In the UK, the defined benefit pension schemes operated for the benefit of former Glaxo Wellcome employees and former SmithKline Beecham employees remain separate. These schemes were closed to new entrants in 2001 and subsequent UK employees are entitled to join a defined contribution scheme. In addition, the Group operates a number of post-retirement healthcare schemes, the principal one of which is in the US.
Following a period of consultation with impacted employees, it was announced on 17 December 2020 that the UK defined benefit plans would be closed to future accrual effective from 31 March 2022. As a result, post closure the accrued benefits of active participants will be revalued in line with inflation (RPI for the legacy Glaxo Wellcome plans and CPI for the legacy SmithKline Beecham plans subject to the relevant caps for each arrangement) rather than capped pay increases. In addition, all defined benefit plan participants who are still active at 1 April 2022 will receive a defined pension contribution of £10,000 each. The effect of closure and the defined contribution enhancement together result in a one off cost of £74 million.
It was announced on 9 September 2020 that the US cash balance pension plans would be closed to future accrual from 1 January 2021. This change resulted in a credit of £56 million. On 1 June 2020 and 9 September 2020, two amendments were made to the retiree healthcare plans in the US resulting in a credit of £55 million.
The Group has applied the following financial assumptions in assessing the defined benefit liabilities:
| UK | US | Rest of World | ||||||||||||||||||||||||||||||||||
| 2020 % pa |
2019 % pa |
2018 % pa |
2020 % pa |
2019 % pa |
2018 % pa |
2020 % pa |
2019 % pa |
2018 % pa |
||||||||||||||||||||||||||||
| Rate of increase of future earnings |
2.0 | 2.00 | 2.00 | n/a | 4.00 | 4.00 | 2.6 | 2.70 | 2.70 | |||||||||||||||||||||||||||
| Discount rate |
1.4 | 2.00 | 2.90 | 2.3 | 3.20 | 4.20 | 0.6 | 1.10 | 1.80 | |||||||||||||||||||||||||||
| Expected pension increases |
2.8 | 3.00 | 3.20 | n/a | n/a | n/a | 2.1 | 2.10 | 2.10 | |||||||||||||||||||||||||||
| Cash balance credit/conversion rate |
n/a | n/a | n/a | 1.9 | 2.60 | 3.20 | 0.1 | 0.10 | 0.40 | |||||||||||||||||||||||||||
| Inflation rate |
2.8 | 3.00 | 3.20 | 2.0 | 2.25 | 2.25 | 1.3 | 1.40 | 1.50 | |||||||||||||||||||||||||||
Sensitivity analysis detailing the effect of changes in assumptions is provided on page 199. The analysis provided reflects the assumption changes which have the most material impact on the results of the Group.
192 GSK Annual Report 2020
|
Strategic report
| ||
|
Governance and remuneration
| ||
|
Financial statements
| ||
|
Investor information
|
Notes to the financial statements continued
30. Pensions and other post-employment benefits continued
The amounts recorded in the income statement and statement of comprehensive income for the three years ended 31 December 2020 in relation to the defined benefit pension and post-retirement healthcare schemes were as follows:
| Pensions | Post-retirement benefits |
|||||||||||||||||||
| 2020 |
UK £m |
US £m |
Rest of World £m |
Group £m |
Group £m |
|||||||||||||||
| Amounts charged to operating profit |
||||||||||||||||||||
| Current service cost |
61 | 83 | 147 | 291 | 36 | |||||||||||||||
| Past service cost/(credit) |
98 | (56 | ) | 1 | 43 | (55 | ) | |||||||||||||
| Net interest (income)/cost |
3 | 23 | 10 | 36 | 39 | |||||||||||||||
| Gains from settlements |
– | – | (18 | ) | (18 | ) | (7 | ) | ||||||||||||
| Expenses |
9 | 12 | – | 21 | – | |||||||||||||||
| 171 | 62 | 140 | 373 | 13 | ||||||||||||||||
| Remeasurement
gains/(losses) recorded in the statement of |
51 | (96 | ) | (60 | ) | (105 | ) | (82 | ) | |||||||||||
| Pensions | Post-retirement benefits |
|||||||||||||||||||
| 2019 |
UK £m |
US £m |
Rest of World £m |
Group £m |
Group £m |
|||||||||||||||
| Amounts charged to operating profit |
||||||||||||||||||||
| Current service cost |
62 | 74 | 130 | 266 | 22 | |||||||||||||||
| Past service cost/(credit) |
49 | (3 | ) | (15 | ) | 31 | – | |||||||||||||
| Net interest (income)/cost |
(19 | ) | 29 | 16 | 26 | 52 | ||||||||||||||
| Gains from settlements |
– | – | (9 | ) | (9 | ) | – | |||||||||||||
| Expenses |
7 | 20 | – | 27 | – | |||||||||||||||
| 99 | 120 | 122 | 341 | 74 | ||||||||||||||||
| Remeasurement losses
recorded in the statement of |
(894 | ) | (1 | ) | (78 | ) | (973 | ) | (77 | ) | ||||||||||
| Pensions | Post-retirement benefits |
|||||||||||||||||||
| 2018 |
UK £m |
US £m |
Rest of World £m |
Group £m |
Group £m |
|||||||||||||||
| Amounts charged to operating profit |
||||||||||||||||||||
| Current service cost |
75 | 72 | 134 | 281 | 29 | |||||||||||||||
| Past service cost/(credit) |
93 | 1 | – | 94 | (27 | ) | ||||||||||||||
| Net interest (income)/cost |
(3 | ) | 20 | 19 | 36 | 49 | ||||||||||||||
| Gains from settlements |
– | – | (14 | ) | (14 | ) | (1 | ) | ||||||||||||
| Expenses |
8 | 7 | – | 15 | – | |||||||||||||||
| 173 | 100 | 139 | 412 | 50 | ||||||||||||||||
| Remeasurement
gains/(losses) recorded in the statement of |
495 | (108 | ) | 196 | 583 | 145 | ||||||||||||||
The amounts included within past service costs in the UK included £24 million (2019 – £58 million; 2018 – £43 million) of augmentation costs which arose from Major restructuring programmes, together with a charge of £74 million in relation to the impact of the closure of the defined benefit schemes to future accrual. In 2018, past service costs in the UK included a charge of £40 million in relation to the estimated impact of Guaranteed Minimum Pension (GMP) equalisation. GMPs are minimum pension entitlements for members of those schemes that elected to contract out of the State Earnings Related Pension Scheme. A UK High Court ruling in 2018 required the equalisation of benefits earned between 1990 and 1997 that included GMPs in order to address gender inequality arising because GMPs were different for men and women.
The past service credit of £56 million in the US reflected the closure of the cash balance pension plans from 1 January 2021. Amendments to the retiree healthcare plan in the US resulted in a credit of £55 million to past service costs in post-retirement benefits.
GSK Annual Report 2020 193
|
|
||
|
|
Notes to the financial statements continued
30. Pensions and other post-employment benefits continued
A summarised balance sheet presentation of the Group defined benefit pension schemes and other post-retirement benefits is set out in the table below:
| 2020 £m |
2019 £m |
2018 £m |
||||||||||
| Recognised in Other non-current assets: |
||||||||||||
| Pension schemes in surplus |
183 | 127 | 760 | |||||||||
| Recognised in Assets held for sale: |
||||||||||||
| Post-retirement benefits |
– | (9 | ) | (9 | ) | |||||||
| Recognised in Pensions and other post-employment benefits: |
||||||||||||
| Pension schemes in deficit |
(2,287 | ) | (2,048 | ) | (1,755 | ) | ||||||
| Post-retirement benefits |
(1,363 | ) | (1,409 | ) | (1,370 | ) | ||||||
| (3,650 | ) | (3,457 | ) | (3,125 | ) | |||||||
In the event of a plan wind-up, GSK believes the UK pension scheme rules provide the company with the right to a refund of surplus assets following the full settlement of plan liabilities. As a result, the net surplus in the UK defined benefit pension schemes is recognised in full.
The fair values of the assets and liabilities of the UK and US defined benefit pension schemes, together with aggregated data for other defined benefit pension schemes in the Group are as follows:
| At 31 December 2020 | UK £m |
US £m |
Rest of World £m |
Group £m |
||||||||||||||
| Equities: |
– listed | 2,686 | 539 | 686 | 3,911 | |||||||||||||
| – unlisted | – | – | 5 | 5 | ||||||||||||||
|
Multi-asset funds |
2,075 | – | – | 2,075 | ||||||||||||||
| Property: |
– listed | – | – | 57 | 57 | |||||||||||||
| – unlisted | 447 | 136 | 2 | 585 | ||||||||||||||
| Corporate bonds: |
– listed | 1,113 | 1,066 | 154 | 2,333 | |||||||||||||
| – unlisted | – | – | 20 | 20 | ||||||||||||||
| Government bonds: |
– listed | 6,055 | 758 | 999 | 7,812 | |||||||||||||
| Insurance contracts |
1,409 | – | 988 | 2,397 | ||||||||||||||
| Other (liabilities)/assets |
(203 | ) | 136 | 78 | 11 | |||||||||||||
| Fair value of assets |
13,582 | 2,635 | 2,989 | 19,206 | ||||||||||||||
| Present value of scheme obligations |
(13,858 | ) | (3,445 | ) | (4,007 | ) | (21,310 | ) | ||||||||||
| Net surplus/(obligation) |
(276 | ) | (810 | ) | (1,018 | ) | (2,104 | ) | ||||||||||
| Included in Other non-current assets |
77 | – | 106 | 183 | ||||||||||||||
| Included in Pensions and other post-employment benefits |
(353 | ) | (810 | ) | (1,124 | ) | (2,287 | ) | ||||||||||
| (276 | ) | (810 | ) | (1,018 | ) | (2,104 | ) | |||||||||||
| Actual return on plan assets |
1,092 | 159 | 177 | 1,428 | ||||||||||||||
The multi-asset funds comprise investments in pooled investment vehicles that are invested across a range of asset classes, increasing diversification within the growth portfolio. The value of funds in this asset class with a quoted market price is £847 million (2019 – £861 million).
The ‘Other assets’ category comprises cash and mark to market values of derivative positions.
Index-linked gilts held as part of a UK repo programme are included in government bonds. The related loan of £650 million at 31 December 2020 (2019 – £243 million; 2018 – £nil) is deducted within ‘Other assets’.
194 GSK Annual Report 2020
|
Strategic report
| ||
|
Governance and remuneration
| ||
|
Financial statements
| ||
|
Investor information
|
Notes to the financial statements continued
30. Pensions and other post-employment benefits continued
| At 31 December 2019 | UK £m |
US £m |
Rest of World £m |
Group £m |
||||||||||||||
| Equities: |
– listed | 2,904 | 671 | 638 | 4,213 | |||||||||||||
| – unlisted | – | – | 8 | 8 | ||||||||||||||
| Multi-asset funds |
2,700 | – | – | 2,700 | ||||||||||||||
| Property: |
– listed | – | – | 55 | 55 | |||||||||||||
| – unlisted | 460 | 145 | 2 | 607 | ||||||||||||||
| Corporate bonds: |
– listed | 297 | 855 | 141 | 1,293 | |||||||||||||
| – unlisted | 326 | – | 23 | 349 | ||||||||||||||
| Government bonds: |
– listed | 4,923 | 803 | 889 | 6,615 | |||||||||||||
| Insurance contracts |
1,406 | – | 832 | 2,238 | ||||||||||||||
| Other (liabilities)/assets |
(35 | ) | 315 | 74 | 354 | |||||||||||||
| Fair value of assets |
12,981 | 2,789 | 2,662 | 18,432 | ||||||||||||||
| Present value of scheme obligations |
(13,293 | ) | (3,506 | ) | (3,554 | ) | (20,353 | ) | ||||||||||
| Net surplus/(obligation) |
(312 | ) | (717 | ) | (892 | ) | (1,921 | ) | ||||||||||
|
Included in Other non-current assets |
|
70 |
|
|
– |
|
|
57 |
|
|
127 |
| ||||||
| Included in Pensions and other post-employment benefits |
(382 | ) | (717 | ) | (949 | ) | (2,048 | ) | ||||||||||
| (312 | ) | (717 | ) | (892 | ) | (1,921 | ) | |||||||||||
| Actual return on plan assets |
787 | 356 | 345 | 1,488 | ||||||||||||||
| At 31 December 2018 | UK £m |
US £m |
Rest of World £m |
Group £m |
||||||||||||||
| Equities: |
– listed | 3,257 | 1,280 | 518 | 5,055 | |||||||||||||
| – unlisted | – | – | 7 | 7 | ||||||||||||||
| Multi-asset funds |
2,997 | – | – | 2,997 | ||||||||||||||
| Property: |
– listed | – | – | 33 | 33 | |||||||||||||
| – unlisted | 423 | 231 | 4 | 658 | ||||||||||||||
| Corporate bonds: |
– listed | 404 | 783 | 111 | 1,298 | |||||||||||||
| – unlisted | 306 | – | 25 | 331 | ||||||||||||||
| Government bonds: |
– listed | 3,835 | 286 | 795 | 4,916 | |||||||||||||
| Insurance contracts |
770 | – | 831 | 1,601 | ||||||||||||||
| Other assets |
589 | 228 | 66 | 883 | ||||||||||||||
| Fair value of assets |
12,581 | 2,808 | 2,390 | 17,779 | ||||||||||||||
| Present value of scheme obligations |
(12,087 | ) | (3,474 | ) | (3,213 | ) | (18,774 | ) | ||||||||||
| Net surplus/(obligation) |
494 | (666 | ) | (823 | ) | (995 | ) | |||||||||||
|
Included in Other non-current assets |
711 | – | 49 | 760 | ||||||||||||||
| Included in Pensions and other post-employment benefits |
(217 | ) | (666 | ) | (872 | ) | (1,755 | ) | ||||||||||
| 494 | (666 | ) | (823 | ) | (995 | ) | ||||||||||||
| Actual return on plan assets |
(88 | ) | (123 | ) | 55 | (156 | ) | |||||||||||
GSK Annual Report 2020 195
|
|
||
|
|
Notes to the financial statements continued
30. Pensions and other post-employment benefits continued
| Pensions | Post-retirement benefits |
|||||||||||||||||||
| Movements in fair values of assets |
UK £m |
US £m |
Rest of World £m |
Group £m |
Group £m |
|||||||||||||||
| Assets at 1 January 2018 |
13,154 | 2,874 | 2,252 | 18,280 | – | |||||||||||||||
| Exchange adjustments |
– | 171 | 53 | 224 | – | |||||||||||||||
| Interest income |
323 | 102 | 29 | 454 | – | |||||||||||||||
| Expenses |
(8 | ) | (7 | ) | – | (15 | ) | – | ||||||||||||
| Settlements and curtailments |
– | – | (14 | ) | (14 | ) | – | |||||||||||||
| Remeasurement |
(411 | ) | (225 | ) | 26 | (610 | ) | – | ||||||||||||
| Employer contributions |
119 | 150 | 117 | 386 | 93 | |||||||||||||||
| Scheme participants’ contributions |
4 | – | 16 | 20 | 16 | |||||||||||||||
| Benefits paid |
(600 | ) | (257 | ) | (89 | ) | (946 | ) | (109 | ) | ||||||||||
| Assets at 31 December 2018 |
12,581 | 2,808 | 2,390 | 17,779 | – | |||||||||||||||
| Exchange adjustments |
– | (110 | ) | (120 | ) | (230 | ) | – | ||||||||||||
| Additions through business combinations |
– | – | 14 | 14 | – | |||||||||||||||
| Interest income |
360 | 111 | 37 | 508 | – | |||||||||||||||
| Expenses |
(7 | ) | (20 | ) | – | (27 | ) | – | ||||||||||||
| Settlements and curtailments |
– | – | 1 | 1 | – | |||||||||||||||
| Remeasurement |
427 | 245 | 312 | 984 | – | |||||||||||||||
| Employer contributions |
187 | 40 | 116 | 343 | 110 | |||||||||||||||
| Scheme participants’ contributions |
3 | – | 17 | 20 | 17 | |||||||||||||||
| Benefits paid |
(570 | ) | (285 | ) | (105 | ) | (960 | ) | (127 | ) | ||||||||||
| Assets at 31 December 2019 |
12,981 | 2,789 | 2,662 | 18,432 | – | |||||||||||||||
| Exchange adjustments |
– | (86 | ) | 138 | 52 | – | ||||||||||||||
| Additions through business combinations |
– | – | – | – | – | |||||||||||||||
| Interest income |
256 | 87 | 29 | 372 | – | |||||||||||||||
| Expenses |
(9 | ) | (12 | ) | – | (21 | ) | – | ||||||||||||
| Settlements and curtailments |
– | – | (20 | ) | (20 | ) | – | |||||||||||||
| Remeasurement |
836 | 72 | 148 | 1,056 | – | |||||||||||||||
| Employer contributions |
156 | 33 | 124 | 313 | 105 | |||||||||||||||
| Scheme participants’ contributions |
3 | – | 18 | 21 | 18 | |||||||||||||||
| Benefits paid |
(641 | ) | (248 | ) | (110 | ) | (999 | ) | (123 | ) | ||||||||||
| Assets at 31 December 2020 |
13,582 | 2,635 | 2,989 | 19,206 | – | |||||||||||||||
During 2020, the Group made special funding contributions to the UK pension schemes of £76 million (2019 – £78 million; 2018 – £nil) but £nil (2019 – £nil; 2018 – £125 million) to the US schemes. In 2018, GSK reached a revised agreement with the trustees of the UK pension schemes to make additional contributions to eliminate the pension deficits identified within the schemes at the 31 December 2017 actuarial funding valuation. Based on these funding agreements, the additional contributions to eliminate the pension deficit are expected to be £44 million in 2021 and 2022 and these are included within Note 35, ‘Commitments’ on page 202. This funding commitment supersedes the previous agreement made in 2016. The contributions were based on a government bond yield curve approach to selecting the discount rate; the rate chosen included an allowance for expected investment returns which reflected the asset mix of the schemes.
Employer contributions for 2021, including special funding contributions, are estimated to be approximately £320 million in respect of defined benefit pension schemes and £100 million in respect of post-retirement benefits.
196 GSK Annual Report 2020
|
Strategic report
| ||
|
Governance and remuneration
| ||
|
Financial statements
| ||
|
Investor information
|
Notes to the financial statements continued
30. Pensions and other post-employment benefits continued
| Pensions | Post-retirement benefits |
|||||||||||||||||||
|
Movements in defined benefit obligations |
UK £m |
US £m |
Rest of World £m |
Group £m |
Group £m |
|||||||||||||||
|
Obligations at 1 January 2018 |
(13,101 | ) | (3,445 | ) | (3,239 | ) | (19,785 | ) | (1,496 | ) | ||||||||||
|
Exchange adjustments |
– | (208 | ) | (63 | ) | (271 | ) | (71 | ) | |||||||||||
|
Service cost |
(75 | ) | (72 | ) | (134 | ) | (281 | ) | (29 | ) | ||||||||||
|
Past service cost/(credit) |
(93 | ) | (1 | ) | – | (94 | ) | 27 | ||||||||||||
|
Interest cost |
(320 | ) | (122 | ) | (48 | ) | (490 | ) | (49 | ) | ||||||||||
|
Settlements and curtailments |
– | – | 28 | 28 | 1 | |||||||||||||||
|
Remeasurement |
906 | 117 | 170 | 1,193 | 145 | |||||||||||||||
|
Scheme participants’ contributions |
(4 | ) | – | (16 | ) | (20 | ) | (16 | ) | |||||||||||
|
Benefits paid |
600 | 257 | 89 | 946 | 109 | |||||||||||||||
|
Obligations at 31 December 2018 |
(12,087 | ) | (3,474 | ) | (3,213 | ) | (18,774 | ) | (1,379 | ) | ||||||||||
|
Exchange adjustments |
– | 140 | 177 | 317 | 50 | |||||||||||||||
|
Additions through business combinations |
– | – | (56 | ) | (56 | ) | (48 | ) | ||||||||||||
|
Service cost |
(62 | ) | (74 | ) | (130 | ) | (266 | ) | (22 | ) | ||||||||||
|
Past service cost |
(49 | ) | 3 | 15 | (31 | ) | – | |||||||||||||
|
Interest cost |
(341 | ) | (140 | ) | (53 | ) | (534 | ) | (52 | ) | ||||||||||
|
Settlements and curtailments |
– | – | 8 | 8 | – | |||||||||||||||
|
Remeasurement |
(1,321 | ) | (246 | ) | (390 | ) | (1,957 | ) | (77 | ) | ||||||||||
|
Scheme participants’ contributions |
(3 | ) | – | (17 | ) | (20 | ) | (17 | ) | |||||||||||
|
Benefits paid |
570 | 285 | 105 | 960 | 127 | |||||||||||||||
|
Obligations at 31 December 2019 |
(13,293 | ) | (3,506 | ) | (3,554 | ) | (20,353 | ) | (1,418 | ) | ||||||||||
|
Exchange adjustments |
– | 118 | (188 | ) | (70 | ) | 36 | |||||||||||||
|
Disposals |
– | – | – | – | 9 | |||||||||||||||
|
Service cost |
(61 | ) | (83 | ) | (147 | ) | (291 | ) | (36 | ) | ||||||||||
|
Past service cost |
(98 | ) | 56 | (1 | ) | (43 | ) | 55 | ||||||||||||
|
Interest cost |
(259 | ) | (110 | ) | (39 | ) | (408 | ) | (39 | ) | ||||||||||
|
Settlements and curtailments |
– | – | 38 | 38 | 7 | |||||||||||||||
|
Remeasurement |
(785 | ) | (168 | ) | (208 | ) | (1,161 | ) | (82 | ) | ||||||||||
|
Scheme participants’ contributions |
(3 | ) | – | (18 | ) | (21 | ) | (18 | ) | |||||||||||
|
Benefits paid |
641 | 248 | 110 | 999 | 123 | |||||||||||||||
|
Obligations at 31 December 2020 |
(13,858 | ) | (3,445 | ) | (4,007 | ) | (21,310 | ) | (1,363 | ) | ||||||||||
The defined benefit pension obligation is analysed as follows:
| 2020 £m |
2019 £m |
2018 £m |
||||||||||
|
Funded |
(20,504 | ) | (19,547 | ) | (18,025 | ) | ||||||
|
Unfunded |
(806 | ) | (806 | ) | (749 | ) | ||||||
| (21,310 | ) | (20,353 | ) | (18,774 | ) | |||||||
The liability for the US post-retirement healthcare scheme has been assessed using the same assumptions as for the US pension scheme, together with the assumption for future medical inflation of 6.0% (2019 – 6.25%) in 2021, grading down to 4.75% in 2026 and thereafter. At 31 December 2020, the US post-retirement healthcare scheme obligation was £1,124 million (2019 – £1,198 million; 2018 – £1,179 million). Post-retirement benefits are unfunded.
GSK Annual Report 2020 197
|
|
||
|
|
Notes to the financial statements continued
30. Pensions and other post-employment benefits continued
The movement in the net defined benefit liability is as follows:
| 2020 £m |
2019 £m |
2018 £m |
||||||||||
|
At 1 January
|
|
(1,921
|
)
|
|
(995
|
)
|
|
(1,505
|
)
| |||
| Exchange adjustments
|
|
(18
|
)
|
|
87
|
|
|
(47
|
)
| |||
| Additions through business combinations
|
|
–
|
|
|
(42
|
)
|
|
–
|
| |||
| Service cost
|
|
(291
|
)
|
|
(266
|
)
|
|
(281
|
)
| |||
| Past service cost
|
|
(43
|
)
|
|
(31
|
)
|
|
(94
|
)
| |||
| Interest cost
|
|
(36
|
)
|
|
(26
|
)
|
|
(36
|
)
| |||
| Settlements and curtailments
|
|
18
|
|
|
9
|
|
|
14
|
| |||
| Remeasurements:
|
||||||||||||
| Return on plan assets, excluding amounts included in interest
|
|
1,056
|
|
|
984
|
|
|
(610
|
)
| |||
| Gain from change in demographic assumptions
|
|
69
|
|
|
78
|
|
|
131
|
| |||
| (Loss)/gain from change in financial assumptions
|
|
(1,340
|
)
|
|
(2,022
|
)
|
|
1,149
|
| |||
| Experience gains/(losses)
|
|
110
|
|
|
(13
|
)
|
|
(87
|
)
| |||
| Employer contributions
|
|
313
|
|
|
343
|
|
|
386
|
| |||
| Expenses
|
|
(21
|
)
|
|
(27
|
)
|
|
(15
|
)
| |||
| At 31 December |
(2,104 | ) | (1,921 | ) | (995 | ) | ||||||
| The remeasurements included within post-retirement benefits are detailed below: | ||||||||||||
| 2020 £m |
2019 £m |
2018 £m |
||||||||||
|
Gain from change in demographic assumptions
|
|
7
|
|
|
–
|
|
|
6
|
| |||
| (Loss)/gain from change in financial assumptions
|
|
(93
|
)
|
|
(80
|
)
|
|
100
|
| |||
| Experience gains
|
|
4
|
|
|
3
|
|
|
39
|
| |||
| (82 | ) | (77 | ) | 145 | ||||||||
| The defined benefit pension obligation analysed by membership category is as follows: | ||||||||||||
| 2020 £m |
2019 £m |
2018 £m |
||||||||||
|
Active
|
|
4,660
|
|
|
4,572
|
|
|
4,427
|
| |||
| Retired
|
|
11,257
|
|
|
10,485
|
|
|
9,542
|
| |||
| Deferred
|
|
5,393
|
|
|
5,296
|
|
|
4,805
|
| |||
| 21,310 | 20,353 | 18,774 | ||||||||||
| The post-retirement benefit obligation analysed by membership category is as follows: | ||||||||||||
| 2020 £m |
2019 £m |
2018 £m |
||||||||||
|
Active
|
|
551
|
|
|
549
|
|
|
499
|
| |||
| Retired
|
|
808
|
|
|
869
|
|
|
879
|
| |||
| Deferred
|
|
4
|
|
|
–
|
|
|
1
|
| |||
| 1,363 | 1,418 | 1,379 | ||||||||||
| The weighted average duration of the defined benefit obligation is as follows: | ||||||||||||
| 2020 years |
2019 years |
2018 years |
||||||||||
|
Pension benefits
|
|
16
|
|
|
15
|
|
|
15
|
| |||
|
Post-retirement benefits |
12 | 12 | 11 | |||||||||
198 GSK Annual Report 2020
|
Strategic report
| ||
|
Governance and remuneration
| ||
|
Financial statements
| ||
|
Investor information
|
Notes to the financial statements continued
30. Pensions and other post-employment benefits continued
Sensitivity analysis
The effect of changes in assumptions used on the benefit obligations and on the 2021 annual defined benefit pension and post-retirement costs are detailed below. This information has been determined by taking into account the duration of the liabilities and the overall profile of the plan memberships.
| 0.25% increase £m |
0.25% £m |
|||||||||||
| Discount rate |
||||||||||||
| (Decrease)/increase in annual pension cost |
(20 | ) | 15 | |||||||||
| Increase/(decrease) in annual post-retirement benefits cost |
1 | (1 | ) | |||||||||
| (Decrease)/increase in pension obligation |
(797 | ) | 846 | |||||||||
| (Decrease)/increase in post-retirement benefits obligation |
(40 | ) | 42 | |||||||||
| 0.5% increase £m |
|
0.5% decrease £m |
||||||||||
| (Decrease)/increase in annual pension cost |
(39 | ) | 27 | |||||||||
| Increase/(decrease) in annual post-retirement benefits cost |
2 | (2 | ) | |||||||||
| (Decrease)/increase in pension obligation |
(1,550 | ) | 1,745 | |||||||||
|
(Decrease)/increase in post-retirement benefits obligation |
(78 | ) | 86 | |||||||||
| 0.25% increase £m |
0.25% decrease £m |
|||||||||||
| Inflation rate |
||||||||||||
| Increase/(decrease) in annual pension cost |
14 | (13 | ) | |||||||||
|
Increase/(decrease) in pension obligation |
617 | (572 | ) | |||||||||
| 1 year increase £m |
||||||||||||
| Life expectancy |
||||||||||||
| Increase in annual pension cost |
15 | |||||||||||
| Increase in annual post-retirement benefits cost |
1 | |||||||||||
| Increase in pension obligation |
801 | |||||||||||
| Increase in post-retirement benefits obligation |
40 | |||||||||||
| 1% increase £m |
||||||||||||
| Rate of future healthcare inflation |
||||||||||||
| Increase in annual post-retirement benefits cost |
1 | |||||||||||
| Increase in post-retirement benefits obligation |
50 | |||||||||||
GSK Annual Report 2020 199
|
|
||
|
|
Notes to the financial statements continued
31. Other provisions
|
Legal and other disputes £m |
Major restructuring programmes £m |
Employee related provisions £m |
Other provisions £m |
Total £m |
||||||||||||||||
| At 1 January 2020 |
198 | 505 | 387 | 201 | 1,291 | |||||||||||||||
| Exchange adjustments |
(12 | ) | 4 | 4 | (3 | ) | (7 | ) | ||||||||||||
| Charge for the year |
234 | 746 | 64 | 102 | 1,146 | |||||||||||||||
| Reversed unused |
(3 | ) | (96 | ) | (21 | ) | (7 | ) | (127 | ) | ||||||||||
| Unwinding of discount |
1 | 2 | – | – | 3 | |||||||||||||||
| Utilised |
(98 | ) | (287 | ) | (99 | ) | (44 | ) | (528 | ) | ||||||||||
| Reclassifications and other movements |
– | 18 | (9 | ) | 4 | 13 | ||||||||||||||
| Transfer to Pension obligations |
– | (32 | ) | – | – | (32 | ) | |||||||||||||
| At 31 December 2020 | 320 | 860 | 326 | 253 | 1,759 | |||||||||||||||
| To be settled within one year |
279 | 634 | 63 | 76 | 1,052 | |||||||||||||||
| To be settled after one year |
41 | 226 | 263 | 177 | 707 | |||||||||||||||
| At 31 December 2020 | 320 | 860 | 326 | 253 | 1,759 | |||||||||||||||
200 GSK Annual Report 2020
|
Strategic report
| ||
|
Governance and remuneration
| ||
|
Financial statements
| ||
|
Investor information
|
Notes to the financial statements continued
31. Other provisions continued
32. Contingent consideration liabilities
The consideration for certain acquisitions includes amounts contingent on future events such as development milestones or sales performance. The Group has provided for the fair value of this contingent consideration as follows:
| Shionogi- ViiV Healthcare £m |
Novartis Vaccines £m |
Other £m |
Total £m |
|||||||||||||
| At 1 January 2018 |
5,542 | 584 | 46 | 6,172 | ||||||||||||
| Remeasurement through income statement |
1,188 | 56 | 7 | 1,251 | ||||||||||||
| Cash payments: operating cash flows |
(703 | ) | (281 | ) | – | (984 | ) | |||||||||
| Cash payments: investing activities |
(90 | ) | (63 | ) | – | (153 | ) | |||||||||
| At 31 December 2018 |
5,937 | 296 | 53 | 6,286 | ||||||||||||
| Remeasurement through income statement |
31 | 67 | (15 | ) | 83 | |||||||||||
| Cash payments: operating cash flows |
(767 | ) | (13 | ) | – | (780 | ) | |||||||||
| Cash payments: investing activities |
(98 | ) | (11 | ) | (4 | ) | (113 | ) | ||||||||
| Other movements |
– | – | 3 | 3 | ||||||||||||
| At 31 December 2019 |
5,103 | 339 | 37 | 5,479 | ||||||||||||
| Remeasurement through income statement |
1,114 | 161 | – | 1,275 | ||||||||||||
| Cash payments: operating cash flows |
(751 | ) | (14 | ) | – | (765 | ) | |||||||||
| Cash payments: investing activities |
(107 | ) | (9 | ) | (4 | ) | (120 | ) | ||||||||
| At 31 December 2020 |
5,359 | 477 | 33 | 5,869 | ||||||||||||
Of the contingent consideration payable at 31 December 2020, £765 million (2019 – £755 million) is expected to be paid within one year.
The consideration payable for the acquisition of the Shionogi-ViiV Healthcare joint venture and the Novartis Vaccines business is expected to be paid over a number of years. As a result, the total estimated liabilities are discounted to their present values, shown above. The Shionogi-ViiV Healthcare contingent consideration liability is discounted at 8.5% and the Novartis Vaccines contingent consideration liability is discounted at 8% for commercialised products and at 9% for pipeline assets.
The Shionogi-ViiV Healthcare and Novartis Vaccines contingent consideration liabilities are calculated principally based on the forecast sales performance of specified products over the lives of those products.
The table below shows on an indicative basis the income statement and balance sheet sensitivity to reasonably possible changes in key inputs to the valuations of the contingent consideration liabilities.
| 2000 | 2019 | |||||||||||||||
| Increase/(decrease) in financial liability and loss/(gain) in Income statement | Shionogi- ViiV Healthcare £m |
Novartis Vaccines £m |
Shionogi- ViiV Healthcare £m |
Novartis Vaccines £m |
||||||||||||
| 10% increase in sales forecasts |
515 | 80 | 489 | 65 | ||||||||||||
| 10% decrease in sales forecasts |
(516 | ) | (78 | ) | (490 | ) | (65 | ) | ||||||||
| 1% increase in discount rate |
(207 | ) | (39 | ) | (192 | ) | (24 | ) | ||||||||
| 1% decrease in discount rate |
223 | 45 | 205 | 27 | ||||||||||||
| 5% increase in probability of milestone success |
7 | 7 | ||||||||||||||
| 5% decrease in probability of milestone success |
(7 | ) | (7 | ) | ||||||||||||
| 10 cent appreciation of US Dollar |
305 | 4 | 302 | (8 | ) | |||||||||||
| 10 cent depreciation of US Dollar |
(262 | ) | (2 | ) | (261 | ) | 7 | |||||||||
| 10 cent appreciation of Euro |
125 | 30 | 106 | 26 | ||||||||||||
| 10 cent depreciation of Euro |
(105 | ) | (24 | ) | (91 | ) | (22 | ) | ||||||||
An explanation of the accounting for ViiV Healthcare is set out on page 52.
GSK Annual Report 2020 201
|
|
||
|
|
Notes to the financial statements continued
33. Other non-current liabilities
|
2020 |
2019 |
|||||||
| Accruals | 41 | 42 | ||||||
| Deferred income |
21 | 24 | ||||||
| Other payables |
741 | 778 | ||||||
| 803 | 844 | |||||||
Other payables includes a number of employee-related liabilities including employee savings plans.
34. Contingent liabilities
At 31 December 2020, contingent liabilities where GSK has a present obligation as a result of a past event, comprising guarantees, discounted bills and other items arising in the normal course of business, amounted to £138 million (2019 – £97 million). These contingent liabilities arise where the Group has a present obligation arising from a past event. At 31 December 2020, £0.4 million (2019 – £1 million) of financial assets were pledged as collateral for contingent liabilities. Provision is made for the outcome of tax, legal and other disputes where it is both probable that the Group will suffer an outflow of funds and it is possible to make a reliable estimate of that outflow. At 31 December 2020, other than for those disputes where provision has been made, it was not possible to make a reliable estimate of the potential outflow of funds that might be required to settle disputes where the possibility of there being an outflow was more than remote. Descriptions of the significant legal and other disputes to which the Group is a party are set out in Note 46, ‘Legal proceedings’.
35. Commitments
| Contractual obligations and commitments |
2020 £m |
2019 £m |
||||||
| Contracted for but not provided in the financial statements: |
||||||||
| Intangible assets |
12,307 | 9,727 | ||||||
| Property, plant and equipment |
528 | 413 | ||||||
| Investments |
153 | 47 | ||||||
| Purchase commitments |
746 | 1,047 | ||||||
| Pensions |
88 | 163 | ||||||
| Interest on loans |
8,309 | 8,952 | ||||||
| Future finance charges on leases |
180 | 223 | ||||||
| 22,311 | 20,572 | |||||||
The commitments related to intangible assets include milestone payments, which are dependent on successful clinical development or on meeting specified sales targets, and which represent the maximum that would be paid if all milestones, however unlikely, are achieved. The amounts are not risk-adjusted or discounted. The increase in intangible commitments in 2020 is mainly attributable to a number of new R&D collaborations, including with CureVac, Ideaya Biosciences and Surface Oncology.
In 2018, GSK reached an agreement with the trustees of the UK pension schemes to make additional contributions to eliminate the pension deficit identified at the 31 December 2017 actuarial funding valuation. A payment of £44 million is due in both 2021 and 2022. The table above includes this commitment, but excludes the normal ongoing annual funding requirement in the UK of approximately £130 million.
The Group also has other commitments which principally relate to revenue payments to be made under licences and other alliances.
Commitments in respect of future interest payable on loans are disclosed before taking into account the effect of interest rate swaps.
202 GSK Annual Report 2020
|
Strategic report
| ||
|
Governance and remuneration
| ||
|
Financial statements
| ||
|
Investor information
|
Notes to the financial statements continued
36. Share capital and share premium account
| Ordinary Shares of 25p each | Share premium |
|||||||||||
| Number | £m | £m | ||||||||||
| Share capital issued and fully paid |
||||||||||||
| At 1 January 2018 |
5,372,553,820 | 1,343 | 3,019 | |||||||||
| Issued under employee share schemes |
6,513,804 | 2 | 72 | |||||||||
| At 31 December 2018 |
5,379,067,624 | 1,345 | 3,091 | |||||||||
| Issued under employee share schemes |
4,034,607 | 1 | 50 | |||||||||
| Ordinary shares acquired by ESOP Trusts |
– | – | 33 | |||||||||
| At 31 December 2019 |
5,383,102,231 | 1,346 | 3,174 | |||||||||
| Issued under employee share schemes |
2,087,386 | – | 29 | |||||||||
| Ordinary shares acquired by ESOP Trusts |
– | – | 78 | |||||||||
| At 31 December 2020 |
5,385,189,617 | 1,346 | 3,281 | |||||||||
| 31 December 2020 000 |
31 December 2019 000 |
|||||||||||
| Number of shares issuable under employee share schemes |
48,205 | 57,871 | ||||||||||
| Number of unissued shares not under option |
4,566,605 | 4,559,027 | ||||||||||
At 31 December 2020, of the issued share capital, 48,975,304 shares were held in the ESOP Trusts, 355,205,950 shares were held as Treasury shares and 4,981,008,363 shares were in free issue. All issued shares are fully paid. The nominal, carrying and market values of the shares held in the ESOP Trusts are disclosed in Note 44, ‘Employee share schemes’.
GSK Annual Report 2020 203
|
|
||
|
|
Notes to the financial statements continued
37. Movements in equity
Retained earnings and other reserves amounted to £9,960 million at 31 December 2020 (2019 – £6,885 million; 2018 – £655 million loss) of which £440 million (2019 – £394 million; 2018 – £337 million) related to associates and joint ventures.
The cumulative translation exchange in equity is as follows:
| Net translation exchange included in: | ||||||||||||||||
| Retained earnings £m |
Fair value reserve £m |
Non- controlling interests £m |
Total translation exchange £m |
|||||||||||||
| At 1 January 2018 |
443 | 23 | 345 | 811 | ||||||||||||
| Exchange movements on overseas net assets |
(458 | ) | (22 | ) | (1 | ) | (481 | ) | ||||||||
| At 31 December 2018, as reported |
(15 | ) | 1 | 344 | 330 | |||||||||||
| Adjustment of exchange movements on overseas net assets |
396 | – | (396 | ) | – | |||||||||||
| At 31 December 2018, as revised |
381 | 1 | (52 | ) | 330 | |||||||||||
| Exchange movements on overseas net assets |
(830 | ) | (2 | ) | (75 | ) | (907 | ) | ||||||||
| Reclassification of exchange movements on liquidation or disposal of overseas subsidiaries |
(75 | ) | – | – | (75 | ) | ||||||||||
| At 31 December 2019 |
(524 | ) | (1 | ) | (127 | ) | (652 | ) | ||||||||
| Exchange movements on overseas net assets |
(51 | ) | (8 | ) | (34 | ) | (93 | ) | ||||||||
| Reclassification of exchange movements on liquidation or disposal of overseas subsidiaries |
36 | – | – | 36 | ||||||||||||
| At 31 December 2020 |
(539 | ) | (9 | ) | (161 | ) | (709 | ) | ||||||||
| The analysis of other comprehensive income by equity category is as follows: |
| |||||||||||||||
| 2020 | Retained earnings £m |
Other reserves £m |
Non- controlling interests £m |
Total £m |
||||||||||||
| Items that may be subsequently reclassified to income statement: |
||||||||||||||||
| Exchange movements on overseas net assets and net investment hedges |
(51 | ) | (8 | ) | – | (59 | ) | |||||||||
| Reclassification of exchange movements on liquidation or disposal of overseas subsidiaries |
36 | – | – | 36 | ||||||||||||
| Fair value movements on cash flow hedges |
– | (19 | ) | – | (19 | ) | ||||||||||
| Reclassification of cash flow hedges to income and expense |
– | 54 | – | 54 | ||||||||||||
| Tax on fair value movements on cash flow hedges |
– | (18 | ) | – | (18 | ) | ||||||||||
| Items that will not be reclassified to income statement: |
||||||||||||||||
| Exchange movements on overseas net assets of non-controlling interests |
– | – | (34 | ) | (34 | ) | ||||||||||
| Fair value movements on equity investments |
– | 1,348 | – | 1,348 | ||||||||||||
| Tax on fair value movements on equity investments |
– | (220 | ) | – | (220 | ) | ||||||||||
| Remeasurement losses on defined benefit plans |
(187 | ) | – | – | (187 | ) | ||||||||||
| Tax on remeasurement losses in defined benefit plans |
69 | – | – | 69 | ||||||||||||
| Other comprehensive (expense)/income for the year |
(133 | ) | 1,137 | (34 | ) | 970 | ||||||||||
| 2019 | Retained earnings £m |
Other reserves £m |
Non- controlling interests £m |
Total £m |
||||||||||||
| Items that may be subsequently reclassified to income statement: |
||||||||||||||||
| Exchange movements on overseas net assets and net investment hedges |
(830 | ) | (2 | ) | – | (832 | ) | |||||||||
| Reclassification of exchange movements on liquidation or disposal of overseas subsidiaries |
(75 | ) | – | – | (75 | ) | ||||||||||
| Fair value movements on cash flow hedges |
– | (20 | ) | – | (20 | ) | ||||||||||
| Reclassification of cash flow hedges to income and expense |
– | 3 | – | 3 | ||||||||||||
| Tax on fair value movements on cash flow hedges |
– | 16 | – | 16 | ||||||||||||
| Items that will not be reclassified to income statement: |
||||||||||||||||
| Exchange movements on overseas net assets of non-controlling interests |
– | – | (75 | ) | (75 | ) | ||||||||||
| Fair value movements on equity investments |
– | 372 | – | 372 | ||||||||||||
| Tax on fair value movements on equity investments |
– | (95 | ) | – | (95 | ) | ||||||||||
| Remeasurement gains on defined benefit plans |
(1,050 | ) | – | – | (1,050 | ) | ||||||||||
| Tax on remeasurement gains in defined benefit plans |
189 | – | – | 189 | ||||||||||||
| Other comprehensive (expense)/income for the year |
(1,766 | ) | 274 | (75 | ) | (1,567 | ) | |||||||||
204 GSK Annual Report 2020
|
Strategic report
| ||
|
Governance and remuneration
| ||
|
Financial statements
| ||
|
Investor information
|
Notes to the financial statements continued
37. Movements in equity continued
| 2018 | Retained earnings £m |
Other reserves £m |
Non- controlling interests £m |
Total £m |
||||||||||||
| Items that may be subsequently reclassified to income statement: |
||||||||||||||||
| Exchange movements on overseas net assets and net investment hedges |
(458 | ) | (22 | ) | – | (480 | ) | |||||||||
| Fair value movements on cash flow hedges |
– | 140 | – | 140 | ||||||||||||
| Reclassification of cash flow hedges to income and expense |
– | (175 | ) | – | (175 | ) | ||||||||||
| Tax on fair value movements on cash flow hedges |
– | (22 | ) | – | (22 | ) | ||||||||||
| Deferred tax reversed on reclassification of cash flow hedges |
– | 20 | – | 20 | ||||||||||||
| Items that will not be reclassified to income statement: |
||||||||||||||||
| Exchange movements on overseas net assets of non-controlling interests |
– | – | (1 | ) | (1 | ) | ||||||||||
| Fair value movements on equity investments |
– | 180 | – | 180 | ||||||||||||
| Tax on fair value movements on equity investments |
– | 10 | – | 10 | ||||||||||||
| Remeasurement gains on defined benefit plans |
728 | – | – | 728 | ||||||||||||
| Tax on remeasurement gains in defined benefit plans |
(146 | ) | – | – | (146 | ) | ||||||||||
| Other comprehensive income/(expense) for the year |
124 | 131 | (1 | ) | 254 | |||||||||||
Information on net investment hedges is provided in part (d) of Note 43 ‘Financial instruments and related disclosures’.
The analysis of other reserves is as follows:
| ESOP Trust shares £m |
Fair value reserve £m |
Cash flow hedge reserve £m |
Other reserves £m |
Total £m |
||||||||||||||||
| At 1 January 2018 |
(400 | ) | 41 | (11 | ) | 2,129 | 1,759 | |||||||||||||
| Exchange adjustments |
(26 | ) | – | – | – | (26 | ) | |||||||||||||
| Transferred to Retained earnings in the year on disposal of equity investments |
– | (94 | ) | – | – | (94 | ) | |||||||||||||
| Net fair value movement in the year |
– | 193 | (36 | ) | – | 157 | ||||||||||||||
| Write-down of shares held by ESOP Trusts |
265 | – | – | – | 265 | |||||||||||||||
| At 31 December 2018 |
(161 | ) | 140 | (47 | ) | 2,129 | 2,061 | |||||||||||||
| Exchange adjustments |
10 | – | – | – | 10 | |||||||||||||||
| Transferred to Retained earnings in the year on disposal of equity investments |
– | 5 | – | – | 5 | |||||||||||||||
| Net fair value movement in the year |
– | 264 | (1 | ) | – | 263 | ||||||||||||||
| Ordinary shares acquired by ESOP Trusts |
(328 | ) | – | – | – | (328 | ) | |||||||||||||
| Write-down of shares held by ESOP Trusts |
344 | – | – | – | 344 | |||||||||||||||
| At 31 December 2019 |
(135 | ) | 409 | (48 | ) | 2,129 | 2,355 | |||||||||||||
| Exchange adjustments |
20 | – | – | – | 20 | |||||||||||||||
| Transferred to Retained earnings in the year on disposal of equity investments |
– | (207 | ) | – | – | (207 | ) | |||||||||||||
| Net fair value movement in the year |
– | 1,100 | 17 | – | 1,117 | |||||||||||||||
| Ordinary shares acquired by ESOP Trusts |
(609 | ) | – | – | – | (609 | ) | |||||||||||||
| Write-down of shares held by ESOP Trusts |
529 | – | – | – | 529 | |||||||||||||||
| At 31 December 2020 |
(195 | ) | 1,302 | (31 | ) | 2,129 | 3,205 | |||||||||||||
Other reserves include various non-distributable merger and pre-merger reserves amounting to £1,849 million at 31 December 2020 (2019 – £1,849 million; 2018 – £1,849 million). Other reserves also include the capital redemption reserve created as a result of the share buy-back programme amounting to £280 million at 31 December 2020 (2019 – £280 million; 2018 – £280 million).
GSK Annual Report 2020 205
|
|
||
|
|
Notes to the financial statements continued
38. Non-controlling interests
Total non-controlling interests includes the following individually material non-controlling interests. Other non-controlling interests are individually not material.
ViiV Healthcare
GSK holds 78.3% of the ViiV Healthcare sub-group, giving rise to a material non-controlling interest. Summarised financial information in respect of the ViiV Healthcare sub-group is as follows:
| 2020 £m |
2019 £m |
2018 £m |
||||||||||
| Turnover |
4,848 | 4,816 | 4,665 | |||||||||
| Profit after taxation |
762 | 2,574 | 560 | |||||||||
| Other comprehensive income/(expense) |
33 | (29 | ) | 19 | ||||||||
| Total comprehensive income |
795 | 2,545 | 579 | |||||||||
| 2020 £m |
2019 £m |
|||||||||||
| Non-current assets |
2,564 | 2,660 | ||||||||||
| Current assets |
2,405 | 2,905 | ||||||||||
| Total assets |
4,969 | 5,565 | ||||||||||
| Current liabilities |
(2,748 | ) | (2,742 | ) | ||||||||
|
Non-current liabilities |
(8,343 | ) | (7,811 | ) | ||||||||
| Total liabilities |
(11,091 | ) | (10,553 | ) | ||||||||
| Net liabilities |
(6,122 | ) | (4,988 | ) | ||||||||
| 2020 £m |
2019 £m |
2018 £m |
||||||||||
| Net cash inflow from operating activities |
2,249 | 2,375 | 2,212 | |||||||||
| Net cash outflow from investing activities |
(294 | ) | (202 | ) | (237 | ) | ||||||
| Net cash outflow from financing activities |
(2,483 | ) | (1,947 | ) | (1,982 | ) | ||||||
| (Decrease)/increase in cash and bank overdrafts in the year |
(528 | ) | 226 | (7 | ) | |||||||
The above financial information relates to the ViiV Healthcare group on a stand-alone basis, before the impact of Group-related adjustments, primarily related to the recognition of preferential dividends. The profit after taxation of £762 million (2019 – £2,574 million; 2018 – £560 million) is stated after charging preferential dividends payable to GSK, Shionogi and Pfizer and after a charge of £1,112 million (2019 – £37 million; 2018 – £1,194 million) for remeasurement of contingent consideration payable. This consideration is expected to be paid over a number of years.
The following amounts attributable to the ViiV Healthcare group are included in GSK’s Financial statements:
|
2020 £m |
2019 £m |
2018 £m |
||||||||||
| Share of profit for the year attributable to non-controlling interest |
223 | 482 | 254 | |||||||||
| Dividends paid to non-controlling interest |
419 | 310 | 332 | |||||||||
| Non-controlling interest in the Consolidated balance sheet |
(539 | ) | (344 | ) | (543 | ) | ||||||
206 GSK Annual Report 2020
|
Strategic report
| ||
|
Governance and remuneration
| ||
|
Financial statements
| ||
|
Investor information
|
Notes to the financial statements continued
38. Non-controlling interests continued
Consumer Healthcare Joint Venture
GSK holds 68% of the Consumer Healthcare sub-group, giving rise to a material non-controlling interest. Summarised financial information in respect of the Consumer Healthcare sub-group is as follows:
| 2020 £m |
2019 £m |
|||||||
| Turnover |
9,837 | 4,240 | ||||||
| Profit after taxation |
1,219 | 150 | ||||||
| Other comprehensive expenses |
(266 | ) | (721 | ) | ||||
| Total comprehensive income/(expenses) |
953 | (571 | ) | |||||
| 2020 £m |
2019 £m |
|||||||
| Non-current assets |
29,134 | 29,899 | ||||||
| Current assets |
4,918 | 5,713 | ||||||
| Total assets |
34,052 | 35,612 | ||||||
| Current liabilities |
(4,254 | ) | (4,219 | ) | ||||
|
Non-current liabilities |
(3,890 | ) | (4,027 | ) | ||||
| Total liabilities |
(8,144 | ) | (8,246 | ) | ||||
| Net assets |
25,908 | 27,366 | ||||||
| 2020 £m |
2019 £m |
|||||||
| Net cash inflow from operating activities |
1,419 | 1,014 | ||||||
| Net cash inflow/(outflow) from investing activities |
1,018 | (776 | ) | |||||
| Net cash outflow from financing activities |
(2,437 | ) | (78 | ) | ||||
| Increase in cash and bank overdraft in the year/period |
– | 160 | ||||||
The above financial information relates to the Consumer Healthcare Joint Venture on a stand-alone basis for the year ended
31 December 2020 (2019: for the period from its formation on 31 July 2019 to December 2019), before the impact of Group-related adjustments and the classification of cash pooling accounts with Group companies outside the Consumer Healthcare Joint Venture but after Major restructuring charges.
The following amounts attributable to the Consumer Healthcare Joint Venture are included in GSK’s Financial statements:
| 2020 £m |
2019 £m |
|||||||
| Share of profit for the year/period attributable to non-controlling interest |
374 | 69 | ||||||
| Dividends paid to non-controlling interest |
735 | – | ||||||
|
Non-controlling interest in the Consolidated balance sheet |
6,538 | 6,911 | ||||||
GSK Annual Report 2020 207
|
|
||
|
|
Notes to the financial statements continued
39. Related party transactions
At 31 December 2020, GSK owned 32 million shares or 31.6% of Innoviva Inc. which is a biopharmaceutical company listed on NASDAQ. GSK began recognising Innoviva as an associate on 1 September 2015. The royalties due from GSK to Innoviva in the year were £261 million (2019 – £215 million). At 31 December 2020, the balance payable by GSK to Innoviva was £65 million (2019 – £63 million).
A loan of £3.0 million to Medicxi Ventures I LP remained due to GSK at 31 December 2020. The loan due from Index Ventures Life VI (Jersey) LP was repaid in the year. In 2020, GSK increased the investment in Kurma Biofund II, FCPR by £0.8 million and Apollo Therapeutics LLP by £2.0 million. Further investments were also made in Medicxi Ventures I LP of £1.2 million. As part of the joint venture agreement with Qura Therapeutics LLC, the Group had an obligation to fund the joint venture $1 million per quarter up to April 2020. On 26 June 2019, the agreement was extended for a second five-year period up to April 2025, with both GSK and its joint venture partner committing additional financial support in the amount of $20 million. At December 2020, the outstanding liability due to Qura was $17 million.
Cash distributions were received from our investments in Medicxi Ventures I LP of £14.5 million and in Index Venture VI (Jersey) LP of £10.6 million.
The aggregate compensation of the Directors and CET is given in Note 9, ‘Employee costs’.
40. Acquisitions and disposals
Details of the acquisition and disposal of significant subsidiaries and associates, joint ventures and other businesses are given below:
2020
Business acquisitions
GSK completed one smaller business acquisition when it acquired 55% of Pfizer Biotech Corporation Taiwan, a part of Pfizer’s consumer healthcare business, which was not previously recognised as part of the Consumer Healthcare Joint Venture, on 28 September 2020 for non cash consideration of £129 million. This represented goodwill of £124 million, cash of £21 million and other assets acquired of £18 million less non-controlling interest of £14 million and net liabilities of £20 million.
| Total £m |
||||
| Net assets acquired: |
||||
| Intangible assets |
2 | |||
| Property, plant and equipment |
5 | |||
| Inventory |
5 | |||
| Trade and other receivables |
6 | |||
| Cash and cash equivalents |
21 | |||
| Trade and other payables |
(20 | ) | ||
| 19 | ||||
| Non-controlling interest |
(14 | ) | ||
| Goodwill |
124 | |||
| 129 | ||||
|
Non-cash consideration (settlement of a promissory note) |
129 | |||
| Total consideration |
129 | |||
Business disposals
On 1 April 2020, GSK completed its divestment of Horlicks and other Consumer Healthcare nutrition products in India and a number of other countries (excluding Bangladesh) to Unilever and the merger of GSK’s Indian listed Consumer Healthcare entity with Hindustan Unilever, an Indian listed public company. GSK received a 5.7% equity stake in Hindustan Unilever and £395 million in cash. GSK disposed of its equity stake in Hindustan Unilever during May 2020.
The divestment in Bangladesh closed on 30 June 2020. Total cash consideration received was £177 million.
The cash divested as part of the disposal of the India and Bangladesh Consumer Healthcare entities was £478 million.
208 GSK Annual Report 2020
|
Strategic report
| ||
|
Governance and remuneration
| ||
|
Financial statements
| ||
|
Investor information
|
Notes to the financial statements continued
40. Acquisitions and disposals continued
The profit on the disposal of the businesses in the year of £2,795 million was calculated as follows:
| Horlicks divestment £m |
Other £m |
Total £m |
||||||||||
| Consideration: |
||||||||||||
| Cash consideration receivable including currency forwards and purchase adjustments |
492 | 157 | 649 | |||||||||
| Equity investment in Hindustan Unilever Limited |
3,124 | – | 3,124 | |||||||||
| Total |
3,616 | 157 | 3,773 | |||||||||
| Net assets disposed: |
||||||||||||
| Goodwill |
142 | 1 | 143 | |||||||||
| Intangible assets |
15 | 103 | 118 | |||||||||
| Property, plant and equipment |
56 | 12 | 68 | |||||||||
| Inventory |
– | 6 | 6 | |||||||||
| Cash and cash equivalents |
478 | 3 | 481 | |||||||||
| Other net (liabilities)/assets |
(155 | ) | 1 | (154 | ) | |||||||
| Total |
536 | 126 | 662 | |||||||||
| Costs: |
||||||||||||
| Transaction costs |
12 | 28 | 40 | |||||||||
| Derivative |
240 | – | 240 | |||||||||
| Reclassification of exchange from other comprehensive income |
36 | – | 36 | |||||||||
| Total |
288 | 28 | 316 | |||||||||
| Gain on disposals |
2,792 | 3 | 2,795 | |||||||||
| The exposure to share price movements embedded in the agreement to merge GSK’s Indian listed Consumer Healthcare entity with Hindustan Unilever Limited as part of the divestment of Horlicks and other nutrition products in India and a number of other countries was recognised as a derivative between signing of the agreement in 2018 and completion of the transaction in 2020. £240 million is recorded as a cost in the table above for the derecognition of the derivative asset. This largely reflects fair value gains recognised in the Income Statement in prior periods. |
| |||||||||||
| Associates and joint ventures |
| |||||||||||
| During the year, GSK made investments into associates of £4 million and £4 million was paid in cash. |
| |||||||||||
| Cash flows | Business acquisitions £m |
Business disposals £m |
Associates and joint ventures investments £m |
|||||||||
| Cash consideration received/(paid) |
– | 786 | (4 | ) | ||||||||
| Net deferred consideration |
– | (19 | ) | – | ||||||||
| Transaction costs |
(6 | ) | (27 | ) | – | |||||||
| Cash and cash equivalents acquired/(divested) |
21 | (481 | ) | – | ||||||||
| Cash inflow/(outflow) |
15 | 259 | (4 | ) | ||||||||
GSK Annual Report 2020 209
|
|
||
|
|
Notes to the financial statements continued
40. Acquisitions and disposals continued
2019
Business acquisitions
Pfizer consumer healthcare business
The acquisition of Pfizer’s consumer healthcare business completed on 31 July 2019.
GSK and Pfizer have contributed their respective consumer healthcare businesses into a new Consumer Healthcare Joint Venture in a non-cash transaction, whereby GSK has acquired Pfizer’s consumer healthcare business in return for shares in the Joint Venture. GSK has an equity interest of 68% and majority control of the Joint Venture and Pfizer has an equity interest of 32%. As the Group has control over the Consumer Healthcare Joint Venture it is consolidated within the Group’s financial statements. In a number of territories, legal completion of the acquisition has not occurred because of regulatory constraints. However, the Consumer Healthcare Joint Venture obtained control of the majority of these businesses in these territories from 31 July 2019 and has consolidated the net assets of those businesses from that date, but in all cases is entitled to the benefits of the trading of businesses in the delayed territories.
The non-controlling interest in the Consumer Healthcare Joint Venture, calculated applying the proportionate goodwill method, represents Pfizer’s share of the net assets of the Joint Venture, excluding goodwill.
Goodwill of £3.9 billion, which is not expected to be deductible for tax purposes, has been recognised. The goodwill represents the potential for further synergies arising from combining the acquired businesses with GSK’s existing business together with the value of the workforce acquired. Total transaction costs recognised in 2018 and 2019 for the acquisition amounted to £77 million.
Since acquisition on 31 July 2019, sales of £1.2 billion arising from the Pfizer consumer healthcare business have been included in Group turnover. If the business had been acquired at the beginning of the year, it is estimated that Group turnover in 2019 would have been approximately £1.5 billion higher. The business has been integrated into the Group’s existing activities and it is not practicable to identify the impact on the Group profit in the period.
Tesaro Inc.
On 22 January 2019, GSK acquired 100% of Tesaro Inc., an oncology focused biopharmaceutical company, for cash consideration of $5.0 billion (£3.9 billion), in order to strengthen the Group’s pharmaceutical pipeline. Transaction costs amounted to £31 million.
Goodwill of £1.2 billion, none of which is expected to be tax-deductible, has been recognised. The goodwill represents the potential for further synergies arising from combining the acquired businesses with GSK’s existing business together with the value of the workforce acquired. From acquisition on 22 January 2019 to 31 December 2019, sales of £0.2 billion arising from the Tesaro business have been included in Group turnover. The business has been integrated into the Group’s existing activities and it is not practicable to identify the impact on the Group profit in the period.
The fair value of the assets acquired in business combinations, including goodwill, are set out in the table below. Amounts related to the Pfizer consumer healthcare business acquisition are provisional and subject to change.
| Pfizer consumer healthcare business £m |
Tesaro £m |
Other £m |
||||||||||
| Net assets acquired: |
||||||||||||
| Intangible assets |
12,357 | 3,092 | – | |||||||||
| Property, plant and equipment |
354 | 6 | – | |||||||||
| Right of use assets |
39 | 40 | – | |||||||||
| Inventory |
986 | 162 | – | |||||||||
| Trade and other receivables |
546 | 115 | 35 | |||||||||
| Other assets including cash and cash equivalents |
302 | 254 | 16 | |||||||||
| Trade and other payables |
(779 | ) | (282 | ) | (39 | ) | ||||||
| Net deferred tax liabilities |
(2,591 | ) | (252 | ) | – | |||||||
| Other liabilities |
(99 | ) | (5 | ) | – | |||||||
| Term loan |
– | (445 | ) | – | ||||||||
| Non-controlling interest |
(3,577 | ) | – | – | ||||||||
| Goodwill |
3,854 | 1,169 | – | |||||||||
| Total |
11,392 | 3,854 | 12 | |||||||||
| Consideration settled by shares in GSK Consumer Healthcare Joint Venture |
11,392 | – | – | |||||||||
| Cash consideration paid |
– | 3,854 | 6 | |||||||||
| Fair value of investment in joint venture converted into subsidiary |
– | – | 6 | |||||||||
| Total consideration |
11,392 | 3,854 | 12 | |||||||||
210 GSK Annual Report 2020
|
Strategic report
| ||
|
Governance and remuneration
| ||
|
Financial statements
| ||
|
Investor information
|
Notes to the financial statements continued
40. Acquisitions and disposals continued
The non-controlling interest of £3,577 million represents Pfizer’s share of the fair value of the Pfizer consumer healthcare business, excluding goodwill. The total non-controlling interest initially recognised in the Consolidated statement of changes in equity of £6,887 million also includes Pfizer’s share of the book value of GSK Consumer Healthcare.
Business disposals
GSK made a number of business disposals for net cash consideration received in the year of £104 million. The profit on the disposal of the businesses in the year of £201 million was calculated as follows:
| £m | Total £m |
|||||||
| Cash consideration receivable net of subsidy payable |
106 | |||||||
| Net assets disposed: |
||||||||
| Goodwill |
(4 | ) | ||||||
| Intangible assets |
(1 | ) | ||||||
| Property, plant and equipment |
(44 | ) | ||||||
| Inventory |
(7 | ) | ||||||
| Cash and cash equivalents |
(12 | ) | ||||||
| Other net assets |
(4 | ) | ||||||
| (72 | ) | |||||||
| Transaction costs |
(27 | ) | ||||||
| Reclassification of exchange from other comprehensive income |
75 | |||||||
|
Non-controlling interest divested |
16 | |||||||
| 98 | ||||||||
| Transaction signed but not yet completed - gain on embedded derivative |
143 | |||||||
| Transaction signed but not yet completed - transaction costs |
(40 | ) | ||||||
| Total profit on disposal |
201 | |||||||
Transaction signed but not yet completed at 31 December 2019
In December 2018, GSK agreed to divest Horlicks and other Consumer Healthcare nutrition brands to Unilever plc and to form a merger of GlaxoSmithKline Consumer Healthcare Limited with Hindustan Unilever Limited for a total consideration valued at approximately £3.1 billion. GlaxoSmithKline Consumer Healthcare Limited was a public company listed on the National Stock Exchange (NSE) and Bombay Stock Exchange (BSE), in which GSK held a 72.5% stake. Following the merger of GlaxoSmithKline Consumer Healthcare Limited with Hindustan Unilever Limited, a public company listed on the NSE and BSE, GSK would own 133.8 million Hindustan Unilever Limited shares.
The Group entered into forward foreign exchange contracts in relation to the transaction. Contracts with a value of £1.7 billion were designated as a cash flow hedge of part of the foreign exposure arising on the transaction. Further contracts with a value of £0.6 billion were designated as net investment hedges against INR and EUR assets. In addition, the exposure to share price movements in the forward purchase of shares in Hindustan Unilever Limited were recognised as an embedded derivative. The embedded derivative was in an asset position and had a fair value of £240 million at 31 December 2019 (2018 – £100 million).
Associates and joint ventures
During the year, GSK made investments of £27 million into associates and joint ventures of which £11 million was paid in cash.
| Cash flows | Associates | |||||||||||
| and joint | ||||||||||||
| Business | Business | venture | ||||||||||
| acquisitions | disposals | investments | ||||||||||
| £m | £m | £m | ||||||||||
| Cash consideration (paid)/received |
(3,860 | ) | 161 | (11 | ) | |||||||
| Net deferred consideration received |
– | 29 | – | |||||||||
| Transaction costs |
(95 | ) | (73 | ) | – | |||||||
| Cash and cash equivalents acquired/divested |
384 | (13 | ) | – | ||||||||
| Cash (outflow)/inflow |
(3,571 | ) | 104 | (11 | ) | |||||||
GSK Annual Report 2020 211
|
|
||
|
|
Notes to the financial statements continued
2018
Business acquisitions
There were no business acquisitions during 2018.
Business disposals
GSK made a number of small business disposals during the year for a net cash consideration of £2 million.
| Cash flows | Associates | Associates | ||||||||||
| and joint | and joint | |||||||||||
| Business | venture | venture | ||||||||||
| disposals | investments | disposals | ||||||||||
| £m | £m | £m | ||||||||||
| Cash consideration |
2 | (10 | ) | 3 | ||||||||
| Net deferred consideration received |
24 | – | – | |||||||||
| Cash inflow/(outflow) |
26 | (10 | ) | 3 | ||||||||
41. Adjustments reconciling profit after tax to operating cash flows
| 2020 £m |
2019 £m |
2018 £m |
||||||||||
| Profit after tax |
6,388 | 5,268 | 4,046 | |||||||||
| Tax on profits |
580 | 953 | 754 | |||||||||
| Share of after-tax profits of associates and joint ventures |
(33 | ) | (74 | ) | (31 | ) | ||||||
| Finance expense net of finance income |
848 | 814 | 717 | |||||||||
| Depreciation |
1,214 | 1,231 | 954 | |||||||||
| Amortisation of intangible assets |
1,137 | 1,103 | 902 | |||||||||
| Impairment and assets written off |
781 | 825 | 350 | |||||||||
| Profit on sale of businesses |
(2,831 | ) | (201 | ) | (63 | ) | ||||||
| Profit on sale of intangible assets |
(426 | ) | (342 | ) | (201 | ) | ||||||
| Profit on sale of investments in associates |
– | – | (3 | ) | ||||||||
| Profit on sale of equity investments |
(69 | ) | (2 | ) | (4 | ) | ||||||
| Gain on Novartis Consumer Healthcare Joint Venture put option hedging |
– | – | (513 | ) | ||||||||
| Business acquisition costs |
– | 59 | 47 | |||||||||
| Changes in working capital: |
||||||||||||
| Decrease in inventories |
119 | 300 | 51 | |||||||||
| Increase in trade receivables |
(224 | ) | (32 | ) | (429 | ) | ||||||
| Increase in trade payables |
225 | 263 | 131 | |||||||||
| (Increase)/decrease in other receivables |
(159 | ) | (160 | ) | 18 | |||||||
| Contingent consideration paid (see Note 32) |
(765 | ) | (780 | ) | (984 | ) | ||||||
| Other non-cash increase in contingent consideration liabilities |
1,275 | 83 | 1,250 | |||||||||
| Increase in other payables |
818 | 89 | 2,362 | |||||||||
| Increase/(decrease) in pension and other provisions |
400 | (188 | ) | 102 | ||||||||
| Share-based incentive plans |
381 | 365 | 360 | |||||||||
| Fair value adjustments |
464 | 19 | (7 | ) | ||||||||
| Other |
(27 | ) | (61 | ) | (62 | ) | ||||||
| 3,708 | 4,264 | 5,701 | ||||||||||
| Cash generated from operations |
10,096 | 9,532 | 9,747 | |||||||||
212 GSK Annual Report 2020
|
Strategic report
| ||
|
Governance and remuneration
| ||
|
Financial statements
| ||
|
Investor information
|
Notes to the financial statements continued
42. Reconciliation of net cash flow to movement in net debt
| 2020 £m |
2019 £m |
2018 £m |
||||||||||||||||||||||||||
| Net debt, as previously reported |
(25,215 | ) | (21,621 | ) | (13,178 | ) | ||||||||||||||||||||||
| Implementation of IFRS 16 |
– | (1,303 | ) | – | ||||||||||||||||||||||||
| Net debt at beginning of year, as adjusted |
(25,215 | ) | (22,924 | ) | (13,178 | ) | ||||||||||||||||||||||
| Increase in cash and bank overdrafts |
470 | 826 | 479 | |||||||||||||||||||||||||
| Increase/(decrease) in liquid investments |
1 | (1 | ) | – | ||||||||||||||||||||||||
| Increase in long-term loans |
(3,298 | ) | (4,794 | ) | (10,138 | ) | ||||||||||||||||||||||
| Repayment of short-term Notes |
3,738 | 4,160 | 2,067 | |||||||||||||||||||||||||
| Repayment of/(increase in) other short-term loans |
3,567 | (3,095 | ) | (81 | ) | |||||||||||||||||||||||
| Repayment of lease liabilities |
227 | 214 | 28 | |||||||||||||||||||||||||
| Debt of subsidiary undertakings acquired |
– | (524 | ) | – | ||||||||||||||||||||||||
| Exchange adjustments |
(135 | ) | 1,015 | (776 | ) | |||||||||||||||||||||||
| Other non-cash movements |
(135 | ) | (92 | ) | (22 | ) | ||||||||||||||||||||||
| Movement in net debt |
4,435 | (2,291 | ) | (8,443 | ) | |||||||||||||||||||||||
| Net debt at end of year |
(20,780 | ) | (25,215 | ) | (21,621 | ) | ||||||||||||||||||||||
| Analysis of changes in net debt | At 1 January 2020 £m |
Exchange £m |
Other £m |
Profit and loss £m |
Reclass- ifications £m |
Cash flow £m |
At 31 December 2020 £m |
|||||||||||||||||||||
| Liquid investments |
79 | – | – | – | – | (1 | ) | 78 | ||||||||||||||||||||
| Cash and cash equivalents |
4,707 | (44 | ) | – | – | – | 1,629 | 6,292 | ||||||||||||||||||||
| Cash and cash equivalents – AHFS |
507 | – | – | – | – | (507 | ) | – | ||||||||||||||||||||
| Overdrafts |
(383 | ) | 5 | – | – | – | (652 | ) | (1,030 | ) | ||||||||||||||||||
| 4,831 | (39 | ) | – | – | – | 470 | 5,262 | |||||||||||||||||||||
| Debt due within one year: |
||||||||||||||||||||||||||||
| Commercial paper |
(3,586 | ) | (50 | ) | – | – | – | 3,619 | (17 | ) | ||||||||||||||||||
| European/US Medium Term Notes and bank facilities |
(2,658 | ) | 38 | – | – | (3,468 | ) | 3,738 | (2,350 | ) | ||||||||||||||||||
| Lease liabilities |
(240 | ) | (4 | ) | 16 | – | (229 | ) | 227 | (230 | ) | |||||||||||||||||
| Other |
(51 | ) | 12 | (7 | ) | – | – | (52 | ) | (98 | ) | |||||||||||||||||
| (6,535 | ) | (4 | ) | 9 | – | (3,697 | ) | 7,532 | (2,695 | ) | ||||||||||||||||||
| Debt due after one year: |
||||||||||||||||||||||||||||
| European/US Medium Term Notes and bank facilities |
(22,580 | ) | (104 | ) | (4 | ) | (20 | ) | 3,468 | (3,298 | ) | (22,538 | ) | |||||||||||||||
| Lease liabilities |
(1,010 | ) | 19 | (125 | ) | – | 229 | – | (887 | ) | ||||||||||||||||||
| (23,590 | ) | (85 | ) | (129 | ) | (20 | ) | 3,697 | (3,298 | ) | (23,425 | ) | ||||||||||||||||
| Net debt |
(25,215 | ) | (128 | ) | (120 | ) | (20 | ) | – | 4,703 | (20,780 | ) | ||||||||||||||||
| Analysis of changes in liabilities from financing activities |
||||||||||||||||||||||||||||
| Debt due within one year |
(6,535 | ) | (4 | ) | 9 | – | (3,697 | ) | 7,532 | (2,695 | ) | |||||||||||||||||
| Debt due after one year |
(23,590 | ) | (85 | ) | (129 | ) | (20 | ) | 3,697 | (3,298 | ) | (23,425 | ) | |||||||||||||||
| Derivative financial instruments |
335 | – | (643 | ) | 353 | – | (119 | ) | (74 | ) | ||||||||||||||||||
| Other financing items |
– | – | 357 | (357 | ) | – | – | – | ||||||||||||||||||||
| Interest payable |
(244 | ) | 1 | – | (868 | ) | – | 864 | (247 | ) | ||||||||||||||||||
| Total liabilities from financing activities |
(30,034 | ) | (88 | ) | (406 | ) | (892 | ) | – | 4,979 | (26,441 | ) | ||||||||||||||||
| At 1 January 2019 £m |
IFRS 16 Implement- ation £m |
Exchange £m |
Debt acquired £m |
Other £m |
Profit and loss £m |
Reclass- ifications £m |
Cash flow £m |
At 31 December 2019 £m |
||||||||||||||||||||||||||||
| 2019 Analysis of changes in liabilities from financing activities |
|
|||||||||||||||||||||||||||||||||||
| Debt due within one year |
(5,521 | ) | (229 | ) | 348 | (464 | ) | (1 | ) | – | (1,758 | ) | 1,090 | (6,535 | ) | |||||||||||||||||||||
| Debt due after one year |
(20,271 | ) | (1,074 | ) | 755 | (60 | ) | (104 | ) | (27 | ) | 1,758 | (4,567 | ) | (23,590 | ) | ||||||||||||||||||||
| Derivative financial instruments |
129 | – | (1 | ) | – | 188 | 21 | – | (2 | ) | 335 | |||||||||||||||||||||||||
| Other financing items |
– | – | (189 | ) | – | – | – | – | 189 | – | ||||||||||||||||||||||||||
| Interest payable |
(239 | ) | – | 1 | – | (3 | ) | (898 | ) | – | 895 | (244 | ) | |||||||||||||||||||||||
| Total liabilities from financing activities |
(25,902 | ) | (1,303 | ) | 914 | (524 | ) | 80 | (904 | ) | – | (2,395 | ) | (30,034 | ) | |||||||||||||||||||||
For further information on significant changes in net debt see Note 29, ‘Net debt’.
GSK Annual Report 2020 213
|
|
||
|
|
Notes to the financial statements continued
43. Financial instruments and related disclosures
214 GSK Annual Report 2020
|
Strategic report
| ||
|
Governance and remuneration
| ||
|
Financial statements
| ||
|
Investor information
|
Notes to the financial statements continued
43. Financial instruments and related disclosures continued
GSK Annual Report 2020 215
|
|
||
|
|
Notes to the financial statements continued
43. Financial instruments and related disclosures continued
Credit ratings are assigned by Standard and Poor’s and Moody’s respectively. Where the opinions of the two rating agencies differ, GSK assigns the lower rating of the two to the counterparty. Where local rating agency or Fitch data is the only source available, the ratings are converted to global ratings equivalent to those of Standard and Poor’s or Moody’s using published conversion tables. These credit ratings form the basis of the assessment of the expected credit loss on Treasury-related balances held at amortised cost being bank balances and deposits and Government securities.
| 2020 | AAA/Aaa £m |
AA/Aa £m |
A/A £m |
BBB/Baa £m |
BB+/Ba1 and below /unrated £m |
Total £m |
||||||||||||||||||
| Bank balances and deposits |
– | 10 | 2,575 | 368 | 47 | 3,000 | ||||||||||||||||||
| US Treasury and Treasury repo only money market funds |
317 | – | – | – | – | 317 | ||||||||||||||||||
| Liquidity funds |
2,975 | – | – | – | – | 2,975 | ||||||||||||||||||
| Government securities |
– | 77 | – | 1 | – | 78 | ||||||||||||||||||
| 3rd party financial derivatives |
– | – | 134 | 12 | – | 146 | ||||||||||||||||||
| Total |
3,292 | 87 | 2,709 | 381 | 47 | 6,516 | ||||||||||||||||||
| 2019 | AAA/Aaa £m |
AA/Aa £m |
A/A £m |
BBB/Baa £m |
BB+/Ba1 and below /unrated £m |
Total £m |
||||||||||||||||||
| Bank balances and deposits |
– | 538 | 1,906 | 605 | 23 | 3,072 | ||||||||||||||||||
| US Treasury and Treasury repo only money market funds |
102 | – | – | – | – | 102 | ||||||||||||||||||
| Liquidity funds |
2,040 | – | – | – | – | 2,040 | ||||||||||||||||||
| Government securities |
– | 78 | – | 1 | – | 79 | ||||||||||||||||||
| 3rd party financial derivatives |
– | 35 | 225 | 10 | – | 270 | ||||||||||||||||||
| Total |
2,142 | 651 | 2,131 | 616 | 23 | 5,563 | ||||||||||||||||||
216 GSK Annual Report 2020
|
Strategic report
| ||
|
Governance and remuneration
| ||
|
Financial statements
| ||
|
Investor information
|
Notes to the financial statements continued
43. Financial instruments and related disclosures continued
GSK Annual Report 2020 217
|
|
||
|
|
Notes to the financial statements continued
43. Financial instruments and related disclosures continued
| 2020 | 2019 | |||||||||||||||||||
| Notes | Carrying value £m |
Fair value £m |
Carrying value £m |
Fair value £m |
||||||||||||||||
| Financial assets measured at amortised cost: |
||||||||||||||||||||
| Other non-current assets |
b | 37 | 37 | 76 | 76 | |||||||||||||||
| Trade and other receivables |
b | 3,990 | 3,990 | 4,533 | 4,533 | |||||||||||||||
| Liquid investments |
78 | 78 | 79 | 79 | ||||||||||||||||
| Cash and cash equivalents |
3,000 | 3,000 | 3,072 | 3,072 | ||||||||||||||||
| Other items in Assets held for sale |
b | – | – | 69 | 69 | |||||||||||||||
| Financial assets measured at fair value through other comprehensive income (FVTOCI): |
||||||||||||||||||||
| Other investments designated at FVTOCI |
a | 2,939 | 2,939 | 1,781 | 1,781 | |||||||||||||||
| Trade and other receivables |
a,b | 1,942 | 1,942 | 1,665 | 1,665 | |||||||||||||||
| Financial assets mandatorily measured at fair value through profit or loss (FVTPL): |
||||||||||||||||||||
| Other investments |
a | 121 | 121 | 56 | 56 | |||||||||||||||
| Other non-current assets |
a,b | 30 | 30 | 44 | 44 | |||||||||||||||
| Trade and other receivables |
a,b | 46 | 46 | 44 | 44 | |||||||||||||||
| Held for trading derivatives that are not in a designated and effective hedging relationship |
a,d,e | 68 | 68 | 357 | 357 | |||||||||||||||
| Cash and cash equivalents |
a | 3,292 | 3,292 | 2,142 | 2,142 | |||||||||||||||
| Derivatives designated and effective as hedging instruments (fair value movements through Other comprehensive income) |
a,d,e | 89 | 89 | 167 | 167 | |||||||||||||||
| Total financial assets |
15,632 | 15,632 | 14,085 | 14,085 | ||||||||||||||||
| Financial liabilities measured at amortised cost: |
||||||||||||||||||||
| Borrowings excluding obligations under lease liabilities: |
||||||||||||||||||||
| – bonds in a designated hedging relationship |
d | (7,681 | ) | (8,171 | ) | (8,636 | ) | (9,085 | ) | |||||||||||
| – other bonds |
(17,205 | ) | (21,966 | ) | (15,582 | ) | (19,048 | ) | ||||||||||||
| – bank loans and overdrafts |
(1,110 | ) | (1,110 | ) | (416 | ) | (416 | ) | ||||||||||||
| – commercial paper |
(17 | ) | (17 | ) | (3,586 | ) | (3,586 | ) | ||||||||||||
| – other borrowings |
(20 | ) | (20 | ) | (1,038 | ) | (1,038 | ) | ||||||||||||
| Total borrowings excluding lease liabilities |
f | (26,033 | ) | (31,284 | ) | (29,258 | ) | (33,173 | ) | |||||||||||
| Trade and other payables |
c | (14,977 | ) | (14,977 | ) | (14,177 | ) | (14,177 | ) | |||||||||||
| Other provisions |
c | (232 | ) | (232 | ) | (94 | ) | (94 | ) | |||||||||||
| Other non-current liabilities |
c | (72 | ) | (72 | ) | (84 | ) | (84 | ) | |||||||||||
| Other items in Assets held for sale |
c | – | – | (126 | ) | (126 | ) | |||||||||||||
| Financial liabilities mandatorily measured at fair value through profit or loss (FVTPL): |
||||||||||||||||||||
| Contingent consideration liabilities |
a,c | (5,869 | ) | (5,869 | ) | (5,479 | ) | (5,479 | ) | |||||||||||
| Held for trading derivatives that are not in a designated and effective hedging relationship |
a,d,e | (200 | ) | (200 | ) | (141 | ) | (141 | ) | |||||||||||
| Derivatives designated and effective as hedging instruments (fair value movements through Other comprehensive income) |
a,d,e | (31 | ) | (31 | ) | (48 | ) | (48 | ) | |||||||||||
| Total financial liabilities excluding lease liabilities |
(47,414 | ) | (52,665 | ) | (49,407 | ) | (53,322 | ) | ||||||||||||
| Net financial assets and financial liabilities excluding lease liabilities |
(31,782 | ) | (37,033 | ) | (35,322 | ) | (39,237 | ) | ||||||||||||
The valuation methodology used to measure fair value in the above table is described and categorised on page 217.
Trade and other receivables, Other non-current assets, Trade and other payables, Other provisions, Other non-current liabilities, Contingent consideration liabilities and Other items in Assets held for sale are reconciled to the relevant Notes on pages 220 and 221.
At 31 December 2019, Cash and cash equivalents in the table above included £507 million reported in Assets held for sale (see Note 27, ‘Assets held for sale’).
218 GSK Annual Report 2020
|
Strategic report
| ||
|
Governance and remuneration
| ||
|
Financial statements
| ||
|
Investor information
|
Notes to the financial statements continued
43. Financial instruments and related disclosures continued
Fair value of investments in GSK shares
At 31 December 2020, the Employee Share Ownership Plan (ESOP) Trusts held GSK shares with a carrying value of £195 million (2019 – £135 million) and a market value of £657 million (2019 – £647 million) based on quoted market price. The shares are held by the ESOP Trusts to satisfy future exercises of options and awards under employee incentive schemes. In 2020, the carrying value, which is the lower of cost or expected proceeds, of these shares has been recognised as a deduction from other reserves. At 31 December 2020, GSK held Treasury shares at a cost of £4,969 million (2019 – £5,505 million) which has been deducted from retained earnings.
(a) Financial instruments held at fair value
The following tables categorise the Group’s financial assets and liabilities held at fair value by the valuation methodology applied in determining their fair value. Where possible, quoted prices in active markets are used (Level 1). Where such prices are not available, the asset or liability is classified as Level 2, provided all significant inputs to the valuation model used are based on observable market data. If one or more of the significant inputs to the valuation model is not based on observable market data, the instrument is classified as Level 3. Other investments classified as Level 3 in the tables below comprise equity investments in unlisted entities with which the Group has entered into research collaborations and also investments in emerging life science companies.
| At 31 December 2020 | Level 1 £m |
Level 2 £m |
Level 3 £m |
Total £m |
||||||||||||
| Financial assets at fair value |
||||||||||||||||
| Financial assets measured at fair value through other comprehensive income (FVTOCI): |
||||||||||||||||
| Other investments designated at FVTOCI |
2,281 | – | 658 | 2,939 | ||||||||||||
| Trade and other receivables |
– | 1,942 | – | 1,942 | ||||||||||||
| Financial assets mandatorily measured at fair value through profit or loss (FVTPL): |
||||||||||||||||
| Other investments |
– | – | 121 | 121 | ||||||||||||
| Other non-current assets |
– | – | 30 | 30 | ||||||||||||
| Trade and other receivables |
– | 46 | – | 46 | ||||||||||||
| Held for trading derivatives that are not in a designated and effective hedging relationship |
– | 63 | 5 | 68 | ||||||||||||
| Cash and cash equivalents |
3,292 | – | – | 3,292 | ||||||||||||
| Derivatives designated and effective as hedging instruments (fair value movements through OCI) |
– | 89 | – | 89 | ||||||||||||
| 5,573 | 2,140 | 814 | 8,527 | |||||||||||||
| Financial liabilities at fair value |
||||||||||||||||
| Financial liabilities mandatorily measured at fair value through profit or loss (FVTPL): |
||||||||||||||||
| Contingent consideration liabilities |
– | – | (5,869 | ) | (5,869 | ) | ||||||||||
| Held for trading derivatives that are not in a designated and effective hedging relationship |
– | (191 | ) | (9 | ) | (200 | ) | |||||||||
| Derivatives designated and effective as hedging instruments (fair value movements through OCI) |
– | (31 | ) | – | (31 | ) | ||||||||||
| – | (222 | ) | (5,878 | ) | (6,100 | ) | ||||||||||
| At 31 December 2019 | Level 1 £m |
Level 2 £m |
Level 3 £m |
Total £m |
||||||||||||
| Financial assets at fair value |
||||||||||||||||
| Financial assets measured at fair value through other comprehensive income (FVTOCI): |
||||||||||||||||
| Other investments designated at FVTOCI |
1,128 | – | 653 | 1,781 | ||||||||||||
| Trade and other receivables |
– | 1,665 | – | 1,665 | ||||||||||||
| Financial assets mandatorily measured at fair value through profit or loss (FVTPL): |
||||||||||||||||
| Other investments |
– | – | 56 | 56 | ||||||||||||
| Other non-current assets |
– | – | 44 | 44 | ||||||||||||
| Trade and other receivables |
– | 44 | – | 44 | ||||||||||||
| Held for trading derivatives that are not in a designated and effective hedging relationship |
– | 353 | 4 | 357 | ||||||||||||
| Cash and cash equivalents |
2,142 | – | – | 2,142 | ||||||||||||
| Derivatives designated and effective as hedging instruments (fair value movements through OCI) |
– | 167 | – | 167 | ||||||||||||
| 3,270 | 2,229 | 757 | 6,256 | |||||||||||||
| Financial liabilities at fair value |
||||||||||||||||
| Financial liabilities mandatorily measured at fair value through profit or loss (FVTPL): |
||||||||||||||||
| Contingent consideration liabilities |
– | – | (5,479 | ) | (5,479 | ) | ||||||||||
| Held for trading derivatives that are not in a designated and effective hedging relationship |
– | (141 | ) | – | (141 | ) | ||||||||||
| Derivatives designated and effective as hedging instruments (fair value movements through OCI) |
– | (48 | ) | – | (48 | ) | ||||||||||
| – | (189 | ) | (5,479 | ) | (5,668 | ) | ||||||||||
GSK Annual Report 2020 219
|
|
||
|
|
Notes to the financial statements continued
43. Financial instruments and related disclosures continued
Movements in the year for financial instruments measured using Level 3 valuation methods are presented below:
| 2020 £m |
2019 £m |
|||||||
| At 1 January |
(4,722) | (5,532 | ) | |||||
| Net losses recognised in the income statement |
(1,269) | (103 | ) | |||||
| Net gains recognised in other comprehensive income |
160 | 31 | ||||||
| Settlement of contingent consideration liabilities |
885 | 893 | ||||||
| Settlement of contingent consideration receivables |
– | (42 | ) | |||||
| Additions |
126 | 241 | ||||||
| Disposals and settlements |
(172) | (33 | ) | |||||
| Transfers from Level 3 |
(72) | (174 | ) | |||||
| Other movements |
– | (3 | ) | |||||
| At 31 December |
(5,064) | (4,722 | ) | |||||
Net losses of £1,269 million (2019 – £103 million) attributable to Level 3 financial instruments which were recognised in the income statement included net losses of £1,269 million (2019 – £97 million) in respect of financial instruments which were held at the end of the year. Losses of £1,269 million (2019 – £105 million) were reported in Other operating income and gains of £nil (2019 – £2 million) were reported in Finance income. Charges of £1,114 million (2019 – £31 million) arose from remeasurement of the contingent consideration payable for the acquisition of the former Shionogi-ViiV Healthcare joint venture and £161 million (2019 – £67 million) arose from remeasurement of the contingent consideration payable for the acquisition of the Novartis Vaccines business. Net gains of £160 million (2019 – £31 million) attributable to Level 3 financial instruments reported in Other comprehensive income as Fair value movements on equity investments included net gains of £144 million (2019 – net gains of £38 million) in respect of financial instruments held at the end of the year, of which net gains of £39 million (2019 – net gains of £174 million) arose prior to transfer from Level 3 on equity investments which transferred to a Level 1 valuation methodology as a result of listing on a recognised stock exchange during the year. Net gains and losses include the impact of exchange movements.
Financial liabilities measured using Level 3 valuation methods at 31 December included £5,359 million (2019 – £5,103 million) in respect of contingent consideration payable for the acquisition in 2012 of the former Shionogi-ViiV Healthcare joint venture. This consideration is expected to be paid over a number of years and will vary in line with the future performance of specified products and movements in certain foreign currencies. They also included £477 million (2019 – £339 million) in respect of contingent consideration for the acquisition in 2015 of the Novartis Vaccines business. This consideration is expected to be paid over a number of years and will vary in line with the future performance of specified products, the achievement of certain milestone targets and movements in certain foreign currencies. Sensitivity analysis on these balances is provided in Note 32, ‘Contingent consideration liabilities’.
(b) Trade and other receivables, Other non-current assets and other items in Assets held for sale in scope of IFRS 9
The following table reconciles financial instruments within Trade and other receivables, Other non-current assets and other items in Assets held for sale which fall within the scope of IFRS 9 to the relevant balance sheet amounts. The financial assets are predominantly non-interest earning. Non-financial instruments include tax receivables, pension surplus balances and prepayments, which are outside the scope of IFRS 9.
| 2020 |
2019 |
|||||||||||||||||||||||||||||||||||||||||||||||
| At FVTPL £m |
At FVTOCI £m |
Amortised cost £m |
Financial instruments £m |
Non- financial instruments £m |
Total £m |
At FVTPL £m |
At FVTOCI £m |
Amortised cost £m |
Financial instruments £m |
Non- financial instruments £m |
Total £m |
|||||||||||||||||||||||||||||||||||||
| Trade and other receivables (Note 25) |
46 | 1,942 | 3,990 | 5,978 | 974 | 6,952 | 44 | 1,665 | 4,533 | 6,242 | 960 | 7,202 | ||||||||||||||||||||||||||||||||||||
| Other non-current assets (Note 23) |
30 | – | 37 | 67 | 974 | 1,041 | 44 | – | 76 | 120 | 900 | 1,020 | ||||||||||||||||||||||||||||||||||||
| Other items in Assets held for sale (Note 27) |
– | – | – | – | – | – | – | – | 69 | 69 | 22 | 91 | ||||||||||||||||||||||||||||||||||||
| 76 | 1,942 | 4,027 | 6,045 | 1,948 | 7,993 | 88 | 1,665 | 4,678 | 6,431 | 1,882 | 8,313 | |||||||||||||||||||||||||||||||||||||
Trade and other receivables include trade receivables of £5,549 million (2019 – £5,487 million). The Group has portfolios in each of the three business models under IFRS 9 due to factoring arrangements in place: £46 million (2019 – £44 million) is held to sell the contractual cash flows and is measured at FVTPL, £1,942 million (2019 – £1,665 million) is held to either collect or sell the contractual cash flows and is measured at FVTOCI and £3,561 million (2019 – £3,778 million) is held to collect the contractual cash flows and is measured at amortised cost. At 31 December 2019, Other items in Assets held for sale included £44 million of trade receivables measured at amortised cost.
220 GSK Annual Report 2020
|
Strategic report
| ||
|
Governance and remuneration
| ||
|
Financial statements
| ||
|
Investor information
|
Notes to the financial statements continued
43. Financial instruments and related disclosures continued
(c) Trade and other payables, Other provisions, Other non-current liabilities, Contingent consideration liabilities and other items in Assets held for sale in scope of IFRS 9
The following table reconciles financial instruments within Trade and other payables, Other provisions, Other non-current liabilities, Contingent consideration liabilities and other items in Assets held for sale which fall within the scope of IFRS 9 to the relevant balance sheet amounts. The financial liabilities are predominantly non-interest bearing. Accrued wages and salaries are included within financial liabilities. Non-financial instruments include payments on account, tax and social security payables and provisions which do not arise from contractual obligations to deliver cash or another financial asset, which are outside the scope of IFRS 9.
| 2020 | 2019 | |||||||||||||||||||||||||||||||||||||||
| At FVTPL £m |
Amortised cost £m |
Financial instruments £m |
Non- financial instruments £m |
Total £m |
At FVTPL £m |
Amortised cost £m |
Financial instruments £m |
Non- financial instruments £m |
Total £m |
|||||||||||||||||||||||||||||||
| Trade and other payables |
– | (14,977 | ) | (14,977 | ) | (863 | ) | (15,840 | ) | – | (14,177 | ) | (14,177 | ) | (762 | ) | (14,939 | ) | ||||||||||||||||||||||
| Other provisions |
– | (232 | ) | (232 | ) | (1,527 | ) | (1,759 | ) | – | (94 | ) | (94 | ) | (1,197 | ) | (1,291 | ) | ||||||||||||||||||||||
| Other non-current liabilities |
– | (72 | ) | (72 | ) | (731 | ) | (803 | ) | – | (84 | ) | (84 | ) | (760 | ) | (844 | ) | ||||||||||||||||||||||
| Contingent consideration liabilities |
(5,869) | – | (5,869 | ) | – | (5,869 | ) | (5,479 | ) | – | (5,479 | ) | – | (5,479 | ) | |||||||||||||||||||||||||
| Other items in Assets held for sale |
– | – | – | – | – | – | (126 | ) | (126 | ) | (87 | ) | (213 | ) | ||||||||||||||||||||||||||
| (5,869) | (15,281 | ) | (21,150 | ) | (3,121 | ) | (24,271 | ) | (5,479 | ) | (14,481 | ) | (19,960 | ) | (2,806 | ) | (22,766 | ) | ||||||||||||||||||||||
(d) Derivative financial instruments and hedging programmes
Derivatives are only used for economic hedging purposes and not as speculative investments and are classified as ‘held for trading’, other than designated and effective hedging instruments, and are presented as current assets or liabilities if they are expected to be settled within 12 months after the end of the reporting period, otherwise they are classified as non-current. The Group has the following derivative financial instruments:
| 2020 Fair value |
2019 Fair value |
|||||||||||||||||||
|
Assets £m |
Liabilities £m |
Assets £m |
Liabilities £m |
|||||||||||||||||
| Non-current |
||||||||||||||||||||
| Cash flow hedges – Interest rate swap
contracts |
– | – | 1 | – | ||||||||||||||||
| Net investment hedges – Cross currency swaps |
– | – | 98 | – | ||||||||||||||||
| Current |
||||||||||||||||||||
| Cash flow hedges – Interest rate swap
contracts |
– | (1 | ) | – | (1 | ) | ||||||||||||||
| Net investment hedges – Cross currency swaps |
– | (18 | ) | – | – | |||||||||||||||
| Cash flow hedges – Foreign exchange contracts |
– | – | 24 | (17 | ) | |||||||||||||||
| Net investment hedges
– Foreign exchange contracts |
89 | (12 | ) | 44 | (30 | ) | ||||||||||||||
|
Derivatives designated and effective as hedging instruments |
89 | (31 | ) | 167 | (48 | ) | ||||||||||||||
|
Non-current |
||||||||||||||||||||
| Embedded and other derivatives |
5 | (10 | ) | 4 | (1 | ) | ||||||||||||||
| Current |
||||||||||||||||||||
| Foreign exchange contracts |
57 | (190 | ) | 103 | (140 | ) | ||||||||||||||
| Embedded and other derivatives |
6 | – | 250 | – | ||||||||||||||||
|
Derivatives classified as held for trading |
68 | (200 | ) | 357 | (141 | ) | ||||||||||||||
|
Total derivative instruments |
157 | (231 | ) | 524 | (189 | ) | ||||||||||||||
Fair value hedges
At 31 December 2020 and 31 December 2019, the Group had no designated fair value hedges.
GSK Annual Report 2020 221
|
|
||
|
|
Notes to the financial statements continued
43. Financial instruments and related disclosures continued
Net investment hedges
At 31 December 2020, certain foreign exchange contracts were designated as net investment hedges in respect of the foreign currency translation risk arising on consolidation of the Group’s net investment in its European (Euro), Singaporean (SGD) and Japanese (JPY) foreign operations as shown in the table above.
The carrying value of bonds on page 218 included £7,681 million (2019 – £8,636 million) that were designated as hedging instruments in net investment hedges.
Cash flow hedges
During 2018, 2019 and 2020, the Group entered into forward foreign exchange contracts which have been designated as cash flow hedges. These were entered into to hedge the foreign exchange exposure arising on cash flows from Euro denominated coupon payments relating to notes issued under the Group’s European Medium Term Note programme, on the buyout of Novartis’ non-controlling interest in the Consumer Healthcare Joint Venture in 2018, on the divestment of Horlicks and other nutrition brands which took place in 2020 and on refinancing existing debt maturities.
The Group manages its cash flow interest rate risk by using floating-to-fixed interest rate swaps. In addition, the Group carries a balance in reserves that arose from pre-hedging fluctuations in long-term interest rates when pricing bonds issued in prior years and in the current year. The balance is reclassified to finance costs over the life of these bonds.
Foreign exchange risk
In the current year, the Group has designated certain foreign exchange forward contracts and swaps as cash flow and net investment hedges. Foreign exchange derivative financial assets and liabilities are presented in the line ‘Derivative financial instruments’ (either as assets or liabilities) on the Consolidated balance sheet. The following tables detail the foreign exchange forward contracts and swaps outstanding at the end of the reporting period, as well as information on the related hedged items. The notional value of foreign exchange forward contracts and swaps is the absolute total of outstanding positions at the balance sheet date.
Hedge effectiveness is determined at the inception of the hedge relationship, and through periodic prospective effectiveness assessments to ensure that an economic relationship exists between the hedged item and hedging instrument. The Group enters into hedge relationships where the critical terms of the hedging instrument match exactly with the terms of the hedged item, and so a qualitative assessment of effectiveness is performed. If changes in circumstances affect the terms of the hedged item such that the critical terms no longer match exactly with the critical terms of the hedging instrument, the Group uses the hypothetical derivative method to assess effectiveness.
The main source of hedge ineffectiveness in these hedging relationships is the effect of the counterparty and the Group’s own credit risk on the fair value of the foreign exchange forward contracts and swaps, which is not reflected in the fair value of the hedged item attributable to changes in foreign exchange rates and ineffectiveness on rolling the cash flow hedges of the divestments mentioned above. No other sources of ineffectiveness emerged from these hedging relationships. Ineffectiveness to be recorded from cash flow hedges amounted to a gain of £7 million in 2020 (2019 – loss of £7 million). No ineffectiveness was recorded from net investment hedges (2019 – £nil).
Included in the table below under ‘Borrowings’ are bonds with notional value of US$750 million that have been swapped to fixed interest rate EUR debt with a cross currency interest rate swap.
| 2020 | ||||||||||||||||
| Hedging instruments | Average exchange rate |
Foreign currency |
Notional value £m |
Carrying value £m |
||||||||||||
| Cash flow hedges |
||||||||||||||||
| Foreign exchange contracts
Buy foreign currency: |
||||||||||||||||
| 3 to 6 months |
1.12 | EUR | 24 | 0.1 | ||||||||||||
| 24 | 0.1 | |||||||||||||||
222 GSK Annual Report 2020
|
Strategic report
| ||
|
Governance and remuneration
| ||
|
Financial statements
| ||
|
Investor information
|
Notes to the financial statements continued
43. Financial instruments and related disclosures continued
| 2020 | ||||||||||||||
| Hedging instruments | Average exchange rate |
Foreign currency |
Notional value £m |
Carrying value £m |
||||||||||
| Net investment hedges |
||||||||||||||
| Foreign exchange contracts |
||||||||||||||
| Sell foreign currency: |
||||||||||||||
| Less than 3 months |
1.10 | EUR | 9,663 |
60 | ||||||||||
| Less than 3 months |
1.79 | SGD | 1,387 |
13 | ||||||||||
| Less than 3 months |
139.41 | JPY | 143 |
4 | ||||||||||
| Borrowings (including cross currency interest rate swaps): |
||||||||||||||
| 3 to 6 months |
EUR | 549 |
(550 | ) | ||||||||||
| Over 6 months |
EUR | 7,117 | (7,131 | ) | ||||||||||
| 18,859 | (7,604 | ) | ||||||||||||
| 2020 | ||||||||||||||
| Hedged items |
Periodic change in value for calculating hedge ineffectiveness £m |
Cumulative balance in cash flow hedge reserve/foreign currency translation reserve for continuing hedges £m |
||||||||||||
| Cash flow hedges |
||||||||||||||
| Variability in cash flows from a highly probable forecast transaction |
– | – | ||||||||||||
| Variability in cash flows from foreign exchange exposure arising on |
– | – | ||||||||||||
| Net investment hedges |
||||||||||||||
| Net investment in foreign operations |
903 | (1,983 | ) | |||||||||||
There are no balances in the cash flow hedge reserve arising from hedging relationships for which hedge accounting is no longer applied.
| 2019 | ||||||||||||||||
| Hedging instruments | Average exchange rate |
Foreign currency |
Notional value £m |
Carrying value £m |
||||||||||||
| Cash flow hedges |
||||||||||||||||
| Foreign exchange contracts |
||||||||||||||||
| Buy foreign currency: |
||||||||||||||||
| 3 to 6 months |
1.14 | EUR | 47 | (1 | ) | |||||||||||
| Over 6 months |
1.15 | EUR | 23 | – | ||||||||||||
| Sell foreign currency: |
||||||||||||||||
| Less than 3 months |
93.85 | INR/GBP | 999 | 5 | ||||||||||||
| Less than 3 months |
52.82 | INR/SGD | 677 | 3 | ||||||||||||
| 1,746 | 7 | |||||||||||||||
| Net investment hedges |
||||||||||||||||
| Foreign exchange contracts |
||||||||||||||||
| Sell foreign currency: |
||||||||||||||||
| Less than 3 months |
1.18 | EUR | 8,250 | 2 | ||||||||||||
| Less than 3 months |
1.77 | SGD | 471 | 3 | ||||||||||||
| Less than 3 months |
92.23 | INR | 239 | 6 | ||||||||||||
| Less than 3 months |
142.26 | JPY | 416 | 3 | ||||||||||||
| Borrowings (including cross currency interest rate swaps): |
||||||||||||||||
| 3 to 6 months |
EUR | 638 | (638 | ) | ||||||||||||
| Over 6 months |
EUR | 7,914 | (7,998 | ) | ||||||||||||
| 17,928 | (8,622 | ) | ||||||||||||||
GSK Annual Report 2020 223
|
|
||
|
|
Notes to the financial statements continued
43. Financial instruments and related disclosures continued
| 2019 | ||||||||
| Hedged items |
Periodic change in value £m |
Cumulative balance in cash £m |
||||||
| Cash flow hedges |
||||||||
| Variability in cash flows from a highly probable forecast transaction |
(7 | ) | (42 | ) | ||||
| Variability in cash flows from foreign exchange exposure arising on |
(1 | ) | 1 | |||||
| Net investment hedges |
||||||||
| Net investment in European foreign operations |
(987 | ) | (1,080 | ) | ||||
There are no balances in the cash flow hedge reserve arising from hedging relationships for which hedge accounting is no longer applied.
The following table details the effectiveness of the hedging relationships and the amounts reclassified from the hedging reserve to profit or loss:
| 2020 | ||||||||||||||||||||||||
| Amount reclassified to profit or loss | ||||||||||||||||||||||||
| Hedging gains/(losses) recognised in reserves £m |
Amount of hedge |
Line item in profit or loss in which hedge
|
Hedged no longer £m |
As hedged £m |
Line item in which is included
|
|||||||||||||||||||
| Cash flow hedges |
||||||||||||||||||||||||
| Variability in cash flows from a highly probable forecast transaction |
(15 | ) | 7 | |
Other operating income/ (expense) |
|
– | 51 | |
Other operating income/ (expense) |
| |||||||||||||
| Variability in cash flows from foreign
exchange exposure arising on |
– | – | |
Finance income/ (expense) |
|
– | – | |
Finance income/ (expense) |
| ||||||||||||||
| Net investment hedges |
||||||||||||||||||||||||
| Net investment in foreign operations |
(903 | ) | – | |
Finance income/ (expense) |
|
– | – | |
Finance income/ (expense) |
| |||||||||||||
The following table details the effectiveness of the hedging relationships and the amounts reclassified from the hedging reserve to profit or loss:
| 2019 | ||||||||||||||||||||||||
| Amount reclassified to profit or loss | ||||||||||||||||||||||||
| Hedging gains/(losses) recognised in reserves £m |
Amount of hedge ineffectiveness recognised in profit or loss £m |
Line item in profit or loss in which hedge ineffectiveness is included
|
Hedged future cash flows no longer expected to occur £m |
As hedged item affects profit or loss £m |
Line item in which is included
|
|||||||||||||||||||
| Cash flow hedges |
||||||||||||||||||||||||
| Variability in cash flows from a highly probable forecast transaction |
– | (7 | ) | |
Other operating income/ (expense) |
|
– | – | |
Other operating income/ (expense) |
| |||||||||||||
| Variability in cash flows from foreign
exchange exposure arising on |
1 | – | |
Finance income/ (expense) |
|
– | – | |
Finance income/ (expense) |
| ||||||||||||||
| Net investment hedges |
||||||||||||||||||||||||
| Net investment in foreign operations |
987 | – | |
Finance income/ (expense) |
|
– | – | |
Finance income/ (expense) |
| ||||||||||||||
224 GSK Annual Report 2020
|
Strategic report
| ||
|
Governance and remuneration
| ||
|
Financial statements
| ||
|
Investor information
|
Notes to the financial statements continued
43. Financial instruments and related disclosures continued
Interest rate risk
The Group manages its cash flow interest rate risk by using floating-to-fixed interest rate swaps, where at quarterly intervals the difference between fixed contract rates and floating rate interest amounts calculated by reference to the agreed notional principal amounts are exchanged.
The interest rate swap contracts, exchanging floating rate interest for fixed interest, have been designated as cash flow hedges to hedge the variability of the interest cash flows associated with floating rate debt relating to notes issued under the Group’s European Medium Term Note programme. The interest rate swaps and the interest payments on the loan occur simultaneously and the amount accumulated in equity is reclassified to profit or loss over the period that the floating rate interest payments affect profit or loss.
The critical terms of the interest rate swap contracts and their corresponding hedged items are the same. A qualitative assessment of effectiveness is performed and it is expected that the value of the interest rate swap contracts and the value of the corresponding hedged items will systematically change in opposite directions in response to movements in the underlying interest rates. The main sources of ineffectiveness in these hedge relationships are the effects of the Group’s own credit risk on the fair value of the interest rate swap contracts, which are not reflected in the fair value of the hedged item attributable to the change in interest rates. No other sources of ineffectiveness emerged from these hedging relationships.
The following tables provide information regarding interest rate swap contracts outstanding and the related hedged items at 31 December 2020 and 31 December 2019. Interest rate swap contract assets and liabilities are presented in the line ‘Derivative financial instruments’ (either as assets or liabilities) on the Consolidated balance sheet.
| 2020 | ||||||||||||||||
|
|
|
|||||||||||||||
| Hedging instruments |
Average % |
Notional principal value £m |
Change in fair value for |
Fair
value £m |
||||||||||||
| Less than 1 year |
0.17 | 1,449 | 3 | (19 | ) | |||||||||||
| 1 to 2 years |
– | – | – | – | ||||||||||||
| 2020 | ||||||||||||||||
|
|
|
|||||||||||||||
| Hedged items | Change in value used for |
Balance in cash £m |
||||||||||||||
| Variable rate borrowings |
(3 | ) | 1 | |||||||||||||
| 2019 | ||||||||||||||||
|
|
|
|||||||||||||||
| Hedging instruments | Average % |
Notional principal value £m |
Change in fair value for |
Fair
value £m |
||||||||||||
| Less than 1 year |
0.11 | 637 | – | (1 | ) | |||||||||||
| 1 to 2 years |
0.13 | 1,418 | (6 | ) | 33 | |||||||||||
| 2019 | ||||||||||||||||
|
|
|
|||||||||||||||
| Hedged items | Change in value used for calculating hedge ineffectiveness £m |
Balance in cash £m |
||||||||||||||
| Variable rate borrowings |
6 | 4 | ||||||||||||||
GSK Annual Report 2020 225
|
|
||
|
|
Notes to the financial statements continued
43. Financial instruments and related disclosures continued
The following table details the effectiveness of the hedging relationships and the amounts reclassified from the hedging reserve to profit or loss:
| 2020 | ||||||||||||||||||||||||
|
|
|
|||||||||||||||||||||||
| Amount reclassified to profit or loss | ||||||||||||||||||||||||
|
Hedging £m |
Amount of hedge |
Line item in profit or loss in which hedge
|
Hedged no longer £m |
As hedged item affects profit or loss £m |
Line item in which
|
|||||||||||||||||||
| Cash flow hedges |
||||||||||||||||||||||||
| Variability in cash flows |
3 | – | |
Finance income/ (expense) |
|
– | – | |
Finance income/ (expense) |
| ||||||||||||||
|
Pre-hedging of long-term interest rates |
(7 | ) | – | |
Finance income/ (expense) |
|
– | 3 | |
Finance income/ (expense) |
| |||||||||||||
| 2019 | ||||||||||||||||||||||||
|
|
|
|||||||||||||||||||||||
| Amount reclassified to profit or loss | ||||||||||||||||||||||||
|
Hedging £m |
Amount of hedge |
Line item in profit or loss in which hedge
|
Hedged no longer £m |
As hedged item affects profit or loss £m |
Line item in which
|
|||||||||||||||||||
| Cash flow hedges |
||||||||||||||||||||||||
| Variability in cash flows |
(7 | ) | – | |
Finance income/ (expense) |
|
– | (2 | ) | |
Finance income/ (expense) |
| ||||||||||||
|
Pre-hedging of long-term interest rates |
(12 | ) | – | |
Finance income/ (expense) |
|
– | 3 | |
Finance income/ (expense) |
| |||||||||||||
(e) Offsetting of financial assets and liabilities
Financial assets and liabilities are offset and the net amount reported in the balance sheet where there is a legally enforceable right to offset the recognised amounts, and there is an intention to settle on a net basis or realise the asset and settle the liability simultaneously. There are also arrangements that do not meet the criteria for offsetting but still allow for the related amounts to be offset in certain circumstances, such as bankruptcy or the termination of a contract.
The following tables set out the financial assets and liabilities that are offset, or subject to enforceable master netting arrangements and other similar agreements but not offset, as at 31 December 2020 and 31 December 2019. The column ‘Net amount’ shows the impact on the Group’s balance sheet if all offset rights were exercised.
| At 31 December 2020 | Gross financial assets/ (liabilities) £m |
Financial £m |
Net financial assets/ (liabilities) £m |
Related £m |
Net amount £m |
|||||||||||||||
| Financial assets |
||||||||||||||||||||
| Trade and other receivables |
5,997 | (19 | ) | 5,978 | (28 | ) | 5,950 | |||||||||||||
| Derivative financial instruments |
157 | – | 157 | (142 | ) | 15 | ||||||||||||||
| Financial liabilities |
||||||||||||||||||||
| Trade and other payables |
(14,996 | ) | 19 | (14,977 | ) | 28 | (14,949 | ) | ||||||||||||
| Derivative financial instruments |
(231 | ) | – | (231 | ) | 142 | (89 | ) | ||||||||||||
226 GSK Annual Report 2020
|
Strategic report
| ||
|
Governance and remuneration
| ||
|
Financial statements
| ||
|
Investor information
|
Notes to the financial statements continued
43. Financial instruments and related disclosures continued
| At 31 December 2019 |
Gross |
Financial £m |
Net financial assets/ (liabilities) £m |
Related £m |
Net balance £m |
|||||||||||||||
| Financial assets |
||||||||||||||||||||
| Trade and other receivables |
6,246 | (4 | ) | 6,242 | (62 | ) | 6,180 | |||||||||||||
| Derivative financial instruments |
524 | – | 524 | (131 | ) | 393 | ||||||||||||||
| Financial liabilities |
||||||||||||||||||||
| Trade and other payables |
(14,181 | ) | 4 | (14,177 | ) | 62 | (14,115 | ) | ||||||||||||
| Derivative financial instruments |
(189 | ) | – | (189 | ) | 131 | (58 | ) | ||||||||||||
Amounts which do not meet the criteria for offsetting on the balance sheet but could be settled net in certain circumstances principally relate to derivative transactions under ISDA (International Swaps and Derivatives Association) agreements where each party has the option to settle amounts on a net basis in the event of default of the other party. As there is presently not a legally enforceable right of offset, these amounts have not been offset in the balance sheet, but have been presented separately in the table above.
(f) Debt interest rate repricing table
The following table sets out the exposure of the Group to interest rates on debt, including commercial paper. The maturity analysis of fixed rate debt is stated by contractual maturity and of floating rate debt by interest rate repricing dates. For the purpose of this table, debt is defined as all classes of borrowings other than lease liabilities.
| 2020 | 2019 | |||||||
| Total debt £m |
Total £m |
|||||||
| Floating and fixed rate debt less than one year |
(3,495 | ) | (6,678 | ) | ||||
| Between one and two years |
(2,561 | ) | (3,235 | ) | ||||
| Between two and three years |
(4,061 | ) | (2,643 | ) | ||||
| Between three and four years |
(1,622 | ) | (2,308 | ) | ||||
| Between four and five years |
(1,398 | ) | (1,595 | ) | ||||
| Between five and ten years |
(5,981 | ) | (5,904 | ) | ||||
| Greater than ten years |
(6,915 | ) | (6,895 | ) | ||||
| Total |
(26,033 | ) | (29,258 | ) | ||||
| Original issuance profile: |
||||||||
| Fixed rate interest |
(23,002 | ) | (21,763 | ) | ||||
| Floating rate interest |
(3,031 | ) | (7,495 | ) | ||||
| (26,033 | ) | (29,258 | ) | |||||
GSK Annual Report 2020 227
|
|
||
|
|
Notes to the financial statements continued
43. Financial instruments and related disclosures continued
(g) Sensitivity analysis
The tables below illustrate the estimated impact on the income statement and equity as a result of hypothetical market movements in foreign exchange and interest rates in relation to the Group’s financial instruments. The range of variables chosen for the sensitivity analysis reflects management’s view of changes which are reasonably possible over a one-year period.
Foreign exchange sensitivity
The Group operates internationally and is primarily exposed to foreign exchange risk in relation to Sterling against movements in US Dollar, Euro and Japanese Yen. Foreign exchange risk arises from the translation of financial assets and liabilities which are not in the functional currency of the entity that holds them. Based on the Group’s net financial assets and liabilities as at 31 December, a weakening and strengthening of Sterling against these currencies, with all other variables held constant, is illustrated in the tables below. The tables exclude financial instruments that expose the Group to foreign exchange risk where this risk is fully hedged with another financial instrument.
| 2020 | 2019 | |||||||
| Income statement impact of non-functional currency foreign exchange exposures |
Increase/(decrease) in income £m |
Increase/(decrease) in £m |
||||||
| 10 cent appreciation of the US Dollar |
20 | 3 | ||||||
| 10 cent appreciation of the Euro |
(25 | ) | (29 | ) | ||||
| 10 yen appreciation of the Yen |
(1 | ) | – | |||||
| 2020 | 2019 | |||||||
| Income statement impact of non-functional currency foreign exchange exposures | Increase/(decrease) in income £m |
Increase/(decrease)
in £m |
||||||
| 10 cent depreciation of the US Dollar |
(17 | ) | (3 | ) | ||||
| 10 cent depreciation of the Euro |
21 | 25 | ||||||
| 10 yen depreciation of the Yen |
1 | – | ||||||
|
The equity impact, shown below, for foreign exchange sensitivity relates to derivative and non-derivative financial instruments hedging the Group’s net investments in its European (Euro) foreign operations and cash flow hedges of its foreign exchange exposure arising on Euro denominated coupon payments relating to notes issued under the Group’s European Medium Term Note programme.
|
| |||||||
| 2020 | 2019 | |||||||
| Equity impact of non-functional currency foreign exchange exposures |
Increase/(decrease) in equity £m |
Increase/(decrease) in £m |
||||||
| 10 cent appreciation of the Euro |
(1,711 | ) | (1,561 | ) | ||||
| 2020 | 2019 | |||||||
| Equity impact of non-functional currency foreign exchange exposures | Increase/(decrease) in equity £m |
Increase/(decrease)
in £m |
||||||
| 10 cent depreciation of the Euro |
1,429 | 1,316 | ||||||
228 GSK Annual Report 2020
|
Strategic report
| ||
|
Governance and remuneration
| ||
|
Financial statements
| ||
|
Investor information
|
Notes to the financial statements continued
43. Financial instruments and related disclosures continued
The tables below present the Group’s sensitivity to a weakening and strengthening of Sterling against the relevant currency based on the composition of net debt as shown in Note 29 adjusted for the effects of foreign exchange derivatives that are not part of net debt but affect future foreign currency cash flows.
| 2020 | 2019 | |||||||
| Impact of foreign exchange movements on net debt |
(Increase)/decrease in net debt £m |
(Increase)/decrease £m |
||||||
| 10 cent appreciation of the US Dollar |
(782 | ) | (1,051 | ) | ||||
| 10 cent appreciation of the Euro |
286 | 74 | ||||||
| 10 yen appreciation of the Yen |
23 | (5 | ) | |||||
| 2020 | 2019 | |||||||
| Impact of foreign exchange movements on net debt | (Increase)/decrease in net debt £m |
(Increase)/decrease in net debt £m |
||||||
| 10 cent depreciation of the US Dollar |
675 | 903 | ||||||
| 10 cent depreciation of the Euro |
(239 | ) | (63 | ) | ||||
| 10 yen depreciation of the Yen |
(20 | ) | 5 | |||||
Interest rate sensitivity
The Group is exposed to interest rate risk on its outstanding borrowings and investments where any changes in interest rates will affect future cash flows or the fair values of financial instruments.
The majority of debt is issued at fixed interest rates and changes in the floating rates of interest do not significantly affect the Group’s net interest charge, although the majority of cash and liquid investments earn floating rates of interest.
The table below hypothetically shows the Group’s sensitivity to changes in interest rates in relation to Sterling, US Dollar and Euro floating rate financial assets and liabilities. If the interest rates applicable to floating rate financial assets and liabilities were to have increased by 1% (100 basis points), and assuming other variables had remained constant, it is estimated that the Group’s finance income for 2020 would have increased by approximately £14 million (2019 – £9 million decrease). A 1% (100 basis points) movement in interest rates is not deemed to have a material effect on equity.
| 2020 | 2019 | |||||||
| Income statement impact of interest rate movements |
Increase/(decrease) in income £m |
Increase/(decrease) in income £m |
||||||
| 1% (100 basis points) increase in Sterling interest rates |
8 | 14 | ||||||
| 1% (100 basis points) increase in US Dollar interest rates |
28 | (4 | ) | |||||
| 1% (100 basis points) increase in Euro interest rates |
(22) | (19 | ) | |||||
GSK Annual Report 2020 229
|
|
||
|
|
Notes to the financial statements continued
43. Financial instruments and related disclosures continued
(h) Contractual cash flows for non-derivative financial liabilities and derivative instruments
The following tables provide an analysis of the anticipated contractual cash flows including interest payable for the Group’s non-derivative financial liabilities on an undiscounted basis. For the purpose of this table, debt is defined as all classes of borrowings except for lease liabilities. Interest is calculated based on debt held at 31 December without taking account of future issuance. Floating rate interest is estimated using the prevailing interest rate at the balance sheet date. Cash flows in foreign currencies are translated using spot rates at 31 December.
| At 31 December 2020 | Debt £m |
Interest on debt £m |
Lease liabilities £m |
Finance on lease £m |
Trade payables and other liabilities not in net debt £m |
Total £m |
||||||||||||||||||
| Due in less than one year |
(3,493) | (725 | ) | (230 | ) | (34 | ) | (15,783 | ) | (20,265 | ) | |||||||||||||
| Between one and two years |
(2,566) | (686 | ) | (207 | ) | (28 | ) | (995 | ) | (4,482 | ) | |||||||||||||
| Between two and three years |
(4,078) | (621 | ) | (126 | ) | (22 | ) | (897 | ) | (5,744 | ) | |||||||||||||
| Between three and four years |
(1,632) | (576 | ) | (96 | ) | (18 | ) | (867 | ) | (3,189 | ) | |||||||||||||
| Between four and five years |
(1,407) | (539 | ) | (86 | ) | (15 | ) | (883 | ) | (2,930 | ) | |||||||||||||
| Between five and ten years |
(6,018) | (2,177 | ) | (239 | ) | (47 | ) | (3,169 | ) | (11,650 | ) | |||||||||||||
| Greater than ten years |
(6,997) | (2,985 | ) | (133 | ) | (16 | ) | (1,529 | ) | (11,660 | ) | |||||||||||||
| Gross contractual cash flows |
(26,191) | (8,309 | ) | (1,117 | ) | (180 | ) | (24,123 | ) | (59,920 | ) | |||||||||||||
| At 31 December 2019 | Debt £m |
Interest on debt £m |
Lease liabilities £m |
Finance charge on liabilities £m |
Trade
payables liabilities not in net debt £m |
Total £m |
||||||||||||||||||
| Due in less than one year |
(6,678) | (780 | ) | (240 | ) | (41 | ) | (14,952 | ) | (22,691 | ) | |||||||||||||
| Between one and two years |
(3,232) | (742 | ) | (227 | ) | (36 | ) | (912 | ) | (5,149 | ) | |||||||||||||
| Between two and three years |
(2,651) | (667 | ) | (119 | ) | (30 | ) | (806 | ) | (4,273 | ) | |||||||||||||
| Between three and four years |
(2,318) | (600 | ) | (105 | ) | (23 | ) | (835 | ) | (3,881 | ) | |||||||||||||
| Between four and five years |
(1,607) | (559 | ) | (93 | ) | (19 | ) | (799 | ) | (3,077 | ) | |||||||||||||
| Between five and ten years |
(5,946) | (2,276 | ) | (296 | ) | (52 | ) | (3,131 | ) | (11,701 | ) | |||||||||||||
| Greater than ten years |
(6,976) | (3,328 | ) | (170 | ) | (22 | ) | (984 | ) | (11,480 | ) | |||||||||||||
| Gross contractual cash flows |
(29,408) | (8,952 | ) | (1,250 | ) | (223 | ) | (22,419 | ) | (62,252 | ) | |||||||||||||
The table below provides an analysis of the anticipated contractual cash flows for the Group’s derivative instruments excluding equity options which do not give rise to cash flows, and other embedded derivatives, which are not material, using undiscounted cash flows. Cash flows in foreign currencies are translated using spot rates at 31 December. The gross cash flows of foreign exchange contracts are presented for the purpose of this table although, in practice, the Group uses standard settlement arrangements to reduce its liquidity requirements on these instruments.
Cash flows on interest rate swaps are not shown in the table below as they are not significant.
| 2020 | 2019 | |||||||||||||||||||||||||||||||||||||||||
| Gross cash inflows | Gross cash ouflows | Gross cash inflows | Gross cash outflows | |||||||||||||||||||||||||||||||||||||||
| Cross currency interest rate swaps |
Foreign exchange forward contracts and swaps |
Cross swaps |
Foreign exchange forward contracts and swaps |
Cross currency interest rate swaps |
Foreign exchange forward contracts and swaps |
Cross currency interest rate swaps |
Foreign and swaps |
|||||||||||||||||||||||||||||||||||
| £m | £m | £m | £m | £m | £m | £m | £m | |||||||||||||||||||||||||||||||||||
| Due in less than one year |
551 | 32,451 | (569 | ) | (32,508 | ) | 33 | 33,273 | (2 | ) | (33,290 | ) | ||||||||||||||||||||||||||||||
| Between one and two years |
– | – | – | – | 1,529 | – | (1,430 | ) | – | |||||||||||||||||||||||||||||||||
| Gross contractual cash flows |
551 | 32,451 | (569 | ) | (32,508 | ) | 1,562 | 33,273 | (1,432 | ) | (33,290 | ) | ||||||||||||||||||||||||||||||
230 GSK Annual Report 2020
|
Strategic report
| ||
|
Governance and remuneration
| ||
|
Financial statements
| ||
|
Investor information
|
Notes to the financial statements continued
44. Employee share schemes
GSK operates several employee share schemes, including the Share Value Plan, whereby awards are granted to employees to acquire shares or ADS in GlaxoSmithKline plc at no cost after a three year vesting period and the Performance Share Plan, whereby awards are granted to employees to acquire shares or ADS in GlaxoSmithKline plc at no cost, subject to the achievement by the Group of specified performance targets. The granting of these restricted share awards has replaced the granting of options to employees as the cost of the schemes more readily equates to the potential gain to be made by the employee. The Group also operates savings related share option schemes, whereby options are granted to employees to acquire shares in GlaxoSmithKline plc at a discounted price.
Grants of restricted share awards are normally exercisable at the end of the three-year vesting or performance period. Awards are normally granted to employees to acquire shares or ADS in GlaxoSmithKline plc but in some circumstances may be settled in cash. Grants under savings-related share option schemes are normally exercisable after three years’ saving. In accordance with UK practice, the majority of options under the savings-related share option schemes are granted at a price 20% below the market price ruling at the date of grant. Options under historical share option schemes were granted at the market price ruling at the date of grant.
The total charge for share-based incentive plans in 2020 was £393 million (2019 – £432 million; 2018 – £393 million). Of this amount, £313 million (2019 – £302 million; 2018 – £304 million) arose from the Share Value Plan. See Note 9, ‘Employee Costs’ for further details.
GlaxoSmithKline share award schemes
Share Value Plan
Under the Share Value Plan, share awards are granted to certain employees at no cost. The awards vest after two and a half to three years and there are no performance criteria attached. The fair value of these awards is determined based on the closing share price on the day of grant, after deducting the expected future dividend yield of 5.0% (2019 – 4.2%; 2018 – 4.8%) over the duration of the award.
| Number of shares and ADS issuable | Shares |
Weighted fair value |
ADS Number (000) |
Weighted fair value |
||||||||||||
| At 1 January 2018 |
33,925 | 17,392 | ||||||||||||||
| Awards granted |
12,751 | £13.74 | 6,503 | $35.28 | ||||||||||||
| Awards exercised |
(11,089 | ) | (5,583 | ) | ||||||||||||
| Awards cancelled |
(1,519 | ) | (925 | ) | ||||||||||||
| At 31 December 2018 |
34,068 | 17,387 | ||||||||||||||
| Awards granted |
12,814 | £15.85 | 7,008 | $37.90 | ||||||||||||
| Awards exercised |
(11,709 | ) | (6,079 | ) | ||||||||||||
| Awards cancelled |
(1,704 | ) | (976 | ) | ||||||||||||
| At 31 December 2019 |
33,469 | 17,340 | ||||||||||||||
| Awards granted |
13,223 | £13.60 | 7,411 | $34.42 | ||||||||||||
| Awards exercised |
(11,402 | ) | (5,746 | ) | ||||||||||||
| Awards cancelled |
(1,418 | ) | (1,015 | ) | ||||||||||||
| At 31 December 2020 |
33,872 | 17,990 | ||||||||||||||
Performance Share Plan
Under the Performance Share Plan, share awards are granted to Directors and senior executives at no cost. The percentage of each award that vests is based upon the performance of the Group over a defined measurement period with dividends reinvested during the same period. For awards granted from 2015 to 2019, the performance conditions are based on three equally weighted measures over a three-year performance period. These were adjusted free cash flow, TSR and R&D new product performance. For awards granted from 2020, the performance conditions are based on four measures over a three-year performance period. These are adjusted free cash flow (30%), TSR (30%), R&D new product performance (20%) and pipeline progress (20%).
The fair value of the awards is determined based on the closing share price on the day of grant. For TSR performance elements, this is adjusted by the likelihood of that condition being met, as assessed at the time of grant.
During 2020, awards were made of 4.2 million shares at a weighted fair value of £13.92 and 1.4 million ADS at a weighted fair value of $35.85. At 31 December 2020, there were outstanding awards over 12.4 million shares and 3.8 million ADS.
GSK Annual Report 2020 231
|
|
||
|
|
Notes to the financial statements continued
44. Employee share schemes continued
Share options and savings-related options
For the purposes of valuing savings-related options to arrive at the share-based payment charge, a Black-Scholes option pricing model has been used. The assumptions used in the model are as follows:
| 2020 Grant | 2019 Grant | 2018 Grant | ||||||||||||||||||||||||||||||||||
| Risk-free interest rate |
(0.07)% | 0.44% | 0.76% | |||||||||||||||||||||||||||||||||
| Dividend yield |
6.2% | 4.5% | 5.3% | |||||||||||||||||||||||||||||||||
| Volatility |
27% | 22% | 21% | |||||||||||||||||||||||||||||||||
| Expected life |
3 years | 3 years | 3 years | |||||||||||||||||||||||||||||||||
| Savings-related options grant price (including 20% discount) |
£10.34 | £14.15 | £12.09 | |||||||||||||||||||||||||||||||||
| Options outstanding | Share option schemes – shares |
Share option schemes – ADS |
Savings-related share option schemes |
|||||||||||||||||||||||||||||||||
| Number 000 |
Weighted exercise price |
Number 000 |
Weighted exercise price |
Number 000 |
Weighted exercise price |
|||||||||||||||||||||||||||||||
| At 31 December 2020 |
– | n/a | – | n/a | 7,332 | £11.32 | ||||||||||||||||||||||||||||||
| Range of exercise prices on options outstanding at year end |
n/a | n/a | £10.34 | – | £14.15 | |||||||||||||||||||||||||||||||
| Weighted average market price on exercise during year |
£16.52 | $42.41 | £16.29 | |||||||||||||||||||||||||||||||||
| Weighted average remaining contractual life |
n/a | n/a | 2.1 years | |||||||||||||||||||||||||||||||||
Options over 3.1 million shares were granted during the year under the savings-related share option scheme at a weighted average fair value of £2.12. At 31 December 2020, 5.9 million of the savings-related share options were not exercisable. All of the other share options and ADS options were exercisable or expired if not exercised on or before 22 July 2020.
There has been no change in the effective exercise price of any outstanding options during the year.
Employee Share Ownership Plan Trusts
The Group sponsors Employee Share Ownership Plan (ESOP) Trusts to acquire and hold shares in GlaxoSmithKline plc to satisfy awards made under employee incentive plans and options granted under employee share option schemes. The trustees of the ESOP Trusts purchase shares with finance provided by the Group by way of loans or contributions. The costs of running the ESOP Trusts are charged to the income statement. Shares held by the ESOP Trusts are deducted from other reserves and amortised down to the value of proceeds, if any, receivable from employees on exercise by a transfer to retained earnings. The trustees have waived their rights to dividends on the shares held by the ESOP Trusts.
| Shares held for share award schemes | 2020 | 2019 | ||||||
| Number of shares (000) |
48,835 | 36,225 | ||||||
| £m | £m | |||||||
| Nominal value |
12 | 9 | ||||||
| Carrying value |
194 | 134 | ||||||
| Market value |
655 | 645 | ||||||
| Shares held for share option schemes | 2020 | 2019 | ||||||
| Number of shares (000) |
139 | 139 | ||||||
| £m | £m | |||||||
| Nominal value |
– | – | ||||||
| Carrying value |
1 | 1 | ||||||
| Market value |
2 | 2 | ||||||
232 GSK Annual Report 2020
|
Strategic report
| ||
|
Governance and remuneration
| ||
|
Financial statements
| ||
|
Investor information
|
Notes to the financial statements continued
45. Principal Group companies
The following represent the principal subsidiaries and their countries of incorporation of the Group at 31 December 2020. The equity share capital of these entities is wholly owned by the Group except where its percentage interest is shown otherwise. All companies are incorporated in their principal country of operation except where stated.
| England | US | |
|
| ||
| Glaxo Group Limited | Block Drug Company, Inc. (68%) | |
| Glaxo Operations UK Limited | Corixa Corporation | |
| GlaxoSmithKline Capital plc | GlaxoSmithKline Capital Inc. | |
| GlaxoSmithKline Consumer Healthcare Holdings Limited* | GlaxoSmithKline Consumer Healthcare Holdings (US) LLC (68%) | |
| GlaxoSmithKline Consumer Healthcare (UK) Trading Limited (68%) | GlaxoSmithKline Consumer Healthcare, L.P. (59.84%) | |
| GlaxoSmithKline Consumer Trading Services Limited (68%) | GlaxoSmithKline Holdings (Americas) Inc. | |
| GlaxoSmithKline Export Limited | GlaxoSmithKline LLC | |
| GlaxoSmithKline Finance plc | Human Genome Sciences, Inc. | |
| GlaxoSmithKline Holdings Limited* | GSK Consumer Health, Inc. (68%) | |
| GlaxoSmithKline Research & Development Limited | PF Consumer Healthcare 1 LLC (68%) | |
| GlaxoSmithKline Services Unlimited* | GSK Equity Investments, Limited | |
| GlaxoSmithKline UK Limited | Stiefel Laboratories, Inc. | |
| Setfirst Limited | Tesaro, Inc. | |
| SmithKline Beecham Limited | ViiV Healthcare Company (78.3%) | |
| ViiV Healthcare Finance Limited (78.3%) | ||
| ViiV Healthcare Limited (78.3%) | ||
| ViiV Healthcare UK Limited (78.3%) | ||
| Europe | Others | |
|
| ||
| GlaxoSmithKline Biologicals SA (Belgium) | GlaxoSmithKline Australia Pty Ltd (Australia) | |
| GlaxoSmithKline Sante Grand Public SAS (France) (68%) | GlaxoSmithKline Consumer Healthcare Australia Pty Ltd (Australia) (68%) | |
| Laboratoire GlaxoSmithKline (France) | GlaxoSmithKline Brasil Limitada (Brazil) | |
| ViiV Healthcare SAS (France) (78.3%)
GlaxoSmithKline Consumer Healthcare GmbH & Co. KG (Germany) (68%) |
GlaxoSmithKline Consumer Healthcare ULC/GlaxoSmithKline
Soins De | |
| GlaxoSmithKline GmbH & Co. KG (Germany) | GlaxoSmithKline Inc. (Canada) | |
| GSK Vaccines GmbH (Germany) | ID Biomedical Corporation of Quebec (Canada) | |
| GlaxoSmithKline Consumer Healthcare S.r.l (Italy) (68%) | PF Consumer Healthcare Canada ULC/PF Soins De Sante SRI (Canada) (68%) | |
| GlaxoSmithKline S.p.A. (Italy) | GlaxoSmithKline Limited (China (Hong Kong)) | |
| GSK Vaccines S.r.l. (Italy) | Sino-American Tianjin Smith Kline & French Laboratories Ltd (China) (37.4%) | |
| ViiV Healthcare S.r.l. (Italy) (78.3%) | Wyeth Pharmaceutical Co. Ltd (China) (68%) | |
| Pfizer Consumer Manufacturing Italy S.r.l. (Italy) (68%) | GlaxoSmithKline Asia Pvt. Limited (India) | |
| GSK Services Sp z o.o. (Poland) | GlaxoSmithKline Pharmaceuticals Limited (India) (75%) | |
| GlaxoSmithKline Trading Services Limited (Republic of Ireland) | GlaxoSmithKline Consumer Healthcare Japan K.K. (Japan) (68%) | |
| GlaxoSmithKline Healthcare AO (Russia) (68%) | GlaxoSmithKline K.K. (Japan) | |
| GlaxoSmithKline S.A. (Spain) | GlaxoSmithKline Pakistan Limited (Pakistan) (82.6%) | |
| Laboratorios ViiV Healthcare, S.L. (Spain) (78.3%) | Glaxo Wellcome Manufacturing Pte Ltd. (Singapore) | |
| GSK Consumer Healthcare S.A. (Switzerland) (68%) | GlaxoSmithKline Korea Limited (Republic of Korea) | |
| GlaxoSmithKline llaclari Sanayi ve Ticaret A.S. (Turkey)
| ||
|
| ||
| * | Directly held wholly-owned subsidiary of GlaxoSmithKline plc. |
The subsidiaries and associates listed above principally affect the figures in the Group’s financial statements. Each of
GlaxoSmithKline Capital Inc., GlaxoSmithKline Capital plc and GlaxoSmithKline LLC, is a wholly-owned finance subsidiary of the company, and the company has fully and unconditionally guaranteed the securities issued by each of GlaxoSmithKline Capital Inc., GlaxoSmithKline Capital plc and GlaxoSmithKline LLC.
See pages 287 to 298 for a complete list of subsidiary undertakings, associates and joint ventures, which form part of these financial statements.
GSK Annual Report 2020 233
|
|
||
|
|
Notes to the financial statements continued
46. Legal proceedings
234 GSK Annual Report 2020
|
Strategic report
| ||
|
Governance and remuneration
| ||
|
Financial statements
| ||
|
Investor information
|
Notes to the financial statements continued
46. Legal proceedings continued
GSK Annual Report 2020 235
|
|
||
|
|
Notes to the financial statements continued
46. Legal proceedings continued
236 GSK Annual Report 2020
|
Strategic report
| ||
|
Governance and remuneration
| ||
|
Financial statements
| ||
|
Investor information
|
Notes to the financial statements continued
46. Legal proceedings continued
47. Post balance sheet events
An intention to increase the UK corporation tax rate from 19% to 25% (effective 1 April 2023) was announced in the UK Budget on 3 March 2021. Deferred taxes have been measured using appropriate rates substantively enacted at the balance sheet date.
The overall effect of the proposed change to the UK corporation tax rate from 19% to 25%, if applied to the deferred tax balance at 31 December 2020, would be an increase in deferred tax assets by approximately £350 million.
GSK Annual Report 2020 237
|
|
||
|
|
Company balance sheet – UK GAAP
(including FRS 101 ‘Reduced Disclosure Framework’) as at 31 December 2020
| Notes | 2020 £m |
2020 £m |
2019 £m |
2019 £m |
||||||||||||||||
| Fixed assets – investments |
E | 54,992 | 54,854 | |||||||||||||||||
| Current assets: |
||||||||||||||||||||
| Trade and other receivables |
F | 1,689 | 2,210 | |||||||||||||||||
| Cash at bank |
14 | 12 | ||||||||||||||||||
| Total current assets |
1,703 | 2,222 | ||||||||||||||||||
| Short term borrowings |
G | – | (1,000) | |||||||||||||||||
| Trade and other payables |
H | (531) | (609) | |||||||||||||||||
| Total current liabilities |
(531) | (1,609) | ||||||||||||||||||
| Net current assets |
1,172 | 613 | ||||||||||||||||||
| Total assets less current liabilities |
56,164 | 55,467 | ||||||||||||||||||
| Provisions for liabilities |
I | (7) | (4) | |||||||||||||||||
| Other non-current liabilities |
J | (457) | (317) | |||||||||||||||||
| Net assets |
55,700 | 55,146 | ||||||||||||||||||
| Capital and reserves |
||||||||||||||||||||
| Share capital |
K | 1,346 | 1,346 | |||||||||||||||||
| Share premium account |
K | 3,281 | 3,174 | |||||||||||||||||
| Other reserves |
L | 1,420 | 1,420 | |||||||||||||||||
| Retained earnings: |
||||||||||||||||||||
| At 1 January |
49,206 | 18,117 | ||||||||||||||||||
| Profit/(loss) for the year |
3,893 | (53) | ||||||||||||||||||
| Other changes in retained earnings |
(3,446) | 31,142 | ||||||||||||||||||
| L | 49,653 | 49,206 | ||||||||||||||||||
| Equity shareholders’ funds |
55,700 | 55,146 | ||||||||||||||||||
The financial statements on pages 238 to 242 were approved by the Board on 8 March 2021 and signed on its behalf by
Sir Jonathan Symonds
Chairman
GlaxoSmithKline plc
Registered number: 3888792
Company statement of changes in equity
for the year ended 31 December 2020
| Share capital £m |
Share premium account £m |
Other reserves £m |
Retained earnings £m |
Total equity £m |
||||||||||||||||
| At 1 January 2019 |
1,345 | 3,091 | 1,420 | 18,117 | 23,973 | |||||||||||||||
| Loss and Total comprehensive expense attributable to shareholders |
– | – | – | (53 | ) | (53 | ) | |||||||||||||
| Distribution received of GlaxoSmithKline Consumer Healthcare Holdings Limited |
– | – | – | 34,800 | 34,800 | |||||||||||||||
| Total comprehensive income for the year |
1,345 | 3,091 | 1,420 | 34,747 | 34,747 | |||||||||||||||
| Dividends to shareholders |
– | – | – | (3,953 | ) | (3,953 | ) | |||||||||||||
| Shares issued under employee share schemes |
1 | 50 | – | – | 51 | |||||||||||||||
| Treasury shares transferred to the ESOP Trusts |
– | 33 | – | 295 | 328 | |||||||||||||||
| At 31 December 2019 |
1,346 | 3,174 | 1,420 | 49,206 | 55,146 | |||||||||||||||
| Profit and Total comprehensive income attributable to shareholders |
– | – | – | 3,893 | 3,893 | |||||||||||||||
| Dividends to shareholders |
– | – | – | (3,977 | ) | (3,977 | ) | |||||||||||||
| Shares issued under employee share schemes |
– | 29 | – | – | 29 | |||||||||||||||
| Treasury shares transferred to the ESOP Trusts |
– | 78 | – | 531 | 609 | |||||||||||||||
| At 31 December 2020 |
1,346 | 3,281 | 1,420 | 49,653 | 55,700 | |||||||||||||||
238 GSK Annual Report 2020
|
Strategic report
| ||
|
Governance and remuneration
| ||
|
Financial statements
| ||
|
Investor information
|
Notes to the company balance sheet –
UK GAAP (including FRS 101 ‘Reduced Disclosure Framework’)
GSK Annual Report 2020 239
|
|
||
|
|
Notes to the company balance sheet – UK GAAP
(including FRS 101 ‘Reduced Disclosure Framework’) continued
E) Fixed assets – investments
| 2020 £m |
2019 £m |
|||||
| Shares in GlaxoSmithKline Services Unlimited |
637 | 637 | ||||
| Shares in GlaxoSmithKline Holdings (One) Limited |
18 | 18 | ||||
| Shares in GlaxoSmithKline Holdings Limited |
17,888 | 17,888 | ||||
| Shares in GlaxoSmithKline Consumer Healthcare Holdings Limited |
34,800 | 34,800 | ||||
| Shares in GlaxoSmithKline Mercury Limited |
33 | 33 | ||||
| 53,376 | 53,376 | |||||
| Capital contribution relating to share-based payments |
1,139 | 1,139 | ||||
| Contribution relating to contingent consideration |
477 | 339 | ||||
| 54,992 | 54,854 | |||||
|
The shares in GlaxoSmithKline Consumer Healthcare Holdings Limited were received during 2019 as a dividend in specie as part of a Group reorganisation prior to the acquisition of the Pfizer consumer healthcare business.
F) Trade and other receivables
|
| |||||
| 2020 £m |
2019 £m |
|||||
| Amounts due within one year: |
||||||
| UK Corporation tax recoverable |
10 | 14 | ||||
| Amounts owed by Group undertakings |
1,231 | 1,645 | ||||
| 1,241 | 1,659 | |||||
| Amounts due after more than one year: |
||||||
| Amounts owed by Group undertakings |
448 | 551 | ||||
| 1,689 | 2,210 | |||||
240 GSK Annual Report 2020
|
Strategic report
| ||
|
Governance and remuneration
| ||
|
Financial statements
| ||
|
Investor information
|
Notes to the company balance sheet – UK GAAP
(including FRS 101 ‘Reduced Disclosure Framework’) continued
G) Short-term borrowings
The £1 billion borrowing at 31 December 2019 related to the balance of a facility taken out in June 2018 as part of the financing of the buyout of the non-controlling interest in the Consumer Healthcare Joint Venture held by Novartis. This loan was repaid on 18 May 2020.
H) Trade and other payables
| 2020 £m |
2019 £m |
|||||
| Amounts due within one year: |
||||||
| Other creditors |
511 | 564 | ||||
| Contingent consideration payable |
20 | 22 | ||||
| Amounts owed to Group undertakings |
– | 23 | ||||
| 531 | 609 | |||||
The company has guaranteed debt issued by its subsidiary companies from two of which it receives fees. In aggregate, the company has outstanding guarantees over £24.9 billion of debt instruments (2019 – £27.8 billion). The amounts due from the subsidiary company in relation to these guarantee fees will be recovered over the life of the bonds and are disclosed within ‘Trade and other receivables’ (see Note F).
I) Provisions for liabilities
| 2020 £m |
2019 £m |
|||||
| At 1 January |
4 | 16 | ||||
| Charge for the year |
15 | 5 | ||||
| Utilised |
(12) | (17 | ) | |||
| At 31 December |
7 | 4 | ||||
| The provisions relate to a number of legal and other disputes in which the company is currently involved. | ||||||
| J) Other non-current liabilities | ||||||
| 2020 £m |
2019 £m |
|||||
| Contingent consideration payable |
457 | 317 | ||||
| 457 | 317 | |||||
The contingent consideration relates to the amount payable for the acquisition in 2015 of the Novartis Vaccines portfolio. The current year liability is included within ‘Trade and other payables’. For further details, see Note 32 to the Group financial statements, ‘Contingent consideration liabilities’.
GSK Annual Report 2020 241
|
|
||
|
|
Notes to the company balance sheet – UK GAAP
(including FRS 101 ‘Reduced Disclosure Framework’) continued
K) Share capital and share premium account
| Ordinary Shares of 25p each | Share premium account |
|||||||||
| Number | £m | £m | ||||||||
| Share capital issued and fully paid |
||||||||||
| At 1 January 2019 |
5,379,067,624 | 1,345 | 3,091 | |||||||
| Issued under employee share schemes |
4,034,607 | 1 | 50 | |||||||
| Ordinary shares acquired by ESOP trusts |
– | – | 33 | |||||||
| At 31 December 2019 |
5,383,102,231 | 1,346 | 3,174 | |||||||
| Issued under employee share schemes |
2,087,386 | – | 29 | |||||||
| Ordinary shares acquired by ESOP trusts |
– | – | 78 | |||||||
| At 31 December 2020 |
5,385,189,617 | 1,346 | 3,281 | |||||||
| 31 December 2020 000 |
|
31 December 2019 000 |
| |||||||
| Number of shares issuable under employee share schemes |
48,205 | 57,871 | ||||||||
| Number of unissued shares not under option |
4,566,605 | 4,559,027 | ||||||||
At 31 December 2020, of the issued share capital, 48,975,304 shares were held in the ESOP Trusts, 355,205,950 shares were held as Treasury shares and 4,981,008,363 shares were in free issue. All issued shares are fully paid. The nominal, carrying and market values of the shares held in the ESOP Trusts are disclosed in Note 44, ‘Employee share schemes’.
L) Retained earnings and other reserves
The profit of GlaxoSmithKline plc for the year was £3,893 million (2019 – £53 million loss). After dividends paid of £3,977 million (2019 – £3,953 million), the effect of £531 million Treasury shares transferred to a subsidiary company (2019 – £295 million) and no distribution received of the shares in a subsidiary company (2019 – £34,800) million, retained earnings at 31 December 2020 stood at £49,653 million (2019 – £49,206 million), of which £38,896 million was unrealised (2019 – £38,896 million). Dividends to shareholders are paid out of the realised profits of the company, which at 31 December 2020 amounted to £10,757 million (2019 – £10,310 million).
Other reserves includes a capital redemption reserve and a reserve reflecting historical contributions of shares in the company which were issued to satisfy share option awards granted to employees of subsidiary companies.
M) Group companies
See pages 287 to 298 for a complete list of subsidiaries, associates, joint ventures and other significant shareholdings, which forms part of these financial statements.
242 GSK Annual Report 2020
|
Strategic report
| ||
|
Governance and remuneration
| ||
|
Financial statements
| ||
|
Investor information
|
|
In this section |
||||||||||||
| Quarterly trend | 244 | |||||||||||
| Pharmaceuticals turnover | 246 | |||||||||||
| Vaccines turnover | 248 | |||||||||||
| Five year record | 249 | |||||||||||
| Product development pipeline | 255 | |||||||||||
| Products, competition and intellectual property | 258 | |||||||||||
| Principal risks and uncertainties | 261 | |||||||||||
| Share capital and control | 276 | |||||||||||
| Dividends | 278 | |||||||||||
| Financial calendar 2021 | 279 | |||||||||||
| Annual General Meeting 2021 | 279 | |||||||||||
| Tax information for shareholders | 280 | |||||||||||
| Shareholder services and contacts | 282 | |||||||||||
| US law and regulation | 284 | |||||||||||
| Group companies | 287 | |||||||||||
| Glossary of terms | 299 | |||||||||||
| GSK Annual Report 2020 243 | ||||||||||||
|
|
||
|
|
Financial record
An unaudited analysis of the Group results is provided by quarter in Sterling for the financial year 2020.
Income statement – Total
| 12 months 2020 | Q4 2020 | |||||||||||||||||||||||||||||||||||
| Reported | Pro-forma | Reported | ||||||||||||||||||||||||||||||||||
| £m | £% | CER% | CER% | £m | £% | CER% | ||||||||||||||||||||||||||||||
| Turnover |
||||||||||||||||||||||||||||||||||||
| Pharmaceuticals |
17,056 | (3 | ) | (1 | ) | (1 | ) | 4,366 | (4 | ) | (3 | ) | ||||||||||||||||||||||||
| Vaccines |
6,982 | (2 | ) | (1 | ) | (1 | ) | 2,012 | 15 | 16 | ||||||||||||||||||||||||||
| Consumer Healthcare |
10,033 | 12 | 14 | (2 | ) | 2,360 | (8 | ) | (7 | ) | ||||||||||||||||||||||||||
| 34,071 | 1 | 3 | (2 | ) | 8,738 | (1 | ) | – | ||||||||||||||||||||||||||||
| Corporate and other unallocated turnover |
28 | 1 | ||||||||||||||||||||||||||||||||||
| Total turnover |
34,099 | 1 | 3 | (2 | ) | 8,739 | (2 | ) | (1 | ) | ||||||||||||||||||||||||||
| Cost of sales |
(11,704 | ) | (1 | ) | – | (3,171 | ) | (2 | ) | (2 | ) | |||||||||||||||||||||||||
| Selling, general and administration |
(11,456 | ) | – | 2 | (3,162 | ) | (8 | ) | (6 | ) | ||||||||||||||||||||||||||
| Research and development |
(5,098 | ) | 12 | 12 | (1,470 | ) | 18 | 19 | ||||||||||||||||||||||||||||
| Royalty income |
318 | (9 | ) | (9 | ) | 91 | 11 | 12 | ||||||||||||||||||||||||||||
| Other operating income/(expense) |
1,624 | 34 | ||||||||||||||||||||||||||||||||||
| Operating profit |
7,783 | 12 | 15 | 1,061 | (44 | ) | (44 | ) | ||||||||||||||||||||||||||||
| Net finance costs |
(848 | ) | (234 | ) | ||||||||||||||||||||||||||||||||
| Share of after-tax profits/(losses) of associates and joint ventures |
33 | (6 | ) | |||||||||||||||||||||||||||||||||
| Profit before taxation |
6,968 | 12 | 16 | 821 | (52 | ) | (52 | ) | ||||||||||||||||||||||||||||
| Taxation |
(580 | ) | 18 | |||||||||||||||||||||||||||||||||
| Tax rate % |
8.3 | % | (2.2 | )% | ||||||||||||||||||||||||||||||||
| Profit after taxation for the period |
6,388 | 21 | 25 | 839 | (45 | ) | (45 | ) | ||||||||||||||||||||||||||||
| Profit attributable to non-controlling interests |
639 | 162 | ||||||||||||||||||||||||||||||||||
| Profit attributable to shareholders |
5,749 | 677 | ||||||||||||||||||||||||||||||||||
| Basic earnings per share (pence) |
115.5 | p | 23 | 26 | 13.6 | p | (48 | ) | (48 | ) | ||||||||||||||||||||||||||
| Diluted earnings per share (pence) |
114.1 | p | 13.4 | p | ||||||||||||||||||||||||||||||||
| Income statement – Adjusted
|
||||||||||||||||||||||||||||||||||||
| Total turnover |
34,099 | 1 | 3 | (2 | ) | 8,739 | (2 | ) | (1 | ) | ||||||||||||||||||||||||||
| Cost of sales |
(10,191 | ) | 1 | 2 | (3 | ) | (2,792 | ) | (2 | ) | (2 | ) | ||||||||||||||||||||||||
| Selling, general and administration |
(10,717 | ) | – | 2 | (3 | ) | (2,924 | ) | (6 | ) | (4 | ) | ||||||||||||||||||||||||
| Research and development |
(4,603 | ) | 6 | 7 | 6 | (1,297 | ) | 11 | 12 | |||||||||||||||||||||||||||
| Royalty income |
318 | (9 | ) | (9 | ) | (9 | ) | 91 | 11 | 12 | ||||||||||||||||||||||||||
| Operating profit |
8,906 | (1 | ) | 2 | (3 | ) | 1,817 | (2 | ) | (1 | ) | |||||||||||||||||||||||||
| Net finance costs |
(844 | ) | (233 | ) | ||||||||||||||||||||||||||||||||
| Share of after-tax profits/(losses) of associates and joint ventures |
33 | (6 | ) | |||||||||||||||||||||||||||||||||
| Profit before taxation |
8,095 | (2 | ) | 1 | 1,578 | (5 | ) | (5 | ) | |||||||||||||||||||||||||||
| Taxation |
(1,295 | ) | (220 | ) | ||||||||||||||||||||||||||||||||
| Tax rate % |
16.0 | % | 13.9 | % | ||||||||||||||||||||||||||||||||
| Profit after taxation for the period |
6,800 | (2 | ) | 1 | 1,358 | (6 | ) | (6 | ) | |||||||||||||||||||||||||||
| Profit attributable to non-controlling interests |
1,031 | 195 | ||||||||||||||||||||||||||||||||||
| Profit attributable to shareholders |
5,769 | 1,163 | ||||||||||||||||||||||||||||||||||
| Adjusted earnings per share (pence) |
115.9 | p | (6 | ) | (4 | ) | 23.3 | p | (6 | ) | (5 | ) | ||||||||||||||||||||||||
|
The calculation of Adjusted results is described on page 51. | ||||||||||||||||||
244 GSK Annual Report 2020
|
Strategic report
| ||
|
Governance and remuneration
| ||
|
Financial statements
| ||
|
Investor information
|
Financial record continued
Quarterly trend continued
| Q3 2020 | Q2 2020 | Q1 2020 | ||||||||||||||||||||||||||||||||||||||||
| Reported | Reported | Reported | ||||||||||||||||||||||||||||||||||||||||
| £m | £% | CER% | £m | £% | CER% | £m | £% | CER% | ||||||||||||||||||||||||||||||||||
| 4,192 | (7 | ) | (3 | ) | 4,102 | (5 | ) | (5 | ) | 4,396 | 6 | 6 | ||||||||||||||||||||||||||||||
| 2,032 | (12 | ) | (9 | ) | 1,133 | (29 | ) | (29 | ) | 1,805 | 19 | 19 | ||||||||||||||||||||||||||||||
| 2,422 | (4 | ) | 2 | 2,389 | 25 | 25 | 2,862 | 44 | 46 | |||||||||||||||||||||||||||||||||
| 8,646 | (8 | ) | (3 | ) | 7,624 | (2 | ) | (3 | ) | 9,063 | 18 | 19 | ||||||||||||||||||||||||||||||
| – | – | 27 | ||||||||||||||||||||||||||||||||||||||||
| 8,646 | (8 | ) | (3 | ) | 7,624 | (2 | ) | (3 | ) | 9,090 | 19 | 19 | ||||||||||||||||||||||||||||||
| (2,885 | ) | (11 | ) | (8 | ) | (2,449 | ) | (7 | ) | (7 | ) | (3,199 | ) | 17 | 18 | |||||||||||||||||||||||||||
| (2,669 | ) | (8 | ) | (4 | ) | (2,709 | ) | 5 | 5 | (2,916 | ) | 18 | 19 | |||||||||||||||||||||||||||||
| (1,140 | ) | (5 | ) | (2 | ) | (1,301 | ) | 17 | 15 | (1,187 | ) | 18 | 18 | |||||||||||||||||||||||||||||
| 85 | (28 | ) | (26 | ) | 75 | (4 | ) | (10 | ) | 67 | (8 | ) | (5 | ) | ||||||||||||||||||||||||||||
| (179 | ) | 1,610 | 159 | |||||||||||||||||||||||||||||||||||||||
| 1,858 | (13 | ) | (2 | ) | 2,850 | 92 | 90 | 2,014 | 41 | 42 | ||||||||||||||||||||||||||||||||
| (198 | ) | (228 | ) | (188 | ) | |||||||||||||||||||||||||||||||||||||
| 11 | 19 | 9 | ||||||||||||||||||||||||||||||||||||||||
| 1,671 | (14 | ) | (2 | ) | 2,641 | >100 | >100 | 1,835 | 42 | 42 | ||||||||||||||||||||||||||||||||
| (241 | ) | (201 | ) | (156 | ) | |||||||||||||||||||||||||||||||||||||
| 14.4 | % | 7.6 | % | 8.5 | % | |||||||||||||||||||||||||||||||||||||
| 1,430 | (17 | ) | (5 | ) | 2,440 | >100 | >100 | 1,679 | 70 | 71 | ||||||||||||||||||||||||||||||||
| 186 | 177 | 114 | ||||||||||||||||||||||||||||||||||||||||
| 1,244 | 2,263 | 1,565 | ||||||||||||||||||||||||||||||||||||||||
| 25.0 | p | (20 | ) | (9 | ) | 45.5 | p | >100 | >100 | 31.5 | p | 87 | 89 | |||||||||||||||||||||||||||||
| 24.7 | p | 45.0 | p | 31.2 | p | |||||||||||||||||||||||||||||||||||||
| 8,646 | (8 | ) | (3 | ) | 7,624 | (2 | ) | (3 | ) | 9,090 | 19 | 19 | ||||||||||||||||||||||||||||||
| (2,540 | ) | (9 | ) | (6 | ) | (2,249 | ) | – | – | (2,610 | ) | 18 | 20 | |||||||||||||||||||||||||||||
| (2,477 | ) | (11 | ) | (7 | ) | (2,530 | ) | 4 | 4 | (2,786 | ) | 16 | 18 | |||||||||||||||||||||||||||||
| (1,049 | ) | (10 | ) | (6 | ) | (1,171 | ) | 13 | 11 | (1,086 | ) | 12 | 11 | |||||||||||||||||||||||||||||
| 85 | (28 | ) | (26 | ) | 75 | (4 | ) | (10 | ) | 67 | (8 | ) | (5 | ) | ||||||||||||||||||||||||||||
| 2,665 | (4 | ) | 4 | 1,749 | (19 | ) | (21 | ) | 2,675 | 24 | 24 | |||||||||||||||||||||||||||||||
| (197 | ) | (227 | ) | (187 | ) | |||||||||||||||||||||||||||||||||||||
| 11 | 19 | 9 | ||||||||||||||||||||||||||||||||||||||||
| 2,479 | (5 | ) | 4 | 1,541 | (21 | ) | (22 | ) | 2,497 | 23 | 23 | |||||||||||||||||||||||||||||||
| (417 | ) | (316 | ) | (342 | ) | |||||||||||||||||||||||||||||||||||||
| 16.8 | % | 20.5 | % | 13.7 | % | |||||||||||||||||||||||||||||||||||||
| 2,062 | (6 | ) | 3 | 1,225 | (26 | ) | (27 | ) | 2,155 | 32 | 32 | |||||||||||||||||||||||||||||||
| 287 | 267 | 282 | ||||||||||||||||||||||||||||||||||||||||
| 1,775 | 958 | 1,873 | ||||||||||||||||||||||||||||||||||||||||
| 35.6 | p | (8 | ) | 1 | 19.2 | p | (37 | ) | (38 | ) | 37.7 | p | 25 | 26 | ||||||||||||||||||||||||||||
GSK Annual Report 2020 245
|
|
||
|
|
Financial record continued
Pharmaceutical turnover by therapeutic area 2020
| Total | US | Europe | International | |||||||||||||||||||||||||||||||||||||||||||||||||||||||
| 2020 | 2019 | Growth | 2020 | Growth | 2020 | Growth | 2020 | Growth | ||||||||||||||||||||||||||||||||||||||||||||||||||
| Therapeutic area/major products | £m | £m | £% | CER% | £m | £% | CER% | £m | £% | CER% | £m | £% | CER% | |||||||||||||||||||||||||||||||||||||||||||||
| Respiratory |
3,749 | 3,081 | 22 | 23 | 2,114 | 21 | 23 | 944 | 21 | 20 | 691 | 24 | 27 | |||||||||||||||||||||||||||||||||||||||||||||
| Ellipta products |
2,755 | 2,313 | 19 | 20 | 1,516 | 18 | 19 | 706 | 22 | 22 | 533 | 19 | 22 | |||||||||||||||||||||||||||||||||||||||||||||
| Anoro Ellipta |
547 | 514 | 6 | 8 | 327 | 1 | 2 | 142 | 18 | 17 | 78 | 11 | 17 | |||||||||||||||||||||||||||||||||||||||||||||
| Arnuity Ellipta |
45 | 48 | (6 | ) | (6 | ) | 37 | (10 | ) | (7 | ) | – | – | – | 8 | 14 | – | |||||||||||||||||||||||||||||||||||||||||
| Incruse Ellipta |
220 | 262 | (16 | ) | (15 | ) | 117 | (27 | ) | (27 | ) | 74 | 1 | 1 | 29 | 4 | 7 | |||||||||||||||||||||||||||||||||||||||||
| Relvar/Breo Ellipta |
1,124 | 971 | 16 | 17 | 474 | 24 | 25 | 322 | 14 | 13 | 328 | 6 | 9 | |||||||||||||||||||||||||||||||||||||||||||||
| Trelegy Ellipta |
819 | 518 | 58 | 59 | 561 | 47 | 48 | 168 | 65 | 65 | 90 | >100 | >100 | |||||||||||||||||||||||||||||||||||||||||||||
|
Nucala |
994 | 768 | 29 | 30 | 598 | 32 | 33 | 238 | 16 | 15 | 158 | 45 | 46 | |||||||||||||||||||||||||||||||||||||||||||||
| HIV |
4,876 | 4,854 | – | 1 | 3,005 | – | 1 | 1,213 | 5 | 4 | 658 | (5 | ) | (1 | ) | |||||||||||||||||||||||||||||||||||||||||||
| Dolutegravir products |
4,702 | 4,633 | 1 | 2 | 2,941 | – | 1 | 1,163 | 7 | 6 | 598 | (2 | ) | 3 | ||||||||||||||||||||||||||||||||||||||||||||
| Tivicay |
1,527 | 1,662 | (8 | ) | (7 | ) | 871 | (11 | ) | (10 | ) | 368 | (7 | ) | (8 | ) | 288 | (1 | ) | 5 | ||||||||||||||||||||||||||||||||||||||
| Triumeq |
2,306 | 2,549 | (10 | ) | (9 | ) | 1,454 | (10 | ) | (9 | ) | 568 | (9 | ) | (10 | ) | 284 | (9 | ) | (6 | ) | |||||||||||||||||||||||||||||||||||||
| Juluca |
495 | 366 | 35 | 36 | 387 | 28 | 29 | 97 | 73 | 71 | 11 | 57 | 71 | |||||||||||||||||||||||||||||||||||||||||||||
| Dovato |
374 | 56 | >100 | >100 | 229 | >100 | >100 | 130 | >100 | >100 | 15 | >100 | >100 | |||||||||||||||||||||||||||||||||||||||||||||
| Epzicom/Kivexa |
31 | 75 | (59 | ) | (59 | ) | 1 | (67 | ) | (67 | ) | 9 | (61 | ) | (61 | ) | 21 | (57 | ) | (57 | ) | |||||||||||||||||||||||||||||||||||||
| Selzentry |
91 | 97 | (6 | ) | (5 | ) | 47 | (11 | ) | (11 | ) | 27 | (7 | ) | (7 | ) | 17 | 13 | 20 | |||||||||||||||||||||||||||||||||||||||
| Rukobia |
11 | – | – | – | 11 | – | – | – | – | – | – | – | – | |||||||||||||||||||||||||||||||||||||||||||||
| Other |
41 | 49 | (16 | ) | (12 | ) | 5 | (50 | ) | (40 | ) | 14 | (22 | ) | (17 | ) | 22 | 5 | 5 | |||||||||||||||||||||||||||||||||||||||
|
Immuno-inflammation |
727 | 613 | 19 | 20 | 612 | 14 | 16 | 56 | 22 | 20 | 59 | 84 | 91 | |||||||||||||||||||||||||||||||||||||||||||||
|
Benlysta |
719 | 613 | 17 | 19 | 612 | 14 | 16 | 56 | 22 | 20 | 51 | 59 | 66 | |||||||||||||||||||||||||||||||||||||||||||||
| Oncology |
372 | 230 | 62 | 62 | 231 | 72 | 74 | 136 | 42 | 40 | 5 | – | – | |||||||||||||||||||||||||||||||||||||||||||||
| Zejula |
339 | 229 | 48 | 48 | 206 | 54 | 55 | 128 | 35 | 33 | 5 | – | – | |||||||||||||||||||||||||||||||||||||||||||||
|
Blenrep |
33 | – | – | – | 25 | – | – | 8 | – | – | – | – | – | |||||||||||||||||||||||||||||||||||||||||||||
| Pharmaceuticals excluding established products | 9,724 | 8,778 | 11 | 12 | 5,962 | 10 | 11 | 2,349 | 13 | 12 | 1,413 | 10 | 14 | |||||||||||||||||||||||||||||||||||||||||||||
| Established pharmaceuticals | 7,332 | 8,776 | (16 | ) | (15 | ) | 1,489 | (25 | ) | (24 | ) | 1,755 | (14 | ) | (15 | ) | 4,088 | (14 | ) | (11 | ) | |||||||||||||||||||||||||||||||||||||
| Established Respiratory | 3,251 | 3,900 | (17 | ) | (15 | ) | 1,048 | (26 | ) | (25 | ) | 738 | (9 | ) | (9 | ) | 1,465 | (13 | ) | (10 | ) | |||||||||||||||||||||||||||||||||||||
| Seretide/Advair |
1,535 | 1,730 | (11 | ) | (10 | ) | 434 | (14 | ) | (13 | ) | 449 | (11 | ) | (11 | ) | 652 | (10 | ) | (7 | ) | |||||||||||||||||||||||||||||||||||||
| Flixotide/Flovent |
419 | 629 | (33 | ) | (32 | ) | 183 | (50 | ) | (50 | ) | 80 | (9 | ) | (10 | ) | 156 | (10 | ) | (5 | ) | |||||||||||||||||||||||||||||||||||||
| Ventolin |
785 | 938 | (16 | ) | (14 | ) | 430 | (21 | ) | (20 | ) | 116 | (3 | ) | (4 | ) | 239 | (12 | ) | (7 | ) | |||||||||||||||||||||||||||||||||||||
| Avamys/Veramyst |
297 | 324 | (8 | ) | (6 | ) | – | – | – | 66 | (4 | ) | (4 | ) | 231 | (10 | ) | (7 | ) | |||||||||||||||||||||||||||||||||||||||
| Other Respiratory |
215 | 279 | (23 | ) | (23 | ) | 1 | >100 | >100 | 27 | (4 | ) | – | 187 | (25 | ) | (26 | ) | ||||||||||||||||||||||||||||||||||||||||
| Dermatology |
425 | 445 | (4 | ) | (1 | ) | 1 | (67 | ) | (67 | ) | 140 | (12 | ) | (13 | ) | 284 | – | 6 | |||||||||||||||||||||||||||||||||||||||
| Augmentin |
490 | 602 | (19 | ) | (15 | ) | – | – | – | 145 | (16 | ) | (16 | ) | 345 | (20 | ) | (15 | ) | |||||||||||||||||||||||||||||||||||||||
| Avodart |
466 | 574 | (19 | ) | (17 | ) | 5 | 25 | 25 | 158 | (24 | ) | (25 | ) | 303 | (16 | ) | (13 | ) | |||||||||||||||||||||||||||||||||||||||
| Imigran/Imitrex |
118 | 138 | (14 | ) | (14 | ) | 42 | (29 | ) | (29 | ) | 51 | (2 | ) | (4 | ) | 25 | (7 | ) | (4 | ) | |||||||||||||||||||||||||||||||||||||
| Lamictal |
537 | 566 | (5 | ) | (4 | ) | 269 | (5 | ) | (5 | ) | 120 | 7 | 6 | 148 | (13 | ) | (9 | ) | |||||||||||||||||||||||||||||||||||||||
| Seroxat/Paxil |
146 | 160 | (9 | ) | (6 | ) | – | – | – | 37 | – | (3 | ) | 109 | (11 | ) | (7 | ) | ||||||||||||||||||||||||||||||||||||||||
| Valtrex |
103 | 107 | (4 | ) | (2 | ) | 15 | 7 | 7 | 32 | 3 | – | 56 | (10 | ) | (5 | ) | |||||||||||||||||||||||||||||||||||||||||
| Other |
1,796 | 2,284 | (21 | ) | (20 | ) | 109 | (48 | ) | (47 | ) | 334 | (28 | ) | (28 | ) | 1,353 | (16 | ) | (14 | ) | |||||||||||||||||||||||||||||||||||||
|
Pharmaceuticals |
17,056 | 17,554 | (3 | ) | (1 | ) | 7,451 | 1 | 2 | 4,104 | (1 | ) | (1 | ) | 5,501 | (9 | ) | (5 | ) | |||||||||||||||||||||||||||||||||||||||
246 GSK Annual Report 2020
|
Strategic report
| ||
|
Governance and remuneration
| ||
|
Financial statements
| ||
|
Investor information
|
Financial record continued
Pharmaceutical turnover by therapeutic area 2019
| Total | US | Europe | International | |||||||||||||||||||||||||||||||||||||||||||||||||||||||
| 2019 | 2018 | Growth | 2019 | Growth | 2019 | Growth | 2019 | Growth | ||||||||||||||||||||||||||||||||||||||||||||||||||
| Therapeutic area/major products | £m | £m | £% | CER% | £m | £% | CER% | £m | £% | CER% | £m | £% | CER% | |||||||||||||||||||||||||||||||||||||||||||||
| Respiratory |
3,081 | 2,612 | 18 | 15 | 1,742 | 10 | 6 | 783 | 29 | 29 | 556 | 33 | 31 | |||||||||||||||||||||||||||||||||||||||||||||
| Ellipta products |
2,313 | 2,049 | 13 | 10 | 1,289 | 4 | – | 577 | 26 | 27 | 447 | 29 | 27 | |||||||||||||||||||||||||||||||||||||||||||||
| Anoro Ellipta |
514 | 476 | 8 | 5 | 324 | 2 | (2 | ) | 120 | 19 | 20 | 70 | 23 | 21 | ||||||||||||||||||||||||||||||||||||||||||||
| Arnuity Ellipta |
48 | 44 | 9 | 5 | 41 | 5 | 3 | – | – | – | 7 | 40 | 20 | |||||||||||||||||||||||||||||||||||||||||||||
| Incruse Ellipta |
262 | 284 | (8 | ) | (10 | ) | 161 | (13 | ) | (17 | ) | 73 | (1 | ) | (1 | ) | 28 | 17 | 17 | |||||||||||||||||||||||||||||||||||||||
| Relvar/Breo Ellipta |
971 | 1,089 | (11 | ) | (13 | ) | 381 | (34 | ) | (37 | ) | 282 | 11 | 12 | 308 | 21 | 19 | |||||||||||||||||||||||||||||||||||||||||
| Trelegy Ellipta |
518 | 156 | >100 | >100 | 382 | >100 | >100 | 102 | >100 | >100 | 34 | >100 | >100 | |||||||||||||||||||||||||||||||||||||||||||||
|
Nucala |
768 | 563 | 36 | 33 | 453 | 33 | 28 | 206 | 36 | 37 | 109 | 56 | 50 | |||||||||||||||||||||||||||||||||||||||||||||
| HIV |
4,854 | 4,722 | 3 | 1 | 3,004 | 3 | (1 | ) | 1,156 | (3 | ) | (2 | ) | 694 | 13 | 13 | ||||||||||||||||||||||||||||||||||||||||||
| Dolutegravir products |
4,633 | 4,420 | 5 | 2 | 2,938 | 4 | – | 1,086 | – | – | 609 | 22 | 22 | |||||||||||||||||||||||||||||||||||||||||||||
| Tivicay |
1,662 | 1,639 | 1 | (1 | ) | 977 | (6 | ) | (9 | ) | 395 | 5 | 6 | 290 | 28 | 28 | ||||||||||||||||||||||||||||||||||||||||||
| Triumeq |
2,549 | 2,648 | (4 | ) | (6 | ) | 1,611 | (4 | ) | (7 | ) | 626 | (11 | ) | (11 | ) | 312 | 15 | 15 | |||||||||||||||||||||||||||||||||||||||
| Juluca |
366 | 133 | >100 | >100 | 303 | >100 | >100 | 56 | >100 | >100 | 7 | >100 | >100 | |||||||||||||||||||||||||||||||||||||||||||||
| Dovato |
56 | – | – | – | 47 | – | – | 9 | – | – | – | – | – | |||||||||||||||||||||||||||||||||||||||||||||
| Epzicom/Kivexa |
75 | 117 | (36 | ) | (35 | ) | 3 | (57 | ) | (57 | ) | 23 | (48 | ) | (48 | ) | 49 | (26 | ) | (24 | ) | |||||||||||||||||||||||||||||||||||||
| Selzentry |
97 | 115 | (16 | ) | (17 | ) | 53 | (9 | ) | (12 | ) | 29 | (17 | ) | (14 | ) | 15 | (32 | ) | (32 | ) | |||||||||||||||||||||||||||||||||||||
| Other |
49 | 70 | (30 | ) | (31 | ) | 10 | (44 | ) | (44 | ) | 18 | (25 | ) | (29 | ) | 21 | (25 | ) | (25 | ) | |||||||||||||||||||||||||||||||||||||
|
Immuno-inflammation |
613 | 472 | 30 | 25 | 535 | 27 | 23 | 46 | 28 | 28 | 32 | >100 | 94 | |||||||||||||||||||||||||||||||||||||||||||||
|
Benlysta |
613 | 473 | 30 | 25 | 535 | 27 | 23 | 46 | 24 | 24 | 32 | >100 | 94 | |||||||||||||||||||||||||||||||||||||||||||||
| Oncology |
230 | – | – | – | 134 | – | – | 96 | – | – | – | – | – | |||||||||||||||||||||||||||||||||||||||||||||
|
Zejula |
229 | – | – | – | 134 | – | – | 95 | – | – | – | – | – | |||||||||||||||||||||||||||||||||||||||||||||
| Pharmaceuticals excluding established products | 8,778 | 7,806 | 12 | 10 | 5,415 | 10 | 6 | 2,081 | 13 | 14 | 1,282 | 22 | 21 | |||||||||||||||||||||||||||||||||||||||||||||
| Established pharmaceuticals |
8,776 | 9,463 | (7 | ) | (8 | ) | 1,987 | (22 | ) | (24 | ) | 2,044 | (8 | ) | (8 | ) | 4,745 | 1 | 1 | |||||||||||||||||||||||||||||||||||||||
| Established Respiratory |
3,900 | 4,316 | (10 | ) | (11 | ) | 1,415 | (21 | ) | (23 | ) | 807 | (13 | ) | (12 | ) | 1,678 | 4 | 3 | |||||||||||||||||||||||||||||||||||||||
| Seretide/Advair |
1,730 | 2,422 | (29 | ) | (29 | ) | 502 | (54 | ) | (56 | ) | 502 | (16 | ) | (16 | ) | 726 | – | (1 | ) | ||||||||||||||||||||||||||||||||||||||
| Flixotide/Flovent |
629 | 595 | 6 | 4 | 368 | 11 | 6 | 88 | (5 | ) | (4 | ) | 173 | 2 | 2 | |||||||||||||||||||||||||||||||||||||||||||
| Ventolin |
938 | 737 | 27 | 25 | 547 | 55 | 49 | 120 | (8 | ) | (7 | ) | 271 | 6 | 7 | |||||||||||||||||||||||||||||||||||||||||||
| Avamys/Veramyst |
324 | 300 | 8 | 6 | (2 | ) | >(100 | ) | >(100 | ) | 69 | (7 | ) | (5 | ) | 257 | 14 | 11 | ||||||||||||||||||||||||||||||||||||||||
| Other Respiratory |
279 | 262 | 6 | 2 | – | – | – | 28 | – | (4 | ) | 251 | 7 | 3 | ||||||||||||||||||||||||||||||||||||||||||||
| Dermatology |
445 | 435 | 2 | 3 | 3 | – | – | 159 | (1 | ) | (1 | ) | 283 | 4 | 6 | |||||||||||||||||||||||||||||||||||||||||||
| Augmentin |
602 | 570 | 6 | 6 | – | – | – | 172 | (5 | ) | (4 | ) | 430 | 11 | 11 | |||||||||||||||||||||||||||||||||||||||||||
| Avodart |
574 | 572 | – | (1 | ) | 4 | (67 | ) | (67 | ) | 208 | (13 | ) | (12 | ) | 362 | 13 | 11 | ||||||||||||||||||||||||||||||||||||||||
| Imigran/Imitrex |
138 | 141 | (2 | ) | (3 | ) | 59 | 2 | – | 52 | (9 | ) | (7 | ) | 27 | 4 | – | |||||||||||||||||||||||||||||||||||||||||
| Lamictal |
566 | 617 | (8 | ) | (10 | ) | 284 | (8 | ) | (12 | ) | 112 | (1 | ) | – | 170 | (12 | ) | (13 | ) | ||||||||||||||||||||||||||||||||||||||
| Seroxat/Paxil |
160 | 170 | (6 | ) | (6 | ) | – | – | – | 37 | (5 | ) | (5 | ) | 123 | (6 | ) | (7 | ) | |||||||||||||||||||||||||||||||||||||||
| Valtrex |
107 | 123 | (13 | ) | (15 | ) | 14 | (33 | ) | (38 | ) | 31 | 3 | 3 | 62 | (14 | ) | (15 | ) | |||||||||||||||||||||||||||||||||||||||
| Other |
2,284 | 2,519 | (9 | ) | (9 | ) | 208 | (40 | ) | (43 | ) | 466 | (5 | ) | (4 | ) | 1,610 | (4 | ) | (4 | ) | |||||||||||||||||||||||||||||||||||||
|
Pharmaceuticals |
17,554 | 17,269 | 2 | – | 7,402 | (1 | ) | (4 | ) | 4,125 | 1 | 2 | 6,027 | 5 | 4 | |||||||||||||||||||||||||||||||||||||||||||
GSK Annual Report 2020 247
|
|
||
|
|
Financial record continued
| Total | US | Europe | International | |||||||||||||||||||||||||||||||||||||||||||||||||||||||
| 2020 | 2019 | Growth | 2020 | Growth | 2020 | Growth | 2020 | Growth | ||||||||||||||||||||||||||||||||||||||||||||||||||
| Major products | £m | £m | £% | CER% | £m | £% | CER% | £m | £% | CER% | £m | £% | CER% | |||||||||||||||||||||||||||||||||||||||||||||
| Meningitis |
1,029 | 1,018 | 1 | 3 | 433 | 1 | 2 | 356 | 4 | 3 | 240 | (2 | ) | 4 | ||||||||||||||||||||||||||||||||||||||||||||
| Bexsero |
650 | 679 | (4 | ) | (2 | ) | 260 | – | 1 | 324 | 2 | 1 | 66 | (34 | ) | (20 | ) | |||||||||||||||||||||||||||||||||||||||||
| Menveo |
265 | 267 | (1 | ) | 1 | 173 | 2 | 3 | 26 | 44 | 39 | 66 | (16 | ) | (13 | ) | ||||||||||||||||||||||||||||||||||||||||||
| Other |
114 | 72 | 58 | 57 | – | – | – | 6 | – | – | 108 | 64 | 62 | |||||||||||||||||||||||||||||||||||||||||||||
| Influenza |
733 | 541 | 35 | 37 | 535 | 30 | 31 | 98 | 75 | 73 | 100 | 37 | 42 | |||||||||||||||||||||||||||||||||||||||||||||
| Fluarix, FluLaval |
733 | 541 | 35 | 37 | 535 | 30 | 31 | 98 | 75 | 73 | 100 | 37 | 42 | |||||||||||||||||||||||||||||||||||||||||||||
| Shingles |
1,989 | 1,810 | 10 | 11 | 1,675 | – | 1 | 186 | >100 | >100 | 128 | 47 | 49 | |||||||||||||||||||||||||||||||||||||||||||||
|
Shingrix |
1,989 | 1,810 | 10 | 11 | 1,675 | – | 1 | 186 | >100 | >100 | 128 | 47 | 49 | |||||||||||||||||||||||||||||||||||||||||||||
| Established vaccines |
3,231 | 3,788 | (15 | ) | (14 | ) | 1,054 | (24 | ) | (24 | ) | 801 | (23 | ) | (23 | ) | 1,376 | 1 | 3 | |||||||||||||||||||||||||||||||||||||||
| Infanrix, Pediarix |
629 | 733 | (14 | ) | (13 | ) | 311 | (14 | ) | (13 | ) | 174 | (18 | ) | (19 | ) | 144 | (10 | ) | (6 | ) | |||||||||||||||||||||||||||||||||||||
| Boostrix |
476 | 584 | (18 | ) | (18 | ) | 257 | (14 | ) | (13 | ) | 140 | (10 | ) | (11 | ) | 79 | (39 | ) | (36 | ) | |||||||||||||||||||||||||||||||||||||
| Hepatitis |
576 | 874 | (34 | ) | (33 | ) | 333 | (37 | ) | (36 | ) | 140 | (39 | ) | (39 | ) | 103 | (10 | ) | (6 | ) | |||||||||||||||||||||||||||||||||||||
| Rotarix |
559 | 558 | – | 1 | 123 | (12 | ) | (11 | ) | 119 | 6 | 6 | 317 | 4 | 5 | |||||||||||||||||||||||||||||||||||||||||||
| Synflorix |
402 | 468 | (14 | ) | (14 | ) | – | – | – | 53 | (2 | ) | (2 | ) | 349 | (16 | ) | (15 | ) | |||||||||||||||||||||||||||||||||||||||
| Priorix, Priorix Tetra, Varilrix |
261 | 232 | 13 | 14 | – | – | – | 126 | 26 | 25 | 135 | 2 | 5 | |||||||||||||||||||||||||||||||||||||||||||||
| Cervarix |
139 | 50 | >100 | >100 | – | – | – | 30 | 43 | 43 | 109 | >100 | >100 | |||||||||||||||||||||||||||||||||||||||||||||
| Other |
189 | 289 | (35 | ) | (35 | ) | 30 | (55 | ) | (56 | ) | 19 | (87 | ) | (87 | ) | 140 | 87 | 85 | |||||||||||||||||||||||||||||||||||||||
|
Vaccines |
6,982 | 7,157 | (2 | ) | (1 | ) | 3,697 | (5 | ) | (4 | ) | 1,441 | (3 | ) | (4 | ) | 1,844 | 5 | 7 | |||||||||||||||||||||||||||||||||||||||
£% represents growth at actual exchange rates. CER% represents growth at constant exchange rates.
Vaccines turnover 2019
| Total | US | Europe | International | |||||||||||||||||||||||||||||||||||||||||||||||||||||||
| 2019 | 2018 | Growth | 2019 | Growth | 2019 | Growth | 2019 | Growth | ||||||||||||||||||||||||||||||||||||||||||||||||||
| Major products | £m | £m | £% | CER% | £m | £% | CER% | £m | £% | CER% | £m | £% | CER% | |||||||||||||||||||||||||||||||||||||||||||||
| Meningitis |
1,018 | 881 | 16 | 15 | 430 | 15 | 10 | 343 | 2 | 3 | 245 | 43 | 50 | |||||||||||||||||||||||||||||||||||||||||||||
| Bexsero |
679 | 584 | 16 | 16 | 260 | 30 | 25 | 319 | 3 | 4 | 100 | 37 | 48 | |||||||||||||||||||||||||||||||||||||||||||||
| Menveo |
267 | 232 | 15 | 13 | 170 | (2 | ) | (6 | ) | 18 | 6 | 6 | 79 | 93 | 100 | |||||||||||||||||||||||||||||||||||||||||||
| Other |
72 | 65 | 11 | 11 | – | – | – | 6 | (25 | ) | (25 | ) | 66 | 16 | 16 | |||||||||||||||||||||||||||||||||||||||||||
| Influenza |
541 | 523 | 3 | 1 | 412 | 7 | 3 | 56 | (15 | ) | (15 | ) | 73 | 1 | 4 | |||||||||||||||||||||||||||||||||||||||||||
| Fluarix, FluLaval |
541 | 523 | 3 | 1 | 412 | 7 | 3 | 56 | (15 | ) | (15 | ) | 73 | 1 | 4 | |||||||||||||||||||||||||||||||||||||||||||
| Shingles |
1,810 | 784 | >100 | >100 | 1,669 | >100 | >100 | 54 | >100 | >100 | 87 | 78 | 76 | |||||||||||||||||||||||||||||||||||||||||||||
|
Shingrix |
1,810 | 784 | >100 | >100 | 1,669 | >100 | >100 | 54 | >100 | >100 | 87 | 78 | 76 | |||||||||||||||||||||||||||||||||||||||||||||
| Established vaccines |
3,788 | 3,706 | 2 | 1 | 1,394 | 15 | 11 | 1,035 | (11 | ) | (10 | ) | 1,359 | 1 | 2 | |||||||||||||||||||||||||||||||||||||||||||
| Infanrix, Pediarix |
733 | 680 | 8 | 6 | 360 | 22 | 17 | 213 | (20 | ) | (19 | ) | 160 | 36 | 35 | |||||||||||||||||||||||||||||||||||||||||||
| Boostrix |
584 | 517 | 13 | 11 | 299 | 13 | 9 | 156 | (4 | ) | (3 | ) | 129 | 43 | 44 | |||||||||||||||||||||||||||||||||||||||||||
| Hepatitis |
874 | 808 | 8 | 6 | 529 | 16 | 11 | 231 | (6 | ) | (5 | ) | 114 | 9 | 10 | |||||||||||||||||||||||||||||||||||||||||||
| Rotarix |
558 | 521 | 7 | 6 | 140 | 11 | 6 | 112 | 2 | 3 | 306 | 7 | 8 | |||||||||||||||||||||||||||||||||||||||||||||
| Synflorix |
468 | 424 | 10 | 11 | – | – | – | 54 | (7 | ) | (5 | ) | 414 | 13 | 13 | |||||||||||||||||||||||||||||||||||||||||||
| Priorix, Priorix Tetra, Varilrix |
232 | 305 | (24 | ) | (23 | ) | – | – | – | 100 | (37 | ) | (37 | ) | 132 | (9 | ) | (9 | ) | |||||||||||||||||||||||||||||||||||||||
| Cervarix |
50 | 138 | (64 | ) | (64 | ) | – | – | – | 21 | 5 | 5 | 29 | (75 | ) | (76 | ) | |||||||||||||||||||||||||||||||||||||||||
| Other |
289 | 313 | (8 | ) | (7 | ) | 66 | 3 | 2 | 148 | 8 | 10 | 75 | (33 | ) | (33 | ) | |||||||||||||||||||||||||||||||||||||||||
|
Vaccines |
7,157 | 5,894 | 21 | 19 | 3,905 | 45 | 39 | 1,488 | (5 | ) | (4 | ) | 1,764 | 8 | 9 | |||||||||||||||||||||||||||||||||||||||||||
£% represents growth at actual exchange rates. CER% represents growth at constant exchange rates.
248 GSK Annual Report 2020
|
Strategic report
| ||
|
Governance and remuneration
| ||
|
Financial statements
| ||
|
Investor information
|
Financial record continued
A record of financial performance is provided, analysed in accordance with current reporting practice. The information included in the Five year record is prepared in accordance with IFRS as adopted by the European Union and also with IFRS as issued by the International Accounting Standards Board.
| Group turnover by geographic region | 2020 £m |
2019 £m |
2018 £m |
2017 £m |
2016 £m |
|||||||||||||||
| US |
14,556 | 13,890 | 11,982 | 11,263 | 10,197 | |||||||||||||||
| Europe |
8,164 | 8,069 | 7,973 | 7,943 | 7,476 | |||||||||||||||
|
International |
11,379 | 11,795 | 10,866 | 10,980 | 10,216 | |||||||||||||||
| 34,099 | 33,754 | 30,821 | 30,186 | 27,889 | ||||||||||||||||
| Group turnover by segment | 2020 £m |
2019 £m |
2018 £m |
2017 £m |
2016 £m |
|||||||||||||||
| Pharmaceuticals |
17,056 | 17,554 | 17,269 | 17,276 | 16,104 | |||||||||||||||
| Vaccines |
6,982 | 7,157 | 5,894 | 5,160 | 4,592 | |||||||||||||||
| Consumer Healthcare |
10,033 | 8,995 | 7,658 | 7,750 | 7,193 | |||||||||||||||
| Segment turnover |
34,071 | 33,706 | 30,821 | 30,186 | 27,889 | |||||||||||||||
| Corporate and other unallocated turnover |
28 | 48 | – | – | – | |||||||||||||||
| 34,099 | 33,754 | 30,821 | 30,186 | 27,889 | ||||||||||||||||
| Pharmaceuticals turnover | 2020 £m |
2019 £m |
2018 £m |
2017 £m |
2016 £m |
|||||||||||||||
| Respiratory |
3,749 | 3,081 | 2,612 | 1,930 | 1,052 | |||||||||||||||
| HIV |
4,876 | 4,854 | 4,722 | 4,350 | 3,556 | |||||||||||||||
|
Immuno-inflammation |
727 | 613 | 472 | 377 | 340 | |||||||||||||||
| Oncology |
372 | 230 | – | – | – | |||||||||||||||
| Established Pharmaceuticals |
7,332 | 8,776 | 9,463 | 10,619 | 11,156 | |||||||||||||||
| 17,056 | 17,554 | 17,269 | 17,276 | 16,104 | ||||||||||||||||
| Vaccines turnover | 2020 £m |
2019 £m |
2018 £m |
2017 £m |
2016 £m |
|||||||||||||||
| Meningitis |
1,029 | 1,018 | 881 | 890 | 662 | |||||||||||||||
| Influenza |
733 | 541 | 523 | 488 | 414 | |||||||||||||||
| Shingles |
1,989 | 1,810 | 784 | 22 | – | |||||||||||||||
| Established Vaccines |
3,231 | 3,788 | 3,706 | 3,760 | 3,516 | |||||||||||||||
| 6,982 | 7,157 | 5,894 | 5,160 | 4,592 | ||||||||||||||||
| Consumer Healthcare turnover | 2020 £m |
2019 (revised) £m |
2018 (revised) £m |
2017 (revised) £m |
2016 (revised) £m |
|||||||||||||||
| Oral health |
2,753 | 2,673 | 2,496 | 2,466 | 2,223 | |||||||||||||||
| Pain relief |
2,219 | 1,781 | 1,440 | 1,465 | 1,329 | |||||||||||||||
| Vitamins, minerals and supplements |
1,506 | 611 | 103 | 105 | 101 | |||||||||||||||
| Respiratory health |
1,209 | 1,186 | 1,085 | 1,057 | 965 | |||||||||||||||
| Digestive health and other |
1,824 | 1,646 | 1,435 | 1,447 | 1,370 | |||||||||||||||
|
Sub-total |
9,511 | 7,897 | 6,559 | 6,540 | 5,988 | |||||||||||||||
| Brands divested/under review |
522 | 1,098 | 1,099 | 1,210 | 1,205 | |||||||||||||||
| 10,033 | 8,995 | 7,658 | 7,750 | 7,193 | ||||||||||||||||
GSK Annual Report 2020 249
|
|
||
|
|
Financial record continued
Five year record continued
| Financial results – Total | 2020 £m |
2019 £m |
2018 £m |
2017 £m |
2016 £m |
|||||||||||||||
| Turnover |
34,099 | 33,754 | 30,821 | 30,186 | 27,889 | |||||||||||||||
| Operating profit |
7,783 | 6,961 | 5,483 | 4,087 | 2,598 | |||||||||||||||
| Profit before taxation |
6,968 | 6,221 | 4,800 | 3,525 | 1,939 | |||||||||||||||
| Profit after taxation |
6,388 | 5,268 | 4,046 | 2,169 | 1,062 | |||||||||||||||
| pence | pence | pence | pence | pence | ||||||||||||||||
| Basic earnings per share |
115.5 | 93.9 | 73.7 | 31.4 | 18.8 | |||||||||||||||
| Diluted earnings per share |
114.1 | 92.6 | 72.9 | 31.0 | 18.6 | |||||||||||||||
| 2020 millions |
2019 millions |
2018 millions |
2017 millions |
2016 millions |
||||||||||||||||
| Weighted average number of shares in issue: |
||||||||||||||||||||
| Basic |
4,976 | 4,947 | 4,914 | 4,886 | 4,860 | |||||||||||||||
|
Diluted |
5,038 | 5,016 | 4,971 | 4,941 | 4,909 | |||||||||||||||
| Financial results – Adjusted | 2020 £m |
2019 £m |
2018 £m |
2017 £m |
2016 £m |
|||||||||||||||
| Turnover |
34,099 | 33,754 | 30,821 | 30,186 | 27,889 | |||||||||||||||
| Operating profit |
8,906 | 8,972 | 8,745 | 8,568 | 7,671 | |||||||||||||||
| Profit before taxation |
8,095 | 8,236 | 8,078 | 7,924 | 7,024 | |||||||||||||||
| Profit after taxation |
6,800 | 6,918 | 6,543 | 6,257 | 5,526 | |||||||||||||||
| pence | pence | pence | pence | pence | ||||||||||||||||
| Adjusted earnings per share |
115.9 | 123.9 | 119.4 | 111.8 | 100.6 | |||||||||||||||
| % | % | % | % | % | ||||||||||||||||
| Return on capital employed |
35.6 | 56.5 | 134.0 | 83.4 | 28.0 | |||||||||||||||
Return on capital employed is calculated as total profit before taxation as a percentage of average net assets over the year.
250 GSK Annual Report 2020
|
Strategic report
| ||
|
Governance and remuneration
| ||
|
Financial statements
| ||
|
Investor information
|
Financial record continued
Five year record continued
| Balance sheet | 2020 £m |
2019 £m |
2018 £m |
2017 £m |
2016 £m |
|||||||||||||||||||||||
| Non-current assets |
60,184 | 60,201 | 41,139 | 40,474 | 42,370 | |||||||||||||||||||||||
| Current assets |
20,247 | 19,491 | 16,927 | 15,907 | 16,711 | |||||||||||||||||||||||
| Total assets |
80,431 | 79,692 | 58,066 | 56,381 | 59,081 | |||||||||||||||||||||||
| Current liabilities |
(22,148 | ) | (24,050 | ) | (22,491 | ) | (26,569 | ) | (19,001 | ) | ||||||||||||||||||
| Non-current liabilities |
(37,475 | ) | (37,285 | ) | (31,903 | ) | (26,323 | ) | (35,117 | ) | ||||||||||||||||||
| Total liabilities |
(59,623 | ) | (61,335 | ) | (54,394 | ) | (52,892 | ) | (54,118 | ) | ||||||||||||||||||
| Net assets |
20,808 | 18,357 | 3,672 | 3,489 | 4,963 | |||||||||||||||||||||||
| Shareholders’ equity |
14,587 | 11,405 | 3,781 | (68 | ) | 1,124 | ||||||||||||||||||||||
| Non-controlling interests |
6,221 | 6,952 | (109 | ) | 3,557 | 3,839 | ||||||||||||||||||||||
| Total equity |
20,808 | 18,357 | 3,672 | 3,489 | 4,963 | |||||||||||||||||||||||
| Number of employees | ||||||||||||||||||||||||||||
| 2020 | 2019 | 2018 | 2017 | 2016 | ||||||||||||||||||||||||
| US |
15,706 | 16,676 | 13,804 | 14,526 | 14,491 | |||||||||||||||||||||||
| Europe |
40,711 | 40,524 | 41,943 | 43,002 | 42,330 | |||||||||||||||||||||||
|
International |
37,649 | 42,237 | 39,743 | 40,934 | 42,479 | |||||||||||||||||||||||
| 94,066 | 99,437 | 95,490 | 98,462 | 99,300 | ||||||||||||||||||||||||
| Manufacturing |
33,848 | 36,925 | 36,527 | 38,245 | 38,372 | |||||||||||||||||||||||
| Selling |
36,391 | 39,184 | 36,351 | 37,374 | 38,158 | |||||||||||||||||||||||
| Administration |
11,730 | 11,249 | 10,768 | 11,307 | 11,244 | |||||||||||||||||||||||
| Research and development |
12,097 | 12,079 | 11,844 | 11,536 | 11,526 | |||||||||||||||||||||||
| 94,066 | 99,437 | 95,490 | 98,462 | 99,300 | ||||||||||||||||||||||||
|
The geographic distribution of employees in the table above is based on the location of GSK’s subsidiary companies. The number of employees is the number of permanent employed staff at the end of the financial period. It excludes those employees who are employed and managed by GSK on a contract basis.
Exchange rates As a guide to holders of ADS, the following tables set out, for the periods indicated, information on the exchange rate of US Dollars for Sterling as reported by the Bank of England (4pm buying rate).
The average rate for the year is calculated as the average of the 4pm buying rates for each day of the year.
|
| |||||||||||||||||||||||||||
| 2020 | 2019 | 2018 | 2017 | 2016 | ||||||||||||||||||||||||
|
Average |
1.29 | 1.28 | 1.34 | 1.29 | 1.35 | |||||||||||||||||||||||
| |
2021 Mar |
|
|
2021 Feb |
|
2021 Jan |
|
2020 Dec |
|
2020 Nov |
|
2020 Oct |
|
2020 Sep |
||||||||||||||
| High |
1.40 | 1.41 | 1.37 | 1.36 | 1.34 | 1.32 | 1.35 | |||||||||||||||||||||
| Low |
1.39 | 1.36 | 1.35 | 1.32 | 1.29 | 1.29 | 1.27 | |||||||||||||||||||||
The 4pm buying rate on 3 March was £1= US$1.40.
GSK Annual Report 2020 251
|
|
||
|
|
Financial record continued
Five year record continued
| Adjusted results reconciliation 31 December 2020 |
Total results £m |
Intangible asset amortisation £m |
Intangible asset impairment £m |
Major restructuring £m |
Transaction- related £m |
Divestments, significant legal and other items £m |
Separation £m |
Adjusted results £m |
||||||||||||||||||||||||
| Turnover |
34,099 | 34,099 | ||||||||||||||||||||||||||||||
| Cost of sales |
(11,704 | ) | 699 | 31 | 667 | 116 | (10,191 | ) | ||||||||||||||||||||||||
| Gross profit |
22,395 | 699 | 31 | 667 | 116 | 23,908 | ||||||||||||||||||||||||||
| Selling, general and administration |
(11,456 | ) | 1 | 18 | 659 | (23 | ) | 16 | 68 | (10,717 | ) | |||||||||||||||||||||
| Research and development |
(5,098 | ) | 75 | 214 | 206 | (4,603 | ) | |||||||||||||||||||||||||
| Royalty income |
318 | 318 | ||||||||||||||||||||||||||||||
| Other operating (expense)/income |
1,624 | 1,215 | (2,839 | ) | – | |||||||||||||||||||||||||||
| Operating profit |
7,783 | 775 | 263 | 1,532 | 1,308 | (2,823 | ) | 68 | 8,906 | |||||||||||||||||||||||
| Net finance costs |
(848 | ) | 2 | 2 | (844 | ) | ||||||||||||||||||||||||||
| Share of after-tax profits of associates and joint ventures |
33 | 33 | ||||||||||||||||||||||||||||||
| Profit before taxation |
6,968 | 775 | 263 | 1,534 | 1,308 | (2,821 | ) | 68 | 8,095 | |||||||||||||||||||||||
| Taxation |
(580 | ) | (150 | ) | (47 | ) | (292 | ) | (229 | ) | 17 | (14 | ) | (1,295 | ) | |||||||||||||||||
| Tax rate |
8.3% | 16.0% | ||||||||||||||||||||||||||||||
| Profit after taxation |
6,388 | 625 | 216 | 1,242 | 1,079 | (2,804 | ) | 54 | 6,800 | |||||||||||||||||||||||
| Profit attributable to non-controlling interests |
639 | 392 | 1,031 | |||||||||||||||||||||||||||||
| Profit attributable to shareholders |
5,749 | 625 | 216 | 1,242 | 687 | (2,804 | ) | 54 | 5,769 | |||||||||||||||||||||||
| Earnings per share |
115.5p | 12.6p | 4.4p | 25.0p | 13.8p | (56.5)p | 1.1p | 115.9p | ||||||||||||||||||||||||
| Weighted average number of shares (millions) |
4,976 | 4,976 | ||||||||||||||||||||||||||||||
| Adjusted results reconciliation 31 December 2019 |
Total results £m |
Intangible asset amortisation £m |
Intangible asset impairment £m |
Major restructuring £m |
Transaction- £m |
Divestments, significant legal and other items £m |
Adjusted results £m |
|||||||||||||||||||||||||
| Turnover |
33,754 | 33,754 | ||||||||||||||||||||||||||||||
| Cost of sales |
(11,863 | ) | 713 | 30 | 658 | 383 | (10,079 | ) | ||||||||||||||||||||||||
| Gross profit |
21,891 | 713 | 30 | 658 | 383 | 23,675 | ||||||||||||||||||||||||||
| Selling, general and administration |
(11,402 | ) | 4 | 332 | 104 | 247 | (10,715 | ) | ||||||||||||||||||||||||
| Research and development |
(4,568 | ) | 64 | 49 | 114 | 2 | (4,339 | ) | ||||||||||||||||||||||||
| Royalty income |
351 | 351 | ||||||||||||||||||||||||||||||
| Other operating (expense)/income |
689 | 1 | (142 | ) | (548 | ) | – | |||||||||||||||||||||||||
| Operating profit |
6,961 | 777 | 83 | 1,105 | 345 | (299 | ) | 8,972 | ||||||||||||||||||||||||
| Net finance costs |
(814 | ) | 5 | (1 | ) | (810 | ) | |||||||||||||||||||||||||
| Share of after-tax profits of associates and joint ventures |
74 | 74 | ||||||||||||||||||||||||||||||
| Profit before taxation |
6,221 | 777 | 83 | 1,110 | 345 | (300 | ) | 8,236 | ||||||||||||||||||||||||
| Taxation |
(953 | ) | (156 | ) | (17 | ) | (208 | ) | (124 | ) | 140 | (1,318 | ) | |||||||||||||||||||
| Tax rate |
15.3% | 16.0% | ||||||||||||||||||||||||||||||
| Profit after taxation |
5,268 | 621 | 66 | 902 | 221 | (160 | ) | 6,918 | ||||||||||||||||||||||||
| Profit attributable to non-controlling interests |
623 | 164 | 787 | |||||||||||||||||||||||||||||
| Profit attributable to shareholders |
4,645 | 621 | 66 | 902 | 57 | (160 | ) | 6,131 | ||||||||||||||||||||||||
| Earnings per share |
93.9p | 12.6p | 1.3p | 18.2p | 1.2p | (3.3)p | 123.9p | |||||||||||||||||||||||||
| Weighted average number of shares (millions) |
4,947 | 4,947 | ||||||||||||||||||||||||||||||
252 GSK Annual Report 2020
|
Strategic report
| ||
|
Governance and remuneration
| ||
|
Financial statements
| ||
|
Investor information
|
Financial record continued
Five year record continued
| Adjusted results reconciliation 31 December 2018 |
Total results £m |
Intangible asset amortisation £m |
Intangible asset impairment £m |
Major restructuring £m |
Transaction- related £m |
Divestments, significant legal and other items £m |
Adjusted results £m |
|||||||||||||||||||||||||
| Turnover |
30,821 | 30,821 | ||||||||||||||||||||||||||||||
| Cost of sales |
(10,241 | ) | 536 | 69 | 443 | 15 | (9,178 | ) | ||||||||||||||||||||||||
| Gross profit |
20,580 | 536 | 69 | 443 | 15 | 21,643 | ||||||||||||||||||||||||||
| Selling, general and administration |
(9,915 | ) | 2 | 315 | 98 | 38 | (9,462 | ) | ||||||||||||||||||||||||
| Research and development |
(3,893 | ) | 44 | 45 | 49 | 20 | (3,735 | ) | ||||||||||||||||||||||||
| Royalty income |
299 | 299 | ||||||||||||||||||||||||||||||
| Other operating (expense)/income |
(1,588 | ) | 2 | 1,864 | (278 | ) | – | |||||||||||||||||||||||||
| Operating profit |
5,483 | 580 | 116 | 809 | 1,977 | (220 | ) | 8,745 | ||||||||||||||||||||||||
| Net finance costs |
(717 | ) | 4 | (3 | ) | 18 | (698 | ) | ||||||||||||||||||||||||
| Profit on disposal of associates |
3 | (3 | ) | – | ||||||||||||||||||||||||||||
| Share of after-tax profits of associates and joint ventures |
31 | 31 | ||||||||||||||||||||||||||||||
| Profit before taxation |
4,800 | 580 | 116 | 813 | 1,974 | (205 | ) | 8,078 | ||||||||||||||||||||||||
| Taxation |
(754 | ) | (109 | ) | (19 | ) | (170 | ) | (239 | ) | (244 | ) | (1,535 | ) | ||||||||||||||||||
| Tax rate |
15.7% | 19.0% | ||||||||||||||||||||||||||||||
| Profit after taxation |
4,046 | 471 | 97 | 643 | 1,735 | (449 | ) | 6,543 | ||||||||||||||||||||||||
| Profit attributable to non-controlling interests |
423 | 251 | 674 | |||||||||||||||||||||||||||||
| Profit attributable to shareholders |
3,623 | 471 | 97 | 643 | 1,484 | (449 | ) | 5,869 | ||||||||||||||||||||||||
| Earnings per share |
73.7p | 9.6p | 2.0p | 13.1p | 30.2p | (9.2)p | 119.4p | |||||||||||||||||||||||||
| Weighted average number of shares (millions) |
4,914 | 4,914 | ||||||||||||||||||||||||||||||
| Adjusted results reconciliation 31 December 2017 |
Total results £m |
Intangible asset amortisation £m |
Intangible asset impairment £m |
Major restructuring £m |
Transaction- £m |
Divestments, significant legal and other items £m |
US tax reform £m |
Adjusted results £m |
||||||||||||||||||||||||
| Turnover |
30,186 | 30,186 | ||||||||||||||||||||||||||||||
| Cost of sales |
(10,342 | ) | 546 | 400 | 545 | 80 | (8,771 | ) | ||||||||||||||||||||||||
| Gross profit |
19,844 | 546 | 400 | 545 | 80 | 21,415 | ||||||||||||||||||||||||||
| Selling, general and administration |
(9,672 | ) | 248 | 83 | (9,341 | ) | ||||||||||||||||||||||||||
| Research and development |
(4,476 | ) | 45 | 288 | 263 | 18 | (3,862 | ) | ||||||||||||||||||||||||
| Royalty income |
356 | 356 | ||||||||||||||||||||||||||||||
| Other operating (expense)/income |
(1,965 | ) | 1,519 | (220 | ) | 666 | – | |||||||||||||||||||||||||
| Operating profit |
4,087 | 591 | 688 | 1,056 | 1,599 | (119 | ) | 666 | 8,568 | |||||||||||||||||||||||
| Net finance costs |
(669 | ) | 4 | 8 | (657 | ) | ||||||||||||||||||||||||||
| Profit on disposal of associates |
94 | (94 | ) | – | ||||||||||||||||||||||||||||
| Share of after-tax profits of associates and joint ventures |
13 | 13 | ||||||||||||||||||||||||||||||
| Profit before taxation |
3,525 | 591 | 688 | 1,060 | 1,599 | (205 | ) | 666 | 7,924 | |||||||||||||||||||||||
| Taxation |
(1,356 | ) | (134 | ) | (176 | ) | (209 | ) | (619 | ) | (251 | ) | 1,078 | (1,667 | ) | |||||||||||||||||
| Tax rate |
38.5% | 21.0% | ||||||||||||||||||||||||||||||
| Profit after taxation |
2,169 | 457 | 512 | 851 | 980 | (456 | ) | 1,744 | 6,257 | |||||||||||||||||||||||
| Profit attributable to non-controlling interests |
637 | 42 | 114 | 793 | ||||||||||||||||||||||||||||
| Profit attributable to shareholders |
1,532 | 457 | 512 | 851 | 938 | (456 | ) | 1,630 | 5,464 | |||||||||||||||||||||||
| Earnings per share |
31.4p | 9.4p | 10.5p | 17.4p | 19.2p | (9.4)p | 33.3p | 111.8p | ||||||||||||||||||||||||
| Weighted average number of shares (millions) |
4,886 | 4,886 | ||||||||||||||||||||||||||||||
GSK Annual Report 2020 253
|
|
||
|
|
Financial record continued
Five year record continued
| Adjusted results reconciliation 31 December 2016 |
Total results £m |
Intangible asset amortisation £m |
Intangible asset impairment £m |
Major restructuring £m |
Transaction- £m |
Divestments, significant legal and other items £m |
Adjusted results £m |
|||||||||||||||||||||
| Turnover |
27,889 | 27,889 | ||||||||||||||||||||||||||
| Cost of sales |
(9,290 | ) | 547 | 7 | 297 | 86 | 2 | (8,351 | ) | |||||||||||||||||||
| Gross profit |
18,599 | 547 | 7 | 297 | 86 | 2 | 19,538 | |||||||||||||||||||||
| Selling, general and administration |
(9,366 | ) | 514 | 55 | (8,797 | ) | ||||||||||||||||||||||
| Research and development |
(3,628 | ) | 41 | 13 | 159 | (81 | ) | 28 | (3,468 | ) | ||||||||||||||||||
| Royalty income |
398 | 398 | ||||||||||||||||||||||||||
| Other operating (expense)/income |
(3,405 | ) | 3,914 | (509 | ) | – | ||||||||||||||||||||||
| Operating profit |
2,598 | 588 | 20 | 970 | 3,919 | (424 | ) | 7,671 | ||||||||||||||||||||
| Net finance costs |
(664 | ) | 4 | 8 | (652 | ) | ||||||||||||||||||||||
| Share of after-tax profits of associates and joint ventures |
5 | 5 | ||||||||||||||||||||||||||
| Profit before taxation |
1,939 | 588 | 20 | 974 | 3,919 | (416 | ) | 7,024 | ||||||||||||||||||||
| Taxation |
(877 | ) | (130 | ) | (5 | ) | (217 | ) | (439 | ) | 170 | (1,498 | ) | |||||||||||||||
| Tax rate |
45.2% | 21.3% | ||||||||||||||||||||||||||
| Profit after taxation |
1,062 | 458 | 15 | 757 | 3,480 | (246 | ) | 5,526 | ||||||||||||||||||||
| Profit attributable to non-controlling interests |
150 | 487 | 637 | |||||||||||||||||||||||||
| Profit attributable to shareholders |
912 | 458 | 15 | 757 | 2,993 | (246 | ) | 4,889 | ||||||||||||||||||||
| Earnings per share |
18.8p | 9.4p | 0.3p | 15.6p | 61.6p | (5.1)p | 100.6p | |||||||||||||||||||||
| Weighted average number of shares (millions) |
4,860 | 4,860 | ||||||||||||||||||||||||||
254 GSK Annual Report 2020
|
Strategic report
| ||
|
Governance and remuneration
| ||
|
Financial statements
| ||
|
Investor information
|
Pipeline, products and competition
Pharmaceuticals and Vaccines product development pipeline
| Key | † | In-license or other alliance relationship with third party, | NDA | New Drug Application (US) | ||||||
| with the exception of rituximab owned by Biogen MA Inc | A | Approved | ||||||||
| ^ | ViiV Healthcare, a global specialist HIV company with | S | Submitted | |||||||
| GSK, Pfizer, Inc. and Shionogi Limited as shareholders, | Phase I | Evaluation of clinical pharmacology, usually conducted | ||||||||
| is responsible for developing and delivering HIV medicines. | in volunteers | |||||||||
| * | GSK is contributing pandemic adjuvant to COVID-19 | Phase II | Determination of dose and initial evaluation of efficacy, | |||||||
| vaccines collaborations | conducted in a small number of patients | |||||||||
| BLA | Biological Licence Application | Phase III | Large comparative study (compound versus placebo | |||||||
| MAA | Marketing Authorisation Application (Europe) | and/or established treatment) in patients to establish | ||||||||
| clinical benefit and safety
| ||||||||||
MAA and NDA/BLA regulatory review milestones shown in the table below are those that have been achieved. Future filing dates are not included in this list.
For Oncology assets, only US/EU regulatory approvals/submissions and most advanced indication in the clinic are listed.
| Achieved regulatory review milestones | ||||||||||
|
| ||||||||||
| Compound | Mechanism of Action | Indication | Phase | MAA | NDA/BLA | |||||
| Oncology | ||||||||||
| Zejula (niraparib)† |
Poly (ADP-ribose) polymerase (PARP) 1/2 inhibitor | 1L maintenance ovarian cancer
1L maintenance ovarian cancer in combination with dostarlimab 1L maintenance non small cell lung cancer (NSCLC) |
Approved (PRIMA) III
III
|
A: Oct20 | A: Apr20 | |||||
| Blenrep belantamab mafodotin† |
ADC targeting B-cell maturation antigen | 4L+ multiple myeloma
3L+ multiple myeloma 2L+ multiple myeloma |
Approved (DREAMM2) III III |
A: Aug20 | A: Aug20 | |||||
| dostarlimab† | Anti-Programmed Cell Death protein 1 receptor (PD-1) antibody |
2L dMMR/MSI-H endometrial cancer 2L dMMR solid tumours 1L endometrial cancer |
Submitted Submitted III |
S: Mar20 | S: Dec19 S: Dec20 | |||||
| feladilimab (3359609)† |
ICOS receptor agonist without cell depletion | 1L relapsed/metastatic head and neck squamous cell carcinoma (HNSCC) |
II/III | |||||||
| bintrafusp alfa (M7824)† |
Transforming growth factor beta (TGFß) trap and immune checkpoint (PD-1) inhibitor | 1L biliary tract cancer (BTC) | II/III | |||||||
| letetresgene- autoleucel (3377794)† |
Engineered TCR T-cells targeting NY-ESO-1 | Synovial sarcoma | II (pivotal) |
|||||||
| cobolimab (TSR-022)† |
Anti-T-cell immunoglobulin and mucin domain-3 (TIM-3) antibody | Non-small cell lung cancer (NSCLC) | II | |||||||
| 3326595† | Protein arginine methyltransferase 5 (PRMT5) inhibitor | Solid tumours and haematological malignancies | I/II | |||||||
| 4074386 | Anti-lymphocyte activation gene-3 (LAG-3) | Cancer | I | |||||||
| (TSR-033)† | antibody | |||||||||
| 3368715† | Type I protein arginine methyltransferase (Type I PRMT) inhibitor | Cancer | I | |||||||
| 3745417 | STING cytosolic DNA pathway agonist | Cancer | I | |||||||
| 6097608† | CD96 antagonist | Cancer | I | |||||||
| 3901961† | Engineered TCR T-cells, co-expressing the CD8a cell surface receptor, targeting NY-ESO-1 | Cancer | I | |||||||
| 3845097† | Engineered TCR T-cells, co-expressing the dnTGF-ßRII cell surface receptor, targeting NY-ESO-1 | Cancer | I | |||||||
| HIV^ and Infectious Diseases | ||||||||||
| Rukobia fostemasavir |
HIV attachment inhibitor | HIV infection | Approved | A: Feb21 | A: Jul20 | |||||
| Cabenuva/ Vocabria cabotegravir + rilpivirine† |
HIV integrase strand transfer inhibitor + non-nucleoside reverse transcriptase inhibitor (NNRTI) (long-acting regimen) | HIV infection | Approved | A: Dec20 | A: Jan21 | |||||
| cabotegravir | HIV integrase strand transfer inhibitor (long-acting) | HIV pre-exposure prophylaxis | III | |||||||
| gepotidacin† | triazaacenaphthylene bacterial type II topoisomerase inhibitor | uncomplicated urinary tract infection (uUTI) and gonorrhea (GC) | III | |||||||
GSK Annual Report 2020 255
|
|
||
|
|
Pipeline, products and competition continued
Pharmaceuticals and Vaccines product development pipeline continued
| Achieved regulatory review milestones | ||||||||||
|
| ||||||||||
| Compound | Mechanism of Action | Indication | Phase | MAA | NDA/BLA | |||||
| HIV^ and Infectious Diseases continued | ||||||||||
| 4182136 (VIR-7831)† | anti-spike protein Antibody | COVID-19 | II/III | |||||||
| 3036656† | Leucyl t-RNA synthetase inhibitor | Tuberculosis | II | |||||||
| 3228836† | HBV antisense | Hepatitis B | II | |||||||
| 3640254 | HIV maturation inhibitor | HIV infection | II | |||||||
| 3186899† | CRK-12 inhibitor | Visceral leishmaniasis | I | |||||||
| 3810109† | HIV attachment inhibitor | HIV infection | I | |||||||
| 3739937 | HIV maturation inhibitor | HIV infection | I | |||||||
| 3882347† | FimH antagonist | uncomplicated urinary tract infection (uUTI) | I | |||||||
| 3494245† | Proteasome inhibitor | Visceral leishmaniasis | I | |||||||
| 2556286† | Mtb cholesterol dependent inhibitor | Tuberculosis | I | |||||||
| 3729098† | Ethionamide booster | Tuberculosis | I | |||||||
| 4182137 (VIR-7832)† | anti-spike protein Antibody | COVID-19 | I | |||||||
| Immuno-inflammation | ||||||||||
| Benlysta | B lymphocyte stimulator monoclonal antibody | Lupus Nephritis | Approved (US) Submitted (EU) | S: Jun20 | A: Dec20 | |||||
| Benlysta + rituximab† | B lymphocyte stimulator monoclonal antibody + cluster of differentiation 20 (CD20) monoclonal antibody | Systemic Lupus Erythematosus | III | |||||||
| otilimab (3196165)† | Granulocyte macrophage colony- stimulating factor inhibitor |
Rheumatoid arthritis COVID-19 related acute pulmonary disease |
III II |
|||||||
| 3858279† | CCL17 inhibitor | Osteoarthritis pain | I | |||||||
| 2982772 | RIP1 kinase inhibitor | Psoriasis | I | |||||||
| Respiratory | ||||||||||
| Trelegy (fluticasone furoate + vilanterol† + umeclidinium) |
Glucocorticoid agonist + long-acting beta2 agonist + muscarinic acetylcholine antagonist | Asthma | Approved (US) Submitted (EU) | S: Jan20 | A: Sep20 | |||||
| Nucala | Interleukin 5 (IL5) antagonist | Hypereosinophilic syndrome
Nasal polyposis
COPD |
Approved (US)/ Submitted (EU) Submitted (US/EU) III |
S:Oct20
S:Oct20 |
A:Sep20
S:Sep20 | |||||
| 3511294† | Interleukin 5 (IL5) antagonist (long-acting) | Asthma | III | |||||||
| 3923868 | PI4K beta inhibitor | Viral COPD exacerbations | I | |||||||
| Other Pharmaceuticals | ||||||||||
| daprodustat | Prolyl hydroxylase inhibitor | Anaemia associated with chronic renal disease | JNDA Approved III (RoW) | JNDA: Jun20 | ||||||
| linerixibat | Ileal bile acid transporter (IBAT) inhibitor | Cholestatic pruritus in PBC (primary biliary cholangitis) | II | |||||||
| 3439171† | Hematopoietic prostaglandin D2 synthase (H-PGDS) inhibitor | Duchenne muscular dystrophy | I | |||||||
| 2798745† | TRPV4 channel blocker | Diabetic macular edema (DME) | I | |||||||
| 3915393† | Transglutaminase 2 (TG2) inhibitor | Celiac disease | I | |||||||
256 GSK Annual Report 2020
|
Strategic report
| ||
|
Governance and remuneration
| ||
|
Financial statements
| ||
|
Investor information
|
Pipeline, products and competition continued
Pharmaceuticals and Vaccines product development pipeline continued
| Achieved regulatory review milestones | ||||||||||
|
| ||||||||||
| Compound | Vaccine Type | Indication | Phase | MAA | NDA/BLA | |||||
| Vaccines | ||||||||||
| Shingrix† | Recombinant protein – adjuvanted |
Herpes Zoster prophylaxis for immunocompromised | Approved (EU) Submitted (US) |
A: Jul 20 | S: Sep 20 | |||||
| Rotarix | Live attenuated, PCV (Porcine circovirus) free |
Rotavirus prophylaxis | Approved in EU (Variation) III (US) |
A: Feb 20 | ||||||
| Bexsero | Recombinant protein |
Meningococcal B disease prophylaxis in infants (US) | III | |||||||
| MMR | Live attenuated |
Measles, mumps, rubella prophylaxis (US) | III | |||||||
| Men ABCWY | Recombinant protein – conjugated |
Meningococcal A,B,C,W, Y disease prophylaxis in adolescents | III | |||||||
| RSV | Recombinant protein |
Respiratory syncytial virus prophylaxis in pregnant woman population to prevent respiratory syncytial virus lower respiratory tract illness in infants during first months of life by transfer of maternal antibodies† | III | |||||||
| Recombinant protein – adjuvanted |
Respiratory syncytial virus prophylaxis in older adult population† | III | ||||||||
| Replication-defective recombinant viral vector |
Respiratory syncytial virus prophylaxis in paediatric population | II | ||||||||
| Malaria next generation† (fractional dose) | Recombinant protein – adjuvanted |
Malaria prophylaxis (Plasmodium falciparum) | II | |||||||
| Menveo | Conjugated – Liquid formulation |
Meningococcal A,C,W, Y disease prophylaxis in adolescents | II | |||||||
| Shigella† | Bioconjugated (tetravalent) |
Shigella diarrhoea prophylaxis | II | |||||||
| Therapeutic HBV† | Prime-boost with viral vector vaccines co- or sequentially administrated with adjuvanted recombinant proteins | Treatment of chronic Hepatitis B infections – aims at functional cure by controlling and resolving the infection and reducing the need for further treatment | I/II | |||||||
| C. Difficile† | Recombinant protein – adjuvanted |
Active immunization for the prevention of the primary C. Difficile diseases and for prevention of recurrences | I | |||||||
| SAM (Rabies model) | Self-Amplifying mRNA |
Rabies prophylaxis | I | |||||||
| S. aureus† | Recombinant protein – bioconjugated – adjuvanted |
Active immunization for the prevention of primary and recurrent Soft-Skin-Tissue Infections caused by S. aureus | I | |||||||
| COVID-19 plant-derived virus-like particles vaccine (Medicago)†* | Recombinant protein – adjuvanted |
COVID-19 | II/III | |||||||
| COVID-19 vaccine (Sanofi)†* | Recombinant protein – adjuvanted |
COVID-19 | II | |||||||
| COVID-19 vaccine (SK Bioscience)†* | Recombinant protein nanoparticle – adjuvanted |
COVID-19 | I/II | |||||||
| SAM (COVID-19 model) | Self-Amplifying mRNA |
COVID-19 | I | |||||||
GSK Annual Report 2020 257
|
|
||
|
|
Pipeline, products and competition continued
Pharmaceutical products, competition and intellectual property
| Major competitor brands |
Patent expiry dates2 | |||||||||
|
| ||||||||||
| Products | Compounds | Indication(s) | US | EU | ||||||
| Respiratory | ||||||||||
| Anoro Ellipta | umeclidinium bromide/ vilanterol trifenatate | COPD | Stiolto Respimat, Utibron/Ultibro Breezhaler, Duaklir Genuair Bevespi Aerosphere, Brimica Genuair | 2027 (NCE) 2027-2030 (device/ formulation) |
2029 (NCE) 2022-2026 (device/ formulation) | |||||
| Arnuity Ellipta | fluticasone furoate | asthma | Beclazone, Pulmicort, Budesonide Gx, Asmanex, Alvesco | 2021 (NCE) 2027-2030 (device/ formulation) |
2023 (NCE) 2022-2026 (device/ formulation) | |||||
| Avamys/Veramyst | fluticasone furoate | rhinitis | Dymista, Xhance, Nasonex, Fluticasone Gx | 20211 | 2023 | |||||
| Flixotide/Flovent | fluticasone propionate | asthma/COPD | Beclazone, Pulmicort, Budesonide Gx, Asmanex, Alvesco | expired (Diskus device) 2023-2026 (HFA-device) |
expired (Diskus device) expired (HFA-device) | |||||
| Incruse Ellipta | umeclidinium bromide | COPD | Spiriva Handihaler/ Respimat, Yupelri, Braltus, Seebri Breezhaler, Bretaris Genuair | 2027 (NCE) 2027-2030 (device/formulation) |
2029 (NCE) 2022-2026 (device/formulation) | |||||
| Nucala | mepolizumab | severe eosinophilic asthma, EGPA hypereosinophilic syndrome | Xolair, Cinqair, Fasenra, Dupixent | expired3 | expired3 | |||||
| Relvar/Breo Ellipta | fluticasone furoate/ vilanterol trifenatate | asthma/COPD | Symbicort, Foster, Budesonide/Formetrol Gx Sirdupla, Dulera | 2025 (NCE) 2027-2030 (device/ formulation) |
2027 (NCE) 2022-2026 (device/formulation) | |||||
| Seretide/Advair | salmeterol xinafoate/ fluticasone propionate | asthma/COPD | Symbicort, Foster, Budesonide/Formetrol Gx Sirdupla, Dulera | expired (Diskus device) 2023-2026 (HFA-device) |
expired (Diskus device) expired (HFA-device) | |||||
| Trelegy Ellipta | fluticasone furoate/ vilanterol trifenatate umeclidinium bromide | COPD | Trimbow, Breztri Aerosphere, Trixeo Aerosphere, Enerzair Breezhaler | 2027 (NCE) 2027-2030 (device/ formulation) |
2029 (NCE) 2022-2026 (device/formulation) | |||||
| Ventolin HFA | albuterol sulphate | asthma/COPD | generic companies | 2023-2026 (HFA-device) |
expired (HFA-device) | |||||
| Anti-virals | ||||||||||
| Valtrex | valaciclovir | genital herpes, coldsores, shingles | Prevymis, Valacyclovir Gx, Valcyte | expired | expired | |||||
| Central nervous system | ||||||||||
| Lamictal | lamotrigine | epilepsy, bipolar disorder | Vimpat, Trokendi XR, Inovelon | expired | expired | |||||
| Imigran/Imitrex | sumatriptan | migraine | Zomig, Maxalt, Relpax | expired | expired | |||||
| Seroxat/Paxil | paroxetine | depression, various anxiety disorders | Trintellix, Aplenzin Viibryd, Zoloft | expired | expired | |||||
| Cardiovascular and urogenital | ||||||||||
| Avodart | dutasteride | benign prostatic hyperplasia | Harnal, Vesomni, Urorec | expired | expired | |||||
| Anti-bacterials | ||||||||||
| Augmentin | amoxicillin/clavulanate potassium | common bacterial infections | generic products | NA | expired | |||||
| 1 | Generic competition commenced in 2017. |
| 2 | Includes Supplementary Protection Certificates which were granted in multiple countries in EU and patent term extensions granted in the US. |
| 3 | Data exclusivity expires 2025 (EU) and 2027 (US). |
258 GSK Annual Report 2020
|
Strategic report
| ||
|
Governance and remuneration
| ||
|
Financial statements
| ||
|
Investor information
|
Pipeline, products and competition continued
Pharmaceutical products, competition and intellectual property continued
| Major competitor brands |
Patent expiry dates2 | |||||||||
|
| ||||||||||
| Products | Compounds | Indication(s) | US | EU | ||||||
| Oncology Zejula |
niraparib |
ovarian cancer | Lynparza, Rubraca | 2030 (NCE) |
2028 (NCE) | |||||
| Blenrep | belantamab mafodotin |
relapsed/refractory multiple myeloma | Sarclisa, Xpovio | 2032 | 2032 | |||||
| Immuno-inflammation |
||||||||||
| Benlysta, Benlysta (SC and IV) |
belimumab |
systemic lupus erythematosus, lupus nephritis | Lupkynis | 2025 | 2026 | |||||
| HIV | ||||||||||
| Juluca | dolutegravir, rilpivirine |
HIV/AIDS | Descovy, Genvoya, Odefsey, Biktarvy | 2027 (NCE) |
2029 (NCE) | |||||
| Dovato | dolutegravir, lamivudine |
HIV/AIDS | Descovy, Genvoya, Odefsey, Biktarvy | 2027 (NCE) |
2029 (NCE) | |||||
| Selzentry/Celsentri | maraviroc |
HIV/AIDS | Isentress, Intelence, Prezista | 2022 (NCE) |
2023 (NCE) | |||||
| Tivicay |
dolutegravir |
HIV/AIDS | Isentress, Prezista Symtuza, Reyataz, Biktarvy | 20271 (NCE) |
2029 (NCE) | |||||
| Triumeq | dolutegravir, lamivudine and abacavir | HIV/AIDS | Descovy, Genvoya Odefsey, Biktarvy | 2027 (NCE) |
2029 (NCE) | |||||
| Vaccine products, competition and intellectual property | ||||||||||
| Major competitor brands |
Patent expiry dates2 | |||||||||
|
| ||||||||||
| Products | Compounds | Indication(s) | US | EU | ||||||
| Bexsero | meningococcal group-B vaccine | Meningitis group B prevention | Trumenba | 2027 | 2028 | |||||
| Boostrix | diphtheria, tetanus, acellular pertussis | diphtheria, tetanus, acellular Pertussis booster vaccination | Adacel | expired | expired | |||||
| Infanrix Hexa/Pediarix | diphtheria, tetanus, pertussis, polio, hepatitis B, Haemophilus influenzae type B (EU) | Prophylaxis against diphtheria, tetanus, pertussis, polio, hepatitis B, Haemophilus influenzae type B (EU) | Pentacel, Pediacel, Pentaxim, Pentavac, Hexaxim, Hexyon Vaxelis | expired | expired | |||||
| Cervarix | HPV 16 & 18 virus like particles (VLPs), AS04 adjuvant (MPL + aluminium hydroxide) | human papilloma virus type 16 and 18 | Gardasil (Silgard) | 2028 | 2022 | |||||
| Fluarix Tetra | split inactivated influenza antigens (2 virus subtypes A and 2 subtype B) | seasonal influenza prophylaxis | Intenza, Flumist QIV, Vaxigrip QIV, Fluzone QIV, Fluzone High Dose | 2022 | 2022 | |||||
| FluLaval | split inactivated influenza antigens (2 virus subtypes A and 2 subtype B) | seasonal influenza prophylaxis | Vaxigrip, Mutagrip, Fluzone, Influvac, Aggripal, Fluad, Intenza, Flumist | 2022 | 2022 | |||||
| Menveo | meningococcal group A, C, W-135 and Y conjugate vaccine | Meningitis group A, C, W-135 and Y prophylaxis | Nimenrix, Menactra | 2025 | 2025 | |||||
| Prepandrix | derived split inactivated influenza virus antigen, AS03 adjuvant | pandemic H5N1 influenza prophylaxis | Aflunov, Vepacel | — | 2026 | |||||
| Priorix, Priorix Tetraa,b Varilrixb |
live attenuated measles, mumps, rubella and varicella vaccine | measles, mumps, rubella and chickenpox prophylaxis | MMR II (M-M-RVaxPro) Proquad, Varivax | expired | expired | |||||
| Rotarix | Human rotavirus RIX4414 strain | Rotavirus prophylaxis | Rotateq | 2022 | 2026 | |||||
| Synflorix | conjugated pneumococcal polysaccharide | Prophylaxis against invasive disease, pneumonia, acute otitis media | Prevenar (Prevnar) | NA | 2026 | |||||
| Shingrix | zoster vaccine recombinant, adjuvanted | herpes zoster (shingles) | Zostavax | 2026 | 2026 | |||||
| 1 | See Note 46 to the financial statements, ‘Legal proceedings’. |
| 2 | Includes Supplementary Protection Certificates which were granted in multiple countries in EU and patent term extensions granted in the US. |
| a | Related compounds/indications are measles, mumps and rubella vaccine/prophylaxis |
| b | Related compound is varicella vaccine |
GSK Annual Report 2020 259
|
|
||
|
|
Pipeline, products and competition continued
Consumer Healthcare products and competition
| Brand | Products | Application | Markets | Competition | ||||
| Oral health | ||||||||
| Sensodyne, Pronamel |
toothpastes, toothbrushes, mouth rinse | relief of dentinal hypersensitivity. Pronamel additionally protects against acid erosion | global | Colgate Sensitive Pro-Relief, Colgate-Palmolive Elmex, Colgate-Palmolive Oral B, Procter & Gamble | ||||
| parodontax/ Corsodyl | toothpaste, daily/medicated mouthwash, gel and spray | helps stop and prevent bleeding gums, treats and prevents gingivitis | global | Colgate Total Gum Health, Colgate-Palmolive Oral B Gum & Enamel Repair, Crest Gum Detoxify, Procter & Gamble | ||||
| Polident, Poligrip, Corega | denture adhesive, denture cleanser, wipes | improve retention and comfort of dentures, cleans dentures | global | Fixodent and Kukident, Procter & Gamble, Steradent, Reckitt Benckiser | ||||
| Aquafresh | toothpastes, toothbrushes mouthwashes | aids prevention of dental cavities, maintains healthy teeth, gums and fresh breath | global | Colgate, Colgate-Palmolive Crest, Procter & Gamble Oral-B, Procter & Gamble | ||||
| Pain relief | ||||||||
| Panadol and Panadol Cold & Flu |
tablets, caplets, infant syrup | paracetamol-based treatment for headache, joint pain, fever, cold symptoms | global (except US) | Aspirin, Bayer Tylenol, Johnson & Johnson Nurofen, Reckitt Benckiser | ||||
| Voltaren | topical gel | non-steroidal, diclofenac based anti-inflammatory | global | Salonpas, Hisamitsu Aspirin, Bayer Tylenol, Johnson & Johnson Nurofen, Reckitt Benckiser | ||||
| Advil non-respiratory range | tablets, caplets, gel caplets, liquid filled suspension, drops (children’s) | ibuprofen based treatment for headache, toothache, backache, menstrual cramps, muscular pains, minor pain of arthritis | US, Canada, Brazil, Colombia, Mexico | Tylenol, Tylenol PM, Tylenol Children’s Motrin, Motrin Children’s, Johnson & Johnson Aleve, Aleve PM, Bayer | ||||
| Vitamins, minerals and supplements | ||||||||
| Centrum | tablets, gummies, capsules, chewables | vitamin supplement | global | Nutralite, Infinitus Cheong-Kwan-Jung, By-Health, Nature Made, Herbalife, Swisse | ||||
| Caltrate | tablets, gummies, soft chews | calcium supplement | global | Citracal, Bayer, OS-Cal, Nature Made and private label | ||||
| Emergen-C | powder, gummies | immune support dietary supplement | US, Canada | Airborne, Reckitt Benckiser Zicam, Church & Dwight Nature made, Pharmavite Sambucol, Healthcare Brands International Ester-C, American Health | ||||
| Respiratory health | ||||||||
| Otrivin | nasal spray | nasal decongestant | Germany, Netherlands, Norway, Russia, Sweden | Afrin, Bayer, Nasivin, Proctor & Gamble, Tyzine, Johnson & Johnson | ||||
| Theraflu | hot liquids, tablets, syrups | cold and flu relief | Russia, Poland, US | Tylenol Cold & Flu, Johnson & Johnson Mucinex, Reckitt Benckiser Lemsip, Reckitt Benckiser | ||||
| Advil Respiratory Cold and Flu, Advil Respiratory Allergy | tablets | allergy relief and cold & flu relief | Tylenol Cold & Flu, Johnson & Johnson, Lemsip, Mucinex, Reckit Benckiser | |||||
| Flixonase/Flonase Piriton | nasal spray, tablets | allergy relief | US, China, UK, Ireland | Claritin, Bayer, Allegra, Sanofi Zyrtec, Johnson & Johnson | ||||
| Robitussin | syrup, tablets | cough/cold | US, Canada, Singapore, Philippines, Australia | Mucinex, Reckitt Benckiser Dimetapp, Foundation Consumer Healthcare | ||||
| Digestive health and other | ||||||||
| Zovirax Abreva | topical cream and non-medicated patch | lip care to treat and prevent the onset of cold sores | global | Compeed, Johnson & Johnson Carmex, Carma Labs Blistex, Blistex Incorporated retail own label | ||||
| ChapStick | lip balm | protect, moisturise, prevent and soothe chapped lips | global | Blistex, Burt’s Bees, Carmex, Carma Labs, EOS, Nivea, Beiersdorf, Vaseline, Unilever | ||||
| ENO | effervescent | immediate relief antacid | global (except US) | Estomazil, Hypermarca, Gelusil | ||||
| Tums | chewable tablets | immediate relief antacid | US | Alka-Seltzer, Bayer Gaviscon, Reckitt Benckiser Rolaids, Sanofi | ||||
| Nicorette (US), NicoDerm, Nicotinell (ex. Australia) | lozenges, gum and trans-dermal patches | treatment of nicotine withdrawal as an aid to smoking reduction and cessation | global | Nicorette, Johnson & Johnson NiQuitin, Perrigo | ||||
260 GSK Annual Report 2020
|
|
||
|
|
Principal risks and uncertainties continued
Patient safety continued
Product quality
262 GSK Annual Report 2020
|
Strategic report
| ||
|
Governance and remuneration
| ||
|
Financial statements
| ||
|
Investor information
|
Principal risks and uncertainties continued
Product quality continued
Financial controls and reporting
GSK Annual Report 2020 263
|
|
||
|
|
Principal risks and uncertainties continued
Financial controls and reporting continued
264 GSK Annual Report 2020
|
Strategic report
| ||
|
Governance and remuneration
| ||
|
Financial statements
| ||
|
Investor information
|
Principal risks and uncertainties continued
Anti-bribery and corruption (ABAC)
GSK Annual Report 2020 265
|
|
||
|
|
Principal risks and uncertainties continued
Commercial practices and pricing
266 GSK Annual Report 2020
|
Strategic report
| ||
|
Governance and remuneration
| ||
|
Financial statements
| ||
|
Investor information
|
Principal risks and uncertainties continued
Commercial practices continued
Non-promotional engagement
GSK Annual Report 2020 267
|
|
||
|
|
Non-promotional engagement continued
Privacy
268 GSK Annual Report 2020
|
Strategic report
| ||
|
Governance and remuneration
| ||
|
Financial statements
| ||
|
Investor information
|
Principal risks and uncertainties continued
Privacy continued
Research practices
GSK Annual Report 2020 269
|
|
||
|
|
Principal risks and uncertainties continued
Research practices continued
270 GSK Annual Report 2020
|
Strategic report
| ||
|
Governance and remuneration
| ||
|
Financial statements
| ||
|
Investor information
|
Environment, health and safety
GSK Annual Report 2020 271
|
|
||
|
|
Principal risks and uncertainties continued
Environmental sustainability
272 GSK Annual Report 2020
|
Strategic report
| ||
|
Governance and remuneration
| ||
|
Financial statements
| ||
|
Investor information
|
Information security
GSK Annual Report 2020 273
|
|
||
|
|
Principal risks and uncertainties continued
Supply continuity
274 GSK Annual Report 2020
|
Strategic report
| ||
|
Governance and remuneration
| ||
|
Financial statements
| ||
|
Investor information
|
Transformation
GSK Annual Report 2020 275
|
Strategic report
| ||
|
Governance and remuneration
| ||
|
Financial statements
| ||
|
Investor information
|
Shareholder information continued
Share capital and control continued
Nature of trading market
The following table sets out, for the periods indicated, the high and low middle market closing prices for the company’s Ordinary Shares on the LSE and for the ADS on the NYSE.
| Ordinary Shares | ADS | |||||||||||||||
| UK£ per share | US$ per share | |||||||||||||||
| High | Low | High | Low | |||||||||||||
| March 2021* |
12.09 | 12.01 | 34.24 | 33.73 | ||||||||||||
| February 2021 |
13.68 | 11.91 | 37.59 | 33.61 | ||||||||||||
| January 2021 |
14.14 | 13.42 | 39.24 | 36.80 | ||||||||||||
| December 2020 |
14.17 | 13.33 | 37.97 | 36.09 | ||||||||||||
| November 2020 |
14.68 | 13.25 | 39.17 | 34.40 | ||||||||||||
| October 2020 |
14.50 | 12.92 | 37.69 | 33.42 | ||||||||||||
| September 2020 |
15.33 | 14.35 | 39.90 | 37.38 | ||||||||||||
| Quarter ended 31 December 2020 |
14.68 | 12.92 | 39.17 | 33.42 | ||||||||||||
| Quarter ended 30 September 2020 |
16.60 | 14.35 | 42.16 | 37.38 | ||||||||||||
| Quarter ended 30 June 2020 |
17.42 | 14.89 | 42.74 | 37.14 | ||||||||||||
| Quarter ended 31 March 2020 |
18.46 | 13.75 | 47.89 | 31.85 | ||||||||||||
| Quarter ended 31 December 2019 |
18.19 | 16.36 | 47.32 | 41.19 | ||||||||||||
| Quarter ended 30 September 2019 |
17.45 | 15.90 | 42.68 | 39.68 | ||||||||||||
| Quarter ended 30 June 2019 |
16.07 | 15.02 | 41.88 | 38.64 | ||||||||||||
| Quarter ended 31 March 2019 |
15.97 | 14.36 | 41.87 | 37.83 | ||||||||||||
| Year ended 31 December 2019 |
18.19 | 14.36 | 47.32 | 37.83 | ||||||||||||
| Year ended 31 December 2018 |
16.22 | 12.43 | 41.94 | 35.49 | ||||||||||||
| Year ended 31 December 2017 |
17.22 | 12.76 | 44.37 | 34.66 | ||||||||||||
| Year ended 31 December 2016 |
17.23 | 13.45 | 45.49 | 37.39 | ||||||||||||
|
* to 3 March 2021 |
||||||||||||||||
GSK Annual Report 2020 277
|
|
||
|
|
Shareholder information continued
Analysis of shareholdings at 31 December 2020
| Number of accounts |
% of total accounts |
% of total shares |
Number of shares |
|||||||||||||
| Holding of shares |
||||||||||||||||
| Up to 1,000 |
73,707 | 71.20 | 0.47 | 25,340,430 | ||||||||||||
| 1,001 to 5,000 |
23,295 | 22.50 | 0.93 | 50,136,696 | ||||||||||||
| 5,001 to 100,000 |
5,413 | 5.23 | 1.55 | 83,179,656 | ||||||||||||
| 100,001 to 1,000,000 |
739 | 0.71 | 4.79 | 258,213,935 | ||||||||||||
| Over 1,000,000 |
374 | 0.36 | 92.26 | 4,968,318,900 | ||||||||||||
| 103,528 | 100.00 | 100.00 | 5,385,189,617 | |||||||||||||
| Held by |
||||||||||||||||
| Institutional and Corporate holders |
4,829 | 4.66 | 61.90 | 3,333,752,207 | ||||||||||||
| Individuals and other corporate bodies |
98,696 | 95.34 | 14.03 | 755,558,172 | ||||||||||||
| Guaranty Nominees Limited |
2 | 0.00 | 17.47 | 940,673,288 | ||||||||||||
| Held as Treasury shares by GlaxoSmithKline |
1 | 0.00 | 6.60 | 355,205,950 | ||||||||||||
J.P. Morgan Chase Bank, N.A. is the Depositary for the company’s American Depository Receipt (ADR) programme. The company’s ADS are listed on the NYSE. Ordinary Shares representing the company’s ADR programme, which is managed by the Depositary, are registered in the name of Guaranty Nominees Limited. At 3 March 2021, Guaranty Nominees Limited held 935,976,788 Ordinary Shares representing 18.60% of the issued share capital (excluding Treasury shares) at that date.
At 3 March 2021, the number of holders of Ordinary Shares in the US was 949 with holdings of 947,263 Ordinary Shares, and the number of registered holders of ADS was 19,411 with holdings of 467,988,394 ADS. Certain of these Ordinary Shares and ADS were held by brokers or other nominees. As a result, the number of holders of record or registered holders in the US is not representative of the number of beneficial holders or of the residence of beneficial holders.
278 GSK Annual Report 2020
|
Strategic report
| ||
|
Governance and remuneration
| ||
|
Financial statements
| ||
|
Investor information
|
Shareholder information continued
Tax information for shareholders continued
GSK Annual Report 2020 281
|
|
||
|
|
Other statutory disclosures
Shareholder services and contacts
Registrar
The company’s registrar is:
Equiniti Limited
Aspect House, Spencer Road, Lancing, BN99 6DA
www.shareview.co.uk
Tel: 0371 384 2991 (in the UK)*
Tel: +44 (0)121 415 7067 (outside the UK)
Equiniti provides a range of services for shareholders:
| Service
|
What it offers
|
How to participate
| ||
| Dividend Reinvestment Plan (DRIP) |
As an alternative to receiving cash dividends you may choose to reinvest your dividends to buy more GSK shares.
|
A DRIP election form can be downloaded from www.shareview.co.uk or requested by contacting Equiniti.
| ||
| Dividend payment direct to your bank account (Bank Mandate) | All dividends are paid directly into your bank or building society account. To receive your cash dividends, you must provide Equiniti with your bank or building society account details. This is a quick and secure method of payment.
|
A dividend bank mandate form can be downloaded from www.shareview.co.uk or requested by contacting Equiniti. | ||
| Dividend payment direct to bank account for overseas shareholders | Equiniti can convert your dividend into your local currency and send it direct to your local bank account. This service is available in over 100 countries worldwide.
|
For more details on this service and the costs involved please contact Equiniti. | ||
| Electronic communications | Shareholders may elect to receive electronic notifications of company communications including our Annual Report, dividend payments, dividend confirmations and the availability of online voting for all general meetings. Each time GSK publishes shareholder documents you will receive an email containing a link to the document or relevant website.
|
Please register at www.shareview.co.uk. | ||
| Shareview portfolio service | This enables you to create a free online portfolio to view your share balance and movements, update your address and dividend payment instructions and register your votes for our general meetings.
|
Please register at www.shareview.co.uk. | ||
| Deduplication of publications or mailings | If you receive duplicate copies of mailings, you may have more than one account. Please contact Equiniti and they will arrange for your accounts to be merged into one for your convenience and to avoid waste and unnecessary costs.
|
Please contact Equiniti. | ||
| Share dealing service† (please note that market trading hours are from 8.00am to 4.30pm UK time, Monday to Friday (excluding public holidays in England and Wales)) |
Shareholders may trade shares, either held in certificated form or in our Corporate Sponsored Nominee, online, by telephone or via postal dealing service provided by Equiniti Financial Services Limited. | For online transactions, please log on to: www.shareview.co.uk/dealing.
For telephone transactions, please call: 0345 603 7037 (in the UK) or +44 (0)121 415 7560 (outside the UK). Lines are open from 8.00am to 4.30pm UK time, Monday to Friday (excluding UK public holidays).
For postal transactions, please call: 0371 384 2991* to request a dealing form.
| ||
| Corporate Sponsored Nominee Account | This is a convenient way to manage your shares without requiring a share certificate. The service provides a facility for you to hold your shares in a nominee account sponsored by the company. You will continue to receive dividend payments and can attend and vote at the company’s general meetings. Shareholders’ names do not appear on the publicly available share register and the service is free to join.
|
An application form can be requested from www.shareview.co.uk or by contacting Equiniti. | ||
| Individual Savings Accounts (ISAs)† | The company has arranged for Equiniti Financial Services Limited to provide a GSK Corporate ISA to hold GSK shares. | Details are available from www.shareview.co.uk or can be requested by telephoning Equiniti, on 0345 300 0430. Lines are open 8.00am to 4.30pm for dealing, and until 6.00pm for enquiries Monday to Friday (excluding public holidays in England and Wales).
|
| * | Lines are open from 8.30am to 5.30pm, Monday to Friday (excluding public holidays in England and Wales). |
| † | The provision of share dealing details is not intended to be an invitation or inducement to engage in an investment activity. Advice on share dealing should be obtained from a stockbroker or independent financial adviser. |
282 GSK Annual Report 2020
|
Strategic report
| ||
|
Governance and remuneration
| ||
|
Financial statements
| ||
|
Investor information
|
Other statutory disclosures continued
Shareholders services and contacts continued
GSK Annual Report 2020 283
|
Strategic report
| ||
|
Governance and remuneration
| ||
|
Financial statements
| ||
|
Investor information
|
Other statutory disclosures continued
US law and regulation continued
GSK Annual Report 2020 285
|
|
||
|
|
Other statutory disclosures continued
Donations to political organisations and political expenditure
286 GSK Annual Report 2020
|
Strategic report
| ||
|
Governance and remuneration
| ||
|
Financial statements
| ||
|
Investor information
|
Other statutory disclosures continued
In accordance with Section 409 of the Companies Act 2006 a full list of subsidiaries, associates, joint ventures and joint arrangements, the address of the registered office and effective percentage of equity owned, as at 31 December 2020 are disclosed below. Unless otherwise stated the share capital disclosed comprises Ordinary shares which are indirectly held by GlaxoSmithKline plc. The percentage held by class of share is stated where this is less than 100%. Unless otherwise stated, all subsidiary companies have their registered office and are tax resident in their country of incorporation.
| Name | Security | Registered address | ||
| Wholly owned subsidiaries | ||||
| 1506369 Alberta ULC | Common | 3500 855-2nd Street SW, Calgary, AB, T2P 4J8, Canada | ||
| Action Potential Venture Capital Limited | Ordinary | 980 Great West Road, Brentford, Middlesex, TW8 9GS, England | ||
| Adechsa GmbH (ii) | Ordinary | c/o PRV Provides Treuhandgesellschaft AG, Dorfstrasse 38, Baar, 6341, Switzerland | ||
| Affymax Research Institute | Common | Corporation Service Company, 2710 Gateway Oaks Drive, Suite 150N, Sacramento, California, 95833, United States | ||
| Allen & Hanburys Limited (ii) | Ordinary | 980 Great West Road, Brentford, Middlesex, TW8 9GS, England | ||
| Allen & Hanburys Pharmaceutical Nigeria Limited | Ordinary | 24 Abimbola Way, Ilasamaja, Isolo, Lagos, Nigeria | ||
| Allen Farmaceutica, S.A. | Ordinary | Severo Ochoa, 2, Parque Tecnologico de Madrid, Tres Cantos, Madrid, 28760, Spain | ||
| Allen Pharmazeutika Gesellschaft m.b.H. | Ordinary | Wagenseilgasse 3, Euro Plaza, Gebäude I, 4. Stock, Vienna, A-1120, Austria | ||
| Beecham Group p.l.c | 20p Shares ‘A’; 5p Shares ‘B’ | 980 Great West Road, Brentford, Middlesex, TW8 9GS, England | ||
| Beecham Pharmaceuticals (Pte) Limited | Ordinary | 38 Quality Road, Jurong Industrial Estate, Jurong, 618809, Singapore | ||
| Beecham Portuguesa-Produtos Farmaceuticos e Quimicos, Lda | Ordinary Quota | Rua Dr Antonio Loureiro Borges No 3, Arquiparque, Miraflores, Alges, 1495-131, Portugal | ||
| Beecham S.A. (ii) | Ordinary | Parc de la Noire Epine, Avenue Fleming 20, 1300 Wavre, Belgium | ||
| Biovesta Ilaçlari Ltd. Sti. (ii) | Nominative | Büyükdere Caddesi No. 173, 1.Levent Plaza B Blok, 1.Levent, Istanbul, 34394, Turkey | ||
| Cascan GmbH & Co. KG | Partnership Capital | Prinzregentenplatz 9, D-81675, Munich, Germany | ||
| Castleton Investment Ltd (in liquidation) | Ordinary | c/o DTOS, 19 Cybercity, 10th Floor Standard Chartered Tower, Ebene, Mauritius | ||
| Cellzome GmbH | Ordinary | Meyerhofstrasse 1, Heidelberg, 69117, Germany | ||
| Cellzome, Inc. (Merged into GlaxoSmithKline LLC 31 Dec 2020) | Common; Series A Preferred; Series B Preferred; Series C-1 Convertible Preferred; Series C-3 Convertible Preferred |
Corporation Service Company, 251 Little Falls Drive, Wilmington, Delaware, 19808, United States | ||
| Charles Midgley Limited (ii) | Ordinary; 7% Cumulative Preference | 980 Great West Road, Brentford, Middlesex, TW8 9GS, England | ||
| Clarges Pharmaceuticals Trustees Limited (ii) (iv) | Ordinary | 980 Great West Road, Brentford, Middlesex, TW8 9GS, England | ||
| Colleen Corporation | Common | Corporation Service Company, 251 Little Falls Drive, Wilmington, Delaware, 19808, United States | ||
| Corixa Corporation | Common | Corporation Service Company, 251 Little Falls Drive, Wilmington, Delaware, 19808, United States | ||
| Coulter Pharmaceutical, Inc. (ii) | Common | Corporation Service Company, 251 Little Falls Drive, Wilmington, Delaware, 19808, United States | ||
| Dealcyber Limited | Ordinary | 980 Great West Road, Brentford, Middlesex, TW8 9GS, England | ||
| Desarrollo Energia Solar Alternativa S.L. | Ordinary | Severo Ochoa, 2, Parque Tecnologico de Madrid, Tres Cantos, Madrid, 28760, Spain | ||
| Duncan Flockhart Australia Pty Limited (ii) (iv) | Ordinary | 1061 Mountain Highway, Boronia, VIC, 3155, Australia | ||
| Etex Farmaceutica Ltda | Social Capital | Avenue Andres Bello 2687, Piso 19, Las Condes, Santiago, C.P. 7550611, Chile | ||
| Fipar (Thailand) Ltd (in liquidation) | Ordinary | 12th Floor Wave Place, 55 Wireless Road, Lumpini, Pathumwan, Bangkok, 10330, Thailand | ||
| Genelabs Technologies, Inc. | Common | Corporation Service Company, 2710 Gateway Oaks Drive, Suite 150N, Sacramento, California, CA, 95833, United States | ||
| Glaxo Group Limited | Ordinary | 980 Great West Road, Brentford, Middlesex, TW8 9GS, England | ||
| Glaxo Kabushiki Kaisha (ii) | Ordinary | 1-8-1 Akasaka Minato-Ku, Tokyo, Japan | ||
| Glaxo Laboratories (Nigeria) Limited (ii) | Ordinary | 82 Marine Road, Apapa, Lagos, Nigeria | ||
| Glaxo Laboratories Limited (in liquidation) | Ordinary | 55 Baker Street, London, W1U 7EU, England | ||
| Glaxo New Zealand Pension Plan Trustee Limited | Ordinary | Level 2 E.2,Generator at GridAKL, 12 Madden Street, Wynyard Quarter, Auckland 1010, New Zealand | ||
| Glaxo Operations UK Limited | Ordinary | 980 Great West Road, Brentford, Middlesex, TW8 9GS, England | ||
| Glaxo Properties BV | Ordinary | Van Asch van Wijckstraat 55h, 3811 LP, Amersfoort, Netherlands | ||
GSK Annual Report 2020 287
|
|
||
|
|
Other statutory disclosures continued
Group companies continued
| Name | Security | Registered address | ||
| Wholly owned subsidiaries continued | ||||
| Glaxo Trustees Limited (in liquidation) | Ordinary | 55 Baker Street, London, W1U 7EU, England | ||
| Glaxo Verwaltungs GmbH | Ordinary | Industriestrasse 32-36, Bad Oldesloe, 23843, Germany | ||
| Glaxo Wellcome Australia Pty Ltd (ii) (iv) | Ordinary | 1061 Mountain Highway, Boronia, VIC, 3155, Australia | ||
| Glaxo Wellcome Farmaceutica, Limitada | Ordinary Quota | Rua Dr Antonio Loureiro Borges No 3, Arquiparque, Miraflores, Alges, 1495-131, Portugal | ||
| Glaxo Wellcome International B.V. (ii) (iii) | Ordinary | Huis ter Heideweg 62, 3705 LZ, Zeist, Netherlands | ||
| Glaxo Wellcome Manufacturing Pte Ltd | Ordinary | 1 Pioneer Sector 1, Jurong Industrial Estate, Jurong, 628413, Singapore | ||
| Glaxo Wellcome Production S.A.S. | Ordinary | 23 rue François Jacob, 92500, Rueil-Malmaison, France | ||
| Glaxo Wellcome Vidhyasom Limited (ii) | Ordinary | 12th Floor Wave Place, 55 Wireless Road, Lumpini, Pathumwan, Bangkok, 10330, Thailand | ||
| Glaxo Wellcome, S.A. | Ordinary | Poligono Industrial Allendeduero, Avenida de Extremadura, 3, Aranda de Duero, Burgos, 09400, Spain | ||
| Glaxo, S.A. | Ordinary | Severo Ochoa, 2, Parque Tecnologico de Madrid, Tres Cantos, Madrid, 28760, Spain | ||
| Glaxo-Allenburys (Nigeria) Limited (ii) | Ordinary | 41 Creek Road, Apapa, Lagos, PMB 1401, Nigeria | ||
| Glaxochem Pte Ltd (iii) | Ordinary | 23 Rochester Park, 139234, Singapore | ||
| GlaxoSmithKline – Produtos Farmaceuticos, Limitada | Ordinary Quota | Rua Dr Antonio Loureiro Borges No 3, Arquiparque, Miraflores, Alges, 1495-131, Portugal | ||
| GlaxoSmithKline (Cambodia) Co., Ltd. (in liquidation) | Ordinary | 5th Floor DKSH Building, No. 797 Preah Monivong Boulevard (Corner of Street 484), Sangkat Phsar Deum Thakov, Khan Chamkarmon, Phnom Penh, Cambodia | ||
| GlaxoSmithKline (China) Investment Co Ltd | Ordinary | Room 901, 902, 903, 905, 908, 909 and 910, Unit 901, Floor 9, No.56 Mid 4th East Ring Road, Chaoyang District, Beijing, China | ||
| GlaxoSmithKline (China) R&D Company Limited | Equity | F1-3, No. 18 building, 999 Huanke Road, Pilot Free Trade Zone, Shanghai, 201210, China | ||
| GlaxoSmithKline (Cyprus) Limited | Ordinary | Arch. Makariou III, 2-4, Capital Center, 9th Floor, Nicosia, P.C. 1505, Cyprus | ||
| GlaxoSmithKline (GSK) S.R.L. | Ordinary | 1-5 Costache Negri Street, Opera Center One, 5th and 6th floors, Zone 1, District 5, Bucharest, Romania | ||
| GlaxoSmithKline (Ireland) Limited | Ordinary | 12 Riverwalk Citywest Business Campus, Dublin, 24, Ireland | ||
| GlaxoSmithKline (Israel) Ltd | Ordinary | 25 Basel Street, PO Box 10283, Petach-Tikva, 49002, Israel | ||
| GlaxoSmithKline (Malta) Limited | Ordinary | 1, First Floor, De La Cruz Avenue, Qormi, QRM2458, Malta | ||
| GlaxoSmithKline (Private) Limited (ii) | Ordinary | Unit 3, 20 Anthony Road, Msasa, Harare, Zimbabwe | ||
| GlaxoSmithKline (Thailand) Limited | Ordinary | 12th Floor Wave Place, 55 Wireless Road, Lumpini, Pathumwan, Bangkok, 10330, Thailand | ||
| GlaxoSmithKline AB | Ordinary | Hemvarnsg. 9, Solna, 171 54, Sweden | ||
| GlaxoSmithKline AG | Ordinary | Talstrasse 3-5, 3053 Muenchenbuchsee, Switzerland | ||
| GlaxoSmithKline Angola Unipessoal Limitada (iv) | Quotas | Luanda, Bairro Petrangol, Estrada de Cacuaco n° 288, Angola | ||
| GlaxoSmithKline Argentina S.A. | Ordinary | Tucumán 1, piso 4, Buenos Aires, C1049AAA, Argentina | ||
| GlaxoSmithKline AS | Ordinary | Drammensveien 288, 0283 Oslo, Norway | ||
| GlaxoSmithKline Asia Pvt. Limited | Equity | Patiala Road, Nabha 147201, Dist Patiala, Punjab, India | ||
| GlaxoSmithKline Australia Pty Ltd | Ordinary | 1061 Mountain Highway, Boronia, VIC, 3155, Australia | ||
| GlaxoSmithKline B.V. | Ordinary | Van Asch van, Wijckstraat 55h, 3811 LP Amersfoort, The Netherlands, Netherlands | ||
| GlaxoSmithKline Beteiligungs GmbH | Ordinary | Prinzregentenplatz 9, Munchen, 81675, Germany | ||
| GlaxoSmithKline Biologicals (Shanghai) Ltd. | Ordinary | 277 Niudun Road, Pilot Free Trade Zone, Shanhai, China | ||
| GlaxoSmithKline Biologicals Kft. | Ordinary | 2100 Gödöllõ, Homoki Nagy István utca 1, Hungary | ||
| GlaxoSmithKline Biologicals S.A.S. | Ordinary | 637 Rue des Aulnois, Saint-Amand Les Eaux, 59230, France | ||
| GlaxoSmithKline Biologicals SA | Ordinary; Preference | Rue de l’Institut 89, B-1330 Rixensart, Belgium | ||
| GlaxoSmithKline Brasil Limitada | Quotas | Estrada dos Bandeirantes, 8464, Rio de Janeiro, 22783-110, Brazil | ||
| GlaxoSmithKline Capital Inc. | Common | Wilmington Trust SP Services Inc., 1105 North Market Street, Suite 1300, Wilmington, Delaware, 19801, United States | ||
| GlaxoSmithKline Capital plc | Ordinary | 980 Great West Road, Brentford, Middlesex, TW8 9GS, England | ||
| GlaxoSmithKline Caribbean Limited | Ordinary | 980 Great West Road, Brentford, Middlesex, TW8 9GS, England | ||
| GlaxoSmithKline Chile Farmaceutica Limitada | Social Capital | Avenue Andres Bello No. 2687, Piso 19, Las Condes, Santiago, C.P. 7550611, Chile | ||
| GlaxoSmithKline Colombia S.A. | Ordinary | Avenida El Dorado, #69B-45/Piso 9, Bogota, Colombia | ||
| GlaxoSmithKline Consumer Healthcare Holdings Limited (i) | Ordinary | 980 Great West Road, Brentford, Middlesex, TW8 9GS, England | ||
| GlaxoSmithKline Consumer Healthcare Investments (Ireland) Limited (iii) (in liquidation) | Ordinary | Knockbrack, Dungarvan, Co Waterford, X35 RY76, Ireland | ||
| GlaxoSmithKline Consumer Healthcare Ireland IP Limited (iii) (in liquidation) | Ordinary | Knockbrack, Dungarvan, Co Waterford, X35 RY76, Ireland | ||
| GlaxoSmithKline Consumer Holding B.V. (ii) | Ordinary | Van Asch van Wijckstraat 55h, 3811 LP, Amersfoort, Netherlands | ||
288 GSK Annual Report 2020
|
Strategic report
| ||
|
Governance and remuneration
| ||
|
Financial statements
| ||
|
Investor information
|
Other statutory disclosures continued
Group companies continued
| Name | Security | Registered address | ||
| Wholly owned subsidiaries continued | ||||
| GlaxoSmithKline d.o.o | Quotas | Zmja od Bosne broj 7-7a, Sarajevo, 71000, Bosnia and Herzegovina | ||
| GlaxoSmithKline d.o.o. | Equity capital | Ulica Damira Tomljanovica Gavrana 15, Zagreb, Croatia | ||
| GlaxoSmithKline doo Beograd | Ordinary | Omladinskih brigada 88, New Belgrade, City of Belgrade, 11070, Serbia | ||
| GlaxoSmithKline Ecuador S.A. | Ordinary | Av 10 De Agosto N36-239, y Naciones Unidas, Edificio Electroectuatoriana, 2do piso, Quito, Ecuador | ||
| GlaxoSmithKline Eesti OU | Ordinary | Lõõtsa 8a, Tallinn, 11415, Estonia | ||
| GlaxoSmithKline El Salvador S.A. de C.V. | Ordinary | Municipio de San Salvador, Departamento de San Salvador, El Salvador | ||
| GlaxoSmithKline EOOD | Ordinary | 115 G Tsarigradsko Shose Blvd., floor 9, Mladost Region, Sofia, 1784, Bulgaria | ||
| GlaxoSmithKline Export Limited | Ordinary | 980 Great West Road, Brentford, Middlesex, TW8 9GS, England | ||
| GlaxoSmithKline Export Panama S.A. | Ordinary | Panama City, Republic of Panama, Panama | ||
| GlaxoSmithKline Far East B.V. | Ordinary | Van Asch van Wijckstraat 55h, 3811 LP, Amersfoort, Netherlands | ||
| GlaxoSmithKline Finance plc | Ordinary | 980 Great West Road, Brentford, Middlesex, TW8 9GS, England | ||
| GlaxoSmithKline GmbH & Co. KG | Partnership Capital | Prinzregentenplatz 9, Munchen, 81675, Germany | ||
| GlaxoSmithKline Guatemala S.A. | Ordinary | 3ra. Av. 13-78 Zona 10, Torre Citibank, Nivel 8, Guatemala City, Guatemala | ||
| GlaxoSmithKline Holding AS | Ordinary | Drammensveien 288, 0283 Oslo, Norway | ||
| GlaxoSmithKline Holdings (Americas) Inc. | Common | Wilmington Trust SP Services Inc., 1105 North Market Street, Suite 1300, Wilmington, Delaware, 19801, United States | ||
| GlaxoSmithKline Holdings (Ireland) Limited | Ordinary; Deferred | 980 Great West Road, Brentford, Middlesex, TW8 9GS, England | ||
| GlaxoSmithKline Holdings (One) Limited (i) | Ordinary | 980 Great West Road, Brentford, Middlesex, TW8 9GS, England | ||
| GlaxoSmithKline Holdings Limited (i) | Ordinary | 980 Great West Road, Brentford, Middlesex, TW8 9GS, England | ||
| GlaxoSmithKline Holdings Pty Ltd | Ordinary | 1061 Mountain Highway, Boronia, VIC, 3155, Australia | ||
| GlaxoSmithKline Honduras S.A. | Ordinary | Tegucigalpa, MDC, Honduras | ||
| GlaxoSmithKline IHC Limited | Ordinary | 980 Great West Road, Brentford, Middlesex, TW8 9GS, England | ||
| GlaxoSmithKline Ilaclari Sanayi ve Ticaret A.S. | Nominative | Büyükdere Caddesi No. 173, 1.Levent Plaza B Blok, 1.Levent, Istanbul, 34394, Turkey | ||
| GlaxoSmithKline Inc. | Class A Common; Class C Preference | 7333 Mississauga Road North, Mississauga, ON, L5N 6L4, Canada | ||
| GlaxoSmithKline Insurance Ltd. | Ordinary | 19 Par-La-Ville Road, Hamilton, HM11, Bermuda | ||
| GlaxoSmithKline Intellectual Property (No.2) Limited | Ordinary | 980 Great West Road, Brentford, Middlesex, TW8 9GS, England | ||
| GlaxoSmithKline Intellectual Property Development Limited | Ordinary | 980 Great West Road, Brentford, Middlesex, TW8 9GS, England | ||
| GlaxoSmithKline Intellectual Property Holdings Limited | A Ordinary; B Ordinary | 980 Great West Road, Brentford, Middlesex, TW8 9GS, England | ||
| GlaxoSmithKline Intellectual Property Limited | Ordinary; Deferred | 980 Great West Road, Brentford, Middlesex, TW8 9GS, England | ||
| GlaxoSmithKline Intellectual Property Management Limited | Ordinary | 980 Great West Road, Brentford, Middlesex, TW8 9GS, England | ||
| GlaxoSmithKline Investigación y Desarrollo, S.L. | Ordinary | Severo Ochoa 2 Parque Tecnológico de Madrid, Tres Cantos, Madrid, 28760, Spain | ||
| GlaxoSmithKline Investment Holdings Limited (In liquidation) | Ordinary | 55 Baker Street, London, W1U 7EU, England | ||
| GlaxoSmithKline Investment Services Limited (In liquidation) | Ordinary | 55 Baker Street, London, W1U 7EU, England | ||
| GlaxoSmithKline Investments (Ireland) Limited (iii) (in liquidation) | Ordinary | 12 Riverwalk Citywest Business Campus, Dublin, 24 Ireland | ||
| GlaxoSmithKline Investments Pty Ltd | Ordinary | 1061 Mountain Highway, Boronia, VIC, 3155, Australia | ||
| GlaxoSmithKline K.K. | Ordinary | 1-8-1 Akasaka Minato-Ku, Tokyo, Japan | ||
| GlaxoSmithKline Korea Limited | Ordinary | 9F LS Yongsan Tower 92, Hangangdae-ro Yongsan-gu, Seoul, 04386, Republic of Korea | ||
| GlaxoSmithKline Latin America, S.A. | Ordinary | Panama City, Republic of Panama, Panama | ||
| GlaxoSmithKline Latvia SIA | Ordinary | Duntes iela 3, Riga, Latvia | ||
| GlaxoSmithKline Lietuva UAB | Ordinary | Ukmerges st. 120, Vilnius, LT-08105, Lithuania | ||
| GlaxoSmithKline Limited | Ordinary | 23/F., Tower 6, The Gateway, 9 Canton Road, Tsimshatsui, Kowloon, Hong Kong | ||
| GlaxoSmithKline LLC | LLC Interests | Corporation Service Company, 251 Little Falls Drive, Wilmington, Delaware, 19808, United States | ||
| GlaxoSmithKline Manufacturing SpA | Ordinary | Via Alessandro Fleming 2, Verona, 37135, Italy | ||
| GlaxoSmithKline Maroc S.A. | Ordinary | 42-44 Angle Bd, Rachidi et Abou Hamed El Glaza, Casablanca, Morocco | ||
| GlaxoSmithKline Medical and Healthcare Products Limited | Ordinary | H-1124, Csorsz utca 43, Budapest, Hungary | ||
| GlaxoSmithKline Mercury Limited (i) | Ordinary | 980 Great West Road, Brentford, Middlesex, TW8 9GS, England | ||
| GlaxoSmithKline Mexico S.A. de C.V. | Ordinary A; Ordinary B | Calzada, Mexico-Xochimilco 4900, Colonia San Lorenzo, Huipulco, Delegacion Tlalpan, 14370, Mexico | ||
| GlaxoSmithKline NZ Limited | Ordinary | Level 2 E.2, 12 Madden Street, Wynyard Quarter, Auckland 1010, New Zealand | ||
| GlaxoSmithKline Oy | Ordinary | Piispansilta 9A, P.O. Box 24, Espoo, FIN-02230, Finland | ||
| GlaxoSmithKline Peru S.A. | Ordinary | Av. Javier Prado Oeste, 995, San Isidro, Lima 27, Peru | ||
| GlaxoSmithKline Pharma A/S | Ordinary | Nykaer 68, Brondby, DK-2605, Denmark | ||
GSK Annual Report 2020 289
|
|
||
|
|
Other statutory disclosures continued
Group companies continued
| Name | Security | Registered address | ||
| Wholly owned subsidiaries continued | ||||
| GlaxoSmithKline Pharma GmbH | Ordinary | Wagenseilgasse 3, Euro Plaza, Gebäude I, 4. Stock, Vienna, A-1120, Austria | ||
| GlaxoSmithKline Pharmaceutical Kenya Limited | Ordinary | Likoni Road, Nairobi, 78392 - 00507, Kenya | ||
| GlaxoSmithKline Pharmaceutical Nigeria Limited | Ordinary | 1 Industrial Avenue, Ilupeju, Ikeja, Lagos, PM B 21218, Nigeria | ||
| GlaxoSmithKline Pharmaceutical Sdn Bhd | Ordinary | Level 6, Quill 9, 112, Jalan Prof. Khoo Kay Kim, 46300 Petaling Jaya, Selangor, Malaysia | ||
| GlaxoSmithKline Pharmaceuticals (Pvt) Ltd | Ordinary | 121 Galle Road, Kaldemulla, Moratuwa, Sri Lanka | ||
| GlaxoSmithKline Pharmaceuticals Costa Rica S.A | Ordinary | 300 metros al este de la Rotonda de la Betania, Mercedes de Montes de Oca, Sabanilla, Montes de Oca, San Jose, Costa Rica | ||
| GlaxoSmithKline Pharmaceuticals S.A. | Ordinary A; Ordinary B; Ordinary C; Ordinary D |
Ul. Grunwaldzka 189, Poznan, 60-322, Poland | ||
| GlaxoSmithKline Pharmaceuticals SA | Ordinary | Site Apollo, Avenue Pascal 2-4-6, Wavre, 1300, Belgium | ||
| GlaxoSmithKline Pharmaceuticals Ukraine LLC | Chartered Capital | Pavla Tychyny avenue, 1-V, Kiev, 02152, Ukraine | ||
| GlaxoSmithKline Pte Ltd | Ordinary | 23 Rochester Park, 139234, Singapore | ||
| GlaxoSmithKline Puerto Rico, Inc. | Common | The Prentice-Hall Corporation System, Puerto Rico, Inc., c/o Fast Solutions, LLC, 252 Ponce de Leon Avenue, Floor 20, San Juan, 00918, Puerto Rico | ||
| GlaxoSmithKline Republica Dominicana S.A. | Ordinary | Blue Mall Tower, Floor 23 Ave., Winston Churchill 95, Santo Domingo, Dominican Republic | ||
| GlaxoSmithKline Research & Development Limited | Ordinary | 980 Great West Road, Brentford, Middlesex, TW8 9GS, England | ||
| GlaxoSmithKline S.A. | Ordinary | Severo Ochoa, 2, Parque Tecnologico de Madrid, Tres Cantos, Madrid, 28760, Spain | ||
| GlaxoSmithKline S.p.A. | Ordinary | Viale dell’Agricoltura 7, Verona, 37135, Italy | ||
| GlaxoSmithKline s.r.o. | Ordinary | Hvezdova 1734/2c, Prague, 4 140 00, Czech Republic | ||
| GlaxoSmithKline Services GmbH & Co. KG | Partnership Capital | Prinzregentenplatz 9, Munchen, 81675, Germany | ||
| GlaxoSmithKline Services Inc. (ii) | Common | Corporation Service Company, 251 Little Falls Drive, Wilmington, Delaware, 19808, United States | ||
| GlaxoSmithKline Services Unlimited (i) | Ordinary | 980 Great West Road, Brentford, Middlesex, TW8 9GS, England | ||
| GlaxoSmithKline Single Member A.E.B.E. | Ordinary | 266 Kifissias Avenue, Halandri, Athens, 152 32, Greece | ||
| GlaxoSmithKline SL LLC | LLC Interests | Corporation Service Company, 251 Little Falls Drive, Wilmington, Delaware, 19808, United States | ||
| GlaxoSmithKline SL LP (ii) (viii) | Partnership | 980 Great West Road, Brentford, Middlesex, TW8 9GS, England | ||
| GlaxoSmithKline Slovakia s.r.o. | Ordinary | Galvaniho 7/A, Bratislava, 821 04, Slovakia | ||
| GlaxoSmithKline South Africa (Pty) Limited | Ordinary | Flushing Meadows Building, The Campus, 57 Sloane Street, Bryanston 2021, South Africa | ||
| GlaxoSmithKline Trading | Ordinary | Leningradskiy Prospect 37A, Building 4, Floor 3, Premises XV, Room 1, Moscow, 125167, Russian Federation | ||
| GlaxoSmithKline Trading Services Limited (iii) | Ordinary | 12 Riverwalk Citywest Business Campus, Dublin, 24, Ireland | ||
| GlaxoSmithKline Tunisia S.A.R.L. | Ordinary | Immeuble Les Quatres R, Rue du Lac Lochness, Berges du Lac, Tunis, Tunisia | ||
| GlaxoSmithKline UK Limited | Ordinary | 980 Great West Road, Brentford, Middlesex, TW8 9GS, England | ||
| GlaxoSmithKline Uruguay S.A. | Registered shares provisory stock | Salto 1105, CP 11.200 Montevideo, Uruguay | ||
| GlaxoSmithKline US Trading Limited | Ordinary | 980 Great West Road, Brentford, Middlesex, TW8 9GS, England | ||
| GlaxoSmithKline Venezuela C.A. | Ordinary | Urbanizacion La Trinidad, Calle luis De Camoems, Edif No 115-117 Apatado Posta, Caracas, 1010, Venezuela | ||
| GlaxoSmithKline Vietnam Limited Liability Company (ii) (iv) | Equity capital | The Metropolitan, 235 Dong Khoi Street, District 1, 7th Floor Unit 701, Ho Chi Minh City, Viet Nam | ||
| GlycoVaxyn AG (iv) | Common; Preferred A; Preferred B; Preferred C |
Grabenstrasse 3, 8952 Schlieren, Switzerland | ||
| Groupe GlaxoSmithKline S.A.S. | Ordinary | 23 Rue françois Jacob, 92500, Rueil-Malmaison, France | ||
| GSK Australia NVD Pty Ltd (ii) (iv) | Ordinary | 1061 Mountain Highway, Boronia, VIC, 3155, Australia | ||
| GSK Bangladesh Private Limited | Ordinary | Sweden Tower, 1, Harinnachala, Konabari, Gazipur, Bangladesh | ||
| GSK Biopharma Argentina S.A. | Nominative non endorseable ordinary shares |
Tucumán 1, piso 4, Buenos Aires, C1049AAA, Argentina | ||
| GSK Business Service Centre Sdn Bhd | Ordinary | Level 6, Quill 9, 112 Jalan Prof. Khoo Kay Kim, Petaling Jaya, Selangor, 46300, Malaysia | ||
| GSK Capital B.V. (Incorporated on 01/02/2021) (iii) (ix) | Ordinary | 980 Great West Road, Brentford, Middlesex, TW8 9GS, England | ||
| GSK Capital K.K. | Ordinary | 1-8-1 Akasaka Minato-Ku, Tokyo, Japan | ||
| GSK Commercial Sp. z o.o. | Ordinary | ul. Rzymowskiego 53, Warsaw, 02-697, Poland | ||
| GSK d.o.o., Ljubljana | Ordinary | Ameriška ulica 8,Ljubljana, 1000, Slovenia | ||
| GSK Enterprise Management Co, Ltd | Ordinary | Floor 4, 18 Lane 999 Huanke Road, No. 1358 Zhongke Road, Shanghai, China | ||
| GSK Equity Investments, Limited | Unit | Corporation Service Company, 2595 Interstate Drive, Suite 103, Harrisburg, Pennsylvania, PA, 17110, United States | ||
290 GSK Annual Report 2020
|
Strategic report
| ||
|
Governance and remuneration
| ||
|
Financial statements
| ||
|
Investor information
|
Other statutory disclosures continued
Group companies continued
| Name | Security | Registered address | ||
| Wholly owned subsidiaries continued | ||||
| GSK Finance (No 2) Limited | Ordinary | 980 Great West Road, Brentford, Middlesex, TW8 9GS, England | ||
| GSK Finance (No.3) plc | Ordinary | 980 Great West Road, Brentford, Middlesex, TW8 9GS, England | ||
| GSK India Global Services Private Limited | Equity shares | Prestige Trade Tower, 4, 5, 6th Floor, Palace Road, Sampangiramnagar, Bangalore, Karnataka, 560001, India | ||
| GSK Kazakhstan LLP | Participation/Participating Interest | 23, Furmanov Street, Almaty, Medeu District, 050059, Kazakhstan | ||
| GSK Pharma Vietnam Company Limited | Chartered Capital | Unit 702/703 7th Floor, The Metropolitan Tower, 235 Dong Khoi Street, Ben Nghe Ward, District 1, Ho Chi Minh, Viet Nam | ||
| GSK Pharmaceutical Trading SA (ii) (iv) | Ordinary | 1-5 Costache Negri Street, Opera Center One, 5th floor, discussions room 01, District 5, Bucharest, Romania | ||
| GSK Services Sp z o.o. | Ordinary | Ul. Grunwaldzka 189, Poznan, 60-322, Poland | ||
| GSK Vaccines BV | Ordinary | Hullenbergweg 85, Amsterdam, 1101 CL, Netherlands | ||
| GSK Vaccines GmbH | Ordinary | Emil-von-Behring-Str.76, 35041 Marburg, Germany | ||
| GSK Vaccines Institute for Global Health S.r.l. | Quotas | Via Fiorentina 1, Siena, 53100, Italy | ||
| GSK Vaccines S.r.l. | Quotas | Via Fiorentina 1, Siena, 53100, Italy | ||
| GSK Vaccines Vertriebs GmbH (ii) | Ordinary | Rudolf-Diesel-Ring 27, Holzkirchen, 83607, Germany | ||
| HGS France S.a.r.l. (ii) (iv) | Ordinary | 52-54, Rue de la Belle Feuille, Boulogne-Billancourt, 92100, France | ||
| Horlicks Limited | Ordinary; Preference | 980 Great West Road, Brentford, Middlesex, TW8 9GS, England | ||
| Human Genome Sciences, Inc. | Common | Corporation Service Company, 251 Little Falls Drive, Wilmington, Delaware, 19808, United States | ||
| ID Biomedical Corporation of Quebec | Common | 2323, boul. Du Parc Technologique, Québec, G1P 4R8, Canada | ||
| Instituto Luso Farmaco, Limitada (ii) | Ordinary Quota | Rua Dr Antonio Loureiro Borges No 3, Arquiparque, Miraflores, Alges, 1495-131, Portugal | ||
| InterPharma Dienstleistungen GmbH (ii) | Quotas | Wagenseilgasse 3, Euro Plaza, Gebäude I, 4. Stock, Vienna, A-1120, Austria | ||
| J&J Technologies, LC | LLC Interests | Corporation Service Company, 100 Shockoe Slip, 2nd Floor, Richmond, VA 23219, United States | ||
| Laboratoire GlaxoSmithKline | Ordinary | 23 rue François Jacob, 92500, Rueil-Malmaison, France | ||
| Laboratoire Pharmaceutique Algérien LPA Production SPA | Ordinary | Zone Industrielle Est, Boudouaou, Boumerdes, Algeria | ||
| Laboratoire Pharmaceutique Algérien SPA | Ordinary | Zone Industrielle Est, Boudouaou, Boumerdes, Algeria | ||
| Laboratoires Paucourt (ii) | Ordinary | 23 rue François Jacob, 92500, Rueil-Malmaison, France | ||
| Laboratoires Saint-Germain (ii) | Ordinary | 23 rue François Jacob, 92500, Rueil-Malmaison, France | ||
| Laboratorios Dermatologicos Darier, S.A de C.V. | “Ordinary A; Ordinary B” | Calzada Mexico Xochimilco, 4900 San Lorenzo Huipulco, District Federal Mexico, 14370, Mexico | ||
| Laboratorios Farmaceuticos Stiefel (Portugal) LTDA (ii) | Ordinary Quota | Rua Dr Antonio Loureiro Borges No 3, Arquiparque, Miraflores, Alges, 1495-131, Portugal | ||
| Laboratorios Stiefel de Venezuela SA | Ordinary | Calle Luis de Camoens, Edificio GlaxoSmithKline, No. 115-117, Urb. La Trinidad, Caracas, Venezuela | ||
| Laboratorios Stiefel Ltda. | Ordinary | Rua Professor Joao Cavalheiro Salem, no.1077, Bairro de Bonsucesso, Municipality of Guarulhos, Sao Paulo, CEP 07243-580, Brazil | ||
| Laboratorios Wellcome De Portugal Limitada (ii) | Ordinary Quota | Rua Dr Antonio Loureiro Borges No 3, Arquiparque, Miraflores, Alges, 1495-131, Portugal | ||
| Mixis Genetics Limited (In liquidation) | Ordinary; Ordinary Euro | 55 Baker Street, London, W1U 7EU, England | ||
| Montrose Pharma Company Limited (ii) (iv) | Ordinary Quota | H-1124, Csorsz utca 43, Budapest, Hungary | ||
| Okairos AG (in liquidation) | Common; Preferred A; Preferred B | c/o OBC Suisse AG, Aeschenvorstadt 71, 4051, Basel, Switzerland | ||
| Penn Labs Inc. (ii) | Common | Corporation Service Company, 251 Little Falls Drive, Wilmington, Delaware, 19808, United States | ||
| S.R. One International B.V. | Ordinary | Van Asch van Wijckstraat 55h, 3811 LP, Amersfoort, Netherlands | ||
| Setfirst Limited | Ordinary; Preference | 980 Great West Road, Brentford, Middlesex, TW8 9GS, England | ||
| Sitari Pharma, Inc. | Common Stock | Corporation Service Company, 251 Little Falls Drive, Wilmington, Delaware, DE, 19808, United States | ||
| Smith Kline & French Portuguesa-Produtos Farmaceuticos, LDA (ii) | Ordinary Quota | Rua Dr Antonio Loureiro Borges No 3, Arquiparque, Miraflores, Alges, 1495-131, Portugal | ||
| SmithKline Beecham (Bangladesh) Private Limited (ii) | Ordinary | 14, Topkhana Road, Segunbagicha, Dhaka 1000, Bangladesh | ||
| SmithKline Beecham (Cork) Limited | Ordinary | 12 Riverwalk Citywest Business Campus, Dublin, 24, Ireland | ||
| SmithKline Beecham (Manufacturing) Limited | Ordinary | 12 Riverwalk Citywest Business Campus, Dublin, 24, Ireland | ||
| SmithKline Beecham (SWG) Limited (In liquidation) | Ordinary | 55 Baker Street London W1U 7EU, England | ||
| SmithKline Beecham Biologicals US Partnership | Partnership Interest | Corporation Service Company, 251 Little Falls Drive, Wilmington, Delaware, 19808, United States | ||
| SmithKline Beecham Egypt L.L.C. | Quotas | Amoun Street, El Salam City, Cairo, Egypt | ||
| SmithKline Beecham Farma, S.A. | Ordinary | Severo Ochoa, 2, Parque Tecnologico de Madrid, Tres Cantos, Madrid, 28760, Spain | ||
| SmithKline Beecham Inter-American Corporation (ii) | Common | Corporation Service Company, 251 Little Falls Drive, Wilmington, Delaware, 19808, United States | ||
GSK Annual Report 2020 291
|
|
||
|
|
Other statutory disclosures continued
Group companies continued
| Name | Security | Registered address | ||
| Wholly owned subsidiaries continued | ||||
| SmithKline Beecham Limited | Ordinary | 980 Great West Road, Brentford, Middlesex, TW8 9GS, England | ||
| SmithKline Beecham Overseas Limited | Ordinary | 980 Great West Road, Brentford, Middlesex, TW8 9GS, England | ||
| SmithKline Beecham Pension Plan Trustee Limited (ii) | Ordinary | 980 Great West Road, Brentford, Middlesex, TW8 9GS, England | ||
| SmithKline Beecham Pension Trustees Limited (in liquidation) | Ordinary | 55 Baker Street, London, W1U 7EU, England | ||
| SmithKline Beecham Pharma GmbH & Co KG | Partnership Capital | Prinzregentenplatz 9, Munchen, 81675, Germany | ||
| SmithKline Beecham Pharma Verwaltungs GmbH | Ordinary | Prinzregentenplatz 9, Munchen, 81675, Germany | ||
| SmithKline Beecham Pharmaceuticals (Pty) Limited (ii) (iv) | Ordinary | Flushing Meadows Building, The Campus, 57 Sloane Street, Bryanston 2021, South Africa | ||
| SmithKline Beecham Pharmaceuticals Co. | Common | Corporation Service Company, 251 Little Falls Drive, Wilmington, Delaware, 19808, United States | ||
| SmithKline Beecham Port Louis Limited (in liquidation) | Ordinary | c/o CIM Corporate Services Ltd, Les Cascades Building, Edith Cavell Street, Port Louis, Mauritius | ||
| SmithKline Beecham Senior Executive Pension Plan Trustee Limited (ii) | Ordinary | 980 Great West Road, Brentford, Middlesex, TW8 9GS, England | ||
| Stiefel Distributors (Ireland) Limited (in liquidation) | Ordinary | Finisklin Business Park, Sligo, Ireland | ||
| Stiefel Dominicana, S.R.L. (ii) (iv) | Ordinary | Ave. Lope de Vega #29, Torre NovoCentro, Local 406, Santo Domingo, Dominican Republic | ||
| Stiefel Farma, S.A. | Ordinary | Severo Ochoa, 2, Parque Tecnologico de Madrid, Tres Cantos, Madrid, 28760, Spain | ||
| Stiefel GmbH & Co. KG | Partnership Capital | Prinzregentenplatz 9, Munchen, 81675, Germany | ||
| Stiefel India Private Limited | Equity | 401-402, A, Wing, 4th Floor,Floral Deck Plaza, Opp Rolta Bhavan, Central MIDC Road, Mumbai, Andheri (E), 400093, India | ||
| Stiefel Laboratories (Maidenhead) Ltd (In liquidation) | Ordinary | 55 Baker Street, London, W1U 7EU, England | ||
| Stiefel Laboratories Legacy (Ireland) Limited | Ordinary | Unit 2 Building 2500, Avenue 2000 Cork Airport Business Park, Cork, Ireland | ||
| Stiefel Laboratories Limited (ii) | Ordinary | Eurasia Headquarters, Concorde Road, Maidenhead, Berkshire, SL6 4BY, England | ||
| Stiefel Laboratories Pte Limited (ii) | Ordinary | 1 Pioneer, Sector 1, 62841, Singapore | ||
| Stiefel Laboratories, Inc. | Common | Corporation Service Company, 251 Little Falls Drive, Wilmington, Delaware, 19808, United States | ||
| Stiefel Maroc SARL (ii) (iv) | Ordinary | 275 Boulevard Zerktouni, Casablanca, Morocco | ||
| Stiefel Research (Australia) Holdings Pty Ltd | Ordinary | 1061 Mountain Highway, Boronia, VIC, 3155, Australia | ||
| Stiefel Research Australia Pty Ltd | Ordinary | 1061 Mountain Highway, Boronia, VIC, 3155, Australia | ||
| Stiefel West Coast LLC | LLC Interests | Corporation Service Company, 251 Little Falls Drive, Wilmington, Delaware, 19808, United States | ||
| Strebor Inc. | Common | Corporation Service Company, 251 Little Falls Drive, Wilmington, Delaware, 19808, United States | ||
| Tempero Pharmaceuticals, Inc. | Series A Preference; Series B Preference; Common | Corporation Service Company, 251 Little Falls Drive, Wilmington, Delaware, 19808, United States | ||
| Tesaro Bio Austria GmbH in Liqu (in liquidation) | Common | Fleischmarkt 1/6/12, Vienna, 1010, Austria | ||
| Tesaro Bio GmbH | Ordinary | Poststrasse 6, 6300 Zug, Switzerland | ||
| Tesaro Bio Netherlands B.V | Shares | Joop Geesinkweg 901, 1114 AB, Amsterdam-Duivendrecht, Netherlands | ||
| Tesaro Bio Spain S.L.U. (iv) | Shares/Participation Quota | Severo Ochoa 2 Parque Tecnológico de Madrid, Tres Cantos, Madrid, 28760, Spain | ||
| Tesaro Bio Sweden AB | Common | c/o BDO Malardalen AB, Skatt Box 24193, Stockholm, 104 51, Sweden | ||
| Tesaro Development Limited | Shares | Clarendon House, 2 Church Street, Hamilton HM11, Bermuda | ||
| Tesaro, Inc. | Common | Corporation Service Company, 251 Little Falls Drive, Wilmington, Delaware, DE, 19808, United States | ||
| The Sydney Ross Co. (ii) | Common | Corporation Service Company, Princeton South Corporate Center, Suite 160, 100 Charles Ewing Blvd, Ewing, New Jersey, 08628, United States | ||
| The Wellcome Foundation Investment Company Limited (Active proposal to strike off) |
Limited by guarantee | 980 Great West Road, Brentford, Middlesex, TW8 9GS, England | ||
| UCB Pharma Asia Pacific Sdn Bhd (ii) | Ordinary | 12th Floor, Menara Symphony, No.5, Jalan Prof. Khoo Kay Kim, Seksyen 13, Petaling Jaya, 46200, Malaysia | ||
| Wellcome Consumer Healthcare Limited (ii) | Ordinary | 980 Great West Road, Brentford, Middlesex, TW8 9GS, England | ||
| Wellcome Consumer Products Limited (ii) | Ordinary | 980 Great West Road, Brentford, Middlesex, TW8 9GS, England | ||
| Wellcome Developments Pty Ltd (ii) (iv) | Ordinary | 1061 Mountain Highway, Boronia, VIC, 3155, Australia | ||
| Wellcome Limited | Ordinary | 980 Great West Road, Brentford, Middlesex, TW8 9GS, England | ||
| Wellcome Operations Pty Ltd (ii) (iv) | Ordinary | 1061 Mountain Highway, Boronia, VIC, 3155, Australia | ||
| GSK Pharma Vietnam Company Limited | Chartered Capital | Unit 702/703 7th Floor, The Metropolitan Tower, 235 Dong Khoi Street, Ben Nghe Ward, District 1, Ho Chi Minh, Viet Nam | ||
| GlaxoSmithKline Limited | Ordinary | Likoni Road; PO Box 78392; Nairobi; Kenya | ||
| GSK Consumer Healthcare Export Limited | 980, Great West Road, Brentford, Middlesex, TW8 9GS, England | |||
292 GSK Annual Report 2020
|
Strategic report
| ||
|
Governance and remuneration
| ||
|
Financial statements
| ||
|
Investor information
|
Other statutory disclosures continued
Group companies continued
| Name | Security | Effective % Ownership |
Registered address | |||
| Subsidiaries where the effective interest is less than 100% | ||||||
| Alacer Corp. | Common | 68 | Corporate Service Company d/b/a CSC-Lawyers Incorp., 2710 Gateway Oaks Drive, Suite 150N, Sacramento, California, 95833-3505, United States | |||
| Amoun Pharmaceutical Industries Co. S.A.E. | New Monetary Shares (99.5%) | 90.7 | El Salam City 11491, PO Box 3001, Cairo, Egypt | |||
| Beecham Enterprises Inc. (ii) | Common | 59.8 | Corporation Service Company, 251 Little Falls Drive, Wilmington, Delaware, 19808, United States | |||
| Biddle Sawyer Limited | Equity | 75 | 252 Dr Annie Besant Road, Mumbai, 400030, India | |||
| Block Drug Company, Inc. | Common | 68 | Corporation Service Company, Princeton South Corporate Center, Suite 160, 100 Charles Ewing Blvd, Ewing, New Jersey, 08628, United States | |||
| Block Drug Corporation (ii) | Common | 68 | Corporation Service Company, Princeton South Corporate Center, Suite 160, 100 Charles Ewing Blvd, Ewing, New Jersey, 08628, United States | |||
| British Pharma Group Limited (i) | Captial (50%) | 50 | 980 Great West Road, Brentford, Middlesex, TW8 9GS, England | |||
| Consumer Healthcare Holdings Limited | Ordinary | 68 | 980 Great West Road, Brentford, Middlesex, TW8 9GS, England | |||
| Consumer Healthcare Intermediate Holdings Limited | Ordinary | 68 | 980 Great West Road, Brentford, Middlesex, TW8 9GS, England | |||
| Duncan Consumer Healthcare Philippines Inc | Common | 68 | 23rd Floor, The Finance Centre, 26th Street Corner 9th Avenue, Bonifacio Global City, Taguig City, 1634, Philippines | |||
| Duncan Pharmaceuticals Philippines Inc. | Common | 92.5 | 23rd Floor, The Finance Centre, 26th Street Corner 9th Avenue, Bonifacio Global City, Taguig City, 1634, Philippines | |||
| Ex-Lax, Inc. | Common | 68 | The Prentice Hall Corporation System, Puerto Rico, Inc., c/o Fast Solutions, LLC, Citi Tower, 252 Ponce de Leon Avenue, Floor 20, San Juan, 00918, Puerto Rico | |||
| Ferrosan ApS | A Shares; B Shares | 68 | Nykaer 68, Brondby, DK-2605, Denmark | |||
| Ferrosan International ApS | Ordinary | 68 | Nykaer 68, Brondby, DK-2605, Denmark | |||
| Ferrosan S.R.L. | Registered capital | 68 | 178/C Calea Turzii, Cluj-Napoca, Cluj County, Romania | |||
| Galvani Bioelectronics Inc. | Common | 55 | Corporation Service Company, 251 Little Falls Drive, Wilmington, Delaware, 19808, United States | |||
| Galvani Bioelectronics Limited | A Ordinary; B Ordinary (0%) | 55 | 980 Great West Road, Brentford, Middlesex, TW8 9GS, England | |||
| Glaxo Saudi Arabia Limited | Ordinary | 75 | PO Box 22617, Area No 56 to 73, Warehouse City, First Stage Al Khomrah, Jeddah 21416, Saudi Arabia | |||
| Glaxo Wellcome Ceylon Limited | Ordinary; Ordinary B | 67.8 | 121 Galle Road, Kaldemulla, Moratuwa, Sri Lanka | |||
| GlaxoSmithKline (Tianjin) Co. Ltd | Ordinary | 90 | No. 65, the Fifth Avenue, Tai Feng Industrial Park, Tianjin Economic and Technolog, Tianjin, 300457, China | |||
| GlaxoSmithKline Algérie S.P.A. | Ordinary | 99.99 | Zone Industrielle Est, Boudouaou, Wilaya de Boumerdes, Algeria | |||
| GlaxoSmithKline Brasil Produtos para Consumo e Saude Ltda | Quotas | 68 | Av das Americas, 3500, 4th floor, rooms 407-420, Rio de Janeiro, RJ, 22621-000, Brazil | |||
| GlaxoSmithKline Consumer Healthcare (China) Co. Ltd | Ordinary | 68 | Floor 8, 168 Xizangzhong Road, Huangpu District, Shanghai, China | |||
| GlaxoSmithKline Consumer Healthcare (Hong Kong) Limited | Ordinary | 68 | 23/F., Tower 6, The Gateway, 9 Canton Road, Tsimshatsui, Kowloon, Hong Kong | |||
| GlaxoSmithKline Consumer Healthcare (Ireland) Limited | Ordinary | 68 | 12 Riverwalk Citywest Business Campus, Dublin, 24, Ireland | |||
| GlaxoSmithKline Consumer Healthcare (Overseas) Limited | Ordinary | 68 | 980 Great West Road, Brentford, Middlesex, TW8 9GS, England | |||
| GlaxoSmithKline Consumer Healthcare (Thailand) Limited | Ordinary | 68 | 13th Floor, Unit 13.05 and 13.06 Wave Place, 55 Wireless Road, Lumpini, Pathumwan, Bangkok, 10330, Thailand | |||
| GlaxoSmithKline Consumer Healthcare (UK) IP Limited (iv) | Ordinary | 68 | 980 Great West Road, Brentford, Middlesex, TW8 9GS, England | |||
| GlaxoSmithKline Consumer Healthcare (UK) Trading Limited | Ordinary | 68 | 980 Great West Road, Brentford, Middlesex, TW8 9GS, England | |||
| GlaxoSmithKline Consumer Healthcare (US) IP LLC | LLC Interests | 68 | Corporation Service Company, 251 Little Falls Drive, Wilmington, Delaware, 19808, United States | |||
| GlaxoSmithKline Consumer Healthcare A/S | Ordinary | 68 | Nykaer 68, Brondby, DK-2605, Denmark | |||
| GlaxoSmithKline Consumer Healthcare AB (v) | Ordinary | 68 | Nykaer 68, Brondby, DK-2605, Denmark | |||
| GlaxoSmithKline Consumer Healthcare Australia Pty ltd | Ordinary | 68 | 82 Hughes Avenue, Ermington, NSW, 2115, Australia | |||
| GlaxoSmithKline Consumer Healthcare B.V. | Ordinary | 68 | Van Asch van Wijckstraat 55G, Amersfoort, 3811 LP, Netherlands | |||
| GlaxoSmithKline Consumer Healthcare Colombia SAS | Ordinary | 68 | Carrera 7 No. 113 - 43 Piso 4, Colombia | |||
| GlaxoSmithKline Consumer Healthcare Czech Republic s.r.o. | Ordinary | 68 | Hvezdova 1734/2c, Prague, 4 140 00, Czech Republic | |||
| GlaxoSmithKline Consumer Healthcare Finance Limited | Ordinary | 68 | 980 Great West Road, Brentford, Middlesex, TW8 9GS, England | |||
| GlaxoSmithKline Consumer Healthcare Finance No.2 Limited | Ordinary | 68 | 980 Great West Road, Brentford, Middlesex, TW8 9GS, England | |||
| GlaxoSmithKline Consumer Healthcare Finland Oy | Ordinary | 68 | Piispansilta 9A, Fin-02230, Espoo, Finland | |||
| GlaxoSmithKline Consumer Healthcare GmbH | Ordinary | 68 | Wagenseilgasse 3, Euro Plaza, Gebäude I, 4. Stock, Vienna, A-1120, Austria | |||
| GlaxoSmithKline Consumer Healthcare GmbH & Co. KG | Partnership Capital | 68 | Barthstr. 4, München, 80339, Germany | |||
| GlaxoSmithKline Consumer Healthcare Hellas Single Member Societe Anonyme | Ordinary | 68 | 274 Kifissias Avenue Halandri, Athens, 152 32, Greece | |||
GSK Annual Report 2020 293
|
|
||
|
|
Other statutory disclosures continued
Group companies continued
| Name | Security | Effective % Ownership |
Registered address | |||
| Subsidiaries where the effective interest is less than 100% continued | ||||||
| GlaxoSmithKline Consumer Healthcare Holdings (No.2) Limited | A; B(0%); Preference | 68 | 980 Great West Road, Brentford, Middlesex, TW8 9GS, England | |||
| GlaxoSmithKline Consumer Healthcare Holdings (US) LLC | LLC Interests | 68 | Corporation Service Company, 251 Little Falls Drive, Wilmington, Delaware, 19808, United States | |||
| GlaxoSmithKline Consumer Healthcare Investments (Ireland) (No 3) Limited (iii) (In liquidation) | Ordinary | 68 | Knockbrack, Dungarvan, Co Waterford, X35 RY76, Ireland | |||
| GlaxoSmithKline Consumer Healthcare Investments (Ireland) (No.2) Unlimited Company (iii) (In liquidation) | Ordinary | 68 | Knockbrack, Dungarvan, Co Waterford, X35 RY76, Ireland | |||
| GlaxoSmithKline Consumer Healthcare Japan K.K. | Ordinary | 68 | 1-8-1 Akasaka Minato-Ku, Tokyo, Japan | |||
| GlaxoSmithKline Consumer Healthcare Korea Co., Ltd. | Ordinary | 68 | 9F LS Yongsan Tower, 92, Hangang-daero, Yongsan-gu, Seoul, 04386, Korea, Republic of | |||
| GlaxoSmithKline Consumer Healthcare L.L.C. | LLC Interests | 68 | Corporation Service Company, 2595 Interstate Drive Suite 103, Harrisburg, Pennsylvania, 17110, United States | |||
| GlaxoSmithKline Consumer Healthcare Mexico, S. De R.L. de C.V. | Ordinary | 68 | Calzada Mexico-Xochimilco 4900, Colonia San Lorenzo Huipulco, Delegacion Tlalpan, Mexico, D.F. 14370, Mexico | |||
| GlaxoSmithKline Consumer Healthcare New Zealand ULC | Ordinary | 68 | Level 11, Zurich House, 21 Queen Street, Auckland, 1010, New Zealand | |||
| GlaxoSmithKline Consumer Healthcare Norway AS | Ordinary | 68 | Drammensveien 288, 1326 Lysaker, Norway | |||
| GlaxoSmithKline Consumer Healthcare Pakistan Limited | Ordinary (85.8%) | 58.3 | The Sykes Building, 35 Dockyard Road, West Wharf, Karachi, 74000, Pakistan | |||
| GlaxoSmithKline Consumer Healthcare Philippines Inc | Common | 68 | 23rd Floor, The Finance Centre, 26th Street Corner 9th Avenue, Bonifacio Global City, Taguig City, 1634, Philippines | |||
| GlaxoSmithKline Consumer Healthcare Pte. Ltd. | Ordinary | 68 | 23 Rochester Park, 139234, Singapore | |||
| GlaxoSmithKline Consumer Healthcare S.A. | Ordinary | 68 | Site Apollo, Avenue Pascal 2-4-6, Wavre, 1300, Belgium | |||
| GlaxoSmithKline Consumer Healthcare S.A. | Ordinary | 68 | Severo Ochoa, 2, Parque Tecnologico de Madrid, Tres Cantos, Madrid, 28760, Spain | |||
| GlaxoSmithKline Consumer Healthcare S.r.l | Ordinary | 68 | Via Zambeletti snc,Baranzate, Milan, 20021, Italy | |||
| GlaxoSmithKline Consumer Healthcare Saudi Limited | Ordinary | 68 | 603 Salamah Tower 6th Floor, Madinah Road Al-Salamah District Jeddah 21425, Saudi Arabia | |||
| GlaxoSmithKline Consumer Healthcare Sdn. Bhd. | Ordinary | 68 | Lot 89, Jalan Enggang, Ampang/Ulu Kelang Industrial Estate, 6800 Ampang, Selangor, Darul Ehsan, Malaysia | |||
| GlaxoSmithKline Consumer Healthcare Slovakia s. r. o. | Ownership interest | 68 | Galvaniho 7/A, Bratislava, 821 04, Slovakia | |||
| GlaxoSmithKline Consumer Healthcare South Africa (Pty) Ltd | Ordinary | 68 | Flushing Meadows Building, The Campus, 57 Sloane Street, Bryanston 2021, South Africa | |||
| GlaxoSmithKline Consumer Healthcare Sp.z.o.o. | Ordinary | 68 | Ul. Grunwaldzka 189, Poznan, 60-322, Poland | |||
| GlaxoSmithKline Consumer Healthcare SRL | Ordinary | 68 | 1-5 Costache Negri Street, Opera Center One, 6th floor (Zone 2), District 5, Bucharest, Romania | |||
| GlaxoSmithKline Consumer Healthcare ULC / GlaxoSmithKline Soins De Sante Aux Consommateurs SRI | A Class Preference; Common | 68 | 595 Burrard Street, Suite 2600 Three Bentall Centre, P.O. Box 49314, Vancouver, BC V7X 1L3, Canada | |||
| GlaxoSmithKline Consumer Healthcare Vietnam Company Limited (ii) | Charter Capital | 68 | Floor 16, Metropolitan, 235 Dong Khoi, Ben Nghe Ward, District 1, Ho Chi Minh City, Viet Nam | |||
| GlaxoSmithKline Consumer Healthcare, L.P. | Partnership Capital | 59.8 | Corporation Service Company, 251 Little Falls Drive, Wilmington, Delaware, 19808, United States | |||
| GlaxoSmithKline Consumer Healthcare, Produtos para a Saude e Higiene, Lda | Ordinary Quota | 68 | Rua Dr Antonio Loureiro Borges No 3, Arquiparque, Miraflores, Alges, 1495-131, Portugal | |||
| GlaxoSmithKline Consumer Nigeria plc (vi) | Ordinary (46.4%) | 46.4 | 1 Industrial Avenue, Ilupeju, Ikeja, Lagos, PM B 21218, Nigeria | |||
| GlaxoSmithKline Consumer Private Limited | Equity | 68 | Patiala Road, Nabha 147201, Dist Patiala, Punjab, India | |||
| GlaxoSmithKline Consumer Trading Services Limited | Ordinary | 68 | 980 Great West Road, Brentford, Middlesex, TW8 9GS, England | |||
| GlaxoSmithKline Costa Rica S.A. | Ordinary | 68 | San Jose 300 Este de la Rotonda Betania, Carretera a Sabanilla, Costa Rica | |||
| GlaxoSmithKline Dungarvan Limited | Ordinary | 68 | Knockbrack, Dungarvan, Co Waterford, X35 RY76, Ireland | |||
| GlaxoSmithKline Healthcare AO | Ordinary | 68 | Premises III, Room 9, floor 6, Presnenskaya nab. 10, Moscow, 123112, Russian Federation | |||
| GlaxoSmithKline Healthcare GmbH | Ordinary | 68 | Barthstr. 4, München, 80339, Germany | |||
| GlaxoSmithKline Healthcare Ukraine O.O.O. | Ownership interest | 68 | Pavla Tychyny avenue, 1-V, Kiev, 02152, Ukraine | |||
| GlaxoSmithKline Pakistan Limited | Ordinary (82.6%) | 82.6 | The Sykes Building, 35 Dockyard Road, West Wharf, Karachi, 74000, Pakistan | |||
| GlaxoSmithKline Panama S.A. | Ordinary | 68 | Urbanizacion Industrial Juan D, Calles A Y B, Republic of Panama, Panama | |||
| GlaxoSmithKline Paraguay S.A. | Ordinary | 68 | Oficial Gilberto Aranda 333, Planta Alta casi Salvador del Mundo, Asuncion, Paraguay | |||
| GlaxoSmithKline Pharmaceuticals Limited | Equity (75%) | 75 | 252 Dr Annie Besant Road, Mumbai, 400030, India | |||
| GlaxoSmithKline Philippines Inc | Common | 92.5 | 23rd Floor, The Finance Centre, 26th Street Corner 9th Avenue, Bonifacio Global City, Taguig City, 1634, Philippines | |||
294 GSK Annual Report 2020
|
Strategic report
| ||
|
Governance and remuneration
| ||
|
Financial statements
| ||
|
Investor information
|
Other statutory disclosures continued
Group companies continued
|
Name |
Security | Effective % Ownership |
Registered address | |||
| Subsidiaries where the effective interest is less than 100% continued | ||||||
| GlaxoSmithKline S.A.E. | Ordinary (91.2%) | 91.2 | Boomerang Office Building – Land No. 46, Zone (J) – 1st District, Town Center – 5th Tagammoe, New Cairo City, Egypt | |||
| GlaxoSmithKline Sante Grand Public SAS | Ordinary | 68 | 23 rue François Jacob, 92500, Rueil-Malmaison, France | |||
| GlaxoSmithKline Technology (Taizhou) Co., Ltd | Ordinary | 68 | Room 708 in Building D, Phase II of New Drug Innovation Base, Taizhou, 225300, Jiangsu Province, China | |||
| GlaxoSmithKline Tuketici Sagligi Anonim Sirketi | Nominative | 68 | Büyükdere Caddesi No. 173, 1.Levent Plaza B Blok, 1.Levent, Istanbul, 34394, Turkey | |||
| GlaxoSmithKline-Consumer Hungary Limited Liability Company | Membership | 68 | H-1124, Csorsz utca 43, Budapest, Hungary | |||
| GSK Canada Holding Company Limited | Ordinary | 68 | 980 Great West Road, Brentford, Middlesex, TW8 9GS, England | |||
| GSK CH Kazakhstan LLP | Charter Capital | 68 | 32 A Manasa Str., Bostandyk District, Almaty, 050008, Kazakhstan | |||
| GSK Consumer Health, Inc. | Common | 68 | Corporation Service Company, 251 Little Falls Drive, Wilmington, Delaware, DE, 19808, United States | |||
| GSK Consumer Healthcare Holdings (US) Inc. | Common | 68 | Corporation Service Company, 251 Little Falls Drive, Wilmington, Delaware, DE, 19808, United States | |||
| GSK Consumer Healthcare Holdings No. 2 LLC (iii) | Unit | 68 | Corporation Service Company, 251 Little Falls Drive, Wilmington, Delaware, DE, 19808, United States | |||
| GSK Consumer Healthcare Israel Ltd (iv) | Ordinary | 68 | 25 Basel Street, Petech Tikva 49510, Israel | |||
| GSK Consumer Healthcare Levice, s.r.o. | Ordinary | 68 | Priemyselny Park Gena, Ul. E. Sachsa 4-6, 934 01, Levice, Slovakia | |||
| GSK Consumer Healthcare S.A. | Ordinary | 68 | Route de I’Etraz, 1197 Prangins, Switzerland | |||
| GSK Consumer Healthcare Schweiz AG | Ordinary | 68 | Suurstoffi 14, Rotkreuz, 6343, Switzerland | |||
| GSK Consumer Healthcare Services, Inc. | Common | 68 | Corporation Service Company, 251 Little Falls Drive, Wilmington, Delaware, 19808, United States | |||
| GSK Consumer Healthcare Singapore Pte. Ltd. | Ordinary | 68 | 23 Rochester Park, 139234, Singapore | |||
| GSK Consumer Healthcare Trinidad and Tobago Limited (Incorporated 20 Jan 2021) | Ordinary | 68 | 5th Floor Algico Plaza, 91-93 St.Vincent Street, Port of Spain, Trinidad and Tobago | |||
| GSK New Zealand Holding Company Limited | Ordinary | 68 | 980 Great West Road, Brentford, Middlesex, TW8 9GS, England | |||
| GSK-Gebro Consumer Healthcare GmbH | Ordinary (60%) | 40.8 | Bahnhofbichl 13, 6391 Fieberbrunn, Kitzbühel, Austria | |||
| Iodosan S.p.A. | Ordinary | 68 | Via Zambeletti snc,Baranzate, Milan, 20021, Italy | |||
| Kuhs GmbH | Ordinary | 68 | Barthstr. 4, München, 80339, Germany | |||
| Laboratorios ViiV Healthcare, S.L. | Ordinary | 78.3 | Severo Ochoa, 2, Parque Tecnologico de Madrid, Tres Cantos, Madrid, 28760, Spain | |||
| Modern Pharma Trading Company L.L.C. | Quotas (98.2%) | 98.2 | Amoun Street, PO Box 3001, El Salam City, Cairo, 11491, Egypt | |||
| N.C.H. – Nutrition Consumer Health Ltd (ii) | Ordinary | 68 | 14 Hamephalsim St, Petach Tikva, Israel | |||
| P.T. SmithKline Beecham Pharmaceuticals | A Shares; B Shares (0%) | 99 | Jl. Pulobuaran Raya, Kav. III DD/2,3,4, Kawasan Industri Pulogadung, Jakarta, 13930, Indonesia | |||
| P.T. Sterling Products Indonesia | A Shares; B Shares | 68 | Graha Paramita Building, 5th F, Jalan Denpasar Raya Blok D-2, Jakarta, 12940, Indonesia | |||
| Panadol GmbH | Ordinary | 68 | Barthstr. 4, München, 80339, Germany | |||
| PF Consumer Healthcare 1 LLC | Membership Interest | 68 | Corporation Service Company, 251 Little Falls Drive, Wilmington, Delaware, DE, 19808, United States | |||
| PF Consumer Healthcare B.V. | Class A; Class B | 68 | Van Asch van Wijckstraat 55G, 3811 LP Amersfoort, The Netherlands | |||
| PF Consumer Healthcare Brazil Importadora e Distribuidora de Medicamentos Ltda | Quota | 68 | Barueri, at Avenida Ceci, No.1900, Block III, Part 67, Tambore District, Sao Paulo, 06460, Brazil | |||
| PF Consumer Healthcare Canada ULC / PF Soins De Sante SRI | Common | 68 | 595 Burrard Street, Suite 2600 Three Bentall Centre, P.O. Box 49314, Vancouver, BC V7X 1L3, Canada | |||
| PF Consumer Healthcare Holding B.V. | Ordinary | 68 | Van Asch van Wijckstraat 55G, 3811 LP Amersfoort, The Netherlands | |||
| PF Consumer Healthcare Poland sp.z.o.o | Ordinary | 68 | Rzymowskiego 53 street, 02-697 Warsaw, Poland | |||
| PF Consumer Healthcare Singapore Pte. Ltd | Ordinary | 68 | 23 Rochester Park, 139234, Singapore | |||
| PF Consumer Ireland Company Limited | Ordinary | 68 | 9 Riverwalk, National Digital Park, Citywest Business Park, Dublin, 24, Ireland | |||
| PF Consumer Taiwan LLC | Interests | 68 | 1209 Orange Street, Corporate Trust Center, Wilmington, Delaware, 19808,United States | |||
| Pfizer Biotech Corporation | Ordinary (55%) | 37.4 | 24F, No.66, Sec. 1, Zhong Xiao W. Rd., Taipei 100, Taiwan | |||
| Pfizer Consumer Healthcare AB | Ordinary | 68 | Vetenskapsvagen 10, SE-191 90, Sollentuna, Sweden | |||
| Pfizer Consumer Healthcare GmbH | Ordinary | 68 | Linkstrasse 10, 10785, Berlin, Germany | |||
| Pfizer Consumer Manufacturing Italy S.r.l. | Quota (no stock) | 68 | 90, Via Nettunese, 04011, Aprilia (Prov. di Latin), Italy | |||
| Pfizer Laboratories PFE (Pty) Ltd. | Common | 68 | Flushing Meadows Building, The Campus, 57 Sloane, Bryanston 2021, South Africa | |||
| Pfizer PFE Colombia S.A.S | Common | 68 | Carrera 7 No. 113-43 Piso 4, Colombia | |||
| PHIVCO Jersey II Limited (iii) (Dissolved 31 Dec 2020) | Ordinary | 78.3 | IFC 5, St Helier, JE1 1ST, Jersey, United Kingdom | |||
| PHIVCO Jersey Limited (iii) (Dissolved 31 Dec 2020) | Ordinary | 78.3 | IFC 5, St Helier, JE1 1ST, Jersey, United Kingdom | |||
GSK Annual Report 2020 295
|
|
||
|
|
Other statutory disclosures continued
Group companies continued
| Name | Security | Effective % Ownership |
Registered address | |||
| Subsidiaries where the effective interest is less than 100% continued | ||||||
| PHIVCO-1 LLC | LLC Interests | 78.3 | Corporation Service Company, 251 Little Falls Drive, Wilmington, Delaware, 19808, United States | |||
| PHIVCO-2 LLC | LLC Interests | 78.3 | Corporation Service Company, 251 Little Falls Drive, Wilmington, Delaware, 19808, United States | |||
| PRISM PCH Limited | Voting Shares; Non Voting Shares | 68 | 980 Great West Road, Brentford, Middlesex, TW8 9GS, England | |||
| PT Glaxo Wellcome Indonesia | A Shares; B Shares (0%) | 95 | Jl Pulobuaran Raya Kav III DD/, Kawasan Industri Pulogadung, Timur, Jakarta, 13930, Indonesia | |||
| PT GSK Consumer Healthcare Indonesia | Ordinary | 68 | Graha Paramita Building, 5th F, Jalan Denpasar Raya Blok D-2, Kuningan, JAKARTA SELATAN, 12940, Indonesia | |||
| PT. Bina Dentalindo (in liquidation) | Ordinary | 68 | Gedung Graha Ganesha Lantai 3, Jl Raya Bekasi Km 17, No5, Jakarta Timur 13930, Indonesia | |||
| Shionogi-ViiV Healthcare LLC (ii) | Common Interests | 78.3 | Corporation Service Company, 251 Little Falls Drive, Wilmington, Delaware, 19808, United States | |||
| Sino-American Tianjin Smith Kline & French Laboratories Ltd | Ordinary (55%) | 37.4 | Cheng Lin Zhuang Industrial Zone, Dong Li District, Tianjin, 300163, China | |||
| SmithKline Beecham (Private) Limited | Ordinary (99.6%) | 67.8 | World Trade Center, Level 34, West Tower, Echelon Square, Colombo 1, Sri Lanka | |||
| SmithKline Beecham Research Limited | Ordinary | 68 | 980 Great West Road, Brentford, Middlesex, TW8 9GS, England | |||
| SmithKline Beecham S.A. | Ordinary | 68 | Ctra de Ajalvir Km 2.500, Alcala de Henares, Madrid, 28806, Spain | |||
| SmithKline Beecham-Biomed O.O.O. | Participation Interest (97%) | 97 | Leningradskiy Prospect 37A, Building 4, Floor 2, Premises XIV, Room 42, Moscow, 125167, Russian Federation | |||
| Stafford-Miller (Ireland) Limited | Ordinary | 68 | Clocherane, Youghal Road, Dungarvan, Co. Waterford, Ireland | |||
| Stafford-Miller Limited (In liquidation) | Ordinary; Non-Cumulative Non Redeemable Preference |
68 | 55 Baker Street, London, W1U 7EU, United Kingdom | |||
| Sterling Drug (Malaya) Sdn Berhad | Ordinary | 68 | Lot 89, Jalan Enggang,Ampang / Hulu Kelang Industrial Estate, Selangor Darul Ehsan, 68000 Ampang, Malaysia | |||
| Sterling Products International, Incorporated (ii) | Common | 68 | Corporation Service Company, 251 Little Falls Drive, Wilmington, Delaware, 19808, United States | |||
| Stiefel Consumer Healthcare (UK) Limited | Ordinary | 68 | 980 Great West Road, Brentford, Middlesex, TW8 9GS, England | |||
| Stiefel Egypt LLC (ii) | Quota (99%) | 99 | Amoun Street, PO Box 3001, El Salam City, Cairo, 11491, Egypt | |||
| Stiefel Laboratories (Ireland) Limited (iv) | Ordinary | 68 | Finisklin Business Park, County Sligo, Ireland | |||
| Treerly Health Co., Ltd | Capital Contribution | 68 | Unit 01A, Room 3901, No 16. East Zhujiang Road, Tianhe District, Guangzhou City, the PRC, China | |||
| ViiV Healthcare (South Africa) (Proprietary) Limited (ii) (iv) | Ordinary | 78.3 | Flushing Meadows Building, The Campus, 57 Sloane Street, Bryanston 2021, South Africa | |||
| ViiV HealthCare BV | Ordinary | 78.3 | Van Asch van, Wijckstraat 55h, 3811 LP Amersfoort, The Netherlands, Netherlands | |||
| ViiV Healthcare Company | Common | 78.3 | Corporation Service Company, 251 Little Falls Drive, Wilmington, Delaware, 19808, United States | |||
| ViiV Healthcare Finance 1 Limited (in liquidation) | Ordinary | 78.3 | 55 Baker Street, London, W1U 7EU, England | |||
| ViiV Healthcare Finance 2 Limited | Ordinary | 78.3 | 980 Great West Road, Brentford, Middlesex, TW8 9GS, England | |||
| ViiV Healthcare Finance Limited | Ordinary; Redeemable Preference | 78.3 | 980 Great West Road, Brentford, Middlesex, TW8 9GS, England | |||
| ViiV Healthcare GmbH | Ordinary | 78.3 | Prinzregentenplatz 9, Munchen, 81675, Germany | |||
| ViiV Healthcare GmbH | Ordinary | 78.3 | Talstrasse 3-5, 3053 Muenchenbuchsee, Switzerland | |||
| ViiV Healthcare Hong Kong Limited (ii) | Ordinary | 78.3 | 23/F Tower 6, The Gateway, 9 Canton Road, Harbour City, Tsimshatsui, Kowloon, Hong Kong | |||
| ViiV Healthcare K.K. | Ordinary | 78.3 | 1-8-1 Akasaka Minato-Ku, Tokyo, Japan | |||
| ViiV Healthcare Limited | Class A Shares, Deferred; Class B Shares (0%); Class C Shares (0%); Class D1 (0%); Class D2 (0%); Class E 5% CumulativePreference (0%) |
78.3 | 980 Great West Road, Brentford, Middlesex, TW8 9GS, England | |||
| ViiV Healthcare Pty Ltd | Ordinary | 78.3 | 1061 Mountain Highway, Boronia, VIC, 3155, Australia | |||
| ViiV Healthcare Puerto Rico, LLC | LLC Interests | 78.3 | Centro International de Mercadeo, 90 carr. 165 Torre 2, Suite 800, Guaynabo, 00968, Puerto Rico | |||
| ViiV Healthcare S.r.l. | Quota | 78.3 | Viale dell’Agricoltura 7, Verona, 37135, Italy | |||
| ViiV Healthcare SAS | Ordinary | 78.3 | 23 rue François Jacob, 92500, Rueil-Malmaison, France | |||
| ViiV Healthcare sprl | Ordinary | 78.3 | Site Apollo, Avenue Pascal 2-4-6, Wavre, 1300, Belgium | |||
| ViiV Healthcare Trading LLC (ii) | Participation Interest | 78.3 | Leningradskiy Prospect 37A, Building 4, Floor 2, Premises XIV, Room 28, Moscow, 125167, Russian Federation | |||
296 GSK Annual Report 2020
|
Strategic report
| ||
|
Governance and remuneration
| ||
|
Financial statements
| ||
|
Investor information
|
Other statutory disclosures continued
Group companies continued
| Name | Security | Effective % Ownership |
Registered address | |||
| Subsidiaries where the effective interest is less than 100% continued | ||||||
| ViiV Healthcare Trading Services UK Limited |
Ordinary | 78.3 | 980 Great West Road, Brentford, Middlesex, TW8 9GS, England | |||
| ViiV Healthcare UK (No.2) Limited (in liquidation) |
Ordinary | 78.3 | IFC 5, St Helier, JE1 1ST, Jersey, United Kingdom | |||
| ViiV Healthcare UK (No.3) Limited |
Ordinary | 78.3 | 980 Great West Road, Brentford, Middlesex, TW8 9GS, England | |||
| ViiV Healthcare UK (No.4) Limited |
Ordinary | 78.3 | 980 Great West Road, Brentford, Middlesex, TW8 9GS, England | |||
| ViiV Healthcare UK (No.5) Limited |
Ordinary | 78.3 | 980 Great West Road, Brentford, Middlesex, TW8 9GS, England | |||
| ViiV Healthcare UK (No.6) Limited |
Ordinary | 78.3 | 980 Great West Road, Brentford, Middlesex, TW8 9GS, England | |||
| ViiV Healthcare UK Limited |
Ordinary | 78.3 | 980 Great West Road, Brentford, Middlesex, TW8 9GS, England | |||
| ViiV Healthcare ULC |
Common | 78.3 | 3500 855-2nd Street SW, Calgary, AB, T2P 4J8, Canada | |||
| ViiV Healthcare Venture LLC |
LLC Interests | 78.3 | Corporation Service Company, 251 Little Falls Drive, Wilmington, Delaware, 19808, United States | |||
| ViiVHIV Healthcare Unipessoal Lda |
Quota | 78.3 | Rua Dr Antonio Loureiro Borges No 3, Arquiparque, Miraflores, Alges, 1495-131, Portugal | |||
| Vog AU PTY LTD (ii) |
Ordinary; Redeemable Preference |
68 | 82 Hughes Avenue, Ermington, NSW, 2115, Australia | |||
| Winster Pharmaceuticals Limited (ii) |
Ordinary | 46.4 | 2A Association Avenue, Ilupeju Industrial Estate, Lagos, PO Box 3199, Nigeria | |||
| Wyeth Consumer Healthcare LLC |
Membership Interest | 68 | CT Corporation System, 600 N 2nd St, Suite 401, Harrisburg, Pennsylvania, 17101, United States | |||
| Wyeth Pharmaceutical Co. Ltd |
Registered capital | 68 | 4 Baodai West Road, Suzhou, Jiangsu Province, 215128, China | |||
| Wyeth Pharmaceuticals Company (vii) |
Capital Contribution | 68 | State Road No 3, Kilometer 141.3, Guayama, 00784, Puerto Rico | |||
| Associates | ||||||
| Apollo Therapeutics LLP |
Partnership interest (25%) | 25 | Stevenage Biosciences Catalyst, Gunnels Wood Road, Stevenage, Hertfordshire, SG1 2FX, England | |||
| GlaxoSmithKline Landholding Company, Inc |
Common (40%) | 39.9 | 2266 Chino Roces Avenue, City of Makati, 1231, Philippines | |||
| Index Ventures Life VI (Jersey) LP |
Partnership interest (25%) | 25 | 44 Esplanade, St Helier, Jersey JE4 9WG, Channel Islands | |||
| Innoviva Inc |
Common shares (31.6%) | 31.6 | 1350 Old Bayshore Highway, Suite 400, Burlingame, CA, 94010, United States | |||
| Kurma Biofund II FCPR |
Partnership Interest (32.1%) | 32.1 | 24 rue Royale, 75008 Paris, France | |||
| Longwood Fund I, LP |
Partnership Interest (35%) | 35 | The Prudential Tower, Suite 1555, 800 Boylston Street, Boston, MA 02199 | |||
| Medicxi Ventures I LP |
Partnership Interest (26.2%) | 26.2 | 44 Esplanade, St Helier, Jersey JE4 9WG, Channel Islands | |||
| Joint Ventures | ||||||
| Chiron Panacea Vaccines Private Limited (ii) |
Equity Shares (50%) | 50 | 708/718, 7th Floor, A Wing, Sagar Tech Plaza, Saki Naka, Andheri East, Mumbai, Maharashtra, 400072, India | |||
| Qualivax Pte. Limited |
Ordinary (50%) | 50 | 80 Robinson Road, #02-00, 068898 Singapore | |||
| Quell Intellectual Property Corp., LLC |
Membership Interest (34%) | 34 | Corporation Service Company, 251 Little Falls Drive, Wilmington, Delaware, 19808, United States | |||
| Qura Therapeutics, LLC |
Units (39.2%) | 39.2 | Corporation Service Company, 251 Little Falls Drive, Wilmington, Delaware, 19808, United States | |||
| Other significant shareholdings | ||||||
| Axon Therapies, Inc |
Common shares (9%) Series A Preference (13%) |
22 | C/O Coridea, LLC, 315 west 36th street, New York 10018, Delaware, USA | |||
| Gladius Pharmaceuticals Corporation |
Series A shares (21.2%) | 21.2 | 500 Boulevard West Cartier Quest, Laval, QC H7V 5B7 | |||
| Global Farm S.A. |
A Shares (0%) B Shares (0%) C shares(100%) D Shares (0%) E Shares (0%) F Shares (0%) |
16.7 | Cazadores de Coquimbo 2841 piso 3, Munro, Argentina | |||
| Longwood Fund II LP |
Partnership Interest (20%) | 20 | The Prudential Tower, Suite 1555, 800 Boylston Street, Boston, MA 02199 | |||
| NeuSpera Medical, Inc. |
Series A Preference (9.3%) Series B Preference (10.5%) |
19.8 | 51 Daggett Dr, San Jose, CA 95134, United States | |||
| Sanderling Ventures VII, L.P. A63 |
Partnership Interest (25.3%) | 25.3 | 400 S. El Camino Real, Suite 1200, San Mateo, CA 94402 | |||
| SR One Capital Fund I-B, LP |
Partnership Interest (44%) | 44 | Corporation service company, 251 Little Falls Drive, City of Wilmington, County of New Castle, Delaware 19808 | |||
| VHsquared Limited |
Series A Preference shares (27.2%) | 27.2 | Copley Hill Farm, Cambridge Rd, Babraham, Cambridge CB22 3GN, United Kingdom | |||
GSK Annual Report 2020 297
|
|
||
|
|
Other statutory disclosures continued
Group companies continued
The following UK subsidiaries will take advantage of the audit exemption set out within section 479A of the Companies Act 2006 for the period ended 31 December 2020. Unless otherwise stated, the undertakings listed below are owned, either directly or indirectly, by GlaxoSmithKline plc.
| Name | Security | Registered address | Company Number | |||
| UK registered subsidiaries exempted from audit | ||||||
| Burroughs Wellcome International Limited | Ordinary | 980 Great West Road, Brentford, Middlesex, TW8 9GS, England | 00543757 | |||
| Cellzome Limited | Ordinary | 980 Great West Road, Brentford, Middlesex, TW8 9GS, England | 05001893 | |||
| Clarges Pharmaceuticals Limited | Ordinary; Preference (99.97%) | 980 Great West Road, Brentford, Middlesex, TW8 9GS, England | 00100583 | |||
| Domantis Limited | Ordinary | 980 Great West Road, Brentford, Middlesex, TW8 9GS, England | 03907643 | |||
| Edinburgh Pharmaceutical Industries Limited | Ordinary; Preference | Shewalton Road, Irvine, Ayrshire, KA11 5AP, Scotland | SC005534 | |||
| Eskaylab Limited | 10p Ordinary | 980 Great West Road, Brentford, Middlesex, TW8 9GS, England | 00099025 | |||
| Glaxo Wellcome UK Limited | Ordinary | 980 Great West Road, Brentford, Middlesex, TW8 9GS, England | 00480080 | |||
| Glaxochem (UK) Unlimited | Ordinary; Ordinary B; Ordinary C |
980 Great West Road, Brentford, Middlesex, TW8 9GS, England | 04299472 | |||
| GlaxoSmithKline Consumer Healthcare (UK) (No.1) Limited** | Ordinary | 980 Great West Road, Brentford, Middlesex, TW8 9GS, England | 00753340 | |||
| GlaxoSmithKline Consumer Healthcare Sri Lanka Holdings Limited** | Ordinary | 980 Great West Road, Brentford, Middlesex, TW8 9GS, England | 09400298 | |||
| GlaxoSmithKline Intellectual Property (No.3) Limited | Ordinary | 980 Great West Road, Brentford, Middlesex, TW8 9GS, England | 11480952 | |||
| GlaxoSmithKline Intellectual Property (No.4) Limited | Ordinary | 980 Great West Road, Brentford, Middlesex, TW8 9GS, England | 11721880 | |||
| GlaxoSmithKline Intellectual Property (No.5) Limited | Ordinary | 980 Great West Road, Brentford, Middlesex, TW8 9GS, England | 11959399 | |||
| GlaxoSmithKline International Limited | Ordinary | 980 Great West Road, Brentford, Middlesex, TW8 9GS, England | 02298366 | |||
| GSK Consumer Healthcare Export Limited** | Ordinary | 980 Great West Road, Brentford, Middlesex, TW8 9GS, England | 12508093 | |||
| GSK Limited (ii) | Ordinary | 980 Great West Road, Brentford, Middlesex, TW8 9GS, England | 12215835 | |||
| GSK New Zealand Holding Company Limited** | Ordinary | 980 Great West Road, Brentford, Middlesex, TW8 9GS, England | 12342879 | |||
| Montrose Fine Chemical Company Ltd | Ordinary | Shewalton Road, Irvine, Ayrshire, KA11 5AP, Scotland | SC190635 | |||
| PF Consumer Healthcare UK Limited** | Ordinary | 980 Great West Road, Brentford, Middlesex, TW8 9GS, England | 11678315 | |||
| PHIVCO UK II Limited* | Ordinary | 980 Great West Road, Brentford, Middlesex, TW8 9GS, England | 06944229 | |||
| PHIVCO UK Limited* | Ordinary | 980 Great West Road, Brentford, Middlesex, TW8 9GS, England | 06944223 | |||
| Smith Kline & French Laboratories Limited | Ordinary | 980 Great West Road, Brentford, Middlesex, TW8 9GS, England | 00052207 | |||
| SmithKline Beecham (Export) Limited | Ordinary | 980 Great West Road, Brentford, Middlesex, TW8 9GS, England | 02860752 | |||
| SmithKline Beecham (H) Limited | Non-cumulative non-redeemables; Ordinary |
980 Great West Road, Brentford, Middlesex, TW8 9GS, England | 03296131 | |||
| SmithKline Beecham (Investments) Limited | Ordinary | 980 Great West Road, Brentford, Middlesex, TW8 9GS, England | 00302065 | |||
| SmithKline Beecham Marketing and Technical Services Limited | Ordinary | 980 Great West Road, Brentford, Middlesex, TW8 9GS, England | 00494385 | |||
| SmithKline Beecham Nominees Limited | Ordinary | 980 Great West Road, Brentford, Middlesex, TW8 9GS, England | 00503868 | |||
| Stiefel Laboratories (U.K.) Ltd | Ordinary | Eurasia Headquarters, Concorde Road, Maidenhead, Berkshire, SL6 4BY, England | 00831160 | |||
| Tesaro UK Limited | Ordinary | 55 Baker Street, London, W1U 7EU, England | 07890847 | |||
| The Wellcome Foundation Limited | Ordinary | 980 Great West Road, Brentford, Middlesex, TW8 9GS, England | 00194814 | |||
| ViiV Healthcare Overseas Limited* | Ordinary | 980 Great West Road, Brentford, Middlesex, TW8 9GS, England | 07027385 | |||
| * | The company has an effective ownership in ViiV Healthcare Overseas Limited, PHIVCO UK II Limited and PHIVCO UK Limited of 78.3% |
| ** | The company has an effective ownership in GlaxoSmithKline Consumer Healthcare (UK) (No.1) Limited, GlaxoSmithKline Consumer Healthcare Sri Lanka Holdings Limited, GSK Consumer Healthcare Export Limited and GSK New Zealand Holding Company Limited of 68% |
In accordance with section 479C of the Companies Act 2006, the Company will guarantee debts and liabilities of the above UK subsidiary undertakings. As at 31 December 2020 the total sum of these debts and liabilities is £168 million (2019 – £16 million)
Key
| (i) | Directly owned by GlaxoSmithKline plc. |
| (ii) | Dormant entity. |
| (iii) | Tax resident in the UK. |
| (iv) | Entity expected to be disposed of or removed. |
| (v) | Incorporated in Sweden. |
| (v) | Consolidated as a subsidiary in accordance with section 1162 (4)(a) of the Companies Act 2006 on the grounds of dominant influence. |
| (vii) | Principal business address in Puerto Rico. |
| (viii) | Exempt from the provisions of Regulations 4-6 of the Partnership (Accounts) Regulation 2008, in accordance with the exemptions noted in Regulation 7 of that Regulation. |
| (ix) | Incorporated in the Netherlands |
298 GSK Annual Report 2020
|
Strategic report
| ||
|
Governance and remuneration
| ||
|
Financial statements
| ||
|
Investor information
|
GSK Annual Report 2020 299
|
|
||
|
|
Index
| Page | Page | |||||||||
| 2020 Remuneration policy summary | 133 | Investor relations | 283 | |||||||
| Accounting principles and policies | 158 | Key accounting judgements and estimates | 163 | |||||||
| Acquisitions and disposals | 208 | Key performance indicators | 11 | |||||||
| Adjustments reconciling profit after tax to operating | Legal proceedings | 234 | ||||||||
| cash flows |
212 | Major restructuring costs | 172 | |||||||
| Affordability and availability | 35 | Modern employer | 36 | |||||||
| Annual General Meeting 2021 | 279 | Movements in equity | 204 | |||||||
| Approach to tax | 54 | Net debt | 189 | |||||||
| Assets held for sale | 187 | New accounting requirements | 165 | |||||||
| Associates and joint ventures | 174 | Nominations Committee Report | 105 | |||||||
| Audit & Risk Committee Report | 97 | Non-controlling interests | 206 | |||||||
| Business model | 01 | Non-controlling interests in ViiV Healthcare | 52 | |||||||
| Cash and cash equivalents | 187 | Non-Executive Directors’ fees | 129 | |||||||
| Cash generation and conversion | 68 | Non-financial information statement | 49 | |||||||
| CEO’s statement | 04 | Notes to the financial statements | 158 | |||||||
| Chairman’s statement | 03 | Operating profit | 170 | |||||||
| Chairman’s Governance statement | 78 | Other intangible assets | 182 | |||||||
| Chairman’s Remuneration annual statement | 112 | Other investments | 185 | |||||||
| Climate-related financial disclosure | 46 | Other non-current assets | 185 | |||||||
| Commitments | 202 | Other non-current liabilities | 202 | |||||||
| Consolidated balance sheet | 155 | Other operating income/(expense) | 169 | |||||||
| Consolidated cash flow statement | 157 | Other provisions | 200 | |||||||
| Consolidated income statement | 154 | Our culture | 10 | |||||||
| Consolidated statement of changes in equity | 156 | Our long-term priorities | 09 | |||||||
| Consolidated statement of comprehensive income | 154 | Pensions and other post-employment benefits | 191 | |||||||
| Consumer Healthcare | 27,31 | Performance | 28 | |||||||
| Consumer Healthcare products and competition | 260 | Pharmaceuticals | 18,28 | |||||||
| Contingent consideration liabilities | 201 | Pharmaceutical products, competition and | ||||||||
| Contingent liabilities | 202 | intellectual property |
258 | |||||||
| Corporate Executive Team | 83 | Pipeline | 255 | |||||||
| Corporate governance | 77 | Post balance sheet events | 237 | |||||||
| Corporate Responsibility Committee Report | 102 | Presentation of the financial statements | 158 | |||||||
| Critical accounting policies | 75 | Principal Group companies | 233 | |||||||
| Data and engagement | 40 | Principal risks and uncertainties | 261 | |||||||
| Directors and senior management | 131 | Property, plant and equipment | 179 | |||||||
| Directors’ interests in shares | 130 | Quarterly trend | 244 | |||||||
| Directors’ report | 109 | Reconciliation of net cash flow to movement in net debt | 213 | |||||||
| Directors’ statement of responsibilities | 140 | Registrar | 282 | |||||||
| Dividends | 178,278 | Related party transactions | 208 | |||||||
| Donations to political organisations and political | Reliable supply | 39 | ||||||||
| expenditure |
286 | Remuneration governance | 128 | |||||||
| Earnings per share | 178 | Remuneration report | 114 | |||||||
| Employee costs | 171 | Reporting framework | 51 | |||||||
| Employee share schemes | 231 | Responsible business | 39 | |||||||
| Environment | 41 | Right of use assets | 180 | |||||||
| Ethics and values | 39 | Risk management | 43 | |||||||
| Exchange rates | 166 | Science and technology | 34 | |||||||
| Finance expense | 173 | Science Committee report | 104 | |||||||
| Finance income | 173 | Section 172 statement | 108 | |||||||
| Financial calendar 2021 | 279 | Share capital and control | 276 | |||||||
| Financial instruments and related disclosures | 214 | Share capital and share premium account | 203 | |||||||
| Financial performance | 06,55 | Shareholder information | 276 | |||||||
| Financial position and resources | 69 | Shareholder services and contacts | 282 | |||||||
| Financial statements of GlaxoSmithKline plc, prepared | Stakeholder engagement | 16 | ||||||||
| under UK GAAP |
238 | Taxation | 175 | |||||||
| Five year record | 249 | Tax information for shareholders | 280 | |||||||
| Glossary of terms | 299 | The Board | 80 | |||||||
| Goodwill | 181 | Trade and other payables | 188 | |||||||
| Group companies | 287 | Trade and other receivables | 186 | |||||||
| Group financial review | 51 | Transformation & Separation Committee report | 107 | |||||||
| Impact of Brexit | 49 | Treasury policies | 74 | |||||||
| Independent Auditor’s report | 142 | Trust | 33 | |||||||
| Industry trends | 12 | Turnover and segment information | 166 | |||||||
| Innovation | 18 | US law and regulation | 284 | |||||||
| Inventories | 186 | Vaccines | 18,30 | |||||||
| Investments in associates and joint ventures | 184 | Vaccine products, competition and intellectual property | 259 | |||||||
| Viability statement | 48 | |||||||||
300 GSK Annual Report 2020
About GSK
|
GlaxoSmithKline plc was incorporated as an
English
Our shares are listed on the London Stock
Exchange |
Brand names
Brand names appearing in italics throughout this report are trade marks either owned by and/or licensed to GSK or associated companies. All other trade marks are the property of their respective owners.
Acknowledgements
Printing Printed sustainably in the UK by Pureprint, a CarbonNeutral® company with FSC® chain of custody and an ISO 14001 certified environmental management system recycling over 99% of all dry waste.
Paper Printed on Innovation Premium, an FSC certified paper. The pulps used are Totally Chlorine Free and the manufacturing mill has ISO 14001 environmental management certification. The mill’s energy is produced from 100% biomass fuels sourced from local forestry and no fossil fuels are used. The carbon emissions have been measured and offset using the World Land Trust’s Carbon Balanced scheme.
Download PDFs:
| |||||||
|
|
Read more at www.gsk.com | |||||||
|
|
Annual Report 2020
| |||||||
|
|
Form 20-F | |||||||
|
Cautionary statement regarding
The Group’s reports filed with or furnished to the US Securities and Exchange Commission (SEC), including this document, and any other written information released, or oral statements made, to the public in the future by or on behalf of the Group, may contain forward-looking statements. Forward-looking statements give the Group’s current expectations or forecasts of future events. An investor can identify these statements by the fact that they do not relate strictly to historical or current facts. They use words such as ‘anticipate’, ‘estimate’, ‘expect’, ‘intend’, ‘will’, ‘project’, ‘plan’, ‘believe’, ‘target’ and other words and terms of similar meaning in connection with any discussion of future operating or financial performance. In particular, these include statements relating to future actions, prospective products or product approvals, future performance or results of current and anticipated products, sales efforts, expenses, the outcome of contingencies such as legal proceedings, dividend payments and financial results. Other than in accordance with its legal or regulatory obligations (including under the Market Abuse Regulations, the UK Listing Rules and the Disclosure and Transparency Rules of the Financial Conduct Authority), the Group undertakes no obligation to update any forward-looking statements, whether as a result of new information, future events or otherwise. The reader should, however, consult any additional disclosures that the Group may make in any documents which it publishes and/or files with the SEC. All readers, wherever located, should take note of these disclosures. Accordingly, no assurance can be given that any particular expectation will be met and investors are cautioned not to place undue reliance on the forward- looking statements.
Forward-looking statements are subject to assumptions, inherent risks and uncertainties, many of which relate to factors that are beyond the Group’s control or precise estimate. The Group cautions investors that a number of important factors, including those in this document, could cause actual results to differ materially from those expressed or implied in any forward-looking statement.
|
Such factors include, but are not limited to, those discussed under ‘Principal risks and uncertainties’ on pages 261 to 275 of this Annual Report and any impacts of the COVID-19 pandemic. Any forward-looking statements made by or on behalf of the Group speak only as of the date they are made and are based upon the knowledge and information available to the Directors on the date of this Annual Report.
A number of non-IFRS measures are used to report the performance of our business. These measures are defined on pages 51 to 53 and a reconciliation of Adjusted results to Total results is set out on page 64.
The information in this document does not constitute an offer to sell or an invitation to buy shares in GlaxoSmithKline plc or an invitation or inducement to engage in any other investment activities. Past performance cannot be relied upon as a guide to future performance. Nothing in this Annual Report should be construed as a profit forecast.
Assumptions related to 2021 guidance
In outlining the guidance for 2021, the Group has made certain assumptions about the healthcare sector, the different markets in which the Group operates and the delivery of revenues and financial benefits from its current portfolio, pipeline and restructuring programmes.
The Group has made planning assumptions for 2021 that healthcare systems and consumer trends will approach normality in the second half of the year, and we expect turnover to be flat to low single digit growth for the Pharmaceuticals and Vaccines businesses and low to mid-single digit growth for Consumer Healthcare excluding brands divested/under review. These planning assumptions as well as earnings guidance and dividend expectations assume no material interruptions to supply of the Group’s products, no material mergers, acquisitions or disposals, no material litigation or investigation costs for the Company (save for those that are already recognised or for which provisions have been made), no share repurchases by the Company, and no change in the Group’s shareholdings in ViiV Healthcare. The assumptions also assume no material changes in the healthcare environment. The 2021 guidance factors in all divestments and product exits announced to date, including product divestments planned in connection with the formation of the Consumer Healthcare Joint Venture with Pfizer, and the non-core divestments planned to fund the cash costs of the Separation Preparation restructuring programme.
|
The Group’s guidance assumes successful delivery of the Group’s integration and restructuring plans. It also assumes that the integration and investment programmes following the creation of the Consumer Healthcare Joint Venture with Pfizer are delivered successfully. Material costs for investment in new product launches and R&D have been factored into the expectations given. Given the potential development options in the Group’s pipeline, the outlook may be affected by additional data-driven R&D investment decisions. Our guidance assumes no significant new changes in tax regimes, and does not include the impact of the intended change in the UK corporation tax rate announced on 3 March 2021. The guidance is given on a constant currency basis.
Notice
regarding limitations on
Under the UK Companies Act 2006, a safe harbour limits the liability of Directors in respect of statements in and omissions from the Directors’ Report (for which see page 109), the Strategic report and the Remuneration report. Under English law the Directors would be liable to the company, but not to any third party, if one or more of these reports contained errors as a result of recklessness or knowing misstatement or dishonest concealment of a material fact, but would otherwise not be liable. Pages 77 to 110, 140 to 141, and 261 to 298 inclusive comprise the Directors’ Report, pages 1 to 76 inclusive comprise the Strategic report and pages 111 to 138 inclusive comprise the Remuneration report, each of which have been drawn up and presented in accordance with and in reliance upon English company law and the liabilities of the Directors in connection with these reports shall be subject to the limitations and restrictions provided by such law.
Website
GSK’s website www.gsk.com gives additional information on the Group. Notwithstanding the references we make in this Annual Report to GSK’s website, none of the information made available on the website constitutes part of this Annual Report or shall be deemed to be incorporated by reference herein.
|


 For Consumer Healthcare read more on page 27