Chunghwa Telecom Co., Ltd.
Sustainability-Related Financial Information 2025
Aligned with IFRS Sustainability Disclosure Standards: IFRS S1 & IFRS S2
(This translated document is prepared in accordance with the Chinese version and is for reference only. In the event of any inconsistency between the English version and the Chinese version, the Chinese version shall prevail.)
| 1. |
Introduction | 3 | ||||||||
| 1.1 Company Introduction |
3 | |||||||||
| 1.2 Reporting Entity |
3 | |||||||||
| 1.3 Statement of Compliance |
3 | |||||||||
| 1.4 Date and Procedures for Approval of the Sustainability Information Section |
3 | |||||||||
| 1.5 Application of Exemptions |
4 | |||||||||
| 2. |
Governance | 4 | ||||||||
| 2.1 Role of the Governing Body in Overseeing Sustainability-Related Risks and Opportunities |
4 | |||||||||
| 2.1.1 Governance Structure for Sustainability-Related Risks and Opportunities | 4 | |||||||||
| 2.1.2 Development of Skills and Expertise Related to Sustainability-Related Risks and Opportunities | 6 | |||||||||
| 2.1.3 Trade-Offs in Policies Related to Sustainability-Related Risks and Opportunities | 7 | |||||||||
| 2.1.4 Target Setting for Sustainability-Related Risks and Opportunities, and Linkage to Performance and Remuneration Policies | 7 | |||||||||
| 3. |
Strategies | 8 | ||||||||
| 3.1 Sustainability-Related Risks and Opportunities |
8 | |||||||||
| 3.1.1 Time Horizons: Definitions and Linkage to Strategic Planning Timelines | 9 | |||||||||
| 3.1.2 Sustainability-related Risks and Opportunities Reasonably Expected to Affect the Company’s Outlook, and Their Potential Impacts on the Business Model and Value Chain |
10 |
|||||||||
| 3.2 Impacts of Sustainability-Related Risks and Opportunities on Strategy and Decision-making |
16 |
|||||||||
| 3.2.1 Sustainability Plan and Climate Transition Plan |
16 | |||||||||
| 3.2.2 Financial Impact of Sustainability-Related Risks and Opportunities |
23 | |||||||||
| 3.3 Resilience Assessment |
27 | |||||||||
| 3.3.1 Climate-Related Scenario Analysis and Assessment |
27 | |||||||||
| 3.3.2 Resilience Assessment for Non-Climate Sustainability-related Risks |
32 | |||||||||
| 4. |
Risk Management | 32 | ||||||||
| 4.1 Processes and Policies for Identifying, Assessing, Prioritizing, and Monitoring Sustainability-Related Risks |
32 | |||||||||
| 4.1.1 Input Data Sources and Parameters for Sustainability-Related Risks and Opportunities |
33 | |||||||||
| 4.1.2 Assessment Methods for the Nature, Likelihood, and Impact of Sustainability-Related Risks and Opportunities |
33 |
|||||||||
| 4.1.3 Prioritization of Sustainability-Related Risks and Opportunities and the Methodology |
34 | |||||||||
| 4.1.4 Mechanisms for Monitoring Sustainability-Related Risks and Opportunities |
34 | |||||||||
| 5. |
Metrics & Targets | 35 | ||||||||
| 5.1 Disclosure of Established Sustainability-Related Metrics and Targets |
35 | |||||||||
| 5.1.1 Greenhouse Gas–related Targets and Metrics |
38 | |||||||||
| 5.1.2 Cross-Industry Climate-Related Indicators |
45 | |||||||||
| 5.1.3 Internal Carbon Pricing |
46 | |||||||||
| 5.1.4 Remuneration |
46 | |||||||||
| 5.2 Information Relevant to Industry-Based Metrics | 47 | |||||||||
- 2 -
| 1. | Introduction |
| 1.1 | Company Introduction |
Chunghwa Telecom Co., Ltd. (hereinafter referred to as “Chunghwa Telecom”) is the largest integrated telecommunications operator in Taiwan. Its core business encompasses fixed-line communications, mobile communications, broadband access, and internet services. Leveraging technological capabilities in big data, cybersecurity, cloud computing, and network data center, the Company provides ICT services to enterprise customers. It also develops emerging technology solutions such as the Internet of Things (IoT) and artificial intelligence (AI), creating a high-quality communications environment and an exciting and convenient digital lifestyle for customers. In addition, Chunghwa Telecom actively strengthens its strategic partnerships with international telecommunications operators to advance its global presence.
| 1.2 | Reporting Entity |
The reporting entity covered in this dedicated section on sustainability-related financial information (hereinafter referred to as “the Group”) is consistent with that presented in the Group’s consolidated financial statements for the reporting period ended December 31, 2025.
| 1.3 | Statement of Compliance |
The Group has prepared this report in accordance with the Regulations Governing Information to be Published in Annual Reports of Public Companies and the IFRS Sustainability Disclosure Standards recognized by the Financial Supervisory Commission. Fiscal year 2025 marks the first year in which the Group applies the IFRS Sustainability Disclosure Standards.
| 1.4 | Date and Procedures for Approval of the Sustainability Information Section |
This Sustainability-Related Financial Information Section (hereinafter referred to as “this Section”) was approved and released by the Board of Directors on February 26, 2026.
- 3 -
| 1.5 | Application of Exemptions |
The exemptions applied by the Group for the current year in accordance with the transitional provisions and other provisions under the IFRS Sustainability Disclosure Standards are summarized in the table below:
| Exemption Items | Description |
Corresponding Paragraphs under the IFRS Sustainability Disclosure Standards | ||
| Comparative Information | Entities are not required to disclose comparative information (including information related to climate-related risks and opportunities) in the first annual reporting period in which IFRS S1 is applied. | IFRS S1.E3& E6(a), IFRS S2.C3 | ||
| Commercially Sensitive Information | Commercially sensitive information related to sustainability-related opportunities may be omitted when the conditions specified in paragraph B35 of IFRS S1 are met. | IFRS S1.B34-B36 | ||
|
Use of Global Warming Potential (GWP) values other than those provided in the latest IPCC Assessment Report.
|
In accordance with the “Greenhouse Gas Emissions Inventory and Reporting Guidelines (2024 Edition)” issued by the Ministry of Environment, the GWP values from the IPCC Fifth Assessment Report (AR5), as specified in Appendix 1 of the Guidelines, shall be applied when calculating greenhouse gas (GHG) emissions. | IFRS S2.B21-B22 |
| 2. | Governance |
| 2.1 | Role of the Governing Body in Overseeing Sustainability-Related Risks and Opportunities |
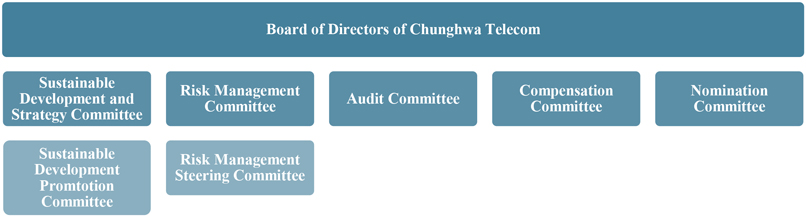
The Board of Directors serves as the highest governing body, responsible for the governance and oversight of sustainability- and climate-related matters. The Board conducts regular supervision of sustainability- and climate-related issues and, through its functional committees at the board level, ensures that sustainability- and climate-related affairs receive adequate attention and management.
| 2.1.1 | Governance Structure for Sustainability-Related Risks and Opportunities |
The Board of Directors and its functional committees provide the highest level of guidance in addressing risks and seizing opportunities across various dimensions of sustainability- and climate-related matters. The detailed responsibilities of the Board and senior management are described as follows:
- 4 -
| Board of Directors of Chunghwa Telecom: • Holds meetings on a quarterly basis. • Oversees the overall sustainability and climate governance strategies and mechanisms, formulates major decisions and sets the vision, and regularly reviews the effectiveness of the implementation of sustainability and climate strategies.
| ||
|
Board-Level
|
Sustainable Development and Strategy Committee: • Holds meetings at least twice a year. • Aims to enhance the effectiveness of the Board of Directors by convening discussions on key corporate development matters, with meeting conclusions submitted to the Board for approval when necessary. Key topics include, but are not limited to: establishing sustainability policies and management guidelines, setting medium- to long-term development goals and strategies, major investments and mergers & acquisitions, significant organizational adjustments, acquisition or surrender of business licenses, preparation and revision of annual operational plans and budgets, and changes in capital.
Risk Management Committee: • Holds meetings at least twice a year. • Integrates sustainability- and climate-related risks into the Enterprise Risk Management (ERM) system and internal risk management framework for oversight.
Audit Committee: • Holds meetings on a quarterly basis. • Oversees the proper presentation of the financial statements, the effective implementation of internal controls over overall operations (including sustainability-related activities), the Company’s risk management mechanisms, and compliance with applicable laws and regulations, and reviews the Chief Audit Executive’s report and recommendations on the effectiveness of the Company’s internal control implementation.
Compensation Committee: • Holds meetings at least twice a year. • Establishes and regularly reviews the policies, systems, standards, and structures for the performance evaluation and remuneration of directors and executives, linking the assessment results of sustainability- and climate-related target achievements to compensation. For detailed mechanisms, please refer to ‘‘2.1.4 Target Setting for Sustainability-Related Risks and Opportunities, and Linkage to Performance and Remuneration Policies’’ for further information.
Nomination Committee: • Holds meetings at least once a year. • Establishes standards for board diversity and independence, nominates and reviews director candidates; regularly evaluates the performance of the Board and its functional committees; formulates and recommends continuing education programs for directors; and reviews proposed amendments to the Company’s Corporate Governance Code and the Board Performance Evaluation Regulations. | |
- 5 -
|
Management-Level
|
Sustainable Development Promotion Committee: • The Chairman and the President serve as the Chair and Deputy Chair of the Committee, respectively, responsible for driving the formulation, review, and oversight of sustainability strategies, policies, and targets, as well as the supervision of annual ESG performance outcomes. The Committee reports key sustainability issues to the Sustainable Development and Strategy Committee, and provides quarterly updates to the Board of Directors on major sustainability progress and target achievement status. • The Committee has established four subgroups corresponding to the Environmental, Social 1, Social 2, and Governance dimensions, each supervised by an Executive Vice President from the headquarters. Each subgroup convenes a monthly meeting to oversee progress. A cross-functional quarterly meeting is held, presided over by the President, to supervise ESG-related sustainability planning, stakeholder engagement, and the execution outcomes of action plans across all dimensions.
Risk Management Steering Committee: • The President serves as the Chairperson, leading the Committee in reviewing, overseeing, and formulating the Company’s enterprise risk management (ERM) policies and mechanisms, as well as planning risk management training programs to enhance overall risk awareness and organizational culture. The Committee provides regular reports to the Risk Management Committee and the Board of Directors. • The Committee has established a dedicated Risk Management Execution Unit responsible for carrying out day-to-day risk management activities, consolidating and regularly reporting the Company’s ERM implementation status. Currently, quarterly meetings are convened with the participation of relevant departments to ensure continuous enhancement and effective execution of risk management operations. |
2.1.2 Development of Skills and Expertise Related to Sustainability-Related Risks and Opportunities
Of the 13 directors on the current Board, 9 possess professional expertise in ESG-related matters, while 8 have relevant experience in risk management, with several directors holding expertise in both areas. The distribution of the aforementioned competencies is presented in the table below:
|
Directors Name |
Sustainability (including Climate Change)–Related Competencies | |||||
| Sustainable Development (ESG) |
Audit / Risk Management |
Climate Change | ||||
| Chih-Cheng Chien | ◎ | ◎ | ◎ | |||
| Rong-Shy Lin | ◎ | ◎ | ◎ | |||
| Sheng-Yuan Wu | ◎ | ◎ | « | |||
| Ching-Hwi Lee | « | « | ||||
| Chi-Hwa Chern | ◎ | ◎ | ◎ | |||
| Lee-Feng Chien | « | |||||
| I-Jen Su | ◎ | |||||
| Shiow-Long Horng | ◎ | « | ||||
| Su-ming Lin | ◎ | ◎ | ◎ | |||
| Yi-Chin Tu | ◎ | ◎ | « | |||
| Ikujin Ko | ◎ | « | ||||
| Ching-Feng Hsueh | « | « | ||||
| Jer-Liang Yeh | ◎ | ◎ | ||||
« Indicates partial capability.
- 6 -
To enhance the Board of Directors’ awareness and competencies regarding climate change issues, as well as their sensitivity to sustainability trends and green technology developments, the Group arranges annual training programs covering topics such as sustainability trends, sustainability- and climate-related risks, advancements in green technologies, and emerging domestic and international sustainability and climate regulatory trends. These programs support directors in strengthening their understanding of sustainability transitions and practical developments. During the reporting year, all 13 directors completed sustainability-related training, accumulating a total of 93 training hours.
2.1.3 Trade-Offs in Policies Related to Sustainability-Related Risks and Opportunities
In governing sustainability- and climate-related matters, various decision-making dimensions are taken into account and the perspectives of different stakeholders are considered to the greatest extent possible. The Board of Directors, in its oversight of corporate strategy, review of material transactions, and supervision of risk management processes and related policies, evaluates sustainability- and climate-related considerations as presented by the responsible units and carefully weighs the potential impacts of all relevant factors in its decision-making.
2.1.4 Target Setting for Sustainability-Related Risks and Opportunities, and Linkage to Performance and Remuneration Policies
The Group’s oversight of the target-setting process for sustainability-related risks and opportunities, as well as the monitoring of progress against such targets, is detailed in “2.1.1 Governance Structure for Sustainability-Related Risks and Opportunities”.
In addition, to foster sustainability and climate awareness and enhance response capabilities, the Group links the remuneration of directors and senior management at headquarters to corporate sustainability- and climate-related matters. This approach is designed to incentivize all employees to actively engage with sustainability and climate issues, strengthen the willingness to implement action plans, and ultimately enhance overall climate resilience, advancing the Group’s proactive transition toward a low-carbon and sustainable pathway.
| Directors | To strengthen the alignment between directors’ performance and the Company’s sustainability vision, as well as its short-, medium-, and long-term strategic objectives, the Company has incorporated sustainability management and ESG-related issues into the evaluation dimensions set forth in the Regulations Governing the Performance Evaluation of the Board of Directors of Chunghwa Telecom Co., Ltd. The ESG evaluation dimension assesses directors’ understanding of sustainability-related matters, their ongoing oversight of the Company’s ESG performance, and the extent to which directors support and promote the Company’s sustainability initiatives. The evaluation results serve as an important reference for continuously enhancing board governance quality and overall operational effectiveness. In addition to conducting annual internal self-evaluations, the Board commissions external professional institutions or teams of experts and scholars to conduct independent evaluations every three years, thereby providing objective perspectives and professional insights. | |
| Executives | The Company has established the Regulations of Performance Management for Senior Executives, and Related Incentive Issuance Ruler, and in alignment with the Group’s sustainability vision and strategy, has formally incorporated ESG indicators into its performance management framework. Senior executive compensation is explicitly linked to ESG performance. The relevant sustainability indicators include electricity consumption, renewable energy utilization, digital empowerment of small and medium-sized enterprises (SMEs), corporate governance, and international sustainability ratings. The ESG-linked weighting increased to 10% in 2022, thereby reinforcing accountability and incentivizing senior management to fully integrate ESG principles into day-to-day operations. The proportion will be progressively increased on an annual basis to reach 30% by 2025. |
- 7 -
| 3. | Strategies |
| 3.1 | Sustainability-Related Risks and Opportunities |
To identify sustainability-related risks and opportunities that could reasonably be expected to affect the Group’s development, the Group established, in 2024, a project task force for the implementation of the IFRS Sustainability Disclosure Standards. The task force operates under the supervision of the President, with joint leadership by the Senior Executive Vice President of Finance and the Senior Executive Vice President of Technology, to advance the disclosure of sustainability-related risks and opportunities.
In identifying sustainability-related risks and opportunities, the information used by the Group is based on reasonable and supportable data that can be obtained without incurring undue cost or effort as of the reporting date, including past events, current conditions, and forward-looking projections. This approach ensures that the primary users of general purpose financial reports can fully understand the impacts of such risks and opportunities on the Group’s development.
The significant judgments involved in the preparation of the Group’s sustainability-related financial disclosures follow the process set out in the table below:
|
Procedures |
Description | |
|
Step 1 Consolidation of Group Sustainability-related Topics |
Through ongoing operational activities and continuous engagement and communication with stakeholders, the Group identifies sustainability-related topics by integrating its sustainability development framework with global sustainability disclosure standards, thereby recognizing sustainability-related risks and opportunities. The primary bases and sources of analysis include: • Sustainability Management Framework: Incorporating the Group’s sustainability vision, development objectives, and historical material sustainability topics. • Standards and Frameworks: Including the Sustainability Accounting Standards Board (SASB) Standards, IFRS S2 Industry-based Implementation Guidance, GRI Standards, and TCFD. • Industry trends and benchmark cases from leading domestic and international peers. • Perspectives from internal and external experts, as well as sustainability issues prioritized by stakeholders.
| |
|
Step 2 Identifying the Potential Impacts of Sustainability-related Risks and Opportunities on Current and Expected Financial Performance
|
The Group analyzes interactions with stakeholders, society, the economy, and the natural environment across the value chain to identify how sustainability-related positive and negative events may affect the Group’s business model and strategic direction. Furthermore, the Group assesses the extent to which these impacts may reasonably be expected to give rise to sustainability-related risks and opportunities in the short, medium, and long term, potentially influencing the Group’s cash flows, access to financing, and cost of capital. | |
|
Step 3 Establishing Sustainability-related Metrics and Targets
|
For material sustainability-related risks and opportunities, the Group establishes concrete management measures and sets short-, medium-, and long-term metrics and targets, accompanied by monitoring, evaluation, and tracking mechanisms. |
- 8 -
Furthermore, the Group implements a periodic issue-maintenance mechanism to ensure that, during each financial reporting period, any occurrence of significant events or substantial changes in circumstances is promptly identified and addressed. The Group has reassessed the scope of all relevant sustainability-related risks and opportunities across its operations and value chain.
| 3.1.1 | Time Horizons: Definitions and Linkage to Strategic Planning Timelines |
The Group classifies the time horizons within which sustainability-related risks and opportunities are expected to occur into short-term, medium-term, and long-term. The definitions are presented in the table below:
| Period | Definition | Linkage to Strategic Decision-Making | ||
|
Short- term |
• Less than 1 year • 2026 |
In consideration of the Group’s planning cycles for sustainability-related decision-making, as well as relevant national policies and regulatory requirements, the time horizons are categorized into short-term, medium-term, and long-term. | ||
| Medium-term | • More than 1 year and up to 5 years • 2027 to 2031 | |||
|
Long- |
• More than 5 years • 2032 and afterwards |
- 9 -
3.1.2 Sustainability-related Risks and Opportunities Reasonably Expected to Affect the Company’s Outlook, and Their Potential Impacts on the Business Model and Value Chain
The sustainability-related risks and opportunities reasonably expected to affect the Group’s development—along with their potential impacts on the business model and value chain, as well as the anticipated time horizons—are summarized in the table below.
| Sustainability-Related Risks and Opportunities |
Current and Expected Impacts on the Business Model and Value Chain |
Affected Positions within the Value Chain |
Expected Time Horizon of Major Impacts | |||||||||||||||||
| Type | Description | Upstream | The Group |
Downstream |
Short- term |
Medium - term |
Long- term 2032) | |||||||||||||
|
Sustainability-Related Opportunities |
To meet the digital resilience requirements of government and corporate clients, the Group provides solutions encompassing network, system, and cybersecurity resilience |
The telecommunications industry serves as the foundation of digital resilience across all sectors. Through investments in research and development, as well as in equipment procurement to enhance intellectual and manufactured capital, telecommunications companies can strengthen their financial capital while driving business growth and enhancing overall social and relationship capital through improved digital resilience. |
Current Situation • Network Resilience: Key infrastructure network backup requirements from clients in maritime, remote island, and banking sectors are expected to increase revenue opportunities of CT- and ICT-related services for satellite communications. • System Resilience: In line with the national development plan to build a resilient Taiwan, and with regulatory relaxation in the financial sector allowing hybrid cloud deployment for backup and disaster recovery, demand for IDC and cloud services is expected to grow. Geopolitical factors also reinforce this trend. • Cybersecurity Resilience: In recent years, the resilience of digital communication infrastructure has become a national development priority. Demand from government and corporate clients for professional cybersecurity services and integrated cybersecurity hardware and software solutions is expected to increase. Expected Situation In response to business opportunities arising from the government’s five major trusted industries and next-generation communications initiatives, the Group will leverage diversified network, system, and cybersecurity resilience services to empower vertical industries and provide comprehensive resilience solutions covering networks, systems, and cybersecurity for government and corporate clients. |
◎ | ◎ | ◎ | ◎ | |||||||||||||
- 10 -
| Sustainability-Related Risks and Opportunities |
Current and Expected Impacts on the Business Model and Value Chain |
Affected Positions within the Value Chain |
Expected Time Horizon of Major Impacts | |||||||||||||||||
| Type | Description | Upstream | The Group |
Downstream |
Short- term |
Medium - term |
Long- term 2032) | |||||||||||||
| Climate-Related Opportunities | Providing customers with products or services that enhance climate resilience. | As core infrastructure within the information and communications technology (ICT) industry, telecommunications services can expand business scope and enhance both financial capital and social and relationship capital through investments in intellectual and manufactured capital, including R&D and advanced equipment. | Current Situation By leveraging the Internet of Things (IoT) to enhance disaster early warning, energy management, and remote maintenance capabilities, the Group assists enterprises in addressing challenges posed by climate change. Promoting smart service applications for disaster prevention can expand business scope and increase operational revenue. Expected Situation • Deepen IoT smart applications to generate new revenue streams. • Through diversified business development, integrate technologies and resources, and strengthen collaboration with suppliers. Develop digital, communication, and smart solutions—including cloud computing, data processing, carbon reduction analytics, and low-carbon digital services—to help enterprise clients enhance climate resilience and operational stability. |
◎ | ◎ | ◎ | ◎ | ◎ | ◎ | |||||||||||
- 11 -
| Sustainability-Related Risks and Opportunities |
Current and Expected Impacts on the Business Model and Value Chain |
Affected Positions within the Value Chain |
Expected Time Horizon of Major Impacts | |||||||||||||||||
| Type | Description | Upstream | The Group |
Downstream |
Short- term |
Medium - term |
Long- term 2032) | |||||||||||||
| Climate-Related Opportunities | Energy efficiency improvements to reduce electricity consumption and associated carbon pricing costs | The telecommunications industry is characterized by substantial capital investment in energy-intensive equipment. By investing in energy-saving and high-energy-efficiency equipment manufacturing capital, companies can enhance energy efficiency and reduce electricity consumption, thereby strengthening financial capital and intellectual capital. | Current Situation The Group’s guideline focuses on reducing electricity cost and ensuring business stability: • In terms of operations, by implementing energy-efficient equipment and enhancing data center energy efficiency, the Group reduces electricity consumption and lowers long-term operational electricity costs. • In terms of business, through energy efficiency initiatives, the Group supports clients in reducing long-term electricity costs, enhancing operational efficiency, and thereby stabilizing business revenue. Expected Situation • Promote energy efficiency for base stations and retire outdated fixed-network equipment; develop energy consumption analysis and air-conditioning optimization technologies for cloud data centers, and implement centralized energy monitoring with anomaly detection. • Leverage information and communication technologies to manage EV charging stations, inspect solar photovoltaic modules, optimize green energy storage, and provide carbon footprint analysis solutions, assisting enterprises in adopting green energy applications and carbon management practices. |
◎ | ◎ | ◎ | ||||||||||||||
- 12 -
| Sustainability-Related Risks and Opportunities |
Current and Expected Impacts on the Business Model and Value Chain |
Affected Positions within the Value Chain |
Expected Time Horizon of Major Impacts | |||||||||||||||||
| Type | Description | Upstream | The Group |
Downstream |
Short- term |
Medium - term |
Long- term 2032) | |||||||||||||
|
Climate-Related Risks — Transition Risks |
Increased compliance costs in response to the government’s 2050 net-zero emissions policy |
The telecommunications industry’s service operations rely heavily on electricity consumption and therefore generate substantial GHG emissions. In response to global net-zero decarbonization trends and relevant regulatory policies of regulatory authorities, telecommunications operators may be required to incur additional operating costs, expenses, or capital expenditures related to intellectual capital and manufactured capital investments. |
Current Situation In response to the government’s 2050 net-zero emissions policy, the Group has proactively planned its decarbonization pathway and established a target to achieve net-zero emissions by 2045. Implementation actions—such as the replacement of energy-intensive equipment, deployment of energy management systems, procurement of renewable energy, and the purchase of carbon credits—are expected to increase compliance costs. Expected Situation In order to achieve 100% renewable energy usage by 2040 (RE100) and 100% electrification of engineering and corporate fleet vehicles by 2030 (EV100), higher long-term procurement costs are anticipated. |
◎ | ◎ | ◎ | ||||||||||||||
- 13 -
| Sustainability-Related Risks and Opportunities |
Current and Expected Impacts on the Business Model and Value Chain |
Affected Positions within the Value Chain |
Expected Time Horizon of Major Impacts | |||||||||||||||||
| Type | Description | Upstream | The Group |
Downstream |
Short- term |
Medium - term |
Long- term 2032) | |||||||||||||
| Sustainability-Related Risks | Power and network disruptions and abnormal outages of critical information systems or cloud data center infrastructure caused by major natural disasters, external environmental changes, or multi-hazard events |
Chunghwa Telecom owns extensive equipment and infrastructure classified as manufactured capital (including but not limited to base stations and data centers) and continuously utilizes such capital to provide essential telecommunications services to society. When exposed to significant external events (including but not limited to strong winds, heavy rainfall, and earthquakes), such manufactured capital may be impaired. These events may also adversely affect Chunghwa Telecom’s social capital, including customer relationships and brand reputation. |
Current Situation • Malfunctions of critical network equipment may disrupt voice and broadband internet services. • Instability or operational failures in IDC and cloud data center facilities. • Inability to resolve outages in critical information systems. These issues may result in shortfalls in operating revenue and require additional capital expenditures for restoration and reconstruction. Expected Situation Taiwan is located in a region highly susceptible to natural disasters, and various telecommunications network infrastructures are prone to damage. When large-scale disasters strike affected areas, communications services may be severely disrupted, leading to interruptions in customer communications and emergency reporting, and potentially creating “communication islands.” Such incidents would significantly impair disaster response efforts, endanger life and property, and result in substantial revenue losses for the Company. |
◎ | ◎ | ◎ | ◎ | ◎ | ||||||||||||
- 14 -
| Sustainability-Related Risks and Opportunities |
Current and Expected Impacts on the Business Model and Value Chain |
Affected Positions within the Value Chain |
Expected Time Horizon of Major Impacts | |||||||||||||||||
| Type | Description | Upstream | The Group |
Downstream |
Short- term |
Medium - term |
Long- term 2032) | |||||||||||||
| Sustainability-Related Risks | The occurrence of major cybersecurity incidents, leakage or improper use of personal data resulting in administrative penalties imposed by regulatory authorities or operational losses |
During the provision of telecommunications services, operators inevitably process and access customer information, thereby accumulating substantial social and relationship capital. In the event of a cybersecurity incident or a cyberattack, the company may suffer reputational damage and regulatory penalties, which could negatively impact both its intellectual capital and its social and relationship capital. |
Current Situation Due to hacker attacks, major cybersecurity incidents, personal data leakage or improper use may occur, potentially resulting in regulatory sanctions or operational losses, including: • Shortfalls in operating revenue • Administrative penalties imposed by government authorities • Legal claims and compensation arising from litigation • Customer remediation and compensation costs Expected Situation With cyberattacks and personal data breaches occurring frequently worldwide, a successful hacker attack could lead to service disruptions, theft of customers’ personal data or confidential information, and financial transaction issues. Such incidents would severely impact the Group’s reputation and result in significant financial losses. |
◎ | ◎ | ◎ | ◎ | ◎ | ||||||||||||
- 15 -
| 3.2 | Impacts of Sustainability-Related Risks and Opportunities on Strategy and Decision-making |
Based on the results of risk and opportunity identification, the Group considers aspects such as business operations, products and services, adaptation and mitigation activities, and R&D investments to formulate a sustainability vision, long-term strategies, and medium- to long-term targets that are appropriate for the Group’s business model.
| 3.2.1 | Sustainability Plan and Climate Transition Plan |
In 2023, the Group officially obtained verification of its GHG reduction targets under the Science Based Targets initiative (SBTi). The Group’s GHG reduction targets for 2030 are as follows: a 50% reduction in Scope 1 and Scope 2 emissions compared with the 2020 base year, and a 25% reduction in Scope 3 emissions compared with the 2021 base year. The Group is committed to achieving net-zero emissions by 2045, five years earlier than the 2050 target, in alignment with the global 1.5°C warming limit pathway outlined by the Intergovernmental Panel on Climate Change (IPCC).
The Group has developed a transition plan to address the aforementioned GHG reduction targets related to climate mitigation and adaptation, as well as the identified transition risks and associated opportunities. The specific actions are outlined as follows:
| Specific Actions | Description and Progress of the Plan | Action Targets | ||
| Climate-Related Products and Services | During the initial implementation stage, existing systems are integrated and IoT security and data management mechanisms are strengthened to establish a robust technological foundation. These efforts are expected to enable predictive maintenance and real-time disaster response, further enhancing operational efficiency and service reliability while creating greater service value and competitive advantages. | • Continuously expand and enhance the scale of climate resilience–related services, products, and solutions, broaden customer adoption and application, and increase their contribution to overall revenue. | ||
| Technology-driven decarbonization in IDC data centers | 1. Actively Introducing Advanced Technologies to Enhance Data Center Energy Efficiency: • Replaced outdated equipment with high-efficiency solutions, such as upgrading to magnetic levitation variable-speed chillers and ultra-high-efficiency pumps (IE3 or above). • Expanded deployment of proprietary AI-driven energy-saving technologies to optimize operations, stabilize rack temperatures, and enhance power efficiency. For AI data center construction, direct liquid cooling solutions using Coolant Distribution Units (CDUs) were implemented to dissipate 65% of heat from computing nodes, thereby improving system performance, increasing energy efficiency, and reducing PUE. 2. Through these initiatives, the IDC achieved a PUE of approximately 1.587 in 2025, meeting the annual target and improving from 1.61 in 2024. |
• By 2030, the IDC data center aims to achieve a Power Usage Effectiveness (PUE) of below 1.5. | ||
- 16 -
| Specific Actions | Description and Progress of the Plan | Action Targets | ||
| RE100 | The Group joined the RE100 initiative in 2023, committing to achieve 100% renewable energy usage across all operations by 2040. In 2025, renewable energy procurement and self-generated power reached 88.679 million kWh (Note 1), including the following: • Solar PV and green base station construction: With a cumulative total of 171 installations, achieving a total installed capacity of 13.1MWp. • Renewable energy procurement: In 2025, an investment of hundreds of millions NTD was made to purchase renewable energy. |
• By 2030, IDC data centers are targeted to use 100% renewable energy. • By 2040, all operational sites are expected to achieve 100% renewable energy usage. | ||
| EV100 |
The Group officially joined the EV100 initiative in 2024, committing to achieve 100% electrification of engineering and official vehicles by 2030: • By the end of 2025, replaced 386 engineering and official vehicles with electric vehicles.
|
• From 2024 to 2026, 30%–50% of engineering and official vehicles will be gradually replaced with electric vehicles. • By 2030, the Group aims to achieve full electrification of all engineering and official vehicles. | ||
| Replacement of Aging, Energy-Intensive Equipment |
In 2025, the Group made an investment of hundreds of millions NTD to construct and procure energy-efficient equipment, including energy-saving measures for power systems, air conditioning, switching equipment, transmission equipment, access networks, and mobile devices. Compared to 2024, the replacement of outdated, energy-consuming equipment resulted in an overall electricity reduction of 44.3 million kWh (Note 1) and cost savings of approximately NT$ 186 million (based on an average rate of NT$4.19 per kWh).
|
• Introduction and testing of energy-saving technologies and next-generation hardware (antennas and baseband modules) to compare energy-saving performance with previous equipment, and to develop optimal solutions that balance power efficiency, recovery time, and user experience. | ||
| Note 1: | Regarding the electricity consumption data for 2025, where certain activity data could not be obtained due to data availability constraints, the Group applied reasonably obtainable and supportable information available as of the reporting date (including, where necessary, estimates based on prior-period data) to perform estimations. However, the emissions data derived from such estimations involve a high degree of uncertainty and may be subject to material revisions upon the availability of updated information in the subsequent year. |
In advancing its net-zero transition strategy, the Group is required in the short term to allocate capital toward the replacement of energy-intensive equipment, the implementation of energy management and monitoring systems, and the expansion of renewable energy procurement. These initiatives are expected to drive an increase in capital expenditures and certain long-term procurement costs. However, the Group’s assessment indicates that such investments will enhance energy efficiency and reduce electricity consumption over the medium to long term, thereby lowering operating costs and mitigating the risk of rising carbon fees and other compliance-related expenditures under increasingly stringent regulatory requirements. At the same time, the Group is leveraging its capabilities to provide customers with climate resilience–enhancing services and products, assisting corporate clients in strengthening carbon emissions management and improving energy efficiency. In doing so, the Group transforms regulatory compliance–driven risk factors into scalable sources of revenue from low-carbon products and services, thereby reinforcing the resilience of its business model and supporting long-term value creation.
- 17 -
To achieve the climate targets, the key assumptions, elements, and conditions involved in the formulation of the transition plan are as follows:
| • | Key Assumptions: Referring to the IEA NZE scenario, it is assumed that the global energy sector will achieve net-zero CO2 emissions by 2050 and will have deployed a broad portfolio of clean energy technologies. |
| • | Elements: Assumptions include factors such as the cost of green electricity, maturity of carbon capture technologies, renewable energy market conditions, existing infrastructure, and government policies, which align with the Group’s transition strategies of “Technology-driven Decarbonization” and “Use of Renewable Energy.” |
| • | Conditions: Under the SBTi (telecommunications sector) emission reduction plan, assuming the business model and value chain remain unchanged, the Group commits to achieving net-zero emissions by 2045, in line with the IPCC’s global 1.5°C warming limit pathway. |
In addition, there are inherent limits to emission reductions within the value chain. According to the current guidance published by the Science Based Targets initiative (SBTi), once a company has achieved a substantial level of internal emissions reduction, it may pursue beyond-value-chain mitigation through the purchase of carbon credits. Such measures include forest carbon sequestration, high-quality carbon credits, carbon capture technologies, and initiatives to reduce forest degradation, thereby contributing to net-zero emissions. Accordingly, the Group participated in the first carbon credit procurement facilitated by the Taiwan Carbon Solution Exchange (TCSE) in 2023. Moving forward, the Group will continue to plan for and acquire high-quality carbon credits to honor its commitment to achieving net-zero emissions.
- 18 -
For sustainability-related risks and opportunities beyond the scope of the transition plan, the Group provides the following information regarding the developed initiatives, including their progress:
| Strategic Targets | Description and Progress of the Plan | Action Targets | ||
| Sustainability-Related Opportunities – Digital Resilience
To meet the digital resilience requirements of government and corporate clients, the Group provides solutions encompassing network, system, and cybersecurity resilience |
The Group is committed to assisting government and enterprise customers in building a sustainable operational environment and meeting their digital resilience needs. To serve as a solid backbone for digital transformation, the Group actively invests in the research, development, and deployment of digital resilience solutions, including: • Actively enhancing comprehensive network resilience through multi-orbit satellite communication services, constructing the Sea, Land, Satellite and Sky Network, and integrating LEO (Low Earth Orbit), MEO (Medium Earth Orbit) and GEO (Geostationary Earth Orbit) satellite technologies to provide stable, high-speed, and bandwidth-flexible satellite communication services, achieving a substantial improvement in network resilience. |
The Group aspires to become a co-creator within the digital ecosystem by providing customers with comprehensive digital resilience solutions encompassing networks, systems, and cybersecurity. To this end, the Group has established the following product development objectives: • Network Resilience: Secure distribution rights for medium- and low-earth-orbit satellites, and integrate LEO, MEO, and GEO satellite services to deliver a broad portfolio of satellite communication solutions. | ||
• Providing CMCX multi-cloud direct connections, multi-route redundancy, and Tier 3 grade IDC data center subscription-based services that integrate both software and hardware, combined with data encryption and distribution, backup, system redundancy, DDoS protection, and telecom-grade high-speed network lines. These services help enterprises build a resilient cloud-network hybrid architecture, linking cloud and on-premises systems seamlessly. • Based on a Zero Trust architecture, the Group has independently developed the xTrust Zero Trust Network System, offering a one-stop “Cloud-Network-Endpoint Security” (CNE Security) solution that addresses the key concerns of performance, stability, and cybersecurity during cloud migration for government agencies and enterprises. The Group will continue investing in the development of digital resilience products and services, including identity management, enterprise cybersecurity, Zero Trust security, IDC data center construction, hybrid cloud and on-premises backup, cross-border cloud encrypted data-splitting backup mechanism, satellite spectrum deployment, and integrated satellite services. |
• System Resilience: Promote hybrid cloud architectures, geo-redundancy mechanisms, and cross-border cloud encrypted data-splitting backup mechanism. • Cybersecurity Resilience: Develop Zero Trust services integrating identity authentication, device authentication, and intelligent data analytics; establish cloud-native security monitoring services (Cloud SOC) to enhance cybersecurity resilience. All related product development has been completed, and further efforts will focus on continuously enhancing product functionality and expanding adoption among enterprise clients. The Group aims for compound annual growth rate (CAGR) of 6~10% in revenue from “multi-dimensional network, system, and cybersecurity resilience services” from 2025 to 2030. | |||
- 19 -
| Strategic Targets | Description and Progress of the Plan | Action Targets | ||
| Sustainability-Related Risk – Digital Resilience
Power and network disruptions and abnormal outages of critical information systems or cloud data center infrastructure caused by major natural disasters, external environmental changes, or multi-hazard events |
To strengthen disaster response mechanisms, the Company has established the Natural Disaster Protection Operational Procedures, the Natural Disaster Emergency Response and Repair Operational Guidelines, the Information Systems Disaster Emergency Response and Repair Operational Guidelines, and the Information and Communications System Business Continuity Management Guidelines. These procedures apply to major disasters, including natural disasters, fires, explosions, and terrorist attacks, which may cause severe damage to communication network equipment and information and communications systems, and are designed to ensure emergency communication response in affected areas. • Fixed-line Communications: To prevent the escalation of disaster-related damage, measures have been strengthened, including the deployment of multi-routing repeater transmission in remote areas, wireless routing backups, increased backup power capacity, and backups in both international and domestic submarine cable systems. These measures enhance overall disaster prevention and resilience capabilities. Annual drills for network and equipment scheduling and emergency repairs are conducted to improve proficiency in disaster response, thereby minimizing potential losses. Aging and end-of-support (EOS) equipment will continue to be replaced, new high-performance equipment introduced, microwave systems in mountainous and offshore areas expanded, international and domestic submarine cable systems enhanced, and multi-orbit satellite solutions deployed to further strengthen the resilience of critical infrastructure and overall backup capacity. |
The Group has also established a Network Operations Center (NOC) and an ICT system quality monitoring mechanism to detect early signs of network or system performance degradation and anomalies, enabling proactive mitigation to reduce the occurrence of disruptions. In addition, the Group participates annually in exercises for National Critical Infrastructure (CI) and Critical Information Infrastructure (CII). | ||
• Mobile Communications: In the event of a disaster causing mobile communication disruptions, microwave-, satellite-, and mobile base station–based transmission alternatives are in place. These solutions can be rapidly deployed according to the conditions of the affected area to restore emergency communication with external networks in the shortest possible time. Mobile network quality and resilience solutions will continue to be enhanced, redundancy mechanisms established for critical equipment, backup power supply for key base stations strengthened, and the replacement of high-failure-rate and energy-intensive equipment prioritized to maintain mobile network quality and high service stability. |
||||
- 20 -
| Strategic Targets | Description and Progress of the Plan | Action Targets | ||
• Data Communications: Chunghwa Telecom’s HiNet network adopts multi-route architecture with a highly reliable network redundancy mechanism, enabling real-time monitoring and traffic load balancing across all routes. For international routing, traffic is distributed across multiple submarine cable systems to prevent congestion or outages caused by single-route failures. Additionally, collaboration with overseas carriers is undertaken to increase direct international interconnection bandwidth, thereby improving the quality and stability of international internet connectivity. The expansion of international internet bandwidth and diversification of submarine cable routes will remain key resource allocation priorities to enhance HiNet’s domestic backbone capacity and international connectivity. |
||||
• Information Systems and Data Centers: To respond to natural disasters such as typhoons, heavy rainfall, earthquakes, landslides, and tsunamis, as well as major incidents including fires, explosions, terrorist attacks, or other significant catastrophes that may cause severe damage to information systems, equipment, or data centers, backup environments have been established and Business Continuity Management (BCM) levels are assessed based on business impact analysis to define recovery time objectives (RTOs) and recovery point objectives (RPOs). Business continuity plans have been developed, and regular backup drills are conducted to expedite the restoration of damaged equipment, shorten service interruption durations, and ensure the achievement of operational objectives. Inspections of aging equipment will continue, end-of-support (EOS) and end-of-life (EOL) equipment will be replaced, and cross-system and cross-organization joint BCM drills will be promoted to enhance system reliability and disaster resilience. |
||||
- 21 -
| Strategic Targets | Description and Progress of the Plan | Action Targets | ||
| Sustainability-Related Risks - Cybersecurity and Customer Privacy
The occurrence of major cybersecurity incidents, leakage or improper use of personal data resulting in administrative penalties imposed by regulatory authorities |
The Group places a high priority on cybersecurity and personal data protection. We have established the Cybersecurity Policy and the Privacy Policy in accordance with international standards and regulatory requirements. We have also developed a comprehensive cybersecurity governance framework and internal control system to ensure the overall cybersecurity defense and response capabilities of the Group and our subsidiaries, safeguarding operational and customer information security.
• Current Situation: 1. Establish an information security management system in line with international standards and implement the ISO 27701 Privacy Information Management System, in alignment with the national cybersecurity strategy. Conduct cybersecurity risk assessments, develop corresponding protective strategies, and implement various effective mitigation measures. 2. Through technical measures aligned with ISO 27001 standards—such as access controls, transmission encryption, personal data pseudonymization, and de-identification in accordance with CNS 29100-2 standards—the Group ensures the security of customers’ personal data and privacy without infringing upon their rights. 3. Clear requirements and penalties for information security and personal data protection are established for suppliers, and regular monitoring is conducted to ensure that suppliers handle and protect customer data strictly according to authorized procedures. • Expected Situation: 1. The ISO 27701:2019 certification will be transitioned to ISO 27701:2025 within three years. 2. Conduct cybersecurity training and drills to enhance employees’ security awareness and improve response efficiency during incidents. AI technologies are implemented for cybersecurity event detection to enhance early warning capabilities. 3. Expand collaboration with external public and private sector entities is expanded to strengthen information sharing and joint cybersecurity defense, thereby improving the effectiveness of security measures and their societal impact. |
The Group integrates cybersecurity and personal data protection into the core of ESG governance framework. It continuously assesses cybersecurity risks and corresponding protection strategies, and applies a tiered management approach based on the business characteristics of the parent company and its subsidiaries. In accordance with regulations and risk identification results, appropriate measures are implemented, including the establishment of Information Security and Privacy Information Management Systems (ISMS/PIMS), exposure assessment services (EASM), vulnerability scanning, penetration testing, cybersecurity health assessments, red team exercises, cybersecurity monitoring, social engineering drills, training programs, intelligence sharing and joint defense, internal and external audits, and third-party certifications. The Group plans to complete the transition of ISO 27701:2019 certification to ISO 27701:2025 by 2028, while continuously advancing and refining privacy protection management in line with GRI and SASB indicators. | ||
- 22 -
3.2.2 Financial Impact of Sustainability-Related Risks and Opportunities
|
Sustainability-Related Risks and Opportunities |
Impact on Financial Position, Financial Performance, and Cash Flows (Note 1) | |||
| Description | Current Reporting Period (Note 2) | Expected Financial Impact (Note 3) | ||
| Sustainability-Related Opportunities – Digital Resilience
To meet the digital resilience requirements of government and corporate clients, the Group provides solutions encompassing network, system, and cybersecurity resilience. |
“Network, Systems, and Cybersecurity Resilience Services” has become one of the Group’s primary revenue streams. To advance the research and development of technologies and products related to digital resilience, the Group has actively committed internal funds to drive the growth of related business segments. | Driven by government digital development initiatives and ESG-related green energy policies, enterprises continue to advance digital transformation. To meet the digital resilience demands of government and corporate clients, the Group provides “Network, Systems, and Cybersecurity Resilience Solutions” which have driven growth in satellite application services, IDC, cloud services, cybersecurity professional services, hardware and software integration services. The scale of revenue is projected to achieve a revenue compound annual growth rate (CAGR) of 6%-10% from 2025 to 2030. However, the related operating revenue and capital expenditure constitutes commercially sensitive information and therefore cannot be disclosed. | ||
| Climate-Related Opportunities – Climate Resilience Products and Services
Providing customers with products or services that enhance climate resilience |
By adopting innovative technologies and intelligent solutions, leveraging partnership models to increase operating revenue while providing products and services that enhance climate risk response capabilities, such as satellite communications, IDC, and cloud-based solutions. Revenue from these related products and services amounted to approximately NT$20.009 billion for the current year. | Through the development of digital, communication, and intelligent solutions—covering areas such as cloud computing, data processing, carbon-reduction analytics, and low-carbon digital services—the Group assists corporate and individual users in enhancing climate resilience as well as operational and livelihood stability, thereby driving industries and society toward a low-carbon transition and creating sustainable business opportunities and revenue growth. Using 2025 as the base year and applying an annual growth rate of 7.1%, the cumulative operating revenue from the related products and services for 2026 to 2028 is projected to reach approximately NT$ 68.96 billion. However, capital expenditures directly attributable to such operating revenue cannot be separately identified and therefore are not disclosed. | ||
- 23 -
|
Sustainability-Related Risks and Opportunities |
Impact on Financial Position, Financial Performance, and Cash Flows (Note 1) | |||
| Description | Current Reporting Period (Note 2) | Expected Financial Impact (Note 3) | ||
| Climate-Related Opportunities - Energy
Energy efficiency improvements to reduce electricity consumption and associated carbon pricing costs |
By integrating power and environmental monitoring with system development technologies, the Group actively promotes and implements optimization and improvement of office spaces, data centers, and base station infrastructure to reduce electricity consumption.
Compared to 2024, total electricity consumption this year decreased by 44.3 million kWh, resulting in a reduction of approximately NT$186 million in electricity expense. (Note 4) |
• Expected Financial Impact The Group places energy efficiency and low-carbon solutions at the core of its strategy, leveraging its ICT capabilities and talent advantages to systematically invest capital expenditures and resources in advancing its“Technology-Driven Energy Saving and Carbon Reduction” strategy. In 2026, operating costs and expenses, including electricity costs, are expected to decrease by approximately NT$201 million (Note 4). In practice, the financial impact of operating revenue arising from related business opportunities has been incorporated into the measurement and disclosure under“Climate-Related Opportunities — Climate Resilience Products and Services,” while the financial impact of capital expenditures required to implement the strategy has been incorporated into the measurement and disclosure under “Climate-Related Risks — Transition Risks.” • Medium to Long-term Impacts The Group’s medium to long-term energy efficiency and low-carbon initiatives include the in-house development of an intelligent Energy Operations Center (EOC) system to automatically collect and analyze electricity consumption data and to calibrate energy-saving performance in real time; the accelerated decommissioning of outdated, energy-intensive equipment; the continuous reduction of the average PUE of IDC data centers; and the promotion of IP migration for the public switched telephone network, etc. These actions are expected to structurally lower the unit cost of electricity, increase potential revenue, and reduce operating expenses. During the period from 2027 to 2040, the anticipated reduction in potential operating costs and expenses, including electricity expenses, is estimated at approximately NT$3.029 billion. In addition, the Group expects to avoid potential carbon fee charges of approximately NT$427 million during 2027 to 2030 (Note 5). However, the financial impact of operating revenue arising from related business opportunities has been incorporated into the measurement and disclosure under “Climate-Related Opportunities — Climate Resilience Products and Services,” while the financial impact of capital expenditures required to implement the strategy has been incorporated into the measurement and disclosure under “Climate-Related Risks — Transition Risks.” | ||
- 24 -
|
Sustainability-Related Risks and Opportunities |
Impact on Financial Position, Financial Performance, and Cash Flows (Note 1) | |||
| Description | Current Reporting Period (Note 2) | Expected Financial Impact (Note 3) | ||
| Climate-Related Risks - Transition Risks
Increased compliance costs in response to the government’s 2050 net-zero emissions policy |
In response to sustainability compliance requirements and the enhancement of operational resilience, the Group has completed the procurement of green electricity, the replacement of high energy-consumption equipment, and the implementation of a GHG inventory system. During the reporting year, the increase in the proportion of renewable energy resulted in an increase in operating costs and expenses of approximately NT$216 million (Note 6), while capital expenditures for equipment replacement amounted to approximately NT$2.57 billion. The Group continues to allocate hundreds of millions of NTD in ongoing investments, representing more than 3% of the financial impact (Note 7), toward renewable energy procurement costs and capital expenditures for equipment replacement to further deepen our strategic deployment and advancement of renewable energy. | The Group’s climate transition plan is implemented in alignment with the decarbonization pathways advocated by the SBTi. The primary strategies focus on two key pillars: technology-driven carbon reduction and renewable energy procurement. Taking into account the implementation progress of green electricity procurement and equipment upgrades, the potential impacts in the short term and the medium to long term are as follows: • Short-term Impact In accordance with the Group’s SBTi targets, the Group will progressively increase the proportion of renewable energy used and implement GHG inventory and management systems. Increase in operating costs and expenses: approximately NT$395 million, primarily attributable to the increased proportion of renewable energy usage (Note 6). Capital expenditures: approximately NT$2.239 billion, primarily for the replacement of outdated equipment. • Medium- to Long-term Impacts To achieve the SBTi-aligned decarbonization pathway, the Group will be required to further expand its procurement of renewable energy. As a result, operating expenses are expected to increase over the medium to long term. However, as the relevant green electricity procurement contracts are still under negotiation, the associated costs remain highly uncertain and therefore cannot be reliably disclosed at this stage. | ||
- 25 -
|
Sustainability-Related Risks and Opportunities |
Impact on Financial Position, Financial Performance, and Cash Flows (Note 1) | |||
| Description | Current Reporting Period (Note 2) | Expected Financial Impact (Note 3) | ||
| Sustainability-Related Risk – Digital Resilience
Power and network disruptions and abnormal outages of critical information systems or cloud data center infrastructure caused by major natural disasters, external environmental changes, or multi-hazard events |
A failure of critical network equipment, interruption of external power supply or abnormal power conditions, inability to resolve key information system issues, or data center inability to operate stably under abnormal power or environment conditions may cause major service interruptions, potentially affecting operating revenue and generating capital expenditures. | All core services are designed from the outset with built-in mechanisms such as geographically distributed and heterogeneous redundancy, multi-route architecture paths, system decentralization, and robust physical security controls, as well as being integrated with backup power sources such as uninterruptible power systems and generators to address external power interruptions or supply anomalies, thereby meeting the fundamental requirements for disaster and operational resilience. In the event of a large-scale disaster, the Group is able to restore essential service levels within the shortest possible timeframe, thereby preventing network-wide outages caused by the failure of a single device or a single power source. Accordingly, the financial impacts arising across various time horizons from incidents such as network disruptions, power outages, failures of critical information systems, or abnormalities in cloud data center infrastructure are expected to be significantly controlled and reduced going forward. | ||
| Sustainability-Related Risks - Cybersecurity and Customer Privacy
The occurrence of major cybersecurity incidents, leakage or improper use of personal data resulting in administrative penalties imposed by regulatory authorities or operational losses |
Due to hacker attacks, major cybersecurity incidents may occur, and the leakage or improper use of personal data may result in regulatory authorities or operational losses. | The Group adheres to applicable regulatory requirements and the principles of Information Security and Privacy Information Management Systems, such as ISO 27001, ISO 27701, and continuously reviews and refines its practices through the PDCA cycle, integrating them into daily operational activities. Accordingly, incidents such as personal data breaches or improper use of personal data are not expected to result in material financial impacts across the relevant time horizons. | ||
| Note 1: | If the degree of measurement uncertainty involved in estimating the expected financial impacts of sustainability-related risks or opportunities is so high that certain quantitative information would not be useful, the Group provides qualitative disclosures only to assist primary users of general-purpose financial reports in understanding the relevant impacts. |
| Note 2: | The assessment scope covers the impact of sustainability-related risks and opportunities on the Group’s financial position, financial performance, and cash flows for 2025. Based on the evaluation, the Group does not expect any of the sustainability-related risks or opportunities listed in the table above to pose a significant risk of material adjustments to the carrying amounts of assets and liabilities in the next annual financial statements. |
- 26 -
| Note 3: | The assessment scope includes the expected impacts of sustainability-related risks and opportunities on the Group’s short-, medium-, and long-term financial position, financial performance, cash flows, access to financing, and cost of capital. |
| Note 4: | Calculated based on an average of NT$4.19 per kWh for gray electricity; Due to limitations in data availability, certain activity data relating to the Group’s total electricity consumption could not be obtained; therefore, estimates were made using reasonably available and supportable information as of the reporting date, including, where necessary, data from prior periods. |
| Note 5: | For carbon fee estimation, key assumptions include annual implementation progress in line with the reduction pathway set out in the Group’s voluntary emissions reduction plan. Relevant parameters include the estimated annual GHG emissions of the Group and assumed future carbon fee rates to be announced by the regulatory authority, which are expected to increase in phases with reference to international carbon pricing practices and global assessment reports. Changes in these assumptions and estimation bases may result in material adjustments to the estimated carbon fee amounts. |
| Note 6: | Calculated based on the expected annual volume of green electricity procurement and the price differential between green and conventional (grid) electricity. The projected annual green electricity procurement volume is aligned with the Group’s established GHG reduction pathway. Changes in the aforementioned assumptions and estimation bases may result in material adjustments to the estimated amounts. |
| Note 7: | The financial impact of measures already implemented is calculated as a proportion of the Group’s consolidated profit before tax for 2025, in order to assess the relative impact of various climate-related risks and opportunities. |
| 3.3 | Resilience Assessment |
| 3.3.1 | Climate-Related Scenario Analysis and Assessment |
In considering climate-related risks and opportunities, the Group conducts annual scenario analysis to assess climate resilience and evaluate the potential impacts on operations and the supply chain. These assessments help determine whether updates to the estimated effects of climate-related uncertainties are necessary and whether adjustments to operational strategies are required.
- 27 -
3.3.1.1 Time Horizons Used in Climate-Related Scenario Analysis
To facilitate the use of scenario analysis in identifying the most relevant climate-related risks and opportunities and their associated financial impacts, the Group’s analyses adopt three-tiered time horizons linked to the strategic planning cycle. Short term: 2026; Medium term:2027-2031; Long term:2032 and thereafter. For further details, please refer to the disclosures in “3.1.1 Time Horizons: Definitions and Linkage to Strategic Planning Timelines”.
3.3.1.2 Scenario Analysis and Assessment of Strategy and Business Model
| Type | Key Assumptions | Selected Scenarios |
Time Horizon |
Scope of Analysis |
Assessment of Impacts and Resilience Capacity | |||||
| Transition Risks / Carbon Pricing | 1. Climate-related policies in the jurisdictions where the Company operates are formulated in accordance with the Government’s current policy framework. It is anticipated that the “2050 Net-Zero Emissions Pathway” will continue to be implemented. In addition, the Company will comply with the requirement set forth in Appendix I, “Designated Reduction Rates by Industry,” of the Designated GHG Emissions Reduction Goals for Entities Subject to Carbon Fees, which stipulates that GHG emissions for “other industries” in the year 2030 shall be reduced by 42% compared with the base year 2021. |
IEA STEPs Under the Stated Policies Scenario (STEPS), Taiwan has set 2005 as the base year. The government’s emission reduction targets are a 10% reduction by 2025, a 24% (±1%) reduction by 2030, and the achievement of net-zero emissions by 2050, with other policies assumed to remain unchanged. IEA Net Zero Emissions Scenario In assessing transition risks under the IEA Net Zero Emissions (NZE) Scenario, it is assumed that the government amends relevant legislation to set 2020 as the base year. Under this assumption, the emission reduction targets would be strengthened to a 21% reduction by 2025, a 42% reduction by 2030, and the achievement of net-zero emissions by 2050. |
2015–2050 | The scope of analysis covers all major operational sites of the Group. | 1. Impact Assessment: Under the STEPS carbon price scenario, assuming business-as-usual (BAU) trends, the carbon fees payable are estimated to account for approximately 0.33–0.49% of annual revenue in 2030 and 2050. Under an active decarbonization scenario, the carbon fees are expected to account for approximately 0.21–0.31% of annual revenue in 2030, and 0.02–0.03% in 2050. Under the NZE carbon price scenario, carbon fees under the BAU scenario are estimated to account for approximately 1.57% of annual revenue in 2030 and 2.17% in 2050. Under the active decarbonization scenario, carbon fees are expected to account for approximately 1.37% of annual revenue in 2030 and 0.14% in 2050. 2. Resilience Capability: The Group addresses transition risks arising from carbon pricing through “technology-driven emission reductions” and “renewable energy adoption” The detailed response strategies are outlined in “3.2.1 Sustainability Plan and Climate Transition Plan.” |
- 28 -
| Type | Key Assumptions | Selected Scenarios |
Time Horizon |
Scope of Analysis |
Assessment of Impacts and Resilience Capacity | |||||
| Physical Risk / Flooding Caused by Sea Level Rise | 2. Impact of Macroeconomic Trends According to the Chung-Hua Institution for Economic Research, based on its full-year forecast for 2025 and the development of emerging technologies, the annual economic growth rate is projected to reach 5.45%. 3. Impact of Country- or Region-Level Variables According to official reports from the Taiwan Climate Change Projection Information and Adaptation Knowledge Platform and national meteorological observation authorities, climate model projections indicate that Taiwan’s winter season is expected to gradually shorten, total annual precipitation is projected to increase, and the intensity of extreme rainfall events is likely to exhibit an increasing trend. 4. Assumptions on Energy Use and Mix The Group expects to increase the proportion of electricity consumption from renewable energy sources to 100% by 2040. |
1.RCP2.6 The IPCC uses Representative Concentration Pathways (RCPs) to model climate scenarios under varying levels of warming. RCP 2.6 represents a mitigation scenario, in which radiative forcing is projected to decrease by the year 2100. 2.RCP 8.5 • RCP 8.5 represents a high GHG emission scenario, in which radiative forcing is projected to continue increasing by 2100. In assessing physical risks, the Group selected three physical risk types that are most frequently observed in the telecommunications sector and for which domestic research data are available. The assessment parameters include: flooding caused by sea level rise, global temperature increase, and flood risk. • Assumptions: It is assumed that future climate change trends will follow the projections in the “National Climate Change Science Report 2024: Phenomena, Impacts, and Adaptation,” and that temperature increases due to climate change will exhibit the same trend across all of Taiwan. • Analysis Factors: Severity of disaster caused by sea level rise, magnitude of global temperature increase, impact of flood-inducing natural hazards |
2015–2100 | 1. Impact Assessment: Using the NASA Sea Level Projection Tool, the future sea level rise in Taiwan was estimated under a global warming scenario of 2°C (closest to the projected temperature increase under RCP 8.5). For this assessment, the “National Climate Change Science Report 2024: According to studies, disasters caused by sea level rise are expected to occur after 2080 and, therefore, do not have a significant impact on the Group at present. 2. Resilience Capability: Based on the integrated scenario analysis, under a long-term 2°C warming scenario towards the low-carbon economy, some of the Group’s data centers are located in high-risk coastal zones. However, the majority of data centers were designed prior to construction with considerations for wind resistance and sea level rise to ensure the safety of the facilities and the continuity of operations, assuming no further deterioration in climate change and global warming. |
- 29 -
| Type | Key Assumptions | Selected Scenarios |
Time Horizon |
Scope of Analysis |
Assessment of Impacts and Resilience Capacity | |||||
| Physical Risk / Global Temperature Increase | 5. Assumptions on Technological Development With reference to Taiwan’s “2050 Net-Zero Emissions Pathway,” Taiwan is expected to develop low-carbon energy technologies in the short to medium term, while advancing high-efficiency green energy generation technologies over the long term. |
2015–2100 | 1. Impact Assessment: According to the National Climate Change Science Report 2024, under the RCP 8.5 scenario, the mid-21st century (2041–2060) is projected to experience a temperature increase of 1.6°C, while by the end of the century (2081–2100), temperatures could rise by up to 3.4°C. The risks associated with rising temperatures are not significant for the Group, and are mainly reflected in increased electricity costs resulting from cooling needs at office areas or operating locations. 2. Resilience Capability: In recent years, Taiwan’s warming trend has been approximately 0.32°C per decade, accompanied by a corresponding increase in electricity consumption. The Group has implemented an energy management system and established monitoring for major power-consuming equipment, setting electricity usage targets and ensuring effective control and management. | |||||||
| Physical Risk / Flood Risk | 2015–2099 | 1. Impact Assessment: • Under the RCP 8.5 scenario, typhoon-induced waves exceeding 12 meters in height are projected to affect operational sites in Taitung County, as well as localized areas in Hualien County and Yilan County. Locations experiencing extreme storm surge heights exceeding 1.2 meters include New Taipei City, Yilan County, and parts of Taichung City, Yunlin County, Chiayi County, Hualien County, and Taitung County. Such conditions indicate extreme wind and rainfall, which increase the risk of damage to outdoor telecommunications equipment and base stations in the aforementioned counties. • In the long-term scenario (including the mid-century period, 2040–2065, and the end-of-century period, 2075–2099), the probability of flooding gradually increases across counties, primarily affecting Changhua, Yunlin, Chiayi, Nantou, and Tainan. • A comprehensive water stress analysis was conducted for operational sites using the World Resources Institute (WRI) tool, with evaluation years set at 2030 and 2050, under the pessimistic RCP 8.5 scenario. Additionally, the Group utilized the WRI tool to assess physical risks for key suppliers with annual transaction values exceeding NT$ 50 million. The analysis indicates that over 98% of key suppliers fall within low to moderate or below-low risk levels. 2. Resilience Capability: The Group conducts an annual natural disaster preparedness inspection for all data centers. Flood protection measures include leak detection and waterproofing. The operations and maintenance unit issues notifications requiring all data center managers to perform safety checks, such as ensuring drainage openings are free of debris, verifying flood protection measures, and confirming the installation of waterproof gates. | ||||||||
- 30 -
3.3.1.3 Major Areas of Uncertainty Considered in Climate Resilience Assessment
To ensure the decision-usefulness of the resilience assessment, the Group considers several major areas of uncertainty, including policy changes, technological advancements, shifts in market demand, environmental changes, and economic factors. The areas of significant uncertainty are described as follows:
| 1. | Policy Changes: |
Governments worldwide may introduce new regulatory policies and requirements in response to the impacts of climate change. These may include adjustments to carbon fee rates, revisions to eligibility criteria for preferential mechanisms, and the tightening or expansion of resilience standards for critical infrastructure.
| 2. | Technological Advancements: |
With the rapid pace of technological development, the maturity and cost trajectories of data center energy-efficiency technologies, network cloudification/virtualization, power storage solutions, and AI-enabled energy-efficiency tools will influence both the marginal abatement cost and the timing of related investments.
| 3. | Changes in Market Demand: |
Market demand for low-carbon products and services may evolve over time. The Group must anticipate and adapt to such demand shifts to ensure that its offerings continue to meet customer expectations. These shifts include, but are not limited to, changes in demand for cloud/IDC colocation services, the impact of 5G/6G applications on power-use flexibility and peak–off-peak load structures, and evolving customer preferences for low-carbon service offerings, such as green colocation and green SLAs.
| 4. | Environmental Changes: |
Climate change may lead to an increase in extreme weather events, such as typhoons, severe rainfall, and sea-level rise. These environmental changes could significantly impact the Group’s operations and value chain, particularly through risks to sites and submarine cable landing stations, including flood depth, wind and salt damage, power outage likelihood, and regional variations in exposure.
| 5. | Economic Factors: |
Global economic uncertainty may affect investment activities and capital flows. The Group must consider how changes in the economic environment may influence its financial position and operations, including but not limited to the effects of interest rate, exchange rate, and electricity price volatility on PPA pricing, CAPEX discounting, and operating costs.
3.3.1.4 Adaptive Capacity of Climate-Transition Strategies and Business Model in the Short, Medium, and Long Term
The Group’s strategy and business model are implemented based on the most reasonably likely scenarios. The Group assesses its capacity to adjust and adapt its strategy and business model, including the availability and flexibility of financial resources, the ability to reallocate and upgrade assets, and the impact of investments in climate-related mitigation, adaptation, and resilience opportunities, as described below:
| • | Availability and Flexibility of Financial Resources |
The Group has remained profitable each year. The quick ratio has consistently been maintained above 90%, and the debt-to-asset ratio has been remained below 30%. The Group’s existing financial resources are assessed to be adequate and sufficiently flexible.
| • | Capacity for Asset Reallocation and Upgrades |
The Group allocates annual budgets for relevant implementation projects in accordance with its sustainability-related targets. Funding sources include not only net cash inflows from the Group’s operating activities but also the issuance of sustainability bonds, serving as strategic funding to address sustainability-related risks and opportunities. In 2022 and 2025, the Group issued NT$3.5 billion in sustainability bonds each year, totaling NT$7 billion, thereby ensuring no constraints on its ability to reallocate, upgrade, or decommission existing assets.
| • | Impacts on Investments in Sustainability- and Climate-Related Mitigation, Adaptation, and Resilience Opportunities |
For the impacts of the Group’s investments in climate-related mitigation, adaptation, and resilience opportunities, please refer to “3.2.1 Sustainability Plan and Climate Transition Plan”.
- 31 -
3.3.2 Resilience Assessment for Non-Climate Sustainability-related Risks
| Sustainability-Related Risks | Resilience of Strategy and Business Model | |
| Sustainability-Related Risk – Digital Resilience
Power and network disruptions and abnormal outages of critical information systems or cloud data center infrastructure caused by major natural disasters, external environmental changes, or multi-hazard events |
To provide customers with uninterrupted and reliable services while ensuring high disaster resilience, management mechanisms have been established to maintain the continuous operation of critical infrastructure, networks, and information and communication systems, supported by ongoing deployment of geographically dispersed and multi-routing backup protections. This includes regularly assessing the reliability of equipment that has exceeded its durable life and proactively replacing end-of-support (EOS) and end-of-life (EOL) hardware. Regular disaster prevention, network, and ICT continuity tests, drills, reviews, and updates are continuously conducted. Furthermore, to validate the effectiveness of business continuity management mechanisms and procedural frameworks, an enterprise-level Business Continuity Management (BCM) tabletop exercise project has been implemented. This initiative enhances the overall responsiveness and disaster resilience of the information systems while fostering cross-functional and cross-organizational collaborative operating mechanisms to ensure operational stability under various risk scenarios. Based on assessment, current working capitals are sufficient to cover the expenditures associated with these measures. | |
| Sustainability-Related Risks - Cybersecurity and Customer Privacy
The occurrence of major cybersecurity incidents, leakage or improper use of personal data resulting in administrative penalties imposed by regulatory authorities or operational losses |
Adopting a risk management–oriented approach, the Group provides sufficient resources and support for the information security and personal data management systems, and implements related protective measures. The Group allocates dedicated personnel and technical tools, and continuously monitors and enhances protective measures to ensure alignment with international best practices. Based on the assessment, under normal operating conditions, the risk of operational disruption due to these risks is low; furthermore, current working capitals are sufficient to cover the expenditures associated with these measures. | |
4. Risk Management
4.1 Processes and Policies for Identifying, Assessing, Prioritizing, and Monitoring Sustainability-Related Risks
Chunghwa Telecom’s Board of Directors establishes the risk management policies, framework, and culture, and sets up a board-level functional committee, the Risk Management Committee, to oversee and review risk management policies, procedures, and frameworks. At the management level, the Risk Management Steering Committee is responsible for driving the implementation of company-wide risk control operations. The Audit Office reviews risk events, with realized risks reported to the Audit Committee, while imminent or preventive risks are reported to the Risk Management Committee.
In the processes for identifying, assessing, prioritizing, and monitoring sustainability- related risks, the assessment and management plans for sustainability-related risks are integrated into the Company’s Enterprise Risk Management (ERM) framework, in line with the principle of materiality. To ensure timely evaluation of operational risks, annual identification of risk events, monthly reviews, assessments, and follow-ups are conducted, and potential new risk are continuously identified on a rolling basis. This ensures that all risk types—such as strategic risks, operational risks, and reporting/compliance risks—are properly identified. Control indicators and mitigation actions for each risk type are regularly and actively monitored to maintain the overall risk appetite within acceptable levels. In addition, no modifications were made to the risk identification and assessment processes during the reporting year.
- 32 -
4.1.1 Input Data Sources and Parameters for Sustainability-Related Risks and Opportunities
In the process of identifying, assessing, prioritizing, and monitoring sustainability- and climate-related risks and opportunities, input data sources and parameters utilized as listed below.
| Type | Input Data Sources and Parameters | |
| Sustainability-Related Risks and Opportunities | Sustainability-related risks and opportunities are identified by reviewing the sustainability management context, operational activities, and business partnerships, while referencing international sustainability standards and regulations, disclosure frameworks, industry trends, peer sustainability practices, expert opinions, and stakeholder concerns. The collected information is consolidated and organized into material sustainability topics. | |
| Climate-Related Risks and Opportunities | Climate-related risks and opportunities are identified and updated regularly using scenario assumptions from the International Energy Agency (IEA) NZE and STEPS, climate simulation data from the IPCC Sixth Assessment Report (AR6), and government-downscaled physical risk scenarios. The scope of risk and opportunity identification includes potential climate-related risks and opportunities across the Group’s operations and supply chain. | |
Subsequently, scenario analysis is conducted to further identify climate-related risks but is not applied to the identification of climate-related opportunities or other sustainability-related risks and opportunities. Impact and use of climate-related scenario analysis on risk identification is summarized below.
| Type | Impact and Use of Climate-Related Scenario Analysis on Risk Identification | |
| Climate-Related Risks | During the climate risk identification process, the Group conducts scenario analysis for both transition risks and physical risks. Based on these scenario analyses, the potential financial impacts of each risk are evaluated, and risks that exceed the material financial threshold are disclosed accordingly. |
4.1.2 Assessment Methods for the Nature, Likelihood, and Impact of Sustainability-Related Risks and Opportunities
In the risk identification and analysis process, qualitative factors (e.g., corporate reputation, business strategy) and quantitative thresholds are considered. For a detailed description of the nature of sustainability-related risks, please refer to the disclosures in “3.1.2 Sustainability- and Climate-related Risks and Opportunities Reasonably Expected to Affect the Company’s Development Outlook, and Their Potential Impacts on the Business Model and Value Chain”. The methods for assessing the likelihood and impact of risks are summarized below.
| Type | Assessment Methods for the Nature, Likelihood, and Impact of Sustainability- and Climate-Related Risks | |
| Sustainability-Related Risks | The assessment of sustainability-related risks is conducted in accordance with the double materiality principle. Dozens of senior executives involved in sustainability-related operations complete questionnaires for each topic to evaluate both the impact materiality and financial materiality, assessing the likelihood and magnitude of potential positive and negative impacts for each issue. | |
| Climate-Related Risks |
1. Collecting and Identifying Climate Topics: Following the TCFD framework, the Group reviews the service models and characteristics of the telecommunications industry to compile a comprehensive list of climate-related risks and opportunities. 2. Identifying Material Climate Risks and Opportunities: Internal and external inputs are gathered through questionnaires and interviews to assess the magnitude and urgency of impacts. Materiality thresholds are established, and material climate risks and opportunities are selected accordingly. 3. Establishing a Material Climate Risk and Opportunity Matrix: Climate risks and opportunities are prioritized based on the double materiality principle, and annual priorities are determined. After internal review, a materiality matrix is produced, illustrating the ranking of each topic. 4. Target Setting and Strategy Management: Based on the climate risk matrix, annual targets and strategies are formulated. Policy implementation is reviewed quarterly, plans are adjusted, and monitoring mechanisms are established to ensure target achievement and strengthened risk response. |
- 33 -
4.1.3 Prioritization of Sustainability-Related Risks and Opportunities and the Methodology
The severity of operational impacts is assessed based on the likelihood and consequence of each risk event, and risks are prioritized using a risk matrix, with corresponding risk levels assigned. Risk mitigation actions are implemented according to the assigned risk level. (Expected Risk Value = Risk Impact × Risk Probability)
| • | Risk Probability = likelihood of the risk occurring. |
| • | Risk Impact = severity of the risk’s consequence. |
Within the matrix, risks with higher expected values are defined as enterprise-level critical risks, serving as a priority action list for management and a basis for resource allocation.
| Note: | The “Investments in business” risk event is assessed at the subsidiary level, whereas other risk events are primarily assessed for the parent company, Chunghwa Telecom. |
4.1.4 Mechanisms for Monitoring Sustainability-Related Risks and Opportunities
To achieve the four key control objectives—strategy, operations, reporting, and regulatory compliance—risk sources are analyzed based on strategic goals and internal and external environmental variables. Using a risk matrix, we identify and assess opportunities and risk events within the operating environment. Relevant managerial units then formulate strategies and risk response measures to carry out effective risk management and control:
| • | First Line of Defense: Undertaken by risk owners and individual operating units, focusing on day-to-day risk management and response. Risk controls are integrated into routine operational processes. |
| • | Second Line of Defense: Led by the Risk Management Steering Committee and relevant functional units. This line is responsible for overseeing, guiding, and adjusting risk management policies and mechanisms, as well as establishing standardized processes and procedures. |
| • | Third Line of Defense: Led by the Audit Department, which conducts periodic internal audits to evaluate the effectiveness and implementation of the overall risk management framework and provides recommendations for improvement based on identified issues. |
Through the coordinated efforts of the three lines of defense, a multilayered protection system is established that reinforces robust operations and supports long-term sustainable development.
- 34 -
5. Metrics & Targets
5.1 Disclosure of Established Sustainability-Related Metrics and Targets
The Group’s disclosures are aligned with international sustainability disclosure standards and managed in accordance with global frameworks and guidelines. This section provides detailed disclosure of the following information:
| • | The metrics established to continuously measure and monitor sustainability-related risks and opportunities, as well as the strategic targets formulated to mitigate or adapt to such risks or to capitalize on such opportunities, including analyses of performance trends or changes. |
| • | Specific cross-industry metric categories, including: GHG Emissions, Climate-Related Transition Risks — the amount and percentage of assets or business activities exposed to climate-related transition risks, Climate-Related Physical Risks — the amount and percentage of assets or business activities exposed to climate-related physical risks, Climate-Related Opportunities — the amount and percentage of assets or business activities aligned with climate-related opportunities, Capital Allocation — capital expenditures, financing, or investments allocated to climate-related risks and opportunities, Internal Carbon Pricing, Remuneration, etc. |
The Group places high importance on sustainable development and climate change issues, closely monitoring global net-zero and decarbonization trends. The Sustainable Development Promotion Committee participates in the formulation and review of sustainability strategies, policies, and various strategic targets. Quarterly reports on related progress are submitted to the Board of Directors, and significant sustainability topics are also presented to the Sustainable Development and Strategy Committee. The Board’s guidance on each topic is followed by subsequent actions and tracking to ensure effective implementation. These efforts demonstrate the Group’s proactive alignment with the United Nations Sustainable Development Goals (SDGs), the Paris Agreement’s 1.5°C temperature limit target, and Taiwan’s Climate Change Response Act, which sets the national target for achieving net-zero GHG emissions by 2050.
Strategic Objectives and Performance Trends for Sustainability-Related Risks and Opportunities
| Sustainability and Related Risks or Opportunities |
Metrics | Base Period | Strategic Goals | Targets | ||||||||||||||||||||||
| Indicator Definition |
Calculation Input Values |
Third-Party Verification |
Unit of Measurement |
Indicator Type |
Current Value | Target Purpose | Target Scope | Target Type |
Target Period |
Milestone / Interim Target | ||||||||||||||||
| Sustainability-Related Opportunities – Digital Resilience
To meet the digital resilience requirements of government and corporate clients, the Group provides solutions encompassing network, system , and cybersecurity resilience. |
Medium-term revenue compound annual growth rate, CAGR of digital resilience solutions | Calculated based on the Group’s annual operating revenue. | Not verified by a third party | Percentage | Quant. | (Note 1) | 2025 revenue of digital resilience solutions | Provide comprehensive digital resilience solutions for governments and enterprises, covering networks, systems, and cybersecurity. | Position as a co-creator within the digital ecosystem, continuously advancing expertise in network, system, and cybersecurity resilience technologies. | Consolidated entities | Intensity target | 2030 | Medium-term revenue CAGR: 6%~10% (2025 - 2030) | |||||||||||||
- 35 -
| Sustainability and Related Risks or Opportunities |
Metrics | Base Period | Strategic Goals | Targets | ||||||||||||||||||||||
| Indicator Definition |
Calculation Input Values |
Third-Party Verification |
Unit of Measurement |
Indicator Type |
Current Value | Target Purpose | Target Scope | Target Type |
Target Period |
Milestone / Interim Target | ||||||||||||||||
| Climate-Related Opportunities – Climate Resilience Products and Services
Providing customers with products or services that enhance climate resilience. |
Revenue proportion of climate-related opportunity products | Calculated based on the Group’s annual operating revenue. | Not verified by a third party | Percentage | Quant. | 6%~8% | 2025 revenue of climate-related opportunity products | By expanding sustainable revenues, the Group enables its products and solutions to drive greater carbon reductions and makes a tangible contribution to environmental sustainability. | Pioneering new opportunities in the low-carbon market | Consolidated entities | Intensity target | 2030 | Maintain (or increase) the proportion of revenue from climate-related products on an annual basis. | |||||||||||||
| Climate-Related Opportunities - Energy
Energy efficiency improvements to reduce electricity consumption and associated carbon pricing costs |
Reduction in electricity consumption | • Electricity consumption in the previous year • Electricity consumption in the current year |
Electricity consumption is related to Scope 2 GHG emissions. The Group conducts an annual GHG inventory and obtains third-party verification. | Electricity consumption (kWh) | Quant. | Total electricity consumption this year decreased by 124 million kWh compared to the base year, and by 44.3 million kWh compared to 2024 (Note2) | 2020 | Compared to the base year (Year 2020), reduce electricity consumption by 849 million kWh by 2040 | Reduction in electricity consumption | Consolidated entities | Absolute target | 2040 | Compared with the base year (Year 2020), reduce electricity consumption by 216 million kWh by 2030 | |||||||||||||
| Climate-Related Risks — Transition Risks
Increased compliance costs in response to the government’s 2050 net-zero emissions policy |
GHG Emissions Reduction Ratio | Scope 1 & Scope 2 GHG Emissions
Scope 3 GHG Emissions |
Conduct an annual GHG inventory and third-party verification. | Emissions volume | Quant. | Scopes 1 & 2: 20.51% reduction compared to the base year Scope 3: 11.07% reduction compared to the base year (Note 3) |
Scopes 1 & 2: 2020: 857.1 thousand t-CO₂e
Scope 3: 2021: 1.9132 million t-CO₂e |
Net-Zero Carbon Emissions Target: 2045 | Reduce carbon emissions | Scopes 1 & 2: Consolidated entities
Scope 3: Parent company (Chunghwa Telecom) |
Intensity target | 2045 | 2030 Scope 1 and Scope 2 GHG emissions: 50% reduction compared to the base year
Scope 3 GHG emissions: 25% reduction compared to the base year | |||||||||||||
- 36 -
| Sustainability and Related Risks or Opportunities |
Metrics | Base Period | Strategic Goals | Targets | ||||||||||||||||||||||
| Indicator Definition |
Calculation Input Values |
Third-Party Verification |
Unit of Measurement |
Indicator Type |
Current Value | Target Purpose | Target Scope | Target Type |
Target Period |
Milestone / Interim Target | ||||||||||||||||
| Sustainability-Related Risk – Digital Resilience
Power and network disruptions and abnormal outages of critical information systems or cloud data center infrastructure caused by major natural disasters, external environmental changes, or multi-hazard events |
Maintaining Backbone Network Service Availability | Calculation of affected users and duration based on major network outages | Not verified by a third party | Percentage | Quant. | Backbone network service availability ≥ 99.99% | 2025, 99.99% |
Strengthen the resilience and performance of service systems to ensure digital services remain complete and uninterrupted | Maintaining Backbone Network Service Availability | Parent company (Chunghwa Telecom) | Intensity target | 2026 | Backbone network service availability ≥ 99.99% | |||||||||||||
| Maintain the annual service availability of critical information systems and IDC/cloud services. | Total unplanned downtime (excluding scheduled maintenance) | Not verified by a third party | Percentage | Quant. |
Critical information systems: service availability ≥ 99.95% IDC/ cloud services: service availability ≥ 99.95% |
2025, 99.95% |
Maintain the annual service availability of critical information systems and IDC/cloud services | Parent company (Chunghwa Telecom) | Intensity target | 2026 | Critical information systems: service availability ≥ 99.95% (Note 4)
IDC/ cloud services: service availability ≥ 99.95% (Note 4) | |||||||||||||||
| Critical Network Facility backup power duration | Backup power duration (UPS & generators) following external power interruptions. | Not verified by a third party | Hour | Quant. | Critical network facility backup power duration: ≥ 72 hours | 2025, 72 hours |
Maintain the critical network facility backup power | Parent company (Chunghwa Telecom) | Absolute targets | 2026 | Critical network facility backup power duration: ≥ 72 hours (Note 5) | |||||||||||||||
|
Sustainability-Related Risks - Cybersecurity and Customer Privacy
The occurrence of major cybersecurity incidents, leakage or improper use of personal data resulting in administrative penalties imposed by regulatory authorities or operational losses |
1. Number of Data Breaches 2. Number of Affected Customers |
Calculated based on the Group’s Personal Data Incident Reporting Statistics | Not verified by a third party | Case/ Person | Quant. | 1.0 case 2.0 persons |
2025, 1.0 case 2.0 person |
Strengthen cybersecurity resilience and enhance personal data protection to create a top-tier technology group that meets international standards for safety, reliability, and customer trust | Protect customer personal data | Consolidated entities | Absolute targets | 2050 | 1.0 case 2.0 person | |||||||||||||
| Maintain ongoing third-party information security and personal data certification | Based on the Group’s Statistics of Achieved Information Security and Personal Data Certifications | Not verified by a third party | Achievement Rate / Percentage | Quant. | 100% | 2025, 100% |
Comprehensive Information Security and Privacy Information Management System | Consolidated entities | Intensity target | 2050 | Maintain 100% compliance with third-party information security and personal data certification | |||||||||||||||
- 37 -
| Note 1: | 2025 is the base year for this metric/target. The indicator is measured using the Compound Annual Growth Rate (CAGR), which requires data from at least two periods to calculate. Starting from 2026, the calculation will use 2025 as the base year. |
| Note 2: | Electricity consumption for certain subsidiaries includes estimated values, based on the actual consumption for the same period in the previous year. |
| Note 3: | GHG emissions data for Year 2025 is based on internal calculations. A reasonable assurance opinion on the GHG inventory is expected to be obtained by April 30, 2026. The complete assurance information will be disclosed in the Sustainability Report. |
| Note 4: | The availability target for this service refers to circumstances in which a “significant disaster” occurs and that are “not limited to any specific scope or asset”. If circumstances are “limited to a specific scope or asset”, or if an “exclusive SLA agreement has been signed with the customer,” the availability target may exceed 99.95%. |
| Note 5: | Aligned with international TIA-942 IDC Tier 3 standard for high-reliability power resilience. |
5.1.1 Greenhouse Gas–related Targets and Metrics
The Group recognizes the significant impacts and challenges posed by climate change on the industry, while also taking a forward-looking approach to identifying opportunities associated with sustainable and low-carbon development. To proactively address climate-related risks and seize green growth opportunities, the governing bodies and management closely monitor global climate developments. Based on Science-Based Targets (SBTs) for scientifically quantified decarbonization, the Group adopts two core strategies—technology-driven decarbonization and renewable energy utilization—and is committed to achieving 100% renewable energy use by 2040 and net-zero emissions by 2045.
The Group has formulated a GHG reduction strategy and designated 2020 as the base year for emissions reduction. In that year, Scope 1 and Scope 2 emissions were 27,791.4061 t-CO₂e and 829,322.1537 t-CO₂e, respectively, with a total combined emission of 857,113.5598 t-CO₂e. The Group targets a 50% reduction in combined Scope 1 and Scope 2 emissions by 2030 relative to the 2020 base year. To achieve this reduction target, the Group has developed the following decarbonization pathway:
| Year (Gregorian Calendar) | 2020 | 2021 | 2022 | 2023 | 2024 | 2025 | 2026 | 2027 | 2028 | 2029 | 2030 | |||||||||||||||||||||||||||||||||
| Annual Carbon Emission Reduction Ratio |
Base year | 1.7 | % | 3.7 | % | 6.5 | % | 10.1 | % | 14.5 | % | 20.0 | % | 26.0 | % | 33.0 | % | 41.0 | % | 50.0 | % | |||||||||||||||||||||||
Since 2023, the Group has gradually purchased Gold Standard-certified carbon credits through the international carbon trading platform of the Taiwan Carbon Exchange, totaling 3,826 tons, to offset part of the organization’s carbon emissions. Going forward, the Company will assess the purchase of internationally recognized carbon credits based on its carbon reduction plan and actual needs to achieve overall emission reduction targets.
- 38 -
| Strategic Targets | Corresponding Indicator |
Targets | Target Purpose |
Scope of Application |
Target Type | Status and Performance Trend in 2025 | ||||||
| Decarbonization Pathway: Advancement to Achieve Net-Zero Emissions by 2045 (Note 1) |
Scope 1 and Scope 2 GHG emissions | Net-Zero Target – 2030: • Scope 1 and 2: 50% reduction compared to the base year 2020 |
GHG Emission Reduction |
Entire Group | Quantitative – Absolute Target | Scope 1, 2: Actual emissions amounted to 681.3 thousand t-CO₂e, representing a 20.51% reduction compared to the base year (2020). | ||||||
| Gradual Reduction of IDC Data Center PUE Through Technological Decarbonization | IDC Data Center PUE | Reduce IDC Data Center PUE to below 1.5 by 2030, using 2020 as the base year |
GHG Emission Reduction |
Parent Company (Chunghwa Telecom) | Quantitative – Intensity Target |
The PUE value was 1.587, reduce by approximately 0.6%–1% per year | ||||||
| Procure and Self-Build Renewable Energy |
Proportion of Renewable Energy Usage | Achieve 100% renewable energy usage by 2040 across the entire Group (including all five subsidiaries: Chief Telecom, Honghwa International, Chunghwa Precision Test, Chunghwa Leading Photonics, International Integrated Systems) in line with RE100 commitments | GHG Emission Reduction |
Parent company (Chunghwa Telecom) and certain subsidiaries (including all five subsidiaries: Chief Telecom, Honghwa International, Chunghwa Precision Test, Chunghwa Leading Photonics, International Integrated Systems) | Quantitative – Intensity Target |
• Actively promote the development of renewable energy. As of 2025, 171 self-owned solar photovoltaic (PV) sites and green base stations are constructed across Taiwan, with a cumulative installed capacity of 13.1M kWp. • In 2024, total renewable energy consumption reached 72.604 million kWh, accounting for 5.38% of total electricity consumption; In 2025, the proportion of renewable energy usage increased, with total consumption amounting to 88.679 million kWh, representing 6.46% of total electricity consumption. | ||||||
| Setting the EV100 target to advance the adoption of electric vehicles | Electrification Rate (%) of Engineering / Administrative / Transportation Vehicles | Achieve 100% electrification of engineering, administrative, and transportation fleet vehicles by 2030 under the EV100 commitment | GHG Emission Reduction |
Parent Company (Chunghwa Telecom) | Quantitative – Intensity Target |
From 2024 to 2026, the Company has initiated a phased replacement of existing engineering and administrative vehicles with electric vehicles. Beginning in 2027, the Company plans to procure only electric vehicles for all new fleet acquisitions. |
| Note 1: | The Group’s GHG reduction targets are derived using the absolute contraction approach. |
| Note 2: | GHG emissions data for 2025 is based on internal calculations. A reasonable assurance opinion on the GHG inventory is expected to be obtained by April 30, 2026. The complete assurance information will be disclosed in the Sustainability Report. |
| Note 3: | The total renewable energy consumption data are based on the Company’s internal reporting. For certain activity data could not be obtained due to data availability constraints, the Group applied reasonably obtainable and supportable information available as of the reporting date (including, where necessary, estimates based on prior-period data) to perform estimations. However, the emissions data derived from such estimations involve a high degree of uncertainty and may be subject to material revisions upon the availability of updated information in the subsequent year. |
| Note 4: | All other performance indicators are calculated based on internally developed definitions and have not undergone third-party verification. |
- 39 -
5.1.1.1 Absolute Greenhouse Gas Emissions During the Reporting Period
The Group discloses its carbon emissions data annually and obtains third-party verification in accordance with the Greenhouse Gas Protocol (GHG Protocol) and ISO 14064 standards to ensure the accuracy and reliability of its emissions information. Based on 2025 data, the Group’s total GHG emissions for Scope 1, Scope 2, and Scope 3 (Categories 1–6) amounted to 2,468,907.9383 t-CO₂e. The absolute GHG emissions for Scope 1, Scope 2, and Scope 3 generated by the consolidated accounting group during the 2025 reporting period are detailed as follows:
| Scopes 1, 2, 3 |
| |||||||
| Item | Item | Item | ||||||
| Scope 1 (Direct) (t-CO₂e) |
25,561.6967 |
Entire Group | ||||||
| Scope 2 (Indirect Energy) (t-CO₂e) |
Market- based |
655,726.1313 |
Entire Group |
|||||
| Location - based |
697,727.2713 | |||||||
| Scope 3 (Other Indirect) (t-CO₂e) |
1,787,620.1103 |
Entire Group |
||||||
| Total Emissions (Scope 1 + 2) (t-CO₂e) |
Market - based |
681,287.8280 |
Entire Group |
|||||
| Location- based |
723,288.9680 | |||||||
| Total emissions (Scopes 1+2+3) (t-CO₂e) |
Market- based |
2,468,907.9383 |
Entire Group |
|||||
| Location- based |
2,510,909.0783 | |||||||
| Scope 3 Inventory and Verification |
| |||||||
| Category | Category | Category | ||||||
| 3 | Upstream transportation and distribution |
988.1236 | ||||||
| Downstream transportation and distribution |
110.0064 | |||||||
| Business travel |
7,733.7823 | |||||||
| Employee commute |
15,971.4690 | |||||||
| 4 | Purchased goods and services |
596,873.2328 | ||||||
| Procurement of capital goods |
617,767.2306 | |||||||
| Fuel and energy-related activities |
137,866.9587 | |||||||
| Waste generated by operations |
1,974.5813 | |||||||
| Upstream leased assets |
86,170.5668 | |||||||
| 5 | Use of sold products |
94,362.7120 | ||||||
| End-of-life treatment of sold products |
411.3818 | |||||||
| Downstream leased assets |
170,587.8345 | |||||||
| Investment | 56,802.2305 | |||||||
| Note 1: | The industries to which the Group belongs do not emit ozone-depleting substances or other significant pollutants. |
| Note 2: | GHG emissions data for 2025 is based on internal calculations. A reasonable assurance opinion on the GHG inventory is expected to be obtained by April 30, 2026. The complete assurance information will be disclosed in the Sustainability Report. |
| Note 3: | For 2025 GHG emission data, where certain activity data could not be obtained due to data availability constraints, the Group applied reasonably obtainable and supportable information available as of the reporting date (including, where necessary, estimates based on prior-period data) to perform estimations. However, the emissions data derived from such estimations involve a high degree of uncertainty and may be subject to material revisions upon the availability of updated information in the subsequent year. |
5.1.1.2 Methodology, Input Values, and Assumptions for GHG Emissions
The Group’s GHG emissions are verified by a third-party organization in accordance with the Greenhouse Gas Protocol (GHG Protocol) and ISO 14064 standards, in order to track the effectiveness of emission reduction efforts. In addition to completing voluntary inventories at operational sites, the Group has extended the inventory scope to its value chain, establishing a systematic framework that provides a solid information foundation for carbon management. During the reporting period, there were no changes to the methodology, input values, or assumptions used for measuring GHG emissions. For detailed estimation methodologies, please refer to “5.1.1.3 Scope 1 and Scope 2 Greenhouse Gas Emissions”.
- 40 -
5.1.1.3 Scope 1 and Scope 2 Greenhouse Gas Emissions
The Group’s Scope 1 and Scope 2 GHG emissions for 2025 are presented in “5.1.1.1 Absolute Greenhouse Gas Emissions During the Reporting Period.” Scope 1 and Scope 2 emissions are segregated between the consolidated accounting group and other investees not included in the consolidated group. The Group adopts the operational control approach and has determined that it does not exercise operational control over other investees.
The Group discloses Scope 2 emissions on a location-based approach, with emission factors applied to electricity retailing utility enterprise. The aggregated data are summarized as follows:
| Emission Source | Emission Factor | Unit | Source | |||||
| CO2 | ||||||||
| Taiwan | 0.4740 | t/kWh | Electricity emission factors for 2024 as announced by the Bureau of Energy | |||||
| Japan | 0.4230 | t/kWh | Emission Factors by Electricity Providers (TEPCO) as Announced by the Ministry of the Environment, Japan | |||||
| Singapore | 0.4020 | t/kWh | 2024 Electricity Emission Factor as announced by the Energy Market Authority (EMA), Singapore | |||||
| United States (CAMX) | 0.19504800 | t/kWh | US EPA eGRID 2023 | |||||
| United States (AZNM) | 0.32033232 | t/kWh | US EPA eGRID 2023 | |||||
| United States (ERCT) | 0.33412176 | t/kWh | US EPA eGRID 2023 | |||||
| China (Shanghai) | 0.5777 | t/kWh | 2024 Electricity CO2 Emission Factor Announcement – Shanghai | |||||
| Hong Kong | 0.3800 | t/kWh | CLP Power announced electricity emission factor | |||||
| Thailand | 0.4750 | kg/kWh | TGO announced electricity emission factor (2025) | |||||
|
Vietnam |
0.6592 | t/kWh | 2023 Electricity Emission Factor as announced by the Ministry of Climate Change, Vietnam |
The Group additionally utilizes self-installed solar photovoltaic systems and procures renewable energy to achieve its net-zero carbon reduction targets. The data for renewable energy usage and Renewable Energy Certificates (T-REC) for 2025 are summarized as follows:
| Year | Renewable Energy (10,000 kWh) |
Renewable Energy Certificates (Number of Certificates) |
Renewable Energy Utilization Rate (%) | |||
| 2025 | 8,867.9 | 88,170 | 6.46% |
| Note 1: | The total renewable energy consumption data are based on the Company’s internal reporting. For certain activity data could not be obtained due to data availability constraints, the Group applied reasonably obtainable and supportable information available as of the reporting date (including, where necessary, estimates based on prior-period data) to perform estimations. However, the emissions data derived from such estimations involve a high degree of uncertainty and may be subject to material revisions upon the availability of updated information in the subsequent year. |
- 41 -
5.1.1.4 Scope 3 Greenhouse Gas Emissions
The Group’s Scope 3 GHG emissions for 2025 are presented in “5.1.1.1 Absolute Greenhouse Gas Emissions During the Reporting Period.’’ The Group applies a hybrid approach and the average-data method to measure Scope 3 emissions. The hybrid approach combines supplier-specific data and secondary data, while the average-data method primarily multiplies the quantity of purchased goods and services by secondary data (industry-average emission factors) to estimate GHG emissions. In 2025, the Group’s total carbon emissions under Scope 3 amounted to 1,787,620.1103 t-CO₂e. This data is expected to be verified by a third party in accordance with ISO 14064-1 and GHG Protocol standards. The Group anticipates that this information enables key users to understand the verified input values used in measuring Scope 3 GHG emissions and provides supporting information to substantiate the reasonableness and reliability of these input values.
Methodologies for Calculating Scope 3 GHG Emissions and Description of Exclusions
| Scope 3 Categories | Description of Emission Calculation Methodology and Exclusions | |
|
1. Purchased goods and services |
Priority is given to estimating emissions using product life cycle GHG emission factors. For materials or products with available weight data (such as consumables, packaging materials, electronic components, and raw materials), emissions are calculated by multiplying the weight by the corresponding life cycle GHG emission factor (sources include the Environmental Protection Administration’s Carbon Footprint Database or the SimaPro database). If such data are unavailable, quantification is performed using Environmentally Extended Input-Output (EEIO) analysis. The detailed calculation methods for each item are as follows:
1. Water (Carbon Footprint): Multiply the water consumption by the emission factor published on the Product Carbon Footprint Information Platform.
2. Supplier Inventory Items (Carbon Footprint): Based on the quantity of products procured, multiply by the emission factors announced by suppliers to calculate carbon emissions. This includes refrigerants, leased goods, SIM cards, and products sold in retail stores.
3. Others (EEIO): Classify the procurement items according to the industry classification standards of the Directorate-General of Budget, Accounting and Statistics, and calculate carbon emissions based on procurement costs using EEIO analysis. | |
|
2. Procurement of |
The primary approach for quantification is Environmentally Extended Input-Output (EEIO) analysis. Based on the capital expenditures incurred during the year (such as IT equipment, servers, building renovations, vehicles, and facility installations), procurement amounts are classified according to the industry classification standards of the accounting system. These amounts are then multiplied by the corresponding industry-specific GHG emission factors for the manufacturing stage to calculate the indirect GHG emissions associated with the capital goods. | |
| 3. Fuel and energy-related activities |
Based on fuel and electricity consumption within the organizational boundaries defined for the inventory, indirect emissions are calculated by multiplying by the emission factors announced on the Product Carbon Footprint Information Platform (i.e., life-cycle emission factors excluding the use-phase emissions). | |
|
4. Upstream transportation and distribution |
Priority is given to using available material or product weight and delivery data to calculate emissions by applying the corresponding ton-kilometer emission factor approach (sources include the Environmental Protection Administration’s Carbon Footprint Database or the SimaPro database). If such data are unavailable, emissions are quantified using the Environmentally Extended Input-Output (EEIO) method. The detailed calculation methods are as follows:
1. Supplier Inventory Items (Ton-Kilometer): For retail products, the parent company and subsidiaries estimate upstream transportation ton-kilometers based on inbound quantities, weights, supplier shipping records, and sales data. Emissions are calculated using ton-kilometer emission factors published on the Product Carbon Footprint Information Platform. For non-retail products (e.g., HGW, Wi-Fi AP, signal boosters, SIM cards, MOD), the same calculation principle applies. Subsidiaries calculate waste generation using per capita waste generation rates announced by authorities and employee headcount or total working hours, then apply incineration emission factors. Transportation emissions are calculated using the activity-based ton-kilometer method by multiplying waste transport weight and distance to the nearest incineration plant by the transport emission factor.
2. Accounting Items (EEIO): Based on expense records for upstream and downstream transportation and distribution, emissions are calculated using the EEIO approach by applying expenditure amounts, excluding non-product transportation expenses. | |
- 42 -
| Scope 3 Categories | Description of Emission Calculation Methodology and Exclusions | |
| 5. Waste generated by operations |
Priority is given to using available material or product weight and disposal method to calculate emissions by applying the corresponding ton-kilometer or emission factor approach (sources include the Environmental Protection Administration’s Carbon Footprint Database or the SimaPro database). If such data are unavailable, emissions are quantified using the Environmentally Extended Input-Output (EEIO) method. The detailed calculation methods are as follows:
1. Waste Generation (Treatment Emission Factor): Based on the amount of general and industrial waste generated within the organizational boundary at each operating site, and the recorded waste treatment methods (including incineration, composting, and recycling), emissions are calculated by multiplying the waste quantity by the incineration emission factor published on the Product Carbon Footprint Information Platform; food waste is multiplied by the composting emission factor from the same source.
2. Waste Transportation (Ton-Kilometer): For municipal waste transported from operating sites to the final disposal location, emissions are calculated by multiplying the transport distance and weight by the ton-kilometer emission factor published on the Product Carbon Footprint Information Platform. For industrial waste transported from headquarters to treatment facilities, the same method applies.
3. Accounting Items (EEIO): Based on expense records for upstream and downstream transportation and distribution, emissions are calculated using the EEIO approach by applying expenditure amounts. | |
| 6. Business travel |
Priority is given to quantifying emissions using the activity-based method (passenger-kilometer approach). Actual business travel distances for each mode of transportation (e.g., air, rail, car, metro, high-speed rail) are aggregated and multiplied by the corresponding GHG emission factors for each transport mode. The detailed calculation methods are as follows:
1. Transportation (EEIO): Based on business travel classifications, including air transport, sea transport, rail transport, private car (taxi), coach/bus, and airport-related expenses, emissions are calculated using the Environmentally Extended Input-Output (EEIO) method by applying expenditure amounts.
2. Business Accommodation (EEIO): For domestic stays, emissions are quantified using the per-night emission factor published on the Product Carbon Footprint Information Platform; for international stays, SimaPro emission factors are applied. | |
|
7. Employee commute |
Both the parent company and subsidiaries conduct an employee commuting survey and require all employees to complete the questionnaire. After collecting data on commuting modes and distances, emissions are calculated by multiplying the corresponding public transportation emission factors. The calculation method is as follows:
1. Commuting Transportation (Passenger-Kilometer): For each county/city, commuting modes and distances are aggregated and then multiplied by the corresponding public transportation emission factors. The result is adjusted by the response rate (number of respondents ÷ total employees in that county/city) to estimate the commuting emissions for all employees nationwide. | |
- 43 -
| Scope 3 Categories | Description of Emission Calculation Methodology and Exclusions | |
| 8. Upstream
leased |
Priority is given to quantifying emissions from upstream lease-related accounting expenses using the Environmentally Extended Input-Output (EEIO) method, and to include electricity consumption for leased premises without full operational control. The detailed calculation methods are as follows:
1. Accounting Items (EEIO): Based on expense records for upstream leases, emissions are calculated using the EEIO approach by applying procurement costs, excluding service fees, usage fees, and attachment fees.
2. Electricity Without Full Operational Control (Electricity Emission Factor): For leased premises with fixed electricity charges and base stations without full operational control, emissions are calculated using the electricity emission factor. | |
|
9. Downstream transportation and distribution |
Priority is given to quantifying emissions using the transport activity-based method (ton-kilometer approach). Emissions are calculated by multiplying the weight of goods transported during product sales or service delivery by the transport distance to customers and applying the corresponding GHG emission factor for the transport mode (e.g., road, sea, air). If only accounting expense data are available, emissions are quantified using the Environmentally Extended Input-Output (EEIO) method (limited to subsidiary products). The detailed calculation methods are as follows:
1. Supplier Inventory Items (Ton-Kilometer): For products sold in retail stores where suppliers bear the transportation cost, ton-kilometers are estimated using the supplier’s address and product weight. Emissions are calculated using the ton-kilometer emission factors published on the Product Carbon Footprint Information Platform or those provided by the SimaPro database.
2. EEIO Method: For downstream distribution or transportation-related accounting expenses, emissions are calculated by applying EEIO emission factors based on industry classification to reflect indirect emissions generated during product transportation. This method applies only to subsidiary products. | |
| 10. Processing of Sold Products |
As no intermediate products are sold under the current business model, processing of sold products is not applicable. | |
| 11. Use of sold products |
Priority is given to using available product carbon footprint information to quantify emissions based on the number of products sold. If such data are unavailable, emissions are quantified based on the product’s energy consumption throughout its life cycle. The detailed calculation methods are as follows:
1. Product Carbon Footprint: Carbon emissions are calculated by multiplying the number of products sold by the use-phase emission factor announced by suppliers or associated products in the SimaPro database.
2. Product Electricity Consumption (Electricity Emission Factor): If annual electricity consumption data for individual electronic products announced by the Energy Administration or equipment lifetime standards from the Directorate-General of Budget, Accounting and Statistics are available, these are used to calculate product electricity consumption. If such data are unavailable, emissions are calculated by multiplying the number of products sold by estimated electricity consumption over the product’s lifetime and then applying the latest 2024 electricity emission factor. Products without electricity consumption are excluded from carbon emission calculations. | |
| 12. End-of-life treatment of sold products |
The disposal method for each product is determined based on its composition and properties, considering potential end-of-life treatments such as incineration, landfill, or recycling. Emissions are then calculated by multiplying the corresponding end-of-life GHG emission factor for each treatment method. Emission factors are primarily sourced from the treatment stage data in the SimaPro life cycle assessment database. The detailed calculation methods are as follows:
1. Product Carbon Footprint: For sold products and SIM cards, carbon emissions are calculated by multiplying the sales volume by the end-of-life emission factor announced by suppliers or associated products in the SimaPro database.
2. Waste Treatment Volume (Weight-Based Emission Factor): Estimate the total weight based on product characteristics and apply the proportion of regulated recyclable materials announced by the Ministry of Environment to determine the total treatment volume. Multiply this by the emission factor published on the Product Carbon Footprint Information Platform for quantification.
3. Waste Transportation (Ton-Kilometer): Calculate emissions from transporting sold goods from operating sites to the Gangshan incineration plant by multiplying the transport distance and weight by the ton-kilometer emission factor published on the Product Carbon Footprint Information Platform. | |
- 44 -
| Scope 3 Categories | Description of Emission Calculation Methodology and Exclusions | |
| 13. Downstream leased assets |
Downstream leased products and premises are quantified based on electricity consumption. The detailed calculation methods are as follows:
1. Leased Product Electricity Consumption (Electricity Emission Factor): Carbon emissions are calculated by multiplying the product’s rated power or standby and operating electricity consumption by the 2024 electricity emission factor published by the Energy Administration.
2. Leased Premises Electricity Consumption (Electricity Emission Factor): Carbon emissions are calculated by multiplying the electricity allocation recorded by external systems for leased premises by the latest 2024 electricity emission factor. This includes electricity used in IDC facilities subleased by subsidiaries. | |
|
14. Franchise Business |
There were no franchised operations in 2025. | |
|
15. Investment |
The primary focus is on assets with investment amounts disclosed in financial reporting documents, quantified using Environmentally Extended Input-Output (EEIO) analysis. If the investee company provides its Scope 1 and Scope 2 GHG emissions, emissions are further calculated based on the Company’s equity share. The detailed calculation methods are as follows:
1. EEIO Method: In accordance with the GHG Protocol category for debt and equity investments, this includes investments accounted for under the equity method in consolidated financial statements, financial assets measured at fair value through other comprehensive income, and financial assets measured at fair value through profit or loss. All subsidiaries are included in the inventory scope, excluding liquidated or merged entities, and only companies with investment amounts are considered. Emissions are calculated by multiplying the Company’s investment amount by the corresponding industry-specific EEIO emission factor to determine Scope 3 emissions attributable to subsidiaries.
2. Emission Factor Method: For companies that provide Scope 1 and Scope 2 emissions data, carbon emissions are calculated and then weighted based on the Company’s equity share to determine Scope 3 emissions. | |
5.1.2 Cross-Industry Climate-Related Indicators
This section focuses on key performance indicators to disclose the Group’s specific targets and implementation status regarding net-zero carbon emissions, renewable energy goals, data center PUE, and climate adaptation measures. It aims to demonstrate the Group’s commitment and proactive actions on climate change issues.
- 45 -
Cross-Industry Climate-Related Indicators
| Type | Indicator Item | 2025 Current Status Overview | ||
| Climate-Related Opportunities | Revenue from Climate-Related Opportunity Products | In accordance with the Reference Guidelines for the Recognition of Sustainable Economic Activities, the Group’s revenue from climate-related opportunity products amounted to approximately 6%–8% of the Company’s total operating revenue in the year 2025. | ||
| Climate-Related Transition Risks | The Group operates within the service industry and is not classified as a major electricity consumer regulated by the Ministry of Economic Affairs; therefore, its exposure to policy-driven transition risks (e.g., carbon pricing, carbon tariffs) is relatively limited. The potential impacts of climate-related transition risks on operations—including asset allocation, operating costs, and business models—remain within a controllable range. No significant operational disruptions are expected in the short, medium, or long term. | |||
| Climate-Related Physical Risks | Critical communication facilities are located in areas classified as “high/extremely high” risk for extreme rainfall, river and coastal flooding, storm surges, and typhoon-induced waves. | In 2025, no critical communication facilities are located in areas potentially affected, and the impact of sea level rise is currently estimated to become significant only after 2060. | ||
| Capital Allocation | 1. Expenses on Renewable Energy 2. Expenditure on Equipment Replacement |
Hundreds of millions of NTD are being allocated this year toward renewable energy procurement costs and capital expenditures for equipment replacement to further strengthening our strategic deployment and advancement of renewable energy. | ||
5.1.3 Internal Carbon Pricing
Since 2022, Chunghwa Telecom has implemented an internal carbon fee mechanism. The internal carbon price is established based on the average cost of renewable energy, with reference to global trends in internal carbon pricing and prevailing industry practices. Internal carbon fees are charged to operating units according to their electricity consumption and incorporated into their profit and loss performance evaluations. The internal carbon price for 2025 was set at NT$ 1,600 per ton of CO₂e. The collected carbon fees are allocated to an internal carbon fee fund, which is used to incentivize innovative proposals that promote environmental sustainability. The carbon price will be periodically reviewed and adjusted as necessary, taking into consideration government regulations, international carbon pricing developments, and benchmarking data from leading companies.
5.1.4 Remuneration
For policies linking sustainability (including climate)–related risks and opportunities to remuneration, as well as details on remuneration linkages, please refer to “2.1.4 Target Setting for Sustainability- and Climate-Related Risks and Opportunities, and Linkage to Performance and Remuneration Policies”.
- 46 -
5.2 Information Relevant to Industry-Based Metrics
In accordance with the Group’s business model, the parent company identifies the applicable sustainability- and climate-related standards as the SASB Telecommunication Services Standard and the IFRS S2 Industry-based Implementation Guidance, Volume 59: Telecommunication Services (TC-TL). In addition, the subsidiaries included within the scope of this disclosure apply the following standards: the SASB Multiline and Specialty Retailers & Distributors Standard, the SASB Semiconductors Standard, the SASB Software & IT Services Standard, the SASB Telecommunication Services Standard; as well as the IFRS S2 Industry-based Implementation Guidance, Volume 6: Multiline and Specialty Retailers & Distributors (CG-MR), Volume 57: Semiconductors (TC-SC), Volume 58: Software & IT Services (TC-SI), and Volume 59: Telecommunication Services (TC-TL), covering all relevant disclosure topics and associated industry-based metrics.
Sustainability Disclosure Topics and Metrics
| SASB Standards | Topic | Code | Metrics | Category | Unit of Measurement |
Amount/Description | ||||||
|
● Telecommunication Services ● Multiline and Specialty Retailers & Distributors ● Software & IT Services ● Semiconductors |
● Environmental Footprint of Operations ● Energy Management in Retail & Distribution ● Environmental Footprint of Hardware Infrastructure ● Energy Management in Manufacturing |
TC-TL-130a.1 CG-MR-130a.1 TC-SI-130a.1 TC-SC-130a.1 |
(1) Total energy consumed (2) Percentage grid electricity (3) Percentage renewable |
Quantitative | Gigajoules (GJ) Percentage (%) |
(1) 5,483,530.34 Gigajoules (GJ) (2) 90.35% (3) 8.68% | ||||||
|
● Telecommunication Services ● Multiline and Specialty Retailers & Distributors |
● Data Security ● Data Security ● Data Security |
TC-TL-230a.1 CG-MR-230a.2 TC-SI-230a.1 |
(1) Number of data breaches (2) Percentage that are personal data breaches |
Quantitative | Number, Percentage (%) |
(1) 0 cases (2) 0% (3) 0 person |
- 47 -
| SASB Standards | Topic | Code | Metrics | Category | Unit of Measurement |
Amount/Description | ||||||
|
● Software & IT Services |
(3) Number of customers affected |
|||||||||||
|
● Telecommunication Services ● Multiline and Specialty Retailers & Distributors ● Software & IT Services |
● Data Security ● Data Security ● Data Security |
TC-TL-230a.2 CG-MR-230a.1 TC-SI-230a.2 |
• Description of approach to identifying and addressing data security risks, including use of third-party cybersecurity standards. • Provide an explanation of the approaches taken to identify and address data security risks, including the application of third-party cybersecurity standards. |
Discussion and Analysis | Not applicable. | The Group places a high priority on information security and the protection of personal data, and has established an Information Security Policy and a Privacy Protection Policy. In compliance with international standards and regulatory requirements, the Group has built a comprehensive cybersecurity governance framework and internal control system to ensure robust security defenses and incident response capabilities across the Group and its subsidiaries, safeguarding both operational and customer information security. The Group continuously analyzes cybersecurity risks and corresponding protection strategies, implementing a tiered management approach based on the business characteristics of the parent company and subsidiaries. In accordance with regulatory requirements and risk identification outcomes, appropriate measures are adopted, including the establishment of Information Security Management Systems (ISMS) / Personal Information Management Systems (PIMS), External Attack Surface Management (EASM), vulnerability scanning, penetration testing, cybersecurity health checks, red team exercises, threat detection (SOC/MDR), social engineering simulations, training and education, threat intelligence collaboration, internal and external audits, and third-party certifications. These measures are continuously refined through the PDCA (Plan-Do-Check-Act) cycle to protect investor interests and support the Group’s sustainable development. |
- 48 -
| SASB Standards | Topic | Code | Metrics | Category | Unit of Measurement |
Amount/Description | ||||||
|
● Telecommunication Services ● Software & IT Services |
● Data Privacy ● Data Privacy & Freedom of Expression |
TC-TL-220a.1 TC-SI-220a.1 |
Description of policies and practices related to targeted advertising and customer privacy | Discussion and Analysis | Not applicable. | The Group has established policies governing behavioral advertising and customer privacy, clearly outlining how customer data is used and customers’ choices regarding data usage. A comprehensive Privacy Policy is publicly disclosed to enable customers to opt in or opt out of relevant services. The privacy management practices of Chunghwa Telecom, its subsidiaries, and outsourced media service providers are summarized as follows:
1. The Group Our Policy: Chunghwa Telecom places strong emphasis on protecting customer privacy and complies with the Personal Data Protection Act and the Regulations Governing the Security Maintenance of Personal Data Files by Non-Government Agencies issued by the National Communications Commission (NCC). A comprehensive Privacy Protection Policy has been established, applicable to all branches, operating locations, subsidiaries, and suppliers.
Our Management Measures: • We have established rigorous personal data privacy protection and security controls, implemented data governance systems, defined data standards and classifications, and enforced access control mechanisms and data owner review processes. These measures ensure that data access and sharing are properly governed and safeguarded to maintain data availability, integrity, and confidentiality. • Prior to launching relevant business initiatives, we conduct risk assessments to verify compliance in data access and to ensure that adequate data protection measures are in place. To enhance customer privacy protection, we have implemented the ISO 27701 Privacy Information Management System (PIMS) to ensure the effectiveness and compliance of the entire data lifecycle. |
- 49 -
| SASB Standards | Topic | Code | Metrics | Category | Unit of Measurement |
Amount/Description | ||||||
|
• For the collection, processing, use, and protection of personal data involved in our operations, we strictly follow all applicable laws and regulations and use personal data only within the scope permitted by law. We do not provide, rent, or disclose personal data to third parties in any disguised form. All practices strictly adhere to the Company’s Chunghwa Telecom Privacy Protection Policy, ensuring robust customer data security and privacy rights. • The National Communications Commission (NCC) has not established specific regulations governing children’s online privacy. In Taiwan, the primary regulations pertaining to children’s online privacy protection include: • Protection of Children and Youths Welfare and Rights Act • Child and Youth Sexual Exploitation Prevention Act • Sexual Assault Crime Prevention Act • With respect to personally identifiable information, Chunghwa Telecom does not collect or process biometric data. For more information, please refer to the Chunghwa Telecom official website g Sustainability ESG g Privacy Protection.
2. Outsourced Company – Carat Media Taiwan Ltd. (“Carat Media”) |
- 50 -
| SASB Standards | Topic | Code | Metrics | Category | Unit of Measurement |
Amount/Description | ||||||
|
• The Group engages Carat Media to provide communication planning, interactive marketing, direct marketing, event marketing, consumer research, and related services, including targeted advertising and behavioral advertising. In addition to requiring Carat Media to establish a comprehensive Privacy Policy, the Company mandates full compliance with Chunghwa Telecom’s Privacy Protection Policy and all related management procedures. Carat Media must also provide mechanisms ensuring lawful and explicit customer consent, data anonymization and security measures, as well as user control and opt-out options to safeguard customer privacy. For the complete Privacy Policy, please refer to the Carat Media official website. | ||||||||||||
|
● Telecommunication Services ● Software & IT Services |
● Data Privacy ● Data Privacy & Freedom of Expression |
TC-TL-220a.2 TC-SI-220a.2 |
Number of customers/users whose information was used for secondary purposes | Quantitative | Number | 75.79% Note: The number of customers who consented to the use of their personal data for secondary purposes constitutes sensitive business information; therefore, it is disclosed in percentage terms. | ||||||
|
● Telecommunication Services ● Software & IT Services |
● Data Privacy ● Data Privacy & Freedom of Expression |
TC-TL-220a.3 TC-SI-220a.3 |
Total amount of monetary losses as a result of legal proceedings associated with customer/user privacy | Quantitative | Presentation Currency | 0. In 2025, no monetary losses incurred resulting from violations of laws related to customer privacy. | ||||||
|
● Telecommunication Services ● Software & IT Services |
● Data Privacy ● Data Privacy & Freedom of Expression |
TC-TL-220a.4 TC-SI-220a.4 |
(1) Number of law-enforcement requests for customer/user information (2) Number of customers/users whose information was requested (3) Percentage resulting in disclosure |
Quantitative | Number, Percentage (%) |
(1) 247,539 (2) 97,422 (3) 98.33% |
- 51 -
| SASB Standards | Topic | Code | Metrics | Category | Unit of Measurement |
Amount/Description | ||||||
|
● Semiconductors ● Software & IT Services |
● Recruitment and Management of a Global and Skilled Workforce ● Recruitment & Management of a Global, Diverse, and Skilled Workforce |
TC-SC-330a.1 TC-SI-330a.1 |
Percentage of employees requiring work visas | Quantitative | Percentage (%) | 5.61% | ||||||
|
● Semiconductors ● Software & IT Services |
● Water Management ● Environmental Footprint of Hardware Infrastructure |
TC-SC-140a.1 TC-SI-130a.2 |
(1) Total water withdrawn, (2) total water consumed; percentage of each in regions with High or Extremely High Baseline |
Quantitative | thousand cubic meters (m³) Percentage (%) |
(1) 253,626.30,0% (2) 156,810.30,0% | ||||||
|
● Telecommunication Services |
● Product End-of-Life Management |
TC-TL-440a.1 | (1) Materials recovered through take-back programmes, percentage of recovered materials that were (2) reused, (3) recycled, and (4) landfilled. |
Quantitative | metric tonnes (t) Percentage (%) |
(1) 16.91 (2) 89.37% (3) 0% (4) 10.63% |
- 52 -
| SASB Standards | Topic | Code | Metrics | Category | Unit of Measurement |
Amount/Description | ||||||
|
● Telecommunication Services |
● Competitive Behavior & Open Internet |
TC-TL-520a.1 | Total amount of monetary losses as a result of legal proceedings associated with anti-competitive behavior regulations. | Quantitative | Presentation Currency | 0. In 2025, there were no violations of regulations related to anti-competitive behavior. | ||||||
|
● Telecommunication Services |
● Competitive Behavior & Open Internet |
TC-TL-520a.2 | Average actual sustained download speed of (1) owned and commercially associated content and (2) non-associated content |
Quantitative | Megabits per second (Mbps) | The Group provides consistent download speeds across all types of content. For the average actual download speeds, please refer to Table 5-2-1: Telecommunication Services – Average Actual Download Speeds in page 67, which details the speeds for fixed-line, data communication, and mobile communication. | ||||||
|
● Telecommunication Services |
● Competitive Behavior & Open Internet |
TC-TL-520a.3 | Description of risks and opportunities associated with net neutrality, paid peering, zero-rating, and related practices. | Discussion and Analysis | Not applicable. |
1. The Group adheres to Taiwan’s Digital Communication Act and Telecommunications Management Act, which require Internet Service Providers (ISPs) to disclose traffic management practices to users. ISPs with significant market power are prohibited from engaging in discriminatory treatment in the telecommunications services market. 2. Article 13 of the Telecommunications Management Act sets out general regulations on interconnection agreements. Articles 30 and 31, along with their authorized regulations (i.e., the Regulations Governing Interconnection involving Significant Market Power), establish specific interconnection rules for entities with significant market power and other telecommunication enterprises. |
- 53 -
| SASB Standards | Topic | Code | Metrics | Category | Unit of Measurement |
Amount/Description | ||||||
| Potential Risks and Opportunities Risks: • The international Internet transit price continues to decline, reducing the willingness of local ISPs to establish interconnection agreements. • Remote interconnection models have become a new trend at Internet Exchange Points (IXPs). Large international IXPs establish Points-of-Presence (POPs) closer to local ISPs, enabling direct connection to international traffic and bypassing local IXPs, which poses a threat to local ISP interconnection markets. • The New Telecommunications Act continues to regulate wholesale pricing for dominant market players. Declining Internet transit prices year by year affect ISP interconnection revenue. • Internet Data Centers (IDCs) are attracting more content service providers, reducing the demand for ISP interconnection. Opportunities: • Domestic Internet Exchange Points in Taiwan may have insufficient interconnection trust, encouraging content service providers to explore bilateral interconnections with major operators and data centers. • International content service providers strive to reduce network latency and improve user service quality by providing services closer to end-users. If a substantial local aggregation develops, it could increase interconnection demand for local small- and medium-sized ISPs. • For details regarding the Taiwan Internet Exchange (TWIX), please refer to its official website. • Chunghwa Telecom currently does not offer any zero-rating agreements. |
- 54 -
| SASB Standards | Topic | Code | Metrics | Category | Unit of Measurement |
Amount/Description | ||||||
|
● Telecommunication Services |
● Managing Systemic Risks from Technology Disruptions |
TC-TL-550a.1 | (1) System average interruption duration, (2) system average interruption frequency and (3) customer average interruption duration |
Quantitative | Minutes, Quantity |
(1) 8.19 (2) 0.03 (3) 270.39 | ||||||
|
● Telecommunication Services |
● Managing Systemic Risks from Technology Disruptions |
TC-TL-550a.2 | Discussion of systems to provide uninterrupted service during service disruptions |
Discussion and Analysis | Not applicable. |
1. In 2025, a total of four significant network outage incidents occurred: three were caused by careless excavation by road construction units, resulting in damage to critical optical cables, and one was due to the Subscriber Location Function (SLF) going online, which caused database corruption and led to mobile voice service disruptions. Key measures and explanations are as follows: (1) Close communication with road authorities and construction units is maintained, including providing pipeline mapping data and reinforcing line inspections, to ensure existing pipelines are avoided during external excavation, thereby reducing the risk of cable damage. (2) For fixed-line infrastructure with lower resilience (e.g., microwave stations), backup optical cable routes or satellite circuit backups are planned to reduce the risk of service interruption. (3) The SLF malfunction caused service interruptions for 400,000 mobile customers, significantly increasing the metrics for Average System Downtime Duration (minutes) and Average System Interruption Frequency (times). |
- 55 -
| SASB Standards | Topic | Code | Metrics | Category | Unit of Measurement |
Amount/Description | ||||||
|
(4) A fail-safe mechanism has been implemented to prevent service disruptions during SLF synchronization operations. In the event of an SLF malfunction, mobile registration signaling bypasses the SLF and queries user subscription information directly from the Home Subscriber Server (HSS), ensuring uninterrupted service. To strengthen disaster prevention, improve disaster response capabilities, and minimize losses, the Group has established the “Disaster Protection Operation Guidelines.” 2. The Group has also implemented “Emergency Disaster Response and Restoration Procedures” to address major disasters, including natural disasters, fires, explosions, and terrorist attacks, which may severely damage telecommunications network equipment. These procedures ensure emergency communication services in affected areas, minimizing service downtime. In the fixed-line communications segment, to prevent the escalation of disaster-related damage, we have reinforced the deployment of multi-route relay transmission in remote areas, wireless backup routing, expanded standby power capacity, and enhanced redundancy for both international and domestic submarine cable systems. These measures strengthen our overall disaster prevention and resilience capabilities. In addition, we conduct annual network and equipment dispatch and emergency repair drills to improve operational proficiency in disaster response and thereby reduce potential losses. Regarding mobile communications: In the event that disasters cause disruptions to mobile communications, we have equipped 4WD off-road mobile base stations with high-orbit ST-2 or low-orbit OneWeb satellite antennas for signal transmission. These units can be rapidly deployed and set up based on on-site conditions in affected areas, enabling the swift restoration of mobile connectivity to the outside world. |
- 56 -
| SASB Standards | Topic | Code | Metrics | Category | Unit of Measurement |
Amount/Description | ||||||
|
3. For critical transportation corridors with single access points—such as the Suhua Highway, South-Link Highway, and Alishan Highway—we have not only reinforced 4G/5G base station infrastructure and mobile communication multilayer coverage along the routes, but also conduct regular disaster-prevention drills to ensure the stable operation of mobile communication networks. These efforts enhance the disaster resilience and robustness of the mobile network. In the data communications segment, the Group’s HiNet network adopts multi-route architecture with a highly reliable network redundancy mechanism, enabling real-time monitoring and traffic load balancing across all routes. For international routing, traffic is distributed across multiple submarine cable systems to prevent congestion or outages caused by single-route failures. Additionally, we collaborate with overseas carriers to increase direct international interconnection bandwidth, thereby improving the quality and stability of international internet connectivity. | ||||||||||||
|
● Multiline and Specialty Retailers & Distributors |
● Product Sourcing, Packaging & Marketing |
CG-MR-410a.1 | Product Revenue with third-party certified environmental or social sustainability standards | Quantitative | Presentation Currency | NT$ 12.059 billion |
- 57 -
| SASB Standards | Topic | Code | Metrics | Category | Unit of Measurement |
Amount/Description | ||||||
|
● Multiline and Specialty Retailers & Distributors |
● Product Sourcing, Packaging & Marketing |
CG-MR-410a.2 | Discussion of processes to assess and manage risks or hazards associated with chemicals in products | Discussion and Analysis | Not applicable. | The Group is the largest distributor and agent of 3C products in Taiwan, and not a manufacturer of end-products. Nevertheless, we remain committed to minimizing potential health and safety risks to consumers. We assess and manage potential risks through the following measures to ensure that third-party products distributed and sold by our Group are subject to effective controls and adequate disclosure of chemical substances and hazardous materials: During the procurement process, we require suppliers/agents to fulfill their obligation to disclose product information and to provide declarations/certificates regarding the use of chemicals and hazardous substances in the products they represent or supply. Where feasible, suppliers must provide chemical control documentation or verification reports issued by original manufacturers or producers—such as REACH and RoHS certifications—so that our procurement teams can effectively implement chemical-related risk and hazard management. 1. Chemical Management (1) Chemical Usage Scenarios: Currently, the Group primarily uses four types of chemicals in repair operations: isopropyl alcohol (IPA), cleaning agents, DOWSIL™ SE 9160 Adhesive, and EH9777BS. These chemicals are used for cleaning and bonding handheld smart devices. Isopropyl alcohol and cleaning agents: Used for cleaning functions such as fingerprint and ink removal on device casings, full-device cleaning and disinfection, removal of adhesive residues during lamination, cleaning solder flux on motherboards, and removing copper chloride corrosion caused by moisture intrusion. DOWSIL™ SE 9160 Adhesive and EH9777BS: Used for bonding processes, including the lamination of smartphone LCD panels. |
- 58 -
| SASB Standards | Topic | Code | Metrics | Category | Unit of Measurement |
Amount/Description | ||||||
|
(2) Chemical Issuance and Control: • Isopropyl alcohol and cleaning agents: Engineers request chemicals from warehouse custodians as needed during repair operations. The custodian dispenses the required quantity at the warehouse and distributes it to the requester. • DOWSIL™ SE 9160 Adhesive and EH9777BS: Engineers request usage from the designated custodian. Upon verifying the legitimacy of the request, the custodian retrieves the items from controlled storage areas, records the issuance in the logbook, and distributes them to the requester. (3) Operational Management Procedures: As the largest 3C product distributor and agent in Taiwan—and not a manufacturer— the Group manages chemical-related consumer risks by requiring suppliers to provide chemical management/certification documents issued by product manufacturers as part of the procurement process. 2. Enhanced Supplier Communication: Chemical Use Prioritization and Development of Substitutes The Group communicates with suppliers regularly—such as through email—each year to emphasize consumers’ growing expectations for sustainable products. Upholding our green |
- 59 -
| SASB Standards | Topic | Code | Metrics | Category | Unit of Measurement |
Amount/Description | ||||||
|
procurement principles, we encourage suppliers to produce or provide products that do not contain chemicals harmful to human health. We also expect suppliers to adopt eco-design principles during product design and manufacturing, using green chemicals to replace traditional chemical substances that may pose potential health risks. 3. Disclosure of Complete Chemical Formulations for Products Sold For all products we distribute or act as agent for, we require manufacturers and agents to comply with product labeling regulations applicable in the country of manufacture or import, ensuring that product information is clearly disclosed. 4. Chemical Composition Verification (1) The Group does not own any private-label brands; therefore, we do not maintain chemical composition testing mechanisms for in-house products. (2) For third-party branded products, there is currently no mechanism to screen or select products that have obtained third-party chemical composition certifications. However, during procurement, we require suppliers or agents to fulfill their product information disclosure obligations and provide declarations or certificates regarding the use of chemicals and hazardous substances in supplied or represented products. | ||||||||||||
|
● Multiline and Specialty Retailers & Distributors |
● Product Sourcing, Packaging & Marketing |
CG-MR-410a.3 | Discussion of strategies to reduce the environmental impact of packaging | Discussion and Analysis | Not applicable. | To reduce packaging used in warehousing and logistics, the Group utilizes appropriately sized corrugated cartons and environmentally friendly cushioning materials to prevent product damage caused by impact during transportation. |
- 60 -
| SASB Standards | Topic | Code | Metrics | Category | Unit of Measurement |
Amount/Description | ||||||
|
1. Compliance with the Ministry of Environment’s “Entities Subject to Online Shopping Packaging Restrictions and Implementation Methods”: (1) Implementation Requirements for Packaging Material Restrictions: • Packaging materials must not contain polyvinyl chloride (PVC). • The recycled content ratio of corrugated cartons (boxes), paperboard products, and molded pulp packaging used for paper-based packaging boxes (bags) must reach 90% or above. • Plastic packaging boxes (bags) and cushioning materials must contain at least 25% recycled content. (2) Product-to-Packaging Weight Ratio Requirements: • For goods weighing 250 grams to less than 1 kilogram, the packaging weight ratio must be less than 40%. • For goods weighing 1 kilogram to less than 3 kilograms, the packaging weight ratio must be less than 30%. • For goods weighing 3 kilograms or more, the packaging weight ratio must be less than 15%. • Packaging Weight Ratio= [Weight of Online Shopping Packaging Materials ÷ (Weight of Online Shopping Packaging Materials + Total Product Weight)] × 100%. 2. Implementation Measures: (1) No PVC-containing packaging materials are used; current materials include OPP (adhesive tape) and HDPE (cushioning materials for inner cartons). (2) The recycled content ratio of corrugated cartons (boxes), paperboard products, and molded pulp used in paper-based packaging boxes (bags) has reached 95% or above. |
- 61 -
| SASB Standards | Topic | Code | Metrics | Category | Unit of Measurement |
Amount/Description | ||||||
|
(3) Cushioning materials contain 30% recycled content and are certified under the Global Recycled Standard (GRS). (4) Conduct statistical analysis of packaging weight ratio data and produce corresponding reports. Performance and Outcomes: (1) Recognized by the Ministry of Environment as a certified Online Shopping Packaging Reduction Label enterprise. (A total of 22 B2C platforms in Taiwan have obtained this certification.) (2) All current packaging materials used by the Group exceed the government’s regulatory requirements. (3) Reduced waste generated from logistics packaging, thereby mitigating environmental impacts and resource consumption. | ||||||||||||
|
● Software and Information Services |
● Environmental Footprint of Hardware Infrastructure |
TC-SI-130a.3 | Discussion on integrating environmental considerations into strategic planning for data center requirements | Discussion and Analysis | Not applicable. | The Group continues to enhance energy efficiency by implementing intelligent energy management systems, developing cloud computing technologies, and optimizing energy-saving equipment and electricity usage practices. In addition, when planning for equipment replacement or new procurement, priority is given to products with energy-efficient designs. Examples include high sensible-heat EC fan constant-temperature and humidity control units, the installation of chilled water flow energy-saving control systems on chillers, the replacement of cooling water pumps with variable-frequency drive (VFD) systems, and the establishment of an energy monitoring system to manage data center airflow efficiency (cold and hot aisle configuration) and other energy-saving measures. |
- 62 -
| SASB Standards | Topic | Code | Metrics | Category | Unit of Measurement |
Amount/Description | ||||||
|
● Software and Information Services |
● Data Privacy & Freedom of Expression |
TC-SI-220a.5 | List of countries where core products or services are subject to government-mandated oversight, restrictions, content filtering, or censorship | Discussion and Analysis | Not applicable. | Currently not subject to government-mandated monitoring. | ||||||
|
● Software and Information Services |
● Recruitment and Managing a Global, Diverse, and Skilled Workforce |
TC-SI-330a.2 | Employee engagement as a percentage | Quantitative | Percentage (%) | 81.43% | ||||||
|
● Software and Information Services |
● Recruitment and Managing a Global, Diverse, and Skilled Workforce |
TC-SI-330a.3 | Percentage of: (1) gender and (2) diversity group representation for (a) executive management, (b) non-executive management, (c) technical employees, and (d) all other employees |
Quantitative | Percentage (%) | For employee headcount and percentages, please refer to Table 5-2-2: Recruitment and Management of a Global, Diverse, and Skilled Workforce in page 68. | ||||||
|
● Semiconductors |
● GHG emissions |
TC-SC-110a.1 | (1) Total global scope 1 emissions, and (2) total emissions from perfluorinated compounds (PFCs) |
Quantitative | Metric tonness (t) CO₂-e | (1) 1,571.06 (2) 1050.20 | ||||||
|
● Semiconductors |
● GHG emissions |
TC-SC-110a.2 | Discussion on long-term and short-term | Discussion and Analysis | Not applicable. | For subsidiaries applicable to the semiconductor industry, the base year is 2022, and they are committed to achieving a target of zero growth in GHG emissions by 2027. |
- 63 -
| SASB Standards | Topic | Code | Metrics | Category | Unit of Measurement |
Amount/Description | ||||||
| strategies or plan to manage scope 1 emissions, emission reduction targets, and performance analysis against those targets |
• Scope 1 and Scope 2 carbon emissions in 2030 are projected to decrease by 8–15% compared with the base year. | |||||||||||
|
● Semiconductors |
● Waste Management |
TC-SC-150a.1 | (1) Amount of hazardous waste from manufacturing, (2) percentage recycled |
Quantitative | metric tonnes (t), Percentage (%) |
(1) 457.18 (2) 98.81% | ||||||
|
● Semiconductors |
● Product Lifecycle Management |
TC-SC-410a.1 | Percentage of product by revenue that contain IEC 62474 declarable substances | Quantitative | Percentage (%) | Not applicable. The Group does not report products under IEC 62474 | ||||||
|
● Semiconductors |
● Product Lifecycle Management |
TC-SC-410a.2 | Processor energy efficiency at a system-level for: (1) servers, (2) desktops, and (3) laptop |
Quantitative | Varies by Product Category | The Group does not manufacture servers, desktop computers, or laptop computers; therefore, this metric is not applicable to the Group’s products. | ||||||
|
● Semiconductors |
● Materials Sourcing |
TC-SC-440a.1 | Description of the management of risks associated with the use of critical materials | Discussion and Analysis | Not applicable. | Supplier Risk Identification: The Group conducts annual risk assessments of raw material suppliers to determine their risk levels. In 2025, a total of 26 suppliers underwent risk identification (4 key suppliers and 22 important suppliers), with evaluation criteria including quality, delivery performance, information security, and sustainability factors. Based on the risk assessment mechanism, certain supplier products were identified as requiring enhanced management. In accordance with the supplier risk assessment and rolling management principles, a Second Source mechanism was activated to ensure timely adjustment of supply allocations, thereby maintaining operational and quality stability. |
- 64 -
| SASB Standards | Topic | Code | Metrics | Category | Unit of Measurement |
Amount/Description | ||||||
|
In 2025, all products supplied to customers by the Group were confirmed to be conflict-free metal products. During the manufacturing process, 29 raw materials containing gold, tin, tantalum, and cobalt were used. The Group conducted inquiries and surveys with the suppliers of these raw materials. All suppliers completed the CMRT to verify that the gold, tin, tantalum, and cobalt contained in the materials used for production originated from RMAP-audited conflict-free smelters/refiners. In 2025, no suppliers were found to be in violation or disqualified.
Prohibited Substances: The Group promotes halogen-free raw materials for customer selection. Due to product requirements, some materials containing restricted substances are still used; however, in alignment with increasing environmental awareness and global sustainability trends, the Group actively develops and researches raw materials free of restricted substances. The Group has implemented an SCM Supplier Master Data Platform. When a new supplier is added, the procurement unit manages hazardous substances under RoHS and Halogen-Free (HF) requirements for direct raw materials, requiring suppliers to submit relevant test reports prior to ordering. The Group verifies report contents and validity, and green product test reports are incorporated into the supplier master data system for ongoing management. |
- 65 -
| SASB Standards | Topic | Code | Metrics | Category | Unit of Measurement |
Amount/Description | ||||||
|
● Telecommunication Services |
● Activity Metrics |
TC-TL-000.A TC-TL-000.B TC-TL-000.C TC-TL-000.D |
(1) Number of wireless subscribers (2) Number of wireline subscribers (3) Number of broadband subscribers (4) Network traffic |
Quantitative | (1) Number (10,000 subscribers) (2) Number (10,000 subscribers) (3) Number (10,000 subscribers) (4) Terabyte (TB) |
(1) 1123.9 (2) 1,064.5 (Local network: 863.4; MOD: 201.1) (3) 824.1 (Broadband access: 444.9: Internet: 379.2) (4) (a) This information is confidential and cannot be disclosed. (b) Regarding network traffic data reported to the National Communications Commission (NCC), such as quarterly mobile internet traffic, fixed-network operator connection bandwidth and peak traffic volume, and annual fixed broadband internet traffic, all are considered trade secrets and cannot be provided. (c) For interconnection traffic statistics, please refer to the Internet Exchange Center statistics published by the National Communications Commission. | ||||||
|
● Multiline and Specialty Retailers & Distributors |
● Activity Metrics |
CG-MR-000.A | (1) Number of retail locations, and (2) Number of distribution centers |
Quantitative | Number Square meters (m2) |
(1) 817 (2) 4 | ||||||
| CG-MR-000.B | (1) Total area of retail spaces, and (2) Total area of distribution centers |
(1) 96,488.96 (2) 9,897.54 | ||||||||||
|
● Software & IT Services |
● Activity Metrics |
TC-SI-000.A | (1) Number of licensed or subscribed users, and (2) Percentage cloud-based |
Quantitative | (1) Quantity (2) Percentage (%) |
For sales volume and sales value of software and information technology services, please refer to Table 5-2-3: Software & IT Services – Activity Indicators in page 68. | ||||||
| TC-SI-000.B | (1) Data processing capacity, and (2) Percentage outsourced |
(1) Sales Volume (2) Percentage (%) |
- 66 -
| SASB Standards | Topic | Code | Metrics | Category | Unit of Measurement |
Amount/Description | ||||||
| TC-SI-000.C | (1) Data storage volume, and (2) Percentage outsourced |
(1) Terabyte (TB) (2) Percentage (%) |
||||||||||
|
● Semiconductors |
● Activity Metrics |
TC-SC-000.A TC-SC-000.B |
Total production Percentage of production from owned facilities | Quantitative | Production Volume Percentage (%) |
All sold products are manufactured at owned facilities (100%). For related production capacity and output, please refer to Table 5-2-4: Semiconductor – Activity Indicators in page 69. |
Note 1: For certain metrics, due to data availability limitations, some activity data could not be obtained. Reasonably obtainable and supportable information as of the reporting date (including, where necessary, data from prior periods) was used for measurement and disclosure.
|
Table 5-2-1 Telecommunication Services – Average Actual Download Speed
| ||||
|
1. Fixed Network and Data Communications – 2025 Measured Line Speeds for ADSL Broadband Installations and HiNet Internet Data Rates (Measured Monthy)
| ||||
| Internet Speed: bps (Download / Upload) | Line Rate: bps (Download / Upload) – 80% of Customer-Measured Values | Data Rate: bps (Download / Upload) – 80% of Customer-Measured Values (Measured Using Technicians’ Computers) | ||
| 2M/64K | 2.165~2.154M/80.000~78.000K | 2.009~1.575M/73.000~63.000K | ||
|
2. Fixed Network and Data Communications – 2025 Measured Line Speeds for FTTx Broadband Installations and HiNet Internet Data Rates (Measured Monthly)
| ||||
| Internet Speed: bps (Download / Upload) | Line Rate: bps (Download / Upload) – 80% of Customer-Measured Values | Data Rate: bps (Download / Upload) – 80% of Customer-Measured Values (Measured Using Technicians’ Computers) | ||
| 16M/3M | 17.145~17.008M/ 3.484~3.165M | 16.259~14.680M/ 3.212~2.632M | ||
| 35M/6M | 37.759~37.205M/ 6.969~6.330M | 35.690~32.195M/ 6.522~5.677M | ||
| 100M/40M | 116.930~100.035M/ 47.348~42.066M | 110.569~93.188M/ 45.613~39.952M | ||
| 300M/300M | 334.845~334.845M/ 332.325~332.325M | 316.004~299.470M/ 318.546~310.164M | ||
| 500M/500M | 558.075~558.075M/ 553.875~553.875M | 527.362~507.552M/ 530.261~518.340M | ||
| 1G/1G | 1000.000~1000.000M/ 1000.000~1000.000M | 948.166~894.032M/ 949.766~884.115M | ||
| 2G/1G | 2304.970~2304.970M/ 2295.000~2295.000M | 2194.060~2109.400M/ 2167.060~2161.650M | ||
|
3. Mobile Communications (Please refer to the official website)
| ||||
- 67 -
|
Table 5-2-2 Recruitment and Management of a Global, Diverse, and Skilled Workforce
| ||||||
| Unit: Number of Employees | Number of Employees | Percentage | ||||
| Total Employees | 1,826 | 100% | ||||
| Senior Management | Male | 66 | 3.61% | |||
| Female | 11 | 0.60 | ||||
| Not disclosed. | - | 0.00% | ||||
| Non-Senior Management | Male | 69 | 3.78% | |||
| Female | 26 | 1.42% | ||||
| Not disclosed. | - | 0.00% | ||||
| Technical Personnel | Male | 789 | 43.21% | |||
| Female | 330 | 18.07% | ||||
| Not disclosed. | - | 0.00% | ||||
| All Other Employees | Male | 158 | 8.65% | |||
| Female | 377 | 20.65% | ||||
| Not disclosed. | - | 0.00% | ||||
| Senior Management | Diverse Groups | - | 0.00% | |||
| Non-Senior Management | Diverse Groups | 3 | 0.16% | |||
| Technical Personnel | Diverse Groups | 13 | 0.71% | |||
| All Other Employees | Diverse Groups | 16 | 0.88% | |||
|
Table 5-2-3 Software & IT Services–Activity Indicators
| ||||
| Sales Volume/Key Products | Sales Volume | Sales Value | ||
| IDC Data Center Services (Ping) | 5,325 | 1,776,356 | ||
| Data Network Services (Mbps) | 1,408,253 | 1,470,353 | ||
| Voice Communication Services (Minutes) | 22,520,788 | 48,929 | ||
- 68 -
|
Table 5-2-3 Software & IT Services–Activity Indicators
| ||||
| Cloud Application Services (G) | 2,629 | 648,027 | ||
| Number of licenses or subscriptions | 26,375 | - | ||
| Total | N/A | 3,943,665 | ||
| Number of licenses or subscriptions; percentage based on cloud infrastructure | 93.58% | |||
| Data processing capacity; percentage outsourced | 0.00% | |||
| Number of licenses or subscriptions; percentage outsourced | 0.00% | |||
|
Table 5-2-4 Semiconductor – Activity Indicators
| ||||
| Product | Production Capacity | Production Volume | ||
| Wafer Test Card | 24,049 | 25,143 | ||
| IC Test Board | 6,873 | 3,382 | ||
| 30,922 | 28,525 | |||
- 69 -