UNITED STATES
SECURITIES AND EXCHANGE COMMISSION
WASHINGTON, DC 20549
FORM 6-K
REPORT OF FOREIGN PRIVATE ISSUER
PURSUANT TO RULE 13a-16 OR 15d-16 OF THE
SECURITIES EXCHANGE ACT OF 1934
For the month of February 2026
Commission File Number 1-15200
Equinor ASA
(Translation of registrant’s name into English)
FORUSBEEN 50 NO-4035, STAVANGER, Norway
(Address of principal executive offices)
Indicate by check mark whether the registrant files or will file annual reports under cover of Form 20-F or Form 40-F:
Form 20-F X Form 40-F
This Report on Form 6-K contains a report of the fourth quarter 2025 results of Equinor ASA.

2025
Fourth quarter
Financial statements and review


Equinor fourth quarter 2025
2 | Press release | FOURTH QUARTER 2025 REVIEW |
Key figures
Operational | |
2,198 | |
MBOE/D | |
Equity oil & gas production per day | |
1.76 | |
TWh | |
Total power generation, Equinor share | |
1.18 | |
TWh | |
Renewable power generation, Equinor share |
Financial | ||
5.49 | 6.20 | |
USD BILLION | USD BILLION | |
Net operating income | Adjusted operating income* | |
3.31 | 0.81 | |
USD BILLION | USD | |
Cash flow from operations after taxes paid* | Adjusted earnings per share* | |
0.39 | 5 | |
USD PER SHARE | USD BILLION | |
Announced cash dividend per share | Share buy-back programme for 2025 | |
Sustainability |
0.21 |
SIF |
Serious incident frequency (per million hours worked) |
6.3 |
KG / BOE |
CO₂ upstream intensity. Scope 1 CO₂ emissions, Equinor operated, 100% basis for the full year of 2025 |
10.2 |
MILLION TONNES CO2e |
Absolute scope 1+2 GHG emissions for the full year of 2025 |
Always safe
High value
Low carbon
1 Adjusted operating and administrative expenses* excluding royalties and transportation costs, over/underlift and a few selected one-offs. Including portfolio changes, equity accounting effects, and excluding held for sale assets.
Equinor fourth quarter 2025
3 | Press release | FOURTH QUARTER 2025 REVIEW |
Equinor fourth quarter and full year 2025 results
Equinor delivered an adjusted operating income* of USD 6.20 billion and USD 1.55 billion after tax* in the fourth quarter of 2025. Equinor reported a net operating
income of USD 5.49 billion and a net income of USD 1.31 billion. Adjusted net income* was USD 2.04 billion, leading to adjusted earnings per share* of USD 0.81.
The fourth quarter and full year were characterised by:
•Strong production and operational performance, delivering 6%
production growth in the quarter and 3.4% for the full year
•Continued high-grading of portfolio
•Cost and capital discipline
Taking action to strengthen competitiveness, cash flow and
robustness
•Strategic priorities guiding capital allocation
◦Develop the NCS to maximise value
◦Focused growth in international oil and gas
◦Building an integrated power business
•Strengthening free cash flow* by reducing the organic capital
expenditures* outlook for 2026/27 by USD 4 billion
•Reducing operating costs1 by 10% in 2026 through strong cost focus
and portfolio high-grading
•Expecting around 3% oil and gas production growth in 2026
•Set to deliver return on average capital employed* of around 13% for
2026/27
Capital distribution
•Proposed increase of fourth quarter cash dividend to USD 0.39 per
share
•Announced share buy-back of up to USD 1.5 billion for 2026
Anders Opedal, President and CEO of Equinor ASA:

“With new fields on stream and strong operations, we deliver record-high
production and competitive returns in 2025.”
“We continue to allocate capital to further develop and maximise value
from the Norwegian continental shelf. At the same time, we are delivering
focused growth in our international oil and gas portfolio and building our
integrated power business, now focusing on the execution of
already‑sanctioned projects.”
“In 2026, we expect around 3 percent production growth, up from record
levels in 2025. We are taking firm actions to strengthen free cash flow,
remain robust towards lower prices and maintain competitive capital
distribution.”
Anders Opedal

Equinor fourth quarter 2025
4 | Press release | FOURTH QUARTER 2025 REVIEW |
Financial information | Quarters | Change | Full year | ||||
(unaudited, in USD million) | Q4 2025 | Q3 2025 | Q4 2024 | Q4 on Q4 | 2025 | 2024 | Change |
Net operating income/(loss) | 5,487 | 5,270 | 8,735 | (37)% | 25,352 | 30,927 | (18)% |
Net income/(loss) | 1,314 | (204) | 1,999 | (34)% | 5,058 | 8,829 | (43)% |
Basic earnings per share (USD) | 0.52 | (0.08) | 0.73 | (28)% | 1.94 | 3.12 | (38)% |
Adjusted operating income* | 6,196 | 6,215 | 7,896 | (22)% | 27,591 | 29,798 | (7)% |
Adjusted net income* | 2,042 | 932 | 1,733 | 18% | 6,434 | 9,177 | (30)% |
Adjusted earnings per share* (USD) | 0.81 | 0.37 | 0.63 | 29% | 2.47 | 3.24 | (24)% |
Cash flows provided by operating activities1) | 2,107 | 6,346 | 2,022 | 4% | 19,971 | 19,465 | 3% |
Cash flow from operations after taxes paid1)* | 3,314 | 5,334 | 3,508 | (6)% | 17,980 | 17,246 | 4% |
Net cash flow before capital distribution1)* | 245 | 2,085 | (2,555) | N/A | 5,587 | 1,739 | >100% |
Operational information | |||||||
Group average liquids price (USD/bbl) [1] | 58.6 | 64.9 | 68.5 | (14)% | 64.2 | 74.1 | (13)% |
Total equity liquids and gas production (mboe per day) [3] | 2,198 | 2,130 | 2,072 | 6% | 2,137 | 2,067 | 3% |
Total power generation (TWh) Equinor share | 1.76 | 1.37 | 1.43 | 23% | 5.65 | 4.92 | 15% |
Renewable power generation (TWh) Equinor share | 1.18 | 0.91 | 0.83 | 42% | 3.67 | 2.93 | 25% |
* For items marked with an asterisk throughout this report, see Use and reconciliation of non-GAAP financial measures in the Supplementary disclosures. 1) Previously reported numbers for 2024 have been restated due to a change in accounting policy. For more information see note 1 Organisation and basis of preparation. [ ] For items marked with numbers within brackets, see End notes in the Supplementary disclosures. | |||||||
Adjusted operating income* | E&P equity liquids and gas production | Total power generation Equinor share | |
Key figures by segment | (USD million) | (mboe/day) | (TWh) |
E&P Norway | 5,026 | 1,468 | 0.04 |
E&P International | 214 | 289 | |
E&P USA | 359 | 441 | |
MMP | 678 | 0.59 | |
REN | (26) | 1.14 | |
Other incl. eliminations | (54) | ||
Equinor Group Q4 2025 | 6,196 | 2,198 | 1.76 |
Equinor Group Q4 2024 | 7,896 | 2,072 | 1.43 |
Equinor Group full year 2025 | 27,591 | 2,137 | 5.65 |
Equinor Group full year 2024 | 29,798 | 2,067 | 4.92 |
Net debt to capital employed adjusted* | 31 December 2025 | 31 December 2024 | %-point change |
Net debt to capital employed adjusted* | 17.8% | 11.9% | 5.9% |
Dividend (USD per share) | Q4 2025 | Q3 2025 | Q4 2024 |
Ordinary cash dividend per share | 0.39 | 0.37 | 0.37 |
In 2025, Equinor acquired and settled shares in the market under the 2024 and 2025 share buy-back programmes for USD 5,916 million, and redeemed and settled shares owned by the Norwegian state (proportionate share of the second, third and fourth tranche of the 2024 programme and the first tranche of the 2025 programme) for a total amount of USD 4,260 million. | |||
Equinor fourth quarter 2025
5 | Press release | FOURTH QUARTER 2025 REVIEW |
Strong production
Equinor had high production in the fourth quarter,
with a total equity production of 2,198 mboe per day,
up 6% from 2,072 mboe per day in the same quarter
last year. For the full year, the production reached a
record high of 2,137 mboe per day, a 3.4% increase
from the year before.
On the Norwegian continental shelf (NCS), the
production in the quarter was high with a 5%
increase compared to the same quarter in 2024.
New fields, such as Johan Castberg and Halten
East, delivered substantial contributions, along with
new wells. This offset impact from unplanned
maintenance at Johan Castberg. For the full year,
production was up by 2% in 2025 compared to 2024.
The acquisition of additional interests in US onshore
gas assets in late 2024 and new wells on stream,
resulted in strong production from the E&P USA
segment in the fourth quarter and full year of 2025,
compared to the year before.
The exits from Nigeria and Azerbaijan in 2024, along
with a production stop and sale of a 40% operated
interest in the Peregrino field in Brazil in the fourth
quarter of 2025, resulted in lower production in E&P
International in the quarter and full year of 2025.
Production from new wells in Argentina and Angola
contributed positively to the results. Other important
contributions were the establishment of the Adura
joint venture with Shell in the UK and the Bacalhau
field in Brazil coming on stream.
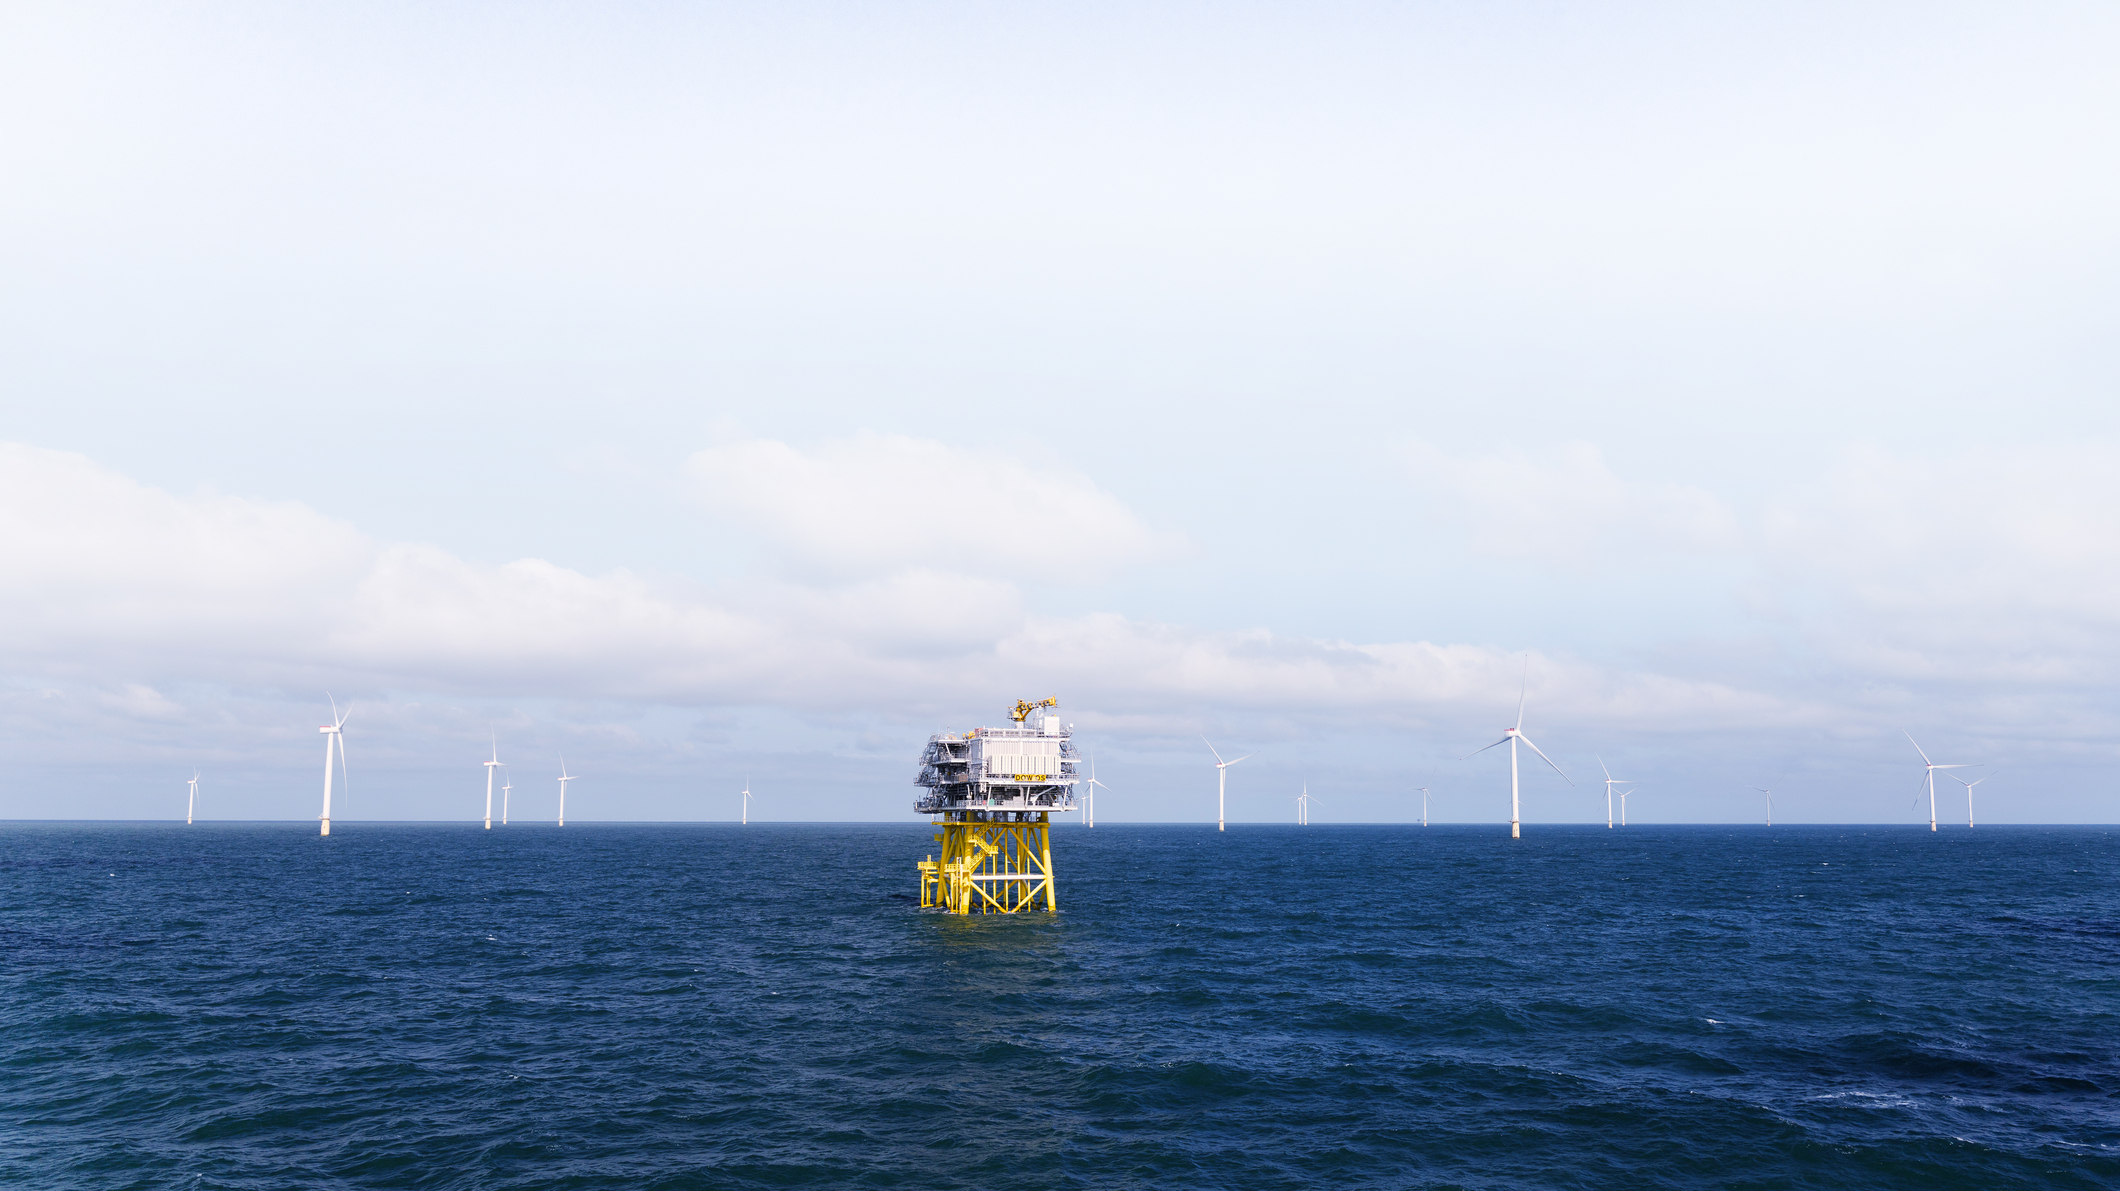
The total power generation was 1.76 TWh in the
quarter and 5.65 TWh for the full year. The
renewable portfolio drove the increase through
ramp-up of production from the offshore wind farm
Dogger Bank A and higher onshore production. This
led to a 42% increase in renewable generation for
the fourth quarter and a 25% increase for the full
year, compared to 2024.
Financial results
Equinor realised a European gas price of USD 10.6
per mmbtu and realised liquids prices were USD
58.6 per bbl in the fourth quarter of 2025.
Equinor delivered an adjusted operating income* of
USD 6.20 billion and USD 1.55 billion after tax* in
the fourth quarter. The results are affected by lower
liquids prices, which were partially offset by higher
production and higher gas prices in the US.
The reported net operating income of USD 5.49
billion is down from USD 8.74 billion in the same
quarter last year. This was impacted by net
impairments of USD 626 million in REN, E&P
International and E&P Norway. Net impairments for
the full year of 2025 amounted to USD 2,481 million,
mainly impacted by reduced expected synergies
from future offshore wind projects in the US and
updated price assumptions.
The Marketing, Midstream and Processing results
were strong, driven by gas trading and optimisation,
and a favourable price review result.
Adjusted operating and administrative expenses* are
higher compared to the same quarter last year. This
is mainly due to higher transportation costs driven by
market conditions and currency effects. This was
partially offset by a reduction in the Gassled removal
obligation and cost improvements in the renewable
segment.
High production generated cash flows provided by
operating activities, before taxes paid and working
capital items, of USD 9.55 billion for the fourth
quarter.
Equinor paid three NCS tax instalments totalling
USD 5.96 billion in the quarter.
Cash flow from operations after taxes paid* ended at
USD 3.31 billion for the fourth quarter, bringing the
cash flow from operations after taxes paid* to USD
18.0 billion for the year.
Organic capital expenditure* was USD 3.29 billion
for the quarter and USD 13.1 billion for the full year.
The net debt to capital employed adjusted ratio* was
17.8% at the end of the fourth quarter, compared to
12.2% at the end of the third quarter of 2025.
Strategic progress
Equinor continued to develop the portfolio and
deliver on its strategy in the quarter.
On the NCS, production started from the Verdande
subsea field in the Norwegian Sea, adding volumes
to and extending the field life of Norne beyond 2030.
2025 was a successful exploration year with 14
commercial discoveries on the NCS, of which seven
were Equinor-operated. Three commercial
discoveries were made during the quarter,
contributing with volumes to meet the ambition of
maintaining the production level from 2020 in 2035.
The international portfolio was significantly
strengthened with the production start at Bacalhau,
off the coast of Brazil, adding future production and
cash flow. The operatorship of the Peregrino field
was transferred to PRIO in the quarter.
Equinor and Shell officially launched Adura, which is
expected to play a crucial role in securing the UK’s
energy supply. Adura is fully self-funded and aims to
distribute more than 50% of cash flow from
operations from 2026.
A 10-year gas sale agreement was signed with gas
and electricity company Pražská plynárenská,
securing Norwegian gas to the Czech Republic until
2035.
The new business area Power was established in
fourth quarter of 2025, integrating renewables with
flexible power assets. Power is a reportable segment
effective from 1 January 2026.
Equinor’s first hybrid power complex, combining
solar and wind resources, was launched in Brazil. In
Texas, US, Equinor’s first commercial battery
storage system came online in the quarter.
At the end of the quarter, the Empire Wind project in
the US received a second stop work order.
Operations were resumed in January, following the
grant of a preliminary injunction. Project execution is
strong and the project is now over 60% complete.
The three-year average reserves replacement ratio
(RRR) 2023-2025 was 100%, including both organic
and inorganic replacements.
Equinor’s absolute scope 1 and 2 GHG emissions
from operated production (100% basis) were 10.2
million tonnes CO₂e in 2025, a 33% reduction from
2015.
The positive twelve-month average serious incident
frequency (SIF) trend continues, and was 0.21 in
2025, compared to 0.3 in 2024.
Health, safety and the environment | Twelve months average per Q4 2025 | Full year 2024 |
Serious incident frequency (SIF) | 0.21 | 0.3 |
Full year 2025 | Full year 2024 | |
Upstream CO₂ intensity (kg CO₂/boe) | 6.3 | 6.2 |
Full year 2025 | Full year 2024 | |
Absolute scope 1+2 GHG emissions (million tonnes CO₂e) | 10.2 | 11.0 |
Equinor fourth quarter 2025
6 | Press release | FOURTH QUARTER 2025 REVIEW |
Competitive capital distribution
The board of directors proposes to the annual general
meeting in 2026 a cash dividend of USD 0.39 per share for
the fourth quarter of 2025. This is an increase of USD 0.02
per share from the third quarter of 2025 and in line with the
previously announced ambition. The Equinor share will
trade ex-dividend on Oslo Børs from and including 13 May
and New York Stock Exchange from and including 15 May
2026.
The interim cash dividends for the first, second and third
quarters of 2026 are expected to be at the same level as
for the fourth quarter of 2025. This is to be decided by the
board of directors on a quarterly basis and in line with the
company's dividend policy, subject to existing and
renewed authorisation from the annual general meeting.
The fourth tranche of the share buy-back programme for
2025 was completed on 29 January 2026 with a total value
of USD 1,266 million. Following this, the total share buy-
backs under the share buy-back programme for 2025
amounts to USD 5 billion.
The board of directors has decided to announce share
buy-back for 2026 of up to USD 1.5 billion. The 2026 share
buy-back programme will be subject to market outlook and
balance sheet strength. The first tranche of up to USD 375
million of the 2026 share buy-back programme will
commence on 5 February and end no later than 30 March
2026. Commencement of new share buy-back tranches
after the first tranche will be decided by the board of
directors on a quarterly basis in line with the company's
dividend policy. It will be subject to existing and new board
authorisations for share buy-back from the company's
annual general meeting and agreement with the
Norwegian State regarding share buy-back.
All share buy-back amounts include shares to be
redeemed by the Norwegian state.
2 All forward looking financial numbers are based on Brent blend 65 USD/bbl, European gas price 9 USD/MMBtu and Henry Hub 3.5 USD/MMBtu.
3 Adjusted operating and administrative expenses* excluding royalties and transportation costs, over/underlift and a few selected one-offs. Including portfolio changes, equity accounting effects, and excluding held for sale assets.
4 USD/NOK exchange rate assumption of 10.
Equinor fourth quarter 2025
7 | Press release | FOURTH QUARTER 2025 REVIEW |
Strengthening competitiveness, cash flow and
robustness
Key messages:
•Strategic priorities guiding capital allocation
Equinor will continue to develop the NCS to
maximise value and aims to maintain the production
level from 2020 in 2035. Focused growth from the
high-graded international oil and gas portfolio is
expected to deliver strong production and cash flow
growth2. In building the integrated power business,
Equinor will be disciplined in execution and capital
allocation. Trading provides value uplift across
businesses.
•Firm actions to strengthen free cash flow*
Equinor has taken firm actions to strengthen cash
flow and robustness towards lower prices. The
organic capex* outlook for 2026 and 2027 is reduced
by USD 4 billion, mainly within power and low
carbon. Cost improvement efforts continue with an
aim to reduce operating cost3 with 10% in 2026,
including the effects from portfolio high-grading. The
investments of around USD 10 billion annually to oil
and gas will be maintained. Reflecting changing
markets and fewer value creating opportunities, the
net carbon intensity ambition for 2030 and 2035 is
updated to 5-15% and 15-30% respectively.
•Delivering production growth
A production growth of around 3% is expected for oil
and gas in 2026. Equinor has added attractive
exploration acreage in Norway, Brazil and Angola,
and around 30 exploration wells are planned for
2026. A reduction to USD 6 per boe unit production
cost is aimed for in 2026. Equinor will continue the
efforts to deliver a carbon efficient portfolio, and had
a CO₂ upstream intensity of 6.3 kg/boe for Equinor
operated assets in 2025.
Updated outlook for 2026:
•Organic capital expenditures* are estimated at
around USD 13 billion for 20264.
•Oil & gas production for 2026 is estimated to
grow around 3% compared to 2025 level.
This press release contains Forward Looking
Statements. Please see the Forward Looking
Statement disclaimer published on Equinor.com/
investors/4q2025-forward-looking-statements.

Equinor fourth quarter 2025
9 | Group review | FOURTH QUARTER 2025 REVIEW |
Group review
Operational information | Quarters | Change | Full year | ||||
Q4 2025 | Q3 2025 | Q4 2024 | Q4 on Q4 | 2025 | 2024 | Change | |
Total equity liquid and gas production (mboe/day) | 2,198 | 2,130 | 2,072 | 6% | 2,137 | 2,067 | 3% |
Total entitlement liquid and gas production (mboe/day) | 2,093 | 2,005 | 1,953 | 7% | 2,019 | 1,942 | 4% |
Total Power generation (TWh) Equinor share | 1.76 | 1.37 | 1.43 | 23% | 5.65 | 4.92 | 15% |
Renewable power generation (TWh) Equinor share | 1.18 | 0.91 | 0.83 | 42% | 3.67 | 2.93 | 25% |
Average Brent oil price (USD/bbl) | 63.7 | 69.1 | 74.7 | (15)% | 69.1 | 80.8 | (14)% |
Group average liquids price (USD/bbl) [1] | 58.6 | 64.9 | 68.5 | (14)% | 64.2 | 74.1 | (13)% |
E&P Norway average internal gas price (USD/ mmbtu) | 9.02 | 9.98 | 12.05 | (25)% | 10.70 | 9.47 | 13% |
E&P USA average internal gas price (USD/mmbtu) | 2.84 | 2.01 | 2.22 | 28% | 2.60 | 1.70 | 53% |
Financial information | Quarters | Change | Full year | ||||
(unaudited, in USD million) | Q4 2025 | Q3 2025 | Q4 2024 | Q4 on Q4 | 2025 | 2024 | Change |
Total revenues and other income | 25,346 | 26,049 | 27,654 | (8)% | 106,462 | 103,774 | 3% |
Total operating expenses | (19,860) | (20,779) | (18,919) | 5% | (81,109) | (72,846) | 11% |
Net operating income/(loss) | 5,487 | 5,270 | 8,735 | (37)% | 25,352 | 30,927 | (18)% |
Net financial items | 283 | (604) | (548) | N/A | (265) | 58 | N/A |
Income tax | (4,456) | (4,870) | (6,188) | (28)% | (20,030) | (22,157) | (10)% |
Net income/(loss) | 1,314 | (204) | 1,999 | (34)% | 5,058 | 8,829 | (43)% |
Adjusted total revenues and other income* | 25,260 | 26,063 | 26,418 | (4)% | 106,036 | 102,262 | 4% |
Adjusted purchases* [4] | (13,145) | (13,826) | (12,782) | 3% | (55,326) | (50,024) | 11% |
Adjusted operating and administrative expenses* | (2,969) | (3,263) | (2,784) | 7% | (12,469) | (11,491) | 9% |
Adjusted depreciation, amortisation and net impairments* | (2,663) | (2,543) | (2,612) | 2% | (9,837) | (9,765) | 1% |
Adjusted exploration expenses* | (287) | (216) | (343) | (16)% | (813) | (1,185) | (31)% |
Adjusted operating income/(loss)* | 6,196 | 6,215 | 7,896 | (22)% | 27,591 | 29,798 | (7)% |
Adjusted net financial items* | 167 | (628) | (442) | N/A | (798) | 192 | N/A |
Income tax less tax effect on adjusting items | (4,320) | (4,655) | (5,721) | (24)% | (20,360) | (20,813) | (2)% |
Adjusted net income* | 2,042 | 932 | 1,733 | 18% | 6,434 | 9,177 | (30)% |
Basic earnings per share (in USD) | 0.52 | (0.08) | 0.73 | (28)% | 1.94 | 3.12 | (38)% |
Adjusted earnings per share* (in USD) | 0.81 | 0.37 | 0.63 | 29% | 2.47 | 3.24 | (24)% |
Capital expenditures and Investments | 4,146 | 3,420 | 3,646 | 14% | 13,994 | 12,177 | 15% |
Cash flows provided by operating activities1) | 2,107 | 6,346 | 2,022 | 4% | 19,971 | 19,465 | 3% |
Cash flows from operations after taxes paid1)* | 3,314 | 5,334 | 3,508 | (6)% | 17,980 | 17,246 | 4% |
1) Previously reported numbers for 2024 have been restated due to a change in accounting policy. For more information see note 1 Organisation and basis of preparation. | |||||||
Operations and financial results
Equinor delivered strong production in the fourth
quarter, driven by significant contributions from the
NCS and the US upstream portfolio, while lower
liquids prices continued to temper financial results.
In E&P Norway, the new Johan Castberg and Halten
East fields drove increased production for the fourth
quarter and full year of 2025. Production increased
by 5% compared to the same quarter last year,
despite natural decline on the NCS and unplanned
maintenance at Johan Castberg, which operated at
restricted levels for 25 days. New wells supported
full-year production, with natural decline across
several fields limiting the overall increase.
Portfolio changes in the international upstream
business during 2024 and 2025 continued to
influence production levels. The acquisition of
additional interests in US onshore assets in
December 2024 increased E&P USA production for
the fourth quarter and full year of 2025, supported by
new offshore wells.
In E&P International, the divestments of interests in
Nigeria and Azerbaijan late in the fourth quarter of
2024 resulted in lower production volumes for the
quarter and full year of 2025. The closing of the sale
of the 40% operated interest in Peregrino in
November 2025 further reduced production. These
decreases were partially offset by new wells brought
on stream and contributions from Adura, a new joint
venture with Shell. In December 2025, Equinor
completed the divestment of its offshore UK assets
and received a 50% ownership interest in Adura. The
transaction contributed to higher net production,
reflecting the asset mix of the portfolio transferred by
the partners to the joint venture.
The renewables portfolio drove the increase in total
power generation for 2025. The ongoing ramp-up of
Dogger Bank A and the onshore acquisition in
Equinor fourth quarter 2025
10 | Group review | FOURTH QUARTER 2025 REVIEW |
Sweden in March 2025 led to a 42% increase in
renewable power generation for the fourth quarter
and a 25% increase for the full year, compared to the
same periods last year.
In the fourth quarter, Marketing, Midstream and
Processing segment results were primarily driven by
Gas and Power through optimisation of piped gas
trading in Europe and LNG trading, and were
supported by a favourable price review result.
Segment results were impacted by unrealised
derivative losses, as well as a negative contribution
from the methanol value chain. For the full year, Gas
and Power declined mainly due to weaker LNG
trading driven by operational issues and lower power
trading gains. Lower LPG trading results in Crude,
Products and Liquids also contributed to the decline,
which was partially offset by stronger refining
margins.
Higher production volumes and realised gas prices
contributed to increased revenue for the full year of
2025, partially offset by lower liquids prices. For the
quarter, lower liquids prices and reduced realised
gas prices in Europe outweighed the gains from
higher production, resulting in lower revenue.
Adjusted operating and administrative expenses*
increased in the quarter and full year compared to
the same periods last year, primarily due to higher
transportation costs driven by market conditions and
the weakening of the USD against NOK. The
quarterly increase was partially offset by a reduction
in the Gassled removal obligation, while changes in
estimates of asset retirement obligations during the
third quarter negatively impacted the full year. These
cost increases were partially offset by the
divestments in E&P International, as well as the
reduction in business development and early-phase
projects within the renewables and low carbon
solutions businesses.
The new fields on the NCS and field-specific
investments across the business were the primary
drivers of higher adjusted depreciation, amortisation
and net impairments* in the quarter. For the full year
of 2025, the impact of these new fields and
investments was largely offset by the cessation of
depreciation for UK assets and Peregrino, which
were classified as held for sale since December
2024 and May 2025, respectively. Increased proved
reserves further contributed to stable depreciation
relative to the prior year.
Exploration expenses were lower in the fourth
quarter and for the full year, despite high exploration
activity on the NCS. The decrease was primarily
driven by lower drilling activity across our
international portfolio in 2025.
In the fourth quarter, net operating income included a
loss of USD 291 million related to divestments and
net impairments of USD 626 million, primarily related
to impairments of an asset held for sale and early-
phase renewable projects. Net impairments for the
full year of 2025 amounted to USD 2,481 million,
mainly impacted by reduced expected synergies
from future offshore wind projects in the US and
updated price assumptions.
Adjusted net financial items* benefited from gains on
financial investments in the quarter, while losses on
financial investments earlier in 2025 contributed to a
decline for the full year.
For the full year, basic earnings per share and
adjusted earnings per share* were USD 1.94 and
USD 2.47, respectively, primarily impacted by lower
net income.
Taxes
The effective reported tax rate of 77.2% for the
fourth quarter of 2025, increased compared to 75.6%
in 2024, impacted by derecognition of deferred tax
assets, a loss related to the Adura joint venture
agreement with Shell and the lower effect of the
Energy Profits Levy in the UK. The effective reported
rate of 79.8% for the full year 2025 increased
compared to 71.5% in 2024, due to higher share of
income from jurisdictions with high tax rates and the
extension of the Energy Profits Levy in the UK. The
tax rate was also impacted by derecognition of
deferred tax assets and a loss related to the joint
venture agreement with Shell in the UK, see note 3.
The increase was partially offset by currency effects
and the tax exempted gain from the swap with
Petoro on the NCS.
Cash flow and net debt
Strong operational performance in the fourth quarter
generated cash flow provided by operating activities
before taxes paid and working capital items of USD
9,554 million, compared to USD 9,414 million in the
same quarter last year. For the full year, cash flow
provided by operating activities before taxes paid
and working capital items increased slightly from
USD 37,838 million in the same period last year to
USD 38,439 million.
Cash flow from operations after taxes paid*
decreased to USD 3,314 million from USD 3,508
million in the fourth quarter of 2024, primarily due to
higher tax payments in the quarter. For the full year
of 2025, cash flow from operations after taxes paid*
was USD 17,980 million, up from USD 17,246 million
in the prior year.
Tax payments in the fourth quarter totalled USD
6,240 million, mainly representing three scheduled
Norwegian corporation tax instalments related to
2025 earnings. This is an increase from USD 5,906
million in the same period last year, reflecting the
change in the NCS instalment tax payment structure.
NCS tax instalments totalling NOK 100.1 billion are
expected to be paid in the first half of 2026.
A working capital increase of USD 1,207 million
negatively impacted the cash flow in the fourth
quarter of 2025, compared to an increase of USD
1,486 million in the fourth quarter of 2024.
Net cash flow before capital distribution* decreased
from USD 2,085 million in the prior quarter to USD
245 million in the fourth quarter, mainly due to higher
tax payments under the new NCS instalment tax
payment structure, with three instalments paid
compared to two in the prior quarter. The
subscription of additional shares in Ørsted A/S for
USD 0.9 billion also impacted net cash flow before
capital distribution* during the quarter.
In the fourth quarter, net cash flow* amounted to an
outflow of USD 1,062 million, reflecting USD 917
million in dividends paid and USD 389 million related
to the share buy-back programme. Net cash flow*
was an outflow of USD 5,120 million for the full year
of 2025, down from an outflow of USD 12,851 million
in the same period last year, primarily due to
extraordinary dividend payments in the prior year.
A decrease in liquid assets in the quarter, combined
with slightly decreased equity caused an increase in
the net debt to capital employed adjusted* ratio at
the end of December 2025 to 17.8% from 12.2% at
the end of September 2025.
Capital distribution
The board of directors proposes to the annual
general meeting in 2026 a cash dividend of USD
0.39 per share for the fourth quarter of 2025. This is
an increase of USD 0.02 per share from the third
quarter of 2025 and in line with the previously
announced ambition. The Equinor share will trade
ex-dividend on Oslo Børs from and including 13 May
and New York Stock Exchange from and including
15 May 2026.
The interim cash dividends for the first, second and
third quarters of 2026 are expected to be at the
same level as for the fourth quarter of 2025. This is
to be decided by the board of directors on a quarterly
Equinor fourth quarter 2025
11 | Group review | FOURTH QUARTER 2025 REVIEW |
basis and in line with the company's dividend policy,
subject to existing and renewed authorisation from
the annual general meeting.
The fourth tranche of the share buy-back programme
for 2025 was completed on 29 January 2026 with a
total value of USD 1,266 million. Following this, the
total share buy-backs under the share buy-back
programme for 2025 amounts to USD 5 billion.
The board of directors has decided to announce
share buy-back for 2026 of up to USD 1.5 billion.
The 2026 share buy-back programme will be subject
to market outlook and balance sheet strength. The
first tranche of up to USD 375 million of the 2026
share buy-back programme will commence on 5
February and end no later than 30 March 2026.
Commencement of new share buy-back tranches
after the first tranche will be decided by the board of
directors on a quarterly basis in line with the
company's dividend policy. It will be subject to
existing and new board authorisations for share buy-
back from the company's annual general meeting
and agreement with the Norwegian State regarding
share buy-back.
All share buy-back amounts include shares to be
redeemed by the Norwegian state.
ROACE*, organic capital expenditure* and
reserves
Based on adjusted operating income after tax* and
average capital employed adjusted*, calculated
return on average capital employed (ROACE)*
was 14.5% for the 12-month period ended 31
December 2025 and 20.6% for the 12-month period
ended 31 December 2024.
Organic capital expenditures* amounted to USD
13.1 billion for the full year 2025.
Estimated Proved reserves at the end of 2025
were 5,183 million barrels of oil equivalents (boe), a
net decrease of 388 million boe compared to 5,571

million boe at the end of 2024.
The net decrease was mainly due to the increased
entitlement production not being fully replaced by
new proved reserves added during the year, and
sale of reserves in the Peregrino field in Brazil.
Positive revisions and implementation of increased
recovery projects added a total of 250 million boe
compared to 650 million boe in 2024. Sanctioning
new projects and extensions of the proved areas
added 199 million boe compared to 123 million boe
in 2024. The net effect of purchase and sale of
reserves in place was a reduction of 95 million boe,
which includes the sale of reserves in place in
Peregrino as well as the net effect of the Adura
transaction. The entitlement production available for
sale in 2025 was 741 million boe compared to 699
million boe in 2024.
This results in a reserve replacement ratio (RRR)
of 48% and an organic RRR excluding purchase and
sale of 61% in 2025 compared to 151% and 111% in
2024. The corresponding three-year average
replacement ratio was 100%, and the organic three-
year average was 90% at the end of 2025 compared
to 110% and 101% at the end of 2024.
The RRR measures the estimated proved reserves
added to the reserve base, including the effects of
sales and purchases, relative to the amount of oil
and gas produced.
All reserves numbers are preliminary.
Equinor fourth quarter 2025
12 | Group review | FOURTH QUARTER 2025 REVIEW |

Health, safety and the environment
In May 2021, Equinor Refining Norway AS (“Equinor
Mongstad”) was charged with violations of the
Pollution Control Act. The case concerned historical
matters related to emissions and discharges that the
company itself had uncovered, investigated, and
improved. The investigation has concluded, and
Equinor Mongstad has received a fine from Økokrim
of NOK 220 million and a confiscation claim of NOK
500 million. We disagree with the allegation that the
company failed to fulfil its duty of proper
maintenance of the plant over several decades and
saved cost through inadequate maintenance.
Equinor has contested the penalty notice from
Økokrim and intends to litigate this matter.
The twelve-month average serious incident
frequency (SIF) for the period ended 31 December
2025 was 0.21, a decrease from 2024 which ended
at 0.3.
Equinor’s absolute Scope 1 and 2 GHG emissions
from operated production (100% basis) were 10.2
million tonnes CO2e in 2025; this was 7% lower than
11.0 million tonnes CO2e in 2024. This difference
was due to a change in the number of assets in
scope from 2025 following a reassessment of
Technical Service Provider arrangements. Equinor
has adjusted targets and baselines accordingly.
Excluding the impact of the boundary adjustment,
year-on-year emissions in 2025 remain unchanged.
Emissions reduction from electrification efforts on the
NCS, as well as turnaround activities at Mongstad
and Hammerfest LNG during 2025, were offset by
increased emissions associated with the start-up and
ramp-up of new fields, including Johan Castberg and
Bacalhau.
Equinor fourth quarter 2025
13 | Outlook | FOURTH QUARTER 2025 REVIEW |
Outlook
•Organic capital expenditures* are estimated at
around USD 13 billion for 20265.
•Oil & gas production for 2026 is estimated to
grow around 3% compared to 2025 level [5].
•Equinor’s ambition is to keep the unit of
production cost in the top quartile of its peer
group.
•Scheduled maintenance activity is estimated to
reduce equity production by around 35 mboe per
day for the full year of 2026.
These forward-looking statements reflect current
views about future events and are, by their nature,
subject to significant risks and uncertainties because
they relate to events and depend on circumstances
that will occur in the future. Deferral of production to
create future value, gas off-take, timing of new
capacity coming on stream and operational regularity
and levels of industry product supply, demand and
pricing represent the most significant risks related to
the foregoing production guidance. Our future
financial performance, including cash flow and
liquidity, will be affected by geopolitical and
macroeconomic conditions, changes in the
regulatory and policy landscape, the development in
realised prices, including price differentials, tolls and
tariffs and other factors discussed elsewhere in the
report.
For further information, see section Forward-looking
statements in the report.
5) USD/NOK exchange rate assumption of 10
Equinor fourth quarter 2025
14 | Supplementary operational disclosures | FOURTH QUARTER 2025 REVIEW |
Supplementary operational disclosures
Quarters | Change | Full year | Quarters | Change | Full year | |||||||||||
Operational information | Q4 2025 | Q3 2025 | Q4 2024 | Q4 on Q4 | 2025 | 2024 | Change | Operational information | Q4 2025 | Q3 2025 | Q4 2024 | Q4 on Q4 | 2025 | 2024 | Change | |
Prices | Equity production (mboe per day) | |||||||||||||||
Average Brent oil price (USD/bbl) | 63.7 | 69.1 | 74.7 | (15)% | 69.1 | 80.8 | (14)% | E&P Norway equity liquids production | 687 | 714 | 627 | 10% | 671 | 628 | 7% | |
E&P Norway average liquids price (USD/bbl) | 61.1 | 67.9 | 71.4 | (14)% | 66.8 | 77.1 | (13)% | E&P International equity liquids production | 241 | 239 | 304 | (21)% | 255 | 306 | (17)% | |
E&P International average liquids price (USD/bbl) | 55.5 | 62.1 | 66.5 | (17)% | 62.0 | 72.0 | (14)% | E&P USA equity liquids production | 150 | 155 | 150 | —% | 150 | 148 | 1% | |
E&P USA average liquids price (USD/bbl) | 50.2 | 55.2 | 58.8 | (15)% | 55.7 | 64.5 | (14)% | Group equity liquids production | 1,078 | 1,109 | 1,081 | —% | 1,075 | 1,082 | (1)% | |
Group average liquids price (USD/bbl) [1] | 58.6 | 64.9 | 68.5 | (14)% | 64.2 | 74.1 | (13)% | E&P Norway equity gas production | 781 | 707 | 772 | 1% | 739 | 758 | (2)% | |
Group average liquids price (NOK/bbl) [1] | 592 | 655 | 754 | (22)% | 667 | 796 | (16)% | E&P International equity gas production | 48 | 29 | 34 | 39% | 38 | 34 | 10% | |
E&P Norway average internal gas price (USD/mmbtu) [7] | 9.02 | 9.98 | 12.05 | (25)% | 10.70 | 9.47 | 13% | E&P USA equity gas production | 292 | 286 | 185 | 57% | 285 | 193 | 48% | |
E&P USA average internal gas price (USD/mmbtu) [7] | 2.84 | 2.01 | 2.22 | 28% | 2.60 | 1.70 | 53% | Group equity gas production | 1,120 | 1,022 | 991 | 13% | 1,062 | 985 | 8% | |
Realised piped gas price Europe (USD/mmbtu) [6] | 10.56 | 11.43 | 13.54 | (22)% | 12.20 | 11.03 | 11% | Total equity liquids and gas production [2] [3] | 2,198 | 2,130 | 2,072 | 6% | 2,137 | 2,067 | 3% | |
Realised piped gas price US (USD/mmbtu) [6] | 3.29 | 2.42 | 2.36 | 39% | 3.07 | 2.00 | 54% | |||||||||
Power generation | ||||||||||||||||
Entitlement production (mboe per day) | Power generation (TWh) Equinor share | 1.76 | 1.37 | 1.43 | 23% | 5.65 | 4.92 | 15% | ||||||||
E&P Norway entitlement liquids production | 687 | 714 | 627 | 10% | 671 | 628 | 7% | Renewable power generation (TWh) Equinor share1) | 1.18 | 0.91 | 0.83 | 42% | 3.67 | 2.93 | 25% | |
E&P International entitlement liquids production | 213 | 184 | 245 | (13)% | 211 | 239 | (12)% | |||||||||
E&P USA entitlement liquids production | 132 | 138 | 134 | (1)% | 134 | 133 | 1% | 1)Includes Hywind Tampen renewable power generation. | ||||||||
Group entitlement liquids production | 1,032 | 1,036 | 1,006 | 3% | 1,015 | 1,000 | 2% | |||||||||
E&P Norway entitlement gas production | 781 | 707 | 772 | 1% | 739 | 758 | (2)% | |||||||||
E&P International entitlement gas production | 32 | 19 | 19 | 64% | 23 | 22 | 7% | |||||||||
E&P USA entitlement gas production | 248 | 242 | 157 | 58% | 242 | 163 | 49% | |||||||||
Group entitlement gas production | 1,060 | 968 | 948 | 12% | 1,004 | 942 | 7% | |||||||||
Total entitlement liquids and gas production [2] [3] | 2,093 | 2,005 | 1,953 | 7% | 2,019 | 1,942 | 4% | |||||||||
Equinor fourth quarter 2025
15 | Supplementary operational disclosures | FOURTH QUARTER 2025 REVIEW |

Health, safety and the environment | ||
Twelve months average per Q4 2025 | Full year 2024 | |
Total recordable injury frequency (TRIF) | 2.3 | 2.3 |
Serious Incident Frequency (SIF) | 0.21 | 0.3 |
Oil and gas leakages (number of)1) | 6 | 7 |
Full year 2025 | Full year 2024 | |
Upstream CO₂ intensity (kg CO₂/boe)2) | 6.3 | 6.2 |
Full year 2025 | Full year 2024 | |
Absolute scope 1+2 GHG emissions (million tonnes CO₂e)3) | 10.2 | 11.0 |
1)Number of leakages with rate above 0.1kg/second during the past 12 months. 2)Operational control, total scope 1 emissions of CO2 from expectations and production, divided by total production (boe). 3)Operational control, total scope 1 and 2 emissions of CO2 and CH4. | ||
Equinor fourth quarter 2025
16 | Exploration & Production Norway | FOURTH QUARTER 2025 REVIEW |
Exploration & Production Norway
Financial information | Quarters | Change | Full year | ||||
(unaudited, in USD million) | Q4 2025 | Q3 2025 | Q4 2024 | Q4 on Q4 | 2025 | 2024 | Change |
Total revenues and other income | 7,825 | 8,278 | 9,257 | (15)% | 34,392 | 33,643 | 2% |
Total operating expenses | (2,972) | (2,660) | (2,452) | 21% | (10,271) | (9,078) | 13% |
Net operating income/(loss) | 4,853 | 5,618 | 6,805 | (29)% | 24,121 | 24,564 | (2)% |
Adjusted total revenues and other income* | 7,825 | 8,278 | 9,257 | (15)% | 33,901 | 33,643 | 1% |
Adjusted operating and administrative expenses* | (940) | (926) | (894) | 5% | (3,834) | (3,612) | 6% |
Adjusted depreciation, amortisation and net impairments* | (1,630) | (1,602) | (1,382) | 18% | (5,697) | (4,954) | 15% |
Adjusted exploration expenses* | (229) | (132) | (176) | 30% | (567) | (513) | 11% |
Adjusted operating income/(loss)* | 5,026 | 5,618 | 6,804 | (26)% | 23,803 | 24,564 | (3)% |
Additions to PP&E, intangibles and equity accounted investments | 1,726 | 1,557 | 1,872 | (8)% | 7,366 | 6,285 | 17% |
Operational information | Quarters | Change | Full year | ||||
E&P Norway | Q4 2025 | Q3 2025 | Q4 2024 | Q4 on Q4 | 2025 | 2024 | Change |
E&P entitlement liquid and gas production (mboe/day) | 1,468 | 1,422 | 1,398 | 5% | 1,410 | 1,386 | 2% |
Average liquids price (USD/bbl) | 61.1 | 67.9 | 71.4 | (14)% | 66.8 | 77.1 | (13)% |
Average internal gas price (USD/mmbtu) | 9.02 | 9.98 | 12.05 | (25)% | 10.70 | 9.47 | 13% |
Production & Revenues
In the fourth quarter of 2025, production increased
compared to the same quarter last year, driven by
new fields coming on stream, including Johan
Castberg and Halten East, as well as new wells. The
increase was partially offset by natural decline in
several fields. Johan Castberg operated at minimum
production levels for 25 days during the quarter due
to unplanned maintenance.
Liquids production increased more than gas in the
quarter, driven by new fields coming on stream with
a higher proportion of liquids in the production mix.
Production increased for 2025 compared to 2024,
reflecting ramp-up of new fields and new wells
during the year, as well as stable performance,
partially offset by natural decline.
Total revenues and other income in the fourth
quarter of 2025 were lower compared to the same
quarter last year, as the decline in gas and liquids
prices more than offset strong production
performance. For the full year of 2025, revenues
increased compared to 2024, mainly reflecting
higher production and higher gas prices largely
offsetting lower liquids prices.
Operating expenses and financial results
Operating and administrative expenses increased in
the fourth quarter of 2025 compared to the same
quarter last year, mainly driven by increased activity
from new fields coming on stream and cancellation
costs related to the Halten electrification project. The
reported increase also reflects the weakening of the
USD against NOK in addition to one off effect
positively affecting the fourth quarter of the prior
year. These effects were partially offset by lower
transportation costs, mainly related to the Gassled
removal obligation compared to the prior year. The
same factors drove the increase for the full year of
2025 relative to 2024, in addition to an adverse non-
recurring transportation cost recognised in the third
quarter.
Adjusted depreciation, amortisation and net
impairments* in the fourth quarter and the full year of
2025 increased due to the ramp-up of new fields and
field-specific investments, as well as the
development in the USD/NOK exchange rate. These
effects were partially offset by increased proved
reserves compared to the same periods last year,
and impairment of an asset in the fourth quarter of
2024.
Exploration expenses increased compared to the
fourth quarter of 2024, mainly reflecting higher
expensing of well costs from earlier years as wells
were evaluated in the quarter. The exploration
activity in the quarter was slightly lower than in the
same quarter last year, with 12 wells compared to 13
wells, while successful outcomes resulted in higher
capitalisation, partially offsetting the cost increase.
Net operating income in the first quarter of 2025 was
positively impacted by a gain of USD 491 million
related to the swap transaction with Petoro, while net
operating income in the fourth quarter of 2025 was
negatively impacted by an impairment of USD 173
million.
Additions to PP&E, intangibles and equity accounted
investments in 2025 was influenced by the assets
acquired in the swap transaction amounting to USD
1,086 million.
Equinor fourth quarter 2025
17 | Exploration & Production International | FOURTH QUARTER 2025 REVIEW |
Exploration & Production International
Financial information | Quarters | Change | Full year | ||||
(unaudited, in USD million) | Q4 2025 | Q3 2025 | Q4 2024 | Q4 on Q4 | 2025 | 2024 | Change |
Total revenues and other income | 868 | 1,315 | 2,183 | (60)% | 5,102 | 7,343 | (31)% |
Total operating expenses | (1,140) | (1,569) | (1,159) | (2)% | (4,633) | (4,597) | 1% |
Net operating income/(loss) | (271) | (254) | 1,024 | N/A | 470 | 2,746 | (83)% |
Adjusted total revenues and other income* | 877 | 1,315 | 1,378 | (36)% | 5,062 | 6,538 | (23)% |
Adjusted purchases* | 77 | (38) | 64 | 21% | (25) | 85 | N/A |
Adjusted operating and administrative expenses* | (339) | (532) | (542) | (38)% | (1,928) | (2,038) | (5)% |
Adjusted depreciation, amortisation and net impairments* | (344) | (269) | (538) | (36)% | (1,318) | (2,064) | (36)% |
Adjusted exploration expenses* | (58) | (80) | (58) | (1)% | (222) | (496) | (55)% |
Adjusted operating income/(loss)* | 214 | 396 | 303 | (29)% | 1,569 | 2,025 | (23)% |
Additions to PP&E, intangibles and equity accounted investments | 6,146 | 695 | 896 | >100% | 8,224 | 3,191 | >100% |
Operational information | Quarters | Change | Full year | ||||
E&P International | Q4 2025 | Q3 2025 | Q4 2024 | Q4 on Q4 | 2025 | 2024 | Change |
E&P equity liquid and gas production (mboe/ day) | 289 | 267 | 339 | (15)% | 293 | 340 | (14)% |
E&P entitlement liquid and gas production (mboe/day) | 245 | 203 | 264 | (7)% | 234 | 261 | (10)% |
Production sharing agreements (PSA) effects | 44 | 65 | 74 | (41)% | 59 | 79 | (26)% |
Average liquids price (USD/bbl) | 55.5 | 62.1 | 66.5 | (17)% | 62.0 | 72.0 | (14)% |
Production & Revenues
The divestment of assets in Azerbaijan and Nigeria
late in 2024 along with the production stop in
Peregrino from August to October 2025 and natural
decline in certain fields, led to a decrease in
production in the fourth quarter and the full year of
2025 compared to the same periods last year. The
sale of the 40% operated interest in Peregrino to
PRIO in the middle of November 2025 and
operational issues in certain fields further contributed
to the overall drop in production in the fourth quarter
2025. The decrease was partially offset by
contributions from new wells, mainly in Argentina
and Angola, in addition to the establishment of Adura
in December 2025 and Bacalhau coming on stream
in the middle of October 2025.
In December 2025, Equinor completed the
divestment of its offshore UK assets, including
interests in Rosebank, Mariner and Buzzard, and
received a 50% ownership interest in Adura, a joint
venture with Shell. The transaction contributed to
higher net production, reflecting the asset mix of the
portfolio transferred by the partners to the joint
venture, and resulted in a loss on divestment of USD
173 million recognised in the fourth quarter.
Production Sharing Agreements (PSA) effects were
reduced in the fourth quarter and full year of 2025
compared to the same periods last year, mainly
reflecting higher divestments and lower prices.
Lower volumes and prices together with gains from
divestments in 2024 contributed to lower total
revenues and other income in the fourth quarter and
the full year of 2025 compared with the same
periods last year. The fourth quarter of 2025 was
also negatively impacted by underlift timing effect.
Operating expenses and financial results
The decrease in adjusted operating and
administrative expenses* in the fourth quarter and
for the full year of 2025 compared to the
corresponding periods in 2024 was mainly driven by
the sale of assets in Azerbaijan and Nigeria in 2024,
along with the sale of the 40% operated interest in
the Peregrino field and variations in the over/underlift
position.
Following the cessation of depreciation for assets
classified as held for sale in the UK from late 2024
and in Brazil from the second quarter of 2025,
adjusted depreciation, amortisation and net
impairments* was lower in the fourth quarter and full
year of 2025 compared to the same periods in 2024.
Exploration expenses were stable quarter on quarter,
but decreased for the full year of 2025 primarily due
to higher expensed well costs related to Brazil,
Canada and Argentina last year.
Net operating income in the fourth quarter of 2025
was negatively impacted by losses mainly related to
transactions in the UK and Brazil of USD 275 million,
and an impairment of the remaining assets held for
sale in Brazil of USD 201 million. For the full year of
2025, net operating income also included an
impairment of the assets which were held for sale in
the UK of USD 650 million, recognised in the third
quarter.
Additions to PP&E, intangibles and equity accounted
investments increased in the fourth quarter and for
the full year of 2025 compared to the same periods
last year mainly due to the acquisition of shares in
Adura in December 2025.
Equinor fourth quarter 2025
18 | Exploration & Production USA | FOURTH QUARTER 2025 REVIEW |
Exploration & Production USA
Production & Revenues
Financial information | Quarters | Change | Full year | ||||
(unaudited, in USD million) | Q4 2025 | Q3 2025 | Q4 2024 | Q4 on Q4 | 2025 | 2024 | Change |
Total revenues and other income | 1,045 | 1,014 | 957 | 9% | 4,296 | 3,957 | 9% |
Total operating expenses | (686) | (1,398) | (773) | (11)% | (3,628) | (2,925) | 24% |
Net operating income/(loss) | 359 | (384) | 184 | 95% | 668 | 1,031 | (35)% |
Adjusted total revenues and other income* | 1,045 | 1,014 | 957 | 9% | 4,296 | 3,957 | 9% |
Adjusted operating and administrative expenses* | (292) | (569) | (257) | 14% | (1,477) | (1,142) | 29% |
Adjusted depreciation, amortisation and net impairments* | (394) | (405) | (408) | (3)% | (1,705) | (1,607) | 6% |
Adjusted exploration expenses* | — | (3) | (109) | (100)% | (24) | (176) | (86)% |
Adjusted operating income/(loss)* | 359 | 37 | 184 | 95% | 1,089 | 1,031 | 6% |
Additions to PP&E, intangibles and equity accounted investments | 284 | 314 | 1,651 | (83)% | 1,199 | 3,862 | (69)% |
Operational information | Quarters | Change | Full year | ||||
E&P USA | Q4 2025 | Q3 2025 | Q4 2024 | Q4 on Q4 | 2025 | 2024 | Change |
E&P equity liquid and gas production (mboe/ day) | 441 | 441 | 335 | 32% | 434 | 341 | 27% |
E&P entitlement liquid and gas production (mboe/day) | 380 | 380 | 291 | 31% | 375 | 295 | 27% |
Royalties | 61 | 61 | 44 | 39% | 59 | 46 | 29% |
Average liquids price (USD/bbl) | 50.2 | 55.2 | 58.8 | (15)% | 55.7 | 64.5 | (14)% |
Average internal gas price (USD/mmbtu) | 2.84 | 2.01 | 2.22 | 28% | 2.60 | 1.70 | 53% |
E&P USA reported higher production volumes in the
fourth quarter and full year of 2025 compared with
the corresponding periods in 2024. The increase
was primarily attributable to higher natural gas
production from the Appalachia onshore assets
following the acquisition of additional interests in late
2024 and increased operational activity in the
Appalachia region throughout 2025. U.S. Offshore
production remained relatively stable in the fourth
quarter and full year of 2025 compared to the same
periods last year, with new wells on stream offset by
natural decline.
Total revenues and other income increased in both
the fourth quarter and the full year of 2025 compared
with the same periods in 2024. The increase was
primarily driven by higher natural gas prices and
increased gas production volumes, partially offset by
lower realized liquids prices.
Operating expenses and financial results
Operating and administrative expenses increased
during both the fourth quarter and the full year of
2025 compared with the same periods in 2024. The
increase was primarily driven by higher
transportation costs resulting from increased
production volumes in the Appalachia basin. For the
full year, operating and administrative expenses
were further impacted by higher asset retirement
obligations from updated cost estimates related to a
late-life offshore asset that ceased production during
the third quarter of 2025.
Adjusted depreciation, amortisation, and net
impairments* decreased slightly in the fourth quarter
of 2025 compared with the fourth quarter of 2024,
primarily reflecting the impact of increased proved
reserves at year-end 2024. For the full year, the
increase from 2024 was largely driven by asset
retirement obligations recognised in the second
quarter of 2025, partially offset by upward revisions
to proved reserves recorded at year-end 2024.
Exploration expenses declined in the fourth quarter
and full year of 2025 compared to the same periods
in 2024, primarily due to reduced drilling activity.
In the full year of 2025, net operating income was
adversely affected by impairments of USD 385
million related to two producing assets in U.S.
Offshore, in addition to USD 35 million in exploration
licence write-downs.
The decrease in additions to PP&E, intangibles and
equity accounted investments in 2025, compared to
2024, is primarily attributed to the swap with EQT,
which closed in the second quarter of 2024, and the
additional interests purchased in late 2024. This
resulted in an increase in the Northern Marcellus
formation offset by a decrease from the Appalachia-
operated assets.
Equinor fourth quarter 2025
19 | Marketing, Midstream & Processing | FOURTH QUARTER 2025 REVIEW |
Marketing, Midstream & Processing
Financial information | Quarters | Change | Full year | ||||
(unaudited, in USD million) | Q4 2025 | Q3 2025 | Q4 2024 | Q4 on Q4 | 2025 | 2024 | Change |
Total revenues and other income | 25,146 | 25,753 | 26,573 | (5)% | 104,769 | 101,792 | 3% |
Total operating expenses | (24,368) | (25,244) | (25,590) | (5)% | (103,069) | (98,466) | 5% |
Net operating income/(loss) | 778 | 509 | 983 | (21)% | 1,700 | 3,326 | (49)% |
Adjusted total revenues and other income* | 25,044 | 25,772 | 26,266 | (5)% | 104,845 | 101,209 | 4% |
Adjusted purchases* [4] | (22,756) | (23,985) | (24,194) | (6)% | (97,178) | (92,777) | 5% |
Adjusted operating and administrative expenses* | (1,367) | (1,270) | (1,176) | 16% | (5,184) | (4,871) | 6% |
Adjusted depreciation, amortisation and net impairments* | (243) | (217) | (236) | 3% | (919) | (949) | (3)% |
Adjusted operating income/(loss)* | 678 | 299 | 659 | 3% | 1,563 | 2,612 | (40)% |
— Gas and Power | 583 | 282 | 571 | 2% | 1,354 | 2,062 | (34)% |
— Crude, Products and Liquids | 111 | 31 | 247 | (55)% | 499 | 1,153 | (57)% |
— Other | (16) | (13) | (159) | 90% | (290) | (603) | 52% |
Additions to PP&E, intangibles and equity accounted investments | 374 | 307 | 369 | 2% | 1,142 | 953 | 20% |
Operational information | Quarters | Change | Full year | ||||
Marketing, Midstream and Processing | Q4 2025 | Q3 2025 | Q4 2024 | Q4 on Q4 | 2025 | 2024 | Change |
Liquids sales volumes (mmbl) | 276.4 | 279.1 | 248.9 | 11% | 1,106.3 | 1,008.8 | 10% |
Natural gas sales Equinor (bcm) | 18.0 | 16.8 | 16.6 | 8% | 67.4 | 63.6 | 6% |
Natural gas entitlement sales Equinor (bcm) | 15.5 | 14.1 | 13.6 | 14% | 56.6 | 53.2 | 6% |
Power generation (TWh) Equinor share | 0.59 | 0.46 | 0.60 | (2)% | 1.98 | 1.98 | 0% |
Realised piped gas price Europe (USD/mmbtu) | 10.56 | 11.43 | 13.54 | (22)% | 12.20 | 11.03 | 11% |
Realised piped gas price US (USD/mmbtu) | 3.29 | 2.42 | 2.36 | 39% | 3.07 | 2.00 | 54% |
Volumes, Pricing & Revenues
Liquids sales volumes remained at similar levels
compared to the previous quarter. Higher equity and
third party volumes drove the increase compared to
the previous year.
Gas sales volumes increased compared to the
previous quarter due to recovery from maintenance
activity on the NCS. Compared to the previous year,
the increase reflected higher Equinor international
gas production.
Power generation rose compared to the last quarter,
driven by seasonal factors, and remained stable
compared to the same period last year.
The realised European piped gas price decreased
compared to the previous quarter due to solid NCS
flows and increasing LNG supplies, combined with a
mild winter. Compared to the same quarter last year,
the realised European piped gas prices decreased
due to a combination of lower gas demand and
growing LNG supplies.
The realised piped gas price in the US increased
compared to the previous quarter due to higher
demand explained by lower temperatures.
Compared to the same quarter last year, realised US
gas price increased due to higher demand from
power generation and LNG exports.
Financial Results
In the fourth quarter of 2025, Gas and Power was
the main contributor to adjusted operating income*.
This result was driven by optimisation of piped gas
trading in Europe and LNG trading. Crude, Products
and Liquids contributed positively, mainly through
physical trading of crude and products, as well as
shipping optimisation. Additionally, the results were
impacted by high refining margins, unrealised
derivative losses, coupled with a negative result in
methanol value chain. The Gas and Power
subsegment was also affected by a favourable price
review result.
In addition to the price review, the increase in
adjusted operating income* compared to the prior
quarter was driven by improved crude trading from
shipping optimisation and positive results from
speculative trading. Stabilised operations at
Hammerfest LNG also positively contributed,
partially offset by weaker US gas trading.
Adjusted operating income* for the full year of 2025
was lower than the previous year. Gas and Power
declined mainly due to weaker LNG trading driven by
operational issues and lower power trading gains. In
Crude, Products and Liquids, crude and LPG trading
also had a lower result compared to 2024. These
declines were partially offset by stronger refining
margins.
Net operating income includes the net effect of fair
value changes in derivatives and storages, changes
in onerous provisions and operational storage value,
and net impairments, totalling USD 100 million for
the quarter and USD 137 million for the full year.
Equinor fourth quarter 2025
20 | Renewables | FOURTH QUARTER 2025 REVIEW |
Renewables
Financial information | Quarters | Change | Full year | ||||
(unaudited, in USD million) | Q4 2025 | Q3 2025 | Q4 2024 | Q4 on Q4 | 2025 | 2024 | Change |
Revenues third party, other revenue and other income | 36 | 42 | 149 | (76)% | 93 | 216 | (57)% |
Net income/(loss) from equity accounted investments | 55 | (9) | 26 | >100% | 99 | 100 | (2)% |
Total revenues and other income | 90 | 34 | 174 | (48)% | 192 | 317 | (39)% |
Total operating expenses | (385) | (92) | (374) | 3% | (1,806) | (993) | 82% |
Net operating income/(loss) | (295) | (59) | (200) | 48% | (1,614) | (676) | >100% |
Adjusted total revenues and other income* | 97 | 29 | 50 | 93% | 221 | 193 | 15% |
Adjusted purchases* | (1) | (7) | — | N/A | (8) | — | N/A |
Adjusted operating and administrative expenses* | (109) | (74) | (137) | (21)% | (382) | (524) | (27)% |
Adjusted depreciation, amortisation and net impairments* | (14) | (13) | (13) | 4% | (46) | (44) | 4% |
Adjusted operating income/(loss)* | (26) | (64) | (100) | (74)% | (214) | (375) | (43)% |
Additions to PP&E, intangibles and equity accounted investments | 565 | 773 | 559 | 1% | 2,837 | 2,153 | 32% |
Operational information | Quarters | Change | Full year | ||||
Renewables | Q4 2025 | Q3 2025 | Q4 2024 | Q4 on Q4 | 2025 | 2024 | Change |
Renewables power generation (TWh) Equinor share | 1.14 | 0.88 | 0.78 | 45% | 3.50 | 2.80 | 25% |
Power generation
Total power generation increased in both the fourth
quarter and the full year of 2025 compared to the
same periods in 2024, mainly reflecting a ramp-up of
Dogger Bank A and the addition of the Lyngsåsa
onshore wind farm. In the fourth quarter of 2025,
total power generation amounted to 1.14 TWh,
comprising 0.70 TWh from offshore wind farms and
0.44 TWh from onshore renewables.
For the full year of 2025, total power generation
reached 3.50 TWh, including 1.89 TWh from offshore
wind and 1.61 TWh from onshore assets. The
offshore wind power was primarily generated by
Dudgeon, Sheringham Shoal and Dogger Bank A,
while the onshore volumes mainly came from the
Serra Da Babilônia Wind Complex, other plants in
Brazil and Lyngsåsa in Sweden.
Total revenues and other income
Contributions from equity accounted investments in
the UK drove the increase in adjusted total revenues
and other income* in the fourth quarter while
revenues from operated activities remained broadly
stable. New acquisitions in the onshore portfolio
drove a similar increase for the full year of 2025,
Operating expenses and financial results
Adjusted operating and administrative expenses*
decreased in the fourth quarter and the full year of
2025 compared to the same periods in 2024,
primarily due to a reduction in business development
costs. The decline reflects a disciplined focus on
operational priorities and cost reduction efforts in
accordance with strategic objectives and current
market conditions.
The net operating loss for the fourth quarter of 2025
was impacted by an impairment of USD 252 million
mainly relating to early phase projects.
Net operating loss for the full year of 2025 also
included a USD 955 million impairment loss for
Empire Wind 1/South Brooklyn Marine Terminal
project under construction and for the undeveloped
Empire Wind 2 lease. This impairment primarily
reflected reduced expected synergies from future
offshore wind projects resulting from regulatory
changes and increased exposure to tariffs, which
impacted the project economics negatively in the
second quarter.
In the fourth quarter of 2025, USD 37 million of
additions to PP&E, intangibles, and equity accounted
investments related to onshore renewables and USD
528 million related to offshore wind projects. The
offshore additions primarily reflect continued
investments in the Empire Wind project in the US.
With effect from the first quarter of 2026, the
Renewables activities will be included in the Power
reporting segment.
Equinor fourth quarter 2025
21 | FOURTH QUARTER 2025 REVIEW |
Condensed interim financial statements and notes
Equinor fourth quarter 2025
22 | Condensed Interim financial statements and notes | FOURTH QUARTER 2025 REVIEW |
CONSOLIDATED STATEMENT OF INCOME
Quarters | Full year | Quarters | Full year | |||||||||||
(unaudited, in USD million) | Note | Q4 2025 | Q3 2025 | Q4 2024 | 2025 | 2024 | (unaudited, in USD million) | Note | Q4 2025 | Q3 2025 | Q4 2024 | 2025 | 2024 | |
Revenues | 25,296 | 26,017 | 26,535 | 105,828 | 102,502 | Interest income and other financial income | 271 | 265 | 435 | 1,175 | 1,951 | |||
Net income/(loss) from equity accounted investments | 12 | (16) | 6 | 18 | 49 | Interest expenses and other financial expenses | (394) | (366) | (401) | (1,436) | (1,582) | |||
Other income | 38 | 48 | 1,113 | 616 | 1,223 | Other financial items | 406 | (503) | (582) | (3) | (311) | |||
Total revenues and other income | 25,346 | 26,049 | 27,654 | 106,462 | 103,774 | Net financial items | 283 | (604) | (548) | (265) | 58 | |||
Purchases [net of inventory variation] | (13,064) | (13,917) | (12,869) | (55,164) | (50,040) | Income/(loss) before tax | 5,770 | 4,666 | 8,187 | 25,088 | 30,986 | |||
Operating expenses | (2,921) | (3,055) | (2,622) | (11,571) | (10,531) | |||||||||
Selling, general and administrative expenses | (298) | (258) | (261) | (1,207) | (1,255) | Income tax | (4,456) | (4,870) | (6,188) | (20,030) | (22,157) | |||
Depreciation, amortisation and net impairments | (3,290) | (3,297) | (2,824) | (12,318) | (9,835) | |||||||||
Exploration expenses | (287) | (252) | (343) | (849) | (1,185) | Net income/(loss) | 1,314 | (204) | 1,999 | 5,058 | 8,829 | |||
Total operating expenses | (19,860) | (20,779) | (18,919) | (81,109) | (72,846) | Attributable to equity holders of the company | 1,314 | (210) | 1,996 | 5,043 | 8,806 | |||
Attributable to non-controlling interests | 1 | 7 | 3 | 15 | 23 | |||||||||
Net operating income/(loss) | 5,487 | 5,270 | 8,735 | 25,352 | 30,927 | |||||||||
Basic earnings per share (in USD) | 0.52 | (0.08) | 0.73 | 1.94 | 3.12 | |||||||||
Diluted earnings per share (in USD) | 0.52 | (0.08) | 0.73 | 1.94 | 3.11 | |||||||||
Weighted average number of ordinary shares outstanding (in millions) | 2,509 | 2,527 | 2,739 | 2,593 | 2,821 | |||||||||
Weighted average number of ordinary shares outstanding diluted (in millions) | 2,518 | 2,535 | 2,746 | 2,601 | 2,827 | |||||||||
Equinor fourth quarter 2025
23 | Condensed Interim financial statements and notes | FOURTH QUARTER 2025 REVIEW |
CONSOLIDATED STATEMENT OF COMPREHENSIVE INCOME
Quarters | Full year | ||||
(unaudited, in USD million) | Q4 2025 | Q3 2025 | Q4 2024 | 2025 | 2024 |
Net income/(loss) | 1,314 | (204) | 1,999 | 5,058 | 8,829 |
Actuarial gains/(losses) on defined benefit pension plans | 157 | 306 | 540 | 162 | 1,028 |
Income tax effect on income and expenses recognised in OCI1) | (36) | (67) | (132) | (29) | (239) |
Items that will not be reclassified to the Consolidated statement of income | 121 | 240 | 408 | 133 | 790 |
Foreign currency translation effects | (230) | (78) | (1,979) | 2,466 | (1,943) |
Share of OCI from equity accounted investments | 44 | 10 | 1 | 51 | (42) |
Items that may be subsequently reclassified to the Consolidated statement of income | (186) | (68) | (1,978) | 2,517 | (1,985) |
Other comprehensive income/(loss) | (64) | 171 | (1,570) | 2,650 | (1,196) |
Total comprehensive income/(loss) | 1,250 | (32) | 429 | 7,708 | 7,633 |
Attributable to the equity holders of the company | 1,250 | (39) | 426 | 7,693 | 7,611 |
Attributable to non-controlling interests | 1 | 7 | 3 | 15 | 23 |
1)Other comprehensive income (OCI). | |||||
Equinor fourth quarter 2025
24 | Condensed Interim financial statements and notes | FOURTH QUARTER 2025 REVIEW |
CONSOLIDATED BALANCE SHEET
At 31 December | At 31 December | ||
(in USD million) | Note | 2025 (unaudited) | 2024 (audited) |
ASSETS | |||
Property, plant and equipment | 61,241 | 55,560 | |
Intangible assets | 5,950 | 5,654 | |
Equity accounted investments | 8,504 | 2,471 | |
Deferred tax assets | 5,053 | 4,900 | |
Pension assets | 2,107 | 1,717 | |
Derivative financial instruments | 1,020 | 648 | |
Financial investments | 6,839 | 5,616 | |
Prepayments and financial receivables | 2,073 | 1,379 | |
Total non-current assets | 92,787 | 77,946 | |
Inventories | 3,330 | 4,031 | |
Trade and other receivables | 10,819 | 13,590 | |
Prepayments and financial receivables1) 2) | 3,885 | 6,084 | |
Derivative financial instruments | 667 | 1,024 | |
Financial investments | 14,297 | 15,335 | |
Cash and cash equivalents1) | 5,036 | 5,903 | |
Total current assets | 38,034 | 45,967 | |
Assets classified as held for sale | 906 | 7,227 | |
Total assets | 131,727 | 131,141 | |
1) Restated for 2024. For more information see note 1 Organisation and basis of preparation. | |||
2) Includes collateral deposits of USD 1.3 billion for 31 December 2025 related to certain requirements set out by exchanges where Equinor is participating. The corresponding figure for 31 December 2024 is USD 2.2 billion. | |||
At 31 December | At 31 December | ||
(in USD million) | Note | 2025 (unaudited) | 2024 (audited) |
EQUITY AND LIABILITIES | |||
Shareholders' equity | 40,424 | 42,342 | |
Non-controlling interests | 74 | 38 | |
Total equity | 40,497 | 42,380 | |
Finance debt | 23,763 | 19,361 | |
Lease liabilities | 2,221 | 2,261 | |
Deferred tax liabilities | 14,524 | 12,726 | |
Pension liabilities | 4,076 | 3,482 | |
Provision and other liabilities | 14,715 | 12,927 | |
Derivative financial instruments | 1,150 | 1,958 | |
Total non-current liabilities | 60,450 | 52,715 | |
Trade and other payables | 9,700 | 11,110 | |
Provisions and other liabilities | 3,299 | 2,384 | |
Current tax payable | 10,994 | 10,319 | |
Finance debt | 4,047 | 7,223 | |
Lease liabilities | 1,190 | 1,249 | |
Dividends payable | 923 | 1,906 | |
Derivative financial instruments | 448 | 833 | |
Total current liabilities | 30,601 | 35,023 | |
Liabilities directly associated with the assets classified for sale | 179 | 1,023 | |
Total liabilities | 91,230 | 88,761 | |
Total equity and liabilities | 131,727 | 131,141 |
Equinor fourth quarter 2025
25 | Condensed Interim financial statements and notes | FOURTH QUARTER 2025 REVIEW |
CONSOLIDATED STATEMENT OF CHANGES IN EQUITY
(unaudited, in USD million) | Share capital | Additional paid-in capital | Retained earnings | Foreign currency translation reserve | OCI from equity accounted investments | Shareholders' equity | Non-controlling interests | Total equity |
At 1 January 2024 | 1,101 | — | 56,521 | (9,442) | 310 | 48,490 | 10 | 48,500 |
Net income/(loss) | 8,806 | 8,806 | 23 | 8,829 | ||||
Other comprehensive income/(loss) | 790 | (1,943) | (42) | (1,196) | (1,196) | |||
Total comprehensive income/(loss) | — | — | 9,596 | (1,943) | (42) | 7,611 | 23 | 7,633 |
Dividends | (7,802) | (7,802) | (7,802) | |||||
Share buy-back | (49) | — | (5,887) | (5,936) | (5,936) | |||
Other equity transactions | — | (20) | (20) | 5 | (15) | |||
At 31 December 2024 | 1,052 | — | 52,407 | (11,385) | 268 | 42,342 | 38 | 42,380 |
At 1 January 2025 | 1,052 | — | 52,407 | (11,385) | 268 | 42,342 | 38 | 42,380 |
Net income/(loss) | 5,043 | 5,043 | 15 | 5,058 | ||||
Other comprehensive income/(loss) | 133 | 2,466 | 51 | 2,650 | 2,650 | |||
Total comprehensive income/(loss) | — | — | 5,176 | 2,466 | 51 | 7,693 | 15 | 7,708 |
Dividends | (3,787) | (3,787) | (3,787) | |||||
Share buy-back1) | (56) | — | (5,735) | (5,791) | (5,791) | |||
Other equity transactions | — | (34) | (34) | 21 | (13) | |||
At 31 December 2025 | 995 | — | 48,028 | (8,919) | 319 | 40,424 | 74 | 40,497 |
1)For more information see note 8 Capital distribution |
Equinor fourth quarter 2025
26 | Condensed Interim financial statements and notes | FOURTH QUARTER 2025 REVIEW |
CONSOLIDATED STATEMENT OF CASH FLOWS
Quarters | Full year | |||||
(unaudited, in USD million) | Note | Q4 2025 | Q3 2025 | Q4 2024 | 2025 | 2024 |
Income/(loss) before tax | 5,770 | 4,666 | 8,187 | 25,088 | 30,986 | |
Depreciation, amortisation and net impairments, including exploration write-offs | 3,367 | 3,369 | 2,807 | 12,473 | 9,906 | |
(Gains)/losses on foreign currency transactions and balances | 6 | (72) | (299) | 135 | (166) | |
(Gains)/losses on sale of assets and businesses | 237 | (12) | (890) | (287) | (772) | |
(Increase)/decrease in other items related to operating activities | (60) | 938 | (101) | (58) | (2,335) | |
(Increase)/decrease in net derivative financial instruments | (188) | (69) | (78) | (429) | (86) | |
Cash collaterals for commodity derivative transactions1) | 453 | 44 | (399) | 962 | (645) | |
Interest received | 234 | 327 | 461 | 1,221 | 1,841 | |
Interest paid | (265) | (93) | (274) | (665) | (891) | |
Cash flow provided by operating activities before taxes paid and working capital items | 9,554 | 9,098 | 9,414 | 38,439 | 37,838 | |
Taxes paid | (6,240) | (3,764) | (5,906) | (20,460) | (20,592) | |
(Increase)/decrease in working capital | (1,207) | 1,012 | (1,486) | 1,992 | 2,218 | |
Cash flows provided by operating activities | 2,107 | 6,346 | 2,022 | 19,971 | 19,465 | |
Cash (used)/received in business combinations | — | — | (1,242) | (26) | (1,710) | |
Capital expenditures and investments | (4,146) | (3,420) | (3,646) | (13,994) | (12,177) | |
(Increase)/decrease in financial investments2) | (1,583) | 617 | 3,295 | 1,571 | 9,364 | |
(Increase)/decrease in derivative financial instruments | (13) | (106) | 103 | 283 | 143 | |
(Increase)/decrease in other interest-bearing items | (11) | 170 | (60) | 114 | (623) | |
Proceeds from sale of assets and businesses | 2,032 | — | 1,355 | 2,456 | 1,470 | |
Cash flows provided by/(used in) investing activities | (3,722) | (2,739) | (196) | (9,596) | (3,532) | |
Quarters | Full year | |||||
(unaudited, in USD million) | Note | Q4 2025 | Q3 2025 | Q4 2024 | 2025 | 2024 |
New finance debt | 1,716 | 556 | — | 5,915 | — | |
Repayment of finance debt | (379) | (766) | (502) | (2,400) | (2,592) | |
Repayment of lease liabilities | (323) | (393) | (377) | (1,459) | (1,491) | |
Dividends paid | (917) | (938) | (1,913) | (4,791) | (8,578) | |
Share buy-back | (389) | (4,712) | (501) | (5,916) | (6,013) | |
Net current finance debt and other financing activities | (1,141) | 1,269 | 1,491 | (2,875) | 933 | |
Cash flows provided by/(used in) financing activities | (1,434) | (4,983) | (1,802) | (11,526) | (17,741) | |
Net increase/(decrease) in cash and cash equivalents | (3,049) | (1,375) | 24 | (1,150) | (1,808) | |
Effect of exchange rate changes in cash and cash equivalents | (23) | 45 | (305) | 284 | (359) | |
Cash and cash equivalents at the beginning of the period1) | 8,107 | 9,437 | 6,184 | 5,903 | 8,070 | |
Cash and cash equivalents at the end of the period1) | 5,036 | 8,107 | 5,903 | 5,036 | 5,903 | |
1) As from the first quarter 2025, cash flows related to collaterals for commodity derivative transactions are presented on a separate line within operating activities, Cash collaterals for commodity derivative transactions. In previous periods, these were included as part of Cash and cash equivalents. Comparative figures have been restated accordingly. See the restatement table in note 1 Organisation and basis of preparation. | ||||||
2) This line item includes the initial acquisition of 10 per cent of the shares in Ørsted A/S for USD 2.5 billion in the fourth quarter 2024, as well as an additional investment of USD 0.9 billion in the fourth quarter 2025. See note 5 Financial items. | ||||||
Equinor fourth quarter 2025
27 | Condensed Interim financial statements and notes | FOURTH QUARTER 2025 REVIEW |
NOTES TO THE CONDENSED INTERIM FINANCIAL STATEMENTS
Note 1. Organisation and basis of preparation
Organisation and principal activities
Equinor Group (Equinor) consists of Equinor ASA
and its subsidiaries. Equinor ASA is incorporated and
domiciled in Norway and listed on the Oslo Børs
(Norway) and the New York Stock Exchange (USA).
The registered office address is Forusbeen 50,
N-4035, Stavanger, Norway.
The objective of Equinor is to develop, produce and
market various forms of energy and derived products
and services, as well as other businesses. The
activities may also be carried out through
participation in or cooperation with other companies.
Equinor Energy AS, a 100% owned operating
subsidiary of Equinor ASA and owner of all of
Equinor's oil and gas activities and net assets on the
Norwegian continental shelf, is a co-obligor or
guarantor of certain debt obligations of Equinor ASA.
Equinor's condensed interim financial statements for
the fourth quarter of 2025 were authorised for issue
by the board of directors on 3 February 2026.
Basis of preparation
These condensed interim financial statements are
prepared in accordance with IAS 34 Interim Financial
Reporting as issued by the International Accounting
Standards Board (IASB) and as adopted by the
European Union (EU). The condensed interim
financial statements do not include all the
information and disclosures required by IFRS®
Accounting Standards for a complete set of financial
statements and should be read in conjunction with
the Consolidated annual financial statements for
2024. IFRS Accounting Standards as adopted by the
EU differs in certain respects from IFRS Accounting
Standards as issued by the IASB, however the
differences do not impact Equinor's financial
statements for the periods presented.
Certain amounts in the comparable years have been
reclassified to conform to current year presentation.
As a result of rounding differences, numbers or
percentages may not add up to the total.
The condensed interim financial statements are
unaudited.
Accounting policies
Except as described in section ‘Change in
accounting policy’ below, the accounting policies
applied in the preparation of the condensed interim
financial statements are consistent with those
applied in the preparation of Equinor’s consolidated
annual financial statements as at, and for the year
ended,
31 December 2024.
A description of the material accounting policies is
included in Equinor’s consolidated annual financial
statements for 2024. When determining fair value,
there have been no changes to the valuation
techniques or models and Equinor applies the same
sources of input and the same criteria for
categorisation in the fair value hierarchy as disclosed
in the Consolidated annual financial statements for
2024.
For information about IFRS Accounting Standards,
amendments to IFRS Accounting Standards and
IFRIC® Interpretations effective from 1 January
2025, that could affect the consolidated financial
statements, please refer to note 2 in Equinor’s
consolidated annual financial statements for 2024.
None of the amendments to IFRS Accounting
Standards effective from 1 January 2025 has had a
significant impact on the condensed interim financial
statements. Equinor has not early adopted any IFRS
Accounting Standards, amendments to IFRS
Accounting Standards or IFRIC Interpretations
issued but not yet effective.
Change in accounting policy
With effect from Q1 2025, Equinor has changed the
classification of cash collaterals for commodity
derivative transactions in the Consolidated balance
sheet from Cash and cash equivalents to
Prepayments and financial receivables (current),
with no impact on Total current assets. These
collateral deposits are related to certain
requirements set out by exchanges where Equinor is
participating and have previously been referred to as
restricted cash and cash equivalents. The
reclassification is intended to better reflect the nature
and purpose of the collateral deposits and to provide
more relevant information to stakeholders.
The change also affects the presentation in the
Consolidated statement of cash flows. With effect
from Q1 2025, the cash flows related to these
collateral deposits are included within Cash flows
provided by operating activities on a new line-item
named Cash collaterals for commodity derivative
transactions.
The change has been retrospectively applied to
comparative periods for consistency and
comparability. The comparative numbers are
restated in tables below.
Use of judgements and estimates
The preparation of financial statements in conformity
with IFRS Accounting Standards requires
management to make judgments, estimates and
assumptions that affect the application of accounting
policies and the reported amounts of assets,
liabilities, income and expenses. The estimates and
associated assumptions are reviewed on an on-
going basis and are based on historical experience
and various other factors that are believed to be
reasonable under the circumstances. These
estimates and assumptions form the basis for
making the judgments about carrying values of
assets and liabilities that are not readily apparent
from other sources. Actual results may differ from
these estimates. Please refer to
note 2 in Equinor’s consolidated annual financial
statements for 2024 for more information about
accounting judgement and key sources of estimation
uncertainty. Management’s future commodity price
assumptions applied in impairment and impairment
reversal assessments based on value in use were
updated with effect from the third quarter 2025. For
information on related impairments and reversals,
please refer to note 2 Segments. For impairments of
assets held for sale measured at fair value, please
see note 3 Acquisitions and disposals in this report.
Equinor fourth quarter 2025
28 | Condensed Interim financial statements and notes | FOURTH QUARTER 2025 REVIEW |
Consolidated balance sheet | At 31 December 2024 | At 31 December 2023/ 1 January 2024 | |||
(in USD million) | As reported | Restated | As reported | Restated | |
Cash and cash equivalents | 8,120 | 5,903 | 9,641 | 8,070 | |
Prepayments and financial receivables | 3,867 | 6,084 | 3,729 | 5,300 | |
Sum | 11,987 | 11,987 | 13,370 | 13,370 | |
Consolidated Statement of Cash Flows | Q1 2024 | Q2 2024 | First six months 2024 | Q3 2024 | First nine months 2024 | Q4 2024 | Full year 2024 | |||||||
(in USD million) | As reported | Restated | As reported | Restated | As reported | Restated | As reported | Restated | As reported | Restated | As reported | Restated | As reported | Restated |
Cash collaterals for commodity derivative transactions | — | 117 | — | 200 | — | 317 | — | (563) | — | (246) | — | (399) | — | (645) |
Cash flow provided by operating activities before taxes paid and working capital items | 9,689 | 9,806 | 9,748 | 9,948 | 19,437 | 19,754 | 9,233 | 8,670 | 28,670 | 28,424 | 9,813 | 9,414 | 38,483 | 37,838 |
Cash flows provided by operating activities | 9,021 | 9,138 | 1,611 | 1,811 | 10,632 | 10,948 | 7,057 | 6,495 | 17,689 | 17,443 | 2,421 | 2,022 | 20,110 | 19,465 |
Cash and cash equivalents at the beginning of the period (net of overdraft) | 9,641 | 8,070 | 9,682 | 8,227 | 9,641 | 8,070 | 8,641 | 7,386 | 9,641 | 8,070 | 8,002 | 6,184 | 9,641 | 8,070 |
Cash and cash equivalents at the end of the period (net of overdraft) | 9,682 | 8,227 | 8,641 | 7,386 | 8,641 | 7,386 | 8,002 | 6,184 | 8,002 | 6,184 | 8,120 | 5,903 | 8,120 | 5,903 |
Consolidated Statement of Cash Flows | Q1 2023 | Q2 2023 | First six months 2023 | Q3 2023 | First nine months 2023 | Q4 2023 | Full year 2023 | |||||||
(in USD million) | As reported | Restated | As reported | Restated | As reported | Restated | As reported | Restated | As reported | Restated | As reported | Restated | As reported | Restated |
Cash collaterals for commodity derivative transactions | — | 3,678 | — | 426 | — | 4,103 | — | (245) | — | 3,858 | — | 698 | — | 4,556 |
Cash flow provided by operating activities before taxes paid and working capital items | 15,305 | 18,982 | 10,485 | 10,910 | 25,789 | 29,893 | 11,336 | 11,091 | 37,126 | 40,984 | 10,890 | 11,588 | 48,016 | 52,572 |
Cash flows provided by operating activities | 14,871 | 18,548 | 1,857 | 2,283 | 16,728 | 20,831 | 5,236 | 4,992 | 21,965 | 25,823 | 2,736 | 3,434 | 24,701 | 29,257 |
Cash and cash equivalents at the beginning of the period (net of overdraft) | 15,579 | 9,451 | 17,380 | 14,930 | 15,579 | 9,451 | 19,650 | 17,626 | 15,579 | 9,451 | 14,420 | 12,151 | 15,579 | 9,451 |
Cash and cash equivalents at the end of the period (net of overdraft) | 17,380 | 14,930 | 19,650 | 17,626 | 19,650 | 17,626 | 14,420 | 12,151 | 14,420 | 12,151 | 9,641 | 8,070 | 9,641 | 8,070 |
Equinor fourth quarter 2025
29 | Condensed Interim financial statements and notes | FOURTH QUARTER 2025 REVIEW |
Note 2. Segments
Equinor’s operations are organised into business areas
and followed up through operating segments in order to
effectively manage and execute our strategy, including
the ability to measure the progress of the business
against its strategic goals. The operating segments are
defined based on the components of Equinor that are
regularly reviewed by the chief operating decision maker,
Equinor's Chief Executive Officer (CEO). The following
reportable segments correspond to the operating
segments: Exploration & Production Norway (E&P
Norway), Exploration & Production International (E&P
International), Exploration & Production USA (E&P USA),
Marketing, Midstream & Processing (MMP) and
Renewables (REN). Based on materiality considerations,
the remaining business areas Projects, Drilling &
Procurement (PDP) and Technology, Digital & Innovation
(TDI), as well as Corporate staff and functions, are
aggregated into the reportable segment Other. The
majority of the costs in PDP and TDI is allocated to the
three Exploration & Production segments, MMP and
REN.
The accounting policies of the reporting segments are
consistent with those described in these Consolidated
financial statements, except for the following:
movements related to changes in asset retirement
obligations are excluded from the line item Additions to
PP&E, intangibles and Equity accounted investments,
and provisions for onerous contracts reflect only
obligations towards group external parties. The
measurement basis of segment profit is net operating
income/(loss). Deferred tax assets, pension assets, non-
current financial assets, total current assets and total
liabilities are not allocated to the segments. Transactions
between the segments, mainly from the sale of crude oil,
gas, and related products, are performed at defined
internal prices which have been derived from market
prices. The transactions are eliminated upon
consolidation.
During the fourth quarter of 2025, Equinor made
changes to its organisational structure by establishing
the new Power business area (PWR). With effect from 1
January 2026, the operating results of PWR will undergo
regular review by the chief operating decision maker for
the purpose of resource allocation, and PWR will be
presented as a reportable segment in Equinor’s financial
statements from the first quarter of 2026. Comparable
segment information will be restated. The PWR business
area is responsible for all power activities, including
Renewables (REN) and flexible power assets from the
business area Marketing, Midstream and Processing
(MMP), as well as Danske Commodities power trading
business.
Net impairments
In the fourth quarter of 2025 Equinor recognised
impairments in the REN segment mainly related to
acquired early phase projects. In the second quarter, net
impairments of USD 955 million were recognised in the
REN segment related to Equinor’s offshore wind projects
on the US North East Coast. Regulatory changes
leading to reduced expected synergies from future
offshore wind projects and increased exposure to tariffs
impacted the project economics for the combined cash
generating unit encompassing Empire Wind 1 (EW1) and
South Brooklyn Marine Terminal (SBMT) negatively, as
well as the undeveloped Empire Wind 2 project. The
impairment test employed a value in use methodology
with a 3% real post-tax discount rate, and the total
carrying amount after impairment in the second quarter
was USD 2.3 billion.
Net impairments in E&P USA in the third quarter related
to Equinor's offshore producing assets in the Gulf of
America, following reduced production estimates,
increased cost estimates, and lower future Brent price
assumptions (75 USD/bbl during 2030-2040).
The net impairment reversal in MMP in the third quarter
mainly related to increased refinery margin assumptions
combined with extended economic lifetime of the
relevant asset.
For information about net impairments in E&P
International, see note 3 Acquisitions and
disposals.
Equinor fourth quarter 2025
30 | Condensed Interim financial statements and notes | FOURTH QUARTER 2025 REVIEW |
Fourth quarter 2025 | ||||||||
(in USD million) | E&P Norway | E&P International | E&P USA | MMP | REN | Other | Eliminations | Total Group |
Revenues third party | 97 | 146 | 54 | 24,961 | 17 | 22 | — | 25,296 |
Revenues and other income inter-segment | 7,700 | 732 | 983 | 222 | 9 | 8 | (9,655) | — |
Net income/(loss) from equity accounted investments | — | — | — | (30) | 55 | (12) | — | 12 |
Other income | 28 | (10) | 8 | (7) | 9 | 9 | — | 38 |
Total revenues and other income | 7,825 | 868 | 1,045 | 25,146 | 90 | 27 | (9,655) | 25,346 |
Purchases [net of inventory variation] | — | 77 | — | (22,793) | (1) | — | 9,652 | (13,064) |
Operating, selling, general and administrative expenses | (940) | (614) | (292) | (1,332) | (118) | (43) | 120 | (3,219) |
Depreciation and amortisation | (1,630) | (344) | (394) | (243) | (14) | (38) | — | (2,663) |
Net impairment (losses)/reversals | (173) | (201) | — | — | (252) | — | — | (626) |
Exploration expenses | (229) | (58) | — | — | — | — | — | (287) |
Total operating expenses | (2,972) | (1,140) | (686) | (24,368) | (385) | (81) | 9,773 | (19,860) |
Net operating income/(loss) | 4,853 | (271) | 359 | 778 | (295) | (54) | 117 | 5,487 |
Additions to PP&E, intangibles and equity accounted investments | 1,726 | 6,146 | 284 | 374 | 565 | 45 | — | 9,140 |
Equinor fourth quarter 2025
31 | Condensed Interim financial statements and notes | FOURTH QUARTER 2025 REVIEW |
Third quarter 2025 | ||||||||
(in USD million) | E&P Norway | E&P International | E&P USA | MMP | REN | Other | Eliminations | Total Group |
Revenues third party | 77 | 125 | 57 | 25,719 | 16 | 24 | — | 26,017 |
Revenues and other income inter-segment | 8,212 | 1,169 | 957 | 28 | 11 | 8 | (10,386) | — |
Net income/(loss) from equity accounted investments | — | — | — | (1) | (9) | (6) | — | (16) |
Other income | (11) | 22 | — | 8 | 15 | 14 | — | 48 |
Total revenues and other income | 8,278 | 1,315 | 1,014 | 25,753 | 34 | 40 | (10,386) | 26,049 |
Purchases [net of inventory variation] | — | (38) | — | (23,988) | (7) | — | 10,115 | (13,917) |
Operating, selling, general and administrative expenses | (926) | (532) | (569) | (1,323) | (70) | (74) | 182 | (3,312) |
Depreciation and amortisation | (1,602) | (269) | (405) | (217) | (13) | (38) | — | (2,543) |
Net impairment (losses)/reversals | — | (650) | (385) | 283 | (3) | — | — | (754) |
Exploration expenses | (132) | (80) | (39) | — | — | — | — | (252) |
Total operating expenses | (2,660) | (1,569) | (1,398) | (25,244) | (92) | (112) | 10,297 | (20,779) |
Net operating income/(loss) | 5,618 | (254) | (384) | 509 | (59) | (71) | (89) | 5,270 |
Additions to PP&E, intangibles and equity accounted investments | 1,557 | 695 | 314 | 307 | 773 | 34 | — | 3,679 |
Equinor fourth quarter 2025
32 | Condensed Interim financial statements and notes | FOURTH QUARTER 2025 REVIEW |
Fourth quarter 2024 | ||||||||
(in USD million) | E&P Norway | E&P International | E&P USA | MMP | REN | Other | Eliminations | Total Group |
Revenues third party | 61 | 164 | 62 | 26,208 | 19 | 22 | — | 26,535 |
Revenues and other income inter-segment | 9,152 | 1,211 | 896 | 246 | 5 | 8 | (11,519) | — |
Net income/(loss) from equity accounted investments | — | 3 | — | (17) | 26 | (5) | — | 6 |
Other income | 44 | 805 | — | 135 | 124 | 5 | — | 1,113 |
Total revenues and other income | 9,257 | 2,183 | 957 | 26,573 | 174 | 29 | (11,519) | 27,654 |
Purchases [net of inventory variation] | — | 64 | — | (24,175) | — | — | 11,243 | (12,869) |
Operating, selling, general and administrative expenses | (894) | (627) | (257) | (1,179) | (150) | 52 | 171 | (2,883) |
Depreciation and amortisation | (1,318) | (538) | (408) | (236) | (9) | (35) | — | (2,544) |
Net impairment (losses)/reversals | (64) | — | — | — | (216) | — | — | (280) |
Exploration expenses | (176) | (58) | (109) | — | — | — | — | (343) |
Total operating expenses | (2,452) | (1,159) | (773) | (25,590) | (374) | 16 | 11,414 | (18,919) |
Net operating income/(loss) | 6,805 | 1,024 | 184 | 983 | (200) | 45 | (105) | 8,735 |
Additions to PP&E, intangibles and equity accounted investments | 1,872 | 896 | 1,651 | 369 | 559 | 67 | — | 5,414 |
Equinor fourth quarter 2025
33 | Condensed Interim financial statements and notes | FOURTH QUARTER 2025 REVIEW |
Full year 2025 | ||||||||
(in USD million) | E&P Norway | E&P International | E&P USA | MMP | REN | Other | Eliminations | Total Group |
Revenues third party | 307 | 579 | 235 | 104,540 | 73 | 94 | — | 105,828 |
Revenues and other income inter-segment | 33,561 | 4,456 | 4,053 | 288 | 31 | 33 | (42,421) | — |
Net income/(loss) from equity accounted investments | — | — | — | (61) | 99 | (19) | — | 18 |
Other income | 524 | 67 | 8 | 2 | (10) | 25 | — | 616 |
Total revenues and other income | 34,392 | 5,102 | 4,296 | 104,769 | 192 | 132 | (42,421) | 106,462 |
Purchases [net of inventory variation] | — | (25) | — | (97,243) | (8) | (1) | 42,112 | (55,164) |
Operating, selling, general and administrative expenses | (3,834) | (2,217) | (1,477) | (5,190) | (396) | (199) | 536 | (12,778) |
Depreciation and amortisation | (5,697) | (1,318) | (1,705) | (919) | (47) | (151) | — | (9,838) |
Net impairment (losses)/reversals | (173) | (851) | (385) | 283 | (1,355) | — | — | (2,481) |
Exploration expenses | (567) | (222) | (60) | — | — | — | — | (849) |
Total operating expenses | (10,271) | (4,633) | (3,628) | (103,069) | (1,806) | (351) | 42,648 | (81,109) |
Net operating income/(loss) | 24,121 | 470 | 668 | 1,700 | (1,614) | (219) | 227 | 25,352 |
Additions to PP&E, intangibles and equity accounted investments | 7,366 | 8,224 | 1,199 | 1,142 | 2,837 | 124 | — | 20,892 |
Balance sheet information | ||||||||
Equity accounted investments1) | 4 | 5,574 | — | 693 | 2,039 | 193 | — | 8,504 |
Non-current segment assets | 32,170 | 13,644 | 11,825 | 3,899 | 4,772 | 881 | — | 67,192 |
Non-current assets not allocated to segments | 17,092 | |||||||
Total non-current assets (excl. assets classified as held for sale) | 92,787 | |||||||
1) The increase in Equity accounted investments within EPI mainly relates to the joint venture agreement with Shell in the UK, for more information please see note 3. | ||||||||
Equinor fourth quarter 2025
34 | Condensed Interim financial statements and notes | FOURTH QUARTER 2025 REVIEW |
Full year 2024 | ||||||||
(in USD million) | E&P Norway | E&P International | E&P USA | MMP | REN | Other | Eliminations | Total Group |
Revenues third party | 239 | 635 | 263 | 101,208 | 72 | 86 | — | 102,502 |
Revenues and other income inter-segment | 33,296 | 5,891 | 3,664 | 507 | 20 | 32 | (43,409) | — |
Net income/(loss) from equity accounted investments | — | 13 | — | (59) | 100 | (6) | — | 49 |
Other income | 108 | 804 | 30 | 136 | 124 | 21 | — | 1,223 |
Total revenues and other income | 33,643 | 7,343 | 3,957 | 101,792 | 317 | 133 | (43,409) | 103,774 |
Purchases [net of inventory variation] | — | 85 | — | (92,789) | — | — | 42,664 | (50,040) |
Operating, selling, general and administrative expenses | (3,612) | (2,123) | (1,142) | (4,919) | (687) | (44) | 742 | (11,786) |
Depreciation and amortisation | (4,890) | (2,064) | (1,607) | (949) | (34) | (140) | — | (9,684) |
Net impairment (losses)/reversals | (64) | — | — | 191 | (271) | (7) | — | (151) |
Exploration expenses | (513) | (496) | (176) | — | — | — | — | (1,185) |
Total operating expenses | (9,078) | (4,597) | (2,925) | (98,466) | (993) | (193) | 43,406 | (72,846) |
Net operating income/(loss) | 24,564 | 2,746 | 1,031 | 3,326 | (676) | (60) | (3) | 30,927 |
Additions to PP&E, intangibles and equity accounted investments | 6,285 | 3,191 | 3,862 | 953 | 2,153 | 250 | — | 16,695 |
Balance sheet information | ||||||||
Equity accounted investments | 4 | — | — | 768 | 1,530 | 168 | 2 | 2,471 |
Non-current segment assets | 26,695 | 14,662 | 12,490 | 3,259 | 3,138 | 971 | — | 61,214 |
Non-current assets not allocated to segments | 14,261 | |||||||
Total non-current assets (excl. assets classified as held for sale) | 77,946 |
Equinor fourth quarter 2025
35 | Condensed Interim financial statements and notes | FOURTH QUARTER 2025 REVIEW |
Non-current assets by country | ||
At 31 December | At 31 December | |
(in USD million) | 2025 | 2024 |
Norway1) | 35,932 | 30,017 |
USA | 16,472 | 15,638 |
Brazil | 10,234 | 11,487 |
UK2) | 7,349 | 1,641 |
Angola | 1,248 | 1,159 |
Poland | 1,088 | 644 |
Canada | 1,015 | 1,019 |
Argentina | 985 | 822 |
Denmark | 768 | 770 |
Germany | 301 | 287 |
Other | 303 | 202 |
Total non-current assets3) | 75,695 | 63,686 |
1)Increase is mainly due to weakening of USD versus NOK and acquisitions. For more information on acquisitions please see note 3. 2)This increase mainly relates to the Adura transaction, for more information please see note 3. 3)Excluding deferred tax assets, pension assets and non-current financial assets. Non-current assets are attributed to country of operations. | ||
Equinor fourth quarter 2025
36 | Condensed Interim financial statements and notes | FOURTH QUARTER 2025 REVIEW |
Note 3. Acquisitions and disposals
Acquisitions and disposals
Swap with Petoro in the Haltenbanken area
On 1 January 2025, Equinor closed a transaction with Petoro to swap ownership interests in the Haltenbanken
area. Equinor increased its ownership interests primarily in the Heidrun field (from 13.0% to 34.4%) and reduced its
interests primarily in the Tyrihans field (from 58.8% to 36.3%) and the Johan Castberg field (from 50.0% to 46.3%).
No cash consideration was involved. The purpose of the transaction was to align ownership interests in the
licences to maximise resource utilisation. The assets acquired and liabilities assumed were recognised in
accordance with the principles in IFRS 3 Business Combinations within the E&P Norway segment, mainly as
property, plant, and equipment (USD 610 million), goodwill (USD 476 million) and deferred tax liability (USD 381
million). The swap resulted in a gain of USD 491 million, reported as Other Income in the Consolidated statement
of income.
Joint venture agreement with Shell in the UK
On 1 December 2025, Equinor closed an agreement with Shell to merge their UK upstream businesses and
establish a joint venture, named Adura. The parties hold a 50% equity interest each. Selected UK North Sea
upstream fields, associated licences and infrastructure have been transferred by both parties to Adura, including
Equinor’s interests in Rosebank, Mariner and Buzzard. The owners will market Adura's oil and gas volumes and
also provide transitional services under temporary service agreements. The joint venture is accounted for under the
equity method from the date of transaction completion. Adura is recognised at fair value of USD 5,574 million. The
estimated fair value of performance based contingent consideration and interim period settlement have been
included in the loss of USD 174 million recognised within the E&P International segment in the fourth quarter 2025
and presented in the line-item Operating expenses in the Consolidated statement of income. An impairment loss of
USD 650 million was recognised in third quarter 2025, presented within the line-item Depreciation, amortisation
and net impairments in the Consolidated statement of income. The valuation of the notional Purchase Price
Allocation and the final interim period settlement have not been completed by the date the report was approved for
issuance by the Board of Directors.
Divestment of 40% interest in the Peregrino field in Brazil
On 11 November 2025, Equinor closed a transaction with Prio Tigris Ltda., a subsidiary of PRIO SA, to sell its 40%
operated interest in the Peregrino field in Brazil as part of the ongoing optimisation of Equinor’s international
upstream portfolio. Following this transaction, PRIO assumed full operatorship of the field. The total cash
consideration net of interim period adjustments amounted to USD 1,795 million, of which USD 1,555 million was
received at closing. A loss of USD 75 million has been recognised within the E&P International segment in the
fourth quarter as Operating expenses in the Consolidated statement of income.
Held for sale
Sale of remaining interests in the Peregrino field in Brazil
Equinor has also agreed to sell its remaining 20% interest in the Peregrino field. The sale is expected to be
completed within 2026, subject to regulatory and legal approvals. The net assets classified as held for sale were
measured at fair value at the end of the fourth quarter, leading to an impairment of USD 200 million. This is mainly
due to earnings during a longer than anticipated interim period, that will be deducted from the agreed consideration
at closing. As of 31 December 2025, assets held for sale amounted to USD 906 million, and liabilities directly
associated with the assets held for sale amounted to USD 179 million. Peregrino is part of the E&P International
segment.
Equinor fourth quarter 2025
37 | Condensed Interim financial statements and notes | FOURTH QUARTER 2025 REVIEW |
Note 4. Revenues
Revenues from contracts with customers by geographical areas
When attributing the line item Revenues from contracts with customers for the fourth quarter 2025 to the country of
the legal entity executing the sale, Norway and the USA accounted for 79% and 17%, respectively, of such
revenues (78% and 19%, respectively, for the third quarter of 2025 and 78% and 18%, respectively, for the fourth
quarter of 2024).
For the full year of 2025, Norway and the USA accounted for 77% and 19% of such revenues, respectively (79%
and 18% respectively for the full year of 2024). Revenues from contracts with customers are mainly reflecting such
revenues from the reporting segment MMP.
Revenues from contracts with customers and other revenues | |||||
Quarters | Full year | ||||
(in USD million) | Q4 2025 | Q3 2025 | Q4 2024 | 2025 | 2024 |
Crude oil | 13,337 | 15,114 | 13,333 | 58,396 | 58,249 |
Natural gas | 6,057 | 5,722 | 7,110 | 25,288 | 22,192 |
- European gas | 5,131 | 4,848 | 5,743 | 21,220 | 18,133 |
- North American gas | 593 | 445 | 315 | 2,067 | 1,044 |
- Other incl. Liquefied natural gas | 333 | 429 | 1,053 | 2,001 | 3,015 |
Refined products | 2,807 | 2,617 | 2,556 | 10,380 | 9,242 |
Natural gas liquids | 1,592 | 1,593 | 2,044 | 7,035 | 7,751 |
Power | 624 | 448 | 536 | 2,103 | 1,882 |
Transportation | 309 | 328 | 278 | 1,262 | 1,334 |
Other sales | 391 | 174 | 345 | 778 | 649 |
Revenues from contracts with customers | 25,117 | 25,998 | 26,202 | 105,242 | 101,298 |
Total other revenues1) | 180 | 19 | 333 | 586 | 1,204 |
Revenues | 25,296 | 26,017 | 26,535 | 105,828 | 102,502 |
1)This item mainly relates to commodity derivatives, lease revenues and income recognised from paying taxes in kind with commodities. | |||||
Note 5. Financial items
Quarters | Full year | ||||
(in USD million) | Q4 2025 | Q3 2025 | Q4 2024 | 2025 | 2024 |
Interest income and other financial income | 271 | 265 | 435 | 1,175 | 1,951 |
Interest expenses and other financial expenses | (394) | (366) | (401) | (1,436) | (1,582) |
Net foreign currency exchange gains/(losses) | (6) | 72 | 299 | (135) | 166 |
Gains/(losses) on financial investments | 353 | (552) | (885) | (112) | (522) |
Gains/(losses) other derivative financial instruments | 59 | (22) | 4 | 245 | 46 |
Net financial items | 283 | (604) | (548) | (265) | 58 |
In October 2025, Equinor participated in Ørsted’s DKK 60 billion rights issue to maintain the ownership share in the
company. The subscription of additional shares for USD 0.9 billion was settled in October 2025.
During 2025, Equinor issued USD bonds with maturities from 3 to 10 years for a total of USD 3.25 billion of which
USD 1.5 billion was issued in the fourth quarter.
During 2025, Equinor has drawn on project financing for a total amount of USD 2.7 billion, of which USD 0.3 billion
was drawn in the fourth quarter of 2025.
Equinor has a US Commercial paper programme available with a limit of USD 5 billion. As of 31 December 2025,
USD 0.2 billion were utilised compared to USD 4.1 billion utilised as of 31 December 2024.
Equinor fourth quarter 2025
38 | Condensed Interim financial statements and notes | FOURTH QUARTER 2025 REVIEW |
Note 6. Income taxes
Quarters | Full year | ||||
(in USD million) | Q4 2025 | Q3 2025 | Q4 2024 | 2025 | 2024 |
Income/(loss) before tax | 5,770 | 4,666 | 8,187 | 25,088 | 30,986 |
Income tax | (4,456) | (4,870) | (6,188) | (20,030) | (22,157) |
Effective tax rate | 77.2% | 104.4% | 75.6% | 79.8% | 71.5% |
The effective reported tax rate of 79.8% for the full year 2025 increased compared to 71.5% in 2024 due to higher
share of income from jurisdictions with high tax rates and the extension of the Energy Profits Levy in the UK. The
tax rate was also influenced by de-recognition of deferred tax assets and a loss related to the Adura joint venture
agreement with Shell in the UK, see note 3. The increase was partially offset by currency effects in entities that are
taxable in other currencies than the functional currency and the tax exempted gain from the swap with Petoro on
the NCS.
The effective tax rate of 77.2% for the fourth quarter of 2025 increased compared to 75.6% in 2024.The increase
was impacted by de-recognition of deferred tax assets and a loss related to the Adura joint venture agreement with
Shell, see note 3. The tax rate was also influenced by lower effect of the Energy Profits Levy in the UK. The
increase was partially offset by higher share of income from jurisdictions with low tax rates.
Note 7. Provisions
Asset retirement obligation
Equinor’s estimated asset retirement obligations (ARO) have increased by approximately USD 2.7 billion to USD
13.6 billion at 31 December 2025 compared to year-end 2024, mainly due to currency effects (USD weakening
versus NOK) and net increase in estimates.
Equinor fourth quarter 2025
39 | Condensed Interim financial statements and notes | FOURTH QUARTER 2025 REVIEW |
Note 8. Capital distribution
Dividend for the fourth quarter 2025 and share buy-back programme 2026
On 3 February 2026, the board of directors proposed to the annual general meeting on 12 May 2026 a cash
dividend for the fourth quarter of 2025 of USD 0.39 per share. The Equinor shares will trade ex-dividend 13 May
2026 on the Oslo Børs and 15 May for ADR holders on the New York Stock Exchange. Record date will be 15 May
and payment date will be 27 May 2026.
On 3 February 2026, the board of directors further decided to announce share buy-back for 2026 of up to USD 1.5
billion, subject to market outlook and balance sheet strength.
The first tranche of up to USD 375 million of the 2026 share buy-back programme will commence on 5 February
and end no later than 30 March 2026. This tranche is based on the authorisation from the annual general meeting
in May 2025, valid until the next annual general meeting, but no later than 30 June 2026. Commencement of new
share buy-back tranches after the first tranche in 2026 will be decided by the board of directors on a quarterly basis
in line with the company’s dividend policy, and will be subject to board authorisation for share buy-back from the
company’s annual general meeting and agreement with the Norwegian state regarding share buy-back.
Share buy-back programme 2025
Based on the authorisation from the annual general meeting on 14 May 2025, the board of directors has, on a
quarterly basis, decided on share buy-back tranches. The 2025 share buy-back programme was up to USD 5
billion, including shares to be redeemed from the Norwegian state.
In 2025, Equinor executed the first three tranches of USD 3,735 million in total, of which USD 1,114 million was
acquired in the market in the first nine months and USD 119 million was acquired in fourth quarter. In October
2025, Equinor launched the fourth and final tranche of USD 1,266 million including shares to be redeemed from the
Norwegian state, and entered into an irrevocable agreement with a third party to purchase shares for USD 418
million in the market. Of this fourth tranche, shares for USD 271 million have been purchased in the market and
settled as of 31 December 2025, whereas USD 418 million have been recognised as reduction in equity. The
market execution of the fourth tranche was completed in January 2026.
In order to maintain the Norwegian state’s ownership share in Equinor at 67%, a proportionate share of the second,
third and fourth tranche of the 2024 programme as well as the first tranche of the 2025 programme was redeemed
and cancelled through a capital reduction by the annual general meeting on 14 May 2025. The Norwegian state’s
share of USD 4,141 million (NOK 42.7 billion) following the capital reduction was settled in July 2025. A
proportionate share of the second, third and fourth tranche of the 2025 programme as well as the first tranche of
the 2026 programme will be redeemed and cancelled at the annual general meeting in May 2026.
Full year | ||
Equity impact of share buy-back programmes (in USD million) | 2025 | 2024 |
First tranche | 397 | 396 |
Second tranche | 418 | 528 |
Third tranche | 418 | 528 |
Fourth tranche | 418 | 528 |
Norwegian state share1) | 4,141 | 3,956 |
Total | 5,791 | 5,936 |
1)Relates to second to fourth tranche of previous year programme and first tranche of current year programme | ||
Equinor fourth quarter 2025
40 | Condensed Interim financial statements and notes | FOURTH QUARTER 2025 REVIEW |
Note 9. Geopolitical and market uncertainty
Geopolitical and market uncertainty
The geopolitical and macroeconomic uncertainty relating to announcements and policy updates in the US
regarding international trade continue to prevail. As the policy changes, both substance and duration, are
developing, so are the implications for economic growth, demand for energy, supply costs, inflation, interest rates
and foreign exchange rates. Equinor is affected by the global macroeconomic conditions, which in turn affect our
financial performance. Given the current uncertainty, potential developments could unfold in various directions.
Equinor is actively assessing the impact of these uncertainties; however, the resulting operational and economic
effects on the company cannot fully be determined at this time.
As of the fourth quarter of 2025, there is an increased risk associated with offshore wind projects in the U.S.,
including the development of the Empire Wind project which is owned by Empire Offshore Wind LLC (Empire), a
100% owned Equinor subsidiary. The Bureau of Ocean Energy Management issued a second stop work order on
December 22, 2025 (the Order) ordering the suspension of ongoing activities on the Outer Continental Shelf citing
national security concerns. The US Department of Interior has confirmed that a total of five offshore wind projects
under construction have received notices. Empire has filed a lawsuit challenging the validity of the Order.
Furthermore, on January 15, 2026, the U.S. District Court for the District of Columbia granted a preliminary
injunction allowing construction to resume while the underlying case is considered. The injunction enables work to
continue without significant delays or adverse financial consequences for the project.
On 31 December 2025, the gross book value of Equinor’s assets related to the Empire Wind project was around
USD 3.7 billion, including South Brooklyn Marine Terminal. In addition, the total amount drawn under the project
finance term loan facility per 31 December 2025 was USD 2.7 billion.
Note 10. Subsequent events
Agreement to sell Equinor’s onshore assets in Argentina
On 2 February 2026, Equinor announced that it had entered into an agreement with Vista Energy to divest its full
onshore position in Argentina’s Vaca Muerta basin, and the assets have met the requirements for classification as
held for sale after the reporting period. The transaction includes Equinor’s 30% non-operated interest in Bandurria
Sur and its 50% non-operated interest in Bajo del Toro within the E&P International segment. The total
consideration before interim period adjustments is estimated to around USD 1,100 million, consisting of USD 550
million in cash at closing and the remainder in Vista shares and contingent payments linked to production and oil
prices over a five-year period. The transaction has an effective date of 1 July 2025. Closing of the transaction is
subject to relevant approvals, and is expected within 2026.

Equinor fourth quarter 2025
42 | Supplementary disclosures | FOURTH QUARTER 2025 REVIEW |
Supplementary disclosures
Exchange rates
Quarters | Change | Full year | |||||
Exchange rates | Q4 2025 | Q3 2025 | Q4 2024 | Q4 on Q4 | 2025 | 2024 | Change |
USD/NOK average daily exchange rate | 10.0978 | 10.0995 | 11.0072 | (8)% | 10.3912 | 10.7434 | (3)% |
EUR/USD average daily exchange rate | 1.1632 | 1.1680 | 1.0683 | 9% | 1.1277 | 1.0823 | 4% |
Quarters | Change | Full year | Full year | ||||
Q4 2025 | Q3 2025 | Q4 2024 | Q4 on Q4 | 2025 | 2024 | Change | |
USD/NOK period-end exchange rate | 10.0791 | 9.9877 | 11.3534 | (11)% | 10.0791 | 11.3534 | (11)% |
EUR/USD period-end exchange rate | 1.1750 | 1.1741 | 1.0389 | 0% | 1.1750 | 1.0389 | 0% |
Use and reconciliation of Non-GAAP financial
measures
Non-GAAP financial measures are defined as
numerical measures that either exclude or include
amounts that are not excluded or included in the
comparable measures calculated and presented in
accordance with GAAP (i.e., IFRS Accounting
Standards in the case of Equinor). The following
financial measures included in this report may be
considered non-GAAP financial measures:
Adjusted operating income is based on net
operating income/ (loss) and adjusts for certain items
affecting the income for the period to separate out
effects that management considers may not be well
correlated to Equinor’s underlying operational
performance in the individual reporting period.
Management believes adjusted operating income
provides an indication of Equinor’s underlying
operational performance and facilitates comparison
of operational trends between periods.
Adjusted operating income after tax equals
adjusted operating income less tax on adjusted
operating income. Tax on adjusted operating income
is computed by adjusting the income tax for tax
effects of adjustments made to net operating
income. The tax rate applied is the tax rate
applicable to each adjusting item and tax regime,
adjusted for certain foreign currency effects as well
as effects of specific changes to deferred tax assets.
Management believes adjusted operating income
after tax provides an indication of Equinor’s
underlying operational performance after tax and
facilitates comparisons of operational trends after tax
between periods as it reflects the tax charge
associated with operational performance excluding
the impact of financing. Tax on adjusted operating
income should not be considered indicative of the
amount of current or total tax expense (or taxes
payable) for the period.
Adjusted net income is based on net income/(loss)
and provides additional transparency to Equinor’s
underlying financial performance by also including
net financial items and the associated tax effects.
This measure includes adjustments made to arrive at
adjusted operating income after tax, in addition to
specific adjustments related to net financial items
and related tax effects, as well as certain
adjustments to income tax as described below.
Management believes this measure provides an
indication of Equinor’s underlying financial
performance including the impact from financing and
facilitates comparison of trends between periods.
Adjusted Earnings Per Share (Adjusted EPS) is
computed by dividing Adjusted net income by the
weighted average number of shares outstanding
during the period. Earnings per share is a metric that
is frequently used by investors, analysts and other
parties to assess a company's profitability per share.
Management believes this measure provides an
indication of Equinor’s underlying financial
performance including the impact from financing and
facilitates comparison of trends between periods.
The non-GAAP financial measures presented above
are supplementary measures and should not be
viewed in isolation or as substitutes for net operating
income/(loss), net income/(loss) and earnings per
share, which are the most directly comparable IFRS
Accounting Standards measures. The reconciliation
tables later in this report reconcile the above non-
GAAP measures to the most directly comparable
IFRS Accounting Standards measure or measures.
There are material limitations associated with the
above measures compared with the IFRS
Accounting Standards measures, as these non-
GAAP measures do not include all the items of
revenues/ gains or expenses/losses of Equinor that
are required to evaluate its profitability on an overall
basis. The non-GAAP measures are only intended to
be indicative of the underlying developments in
trends of our on-going operations.
Adjusted operating income adjusts for the
following items:
•Changes in fair value of derivatives:
In the ordinary course of business, Equinor
enters into commodity derivative contracts to
manage the price risk exposure relating to future
sale and purchase contracts. These commodity
derivatives are measured at fair value at each
reporting date, with the movements in fair value
recognised in the income statement. By contrast,
the related sale and purchase contracts are not
recognised until the transaction occurs resulting
in timing differences. Therefore, the unrealised
movements in the fair value of these commodity
derivative contracts are excluded from adjusted
operating income and deferred until the time of
the physical delivery to minimise the effect of
these timing differences. Further, embedded
derivatives within certain gas contracts and
contingent consideration related to historical
divestments are carried at fair value. Any
accounting impacts resulting from such changes
in fair value are also excluded from adjusted
operating income, as these fluctuations are not
Equinor fourth quarter 2025
43 | Supplementary disclosures | FOURTH QUARTER 2025 REVIEW |
indicative of the underlying performance of the
business.
•Periodisation of inventory hedging effect:
Equinor enters into derivative contracts to
manage price risk exposure relating to its
commercial storage. These derivative contracts
are carried at fair value while the inventories are
accounted for at the lower of cost or market
price. An adjustment is made to align the
valuation principles of inventories with related
derivative contracts. The adjusted valuation of
inventories is based on the forward price at the
expected realisation date. This is so that the
valuation principles between commercial
storages and derivative contracts are better
aligned.
•The operational storage is not hedged and is
not part of the trading portfolio. Cost of goods
sold is measured based on the FIFO (first-in,
first-out) method, and includes realised gains or
losses that arise due to changes in market
prices. These gains or losses will fluctuate from
one period to another and are not considered
part of the underlying operations for the period.
•Impairment and reversal of impairment are
excluded from adjusted operating income since
they affect the economics of an asset for the
lifetime of that asset, not only the period in which
it is impaired, or the impairment is reversed.
Impairment and reversal of impairment can
impact both the exploration expenses and the
depreciation, amortisation and net impairment
line items.
•Gain or loss from sales of assets is eliminated
from the measure since the gain or loss does not
give an indication of future performance or
periodic performance; such a gain or loss is
related to the cumulative value creation from the
time the asset is acquired until it is sold.
•Eliminations (Internal unrealised profit on
inventories): Volumes derived from equity oil
inventory vary depending on several factors and
inventory strategies, i.e., level of crude oil in
inventory, equity oil used in the refining process
and level of in-transit cargoes. Internal profit
related to volumes sold between entities within
the group, and still in inventory at period end, is
eliminated according to IFRS Accounting
Standards (write down to production cost). The
proportion of realised versus unrealised gain
fluctuates from one period to another due to
inventory strategies and consequently impact net
operating income/ (loss). Write-down to
production cost is not assessed to be a part of
the underlying operational performance, and
elimination of internal profit related to equity
volumes is excluded in adjusted operating
income.
•Other items of income and expense are
adjusted when the impacts on income in the
period are not reflective of Equinor’s underlying
operational performance in the reporting period.
Such items may be unusual or infrequent
transactions, but they may also include
transactions that are significant which would not
necessarily qualify as either unusual or
infrequent. However, other items adjusted do not
constitute normal, recurring income and
operating expenses for the company. Other items
are carefully assessed and can include
transactions such as provisions related to
reorganisation, early retirement, etc.
•Change in accounting policy is adjusted when
the impacts on income in the period are unusual
or infrequent, and not reflective of Equinor’s
underlying operational performance in the
reporting period.
Adjusted net income incorporates the
adjustments above, as well as the following items
impacting net financial items:
•Changes in fair value of financial derivatives
used to hedge interest bearing instruments.
Equinor enters into financial derivative contracts
to manage interest rate risk on long term interest-
bearing liabilities including bonds and financial
loans. The financial derivative contracts (hedging
instruments) are measured at fair value at each
reporting date, with movements in fair value
recognised in the income statement. The long
term interest-bearing liabilities are measured at
amortised cost and not remeasured at fair value
at each reporting date. This creates
measurement differences and therefore the
movements in the fair value of these financial
derivative contracts and associated tax effects
are excluded from the calculation of adjusted net
income and deferred until the time the underlying
instrument is matured, exercised, or settled.
Management believes that this appropriately
reflects the economic effect of these risk
management activities in each period and
provides an indication of Equinor’s underlying
financial performance.
•Foreign currency gains/losses on positions
used to manage currency risk exposure
related to future payments in NOK and
foreign currency gains/losses on
intercompany bank balances. Foreign currency
gains/losses on positions used to manage
currency risk exposure (cash equivalents/
financial investments and related currency
derivatives where applicable), as well as
currency gains/losses on intercompany bank
balances are eliminated from adjusted net
income. The currency effects on intercompany
bank balances are mainly due to a large part of
Equinor’s operations having a functional currency
different from USD, and these effects are offset
within equity as other comprehensive income
arising on translation from functional currency to
presentation currency USD. These currency
effects increase volatility in financial
performance, which does not reflect Equinor’s
underlying financial performance. Management
believes that these adjustments remove periodic
fluctuations in Equinor’s adjusted net income.
Adjustments made to arrive at adjusted operating
income and adjusted net income listed below are
similarly applied to net income/(loss) from equity
accounted investments when relevant.
Adjustments to income tax and tax rate:
•Derecognition of deferred tax assets or
recognition of previously unrecognised
deferred tax assets. These changes are related
to taxable income in future reporting periods and
are not reflective of performance in the current
reporting period.
•Income tax effects arising only when
calculating income tax in the functional
currency USD. Certain group companies have
USD as functional currency, which is different
from the currency in which the taxable income is
measured (tax currency). Income tax effects
arising only when calculating income tax in the
functional currency USD, that are not part of the
tax calculation in the tax currency, are adjusted
for. Management believes this better aligns the
effective tax rate in functional currency with the
statutory tax rate in the period.
Net debt to capital employed ratio – In Equinor’s
view, net debt ratios provide a more informative
picture of Equinor’s financial strength than gross
interest-bearing financial debt. Three different net
debt to capital ratios are presented in this report: 1)
net debt to capital employed, 2) net debt to capital
employed adjusted, including lease liabilities, and 3)
net debt to capital employed adjusted. These
calculations are all based on Equinor’s gross
interest-bearing financial liabilities as recorded in the
Consolidated balance sheet and exclude cash, cash
equivalents and current financial investments.
The following adjustments are made in calculating
the net debt to capital employed adjusted, including
lease liabilities ratio and the net debt to capital
employed adjusted ratio: financial investments held
in Equinor Insurance AS (classified as Current
Equinor fourth quarter 2025
44 | Supplementary disclosures | FOURTH QUARTER 2025 REVIEW |
financial investments in the Consolidated balance
sheet) are treated as non-cash and excluded from
the calculation of these non-GAAP measures, as
these investments are not readily available for the
group to meet short term commitments. These
adjustments result in a higher net debt figure and in
Equinor’s view provides a more prudent measure of
the net debt to capital employed ratio than would be
the case without such exclusions. Additionally, lease
liabilities are further excluded in calculating the net
debt to capital employed adjusted ratio. The table
Calculation of capital employed and net debt to
capital employed ratio later in this report details the
calculations for these non-GAAP measures and
reconciles them with the most directly comparable
IFRS Accounting Standards financial measure or
measures.
Organic capital expenditures (organic
investments/capex) – Capital expenditures is defined
as Additions to PP&E, intangibles and equity
accounted investments, which excludes assets held
for sale, as presented in note 2 Segments to the
Condensed interim financial statements. Organic
capital expenditures are capital expenditures
excluding expenditures related to acquisitions,
leased assets and other investments with
significantly different cash flow patterns. Equinor
believes this measure gives stakeholders relevant
information to understand the company’s
investments in maintaining and developing its
assets. Forward-looking organic capital expenditures
included in this report are not reconcilable to its most
directly comparable IFRS Accounting Standards
measure without unreasonable efforts, because the
amounts excluded from such IFRS Accounting
Standards measure to determine organic capital
expenditures cannot be predicted with reasonable
certainty.
Cash flows from operations after taxes paid
(CFFO after taxes paid) represents, and is used by
management, to evaluate cash generated from
operating activities after taxes paid, which is
available for investing activities, debt servicing and
distribution to shareholders. Cash flows from
operations after taxes paid is not a measure of our
liquidity under IFRS Accounting Standards and
should not be considered
in isolation or as a substitute for an analysis of our
results as reported in this report. Our definition of
Cash flows from operations after taxes paid is limited
and does not represent residual cash flows available
for discretionary expenditures. The table Calculation
of CFFO after taxes paid and net cash flow later in
this report provides a reconciliation of Cash flows
from operations after taxes paid to its most directly
comparable IFRS Accounting Standards measure,
Cash flows provided by operating activities before
taxes paid and working capital items, as of the
specified dates.
Net cash flow before capital distribution - Net
cash flow before capital distribution represents, and
is used by management to evaluate, cash generated
from operational and investing activities available for
debt servicing and distribution to shareholders. Net
cash flow before capital distribution is not a measure
of our liquidity under IFRS Accounting Standards
and should not be considered in isolation or as a
substitute for an analysis of our results as reported in
this report. Our definition of Net cash flow before
capital distribution is limited and does not represent
residual cash flows available for discretionary
expenditures. The table Calculation of CFFO after
taxes paid and net cash flow later in this report
provides a reconciliation of Net cash flow before
capital distribution to its most directly comparable
IFRS Accounting Standards measure, Cash flows
provided by operating activities before taxes paid
and working capital items, as of the specified dates.
Net cash flow - Net cash flow represents, and is
used by management to evaluate, cash generated
from operational and investing activities available for
debt servicing. Net cash flow is not a measure of our
liquidity under IFRS Accounting Standards and
should not be considered in isolation or as a
substitute for an analysis of our results as reported in
this report. Our definition of Net cash flow is limited
and does not represent residual cash flows available
for discretionary expenditures. The table Calculation
of CFFO after taxes paid and net cash flow later in
this report provides a reconciliation of Net cash flow
to its most directly comparable IFRS Accounting
Standards measure, Cash flows provided by
operating activities before taxes paid and working
capital items, as of the specified dates.
Free cash flow (adjusted) - Free cash flow
represents, and is used by management, to evaluate
cash generated from operating activities after taxes
paid after allocation of cash to organic capital
expenditures, including shareholder loans to equity
accounted investments, which is available for
corporate debt servicing (including lease liabilities),
distribution of cash to shareholders, and inorganic
investments. Net cash received or paid related to
external project financing in consolidated
subsidiaries, is included. Tax credits and other
government grants are included at recognition.
Free cash flow is based on Cash flows provided by
operating activities before taxes paid and working
capital items, less taxes paid as presented in
separate line items in the cash flow statement.
Deductions are made for allocation of cash to
organic capital expenditures (adjusted for related
government grants and tax credits) and shareholder
loans to equity accounted investments. Net cash
received or paid in relation to external project
financing in subsidiaries is included.
Free cash flow is not a measure of our liquidity under
IFRS Accounting Standards and should not be
considered in isolation or as a substitute for an
analysis of our results as reported in this report. Our
definition of Free cash flow is limited and does not
represent residual cash flows available for
discretionary expenditures.
Return on average capital employed (ROACE) –
ROACE is the ratio of adjusted operating income
after tax to the average capital employed adjusted.
For a reconciliation for adjusted operating income
after tax, see Reconciliation of adjusted operating
income as presented later in this report. Average
capital employed adjusted refers to the average of
the capital employed adjusted values as of 31
December for both the current and the preceding
year, as presented in the table Calculation of capital
employed and net debt to capital employed ratio
later in this report.
Equinor uses ROACE to evaluate performance by
measuring how effectively the company employs its
capital, whether financed through equity or debt.
An IFRS Accounting Standards measure most
directly comparable to ROACE would be calculated
as the ratio of net income/(loss) to average capital
employed that is based on Equinor’s gross interest-
bearing financial liabilities as recorded in the
Consolidated balance sheet, excluding cash, cash
equivalents and current financial investments.
ROACE is used as a supplementary measure and
should not be viewed in isolation or as an alternative
to measures calculated in accordance with IFRS
Accounting Standards, including income before
financial items, income taxes and minority interest,
or net income, or ratios based on these figures.
Forward-looking ROACE included in this report is not
reconcilable to its most directly comparable IFRS
Accounting Standards measure without
unreasonable efforts, because the amounts included
or excluded from IFRS Accounting Standards
measures used to determine ROACE cannot be
predicted with reasonable certainty.
Equinor fourth quarter 2025
45 | Supplementary disclosures | FOURTH QUARTER 2025 REVIEW |
For more information on our definitions and use of
non-GAAP financial measures, see section 5.5 Use
and reconciliation of non-GAAP financial measures
in Equinor's 2024 Annual Report.
Equinor fourth quarter 2025
46 | Supplementary disclosures | FOURTH QUARTER 2025 REVIEW |
Reconciliation of adjusted operating income
The table specifies the adjustments made to each of the profit and loss line item included in the net operating income/(loss) subtotal.
Items impacting net operating income/(loss) in the fourth quarter of 2025 (in USD million) | Equinor Group | E&P Norway | E&P International | E&P USA | MMP | REN | Other |
Net operating income/(loss) | 5,487 | 4,853 | (271) | 359 | 778 | (295) | 63 |
Total revenues and other income | 25,346 | 7,825 | 868 | 1,045 | 25,146 | 90 | (9,628) |
Adjusting items | (86) | — | 9 | — | (102) | 7 | — |
Changes in fair value of derivatives | (111) | — | — | — | (111) | — | — |
Gain/loss on sale of assets | 9 | — | 9 | — | — | — | — |
Other adjustments | 50 | — | — | — | 36 | 15 | — |
Periodisation of inventory hedging effect | (27) | — | — | — | (27) | — | — |
Provisions | (8) | — | — | — | — | (8) | — |
Adjusted total revenues and other income | 25,260 | 7,825 | 877 | 1,045 | 25,044 | 97 | (9,628) |
Purchases [net of inventory variation] | (13,064) | — | 77 | — | (22,793) | (1) | 9,652 |
Adjusting items | (81) | — | — | — | 37 | — | (117) |
Eliminations | (117) | — | — | — | — | — | (117) |
Operational storage effects | 37 | — | — | — | 37 | — | — |
Adjusted purchases [net of inventory variation] | (13,145) | — | 77 | — | (22,756) | (1) | 9,535 |
Operating and administrative expenses | (3,219) | (940) | (614) | (292) | (1,332) | (118) | 77 |
Adjusting items | 250 | — | 275 | — | (35) | 10 | — |
Gain/loss on sale of assets | 282 | — | 275 | — | — | 7 | — |
Other adjustments | 3 | — | — | — | — | 3 | — |
Provisions | (35) | — | — | — | (35) | — | — |
Adjusted operating and administrative expenses | (2,969) | (940) | (339) | (292) | (1,367) | (109) | 77 |
Items impacting net operating income/(loss) in the fourth quarter of 2025 (in USD million) | Equinor Group | E&P Norway | E&P International | E&P USA | MMP | REN | Other |
Depreciation, amortisation and net impairments | (3,290) | (1,803) | (545) | (394) | (243) | (266) | (38) |
Adjusting items | 626 | 173 | 201 | — | — | 252 | — |
Impairment | 626 | 173 | 201 | — | — | 252 | — |
Adjusted depreciation, amortisation and net impairments | (2,663) | (1,630) | (344) | (394) | (243) | (14) | (38) |
Exploration expenses | (287) | (229) | (58) | — | — | — | — |
Adjusting items | — | — | — | — | — | — | — |
Adjusted exploration expenses | (287) | (229) | (58) | — | — | — | — |
Sum of adjusting items | 709 | 173 | 485 | — | (100) | 269 | (117) |
Adjusted operating income/(loss) | 6,196 | 5,026 | 214 | 359 | 678 | (26) | (54) |
Tax on adjusted operating income | (4,645) | (3,915) | (93) | (122) | (489) | (21) | (6) |
Adjusted operating income/(loss) after tax | 1,551 | 1,112 | 121 | 237 | 189 | (47) | (60) |
Equinor fourth quarter 2025
47 | Supplementary disclosures | FOURTH QUARTER 2025 REVIEW |
Items impacting net operating income/(loss) in the fourth quarter 2024 (in USD million) | Equinor Group | E&P Norway | E&P International | E&P USA | MMP | REN | Other |
Net operating income/(loss) | 8,735 | 6,805 | 1,024 | 184 | 983 | (200) | (60) |
Total revenues and other income | 27,654 | 9,257 | 2,183 | 957 | 26,573 | 174 | (11,490) |
Adjusting items | (1,236) | — | (805) | — | (307) | (124) | (0) |
Changes in fair value of derivatives | (102) | — | — | — | (102) | — | — |
Gain/loss on sale of assets | (941) | — | (805) | — | (135) | — | (0) |
Periodisation of inventory hedging effect | (70) | — | — | — | (70) | — | — |
Provisions | (124) | — | — | — | — | (124) | — |
Adjusted total revenues and other income | 26,418 | 9,257 | 1,378 | 957 | 26,266 | 50 | (11,490) |
Purchases [net of inventory variation] | (12,869) | — | 64 | — | (24,175) | — | 11,243 |
Adjusting items | 87 | — | — | — | (19) | — | 105 |
Eliminations | 105 | — | — | — | — | — | 105 |
Operational storage effects | (14) | — | — | — | (14) | — | — |
Provisions | (5) | — | — | — | (5) | — | — |
Adjusted purchases [net of inventory variation] | (12,782) | (—) | 64 | — | (24,194) | — | 11,348 |
Operating and administrative expenses | (2,883) | (894) | (627) | (257) | (1,179) | (150) | 223 |
Adjusting items | 99 | — | 84 | — | 2 | 13 | — |
Gain/loss on sale of assets | 84 | — | 84 | — | — | — | — |
Other adjustments | 13 | — | — | — | — | 13 | — |
Provisions | 2 | — | — | — | 2 | — | — |
Adjusted operating and administrative expenses | (2,784) | (894) | (542) | (257) | (1,176) | (137) | 223 |
Items impacting net operating income/(loss) in the fourth quarter 2024 (in USD million) | Equinor Group | E&P Norway | E&P International | E&P USA | MMP | REN | Other |
Depreciation, amortisation and net impairments | (2,824) | (1,382) | (538) | (408) | (236) | (225) | (35) |
Adjusting items | 211 | — | — | — | — | 211 | — |
Impairment | 211 | — | — | — | — | 211 | — |
Adjusted depreciation, amortisation and net impairments | (2,612) | (1,382) | (538) | (408) | (236) | (13) | (35) |
Exploration expenses | (343) | (176) | (58) | (109) | — | — | — |
Adjusting items | — | — | — | — | — | — | — |
Adjusted exploration expenses | (343) | (176) | (58) | (109) | — | — | — |
Sum of adjusting items | (839) | — | (721) | — | (324) | 100 | 105 |
Adjusted operating income/(loss) | 7,896 | 6,805 | 303 | 184 | 659 | (100) | 45 |
Tax on adjusted operating income | (5,603) | (5,276) | (27) | (12) | (302) | 13 | — |
Adjusted operating income/(loss) after tax | 2,292 | 1,529 | 276 | 172 | 356 | (87) | 45 |
Equinor fourth quarter 2025
48 | Supplementary disclosures | FOURTH QUARTER 2025 REVIEW |
Items impacting net operating income/(loss) in the third quarter of 2025 (in USD million) | Equinor Group | E&P Norway | E&P International | E&P USA | MMP | REN | Other |
Net operating income/(loss) | 5,270 | 5,618 | (254) | (384) | 509 | (59) | (160) |
Total revenues and other income | 26,049 | 8,278 | 1,315 | 1,014 | 25,753 | 34 | (10,345) |
Adjusting items | 14 | — | — | — | 18 | (5) | — |
Changes in fair value of derivatives | 51 | — | — | — | 51 | — | — |
Gain/loss on sale of assets | (5) | — | — | — | — | (5) | — |
Other adjustments | (19) | — | — | — | (19) | — | — |
Periodisation of inventory hedging effect | (13) | — | — | — | (13) | — | — |
Adjusted total revenues and other income | 26,063 | 8,278 | 1,315 | 1,014 | 25,772 | 29 | (10,345) |
Purchases [net of inventory variation] | (13,917) | — | (38) | — | (23,988) | (7) | 10,115 |
Adjusting items | 92 | — | — | — | 3 | — | 89 |
Eliminations | 89 | — | — | — | — | — | 89 |
Operational storage effects | 3 | — | — | — | 3 | — | — |
Adjusted purchases [net of inventory variation] | (13,826) | — | (38) | — | (23,985) | (7) | 10,204 |
Operating and administrative expenses | (3,312) | (926) | (532) | (569) | (1,323) | (70) | 108 |
Adjusting items | 49 | — | — | — | 53 | (3) | — |
Other adjustments | (4) | — | — | — | — | (4) | — |
Provisions | 53 | — | — | — | 53 | — | — |
Adjusted operating and administrative expenses | (3,263) | (926) | (532) | (569) | (1,270) | (74) | 108 |
Items impacting net operating income/(loss) in the third quarter of 2025 (in USD million) | Equinor Group | E&P Norway | E&P International | E&P USA | MMP | REN | Other |
Depreciation, amortisation and net impairments | (3,297) | (1,602) | (919) | (790) | 67 | (15) | (38) |
Adjusting items | 754 | — | 650 | 385 | (283) | 3 | — |
Impairment | 1,050 | — | 650 | 385 | 15 | — | — |
Other adjustments | 3 | — | — | — | — | 3 | — |
Reversal of impairment | (299) | — | — | — | (299) | — | — |
Adjusted depreciation, amortisation and net impairments | (2,543) | (1,602) | (269) | (405) | (217) | (13) | (38) |
Exploration expenses | (252) | (132) | (80) | (39) | — | — | — |
Adjusting items | 36 | — | — | 36 | — | — | — |
Impairment | 36 | — | — | 36 | — | — | — |
Adjusted exploration expenses | (216) | (132) | (80) | (3) | — | — | — |
Sum of adjusting items | 944 | — | 650 | 421 | (209) | (6) | 89 |
Adjusted operating income/(loss) | 6,215 | 5,618 | 396 | 37 | 299 | (64) | (71) |
Tax on adjusted operating income | (4,710) | (4,357) | (173) | (11) | (172) | 6 | (2) |
Adjusted operating income/(loss) after tax | 1,505 | 1,261 | 223 | 25 | 127 | (58) | (73) |
Equinor fourth quarter 2025
49 | Supplementary disclosures | FOURTH QUARTER 2025 REVIEW |
Items impacting net operating income/(loss) in the full year of 2025 (in USD million) | Equinor Group | E&P Norway | E&P International | E&P USA | MMP | REN | Other |
Net operating income/(loss) | 25,352 | 24,121 | 470 | 668 | 1,700 | (1,614) | 8 |
Total revenues and other income | 106,462 | 34,392 | 5,102 | 4,296 | 104,769 | 192 | (42,290) |
Adjusting items | (426) | (491) | (40) | — | 76 | 29 | — |
Changes in fair value of derivatives | 49 | — | — | — | 49 | — | — |
Gain/loss on sale of assets | (465) | (491) | 9 | — | (1) | 18 | — |
Other adjustments | (8) | — | (49) | — | 22 | 19 | — |
Periodisation of inventory hedging effect | 6 | — | — | — | 6 | — | — |
Provisions | (8) | — | — | — | — | (8) | — |
Adjusted total revenues and other income | 106,036 | 33,901 | 5,062 | 4,296 | 104,845 | 221 | (42,290) |
Purchases [net of inventory variation] | (55,164) | — | (25) | — | (97,243) | (8) | 42,112 |
Adjusting items | (162) | — | — | — | 65 | — | (227) |
Eliminations | (227) | — | — | — | — | — | (227) |
Operational storage effects | 65 | — | — | — | 65 | — | — |
Adjusted purchases [net of inventory variation] | (55,326) | — | (25) | — | (97,178) | (8) | 41,885 |
Operating and administrative expenses | (12,778) | (3,834) | (2,217) | (1,477) | (5,190) | (396) | 337 |
Adjusting items | 309 | — | 289 | — | 6 | 14 | — |
Gain/loss on sale of assets | 297 | — | 289 | — | — | 9 | — |
Other adjustments | 6 | — | — | — | — | 6 | — |
Provisions | 6 | — | — | — | 6 | — | — |
Adjusted operating and administrative expenses | (12,469) | (3,834) | (1,928) | (1,477) | (5,184) | (382) | 337 |
Items impacting net operating income/(loss) in the full year of 2025 (in USD million) | Equinor Group | E&P Norway | E&P International | E&P USA | MMP | REN | Other |
Depreciation, amortisation and net impairments | (12,318) | (5,870) | (2,169) | (2,090) | (636) | (1,403) | (151) |
Adjusting items | 2,482 | 173 | 851 | 385 | (283) | 1,356 | — |
Impairment | 2,777 | 173 | 851 | 385 | 15 | 1,354 | — |
Other adjustments | 3 | — | — | — | — | 3 | — |
Reversal of impairment | (299) | — | — | — | (299) | — | — |
Adjusted depreciation, amortisation and net impairments | (9,837) | (5,697) | (1,318) | (1,705) | (919) | (46) | (151) |
Exploration expenses | (849) | (567) | (222) | (60) | — | — | — |
Adjusting items | 36 | — | — | 36 | — | — | — |
Impairment | 36 | — | — | 36 | — | — | — |
Adjusted exploration expenses | (813) | (567) | (222) | (24) | — | — | — |
Sum of adjusting items | 2,239 | (318) | 1,100 | 421 | (137) | 1,400 | (227) |
Adjusted operating income/(loss) | 27,591 | 23,803 | 1,569 | 1,089 | 1,563 | (214) | (219) |
Tax on adjusted operating income | (20,549) | (18,522) | (821) | (292) | (1,003) | 51 | 38 |
Adjusted operating income/(loss) after tax | 7,043 | 5,280 | 749 | 797 | 561 | (163) | (181) |
Equinor fourth quarter 2025
50 | Supplementary disclosures | FOURTH QUARTER 2025 REVIEW |
Items impacting net operating income/(loss) in the full year of 2024 (in USD million) | Equinor group | E&P Norway | E&P International | E&P USA | MMP | REN | Other |
Net operating income/(loss) | 30,927 | 24,564 | 2,746 | 1,031 | 3,326 | (676) | (64) |
Total revenues and other income | 103,774 | 33,643 | 7,343 | 3,957 | 101,792 | 317 | (43,277) |
Adjusting items | (1,512) | — | (805) | — | (583) | (124) | — |
Changes in fair value of derivatives | (421) | — | — | — | (421) | — | — |
Gain/loss on sale of assets | (941) | — | (805) | — | (135) | — | — |
Periodisation of inventory hedging effect | (26) | — | — | — | (26) | — | — |
Provisions | (124) | — | — | — | — | (124) | — |
Adjusted total revenues and other income | 102,262 | 33,643 | 6,538 | 3,957 | 101,209 | 193 | (43,277) |
Purchases [net of inventory variation] | (50,040) | — | 85 | — | (92,789) | — | 42,664 |
Adjusting items | 16 | — | — | — | 12 | — | 4 |
Eliminations | 4 | — | — | — | — | — | 4 |
Operational storage effects | 17 | — | — | — | 17 | — | — |
Provisions | (5) | — | — | — | (5) | — | — |
Adjusted purchases [net of inventory variation] | (50,024) | — | 85 | — | (92,777) | — | 42,668 |
Operating and administrative expenses | (11,786) | (3,612) | (2,123) | (1,142) | (4,919) | (687) | 697 |
Adjusting items | 296 | — | 84 | — | 48 | 163 | — |
Gain/loss on sale of assets | 232 | — | 84 | — | — | 147 | — |
Other adjustments | 16 | — | — | — | — | 16 | — |
Provisions | 48 | — | — | — | 48 | — | — |
Adjusted operating and administrative expenses | (11,491) | (3,612) | (2,038) | (1,142) | (4,871) | (524) | 697 |
Items impacting net operating income/(loss) in the full year of 2024 (in USD million) | Equinor group | E&P Norway | E&P International | E&P USA | MMP | REN | Other |
Depreciation, amortisation and net impairments | (9,835) | (4,954) | (2,064) | (1,607) | (757) | (306) | (148) |
Adjusting items | 70 | — | — | — | (191) | 261 | — |
Impairment | 261 | — | — | — | — | 261 | — |
Reversal of impairment | (191) | — | — | — | (191) | — | — |
Adjusted depreciation, amortisation and net impairments | (9,765) | (4,954) | (2,064) | (1,607) | (949) | (44) | (148) |
Exploration expenses | (1,185) | (513) | (496) | (176) | — | — | — |
Adjusting items | — | — | — | — | — | — | — |
Adjusted exploration expenses | (1,185) | (513) | (496) | (176) | — | — | — |
Sum of adjusting items | (1,130) | — | (721) | — | (714) | 301 | 4 |
Adjusted operating income/(loss) | 29,798 | 24,564 | 2,025 | 1,031 | 2,612 | (375) | (60) |
Tax on adjusted operating income | (20,736) | (19,013) | (425) | (224) | (1,174) | 50 | 50 |
Adjusted operating income/(loss) after tax | 9,062 | 5,551 | 1,600 | 807 | 1,438 | (325) | (10) |
Equinor fourth quarter 2025
51 | Supplementary disclosures | FOURTH QUARTER 2025 REVIEW |
Adjusted operating income after tax by reporting segment
Quarters | |||||||||||
Q4 2025 | Q3 2025 | Q4 2024 | |||||||||
(in USD million) | Adjusted operating income | Tax on adjusted operating income | Adjusted operating income after tax | Adjusted operating income | Tax on adjusted operating income | Adjusted operating income after tax | Adjusted operating income | Tax on adjusted operating income | Adjusted operating income after tax | ||
E&P Norway | 5,026 | (3,915) | 1,112 | 5,618 | (4,357) | 1,261 | 6,805 | (5,276) | 1,529 | ||
E&P International | 214 | (93) | 121 | 396 | (173) | 223 | 303 | (27) | 276 | ||
E&P USA | 359 | (122) | 237 | 37 | (11) | 25 | 184 | (12) | 172 | ||
MMP | 678 | (489) | 189 | 299 | (172) | 127 | 659 | (302) | 356 | ||
REN | (26) | (21) | (47) | (64) | 6 | (58) | (100) | 13 | (87) | ||
Other | (54) | (6) | (60) | (71) | (2) | (73) | 45 | — | 45 | ||
Equinor group | 6,196 | (4,645) | 1,551 | 6,215 | (4,710) | 1,505 | 7,896 | (5,603) | 2,292 | ||
Effective tax rates on adjusted operating income | 75.0% | 75.8% | 71.0% | ||||||||
Full year 2025 | Full year 2024 | ||||||||||
(in USD million) | Adjusted operating income | Tax on adjusted operating income | Adjusted operating income after tax | Adjusted operating income | Tax on adjusted operating income | Adjusted operating income after tax | |||||
E&P Norway | 23,803 | (18,522) | 5,280 | 24,564 | (19,013) | 5,551 | |||||
E&P International | 1,569 | (821) | 749 | 2,025 | (425) | 1,600 | |||||
E&P USA | 1,089 | (292) | 797 | 1,031 | (224) | 807 | |||||
MMP | 1,563 | (1,003) | 561 | 2,612 | (1,174) | 1,438 | |||||
REN | (214) | 51 | (163) | (375) | 50 | (325) | |||||
Other | (219) | 38 | (181) | (60) | 50 | (10) | |||||
Equinor group | 27,591 | (20,549) | 7,043 | 29,798 | (20,736) | 9,062 | |||||
Effective tax rates on adjusted operating income | 74.5% | 69.6% | |||||||||
Equinor fourth quarter 2025
52 | Supplementary disclosures | FOURTH QUARTER 2025 REVIEW |
Quarters | Full year | |||||
(in USD million) | Q4 2025 | Q3 2025 | Q4 2024 | 2025 | 2024 | |
Net operating income/(loss) | A | 5,487 | 5,270 | 8,735 | 25,352 | 30,927 |
Income tax | B1 | 4,456 | 4,870 | 6,188 | 20,030 | 22,157 |
Tax on net financial items | B2 | (312) | (59) | (76) | (135) | (107) |
Income tax less tax on net financial items | B = B1 - B2 | 4,767 | 4,929 | 6,264 | 20,164 | 22,264 |
Net operating income after tax | C = A - B | 720 | 341 | 2,471 | 5,188 | 8,663 |
Items impacting net operating income/(loss)1) | D | 709 | 944 | (839) | 2,239 | (1,130) |
Tax on items impacting net operating income/(loss) | E | 122 | 220 | 661 | (384) | 1,529 |
Adjusted operating income after tax | F = C+D+E | 1,551 | 1,505 | 2,292 | 7,043 | 9,062 |
Net financial items | G | 283 | (604) | (548) | (265) | 58 |
Tax on net financial items | H | 312 | 59 | 76 | 135 | 107 |
Net income/(loss) | I = C+G+H | 1,314 | (204) | 1,999 | 5,058 | 8,829 |
1) For items impacting net operating income/(loss), see Reconciliation of adjusted operating income in the Supplementary | ||||||
Reconciliation of adjusted operating income after tax to net income
Quarters | Full year | |||||
(in USD million) | Q4 2025 | Q3 2025 | Q4 2024 | 2025 | 2024 | |
Net operating income/(loss) | 5,487 | 5,270 | 8,735 | 25,352 | 30,927 | |
Items impacting net operating income/(loss)1) | A | 709 | 944 | (839) | 2,239 | (1,130) |
Adjusted operating income1) | B | 6,196 | 6,215 | 7,896 | 27,591 | 29,798 |
Net financial items | 283 | (604) | (548) | (265) | 58 | |
Adjusting items | C | (116) | (24) | 106 | (533) | 134 |
Changes in fair value of financial derivatives used to hedge interest bearing instruments | (59) | 22 | (4) | (245) | (46) | |
Foreign currency (gains)/losses on certain intercompany bank and cash balances | (57) | (46) | 110 | (288) | 179 | |
Adjusted net financial items | D | 167 | (628) | (442) | (798) | 192 |
Income tax | E | (4,456) | (4,870) | (6,188) | (20,030) | (22,157) |
Tax effect on adjusting items | F | 135 | 215 | 467 | (330) | 1,344 |
Adjusted net income | G = B + D + E + F | 2,042 | 932 | 1,733 | 6,434 | 9,177 |
Less: | ||||||
Adjusting items | H = A + C | 593 | 920 | (734) | 1,706 | (996) |
Tax effect on adjusting items | 135 | 215 | 467 | (330) | 1,344 | |
Net income/(loss) | 1,314 | (204) | 1,999 | 5,058 | 8,829 | |
Attributable to shareholders of the company | I | 1,314 | (210) | 1,996 | 5,043 | 8,806 |
Attributable to non-controlling interests | J | 1 | 7 | 3 | 15 | 23 |
Adjusted net income attributable to shareholders of the company | K = G - J | 2,042 | 925 | 1,730 | 6,418 | 9,154 |
Weighted average number of ordinary shares outstanding (in millions) | L | 2,509 | 2,527 | 2,739 | 2,593 | 2,821 |
Basic earnings per share (in USD) | M = I/L | 0.52 | (0.08) | 0.73 | 1.94 | 3.12 |
Adjusted earnings per share (in USD) | N = K/L | 0.81 | 0.37 | 0.63 | 2.47 | 3.24 |
1) For items impacting net operating income/(loss), see Reconciliation of adjusted operating income in the Supplementary | ||||||
Reconciliation of adjusted net income to net income, including calculation of adjusted earnings per share
Equinor fourth quarter 2025
53 | Supplementary disclosures | FOURTH QUARTER 2025 REVIEW |

Adjusted exploration expenses
Quarters | Change | Full year | |||||
(in USD million) | Q4 2025 | Q3 2025 | Q4 2024 | Q4 on Q4 | 2025 | 2024 | Change |
E&P Norway exploration expenditures | 254 | 256 | 251 | 1% | 861 | 715 | 20% |
E&P International exploration expenditures | 54 | 83 | 115 | (53)% | 244 | 538 | (55)% |
E&P USA exploration expenditures | — | 3 | 33 | N/A | 21 | 148 | (86)% |
Group exploration expenditures | 308 | 343 | 400 | (23)% | 1,126 | 1,402 | (20)% |
Expensed, previously capitalised exploration expenditures | 77 | 36 | (7) | N/A | 119 | 76 | 57% |
Capitalised share of current period's exploration activity | (97) | (163) | (40) | >100% | (432) | (288) | 50% |
Impairment (reversal of impairment) | — | 36 | (10) | N/A | 36 | (5) | N/A |
Exploration expenses according to IFRS | 287 | 252 | 343 | (16)% | 849 | 1,185 | (28)% |
Items impacting net operating income/ (loss)1) | — | (36) | — | N/A | (36) | — | N/A |
Adjusted exploration expenses | 287 | 216 | 343 | (16)% | 813 | 1,185 | (31)% |
1) For items impacting net operating income/(loss), see Reconciliation of adjusted operating income in the Supplementary | |||||||
Equinor fourth quarter 2025
54 | Supplementary disclosures | FOURTH QUARTER 2025 REVIEW |
Calculated ROACE
Line items impacted by change in accounting policy | At 31 December 2024 | ||
(in USD million) | As reported | Restated | Impact |
Average cash and cash equivalents | (8,881) | (6,986) | 1,894 |
Average net-interest bearing debt | (215) | 1,679 | 1,894 |
Average capital employed | 45,225 | 47,119 | 1,894 |
Calculated ROACE based on Net income/loss and capital employed | 19.5% | 18.7% | (0.8)% |
Calculated ROACE based on IFRS Accounting Standards | 31 December | ||
(in USD million, except percentages) | 2025 | 2024 | |
Net income/(loss) | A | 5,058 | 8,829 |
Average total equity | 1 | 41,439 | 45,440 |
Average current finance debt and lease liabilities | 6,855 | 7,874 | |
Average non-current finance debt and lease liabilities | 23,803 | 23,071 | |
Average cash and cash equivalents1) | (5,469) | (6,986) | |
Average current financial investments | (14,816) | (22,279) | |
Average net-interest bearing debt1) | 2 | 10,372 | 1,679 |
Average capital employed1) | B = 1+2 | 51,811 | 47,119 |
Calculated ROACE based on Net income/loss and capital employed1) | A/B | 9.8% | 18.7% |
31 December | |||
Calculated ROACE based on Adjusted operating income after tax and capital employed adjusted (in USD million, except percentages) | 2025 | 2024 | |
Adjusted operating income after tax | A | 7,043 | 9,062 |
Average capital employed adjusted (B) | B | 48,677 | 43,991 |
Calculated ROACE based on Adjusted operating income after tax and capital employed | A/B | 14.5% | 20.6% |
1) Previously reported numbers for 2024 have been restated due to a change in accounting policy. The impact of the restatement on relevant line items affected are shown below. For more information see note 1 Organisation and basis of preparation. | |||
Equinor fourth quarter 2025
55 | Supplementary disclosures | FOURTH QUARTER 2025 REVIEW |
Calculation of CFFO after taxes paid, net cash flow before capital distribution and net cash flow
CFFO information | Quarters | Change | Full year | ||||
(in USD million) | Q4 2025 | Q3 2025 | Q4 2024 | Q4 on Q4 | 2025 | 2024 | Change |
Cash flows provided by operating activities before taxes paid and working capital items1) | 9,554 | 9,098 | 9,414 | 1% | 38,439 | 37,838 | 2% |
Taxes Paid | (6,240) | (3,764) | (5,906) | 6% | (20,460) | (20,592) | (1)% |
Cash flow from operations after taxes paid (CFFO after taxes paid)1) | 3,314 | 5,334 | 3,508 | (6)% | 17,980 | 17,246 | 4% |
Net cash flow information | Quarters | Change | Full year | ||||
(in USD million) | Q4 2025 | Q3 2025 | Q4 2024 | Q4 on Q4 | 2025 | 2024 | Change |
Cash flow from operations after taxes paid (CFFO after taxes paid)1) | 3,314 | 5,334 | 3,508 | (6)% | 17,980 | 17,246 | 4% |
(Cash used)/received in business combinations | — | — | (1,242) | N/A | (26) | (1,710) | (98)% |
Capital expenditures and investments | (4,146) | (3,420) | (3,646) | 14% | (13,994) | (12,177) | 15% |
Net (increase)/decrease in strategic non-current financial investments2) | (944) | — | (2,468) | (62)% | (944) | (2,468) | (62)% |
(Increase)/decrease in other interest-bearing items | (11) | 170 | (60) | (81)% | 114 | (623) | N/A |
Proceeds from sale of assets and businesses | 2,032 | — | 1,355 | 50% | 2,456 | 1,470 | 67% |
Net cash flow before capital distribution1) | 245 | 2,085 | (2,555) | N/A | 5,587 | 1,739 | >100% |
Dividend paid | (917) | (938) | (1,913) | (52)% | (4,791) | (8,578) | (44)% |
Share buy-back | (389) | (4,712) | (501) | (22)% | (5,916) | (6,013) | (2)% |
Net cash flow1) | (1,062) | (3,565) | (4,969) | (79)% | (5,120) | (12,851) | (60)% |
1) Previously reported numbers for 2024 have been restated due to a change in accounting policy. The impact of the restatement on relevant line items affected are shown below. For more information see note 1 Organisation and basis of preparation. | |||||||
2) This line item includes the initial acquisition of 10 per cent of the shares in Ørsted A/S in the fourth quarter 2024, in addition to the rights subscription investment in the fourth quarter 2025. | |||||||
Line items impacted by change in accounting policy | Q4 2024 | Full year 2024 | |||||
(in USD million) | As reported | Restated | Impact | As reported | Restated | Impact | |
Cash flows provided by operating activities before taxes paid and working capital items | 9,813 | 9,414 | (399) | 38,483 | 37,838 | (645) | |
Cash flow from operations after taxes paid (CFFO after taxes paid) | 3,907 | 3,508 | (399) | 17,892 | 17,246 | (645) | |
Net cash flow before capital distribution | (2,155) | (2,555) | (399) | 2,385 | 1,739 | (645) | |
Net cash flow | (4,570) | (4,969) | (399) | (12,206) | (12,851) | (645) | |
Equinor fourth quarter 2025
56 | Supplementary disclosures | FOURTH QUARTER 2025 REVIEW |
Organic capital expenditures
Quarters | Full year | ||||
(in USD billion) | Q4 2025 | Q3 2025 | Q4 2024 | 2025 | 2024 |
Additions to PP&E, intangibles and equity accounted investments | 9.1 | 3.7 | 5.4 | 20.9 | 16.7 |
Less: | |||||
Acquisition-related additions1) | 5.6 | — | 1.6 | 6.9 | 3.4 |
Right of use asset additions | 0.3 | 0.3 | 0.5 | 0.9 | 1.2 |
Organic capital expenditures | 3.3 | 3.4 | 3.4 | 13.1 | 12.1 |
1) Q4 2025 and full year 2025 include the addition of Adura as an equity accounted investment (USD 5.6 billion). | |||||
Equinor fourth quarter 2025
57 | Supplementary disclosures | FOURTH QUARTER 2025 REVIEW |
Calculation of capital employed and net debt to capital employed ratio
Calculation of capital employed and net debt to capital employed ratio | At 31 December | At 31 December | |
(in USD million) | 2025 | 2024 | |
Calculation of capital employed* | |||
Capital employed1) | A + B1 | 52,386 | 51,235 |
Capital employed adjusted, including lease liabilities | A + B2 | 52,674 | 51,601 |
Capital employed adjusted | A + B3 | 49,262 | 48,091 |
Calculated net debt to capital employed* | |||
Net debt to capital employed1) | (B1) / (A+B1) | 22.7% | 17.3% |
Net debt to capital employed adjusted, including lease liabilities | (B2) / (A+B2) | 23.1% | 17.9% |
Net debt to capital employed adjusted | (B3) / (A+B3) | 17.8% | 11.9% |
1) Previously reported numbers for 2024 have been restated due to a change in accounting policy. The impact of the restatement on relevant line items affected are shown below. For more information see note 1 Organisation and basis of preparation. 2) Other interest-bearing elements are financial investments in Equinor Insurance AS classified as current financial investments. 3) Under the new tax payment regime in Norway effective from August 2025, tax payments will be more evenly distributed across all four quarters. Therefore, the previous adjustments for tax normalisation have been discontinued with effect from the third quarter of 2025 without restatement of comparative periods. Under the previous tax regime, net interest-bearing debt adjusted including lease liabilities* and net interest-bearing debt adjusted* included adjustments to exclude 50% of the cash build-up ahead of tax payments on 1 April and 1 October. | |||
Calculation of capital employed and net debt to capital employed ratio | At 31 December | At 31 December | |
(in USD million) | 2025 | 2024 | |
Shareholders' equity | 40,424 | 42,342 | |
Non-controlling interests | 74 | 38 | |
Total equity | A | 40,497 | 42,380 |
Current finance debt and lease liabilities | 5,237 | 8,472 | |
Non-current finance debt and lease liabilities | 25,984 | 21,622 | |
Gross interest-bearing debt | B | 31,222 | 30,094 |
Cash and cash equivalents1) | 5,036 | 5,903 | |
Current financial investments | 14,297 | 15,335 | |
Cash and cash equivalents and financial investment1) | C | 19,333 | 21,238 |
Net interest-bearing debt [8]1) | B1 = B - C | 11,888 | 8,856 |
Other interest-bearing elements1)2) | 288 | 366 | |
Net interest-bearing debt adjusted including lease liabilities* 3) | B2 | 12,176 | 9,221 |
Lease liabilities | 3,412 | 3,510 | |
Net interest-bearing debt adjusted* 3) | B3 | 8,765 | 5,711 |
Line items impacted by change in accounting policy | At 31 December 2024 | |||
(in USD million) | As reported | Restated | Impact | |
Cash and cash equivalents | 8,120 | 5,903 | (2,217) | |
Cash and cash equivalents and financial investment | C | 23,455 | 21,238 | (2,217) |
Net interest-bearing debt [8] | B1 = B - C | 6,638 | 8,856 | 2,217 |
Other interest-bearing elements | 2,583 | 366 | (2,217) | |
Capital employed | A + B1 | 49,018 | 51,235 | 2,217 |
Net debt to capital employed | (B1) / (A+B1) | 13.5% | 17.3% | 3.7% |
Equinor fourth quarter 2025
58 | Forward-looking statements | FOURTH QUARTER 2025 REVIEW |
Forward-looking statements
This report contains certain forward-looking
statements that involve risks and uncertainties. In
some cases, we use words such as "ambition",
"continue", "could", "estimate", "intend", "expect",
"believe", "likely", "may", "outlook", "plan", "strategy",
"will", "guidance", "targets", and similar expressions
to identify forward- looking statements. Forward-
looking statements include all statements other than
statements of historical fact, including, among
others, statements regarding Equinor's plans,
intentions, aims, ambitions and expectations; the
commitment to develop as a broad energy company
and diversify its energy mix; the ambition to be a
leading company in the energy transition and reduce
net group-wide greenhouse gas emissions; our
ambitions and expectations regarding
decarbonisation; future financial performance,
including earnings, cash flow and liquidity;
expectations and ambitions regarding value creation;
expectations and ambitions regarding progress on
the energy transition plan; expectations regarding
cash flow and returns from Equinor’s oil and gas
portfolio, CCS projects and renewables and low
carbon solutions portfolio; our expectations and
ambitions regarding operated emissions, annual CO₂
storage, upstream CO₂ intensity and net carbon
intensity; plans to develop fields; expectations and
ambitions regarding exploration activities and
production levels; plans and ambitions for
renewables production capacity and CO₂ transport
and storage and investments in oil and gas,
renewables and low carbon solutions; our intention
to optimise and high-grade our portfolio; robustness
of our portfolio; contributions to energy security;
break-even considerations, targets and other metrics
for investment decisions; future worldwide economic
trends, market outlook and future economic
projections and assumptions, including commodity
price, currency and refinery assumptions;
expectations and ambitions regarding sales, trading
and market strategies; estimates of reserves and
expectations regarding discoveries; organic capital
expenditures* for 2026; ROACE* for 2026 and 2027;
expectations regarding capex through 2027;
expectations and estimates regarding capacity,
production, development, performance and
execution of projects; expectations and estimates
regarding future operational performance, including
oil and gas and renewable power production and
growth; estimates regarding tax payments;
expectations and ambitions regarding costs,
including the ambition to keep unit of production cost
in the top quartile of our peer group; scheduled
maintenance activity and the effects thereof on
equity production; expectations regarding completion
and results of acquisitions, disposals, joint ventures,
partnerships and other strategic and contractual
arrangements; expectations regarding distributions
from joint ventures; plans and expectations
regarding corporate structure; ambitions regarding
capital distributions and expected amount and timing
of dividend payments and the implementation of our
share buy-back programme; projected impact of
legal claims against us; and provisions and
contingent liabilities. You should not place undue
reliance on these forward-looking statements. Our
actual results could differ materially from those
anticipated in the forward-looking statements for
many reasons.
These forward-looking statements reflect current
views about future events, are based on
management’s current expectations and
assumptions and are, by their nature, subject to
significant risks and uncertainties because they
relate to events and depend on circumstances that
will occur in the future. There are a number of factors
that could cause actual results and developments to
differ materially from those expressed or implied by
these forward-looking statements, including levels of
industry product supply, demand and pricing, in
particular in light of significant price volatility for oil
and natural gas; geopolitical, social and/or political
instability, including worsening trade relations and
tariffs; unfavourable macroeconomic conditions and
inflationary pressures; exchange rate and interest
rate fluctuations; levels and calculations of reserves
and material differences from reserves estimates;
regulatory stability and access to resources,
including attractive low carbon opportunities; the
effects of climate change and changes in
stakeholder sentiment and regulatory requirements
regarding climate change; changes in market
demand and supply and policy support from
governments for renewables; inability to meet
strategic objectives; the development and use of
new technology; failure to prevent or manage digital
and cyber disruptions to our information and
operational technology systems and those of third
parties on which we rely; operational problems,
including cost inflation in capital and operational
expenditures; unsuccessful drilling; availability of
adequate infrastructure at commercially viable
prices; the actions of field partners, commercial and
strategic partners and other third-parties;
reputational damage; the actions of competitors; the
actions of the Norwegian state as majority
shareholder and exercise of ownership by the
Norwegian state; changes or uncertainty in or non-
compliance with laws and governmental regulations,
conditions or requirements; inability to obtain
relevant approvals from governments and other
parties for activities and transactions; adverse
changes in tax regimes; the political and economic
policies of Norway and other oil/energy-producing
countries; regulations on hydraulic fracturing and
low-carbon value chains; liquidity, interest rate,
equity and credit risks; risk of losses relating to
trading and commercial supply activities; an inability
to attract and retain personnel; ineffectiveness of
crisis management systems; inadequate insurance
coverage; health, safety and environmental risks;
physical security risks to personnel, assets,
infrastructure and operations from hostile or
malicious acts; failure to meet our ethical and social
standards; actual or perceived non-compliance with
legal or regulatory requirements; and other factors
discussed elsewhere in this report and in Equinor's
Integrated Annual Report for the year ended
December 31, 2024 (including section 5.2 - Risk
factors thereof). Equinor's 2024 Integrated Annual
Report is available at Equinor's website
www.equinor.com.
Although we believe that the expectations reflected
in the forward-looking statements are reasonable,
we cannot assure you that our future results, level of
activity, performance or achievements will meet
these expectations. Moreover, neither we nor any
other person assumes responsibility for the accuracy
and completeness of the forward-looking statements.
Any forward-looking statement speaks only as of the
date on which such statement is made, and, except
as required by applicable law, we undertake no
obligation to update any of these statements after
the date of this report, either to make them conform
to actual results or changes in our expectations. We
use certain terms in this document, such as
"resource" and "resources", that the SEC's rules
prohibit us from including in our filings with the SEC.
U.S. investors are urged to closely consider the
disclosures in our Annual Report on Form 20-F for
the year ended December 31, 2024, SEC File No.
1-15200. This form is available on our website or by
calling 1-800-SEC-0330 or logging on to
www.sec.gov
Equinor fourth quarter 2025
59 | End notes | FOURTH QUARTER 2025 REVIEW |
End notes
1.The group's average liquids price is a volume
weighted average of the segment prices of crude
oil, condensate and natural gas liquids (NGL).
2.Liquids volumes include oil, condensate and
NGL, exclusive of royalty oil.
3.Equity volumes represent Equinor’s
proportionate share of gross production based on
working interest ownership in a lease or unit.
Entitlement volumes differ from equity volumes
where operations are performed under
production sharing agreements (PSA) that
regulate Equinor’s entitlement to volumes, and in
the USA where entitlement production is
expressed net of royalty interests.
4.Transactions with the Norwegian state. The
Norwegian state, represented by the Ministry of
Trade, Industry and Fisheries, is the majority
shareholder of Equinor and it also holds major
investments in other entities. This ownership
structure means that Equinor participates in
transactions with many parties that are under a
common ownership structure and therefore meet
the definition of a related party. Equinor
purchases liquids and natural gas from the
Norwegian state, represented by SDFI (the
State's Direct Financial Interest). In addition,
Equinor sells the State's natural gas production
in its own name, but for the Norwegian state's
account and risk, and related expenditures are
refunded by the State.
5.The production guidance reflects our estimates of
proved reserves calculated in accordance with
US Securities and Exchange Commission (SEC)
guidelines and additional production from other
reserves not included in proved reserves
estimates.
6.The group's average realised piped gas prices
include all realised piped gas sales, including
both physical sales and related paper positions.
7.The internal transfer price paid from the MMP
segment to the E&P Norway, E&P International
and E&P USA segments.
8.Since different legal entities in the group lend to
projects and others borrow from banks, project
financing through external bank or similar
institutions is not netted in the balance sheet and
results in over-reporting of the debt stated in the
balance sheet compared to the underlying
exposure in the group. Similarly, certain net
interest-bearing debt incurred from activities
pursuant to the Marketing Instruction of the
Norwegian government are offset against
receivables on the SDFI. Some interest-bearing
elements are classified together with non-interest
bearing elements and are therefore included
when calculating the net interest-bearing debt.
Photos:
Page 1 Jan Arne Wold, Woldcam
Pages 1, 3, 4, 6, 8, 11, 12, 15, 41 Ole Jørgen
Bratland
Page 2 Einar Aslaksen
Pages 7, 21, 52 Torstein Lund Eik
Page 13 Harald Pettersen
Page 23 Unknown
Page 29 Modec
Equinor ASA
Box 8500
NO-4035 Stavanger
Norway
Telephone:+47 51 99 00 00
www.equinor.com
SIGNATURE - 6K FURNISHED
Pursuant to the requirements of the
Securities Exchange Act of 1934, the
registrant has duly caused this report to be
signed on its behalf by the undersigned,
thereunto duly authorised.
EQUINOR ASA
(Registrant)
Dated: 4 February 2026
By: /s/ Torgrim Reitan
Name: Torgrim Reitan
Title: Chief Financial Officer