Please wait
Management’s Discussion and Analysis
Table of Contents
| | | | | |
| Forward-Looking Statements | |
| Description of the Business | |
| Alberta Electricity Portfolio | |
| Accelerated Clean Electricity Growth Plan | |
| Highlights | |
| Significant and Subsequent Events | |
| Segmented Financial Performance and Operating Results | |
| Fourth Quarter Highlights | |
| Segmented Financial Performance and Operating Results for the Fourth Quarter | |
| Selected Quarterly Information | |
| Financial Position | |
| Financial Capital | |
| Other Consolidated Analysis | |
| Cash Flows | |
| Financial Instruments | |
| Additional IFRS Measures and Non-IFRS Measures | |
| Financial Highlights on a Proportional Basis of TransAlta Renewables | |
| Key Non-IFRS Financial Ratios | |
| 2022 Financial Outlook | |
| Critical Accounting Policies and Estimates | |
| Accounting Changes | |
| Environment, Social and Governance ("ESG") | |
Transforming Our Business Model to Become Carbon Neutral by 2050 | |
| 2022+ Sustainable Targets | |
| Our 2021 Sustainability Performance | |
| Decarbonizing Our Energy Mix | |
| Engaging with Our Stakeholders to Create Positive Relationships | |
| Building a Diverse and Inclusive Workforce | |
Progressive Environmental Stewardship | |
| Reliable, Low-Cost and Sustainable Energy Production | |
Technology Adoption and Innovation Focus | |
| Sustainability Governance | |
| Governance and Risk Management | |
| Disclosure Controls and Procedures | |
| |
| |
| |
| |
| |
| |
| |
| |
| |
This Management’s Discussion and Analysis (“MD&A”) should be read in conjunction with our 2021 audited annual consolidated financial statements (the "consolidated financial statements") and our 2021 annual information form ("AIF"), each for the fiscal year ended Dec. 31, 2021. The consolidated financial statements have been prepared in accordance with International Financial Reporting Standards (“IFRS”) for Canadian publicly accountable enterprises as issued by the International Accounting Standards Board (“IASB”) and in effect at Dec. 31, 2021. All dollar amounts in the tables are in millions of Canadian dollars unless otherwise noted and except amounts per share, which are in whole dollars to the nearest two decimals. All other dollar amounts in this MD&A are in Canadian dollars, unless otherwise noted. This MD&A is dated February 23, 2022. Additional information respecting TransAlta Corporation (“TransAlta”, “we”, “our”, “us” or the “Company”), including our AIF, is available on SEDAR at www.sedar.com, on EDGAR at www.sec.gov and on our website at www.transalta.com. Information on or connected to our website is not incorporated by reference herein.
Management’s Discussion and Analysis
Forward-Looking Statements
This MD&A includes "forward-looking information" within the meaning of applicable Canadian securities laws, and "forward-looking statements" within the meaning of applicable US securities laws, including the US Private Securities Litigation Reform Act of 1995 (collectively referred to herein as "forward-looking statements"). All forward-looking statements are based on our beliefs as well as assumptions based on information available at the time the assumption was made, and on management's experience and perception of historical trends, current conditions and expected future developments, as well as other factors deemed appropriate in the circumstances. Forward-looking statements are not facts, but only predictions and generally can be identified by the use of statements that include phrases such as "may," "will," "can," "could," "would," "shall," "believe," "expect," "estimate," "anticipate," "intend," "plan," "forecast," "foresee," "potential," "enable," "continue" or other comparable terminology. These statements are not guarantees of our future performance, events or results and are subject to risks, uncertainties and other important factors that could cause our actual performance, events or results to be materially different from that set out in or implied by the forward-looking statements.
In particular, this MD&A contains forward-looking statements including, but not limited to, statements relating to: our Clean Electricity Growth Plan and ability to achieve the target of 2 gigawatts ("GW") of incremental renewables capacity with an investment of $3 billion by 2025; the Company's future growth pipeline, including the timing of commercial operations and the costs of the advanced and early-stage projects; expansion of the Company's development pipeline to 5 GW; the White Rock East and White Rock West Wind Power Projects ("White Rock Wind Projects"), including the total construction costs, ability to secure tax equity financing, the timing of commercial operation and expected average earnings before interest, taxes, depreciation and amortization ("EBITDA"); the proportion of EBITDA to be generated from renewable sources by the end of 2025; the suspension of the Sundance 5 repowering project; expected average annual EBITDA of the North Carolina Solar (as defined below) portfolio; the incident at the Kent Hills 1 and 2 wind facilities and the extent of any remediation, the timing and cost of such remediation, the ability to secure waivers in respect of the Kent Hills bonds for any potential event of default, and the impact such incident could have on the Company's revenues and contracts; the Northern Goldfields Solar Project, including the total construction capital and expected average annual EBITDA; the Garden Plain wind project, including construction capital and expected average annual EBITDA; expected increases to our cost per tonne of coal at Centralia; the expected impact and quantum of carbon compliance costs; the ability to realize future growth opportunities with BHP (as defined below); regulatory developments and their expected impact on the Company, including the Canadian federal climate plan and the implementation of the major aspects thereof (including increased carbon pricing and increased funding for clean technology); the ability of the Company to realize benefits from Canadian, US and Australian regulatory developments, including receiving funding for clean electricity projects; the potential increase in value of emission reduction credits; the 2022 financial outlook, including adjusted EBITDA, free cash flow ("FCF") and annualized dividend in 2022; increased gross margin contribution from Energy Marketing; hedged production and price for the full year 2022; hedged gas volume and gas price for 2022; sustaining and productivity capital in 2022, including routine capital, planned major maintenance and mine capital; significant planned major outages for 2022 and lost production due to planned major maintenance for 2022; expected power prices in Alberta, Ontario and the Pacific Northwest; the cyclicality of the business, including as it relates to maintenance costs, production and loads; expectations regarding refinancing the debt maturing in 2022; the liquidated damages potentially payable in respect of the Sarnia cogeneration facility outages in the second quarter of 2021; and the Company continuing to maintain a strong financial position and significant liquidity.
Management’s Discussion and Analysis
The forward-looking statements contained in this MD&A are based on many assumptions including, but not limited to, the following: the impacts arising from COVID-19 not becoming significantly more onerous on the Company; no significant changes to applicable laws and regulations beyond those that have already been announced; no significant changes to the fuel and purchased power costs; no material adverse impacts to the long-term investment and credit markets; Alberta spot prices of $80/MWh to $90/MWh in 2022; Mid-Columbia spot prices of US$45/MWh to US$55/MWh in 2022; sustaining capital of $150 million to $170 million; the Company's proportionate ownership of TransAlta Renewables Inc. ("TransAlta Renewables") not changing materially; no decline in the dividends to be received from TransAlta Renewables; and the growth of TransAlta Renewables. Forward-looking statements are subject to a number of significant risks and uncertainties that could cause actual plans, performance, results or outcomes to differ materially from current expectations. Factors that may adversely impact what is expressed or implied by forward-looking statements contained in this MD&A include risks relating to: the impact of COVID-19, including more restrictive directives of government and public health authorities; increased force majeure claims; reduced labour availability and ability to continue to staff our operations and facilities; disruptions to our supply chains, including our ability to secure necessary equipment; our ability to obtain regulatory approvals on the expected timelines or at all in respect of our growth projects; restricted access to capital and increased borrowing costs; changes in short-term and/or long-term electricity supply and demand; fluctuations in market prices, including lower merchant pricing in Alberta, Ontario and Mid-Columbia; reductions in production; increased costs; a higher rate of losses on our accounts receivables due to credit defaults; impairments and/or write-downs of assets; adverse impacts on our information technology systems and our internal control systems, including increased cybersecurity threats; commodity risk management and energy trading risks, including the effectiveness of the Company’s risk management tools associated with hedging and trading procedures to protect against significant losses; changes in demand for electricity and capacity and our ability to contract our generation for prices that will provide expected returns and replace contracts as they expire; changes to the legislative, regulatory and political environments in the jurisdictions in which we operate; environmental requirements and changes in, or liabilities under, these requirements; operational risks involving our facilities, including unplanned outages; disruptions in the transmission and distribution of electricity; the effects of weather, including man-made or natural disasters and other climate-change related risks; unexpected increases in cost structure; reductions to our generating units’ relative efficiency or capacity factors; disruptions in the source of fuels, including natural gas and coal, as well as the extent of water, solar or wind resources required to operate our facilities; general economic risks, including deterioration of equity markets, increasing interest rates or rising inflation; failure to meet financial expectations; general domestic and international economic and political developments, including armed hostilities, the threat of terrorism, including cyberattacks, diplomatic developments or other similar events that could adversely affect our business; equipment failure and our ability to carry out or have completed the repairs in a cost-effective manner or timely manner or at all, including if the remediation at the Kent Hills 1 and 2 wind facilities is more costly or takes longer than expected; industry risk and competition; fluctuations in the value of foreign currencies; structural subordination of securities; counterparty credit risk; changes to our relationship with, or ownership of, TransAlta Renewables; changes in the payment or receipt of future dividends, including from TransAlta Renewables; risks associated with development projects and acquisitions, including capital costs, permitting, labour and engineering risks, and delays in the construction or commissioning of projects; inadequacy or unavailability of insurance coverage; our provision for income taxes; legal, regulatory and contractual disputes and proceedings involving the Company; reliance on key personnel; and labour relations matters. The foregoing risk factors, among others, are described in further detail in the Governance and Risk Management section of this MD&A and the Risk Factors section in our AIF for the year ended Dec. 31, 2021.
Readers are urged to consider these factors carefully in evaluating the forward-looking statements, which reflect the Company's expectations only as of the date hereof, and are cautioned not to place undue reliance on them. The forward-looking statements included in this document are made only as of the date hereof and we do not undertake to publicly update these forward-looking statements to reflect new information, future events or otherwise, except as required by applicable laws. The purpose of the financial outlooks contained herein is to give the reader information about management's current expectations and plans and readers are cautioned that such information may not be appropriate for other purposes. In light of these risks, uncertainties and assumptions, the forward-looking statements might occur to a different extent or at a different time than we have described, or might not occur at all. We cannot assure that projected results or events will be achieved.
Management’s Discussion and Analysis
Description of the Business
Portfolio of Assets
TransAlta is a Canadian corporation and one of Canada's largest publicly traded power generators with over 110 years of operating experience. We own, operate and manage a geographically diversified portfolio of assets utilizing a broad range of fuels that includes water, wind, solar, natural gas and thermal coal.
The following table provides our consolidated ownership of our facilities across the regions in which we operate as at Dec. 31, 2021:
| | | | | | | | | | | | | | | | | | | | | | |
| As at Dec. 31, 2021 | Hydro | Wind and Solar(4) | Gas(4)(5) | Energy Transition(6) | | | Total |
| Alberta | Gross installed capacity (MW)(1) | 834 | | 636 | | 1,960 | | 801 | | | | 4,231 | |
| | | | | | | |
| Number of facilities | 17 | | 13 | | 7 | | 2 | | | | 39 | |
Weighted average contract life(2) | — | | 7 | | 1 | | — | | | | 2 | |
| Canada, Excl. Alberta | Gross installed capacity (MW)(1) | 91 | | 751 | | 645 | | — | | | | 1,487 | |
| | | | | | | |
| Number of facilities | 9 | | 9 | | 3 | | — | | | | 21 | |
Weighted average contract life(3) | 7 | | 10 | | 6 | | — | | | | 8 | |
| US | Gross installed capacity (MW)(1) | — | | 519 | | 29 | | 671 | | | | 1,219 | |
| | | | | | | |
| Number of facilities | — | | 7 | | 1 | | 2 | | | | 10 | |
Weighted average contract life(3) | — | | 12 | | 4 | | 4 | | | | 8 | |
| Australia | Gross installed capacity (MW)(1) | — | | — | | 450 | | — | | | | 450 | |
| | | | | | | |
| Number of facilities | — | | — | | 6 | | — | | | | 6 | |
Weighted average contract life(3) | — | | — | | 17 | | — | | | | 17 | |
| | | | | | | |
| Total | Gross installed capacity (MW)(1) | 925 | | 1,906 | | 3,084 | | 1,472 | | | | 7,387 | |
| | | | | | | |
| Number of facilities | 26 | | 29 | | 17 | | 4 | | | | 76 | |
Weighted average contract life(3) | 1 | | 9 | | 5 | | 2 | | | | 5 | |
(1) Gross installed capacity for consolidated reporting represents 100 per cent output of a facility. Capacity figures for Wind and Solar includes 100 per cent of the Kent Hills wind facilities; Gas includes 100 per cent of the Ottawa and Windsor facilities, 100 per cent of the Poplar Creek facility, 50 per cent of the Sheerness facility and 60 per cent of the Fort Saskatchewan facility.
(2) The weighted average contract life for the assets in Alberta are nil as it is operating primarily on a merchant basis in the Alberta market. Refer to the Alberta Electricity Portfolio section for more information.
(3) For power generated under long-term power purchase agreements ("PPA"), power hedge contracts and short- and long-term industrial contracts, the PPAs have a weighted average remaining contract life (based on gross long-term average gross installed capacity).
(4) The weighted average remaining contract life is related to the contract period for the McBride Lake (38 MW), the Windrise facility (206 MW), Poplar Creek facility (115 MW) and the Fort Saskatchewan facility (71 MW), with remaining wind and gas facilities operated on a merchant basis.in the Alberta market.
(5) Gas segment includes the segments previously known as Australian Gas and North American Gas and the coal generation assets converted to gas from the segment previously known as Alberta Thermal.
(6) Energy Transition segment includes the segment previously known as Centralia and the coal generation assets not converted to gas (including Sundance 4) and mining assets from the segment previously known as Alberta Thermal.
Our Clean Energy Investment Plan, announced in 2019, included converting our existing Alberta coal assets to natural gas and advancing our leadership position in renewable electricity. To date, we have retired 4,064 MW of coal-fired generation capacity since 2018 while converting 1,659 MW to natural gas, significantly reducing our carbon footprint. During 2021, we increased our renewable fleet by 334 MW through acquisitions and construction of renewable wind and solar facilities and on Sept 28, 2021, we announced a Clean Electricity Growth Plan that includes strategic growth targets. Please refer to the Accelerated Clean Electricity Growth Plan section of this MD&A for further information.
Approximately 57 per cent of our gross installed capacity is located in Alberta. Our portfolio of merchant assets in Alberta is a combination of hydro facilities, wind facilities, a battery storage facility and converted natural-gas-fired thermal facilities. This balance of fuel types provides us with portfolio generation diversification. It also provides us with capacity that can be monetized as ancillary services or dispatched into the energy market during times of supply tightness. We also enter into financial contracts to reduce our exposure to variable power prices on our merchant generation. Please refer to the Alberta Electricity Portfolio section of this MD&A for further information.
Management’s Discussion and Analysis
Clean Energy Transition
The Company has completed the conversion to gas at its Alberta facilities that were formerly fuelled by coal; these facilities are now running solely on gas. The Company retired the Highvale coal mine effective Dec. 31, 2021, and is no longer mining coal. Our Centralia coal-fired facility in Washington State is committed to be retired under the TransAlta Energy Transition Bill by 2025. Centralia Unit 1 retired on Dec. 31, 2020, and the remaining unit, Centralia Unit 2, is scheduled to retire on Dec. 31, 2025.
The following table shows the Company's completed conversions to gas:
| | | | | | | | | | | |
| Project | MW | Cumulative Conversion Project Spend(1) | Project Completion Date |
| Keephills Unit 3 | 463 | | $31 | | Q4 2021 |
| Keephills Unit 2 | 395 | | $34 | | Q2 2021 |
| Sundance Unit 6 | 401 | | $39 | | Q1 2021 |
Sheerness Unit 1(2) | 200 | $7 | | Q1 2021 |
Sheerness Unit 2(2) | 200 | $14 | | Q1 2020 |
(1) Conversion project spend only includes costs associated with the conversion to gas-burning technology. Any additional planned major maintenance has been included as part of sustaining capital spend.
(2) These facilities are jointly owned by TransAlta Cogeneration L.P. ("TA Cogen") and Heartland Generation Ltd. This represents the portion of the 400 MW facility consolidated by the Company.
During the 2021 Investor Day, the Company announced its decision to retire Keephills Unit 1 and Sundance Unit 4 effective Dec. 31, 2021, and April 1, 2022, respectively. The retirement decisions were largely driven by TransAlta's assessment of future market conditions, the age and condition of the units and the Company's strategic focus on customer-centred renewable energy solutions. As a result of the decision to retire these units, the Company recorded impairment charges of $94 million and $56 million, respectively, on these units based on the estimated salvage value.
Following an in-depth evaluation and assessment of the Sundance Unit 5 repowering project, the Company suspended the project. The decision was made due to escalating costs, changing supply and demand dynamics and forecasted power prices in the Alberta market, as well as risks associated with carbon pricing and the evolving regulatory environment. With the suspension of the project, the Company will redeploy the capital previously allocated to the Sundance Unit 5 repowering project to renewable growth projects. The Company recorded an impairment charge of $191 million in 2021 in relation to the project. The total remaining estimated recoverable amount and salvage value for the Sundance Unit 5 repowering project was $33 million. Of this amount, $25 million was related to assets held for sale. Included in the impairment charge was $141 million for assets under construction and $50 million for the balance of the plant steam equipment. An additional $20 million was expensed for amounts due under contracts as a result of the suspension of the project.
With the suspension of the Sundance Unit 5, we have also impaired a previously recognized deferred asset, as it is no longer likely that we will incur sufficient capital or operating expenditures to utilize the remaining credit. The Company impaired the remaining balance of the credit of $10 million (US$8 million) in 2021.
The Highvale mine is no longer considered to be providing significant economic benefit to the Alberta Merchant cash-generating unit ("CGU") and it has been removed from the CGU, which resulted in an impairment recognized in 2021 of $195 million. An onerous contract provision of $14 million relating to future Highvale mine royalty payments (2022 and 2023), has also been recognized as an expense in 2021.
With the successful completion of the Keephills Unit 3 conversion on Dec. 29, 2021, and the planned closure of the Highvale coal mine effective Dec. 31, 2021, TransAlta’s thermal facilities in Alberta have been fully transitioned to 100 per cent natural gas operation. We have reduced our CO2 emissions by 61 per cent from 2015 levels.
Management’s Discussion and Analysis
Reporting Segment Changes
With the completion of the Clean Energy Transition plan and the announcement of our strategic focus on customer-centred renewable generation, the Company has realigned its current operating segments to better reflect its current strategic focus and to align with the Company's Clean Electricity Growth Plan. The segment reporting changes reflect a corresponding change in how the Chief Executive Officer assesses the performance of the Company.
The primary changes are the elimination of the Alberta Thermal and the Centralia segments and the reorganization of the North American Gas and Australia Gas segments into a new "Gas" segment. The Alberta Thermal facilities that have been converted to gas are included in the Gas segment. The remaining assets previously included in Alberta Thermal, including the mining assets and those facilities not converted to gas and the remaining Centralia unit, are included in a new "Energy Transition" segment. No changes have been made to the Hydro, Wind and Solar, Energy Marketing or the Corporate and Other segments. Please refer to the Segmented Financial Performance and Operating Results section of this MD&A for further information.
Performance by Segment with Supplemental Geographical Information
The following table provides the performance of our facilities across the regions we operate in as at Dec. 31, 2021, and Dec. 31, 2020:
| | | | | | | | | | | | | | | | | | | | | | | | |
| | | | | | | | |
| Year ended Dec. 31, 2021 | | Hydro | Wind and Solar | Gas(1) | Energy Transition(2) | Energy Marketing | Corporate and Other | Total |
| | | | | | | | |
| Alberta | | 308 | | 63 | | 269 | | 59 | | — | | (85) | | 614 | |
| | | | | | | | |
| Canada, excl. Alberta | | 14 | | 120 | | 75 | | — | | 137 | | — | | 346 | |
| | | | | | | | |
| US | | — | | 79 | | 10 | | 74 | | — | | — | | 163 | |
| | | | | | | | |
| Australia | | — | | — | | 140 | | — | | — | | — | | 140 | |
Total adjusted EBITDA(3) | | 322 | | 262 | | 494 | | 133 | | 137 | | (85) | | 1,263 | |
| | | | | | | | |
| Loss before income taxes | | | | | | | | (380) | |
| | | | | | | | |
| Year ended Dec. 31, 2020 | | Hydro | Wind and Solar | Gas(1) | Energy Transition(2) | Energy Marketing | Corporate and Other | Total |
| | | | | | | | |
| Alberta | | 88 | | 18 | | 151 | | 36 | | — | | (81) | | 212 | |
| | | | | | | | |
| Canada, excl. Alberta | | 17 | | 153 | | 88 | | — | | 113 | | — | | 371 | |
| | | | | | | | |
| US | | — | | 77 | | 4 | | 139 | | — | | — | | 220 | |
| | | | | | | | |
| Australia | | — | | — | | 124 | | — | | — | | — | | 124 | |
| | | | | | | | |
Total adjusted EBITDA(3) | | 105 | | 248 | | 367 | | 175 | | 113 | | (81) | | 927 | |
| Loss before income taxes | | | | | | | | (303) | |
(1) Gas segment includes the segments previously known as Australian Gas and North American Gas and the coal generation assets converted to gas from the segment previously known as Alberta Thermal.
(2) Energy Transition segment includes the segment previously known as Centralia and the coal generation assets not converted to gas and mining assets from the segment previously known as Alberta Thermal.
(3) Adjusted EBITDA is not defined and has no standardized meaning under IFRS. Presenting this from period to period provides management and investors with the ability to evaluate earnings trends more readily in comparison with prior periods’ results. Please refer to the Segmented Financial Performance and Operating Results section of this MD&A for further discussion of these items, including, where applicable, reconciliations to measures calculated in accordance with IFRS. See also the Additional IFRS Measures and Non-IFRS Measures section of this MD&A.
Management’s Discussion and Analysis
Alberta Electricity Portfolio
Generating capacity in Alberta is subject to market forces, rather than rate regulation. Power from commercial generation is cleared through a wholesale electricity market. Power is dispatched in accordance with an economic merit order administered by the Alberta Electric System Operator ("AESO"), based upon offers by generators to sell power in the real-time energy-only market. Our merchant Alberta fleet operates under this framework and we internally manage our offers to sell power.
On Dec. 31, 2020, the legislated Alberta Power Purchase Arrangements ("Alberta PPA") for our Alberta hydro assets ("Alberta Hydro Assets"), Sheerness 1 and 2 Units, and the Keephills 1 and 2 Units expired. Effective Jan. 1, 2021, these facilities began operating on a fully merchant basis in the Alberta market and form a core part of our Alberta portfolio optimization activities.
The Alberta Electricity Portfolio generated gross margin of $864 million, an increase of $405 million compared to the same period in 2020. This performance was driven by strengthened power prices in the province, optimization of production during periods of favourable pricing, partially offset by higher natural gas and carbon pricing and higher transmission costs. Optimization of facilities is driven by the diversity in fuel types, which enables portfolio management and allows for maximization of operating margins. A portion of the baseload generation in the portfolio is hedged to provide cash flow certainty. The portfolio consists of hydro, wind, energy storage and natural gas units operating, primarily, on a merchant basis in the Alberta market. Prior to 2022, the Alberta Electricity Portfolio also included coal units, which are now either retired, have been converted to natural gas or will only operate on gas. Sundance Unit 4 will continue to operate within the portfolio, fuelled only by gas, until its retirement date on April 1, 2022.
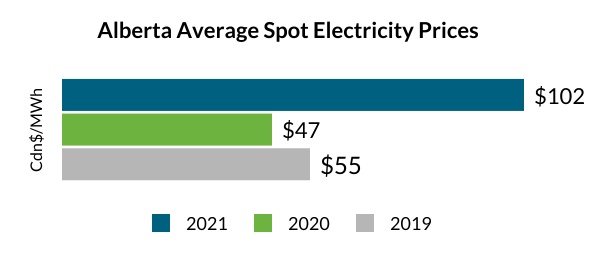
Alberta's annual demand expanded approximately 3.0 per cent from 2020 to 2021 as the economy recovered from the impacts of the COVID-19 pandemic and stronger market conditions for energy commodities supported power demand in the province. The average pool price increased from $47/MWh in 2020 to $102/MWh in 2021. Pool prices were higher in each quarter compared to 2020, generally as a result of competition among generators, higher demand in the province, tighter supply conditions due to higher planned outages, and higher natural gas and carbon prices. In addition, in 2021, Alberta experienced very strong weather-driven demand in February, June, July and December.
| | | | | | | | | | | | | | | | | | | | | | | | | | | | | | | | | | | | | | | | | | | | | | | | |
| 2021 | 2020 | 2019 | |
| Year ended Dec. 31 | Hydro | Wind & Solar | Gas | Energy Transition | Total | Hydro | Wind & Solar | Gas | Energy Transition | Total | Hydro | Wind & Solar | Gas | Energy Transition | Total | |
Total Production (GWh)(1) | 1,586 | | 1,319 | | 7,281 | | 2,591 | | 12,777 | | 1,779 | | 1,320 | | 7,732 | | 2,865 | | 13,696 | | 1,715 | | 1,058 | | 8,691 | | 4,698 | | 16,162 | | |
| | | | | | | | | | | | | | | | |
| | | | | | | | | | | | | | | | |
| | | | | | | | | | | | | | | | |
| | | | | | | | | | | | | | | | |
| | | | | | | | | | | | | | | | |
| Revenues | 358 | | 97 | | 680 | | 257 | | 1,392 | | 126 | | 57 | | 482 | | 207 | | 872 | | 132 | | 59 | | 519 | | 334 | | 1,044 | | |
| Fuel and purchased power | 13 | | 9 | | 258 | | 92 | | 372 | | 6 | | 15 | | 151 | | 73 | | 245 | | 4 | | 6 | | 151 | | 84 | | 245 | | |
| Carbon compliance | — | | — | | 96 | | 60 | | 156 | | — | | — | | 120 | | 48 | | 168 | | — | | — | | 138 | | 77 | | 215 | | |
| Gross margin | 345 | | 88 | | 326 | | 105 | | 864 | | 120 | | 42 | | 211 | | 86 | | 459 | | 128 | | 53 | | 230 | | 173 | | 584 | | |
| | | | | | | | | | | | | | | | |
| | | | | | | | | | | | | | | | |
| | | | | | | | | | | | | | | | |
(1) Units in the Gas and Energy Transition segment in the current and prior years may have operated on coal.
Management’s Discussion and Analysis
The following table provides information for the Company's Alberta Electricity Portfolio:
| | | | | | | | | | | |
| Year ended Dec. 31 | 2021 | 2020 | 2019 |
| Spot power price average per MWh | $102 | | $47 | | $55 | |
| Natural gas price (AECO) per GJ | $3.39 | | $2.11 | | $1.68 | |
| Carbon cost per tonne | $40 | | $30 | | $20 | |
| | | |
Realized power price per MWh(1) | $109 | | $64 | | $65 | |
| Hydro energy realized power price per MWh | $122 | | $51 | | $61 | |
| Hydro ancillary realized price per MWh | $55 | | $23 | | $30 | |
| Wind energy realized power price per MWh | $63 | | $33 | | $38 | |
| Gas and Energy Transition realized power price per MWh | $102 | | $71 | | $64 | |
| | | |
Hedged volume (MW)(2) | 6,992 | | 5,395 | | 5,187 | |
Hedge position (percentage)(3) | 75 | | 100 | | 87 | |
Hedged power price average per MWh(2) | $72 | | $54 | | $55 | |
| | | |
Fuel and purchased power per MWh(4) | $38 | | $23 | | $18 | |
Carbon compliance cost per MWh(4) | $16 | | $16 | | $16 | |
(1) Realized power price for the Alberta Electricity Portfolio is the average price realized as a result of the Company's commercial contracted sales and portfolio optimization activities divided by total GWh produced.
(2) In 2020 and 2019, much of the portfolio in Alberta was still under PPAs and the PPA volumes are not included in the total hedged volumes listed above.
(3) Represents the percentage of production sold forward at the end of the reporting period for the Gas assets only. The hedge program is focused primarily on generation from the merchant Gas and Energy Transition assets.
(4) Fuel and purchased power per MWh and carbon compliance cost per MWh are calculated over production from carbon-emitting generation segments in Gas and Energy Transition.
For the year ended Dec. 31, 2021, the realized power price per MWh of production increased by $45 per MWh, compared with the same period in 2020, primarily due to the optimization of production during periods of favourable pricing. The realized prices include gains and losses from hedging positions that are entered into in order to mitigate the impact of unfavourable market pricing.
For the year ended Dec. 31, 2021, the fuel and purchased power cost per MWh of production increased by $15 per MWh compared to the same period in 2020. Cost per MWh increased due to higher natural gas pricing, higher coal mine depreciation and coal inventory write-downs at the Highvale mine and higher transmission costs.
For the year ended Dec. 31, 2021, carbon compliance costs per MWh of production were consistent with the same period in 2020. Carbon compliance costs have increased in 2021 primarily due to an increase in carbon price from $30 per tonne to $40 per tonne; however, this was substantially offset by changes in fuel ratios as we increased our natural gas combustion compared to coal. The shift in fuel ratio effectively lowered our greenhouse gas ("GHG") compliance costs as natural gas combustion produces fewer GHG emissions than coal combustion.
Management’s Discussion and Analysis
Accelerated Clean Electricity Growth Plan
On Sept. 28, 2021, TransAlta announced its strategic growth targets and Accelerated Clean Electricity Growth Plan. Our goal is to be a leading customer-centred electricity company, committed to a sustainable future, focused on increasing shareholder value by growing our portfolio of high quality generation facilities with stable and predictable cash flows. Our strategy includes meeting our customers' needs for clean, low-cost, reliable electricity and providing operational excellence and continuous improvement in everything we do.
The Company's enhanced focus on renewable generation and storage solutions for customers is driven largely by global decarbonization policies and the increase in demand and growth projections in the renewable sector, namely for companies to achieve their environment, social and governance ("ESG") ambitions. For additional information on regulatory developments, see the ESG section of this MD&A.
We are primarily evaluating greenfield opportunities in Alberta, Western Australia and the US along with acquisitions in markets in which we have existing operations. We maintain highly qualified and experienced development teams to identify and develop these opportunities.
Our Accelerated Clean Electricity Growth Plan has established the following strategic priorities and targets to guide our path from 2021 to 2025. These include:
▪Deliver 2 GW of incremental renewable capacity with a targeted capital investment of $3 billion by the end of 2025. These new assets, once fully operational are targeted to deliver incremental average annual EBITDA1 of $250 million;
▪Accelerate growth into customer-centred renewables and storage through the deployment of our 3 GW development pipeline;
▪Expand the Company's development pipeline to 5 GW by 2025 to enable a two-fold increase in its renewables fleet between 2025 and 2030;
▪Realize targeted diversification and value creation by focusing on expanding our platform in each of our core geographies (Canada, United States and Australia);
▪Lead in ESG policy development to enable the successful evolution of the markets in which we operate and compete; and
▪Define the next generation of power solutions and technologies and potential for parallel investments in new complementary sectors by the end of 2025.
We expect the Company's EBITDA generated from renewable sources, including hydro, wind, and solar technologies, to increase from 35 per cent to 70 per cent by the end of 2025.
The Clean Electricity Growth Plan will largely be funded from current cash balances, cash generated from operations, and asset-level financing.
Growth
In 2021, the Company announced 600 MW of new build projects and asset acquisitions and has 240 MW in advanced-stage development. In addition, the current growth pipeline has a potential capacity ranging from 2,085 MW to 2,685 MW from projects in the early stages of development.
Announced Acquisition
North Carolina Solar
On Nov. 5, 2021, the Company closed the previously announced acquisition of a 122 MW portfolio of operating solar sites located in North Carolina (collectively, “North Carolina Solar”). The North Carolina Solar facility consists of 20 solar photovoltaic sites across North Carolina. The sites were commissioned between November 2019 and May 2021 and are all operational. The facility is secured by long-term PPAs with Duke Energy, which have an average remaining term of 12 years. Under the PPAs, Duke Energy receives the renewable electricity, capacity and environmental attributes from each site. The North Carolina Solar facility is expected to generate an average annual EBITDA1 of approximately US$9 million and average annual cash available for distribution of approximately US$7 million.
1 Average annual EBITDA is not defined and has no standardized meaning under IFRS, and is forward-looking. Please refer to the Additional IFRS Measures and Non-IFRS Measures section of this MD&A for further discussion.
Management’s Discussion and Analysis
Projects under Construction
The following projects have been approved by the Board of Directors ("the Board"), have executed PPAs and are currently under construction. The projects under construction will be financed through existing liquidity in the near term. We will continue to explore project financing or tax equity as a long-term financing solution on an asset-by-asset basis.
| | | | | | | | | | | | | | | | | | | | | | | | | | | | | | | | | | | | | | | | |
| | | | | Total project | | Target completion date(1) | | | | | | |
| Project | Type | Region | MW | Estimated
spend | Spent to
date | PPA Term | | Average annual EBITDA(2) | | | Status |
| Projects Under Construction or Approved for Construction |
| Canada | | | | | | | | | | | | | | | | |
| | | | | | | | | | | | | | | | |
Garden Plain(3) | Wind | AB | 130 | $190 | | | — | $200 | $37 | | H2 2022 | 18 | | $14 - $18 | | | •Secured all required permits and approvals •Construction activities commenced in Q4 2021 •On track to be completed on schedule |
| United States | | | | | | | | | | | | | | | |
| White Rock Wind | Wind | OK | 300 | US$460 | | | — | US$470 | US$30 | | H2 2023 | | | US$42 - US$46 | | | •Long-term PPA executed •All major equipment supply and EPC agreements executed •Detailed design and final permitting on track |
| Australia | | | | | | | | | | | | | | | | |
| Northern Goldfields Solar | Hybrid Solar | WA | 48 | AU$69 | | — | AU$73 | AU$15 | | H2 2022 | 16 | | AU$9 - AU$10 | | | •Final Notice to Proceed issued on Sept. 28, 2021 •On track to be completed on schedule |
| | | | | | | | | | | | | | | | |
| | | | | | | | | | | | | | | | |
(1) H2 is defined as the second half of the year
(2) This item is not defined and has no standardized meaning under IFRS and is forward-looking. Please refer to the Additional IFRS measures and Non-IFRS Measures section of this MD&A for further discussion.
(3) The Garden Plain PPA with Pembina Pipeline Corporation ("Pembina") is for 100 MW of the total 130 MW capacity of the facility.
Advanced-Stage Development
These projects have detailed engineering, advanced position in the interconnection queue and are progressing offtake opportunities. The following table shows the pipeline of future growth projects currently under advanced-stage development:
| | | | | | | | | | | | | | | | | |
| Project | Type | Region | Gross Installed Capacity (MW) | Estimated Spend | Average Annual EBITDA(1) |
| Advanced-Stage Development | | |
| | | | | |
| Horizon Hill | Wind | Oklahoma | 200 | US$290 - US$310 | US$25 - US$35 |
| | | | | |
| Mount Keith 132kV Expansion | Transmission | Western Australia | n/a | AU$50 - AU$53 | AU$6 - AU$7 |
| Mount Keith Capacity Expansion | Gas | Western Australia | 40 | AU$80 - AU$100 | AU$9 - AU$12 |
| | | | | |
(1) This item is not defined and has no standardized meaning under IFRS and is forward-looking. Please refer to the Additional IFRS measures and Non-IFRS Measures section of this MD&A for further discussion.
TRANSALTA CORPORATION M10
Management’s Discussion and Analysis
Early-Stage Development
These projects are in the early stages and may or may not move ahead. Generally, these projects will have:
▪Collected meteorological data;
▪Begun securing land control;
▪Started environmental studies;
▪Confirmed appropriate access to transmission; and
▪Started preliminary permitting and other regulatory approval processes.
The following table shows the pipeline of future growth projects currently under early-stage development:
| | | | | | | | | | | |
| Project | Type | Region | Gross Installed Capacity (MW) |
|
| | | |
| | | |
| | | |
| | | |
| | | |
| Early-Stage Development |
| Canada | | | |
| Riplinger Wind | Wind | Alberta | 300 | |
| Willow Creek 1 | Wind | Alberta | 70 | |
| Willow Creek 2 | Wind | Alberta | 70 | |
| Tempest | Wind | Alberta | 100 | |
| WaterCharger | Battery Storage | Alberta | 180 | |
| | | |
| Sunhills Solar | Solar | Alberta | 85 | |
| Alberta Solar Opportunities | Solar | Alberta | 35 | |
| Canadian Wind Opportunities | Wind | Various | 200 | |
| Brazeau Pumped Hydro | Hydro | Alberta | 300 - 900 |
| | Total | 1,340 - 1,940 |
| US | | | |
| Prairie Violet | Wind | Illinois | 130 | |
| Old Town | Wind | Illinois | 185 | |
| Big Timber | Wind | Pennsylvania | 50 | |
| | | |
| Other US Wind Prospects | Wind | Various | 240 | |
| | | |
| | Total | 605 | |
| Australia | | | |
| Goldfields Expansions | Gas, Solar and Wind | Western Australia | 90 | |
| South Hedland Solar | Solar | Western Australia | 50 | |
| | | |
| | Total | 140 | |
| Canada, US and Australia | | Total | 2,085 - 2,685 |
| | | |
| | | |
| | | |
| | | |
TRANSALTA CORPORATION M11
Management’s Discussion and Analysis
Highlights
Consolidated Financial Highlights | | | | | | | | | | | |
| Year ended Dec. 31 | 2021 | 2020 | 2019 |
| Adjusted availability (%) | 86.6 | | 90.7 | | 90.0 | |
| Production (GWh) | 22,105 | | 24,980 | | 29,071 | |
| Revenues | 2,721 | | 2,101 | | 2,347 | |
Fuel and purchased power(1) | 1,054 | | 805 | | 881 | |
Carbon compliance(1) | 178 | | 163 | | 205 | |
| Operations, maintenance and administration | 511 | | 472 | | 475 | |
Adjusted EBITDA(2,3,7) | 1,263 | | 927 | | 984 | |
| Earnings (loss) before income tax | (380) | | (303) | | 193 | |
| Net earnings (loss) attributable to common shareholders | (576) | | (336) | | 52 | |
| Cash flow from operating activities | 1,001 | | 702 | | 849 | |
Funds from operations(2,3) | 971 | | 685 | | 757 | |
Free cash flow(2,3) | 562 | | 358 | | 435 | |
Net earnings (loss) per share attributable to common shareholders, basic and
diluted | (2.13) | | (1.22) | | 0.18 | |
Dividends declared per common share(4) | 0.19 | | 0.22 | | 0.12 | |
Dividends declared per preferred share(5) | 1.02 | | 1.27 | | 0.78 | |
Funds from operations per share(2,3,8) | 3.58 | | 2.49 | | 2.67 | |
Free cash flow per share(2,3,8) | 2.07 | | 1.30 | | 1.54 | |
| | | |
| As at Dec. 31 | 2021 | 2020 | 2019 |
| Total assets | 9,226 | | 9,747 | | 9,508 | |
Total consolidated net debt(3,6) | 2,636 | | 2,974 | | 3,110 | |
Total long-term liabilities | 4,702 | | 5,376 | | 4,329 | |
| Total liabilities | 6,633 | | 6,311 | | 5,446 | |
(1) Carbon compliance costs have been reclassified from fuel and purchase power costs and disclosed separately. Prior periods have been adjusted for comparative purposes and did not impact previously reported net earnings.
(2) Includes $56 million received on settlement of the dispute with the Balancing Pool in the third quarter of 2019.
(3) These items are not defined and have no standardized meaning under IFRS. Presenting these items from period to period provides management and investors with the ability to evaluate earnings trends more readily in comparison with prior periods’ results. Please refer to the Segmented Financial Performance and Operating Results section of this MD&A for further discussion of these items, including, where applicable, reconciliations to measures calculated in accordance with IFRS. See also the Additional IFRS Measures and Non-IFRS Measures section of this MD&A.
(4) No dividends were declared in the first quarter of 2021 as the quarterly dividend related to the period covering the first quarter of 2021 was declared in December 2020.
(5) Weighted average of the Series A, B, C, E and G preferred share dividends declared. Dividends declared vary year over year due to timing of dividend declarations.
(6) Total consolidated net debt includes long-term debt, including current portion, amounts due under credit facilities, exchangeable securities, US tax equity financing and lease liabilities, net of available cash and cash equivalents, the principal portion of restricted cash on our subsidiary TransAlta OCP LP ("TransAlta OCP") and the fair value of economic hedging instruments on debt. See the table in the Financial Capital section of this MD&A for more details on the composition of total consolidated net debt.
(7) In the fourth quarter of 2021, comparable EBITDA was relabelled as adjusted EBITDA to align with industry standard terminology.
(8) Funds from operations ("FFO") per share and free cash flow per share are calculated using the weighted average number of common shares outstanding during the period. The weighted average number of common shares outstanding at Dec. 31, 2021 was 271 million shares (2020 - 275 million shares and 2019 - 283 million shares). Please refer to the Additional IFRS Measures and Non-IFRS Measures section in this MD&A for the purpose of these non-IFRS ratios.
We have seen exceptional performance from our Alberta Electricity Portfolio, driving overall strong performance for the Company. Both the Hydro and Gas segments had high availability on the merchant assets during periods of peak pricing, which resulted from abnormally warm summer and cold winter weather and periods of province-wide planned thermal outages. The Alberta merchant portfolio was positioned to capture opportunities from these strong spot market conditions through both energy and ancillary service revenues. This was further supplemented by strong performance in our Energy Marketing segment.
Adjusted availability for 2021 was 86.6 per cent compared to 90.7 per cent in 2020. The decrease was primarily due to higher planned and unplanned outages in the Energy Transition segment. The unplanned outages at Centralia Unit 2 and Sundance Unit 4 adversely impacted availability. In addition, adjusted availability was reduced by the planned outages for the Keephills Unit 2 and Keephills Unit 3 boiler conversions. The unplanned outage at the Kent Hills 1 and 2 wind facilities further contributed to reduced adjusted availability.
TRANSALTA CORPORATION M12
Management’s Discussion and Analysis
Production for 2021 was 22,105 gigawatt hours ("GWh") compared to 24,980 GWh in 2020. Overall, the decrease in production was primarily due to the planned retirement of Centralia Unit 1, portfolio optimization activities in Alberta, lower wind resources, the outage at the Kent Hills 1 and 2 wind facilities in the Wind and Solar segment and lower capacity loads in the Gas segment. This was partially offset by higher incremental production at our Ada facility within our Gas segment and higher incremental production from the Skookumchuck wind facility, the Windrise wind facility and the North Carolina Solar facility in the Wind and Solar segment.
Revenues for 2021 increased by $620 million compared to 2020, mainly as a result of capturing higher realized prices within the Alberta market through our optimization and operating activities and the elimination of the net payment obligations under the Alberta Hydro PPA required in the prior period. Revenues also increased due to the strong performance from the Energy Marketing segment, an increase in revenues within the Gas segment from the addition of the Ada facility and an increase within the Wind and Solar segment from the addition of the North Carolina Solar facility and the Windrise wind facility. These increases were partially offset by lower production in the Energy Transition, Hydro, Wind and Solar, and Gas segments.
Fuel and purchased power costs in 2021 increased by $249 million compared to 2020. In our Energy Transition segment, our fuel and purchased power costs increased compared to 2020 due to higher fuel transportation costs and the acquisition of higher-priced power during periods of higher merchant pricing to fulfil our contractual obligations during planned and unplanned outages at the Centralia facility. In addition, the Gas and Energy Transition segments experienced higher natural gas pricing, higher coal mine depreciation and coal inventory write-downs at the Highvale mine, all of which contributed to higher fuel costs.
Carbon compliance costs increased by $15 million compared to 2020, due to an increase in the carbon price per tonne, partially offset by reductions in GHG emissions stemming from changes in the fuel mix ratio as we operated more on natural gas and fired less with coal. Additionally, carbon compliance costs were partially offset by lower production in the Gas and Energy Transition segments. Operating with natural gas reduces carbon compliance costs as we produce fewer GHG emissions than by using coal.
Operations, maintenance and administration ("OM&A") expenses for 2021 increased by $39 million compared to 2020. A write-down of $28 million was recorded on parts and material inventory related to the Highvale mine and coal operations at our natural gas converted facilities. In addition, variability caused by the total return swap resulted in a favourable change of $7 million. During 2021, we received a Canada Emergency Wage Subsidy ("CEWS") of $8 million. Excluding the impact of the total return swap, CEWS funding and inventory write-down, OM&A expenses were higher compared to the same periods in 2020, primarily due to increased staffing costs for growth and strategic initiatives and higher incentive costs. In addition, there were additional costs associated with the legal fees and the settlement of outstanding legal issues. As previously committed, the CEWS funding continues to be used to support incremental employment within the Company.
Adjusted EBITDA increased by $336 million compared to 2020. Adjusted EBITDA increased largely due to higher gross margin, driven by higher realized prices and dispatch optimization in the Alberta market from our merchant facilities residing in the Alberta Electricity Portfolio across the Hydro, Wind and Solar, Gas, and Energy Transition segments. In addition, the Energy Marketing segment also increased adjusted EBITDA due to favourable short-term trading of both physical and financial power and natural gas products across North American markets. This increase was partially offset by the retirement of Centralia Unit 1, unplanned outages at Centralia Unit 2 in the Energy Transition segment and the extended site outage at the Kent Hills 1 and 2 wind facilities. Significant changes in segmented adjusted EBITDA are highlighted in the Segmented Financial Performance and Operating Results section within this MD&A.
Loss before income taxes for 2021 increased by $77 million compared to 2020. Net loss attributable to common shareholders for 2021 was $576 million compared to a loss of $336 million in 2020. The higher loss before income taxes and the higher net loss attributable to common shareholders in 2021 was largely driven by higher asset impairments related to decisions to shut down the Highvale mine, suspend the Sundance 5 repowering project and planned retirements of Sundance Unit 4 and Keephills Unit 1. These higher asset impairments were partially offset by higher adjusted EBITDA largely resulting from the strong performance of the Alberta Electricity Portfolio across all of our fuel segments, higher gains on sale of assets due to the gain on sale of equipment in the Energy Transition segment and the gain from the sale of the Pioneer Pipeline in the Gas segment and lower depreciation. The higher net loss attributable to common shareholders was also impacted by higher income tax expense in 2021 due to higher earnings in the Energy Marketing segment and from the Alberta Electricity Portfolio.
Cash flow from operating activities increased by $299 million compared with 2020, primarily due to higher revenues being realized in Alberta on the merchant assets and changes in non-cash working capital, partially offset by higher fuel and purchased power and OM&A costs as the Company transitioned off coal.
TRANSALTA CORPORATION M13
Management’s Discussion and Analysis
FCF, one of the Company's key financial metrics, totalled $562 million compared to $358 million in 2020. This represents an increase of $204 million, driven primarily by higher adjusted EBITDA, partially offset by an increase in sustaining capital spending related to higher planned maintenance and facility turnarounds, settlement of provisions and higher distributions paid to subsidiaries' non-controlling interests.
Sustaining Capital
We are in a long-cycle, capital-intensive business that requires significant capital expenditures. Our goal is to undertake sustaining capital expenditures that ensures our facilities operate reliably and safely over a long period of time.
| | | | | | | | | | | |
| Year ended Dec. 31 | 2021 | 2020 | 2019 |
| | | |
| | | |
| | | |
| Total sustaining capital expenditures | 199 | | 157 | | 141 | |
| | | |
| | | |
| | | |
| | | |
Total sustaining capital expenditures were $42 million higher compared to 2020, mainly due to higher planned major maintenance turnarounds related to Keephills Unit 2 and 3 and Sheerness Unit 1 and distributed planned maintenance expenditures across the entire hydro and wind fleet, with a focus on planned component replacements in the wind fleet.
Ability to Deliver Financial Results
The metrics we use to track our performance are adjusted EBITDA and FCF. The following table compares target to actual amounts for each of the three past fiscal years:
| | | | | | | | | | | | | | |
| Year ended Dec. 31 | | 2021 | 2020 | 2019 |
Adjusted EBITDA (1) | Target(2) | 1,200-1,300 | 925-1000 | 875-975 |
| Actual | 1,263 | | 927 | | 984 | |
| | | | |
| | | | |
| | | | |
| | | | |
FCF (1) | Target(2) | 500-560 | 325-375 | 350-380 |
| Actual | 562 | | 358 | | 435 | |
| | | |
(1) These items are not defined and have no standardized meaning under IFRS. Please refer to the Additional IFRS Measures and Non-IFRS Measures section of this MD&A for further discussion of these items, including, where applicable, reconciliations to measures calculated in accordance with IFRS.
(2) This represents our revised outlook, as a result of strong performance in the second and third quarters of 2021, the Company revised the following 2021 targets: Adjusted EBITDA from the previously announced target range of $960 million - $1,080 million to the target range of $1,200 million - $1,300 million and FCF target range from $340 million - $440 million to the target range of $500 million - $560 million. In addition, during the fourth quarter of 2019, we revised our FCF target from a range of $270 million to $330 million to a range of $350 million to $380 million.
Significant and Subsequent Events
White Rock Wind Projects and Fully Executed Corporate PPAs
On Dec. 22, 2021, TransAlta executed two long-term PPAs with a new customer with an AA credit rating from S&P Global Ratings for 100 per cent of the generation from its 300 MW White Rock Wind Projects to be located in Caddo County, Oklahoma. The White Rock Wind Projects will consist of a total of 51 Vestas turbines. Construction is expected to begin in late 2022 with a target commercial operation date in the second half of 2023. TransAlta will construct, operate and own the facilities. Total construction capital is estimated at approximately US$460 million to US$470 million and is expected to be financed with a combination of existing liquidity and tax equity financing. Over 90 per cent of the project costs are captured under executed fixed price turbine supply agreements and fixed price engineering, procurement and construction agreements. The project is expected to generate average annual EBITDA2 of approximately US$42 million to US$46 million including production tax credits.
North Carolina Solar Acquisition
On Nov. 5, 2021, the Company closed the acquisition of a 122 MW portfolio of 20 solar photovoltaic sites located in North Carolina. The assets were acquired from a fund managed by Copenhagen Infrastructure Partners for approximately US$99 million (including working capital adjustments) and the assumption of existing tax equity obligations. The acquisition was funded using existing liquidity.
At the closing of the acquisition, TransAlta Renewables acquired a 100 per cent economic interest in North Carolina Solar from a wholly owned subsidiary of TransAlta through a tracking share structure for aggregate consideration of approximately US$102 million.
2 Average annual EBITDA is not defined and has no standardized meaning under IFRS, and is forward-looking. Please refer to the Additional IFRS Measures and Non-IFRS Measures section of this MD&A for further discussion.
TRANSALTA CORPORATION M14
Management’s Discussion and Analysis
The facilities are all operational and were commissioned between November 2019 and May 2021. The facilities are secured by PPAs with Duke Energy, which have an average remaining term of 12 years. Under the PPAs, Duke Energy receives the renewable electricity, capacity and environmental attributes from each facility. North Carolina Solar is expected to generate an average annual EBITDA3 of approximately US$9 million.
Kent Hills Wind Facilities Outage
On Sept. 27, 2021, the Company's subsidiary, Kent Hills Wind LP, experienced a single tower failure at its 167 MW Kent Hills wind facilities in Kent Hills, New Brunswick. The failure involved a collapsed tower located within the Kent Hills 2 site. There were no injuries as a result of the collapse. No one was in the area when the incident occurred and there are no homes in the immediate vicinity. The Company's emergency response team secured the area to ensure safety. The Company recorded an impairment charge of $2 million on the collapsed tower.
The facilities consist of 50 turbines at the Kent Hills 1 and 2 wind facilities and five turbines at Kent Hills 3. Following extensive independent engineering assessments and root cause failure analysis, the Company announced on Jan. 11, 2022, that all 50 turbine foundations at the Kent Hills 1 and 2 wind facilities require a full foundation replacement. The root cause failure analysis indicates that deficiencies in the original design of the foundations had led to subsurface crack propagation within the foundations and that the foundations must be replaced. The Company is in the process of planning the rehabilitation of the wind sites and currently expects the wind facility foundations to be fully replaced by the end of 2023. Based on the recommendations of independent engineers, and in order to maintain the safety of the affected facilities and turbines, the wind turbines will cease to operate until their associated foundations are replaced. The Company has recorded $12 million of accelerated depreciation relating to the 50 foundations that will be replaced.
Foundation replacements will require expenditures of approximately $75 million to $100 million, in aggregate. The remediation plan is expected to begin to be implemented in 2022. The outage is expected to result in foregone revenue of approximately $3.4 million per month on an annualized basis so long as all 50 turbines are offline, based on average historical wind production, with revenue expected to be earned as the wind turbines are returned to service.
TransAlta and New Brunswick Power Corporation continue discussions to enable the safe return to service of the facilities.
The foundation issues at the Kent Hills 1 and 2 wind facilities are unique to the design of those sites and there is no indication of any foundation issue at the Kent Hills 3 facility or any other wind facility in the fleet. The Company is maintaining communication with all key stakeholders and is keeping them fully apprised of the situation. The Company is actively evaluating any options that may be available to recover these costs from third parties and insurance.
As a result of the determination that all 50 foundations require replacement, as well as certain resulting amendments to applicable insurance policies, the Company's operating subsidiary, Kent Hills Wind LP, has provided notice to BNY Trust Company of Canada, as trustee (the “Trustee”), for the approximately $221 million outstanding non-recourse project bonds (the “KH Bonds”) secured by, among other things, the Kent Hills 1, 2 and 3 wind facilities, that events of default may have occurred under the trust indenture governing the terms of the KH Bonds. Upon the occurrence of any event of default, holders of more than 50 per cent of the outstanding principal amount of the KH Bonds have the right to direct the Trustee to declare the principal and interest on the KH Bonds and all other amounts due, together with any make-whole amount as at Dec. 31, 2021 — $39 million, to be immediately due and payable and to direct the Trustee to exercise rights against certain collateral. The Company is in discussions with the Trustee and holders of the KH Bonds to negotiate required waivers and amendments while the Company works to remedy the matters described in the notice. Although the Company expects that it will reach agreement with the Trustee and holders of the KH Bonds with respect to terms of an acceptable waiver and amendment, there can be no assurance that the Company will receive such waivers and amendments. Accordingly, the Company has classified the entire carrying value of the KH Bonds as a current liability as at Dec. 31, 2021.
Investor Day
On Sept. 28, 2021, TransAlta held our 2021 Investor Day and announced our Clean Electricity Growth Plan. The Company has established targets to deliver 2 GW of incremental renewables capacity with a targeted investment of $3 billion by 2025. TransAlta will accelerate its growth with a focus on customer-centred renewables and storage through the execution of its 3 GW development pipeline. Please see the Accelerated Clean Electricity Growth Plan section of this MD&A.
3 Average annual EBITDA is not defined and has no standardized meaning under IFRS, and is forward-looking. Please refer to the Additional IFRS Measures and Non-IFRS Measures section of this MD&A for further discussion.
TRANSALTA CORPORATION M15
Management’s Discussion and Analysis
Retirement of Sundance Unit 4, Keephills Unit 1 and Sundance Unit 5 Coal-Fired Units
The Company announced, during its recent Investor Day, its decision to suspend the Sundance Unit 5 repowering project and retire Keephills Unit 1 on Jan. 1, 2022 and Sundance Unit 4 in 2022.
On July 29, 2021, in accordance with applicable regulatory requirements, the Company gave notice to the AESO of its intention to retire the currently mothballed coal-fired Sundance Unit 5 effective Nov. 1, 2021, and to terminate the associated transmission service agreement. Refer to the Clean Energy Transition section within the Description of the Business section of this MD&A for additional details on these thermal assets.
TransAlta Achieves Full Phase-Out of Coal in Canada
During the year, the Company completed the full conversion of Keephills Unit 2, Keephills Unit 3 and Sundance Unit 6 from thermal coal to natural gas. Keephills Unit 2, Keephills Unit 3 and Sundance Unit 6 will maintain the same generator nameplate capacity of 395 MW, 463 MW and 401 MW, respectively. These conversion to gas projects will reduce our CO2 emissions by more than half and completes our plan to generate 100 per cent clean electricity in Alberta by the end of 2021. As of Dec. 31, 2021, the Company has fully transitioned to natural gas in Canada.
Highvale Mine Impairment
During the third quarter of 2020, the Board approved the accelerated shutdown of the Highvale mine by the end of 2021 and, accordingly, the useful life of the related assets was adjusted to align with the Company's conversion to gas plans. During the third quarter of 2021, with all of TransAlta's remaining coal-fired units having been converted, in the process of being converted to natural gas or being retired, the Highvale mine was no longer considered to be providing significant economic benefit to the Alberta Merchant CGU and was removed from the CGU. This resulted in an impairment being recognized during 2021 of $195 million. Effective Dec. 31, 2021, the mine has entered its reclamation phase.
Announced Common Dividend Increase
On Sept. 28, 2021, the Company announced that the Board approved an 11 per cent increase on its common share dividend and declared a dividend of $0.05 per common share paid on Jan. 1, 2022, to shareholders of record at the close of business on Dec. 1, 2021. The quarterly dividend of $0.05 per common share represents an annualized dividend of $0.20 per common share.
Northern Goldfields Solar Project
On July 29, 2021, TransAlta Renewables announced that Southern Cross Energy ("SCE"), a subsidiary of the Company and an entity in which TransAlta Renewables owns an indirect economic interest, had reached an agreement to provide BHP Billiton Nickel West Pty Ltd. ("BHP") with renewable electricity to its Goldfields-based operations through the construction of the Northern Goldfields Solar Project. The project consists of the 27 MW Mount Keith Solar Farm, 11 MW Leinster Solar Farm, 10 MW/5MWh Leinster Battery Energy Storage System and interconnecting transmission infrastructure, all of which will be integrated into our existing 169 MW Southern Cross Energy North remote network in Western Australia. Construction commenced in the first quarter of 2022 with completion of the projects expected in the second half of 2022. Total construction capital for the project is estimated at approximately AU$69 million to AU$73 million. The project is expected to generate average annual EBITDA4 of approximately AU$9 million to AU$10 million.
On Oct. 22, 2020, SCE replaced and extended its current PPA with BHP. SCE is composed of four generation facilities with a combined capacity of 245 MW in the Goldfields region of Western Australia. The new agreement was effective Dec. 1, 2020, and replaces the previous contract that was scheduled to expire Dec. 31, 2023. The amendment to the PPA extends the term to Dec. 31, 2038, and provides SCE with the exclusive right to supply thermal and electrical energy from the Southern Cross Facilities for BHP's mining operations located in the Goldfields region of Western Australia. The extension will provide SCE a return on new capital investments, which will be required to support BHP's future power requirements and recently announced emission reduction targets. The amendments within the PPA also provide BHP with participation rights in integrating renewable electricity generation, including solar and wind, with energy storage technologies, subject to the satisfaction of certain conditions. In addition to the Northern Goldfields Solar Project, evaluation of further renewable energy supply and carbon emissions reduction initiatives under the extended PPA with BHP are underway, including wind generation and lower emission firming generation to support BHP's future power requirements.
4 Average annual EBITDA is not defined and has no standardized meaning under IFRS, and is forward-looking. Please refer to the Additional IFRS Measures and Non-IFRS Measures section of this MD&A for further discussion.
TRANSALTA CORPORATION M16
Management’s Discussion and Analysis
Sale of the Pioneer Pipeline
On June 30, 2021, the Company closed the sale of the Pioneer Pipeline to ATCO Gas and Pipelines Ltd. ("ATCO") for the aggregate sale price of $255 million. The net cash proceeds to TransAlta from the sale of its 50 per cent interest was approximately $128 million. Pioneer Pipeline has been integrated into the NOVA Gas Transmission Ltd. ("NGTL") and ATCO Alberta natural gas transmission systems to provide reliable natural gas supply to the Company's power generation stations at Sundance and Keephills. As part of the transaction, TransAlta has entered into additional long-term gas transportation agreements with NGTL for new and existing transportation service of 400 TJ per day by the end of 2023.
Sarnia Cogeneration Facility Contract Extension
On May 12, 2021, the Company executed an Amended and Restated Energy Supply Agreement with one of its large industrial customers at the Sarnia cogeneration facility, which provides for the supply of electricity and steam. This agreement will extend the term of the original agreement from Dec. 31, 2022 to Dec. 31, 2032. The agreement provides that if the Company is unable to enter into a new contract with the Ontario Independent Electricity System Operator (“IESO”) or enter into agreements with its other industrial customers at the Sarnia cogeneration facility that extend past Dec. 31, 2025, then the Company has the option to provide notice of termination in 2022 that would terminate the Amended and Restated Energy Supply Agreement four years following such notice. The Company is in active discussions with the three other existing industrial customers regarding extensions to their supply of electricity and steam from the Sarnia cogeneration facility on comparable terms. The current contract with the IESO in respect of the Sarnia cogeneration facility expires on Dec. 31, 2025. On July 19, 2021, the IESO released its Annual Acquisition Report, which included draft details for medium- and long-term procurement mechanisms for capacity for 2026 and beyond for existing and new generation. The medium-term procurement process is scheduled to be run in 2022. The Company plans to bid into the process, seeking to secure a contract extension for the Sarnia cogeneration facility following the end of the current contract.
Garden Plain Wind Project
On May 3, 2021, the Company announced that it entered into a long-term PPA with Pembina pursuant to which Pembina has contracted for the renewable electricity and environmental attributes for 100 MW of the 130 MW Garden Plain project. Under a separate agreement, Pembina has the option to purchase a 37.7 per cent interest in the project (49 per cent of the quantity under the PPA). The option must be exercised no later than 30 days after the commercial operational date. TransAlta would remain the operator of the facility and earn a management fee if Pembina exercises this option. Garden Plain will be located approximately 30 kilometres north of Hanna, Alberta. Construction activities started in the fall of 2021 with completion of the project expected in the second half of 2022. Total construction capital for the project is estimated at approximately $195 million. The project is expected to contribute between $14 million and $18 million of average annual EBITDA5.
TransAlta Renewables is Named on the Best 50 Corporate Citizens List
During the second quarter of 2021, TransAlta Renewables was recognized by Corporate Knights as one of the Best 50 Corporate Citizens for 2021. The Best 50 Corporate Citizens list evaluates and ranks Canadian corporations against a set of 24 key performance indicators covering ESG indicators relative to their industry peers and using publicly available information. The Company is committed to continuous improvement on key ESG issues and to ensuring its economic value creation is balanced with a value proposition for the environment and its communities.
Equity, Diversity and Inclusion Program
On May 3, 2021, TransAlta announced that it received certification from a third party that specializes in measuring and tracking equity, diversity and inclusion ("ED&I") metrics for organizations, due to its continued commitment to and meaningful performance on ED&I in the workplace. The Company developed a five-year ED&I strategy that was approved by the Board in August 2021, and is now executing the first year of that ED&I strategy.
5 Average annual EBITDA is not defined and has no standardized meaning under IFRS, and is forward-looking. Please refer to the Additional IFRS Measures and Non-IFRS Measures section of this MD&A for further discussion.
TRANSALTA CORPORATION M17
Management’s Discussion and Analysis
Sustainability-Linked Loan
In March 2021, TransAlta extended its $1.3 billion syndicated credit facility to June 30, 2025, and converted the facility into a Sustainability-Linked Loan (“SLL”). The facility's financing terms will align the cost of borrowing to TransAlta's GHG emission reductions and gender diversity targets, which are part of the Company's overall ESG strategy. The SLL will have a cumulative pricing adjustment to the borrowing costs on the facilities and a corresponding adjustment to the standby fee (the "Sustainability Adjustment"). Depending on performance against interim targets that have been set for each year of the credit facility term, the Sustainability Adjustment is structured as a two-way mechanism and could move either up, down or remain unchanged for each sustainability performance target based on performance. The SLL further underscores TransAlta's dedication to sustainability, including ED&I and emissions reduction.
Mangrove Claim
On April 23, 2019, the Mangrove Partners Master Fund Ltd. ("Mangrove") commenced an action in the Ontario Superior Court of Justice naming the Company, the members of the Board of the Company on such date, and Brookfield BRP Holdings (Canada) ("Brookfield") as defendants. Mangrove was seeking to set aside the 2019 Brookfield transaction. The parties reached a confidential settlement and the action was discontinued in the Ontario Superior Court of Justice on April 30, 2021.
Fortescue Metals Group Ltd. ("FMG") Dispute at South Hedland Power Station
On May 2, 2021, the Company entered into a conditional settlement with FMG. The settlement was concluded and the actions were formally dismissed in the Supreme Court of Western Australia on Dec. 7, 2021. The settlement amount has been recorded as revenue in the fourth quarter of 2021, while all other balances previously provided for have been reversed. The settlement has resulted in FMG continuing as a customer of the South Hedland facility.
Keephills 1 Superheater Force Majeure
Keephills Unit 1 was taken offline from March 17, 2015, to May 17, 2015, as a result of a large leak in the secondary superheater. TransAlta claimed force majeure under the PPA. ENMAX Energy Corporation ("ENMAX"), the purchaser under the PPA at the time, did not dispute the force majeure but the Balancing Pool attempted to do so, seeking to recover $12 million in capacity payment charges it paid to TransAlta while the unit was offline. The parties reached a confidential settlement on April 21, 2021, and this matter is now resolved.
TransAlta Renewables Acquisitions
The Company completed the sale of its 100 per cent direct interest in the 206 MW Windrise wind project ("Windrise") to TransAlta Renewables on Feb. 26, 2021, for $213 million. The remaining construction costs for Windrise were paid by TransAlta Renewables. On Nov. 10, 2021, Windrise achieved commercial operations. On Dec. 6, 2021, the Company's indirect wholly owned subsidiary, Windrise Wind LP, secured green bond financing by way of private placement for $173 million. The bonds will be amortizing and will bear interest from their date of issue at a rate of 3.41 per cent per annum and mature on Sept. 30, 2041.
On April 1, 2021, the Company completed the sale of its 100 per cent economic interest in the 29 MW Ada cogeneration facility ("Ada") and its 49 per cent economic interest in the 137 MW Skookumchuck wind facility ("Skookumchuck") to TransAlta Renewables for $43 million and $103 million, respectively. Both facilities are fully operational. Pursuant to the transaction, a TransAlta subsidiary owns Ada and Skookumchuck directly and has issued to TransAlta Renewables tracking preferred shares reflecting its economic interest in the facilities. The Ada facility is under a PPA until 2026. The Skookumchuck wind facility is contracted under a PPA until 2040 with an investment grade counterparty.
Normal Course Issuer Bid
On May 25, 2021, the Toronto Stock Exchange ("TSX") accepted the notice filed by the Company to implement a normal course issuer bid ("NCIB") for a portion of our common shares. Pursuant to the NCIB, TransAlta may repurchase up to a maximum of 14,000,000 common shares, representing approximately 7.16 per cent of its public float of common shares as at May 18, 2021. Purchases under the NCIB may be made through open market transactions on the TSX and any alternative Canadian trading platforms on which the common shares are traded, based on the prevailing market price. Any common shares purchased under the NCIB will be cancelled. The period during which TransAlta is authorized to make purchases under the NCIB commenced on May 31, 2021, and ends on May 30, 2022, or such earlier date on which the maximum number of common shares are purchased under the NCIB or the NCIB is terminated at the Company’s election.
No common shares were repurchased under the current or previous NCIB in 2021.
TRANSALTA CORPORATION M18
Management’s Discussion and Analysis
Management Changes
On March 31, 2021, Dawn Farrell retired from the Board and as President and Chief Executive Officer of the Company. John Kousinioris succeeded Mrs. Farrell as President and Chief Executive Officer and joined the Board on April 1, 2021. Prior to his appointment as Chief Executive Officer of TransAlta, Mr. Kousinioris held the roles of Chief Operating Officer, Chief Growth Officer and Chief Legal and Compliance Officer and Corporate Secretary with the Company.
On April 30, 2021, Brett Gellner, our Chief Development Officer, retired after almost 13 years with TransAlta. Mr. Gellner continues to serve on the Board of Directors of TransAlta Renewables as a non-independent director.
Board of Director Changes
On May 4, 2021, the Company announced the election of four new directors: Mr. Thomas O'Flynn, Ms. Laura W. Folse, Mr. Jim Reid and Ms. Sarah Slusser, who each bring diverse expertise and new perspectives to the Board. Mr. Richard Legault, Mr. Yakout Mansour and Mrs. Georgia Nelson did not stand for re-election and retired from the Board immediately following the annual shareholder meeting on May 4, 2021.
COVID-19
The World Health Organization declared a Public Health Emergency of International Concern relating to COVID-19 on Jan. 30, 2020, which they subsequently declared, on March 11, 2020, as a global pandemic.
The Company continues to operate under its business continuity plan, which is focused on ensuring that: (i) employees who can work remotely do so; and (ii) employees who operate and maintain our facilities, and who are not able to work remotely, are able to work safely and in a manner that ensures their health and safety. TransAlta has adopted local public health authority and government guidelines in all jurisdictions in which we operate to promote the health and safety of all employees and contractors with our health and safety protocols. All of TransAlta's offices and sites follow health screening and social distancing protocols, including personal protective equipment. Employees can be exempted from rapid testing if they are able to provide proof of vaccination. Further, TransAlta maintains travel limitations that are aligned to local jurisdictional guidance, enhanced cleaning procedures, revised work schedules, contingent work teams and the reorganization of processes and procedures to minimize any workplace transmission of the virus.
Notwithstanding the challenges associated with the pandemic, all of our facilities continue to remain fully operational and are capable of meeting our customers' needs, with the exception of the Kent Hills 1 and 2 wind facilities, which as described above, is not related to the pandemic. The Company continues to work and serve all of our customers and counterparties under the terms of their contracts. We have not experienced interruptions to service requirements as a result of COVID-19. Electricity and steam supply continue to remain a critical service requirement to all of our customers and have been deemed an essential service in our jurisdictions.
The Company continues to maintain a strong financial position due in part to its long-term contracts and hedged positions, and its ample financial liquidity.
The Board and management have been monitoring the evolution of the pandemic and are continually assessing its impact to the safety of the Company's employees, operations, supply chains and customers as well as, more generally, to our existing capital projects, and the business and affairs of the Company. Potential impacts of the pandemic on the business and affairs of the Company include, but are not limited to: (i) potential interruptions of production; (ii) supply chain disruptions; (iii) unavailability of employees; (iv) potential delays in capital projects; (v) increased credit risk with counterparties and increased volatility in commodity prices; as well as (vi) increased volatility in the valuation of financial instruments. In addition, the broader impacts to the global economy and financial markets could have potential adverse impacts on the availability of capital for investment and the demand for power and commodity pricing.
Strategic Investment by Brookfield
On March 22, 2019, the Company entered into an agreement (the "Investment Agreement") whereby Brookfield agreed to invest $750 million in the Company through the purchase of exchangeable securities, which are exchangeable by Brookfield into an equity ownership interest in certain of TransAlta’s Alberta Hydro Assets in the future at a value based on a multiple of the Alberta Hydro Assets’ future-adjusted EBITDA.
On May 1, 2019, Brookfield invested the initial tranche of $350 million in exchange for seven per cent unsecured subordinated debentures due May 1, 2039. On Oct. 30, 2020, Brookfield invested the second tranche of $400 million in consideration for redeemable, retractable first preferred shares. The proceeds from the first and second tranche were used to accelerate our conversion to gas program. In addition, the proceeds from the second tranche of the financing will be used to fund other growth initiatives and for general corporate purposes.
TRANSALTA CORPORATION M19
Management’s Discussion and Analysis
Under the terms of the Investment Agreement, Brookfield committed to purchase TransAlta common shares on the open market to increase its share ownership in TransAlta to not less than nine per cent. At Dec. 31, 2021, Brookfield, through its affiliates, held, owned or had control over an aggregate of 35,425,696 common shares, representing approximately 13.1 per cent of the issued and outstanding common shares, calculated on an undiluted basis. In connection with the Investment Agreement, Brookfield is entitled to nominate two directors for election to the Board.
In accordance with the terms of the Investment Agreement, TransAlta formed a Hydro Assets Operating Committee consisting of two representatives from Brookfield and two representatives from TransAlta to collaborate in connection with the operation and maximization of the value of the Alberta Hydro Assets. In connection with this, the Company has committed to pay Brookfield an annual fee of $1.5 million for six years beginning May 1, 2019, which is recognized in the OM&A expense on the Consolidated Statements of Earnings (Loss).
Centralia Unit 1 and 2 Retirement
In 2011, Washington State passed the TransAlta Energy Transition Bill (chapter 180, Laws of 2011) (the "Bill'') allowing the Centralia thermal facility to comply with the state's GHG emissions performance standards by ceasing coal generation in one of its two boilers by the end of 2020, and the other by the end of 2025. The Bill removed restrictions that had previously been imposed on the facility limiting the duration of new contracts from the facility and limiting the technology that the facility would be required to implement for nitrogen oxide ("NOx") controls. Centralia Unit 1 was retired from service effective Dec. 31, 2020, as planned. The Centralia Unit 2 is set to shut down at the end of 2025.
TEC Hedland Pty Ltd. Secures AU$800 Million Financing
On Oct. 22, 2020, TEC Hedland Pty Ltd. ("TEC"), a subsidiary of the Company, closed an AU$800 million senior secured note offering, by way of a private placement, which is secured by, among other things, a first ranking charge over all assets of TEC (the "TEC Offering"). The TEC Offering bears interest at 4.07 per cent per annum, payable quarterly and maturing on June 30, 2042, with principal payments starting on March 31, 2022. The TEC Offering has a rating of BBB by Kroll Bond Rating Agency.
TransAlta Renewables has received $480 million (AU$515 million) of the proceeds from the TEC Offering through the redemption of certain intercompany structures. An additional AU$200 million was loaned to TransAlta Renewables by TransAlta Energy (Australia) Pty Ltd., which is a subsidiary of TransAlta. The loan bears interest at 4.32 per cent and will be repaid by Oct. 23, 2022, or on demand. The remaining proceeds from the TEC Offering were set aside for required reserves and transaction costs. TransAlta Renewables used a portion of the proceeds from the redemption and the intercompany loan to repay existing indebtedness on its credit facility and to acquire the asset and economic interests noted above.
TRANSALTA CORPORATION M20
Management’s Discussion and Analysis
Segmented Financial Performance and Operating Results
Segmented Disclosures
Segmented information is prepared on the same basis that the Company manages the business, evaluates financial results and makes key operating decisions. Refer to the Description of the Business section of this MD&A for explanation of the reporting segment changes.
The primary changes are the elimination of the Alberta Thermal and the Centralia segments, and the reorganization of the North American Gas and Australia Gas segments into a new "Gas" segment. The Alberta Thermal facilities that have been converted to gas have been included in the Gas segment. The remaining assets previously included in Alberta Thermal, including the mining assets and those facilities not converted to gas and the remaining Centralia unit, are included in a new "Energy Transition" segment. No changes were made to the Hydro, Wind and Solar, Energy Marketing or the Corporate and Other segments. Prior years' metrics were adjusted to be comparable to the new segments.
Consolidated Results
The following table reflects the generation and summary financial information on a consolidated basis for the year ended Dec. 31:
| | | | | | | | | | | | | | | | | | | | | | | | | | | | | | | | |
| LTA generation (GWh)(1) | Actual production (GWh)(2) | Adjusted EBITDA(3) | |
| For the year ended Dec. 31 | 2021 | 2020 | 2019 | 2021 | 2020 | 2019 | 2021 | 2020 | 2019 | | | |
| Hydro | 2,030 | | 2,030 | | 2,030 | | 1,936 | | 2,132 | | 2,045 | | 322 | | 105 | | 110 | | | | |
| Wind and Solar | 4,345 | | 3,916 | | 3,549 | | 3,898 | | 4,069 | | 3,355 | | 262 | | 248 | | 231 | | | | |
| Renewables | 6,375 | | 5,946 | | 5,579 | | 5,834 | | 6,201 | | 5,400 | | 584 | | 353 | | 341 | | | | |
| Gas | | | | 10,565 | | 10,780 | | 11,819 | | 494 | | 367 | | 403 | | | | |
| | | | | | | | | | | | |
| Energy Transition | | | | 5,706 | | 7,999 | | 11,852 | | 133 | | 175 | | 227 | | | | |
| Energy Marketing | | | | | | | 137 | | 113 | | 89 | | | | |
| Corporate and Other | | | | | | | (85) | | (81) | | (76) | | | | |
| Total | | | | 22,105 | | 24,980 | | 29,071 | | 1,263 | | 927 | | 984 | | | | |
Total earnings (loss) before
income taxes | | | | | | | (380) | | (303) | | 193 | | | | |
| | | | | | | | | | | | |
| | | | | | | | | | | | |
(1) Long-term average production ("LTA (GWh)") is calculated based on our portfolio as at Dec. 31, 2021, on an annualized basis from the average annual energy yield predicted from our simulation model based on historical resource data performed over a period of typically 30-35 years for the Wind and Solar segment and 36 years for Hydro segment. LTA (GWh) for Energy Transition is not considered for these facilities as we are currently transitioning these units completely by the end of 2025 and the LTA (GWh) for Gas is not considered as it is largely dependent on market conditions and merchant demand.
(2) Actual production levels are compared against the long-term average to highlight the impact of an important factor that affects the variability in our business results. In the short term, for each segment for Hydro, Wind and Solar, the conditions will vary from one period to the next and over time facilities will continue to produce in line with their long-term averages, which have proven to be reliable indicators of performance.
(3) This item is not defined and has no standardized meaning under IFRS. Please refer to below in this MD&A for further discussion of this item, including, where applicable, reconciliations to measures calculated in accordance with IFRS. See also the Additional IFRS Measures and Non-IFRS Measures section of this MD&A.
TRANSALTA CORPORATION M21
Management’s Discussion and Analysis
Hydro | | | | | | | | | | | | | | |
| Year ended Dec. 31 | 2021 | 2020 | 2019 | | | |
| Gross installed capacity (MW) | 925 | 925 | 925 | | | | |
| LTA (GWh) | 2,030 | | 2,030 | | 2,030 | | | | |
| Availability (%) | 92.4 | | 93.2 | | 95.9 | | | | |
| Production | | | | | | |
| Energy contract | | | | | | |
Alberta Hydro Assets (GWh)(1) | — | | 1,703 | | 1,653 | | | | |
Other Hydro energy (GWh)(1) | 434 | | 353 | | 331 | | | | |
| Energy merchant | | | | | | |
| Alberta Hydro Assets (GWh) | 1,502 | | — | | — | | | | |
| Other Hydro energy (GWh) | — | | 76 | | 61 | | | | |
| Total energy production (GWh) | 1,936 | | 2,132 | | 2,045 | | | | |
Ancillary service volumes (GWh)(4) | 2,897 | | 2,857 | | 2,978 | | | | |
| | | | | | |
Alberta Hydro Assets(1) | 185 | | 87 | | 101 | | | | |
Other Hydro Assets and other revenue(1)(2) | 42 | | 45 | | 44 | | | | |
Capacity payments(3) | — | | 60 | | 57 | | | | |
Alberta Hydro ancillary services(4) | 160 | | 66 | | 90 | | | | |
| | | | | | |
| | | | | | |
Net payment relating to Alberta Hydro PPA(5) | (4) | | (106) | | (136) | | | | |
| Revenues | 383 | | 152 | | 156 | | | | |
| | | | | | |
| Fuel and purchased power | 16 | | 8 | | 7 | | | | |
| Gross margin | 367 | | 144 | | 149 | | | | |
| Operations, maintenance and administration | 42 | | 37 | | 36 | | | | |
| Taxes, other than income taxes | 3 | | 2 | | 3 | | | | |
| | | | | | |
| Adjusted EBITDA | 322 | | 105 | | 110 | | | | |
| | | | | | |
| | | | | | |
| | | | | | |
| | | | | | |
| | | | | | |
| | | | | | |
| | | | | | |
| Supplemental Information: | | | | | | |
| Gross revenues per MWh | | | | | | |
| Alberta Hydro Assets energy ($/MWh) | 123 | 51 | 61 | | | |
| Alberta Hydro Assets ancillary ($/MWh) | 55 | 23 | 30 | | | |
| | | | | | |
| | | | | | |
| | | | | | |
| | | | | | |
| Sustaining capital | 26 | | 20 | | 14 | | | | |
| | | | | | |
| | | | | | |
| | | | | | |
| | | | | | |
| | | | | | |
| | | | | | |
| | | | | | |
(1) Alberta Hydro Assets include 13 hydro facilities on the Bow and North Saskatchewan river systems included under the PPA legislation. These PPAs expired Dec. 31, 2020. Other hydro facilities include our hydro facilities in BC and Ontario and the hydro facilities in Alberta not included in the legislated PPAs and transmission revenues.
(2) Other revenue includes revenues from our non-PPA hydro facilities, our transmission business and other contractual arrangements including the flood mitigation agreement with the Alberta government and black start services.
(3) Capacity payments include the annual capacity charge as described in the Power Purchase Arrangements Determination Regulation AR 175/2000, available from Alberta Queen's Printer. The PPA expired on Dec. 31, 2020.
(4) Ancillary services as described in the AESO Consolidated Authoritative Document Glossary.
(5) The net payment relating to the Alberta Hydro PPA represents the Company's financial obligations for notional amounts of energy and ancillary services in accordance with the Alberta Hydro PPA that expired on Dec. 31, 2020.
2021
Availability for 2021 decreased compared to 2020, primarily due to higher planned and unplanned outages.
Production for 2021 decreased by 196 GWh compared to 2020, mainly due to higher planned outages and lower precipitation.
Ancillary service volumes for 2021 increased by 40 GWh compared to 2020, in line with our expectations.
Adjusted EBITDA for 2021 increased by $217 million compared to 2020. Effective Jan. 1, 2021, with the expiration of the Alberta PPA for our Alberta Hydro Assets, these facilities began operating on a merchant basis in the Alberta power market. This eliminated the net payment obligations under the Alberta PPA. With strong availability during periods of market volatility, the Company captured higher energy and ancillary service revenue, partially offset by increased costs related to portfolio management services, dam safety staffing, dredging and station services.
TRANSALTA CORPORATION M22
Management’s Discussion and Analysis
Sustaining capital expenditures for 2021 were $6 million higher than in 2020, due to higher planned outages in 2021.
2020
Availability for 2020 decreased compared to 2019, primarily due to higher planned and unplanned outages.
Production for 2020 increased by 87 GWh over 2019, primarily due to higher water resources.
Ancillary service volumes for 2020 decreased by 121 GWh compared to 2019. This was primarily due to the AESO procuring lower ancillary volumes in 2020. Ancillary volumes were impacted by weaker market conditions, partially due to COVID-19 and reduced industrial demand in Alberta.
In 2020, Alberta Hydro energy revenue per MWh of production decreased by approximately $10 per MWh, compared to 2019, as result of lower merchant prices in Alberta. In 2020, Alberta Hydro ancillary revenue per MWh of production decreased by approximately $7 per MWh, compared to 2019. Lower realized prices were primarily due to unfavourable market conditions in Alberta in 2020.
Adjusted EBITDA for 2020 decreased by $5 million compared to 2019, from lower revenues partially offset by recoveries allocated by the AESO related to the AESO transmission line loss proceeding.
Sustaining capital expenditures for 2020 were $6 million higher than in 2019, due to higher planned outages in 2020.
Wind and Solar | | | | | | | | | | | |
| Year ended Dec. 31 | 2021 | 2020 | 2019 |
Gross installed capacity (MW)(1) | 1,906 | | 1,572 | 1,495 | |
| LTA (GWh) | 4,345 | 3,916 | 3,549 | |
| Availability (%) | 91.9 | | 95.1 | 95.0 | |
| Contract production (GWh) | 2,850 | | 2,871 | | 2,395 | |
| Merchant production (GWh) | 1,048 | | 1,198 | | 960 | |
| Total production (GWh) | 3,898 | | 4,069 | | 3,355 | |
Revenues(2) | 348 | | 334 | | 295 | |
| Fuel and purchased power | 17 | | 25 | | 16 | |
Gross margin(2) | 331 | | 309 | | 279 | |
| Operations, maintenance and administration | 59 | | 53 | | 50 | |
| Taxes, other than income taxes | 10 | | 8 | | 8 | |
Net other operating income(3) | — | | — | | (10) | |
| Adjusted EBITDA | 262 | | 248 | | 231 | |
| | | |
| | | |
| | | |
| | | |
| | | |
| | | |
| | | |
| | | |
| | | |
| | | |
| Supplemental information: | | | |
| | | |
| | | |
| | | |
| | | |
| | | |
| Sustaining capital | 13 | | 13 | | 13 | |
| | | |
| | | |
| | | |
| | | |
| | | |
| | | |
(1) The 2021 gross installed capacity includes 206 MW for the Windrise wind facility and 4 MW for the Oldman Wind facility, which were added in 2021. The 2021 and 2020 gross installed capacity includes 10 MW for the WindCharger battery storage facility and 67 MW for our proportionate share of the Skookumchuck wind facility.
(2) For details of the adjustments to revenues included in adjusted EBITDA, refer to the Additional IFRS and Non-IFRS Measures section of this MD&A.
(3) Relates to insurance proceeds included in net other operating income.
2021
Availability for the year ended Dec. 31, 2021, decreased compared to 2020, primarily as a result of the unplanned outage at the Kent Hills 1 and 2 wind facilities.
Production for the year ended 2021, decreased 171 GWh compared to 2020, and was impacted by lower wind resources in Eastern Canada and in the US and the unplanned outage at the Kent Hills 1 and 2 wind facilities, which was partially offset by a full year of production from the Skookumchuck wind facility, the commissioning of the Windrise wind facility, and the acquisition of the North Carolina Solar facility.
TRANSALTA CORPORATION M23
Management’s Discussion and Analysis
Adjusted EBITDA for 2021 increased by $14 million compared to 2020, primarily due to higher merchant pricing in Alberta, a full year of operations from the Skookumchuck wind facility and the WindCharger battery storage facility as well as incremental value from the newly commissioned or acquired assets in 2021: consisting of the Windrise wind facility and the North Carolina Solar facility. Also, fuel and purchased power costs were lower in 2021 due to the AESO transmission line loss recorded in 2020. Adjusted EBITDA was negatively impacted by lower wind resources in Eastern Canada and the US, the unplanned outage at the Kent Hills 1 and 2 wind facilities and the weakening US dollar relative to the Canadian dollar.
Sustaining capital expenditures for 2021 were consistent with 2020.
2020
Availability for the year ended Dec. 31, 2020, was consistent with 2019, which was in line with our expectations.
Production for the year ended Dec. 31, 2020, increased 714 GWh, mainly due to the Big Level and Antrim wind facilities commencing commercial operations in December 2019 and strong wind resources across all regions in 2020, in particular at the Alberta wind facilities.
Adjusted EBITDA for 2020 increased by $17 million compared to 2019, primarily due to the addition of the Big Level and Antrim wind facilities and higher production, partially offset by insurance proceeds received in 2019, lower Alberta pricing and the planned expiry of certain wind power production incentives in 2019. In addition, during 2020, the AESO began issuing invoices pertaining to the AESO transmission line loss. Wind and Solar were allocated $8 million in costs in 2020, which has been reflected in fuel and purchased power within the same year.
Sustaining capital expenditures for 2020 were consistent with 2019.
Gas | | | | | | | | | | | |
| Year ended Dec. 31 | 2021 | 2020 | 2019 |
Gross installed capacity (MW)(1) | 3,084 | | 3,084 | | 3,049 | |
| | | |
| Availability (%) | 85.7 | | 87.7 | | 92.8 | |
| Contract production (GWh) | 3,622 | | 7,280 | | 8,101 | |
Merchant production (GWh)(2) | 7,084 | | 3,698 | | 3,810 | |
Purchased power (GWh)(2) | (141) | | (198) | | (92) | |
| Total production (GWh) | 10,565 | | 10,780 | | 11,819 | |
Revenues(3) | 1,132 | | 848 | | 887 | |
Fuel and purchased power(3) | 374 | | 221 | | 230 | |
| Carbon compliance | 118 | | 120 | | 138 | |
Gross margin(3) | 640 | | 507 | | 519 | |
Operations, maintenance and administration(3) | 173 | | 166 | | 162 | |
| Taxes, other than income taxes | 13 | | 13 | | 9 | |
Net other operating income(3) | (40) | | (39) | | (41) | |
| Termination of Sundance B and C PPAs | — | | — | | (14) | |
| Adjusted EBITDA | 494 | | 367 | | 403 | |
| | | |
| | | |
| | | |
| | | |
| | | |
| | | |
| | | |
| | | |
| | | |
| | | |
| | | |
| | | |
| | | |
| | | |
| | | |
| | | |
| | | |
| | | |
| | | |
| | | |
| | | |
| | | |
| | | |
| | | |
| | | |
| | | |
| | | |
| | | |
| | | |
| Supplemental information: | | | |
| | | |
| | | |
| | | |
| Sustaining capital | 128 | | 87 | | 33 | |
| | | |
| | | |
| | | |
| | | |
| | | |
| | | |
| | | |
(1) 2021 and 2020 includes 29 MW for the acquisition of the Ada facility.
(2) Purchased power used for dispatch optimization has been separated from merchant production in the current year. Comparable periods have been adjusted to reflect this change.
(3) For details of the adjustments to revenues, fuel and purchased power, operations, maintenance and administration and net other operating income included in adjusted EBITDA, refer to the Additional IFRS Measures and Non-IFRS Measures section of this MD&A.
The Gas Segment is a new segment as described in the Segmented Financial Performance and Operating Results section of this MD&A. Included in the Gas segment is the previous North American Gas segment, Australian Gas segment and the facilities from the previous Alberta Thermal segment converted to gas.This includes Sheerness Unit 1 and 2, Keephills Unit 2 and 3 and Sundance Unit 6. Previous periods have been adjusted to be comparable to the new segment.
TRANSALTA CORPORATION M24
Management’s Discussion and Analysis
2021
Availability for the year ended Dec. 31, 2021, decreased compared to 2020, primarily as a result of an increase in unplanned outages and planned boiler conversions of Keephills Unit 2, Keephills Unit 3, and Sheerness Unit 1 in Alberta, partially offset by higher availability of Sundance 6 with the gas conversion completed in 2020.
Production for the year ended Dec. 31, 2021, decreased by 215 GWh compared to 2020, mainly due to higher portfolio optimization activities in Alberta and lower customer loads in Australia, partially offset by higher demand in our other facilities and incremental production from a full year of operations at the Ada cogeneration facility.
Adjusted EBITDA for the year ended Dec. 31, 2021, increased by $127 million compared to 2020, primarily due to higher merchant pricing in the Alberta market, the South Hedland PPA contract settlement and incremental production from a full year of operations at our Ada cogeneration facility, partially offset by an increase in fuel, unplanned short-term steam supply outages at our Sarnia cogeneration facility, higher OM&A costs related to the BHP pass-through projects and legal fees related to the South Hedland PPA contract settlement.
Sustaining capital expenditures for the year ended Dec. 31, 2021, increased by $41 million mainly due to major maintenance costs associated with conversion to natural gas outages of Keephills Unit 2 and Unit 3 and Sheerness Unit 1, planned major maintenance at the Australian gas facilities, and the purchase of an additional engine at the South Hedland facility.
2020
Availability for the year ended Dec. 31, 2020, decreased compared to 2019, due to the Sundance Unit 6 planned turnaround and conversion to gas, higher unplanned outages and derates.
Production for the year ended Dec. 31, 2020, decreased by 1,039 GWh compared to 2019, mainly due to lower availability, lower merchant production in Alberta and Ontario and lower customer demand in Australia, partially offset by the addition of the Ada cogeneration facility.
Adjusted EBITDA for the year ended Dec. 31, 2020, decreased by $36 million compared to 2019, due to lower revenues from lower realized merchant pricing in Alberta and lower production, higher fuel costs and $14 million related to the settlement on the Sundance B and C PPAs in 2019, partially offset by the addition of the Ada facility, deferral of legal costs, reduced staffing due to cost controls and the strengthening of the Australian dollar against the Canadian dollar.
Sustaining capital expenditures for the year ended Dec. 31, 2020, increased by $54 million mainly due to the major maintenance that occurred during the Sheerness dual-fuel conversion and the Sundance Unit 6 turnaround and planned major maintenance at the Southern Cross facility, partially offset by a reduction in sustaining capital associated with a major planned outage for Sarnia cogeneration facility in 2019.
TRANSALTA CORPORATION M25
Management’s Discussion and Analysis
Energy Transition | | | | | | | | | | | |
| Year ended Dec. 31 | 2021 | 2020 | 2019 |
Gross installed capacity (MW)(1) | 1,472 | | 2,548 | | 2,916 | |
| | | |
| Availability (%) | 75.3 | | 82.6 | | 78.7 | |
Adjusted availability (%)(2) | 78.8 | | 91.3 | | 84.2 | |
| Contract sales volume (GWh) | 3,329 | | 5,526 | | 5,622 | |
| Merchant sales volume (GWh) | 6,052 | | 6,248 | | 10,095 | |
| Purchased power (GWh) | (3,675) | | (3,775) | | (3,865) | |
| Total production (GWh) | 5,706 | | 7,999 | | 11,852 | |
| | | |
Revenues(3) | 728 | | 690 | | 893 | |
Fuel and purchased power(3) | 432 | | 352 | | 499 | |
| Carbon compliance | 60 | | 48 | | 77 | |
Gross margin(3) | 236 | | 290 | | 317 | |
Operations, maintenance and administration(3) | 97 | | 106 | | 124 | |
| Taxes, other than income taxes | 6 | | 9 | | 8 | |
| | | |
| Termination of Sundance B and C PPAs | — | | — | | (42) | |
| Adjusted EBITDA | 133 | | 175 | | 227 | |
| | | |
| | | |
| | | |
| | | |
| | | |
| | | |
| | | |
| | | |
| | | |
| | | |
| | | |
| | | |
| | | |
| | | |
| Supplemental information: | | | |
| | | |
| | | |
| | | |
| | | |
| Highvale mine reclamation spend | 6 | 7 | 15 |
| Centralia mine reclamation spend | 9 | 7 | 11 |
| Sustaining capital | 19 | | 22 | | 69 | |
| | | |
| | | |
| | | |
| | | |
| | | |
| | | |
| | | |
(1) 2021 gross installed capacity excludes Centralia Unit 1 (670 MW retired on Dec. 31, 2020) and Sundance Unit 5 (406 MW) retired during the year. 2021 and 2020 excludes 368 MW from Sundance Unit 3, which retired during 2020.
(2) Adjusted for dispatch optimization.
(3) For details of the adjustments to revenues, fuel and purchased power and operations, maintenance and administration included in adjusted EBITDA, refer to the Additional IFRS Measures and Non-IFRS Measures section of this MD&A.
The Energy Transition segment is a new segment as described in the Segmented Financial Performance and Operating Results section of this MD&A. Included in the Energy Transition segment is the previous Centralia segment, mine assets and the previous Alberta Thermal segment facilities that were not converted to gas. This includes Keephills Unit 1 and Sundance Unit 4. Previous periods have been adjusted to be comparable to the new segment.
2021
Adjusted availability for the year ended Dec. 31, 2021, decreased compared to 2020 due to higher planned and unplanned outages at Centralia Unit 2 and Sundance Unit 4 related to derates.
Production decreased by 2,293 GWh for the year ended Dec. 31, 2021, compared to 2020, primarily due the planned retirement of Centralia Unit 1 and dispatch optimization of the Alberta assets.
Adjusted EBITDA decreased by $42 million for the year ended Dec. 31, 2021, compared to 2020, primarily due the planned retirement of Centralia Unit 1, higher fuel and purchased power due to unplanned outages at Centralia Unit 2, higher carbon compliance costs for the Alberta assets primarily due to an increase in carbon prices and the weakening of the US dollar relative to the Canadian dollar throughout the year, partially offset by dispatch optimization of the Alberta assets and lower OM&A as a result the planned retirement of Centralia Unit 1.
Mine reclamation spend for the Highvale and Centralia mines was mainly consistent compared to 2020.
Sustaining capital expenditures for the year ended Dec. 31, 2021, were $3 million lower than 2020 mainly due to reduction in planned outage work performed.
2020
Adjusted availability for the year increased compared to 2019 due to reduced forced outages at Centralia Unit 1 and lower planned outages at the Alberta sites.
TRANSALTA CORPORATION M26
Management’s Discussion and Analysis
Production decreased by 3,853 GWh in 2020 compared to 2019 mainly due to lower merchant pricing and Genesee 3 no longer being owned by the company. In 2020, both Centralia units were taken out of service in February and March as a result of seasonally lower prices in the Pacific Northwest, whereas in 2019 both units remained in service into April due to higher prices in the Pacific Northwest. In 2020, Genesee 3 was not included due to a 2019 ownership swap, resulting in the Company no longer owning a portion of the facility.
Adjusted EBITDA decreased by $52 million compared to 2019, primarily due to lower merchant production in Alberta due to unfavourable market conditions, a $42 million settlement related to the Sundance B and C PPAs in 2019, partially offset by dispatch optimization at Centralia in 2020 and from the increased cost of buybacks due to forced outages.
Mine reclamation spend decreased by $8 million for the Highvale mine and $4 million for the Centralia mine compared to 2019, mainly due to downsizing, an updated mine plan and the mine closure advancement for the Highvale Mine. In addition, due to COVID-19 in 2020, the mine reclamation spend was deferred to future years.
Sustaining capital expenditures for 2020 decreased by $47 million compared to 2019 mainly due to lower planned outage work performed in 2020 and lower mining equipment purchases and maintenance.
Energy Marketing | | | | | | | | | | | |
| Year ended Dec. 31 | 2021 | 2020 | 2019 |
Revenues(1) | 173 | | 143 | | 119 | |
| Operations, maintenance and administration | 36 | | 30 | | 30 | |
| | | |
| Adjusted EBITDA | 137 | 113 | | 89 | |
| | | |
| | | |
| | | |
| | | |
| | | |
| | | |
| | | |
| | | |
| | | |
(1) For details of the adjustments to revenues included in adjusted EBITDA, refer to the Additional IFRS Measures and Non-IFRS Measures section of this MD&A.
2021
Adjusted EBITDA for 2021 increased by $24 million compared to 2020. Results were better primarily due to favourable short-term trading of both physical and financial power and natural gas products across all North American markets. This was partially offset by OM&A increases due to higher incentives related to stronger performance. The Energy Marketing team was able to capitalize on short-term market volatility in the markets in which we trade without materially changing the risk profile of the business unit.
2020
Adjusted EBITDA for 2020 increased by $24 million compared to 2019. Results were primarily from continued strong performance in both power and natural gas markets. Gains were realized from short-term strategies across various geographic regions aided by market and price volatility. The Energy Marketing team was able to capitalize on short-term arbitrage opportunities in the markets in which we trade without materially changing the risk profile of the business unit. OM&A spending for 2020 and 2019 was similar.
Corporate | | | | | | | | | | | |
| Year ended Dec. 31 | 2021 | 2020 | 2019 |
| Operations, maintenance, and administration | 84 | | 80 | | 73 | |
| Taxes, other than income taxes | 1 | | 1 | | 1 | |
| Net other operating loss | — | | — | | 2 | |
| Adjusted EBITDA | (85) | | (81) | | (76) | |
| | | |
| | | |
| | | |
| | | |
| | | |
| | | |
| | | |
| | | |
| | | |
| | | |
| | | |
| | | |
| | | |
| | | |
| | | |
| Supplemental information: | | | |
| | | |
| | | |
| Total sustaining capital | 13 | | 14 | | 12 | |
| | | |
| | | |
| | | |
| | | |
| | | |
| | | |
| | | |
2021
Adjusted EBITDA for the year ended Dec. 31, 2021, decreased by $4 million compared to 2020, primarily due to higher incentive payments, higher employee costs, higher insurance costs, and higher legal fees for settlement of outstanding legal issues, partially offset by the receipt of CEWS funding and realized gains from the total return swap. A portion of the settlement costs of our employee share-based payment plans is hedged by entering into total return swaps, which are cash settled every quarter. Excluding the impact of the total return swap, staffing costs increased due to additional headcount to support growth initiatives. As previously committed, the CEWS funding is being used to support incremental employment within the Company.
TRANSALTA CORPORATION M27
Management’s Discussion and Analysis
For the year ended Dec. 31, 2021, sustaining capital expenditures were consistent with 2020.
2020
Adjusted EBITDA for the year ended Dec. 31, 2020, decreased by $5 million compared to 2019, primarily due to realized gains and losses from the total return swap. A portion of the settlement cost of our employee share-based payment plans is fixed by entering into total return swaps, which are cash settled every quarter. Excluding the impact of the total return swap, Corporate overhead costs for 2020 decreased by $10 million compared to 2019, mainly due to lower legal fees, lower labour and reduced travel costs, partially offset by additional costs to support growth and development projects, centralization of shared services to the Corporate segment and additional costs incurred to support COVID-19 protocols.
For the year ended Dec. 31, 2020, sustaining capital expenditures were $2 million higher than 2019, mainly due to capital spend on information technology.
Fourth Quarter Highlights
Consolidated Financial Highlights | | | | | | | | |
| Three months ended Dec. 31 | 2021 | 2020 |
| Adjusted availability (%) | 83.8 | | 87.1 | |
| Production (GWh) | 5,823 | | 7,704 | |
| Revenues | 610 | | 544 | |
| Fuel and purchased power | 272 | | 282 | |
| Carbon compliance | 39 | | 45 | |
| Operations, maintenance and administration | 124 | | 118 | |
Adjusted EBITDA(1) | 270 | | 234 | |
| Loss before income taxes | (32) | | (168) | |
| Net loss attributable to common shareholders | (78) | | (167) | |
| Cash flow from operating activities | 54 | | 110 | |
FFO(1) | 213 | | 161 | |
FCF(1) | 106 | | 52 | |
| Net earnings (loss) per share attributable to common shareholders, basic and diluted | (0.29) | | (0.61) | |
Dividends declared per common share(2) | 0.10 | | 0.09 | |
Dividends declared per preferred share(3) | 0.25 | | 0.50 | |
FFO per share(1,4) | 0.79 | | 0.59 | |
FCF per share(1,4) | 0.39 | | 0.19 | |
(1) These items are not defined and have no standardized meaning under IFRS. Please refer to the Segmented Financial Performance and Operating Results section of this MD&A for further discussion of these items, including, where applicable, reconciliations to measures calculated in accordance with IFRS. See also the Additional IFRS Measures and Non-IFRS Measures section of this MD&A.
(2) Dividends declared vary year over year due to timing of dividend declarations.
(3) Weighted average of the Series A, B, C, E and G preferred share dividends declared. Dividends declared vary year over year due to timing of dividend declarations.
(4) The weighted average number of common shares outstanding for the three months ended Dec. 31, 2021 was 271 million shares (2020 - 273 million shares).
Financial Highlights
During the fourth quarter of 2021, the Company completed the year with solid performance from our Alberta Electricity Portfolio. Hydro, Gas and the Energy Transition segments had high availability in Alberta during periods of peak pricing, which resulted from extreme cold weather and periods of province-wide planned and unplanned outages. The Alberta merchant portfolio was positioned to capture opportunities from these strong spot market conditions through both energy and ancillary services revenues.
Adjusted availability for the three months ended Dec. 31, 2021, was 83.8 per cent compared to 87.1 per cent for the same period in 2020. Higher unplanned outages at our Wind and Solar segment and Energy Transition segment were partially offset by lower unplanned and planned outages at our Hydro segment. Wind and Solar availability was impacted by the unplanned outages at Kent Hills 1 and 2 wind facilities. Energy Transition availability was impacted by unplanned outages in our Centralia Unit 2 facility and dispatch optimization in Alberta.
TRANSALTA CORPORATION M28
Management’s Discussion and Analysis
Production for the three months ended Dec. 31, 2021, was 5,823 GWh compared to 7,704 GWh for the same period in 2020. The decrease in production for the three-month period in 2021 was due to the planned retirement of Centralia Unit 1 and unplanned outage at Centralia Unit 2, lower availability, the outage at the Kent Hills 1 and 2 wind facilities, and lower wind resources in the Wind and Solar segment. This decrease in production was partially offset by incremental production at our North Carolina Solar facility, the Windrise and Skookumchuck wind facilities in the Wind and Solar segment, and higher production at our Ada and Sarnia facilities within our Gas segment.
Revenues for the three months ended Dec. 31, 2021, increased $66 million compared to the same period in 2020, mainly as a result of capturing higher realized prices within the Alberta market through our optimization and operating activities and the elimination of the net payment obligations under the Alberta Hydro PPA required in the prior period. Revenues further increased due to the addition of the North Carolina Solar facility and commercial operation of the Windrise wind facility in the Wind and Solar segment, in addition to increased revenue from the Ada facility within the Gas segment. These increases were partially offset by lower production in the Energy Transition, Hydro and Wind and Solar segments.
Fuel and purchased power costs decreased by $10 million in the three months ended Dec. 31, 2021, compared to the same period in 2020. In our Energy Transition segment, our costs increased compared to 2020 due to higher fuel transportation costs and the acquisition of higher-priced power to fulfil our contractual obligations during planned and unplanned outages during periods of higher merchant pricing at the Centralia facility and higher natural gas pricing within the Gas segment. This was partially offset by lower coal mine depreciation and coal inventory write-downs at the Highvale mine in the fourth quarter of 2021.
Carbon compliance costs decreased by $6 million in the three months ended Dec. 31, 2021, compared to the same period in 2020, due to reductions in GHG emissions stemming from changes in the fuel mix ratio as we operated more on natural gas and fired less with coal, partially offset by an increase in the carbon price per tonne.
OM&A expenses for the three months ended Dec. 31, 2021, increased by $6 million, compared to the same period in 2020, primarily due to increased staffing costs for growth and strategic initiatives and higher incentive costs.
Adjusted EBITDA for the three months ended Dec. 31, 2021, increased by $36 million compared with the same period in 2020, largely due to higher adjusted EBITDA in our Hydro and Gas segments, which was driven by higher realized prices in the Alberta market, partially offset by lower production at Centralia Unit 2 within our Energy Transition segment due to a transformer failure that has now been resolved and an unplanned outage at the Kent Hills 1 and 2 wind facilities.
Net loss attributable to common shareholders in the fourth quarter of 2021 was $78 million compared to net loss of $167 million in the same period of 2020, a decrease of $89 million. The net loss in 2021 was favourably impacted by lower depreciation and amortization expense related to asset retirements and impairments in our Gas and Energy Transition segments and higher adjusted EBITDA.
Cash flow from operating activities in the fourth quarter of 2021 decreased by $56 million compared with the same period in 2020, primarily due to changes in non-cash working capital.
FCF in the fourth quarter of 2021 was $106 million compared to $52 million in the same period of 2020, as a result of higher adjusted EBITDA due to higher realized prices in Alberta, settlement of provisions and lower sustaining capital expenditures, partially offset by higher distributions paid to subsidiaries' non-controlling interests.
TRANSALTA CORPORATION M29
Management’s Discussion and Analysis
Segmented Financial Performance and Operating Results for the Fourth Quarter
A summary of our adjusted EBITDA by segment and total loss before income taxes for the three months ended Dec. 31, 2021 and 2020 is as follows:
| | | | | | | | | | |
| Adjusted EBITDA | |
| Three months ended Dec. 31 | 2021 | 2020 | | |
| | | | |
| Hydro | 67 | | 22 | | | |
| Wind and Solar | 76 | | 77 | | | |
Gas(1) | 110 | | 92 | | | |
Energy Transition(2) | 37 | | 42 | | | |
| Energy Marketing | 9 | | 23 | | | |
| Corporate and Other | (29) | | (22) | | | |
| Total adjusted EBITDA | 270 | | 234 | | | |
| Loss before income taxes | (32) | | (168) | | | |
(1) Gas segment includes the segments previously known as Australian Gas and North American Gas and the coal generation assets converted to gas from the segment previously known as Alberta Thermal.
(2) Energy Transition segment includes the segment previously known as Centralia and the coal generation assets not converted to gas (including Sundance 4) and mining assets from the segment previously known as Alberta Thermal.
Adjusted EBITDA increased by $36 million for the fourth quarter of 2021, compared to 2020, primarily as a result of:
▪Hydro results were $45 million higher due to increased revenues from higher merchant prices in Alberta. Effective Jan. 1, 2021, with the expiration of the PPA for the Alberta Hydro facilities, these facilities began operating on a merchant basis in the Alberta power market. This eliminated the net payment obligations under the Alberta PPA.
▪Wind and Solar results were consistent compared to the prior period; results were impacted by the unplanned outage at the Kent Hills 1 and 2 wind facilities, which was partially offset by higher merchant pricing in Alberta and incremental value from newly commissioned or acquired assets such as the North Carolina Solar facility and the Windrise facility.
▪Gas results were $18 million higher mainly due to higher merchant prices in Alberta and the South Hedland PPA contract settlement, partially offset by higher OM&A costs and legal fees.
▪Energy Transition results were $5 million lower as a result of the retirement of Centralia Unit 1, unplanned outages at Centralia Unit 2 due to a transformer failure that has now been resolved, partially offset by dispatch optimization of Alberta assets.
▪Energy Marketing results were in line with expectations, but lower than prior year by $14 million.
▪Corporate costs were higher primarily due to higher incentive payments and higher staffing costs, partially offset by lower legal dispute settlement costs. Impacts from the total return swap on our share-based payment plans were higher in 2021 compared to 2020.
Selected Quarterly Information
Our results are seasonal due to the nature of the electricity market and related fuel costs. Higher maintenance costs are often incurred in the spring and fall when electricity prices are expected to be lower, as electricity prices generally increase in the peak winter and summer months in our main markets due to increased heating and cooling loads. Margins are also typically impacted in the second quarter due to the volume of hydro production resulting from spring runoff and rainfall in the Pacific Northwest, which impacts production at Centralia. Typically, hydroelectric facilities generate most of their electricity and revenues during the spring months when melting snow starts feeding watersheds and rivers. Inversely, wind speeds are historically greater during the cold winter months and lower in the warm summer months. | | | | | | | | | | | | | | |
| | Q1 2021 | Q2 2021 | Q3 2021 | Q4 2021 |
| | | | |
| Revenues | 642 | | 619 | | 850 | | 610 | |
| Adjusted EBITDA | 310 | | 302 | | 381 | | 270 | |
| Earnings (loss) before income taxes | 21 | | 72 | | (441) | | (32) | |
| Cash flow from operating activities | 257 | | 80 | | 610 | | 54 | |
| FFO | 211 | | 250 | | 297 | | 213 | |
| Net earnings (loss) attributable to common shareholders | (30) | | (12) | | (456) | | (78) | |
Net earnings (loss) per share attributable to common shareholders, basic and diluted(1) | (0.11) | | (0.04) | | (1.68) | | (0.29) | |
| | | | |
| | Q1 2020 | Q2 2020 | Q3 2020 | Q4 2020 |
| | | | |
| Revenues | 606 | | 437 | | 514 | | 544 | |
| Adjusted EBITDA | 220 | | 217 | | 256 | | 234 | |
| Earnings (loss) before income taxes | 46 | | (52) | | (129) | | (168) | |
| Cash flow from operating activities | 214 | | 121 | | 257 | | 110 | |
| FFO | 172 | | 159 | | 193 | | 161 | |
| Net earnings (loss) attributable to common shareholders | 27 | | (60) | | (136) | | (167) | |
Net earnings (loss) per share attributable to common shareholders, basic and diluted(1) | 0.10 | | (0.22) | | (0.50) | | (0.61) | |
(1) Basic and diluted earnings per share attributable to common shareholders and adjusted earnings per share are calculated each period using the weighted average common shares outstanding during the period. As a result, the sum of the earnings per share for the four quarters making up the calendar year may sometimes differ from the annual earnings per share.
Reported net earnings, adjusted EBITDA and FFO are generally higher in the first and fourth quarters due to higher demand associated with the cold winter months in the markets in which we operate and lower planned outages.
Net earnings (loss) attributable to common shareholders has also been impacted by the following variations and events:
▪Acquisition of the North Carolina Solar facility in the fourth quarter of 2021;
▪The unplanned outage at Kent Hills 1 and 2 wind facilities and Centralia Unit 2 in the fourth quarter of 2021;
▪Sundance Unit 5 repowering was suspended in the third quarter of 2021 and retired during 2021;
▪Gains relating to the sale of the Pioneer Pipeline in the second quarter of 2021 and gains on sale of Gas equipment in the third quarter of 2021;
▪The unplanned outages at the Sarnia cogeneration facility in the second quarter of 2021;
▪Alberta hydro facilities, Keephills Units 1 and 2 and Sheerness began operating on a merchant basis in the Alberta market effective Jan. 1, 2021;
▪Revenues declined due to weaker market conditions in 2020 as a result of the COVID-19 pandemic and low oil prices;
▪Sundance Unit 3 was retired in the third quarter of 2020;
▪Accelerated plans to shutdown the Highvale Mine resulted in remaining future royalty payments being recognized as an onerous contract in the third quarter of 2021;
▪Sheerness going off-coal has resulted in the remaining coal supply payments on the existing coal supply agreement being recognized as an onerous contract in the fourth quarter of 2020;
▪Accelerated shutdown of the Highvale Mine, increased mine depreciation included in the cost of coal. Coal inventory write-downs incurred in the first three quarters of 2021 and third and fourth quarters of 2020;
▪Coal-related parts and materials inventory write-downs incurred in the second and third quarters of 2021;
▪The impact of the updated provision estimates for the transmission line loss rule during the first quarter of 2021 and the last three quarters of 2020;
▪Significant foreign exchange gains in the last three quarters of 2020, which more than offset foreign exchange losses experienced during the first quarter of 2020;
▪The effects of impairments and reversals during all periods shown;
▪The effects of changes in decommissioning and restoration provisions for retired assets in all periods shown;
▪The effects of changes in useful lives of certain assets during the third quarter of 2020; and
▪Current tax expense increases since the fourth quarter of 2020, mainly due to the Energy Marketing segment and certain Hydro operations becoming taxable, increased valuation allowances taken on US deferred tax assets along with a decreased deferred tax recovery mainly due to increased revenues in 2021.
TRANSALTA CORPORATION M30
Management’s Discussion and Analysis
Financial Position
The following table highlights significant changes in the consolidated statements of financial position from Dec. 31, 2020, to Dec. 31, 2021:
| | | | | | | | | | | |
| | | |
| Assets | Dec. 31, 2021 | Dec. 31, 2020 | Increase/(decrease) |
| Current assets | | | |
| Cash and cash equivalents | 947 | | 703 | | 244 | |
| | | |
| Trade and other receivables | 651 | | 583 | | 68 | |
| Risk management assets | 308 | | 171 | | 137 | |
| Inventory | 167 | | 238 | | (71) | |
| Assets held for sale | 25 | | 105 | | (80) | |
Other current assets(1) | 99 | | 102 | | (3) | |
| Total current assets | 2,197 | | 1,902 | | 295 | |
| | | |
| Non-current assets | | | |
| | | |
| | | |
| Risk management assets | 399 | | 521 | | (122) | |
| Property, plant and equipment, net | 5,320 | | 5,822 | | (502) | |
| Right-of-use assets | 95 | | 141 | | (46) | |
| | | |
Other non-current assets(2) | 1,215 | | 1,361 | | (146) | |
| Total non-current assets | 7,029 | | 7,845 | | (816) | |
| Total assets | 9,226 | | 9,747 | | (521) | |
| | | |
| Liabilities | | | |
| Current liabilities | | | |
| | | |
| Credit facilities, long-term debt and lease liabilities (current) | 844 | | 105 | | 739 | |
Other current liabilities(3) | 1,087 | | 830 | | 257 | |
| Total current liabilities | 1,931 | | 935 | | 996 | |
| | | |
| Non-current liabilities | | | |
| Credit facilities, long-term debt and lease liabilities | 2,423 | | 3,256 | | (833) | |
| | | |
| Decommissioning and other provisions (long-term) | 779 | | 614 | | 165 | |
| Risk management liabilities (long-term) | 145 | | 68 | | 77 | |
| Deferred income tax liabilities | 354 | | 396 | | (42) | |
Other non-current liabilities(4) | 1,001 | | 1,042 | | (41) | |
| Total non-current liabilities | 4,702 | | 5,376 | | (674) | |
| Total liabilities | 6,633 | | 6,311 | | 322 | |
| | | |
| Equity | | | |
| Equity attributable to shareholders | 1,582 | | 2,352 | | (770) | |
| Non-controlling interests | 1,011 | | 1,084 | | (73) | |
| Total equity | 2,593 | | 3,436 | | (843) | |
| Total liabilities and equity | 9,226 | | 9,747 | | (521) | |
(1) Includes restricted cash and prepaid expenses.
(2) Includes investments, long-term portion of finance lease receivables, intangible assets, goodwill, deferred income tax assets and other assets.
(3) Includes accounts payable and accrued liabilities, current portion of decommissioning and other provisions, current portion of contract liabilities, income taxes payable and dividends payable.
(4) Includes exchangeable securities, contract liabilities and defined benefit obligation and other long-term liabilities.
TRANSALTA CORPORATION M31
Management’s Discussion and Analysis
Significant changes in TransAlta's consolidated statements of financial position were as follows:
Working Capital
Including the current portion of long term debt and lease liabilities, the excess of current assets over current liabilities was $266 million as at Dec. 31, 2021 (2020 - $967 million). Our working capital decreased year over year mainly due to the reclassification of debt from long-term to current. Excluding the current portion of long-term debt and lease liabilities of $844 million, the excess of current assets over liabilities was $1,110 million as at Dec. 31, 2021 (2020 - $1,072 million), consistent with the previous year.
Current assets increased by $295 million to $2,197 million as at Dec. 31, 2021, from $1,902 million as at Dec. 31, 2020. Strong Alberta pricing has increased operating cash flow and receivables. In addition, a loan receivable relating to Kent Hills Wind LP of $55 million was reclassified as current as it matures in October 2022. This was partially offset by reductions in inventory of $71 million and in assets held for sale of $80 million. Inventory balances have declined with coal inventory write-downs and parts and material write-downs relating to the transition off of coal and the closure of the Highvale mine. Assets held for sale decreased with the closing of the Pioneer Pipeline sale during the year.
Current liabilities increased by $996 million from $935 million as at Dec. 31, 2020, to $1,931 million as at Dec. 31, 2021, mainly due to the reclassification to current of $510 million Senior Notes coming due in 2022 and the reclassification of the Kent Hills bond of $221 million as the KH Bonds may be in default at the end of the year. We currently expect to refinance the senior notes maturing in 2022. Management is in discussions with the Trustee and holders of the KH Bonds to negotiate waivers and amendments related to the KH Bonds.
Derivative financial instruments also contributed favourably to the working capital balance.
Non-Current Assets
Non-Current assets at Dec. 31, 2021 was $7,029 million, a decrease of $816 million from $7,845 million as at Dec. 31, 2020. The decrease was primarily due to the asset impairments that have occurred during the year. The Energy Transition segment recognized $345 million of asset impairment charges in the year as a result of the decision to suspend the Sundance Unit 5 repowering project and the planned retirements of Keephills Unit 1 and Sundance Unit 4. In addition, with the completion of the transition to gas of the Alberta coal fleet, the Highvale mine was removed from the Alberta Merchant CGU, which resulted in an impairment recognized on the remaining mine assets, further reducing the property, plant and equipment ("PP&E") balance by $195 million. These impacts were partially offset by the construction of the Windrise wind facility and Garden Plain wind project, as well as the acquisition of the North Carolina Solar facility.
During 2021, the Company completed the sale of the Pioneer Pipeline to ATCO and derecognized the right- of-use asset of $43 million relating to the natural gas transportation agreement that was terminated as part of the transaction.
Non-Current Liabilities
Non-Current liabilities as at Dec. 31, 2021, are $4,702 million, a decrease of $674 million from $5,376 million as at Dec. 31, 2020, mainly due to a $833 million decrease in long-term debt and lease liabilities related in most part to the reclassification of the Senior Notes and KH Bonds to current liabilities, derecognition of the lease liability on the termination of the natural gas transportation agreement and from scheduled principal repayments on long-term debt and lease liabilities. This was partially offset by a $120 million increase in the wind decommissioning provisions resulting from a review of a recent wind engineering study on the decommissioning of the wind sites. The change in estimate is unrelated to the tower failure identified in the fourth quarter of 2021. In addition, the Company had a $47 million increase related to the Sundance and Keephills facilities to reflect a change in the timing of the expected reclamation work resulting from asset retirements and change in useful lives.
Total Equity
As at December 31, 2021, the decrease in total equity of $843 million was mainly due to the total comprehensive loss of $610 million, distributions to non-controlling interests of $156 million and dividends declared on common and preferred shares of $90 million, partially offset by the effect of shared-based payment plans of $13 million.
TRANSALTA CORPORATION M32
Management’s Discussion and Analysis
Financial Capital
The Company is focused on maintaining a strong balance sheet and financial position to ensure access to sufficient financial capital. Credit ratings provide information relating to the Company's financing costs, liquidity and operations and affect the Company's ability to obtain short-term and long-term financing and/or the cost of such financing. Maintaining a strong balance sheet also allows the Company to enter into contracts with a variety of counterparties on terms and prices that are favourable to the Company’s financial results and provide TransAlta with better access to capital markets through commodity and credit cycles.
In 2021, Moody’s reaffirmed its Corporate Family Rating of Ba1 and maintained its rating outlook at stable. During 2021, DBRS Limited confirmed the Company’s Issuer Rating and Unsecured Debt/Medium-Term Notes rating of BBB (low), and the Company's Preferred Shares rating of Pfd-3 (low), all with stable trends. During 2021, S&P Global Ratings reaffirmed the Company’s Issuer Credit Rating and Senior Unsecured Debt rating of BB+ with a stable outlook. Risks associated with our credit ratings are discussed in the Governance and Risk Management section of this MD&A.
Capital Structure
A strong financial position provides the Company with better access to capital markets through commodity and credit cycles. We use total capital to help evaluate the strength of our financial position.
TRANSALTA CORPORATION M33
Management’s Discussion and Analysis
Our capital structure consists of the following components as shown below:
| | | | | | | | | | | | | | | | | | | | |
| As at Dec. 31 | 2021 | 2020 | 2019 |
| $ | % | $ | % | $ | % |
| TransAlta Corporation | | | | | | |
| Net senior unsecured debt | | | | | | |
Recourse debt — CAD debentures | 251 | | 4 | | 249 | | 3 | | 647 | | 9 | |
Recourse debt —US senior notes | 888 | | 16 | | 886 | | 13 | | 905 | | 13 | |
| | | | | | |
| Credit facilities | — | | — | | 114 | | 2 | | — | | — | |
| Other | 4 | | — | | 7 | | — | | 9 | | — | |
| Less: cash and cash equivalents | (703) | | (12) | | (121) | | (2) | | (348) | | (5) | |
| | | | | | |
Less: other cash and liquid assets(1) | (19) | | — | | (13) | | — | | (17) | | — | |
| Net senior unsecured debt | 421 | | 8 | | 1,122 | | 16 | | 1,196 | | 17 | |
| | | | | | |
| Other debt liabilities | | | | | | |
| Exchangeable debentures | 335 | | 6 | | 330 | | 5 | | 326 | | 5 | |
| Non-recourse debt | | | | | | |
TAPC Holdings LP bond | 102 | | 2 | | 111 | | 2 | | 119 | | 2 | |
| TransAlta OCP bond | 263 | | 5 | | 284 | | 4 | | 305 | | 4 | |
| Other | — | | — | | — | | — | | 2 | | — | |
| Lease liabilities | 78 | | 1 | | 112 | | 2 | | 119 | | 2 | |
Total net debt — TransAlta Corporation | 1,199 | | 22 | | 1,959 | | 29 | | 2,067 | | 30 | |
| | | | | | |
| TransAlta Renewables | | | | | | |
| Net TransAlta Renewables reported debt | | | | | | |
| Credit facility | — | | — | | — | | — | | 220 | | 3 | |
| Non-recourse debt | | | | | | |
| Pingston bond | 45 | | 1 | | 45 | | 1 | | 45 | | 1 | |
| Melancthon Wolfe Wind bond | 235 | | 4 | | 268 | | 4 | | 298 | | 4 | |
| New Richmond Wind bond | 120 | | 2 | | 127 | | 2 | | 134 | | 2 | |
| Kent Hills Wind bond | 221 | | 4 | | 230 | | 3 | | 241 | | 3 | |
| Windrise Wind bond | 171 | | 3 | | — | | — | | — | | — | |
| Lease liabilities | 22 | | — | | 22 | | — | | 23 | | — | |
| Less: cash and cash equivalents | (244) | | (4) | | (582) | | (9) | | (63) | | (1) | |
| | | | | | |
| Debt on TransAlta Renewables Economic Investments | | | | | | |
US tax equity financing(2) | 135 | | 2 | | 134 | | 2 | | 145 | | 2 | |
South Hedland non-recourse debt(3) | 732 | | 13 | | 772 | | 11 | | — | | — | |
Total net debt — TransAlta Renewables | 1,437 | | 25 | | 1,016 | | 14 | | 1,043 | | 14 | |
Total consolidated net debt(4)(5) | 2,636 | | 47 | | 2,975 | | 43 | | 3,110 | | 44 | |
| Non-controlling interests | 1,011 | | 18 | | 1,084 | | 16 | | 1,101 | | 15 | |
Exchangeable preferred securities(5) | 400 | | 7 | | 400 | | 6 | | — | | — | |
| Equity attributable to shareholders | | | | | | |
| Common shares | 2,901 | | 51 | | 2,896 | | 43 | | 2,978 | | 42 | |
| Preferred shares | 942 | | 17 | | 942 | | 14 | | 942 | | 13 | |
Contributed surplus, deficit and accumulated other comprehensive
income | (2,261) | | (40) | | (1,486) | | (22) | | (959) | | (14) | |
| Total capital | 5,629 | | 100 | | 6,811 | | 100 | | 7,172 | | 100 | |
(1) Includes principal portion of TransAlta OCP restricted cash and fair value asset of hedging instruments on debt.
(2) TransAlta Renewables has an economic interest in the entities holding these debts.
(3) TransAlta Renewables has an economic interest in the Australia entities holding these debts.
(4) The tax equity financing for Skookumchuck, an equity accounted joint venture, is not represented in these amounts.
(5) In 2021, total consolidated net debt excludes the exchangeable preferred securities as they are considered equity with dividend payments for credit purposes. In 2020, 50 per cent of the exchangeable preferred securities were classified as debt and included in total consolidated net debt. 2020 has been revised to be consistent with the change in 2021. For accounting purposes, they are accounted for as debt with interest expense in the consolidated financial statements.
TRANSALTA CORPORATION M34
Management’s Discussion and Analysis
Total capital consists of long-term debt, exchangeable securities and equity, less:
▪Available cash and cash equivalents, as capital is managed internally and evaluated by management using a net debt position. In this regard, these funds may be available and used to facilitate repayment of debt;
▪The principal portion of restricted cash on TransAlta OCP bonds because this cash is restricted specifically to repay outstanding debt; and
▪The fair value of economic and designated hedging instruments on debt in an asset or liability, as the carrying value of the related debt is impacted by changes in foreign exchange rates.
We continued strengthening our financial position during 2021 and have sufficient liquidity to fund our growth strategy.
We have enhanced shareholder value through the following:
2021
▪Obtained $173 million in project financing related to our Windrise wind facility.
2020
▪Obtained AU$800 million in project financing related to our South Hedland facility;
▪On Oct. 30, 2020, we received the second tranche of $400 million from Brookfield in consideration for redeemable, retractable first preferred shares;
▪Redeemed our outstanding 5 per cent $400 million medium-term notes due on Nov. 25, 2020; and
▪Purchased and cancelled 7,352,600 common shares at an average price of $8.33 per share through our NCIB program, for a total cost of $61 million.
2019
▪Obtained US$126 million in tax equity financing to fund the Big Level and Antrim wind facilities;
▪Entered into a strategic investment with Brookfield whereby Brookfield agreed to invest $750 million in the Company. On May 1, 2019, we received the initial tranche of $350 million in exchange for seven per cent unsecured subordinated debentures due May 1, 2039, which are exchangeable by Brookfield into an equity ownership interest in our Alberta Hydro Assets in the future; and
▪Purchased and cancelled 7,716,300 common shares at an average price of $8.80 per share through our NCIB program, for a total cost of $68 million.
Between 2022 and 2024, we have $1,104 million of debt maturing, including $515 million of recourse debt, with the balance mainly related to scheduled non-recourse debt repayments. We currently expect to refinance the senior notes maturing in 2022.
Credit Facilities
The Company's credit facilities are summarized in the table below:
| | | | | | | | | | | | | | | | | |
| As at Dec. 31, 2021 | Facility
size | Utilized | Available
capacity | Maturity
date |
Outstanding letters of credit(1) | Actual drawings |
| TransAlta Corporation | | | | | |
Committed syndicated bank facility(2) | 1,250 | 618 | — | 632 | Q2 2025 |
| Canadian committed bilateral credit facilities | 240 | 186 | — | 54 | Q2 2023 |
| | | | | |
| TransAlta Renewables | | | | | |
Committed credit facility(2) | 700 | 98 | — | 602 | Q2 2025 |
| Total | 2,190 | 902 | — | 1,288 | |
(1) TransAlta has obligations to issue letters of credit and cash collateral to secure potential liabilities to certain parties, including those related to potential environmental obligations, commodity risk management and hedging activities, pension plan obligations, construction projects and purchase obligations. At Dec. 31, 2021, we provided cash collateral of $55 million.
(2) TransAlta has letters of credit of $157 million and TransAlta Renewables has letters of credit of $98 million issued from uncommitted demand facilities; these obligations are backstopped and reduce the available capacity on the committed credit facilities.
TRANSALTA CORPORATION M35
Management’s Discussion and Analysis
The US dollar relative to the Canadian dollar weakened from Dec. 31, 2020 to Dec. 31, 2021, with no impact on our long-term debt balances as at Dec. 31, 2021. The weakening of the US dollar decreased our long-term debt balances as at Dec. 31, 2020 by $24 million. Almost all our US-denominated debt is hedged either through financial contracts or net investments in our US operations.
US Tax Equity Financing
The Company owns equity interests in some facilities that are eligible for tax incentives available for renewable energy facilities in the United States. With its current portfolio of renewable energy facilities, TransAlta cannot fully monetize such tax incentives. To take full advantage of these incentives, the Company partners with Tax Equity Investors (“TEI”) who invest in these facilities in exchange for a share of the tax credits.
Some TEI financing structures include a partial pay as you go ("Pay-go") funding arrangement under which, when the actual annual MWh production exceeds a certain production threshold, the TEI are obligated to make a cash contribution (“Pay-go Contribution”) to the Company. The Pay-go arrangement results in a lower initial investment by the TEI and provides them with some protection from potential underperformance of the asset.
TransAlta recognizes the TEI contributions as long-term debt, at an amount representing the proceeds received from the TEI in exchange for shares of a subsidiary of TransAlta, net of the following elements:
▪Production tax credits ("PTC")— Allocation of PTCs to the TEI derived from the power generated during the period is recognized in other revenues as earned and as a reduction in tax equity financing;
▪Tax shield — Allocation of tax benefits and attributes to the TEI, such as investment tax credits and tax depreciation, is recognized in net interest expense as claimed and as a reduction in tax equity financing;
▪Interest expense — Interest expense using the effective interest rate method is recognized in net interest expense as incurred and as an increase in tax equity financing;
▪Pay-go contributions — Additional cash contributions made by the TEI when the annual production exceeds the contractually determined threshold and is recognized as an increase in tax equity financing; and
▪Cash distributions — Cash payments to the TEI, recognized as a reduction in tax equity financing.
Production Tax Credit Program
Current United States tax law allows qualified wind energy projects to receive tax credits that are earned for each MWh of generation during the first 10 years of the projects' operation. The TEIs are allocated a portion of the renewable energy facility's taxable income (losses) and PTCs produced and a portion of the cash generated by the facility until they achieve an agreed-upon after-tax investment return (“Flip Point”). After the Flip Point, the TEI will retain a lesser portion of the cash and the taxable income (losses) generated by the facility.
| | | | | | | | | | | | | | | | | | | | | | | |
| Facility | Commercial operation date | Expected Flip Point | Initial TEI investment ($) | Expected annual PTC generation ($) | Expected annual Pay-go Contribution ($) | TEI allocation of taxable income and PTCs
(pre-Flip Point) | TEI allocation of cash distributions
(pre-Flip Point) ($) |
| Lakeswind | 2014 | 2029 | 45 | | 4 | | — | | 99 | % | 22 | |
| Big Level and Antrim | 2019 | 2030 | 126 | | 9 | | — | | 99 | % | 58 | |
Skookumchuck(1) | 2020 | 2029 - 2030 | 121 | | 10 | | — | | 99 | % | 29 | |
(1) The Company has a 49 per cent interest in the Skookumchuck wind facility, which is treated as an equity investment under IFRS and our proportionate share of the net earnings is reflected as equity income on the statement of earnings under IFRS.
TRANSALTA CORPORATION M36
Management’s Discussion and Analysis
Non-Recourse Debt
The Melancthon Wolfe Wind LP, Pingston, TAPC Holdings LP, New Richmond Wind LP, Kent Hills Wind LP, TEC Hedland Pty Ltd notes, Windrise Wind LP and TransAlta OCP LP non-recourse bonds with a carrying value of $1.9 billion (Dec. 31, 2020 — $1.8 billion) are subject to customary financing conditions and covenants that may restrict the Company’s ability to access funds generated by the facilities’ operations. Upon meeting certain distribution tests, typically performed once per quarter, the funds are able to be distributed by the subsidiary entities to their respective parent entity. These conditions include meeting a debt service coverage ratio prior to distribution, which was met by these entities in the fourth quarter of 2021, except the Kent Hills non-recourse bond as discussed below. However, funds in these entities that have accumulated since the fourth quarter test will remain there until the next debt service coverage ratio can be calculated in the first quarter of 2022. At Dec. 31, 2021, $67 million (Dec. 31, 2020 — $73 million) of cash was subject to these financial restrictions. Additionally, certain non-recourse bonds require that certain reserve accounts be established and funded through cash held on deposit and/or by providing letters of credit.
In connection with the foundation issues at Kent Hills 1 and 2 wind facilities, Kent Hills Wind LP has provided notice to the Trustee, BNY Trust Company of Canada, for the approximately $221 million outstanding non-recourse KH Bonds secured by, among other things, the Kent Hills 1, 2 and 3 wind facilities, that events of default may have occurred under the trust indenture governing the terms of such bonds. The Company is in discussions with the Trustee and holders of the KH Bonds to negotiate waivers and amendments. Refer to the Significant and Subsequent Events section of this MD&A for further details on the Kent Hills 1 and 2 wind facilities outage.
Returns to Providers of Capital
Net Interest Expense
The components of net interest expense are shown below: | | | | | | | | | | | |
| Year ended Dec. 31 | 2021 | 2020 | 2019 |
| Interest on debt | 163 | | 158 | | 161 | |
| Interest on exchangeable debentures | 29 | | 29 | | 20 | |
| Interest on exchangeable preferred shares | 28 | | 5 | | — | |
| Interest income | (11) | | (10) | | (13) | |
| Capitalized interest | (14) | | (8) | | (6) | |
| | | |
| Interest on lease liabilities | 7 | | 8 | | 4 | |
| Credit facility fees, bank charges and other interest | 18 | | 18 | | 15 | |
Tax shield on tax equity financing(1) | (9) | | 1 | | (35) | |
| Interest on the line loss proceeding | — | | 5 | | — | |
Other(2) | 2 | | 2 | | 10 | |
| Accretion of provisions | 32 | | 30 | | 23 | |
| Net interest expense | 245 | | 238 | | 179 | |
(1) Credit in 2021 primarily relates to the tax benefit associated with investment tax credits claimed in 2021 on the North Carolina Solar facility that was assigned to the tax equity investor. Credit in 2019 primarily relates to the tax benefit associated with bonus tax depreciation claimed in 2019 on the Big Level and Antrim wind facilities that was assigned to the tax equity investor. The tax equity investment is treated as debt under IFRS and the monetization of the tax depreciation and investment tax credits (as applicable) is considered a non-cash reduction of the debt balance and is reflected as a reduction in interest expense.
(2) In 2021, other interest expense included approximately nil (2020 — nil; 2019 — $5 million) for the significant financing component required under IFRS 15.
Net interest expense was higher in 2021 primarily due to the full year of interest incurred on the exchangeable preferred shares issued in the fourth quarter of 2020, project financing related to the South Hedland non-recourse debt obtained in the fourth quarter of 2020 and additional project financing related to the Windrise wind facility obtained in the fourth quarter of 2021, partially offset by an increase in capitalized interest on the construction of development projects, the redemption of the $400 million medium-term notes in the fourth quarter of 2020 and lower interest on other debt balances due to scheduled repayments and investment tax credits related to the North Carolina Solar facility tax equity.
Net interest expense was higher in 2020 primarily due to interest on the additional $400 million exchangeable preferred shares issued as part of the Brookfield Investment Agreement and the AU$800 million TEC Offering, both issued in October 2020. In addition, interest was higher due to interest charges received in 2020 for the AESO transmission line loss proceedings, and the 2019 impact of the $35 million tax credit received relating to the tax shield on Big Level and Antrim wind facilities offset by the termination of the Keephills 3 contract liability in 2019, resulting in the deferred financing costs being recognized.
TRANSALTA CORPORATION M37
Management’s Discussion and Analysis
Share Capital
On March 18, 2021, the Company announced that 1,417,338 of its 10.2 million Series A Cumulative Fixed Redeemable Rate Reset Preferred Shares ("Series A Shares") and 871,871 of its 1.8 million Series B Cumulative Redeemable Floating Rate Preferred Shares ("Series B Shares") were tendered for conversion, on a one-for-one basis, into Series B Shares and Series A Shares, respectively, after having taken into account all election notices. As a result of the conversion, the Company had 9.6 million Series A Shares and 2.4 million Series B Shares issued and outstanding at March 31, 2021.
The following tables outline the common and preferred shares issued and outstanding: | | | | | | | | | | | |
| As at | Feb. 23, 2022 | Dec. 31, 2021 | Dec. 31, 2020 |
| | Number of shares (millions) |
| Common shares issued and outstanding, end of period | 271.2 | 271.0 | | 269.8 | |
| Preferred shares | | | |
| Series A | 9.6 | | 9.6 | | 10.2 | |
| Series B | 2.4 | | 2.4 | | 1.8 | |
| Series C | 11.0 | | 11.0 | | 11.0 | |
| Series E | 9.0 | | 9.0 | | 9.0 | |
| Series G | 6.6 | | 6.6 | | 6.6 | |
| | | |
| Preferred shares issued and outstanding in equity, end of period | 38.6 | | 38.6 | | 38.6 | |
Series I - Exchangeable Securities(1) | 0.4 | | 0.4 | | 0.4 | |
| Preferred shares issued and outstanding, end of period | 39.0 | | 39.0 | | 39.0 | |
| | | |
| | | |
(1) Brookfield invested $400 million in consideration for redeemable, retractable, first preferred shares. For accounting purposes, these preferred share are considered debt and disclosed as such in the consolidated financial statements.
Dividends to Shareholders
The declaration of dividends is at the discretion of the Board. The following are the common and preferred shares dividends declared each quarter during 2021:
| | | | | | | | | | | | | | | | | | | | | | | | | | |
| | | | Common | Preferred Series dividends per share |
| | Payable date | dividends | | | | | |
| Declaration date | Common shares | Preferred shares | per share | A | B | C | E | G |
| May 3, 2021 | Jul 1, 2021 | Jun 30, 2021 | 0.0450 | | 0.17981 | | 0.13108 | | 0.25169 | | 0.32463 | | 0.31175 | |
| Aug 5, 2021 | Oct.1, 2021 | Sept. 30, 2021 | 0.0450 | | 0.17981 | | 0.13479 | | 0.25169 | | 0.32463 | | 0.31175 | |
| Nov 1, 2021 | Jan 1, 2022 | Dec. 31. 2021 | 0.0500 | | 0.17981 | | 0.13970 | | 0.25169 | | 0.32463 | | 0.31175 | |
| Dec 31, 2021 | Apr 1, 2022 | Mar 31, 2022 | 0.0500 | | 0.17981 | 0.13309 | 0.25169 | 0.32463 | 0.31175 |
Non-Controlling Interests
As of Dec. 31, 2021, the Company owns 60.1 per cent (2020 — 60.1 per cent) of TransAlta Renewables.
In 2020, our ownership per cent (60.1 per cent) decreased from our ownership in 2019 (60.4 per cent) due to TransAlta Renewables issuing approximately one million common shares under their Dividend Reinvestment Plan ("DRIP"). We did not participate in this plan. In the fourth quarter of 2020, TransAlta Renewables suspended the DRIP in respect of any future declared dividends. The dividend paid on Oct. 30, 2020, to shareholders of record on Oct. 15, 2020, was the last dividend payment eligible for reinvestment by participating shareholders. Subsequent dividends will be paid only in cash.
TransAlta Renewables is a publicly traded company whose common shares are listed on the TSX under the symbol “RNW.” TransAlta Renewables holds a diversified, highly contracted portfolio of assets with comparatively lower carbon intensity.
We also own 50.01 per cent of TA Cogen, which owns, operates or has an interest in three natural-gas-fired facilities (Ottawa, Windsor and Fort Saskatchewan) and one dual-fuel generating facility (Sheerness) for 2021 which will operate as a natural-gas-fired facility in 2022. Since we own a controlling interest in TA Cogen and TransAlta Renewables, we consolidate the entire earnings, assets and liabilities in relation to those assets.
TRANSALTA CORPORATION M38
Management’s Discussion and Analysis
Reported earnings attributable to non-controlling interests for the year ended Dec. 31, 2021, increased by $78 million to $112 million compared to 2020. Earnings increased at TransAlta Renewables in 2021 mainly due to higher finance income from investments in subsidiaries of TransAlta and no fair value losses recognized in the current year, partially offset by liquidating damages provisions related to unplanned outages at Sarnia cogeneration facility, unfavourable steam reconciliation adjustment to Canadian Gas, lower wind production from the Canadian wind fleet, lower foreign exchange gains and higher asset impairments. Earnings from TA Cogen were higher in 2021 mainly due to higher prices in the Alberta market. Refer to Note 13 of the consolidated financial statements for further details.
Reported earnings attributable to non-controlling interests for the year ended Dec. 31, 2020, decreased by $60 million to $34 million compared to 2019. Earnings were down at TransAlta Renewables in 2020 mainly due to lower finance income and change in the fair value of financial assets and an increase in income tax expense, offset by higher operating income and an increase in foreign exchange gains resulting from the strengthening of the Australian dollar relative to the Canadian dollar. Earnings from TA Cogen were lower in 2020 mainly due to lower operating income as a result of the planned outage for the dual-fuel conversion at Sheerness Unit 2, low Alberta market demand and the onerous contract provision for the coal supply agreement.
Other Consolidated Analysis
Unconsolidated Structured Entities or Arrangements
Disclosure is required of all unconsolidated structured entities or arrangements such as transactions, agreements or contractual arrangements with unconsolidated entities, structured finance entities, special purpose entities or variable interest entities that are reasonably likely to materially affect liquidity or the availability of, or requirements for, capital resources. We currently have no such unconsolidated structured entities or arrangements.
Guarantee Contracts
We have obligations to issue letters of credit and cash collateral to secure potential liabilities to certain parties, including those related to potential environmental obligations, commodity risk management and hedging activities, pension plan obligations, construction projects and purchase obligations. At Dec. 31, 2021, we provided letters of credit totalling $902 million (2020 — $621 million) and cash collateral of $55 million (2020 — $49 million). These letters of credit and cash collateral secure certain amounts included on our Consolidated Statements of Financial Position under risk management liabilities, defined benefit obligation and other long-term liabilities, and decommissioning and other provisions. The increase in the amount of letters of credit issued during 2021 relates to the increased energy marketing activity, including the full requirements business, as well as pension plan commitments and the Highvale mine pension plan and reclamation obligations.
Commitments
Contractual commitments are as follows:
| | | | | | | | | | | | | | | | | | | | | | | |
| | 2022 | 2023 | 2024 | 2025 | 2026 | 2027 and thereafter | Total |
| Natural gas, transportation and other contracts | 47 | | 54 | | 45 | | 44 | | 45 | | 508 | | 743 | |
| Transmission | 9 | | 9 | | 6 | | 6 | | 2 | | — | | 32 | |
| Coal supply and mining agreements | 76 | | 98 | | 90 | | 75 | | — | | — | | 339 | |
| Long-term service agreements | 89 | | 46 | | 43 | | 32 | | 25 | | 54 | | 289 | |
Operating leases(1) | 4 | | 3 | | 3 | | 1 | | 1 | | 31 | | 43 | |
Long-term debt(2) | 836 | | 155 | | 113 | | 127 | | 127 | | 1,840 | | 3,198 | |
Exchangeable securities(3) | — | | — | | — | | 750 | | — | | — | | 750 | |
Principal payments on lease liabilities(4) | (6) | | 4 | | 3 | | 3 | | 3 | | 93 | | 100 | |
Interest on long-term debt and lease liabilities(5,6) | 149 | | 120 | | 115 | | 109 | | 104 | | 787 | | 1,384 | |
Interest on exchangeable securities(3,6) | 53 | | 53 | | 62 | | — | | — | | — | | 168 | |
Growth(7) | 941 | | 276 | | — | | — | | — | | — | | 1,217 | |
| TransAlta Energy Transition Bill | 6 | | 6 | | — | | — | | — | | — | | 12 | |
| Total | 2,204 | | 824 | | 480 | | 1,147 | | 307 | | 3,313 | | 8,275 | |
(1) Includes leases that have not yet commenced.
(2) Excludes impact of hedge accounting and derivatives.
(3) Assumes the exchangeable securities will be exchanged by Brookfield on Jan. 1, 2025. Please refer to the Significant and Subsequent Events section of this MD&A for further details.
(4) Lease liabilities include a lease incentive of $13 million, expected to be received in 2022.
(5) Interest on long-term debt is based on debt currently in place with no assumption as to refinancing on maturity.
(6) Not recognized as a financial liability on the Consolidated Statements of Financial Position.
(7) For further details on growth commitments, refer to the Accelerated Clean Electricity Growth Plan section of this MD&A.
TRANSALTA CORPORATION M39
Management’s Discussion and Analysis
Contingencies
Transmission Line Loss Rule Proceeding
The Company has been participating in a line loss rule proceeding before the AUC. The AUC determined that it has the ability to retroactively adjust line loss charges going back to 2006 and directed the AESO to recalculate loss factors for 2006 to 2016. The AUC approved an invoice settlement process and all three planned settlements have been received. The first two invoices were settled by the first quarter of 2021 and the third invoice settled in the second quarter of 2021. The true-up invoices issued by the AESO in the fourth quarter of 2021 were settled by Dec. 31, 2021, with no further invoices expected.
FMG Dispute at South Hedland Power Station
On May 2, 2021, the Company entered into a conditional settlement with FMG. The settlement was concluded and the actions were formally dismissed in the Supreme Court of Western Australia on Dec. 7, 2021. The settlement amount has been recorded as revenue in the fourth quarter of 2021, while all other balances previously provided for have been reversed. The settlement has resulted in FMG continuing as a customer of the South Hedland facility.
Mangrove Claim
On April 23, 2019, Mangrove commenced an action in the Ontario Superior Court of Justice naming the Company, the incumbent members of the Board of the Company on such date, and Brookfield as defendants. Mangrove was seeking to set aside the 2019 Brookfield transaction. The parties reached a confidential settlement and the action was discontinued in the Ontario Superior Court of Justice on April 30, 2021.
Keephills 1 Stator Force Majeure Appeal
The Balancing Pool and ENMAX are seeking to set aside an arbitration award on the basis that they did not receive a fair hearing. The Alberta Court of Queen’s Bench ("ABQB") dismissed the Balancing Pool and ENMAX’s allegations of unfairness on June 26, 2019. The Balancing Pool and ENMAX, however, sought leave to appeal the ABQB’s decision at the Court of Appeal, which was granted on Feb. 13, 2020. The appeal was heard on July 8, 2021. After the hearing, counsel for ENMAX raised concerns that one of the three justices on the appeal panel was distracted during the hearing. The justice has since recused herself from the hearing and the parties made submissions with respect to whether the remaining two justices can continue to issue the decision or whether a new hearing is required. On Nov. 8, 2021, the Alberta Court of Appeal released its decision and ordered that the appeal be re-heard by a new three-person panel of the Court of Appeal, which was heard on Jan. 27, 2022. TransAlta remains of the view that the Court of Appeal will affirm the ABQB decision that the arbitration proceeding was fair.
Keephills 1 Superheater Force Majeure
Keephills Unit 1 was taken offline from March 17, 2015 to May 17, 2015, as a result of a large leak in the secondary superheater. TransAlta claimed force majeure under the Alberta PPA. ENMAX, the purchaser under the Alberta PPA at the time, did not dispute the force majeure but the Balancing Pool attempted to do so, seeking to recover $12 million in capacity payment charges it paid to TransAlta while the unit was offline. The parties reached a confidential settlement on April 21, 2021, and this matter is now resolved.
Sundance A Decommissioning
TransAlta filed an application with the AUC seeking payment from the Balancing Pool for TransAlta’s decommissioning costs for Sundance A, including its proportionate share of the Highvale mine. The Balancing Pool and Utilities Consumer Advocate are participating as interveners because they take issue with the decommissioning costs claimed by TransAlta. Due to various factors, including the COVID-19 pandemic and significant information requests from the Balancing Pool, the application has been delayed. While a hearing date has not been set, the application will likely be heard in late 2022 or early 2023. TransAlta expects to receive payment from the Balancing Pool for its decommissioning costs; however, the amount that the AUC will award is uncertain.
Hydro Power Purchase Arrangement ("Hydro PPA") Emission Performance Credits
The Balancing Pool claims to be entitled to emission performance credits ("EPCs") earned by the Hydro facilities as a result of opting those facilities into the Carbon Competitiveness Incentive Regulation from 2018-2020 inclusive. The Balancing Pool claims ownership of the EPCs because it believes the change-in-law provisions under the Hydro PPA require the EPCs to be passed through to the Balancing Pool. TransAlta has not received any benefit from the EPCs or from any purported change in law and believes that the Balancing Pool has no rights to these credits. An arbitration has commenced, and the hearing is scheduled for Feb. 6-10, 2023.
TRANSALTA CORPORATION M40
Management’s Discussion and Analysis
Direct Assigned Capital Deferral Account ("DACDA") Application
AltaLink Management Ltd. ("AltaLink") and TransAlta (as a secondary applicant) filed an application before the AUC to recover its 2016-2018 DACDA costs incurred for the 240 kV line upgrades for the Edmonton Region Project. The AUC disallowed 15 per cent (approximately $3 million) of TransAlta’s portion. TransAlta disputed this finding and filed a permission to appeal application with the Court of Appeal and a review and variance application with the AUC (the “R&V”). The AUC dismissed the R&V application on April 22, 2021. The permission to appeal was subsequently discontinued on July 5, 2021, which concludes this matter.
Sarnia Outages
The Sarnia cogeneration facility experienced three separate outages between May 19, 2021 and June 9, 2021 that resulted in steam interruptions to its industrial customers. As a result, the customers have submitted claims for liquidated damages. Steam supply disruptions of this nature are atypical and infrequent at the Sarnia cogeneration facility. The Company conducted an investigation to determine the root cause of each of the three events, which concluded that all three events do not qualify as events of force majeure. As such, liquidated damages in an amount dictated by the applicable agreements are payable by TransAlta to the customers for the three outages and have been accrued within contract liabilities.
Kaybob 3 Cogeneration Dispute
The Company is engaged in a dispute with Energy Transfer Canada ULC, formerly SemCAMS Midstream ULC (“ET Canada”) as a result of ET Canada’s purported termination of agreements between the parties to develop, construct and operate a 40 MW cogeneration facility at the Kaybob South No. 3 sour gas processing facility. TransAlta commenced an arbitration seeking full compensation for ET Canada's wrongful termination of the agreements. ET Canada seeks a declaration that the agreements were lawfully terminated. A hearing is scheduled for two weeks starting Jan. 9, 2023.
Cash Flows
The following chart highlights significant changes in the consolidated statements of cash flows for the years ended Dec. 31, 2021, Dec. 31, 2020 and Dec. 31, 2019:
| | | | | | | | | | | |
| Year ended Dec. 31 | 2021 | 2020 | Increase/ (decrease) |
| Cash and cash equivalents, beginning of year | 703 | | 411 | | 292 | |
| Provided by (used in): | | | |
| Operating activities | 1,001 | | 702 | | 299 | |
| Investing activities | (472) | | (687) | | 215 | |
| Financing activities | (282) | | 272 | | (554) | |
| Translation of foreign currency cash | (3) | | 5 | | (8) | |
| Cash and cash equivalents, end of year | 947 | | 703 | | 244 | |
| | | |
| | | |
| | | |
| | | |
| | | |
| | | |
| | | |
| | | |
| | | |
Cash provided by operating activities for the year ended Dec. 31, 2021, increased compared with 2020 primarily due to to higher revenues being realized in Alberta on the merchant assets, partially offset by higher fuel and purchased power and OM&A costs as the Company transitions off coal.
Cash used in investing activities for the year ended Dec. 31, 2021, decreased compared with 2020, largely due to:
▪No acquisitions of investments in 2021 compared to Skookumchuck and EMG International LLC ("EMG") in 2020 ($102 million);
▪Proceeds on the sale of Pioneer Pipeline ($128 million) and the sale of equipment within the Energy Transition segment ($39 million); and
▪Higher cash spent on the North Carolina Solar facility acquisition ($120 million) in 2021 compared to the Ada acquisition of ($32 million) in 2020.
Cash used in financing activities for the year ended Dec. 31, 2021, increased compared with 2020, largely due to:
▪Lower debt issuances in 2021. Issuance of the Windrise Wind LP bond of $173 million in 2021 compared to $753 million in long-term debt from the TEC Offering and $400 million in exchangeable securities in 2020;
▪Increased distributions paid to subsidiaries' non-controlling interests ($59 million);
▪Partially offset by lower repayments on long term debt ($397 million); and
▪Lower common share repurchases under the NCIB ($53 million).
TRANSALTA CORPORATION M41
Management’s Discussion and Analysis
Financial Instruments
Financial instruments are used for proprietary trading purposes and to manage our exposure to interest rates, commodity prices and currency fluctuations, as well as other market risks. We may currently use physical and financial swaps, forward sale and purchase contracts, futures contracts, foreign exchange contracts, interest rate swaps and options to achieve our risk management objectives. Some of our physical commodity contracts have been entered into and are held for the purposes of meeting our expected purchase, sale or usage requirements (“own use”) and as such, are not considered financial instruments and are not recognized as a financial asset or financial liability. Other physical commodity contracts that are not held for normal purchase or sale requirements and derivative financial instruments are recognized on the Consolidated Statements of Financial Position and are accounted for using the fair value method of accounting. The initial recognition of fair value and subsequent changes in fair value can affect reported earnings in the period the change occurs if hedge accounting is not elected. Otherwise, changes in fair value will generally not affect earnings until the financial instrument is settled.
Some of our financial instruments and physical commodity contracts qualify for, and are recorded under, hedge accounting rules. The accounting for those contracts for which we have elected to apply hedge accounting depends on the type of hedge. Our financial instruments are mainly used for cash flow hedges or non-hedges. These categories and their associated accounting treatments are explained in further detail below.
For all types of hedges, we test for effectiveness at the end of each reporting period to determine if the instruments are performing as intended and hedge accounting can still be applied. The financial instruments we enter into are designed to ensure that future cash inflows and outflows are predictable. In a hedging relationship, the effective portion of the change in the fair value of the hedging derivative does not impact net earnings, while any ineffective portion is recognized in net earnings.
We have certain contracts in our portfolio that, at their inception, do not qualify for, or we have chosen not to elect to apply, hedge accounting. For these contracts, we recognize in net earnings mark-to-market gains and losses resulting from changes in forward prices compared to the price at which these contracts were transacted. These changes in price alter the timing of earnings recognition, but do not necessarily determine the final settlement amount received. The fair value of future contracts will continue to fluctuate as market prices change. The fair value of derivatives that are not traded on an active exchange, or extend beyond the time period for which exchange-based quotes are available, are determined using valuation techniques or models.
Cash Flow Hedges
Cash flow hedges are categorized as project, foreign exchange, interest rate or commodity hedges and are used to offset foreign exchange, interest rate and commodity price exposures resulting from market fluctuations.
Foreign currency forward contracts may be used to hedge foreign exchange exposures resulting from anticipated contracts and firm commitments denominated in foreign currencies, primarily related to capital expenditures, and currency exposures related to US-denominated debt.
Physical and financial swaps, forward sale and purchase contracts, futures contracts and options may be used primarily to offset the variability in future cash flows caused by fluctuations in electricity and natural gas prices. Foreign exchange forward contracts and cross-currency swaps may be used to offset the exposures resulting from foreign-denominated long-term debt. Interest rate swaps may be used to convert the fixed interest cash flows related to interest expense at debt to floating rates and vice versa.
In a cash flow hedge, changes in the fair value of the hedging instrument (a forward contract or financial swap, for example) are recognized in risk management assets or liabilities, and the related gains or losses are recognized in other comprehensive earnings ("OCI"). These gains or losses are subsequently reclassified from OCI to net earnings in the same period as the hedged forecast cash flows impact net earnings, and offset the losses or gains arising from the forecast transactions. For project hedges, the gains and losses reclassified from OCI are included in the carrying amount of the related PP&E.
Hedge accounting follows a principles-based approach for qualifying hedges that is aligned with an entity's approach to risk management. When we do not elect hedge accounting or when the hedge is no longer effective and does not qualify for hedge accounting, the gains or losses as a result of changes in prices, interest or exchange rates related to these financial instruments are recorded in net earnings in the period in which they arise.
TRANSALTA CORPORATION M42
Management’s Discussion and Analysis
Net Investment Hedges
Foreign-denominated long-term debt is used to hedge exposure to changes in the carrying values of our net investments in foreign operations that have a functional currency other than the Canadian dollar. Our net investment hedges using US-denominated debt remain effective and in place. Gains or losses on these instruments are recognized and deferred in OCI and reclassified to net earnings on the disposal of the foreign operation. We also manage foreign exchange risk by matching foreign-denominated expenses with revenues, such as offsetting revenues from our US operations with interest payments on our US-dollar debt.
Non-Hedges
Financial instruments not designated as hedges are used for proprietary trading and to reduce commodity price, foreign exchange and interest rate risks. Changes in the fair value of financial instruments not designated as hedges are recognized in risk management assets or liabilities, and the related gains or losses are recognized in net earnings in the period in which the change occurs.
Fair Values
The majority of fair values for our project, foreign exchange, interest rate, commodity hedges and non-hedge derivatives are calculated using adjusted quoted prices from an active market or inputs validated by broker quotes. We may enter into commodity transactions involving non-standard features for which market-observable data is not available. These transactions are defined under IFRS as Level III instruments. Level III instruments incorporate inputs that are not observable from the market and fair value is therefore determined using valuation techniques. Fair values are validated by using reasonably possible alternative assumptions as inputs to valuation techniques, and any material differences are disclosed in the notes to the consolidated financial statements. At Dec. 31, 2021, Level III instruments had a net asset carrying value of $159 million (2020 — $582 million). Please refer to the Critical Accounting Policies and Estimates section of this MD&A for further details regarding valuation techniques. Our risk management profile and practices have not changed materially from Dec. 31, 2020.
Additional IFRS Measures and Non-IFRS Measures
An additional IFRS measure is a line item, heading or subtotal that is relevant to an understanding of the consolidated financial statements but is not a minimum line item mandated under IFRS, or the presentation of a financial measure that is relevant to an understanding of the consolidated financial statements but is not presented elsewhere in the consolidated financial statements. We have included line items entitled gross margin and operating income (loss) in our Consolidated Statements of Earnings (Loss) for the years ended Dec. 31, 2021, 2020 and 2019. Presenting these line items provides management and investors with a measurement of ongoing operating performance that is readily comparable from period to period.
We use a number of financial measures to evaluate our performance and the performance of our business segments, including measures and ratios that are presented on a non-IFRS basis, as described below. Unless otherwise indicated, all amounts are in Canadian dollars and have been derived from our audited annual consolidated financial statements prepared in accordance with IFRS. We believe that these non-IFRS amounts, measures and ratios, read together with our IFRS amounts, provide readers with a better understanding of how management assesses results.
Non-IFRS amounts, measures and ratios do not have standardized meanings under IFRS. They are unlikely to be comparable to similar measures presented by other companies and should not be viewed in isolation from, or as an alternative for, or more meaningful than our IFRS results.
Non-IFRS Financial Measures
Adjusted EBITDA, FFO, FCF, total net debt, total consolidated net debt and adjusted net debt are non-IFRS measures that are presented in this MD&A. See the Segmented Financial Performance and Operating Results, Segmented Financial Performance and Operating Results for the Fourth Quarter, Selected Quarterly Information, Financial Capital and Key Non-IFRS Financial Ratios sections of this MD&A for additional information, including a reconciliation of such non-IFRS measures to the most comparable IFRS measure.
TRANSALTA CORPORATION M43
Management’s Discussion and Analysis
Adjusted EBITDA
In the fourth quarter of 2021, comparable EBITDA was relabelled as adjusted EBITDA to align with industry standard terminology. Each business segment assumes responsibility for its operating results measured to adjusted EBITDA. Adjusted EBITDA is an important metric for management that represents our core business profitability. Interest, taxes, depreciation and amortization are not included, as differences in accounting treatments may distort our core business results. In addition, certain reclassifications and adjustments are made to better assess results excluding those items that may not be reflective of ongoing business performance. This presentation may facilitate the readers analysis of trends. Adjusted EBITDA is a non-IFRS measure. The following are descriptions of the adjustments made.
Adjustments to revenue
▪Certain assets we own in Canada and in Australia are fully contracted and recorded as finance leases under IFRS. We believe it is more appropriate to reflect the payments we receive under the contracts as a capacity payment in our revenues instead of as finance lease income and a decrease in finance lease receivables.
▪Adjusted EBITDA is adjusted to exclude the impact of unrealized mark-to-market gains or losses and unrealized foreign exchange gains or losses on commodity transactions.
Adjustments to fuel and purchased power
▪We adjust for depreciation on our mining equipment included in fuel and purchased power.
▪We adjust for items resulting from the decision in 2020 to accelerate being off-coal and accelerating the shutdown of the Highvale mine by the end of 2021 as not reflective of ongoing business performance. Within fuel and purchased power this included coal inventory write-downs.
▪On the commissioning of the South Hedland facility in July 2017, we prepaid approximately $74 million of electricity transmission and distribution costs. Interest income is recorded on the prepaid funds. We reclassify this interest income as a reduction in the transmission and distribution costs expensed each period to reflect the net cost to the business.
Adjustments to operations, maintenance and administration
▪We adjust for write-down of parts and material inventory related to the Highvale mine and coal operations at our natural gas converted facilities.
▪We adjust for the curtailment gain related to the Highvale mine defined-benefit pension plan.
Adjustments to net other operating income (expense)
▪We adjust for the onerous contract provision for future royalty payments recognized with the shutdown of the Highvale mine.
▪We adjust for the Sheerness going off-coal which resulted in the remaining coal supply payments on the existing coal supply agreement being recognized as an onerous contract in the fourth quarter of 2020.
Adjustments to earnings in addition to interest, taxes, depreciation and amortization
▪Asset impairment charges (reversals) are removed as these are accounting adjustments that impact depreciation and amortization and do not reflect business performance.
▪Any gains or losses on asset sales or foreign exchange gains or losses are not included as these are not part of operating income.
Adjustments for equity accounted investments
▪During the fourth quarter of 2020, we acquired a 49 per cent interest in the Skookumchuck wind facility, which is treated as an equity investment under IFRS and our proportionate share of the net earnings is reflected as equity income on the statement of earnings under IFRS. As this investment is part of our regular power-generating operations, we have included our proportionate share of the adjusted EBITDA of Skookumchuck in our total adjusted EBITDA. In addition, in the Wind and Solar adjusted results, we have included our proportionate share of revenues and expenses to reflect the full operational results of this investment. We have not included EMG's adjusted EBITDA in our total adjusted EBITDA as it does not represent our regular power-generating operations.
TRANSALTA CORPORATION M44
Management’s Discussion and Analysis
Average Annual EBITDA
Average annual EBITDA is a non-IFRS financial measure that is forward-looking, used to show the average annual EBITDA that the project currently under construction is expected to generate upon completion.
Funds From Operations ("FFO")
FFO is an important metric as it provides a proxy for cash generated from operating activities before changes in working capital and provides the ability to evaluate cash flow trends in comparison with results from prior periods. FFO is a non-IFRS measure.
Adjustments to cash from operations
▪Includes FFO related to the Skookumchuk wind facility, which is treated as an equity accounted investment under IFRS and equity income, net of distributions from joint ventures is included in cash flow from operations under IFRS. As this investment is part of our regular power generating operations, we have included our proportionate share of FFO.
▪Payments received on finance lease receivables reclassified to reflect cash from operations.
▪We adjust for items included in cash from operations related to the decision in 2020 to accelerate being off-coal and accelerating the shutdown of the Highvale mine by the end of 2021, and the write-down on parts and material inventory for our coal operations ("Clean energy transition provisions and adjustments").
Free Cash Flow
FCF is an important metric as it represents the amount of cash that is available to invest in growth initiatives, make scheduled principal repayments on debt, repay maturing debt, pay common share dividends or repurchase common shares. Changes in working capital are excluded so FFO and FCF are not distorted by changes that we consider temporary in nature, reflecting, among other things, the impact of seasonal factors and timing of receipts and payments. FCF is a non-IFRS measure.
Non-IFRS Ratios
FFO per share, FCF per share, FFO before interest to adjusted interest coverage and adjusted net debt to adjusted EBITDA are non-IFRS ratios that are presented in the MD&A. See the Reconciliation of Cash Flow from Operations to FFO and FCF and Key Non-IFRS Financial Ratios sections of this MD&A for additional information.
FFO per Share and FCF per Share
FFO per share and FCF per share are calculated using the weighted average number of common shares outstanding during the period. FFO per share and FCF per share is a non-IFRS ratio.
Supplementary Financial Measures
Financial highlights presented on a proportional basis of TransAlta Renewables, deconsolidated adjusted EBITDA, deconsolidated FFO and deconsolidated adjusted EBITDA to deconsolidated FFO are supplementary financial measures the Company uses to present adjusted EBITDA on a deconsolidated basis. See the Financial Highlights on a Proportional Basis of TransAlta Renewables and Key Non-IFRS Financial Ratios sections of this MD&A for additional information.
The Alberta Electricity Portfolio metrics disclosed are also supplementary financial measures used to present the gross margin by segment for the Alberta market. See the Alberta Electricity Portfolio section of this MD&A for additional information.
TRANSALTA CORPORATION M45
Management’s Discussion and Analysis
Reconciliation of Non-IFRS Measures on a Consolidated Basis by Segment
The following table reflects adjusted EBITDA by segment and provides reconciliation to earnings (loss) before income taxes for the three months ended Dec. 31, 2021:
| | | | | | | | | | | | | | | | | | | | | | | | | | | | | | | | |
| Attributable to common shareholders | | | |
| Hydro | Wind & Solar(1) | Gas | Energy Transition | Energy
Marketing | Corporate | Total | Equity accounted investments(1) | Reclass adjustments | IFRS financials |
| Revenues | 84 | | 98 | | 172 | | 238 | | 26 | | (2) | | 616 | | (6) | | — | | 610 | |
| Reclassifications and adjustments: | | | | | | | | | | |
Unrealized mark-to-market
(gain) loss | — | | 3 | | 82 | | (8) | | (12) | | — | | 65 | | — | | (65) | | — | |
Decrease in finance lease
receivable | — | | — | | 11 | | — | | — | | — | | 11 | | — | | (11) | | — | |
| Finance lease income | — | | — | | 6 | | — | | — | | — | | 6 | | — | | (6) | | — | |
Unrealized foreign exchange
(gain) loss on commodity | — | | — | | — | | — | | — | | — | | — | | — | | — | | — | |
| | | | | | | | | | |
| Adjusted revenues | 84 | | 101 | | 271 | | 230 | | 14 | | (2) | | 698 | | (6) | | (82) | | 610 | |
| Fuel and purchased power | 9 | | 6 | | 110 | | 149 | | — | | (2) | | 272 | | — | | — | | 272 | |
| Reclassifications and adjustments: | | | | | | | | | | |
| Australian interest income | — | | — | | (1) | | — | | — | | — | | (1) | | — | | 1 | | — | |
| Mine depreciation | — | | — | | — | | (11) | | — | | — | | (11) | | — | | 11 | | — | |
| Coal Inventory write-down | — | | — | | — | | (1) | | — | | — | | (1) | | — | | 1 | | — | |
| | | | | | | | | | |
| | | | | | | | | | |
Adjusted fuel and purchased
power | 9 | | 6 | | 109 | | 137 | | — | | (2) | | 259 | | — | | 13 | | 272 | |
| Carbon compliance | — | | — | | 14 | | 25 | | — | | — | | 39 | | — | | — | | 39 | |
| Gross margin | 75 | | 95 | | 148 | | 68 | | 14 | | — | | 400 | | (6) | | (95) | | 299 | |
| OM&A | 7 | | 17 | | 46 | | 20 | | 5 | | 29 | | 124 | | — | | — | | 124 | |
| Reclassifications and adjustments: | | | | | | | | | | |
| Parts and materials write-down | — | | — | | — | | 3 | | — | | — | | 3 | | — | | (3) | | — | |
| Curtailment gain | — | | — | | — | | 6 | | — | | — | | 6 | | — | | (6) | | — | |
| Adjusted OM&A | 7 | | 17 | | 46 | | 29 | | 5 | | 29 | | 133 | | — | | (9) | | 124 | |
| Taxes, other than income taxes | 1 | | 2 | | 2 | | 1 | | — | | — | | 6 | | — | | — | | 6 | |
| Net other operating income | — | | — | | (10) | | (8) | | — | | — | | (18) | | — | | — | | (18) | |
| Reclassifications and adjustments: | | | | | | | | | | |
Royalty onerous contract and
contract termination penalties | — | | — | | — | | 9 | | — | | — | | 9 | | — | | (9) | | — | |
Adjusted net other operating
income | — | | — | | (10) | | 1 | | — | | — | | (9) | | — | | (9) | | (18) | |
| Adjusted EBITDA | 67 | | 76 | | 110 | | 37 | | 9 | | (29) | | 270 | | | | |
| Equity income | | | | | | | | | | 4 | |
| | | | | | | | | | |
| | | | | | | | | | |
| | | | | | | | | | |
| | | | | | | | | | |
| | | | | | | | | | |
| Finance income from subsidiaries | | | | | | | | | | 6 | |
| Depreciation and amortization | | | | | | | | | | (134) | |
Asset impairment | | | | | | | | | | (28) | |
| Net interest expense | | | | | | | | | | (59) | |
| Foreign exchange loss | | | | | | | | | | (6) | |
| Gain on sale of assets and other | | | | | | | | | | (2) | |
Loss before income taxes | | | | | | | | | | (32) | |
(1) Skookumchuck has been included on a proportionate basis in the Wind and Solar segment. Includes reclassification adjustments.
TRANSALTA CORPORATION M46
Management’s Discussion and Analysis
The following table reflects Adjusted EBITDA by segment and provides reconciliation to earnings (loss) before income taxes for the three months ended Dec. 31, 2020:
| | | | | | | | | | | | | | | | | | | | | | | | | | | | | | | | |
| Attributable to common shareholders | | | |
| Hydro | Wind & Solar(1) | Gas | Energy Transition | Energy
Marketing | Corporate | Total | Equity accounted investments(1) | Reclass adjustments | IFRS financials |
| | | | | | | | | | |
| Revenues | 31 | | 92 | | 167 | | 230 | | 19 | | 8 | | 547 | | (3) | | — | | 544 | |
| Reclassifications and adjustments: | | | | | | | | | | |
Unrealized mark-to-market
(gain) loss | — | | 10 | | 34 | | (10) | | 10 | | — | | 44 | | — | | (44) | | — | |
Decrease in finance lease
receivable | — | | — | | 6 | | — | | — | | — | | 6 | | — | | (6) | | — | |
| Finance lease income | — | | — | | 3 | | — | | — | | — | | 3 | | — | | (3) | | — | |
Unrealized foreign exchange
(gain) loss on commodity | — | | — | | 4 | | — | | — | | — | | 4 | | — | | (4) | | — | |
| | | | | | | | | | |
| Adjusted revenues | 31 | | 102 | | 214 | | 220 | | 29 | | 8 | | 604 | | (3) | | (57) | | 544 | |
| Fuel and purchased power | (1) | | 11 | | 98 | | 166 | | — | | 8 | | 282 | | — | | — | | 282 | |
| Reclassifications and adjustments: | | | | | | | | | | |
| Australian interest income | — | | — | | (1) | | — | | — | | — | | (1) | | — | | 1 | | — | |
| Mine depreciation | — | | — | | (40) | | (18) | | — | | — | | (58) | | — | | 58 | | — | |
| Coal inventory write-down | — | | — | | — | | (15) | | — | | — | | (15) | | — | | 15 | | — | |
| | | | | | | | | | |
Adjusted fuel and purchased
power | (1) | | 11 | | 57 | | 133 | | — | | 8 | | 208 | | — | | 74 | | 282 | |
| Carbon compliance | — | | — | | 30 | | 15 | | — | | — | | 45 | | — | | — | | 45 | |
| Gross margin | 32 | | 91 | | 127 | | 72 | | 29 | | — | | 351 | | (3) | | (131) | | 217 | |
| OM&A | 9 | | 13 | | 42 | | 27 | | 6 | | 21 | | 118 | | — | | — | | 118 | |
| Taxes, other than income taxes | 1 | | 1 | | 2 | | 3 | | — | | 1 | | 8 | | — | | — | | 8 | |
Net other operating expense
(income) | — | | — | | 19 | | — | | — | | — | | 19 | | — | | — | | 19 | |
| Reclassifications and adjustments: | | | | | | | | | | |
Impact of Sheerness going
off-coal | — | | — | | (28) | | — | | — | | — | | (28) | | — | | 28 | | — | |
Adjusted net other operating
income | — | | — | | (9) | | — | | — | | — | | (9) | | — | | 28 | | 19 | |
| Adjusted EBITDA | 22 | | 77 | | 92 | | 42 | | 23 | | (22) | | 234 | | | | |
| Equity income | | | | | | | | | | 1 | |
| | | | | | | | | | |
| | | | | | | | | | |
| | | | | | | | | | |
| | | | | | | | | | |
| Finance income from subsidiaries | | | | | | | | | | 4 | |
| Depreciation and amortization | | | | | | | | | | (173) | |
| Asset impairment | | | | | | | | | | (17) | |
| Net interest expense | | | | | | | | | | (64) | |
| Foreign exchange loss | | | | | | | | | | 2 | |
| Gain on sale of assets and other | | | | | | | | | | 7 | |
Loss before income taxes | | | | | | | | | | (168) | |
(1) Skookumchuck has been included on a proportionate basis in the Wind and Solar segment. Includes reclassification adjustments.
TRANSALTA CORPORATION M47
Management’s Discussion and Analysis
Reconciliation of Cash flow from operations to FFO and FCF
The table below reconciles our cash flow from operating activities to our FFO and FCF for the three months ended Dec. 31, 2021 and 2020:
| | | | | | | | |
| Three months ended Dec. 31 | 2021 | 2020 |
Cash flow from operating activities(1) | 54 | | 110 | |
| Change in non-cash operating working capital balances | 148 | | 25 | |
| Cash flow from operations before changes in working capital | 202 | | 135 | |
| Adjustments | | |
| | |
Share of adjusted FFO from joint venture(1) | 6 | | 3 | |
| Decrease in finance lease receivable | 11 | | 6 | |
| | |
Clean energy transition provisions and adjustments(2) | (6) | | 15 | |
Other(3) | — | | 2 | |
FFO(4) | 213 | | 161 | |
| Deduct: | | |
Sustaining capital(1) | (55) | | (58) | |
| | |
| Productivity capital | (2) | | (3) | |
| Dividends paid on preferred shares | (10) | | (9) | |
| Distributions paid to subsidiaries’ non-controlling interests | (38) | | (29) | |
Principal payments on lease liabilities(1) | (2) | | (10) | |
| | |
FCF(4) | 106 | | 52 | |
| Weighted average number of common shares outstanding in the period | 271 | | 273 | |
FFO per share(4) | 0.79 | | 0.59 | |
FCF per share(4) | 0.39 | | 0.19 | |
(1) Includes our share of amounts for Skookumchuck, an equity accounted joint venture.
(2) Includes write-down on parts and material inventory for our coal operations, write-down on coal inventory to net realizable value and amounts due to contractors for not proceeding with the Sundance Unit 5 repowering project.
(3) Other consists of production tax credits which is a reduction to tax equity debt.
(4) These items are not defined and have no standardized meaning under IFRS. Please refer to the Additional IFRS Measures and Non-IFRS Measures section of this MD&A.
The table below provides a reconciliation of our adjusted EBITDA to our FFO and FCF for the three months ended Dec. 31, 2021 and 2020:
| | | | | | | | |
| Three months ended Dec. 31 | 2021 | 2020 |
Adjusted EBITDA(1) | 270 | | 234 | |
| Provisions | (18) | | (10) | |
Interest expense(2) | (51) | | (56) | |
Current income tax expense(2) | 3 | | 5 | |
| Realized foreign exchange loss | (4) | | (1) | |
Decommissioning and restoration costs settled(2) | (5) | | (5) | |
| Other non-cash items | 18 | | (6) | |
FFO(3) | 213 | | 161 | |
| Deduct: | | |
Sustaining capital(2) | (55) | | (58) | |
| Productivity capital | (2) | | (3) | |
| Dividends paid on preferred shares | (10) | | (9) | |
| Distributions paid to subsidiaries’ non-controlling interests | (38) | | (29) | |
Principal payments on lease liabilities(2) | (2) | | (10) | |
| | |
FCF(3) | 106 | | 52 | |
| | |
| | |
| | |
| | |
| | |
(1) Adjusted EBITDA is defined in the Additional IFRS Measures and Non-IFRS Measures section and reconciled to earnings (loss) before income taxes above.
(2) Includes our share of amounts for Skookumchuck, an equity accounted joint venture.
(3) FFO and FCF are defined in the Additional IFRS Measures and Non-IFRS Measures section and reconciled to cash flow from operating activities above.
TRANSALTA CORPORATION M48
Management’s Discussion and Analysis
Reconciliation of Non-IFRS Measures on a Consolidated Basis by Segment
The following table reflects adjusted EBITDA by segment and provides reconciliation to earnings (loss) before income taxes for the year ended Dec. 31, 2021:
| | | | | | | | | | | | | | | | | | | | | | | | | | | | | | | | |
| Attributable to common shareholders | | | |
| Hydro | Wind & Solar(1) | Gas | Energy Transition | Energy
Marketing | Corporate | Total | Equity accounted investments(1) | Reclass adjustments | IFRS financials |
| | | | | | | | | | |
| Revenues | 383 | | 323 | | 1,109 | | 709 | | 211 | | 4 | | 2,739 | | (18) | | — | | 2,721 | |
| Reclassifications and adjustments: | | | | | | | | | | |
Unrealized mark-to-market
(gain) loss | — | | 25 | | (40) | | 19 | | (38) | | — | | (34) | | — | | 34 | | — | |
Decrease in finance lease
receivable | — | | — | | 41 | | — | | — | | — | | 41 | | — | | (41) | | — | |
| Finance lease income | — | | — | | 25 | | — | | — | | — | | 25 | | — | | (25) | | — | |
Unrealized foreign exchange
gain on commodity | — | | — | | (3) | | — | | — | | — | | (3) | | — | | 3 | | — | |
| | | | | | | | | | |
| Adjusted revenues | 383 | | 348 | | 1,132 | | 728 | | 173 | | 4 | | 2,768 | | (18) | | (29) | | 2,721 | |
| Fuel and purchased power | 16 | | 17 | | 457 | | 560 | | — | | 4 | | 1,054 | | — | | — | | 1,054 | |
| Reclassifications and adjustments: | | | | | | | | | | |
| Australian interest income | — | | — | | (4) | | — | | — | | — | | (4) | | — | | 4 | | — | |
| Mine depreciation | — | | — | | (79) | | (111) | | — | | — | | (190) | | — | | 190 | | — | |
| Coal inventory write-down | — | | — | | — | | (17) | | — | | — | | (17) | | — | | 17 | | — | |
| | | | | | | | | | |
| | | | | | | | | | |
Adjusted fuel and purchased
power | 16 | | 17 | | 374 | | 432 | | — | | 4 | | 843 | | — | | 211 | | 1,054 | |
| Carbon compliance | — | | — | | 118 | | 60 | | — | | — | | 178 | | — | | — | | 178 | |
| Gross margin | 367 | | 331 | | 640 | | 236 | | 173 | | — | | 1,747 | | (18) | | (240) | | 1,489 | |
| OM&A | 42 | | 59 | | 175 | | 117 | | 36 | | 84 | | 513 | | (2) | | — | | 511 | |
| Reclassifications and adjustments: | | | | | | | | | | |
| Parts and materials write-down | — | | — | | (2) | | (26) | | — | | — | | (28) | | — | | 28 | | — | |
| Curtailment gain | — | | — | | — | | 6 | | — | | — | | 6 | | — | | (6) | | — | |
| Adjusted OM&A | 42 | | 59 | | 173 | | 97 | | 36 | | 84 | | 491 | | (2) | | 22 | | 511 | |
| Taxes, other than income taxes | 3 | | 10 | | 13 | | 6 | | — | | 1 | | 33 | | (1) | | — | | 32 | |
Net other operating expense
(income) | — | | — | | (40) | | 48 | | — | | — | | 8 | | — | | — | | 8 | |
| Reclassifications and adjustments: | | | | | | | | | | |
Royalty onerous contract and
contract termination penalties | — | | — | | — | | (48) | | — | | — | | (48) | | — | | 48 | | — | |
Adjusted net other operating
income | — | | — | | (40) | | — | | — | | — | | (40) | | — | | 48 | | 8 | |
| Adjusted EBITDA | 322 | | 262 | | 494 | | 133 | | 137 | | (85) | | 1,263 | | | | |
| Equity income from associate | | | | | | | | | | 9 | |
| | | | | | | | | | |
| | | | | | | | | | |
| | | | | | | | | | |
| | | | | | | | | | |
| | | | | | | | | | |
Finance lease income | | | | | | | | | | 25 | |
| Depreciation and amortization | | | | | | | | | | (529) | |
| Asset impairment | | | | | | | | | | (648) | |
| Net interest expense | | | | | | | | | | (245) | |
Foreign exchange gain | | | | | | | | | | 16 | |
| Gain on sale of assets and other | | | | | | | | | | 54 | |
Loss before income taxes | | | | | | | | | | (380) | |
(1) Skookumchuck has been included on a proportionate basis in the Wind and Solar segment.
TRANSALTA CORPORATION M49
Management’s Discussion and Analysis
| | | | | | | | | | | | | | | | | | | | | | | | | | | | | | | | |
| Year ended Dec. 31, 2020 | Attributable to common shareholders | | | |
| Hydro | Wind & Solar(1) | Gas | Energy Transition | Energy
Marketing | Corporate | Total | Equity accounted investments(1) | Reclass adjustments | IFRS financials |
| | | | | | | | | | |
| Revenues | 152 | | 332 | | 787 | | 704 | | 122 | | 7 | | 2,104 | | (3) | | — | | 2,101 | |
| Reclassifications and adjustments: | | | | | | | | | | |
Unrealized mark-to-market
(gain) loss | — | | 2 | | 33 | | (14) | | 21 | | — | | 42 | | — | | (42) | | — | |
Decrease in finance lease
receivable | — | | — | | 17 | | — | | — | | — | | 17 | | — | | (17) | | — | |
| Finance lease income | — | | — | | 7 | | — | | — | | — | | 7 | | — | | (7) | | — | |
Unrealized foreign exchange
loss on commodity | — | | — | | 4 | | — | | — | | — | | 4 | | — | | (4) | | — | |
| | | | | | | | | | |
| Adjusted revenues | 152 | | 334 | | 848 | | 690 | | 143 | | 7 | | 2,174 | | (3) | | (70) | | 2,101 | |
| | | | | | | | | | |
| Fuel and purchased power | 8 | | 25 | | 325 | | 435 | | — | | 12 | | 805 | | — | | — | | 805 | |
| Reclassifications and adjustments: | | | | | | | | | | |
| Australian interest income | — | | — | | (4) | | — | | — | | — | | (4) | | — | | 4 | | — | |
| Mine depreciation | — | | — | | (100) | | (46) | | — | | — | | (146) | | — | | 146 | | — | |
| Coal inventory write-down | — | | — | | — | | (37) | | — | | — | | (37) | | — | | 37 | | — | |
| | | | | | | | | | |
Adjusted fuel and purchased
power | 8 | | 25 | | 221 | | 352 | | — | | 12 | | 618 | | — | | 187 | | 805 | |
| Carbon compliance | — | | — | | 120 | | 48 | | — | | (5) | | 163 | | — | | — | | 163 | |
| Gross margin | 144 | | 309 | | 507 | | 290 | | 143 | | — | | 1,393 | | (3) | | (257) | | 1,133 | |
| OM&A | 37 | | 53 | | 166 | | 106 | | 30 | | 80 | | 472 | | — | | — | | 472 | |
| Taxes, other than income taxes | 2 | | 8 | | 13 | | 9 | | — | | 1 | | 33 | | — | | — | | 33 | |
Net other operating expense
(income) | — | | — | | (11) | | — | | — | | — | | (11) | | — | | — | | (11) | |
| Reclassifications and adjustments: | | | | | | | | | | |
Impact of Sheerness going
off-coal | — | | — | | (28) | | — | | — | | — | | (28) | | — | | 28 | | — | |
Adjusted net other operating
income | | | (39) | | — | | — | | — | | (39) | | — | | 28 | | (11) | |
| Adjusted EBITDA | 105 | | 248 | | 367 | | 175 | | 113 | | (81) | | 927 | | | | |
| Equity income from associate | | | | | | | | | | 1 | |
| | | | | | | | | | |
| | | | | | | | | | |
| | | | | | | | | | |
| | | | | | | | | | |
| | | | | | | | | | |
| Finance lease income | | | | | | | | | | 7 | |
| Depreciation and amortization | | | | | | | | | | (654) | |
| Asset impairment | | | | | | | | | | (84) | |
| Net interest expense | | | | | | | | | | (238) | |
| Foreign exchange loss | | | | | | | | | | 17 | |
| Gain on sale of assets and other | | | | | | | | | | 9 | |
| Loss before income taxes | | | | | | | | | | (303) | |
| | | | | | | | | | |
(1) Skookumchuck has been included on a proportionate basis in the Wind and Solar segment.
TRANSALTA CORPORATION M50
Management’s Discussion and Analysis
| | | | | | | | | | | | | | | | | | | | | | | | | | | | | | |
| Year ended Dec. 31, 2019 | Attributable to common shareholders | | | |
| Hydro | Wind & Solar | Gas | Energy Transition | Energy
Marketing | Corporate | Total | | Reclass adjustments | IFRS financials |
| | | | | | | | | | |
| Revenues | 156 | | 312 | | 851 | | 905 | | 129 | | (6) | | 2,347 | | | — | | 2,347 | |
| Reclassifications and adjustments: | | | | | | | | | | |
| Unrealized mark-to-market (gain) loss | — | | (17) | | 6 | | (12) | | (10) | | — | | (33) | | | 33 | | — | |
| Decrease in finance lease receivable | — | | — | | 24 | | — | | — | | — | | 24 | | | (24) | | — | |
| Finance lease income | — | | — | | 6 | | — | | — | | — | | 6 | | | (6) | | — | |
| | | | | | | | | | |
| Adjusted revenues | 156 | | 295 | | 887 | | 893 | | 119 | | (6) | | 2,344 | | | 3 | | 2,347 | |
| | | | | | | | | | |
| Fuel and purchased power | 7 | | 16 | | 315 | | 539 | | — | | 4 | | 881 | | | — | | 881 | |
| Reclassifications and adjustments: | | | | | | | | | | |
| Australian interest income | — | | — | | (4) | | — | | — | | — | | (4) | | | 4 | | — | |
| Mine depreciation | — | | — | | (81) | | (40) | | — | | — | | (121) | | | 121 | | — | |
| Adjusted fuel and purchased power | 7 | | 16 | | 230 | | 499 | | — | | 4 | | 756 | | | 125 | | 881 | |
| Carbon compliance | — | | — | | 138 | | 77 | | — | | (10) | | 205 | | | — | | 205 | |
| Gross margin | 149 | | 279 | | 519 | | 317 | | 119 | | — | | 1,383 | | | (122) | | 1,261 | |
| OM&A | 36 | | 50 | | 162 | | 124 | | 30 | | 73 | | 475 | | | — | | 475 | |
| Taxes, other than income taxes | 3 | | 8 | | 9 | | 8 | | — | | 1 | | 29 | | | — | | 29 | |
| Net other operating expense (income) | — | | (10) | | (41) | | — | | — | | 2 | | (49) | | | — | | (49) | |
| Termination of Sundance B and C PPAs | — | | — | | (14) | | (42) | | — | | — | | (56) | | | — | | (56) | |
| Adjusted EBITDA | 110 | | 231 | | 403 | | 227 | | 89 | | (76) | | 984 | | | | |
| | | | | | | | | | |
| | | | | | | | | | |
| | | | | | | | | | |
| Finance lease income | | | | | | | | | | 6 | |
| Depreciation and amortization | | | | | | | | | | (590) | |
| Asset impairment | | | | | | | | | | (25) | |
Gain on termination of Keephills 3 coal
rights contract | | | | | | | | | | 88 | |
| Net interest expense | | | | | | | | | | (179) | |
| Foreign exchange loss | | | | | | | | | | (15) | |
| Gain on sale of assets and other | | | | | | | | | | 46 | |
| Earnings before income taxes | | | | | | | | | | 193 | |
TRANSALTA CORPORATION M51
Management’s Discussion and Analysis
Reconciliation of Cash flow from operations to FFO and FCF
The table below reconciles our cash flow from operating activities to our FFO and FCF:
| | | | | | | | | | | |
| Year ended Dec. 31 | 2021 | 2020 | 2019 |
Cash flow from operating activities(1)(2) | 1,001 | | 702 | | 849 | |
| Change in non-cash operating working capital balances | (174) | | (89) | | (121) | |
| Cash flow from operations before changes in working capital | 827 | | 613 | | 728 | |
| Adjustments | | | |
| | | |
Share of adjusted FFO from joint venture(2) | 13 | | 3 | | — | |
| Decrease in finance lease receivable | 41 | | 17 | | 24 | |
| | | |
Clean energy transition provisions and adjustments(3) | 79 | | 37 | | — | |
Other(4) | 11 | | 15 | | 5 | |
FFO(5) | 971 | | 685 | | 757 | |
| Deduct: | | | |
Sustaining capital(2) | (199) | | (157) | | (141) | |
| | | |
| Productivity capital | (4) | | (4) | | (9) | |
| Dividends paid on preferred shares | (39) | | (39) | | (40) | |
| Distributions paid to subsidiaries’ non-controlling interests | (159) | | (102) | | (111) | |
Principal payments on lease liabilities(2) | (8) | | (25) | | (21) | |
| | | |
FCF(5) | 562 | | 358 | | 435 | |
| Weighted average number of common shares outstanding in the year | 271 | | 275 | | 283 | |
FFO per share(5) | 3.58 | | 2.49 | | 2.67 | |
FCF per share(5) | 2.07 | | 1.30 | | 1.54 | |
(1) 2019 includes the PPA Termination Payments. See the Significant and Subsequent Events section for further details.
(2) Includes our share of amounts for Skookumchuck, an equity accounted joint venture.
(3) Includes write-down on parts and material inventory for our coal operations, write-down on coal inventory to net realizable value, amounts due to contractors for not proceeding with the Sundance Unit 5 repowering project and impairment of a previously recognized deferred asset, as it is no longer likely that we will incur sufficient capital or operating expenditures to utilize the remaining credit.
(4) Other consists of production tax credits which is a reduction to tax equity debt.
(5) These items are not defined and have no standardized meaning under IFRS. Refer to the Additional IFRS Measures and Non-IFRS Measures section of this MD&A.
The table below bridges our adjusted EBITDA to our FFO and FCF:
| | | | | | | | | | | |
| Year ended Dec. 31 | 2021 | 2020 | 2019 |
Adjusted EBITDA(1)(2) | 1,263 | | 927 | | 984 | |
| Provisions and other | (43) | | 7 | | 13 | |
Interest expense(3) | (200) | | (192) | | (174) | |
Current income tax expense(3) | (55) | | (35) | | (35) | |
| Realized foreign exchange gain (loss) | (2) | | 8 | | (6) | |
Decommissioning and restoration costs settled(3) | (18) | | (18) | | (34) | |
Other cash and non-cash items(4) | 26 | | (12) | | 9 | |
FFO(5) | 971 | | 685 | | 757 | |
| Deduct: | | | |
Sustaining capital(3) | (199) | | (157) | | (141) | |
| Productivity capital | (4) | | (4) | | (9) | |
| Dividends paid on preferred shares | (39) | | (39) | | (40) | |
| Distributions paid to subsidiaries’ non-controlling interests | (159) | | (102) | | (111) | |
Principal payments on lease liabilities(3) | (8) | | (25) | | (21) | |
| | | |
FCF(5) | 562 | | 358 | | 435 | |
(1) 2019 amounts include the PPA Termination Payments.
(2) Adjusted EBITDA is defined in the Additional IFRS Measures and Non-IFRS Measures section and reconciled to earnings (loss) before income taxes above.
(3) Includes our share of amounts for Skookumchuck, an equity accounted joint venture.
(4) Other consists of production tax credits which is a reduction to tax equity debt.
(5) FFO and FCF are defined in the Additional IFRS Measures and Non-IFRS Measures section and reconciled to cash flow from operating activities above.
For explanations for the current period, please refer to the Highlights section of this MD&A.
FCF decreased by $77 million in 2020 compared to 2019, primarily due to lower segmented cash flows for the Alberta Thermal facilities included in the Gas and Energy Transition segments and higher sustaining capital expenditures, partially offset by strong cash flows for the Centralia Unit in the Energy Transition segment and lower distributions paid to subsidiaries' non controlling interests. There were no PPA Termination Payments included in 2020.
TRANSALTA CORPORATION M52
Management’s Discussion and Analysis
Financial Highlights on a Proportional Basis of TransAlta Renewables
The proportionate financial information below reflects TransAlta's share of TransAlta Renewables relative to TransAlta's total consolidated figures. The financial highlights presented on a proportional basis of TransAlta Renewables are supplementary financial measures to reflect TransAlta Renewables' portion of the consolidated figures.
Consolidated Results for the year ended Dec. 31
The following table reflects the generation and summary financial information on a consolidated basis for the year ended Dec. 31:
| | | | | | | | | | | | | | | | | | | | | | | | | | | | | | | | | | | | | | | | | |
| Actual generation (GWh) | | | | Adjusted EBITDA | | Earnings (loss) before income taxes |
| 2021 | 2020 | 2019 | | | | | | | | 2021 | 2020 | 2019 | | | | 2021 | 2020 | 2019 |
| TransAlta Renewables | | | | | | | | | | | | | | | | | | | |
| Hydro | 434 | | 429 | | 393 | | | | | | | | | 17 | | 21 | | 18 | | | | | | | |
Wind and Solar(1) | 3,898 | | 4,042 | | 3,355 | | | | | | | | | 248 | | 256 | | 238 | | | | | | | |
Gas(1) | 3,236 | | 2,919 | | 3,089 | | | | | | | | | 217 | | 205 | | 202 | | | | | | | |
| Corporate | — | | — | | — | | | | | | | | | (19) | | (20) | | (20) | | | | | | | |
| TransAlta Renewables before adjustments | 7,568 | | 7,390 | | 6,837 | | | | | | | | | 463 | | 462 | | 438 | | | | | 133 | | 188 | | 232 | |
| Less: Proportion of TransAlta Renewables not owned by TransAlta Corporation | (3,020) | | (2,938) | | (2,694) | | | | | | | | | (185) | | (182) | | (173) | | | | | (53) | | (74) | | (91) | |
| | | | | | | | | | | | | | | | | | | |
| | | | | | | | | | | | | | | | | | | |
| | | | | | | | | | | | | | | | | | | |
| | | | | | | | | | | | | | | | | | | |
| Portion of TransAlta Renewables owned by TransAlta Corporation | 4,548 | | 4,452 | | 4,143 | | | | | | | | | 278 | | 280 | | 265 | | | | | 80 | | 114 | | 141 | |
| Add: TransAlta Corporation's owned assets excluding TransAlta Renewables | | | | | | | | | | | | | | | | | | | |
| Hydro | 1,502 | | 1,703 | | 1,652 | | | | | | | | | 305 | | 84 | | 92 | | | | | | | |
| Wind and Solar | — | | 27 | | — | | | | | | | | | 14 | | (8) | | (7) | | | | | | | |
| Gas | 7,329 | | 7,861 | | 8,730 | | | | | | | | | 277 | | 162 | | 201 | | | | | | | |
| Energy Transition | 5,706 | | 7,999 | | 11,852 | | | | | | | | | 133 | | 175 | | 227 | | | | | | | |
| Energy Marketing | — | | — | | — | | | | | | | | | 137 | | 113 | | 89 | | | | | | | |
| Corporate | — | | — | | — | | | | | | | | | (66) | | (61) | | (56) | | | | | | | |
| TransAlta Corporation with Proportionate Share of TransAlta Renewables | 19,085 | | 22,042 | | 26,377 | | | | | | | | | 1,078 | | 745 | | 811 | | | | | (433) | | (377) | | 102 | |
| Non-controlling interests | 3,020 | | 2,938 | | 2,694 | | | | | | | | | 185 | | 182 | | 173 | | | | | 53 | | 74 | | 91 | |
| TransAlta Consolidated | 22,105 | | 24,980 | | 29,071 | | | | | | | | | 1,263 | | 927 | | 984 | | | | | (380) | | (303) | | 193 | |
(1) Wind and Solar and Gas segments include those assets that TransAlta Renewables holds an economic interest in.
TRANSALTA CORPORATION M53
Management’s Discussion and Analysis
Key Non-IFRS Financial Ratios
The methodologies and ratios used by rating agencies to assess our credit rating are not publicly disclosed. We have developed our own definitions of ratios and targets to help evaluate the strength of our financial position. These metrics and ratios are not defined and have no standardized meaning under IFRS and may not be comparable to those used by other entities or by rating agencies. We maintained a strong and flexible financial position in 2021.
Funds from Operations before Interest to Adjusted Interest Coverage
| | | | | | | | | | | |
| For the year ended Dec. 31 | 2021 | 2020 | 2019 |
FFO(1) | 971 | | 685 | | 757 | |
| Less: PPA Termination Payments | — | | — | | (56) | |
| | | |
Add: Interest on debt, exchangeable securities and preferred shares and leases, net of interest income and capitalized interest(2) | 202 | | 182 | | 166 | |
| FFO before interest | 1,173 | | 867 | | 867 | |
Interest on debt, exchangeable securities and leases, net of interest income(2)(3) | 188 | | 185 | | 172 | |
| | | |
Add: 50 per cent of dividends paid on preferred shares(3) | 33 | | 22 | | 20 | |
| Adjusted interest | 221 | | 207 | | 192 | |
| FFO before interest to adjusted interest coverage (times) | 5.3 | | 4.2 | | 4.5 | |
(1) See the Segmented Financial Performance and Operating Results section in this MD&A for reconciliation of cash flow from operating activities to FFO. See also the Additional IFRS Measures and Non-IFRS Measures section for further details.
(2) The interest on tax equity financing for Skookumchuck, an equity accounted joint venture, is not represented in the amounts.
(3) Exchangeable preferred shares are considered equity with dividend payments for credit purposes. For accounting purposes, they are accounted for as debt with interest expense in the Consolidated Financial Statements.
The FFO before interest to adjusted interest coverage ratio is used by management to assess our ability to pay interest on outstanding debts. Our target for FFO before interest to adjusted interest coverage is 4.0 to 5.0 times. While 2020 and 2019 are within our target range, the 2021 ratio exceeds the high end of our target, and increased compared to 2020, mainly due to higher FFO in 2021 compared to 2020.
Adjusted Net Debt to Adjusted EBITDA (Excluding PPA Termination Payments)
| | | | | | | | | | | |
| As at Dec. 31 | 2021 | 2020 | 2019 |
Period-end long-term debt(1) | 3,267 | | 3,361 | | 3,212 | |
| Exchangeable securities | 335 | | 330 | | 326 | |
| Less: Cash and cash equivalents | (947) | | (703) | | (411) | |
| | | |
Add: 50 per cent of issued preferred shares and exchangeable preferred shares(2) | 671 | | 671 | | 471 | |
Other(3) | (19) | | (13) | | (17) | |
Adjusted net debt(4) | 3,307 | | 3,646 | | 3,581 | |
Adjusted EBITDA(5) | 1,263 | | 927 | | 984 | |
Less: PPA Termination Payments(5) | — | | — | | (56) | |
Adjusted EBITDA (excluding PPA Termination Payments)(5) | 1,263 | | 927 | | 928 | |
Adjusted net debt to adjusted EBITDA (excluding PPA Termination Payments) (times) | 2.6 | | 3.9 | | 3.9 | |
(1) Consists of current and long-term portion of debt, which includes lease liabilities and tax equity financing.
(2) Exchangeable preferred shares are considered equity with dividend payments for credit-rating purposes. For accounting purposes, they are accounted for as debt with interest expense in the Consolidated Financial Statements. For purpose of this ratio, we consider 50% of issued preferred shares, including these, as debt.
(3) Includes principal portion of TransAlta OCP restricted cash and fair value of hedging instruments on debt (included in risk management assets and/or liabilities on the Consolidated Statements of Financial statements).
(4) The tax equity financing for Skookumchuck, an equity accounted joint venture, is not represented in the amounts. Adjusted net debt is not defined and has no standardized meaning under IFRS. Presenting this item from period to period provides management and investors with the ability to evaluate earnings trends more readily in comparison with prior periods’ results. See the Additional IFRS Measures and Non-IFRS Measures section of this MD&A.
(5) Last 12 months.
The Company's capital is managed internally and evaluated by management using a net debt position. Our current and long-term debt is adjusted for 50 per cent of the exchangeable preferred shares plus 50 per cent of outstanding preferred shares less available cash and cash equivalents, principal portion of TransAlta OCP restricted cash and including fair value assets of hedging instruments on debt, to provide a more readily comparable debt figure from period to period. We use the adjusted net debt to adjusted EBITDA ratio as a measurement of financial leverage and assess our ability to pay off debt. Our target for adjusted net debt to adjusted EBITDA (excluding PPA Termination Payments) is 3.0 to 3.5 times. Our adjusted net debt to adjusted EBITDA ratio for 2021 was better than the low end of our target, and improved compared to 2020, as a result of strong adjusted EBITDA, debt repayments and higher cash and cash equivalents.
TRANSALTA CORPORATION M54
Management’s Discussion and Analysis
Deconsolidated Adjusted EBITDA by Segment
We invest in our assets directly as well as with joint venture partners. Deconsolidated financial information is a supplementary financial measure, and is not intended to be presented in accordance with IFRS.
Adjusted EBITDA is a key metric for TransAlta and TransAlta Renewables and provides management and shareholders a representation of core business profitability. Deconsolidated adjusted EBITDA is used in key planning and credit metrics and segment results highlight the operating performance of assets held directly at TransAlta that are comparable from period to period.
A reconciliation of adjusted EBITDA to deconsolidated adjusted EBITDA by segment results is set out below:
| | | | | | | | | | | | | | | | | | | | | | | | | | | | | |
| 2021 | 2020 | 2019 |
| TransAlta Consolidated | TransAlta Renewables | TransAlta Deconsolidated | TransAlta Consolidated | TransAlta Renewables | TransAlta Deconsolidated | TransAlta Consolidated | TransAlta Renewables | TransAlta Deconsolidated |
| Hydro | 322 | | 17 | | | 105 | | 21 | | | 110 | 18 | | |
| Wind and Solar | 262 | | 248 | | | 248 | | 256 | | | 231 | 238 | | |
| Gas | 494 | | 217 | | | 367 | | 205 | | | 403 | | 202 | | |
| Energy Transition | 133 | | — | | | 175 | | — | | | 227 | | — | | |
| | | | | | | | | |
| | | | | | | | | |
| | | | | | | | | |
| | | | | | | | | |
Energy
Marketing | 137 | | — | | | 113 | | — | | | 89 | — | | |
| Corporate | (85) | | (19) | | | (81) | | (20) | | | (76) | | (20) | | |
Adjusted EBITDA(1) | 1,263 | | 463 | | 800 | | 927 | | 462 | | 465 | | 984 | | 438 | | 546 | |
Less: TA Cogen
adjusted EBITDA | | | (133) | | | | (54) | | | | (80) | |
Less: Termination of Sundance B and C PPAs(1) | | | — | | | | — | | | | (56) | |
Less: EBITDA from joint venture investments(2) | | | — | | | | (3) | | | | — | |
Add: Dividend from TransAlta Renewables(1) | | | 151 | | | | 151 | | | | 151 | |
Add: Dividend from TA Cogen(1) | | | 34 | | | | 17 | | | | 37 | |
Deconsolidated
TransAlta
adjusted EBITDA | | | 852 | | | | 576 | | | | 598 | |
(1) Last 12 months.
(2) Represents our share of amounts for Skookumchuck, an equity accounted joint venture.
TRANSALTA CORPORATION M55
Management’s Discussion and Analysis
Deconsolidated FFO
The Company has set capital allocation targets based on deconsolidated FFO available to shareholders. Deconsolidated financial information is a supplementary financial measure and is not defined and has no standardized meaning under IFRS, and may not be comparable to those used by other entities or by rating agencies. See also the Additional IFRS Measures and Non-IFRS Measures section of this MD&A for further details. Deconsolidated FFO for the years ended Dec. 31 is detailed below:
| | | | | | | | | | | | | | | | | | | | | | | | | | | | | |
| 2021 | 2020 | 2019 |
| TransAlta Consolidated | TransAlta Renewables | TransAlta Deconsolidated | TransAlta Consolidated | TransAlta Renewables | TransAlta Deconsolidated | TransAlta Consolidated | TransAlta Renewables | TransAlta Deconsolidated |
| Cash flow from operating activities | 1,001 | | 336 | | | 702 | | 267 | | | 849 | | 331 | | |
Change in non-
cash operating
working capital
balances | (174) | | (13) | | | (89) | | 31 | | | (121) | | 23 | | |
| Cash flow from operations before changes in working capital | 827 | | 323 | | | 613 | | 298 | | | 728 | | 308 | | |
| Adjustments: | | | | | | | | | |
| Decrease in finance lease receivable | 41 | | — | | | 17 | | — | | | 24 | | — | | |
| Clean energy transition provisions and adjustments | 79 | | — | | | 37 | | — | | | — | | — | | |
Share of FFO from joint venture(1) | 13 | | — | | | 3 | | — | | | — | | — | | |
| Finance income - economic interests | — | | (108) | | | — | | (69) | | | — | | (76) | | |
FFO - economic interests(2) | — | | 191 | | | — | | 180 | | | — | | 153 | | |
Other(3) | 11 | | — | | | 15 | | — | | | 5 | | — | | |
| FFO | 971 | | 406 | | 565 | 685 | | 409 | | 276 | 757 | | 385 | | 372 |
Dividend from
TransAlta
Renewables | | | 151 | | | | 151 | | | | 151 | |
| | | | | | | | | |
Distributions to
TA Cogen's
Partner | | | (56) | | | | (17) | | | | (37) | |
Less: Share of adjusted FFO from joint venture(1) | | | — | | | | (3) | | | | — | |
Less: PPA
Termination
Payments | | | — | | | | — | | | | (56) | |
Deconsolidated
TransAlta FFO | | | 660 | | | | 407 | | | | 430 | |
(1) Represents our share of amounts for Skookumchuck, an equity accounted joint venture.
(2) FFO - economic interests calculated as Free Cash Flow economic interests plus sustaining capital expenditures economic interests plus/minus currency adjustment and in 2021 less distributions from equity accounted joint venture.
(3) Other consists of production tax credits, which is a reduction to tax equity debt and in 2021 less distributions from equity accounted joint venture.
TRANSALTA CORPORATION M56
Management’s Discussion and Analysis
Deconsolidated Net Debt to Deconsolidated Adjusted EBITDA
In addition to reviewing fully consolidated ratios and results, management reviews net debt to adjusted EBITDA on a deconsolidated basis to highlight TransAlta's financial flexibility, balance sheet strength and leverage. Deconsolidated financial information is a supplementary financial measure and is not defined under IFRS, and may not be comparable to those used by other entities or by rating agencies. See also the Additional IFRS Measures and Non-IFRS Measures section of this MD&A for further details.
| | | | | | | | | | | |
| As at Dec. 31 | 2021 | 2020 | 2019 |
| | | |
| | | |
| | | |
| | | |
| | | |
| | | |
| | | |
Adjusted net debt(1) | 3,307 | | 3,646 | | 3,581 | |
| Add: TransAlta Renewables cash and cash equivalents | 244 | | 582 | | 63 | |
| Less: TransAlta Renewables long-term debt | (814) | | (692) | | (961) | |
Less: US tax equity financing and South Hedland debt(2) | (867) | | (906) | | (145) | |
| Deconsolidated net debt | 1,870 | | 2,630 | | 2,538 | |
| | | |
| | | |
| | | |
| | | |
| | | |
| | | |
| | | |
| | | |
| | | |
Deconsolidated adjusted EBITDA(3) | 852 | | 576 | | 598 | |
Deconsolidated net debt to deconsolidated adjusted EBITDA(4) (times) | 2.2 | | 4.6 | | 4.2 | |
(1) Refer to the Adjusted Net Debt to Adjusted EBITDA (Excluding PPA Termination Payments) calculation under the Key Non-IFRS Financial Ratios section of this MD&A for the reconciliation and composition of adjusted net debt.
(2) Relates to assets where TransAlta Renewables has economic interests.
(3) Refer to the Deconsolidated Adjusted EBITDA by Segment section of this MD&A for the reconciliation and composition of deconsolidated adjusted EBITDA.
(4) The non-IFRS ratio is not a standardized financial measure under IFRS and might not be comparable to similar financial measures disclosed by other issuers.
Our target for deconsolidated net debt to deconsolidated adjusted EBITDA is 2.5 to 3.0 times. Our deconsolidated net debt to deconsolidated adjusted EBITDA ratio decreased compared with 2020, due to lower deconsolidated net debt which was partially offset by higher deconsolidated adjusted EBITDA. Lower deconsolidated net debt is a result of scheduled repayments on corporate debt and an increase in cash balances.
2022 Financial Outlook
The following table outlines our expectation on key financial targets and related assumptions for 2022 and should be read in conjunction with the narrative discussion that follows and the Governance and Risk Management section of this MD&A: | | | | | | | | |
| Measure | 2022 Target | 2021 Actuals |
Adjusted EBITDA(1) | $1,065 million - $1,185 million | $1,263 million |
| | |
FCF(1) | $455 million - $555 million | $562 million |
| Dividend | $0.20 per share annualized | $0.20 per share annualized |
(1) These items are not defined and have no standardized meaning under IFRS. Please refer to the Reconciliation of Non-IFRS Measures section of this MD&A for further discussion of these items, including, where applicable, reconciliations to measures calculated in accordance with IFRS. See also the Additional IFRS measures and Non-IFRS Measures section of this MD&A.
| | | | | | |
| Range of key power price assumptions | | |
| Market | 2022 Assumption | |
| Alberta Spot ($/MWh) | $80 - $90 | |
| Mid-C Spot (US$/MWh) | US$45 - US$55 | |
| AECO Gas Price ($/GJ) | $3.60 | |
| | | | | |
| Other assumptions relevant to the 2022 financial outlook |
| Sustaining capital | $150 million - $170 million |
| Energy Marketing gross margin | $95 million - $115 million |
Alberta Hedging
| | | | | | | | | | |
| Range of hedging assumptions | 2022 | | | | | |
| | | | | | |
| Hedged production (GWh) | 6,278 | | | | | |
| Hedge Price ($/MWh) | $75 | | | | | |
| Hedged gas volumes (GJ) | 50 million | | | | | |
| Hedge gas prices ($/GJ) | $2.75 | | | | | |
| | | | | | |
TRANSALTA CORPORATION M57
Management’s Discussion and Analysis
Adjusted EBITDA is estimated to be between $1.065 billion to $1.185 billion. FCF is expected to be between $455 million and $555 million and excludes the impact of rehabilitation capital expenditures required at Kent Hills 1 and 2 wind facilities. The midpoint of the range represents a 5 per cent decrease from the midpoint of the 2021 outlook largely driven by lower expectations on Alberta power pricing, a return to normal performance from Energy Marketing, and a step-up in mine reclamation expenditures, partially offset by the contribution from new assets, settlements of non-recurring provisions in 2021 and lower expected sustaining capital.
The Company expects its outlook for 2022 to be impacted by a number of factors detailed further below.
Market Pricing
For 2022, we see continuing strong merchant pricing levels in Alberta and the Pacific Northwest though at lowered target ranges for both regions. Lower year-over-year pricing in Alberta is expected to be driven by fewer planned outages and the expected additions of new wind and solar supply, including TransAlta’s new Windrise wind facility and Garden Plain wind facility, expected to achieve commercial operation in late 2022. Weather and demand are also major factors in actual settled prices. Lower year-over-year pricing in the Pacific Northwest will be impacted by natural gas prices and hydro generation resulting from actual weather and hydrology of the year. Ontario power prices for 2022 are expected to be higher than 2021 due to higher natural gas prices and additional nuclear refurbishment outages.
The objective of our portfolio management strategy in Alberta is to balance opportunity and risk, and to deliver optimization strategies that contribute to our total investment, which includes a return of and on invested capital. We can be more or less hedged in a given period and we expect to realize our annual targets through a combination of forward hedging and selling generation into the spot market. The Alberta assets are managed as a portfolio to maximize the overall value of generation and capacity from our hydro, wind and energy storage and thermal facilities. Financial hedging is a key component of cash flow certainty and the hedges are tied to the portfolio of assets rather than a single facility.
Kent Hills Wind Facilities Outage
It is expected that the outage at Kent Hills 1 and 2 wind facilities will continue and rehabilitation efforts for all of the foundations is expected to commence during the second quarter of 2022 with the aim of fully returning the wind facilities to service by the end of 2023. The outage is expected to result in foregone revenue of approximately $3.4 million per month on an annualized basis so long as all 50 turbines at Kent Hills 1 and 2 wind facilities are offline, based on average historical wind production, with revenue expected to be earned as the wind turbines are returned to service.
Addition of Windrise and North Carolina Solar
On Nov. 5, 2021, TransAlta Renewables completed the acquisition of the economic interest in the fully contracted 122 MW North Carolina Solar portfolio, which is expected to generate an average annual EBITDA6 of approximately US$9 million.
On Dec. 2, 2021, TransAlta Renewables announced commercial operation of the Windrise wind facility in Alberta was achieved on Nov. 10, 2021. Windrise is expected to generate an average annual EBITDA6 of approximately $20 million to $22 million.
Fuel and Compliance Costs
For the Gas fleet, coal consumption in Alberta is expected to be zero in 2022 given TransAlta has now retired or fully converted all its coal-fired facilities to gas. Increased gas consumption in the Gas fleet will drive lower GHG emissions and the combined effect will result in lower total fuel and GHG costs for a given volume of power production. This will be partially offset by an increased carbon tax in Alberta.
In the Pacific Northwest of the US, the coal mine adjacent to our Centralia thermal facility is in the reclamation stage. Fuel at Centralia has been purchased from external suppliers in the Powder River Basin and delivered by rail. In 2020, we amended our fuel and rail contract such that our rail freight costs fluctuate partly with power prices. The delivered fuel cost in 2022 is expected to be marginally higher than 2021 costs.
Most of the generation from gas turbine-based power facilities is sold under contracts with pass-through provisions for fuel. For gas generation with no pass-through provisions, we purchase natural gas from outside companies coincident with production, thereby minimizing our risk to changes in prices.
6 Average annual EBITDA is not defined and has no standardized meaning under IFRS, and is forward-looking. Please refer to the Additional IFRS Measures and Non-IFRS Measures section of this MD&A for further discussion.
TRANSALTA CORPORATION M58
Management’s Discussion and Analysis
We closely monitor the risks associated with changes in electricity and input fuel prices on our future operations and, where we consider it appropriate, use various physical and financial instruments to hedge our assets and operations from such price risks.
Energy Marketing
Adjusted EBITDA from our Energy Marketing segment is affected by prices and volatility in the market, overall strategies adopted and changes in regulation and legislation. Our outlook has been adjusted to reflect the exceptional performance achieved in 2021. We continuously monitor both the market and our exposure to maximize earnings while still maintaining an acceptable risk profile. Our 2022 objective for Energy Marketing is for the segment to contribute between $95 million to $115 million in gross margin for the year, which is consistent with normalized performance expectations.
Exposure to Fluctuations in Foreign Currencies
Our strategy is to minimize the impact of fluctuations in the Canadian dollar against the US dollar and Australian dollar by offsetting foreign-denominated assets with foreign-denominated liabilities and by entering into foreign exchange contracts. We also have foreign-denominated expenses, including interest charges, which largely offset our net foreign-denominated revenues.
Decommissioning and Restoration Costs
Decommissioning and restoration costs are expected to be higher in 2022 due to the closure of the Highvale coal mine and increased reclamation activity at Centralia due to deferral of certain activities impacted by COVID-19.
Sustaining Capital Expenditures
The Company expects sustaining capital to be in the range of $150 million to $170 million. The midpoint for the range represents a 25 per cent decrease from the midpoint of the 2021 outlook. This is driven by fewer planned maintenance outages at the thermal fleet in Alberta due to the completion of gas conversions that occurred in 2021, partially offset by increased sustaining capital expenditures at the Sarnia cogeneration facility for planned major maintenance, as well as increased dam safety and major maintenance across our Hydro fleet. The Kent Hills foundation rehabilitation capital expenditure has been segregated from our sustaining capital range due to the extraordinary and rare nature of this expenditure. The initial estimated range for the rehabilitation at Kent Hills is between $75 million to $100 million with approximately $40 million to $60 million estimated to be incurred in 2022.
Our estimate for total sustaining capital is as follows:
| | | | | | | | | | | | | | | | | | | | | | | | |
| | Spent in 2020 | Spent in 2021 | | Expected spend in 2022 |
| | | | | | | | |
| | | | | | | | |
| | | | | | | | |
| Total sustaining capital | 157 | | 199 | | | | 150 | | - | 170 |
| | | | | | | | |
| | | | | | | | |
| | | | | | | | |
| | | | | | | |
Liquidity and Capital Resources
We expect to maintain adequate available liquidity under our committed credit facilities. We currently have access to $2.2 billion in liquidity, including $947 million in cash. We expect to be well positioned to refinance the upcoming debt maturity in 2022. The funds required for committed growth, sustaining capital and productivity projects are not expected to be significantly impacted by the current economic environment. Please refer to the Description of Business and Financial Capital sections of this MD&A for further details.
Net Interest Expense
Interest expense for 2022 is expected to be higher than in 2021 largely due to higher levels of debt. The increase in debt is mainly due to the $173 million Windrise project financing that was completed in November 2021. In addition, changes in interest rates on variable debt, and in the value of the Canadian dollar relative to the US and Australian dollars can affect the amount of interest expense incurred.
Critical Accounting Policies and Estimates
The selection and application of accounting policies is an important process that has developed as our business activities have evolved and as accounting rules and guidance have changed. Accounting rules generally do not involve a selection among alternatives, but involve an implementation and interpretation of existing rules and the use of judgment relative to the circumstances existing in the business. Every effort is made to comply with all applicable rules on or before the effective date and we believe the proper implementation and consistent application of accounting rules is critical.
TRANSALTA CORPORATION M59
Management’s Discussion and Analysis
However, not all situations are specifically addressed in the accounting literature. In these cases, our best judgment is used to adopt a policy for accounting for these situations. We draw analogies to similar situations and the accounting guidelines governing them, consider foreign accounting standards and consult with our independent auditors about the appropriate interpretation and application of these policies. Each of the critical accounting policies involves complex situations and a high degree of judgment either in the application and interpretation of existing literature or in the development of estimates that impact our consolidated financial statements.
Our material accounting policies are described in Note 2 of the consolidated financial statements. Each policy involves a number of estimates and assumptions to be made about matters that are uncertain at the time the estimate is made. Different estimates, with respect to key variables used for the calculations, or changes to estimates, could potentially have a material impact on our financial position or results of operations.
We have discussed the development and selection of these critical accounting estimates with our Audit, Finance and Risk Committee ("AFRC") and our independent auditors. The AFRC has reviewed and approved our disclosure relating to critical accounting estimates in this MD&A. These critical accounting estimates are described as follows:
Revenue Recognition
Revenue from Contracts with Customers
Identification of Performance Obligations
Where contracts contain multiple promises for goods or services, management exercises judgment in determining whether goods or services constitute distinct goods or services or a series of distinct goods or services that are substantially the same and that have the same pattern of transfer to the customer. The determination of a performance obligation affects whether the transaction price is recognized at a point in time or over time. Management considers both the mechanics of the contract and the economic and operating environment of the contract in determining whether the goods or services in a contract are distinct.
Transaction Price
In determining the transaction price and estimates of variable consideration, management considers the past history of customer usage and capacity requirements when estimating the goods and services to be provided to the customer. The Company also considers the historical production levels and operating conditions for its variable generating assets.
Allocation of Transaction Price to Performance Obligations
When multiple performance obligations are present in a contract, transaction price is allocated to each performance obligation in an amount that depicts the consideration the Company expects to be entitled to in exchange for transferring the good or service.
The Company’s contracts generally outline a specific amount to be invoiced to a customer associated with each performance obligation in the contract. Where contracts do not specify amounts for individual performance obligations, the Company estimates the amount of the transaction price to allocate to individual performance obligations based on their standalone selling price, which is primarily estimated based on the amounts that would be charged to customers under similar market conditions.
Satisfaction of Performance Obligations
The satisfaction of performance obligations requires management to use judgment as to when control of the underlying good or service transfers to the customer. Determining when a performance obligation is satisfied affects the timing of revenue recognition. Management considers both customer acceptance of the good or service, and the impact of laws and regulations such as certification requirements, in determining when this transfer occurs. Management also applies judgment in determining whether the invoice practical expedient permits recognition of revenue at the invoiced amount, if that invoiced amount corresponds directly with the entity's performance to date.
Revenue from Other Sources
Revenue from Derivatives
Commodity risk management activities involve the use of derivatives such as physical and financial swaps, forward sales contracts, futures contracts and options that are used to earn revenues and to gain market information. These derivatives are accounted for using fair value accounting. The determination of the fair value of commodity risk management contracts and derivative instruments is complex and relies on judgments concerning future prices, volatility and liquidity, among other factors. Some of our derivatives are not traded on an active exchange or extend beyond the time period for which exchange-based quotes are available, requiring us to use internal valuation techniques or models described below.
TRANSALTA CORPORATION M60
Management’s Discussion and Analysis
Merchant Revenue
Revenues from non-contracted capacity (i.e., merchant) are comprised of energy payments, at market price, for each MWh produced and are recognized upon delivery.
Financial Instruments
The fair value of a financial instrument is the price that would be received to sell an asset or paid to transfer a liability in an orderly transaction between market participants at the measurement date. Fair values can be determined by reference to prices for instruments in active markets to which we have access. In the absence of an active market, we determine fair values based on valuation models or by reference to other similar products in active markets.
Fair values determined using valuation models require the use of assumptions. In determining those assumptions, we look primarily to external readily observable market inputs. However, if not available, we use inputs that are not based on observable market data.
Level Determinations and Classifications
The Level I, II and III classifications in the fair value hierarchy utilized by the Company are defined below. The fair value measurement of a financial instrument is included in only one of the three levels, the determination of which is based on the lowest level input that is significant to the derivation of the fair value. Refer to Note 15(B)(I) from our audited annual consolidated financial statements for further details on the inputs used for each level.
The effect of using reasonably possible alternative assumptions as inputs to valuation techniques for contracts included in the Level III fair value measurements at Dec. 31, 2021, is an estimated total upside of $105 million (2020 — $68 million upside) and total downside of $220 million (2020 — $94 million) impact to the carrying value of the financial instruments. Fair values are stressed for volumes and prices. The amount of $22 million upside (2020 — $35 million upside) and $145 million downside (2020 — $59 million downside) in the stress values stems from a long-dated power sale contract in the Pacific Northwest that is designated as a cash flow hedge utilizing assumed power prices ranging from US$28 to US$51/MWh (Dec. 31, 2020 — US$24-US$32/MWh) for the period beyond the liquid period, while the remaining amounts account for the rest of the portfolio. The variable volumes are stressed up and down one standard deviation from historically available production data. Prices are stressed for longer-term deals where there are no liquid market quotes using various internal and external forecasting sources to establish a high and a low price range.
In addition to the Level III fair value measurements discussed above, the Brookfield Investment Agreement allows Brookfield the option to exchange all of the outstanding exchangeable securities into an equity ownership interest of up to a maximum of 49 per cent in an entity formed to hold TransAlta’s Alberta Hydro Assets after Dec. 31, 2024. The fair value of the option to exchange is considered a Level III fair value measurement, with an estimated downside of $32 million (2020 — $33 million downside) potential impact to the carrying value of nil as at Dec. 31, 2021 (2020 — nil). The sensitivity analysis has been prepared using the Company’s assessment that a change in the implied discount rate of the future cash flow of one per cent is a reasonably possible change.
Valuation of PP&E and Associated Contracts
At the end of each reporting period, we assess whether there is any indication that PP&E and finite life intangible assets are impaired or whether a previously recognized impairment may no longer exist or may have decreased.
Our operations, the market and business environment are routinely monitored, and judgments and assessments are made to determine whether an event has occurred that indicates a possible impairment. If such an event has occurred, an estimate is made of the recoverable amount of the asset or CGU to which the asset belongs. The recoverable amount is the higher of an asset’s fair value less costs of disposal and its value in use. Fair value is the price that would be received to sell an asset in an orderly transaction between market participants at the measurement date. In determining fair value less costs of disposal, information about third-party transactions for similar assets is used and if none is available, other valuation techniques, such as discounted cash flows, are used. Value in use is computed using the present value of management’s best estimates of future cash flows based on the current use and present condition of the asset. In estimating either fair value less costs of disposal or value in use using discounted cash flow methods, estimates and assumptions must be made about sales prices, cost of sales, production, fuel consumed, capital expenditures, retirement costs and other related cash inflows and outflows over the life of the facilities, which can range from 30 to 60 years. In developing these assumptions, management uses estimates of contracted and future market prices based on expected market supply and demand in the region in which the facility operates, anticipated production levels, planned and unplanned outages, changes to regulations and transmission capacity or constraints for the remaining life of the facilities.
TRANSALTA CORPORATION M61
Management’s Discussion and Analysis
Discount rates are determined by employing a weighted average cost of capital methodology that is based on capital structure, cost of equity and cost of debt assumptions based on comparable companies with similar risk characteristics and market data as the asset, CGU or group of CGUs subject to the test. These estimates and assumptions are susceptible to change from period to period and actual results can, and often do, differ from the estimates, and can have either a positive or negative impact on the estimate of the impairment charge, and may be material.
The impairment outcome can also be impacted by the determination of CGUs or groups of CGUs for asset and goodwill impairment testing. A CGU is the smallest identifiable group of assets that generates cash inflows that are largely independent of the cash inflows from other assets or groups of assets, and goodwill is allocated to each CGU or group of CGUs that is expected to benefit from the synergies of the acquisition from which the goodwill arose. The allocation of goodwill is reassessed upon changes in the composition of segments, CGUs or groups of CGUs. In respect of determining CGUs, significant judgment is required to determine what constitutes independent cash flows between power facilities that are connected to the same system. We evaluate the market design, transmission constraints and the contractual profile of each facility, as well as our commodity price risk management plans and practices, in order to inform this determination. With regard to the allocation or reallocation of goodwill, significant judgment is required to evaluate synergies and their impacts. Minimum thresholds also exist with respect to segmentation and internal monitoring activities. We evaluate synergies with regard to opportunities from combined talent and technology, functional organization and future growth potential, and we consider our own performance measurement processes in making this determination. No changes arose in our CGUs in 2021.
Impairment charges can be reversed in future periods if circumstances improve. No assurances can be given if any reversal will occur or the amount or timing of any such reversal. Please refer to the Financial Position section of this MD&A for further details.
Valuation of Goodwill
We evaluate goodwill for impairment at least annually, or more frequently if indicators of impairment exist. If the carrying amount of a CGU or group of CGUs, including goodwill, exceeds the unit’s fair value, the excess represents a goodwill impairment loss.
For purposes of the 2021, 2020 and 2019 annual goodwill impairment reviews, the Company determined the recoverable amounts of the CGUs by calculating the fair value less costs of disposal using discounted cash flow projections based on the Company’s long-range forecasts for the period extending to the last planned asset retirement in 2072. The resulting fair value measurement is categorized within Level III of the fair value hierarchy.
Determining the fair value of the CGUs or group of CGUs is susceptible to changes from period to period as management is required to make assumptions about future cash flows, production and trading volumes, margins, and fuel and operating costs.
Project Development Costs
Project development costs include external, direct and incremental costs that are necessary for completing an acquisition or construction project. The appropriateness of capitalization of these costs is evaluated each reporting period, and amounts capitalized for projects no longer probable of occurring are charged to net earnings.
Useful Life of PP&E
Each significant component of an item of PP&E is depreciated over its estimated useful life. A component is a tangible asset that can be separately identified as an asset and is expected to provide a benefit of greater than one year. Estimated useful lives are determined based on current facts and past experience, and take into consideration the anticipated physical life of the asset, existing long-term sales agreements and contracts, current and forecasted demand, the potential for technological obsolescence and regulations. The useful lives of PP&E and depreciation rates used are reviewed at least annually to ensure they continue to be appropriate.
TRANSALTA CORPORATION M62
Management’s Discussion and Analysis
Leases
In determining whether our contracts contain, or are, leases, management must use judgment in assessing whether the contract provides the customer with the right to substantially all of the economic benefits from the use of the asset during the lease term and whether the customer obtains the right to direct the use of the asset during the lease term. For those agreements considered to contain, or be, leases, further judgment is required to determine the lease term by assessing whether termination or extension options are reasonably certain to be exercised. Judgment is also applied in identifying in-substance fixed payments (included) and variable payments that are based on usage or performance factors (excluded) and in identifying lease and non-lease components (services that the supplier performs) of contracts and in allocating contract payments to lease and non-lease components.
For leases where we are a lessor, judgment is required to determine if substantially all of the significant risks and rewards of ownership are transferred to the customer or remain with us, to appropriately account for the agreement as either a finance or operating lease. These judgments can be significant and impact how we classify amounts related to the arrangement as either PP&E or as a finance lease receivable on the Consolidated Statements of Financial Position, and therefore the amount of certain items of revenue and expense are dependent upon such classifications.
Income Taxes
Preparation of the consolidated financial statements involves determining an estimate of, or provision for, income taxes in each of the jurisdictions in which we operate. The process also involves making an estimate of taxes currently payable and income taxes expected to be payable or recoverable in future periods, referred to as deferred income taxes. An assessment must also be made to determine the likelihood that our future taxable income will be sufficient to permit the recovery of deferred income tax assets. To the extent that such recovery is not probable, deferred income tax assets must be reduced. The reduction of the deferred income tax asset can be reversed if the estimated future taxable income improves. No assurances can be given if any reversal will occur or the amount or timing of any such reversal. Management must exercise judgment in its assessment of continually changing tax interpretations, regulations, and legislation to ensure deferred income tax assets and liabilities are complete and fairly presented. Differing assessments and applications than our estimates could materially impact the amount recognized for deferred income tax assets and liabilities. Our tax filings are subject to audit by taxation authorities. The outcome of some audits may change our tax liability, although we believe that we have adequately provided for income taxes in accordance with IFRS based on all information currently available. The outcome of pending audits is not known nor is the potential impact on the consolidated financial statements determinable.
Employee Future Benefits
We provide selected pension and other post-employment benefits to employees, such as health and dental benefits. The cost of providing these benefits is dependent upon many factors, including actual plan experience and estimates and assumptions about future experience.
The liabilities for pension, other post-employment benefits and associated pension costs included in annual compensation expenses are impacted by employee demographics, including age, compensation levels, employment periods, the level of contributions made to the plans and earnings on plan assets.
Changes to the provisions of the plans may also affect current and future pension costs. Pension costs may also be significantly impacted by changes in key actuarial assumptions, including, for example, the discount rates used in determining the defined benefit obligation and the net interest cost on the net defined benefit liability. The discount rate used to estimate our obligation reflects high-quality corporate fixed income securities currently available and expected to be available during the period to maturity of the pension benefits.
Decommissioning and Restoration Provisions
We recognize decommissioning and restoration provisions for generating facilities and mine sites in the period in which they are incurred if there is a legal or constructive obligation to remove the facilities and restore the site. The amount recognized as a provision is the best estimate of the expenditures required to settle the provision. Expected values are probability weighted to deal with the risks and uncertainties inherent in the timing and amount of settlement of many decommissioning and restoration provisions. Expected values are discounted at the current market-based risk-free interest rate adjusted to reflect the market’s evaluation of our credit standing.
We estimate the undiscounted amount of cash flow required to settle the decommissioning and restoration provisions is approximately $1.6 billion, which will be incurred between 2022 and 2072. The majority of these costs will be incurred between 2025 and 2050.
TRANSALTA CORPORATION M63
Management’s Discussion and Analysis
Other Provisions
Where necessary, we recognize provisions arising from ongoing business activities, such as interpretation and application of contract terms, ongoing litigation and force majeure claims. These provisions, and subsequent changes thereto, are determined using our best estimate of the outcome of the underlying event and can also be impacted by determinations made by third parties, in compliance with contractual requirements. The actual amount of the provisions that may be required could differ materially from the amount recognized.
Classification of Joint Arrangements
Upon entering into a joint arrangement, the Company must classify it as either a joint operation or joint venture, and the classification affects the accounting for the joint arrangement. In making this classification, the Company exercises judgment in evaluating the terms and conditions of the arrangement to determine whether the parties have rights to the assets and obligations or rights to the net assets. Factors such as the legal structure, contractual arrangements and other facts and circumstances, such as where the purpose of the arrangement is primarily for the provision of the output to the parties and when the parties are substantially the only source of cash flows for the arrangement, must be evaluated to understand the rights of the parties to the arrangement.
Significant Influence
Upon entering into an investment, the Company must classify it as either an investment as an associate or an investment under IFRS 9. In making this classification, the Company exercises judgment in evaluating whether the Company has significant influence over the investee. Significant influence is the power to participate in the financial and operating policy decisions of the investee, but is not control or joint control over those policies. If the Company holds 20 per cent or more of the voting rights in the investee, it is presumed that the entity has significant influence, unless it can be clearly demonstrated that this is not the case. Other factors such as representation on the board of directors, participation in policy-making processes, material transactions between the Company and investee, interchange of managerial personnel or providing essential technical information are considered when assessing if the Company has significant influence over an investee.
Accounting Changes
Current Accounting Changes
Amendments to IAS 1 Presentation of Financial Statements: Material Accounting Policies
Effective for the 2021 annual financial statements, the Company early adopted amendments to IAS 1 Presentation of Financial Statements in advance of its mandatory effective date of Jan. 1, 2023, which requires entities to disclose their material accounting policy information rather than their significant accounting policies. The Company has updated the accounting policies disclosed in Note 2 based on its assessment of the amended standard.
Amendments to IAS 16 Property, Plant and Equipment: Proceeds before Intended Use
Effective Jan. 1, 2021, the Company early adopted amendments to IAS 16 Property, plant and equipment (“IAS 16 Amendments”) in advance of its mandatory effective date of Jan. 1, 2022. The Company adopted the IAS 16 Amendments retroactively. No cumulative effect of initially applying the guidance arose. The IAS 16 Amendments prohibit deducting from the cost of an item of property, plant and equipment any proceeds from selling items produced while bringing that asset to the location and condition necessary for it to be capable of operating in a manner intended by management. Instead, an entity recognizes the proceeds from selling such items, and the cost of producing those items, in profit or loss. No adjustments resulted from early adopting the amendments.
IFRS 7 Financial Instruments: Disclosures — Interest Rate Benchmark Reform
The transition of the London Interbank Offered Rates ("LIBOR") has begun with the cessation of the publication of one-week and two-month USD LIBOR occurring on Dec. 31, 2021. The remaining overnight, one-, three-, six-, and 12-month USD LIBOR will continue to be published until their cessation date on June 30, 2023. Existing financial instruments may continue to use USD LIBOR while they are published until they mature, however, new financial instruments will not be using USD LIBOR if entered into after Dec. 31, 2021. The IASB issued Interest Rate Benchmark Reform — Phase 2 in August 2020, which amends IFRS 9 Financial Instruments, IAS 39 Financial instruments: Recognition and Measurement, IFRS 7 Financial Instruments: Disclosures and IFRS 16 Leases. The amendments were effective Jan. 1, 2021, and were adopted by the Company on Jan. 1, 2021. There was no financial impact upon adoption.
The Company's credit facilities references USD LIBOR for US-dollar drawings and the Canadian Dollar Offered Rate for Canadian drawings, and includes appropriate fallback language to replace these benchmark rates if a benchmark transition event were to occur. For the year ended Dec. 31, 2021, there were no drawings under the credit facilities. The Company has interest rate swap agreements in place with a notional amount of US$150 million referencing three-month LIBOR, expected to settle in the third quarter of 2022.
TRANSALTA CORPORATION M64
Management’s Discussion and Analysis
Future Accounting Changes
Amendments to IAS 37 Provisions, Contingent Liabilities and Contingent Assets
On May 14, 2020, the IASB issued Onerous Contracts — Cost of Fulfilling a Contract and amendments to IAS 37 Provisions, Contingent Liabilities and Contingent Assets to specify which costs to include when assessing whether a contract will be loss-making. The amendments are effective for annual periods beginning on or after Jan. 1, 2022, and will be adopted by the Company in 2022. The amendments are effective for contracts for which an entity has not yet fulfilled all its obligations on or after the effective date. No financial impact is expected upon adoption.
Amendments to IAS 12 Deferred Tax Related to Assets and Liabilities Arising from a Single Transaction
On May 7, 2021, the IASB issued amendments to IAS 12 Deferred Tax Related to Assets and Liabilities Arising from a Single Transaction. The amendments clarify that the initial recognition exemption under IAS 12 does not apply to transactions such as leases and decommissioning obligations. These transactions give rise to equal and offsetting temporary differences in which deferred tax should be recognized.
The amendments are effective for annual periods beginning on or after Jan. 1, 2023, with early application permitted. The Company's current position aligns with the amendment and no financial impact is therefore expected upon adoption on the effective date.
Amendments to IAS 1 Classification of Liabilities as Current or Non‐Current
In January 2020, the IASB issued amendments to IAS 1 Presentation of Financial Statements, to provide a more general approach to the presentation of liabilities as current or non‐current based on contractual arrangements in place at the reporting date. These amendments specify that the rights and conditions existing at the end of the reporting period are relevant in determining whether the Company has a right to defer settlement of a liability by at least 12 months, provide that management's expectations are not a relevant consideration as to whether the Company will exercise its rights to defer settlement of a liability and clarify when a liability is considered settled.
The amendments are effective for annual periods beginning on or after Jan. 1, 2023, and are to be applied retrospectively. The Company has not yet determined the impact of these amendments on its consolidated financial statements.
Comparative Figures
Certain comparative figures have been reclassified to conform to the current period’s presentation. These reclassifications did not impact previously reported net earnings.
TRANSALTA CORPORATION M65
Management’s Discussion and Analysis
Environmental, Social and Governance (“ESG”)
Sustainability or ESG management and performance is a priority at TransAlta. Sustainability is one of our core values, which means it is part of our corporate culture. We perpetually strive to further integrate sustainability into our governance, decision-making, risk management and day-to-day business processes, while enabling our growth strategy. The ultimate outcome of our sustainability focus is continuous improvement on key, material ESG issues and ensuring our economic value creation is balanced with a value proposition for the environment and our stakeholders.
Our key strategic sustainability pillars build on our corporate strategy and weave through our business. Our track record in these areas illustrates our commitment to sustainability (including climate change leadership and safety). In other areas where we have set new goals in recent years (including ED&I), we believe the focus will only strengthen our corporate strategy and support value creation into the future. Our pillars include:
1.Clean, Reliable and Sustainable Electricity Production
2.Safe, Healthy, Diverse and Engaged Workplace
3.Positive Indigenous, Stakeholder and Customer Relationships
4.Progressive Environmental Stewardship
5.Technology and Innovation
We have been reporting on sustainability since 1994. This year, we have structured the ESG section of this MD&A to help stakeholders better understand the most material issues affecting our ESG performance.
Reporting on Our Material Sustainability Factors
TransAlta’s ESG content is integrated within this MD&A to provide information on how ESG affects our business (including material focus areas) and is guided by leading ESG reporting frameworks. Content is structured using non-traditional capital (this includes natural, human, social and relationship, intellectual and manufactured capital) as per guidance from the International Integrated Reporting Framework.
Climate-related data to be disclosed is informed by climate change questionnaires from CDP (the global disclosure system for environmental impacts known formerly as Carbon Disclosure Project) and the Task Force on Climate-related Financial Disclosures ("TCFD") recommendations. In 2021, we conducted a climate-related scenario analysis that enhanced our alignment with both international sustainability frameworks. GHG emissions data for scopes 1 and 2 follow the accounting and reporting standards of the GHG Protocol. For further information on climate change management and the findings of our scenario analysis, please refer to the Decarbonizing Our Energy Mix section of this MD&A.
We adopt guidance from the Global Reporting Initiative and Sustainability Accounting Standards Board ("SASB") requirements for 'Electric Utilities and Power Generators'. We continue to monitor the development of sustainability disclosure standards to assess our future reporting, such as the International Sustainability Standards Board and the Taskforce on Nature-related Financial Disclosures.
The disclosure of our most relevant sustainability factors is guided by our sustainability materiality assessment. Our materiality assessment is developed through evaluation of key sector-specific research on material issues and supported by internal and external engagement on key sustainability issues. Our Enterprise Risk Management ("ERM") program is designed to help the organization focus its efforts on key enterprise risks, within the planning horizon, that could significantly impact the success of its strategy, including its sustainability objectives. We consider a sustainability factor as material if it could substantively affect our ability to create value. Our major environmental risk factors include climate change, weather, environmental disasters, exposure to the elements, environmental compliance risk and current and emerging environmental regulation. Our major social risk factors include Indigenous and stakeholder relationships, local communities, public health and safety, employee and contractor health and safety, employee retention, supply chain and cybersecurity. For further guidance on our risk factors, please refer to the Governance and Risk Management section of this MD&A.
TRANSALTA CORPORATION M66
Management’s Discussion and Analysis
Transforming Our Business Model to Become Carbon Neutral by 2050
At TransAlta, our mission is to provide safe, low-cost and reliable clean electricity to our customers. As a customer-centred clean energy leader, we are well positioned to support our customers' ESG and sustainability goals. To achieve this goal, in today's evolving economy and increasingly electrified world, our strategy focuses on renewable electricity growth and a deep commitment to sustainability. We believe we are uniquely positioned as the world continues to electrify and adopt sustainability practices. For further information, please refer to the Description of the Business section of this MD&A.
Our President and Chief Executive Officer, John Kousinioris, speaks about our decarbonization journey in the sections below.
How is TransAlta’s strategy contributing to energy transition?
“In our sector, there is a lot of agreement about what is required to achieve a low-carbon energy transition. First, we need to transition away from high-emitting coal generation. As of the end of 2021, TransAlta has completed this transition in Canada and we will retire our single remaining coal unit in the US at the end of 2025. Second, we need to significantly expand the supply of zero-emission renewable electricity. TransAlta already has a leading portfolio of renewable assets and our growth plan will see us expand our wind and solar business by 2 GW over the next five years. Finally, we need to achieve breakthroughs that allow us to harness intermittent renewables to provide reliable electricity for consumers. TransAlta’s WindCharger facility was the first utility-scale battery project linked to a renewables facility in Alberta and our growth plan includes further investments in energy storage. The key elements of TransAlta’s strategy are aligned with the energy transition underway in the global economy.”
How does the company’s strategy align with global climate efforts?
"We are very proud of our emissions track record to date. Our Company has achieved a 29 million tonne annual GHG emission reduction from 2005 levels. This reduction already exceeds the national 2030 emissions targets in Canada, the US and Australia where we operate. In that sense, we are already ahead of the ambitious national efforts in our home markets. That said, we recognize that decarbonizing the electricity sector is a key pillar of global climate efforts because electrification enables emission reductions in other sectors, such as transportation. This means we have to continually raise our level of ambition as we did last year by setting our carbon neutrality target for 2050 and we did this year by enhancing and accelerating our near-term reduction target.
"We are the first publicly traded Canadian energy company to commit to setting a science-based emissions target. This step is critical in ensuring that our actions are aligned with the steps required to achieve global climate goals. Further, we were pleased to join the Powering Past Coal Alliance during the 26th UN Climate Change Conference of the Parties ("COP26") in Glasgow. The Alliance is a group of governments and companies committed to achieving one of the key steps in the global energy transition."
TransAlta accelerated and strengthened its GHG emissions reduction target. Why did the Company choose to take that step?
"Our new target is a function of our new growth strategy. Simply put, by focusing on growing our contracted renewables assets we are growing our business and not our emissions. This type of growth, coupled with coal-to-gas conversions that cut emissions from our thermal assets, and efficient on-site cogeneration, creates an emissions pathway for our Company that delivers substantial reductions over the next five years. We believe it is important for the Company to publicly hold itself accountable for delivering these results and ensuring our investors, customers and stakeholders are aware of where we are going in this important effort."
How can TransAlta help customers to decarbonize?
"Most importantly, TransAlta helps our customers by reliably delivering and operating renewable and storage projects and on-site generation that meet their energy needs. Underneath that core commitment is a set of technologies and contracting options that we tailor to ensure customers receive the energy they require, and environmental outcomes aligned with their ESG commitments. In 2021, we were proud to announce a major wind project in Oklahoma which will provide electricity to a leading US-based company, a major wind project in Alberta to provide electricity to Pembina Pipelines as well as a smaller-scale solar and battery project with BHP in Australia. All are examples of a tailored approach designed to meet the unique needs of customers as they advance their own decarbonization goals. In the future, we see more demand for reliable zero-emission electricity and our growth strategy is designed to position the Company to deliver these projects effectively for new and existing partners in all of our markets."
TRANSALTA CORPORATION M67
Management’s Discussion and Analysis
2022+ Sustainability Targets
Our 2022 and longer-term sustainability targets support the long-term success of our business so that the Company will continue to be positioned as an ESG leader in the future. Goals and targets are established to improve our ESG performance and to manage current and emerging material sustainability issues, in support of the United Nations Sustainable Development Goals ("UN SDGs") and the Future-Fit Business Benchmark. TransAlta is committed to decarbonizing our energy generation and to accelerating clean energy growth. We believe we can make a greater positive impact on UN SDG 7 “Affordable and Clean Energy” and SDG 13 “Climate Action”, while supporting several other SDGs.
In December 2021, TransAlta approved a more stringent climate-related target to reduce 75 per cent of our scope 1 and 2 GHG emissions by 2026 from a 2015 base year. We estimate that this is in line with limiting global warming to 1.5°C and, in December 2021, committed to setting a science-based emissions reduction target through the Science Based Targets initiative. In 2021, the Company established a Sustainability-Linked Loan that will align the cost of borrowing to TransAlta's GHG emission reductions and gender diversity targets. For further details on the Sustainability-Linked Loan, please refer to the Significant and Subsequent Events section of this MD&A. In 2021, the Company's indirect wholly owned subsidiary, Windrise Wind LP, secured green bond financing. This supports our goal to deliver on our customers’ needs for clean electricity. Please refer to the TransAlta Renewables Acquisitions section of this MD&A for further details.
Targets are outlined below:
| | | | | | | | | | | | | | |
| ESG Alignment: Environment |
| TransAlta Sustainability Goal | | TransAlta Sustainability Target | | Alignment with UN SDG Target or Future-Fit Business Benchmark |
| Reclaim land utilized for mining | | By 2040, complete full reclamation of our Centralia coal mine in Washington State | | Future-Fit Business Benchmark: "Positive Pursuits 13: Ecosystems are restored" |
| By 2046, complete full reclamation of our Highvale coal mine in Alberta | | Future-Fit Business Benchmark: "Positive Pursuits 13: Ecosystems are restored" |
| Responsible water management | | By 2026, reduce fleet-wide water consumption (withdrawals minus discharge) by 20 million m3 or 40 per cent over the 2015 baseline | | UN SDG Target 6.4: "By 2030, substantially increase water-use efficiency across all sectors and ensure sustainable withdrawals and supply of freshwater to address water scarcity and substantially reduce the number of people suffering from water scarcity." |
| Reduce operational waste | | By 2022, reduce total waste generation by 80 per cent over a 2019 baseline | | UN SDG Target 12.5: "By 2030, substantially reduce waste generation through prevention, reduction, recycling and reuse." |
| Reduce air emissions | | By 2026, achieve a 95 per cent reduction of SO2 emissions and an 80 per cent reduction of NOx emissions below 2005 levels | | UN SDG Target 9.4: "By 2030, upgrade infrastructure and retrofit industries to make them sustainable, with increased resource-use efficiency and greater adoption of clean and environmentally sound technologies and industrial processes" |
| Reduce GHG emissions | | By 2026, achieve a 75 per cent reduction of scope 1 and 2 GHG emissions from a 2015 base year | | UN SDG Target 13.2: "Integrate climate change measures into national policies, strategies and planning."
|
| By 2050, achieve carbon neutrality | |
| | | | |
| | | | |
TRANSALTA CORPORATION M68
Management’s Discussion and Analysis
| | | | | | | | | | | | | | |
| ESG Alignment: Social |
| TransAlta Sustainability Goal | | TransAlta Sustainability Target | | Alignment with UN SDG Target or Future-Fit Target |
| Reduce safety incidents | | Achieve a Total Recordable Injury Frequency rate below 0.61 | | UN SDG Target 8.8: "Protect labour rights and promote safe and secure working environments for all workers, including migrant workers, in particular women migrants, and those in precarious employment." |
| Support prosperous Indigenous communities | | Support equal access to all levels of education for youth and Indigenous peoples through financial support and employment opportunities | | UN SDG Target 4.5: "By 2030, eliminate gender disparities in education and ensure equal access to all levels of education and vocational training for the vulnerable, including persons with disabilities, Indigenous peoples and children in vulnerable situations." |
| Provide Indigenous cultural awareness training to all TransAlta employees by the end of 2023 | | UN SDG Target 12.8: "By 2030, ensure that people everywhere have the relevant information and awareness for sustainable development and lifestyles in harmony with nature." |
| ESG Alignment: Governance |
| TransAlta Sustainability Goal | | TransAlta Sustainability Target | | Alignment with UN SDG Target or Future-Fit Target |
| Strengthen gender equality | | Achieve 50 per cent female representation on the Board by 2030 | | UN SDG Target 5.5: "Ensure women’s full and effective participation and equal opportunities for leadership at all levels of decision making in political, economic and public life." |
| Achieve at least 40 per cent female employment among all employees of the Company by 2030 | |
| Maintain equal pay for women in equivalent roles as men | |
| Demonstrate leadership on ESG reporting within financial disclosures | | Maintain our position as a leader on integrated ESG disclosure through increased annual alignment with leading sustainability disclosure frameworks | | UN SDG Target 12.6: "Encourage companies, especially large and transnational companies, to adopt sustainable practices and to integrate sustainability information into their reporting cycle." |
| ESG Alignment: Environment and Social |
| TransAlta Sustainability Goal | | TransAlta Sustainability Target | | Alignment with UN SDG Target or Future-Fit Target |
| Coal transition | | No further coal generation by the end of 2025 with 100 per cent of our owned net generation capacity to be from renewables and gas | | UN SDG Target 7.1: "By 2030, ensure universal access to affordable, reliable and modern energy services." |
| Clean energy solutions for customers | | Develop new renewable projects that support customer sustainability goals to achieve both long-term power price affordability and carbon reductions | | UN SDG Target 7.2: "By 2030, increase substantially the share of renewable energy in the global energy mix." |
TRANSALTA CORPORATION M69
Management’s Discussion and Analysis
Our 2021 Sustainability Performance
In 2021, we achieved an environmental performance milestone in our journey to grow our clean electricity fleet with the completion of our coal-to-gas conversions in Canada. Overall, the converted units generate nearly 50 per cent fewer CO2 emissions fuelled by natural gas compared to coal. The completed unit conversions and the end of production at the Highvale coal mine in Alberta also contributed to the goals of the Powering Past Coal Alliance, which TransAlta joined at COP26. Our social performance was highlighted by our positive contribution to support equal access to all levels of education for youth and Indigenous peoples through financial support and employment opportunities.
Performance against our 2021 sustainability targets is outlined below:
| | | | | | | | | | | |
| ESG Alignment: Environment |
| TransAlta Sustainability Goal | TransAlta Sustainability Target | Results | Comments |
| Reclaim land utilized for mining | By 2040, complete full reclamation of our Centralia coal mine in Washington State | On track | Reclamation work at our Centralia and Highvale mines has been executed progressively. |
| By 2046, complete full reclamation of our Highvale coal mine in Alberta | On track | Our Highvale coal mine in Alberta retired on Dec. 31 2021, and reclamation has been executed progressively. |
| Responsible water management | By 2026, reduce fleet-wide water consumption (withdrawals minus discharge) by 20 million m3 or 40 per cent over a 2015 baseline | On track | In 2021, we reduced fleet-wide water consumption by 4 million m3 or 11 per cent over 2020 levels. |
| Reduce operational waste | By 2022, reduce total waste generation by 80 per cent over a 2019 baseline | On track | In 2021, we reduced total waste generation by 620,000 tonnes equivalent or 55 per cent over 2020 levels. |
| Reduce air emissions | By 2026, achieve a 95 per cent reduction of SO2 emissions and an 80 per cent reduction of NOx emissions below 2005 levels | On track | Since 2005, we have reduced SO2 emissions by 90 per cent and NOx emissions by 77 per cent. In 2021, we reduced SO2 emissions by 42 per cent and NOx emissions by 29 per cent over 2020 levels. |
| Reduce GHG emissions | By 2030, achieve company-wide GHG reductions of 60 per cent below 2015 levels, in line with a commitment to the UN SDGs and prevention of 2ºC of global warming | Achieved | Since 2015, we have reduced GHG emissions by 61 per cent. In 2021, we reduced approximately 3.9 million tonnes of CO2e or 24 per cent over 2020 levels. |
| By 2050, achieve carbon neutrality | On track | Since 2015, we have reduced GHG emissions by 61 per cent. In 2021, we reduced approximately 3.9 million tonnes of CO2e or 24 per cent over 2020 levels. |
| ESG Alignment: Social |
| TransAlta Sustainability Goal | TransAlta Sustainability Target | Results | Comments |
| Reduce safety incidents | Achieve a Total Recordable Injury Frequency rate below 0.61 | Not achieved | TRIF performance year over year has remained relatively unchanged. In 2021, we achieved a TRIF of 0.82 compared to 0.81 in 2020. Our focus on safety culture transformation remains as we continue to work to meet and exceed our goal of 0.61 in the future. |
| Support prosperous Indigenous communities | Support equal access to all levels of education for youth and Indigenous peoples through financial support and employment opportunities | Achieved | Support in 2021 represented a total value of $375,000 and provided 14 bursaries through a partnership with Indspire; funded academic upgrading programs through the Southern Alberta Institute of Technology; and maintained communication on employment opportunities through various mediums to support different access options for Indigenous communities. |
| Provide Indigenous cultural awareness training to all TransAlta employees by the end of 2023. | On track | In 2021, we committed to and began development of Indigenous Awareness training that will be provided to all Canadian, Australian and US employees by the end of 2023. |
| | | |
TRANSALTA CORPORATION M70
Management’s Discussion and Analysis
| | | | | | | | | | | |
| ESG Alignment: Governance |
| TransAlta Sustainability Goal | TransAlta Sustainability Target | Results | Comments |
| Strengthen gender equality | Achieve 50 per cent female representation on the Board by 2030 | On track | As of Dec. 31, 2021, women made up 42 per cent of our total Board composition compared to 45 per cent in 2020, due to the retirement of one female Board member. In 2021, we achieved 50 per cent female representation on the Board, excluding the two nominees from Brookfield. |
| Achieve at least 40 per cent female employment among all employees of the Company by 2030 | On track | As of Dec. 31, 2021, women made up 24 per cent of all employees, an increase over 2020 levels (21 per cent). |
| Maintain equal pay for women in equivalent roles as men | Achieved | Equal pay for women in the Company was maintained in 2021. |
| Demonstrate leadership on ESG reporting within financial disclosures | Maintain our position as a leader on integrated ESG disclosure through increased annual alignment with leading sustainability disclosure frameworks | Achieved | In 2021, we conducted a climate-related scenario analysis that enhanced our alignment with TCFD and CDP (the global disclosure system for environmental impacts known formerly as Carbon Disclosure Project). |
| ESG Alignment: Environment and Social |
| TransAlta Sustainability Goal | TransAlta Sustainability Target | Results | Comments |
| Leading clean power company by 2025 | No further coal generation by the end of 2025 with 100 per cent of our owned net generation capacity to be from clean electricity (renewables and gas) | On track | In 2021, Sundance Unit 5 was retired, and Keephills Unit 2, Keephills Unit 3 and Sundance Unit 6 were converted to natural gas. The Highvale coal mine was closed. Centralia Unit 1 retired on Dec. 31, 2020, and the remaining unit is set to retire on Dec. 31, 2025. |
| Discontinue coal power generation in Canada by the end of 2021 | Achieved | In 2021, our Sundance 5 facility was retired, and Keephills Unit 2, Keephills Unit 3 and Sundance 6 facilities were converted to natural gas. The Highvale coal mine was closed. |
| Clean energy solutions for customers | Develop new renewable projects that support customer sustainability goals to achieve both long-term power price affordability and carbon reductions | Achieved | In 2021, the Company purchased a 122 MW portfolio of operating solar facilities in North Carolina and started the construction of a 48 MW solar and battery storage system in Western Australia. We also entered into long-term PPAs for the off take of 100 MW from our Garden Plain wind project in Alberta and 100 per cent of our 300 MW White Rock East and White Rock West wind projects in Oklahoma. |
TRANSALTA CORPORATION M71
Management’s Discussion and Analysis
Decarbonizing Our Energy Mix
ESG is more than simply a business strategy at TransAlta; it is a competitive advantage. Sustainability is one of our core values; therefore, we strive to integrate climate change into governance, decision-making, risk management and our day-to-day business operations. The outcome of our climate change focus is continuous improvement on key climate-related issues and ensuring our economic value creation is balanced with a value proposition for the environment and people.
We recognize the impact of climate change on society and our business both today and into the future. Our renewable energy commitment began more than one hundred years ago when we built the first hydro assets in Alberta, which still operate today. In 2002, we acquired our first wind farm, in 2015, our first solar farm, and in 2020, our first battery storage facility. Today, we operate over 50 renewable facilities across Canada, the US and Australia.
Our climate-change-related reporting is guided by the TCFD. This framework helps inform discussion and provide context on how climate change affects our business.
The following are examples of how we have transitioned our business to manage climate change risk and opportunity, how we have demonstrated leadership through action on climate change-related issues and how we are positioned for climate resiliency.
▪Today, we are proud to be one of the largest producers of wind power in Canada and the largest producer of hydro power in Alberta — we have grown our nameplate renewable energy capacity from approximately 900 MW in 2000 to over 2,800 MW in 2021.
▪Our business demonstrates climate change resiliency by reducing GHG emissions – we have a target to reduce annual CO2e emission by 75 per cent over 2015 levels by 2026. Since 2015, we have reduced our annual emissions by 19.7 million tonnes of CO2e or 61 per cent, putting us on track to achieve our 2026 target.
▪As a leader in North American renewable electricity, we are well-positioned to build renewable energy facilities and hybrid facilities to support customer decarbonization goals. Our strategy involves retiring our single coal unit by the end of 2025 and achieving a 100 per cent mix of renewables and natural gas with 70 per cent of EBITDA from renewables.
Climate Change Governance
Climate-related risks and opportunities can significantly impact our business, especially regulatory changes and shifting customer preferences toward lower-carbon energy. Therefore, we actively manage risks and opportunities so that we can continue to grow and achieve our goals. Climate-related issues are identified at every level of management, including the Board, executive team, business units and corporate functions (for example, government relations, regulatory, emissions trading, sustainability, commercial, customer relations, investor relations). Ensuring climate-related issues are acknowledged and addressed at the most senior levels of the Company (including at the Board and executive level) has allowed us to establish actionable emission reduction targets and grow our generation capacity through renewable energy and storage.
Oversight by the Board of Directors
The highest level of climate change oversight is at the Board level, with specific oversight of certain aspects of the Company's response to climate change being delegated to our Governance, Safety and Sustainability Committee (“GSSC”), our Audit, Finance and Risk Committee ("AFRC"), and our Investment Performance Committee (“IPC”).
Meeting quarterly, the GSSC assists the Board in monitoring and assessing compliance with climate change regulation and reporting. The GSSC receives management reports on changes in climate-related legislation and the potential impact of policy developments on TransAlta's operations. The GSSC then supports the Board in developing Company-wide climate change strategies, policies and practices. The GSSC also reviews environmental protection guidelines, including GHG mitigation, and considers whether our environmental procedures are being effectively implemented.
The AFRC and IPC also play a role in managing TransAlta's climate-related risks and opportunities. The AFRC assists the Board in overseeing the integrity of our consolidated financial statements and ensures climate risks and opportunities are factored into financial decision-making. Further, the AFRC is responsible for approving our Commodity and Financial Exposure Management policies and reviewing quarterly ERM reporting. The IPC considers and assesses risks related to capital projects, including overseeing climate risk assessments and mitigation plans. As a result, climate-related capital expenditures, acquisitions and budgets are reviewed by the AFRC and IPC on a case-by-case basis.
Our Board is composed of individuals with a mix of skills, knowledge and experience critical to our strategy success and business growth. Notably, five of our Board members have identified environment/climate change among their top four relevant competencies.
TRANSALTA CORPORATION M72
Management’s Discussion and Analysis
Role of Senior Management
TransAlta’s President and CEO maintains the highest level of oversight on climate-related issues at the executive level. Our business units and corporate functions work closely together to support the executive team in understanding climate-related risks and opportunities. Our executive team reviews risks and opportunities quarterly and reports to the GSSC and AFRC.
At the business unit level, climate change risks are identified through our Total Safety Management System, asset management function and systems, energy and trading business, communication with stakeholders, active monitoring and participation in working groups.
Notably, we tie a component of executive compensation to reducing GHG emissions and climate change management. We link our corporate executive annual incentive plans (short-term incentive or yearly bonus and long-term share incentives) to performance on our strategic goals. Our strategic goals include growing renewable energy, reducing GHG emissions, and supporting our customers' sustainability goals to decarbonize through on-site low carbon energy generation.
For further information on incentives for ESG performance, please refer to the ESG-Linked Compensation in Building a Diverse and Inclusive Workforce section of this MD&A.
Strategy and Risk Management
Climate Change Strategy
As described in the following sections, our risks and opportunities assessment and climate scenarios analysis support the development and continuous improvement of our climate change strategy. We actively monitor and manage climate-related risks and opportunities as part of our overall business strategy to ensure we remain resilient across all scenarios.
TransAlta remains committed to creating a path to resiliency in a decarbonizing world so that we support the goals proposed under the Paris Agreement and those solidified during successive meetings, such as COP26. Our strategy is focused on the operation of our existing assets (wind, hydro, solar, gas, storage and coal), the phase-out of coal-fired electricity generation and the development of renewable energy and storage projects. Our customers are increasingly integrating ESG risk into their business decisions; therefore, we see an advantage in growing our clean power business to support our customers' sustainability goals. Our investments and growth in renewable energy are highlighted by our portfolio of renewable energy-generating assets. From 2000 to 2021, we grew our nameplate renewables capacity from approximately 900 MW to over 2,800 MW. Today, our diversified renewable fleet makes us one of the largest renewable power producers in North America, one of the largest producers of wind power in Canada and the largest producer of hydro power in Alberta.
Another way we contribute to our customers’ sustainability goals is through environmental attributes. The environmental attributes we generate include carbon offsets, renewable energy credits and emission offsets. Our customers can use environmental attributes to lower compliance costs attributed to carbon policies or renewable portfolio standards. Further, environmental attributes can help achieve voluntary corporate sustainability or carbon reduction goals.
To combat the challenges of renewable energy intermittency, we continue to invest in battery storage. In 2020, we launched WindCharger, a "first of its kind" battery storage project in Alberta that stores energy produced by our Summerview II wind facility and discharges electricity onto the Alberta grid during system supply shortages. Further, in 2021, we agreed to provide renewable solar electricity supported with a battery energy storage system to BHP through the construction of the Northern Goldfields Solar Project in Western Australia. This project will support BHP in meeting its emissions reduction targets and delivering lower carbon, sustainable nickel to its customers. With a target operation date in early 2023, the Northern Goldfields Solar Project is expected to reduce BHP's scope 2 electricity GHG emissions by 540,000 tonnes of CO2e over the first 10 years of operation.
TRANSALTA CORPORATION M73
Management’s Discussion and Analysis
In support of our own path to climate resiliency, we have taken significant steps to reduce our carbon footprint over the last several years. In 2021, we adopted a more stringent climate-related target to reduce 75 per cent of our scope 1 and 2 GHG emissions by 2026 from a 2015 base year. TransAlta estimates that this is in line with limiting global warming to 1.5°C and, in 2021, committed to setting a science-based emissions reduction target through the Science Based Targets initiative. In addition, we have a target to be carbon neutral by 2050, while growing renewable energy and optimizing natural gas. We are also taking strategic steps to decarbonize the power sector and support the energy transition. In 2021, we completed our conversion of existing Canadian coal assets to natural gas, achieving our goal of transitioning off coal in Canada. In 2021, we also announced our Clean Electricity Growth Plan which will see the Company execute on 2 GW of renewables growth by 2025. In 2025 we will also retire our single remaining coal unit, located in the United States, to complete TransAlta's transition away from coal generation.
To date, we have retired 4,064 MW of coal-fired generation capacity since 2018 while converting 1,659 MW to natural gas. Overall, our converted natural gas units generate nearly 50 per cent fewer CO2 emissions compared to coal. Repurposing the facilities rather than decommissioning them reduces the cost and emissions associated with new construction and aligns with the UN SDGs, specifically "Goal 9: Industry, Innovation and Infrastructure." The completed conversions and the closure of the Highvale coal mine also contributes to the goals of the Powering Past Coal Alliance, which TransAlta joined in November 2021 at COP26.
We actively engage policymakers and stakeholders on how to facilitate a transition where the electricity systems we serve can reach net-zero emissions while maintaining reliability. We will continue investing in renewables and assessing the best options to deliver energy storage, including incorporating learnings from our industrial-scale battery into our Company strategy and sharing those learnings with government. At the same time, natural gas will play an essential role in the electricity sector, providing baseload generation to support current system demands and a smooth energy transition. We always seek energy-efficiency improvements and opportunities to achieve emissions reductions at competitive costs. Further, we are committed to investing in climate change mitigation solutions to maximize value for our shareholders, customers, local communities and the environment.
TRANSALTA CORPORATION M74
Management’s Discussion and Analysis
Climate Scenarios
In 2021, we conducted climate scenario analysis to understand risks and opportunities and assess our strategy's resiliency under several future climate scenarios. The analysis utilized scenarios from the International Energy Agency’s ("IEA") 2020 World Energy Outlook, a large-scale simulation model designed to replicate how energy markets function. We used three scenarios, Stated Policies (“STEPS”), Sustainable Development (“SDS”) and Net Zero Emissions by 2050 (“NZE”).
In STEPS, the energy system has no major additional climate and environmental policies enacted by government(s). STEPS assumes that carbon pricing continues in Canada while no carbon price is set in the US or Australia. STEPS also assumes that the power sector reduces emissions by 45 per cent by 2040 while natural gas generation capacity increases. Finally, STEPS is limited to the deployment of commercial-ready technologies, including wind and solar.
In SDS, the goals of the Paris Agreement (2015) are achieved, resulting in net-zero emissions by 2070. The SDS assumes a rapid increase in clean energy policies and investments that position the energy system to also achieve key UN SDGs. In SDS, all current net-zero pledges are achieved, and there are extensive efforts to reduce emissions. SDS assumes that carbon pricing continues in Canada and is set in the US and Australia. It also assumes that the power sector reduces emissions by 90 per cent by 2040 while natural gas capacity remains stable into 2030 and declines toward 2040. Finally, SDS assumes that beyond wind and solar, the energy system relies on batteries, storage and some level of carbon capture, utilization and storage (“CCUS”) and hydrogen.
NZE represents a pathway for the global energy sector to achieve net-zero emissions by 2050. This scenario also assumes key energy-related SDGs are achieved through universal energy access by 2030 and major improvements in air quality. NZE is built upon the idea that a global increase in electrification supports the journey to net-zero. It assumes that an aggressive carbon price is set in Canada, the US and Australia. It also assumes the power sector reaches net-zero emissions by 2035 in advanced economies while natural gas capacity is stable to 2030 and declines significantly into 2040. Like the SDS, NZE assumes that beyond wind and solar, the energy system relies on batteries, storage and some level of CCUS and hydrogen.
TRANSALTA CORPORATION M75
Management’s Discussion and Analysis
Key Climate Scenario Findings
Using climate scenarios, we analyzed the resiliency of our business and determined specific risks and opportunities for our individual assets. All three scenarios present opportunities for TransAlta’s growth related to renewables, storage solutions and ancillary services. The scenario analysis found that our wind and solar assets have the highest prospects for growth, which aligns with our growth strategy. Under all scenarios, hydro remains a valuable asset as it allows for expansion to include storage.
The figures in the following sections highlight TransAlta's top risks, opportunities and management response across all scenarios.
| | | | | | | | | | | | | | | | | | | | |
| Top Identified Climate-Related Risks by Scenario |
| | Increased competition | | Decreased demand of natural gas electricity | | Increased operational costs |
| Description | | Subsidies/funds available for clean energy transition increase as governments aim to grow installed capacity of renewables to meet rising electricity demand and compensate for the closure of carbon-intensive power plants. It is expected that major grid decarbonization investments will flow into Alberta as many other markets where TransAlta operates are heavily regulated and/or are already low carbon. This will increase competition in the merchant market, making a large part of the generating fleet frequently bid at zero, driving down the average price of dispatched electricity. Simultaneously the cost of renewables, expected to decline across all scenarios, decreases the capital barrier to entry. These combined factors will increase competition for TransAlta. The IEA scenarios do not provide clear indication of electricity pricing and how it can be affected by increased competition. As such, this remains a point of uncertainty. Some structural market changes may be required to guarantee returns for power generators and successfully decarbonize the grid. | | Demand of power from natural gas declines as the market shifts towards cleaner power. An additional decline from Canadian oil & gas customers can occur as oil production levels drop under NZE and SDS. The transition to a lower-carbon world will likely result in volatility and market uncertainty. Counterintuitively, natural gas power may be necessary to provide power in the transition if the pace of decarbonization is slower than expected in the scenarios or if grid-scale storage solutions do not develop/commercialize as modelled. In these cases, with coal phased out, natural gas assets will be relied on for baseload generation. This means that natural gas assets may still play a role for a smooth and efficient energy transition. Optimization of natural gas assets is required, and additional investments need to be assessed with caution to consider the pace of decarbonization and consequent risk of decreased demand for natural gas power. | | Carbon price increases the cost of natural gas operations. Additional mandated emission reductions could force remaining plants to invest in technologies like CCUS, increasing the operating costs for natural gas plants further. Natural gas assets in the US and Australia face less risk compared to assets in Alberta as they are contracted and can pass down carbon costs to their clients. Current and anticipated regional carbon pricing monitoring is required to plan and assess increases in operational costs and impacts on new projects and investments. |
| NZE | | By 2040, renewables are expected to comprise over 85 per cent of the total electricity generations in the regions we operate. This surge in renewables will increase competition and drive electricity pricing down. The change in electricity prices and increased market uncertainty are expected to impact our profits. | | The share of natural gas electricity generation is expected to decline over 50 per cent in the regions where we operate by 2040 compared to 2019 levels. This lower demand for natural gas power is expected to impact our natural gas assets if no management responses are implemented. | | Higher operational costs driven by an increase in carbon price to US$205/tonne CO2e by 2040 in all our operating regions (advanced economies under IEA scenarios) and lower operational capacity is expected to impact the profits from our natural gas assets. |
TRANSALTA CORPORATION M76
Management’s Discussion and Analysis
| | | | | | | | | | | | | | | | | | | | |
| Top Identified Climate-Related Risks by Scenario |
| | Increased competition | | Decreased demand of natural gas electricity | | Increased operational costs |
SDS
| | Fewer subsidies/funds are expected under this scenario compared to NZE. However, renewable costs will still decline approximately 10 per cent in wind and 55 per cent in solar by 2040 compared to 2019 levels. This decline with some level of subsidy will increase competition and potentially decrease electricity prices, which is expected to impact our profits. | | Natural gas electricity generation still falls over 50 per cent in North America while remaining flat in Australia by 2040 when compared to 2019 levels. Demand for natural gas power is expected to decrease at slower pace than under NZE. This could potentially impact our natural gas assets if no management responses are implemented. | | Increase in operational costs would happen at a slower rate compared to NZE but carbon costs are still expected to reach US$140/tonne CO2e by 2040 in all of our operating regions. This could potentially impact the operational capacity and profits from our natural gas assets, depending on the ability to pass carbon prices on through our contracts. |
STEPS
| | While minimal subsidies are expected and the cost of entry will not decline at the same rate as SDS or NZE, renewable costs are still expected to decline approximately 8 per cent in wind and 45 per cent in solar by 2040 compared to 2019 levels. This will still cause an increase in competition that is expected to be offset by additional electricity demand and therefore it is not expected to impact our profits. | | Natural gas electricity generation is expected to increase over 15 per cent in the regions we operate by 2040 compared to 2019 levels. These changes are not expected to affect our natural gas assets. | | Operational costs are not expected to significantly increase under this scenario as only Canada sees a carbon price in 2040. Therefore, profits from our natural gas assets are not expected to be affected. |
| Management Response | | Navigating the uncertainty around market dynamics (structure, pricing and competition), government policies and planning is critical for TransAlta. We use hedging and PPAs to stabilize pricing and are planning on leading clean energy growth where we operate. See more details of our strategy and risk management under the Climate Strategy section and Managing Climate Change Risks and Opportunities section of this MD&A. | | Optimize gas assets to maximize value and cash flows to support renewables and storage growth. Our converted natural gas units generate nearly 50 per cent fewer CO2 emissions compared to coal. Repurposing the coal facilities rather than decommissioning them reduces the cost and emissions associated with new construction and aligns with the UN SDGs, specifically "Goal 9: Industry, Innovation and Infrastructure." In parallel, we continue growing our renewable fleet; by 2025 we will have achieved a 100 per cent portfolio mix of renewables and natural gas with 70 per cent of EBITDA attributable to renewables. | | We have taken significant steps to reduce our carbon footprint. In 2021, we achieved a total reduction of 61 per cent compared to our 2015 emission levels. By 2026, we have a commitment to reduce scope 1 and 2 GHG emissions by 75 per cent from a 2015 base year and plan to achieve carbon neutrality by 2050. Further, our corporate functions apply regionally specific carbon pricing, both current and anticipated, as a mechanism to manage future risks of uncertainty in the carbon market. |
TRANSALTA CORPORATION M77
Management’s Discussion and Analysis
| | | | | | | | | | | | | | |
| Top Identified Climate-Related Opportunities by Scenario |
| | Renewables become major energy source | | New technology development |
| Description | | Opportunities to grow the renewable fleet exist across all scenarios. Renewable assets (hydro, wind, solar) are expected to become the default form of generation with demand for power from these type of assets increasing. Hydro is likely to grow in value given increased renewables penetration and the need for reliable zero-emitting generation. This can make hydroelectric power a stronger source of baseload electricity in many regions. The decreasing cost of renewables also facilitates the growth of a renewable fleet, especially under NZE and SDS. | | Opportunities for development of battery or hydroelectric storage systems and ancillary services exist across all scenarios as renewable energy continues to penetrate the grid. Developments in these areas are required to keep electricity flowing when the renewables in a region are not producing. Storage is specially anticipated to play an important role in the energy transition. Cost-competitive battery storage enables greater adoption of renewables. |
| NZE | | A growth of renewable electricity generation of approximately 950 per cent is expected by 2040 compared to 2019 levels. This results in renewables comprising more than 85 per cent of the electricity generation in the regions we operate. The transition of hydro to baseload capacity is expected to create upside for TransAlta. An increase in TransAlta’s renewable capacity and demand are expected to enable growth and higher revenues. | | Increased revenues through access to new and emerging markets are expected to enable growth and higher revenues under NZE. With more than 85 per cent of electricity in areas we operate made up of renewables, there will be big steps forward in storage and ancillary services technologies. Storage capacity is expected to grow to approximately 250 GW in the US by 2040. |
SDS
| | A growth of renewable electricity generation of approximately 550 per cent is expected by 2040 compared to 2019 levels. This results in renewables comprising more than 75 per cent of the electricity generation in the regions where we operate. An increase in TransAlta’s renewable capacity and demand are expected to enable growth and higher revenues. | | Increased revenues through access to new and emerging markets are expected to enable growth and higher revenues under SDS. A lower share of renewables than in NZE will allow swing production to remain present; however, growth in ancillary and storage capacity will still be needed to support the market. Storage capacity is expected to grow to approximately 110 GW in the US by 2040. |
STEPS
| | STEPS growth is muted relative to the other scenarios but still sees a growth of renewables of 280 per cent by 2040 compared to 2019 levels. This growth will allow approximately 50 per cent of electricity generation to come from renewables in areas where we operate by 2040. Increase in TransAlta’s renewable capacity and demand are expected to enable growth and higher revenues. | | Access to new and emerging markets would be limited under this scenario compared to NZE and SDS. While growth in renewables is expected, the need for new technologies is not a necessity in this market and may not be profitable. Therefore, our revenues are not expected to be affected. |
| Management Response | | Our renewable energy commitment began more than 100 years ago when we built the first hydro assets in Alberta, which still operate today. Today we operate over 50 renewable facilities across Canada, the US and Australia. By the end of 2025, we expect 70 per cent of our EBITDA to be derived from renewables. Our strategy is focused on the operation of our existing assets (wind, hydro, solar, gas, storage and coal) and the development of renewable energy, storage and low-carbon natural gas generation. Our investments and growth in renewable energy are highlighted by our portfolio of renewable energy-generating assets. From 2000 to 2021, we grew our nameplate renewables capacity from approximately 900 MW to over 2,800 MW. Today, our diversified renewable fleet makes us one of the largest renewable producers in North America, one of the largest producers of wind power in Canada and the largest producer of hydro power in Alberta. | | To leverage this opportunity and combat the challenges of renewable energy intermittency, we continue to invest in battery storage. In 2020, we launched WindCharger, a "first of its kind" battery storage project that stores energy produced by our Summerview II wind facility and discharges electricity onto the Alberta grid during system supply shortages. Further, in 2021, we agreed to provide renewable solar electricity supported with a battery energy storage system to BHP through the construction of the Northern Goldfields Solar Project in Western Australia. This project will support BHP in meeting its emissions reduction targets and delivering lower carbon, sustainable nickel to its customers. |
TRANSALTA CORPORATION M78
Management’s Discussion and Analysis
NZE: The most significant risks include increased competition, decreased demand for natural gas and increased operational costs due to increased carbon pricing and emission reduction mandates. The most significant opportunities include a shift toward renewables as the default energy source and new technology developments, including battery storage systems and ancillary services. It is worth noting that there are additional risks and opportunities for TransAlta under NZE. For example, changes in how energy market services are offered could positively or negatively impact our business. Further, as carbon credit policies evolve, so will our ability to use credits. Lastly, as renewables become the primary energy source, a rethinking of ancillary services will be necessary but could create significant opportunities for TransAlta.
SDS: The risks and opportunities remain the same under SDS as NZE; however, the impacts are reduced as market changes are slower and less extreme. Renewables still become the primary electricity source, and there are new technology opportunities, particularly in batteries. Natural gas electricity demand still declines by 2040. Carbon pricing exists in the US and Australia, but the price is reduced compared to NZE. Lastly, a reevaluation of ancillary services still presents an opportunity for TransAlta.
STEPS: Under STEPS, renewable generation sees significant growth but does not become the predominant energy source. Implementing new technologies is much slower, and the demand for batteries is reduced. The demand for natural gas electricity does not decline, and there are no large-scale market changes making services, pricing and ancillary services more stable. This removes the risk associated with natural gas electricity demand but eliminates the opportunity for growth in ancillary services. Physical risks become more relevant under this scenario than transitional risks.
To mitigate risks and capitalize on opportunities, we have developed climate signposts to monitor the evolution of future climate scenarios. Signposts are indicators that suggest the likelihood of a particular climate scenario. Examples of signposts include directional change in carbon and oil prices. As demonstrated in the following figure, the findings from the climate scenarios and these signposts work alongside our sustainability metrics and targets to inform the evolution and resiliency of our Company strategy and financial planning, risk management, opportunity assessment and planning for uncertainty.
The figure below shows how we integrate climate into our overall risk management strategy:
TRANSALTA CORPORATION M79
Management’s Discussion and Analysis
Managing Climate Change Risks and Opportunities
We actively monitor and manage climate-related risks through our company-wide enterprise risk management processes. In 2021, we established a formal process to review specific risks using climate scenario analysis. As previously mentioned, climate change risks and opportunities are addressed at each of the Board level, executive and management level, business unit level and through our corporate functions. The business units and corporate functions work closely together and provide information on risks and opportunities to management, the executive team and the Board.
Climate change risks at the asset or business unit level are identified through our Total Safety Management System, asset management function and systems, energy and trading business, communication with stakeholders, active monitoring and participation in working groups. All identified material risks are added to our ERM register and scored based on likelihood and impact. We do not consider risks in isolation, and major risks are the focus of management response and mitigation plans. Further discussion can be found in the Governance and Risk Management section of this MD&A.
We divide our climate change risks into two major categories as per guidance from the TCFD: (i) risks related to the transition to a lower-carbon economy and (ii) risks related to the physical impacts of climate change.
Transition Risks to a Lower Carbon Economy
We actively aim to understand and manage the impact of climate change on our business as the world shifts to a lower-carbon society.
Policy and Legal Risks
Changes in current environmental legislation do have, and will continue to have, an impact upon our operations and our business in Canada, the US and Australia. For a more detailed assessment of policy and regulatory risks please refer to the Governance and Risk Management section of this MD&A.
Canada
The Government of Canada has set out ambitious objectives for carbon emissions reduction, including achieving a 40 to 45 per cent national emissions reduction over 2005 levels by 2030, a net-zero electricity grid by 2035 and a net-zero national economy by 2050. The government plans to rely on several policy tools to achieve its emissions objectives, including carbon pricing, emissions performance regulations, funding for industrial energy transition, a Clean Fuel Regulation and incentives for consumers.
In 2021, a Supreme Court of Canada decision confirmed the federal government has significant authority to set national carbon pricing standards. We anticipate the federal government will use this authority to align provincial carbon pricing systems with national carbon targets. Canada’s provinces have significant jurisdiction over their respective electricity sectors and play an important role in setting carbon pricing policy and emissions performance standards, as well as developing and operating their own funding and incentive programs. Negotiation to align carbon pricing, funding and regulatory standards will likely require significant effort and create the risk of tension and misalignment between federal and provincial governments.
Risks
▪Escalation in carbon prices and emissions performance regulation may impact TransAlta’s natural gas generation fleet in Canada as governments escalate policy stringency to meet 2030, 2035 and 2050 targets.
▪Increased government funding for industrial energy transition may create out of market incentives for competing generation.
▪Regulatory incentives, including emissions reduction crediting, may create out of market incentives for competing generation.
▪Lack of federal/provincial coordination with respect to climate policy and regulation may lead to investment uncertainty.
TRANSALTA CORPORATION M80
Management’s Discussion and Analysis
Opportunities
▪Independent estimates suggest that achieving Canada’s climate targets will require a minimum of twice Canada’s current non-emitting generation. This presents strong policy alignment with TransAlta’s Clean Electricity Growth Plan.
▪Government funding for innovative technology to reduce emissions from the electricity sector offers TransAlta the potential opportunity to gain project support for uneconomic new technologies, which will enable the Company to grow its ESG and policy-aligned generation and energy storage fleet.
▪Government support for industrial electrification and consumer incentives mandates for electrification, such as for the purchase of electric vehicles, will grow the electricity load over time and create new opportunities for contracted clean generation.
Management Response
▪TransAlta’s Clean Electricity Growth Plan will reduce the proportional Company exposure to potential policy and regulatory decisions that negatively impact natural gas generation.
▪Our coal-to-gas facilities fit well within government plans to continue providing reliable and competitively priced electricity for consumers and industry.
▪Our remaining natural gas facilities operate under contract, reducing TransAlta’s exposure to changes in carbon pricing.
▪TransAlta actively engages with the federal and provincial governments in Canada to inform and influence policy development to ensure that our generating fleet continues to serve our customers as the country undertakes a broader energy transition.
▪We actively work, directly and through industry associations, to encourage governments to adopt a level playing field within funding and crediting programs so that all new projects receive equitable governments incentives and funding.
▪TransAlta actively engages with all relevant Canadian governments to seek policy alignment across carbon pricing and regulatory and funding programs to create the greatest possible degree of investment certainty.
United States
The US government has set out ambitious objectives for carbon emissions reduction, including achieving a 50 to 52 per cent national emissions reduction over 2005 levels by 2030, a net-zero electricity grid by 2035 and a net-zero national economy by 2050. The US does not have a national carbon pricing regime but does offer federal incentives for renewable generation, which makes the US policy environment less predictable than in other countries where we operate.
State and regional climate and market policies have a significant impact on the pace of energy transition in the US with many governments operating under renewable portfolio standards and carbon pricing regimes. Similar to Canada, independent estimates suggest that the US will require substantial growth in zero-emissions generation to meet its national climate targets.
Risks
▪TransAlta operates two thermal generating facilities in the US that could be subject to short-term climate policy changes, but our exposure to this policy risk is low (please refer to Management Response below).
▪Given overall political uncertainty, renewable growth projects face elevated uncertainty with respect to long-term federal incentive programs.
Opportunities
▪Achieving US climate goals requires continued growth in zero-emissions electricity generation. TransAlta’s Clean Electricity Growth Plan is focused on providing renewable electricity to contracted customers in a manner aligned with federal and, where applicable, state goals.
▪US tax incentive programs offer significant support for new renewable projects, making the US an attractive growth market.
Management Response
▪TransAlta’s single coal unit in Washington State is subject to a retirement agreement with the state government that exempts the facility from carbon pricing prior to its end of life in 2025. TransAlta’s cogeneration unit at Ada operates under a contract that reduces the Company’s exposure to policy risk.
▪Our Clean Electricity Growth Plan is focused on developing and acquiring contracted assets that provide long-term certainty with respect to revenue and eligibility for government incentive programs. TransAlta actively assesses available government renewable tax legislation and programs to maximize, wherever possible, access to project incentives.
TRANSALTA CORPORATION M81
Management’s Discussion and Analysis
Australia
The Government of Australia has a 26 to 28 per cent national emissions reduction target over 2005 levels by 2030 and a goal to achieve a net-zero national economy by 2050. The government has stated it does not plan to adopt carbon pricing but intends to offer incentives for energy transition. Australian state governments have all adopted net-zero goals and a number of states have interim targets for 2030 and 2040. These state policies are driving demand for zero-emissions electricity and energy storage.
Risks
▪TransAlta’s Australian natural gas assets may face policy risk related to changes in government policies but remain well positioned to mitigate those risks (please refer to Management Response below).
Opportunities
▪Our Clean Electricity Growth Plan is focused on building new, clean generation in Australia and other markets. Government policies and funding programs are generally supportive of the types of projects contemplated within TransAlta’s strategy.
Management Response
▪TransAlta’s assets are predominantly contracted and serve remote industrial load. As a result, the Company faces reduced policy risk.
Technology Risks
Technological changes to support the low-carbon transition present both risks and opportunities for TransAlta. We evaluate existing and emerging impacts of technology through our technologies team and our ERM process. Examples of technology risks and opportunities include infrastructure changes (such as shift to distributed energy and away from large-scale power generation infrastructure assets and projects) and digitization combined with greater adoption of energy efficiency (less use of our end product). Cost-competitive battery storage will enable greater adoption of renewables and a shift to a distributed power generation model. We continue to evaluate battery storage for its financial viability while monitoring the potential impact battery technology could have on natural gas power generation. In 2020, we completed our first battery storage (10 MW) project at one of our wind farms in southern Alberta. In 2021, we agreed to deliver a hybrid system of solar with battery storage (48 MW) in Western Australia. We continue to investigate the possibility of battery storage at our other facility locations. Our teams continuously adopt improved technology at each of our new developments, which helps protect our shareholder value and maintain reliable and affordable electricity delivery.
We are well-positioned to take advantage of technological opportunities in storage through hydro and/or battery power. We are also well-positioned to take advantage of advancements in renewable technologies as we build new facilities. We are actively accelerating our renewable growth strategy, with $3 billion in investment and 2 GW of growth planned by 2025. We will continue monitoring new technologies such as storage, hydrogen and CCUS for future deployment. For further information on technology and innovation, please refer to the Technology Adoption and Innovation Focus section of this MD&A.
Market Risks
Our major market risks are associated with our coal and natural gas assets. Increased costs for natural gas supply due, in part, to carbon pricing changes could impact our operating costs. We actively monitor market risks through our energy marketing and asset optimization teams and our ERM process. We manage the market risks to our coal assets by converting them to natural gas and plan to fully transition off coal by 2025. Further, our corporate functions apply regionally specific carbon pricing, both current and anticipated, as a mechanism to manage future risks of uncertainty in the carbon market. To simultaneously manage our risks and leverage market opportunities, we continue operating our hydro, wind and solar facilities and are investing in expanding our renewable energy fleet.
We currently have over 20 renewable projects that are either under construction or in the development stage. We are committed to growing our clean energy fleet and since 2019 have added over 400 MW of renewables and storage, including utility-scale battery storage. In 2021, we retired or converted 2,260 MW of coal generation. Further, we established approximately 3 GW of wind and solar pipelines and organized Canadian, US and Australian clean energy growth teams. Our renewable fleet makes our overall portfolio more resilient to climate risk, provides increased flexibility in generation and creates incremental environmental value through environmental attributes. Lastly, we recognize the opportunity to grow our ancillary services, such as systems support, providing flexibility to the decarbonizing grid.
TRANSALTA CORPORATION M82
Management’s Discussion and Analysis
Reputation Risks
Negative reputational impacts, including revenue loss and reduced customer base, are evaluated through our ERM process. In the past, we experienced negative reputational impacts due to our coal operations, including a negative impact on the market price of our common shares. Our transition away from coal mitigates this reputational risk. As consumer trends move in favour of renewable and clean electricity, we are investing in a diversified mix of renewable generation and optimizing our natural gas fleet. We continue to actively monitor and manage reputational risks by delivering renewable power solutions while maintaining competitive costs and reliability.
Physical Impact Risks of Climate Change
As we learn more about the physical risks associated with climate change, we continue to consider acute and chronic risks that could significantly impact our operations.
Acute Physical
We have operating assets in three countries and varied geographic locations, many of which could be impacted by extreme weather events. We are thus continuously evaluating the potential impact of acute climate change on our business. Our facilities, construction projects and operations are exposed to potential interruption or loss from environmental disasters (e.g., floods, strong winds, wildfires, ice storms, earthquakes, tornados, cyclones). A significant climate change event could disrupt our ability to produce or sell power for an extended period. Therefore, we strive to mitigate future impacts with climate adaptation solutions.
For example, our gas facility at South Hedland, Australia, is built with climate adaptation in mind. We designed the facility to withstand a category 5 cyclone (the highest cyclone rating). We have mitigated the risk of floods that can occur in the area by constructing the facility above normal flood levels. In 2019, a category 4 cyclone hit this facility but did not impact operations. We were able to continue generating electricity through the storm despite widespread flooding and the shutdown of the nearby port. For further information on weather-related risks, please refer to Weather in the Progressive Environmental Stewardship section of this MD&A.
Chronic Physical
We continuously investigate the physical impacts of chronic climate change on our operating assets and actively integrate climate modelling into our long-term planning. For example, changes to water flow or wind patterns could impact our hydro and wind businesses and associated revenue generation.
Climate Change Metrics and Targets
Metrics and Targets
At TransAlta, climate change management and performance are a top priority. We establish our goals and targets with reference to the UN SDGs and the Future-Fit Business Benchmark. Our sustainability targets support the long-term success of our business. Over time, we have set ourselves apart with actions that demonstrate climate change leadership, including reducing our annual emissions by over 19 million tonnes of CO2e since 2015. We are committed to evolving our leading sustainability target-setting process, ensuring our goals are meaningful and ambitious, and securing TransAlta's competitiveness, both today and in the future.
The following targets outline our pathway to becoming a leader in clean, affordable, and reliable power. We establish goals and targets to manage key and emerging sustainability issues and improve our performance in these areas. We will continue to evolve and adapt our targets to focus on key anticipated climate-related issues.
TRANSALTA CORPORATION M83
Management’s Discussion and Analysis
Progress towards our climate-related targets are presented below:
| | | | | | | | | | | |
| Clean Energy Growth |
| Target | Develop new renewable projects that support our customers' sustainability goals to achieve both long-term power price affordability and carbon reductions | | No further coal generation; 100% of our owned net generation capacity from renewables and gas |
| Year | 2021 | | 2025 |
Progress
(% of target met)
| | | |
| Notes | In 2020, we developed WindCharger, a "first of its kind" battery storage project; in 2021, we agreed to provide renewable solar electricity supported with a battery energy storage system to BHP through the construction of the Northern Goldfields Solar Project in Western Australia. In 2021, we also entered into long-term PPAs for the off take of 100 MW from our Garden Plain wind project in Alberta and 100 per cent of our 300 MW White Rock East and White Rock West wind projects in Oklahoma. | | One of our major strategic goals is to be coal-free in Canada by the end of 2021 with the remaining US unit retiring by 2025. In 2021, we achieved full phase-out of coal in Canada. This means TransAlta’s thermal facilities in Alberta have been fully transitioned to a 100% natural gas operation. The Highvale coal mine was closed. In the US, Centralia Unit 1 retired on Dec. 31, 2020, and the remaining unit is set to retire on Dec. 31, 2025. Thus far, we have retired or converted 90% of our existing coal fleet and will retire the remaining 10% by 2025. |
UN SDG Alignment
| Target 7.2: "By 2030, increase substantially the share of renewable energy in the global energy mix." | | Target 7.1: "By 2030, ensure universal access to affordable, reliable and modern energy services.” |
| | | | | | | | | | | |
| Emissions Reduction |
| Target | By 2026, achieve a 75 per cent reduction of scope 1 and 2 GHG emissions from a 2015 base year. | | Achieve carbon neutrality |
| Year | 2026 | | 2050 |
Progress
(% of target met)
| | | |
| Notes | We are well on track to achieve our target of 75 per cent GHG emissions reductions by 2026. We estimate that this is in line with limiting global warming to 1.5°C and, in 2021, committed to setting a science-based emissions reduction target through the Science Based Targets initiative. Since 2015, we have reduced our annual GHG emission by approximately 19.7 million tonnes CO2e or 61%. In 2021, we reduced approximately 3.9 million tonnes of CO2e over 2020 levels. | | In 2021, we adopted a target to be carbon neutral by 2050. We believe carbon neutrality provides flexibility as we shape our strategy over the coming decades, and we believe our clean electricity strategy has us well positioned to support us achieving this. |
| UN SDG Alignment | Target 13.2: "Integrate climate change measures into national policies, strategies and planning." | | Target 13.2: "Integrate climate change measures into national policies, strategies and planning." |
TRANSALTA CORPORATION M84
Management’s Discussion and Analysis
GHG Disclosures
Our GHG emissions are calculated using a number of different methodologies depending on the technologies available at our facilities. Emissions data has been aligned with the “Setting Organizational Boundaries: Operational Control” methodology set out in the GHG Protocol: A Corporate Accounting and Reporting Standard developed by the World Resources Institute and the World Business Council for Sustainable Development. We report emissions on an operation control basis, which means we report 100 per cent of emissions at the facilities we operate.
The GHG Protocol classifies a company’s GHG emissions into three scopes. Scope 1 emissions are direct emissions from owned or controlled sources. Scope 2 emissions are indirect emissions from the generation of purchased energy. Scope 3 emissions are all indirect emissions (not included in scope 1 or 2) that occur in the value chain of the reporting company, including both upstream and downstream emissions.
We compile our corporate GHG inventory using our business segment GHG calculations. As a result, emission factors and global warming potentials used in our GHG calculations can vary due to difference in regional compliance guidance. The Clean Energy Regulator in Australia amended global warming potentials in August 2020. Therefore, the use of global warming potentials in our GHG calculations related to our Australian assets differs from the rest of our fleet. Applying harmonized global warming potentials across our fleet would result in a minor variance to our overall calculated GHG totals.
Our 2021 GHG data is reported to a number of different regulatory bodies throughout the year for regional compliance and, as a result, may incur minor revisions as we review and report data. Any historical revisions will be captured and reported in future disclosure. As per the Kyoto Protocol, GHGs include carbon dioxide, methane, nitrous oxide, sulphur hexafluoride, nitrogen trifluoride, hydrofluorocarbons and perfluorocarbons. Our exposure is limited to carbon dioxide, methane, nitrous oxide and a small amount of sulphur hexafluoride. The majority of our estimated GHG emissions result from carbon dioxide emissions from stationary combustion from coal and natural-gas-powered generation.
The following tables detail our GHG emissions by scope, business segment and country in million tonnes of CO2e. Some values do not sum to the indicated total due to rounding of tabulated emissions. Zeros (0.0) indicate truncated values.
| | | | | | | | | | | |
| Year ended Dec. 31 | 2021 | 2020 | 2019 |
| Scope 1 | 12.4 | 16.3 | 20.5 |
| Scope 2 | 0.1 | 0.1 | 0.1 |
| Total GHG emissions | 12.5 | 16.4 | 20.6 |
| | | | | | | | | | | |
| Year ended Dec. 31 | 2021 | 2020 | 2019 |
| Hydro | 0.0 | 0.0 | 0.0 |
| Wind & Solar | 0.0 | 0.0 | 0.0 |
| Gas | 6.5 | 7.7 | 9.3 |
| Energy Transition | 6.0 | 8.6 | 11.3 |
| Corporate and Energy Marketing | 0.0 | 0.0 | 0.0 |
| Total GHG emissions | 12.5 | 16.4 | 20.6 |
| | | | | | | | | | | |
| Year ended Dec. 31 | 2021 | 2020 | 2019 |
| Australia | 1.0 | 1.1 | 1.1 |
| Canada | 7.9 | 9.4 | 11.6 |
| US | 3.6 | 5.9 | 8.0 |
| Total GHG emissions | 12.5 | 16.4 | 20.6 |
In 2021, our GHGs emissions (scopes 1 and 2) were estimated to be 12.5 million tonnes as a result of normal operating activities. Compared to 2020, this represents a reduction of approximately 24 per cent or 3.9 million tonnes CO2e. Reductions in GHG emissions were primarily due to shutdowns during coal-to-gas conversions and coal unit retirements. Because we sell the environmental attributes generated from our renewable energy facilities, we do not subtract this amount from our total emissions, but it should be noted that TransAlta’s customers are reporting GHG reductions using our renewable energy assets, projects and operations.
TRANSALTA CORPORATION M85
Management’s Discussion and Analysis
GHG emissions are verified to a level of reasonable assurance in locations where we operate within a carbon regulatory framework. Any historical revisions to GHG data will be captured and reported in future disclosure. The majority of our GHG emissions result from carbon dioxide emissions from stationary combustion from coal and natural-gas-powered generation.
The following highlights our scope 1 and 2 GHG emission reductions since 2015 and our targeted emissions in 2026 (in line with our new GHG target). The actual GHG emissions for the Company in 2026 will vary from that presented below depending on, among other things, the growth of the Company, including its on-site generation business.
| | | | | | | | | | | |
| Year ended Dec. 31 | 2026 (forecast) | 2021 | 2015 |
Total GHG emissions (million tonnes CO2e) | 8.1 | 12.5 | 32.2 |
We estimate our scope 3 emissions in 2021 to be in the range of four million tonnes of CO2e, which is primarily attributed to our non-operated joint venture interests.
The table below shows the alignment of our climate change management disclosure with TCFD recommendations.
| | | | | | | | | | | |
| Recommended Disclosures | | Location |
| Governance | | |
| Describe the board’s oversight of climate-related risks and opportunities | | Oversight by the Board of Directors |
| Describe management’s role in assessing and managing climate-related risks and opportunities | | Role of Senior Management |
| Strategy | | |
| Describe the climate-related risks and opportunities the organization has identified over the short, medium, and long term | | Key Scenario Findings |
| Describe the impact of climate-related risks and opportunities on the organization’s businesses, strategy and financial planning | | Climate Change Strategy, Key Climate Scenario Findings |
| Describe the resilience of the organization’s strategy, taking into consideration different climate-related scenarios, including a 2°C or lower scenario | | Climate Scenarios, Key Climate Scenario Findings |
| Risk Management | | |
| Describe the organization’s processes for identifying and assessing climate-related risks | | Climate Change Strategy |
| Describe the organization’s processes for managing climate-related risks | | Managing Climate Change Risks and Opportunities |
| Describe how processes for identifying, assessing and managing climate-related risks are integrated into the organization’s overall risk management | | Managing Climate Change Risks and Opportunities |
| Metrics and Targets | | |
| Disclose the metrics used by the organization to assess climate-related risks and opportunities in line with its strategy and risk management process | | Climate Change Metrics and Targets |
| Disclose scope 1, scope 2 and, if appropriate, scope 3 greenhouse gas (GHG) emissions and the related risks | | Climate Change Metrics and Targets |
| Describe the targets used by the organization to manage climate-related risks and opportunities and performance against targets | | Climate Change Metrics and Targets |
TRANSALTA CORPORATION M86
Management’s Discussion and Analysis
Engaging with Our Stakeholders to Create Positive Relationships
We strive to create shared value for our stakeholders through social and relationship value creation at TransAlta. The most material impacts on our social and relationship performance are fostering positive relationships with Indigenous neighbours, communities, stakeholders, governments, industry and landowners in the areas where we operate, as well as public health and safety. This section covers sustainability factors of social and relationship capital and intellectual capital as per guidance from the International Integrated Reporting Framework.
Human Rights
TransAlta is committed to honouring domestic and internationally accepted labour standards and supports the protection of human rights of all its employees, contractors, suppliers, partners, Indigenous partners and other stakeholders. We abide by human rights and modern slavery legislation in Canada, the US and Australia. We have a zero tolerance approach to discrimination based on age, disability, gender, race, religion, colour, national origin, political affiliation or veteran’s status or any other prohibited ground as defined by human rights legislation in the jurisdictions in which we operate. We afford equal opportunities for men and women, support the right to freedom of association and the right to organize unions and bargain collectively. We do not conduct operational human rights reviews or impact assessments, but we do have governance practices in place for the protection of human rights.
Our Human Rights and Discrimination Policy communicates our commitment to human rights in our operations and supply chain to ensure that our personnel policies and practices in our global operations will respect fundamental rights. Expected behaviours of all our employees are set out in our Corporate Code of Conduct. We are committed to creating a work environment where all workers feel safe and are valued for the diversity they bring to our business. In 2021, we launched mandatory Code of Conduct training for employees to complete before signing the Code of Conduct. The training completion rate was 100 per cent. We also have adopted a Supplier Code of Conduct that defines the principles and standards expected of suppliers, their employees and contractors to meet while in the provision of goods and/or services to TransAlta.
Our Whistleblower Policy provides a mechanism for our employees, officers, directors and contractors to report, among other things, any actual or suspected ethical or legal violations. We would seek to remedy the impact promptly in order to establish a corrective action plan in collaboration with the relevant individuals and stakeholders.
In Australia, we report under the Australian modern slavery legislation. Our Modern Slavery Act Statements demonstrate the actions we have taken to assess and address modern slavery risks within our operations and supply chain. These annual statements are approved by our Board of Directors and are publicly available.
Indigenous Relationships and Partnerships
At TransAlta, we value relationships and partnerships with our Indigenous neighbours, aspiring to the highest standards in our relationships with Indigenous people. Our core values of safety, innovation, sustainability, respect and integrity represent how we do business and engage with Indigenous people. Our commitment to Indigenous relations is led by a centralized corporate team who foster a relationship-based approach, involving employees at each facility and within each business unit. These employees and teams build relationships with the neighbouring Indigenous communities and work to develop respectful, trusting relationships that help TransAlta continually improve its business practices.
Our Indigenous Relations Policy focuses on four key areas: community engagement and consultation; business development; community investment; and employment. We ensure that TransAlta’s principles for engagement are upheld and that the Company fulfils its commitments to Indigenous communities. Efforts are focused on building and maintaining solid relationships and strong communication channels that enable TransAlta to: share information regarding operations and growth initiatives; gather feedback to inform project planning; and understand priorities and interests from communities to better address concerns and unlock opportunities.
Methods of engagement include:
▪Relationship building through regular communication and meetings with representatives at various levels within Indigenous communities and organizations;
▪Hosting company-community activities to share both business information and cultural knowledge;
▪Maintaining consistent communications with each community and following appropriate community protocols and procedures;
▪Participating in community events such as pow wows and blessing ceremonies; and
▪Providing both monetary and in-kind sponsorships for community initiatives.
TRANSALTA CORPORATION M87
Management’s Discussion and Analysis
TransAlta takes a proactive approach in engagement by initiating communication early in project development to allow concerns to be identified and addressed, minimizing potential project delays. We strive to maintain relationships through the life cycle of our operations, from project development and construction, through operation, until decommissioning phases are complete. We work with communities to build relationships based on a foundation of ongoing communication and mutual respect. This is recognized in our Indigenous Relations Policy, which was recently updated to include our acknowledgement and understanding of the intent of the recommendations of the United Nations Declaration on the Rights of Indigenous Peoples. In addition, TransAlta is a member of the Canadian Council for Aboriginal Business (“CCAB”) and is certified at the Bronze level in the CCAB’s Progressive Aboriginal Relations program.
Participation in Indigenous Ceremonies
In 2021, TransAlta was honoured to participate in three ceremonies with Elders and other representatives from Indigenous communities in Canada: a Water Ceremony with the Aamjiwnaang First Nation; a Water Ceremony with the Wesley First Nation of the Stoney Nakoda Sioux Nations; and a Blessing Ceremony with an Elder from Paul First Nation at the Highvale mine for tree planting.
Support for Indigenous Youth, Education and Employment
TransAlta recognizes the importance of investing in Indigenous students and our financial support helps students complete their education, become self-sufficient and move forward to become future leaders in their communities. We are keen to help young Indigenous students reach their full potential and achieve their dreams. We also believe in providing support to Indigenous primary school students, helping to instill a passion for lifelong learning.
In 2021, TransAlta provided more than $375,000 to support Indigenous youth, education and employment programs, representing 13 per cent of TransAlta’s total community investment. Highlights include:
▪Mother Earth's Children's Charter School ("MECCS") – Located in Treaty 6 territory, Alberta, MECCS offers education for students from kindergarten to Grade 9 and is cited as Canada’s first and only Indigenous children’s charter school. The student population is diverse and includes Métis, Cree, Nakota Sioux and Stoney. Volunteers from TransAlta travel to the school to deliver Christmas gifts, providing both our employees and the students the opportunity to engage with each other. Due to the COVID-19 pandemic, this tradition has been conducted remotely. In 2021, more than 200 Christmas gifts were purchased for students at Mother Earth’s Children’s Charter School and Wihnemne School on Paul First Nation.
▪Spirit North – TransAlta is proud to support Spirit North, a national charitable organization that uses land-based activities to improve the health and well-being of Indigenous youth. Through the transformative power of sport and play, participants learn important lessons, discover untold potential and build the confidence and courage needed to overcome the hardships Indigenous youth often face.
▪Southern Alberta Institute of Technology Gap Program – This program provides critical financial support needed for aspiring Indigenous students who require high school upgrading in order to qualify for a trade program where there is a "gap" in available funding.
▪The Banff Centre for Arts and Creativity – This year, TransAlta continued our ongoing partnership with the Banff Centre and supported scholarship funding for Indigenous community members to participate in leadership training.
▪Books In Homes – Funding supports an early literacy program for the children of Tjiwarl Aboriginal Corporation members in Western Australia.
▪Mount Royal University Foundation – Continued partnership with the Mount Royal University Foundation in support of the Indigenous Family Housing Program, which features an Indigenous family tipi in an outdoor space dedicated to Indigenous students and supporting Indigenous cultural programming.
▪Indspire – Continued support for Indspire, a national Indigenous registered charity. Through this program, 14 bursaries of $3,000 each were given to recipients from the following communities: Blood (Kanai) First Nation, Ermineskin Cree Nation, Enoch Cree Nation, Montana First Nation, Simpcw First Nation and Squamish First Nation.
▪Diamond Willow Youth Lodge – In partnership with the United Way of Calgary & Area, designated funding was provided to the Diamond Willow Youth Lodge, a safe place for Calgary Indigenous youth to connect with peers and participate in a variety of programs that promote health and wellness, education and employment preparation.
TRANSALTA CORPORATION M88
Management’s Discussion and Analysis
Indigenous Cultural Awareness Training for TransAlta Employees
In 2021, we adopted a new sustainability target that will see that all employees complete Indigenous cultural awareness training by the end of 2023. We believe education is the foundation to ensuring respectful and strong relationships with Indigenous peoples into the future.
In addition to our training commitment, in 2021 our Indigenous Relations team led three company-wide cultural awareness initiatives in recognition of National Reconciliation Week in Australia and National Indigenous History Month and National Indigenous Peoples Day in Canada.
In 2021, September 30 marked the first National Day for Truth and Reconciliation, which is a federal statutory holiday in Canada and TransAlta chose to adopt this day as one of its statutory holidays. This is an important day for Canadians to take time to pause, reflect and focus to deepen their awareness and understanding of the Canadian residential school system. This day also provides an opportunity to consider how each of us can contribute to ongoing reconciliation with Indigenous peoples. Coinciding with the announcement of unmarked graves of Indigenous school children in British Columbia and Saskatchewan, TransAlta lowered the flags at its Canadian operations for one hour for each grave that was discovered. TransAlta’s Executive Leadership Team delivered a National Day for Truth and Reconciliation Town Hall online event.
Stakeholder Relationships
Fostering positive relationships with our stakeholders is important to TransAlta. Driven by our core values, we see stakeholder transparency as an integral part of our relationships. We take a proactive approach to building relationships and understanding the impacts our business and operations may have on local stakeholders.
TransAlta Stakeholders
To act in the best interests of the Company and to optimize the balance between financial, environmental and social values for both our stakeholders and TransAlta, we seek to:
▪Build relationships through regular engagement with stakeholders regarding our operations, growth prospects and future developments;
▪Consider feedback and make changes to project designs and plans to resolve and/or accommodate concerns expressed by our stakeholders; and
▪Respond in a timely and professional manner to stakeholder inquiries and concerns and work diligently to resolve issues or complaints.
Our stakeholders are identified through stakeholder mapping exercises conducted for each facility and prospective project development or acquisition. Through decades of establishing stakeholder relationships in the areas of our facilities, we have developed a strong knowledge of who our stakeholders are and have gained understanding of our stakeholders' issues and concerns.
Our principal stakeholder groups are listed in the following table.
| | | | | | | | |
| TransAlta Stakeholders |
| Non-governmental organizations (NGOs) | Community associations and organizations | Connecting transmission facility operators |
| Regulators | Industry organizations | Communities |
| Charitable organizations/Non-profit | Standards organizations | Retirees |
| All levels of government | Media | Residents/Landowners |
| Suppliers | Business partners | Investor organizations |
| Contractors | Unions/Labour organizations | Financial institutions |
| Government agencies | Forest associations/Industry | Mineral rights owners |
| System operators | Oil & gas associations/Industry | Railroad owners |
| Customers | Think tanks | Utility owners |
| Municipalities | Academics | Employees |
TRANSALTA CORPORATION M89
Management’s Discussion and Analysis
Stakeholder Engagement
In order to run our business successfully, we maintain open communication channels with our stakeholders. We commit to timely and professional resolution in our dialogue with stakeholders. Our stakeholder engagement practices are guided by regulatory requirements, industry best practices, international standards and corporate policies. We work internally and with each stakeholder to identify and to mitigate further issues.
Examples of our methods of engagement are listed in the following table.
| | | | | | | | |
| Information & Communication | Dialogue & Consultation | Relationship Building |
| Open houses, town halls and public information sessions | In-person meetings with local groups and communities | Community advisory bodies |
| Newsletters, telephone conversations, emails and letters | Meetings with individual stakeholders (e.g., landowners and residents) | Capacity agreements |
| Websites | Targeted audience sessions | Sponsorships and donations |
| Social media postings | Tours of our facilities and sites | Hosting and attending events |
A key focus of our work is to support business growth through proactive engagement with stakeholders in our geographic operating areas in Canada, the US and Australia to develop and maintain relationships, assess needs and fit and seek out collaborative and sustainable opportunities. This helps ensure any stakeholder concerns are identified and can be addressed early in the development process, thereby minimizing project delays. We conduct consultation primarily during project development and construction and maintain engaged communication throughout operations to decommissioning. Examples of stakeholder engagement in 2021 include: the WaterCharger Battery Energy Storage Project; the closure of the Highvale mine; the suspension of the Sundance Unit 5 Repowering Project; the coal-to-gas transition at our Alberta plants; and noise and aircraft lighting detection systems at the Antrim Wind Energy facility in New Hampshire.
Customers
TransAlta serves industrial and commercial customers with power and energy services across its fleet in Canada, the US and Australia. We are focused on customer-centred renewables growth to bring high levels of service quality and reliability for our customers in a low carbon future. As one of the largest electricity generators in Canada, our team serves businesses with:
▪Sustainable solutions starting from the design phase;
▪Energy consumption and cost management solutions;
▪Market price risk and volume exposure mitigation; and
▪Monitoring of energy market design changes, price signals and applicable and available incentives.
The customer solutions team at TransAlta has maintained a large portfolio of customers in Alberta across a broad range of industry segments, including commercial real estate, municipal, manufacturing, industrial, hospitality, finance and oil and gas.
Across our business in Canada, the US and Australia, we provide on-site generation for large mining and industrial customers. This requires us to be continually engaged with these customers, ensuring that current electricity requirements are provided safely, reliably and cost-effectively with the benefit of lower GHG emissions.
We continue to develop renewable energy facilities to support customers achieving their sustainability goals and targets, such as 100 per cent renewable power targets and/or GHG reduction targets. Production from renewable electricity in 2021 resulted in the avoidance of approximately 2.6 million tonnes of CO2e for our costumers.
Examples of renewable energy projects in 2021 include our Garden Plain wind project in Alberta, which has a 130 MW capacity and is subject to a PPA with Pembina, our White Rock Wind Projects in Oklahoma with a 300 MW capacity, which is subject to a PPA with a single offtaker, and our Northern Goldfields Solar Project with a battery energy storage system in Western Australia, which has a 48 MW capacity and is subject to a PPA with BHP.
For further details on how we support our customers' sustainability objectives, please refer to Applied Technologies in the Technology Adoption and Innovation Focus section of this MD&A.
TRANSALTA CORPORATION M90
Management’s Discussion and Analysis
Energy Affordability
TransAlta focuses on assisting commercial and industrial customers in managing their cost of energy. TransAlta has a full suite of procurement strategies and products with various terms available to our customers to assist in understanding and reducing their energy costs.
For customers interested in making a long-term commitment to obtain predictable costs, TransAlta has the experience to develop renewable energy facilities, battery energy storage systems and hybrid solutions, or long-term offtake agreements from its existing and future renewable and gas-fired facilities.
End-Use Efficiency and Demand
TransAlta’s commercial and industrial customers have access to an extensive set of monthly reports providing detailed tracking of customer usage, allowing for corrective action as required, as well as cost-saving recommendations.
Our Power Factor Report advises the customer of sites that operate at less than a 90 per cent power factor so they can consider installing energy-efficient equipment. By reducing the customer’s power system demand charge through power factor correction, the customer’s site puts less strain on the electricity grid and reduces its carbon footprint. TransAlta’s Site Health Report advises customers of a site whose peak demand has been permanently reduced for a variety of reasons from its initial in-service date. The customer may be paying a higher demand charge each month to the distribution company based on the original peak demand expected at the site. TransAlta collaborates with the customer and determines the new peak demand based on the customer’s operation. The customer, working with the distribution company, may find it economic to buy down the distribution contract to reduce the monthly distribution costs going forward.
Community Investments
In 2021, TransAlta increased its community investments by 36 per cent and contributed approximately $3.0 million in donations and sponsorships (2020 - $2.2 million), with a continued focus in three priority areas: youth and education, environmental leadership, and community health and wellness.
One of our significant community investments each year is to United Way campaigns across Canada and the US. This year, TransAlta employees, retirees, contractors and the Company raised over $1.1 million for the United Way. TransAlta has been supporting the United Way for over 30 years and has contributed more than $20 million over that time. In 2021, TransAlta made a number of other significant investments. Key highlights for the year included:
▪Calgary Health Foundation - In 2021, TransAlta partnered with the Calgary Health Foundation to support the Newborn Needs campaign in support of the development of a new Foothills Medical Centre Neonatal Intensive Care Unit (“NICU”), serving all of southern Alberta. TransAlta provided an initial $1 million of support in 2021, as part of a $2 million total commitment over a five-year term. The NICU will be a Centre of Excellence for Calgary, Alberta, Canada and the world.
▪The Calgary Stampede Foundation – Founded in 2017, the TransAlta Performing Arts Studio at Stampede Park continues to provide a year-round facility for the Calgary Stampede Foundation and Calgary’s youth performing arts groups to rehearse, train and celebrate the arts.
▪TransAlta Tri-Leisure Centre – The TransAlta Tri-Leisure Centre is a sporting and recreation destination for many active and involved residents from the communities of Parkland County, Spruce Grove and Stony Plain in Alberta. At the facility, thousands of local residents and many of our employees participate in a wide range of sporting and cultural activities and join together in many community causes.
▪Calgary Reads – TransAlta was proud to continue to support this organization in 2021, which is dedicated to supporting the improvement of literacy skills for children in Calgary.
TRANSALTA CORPORATION M91
Management’s Discussion and Analysis
▪International Women’s Day – As part of TransAlta’s International Women’s Day Celebration, the company provided donations to five organizations that support women in the jurisdictions where we operate:
◦Rise Kira House (Perth, Western Australia) – the Rise Kira House is a 24-hour service supporting young women (aged 14-18) leaving family and domestic violence.
◦Women’s Interval Home of Sarnia-Lambton (Sarnia, Ontario) – The Women’s Interval Home provides emergency shelter and counselling services to abused women and their children. This includes 24-hour emergency and short-term shelter, support, individual and group counselling, transitional services and child-witness counselling services.
◦Elizabeth Fry Society of Northern Alberta (Edmonton, Alberta) – The Elizabeth Fry Society of Northern Alberta partners with communities from Red Deer to Fort McMurray (including rural and Indigenous communities) to address the unique access to justice needs and gaps in services that affect vulnerable individuals.
◦Women United (Lewis County, Washington) - Women United’s mission is to positively impact the lives of women and children living in poverty in Lewis County by encouraging self-sufficiency and empowerment. Women United gathers local women who seek to understand the issues facing the community and then roll up their sleeves to help. They operate as an affinity group of the United Way of Lewis County and as such, work within its mission to lift 30 per cent of Lewis County families out of poverty by 2030.
◦The Women’s Centre of Calgary (Calgary, Alberta) – The Women’s Centre provides a safe and supportive space accessed by thousands of women in Calgary. Supports include: poverty and hunger, family breakdown, parenting, homelessness, unemployment, health and education, immigration and settlement, domestic violence, isolation and loneliness, life transitions and discrimination. Forty-one per cent of the women who access the services and volunteer their time are living in poverty.
▪Calgary Pride – As part of TransAlta’s Pride Celebration in 2021, the company was happy to sponsor the 2021 Calgary Pride Festival and Parade. Calgary Pride aims to create spaces that ensure LGBTQ2+ belonging and celebration. The Calgary Pride Festival and Parade takes place each Labour Day long weekend, with thousands gathering in celebration of gender and sexual diversity.
▪Leinster Community School – Funding was provided for an upgrade to the kindergarten playground area to create a new play-based learning environment, focused on sustainability.
▪Heart Kids – Support was provided for the annual 2021 charity walk for Heart Kids, Australia’s only not-for-profit organization solely focused on supporting and advocating for people impacted by childhood heart disease.
▪Energy Transition Support – On July 30, 2015, we announced a US$55 million community investment over 10 years to support energy efficiency, economic and community development and education and retraining initiatives in Washington State. The US$55 million community investment is part of the TransAlta Energy Transition Bill passed in 2011. This bill was a historic agreement between policymakers, environmentalists, labour leaders and TransAlta to transition away from coal in Washington State by closing the Centralia facility’s two units, one in 2020 and the other in 2025. Three funding boards were formed to invest the US$55 million: the Weatherization Board (US$10 million), the Economic & Community Development Board (US$20 million) and the Energy Technology Board (US$25 million). To date, the Weatherization Board has invested US$8 million, the Economic & Community Development Board US$15 million and the Energy Technology Board US$10 million. Specific projects that the boards funded in 2021 include financial support to learning centres (the United Learning Center project, a Boys & Girls Club and the Discover Children’s Museum), a project to install the first renewable energy project in Washington state that generates electricity by harvesting excess pressure from municipal water pipeline, and the installation of a shore power connection point at the Bell Street Cruise Terminal at Pier 66 in Seattle, Washington. The shore power connection will allow vessels with shore power technology to plug into the local electrical grid, which reduces GHG emissions and the burden of diesel exposure to people who live, work and visit along the Seattle waterfront.
TRANSALTA CORPORATION M92
Management’s Discussion and Analysis
Supply Chain and Sustainable Sourcing
We continue to seek solutions to advance supply chain sustainability. As we explore major projects, we assess vendors both at the evaluation stage and as part of information requests on such elements as safe work practices, environmental practices and Indigenous spend. This means, for example, getting information on:
▪Estimated value of services that will be procured though local Indigenous businesses;
▪Estimated number of local Indigenous persons that will be employed;
▪Understanding overall community spend and engagement; and
▪Understanding the state of community relations through interview processes and stakeholder work.
In 2021, the Board approved our revised Supplier Code of Conduct that applies to all vendors and suppliers of TransAlta. Under this code, suppliers of goods and services to TransAlta are required to adhere to our core values, including as they pertain to health and safety, ethical business conduct and environmental leadership. The code also allows suppliers to report ethical or legal concerns via TransAlta’s Ethics Helpline.
Engagement and Board Communication
The Board believes that it is important to have constructive engagement with its shareholders and other stakeholders and has established means for the shareholders of the Company and other stakeholders to communicate with the Board. For example, employees and other stakeholders may communicate with the Board through the AFRC by writing to the AFRC or by making submissions via the Company’s toll-free telephone or online Ethic Helpline (please refer to Risk Controls — Whistleblower System in the Governance and Risk Management section of this MD&A for more details). Shareholders are also invited to communicate directly with the Board under the Company’s Shareholder Engagement Policy, which outlines the Company’s approach to proactive director-shareholder engagement at and between the Company’s annual shareholders meetings. Under the Shareholder Engagement Policy, shareholders can submit questions or inquiries to the Board, to which the Company will respond. Our Shareholder Engagement Policy is available in the Governance section of the Investor Centre on our website. Shareholders and other stakeholders may, at their option, communicate with the Board on an anonymous basis. In addition, the Board has adopted an annual non-binding advisory vote on the Company’s approach to executive compensation (i.e., say-on-pay).
The Company is committed to ensuring continued good relations and communications with its shareholders and other stakeholders and regularly evaluates its practices in light of any new governance initiatives or developments in order to maintain sound corporate governance practices. Throughout 2021, representatives of the Board engaged extensively with the Company's significant shareholders. Specifically, since Jan. 1, 2021, independent members of the Board have met with 12 shareholders representing approximately 39 per cent of the Company’s total issued and outstanding common shares. In addition, independent members of the Board engaged with Proxy Advisory firms to discuss a number of topics of relevance to the Company and its stakeholders, including the Company's strategic direction, executive compensation, ESG practices and Board composition and diversity.
Public Health and Safety
We are committed to protecting the public and our assets, as well as the physical, psychological and social well being of our people.
We specifically look to minimize the following risks:
▪Harm to people;
▪Damage to property;
▪Operational liability; and
▪Loss of organizational reputation and integrity.
We work to prevent incidents and lower our risk by administering security controls such as restricting physical access around and into our operating facilities. The use of security technology such as surveillance cameras and electronic access is utilized to ensure the control of secure areas. Regular audits and security risk assessments are conducted to ensure continuous improvement of the Security Management Program. Our Security Management Program is focused on the protection of people, property, information and reputation.
TRANSALTA CORPORATION M93
Management’s Discussion and Analysis
The Corporate Emergency Management Program prepares employees should an emergency incident occur. The program includes an emergency management policy and standard, which sets an expectation for employees to continuously prepare for emergencies. The program has executive sponsorship. It provides the overarching framework for each business unit to provide an Emergency Response Plan and Business Continuity Plan. We implement our Incident Command System, which is a standardized on-scene emergency and incident management system that provides an organizational structure able to respond to single or multiple incidents. Designed to aid in the management of resources during incidents, it combines facilities, equipment, personnel, procedures and communications operating within a common organizational structure. It is used as part of an all-hazards approach for incident management and is officially recognized for multi-agency response in emergency situations, however complex.
We develop strong relationships with local emergency responders. We periodically conduct multi-agency training events at our facilities. This ensures continuous improvement and familiarity with our assets and builds strong communication channels for emergency response.
Our processes designate how we communicate with stakeholders in the event of a crisis. This is managed by our Crisis Communications Team. The team has the responsibility and goal to provide a unified message on behalf of the Company throughout the response and recovery, ensure all messaging is approved by the Incident Commander (the Chief Talent & Transformation Officer, or their designate), co-ordinate messaging with any applicable external agencies and, if necessary, deploy to an incident site.
Annual training requirements are adhered to by our employees operating at our facilities. The results are tracked, audited and presented at our annual executive review. The findings and recommendations assist in maintaining a sustainable program across the organization.
The Company continues to operate under its business continuity plan in response to the global pandemic declared in March 2020. For more information, please refer to COVID-19 in the Significant and Subsequent Events section of this MD&A.
Data and Digital Asset Protection
We work hard to protect our digital assets, including our corporate data and our digital identities that give us access into line of business applications. Cybersecurity risks that work to compromise these assets include the manipulation of data integrity, system and network hacking, use of social engineering tactics through email phishing, compromise of operations and infrastructure through the use of ransomware, credential breaches, attacks introduced through unknowing third-party vendors and service providers, as a well as malware. Given the ever-evolving nature of cyberattacks, we are consistently adapting our cybersecurity program to focus on three key pillars: technology, processes and people. Each of these pillars can be reinforced independently to address specific cyber risks and threats through a comprehensive and multi-faceted program. Through this program, TransAlta continually implements measures and controls to proactively mitigate internal and external cybersecurity risks and threats posed to the organization, and to deal efficiently and effectively with threats.
Please refer to Cybersecurity Risk in the Governance and Risk Management section of this MD&A for further details.
TRANSALTA CORPORATION M94
Management’s Discussion and Analysis
Building a Diverse and Inclusive Workforce
Engaging our workforce, developing our employees, creating a diverse and inclusive work environment and minimizing safety incidents are the keys to human capital value creation at TransAlta and our most material areas for management. In 2021, we improved our ESG performance through our efforts to promote an equitable, diverse and inclusive workforce. This section covers sustainability factors of human capital as per guidance from the International Integrated Reporting Framework.
Equity, Diversity and Inclusion
TransAlta’s commitment and focus on excellence in ED&I is found in our workplace, among our co-workers who at all levels advocate for the core values of equity and inclusion. We believe a strong focus on ED&I will drive performance in innovation, improve service to our customers and positively impact the communities that we all live in.
In 2021, TransAlta’s ED&I Council developed our five-year ED&I strategy to achieve the goals and set out a course to attaining the aspirations set out in our ED&I Pledge. Our five-year ED&I strategy was approved by the Board and sets out key milestones for the annual plans from 2021 to 2025. The first phase of this strategy focuses on raising awareness to build a foundation and common understanding upon which our co-workers can have meaningful conversations to learn about one another. The second phase centres around reinforcing and embedding inclusive behaviours.
We continued to expand our ED&I platform in 2021 by offering employees a variety of training, education and awareness on ED&I such as webinars, employee engagement sessions, articles, videos and blogs. After completing our inaugural 2020 ED&I Census, which was delivered by a third party and was sent to all employees to understand our demographics and our experiences in the workplace, we put actions into place to address pain points in 2021. This included celebrating International Women's week and Pride month with several activities, hosting a number of guest speakers on a variety of topics and implementing partnerships for mentorship and Employee Resource Groups opportunities.
Our 2021 ED&I Census results were benchmarked to those of other companies in our industry and within Canada. The results demonstrated a marked improvement of our workforce feeling a greater sense of inclusion and belonging. In addition, our ED&I Census inclusion results were above the energy industry average meeting the inclusion scores of leading ED&I corporations in Canada. In our ED&I Census we received an above industry average response rate of 58 per cent. Of the respondents that completed the ED&I Census, we understand that 30 per cent of the workforce identifies as female, 24 per cent of the workforce identifies with a racial or ethnic minority group, two per cent of the workforce identifies as members of LGBTQ2+ community and 10 per cent of the workforce are people with disabilities.
In 2021, we received market recognition for our ED&I efforts and were certified by a third party for our commitment to measuring, tracking and improving ED&I. We have been recognized for our efforts to measure and set targets to increase diversity, while regularly collecting data on our co-workers’ experiences to identify bias and barriers faced by underrepresented groups and implementing programs and policies designed to unlock specific challenges while tracking results. We have incorporated diversity metrics into TransAlta's 2021 short-term incentive plan for our employees.
Gender Diversity
A number of case studies have highlighted the link between gender diversity and additional business value. TransAlta is an active supporter of gender diversity as a driver for value, but also as an ethical business practice. Our commitment to gender diversity in our business is evidenced by our female participation rates on both our executive team and Board. As of Dec. 31, 2021, women made up 38 per cent of our executive officer team and 42 per cent of our Board. These percentages are higher than our peers in Canada. Industry research highlights that the percentage of Board seats held by women from all disclosing Canadian TSX-listed companies in Canada is 22 per cent and the average percentage of women on executive teams is 18 per cent.
To further support female advancement, we have set targets to: (i) maintain equal pay for women in equivalent roles, (ii) achieve 50 per cent representation of women on our Board by 2030 and (iii) achieve 40 per cent representation of women among all employees by 2030. Our goal to achieve 40 per cent women across the entire workforce by 2030 is ambitious considering the majority of the operational roles are currently male dominated. Currently, women employees represent 24 per cent of all employees.
TransAlta was once again added to the Bloomberg Gender-Equality Index in 2021. Inclusion in the index recognizes our comprehensive investment in workplace gender equality and our commitment to driving progress by developing inclusive policies and disclosing data using Bloomberg’s gender reporting framework. In 2021, the Company received the Globe and Mail's Women Lead Here award, which evaluates publicly traded Canadian companies' ratio of female-identifying to male-identifying executives in the top three tiers of executive leadership.
TRANSALTA CORPORATION M95
Management’s Discussion and Analysis
In 2021, in celebration of International Women’s Day 2021 theme #ChooseToChallenge, TransAlta delivered a week-long campaign to highlight the contributions of women in the workplace with live events in recognition of this momentous day as well as training, challenges and a webinar with one of our female Board members. During these celebrations, we launched our Women in Trades Scholarship with 13 different educational institutions for eligible students enrolled in post-secondary trade programs. We are committed to investing in our communities through meaningful impact and the opportunity to enhance the quality of life wherever we operate. The Women in Trades Scholarship is intended to assist women in obtaining an education in trades by showcasing and rewarding successful female role models.
We also pioneered a female apprenticeship program in our Generation business to strategically target the recruitment of high potential female students and train them to gain valuable experiential learning in the trades. The female apprenticeship program has created a pipeline of future female talent for the Company and has resulted in us being able to creatively target, recruit, hire and retain the first-ever female wind technicians, as well as the first females in the roles of instrumentation technician, electrical technician and power plant operator in our gas fleet in Alberta.
Workforce Health and Safety
The safety of our people, communities and the environment is one of our core values. At TransAlta, we operate large and often complex facilities. The environments in which we work, including Canadian winters and the Australian outback, can add additional challenges to keeping our employees, contractors and visitors safe. Each year we invest significant resources into improving our safety performance, including positively enhancing our safety culture. At meetings of more than four people, we have a practice of starting the meeting with a “safety moment,” which helps share key safety learnings across the Company.
TransAlta's management systems underpin the delivery of safe, reliable and competitive electricity to our customers and partners. Our Total Safety Management System is a combination of recognized best practices in process safety, risk management, asset management, occupational health, safety and environmental management. Since expanding our Occupational Health and Safety program in 2015 to encompass Total Safety, we have transitioned from the development and implementation of this framework into continuous improvement, always striving to achieve our Target Zero vision to operate our business with zero unexpected asset failures and zero environmental, health and safety incidents.
In 2021, we continued to progress our safety culture transformation despite an unprecedented and extraordinary challenge due to COVID-19. To reinforce behavioural safety, several training and capability-building initiatives were delivered. TransAlta conducted 90 one-hour leadership peer board sessions with participation by Generation leaders from across the fleet. We also implemented and rolled-out our fleet-wide app for Occupation Hazard Assessment. This app supports hazard recognition by identifying hazards and associated controls for tasks related to specific occupations.
Our Total Recordable Injury Frequency ("TRIF") result for 2021 was 0.82 compared to 0.81 in 2020. TRIF tracks the number of more serious injuries, and excludes minor first aids, relative to exposure hours worked. Our TRIF performance year over year has remained relatively unchanged. In 2021, we established an ambitious target of 0.61 and while we did not meet this target, we will continue to work to achieve our goal in the future. In 2021, substantial progress was made on initiatives related to our three key targets: mature our safety culture, assess and address risk tolerance, and standardize safety information and technology. In 2022, we are expanding behavioural safety training to all employees in order to provide them with tools to take control of their behaviours, and consequently, improve our safety results. This training reinforces our journey to create a psychologically safe environment in our workplace as it encourages personal accountability towards safety.
| | | | | | | | | | | |
| Safety at TransAlta (employees and contractors) | 2021 | 2020 | 2019 |
| Lost-time injuries | 3 | 5 | 5 |
| Medical aids | 9 | 9 | 7 |
| Restricted work injuries | 5 | 2 | 3 |
| Exposure hours | 4,134,000 | 3,948,000 | | 4,108,000 | |
| Total Recordable Injury Frequency (TRIF) | 0.82 | 0.81 | 0.73 |
TRANSALTA CORPORATION M96
Management’s Discussion and Analysis
In addition to TRIF, we have also introduced Total Safety Report Frequency as a key safety metric in our 2021 annual incentive compensation. This is a leading indicator that measures Total Safety Reports (hazard, near miss and positive observations) per worker per year. Total Safety Reports are proactive in nature and demonstrate the actions we are taking to identify and prevent an injury or loss from occurring. In this way, we not only manage incidents if they do occur, but methodically work to prevent them from arising in the first place. In 2021, we recorded 7.35 reports per worker, which is above our target of 5.50.
As a demonstration to TransAlta’s commitment to safety, SunHills Mining LP was awarded the Safety Excellence Award from the Alberta Mine Safety Association in June 2021. This award is for best safety performance of all Alberta mines under one million workforce hours based on 2020 performance.
Organizational Culture and Structure
Our employees are central to value creation. Our corporate culture has evolved and adapted throughout our more than 110-year heritage. Our core values are safety, innovation, sustainability, respect and integrity. These five core values help provide clarity for our employees and guide our behaviour and decision-making. They also provide a foundation for leadership, collaboration, community support, personal growth and work/life balance. Through corporate initiatives and support throughout all levels of leadership, we encourage our employees to maximize their potential.
As of Dec. 31, 2021, we had 1,282 (2020 — 1,476) active employees. This number has decreased by 13 per cent from 2020 levels, following a reduction in positions in our coal fleet as part of our conversions to gas and ceasing mining operations. With approximately 33 per cent of our employees being unionized, we strive to maintain open and positive relationships with union representatives and regularly meet to exchange information, listen to concerns and share ideas that further our mutual objectives. Collective bargaining is conducted in good faith, and we respect the rights of employees to participate in collective bargaining.
Our organizational structure changed in 2021 to help facilitate effective pace and decision-making in our organization. Our business operates four generating segments, with Gas, Wind and Solar, Hydro and Energy Transition. The Energy Transition is a new segment as described in the Segmented Disclosures under the Segmented Financial Performance and Operating Results section of this MD&A. In addition, our Energy Marketing segment optimizes our asset fleet and trades electricity and other energy commodities. Our Corporate segment, including finance, legal, administrative, business development and investor relations functions, oversees our business and provides strategic alignment. The Company also includes a Shared Services division that oversees our information technology, supply chain, human resources, engineering and accounting functions. The consolidation and centralization of these functions has allowed us to streamline, standardize and, where appropriate, automate these functions while reducing costs and improving service delivery across the organization. Our operations portfolio is run by a single leadership team, which provides operational and financial synergies, enhancing our competitiveness.
TransAlta is committed to improving its internal work environment and the way that employees perceive their work and the Company. We track a broad number of factors to provide us insight into our progress and we use a third party to assist us in tracking our progress on an annual basis. We have made continual and notable improvements year-over-year and continue to target further improvements as we look forward.
Employee Retention and Recognition
ESG-Linked Compensation
At TransAlta we have linked our ESG performance to our employees’ compensation, including our executive leadership team. Our corporate executive annual incentive plans (short-term incentive or annual bonus and long-term share incentives) are linked to TransAlta's performance (i.e., pay for performance). The targets and remuneration framework are reviewed and approved annually by our Board. In 2021, 20 per cent of our corporate annual incentive plan was linked to achieving specific ESG objectives: 10 per cent related to the completion of CO2 reduction projects at existing facilities and diversity and inclusion and organizational health performance, and 10 per cent was linked to workers’ safety. A further 20 per cent of our corporate annual incentive plan was tied to growth, which is focused on expanding TransAlta’s portfolio of renewable generation and will help reduce the Company’s overall GHG emissions intensity. Our long-term incentive plans include strategic goals related to our focus on clean electricity and strong renewables growth.
Employee Retirement Savings Programs
TransAlta is an attractive employer in all three countries in which we operate. We provide compensation to our employees at levels that are competitive in relation to their respective location. We strive to be an employer of choice through our total rewards programs, which include various incentive plans designed to align performance with our annual and longer-term targets, as determined annually by the Board.
TRANSALTA CORPORATION M97
Management’s Discussion and Analysis
Retirement savings plans are an example of rewards we provide. We have registered pension and savings plans in Canada and the US. The plans cover substantially all employees of the Company, its domestic subsidiaries and specific named employees working internationally. These plans have defined benefit (“DB”) and defined contribution ("DC") options. The Canadian and US DB pension plans are closed to new entrants, with the exception of the Highvale mine (SunHills) pension plan acquired in 2013. The US DB pension plan was frozen effective Dec. 31, 2010. The plans are funded by the Company in accordance with governing regulations and actuarial valuations.
We also offer some optional plans for Canadian employees to enhance their financial wellness and retirement savings, with group RRSP and TFSA plans.
In Canada there is an additional non-registered supplemental pension plan (“SPP”) for executive officers whose annual earnings exceed the Canadian income tax limit. The DB SPP was closed as of Dec. 31, 2015, and only current executive officers were grandfathered in the plan. A new DC SPP commenced for executive members hired after Jan. 1, 2016.
In Australia, employees can nominate a superannuation fund for superannuation contributions. The Australian superannuation scheme is compulsory for employers with contributions required at a rate set by the government.
Other Employee Benefit Programs
TransAlta provides competitive benefit programs for most of our employees (options are dependent on the countries in which we operate). We also provide benefit programs based on negotiated union agreements in certain locations. Our flexible benefit plans provide employees and their families with choices of coverage including, among others, extended health, dental, vision, life insurance, critical illness, accident, disability and a health spending account.
On an annual basis, TransAlta recognizes our top achievements through the President’s Awards. In 2021, we added an ED&I award. This award recognizes employees who significantly contributed towards TransAlta’s target of a 40 per cent female workforce by 2030 and TransAlta’s ED&I objective of creating a workplace where all employees feel they belong.
In 2021, TransAlta launched Wellness Wednesdays. This provides employees with weekly awareness, tips and tools on “wellness” topics. TransAlta’s focus on organizational health remained in 2021 through the implementation of nine priority practices into all facets of the organization.
Talent and Employee Development
Talent and employee development is viewed as a key pillar of organizational health. Investing in our employee development enhances employees’ skills and improves productivity and engagement. This contributes to a strong corporate culture that provides value for TransAlta.
In 2021, we expanded the content and topics in our Professional Development Library, which was launched in 2020. This includes adding a second library for ED&I articles and resources. This library has had over 3,000 hits and over 300 unique users. Important dates and definitions are explained here as well as tips on ED&I best practices such as land acknowledgments and empathetic thinking.
To increase cross-functional internal development opportunities, we created our Opportunity Board. On this Opportunity Board, leaders post opportunities for employees to work on projects within other parts of the organization. Employees then have the opportunity to apply for these projects in order to develop their knowledge and gain experience in a different areas of the business. Eight opportunities were posted, and nine employees were successfully matched to an opportunity during our pilot launch of the board.
Throughout 2021, a Speaker Series of subject matter experts was organized to assist with leadership development and our ED&I journey. Presentation topics included prioritization, constructive conflict, unconscious bias, belonging, allyship, the LGBTQ2+ community and empathy.
Employees and leaders were also offered the opportunity to participate in training focused on working within a remote environment. This training provided leaders and employees with valuable tools to effectively communicate, work productively in a “home” environment and maintain collaboration and connectivity with colleagues across the organization.
Additional internal training is held annually for both leaders and employees. Elevate, a self-directed development program focused on creating a leadership mindset, and Execution Engine, a two-day program that focuses on how to prepare projects, prioritize tasks, improve our communication skills and ensure we are sustaining the work completed by living our health practices. Since launching in 2017, hundreds of employees have participated in these programs.
TRANSALTA CORPORATION M98
Management’s Discussion and Analysis
During 2021, we launched leadership training with Blue Ocean Brain. Partnering with Blue Ocean Brain, a micro-learning consultancy, TransAlta leaders were provided with weekly email drips on best practices relevant to TransAlta’s current interests. In addition, Blue Ocean Brain was also engaged to provide 200 leaders with access to their learning library which contains articles, videos, knowledge checks and leadership briefs.
In addition, we extended our partnership with BetterUp, a consultancy providing professional coaching, to provide 1:1 coaching for over 50 leaders. BetterUp coaching is tailored to the individual’s needs to allow them to work with their personal coach on areas that are important for them. Since our partnership with BetterUp began in October 2019, our leaders have participated in over 640 coaching sessions over 390 hours.
In 2021, 89 corporate managers and supervisors were enrolled into Sentis’ Zero Incident Process ("ZIP") training. ZIP training reinforces our journey to create a psychologically safe environment in our workplace as it encourages personal accountability for ourselves and our work, improves decision-making processes, improves safety attitudes and creates a common language to have constructive conversations. In 2022, Corporate employees will be offered ZIP training.
Customer Relationship Training was designed in 2021 by entering a partnership with Vanry Inc. and tailoring the content with input from our managers in Commercial and Customer Relations. This 20-week series of workshops is currently being built and will be completed by 19 customer-facing leaders and employees in 2022. Topics include connecting with customers, listening for what matters, managing requests and building trust.
In 2021, we commenced the design of two leadership development programs – the Manager Development Program and Executive Development Program. These programs are designed to provide leaders with the skills and knowledge to lead in a changing world and the evolving nature with regards to the future of work. Both programs will be launched in 2022. We also launched leadership training on psychological safety, building and maintaining trust and cultural leadership in 2021. This training will be offered to all employees in 2022.
During 2021, TransAlta has had 28 intern and co-op placements with students in various areas of study including business, communications, finance and engineering. To assist in subsidizing the internship and co-op programs, TransAlta continues to partner with Electricity Human Resources Canada to access government funding. Over $150,000 in wage subsidies were received in 2021.
In addition, TransAlta continued to participate in the Canada Alberta Job Grant, which reimburses employers two-thirds of the cost of approved external training. TransAlta is currently approved to receive over $44,000 to cover training costs from 2021.
Advancing Other Sustainability Factors
In the following sections we outline our progress across other material sustainability factors. The sections cover natural, manufactured, intellectual, and social and relationship capital management as per guidance from the International Integrated Reporting Framework.
TRANSALTA CORPORATION M99
Management’s Discussion and Analysis
Progressive Environmental Stewardship
We continue to increase financial value from natural or environmental capital-related business activities, while minimizing our environmental footprint and potential risk factors related to environmental impacts. Adjusted EBITDA from renewable energy generation in 2021 was $584 million (2020 — $353 million). Our revenue in 2021 from environmental attribute sales was $40 million (2020 — $25 million). In addition, in 2021 the sale of coal byproducts and waste-related recycling generated financial value in the range of $15 million to $20 million, which was the same as our range in 2020.
The following are key trends in our natural capital:
| | | | | | | | | | | |
| Year ended Dec. 31 | 2021 | 2020 | 2019 |
| Renewable energy adjusted EBITDA | 584 | 353 | 341 |
| Environmental attribute sales revenue | 40 | 25 | 28 |
GHG emissions (million tonnes CO2e) | 12.5 | 16.4 | 20.6 |
Environmental Strategy
All energy sources used to generate electricity have some impact on the environment. While we are pursuing a business strategy that includes investing in renewable energy resources such as wind, hydro and solar, we also believe that natural gas will continue to play an important role in meeting energy needs during our clean electricity transition. Our environmental management processes support our corporate strategy of ceasing GHG-intensive coal operations. In 2026, our generation mix will be made up of natural gas and renewable energy only, with a goal of 70 per cent of EBITDA from renewables.
Environmental Policy
Reducing the environmental impact of our activities benefits not only our operations and financial results, but also the communities in which we operate. We have a proactive approach to minimizing environmental risks and we anticipate this strategy will benefit our competitive position as stakeholders and society place an increasing emphasis on successful environmental management. The importance of environmental protection is outlined under our Total Safety Management Policy as a corporate responsibility for TransAlta, and the personal responsibility of each employee and contractor working on TransAlta's behalf.
Environmental Management System
At TransAlta, we operate our facilities in line with best practices related to environmental management standards. Our environmental management processes are verified annually to ensure we continuously improve our environmental performance. Our knowledge of environmental management systems ("EMS") has matured since we aligned our processes in accordance with the internationally recognized ISO 14001 EMS standard. Currently, the most material natural or environmental capital impacts to our business are GHG emissions, air emissions (pollutants, metals) and energy use. Other material impacts that we manage and track performance on via our environmental management practices include land use, water use and waste management.
In addition to our environmental management practices, we are subject to environmental laws and regulations that affect aspects of our operations, including air emissions, water quality, wastewater discharges and the generation, transport and disposal of waste and hazardous substances. The Company’s activities have the potential to damage natural habitat, impact vegetation and wildlife, or cause contamination to land or water that may require remediation under applicable laws and regulations. These laws and regulations require us to obtain and comply with a variety of environmental registrations, licenses, permits and other approvals. The environmental regulations in the jurisdictions in which we operate are robust. Both public officials and private individuals may seek to enforce environmental laws and regulations against the Company. We interact with a number of regulators on an ongoing basis, including but not limited to: Alberta Environment and Parks; Ministry of the Environment, Conservation and Parks in Ontario; Ministry of Northern Development, Mines, Natural Resources and Forestry in Ontario; Ministry of Forests, Natural Resource Operations and Rural Development in British Columbia; Environment and Climate Change Canada; Fisheries and Oceans Canada; Michigan Department of Environment, Great Lakes, and Energy; Southwest Clean Air Agency in Washington; Washington State Department of Ecology; Washington State Department of Health; US Environmental Protection Agency; the Department of Agriculture, Water and the Environment in Australia; and the Clean Energy Regulator in Australia.
TRANSALTA CORPORATION M100
Management’s Discussion and Analysis
Environmental Performance
Our performance on managing environmental aspects, reducing our environmental impact and capitalizing on environmental initiatives includes the following:
Renewable Energy and Battery Storage
Since 2005, we have added over 1,500 MW in renewable electricity capacity. We operate over 900 MW of hydro energy, and we were an early adopter of wind energy and today operate over 1,900 MW of wind power, including battery storage. In 2015, we made our first solar investment in a 21 MW solar facility in Massachusetts, and we continue to look for opportunities to develop and operate solar energy. In 2020, we commissioned the first utility-scale battery storage project in Alberta, located at our Summerview II wind facility. The project uses Tesla battery technology and has a capacity of 10 MW. In 2021, we agreed to provide renewable solar electricity supported with a battery energy storage system to BHP in Western Australia. For more information, please refer to Applied Technologies in the Technology Adoption and Innovation Focus section of this MD&A.
Natural Gas
Natural gas plays an important role in the electricity sector, providing low-emission baseload and peaking generation to support system demands and intermittent renewable generation as part of a clean electricity transition. TransAlta operates simple-cycle, combined-cycle and cogeneration facilities in Canada, the US and Australia. Natural gas facilities provide highly efficient electricity and, in the case of cogeneration, steam production, directly for customers and for wholesale markets. TransAlta is a significant operator of natural gas electricity in Canada and Australia. In 2021, our thermal facilities in Alberta have been fully transitioned to 100 per cent natural gas operation, which generates nearly 50 per cent fewer CO2 emissions fueled compared to coal. In aggregate, TransAlta has retired 4,064 MW of coal-fired generation capacity since 2018 while converting 1,659 MW to natural gas.
Coal Transition
As a result of our coal retirements and conversions to gas our energy use, GHG emissions, air emissions, waste generation and water usage will significantly decline. Transitioning off coal will eliminate all of our mercury emissions, the majority of particulate matter and sulphur dioxide emissions ("SO2"), as well as significantly reduce our NOx emissions. Our converted or repowered facilities will also use lower carbon natural gas, compared to facilities in other jurisdictions, as new methane reduction regulations in Alberta and Canada will reduce GHGs in the production and processing phase with respect to flaring and venting of methane (fugitive GHG emissions).
In 2021, we ceased coal-fired power generation in Canada. Our Centralia coal facility in the US will be retired by the end of 2025. Coal will be entirely eliminated from our operations by the end of 2025.
Energy Use
TransAlta uses energy in a number of different ways. We burn gas, diesel and coal (to the end of 2021 in Canada and the end of 2025 at Centralia) to generate electricity. We harness the kinetic energy of water and wind to generate electricity. We also generate electricity from the sun. In addition to combustion of fuel sources, we also track combustion of gasoline or diesel in our vehicles and the electricity use and fuel use for heating (such as natural gas) in the buildings we occupy. Knowledge of how much energy we use allows us to optimize and create energy efficiencies. As an electricity generator, we continually and consistently look for ways to optimize and create efficiencies related to the use of energy.
The following table captures our energy use (millions of gigajoules). Energy use declined by 31 per cent in 2021 over 2020, primarily as a result of reduced coal use. Some values do not sum to the indicated total due to rounding. Zeros (0) indicate truncated values:
| | | | | | | | | | | |
| Year ended Dec. 31 | 2021 | 2020 | 2019 |
| Hydro | 0 | 0 | 0 |
| Wind & Solar | 0 | 0 | 0 |
| Gas | 118 | 138 | 162 |
| Energy Transition | 74 | 141 | 184 |
| Corporate and Energy Marketing | 0 | 0 | 0 |
| Total energy use (million gigajoules) | 191 | 279 | 346 |
TRANSALTA CORPORATION M101
Management’s Discussion and Analysis
Air Emissions
Our coal facilities emit air emissions that we track, analyze and report to regulatory bodies. We also work on mitigation solutions depending on the type of air emission. We report our major air emissions from coal, which includes NOx, SO2, particulate matter and mercury. We will continue reducing air emissions in our existing fleet through our conversion and retirement of coal units in Alberta (completed in 2021) and Washington State (planned completion by the end of 2025). In 2020, we accelerated our target of 95 per cent SO2 and 50 per cent NOx emission reductions over 2005 levels by moving the target date from 2030 to 2026. In addition, we increased the stringency of our reduction levels for NOx to 80 per cent. Since 2005, we have reduced SO2 emissions by 90 per cent and NOx by 77 per cent. We continue to capture 80 per cent of mercury emissions at our coal facilities and, by the end of 2025, mercury emissions will be eliminated following the planned retirement of the Centralia facility. Particulate matter and SO2 emissions will also be virtually eliminated or considered negligible.
None of our Alberta coal facilities are located within 50 kilometres of dense or urban populations, and they all have been converted to gas in 2021. Our Centralia thermal facility in Washington State is 40 kilometres from a dense or urban population. As per guidance from SASB, “a facility is considered to be located near an area of dense population if it is located within 49 kilometres of an area of dense population” (being deemed to be a "minimum population of 50,000 persons"). The Centralia thermal facility has two units and we retired one unit in 2020 and will retire the additional unit by the end of 2025, at which time air emissions from our coal facilities will be eliminated.
Our gas facilities emit low levels of NOx that trigger reporting obligations to national regulatory bodies. These gas facilities also produce trace amounts of SO2 and particulate matter, but at levels that are deemed negligible and do not trigger any reporting requirements or compliance issues. Many of our gas facilities are located in very remote and unpopulated regions, away from dense urban areas. Our Sarnia, Windsor, Ottawa, Fort Saskatchewan and Ada gas facilities are our only facilities with air emissions within 49 kilometres of dense or urban environments.
Our total air emissions in 2021 decreased compared with 2020 levels. Specifically, NOx was reduced 29 per cent, particulate matter was reduced 80 per cent and SO2 was reduced 42 per cent over 2020 levels. Mercury emissions also decreased by 33 per cent over 2020 levels. Reductions in emissions were primarily due to shutdowns during coal-to-gas conversions and coal unit retirements.
The following table represents our material air emissions. Figures have been rounded to the nearest one thousand with the exception of particulate matter (rounded to the nearest one hundred) and mercury (rounded to the nearest ten):
| | | | | | | | | | | |
| Year ended Dec. 31 | 2021 | 2020 | 2019 |
SO2 (tonnes) | 7,000 | 12,000 | 16,000 |
NOx (tonnes) | 15,000 | 21,000 | | 26,000 | |
| Particulate matter (tonnes) | 790 | 4,000 | | 8,000 |
| Mercury (kilograms) | 40 | 60 | 60 |
Water
Our principal water use is for cooling and steam generation in our coal and gas facilities but our hydro operations also require water flow for operations. Water for coal and gas operations is withdrawn primarily from rivers where we hold permits and must adhere to regulations on the quality of discharged water. The difference between withdrawal and discharge, representing consumption, is due to several factors, which include evaporation loss and steam production for customers. Typically, TransAlta withdraws in the range of 220-240 million m3 of water across our fleet. In 2021, we withdrew approximately 240 million m3 (2020 - 230 million m3) and returned approximately 210 million m3 (2020 — 200 million m3) or 87 per cent. Overall, water consumption was approximately 30 million m3 (2020 — 40 million m3). Water consumption was lower in 2021 primarily due to shutdowns during coal-to-gas conversions and coal unit retirements.
Our water consumption reduction target is to reduce fleet-wide water consumption (withdrawals minus discharge) by 20 million m3 or 40 per cent in 2026 over a 2015 baseline. Water consumption in 2015 was 45 million m3. This target is in line with the UN SDGs, specifically "Goal 6: Clean Water and Sanitation." Our water consumption will fluctuate somewhat over the period of 2020-2025 as we transition off coal, convert and repower gas facilities and ramp production upwards.
TRANSALTA CORPORATION M102
Management’s Discussion and Analysis
The following represents our total water consumption (million m3) over the last three years. Some values do not sum to the indicated total due to rounding. Figures below have been rounded to the nearest 10 million m3:
| | | | | | | | | | | |
| Year ended Dec. 31 | 2021 | 2020 | 2019 |
| Water withdrawal | 240 | 230 | 260 |
| Water discharge | 210 | | 200 | 220 |
Total water consumption (million m3) | 30 | | 40 | 40 |
Our largest water withdrawal and discharge occurs at our Sarnia gas cogeneration facility (which produces both electricity and steam for our customer). The facility operates as a once-through, non-contact cooling system for our steam turbines. Despite large withdrawals from the adjacent St. Clair River to support our Sarnia operations, we return approximately 93 per cent of the water withdrawn. Water from this source is currently at low risk as per analysis from the SASB-endorsed Aqueduct Water Risk Atlas tool.
The Aqueduct Water Risk Atlas tool highlights that water risk is high at our interior and southern Western Australia facilities due to high interannual variability in the region. Interannual variability refers to wider variations in regional water supply from year to year. Our water supply at these facilities is provided at no cost under PPAs with our mining customers, hence our risk is significantly mitigated. In addition, our customers have developed conservation and re-use strategies aimed at recycling water for mining operational needs. All water used in the region is sourced from scheme water, and with respect to gas and diesel turbine water use, water wash techniques and frequency of activities are continually modified to minimize consumption and environmental impact. Water used in our operations is returned to our customers, who repurpose this water for vegetation and dust suppression in their mining operations.
At the South Hedland facility in Western Australia, water risk is also high due to the risk of flooding in the region. The South Hedland facility was built above normal flood levels to mitigate potential risk from flooding. During a category 4 cyclone event in the area and associated flooding in the region in 2019, the South Hedland facility stayed dry and continued to generate power for the region. In addition, the South Hedland facility has developed a Water Efficiency Management Plan with Water Corporation WA, the principal supplier of water, wastewater and drainage services in Western Australia. Initiatives are aimed at reducing water consumption and costs through innovative technology and efficiencies identified through facility management.
In southern Alberta, our hydroelectric facilities have played an increasingly important water management role following the flood of 2013. In 2021, we renewed for another five years our previous agreement with the Government of Alberta to manage water on the Bow River at our Ghost Reservoir facility to aid in potential flood mitigation efforts, as well as at our Kananaskis Lakes System (which includes Interlakes, Pocaterra and Barrier) for drought mitigation efforts.
Waste
The importance of environmental protection and managing waste is outlined in our Total Safety Management Policy as a corporate responsibility for TransAlta, and a responsibility of each employee and contractor working on TransAlta's behalf. Our waste data is reported annually to a number of different regulatory bodies.
Our waste reduction target is that by 2022 TransAlta will reduce total waste generation by 80 per cent over a 2019 baseline of 1.5 million tonnes equivalent of waste generation. This is in line with the UN SDGs, specifically, "Goal 12: Responsible Consumption and Production."
In 2021, our operations generated approximately 515,000 tonnes equivalent of waste (2020 — 1.1 million tonnes). Of the total waste generated, 95 per cent was non-hazardous waste and 5 per cent was hazardous waste. In 2021, only 0.2 per cent of total waste generated was directed to landfill. Our 2020 waste data was revised in 2021 after we received final waste manifests as part of the reclamation project at our Mississauga facility. As a result, approximately 23,000 tonnes equivalent were added to Mississauga in multiple waste categories in 2020.
TRANSALTA CORPORATION M103
Management’s Discussion and Analysis
The following represents our total waste production over the last three years. Figures have been rounded to the nearest one thousand:
| | | | | | | | | | | |
| Year ended Dec. 31 | 2021 | 2020 | 2019 |
| Total waste generation (tonnes equivalent) | 515,000 | | 1,135,000 | | 1,533,000 | |
| Waste to landfill (tonne eq.) | 1,000 | | 11,000 | | 1,000 | |
| Waste recycled (tonne eq.) | 31,000 | | 31,000 | | 6,000 | |
| Waste reuse (tonne eq.) | 176,000 | | 533,000 | | 746,000 | |
| % of total waste to landfill | 0.2 | | 1 | | 0.07 | |
| % of total waste: hazardous | 5 | | 2 | | 1 | |
| % hazardous waste to landfill | 0.9 | | 0.4 | | 0.6 | |
Our reuse waste or byproduct waste is generally sold to third parties. Byproduct sales and associated annual revenue generation typically ranges from $15 million to $20 million. Our operating teams are diligent at not only minimizing waste, but also maximizing recoverable value from waste. We have invested in equipment to capture byproducts from the combustion of coal, such as fly ash, bottom ash, gypsum and cenospheres, for subsequent sale. These non-hazardous materials add value to products like cement and asphalt, wallboard, paints and plastics.
Given our transition off coal, we ceased producing fly ash waste in Canada at the end of 2021 and will no longer produce it past the end of 2025 in the US. The Company is looking at recovering fly ash that was returned to its original source at Highvale mine to replace this supply, which is used extensively in the concrete industry. By turning the recovered product into something marketable, it will continue to aid in reducing the amount of cement produced and consequent emissions while offering new job and economic growth opportunities. This innovative technology contributes to a circular economy and will reduce reclamation liabilities for TransAlta.
Biodiversity
The importance of environmental protection and biodiversity is outlined in our Total Safety Management Policy as a corporate responsibility for TransAlta, and a responsibility of each employee and contractor working on TransAlta's behalf.
Overseeing biodiversity-related issues
TransAlta's GSSC assists the Board in fulfilling its oversight responsibilities with respect to the Company’s monitoring of environmental regulations, public policy changes and the development of strategies, policies and practices for the environment. For further information, please refer to the Sustainability Governance section of this MD&A.
Assessing biodiversity impacts of our value chain
We consider the biodiversity impact at all of our existing operations (a greater focus has been given to mining operations) and the biodiversity impacts of all new growth projects are evaluated in line with regulatory compliance and with respect to TransAlta's focus on biodiversity health. Details on how we asses biodiversity impacts of our value chain are presented in the sections below.
Growth
Each new TransAlta development project must complete an in-depth environmental assessment (as prescribed by the local regulation and in line with our own assessment practices) describing baseline environmental conditions, identifying potential effects and developing mitigation strategies for identified environmental sensitivities prior to construction and operation. These assessments have been specifically designed to meet the environmental information requirements of the respective regions in which we operate while identifying alignment with the intent of the standards and/or regulations applicable to these jurisdictions (e.g., Wildlife Directive for Alberta Wind Energy Projects, US Fish & Wildlife Service Land-Based Wind Energy Guidelines, etc.). Typically, our renewable projects are greenfield development projects that require a higher level of evaluation compared to our gas projects, which integrate into existing industrial facilities.
In addition, TransAlta provides a detailed wildlife mitigation plan to environmental regulators outlining specific measures that will be employed to mitigate the effects that project construction and operation activities may have on wildlife, wildlife habitat and specific wildlife features identified during environmental studies completed during the development stage.
TRANSALTA CORPORATION M104
Management’s Discussion and Analysis
Each greenfield development project has a detailed stakeholder consultation plan designed to ensure all potentially impacted host landowners, stakeholders, agencies, businesses, non-governmental organizations ("NGOs"), environmental NGOs and Indigenous communities understand the nature of the projects, have multiple and varied opportunities for engagement and feedback, and are able to engage in meaningful dialogue and discussion with TransAlta and its representatives. The ultimate goal is addressing, solving and mitigating stakeholder or Indigenous community biodiversity concerns before filing major permit applications for all of our projects.
Day-to-day operations
At our Alberta operations, in 2021 we continued with our Wildlife Monitoring Program designed to monitor wildlife abundance and species diversity in the study area over time. Based on these surveys, TransAlta has seen primarily stable or increasing biodiversity in the area, with various new bird species being detected over the years and incidents of vehicle collisions decreasing due to lower speed limit restrictions. Some animal population sizes fluctuate in the area based on weather conditions and available ground cover.
Our natural gas operations have a relatively limited impact on biodiversity. The facilities are frequently constructed adjacent to existing industrial operations, and TransAlta may not always be the holder of the environmental permits. The land area these facilities occupy is also generally relatively small. One exception is our Sarnia cogeneration facility. This facility is made up of 260 acres of brownfield industrial land, some of which contains areas with tall grasses and potential wildlife. Care will be taken at the time of redevelopment of this land to minimize impact to species-at-risk through the completion of species-at-risk surveys as well as performing certain construction activities outside of nesting periods. For all sites that are under our environmental scope, we adhere to all relevant environmental compliance permits.
At our hydro facilities, a major focus is on reducing the impact on fish and fish habitat. We adhere to provincial and federal regulations and operate in accordance with facility approvals. We continue to work toward operational improvement and regularly review our Environmental Operational Management Plans to ensure our operating parameters are met.
At our wind and solar operations, the business unit has established the WiSPER (Wind Stewardship Planning and Environmental Reporting) Program. The goal of the program is to provide continuous improvement and ongoing environmental monitoring programs beyond TransAlta’s regulatory requirements. This is achieved through periodic verification and inspection programs, and through collaboration with industry and the scientific community to address environmental concerns and impacts. An Operational Environmental Management Plan has been developed for each renewable asset to ensure that our facilities use environmentally sound and responsible practices that are based on a philosophy of continuous improvement of environmental protection through a program of inspection, monitoring and review.
Examples of WiSPER initiatives to support our biodiversity focus include our Avian Protection Program (installation of covers to protect birds from possible electrocution), a bird and bat mortality database (records all injuries and mortalities), environmentally sensitive resource monitoring (monitoring sensitive wildlife features in and around our operating wind facilities such as raptor nests and sharp-tailed grouse leks), long-term dataset collections (e.g., wildlife studies pre-construction and post-construction) and community wind education programs.
Land Use
The largest land use associated with our operations is for surface mining of coal. Of the three mines we have operated, the Whitewood mine in Alberta is completely reclaimed and the land certification process is ongoing. Our Centralia mine in Washington State is currently in the reclamation phase and we have adopted a target to fully reclaim this mine by 2040. Reclamation work continued on the Centralia mine in 2021, including the planting of 23,330 trees.
Our Highvale mine in Alberta ceased operations on Dec. 31, 2021, as part of our target to discontinue coal-fired power generation in Canada at the end of 2021. The mine reclamation has been progressively executed as part of our regulatory approvals, and our target is to have it fully reclaimed by 2046. Approximately 26,000 trees were planted in 2021 at our Highvale mine. In 2021, our reclamation team obtained regulatory approval for our interim reclamation plans, until submission of final reclamation plan in 2022. The updated plans align with community priorities for the reclaimed land. Our reclamation plans at Highvale are set out on a life-cycle basis and include contouring disturbed areas, re-establishing drainage, replacing topsoil and subsoil, re-vegetation and land management.
Our mining practice incorporates progressive reclamation where the final end use of the land is considered at all stages of planning and development. Across our mining operations, to date we have reclaimed approximately 12,000 acres (4,800 hectares), which is approximately 38 per cent of land disturbed.
TRANSALTA CORPORATION M105
Management’s Discussion and Analysis
Environmental Incidents and Spills
Minimizing our impact on the environment supports healthy ecosystems and mitigates our environmental compliance risk and reputational risk. We maintain corporate incident management procedures, as part of our Total Safety Management System, for appropriate initial response, investigation and lessons learned to minimize environmental incidents. With respect to biodiversity management (management of ecosystems, natural habitats and life in the areas we operate), we seek to establish robust environmental research and data collection to establish scientifically sound baselines of the natural environment around our facilities to ensure we can accurately evaluate the level of significance to biodiversity following an incident. We closely monitor the air, land, water and wildlife in these areas to identify and curtail potential impacts.
In 2021, we recorded two regulatory non-compliance environmental incidents (2020 – two incidents). One incident occurred at our Sarnia cogeneration facility and was a wastewater discharge exceedance from our neutralization sump during water treatment. The second incident was related to regulatory compliance at our Centralia facility that resulted in an environmental permit exceedance when a worker opened the incorrect fan breaker. Both incidents had negligible environmental impacts, but the Centralia incident resulted in one enforcement action and a US$3,100 fine from the regulator.
| | | | | | | | | | | |
| Regulatory non-compliance environmental incidents follow: |
| Year ended Dec. 31 | 2021 | 2020 | 2019 |
| Regulatory non-compliance environmental incidents | 2 | 2 | 6 |
Regarding spills and releases, typical spills that could occur at our operation sites are hydrocarbon-based. Spills generally happen in low environmental impact areas and are almost always contained and fully recovered. It is extremely rare for large spills to occur. Efforts are placed on providing immediate response to all environmental spills to ensure assessment, containment and recovery of spilled materials result in minimal impact to the environment.
The estimated volume of spills in 2021 was 6 m3 (2020 — 4 m3). Spill volumes in 2021 were higher due to one environmental incident recorded at our Centralia facility. The incident involved the release of mineral oil due to the failure of a phase generator step-up transformer. Spill response and control efforts were initiated immediately following the incident and environmental impacts were negligible and minimized due to the efficient response.
| | | | | | | | | | | |
| Significant environmental incidents follow: | | | |
| Year ended Dec. 31 | 2021 | 2020 | 2019 |
| Significant environmental incidents | 0 | 6 | 3 |
There is a potential that ash ponds associated with our remaining coal facilities could fail. The probability of this occurring is low, but the impact could be significant. We follow applicable environmental regulations with respect to our ash ponds and satisfy ourselves that management is adequate given the robust regulations in the jurisdictions where we operate. Management includes periodic inspections and appropriate mitigation if issues are uncovered.
Weather
Abnormal weather events can impact our operations and give rise to risks. Due to the nature of our business, our earnings are sensitive to weather variations from period to period. Variations in winter weather affect the demand for electrical heating requirements. Variations in summer weather affect the demand for electrical cooling requirements. These variations in demand translate into spot market price volatility. Variations in precipitation also affect water supplies, which in turn affect our hydroelectric assets. Also, variations in sunlight conditions can have an effect on energy production levels from our solar facility. Variations in weather may be impacted by climate change resulting in sustained higher temperatures and rising sea levels, which could have an impact on our generating assets. Ice can accumulate on wind turbine blades in the winter months. The accumulation of ice on wind turbine blades depends on a number of factors, including temperature and ambient humidity. Accumulated ice can have a significant impact on energy yields and could result in the wind turbine experiencing more downtime. Extreme cold temperatures can also impact the ability of wind turbines to operate effectively and this could result in more downtime and reduced production. In addition, climate change could result in increased variability to our water and wind resources.
TRANSALTA CORPORATION M106
Management’s Discussion and Analysis
Our generation facilities and their operations are exposed to potential damage and partial or complete loss resulting from environmental disasters (e.g., floods, strong winds, wildfires, earthquakes, tornados and cyclones), equipment failures and other events beyond our control. Climate change can increase the frequency and severity of these extreme weather events. The occurrence of a significant event that disrupts the operation or ability of the generation facilities to produce or sell power for an extended period, including events that preclude existing customers from purchasing electricity, could have a material adverse effect. In certain cases, there is the potential that some events may not excuse us from performing our obligations pursuant to agreements with third parties. The fact that several of our generation facilities are located in remote areas may make access for repair of damage difficult.
During the past three years, we have experienced no significant impacts to annual financial results due to deviations from expected weather patterns.
Please refer to the Governance and Risk Management section of this MD&A for further discussion on weather-related risks.
Reliable, Low-Cost and Sustainable Energy Production
TransAlta’s goal is to be a leading customer-centred clean electricity company, one that is committed to a sustainable future. Our strategy is focused on meeting our customers' need for clean, low-cost and reliable electricity, operational excellence and continual improvement in everything that we do, which is a core ethos of our company. This section covers manufactured, intellectual, and social and relationship capital management as per guidance from the International Integrated Reporting Framework.
Brand Recognition
Our business resilience is enhanced by a purpose-based, long-term and sustainable business strategy: growth in renewable electricity, optimization of our existing natural gas generation, and a commitment to sustainability. TransAlta has operated power-generation assets for over 110 years, which reflects this approach to long-term and sustainable business practices. A long-term commitment to business and partnerships lends itself to goodwill and brand recognition, something we value and do not take for granted. We believe our low-cost and clean electricity strategy, supported by our internal values and sustainable approach to business, will help reinforce and continue to increase our positive brand recognition.
Diversified Knowledge
At TransAlta, we define intellectual capital as our knowledge-based assets. Measuring these assets serves two purposes. First, we seek to understand them so we can improve their management and performance. Second, we seek to understand these assets to communicate their real value. The experience and acumen of our employees enhances our value creation. Our experience in developing and operating power-generation technologies extends to over 110 years, and many of our employees have worked with us for over 30 years. Our energy marketing business complements our knowledge of operating power-generation assets.
Our experience in developing and operating power-generation technologies is highlighted below.
| | | | | |
| Power-Generation Type | Operating Experience (years) |
| Hydro | 110 |
| Natural Gas | 71 |
| Coal | 71 |
| Wind | 19 |
| Solar | 6 |
For further details, please refer to Customers in the Engaging with Our Stakeholders to Create Positive Relationships section of this MD&A.
TRANSALTA CORPORATION M107
Management’s Discussion and Analysis
Grid Resiliency
As a large electricity generator, TransAlta works diligently to ensure the power we provide our customers is reliable, affordable and has low environmental impact. We provide decentralized and customized power solutions to industrial customers. In 2021, TransAlta agreed to build the Northern Goldfields Solar Project in Western Australia to provide renewable solar electricity supported with a battery energy storage system to the Goldfields-based operations of BHP. We also supply power to centralized power systems and own and operate transmission grid infrastructure in Alberta that addresses system reliability needs.
In all jurisdictions where we operate, we work closely with the system operators to ensure overall supply adequacy and reliability of the grid. We consider a myriad of factors in our planning and operation decisions that could put grid resiliency at risk, including renewable energy intermittency, cyberattacks, extreme weather events and natural disasters. We are also committed to ensuring strong compliance with North American Electric Reliability Corporation standards and Alberta Reliability Standards for the power plant and transmission infrastructure that we own and operate.
As a Company, we are keenly focused on deploying clean power generation and new technology solutions to meet the emerging and future needs of the electric system that we operate in. For example, in Alberta, we brought online the first battery storage project, called WindCharger, in 2020 that is co-located with our Summerview II wind facility to create an emissions-free, peaking resource. This resource is participating in the AESO’s pilot fast frequency response initiative to support intertie operations. Beyond the fast frequency response initiative, WindCharger introduces a resource with a response time that is unmatched by existing generation technologies and can be operated with a high level of reliability to support the growing need for inertial response and resiliency to support a decarbonized grid with a supply mix made up of intermittent renewable resources.
For more information on technologies to support grid resiliency, please refer to Applied Technologies in the Technology Adoption and Innovation Focus section of this MD&A. For more guidance on cyberattacks, please refer to Public Health and Safety in the Engaging with Our Stakeholders to Create Positive Relationships section of this MD&A. For more information on extreme weather events and natural disasters, please refer to Weather in the Progressive Environmental Stewardship section of this MD&A.
TRANSALTA CORPORATION M108
Management’s Discussion and Analysis
Technology Adoption and Innovation Focus
Technology and innovation are an existing and increasing focus at TransAlta. As we navigate significant macro changes from energy transition, the impacts of climate change and decarbonization, and the continued rise of digital technology, automation and artificial intelligence, we are proactively applying technology solutions across our business. Our conversion of coal units to gas is an excellent example of utilizing useful manufactured capital or infrastructure. We also continue to adopt and apply innovative solutions to meet customer demand for power.
Idea Generation and Project Management
Our Greenlight program continues to be a driving force behind the strong culture of idea generation and problem solving at TransAlta. Led by our Transformation Office, the program emphasizes bottom-up innovation, which means business improvement ideas are generated by employees. These ideas are developed and advanced into business cases, adhering to best practices of project management, to ensure successful implementation of the improvement opportunity. From the initial ideation, to development and delivery, this process is driven entirely by employees, with support from management and the Transformation Office.
Another initiative we promote is the Supplier Innovation Series, which brings in guest speakers from outside TransAlta to discuss innovation. This includes thought leaders on new technologies to discuss conceptual ideas that initiate creative thinking and suppliers that provide insight into commercial applications of evolving technologies. In 2021, we delivered seven sessions on topics such as artificial intelligence, behaviours for achieving success, frontline and corporate worker apps, hydrogen, mobile robots, robotic inspections for boiler and piping systems, and strategic foresight. For further details on how we invest in our workforce, please refer to Talent and Employee Development in the Building a Diverse and Inclusive Workforce section of this MD&A.
Infrastructure Innovation
In 2015, the Government of Alberta introduced regulations designed to end coal-powered generation in the province by 2030. A number of our coal facilities had useful lives beyond 2030 and could be converted to use natural gas. In 2021, our Sundance Unit 5 facility was retired, and Keephills Unit 2, Keephills Unit 3 and Sundance Unit 6 were converted to natural gas. This means TransAlta’s thermal facilities in Alberta have been fully transitioned to 100 per cent natural gas operation. In aggregate, the Company has retired 4,064 MW of coal-fired generation capacity since 2018 while converting 1,659 MW to cleaner-burning natural gas. Overall, the converted units generate nearly 50 per cent fewer CO2 emissions fueled by natural gas compared to coal. Repurposing the facilities rather than decommissioning them supports the concept of reuse and aligns with the UN SDGs, specifically "Goal 9: Industry, Innovation and Infrastructure." The completed conversions and the closure of the Highvale coal mine also contribute to the goals of the Powering Past Coal Alliance, which TransAlta joined at COP26.
Applied Technologies
TransAlta has been at the forefront of innovation in the power-generation sector since the early 1900s when we developed hydro assets. We have been an early adopter and developer of wind technology in Canada and are now one of the largest wind generators in the country. Today we run a Wind Control Centre that monitors, to the second, every wind turbine we operate across North America. In 2015, we made our first investment in solar technology with the purchase of a 21 MW solar facility in Massachusetts and in 2020 we installed the first utility-scale battery in Alberta at our Summerview II wind facility. As we balance growth with decarbonization, we continue to seek solutions to innovate and create value for investors, society and the environment.
In early 2021, TransAlta entered into a long-term PPA with Pembina for the offtake of 100 MW from our proposed 130 MW Garden Plain wind project, to be located in Alberta. The project began in 2021, with a target commercial operation date in the second half of 2022. In late 2021, TransAlta entered into two long-term PPAs for the offtake of 100 per cent of the generation from its 300 MW White Rock Wind Projects located in Oklahoma. Contracting the renewable electricity and environmental attributes to an outstanding new customer with an AA credit rating from S&P Global Ratings enables TransAlta to move into the construction phase expected to begin in late 2022 with a target commercial operation date in the second half of 2023. The delivery of low-cost, reliable and clean energy from Garden Plain and White Rock supports our customers' sustainability goals and represents another step towards executing our growth plan of delivering 2 GW of capacity by 2025, which was announced in September 2021.
TransAlta is actively advancing its development pipeline, which currently consists of 800 MW in the US, up to 2 GW in Canada and 270 MW in Australia. In 2021, TransAlta acquired a 122 MW portfolio of operating solar sites located in North Carolina, which will represent a significant expansion of our solar generation. We intend to further expand our solar generation by actively pursuing solar opportunities in the US and Australian markets. The Company is also focused on pursuing hybrid integrated power solutions with customers.
TRANSALTA CORPORATION M109
Management’s Discussion and Analysis
We continue to invest in battery storage. In 2021, TransAlta agreed to provide renewable solar electricity supported with a battery energy storage system to the Goldfields-based operations of BHP through the construction of the Northern Goldfields Solar Project in Western Australia. The project consists of the 27 MW Mount Keith Solar Farm, 11 MW Leinster Solar Farm and 10 MW/5 MWh Leinster Battery Energy Storage System and interconnecting transmission infrastructure, all of which will be integrated into TransAlta’s 169 MW Southern Cross Energy North remote network. The network and new generation will support BHP to meet its emissions reduction targets and to deliver lower carbon, sustainable nickel to its customers. The Northern Goldfields Solar Project is expected to reduce BHP’s scope 2 electricity GHG emissions from its Leinster and Mount Keith operations by 540,000 tonnes of CO2e over the first 10 years of operation. Construction of the project commenced in early 2022 and commercial operations are targeted in late 2022.
Our teams continuously explore the use of applied or new technologies such as hydrogen and CCUS to find solutions and to expand or adapt our fleet. This helps protect our shareholder value and maintain delivery of reliable and affordable electricity to our costumers. We know that new technologies will emerge over the next number of years as the industry continues to drive towards lower emissions while maintaining a reliable and affordable product for customers.
Asset Analytics and Optimization
TransAlta's Asset Analytics and Optimization (“AAO”) team, formerly the Operations Diagnostic Centre, was founded in 2008. This team monitors coal-fired steam, gas-fired steam, simple-cycle, combined-cycle/cogeneration and wind-generating assets across Canada, the US and Australia. A centralized team of engineers and operations specialists remotely monitors our power facilities for emerging equipment reliability and performance issues.
AAO staff are trained in the development and use of specialized equipment monitoring and performance assessment software and they apply their experience to power facility operations. If an issue is detected, the AAO will initially assess and then notify facility operations of their findings to support investigation and remedy of the issue before there is an impact to operations. This support is critical for reliability and performance of our operations. By way of example, if a wind turbine starts to show very early signs of equipment change compared to others, our operation team is notified and will work to investigate and remedy the issue. The monitoring, analysis and diagnostics completed by the AAO are focused on early identification of equipment issues based on longer-term trend analysis and complements day-to-day facility operations.
The AAO team also performs production reporting functions for the coal-fired steam, gas-fired steam, simple-cycle, combined-cycle/cogeneration and wind-generating assets, and are actively engaged in projects to improve this reporting.
Data and Innovation
TransAlta created the Data and Innovation team in 2019 to modernize its data infrastructure to take advantage of new opportunities in analytics and data science. The Data and Innovation team is cross-functional, composed of data architects, data scientists, data analysts, software developers, engineers, project managers, and financial and systems analysts. The team focuses its efforts on the delivery and enhancement of TransAlta’s Modern Data Architecture, the rapid delivery of data-driven applications, the design and implementation of machine learning and artificial intelligence models and the advancement of process automation through the Robotic Process Automation Centre of Excellence. In 2021, the Data and Innovation team worked with partners across the business to create new decision support tools and processes that improve our financial position and return capacity to our people. A few of the highlights from this work include:
▪GenOS is a digital platform that provides near real-time performance awareness and operational decision support for our Generation fleet. By packaging the analytics and data science models of our operational data into a central platform, we are able to intuitively deliver insights to the Operations teams that drive real revenue increases and a reduction in costs. Built in-house, we have focused on onboarding our Wind and Solar fleet and have begun work with the Gas and Hydro teams.
▪Industry partnership with AltaML Applied AI Lab, a groundbreaking initiative that focuses on building and expanding local talent while improving our business through the application of machine learning and artificial intelligence. The 2021 cohort worked on 11 data science use cases including building an energy market peak prediction model for our Trading team and a river flow forecasting model for our Hydro operations.
TRANSALTA CORPORATION M110
Management’s Discussion and Analysis
Sustainability Governance
In order for an organization to truly integrate sustainability, it requires accountability at the Board and executive level. It requires an understanding of ESG issues and associated corporate actions to address these issues, while continuing to balance operations and growth.
Sustainability is overseen by TransAlta's GSSC of the Board. The GSSC assists the Board in fulfilling its oversight responsibilities with respect to the Company’s monitoring of climate change, environmental, health and safety regulations, public policy changes and the development of strategies, policies and practices for climate change, environment, health and safety, and social well-being, including human rights, working conditions and responsible sourcing.
The following policies help govern sustainability at TransAlta, and are publicly available in the Governance section of the Investor Centre on our website:
▪Corporate Code of Conduct
▪Supplier Code of Conduct
▪Whistleblower Policy
▪Total Safety Management Policy
▪Human Rights and Discrimination Policy
▪Indigenous Relations Policy
▪Board and Workforce Diversity Policy, and Diversity and Inclusion Pledge
Our sustainability memberships include key sustainability organizations and working groups such as the EXCEL Partnership, the Canadian Business for Social Responsibility and the Canadian Electricity Association Sustainable Electricity Steering Committee, which all provide validation and support of our sustainability strategy and practices.
For additional details on governance, please refer to the Governance and Risk Management section of this MD&A.
Governance and Risk Management
Our business activities expose us to a variety of risks and opportunities including, but not limited to, regulatory changes, rapidly changing market dynamics and increased volatility in our key commodity markets. Our goal is to manage these risks and opportunities so that we are in a position to develop our business and achieve our goals while remaining reasonably protected from an unacceptable level of risk or financial exposure. We use a multilevel risk management oversight structure to manage the risks and opportunities arising from our business activities, the markets in which we operate and the political environments and structures with which we interface.
Governance
The key elements of our governance practices are:
▪Employees, management and the Board are committed to ethical business conduct, integrity and honesty;
▪We have established key policies and standards to provide a framework for how we conduct our business;
▪The Chair of our Board and all directors, other than our President and CEO, are independent within the meaning of National Instrument 58-101 — Disclosure of Corporate Governance Practices;
▪The Board is comprised of individuals with a mix of skills, knowledge and experience that are critical for our business and our strategy;
▪The effectiveness of the Board is achieved through robust annual evaluations and continuing education of our directors; and
▪Our management and Board facilitate and foster an open dialogue with shareholders and community stakeholders.
Commitment to ethical conduct is the foundation of our corporate governance model. We have adopted the following codes of conduct to guide our business decisions and everyday business activities:
▪Corporate Code of Conduct, which applies to all employees and officers of TransAlta and its subsidiaries;
▪Directors’ Code of Conduct;
▪Supplier's Code of Conduct;
▪Finance Code of Ethics, which applies to all financial employees of the Company; and
▪Energy Trading Code of Conduct, which applies to all of our employees engaged in energy marketing.
TRANSALTA CORPORATION M111
Management’s Discussion and Analysis
Our codes of conduct outline the standards and expectations we have for our employees, officers, directors, consultants and suppliers with respect to, among other things, the protection and proper use of our assets. The codes also provide guidelines with respect to securing our assets, avoiding conflicts of interest, respect in the workplace, social responsibility, privacy, compliance with laws, insider trading, environment, health and safety, and our commitment to ethical and honest conduct. Our Corporate Code of Conduct and Directors' Code of Conduct each goes beyond the laws, rules and regulations that govern our business in the jurisdictions in which we operate; they outline the principal business practices with which all employees and directors must comply.
Our employees, officers and directors are reminded annually about the importance of ethics and professionalism in their daily work, and must certify annually that they have reviewed and understand their responsibilities as set forth in the respective codes of conduct. This certification also requires our employees, officers and directors to acknowledge that they have complied with the standards set out in the respective code during the last calendar year.
The Board provides stewardship of the Company and ensures that the Company establishes key policies and procedures for the identification, assessment and management of principal risks and strategic plans. The Board monitors and assesses the performance and progress of the Company’s goals through candid and timely reports from the CEO and the senior management team. We have also established an annual evaluation process whereby our directors are provided with an opportunity to evaluate the Board, Board committees, individual directors and the Chair of the Board’s performance.
In order to allow the Board to establish and manage the financial, environmental, and social elements of our governance practices, the Board has established the AFRC, GSSC, the Human Resources Committee (the “HRC”) and the IPC.
The AFRC, consisting of independent members of the Board, provides assistance to the Board in fulfilling its oversight responsibility relating to the integrity of our consolidated financial statements and the financial reporting process; the systems of internal accounting and financial controls; the internal audit function; the external auditors’ qualifications and terms and conditions of appointment, including remuneration, independence, performance and reports; and the legal and risk compliance programs as established by management and the Board. The AFRC approves our Commodity and Financial Exposure Management policies and reviews quarterly ERM reporting.
The GSSC is responsible for developing and recommending to the Board a set of corporate governance principles applicable to the Company and for monitoring compliance with these principles. The GSSC is also responsible for Board recruitment, succession planning and for the nomination of directors to the Board and its committees. In addition, the GSSC assists the Board in fulfilling its oversight responsibilities with respect to the Company’s monitoring of climate change, environmental, health and safety regulations, public policy changes and the development of strategies, policies and practices for climate change, environmental, health and safety, and social well-being, including human rights, working conditions and responsible sourcing. The GSSC also receives an annual report on the annual codes of conduct certification process. For further information on the Board's oversight of climate-related factors, please refer to the Climate Change Governance in Environmental, Social and Governance ("ESG") section of this MD&A.
In regards to overseeing and seeking to ensure that the Company consistently achieves strong environment, health and safety (“EH&S”) performance, the GSSC undertakes a number of actions that include: i) receiving regular reports from management regarding environmental compliance, trends and TransAlta’s responses; ii) receiving reports and briefings on management’s initiatives with respect to changes in climate change legislation, policy developments as well as other draft initiatives and the potential impact such initiatives may have on our operations; iii) assessing the impact of the GHG policies implementation and other legislative initiatives on the Company’s business; iv) reviewing with management the EH&S policies of the Company; v) reviewing with management the health and safety practices implemented within the Company, as well as the evaluation and training processes put in place to address problem areas; vi) discussing with management ways to improve the EH&S processes and practices; and vii) reviewing the effectiveness of our response to EH&S issues and any new initiatives put in place to further improve the Company’s EH&S culture.
The HRC is empowered by the Board to review and approve key compensation and human resources policies of the Company that are intended to attract, recruit, retain and motivate employees of the Company. The HRC also makes recommendations to the Board regarding the compensation of the CEO, including the review and adoption of equity-based incentive compensation plans, the adoption of human resources policies that support human rights and ethical conduct, and the review and approval of executive management succession and development plans.
TRANSALTA CORPORATION M112
Management’s Discussion and Analysis
The IPC is empowered by the Board to oversee management's investment conclusions and the execution of major, Board-approved capital expenditure projects that further the Company's strategic plans. The IPC provides assistance to the Board in fulfilling its oversight responsibilities with respect to broadly reviewing and monitoring project management and control processes, financial profile, capital costs, procurement practices, and project schedules in a more in-depth manner than time permits during regularly scheduled Board meetings.
The responsibilities of other stakeholders within our risk management oversight structure are described below:
The CEO and executive management review and report on key risks quarterly. Specific Trading Risk Management reviews are held monthly by the Commodity Risk and Compliance Committee, and weekly by the commodity risk team, the commercial managers in Trading and Marketing, and the Executive Vice-President, Finance & Trading and Chief Financial Officer.
The Investment Committee is a Management committee chaired by our Senior Vice President, M&A, Strategy and Treasurer and is also comprised of the CEO, Executive Vice-President, Finance & Trading and Chief Financial Officer, Chief Operating Officer, and Executive Vice-President, Legal, Commercial and External Affairs. It reviews and approves all major capital expenditures including growth, productivity, life extensions and major coal outages. Projects that are approved by the Investment Committee will then be put forward for approval by the Board, if required.
The Commodity Risk & Compliance Committee is chaired by our Executive Vice-President, Finance & Trading and Chief Financial Officer and is comprised of at least three members of senior management. It oversees the risk and compliance program in trading and ensures that this program is adequately resourced to monitor trading operations from a risk and compliance perspective. It also ensures the existence of appropriate controls, processes, systems and procedures to monitor adherence to policy.
The Hydro Operating Committee consists of two members who are Brookfield employees with expertise in hydro facility management, and two TransAlta members. This committee was formed in 2019 for the purpose of collaborating on matters in connection with the operation, and maximization of the value, of TransAlta's Alberta Hydro Assets. It is delivering on its objectives by reviewing the operating, maintenance, safety and environmental aspects of TransAlta's Alberta Hydro Assets and, following that review, providing expert advice and recommendations to TransAlta’s hydro operational team. The Hydro Operating Committee has an initial term of six years, which can be extended for an additional two years.
TransAlta is listed on the TSX and the New York Stock Exchange and is subject to the governance regulations, rules and standards applicable under both exchanges. Our corporate governance practices meet the following governance rules of the TSX and Canadian Securities Administrators: i) Multilateral Instrument 52-109 — Certification of Disclosure in Issuers’ Annual and Interim Filings; ii) National Instrument 52-110 — Audit Committees; iii) National Policy 58-201 — Corporate Governance Guidelines; and iv) National Instrument 58-101— Disclosure of Corporate Governance Practices. As a “foreign private issuer” under US securities laws, we are generally permitted to comply with Canadian corporate governance requirements. Additional information regarding our governance practices can be found in our most recent management information circular.
Global Pandemic
We have adopted a number of risk mitigation measures in response to the COVID-19 pandemic. The Board and management is monitoring the development of the outbreak and are continually assessing its impact on the Company's operations, supply chains and customers, as well as, more generally, to the business and affairs of the Company. Potential impacts of the pandemic on the business and affairs of the Company include, but are not limited to: potential interruptions of production, supply chain disruptions, unavailability of employees at TransAlta, potential delays in growth projects, increased credit risk with counterparties and increased volatility in commodity prices and the valuations of financial instruments. In addition, the broader impacts to the global economy and financial markets could have potential adverse impacts on the availability of capital for investment and the demand for power and commodity pricing.
TRANSALTA CORPORATION M113
Management’s Discussion and Analysis
To manage the risks resulting from COVID-19, we continue to take a number of steps in furtherance of the Company's business continuity efforts:
Management Responses
▪Regularly communicated with the Board and employees in regard to the Company's response to COVID-19;
▪Maintained and updated COVID-19 safety protocols, including a back-to-office and site strategy, and a remote work strategy that will remain in place until the pandemic becomes an endemic; and
▪Developed leadership plans, including contingent authorities.
Policy Changes
▪We continue to align all non-essential travel and quarantine requirements with local jurisdictional guidance for all TransAlta employees and contractors for all jurisdictions in which we operate.
Employee Changes
▪Provided continued assurances to employees that their employment with TransAlta would not be impacted by the COVID-19 pandemic;
▪Implemented and have maintained health screening procedures, including questionnaires and temperature tests, enhanced cleaning measures and strict work protocols at the Company’s offices and facilities in accordance with our back-to-office and site strategy to ensure that employees remain safe;
▪Maintained policies to seamlessly allow non-essential employees to work remotely, as appropriate; and
▪Provided COVID-19 related town halls and information sessions for employees featuring medical and epidemiologists.
Operational Changes
▪Modified our operating procedures and implemented restrictions to non-essential access to our facilities to support continued operations through the pandemic;
▪Reviewed the supply chain risk associated with all key power-generation process inputs and implemented weekly monitoring for changes in risk;
▪Reached out to key supply chain contacts to determine strategies and contingencies to ensure we are able to continue to progress our growth projects, wherever possible; and
▪Identified new cybersecurity risks associated with phishing emails and enhanced security protocols and increased awareness of potential threats.
Financial Oversight
▪Continued to maintain a comprehensive commodity hedging program for our merchant assets that can respond to changes in underlying market conditions;
▪Continued to monitor counterparties for changes in creditworthiness, as well as monitor their ability to meet obligations; and
▪Continued to monitor the situation and communicate with our key lenders on any foreseeable impacts and on our response to the crisis. We maintain a strong financial position and significant liquidity with our existing committed credit facilities.
Overall, we continue to actively monitor the situation and advice from public health officials with a view to responding to changing recommendations and adapting our response and approach as necessary.
Risk Controls
Our risk controls have several key components:
Enterprise Tone
We strive to foster beliefs and actions that are true to, and respectful of, our many stakeholders. We do this by investing in communities where we live and work, operating and growing sustainably, putting safety first and being responsible to the many groups and individuals with whom we work.
Policies
We maintain a comprehensive set of enterprise-wide policies. These policies establish delegated authorities and limits for business transactions, as well as allow for an exception approval process. Periodic reviews and audits are performed to ensure compliance with these policies. All employees and directors are required to sign a code of conduct on an annual basis.
TRANSALTA CORPORATION M114
Management’s Discussion and Analysis
Reporting
On a regular basis, residual risk exposures are reported to key decision-makers including the Board, the AFRC, senior management and/or the Commodity Risk & Compliance Committee, as applicable. Reporting to this latter committee includes analysis of new risks, monitoring of status to risk limits, review of events that can affect these risks and discussion and review of the status of actions to minimize risks. This monthly reporting provides for effective and timely risk management and oversight.
Whistleblower System
We have a process in place where employees, contractors, shareholders or other stakeholders may confidentially or anonymously report any potential legal or ethical concerns, including concerns relating to accounting, internal control accounting, auditing or financial matters or relating to alleged violations of any laws or our code of conduct. These concerns can be submitted confidentially and anonymously, either directly to the AFRC or through TransAlta’s toll-free telephone or online Ethics Helpline. The AFRC Chair is immediately notified of any material complaints and, otherwise, the AFRC receives a report at every quarterly committee meeting on all findings related to any material complaints or complaints relating to accounting or financial reporting or alleged breaches in internal controls over financial reporting.
Value at Risk and Trading Positions
Value at risk (“VaR”) is one of the primary measures used to manage our exposure to market risk resulting from commodity risk management activities. VaR is calculated and reported on a daily basis. This metric describes the potential change in the value of our trading portfolio over a three-day period within a 95 per cent confidence level, resulting from normal market fluctuations.
VaR is a commonly used metric that is employed by industry to track the risk in commodity risk management positions and portfolios. Two common methodologies for estimating VaR are the historical variance/covariance and Monte Carlo approaches. We estimate VaR using the historical variance/covariance approach. An inherent limitation of historical variance/covariance VaR is that historical information used in the estimate may not be indicative of future market risk. Stress tests are performed periodically to measure the financial impact to the trading portfolio resulting from potential market events, including fluctuations in market prices, volatilities of those prices and the relationships between those prices. We also employ additional risk mitigation measures. VaR at Dec. 31, 2021, associated with our proprietary commodity risk management activities was $2 million (2020 — $1 million). Please refer to the Risk Factors – Commodity Price Risk section of this MD&A below for further discussion.
Risk Factors
Risk is an inherent factor of doing business. The following section addresses some, but not all, risk factors that could affect our future plans, performance, results or outcomes and our activities in mitigating those risks. These risks do not occur in isolation, but must be considered in conjunction with each other. Further information on the Company's risk factors can be found in the Risk Factors section of the AIF, which risk factors are hereby incorporated by reference. and available on our website at www.transalta.com and under our profile on SEDAR at www.sedar.com and on EDGAR at www.edgar.gov.
A reference herein to a material adverse effect on the Company means such an effect on the Company or its business, operations, financial condition, results of operations and/or its cash flows, as the context requires.
For some risk factors, we show the after-tax effect on net earnings of changes in certain key variables. The analysis is based on business conditions and production volumes in 2021. Each item in the sensitivity analysis assumes all other potential variables are held constant. While these sensitivities are applicable to the period and the magnitude of changes on which they are based, they may not be applicable in other periods, under other economic circumstances or for a greater magnitude of changes. The changes in rates should also not be assumed to be proportionate to earnings in all instances.
Volume Risk
Volume risk relates to the variances from our expected production. The financial performance of our hydro, wind and solar operations is highly dependent upon the availability of their input resources in a given year. Shifts in weather or climate patterns, seasonal precipitation and the timing and rate of melting and runoff may impact the water flow to our facilities. The strength and consistency of the wind resource at our facilities impacts production. The operation of thermal facilities can also be impacted by ambient temperatures and the availability of water and fuel. Where we are unable to produce sufficient quantities of output in relation to contractually specified volumes, we may be required to pay penalties or purchase replacement power in the market.
TRANSALTA CORPORATION M115
Management’s Discussion and Analysis
We manage volume risk by:
▪Actively managing our assets and their condition in order to be proactive in facility maintenance so that our facilities are available to produce when required;
▪Monitoring water resources throughout Alberta to the best of our ability and optimizing this resource against real-time electricity market opportunities;
▪Placing our facilities in locations we believe to have adequate resources to generate electricity to meet the requirements of our contracts. However, we cannot guarantee that these resources will be available when we need them or in the quantities that we require; and
▪Diversifying our fuels and geography to mitigate regional or fuel-specific events.
The sensitivity of volumes to our net earnings is shown below:
| | | | | | | | |
| Factor | Increase or
decrease (%) | Approximate impact
on net earnings |
| Availability/production | 1 | | $12 million |
Generation Equipment and Technology Risk
There is a risk of equipment failure due to wear and tear, latent defect, design error or operator error, among other things, which could have a material adverse effect on the Company. Although our generation facilities have generally operated in accordance with expectations, there can be no assurance that they will continue to do so. Our facilities are exposed to operational risks such as failures due to cyclic, thermal and corrosion damage in boilers, generators and turbines, as well as other issues that can lead to outages and increased production risk. If facilities do not meet availability or production targets specified in their PPA or other long-term contracts, we may be required to compensate the purchaser for the loss in the availability of production or record reduced energy or capacity payments. For merchant facilities, an outage can result in lost merchant opportunities. Therefore, an extended outage could have a material adverse effect on our business, financial condition, results of operations or our cash flows.
As well, we are exposed to procurement risk for specialized parts that may have long lead times. If we are unable to procure these parts when they are needed for maintenance activities, we could face an extended period where our equipment is unavailable to produce electricity.
We manage our generation equipment and technology risk by:
▪Operating our facilities within defined industry standards that optimizes availability over their commercial operating life;
▪Performing preventive maintenance in accordance with applicable industry practices, major equipment supplier recommendations and our operating experience;
▪Adhering to comprehensive maintenance programs and regular turnaround schedules;
▪Adjusting maintenance plans by facility to reflect equipment type, age and commercial risk;
▪Having adequate business interruption insurance in place to cover extended forced outages;
▪Having clauses in our PPAs and other long-term contracts that allow us to declare force majeure in the event of an unforeseen failure;
▪Selecting and applying proven technology in our generating facilities, where practical;
▪Where technology is newer, ensuring service agreements with equipment suppliers include appropriate availability and performance guarantees;
▪Monitoring our fleet against industry performance to identify issues or advancements that may impact performance and adjusting our maintenance and investment programs accordingly;
▪Negotiating strategic supply agreements with selected vendors to ensure key components are readily available in the event of a significant outage;
▪Entering into long-term arrangements with our strategic supply partners to ensure availability of critical spare parts; and
▪Implementing long-term asset management strategies that optimize the life cycles of our existing facilities and/or identify replacement requirements for generating assets.
TRANSALTA CORPORATION M116
Management’s Discussion and Analysis
Commodity Price Risk
We have exposure to movements in certain commodity prices, including the market price of electricity and fuels used to produce electricity in both our electricity generation and proprietary trading businesses.
We manage the financial exposure associated with fluctuations in electricity price risk by:
▪Entering into long-term contracts that specify the price at which electricity, steam and other services are provided;
▪Maintaining a portfolio of short-, medium- and long-term contracts to mitigate our exposure to short-term fluctuations in commodity prices;
▪Purchasing natural gas coincident with production for merchant facilities so spot market spark spreads are adequate to produce and sell electricity at a profit; and
▪Ensuring limits and controls are in place for our proprietary trading activities.
In 2021, we had approximately 78 per cent (2020 – 90 per cent) of production under short-term and long-term contracts and hedges . In the event of a planned or unplanned outage or other similar event, however, we are exposed to changes in electricity prices on purchases of electricity from the market to fulfil our supply obligations under these short- and long-term contracts.
We manage the financial exposure to fluctuations in the cost of fuels used in production by:
▪Entering into long-term contracts that specify the price at which fuel is to be supplied to our facilities;
▪Hedging emissions costs by entering into various emission trading arrangements; and
▪Selectively using hedges, where available, to set prices for fuel.
In 2021, 70 per cent (2020 – 89 per cent) of our gas consumption used in generating electricity was contractually fixed or passed through to our customers and 80 per cent (2020 – 78 per cent) of our purchased coal was contractually fixed.
Actual variations in net earnings can vary from calculated sensitivities and may not be linear due to optimization opportunities, co-dependencies and cost mitigations, production, availability and other factors.
Coal Supply Risk
Having sufficient fuel available when required for generation is essential to maintaining our ability to produce electricity under contracts and for merchant sale opportunities. At Centralia, interruptions at our supplier’s mine, the availability of trains to deliver coal and the financial viability of our coal suppliers could affect our ability to generate electricity.
We manage coal supply risk by:
▪Sourcing the coal used at Centralia from different mine sources to ensure sufficient coal is available at a competitive cost;
▪Contracting sufficient trains to deliver the coal requirements at Centralia;
▪Ensuring coal inventories on hand at Centralia are at appropriate levels for usage requirements;
▪Ensuring efficient coal handling and storage facilities are in place so that the coal being delivered can be processed in a timely and efficient manner;
▪Monitoring and maintaining coal specifications, and carefully matching the specifications mined with the requirements of our facilities;
▪Monitoring the financial viability of Centralia suppliers; and
▪Hedging diesel exposure in mining and transportation costs.
TRANSALTA CORPORATION M117
Management’s Discussion and Analysis
Natural Gas Supply and Price Risk
Having sufficient natural gas and natural gas transportation services available at our Gas facilities is essential to maintaining the reliability and availability of those facilities. Ensuring adequate pipeline transportation service and natural gas supply for our Gas units may be impacted by, among other things, the timing of receiving regulatory and other approvals for firm transportation commitments, weather-related events, work stoppages, system maintenance, variability in pipeline hydraulics pressure and flows, and impacts due to other naturally created events. Pricing of natural gas is driven by market supply and demand fundamentals for natural gas in North America and globally. We are exposed to changes in natural gas prices, which may impact the profitability of our facilities and how the facilities are dispatched into the market.
We manage gas supply and price risk by:
▪Working to ensure that we have at least two pipelines supplying the gas used in electrical generation in Alberta;
▪Contracting for firm gas delivery and supply;
▪Monitoring the financial viability of gas producers and pipelines;
▪Hedging gas price exposure; and
▪Monitoring pipeline maintenance schedules and transportation availability.
Environmental Compliance Risk
Environmental compliance risks are risks to our business associated with existing and/or changes in environmental regulations. New emission reduction objectives for the power sector are being established by governments in Canada, Australia and the US. We anticipate continued and growing scrutiny by investors and other stakeholders relating to sustainability performance. These changes to regulations may affect our earnings by reducing the operating life of generating facilities and imposing additional costs on the generation of electricity through such measures as emission caps or taxes, requiring additional capital investments in emission abatement technology or requiring us to invest in offset credits. It is anticipated that these compliance costs will increase due to increased political and public attention to environmental concerns.
We manage environmental compliance risk by:
▪Seeking continuous improvement in numerous performance metrics such as emissions, safety, land and water impacts, and environmental incidents;
▪Having environmental health and safety management system audits to assess conformance to our Total Safety Management System, which is designed to continuously improve performance;
▪Committing significant experienced resources to work with regulators in Canada, Australia and the US to advocate that regulatory changes are well-designed and cost-effective;
▪Developing compliance plans that address how to meet or surpass emission standards for GHGs, mercury, SO2, and NOx, which will be adjusted as regulations are finalized;
▪Purchasing carbon emissions reduction offsets or credits;
▪Investing in renewable energy projects, such as wind, solar and hydro generation, and storage technologies; and
▪Incorporating change-in-law provisions in contracts that allow recovery of certain compliance costs from our customers.
We are committed to remaining in compliance with all environmental regulations relating to operations and facilities. Compliance with both regulatory requirements and management system standards is regularly audited through our performance assurance policy and results are reported to the GSSC.
TRANSALTA CORPORATION M118
Management’s Discussion and Analysis
Credit Risk
Credit risk is the risk to our business associated with changes in the creditworthiness of entities with which we have commercial exposures. This risk results from the ability of a counterparty to either fulfill its financial or performance obligations to us or where we have made a payment in advance of the delivery of a product or service. The inability to collect cash due to us or to receive products or services may have an adverse impact upon our net earnings and cash flows.
We manage our exposure to credit risk by
▪Establishing and adhering to policies that define credit limits based on the creditworthiness of counterparties, contract term limits and the credit concentration with any specific counterparty;
▪Requiring formal sign-off on contracts that include commercial, financial, legal and operational reviews;
▪Requiring security instruments, such as parental guarantees, letters of credit, and cash collateral or third-party credit insurance if a counterparty goes over its limits. Such security instruments can be collected if a counterparty fails to fulfil its obligation; and
▪Reporting our exposure using a variety of methods that allow key decision-makers to assess credit exposure by counterparty. This reporting allows us to assess credit limits for counterparties and the mix of counterparties based on their credit ratings.
If established credit exposure limits are exceeded, we take steps to reduce this exposure, such as by requesting collateral, if applicable, or by halting commercial activities with the affected counterparty. However, there can be no assurances that we will be successful in avoiding losses as a result of a contract counterparty not meeting its obligations.
As needed, additional risk mitigation tactics will be taken to reduce the risk to TransAlta. These risk mitigation tactics may include, but are not limited to, immediate follow-up on overdue amounts, adjusting payment terms to ensure a portion of funds are received sooner, requiring additional collateral, reducing transaction terms and working closely with impacted counterparties on negotiated solutions.
Our credit risk management profile and practices have not changed materially from Dec. 31, 2020. We had no material counterparty losses in 2021. We continue to keep a close watch on changes and trends in the market and the impact these changes could have on our energy trading business and hedging activities, and will take appropriate actions as required, although no assurance can be given that we will always be successful.
The following table outlines our maximum exposure to credit risk without taking into account collateral held or right of set-off, including the distribution of credit ratings, as at Dec. 31, 2021:
| | | | | | | | | | | | | | |
| Investment grade (%) | Non-investment grade (%) | Total (%) | Total
amount |
Trade and other receivables(1,2) | 89 | | 11 | | 100 | | 651 | |
| Long-term finance lease receivables | 100 | | — | | 100 | | 185 | |
Risk management assets(1) | 86 | | 14 | | 100 | | 707 | |
| | | | |
| Total | | | | 1,543 | |
(1) Letters of credit and cash and cash equivalents are the primary types of collateral held as security related to these amounts.
(2) Includes loan receivable where the counterparties have no external credit ratings.
The maximum credit exposure to any one customer for commodity trading operations, including the fair value of open trading positions net of any collateral held, is $37 million (2020 – $22 million).
Counterparties enter into certain electricity and natural gas purchase and sale contracts for the purposes of asset-backed sales and proprietary trading. The terms and conditions of these contracts require the counterparties to provide collateral when the fair value of the obligation pursuant to these contracts is in excess of any credit limits granted. Downgrades in creditworthiness by certain credit rating agencies may impact our ability to enter into these contracts or any ordinary course contract, decrease the credit limits granted and increase the amount of collateral that may have to be provided. Certain existing contracts contain credit rating contingent clauses, that, when triggered, automatically increase costs under the contract or require additional collateral to be posted. Where the contingency is based on the lowest single rating, a one-level downgrade from a credit rating agency with an originally higher rating may not, however, trigger additional direct adverse impact.
TRANSALTA CORPORATION M119
Management’s Discussion and Analysis
Currency Rate Risk
\We have exposure to various currencies as a result of our investments and operations in foreign jurisdictions, the earnings from those operations, the acquisition of equipment and services and foreign-denominated commodities from foreign suppliers, and our US-denominated debt. Our exposures are primarily to the US and Australian currencies. Changes in the values of these currencies in relation to the Canadian dollar may affect our earnings, cash flows or the value of our foreign investments to the extent that these positions or cash flows are not hedged or the hedges are ineffective.
We manage our currency rate risk by establishing and adhering to policies that include:
▪Hedging our net investments in US operations using US-denominated debt;
▪Entering into forward foreign exchange contracts to hedge future foreign-denominated expenditures including our US-denominated senior debt that is outside the net investment portfolio; and
▪Hedging our expected foreign operating cash flows. Our target is to hedge a minimum of 60 per cent of our forecasted foreign operating cash flows over a four-year period, with a minimum of 90 per cent in the current year, 70 per cent in the next year, 50 per cent in the third year and 30 per cent in the fourth year. The US and Australian exposure, net of debt service and sustaining capital expenditures are managed with forward foreign exchange contracts.
The sensitivity of our net earnings to changes in foreign exchange rates has been prepared using management’s assessment that an average $0.03 increase or decrease in the US or Australian currencies relative to the Canadian dollar is a reasonable potential change over the next quarter, and is shown below:
| | | | | | | | |
| Factor | Increase or decrease | Approximate impact
on net earnings |
| Exchange rate | $0.03 | $12 million |
Liquidity Risk
Liquidity risk relates to our ability to access capital to be used to fund capital projects, refinance debt and pay liabilities, engage in trading and hedging activities and general corporate purposes. Credit ratings facilitate these activities and changes in credit ratings may affect our ability and/or the cost of accessing capital markets, establishing normal course derivative or hedging transactions, including those undertaken by our Energy Marketing segment.
We continue to focus on maintaining our financial position and flexibility. Credit ratings issued for TransAlta, as well as the corresponding rating agency outlooks, are set out in the Financial Capital section of this MD&A. Credit ratings are subject to revision or withdrawal at any time by the rating organization, and there can be no assurance that TransAlta’s credit ratings and the corresponding outlook will not be changed, resulting in the adverse possible impacts identified above.
As at Dec. 31, 2021, we have liquidity of $2.2 billion comprised of amounts not drawn under our committed credit facilities and cash on hand that is available to draw on for projects in 2022.
We manage liquidity risk by:
▪Preparing and revising longer-term financing plans to reflect changes in business plans and the market availability of capital;
▪Reporting liquidity risk exposure for commodity risk management activities on a regular basis to the Commodity Risk & Compliance Committee, senior management and the AFRC;
▪Maintaining a strong balance sheet;
▪Maintaining sufficient undrawn committed credit lines to support potential liquidity requirements; and
▪Monitoring trading positions.
Interest Rate Risk
Changes in interest rates can impact our borrowing costs. Changes in our cost of capital may also affect the feasibility of new growth initiatives.
We manage interest rate risk by establishing and adhering to policies that include:
▪Employing a combination of fixed and floating rate debt instruments;
▪Monitoring the mixture of floating and fixed rate debt and adjusting to ensure efficiency; and
▪Opportunistically hedging for known debt issuances.
TRANSALTA CORPORATION M120
Management’s Discussion and Analysis
At Dec. 31, 2021, approximately 3 per cent (2020 – 7 per cent) of our total debt portfolio was subject to changes in floating interest rates through a combination of floating rate debt and interest rate swaps.
The sensitivity of changes in interest rates upon our net earnings is shown below:
| | | | | | | | |
| Factor | Increase or
decrease (%) | Approximate impact
on net earnings |
| Interest rate | 30 bps | less than $1 million before tax |
IBOR reform could impact interest rate risk with respect to the Company's credit facilities and the Poplar Creek non-recourse bond held by a TransAlta subsidiary. The facility references LIBOR for US-dollar drawings and the Canadian Dollar Offer Rate ("CDOR") for Canadian-dollar drawings; in addition, the non-recourse bond references the three-month CDOR. To date, no US-dollar drawings have been made on the facility and there is currently a plan to discontinue the six- and 12-month CDOR, which does not impact the facility or the non-recourse bond.
Outstanding US dollar forward starting interest rate swaps should not be affected as the three-month USD LIBOR will continue to be published until June 30, 2023. These are expected to to settle in 2022.
Project Management Risk
On capital projects, we face risks associated with cost overruns, delays and performance.
We manage project risks by:
▪Ensuring all projects follow established corporate processes and policies;
▪Identifying key risks during every stage of project development and ensuring mitigation plans are factored into capital estimates and contingencies;
▪Reviewing project plans, key assumptions and returns with senior management prior to Board of Director approvals;
▪Consistently applying project management methodologies and processes;
▪Determining contracting strategies that are consistent with the project scope and scale to ensure key risks, such as labour and technology, are managed by contractors and equipment suppliers;
▪Ensuring contracts for construction and major equipment include key terms for performance, delays and quality backed by appropriate levels of liquidated damages;
▪Reviewing projects after achieving commercial operation to ensure learnings are incorporated into the next project;
▪Negotiating contracts for construction and major equipment to lock-in key terms such as price, availability of long lead equipment, foreign currency rates and warranties as much as is economically feasible before proceeding with the project; and
▪Entering into labour agreements to provide security around labour cost, supply and productivity.
Human Resource Risk
Human resource risk relates to the potential impact upon our business as a result of changes in the workplace. Human resource risk can occur in several ways:
▪Potential disruption as a result of labour action at our generating facilities;
▪Reduced productivity due to turnover in positions;
▪Inability to complete critical work due to vacant positions;
▪Failure to maintain fair compensation with respect to market rate changes; and
▪Reduced competencies due to insufficient training, failure to transfer knowledge from existing employees or insufficient expertise within current employees.
We manage this risk by:
▪Monitoring industry compensation and aligning salaries with those benchmarks;
▪Using incentive pay to align employee goals with corporate goals;
▪Monitoring and managing target levels of employee turnover; and
▪Ensuring new employees have the appropriate training and qualifications to perform their jobs.
In 2021, 33 per cent (2020 – 46 per cent) of our labour force was covered by 11 (2020 – 10) collective bargaining agreements. The increase in the number of collective agreements is the result of splitting one collective agreement into two collective agreements. The decrease in the percentage of our unionized workforce is the result of the coal-to-gas transition and subsequent retirement of Keephills Unit 1. In 2021, one (2020 – 2) agreement was renegotiated. We anticipate the successful negotiation of seven collective agreements in 2022.
TRANSALTA CORPORATION M121
Management’s Discussion and Analysis
Regulatory and Political Risk
Regulatory and political risk is the risk to our business associated with potential changes to the existing regulatory structures and the political influence upon those structures within each of the jurisdictions in which we operate. This risk can come from market regulation and re-regulation, increased oversight and control, structural or design changes in markets, or other unforeseen influences. Market rules are often dynamic and we are not able to predict whether there will be any material changes in the regulatory environment or the ultimate effect of changes in the regulatory environment on our business. This risk includes, among other things, uncertainties associated with the development of carbon pricing policies and funding.
We manage these risks systematically through our Legal and Regulatory groups and our Compliance program, which is reviewed periodically to ensure its effectiveness. We also work with governments, regulators, electricity system operators and other stakeholders to resolve issues as they arise. We are actively monitoring changes to market rules and market design, and we engage in industry- and government-agency-led stakeholder engagement processes. Through these and other avenues, we engage in advocacy and policy discussions at a variety of levels. These stakeholder consultations have allowed us to engage in proactive discussions with governments and regulatory agencies over the longer term.
International investments are subject to unique risks and uncertainties relating to the political, social and economic structures of the respective country and such country’s regulatory regime. We mitigate this risk through the use of non-recourse financing and insurance.
Transmission Risk
Access to transmission lines and transmission capacity for existing and new generation is key to our ability to deliver energy produced at our power facilities to our customers. The risks associated with the aging existing transmission infrastructure in markets in which we operate continue to increase because new connections to the power system are consuming transmission capacity faster than it is being added by new transmission developments.
Reputation Risk
Our reputation is one of our most valued assets. Reputation risk relates to the risk associated with our business because of changes in opinion from the general public, private stakeholders, governments and other entities.
We manage reputation risk by:
▪Striving as a neighbour and business partner, in the regions where we operate, to build viable relationships based on mutual understanding leading to workable solutions with our neighbours and other community stakeholders;
▪Clearly communicating our business objectives and priorities to a variety of stakeholders on a routine and transparent basis;
▪Applying innovative technologies to improve our operations, work environment and environmental footprint;
▪Maintaining positive relationships with various levels of government;
▪Pursuing sustainable development as a longer-term corporate strategy;
▪Ensuring that each business decision is made with integrity and in line with our corporate values;
▪Communicating the impact and rationale of business decisions to stakeholders in a timely manner; and
▪Maintaining strong corporate values that support reputation risk management initiatives, including the annual Code of Conduct sign-off.
Corporate Structure Risk
We conduct a significant amount of business through subsidiaries and partnerships. Our ability to meet and service debt obligations is dependent upon the results of operations of our subsidiaries and partnerships and the payment of funds by our subsidiaries and partnerships in the form of distributions, loans, dividends or otherwise. In addition, our subsidiaries and partnerships may be subject to statutory or contractual restrictions that limit their ability to distribute cash to us.
TRANSALTA CORPORATION M122
Management’s Discussion and Analysis
Cybersecurity Risk
We rely on our information technology to process, transmit and store electronic information and data used for the safe operation of our assets. In today's ever-evolving cybersecurity landscape, any attacks or other breaches of network or information systems may cause disruptions to our business operations. Cyberattackers may use a range of techniques, from exploiting vulnerabilities within our user-base, to using sophisticated malicious code on a single or distributed basis to try to breach our network security controls. Attackers may also use a combination of techniques in their attempt to evade safeguards that we have in place such as firewalls, intrusion prevention systems and antivirus software that exist on our network infrastructure systems. A successful cyberattack may allow for the unauthorized interception, destruction, use or dissemination of our information and may cause disruptions to our business operations.
We continuously take measures to secure our infrastructure against potential cyberattacks that may damage our infrastructure, systems and data. TransAlta’s cybersecurity model consists of three pillars: technology, processes and people. Each of these pillars can be reinforced independently to address specific cyber risks and threats that are confronting TransAlta. Significant cyber risks that could pose a threat to TransAlta include phishing, ransomware, social engineering, supplier chain, commodity hostage, state sponsored, artificial intelligence, machine learning attacks and a high risk of cybersecurity employee turnover. Proactive controls and safeguards to mitigate cybersecurity risk and threats posed to the organization include:
▪Leveraging technologies to restrict communication within TransAlta’s networks thus limiting the ability for adversaries to achieve their aim;
▪Partnering with a third-party cybersecurity specialty firm to outsource critical components of our cybersecurity program;
▪Enhancing our policies and processes through the use of periodic reviews and table-top exercises;
▪Maintaining an effective and robust cybersecurity awareness training and campaign;
▪Integrating cybersecurity into our business processes and performing robust cybersecurity risk assessments; and
▪Continuously improving our cybersecurity program to ensure it is effective in responding to and addressing cybersecurity risks.
While we have cyber insurance (as well as systems, policies, hardware, practices, data backups and procedures designed to prevent or limit the effect of the security breaches of our generation facilities and infrastructure and data), there can be no assurance that these measures will be sufficient or that such security breaches will not occur or, if they do occur, that they will be adequately addressed in a timely manner. We closely monitor both preventive and detective measures to manage these risks.
General Economic Conditions
Changes in general economic conditions impact product demand, revenue, operating costs, the timing and extent of capital expenditures, the net recoverable value of PP&E, financing costs, credit and liquidity risk, and counterparty risk.
Growth Risk
Our business plan includes growth through identifying suitable acquisitions or contracted new build opportunities. There can be no assurance that we will be able to identify attractive growth opportunities in the future, that we will be able to complete growth opportunities that increase the amount of cash available for distribution, or that growth opportunities will be successfully integrated into our existing operations. The successful execution of the growth strategy requires careful timing and business judgment, as well as the resources to complete the due diligence and evaluation of such opportunities and to acquire and successfully integrate those assets into our business.
TRANSALTA CORPORATION M123
Management’s Discussion and Analysis
Income Taxes
Our operations are complex and located in several countries. The computation of the provision for income taxes involves tax interpretations, regulations and legislation that are constantly evolving. Our tax filings are subject to audit by taxation authorities. Management believes that it has adequately provided for income taxes as required by the Income Tax Act and IFRS, based on all information currently available.
The Company is subject to changing laws, treaties and regulations in and between countries. Various tax proposals in the countries we operate in could result in changes to the basis on which deferred taxes are calculated or could result in changes to income or non-income tax expense. There has recently been an increased focus on issues related to the taxation of multinational corporations. A change in tax laws, treaties or regulations, or in the interpretation thereof, could result in a materially higher income or non-income tax expense that could have a material adverse impact on the Company.
The sensitivity of changes in income tax rates upon our net earnings is shown below:
| | | | | | | | |
| Factor | Increase or
decrease (%) | Approximate impact
on net earnings |
| Tax rate | 1 | | $6 million |
Legal Contingencies
We are occasionally named as a party in various disputes, claims and legal or regulatory proceedings that arise during the normal course of our business. We review each of these claims, including the nature and merits of the claim, the amount in dispute or claimed, and the availability of insurance coverage. There can be no assurance that any particular dispute, claim or proceeding will be resolved in our favour or our liabilities with respect to such claims will not have a material adverse effect on us or our business, operations or financial results. Please refer to the Other Consolidated Analysis section of this MD&A for further details.
Other Contingencies
We maintain a level of insurance coverage deemed appropriate by management. During renewal of the insurance policies on Dec. 31, 2021, a coverage restriction was added for losses resulting from a foundation failure at the Kent Hills 1 and 2 wind facilities only. There were no other significant changes to our insurance coverage during renewal of the insurance policies on Dec. 31, 2021. Our insurance coverage may not be available in the future on commercially reasonable terms. There can be no assurance that our insurance coverage will be fully adequate to compensate for potential losses incurred. In the event of a significant economic event, the insurers may not be capable of fully paying all claims. All insurance policies are subject to standard exclusions.
TRANSALTA CORPORATION M124
Management’s Discussion and Analysis
Disclosure Controls and Procedures
Management is responsible for establishing and maintaining adequate internal control over financial reporting (‘‘ICFR’’) and disclosure controls and procedures (“DC&P’’). For the year ended Dec. 31, 2021, the majority of our workforce supporting and executing our ICFR and DC&P worked remotely. There has been minimal impact to the design and performance of our internal controls. Management has reviewed the changes as a result of changes implemented in response to COVID-19 and is reasonably assured that adjustments to process have not materially affected, or are reasonably likely to materially affect, our ICFR or DC&P.
ICFR is a framework designed to provide reasonable assurance regarding the reliability of financial reporting and the preparation of consolidated financial statements for external purposes in accordance with IFRS. Management has used the Internal Control – Integrated Framework issued by the Committee of Sponsoring Organizations of the Treadway Commission (2013 framework) in order to assess the effectiveness of the Company’s ICFR.
DC&P refer to controls and other procedures designed to ensure that information required to be disclosed in the reports we file or submit under securities legislation is recorded, processed, summarized and reported within the time frame specified in applicable securities legislation. DC&P include, without limitation, controls and procedures designed to ensure that information required to be disclosed by us in our reports that we file or submit under applicable securities legislation is accumulated and communicated to management, including our Chief Executive Officer and Chief Financial Officer, as appropriate to allow timely decisions regarding our required disclosure.
Together, the ICFR and DC&P frameworks provide internal control over financial reporting and disclosure. In designing and evaluating our ICFR and DC&P, management recognizes that any controls and procedures, no matter how well designed and operated, can provide only reasonable assurance of achieving the desired control objectives and as such may not prevent or detect all misstatements, and management is required to apply its judgment in evaluating and implementing possible controls and procedures. Further, the effectiveness of ICFR is subject to the risk that controls may become inadequate because of changes in conditions or that the degree of compliance with policies or procedures may change.
In accordance with the provisions of NI 52-109 and consistent with U.S. Securities and Exchange Commission guidance, the scope of the evaluation did not include internal controls over financial reporting of North Carolina Solar, which the Company acquired on Nov. 5, 2021. North Carolina Solar was excluded from management's evaluation of the effectiveness of the Company's internal control over financial reporting as at Dec. 31, 2021, due to the proximity of the acquisition to year-end. Further details related to the acquisition are disclosed in Note 4 to the Company's Consolidated Financial Statements for the year ended Dec. 31, 2021. Included in the 2021 Consolidated Financial Statements of TransAlta for North Carolina Solar is 2 per cent and 5 per cent of the Company's total and net assets, respectively, as at Dec. 31, 2021.
Management has evaluated, with the participation of our Chief Executive Officer and Chief Financial Officer, the effectiveness of our ICFR and DC&P as of the end of the period covered by this MD&A. Based on the foregoing evaluation, our Chief Executive Officer and Chief Financial Officer have concluded that, as at Dec. 31, 2021, the end of the period covered by this MD&A, our ICFR and DC&P were effective.
TRANSALTA CORPORATION M125