
United States
Securities and
exchange commission
washington, d.c. 20549
FORM 6-K
report of foreign
private issuer
pursuant to rule 13a-16 or 15d-16 of
the securities exchange act of 1934
For the month of June 2026
Commission File Number 1-15224
Energy Company of Minas Gerais
(Translation of Registrant’s Name into English)
Avenida Barbacena, 1200
30190-131 Belo Horizonte, Minas Gerais, Brazil
(Address of Principal Executive Offices)
Indicate by check mark whether the registrant files or will file annual reports under cover of Form 20-F or Form 40-F.
Form 20-F a Form 40-F ___
Index
Item Description of Items
| 1. | Material Fact — Election of new Chief Executive Officer, dated May 7, 2026 |
| 2. | Earnings Release — 1Q26 |
| 3. | Notice to the Market – Changes in relevant equity interest, dated May 20, 2026 |
| 4. | Notice to the Market – Cemig SIM completes the acquisition of 11 DG photovoltaic plants, dated June 3, 2026 |
| 5. | Notice to Shareholders – Resolutions of the Annual Shareholders' Meeting - DIVIDENDS/IoE, dated April 30, 2026 |
Forward-Looking Statements
This report contains statements about expected future events and financial results that are forward-looking and subject to risks and uncertainties. Actual results could differ materially from those predicted in such forward-looking statements. Factors which may cause actual results to differ materially from those discussed herein include those risk factors set forth in our most recent Annual Report on Form 20-F filed with the Securities and Exchange Commission. CEMIG undertakes no obligation to revise these forward-looking statements to reflect events or circumstances after the date hereof, and claims the protection of the safe harbor for forward-looking statements contained in the Private Securities Litigation Reform Act of 1995.
SIGNATURES
Pursuant to the requirements of the Securities Exchange Act of 1934, the registrant has duly caused this report to be signed on its behalf by the undersigned, thereunto duly authorized.
COMPANHIA ENERGÉTICA DE MINAS GERAIS – CEMIG
By: /s/ Andrea Marques de Almeida . Name: Andrea Marques de Almeida
Title: Vice President of Finance and Investor Relations
Date: June 9, 2026
| 1. | Material Fact — Election of new Chief Executive Officer, dated May 7, 2026 |
COMPANHIA ENERGÉTICA DE MINAS GERAIS - CEMIG
PUBLICLY HELD COMPANY
CORPORATE TAXPAYER’S ID (CNPJ): 17.155.730/0001-64
COMPANY REGISTRY (NIRE): 31300040127
MATERIAL FACT
Election of new Chief Executive Officer
COMPANHIA ENERGÉTICA DE MINAS GERAIS – CEMIG (“CEMIG” or “Company”), a publicly held company with shares traded on the stock exchanges of São Paulo and New York, pursuant to CVM Resolution 44/2021, hereby informs its shareholders and the market in general that, on this date, the Company’s Board of Directors resolved to elect Mr. Alexandre Ramos Peixoto as Chief Executive Officer (CEO).
Alexandre Ramos Peixoto is a career engineer at CEMIG, with a strong academic background and extensive experience in the power sector. He holds postgraduate degrees in Quality Engineering and Management from PUC Minas and in Strategic Management and Planning from UFMG, and has an MBA in areas related to the energy sector. He has built a professional career spanning the main segments of the Brazilian Electricity Regulatory Agency (Aneel), the Ministry of Mines and Energy (MME), and the Energy Research Company (EPE). Since 2023, he has served as Chair of the Board of Directors of the Electric Energy Trading Chamber (CCEE). Prior to his role at the CCEE, he served as Chief Regulatory and Institutional Relations Officer at CEMIG.
CEMIG thanks Mr. Reynaldo Passanezi Filho for his dedication and leadership throughout his term of office. His management was marked by a significant growth cycle for the Company, consistent advances in operational efficiency, and record-high levels of investments, strengthening CEMIG’s strategic position and contributing to value creation for shareholders and society.
Belo Horizonte, May 07, 2026.
Andrea Marques de Almeida
Vice President of Finance and Investor Relations
| 2. | Earnings Release — 1Q26 |

|
EBITDA and Adjusted EBITDA: R$1.79 billion Net income and Adjusted net income: R$979 million |
|
Distribution § R$213 million (+26.7%) increase in adjusted EBITDA, driven by the positive impact of the tariff adjustment in effect since May 2025, lower post-employment expenses and, solid performance in energy losses, offsetting the market contraction o Distributed energy excluding DG: -3.2% (Captive: -4.0% / Free market: -2.5%) o
Distributed energy including DG-offset energy: -0.4% § Opex and EBITDA better than regulatory targets at R$65 million and R$61 million, respectively § Energy losses at 11.41%, below the regulatory limit of 11.48% § DEC showing continuous improvement: 8.75 in Mar/26 vs. 8.97 in Dec/25
|
|
Post-Employment § R$80 million reduction in adjusted post-employment expenses, due to the end of the health plan-related obligation, effective upon the agreement ratified by the Regional Labor Court (TRT) at the end of 2025 |
|
Trading § R$197.7 million reduction in EBITDA from the trading activity o Exposure to higher prices in energy purchases to close short positions in 1Q26 o Higher impact from undelivered energy related to wind and solar power purchase agreements
LEADERSHIP IN THE FREE MARKET § First trading company to reach the milestone of 10,000 customer accounts § 242 MW sold on average in the retail free market in March (8.82% market share)
Generation § GSF (0.92 in 1Q26 vs. 1.08 in 1Q25) with a negative impact of R$49 million in 1Q26 |
|
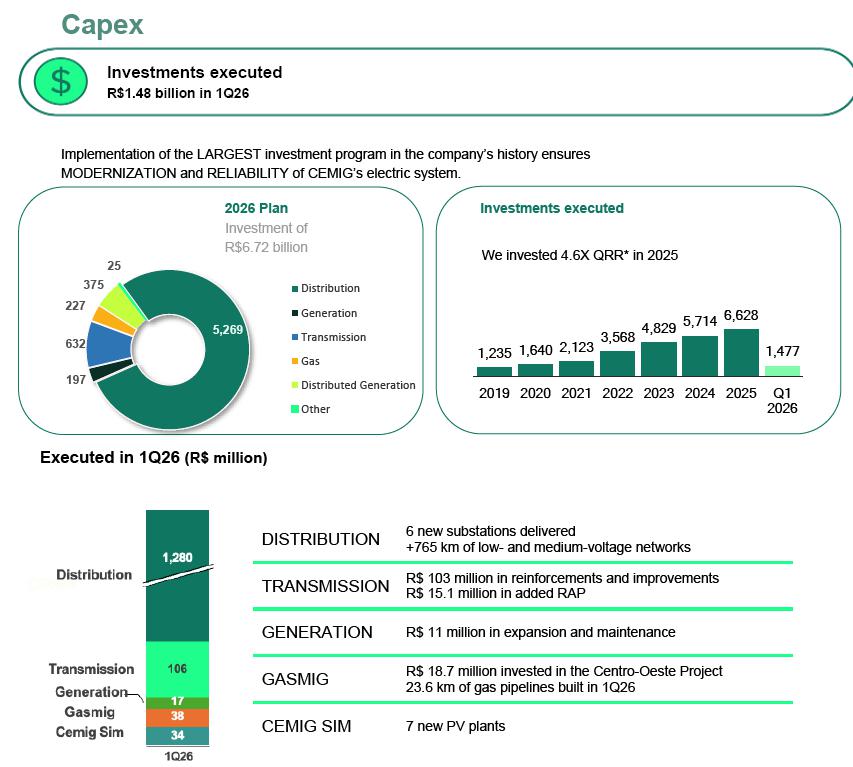
§ Capex of R$1.48 billion (+22.1% YoY), with a focus on regulated businesses o Distribution: R$1.28 billion o Transmission: R$106 million § Completion of the acquisitions of Pipoca HPP (R$39 million) and ETTM Transmission Company (R$30 million)
|
|
§ Raised R$2.61 billion at Cemig D in April o Debentures: R$1.15 billion o Loan: US$280 million, fully hedged § Leverage of 2.45x (net debt / adjusted EBITDA) § Extension of debt maturities: 76% of debt matures in 2029 or later, beyond Cemig D’s Tariff Review
Interest on Capital declared in March: R$658 million
|
Cemig | Earnings Release | 2 |
Key Financial and Operating Data
| 1Q26 | 1Q25 | % Change | |
| Operating Highlights | |||
| Distributed Energy (MWh) | 13,454,458 | 13,503,030 | -0.4% |
| Total captive market | 5,324,493 | 5,547,301 | -4.0% |
| Total transport free market clients | 6,284,468 | 6,448,334 | -2.5% |
| DG2 and DG3 offset | 280,999 | 150,270 | 87.0% |
| DG1 offset | 1,564,498 | 1,357,125 | 15.3% |
| Energy sold GT + Holding (MWh)* | 10,653,535 | 10,601,922 | 0.5% |
| Total distributed gas volume (thousand m³) | 244,498 | 253,120 | -3.4% |
| Financial Highlights (R$ million) | |||
| Net operating revenue | 10,462.5 | 9,844.2 | 6.3% |
| PMSO | 1,145.1 | 1,035.9 | 10.5% |
| EBITDA | 1,788.7 | 1,827.2 | -2.1% |
| Adjusted EBITDA | 1,788.2 | 1,799.1 | -0.6% |
| EBITDA Margin | 17.1% | 18.6% | -1.5p.p. |
| Financial Result | -338.4 | -249.6 | 35.6% |
| Net Income | 979.0 | 1,038.7 | -5.8% |
| Adjusted Net Income | 979.0 | 1,020.5 | -4.1% |
| Investments | 1,476.7 | 1,209.4 | 22.1% |
| 1Q26 | 2025 | % Change | |
| Net Debt | 17,844.0 | 16,795.5 | 6.2% |
| Net Debt/Adjusted EBITDA | 2.45x | 2.30x | 0.15x |
*Excluding energy settled at the Brazilian Electric Energy Trading Chamber (CCEE)
**Does not include post-employment expenses
Financial statements and results spreadsheets can be accessed at the following link:
Results Center | Cemig IR
Cemig | Earnings Release | 3 |

Table of Contents
| EBITDA and Net Income per Company for the Quarter | 5 |
| Income Statements | 6 |
| Income Statement by Business Segment 1Q26 | 7 |
| Consolidated energy market | 8 |
| Consolidated Energy Market | 8 |
| Performance by Company | 9 |
| Cemig D | 9 |
| Billed Energy Market | 9 |
| Performance by Sector | 10 |
| Sources and uses of electricity - MWh | 11 |
| Customer Base | 11 |
| 2025 Tariff Adjustment | 12 |
| Tariff Review | 12 |
| OPEX and EBITDA - Actual vs. Regulatory | 13 |
| Quality Indicators – DEC/FEC | 13 |
| Combating Delinquency | 13 |
| Losses | 14 |
| Cemig GT/Holding | 16 |
| Energy Market | 16 |
| Energy Balance | 16 |
| Gasmig | 17 |
| Consolidated Financial Performance | 18 |
| Operating Revenue | 18 |
| Operating Costs and Expenses | 20 |
| Equity Income | 23 |
| Consolidated EBITDA | 24 |
| Cemig D EBITDA | 25 |
| Cemig GT EBITDA | 26 |
| Financial Income and Expenses | 27 |
| Net Income | 27 |
| Investments | 28 |
| Indebtedness | 29 |
| Evolution of Cemig's Credit Ratings | 30 |
| ESG – Performance Report | 31 |
| Share Performance | 34 |
| Power Plants | 35 |
| RAP – Cycle from July 2025 to June 2026 | 37 |
| Regulatory Revenue and EBITDA from Transmission | 38 |
| Additional Information | 38 |
| Disclaimer | 39 |
Cemig | Earnings Release | 4 |

| 1Q26 | 1Q25 | % Change | 1Q26 | 1Q25 | % Change | |
| (R$ million) | EBITDA (IFRS) | Adjusted EBITDA | ||||
| Cemig D | 1,010 | 819 | 23.3% | 1,010 | 798 | 26.6% |
| Cemig GT | 575 | 749 | -23.2% | 575 | 744 | -22.7% |
| Gasmig | 193 | 213 | -9.4% | 193 | 213 | -9.4% |
| Other | 11 | 46 | -76.1% | 10 | 44 | -77.3% |
| Consolidated | 1,789 | 1,827 | -2.1% | 1,788 | 1,799 | -0.6% |
| New Replacement Value (VNR) | 65 | 53 | 22.6% | 65 | 53 | 22.6% |
| Equity income | 52 | 42 | 23.8% | 52 | 42 | 23.8% |
| Regulatory/IFRS difference from Transco | 94 | 59 | 57.9% | 94 | 59 | 57.9% |
| Consolidated minus VNR and equity income, plus regulatory/IFRS difference from Transco | 1,766 | 1,791 | -1.4% | 1,765 | 1,763 | 0.1% |
| 1Q26 | 1Q25 | % Change | 1Q26 | 1Q25 | % Change | |
| Net Income (IFRS) | Adjusted Net Income | |||||
| Cemig D | 398 | 311 | 28.0% | 398 | 297 | 34.0% |
| Cemig GT | 393 | 541 | -27.4% | 393 | 537 | -26.8% |
| Gasmig | 101 | 114 | -11.4% | 101 | 114 | -11.4% |
| Other | 87 | 73 | 19.2% | 87 | 73 | 19.2% |
| Consolidated | 979 | 1,039 | -5.8% | 979 | 1,021 | -4.1% |
* Additional details on regulatory transmission results are provided in the section “Revenue and Regulatory EBITDA for Transmission”

Cemig | Earnings Release | 5 |
Income Statements
| INCOME STATEMENT (R$ million) | 1Q26 | 1Q25 | % Change |
| NET REVENUE | 10,463 | 9,844 | 6.3% |
| COSTS | |||
| Electricity and gas costs | -5,847 | -5,523 | 5.9% |
| Infrastructure construction costs | -1,482 | -1,202 | 23.3% |
| Operating costs | -1,421 | -1,279 | 11.1% |
| -8,750 | -8,004 | 9.3% | |
| GROSS PROFIT | 1,712 | 1,841 | -7.0% |
| OTHER REVENUES AND EXPENSES | |||
| Expected credit losses | -83 | -51 | 64.7% |
| General and administrative expenses | -202 | -194 | 4.2% |
| Other expenses | -118 | -175 | -32.4% |
| Other revenues | 26 | - | - |
| -377 | -419 | -10.0% | |
| Equity income | 52 | 42 | 24.2% |
| Income before financial results and income taxes | 1,387 | 1,463 | -5.2% |
| Financial income | 258 | 194 | 33.3% |
| Financial expenses | -596 | -443 | 34.6% |
| Net financial result | -338 | -250 | 35.6% |
| Income before income tax and social contribution | 1,049 | 1,214 | -13.6% |
| Current income tax and social contribution | -130 | -259 | -49.7% |
| Deferred income tax and social contribution | 60 | 84 | -28.0% |
| NET INCOME FOR THE PERIOD | 979 | 1,039 | -5.8% |
Cemig | Earnings Release | 6 |

|
Income Statement by Segment (R$ million) |
Electricity | Gas | Equity income / Holding | Eliminations | Consolidated | |||
| Generation | Transmission | Trading | Distribution | |||||
| NET REVENUE | 806 | 352 | 2,020 | 7,391 | 492 | 44 | -644 | 10,463 |
| Intersegment | 399 | 196 | - | 48 | - | - | -644 | - |
| Third-party | 408 | 156 | 2,020 | 7,343 | 492 | 44 | - | 10,463 |
| ELECTRICITY AND GAS COSTS | -173 | -0 | -2,150 | -3,945 | -213 | -0 | 635 | -5,847 |
| Intersegment | -47 | -0 | -371 | -216 | - | -1 | 635 | - |
| Third-party | -126 | -0 | -1,779 | -3,730 | -213 | 1 | - | -5,847 |
| COSTS, EXPENSES, AND OTHER REVENUES | -180 | -178 | -31 | -2,710 | -119 | -71 | 9 | -3,281 |
| Personnel | -37 | -41 | -15 | -241 | -15 | -16 | - | -366 |
| Employee and management profit sharing | -4 | -4 | -3 | -26 | -3 | -5 | - | -45 |
| Post-employment obligations | -4 | -5 | -1 | -29 | - | -12 | - | -50 |
| Materials, third-party services, and other expenses, net | -54 | -13 | -9 | -654 | -19 | -20 | 9 | -760 |
| Intersegment | -7 | -0 | - | -2 | -0 | -0 | 9 | - |
| Third-party | -47 | -13 | -9 | -653 | -19 | -20 | - | -760 |
| Depreciation and amortization | -79 | -5 | -0 | -275 | -32 | -10 | - | -401 |
| Provisions and adjustments for operating losses | -2 | -4 | -3 | -186 | 2 | -8 | - | -202 |
| Infrastructure construction costs | - | -105 | - | -1,326 | -51 | - | - | -1,482 |
| Other revenues | - | - | - | 26 | - | - | - | 26 |
| COSTS, EXPENSES, AND OTHER REVENUES | -353 | -178 | -2,181 | -6,656 | -332 | -71 | 644 | -9,128 |
| Equity income | - | - | - | - | - | 52 | - | 52 |
| INCOME BEFORE FINANCIAL INCOME AND INCOME TAX | 453 | 174 | -161 | 736 | 160 | 25 | - | 1,387 |
| Financial result | -24 | -14 | 7 | -284 | -21 | -3 | - | -338 |
| INCOME BEFORE INCOME TAXES | 429 | 160 | -154 | 452 | 139 | 22 | - | 1,049 |
| Income tax and social contributions | -33 | -21 | 29 | -54 | -39 | 48 | - | -70 |
| NET INCOME FOR THE PERIOD | 396 | 139 | -125 | 398 | 101 | 70 | - | 979 |
Cemig | Earnings Release | 7 |

Consolidated Energy Market
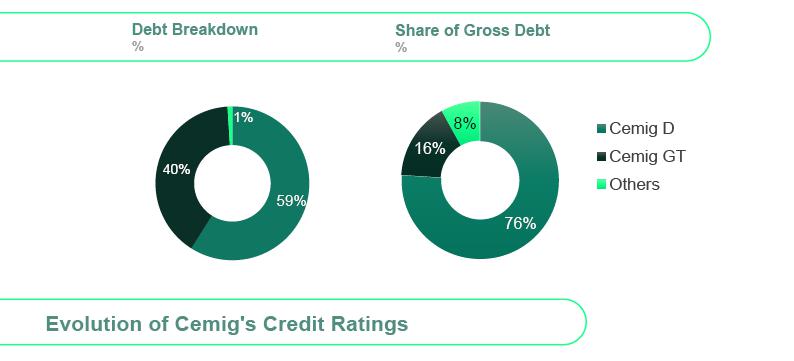
The Cemig Group billed approximately 9.6 million customers in March 2026, adding 161,000 new customers YoY, up by 1.7%. Of this total, 9,624,850 are end-users and self-consumers, and 623 are other players in the Brazilian energy sector.
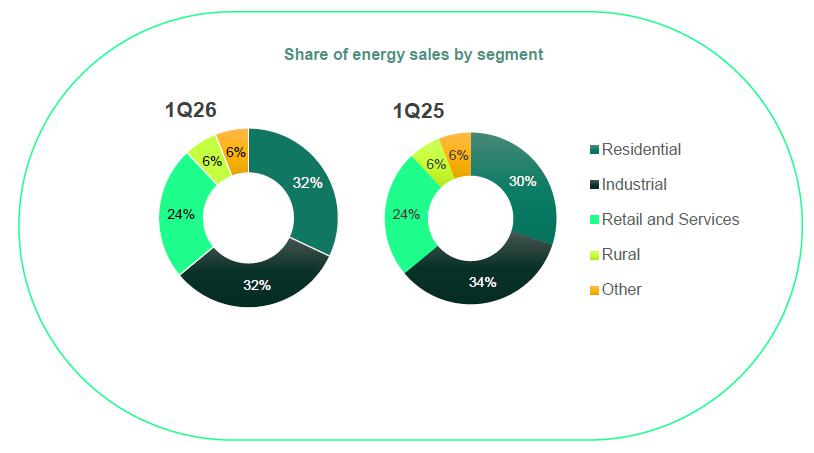
In the chart below, you can see the breakdown of the Cemig Group’s sales to end-users:
Cemig | Earnings Release | 8 |


Billed Energy Market
| 1Q26 | 1Q25 | % Change | |
| Captive + Transport - MWh | |||
| Residential | 3,410,560 | 3,322,630 | 2.6% |
| Industrial | 5,281,913 | 5,633,542 | -6.2% |
| Captive market | 123,347 | 191,693 | -35.7% |
| Transport | 5,158,566 | 5,441,849 | -5.2% |
| Commercial, Services, and Other | 1,544,105 | 1,603,880 | -3.7% |
| Captive market | 784,115 | 895,466 | -12.4% |
| Transport | 759,990 | 708,414 | 7.3% |
| Rural | 519,590 | 555,100 | -6.4% |
| Captive market | 481,742 | 524,314 | -8.1% |
| Transport | 37,848 | 30,786 | 22.9% |
| Public Services | 773,784 | 800,687 | -3.4% |
| Captive market | 516,867 | 605,273 | -14.6% |
| Transport | 256,917 | 195,414 | 31.5% |
| Utilities | 71,147 | 71,871 | -1.0% |
| Transport | 71,147 | 71,871 | -1.0% |
| Own Consumption | 7,862 | 7,925 | -0.8% |
| Total captive market | 5,324,493 | 5,547,301 | -4.0% |
| Total energy transported for free market clients | 6,284,468 | 6,448,334 | -2.5% |
| Total excluding DG | 11,608,961 | 11,995,635 | -3.2% |
| DG1 Offset | 1,564,498 | 1,357,125 | 15.3% |
| DG2 Offset | 280,206 | 149,349 | 87.6% |
| DG3 Offset | 793 | 921 | -13.9% |
| Total DG | 1,845,497 | 1,507,395 | 22.4% |
| Total Market with DG | 13,454,458 | 13,503,030 | -0.4% |
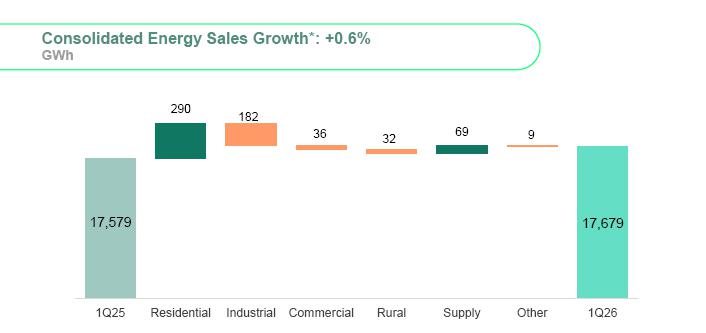
Energy supplied to captive customers, combined with energy transported to free market customers and distributors—excluding DG-offset energy—totaled 11,608 GWh in 1Q26, down 3.2% YoY. This result was primarily driven by lower consumption in the industrial (-351.6 GWh, -6.2%), rural (-35.5 GWh, -6.4%), and commercial (-59.8 GWh, -3.7%) segments, reflecting customer migration to distributed generation (DG) and the basic grid, as well as higher rainfall during the period, which reduced irrigation needs. In contrast, residential consumption increased (+87.9 GWh, +2.6%), reflecting growth in the number of customers.
Distributed energy, excluding DG, decreased by 3.2% driven by a 4.0% decline (-222.8 GWh) in captive market consumption and a 2.5% decline (-163.9 GWh) in grid usage by free-market customers.
When including DG-offset energy, total distributed energy decreased by 0.4% compared to the same period last year.
Cemig | Earnings Release | 9 |
Performance by Sector
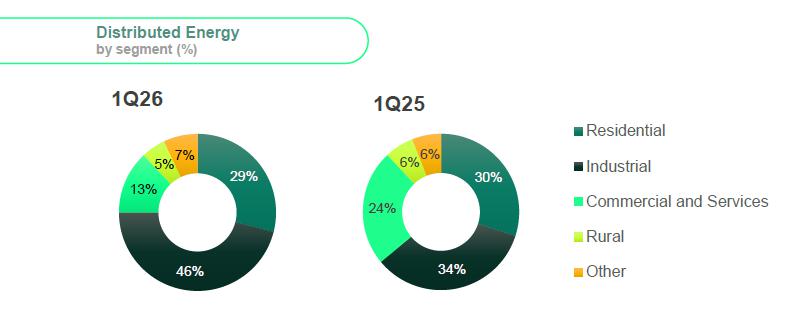
Industrial: Energy distributed to industrial customers decreased by 6.2%* YoY and accounted for 45.5%* of Cemig D’s total. The majority relates to energy supplied to industrial free-market customers (44.4%), which declined by 5.2% YoY. Meanwhile, billed energy for captive customers, representing 1.1% of total distribution, decreased by 35.7% YoY, primarily due to customer migration to the free market.
The decline in industrial consumption was significantly impacted by the migration of two major customers to the basic grid. Excluding this effect, distributed energy would have declined by 1.5%. Lower consumption in the quarter was primarily driven by Steel (-41.6%), Chemicals (-34.9%), and Ferroalloys (-11.4%), while Non-Ferrous Metals (+12.2%), Extractive Industry (+9.5%), and Food and Beverages (+4.0%) segments reported growth in consumption.
Residential: Residential consumption, representing 29.4%* of Cemig D’s distributed energy, increased by 2.6% YoY, driven by a 2.9% growth in the customer base (+230,200), partially offset by a 1.3% decline in average consumption per customer.
Commercial and Services: The commercial segment accounted for 13.3%* of Cemig D’s distributed energy in 1Q26 and declined by 3.7% YoY. This reflects a 12.4% drop in captive customer volumes, partially offset by a 7.3% increase in free-market volumes, directly driven by migration to this market. The overall decline in this segment, in turn, was mainly due to customer migration to DG.
Rural: This sector accounted for 4.5%* of total distributed energy and declined by 6.4% YoY, mainly due to higher rainfall in 1Q26 compared to previous year, which reduced irrigation needs.
Public Services: accounted for 6.7%* of distributed energy in 1Q26, and declined by 3.4% YoY.
*Excluding DG-offset energy
Cemig | Earnings Release | 10 |
Sources and uses of electricity - MWh
| 1Q26 | 1Q25 | % Change | |
| Metered Market - MWh | |||
| Energy Transported to Distributors | 71,147 | 71,871 | -1.0% |
| Energy Transported to Free Market Customers | 6,189,900 | 6,375,406 | -2.9% |
| Own Load + DG | 8,532,690 | 8,716,549 | -2.1% |
| Captive Market Consumption | 5,438,282 | 5,597,673 | -2.8% |
| DG Market | 1,845,136 | 1,507,395 | 22.4% |
| Losses in Distribution Network | 1,249,272 | 1,611,481 | -22.5% |
| Total Volume Carried | 14,793,736 | 15,163,826 | -2.4% |
Customer Base
In March 2026, 9.6 million consumers were billed, up by 1.9% YoY. Of this total, 6,438 are free customers using Cemig D’s distribution network.
| Mar/26 | Mar/25 | % Change | |
| NUMBER OF CAPTIVE CUSTOMERS | |||
| Residential | 8,247,521 | 8,017,329 | 2.9% |
| Industrial | 22,455 | 23,926 | -6.1% |
| Commercial, Services, and Other | 875,867 | 910,920 | -3.8% |
| Rural | 373,448 | 393,234 | -5.0% |
| Public Sector | 75,148 | 73,991 | 1.6% |
| Street Lighting | 8,186 | 7,220 | 13.4% |
| Public Services | 13,163 | 13,519 | -2.6% |
| Own Consumption | 872 | 818 | 6.6% |
| Total captive customers | 9,616,660 | 9,440,957 | 1.9% |
| NUMBER OF FREE MARKET CUSTOMERS | |||
| Industrial | 2,520 | 2,091 | 20.5% |
| Commercial | 3,322 | 2,692 | 23.4% |
| Rural | 168 | 115 | 46.1% |
| Public Sector | 81 | 43 | 88.4% |
| Public Service | 339 | 109 | 211.0% |
| Utilities | 8 | 8 | 0.0% |
| Total free market customers | 6,438 | 5,058 | 27.3% |
| Total Captive + Free Market | 9,623,098 | 9,446,015 | 1.9% |
Cemig | Earnings Release | 11 |
| |
2025 Tariff Adjustment
Cemig D's tariffs are adjusted annually in May, with a tariff review process conducted every five years in the same month. The annual adjustment is designed to fully pass through non-manageable costs and to apply an inflation adjustment to manageable costs, as defined in the tariff review. The adjustment index for manageable costs is IPCA, from which the X Factor is deducted to capture productivity gains, in line with the price-cap regulatory model.
On May 20, 2025, ANEEL approved the result of the Company's Tariff Adjustment, effective from May 28, 2025 through May 27, 2026, with an average impact of 7.78% for consumers. The average effect for low-voltage customers was 7.03%, while for residential consumers it was 6.86%. The adjustment corresponding to the Company's manageable costs (Portion B) had an impact of 1.36 p.p. on the tariff adjustment; non-manageable costs (Portion A) related to energy purchase, transmission, sector charges, and irrecoverable revenues accounted for 6.12 p.p.; and the financial components of the tariff represented an increase of 0.30 p.p. The item with the greatest impact on the tariff adjustment was sector charges, which contributed an effect of 4.63 p.p., driven by the increase in the CDE.
| Average Effect of the Tariff Adjustment | |
| High-Voltage Average | 9.45% |
| Low-Voltage Average | 7.03% |
| Average Effect | 7.78% |
Additional information at:
https://www2.aneel.gov.br/aplicacoes/tarifa/arquivo/SEI_0111327_Nota_Tecnica_116_Cemig.pdf
Tariff Review
Highlights of the 2023 and 2018 Tariff Reviews:
| Tariff Review | 2018 | 2023 |
| Gross remuneration base - R$ million | 20,490 | 25,587 |
| Net remuneration base - R$ million | 8,906 | 15,200 |
| Average depreciation rate | 3.84% | 3.95% |
| WACC (after taxes) | 8.09% | 7.43% |
| Remuneration on Special Obligations - R$ million | 149 | 272 |
| CAIMI - R$ million | 333 | 484 |
| QRR R$ - Depreciation (Gross base x depreciation rate) | 787 | 1,007 |
* CAIMI: (Cobertura Anual de Instalações Móveis e Imóveis) – Annual support for facilities
* QRR: ‘Regulatory Reintegration Quota’: Gross
base x annual depreciation rate
Additional information at:
https://www2.aneel.gov.br/aplicacoes/tarifa/arquivo/NT%2012%202023%20RTP%20Cemig.pdf
Cemig | Earnings Release | 12 |
| |
OPEX and EBITDA - Actual vs. Regulatory
Performance exceeded regulatory OPEX and EBITDA in 1Q26 by R$65 million and R$61 million, respectively.
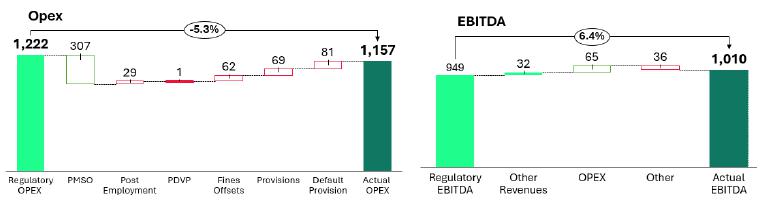
Regulatory Ebitda is calculated by reference to: (i) remuneration of capital; (ii) the QRR quota (Gross base x annual depreciation rate); and (iii) a percentage of the Annual Cost of Facilities and Real Estate, published in Aneel Technical Notes at the times of Tariff Reviews and Tariff Adjustments.
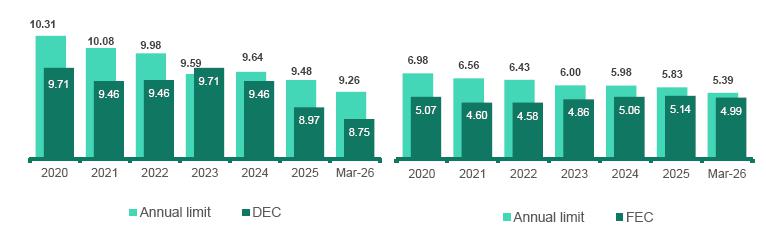
Quality Indicators – DEC/FEC
DEC (Equivalent Interruption Duration per Consumer Unit) reached 8.75 hours in 1Q26—a record low and below the regulatory limit of 9.26 hours. This result represents a reduction of 40 minutes compared to the rolling 12-month period ended March 2025. FEC (Equivalent Interruption Frequency per Consumer Unit) remained slightly below the regulatory benchmark of 5.39, reaching 4.99 on a rolling 12-month basis at the end of 1Q26 (vs. 5.14 in December 2025).
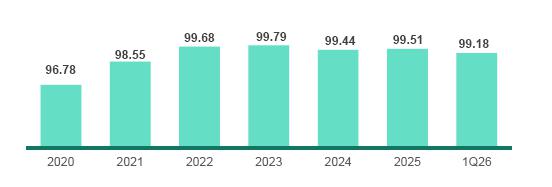
Combating Delinquency
The Receivables Collection Index has remained above 99% since 2022, reaching 99.18% in March 2026. This performance reflects the effectiveness of our collection tools and the successful conclusion of key negotiations, leading to improved cash collections from customers.
Digital collections (PIX, direct debit, credit cards, app, etc.) reached 70.18% of total collections, up from 67.17% in March 2025. PIX, the most widely used payment method, accounted for 36% of collections and has generated R$41.0 million in fee savings since its implementation in 2021.
Cemig | Earnings Release | 13 |
| |

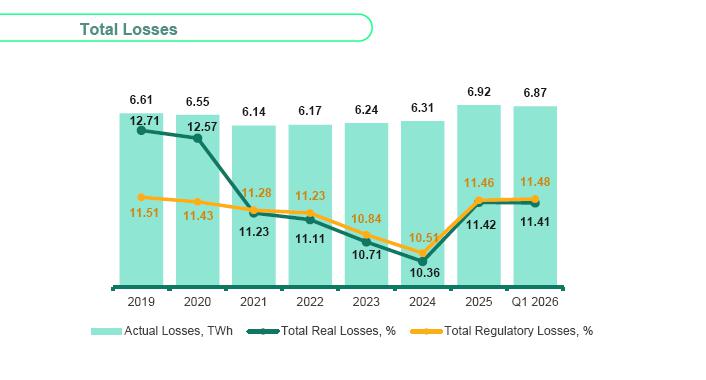
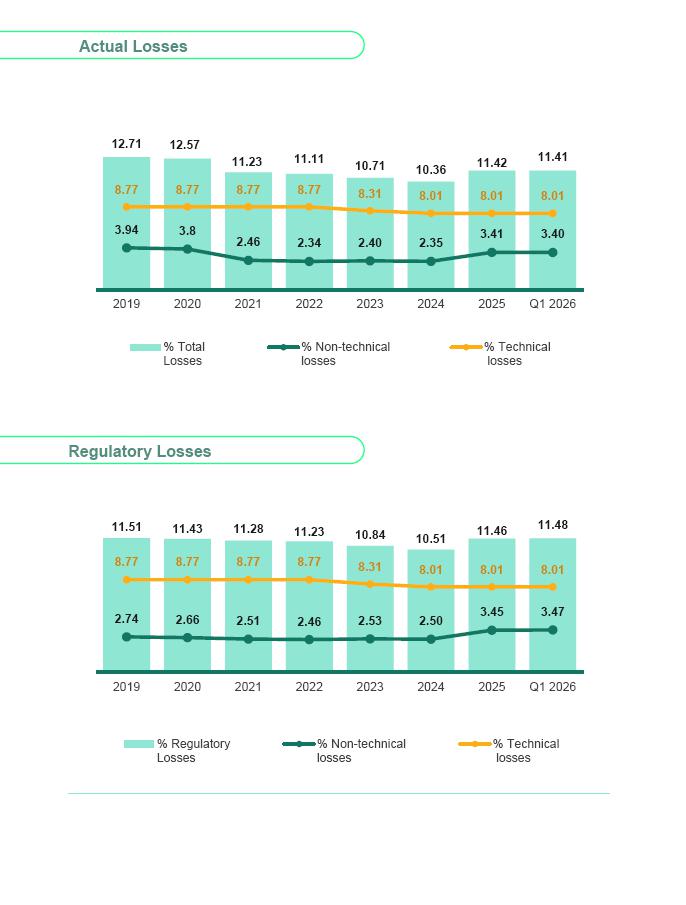
Losses
Energy losses remained below the regulatory target in the 12-month period ended March 2026, reaching 11.41%, compared to a target of 11.48%. Following the tariff adjustment effective May 28, 2025, an enhanced methodology for calculating non-technical loss coverage—defined by ANEEL in Technical Note No. 53/2025—was implemented. The updated methodology includes measured DG energy in the calculation, rather than billed energy, resulting in higher tariff coverage for energy losses.
Key loss-reduction measures implemented in 1Q26 included 74,000 inspections, the replacement of more than 81,000 obsolete meters and 92,000 smart meters (bringing the total to 695,000 since the project’s inception in September 2021). In addition, illegal connections were regularized for households in informal settlements and complex areas using shielded wiring, totaling 27,900 regularizations since the project’s inception in February 2023.
In 2026, the plan calls for 358,000 inspections, 400,000 smart meter installations, replacement of 150,000 obsolete meters, and the regularization of 25,000 households in low-income communities, leveraging BT Zero and Shielded Metering Panel technologies. It also includes expanding capacitor banks to enhance control of technical losses, among other structural initiatives.
Cemig | Earnings Release | 14 |
| |
Cemig | Earnings Release | 15 |
| |

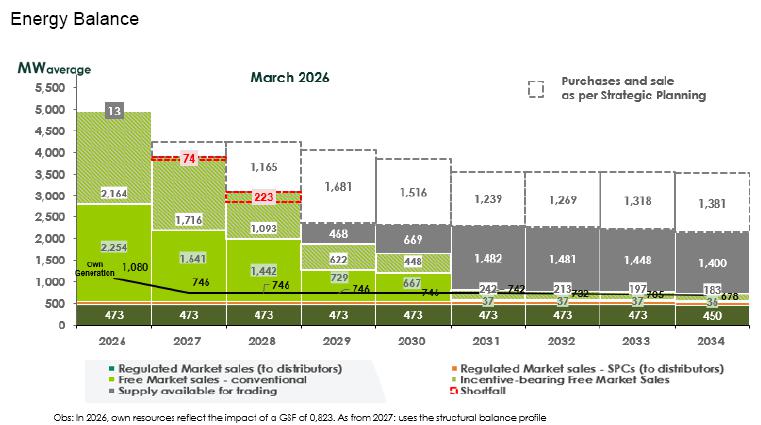
Energy Market
Energy sold by both Cemig GT and Cemig Holding, excluding CCEE, grew (+0.5%) YoY, with energy billed by Cemig GT totaling 6,539 GWh (including quota energy), up by 12.0% YoY, and Cemig Holding recording sales of 4,114 GWh, down 13.6% YoY. The migration of third-party purchase contracts from Cemig GT to Cemig Holding began in 3Q21 and has been proceeding gradually since then, having already reached approximately 61%. Of the total sold by the Holding and Cemig GT in 1Q26, 435.7 GWh were sold in the retail market.
| 1Q26 | 1Q25 | % Change | |
| Cemig GT - MWh | |||
| Free Market Customers | 3,629,097 | 3,390,177 | 7.0% |
| Industrial | 2,342,687 | 2,232,751 | 4.9% |
| Commercial | 1,207,399 | 1,027,676 | 17.5% |
| Rural | 39,352 | 22,979 | 71.3% |
| Public Sector | 39,659 | 106,771 | -62.9% |
| Free Market (ACL) – Traders and Cooperatives | 1,737,699 | 1,266,006 | 37.3% |
| Supply Quotas | 567,622 | 580,100 | -2,2% |
| Regulated Market (ACR) | 571,697 | 570,369 | 0.2% |
| Regulated Market (ACR) – Cemig D | 33,437 | 32,323 | 3.4% |
| Total GT | 6,539,552 | 5,838,975 | 12.0% |
| Cemig H - MWh | |||
| Free Market Customers | 2,050,436 | 2,308,556 | -11.2% |
| Industrial | 1,580,159 | 1,805,744 | -12.5% |
| Commercial | 405,428 | 466,944 | -13.2% |
| Rural | 41,859 | 35,868 | 16.7% |
| Public Service | 22,991 | 0 | - |
| Free Market (ACL) – Traders and Cooperatives | 2,063,547 | 2,454,390 | -15.9% |
| Total H | 4,113,984 | 4,762,946 | -13.6% |
| Cemig GT + H | 10,653,535 | 10,601,922 | 0.5% |
Cemig | Earnings Release | 16 |
| |

Gasmig is the exclusive distributor of piped natural gas in the state of Minas Gerais, serving industrial, commercial, residential, CNG, automotive, and thermoelectric segments. Its concession extends through January 2053. Cemig holds a 99.57% stake.
In April 2022, the Tariff Review process for Gasmig was completed. Highlights were:
| · | Actual post-tax WACC decreased from 10.02% p.a. to 8.71% p.a. |
| · | Net Remuneration Base increased significantly, reaching R$3.48 billion |
| · | PMSO costs fully recognized by the regulator |
| EBITDA - R$ thousand | 1Q26 | 1Q25 | Var. % |
| Net Income | 100,598 | 114,383 | -12,1% |
| Income tax and social contribution expense | 47,083 | 59,679 | -21,1% |
| Financial result | 21,138 | 15,627 | 35,3% |
| Depreciation and amortization | 23,921 | 23,429 | 2,1% |
| EBITDA in accordance to “CVM Resolution 156” | 192,74 | 213,118 | -9,6% |
The decrease in Gasmig’s EBITDA (-9.6% YoY) was driven by a 3.4% decline in distributed volume and customer migration to the free market, which carries lower margins.
Total volume of gas distributed was 3.4% lower YoY in 1Q26, with volume sold to the captive market down 53.1% (-104,100 m³) and volume distributed to industrial and thermal free-market customers up 167.0% (+95,500 m³). Sales volume declined mainly due to the migration of industrial customers to the free market, leading to higher volumes distributed to this segment. Overall, the industrial segment was the main driver of the decline, with a reduction of 7,000 m³ YoY.
Gasmig saw a 5.2% YoY increase in its client base, reaching 110,842 consumers. This growth was driven by both the residential (+4,000 customers) and commercial (+1,400 customers) segments.
| MARKET (Volume in thousand m3) | 2023 | 2024 | 2025 | 1Q25 | 1Q26 | 1Q26 vs. 1Q25 |
| Automotive | 31,907 | 22,511 | 19,216 | 5,473 | 3,923 | -28.3% |
| Automotive Compressed Natural Gas | 541 | 630 | 417 | 148 | 97 | -34.5% |
| Industrial | 830,943 | 786,363 | 513,509 | 177,025 | 76,892 | -56.6% |
| Industrial Compressed Natural Gas | 12,473 | 10,275 | 8,938 | 2,254 | 1,487 | -34.0% |
| Residential | 11,912 | 12,095 | 13,194 | 2,747 | 3,028 | 10.2% |
| Cogeneration | 12,075 | 12,164 | 10,108 | 2,826 | 123 | -95.6% |
| Commercial | 21,964 | 23,203 | 24,598 | 5,477 | 6,281 | 14.7% |
| Subtotal - captive market | 921,815 | 867,241 | 589,980 | 195,950 | 91,831 | -53.1% |
| Industrial - free market | 92,362 | 107,723 | 364,178 | 41,065 | 134,841 | 228.4% |
| Industrial Compressed Natural Gas - free market | 0 | 7,699 | 10,145 | 2,150 | 2,255 | 4.9% |
| Cogeneration - free market | 0 | 0 | 3,763 | 0 | 3,786 | - |
| Thermal - free market | 19,050 | 58,046 | 66,919 | 13,955 | 11,785 | -15.5% |
| Subtotal - free market | 111,412 | 173,468 | 445,005 | 57,170 | 152,667 | 167.0% |
| Total (captive + free) | 1,033,227 | 1,040,709 | 1,034,985 | 253,120 | 244,498 | -3.4% |
Cemig | Earnings Release | 17 |
| |

Operating Revenue
| 1Q26 | 1Q25 | % Change | |
| R$ thousand | |||
| Gross electricity supply | 8,995,136 | 8,374,412 | 7.4% |
| Revenue from the use of electrical distribution systems – TUSD | 1,510,020 | 1,429,008 | 5.7% |
| CVA and other financial components | 369,582 | 126,322 | 192.6% |
| Revenue from transmission operation and maintenance | 49,336 | 60,439 | -18.4% |
| Revenue from transmission construction and improvement | 151,789 | 66,344 | 128.8% |
| Financial return on transmission contract assets | 38,341 | 173,432 | -77.9% |
| Revenue from generation compensation | 35,146 | 26,928 | 30.5% |
| Distribution construction revenue | 1,376,970 | 1,148,545 | 19.9% |
| Adjustment to expected cash flow from the indemnifiable financial asset of the distribution concession (VNR) | 65,278 | 53,203 | 22.7% |
| Revenue from financial restatement of the concession grant | 120,632 | 138,457 | -12.9% |
| Settlement with CCEE | 19,832 | 21,923 | -9.5% |
| Gas supply | 556,413 | 920,783 | -39.6% |
| Compensation for violation of continuity indicator standard | -48,017 | -46,812 | 2.6% |
| Other revenue | 1,030,792 | 722,019 | 42.8% |
| Taxes and charges levied on revenue | -3,808,707 | -3,370,772 | 13.0% |
| Net revenue | 10,462,543 | 9,844,231 | 6.3% |
Gross Electricity Supply
| 1Q26 | 1Q25 | % Change | ||||||
| MWh | R$ thousand | AVERAGE BILLED PRICE (R$/MWh) (1) | MWh | R$ thousand | AVERAGE BILLED PRICE (R$/MWh) (1) | MWh | R$ thousand | |
| Residential | 4,127,482 | 3,810,859 | 923.29 | 3,837,945 | 3,422,558 | 891.77 | 7.54% | 11.35% |
| Industrial | 4,129,740 | 1,102,746 | 267.03 | 4,311,273 | 1,204,333 | 279.35 | -4.21% | -8.44% |
| Commercial, services, and others | 3,026,994 | 1,716,199 | 566.96 | 3,062,598 | 1,646,848 | 537.73 | -1.16% | 4.21% |
| Rural | 706,355 | 536,824 | 759.99 | 738,830 | 516,804 | 699.49 | -4.40% | 3.87% |
| Public sector | 286,640 | 241,090 | 841.09 | 262,961 | 227,803 | 866.3 | 9.00% | 5.83% |
| Street lighting | 233,039 | 142,727 | 612.46 | 233,904 | 128,335 | 548.67 | -0.37% | 11.21% |
| Public services | 266,561 | 122,887 | 461.01 | 297,993 | 150,285 | 504.32 | -10.55% | -18.23% |
| Subtotal | 12,776,811 | 7,673,332 | 600.57 | 12,745,504 | 7,296,966 | 572.51 | 0.25% | 5.16% |
| Own Consumption | 7,862 | - | - | 7,925 | - | - | -0.79% | - |
| Net unbilled retail supply | - | 75,814 | - | - | -32,457 | - | 0 | - |
| Wholesale Supply | 12,784,673 | 7,749,146 | 600.57 | 12,753,429 | 7,264,509 | 572.51 | 0.24% | 6.67% |
| Wholesale supply to other utilities | 4,894,581 | 1,242,619 | 253.88 | 4,825,648 | 1,191,775 | 246.97 | 1.43% | 4.27% |
| Net unbilled wholesale supply | - | 3,371 | - | - | -81,872 | - | - | - |
| Total | 17,679,254 | 8,995,136 | 504.54 | 17,579,077 | 8,374,412 | 483.11 | 0.57% | 7.41% |
| (1) | The average price does not include revenue from unbilled supply |
Cemig | Earnings Release | 18 |
| |
* Including DG-offset energy
Supply Revenue
Gross revenue from energy supply totaled R$8,995.1 million in 1Q26, compared to R$8,374.4 million in 1Q25, up 7.4% YoY, mainly driven by Cemig D’s annual tariff adjustment effective May 28, 2025, with an average increase of 7.78%.
Transmission
The Company’s transmission revenue consists of operating and maintenance revenue, construction revenue, and financial compensation of the contractual asset. In 1Q26, transmission revenue totaled R$239.5 million, down 20.2% YoY. Revenue from financial compensation of the contractual asset decreased by R$135.1 million due to the lower IPCA in the period (the inflation index used to adjust revenue), while construction revenue increased by R$85.4 million, driven by higher investments.
Gas
Gross revenue from gas supply totaled R$556.4 million in 1Q26, down 39.6% YoY, primarily impacted by the migration of industrial customers to the free market and the resulting reduction in sales volume.
Use of Electrical Distribution Systems - TUSD
In 1Q26, TUSD revenue derived from charges levied on free-market consumers for distributed energy increased by R$81.0 million (+5.7%) YoY. This change reflects the distribution company’s annual tariff adjustment, effective May 2025 and fully reflected in the quarter, as well as higher charges paid by consumers, partially offset by lower volumes transported to free-market customers.
CVA (Variation Compensation Account for “Portion A” Items) and other financial components
Revenue of R$369.6 million was recognized in 1Q26, up 192.6% YoY, mainly driven by higher energy purchase costs and CDE costs exceeding the level set in the tariff adjustment.
Cemig D recognizes in its financial statements the positive or negative differences between actual non-manageable costs and the estimated costs underlying tariff setting. These balances represent amounts to be refunded to consumers or passed through to the Company in future tariff adjustments.
Cemig | Earnings Release | 19 |
| |
Operating Costs and Expenses
| CONSOLIDATED (R$ thousand) | 1Q26 | 1Q25 | % Change |
| Energy purchased for resale | 4,915,028 | 4,266,626 | 15.2% |
| Basic grid usage charges | 718,658 | 767,266 | -6.3% |
| Gas purchased for resale | 213,270 | 488,852 | -56.4% |
| Construction Cost | 1,482,436 | 1,201,864 | 23.3% |
| Personnel | 365,592 | 346,291 | 5.6% |
| Employee and management profit sharing | 45,054 | 43,285 | 4.1% |
| Post-employment obligations | 50,233 | 102,405 | -50.9% |
| Materials | 32,348 | 38,693 | -16.4% |
| Third-party services | 596,063 | 514,714 | 15.8% |
| Depreciation and amortization | 401,321 | 363,847 | 10.3% |
| Provisions (reversals) | 84,000 | 145,574 | -42.3% |
| Expected credit losses | 83,363 | 50,628 | 64.7% |
| Expected loss on other loans | 34,534 | 0 | - |
| Other costs and expenses | 131,804 | 92,908 | 41.9% |
| Total costs and expenses | 9,153,704 | 8,422,953 | 8.7% |
| Gain on disposal of intangible assets | -26,191 | 0 | |
| Total other revenue (reduction in expenses) | -26,191 | 0 | - |
| Grand total | 9,127,513 | 8,422,953 | 8.4% |
Operating costs and expenses totaled R$9.15 billion in 1Q26, up R$730.8 million (+8.7%). This amount excludes R$26.2 million in other revenue, related to gains on real estate sales and classified as contra-revenue.
This variation was mainly driven by a R$684.4 million increase in purchased energy costs and a R$280.6 million increase in construction costs (reflecting higher investments), partially offset by lower gas purchase costs for resale (-R$275.6 million).
Further details on costs and expenses are provided below:
Energy Purchased for Resale
| CONSOLIDATED (R$ thousand) | 1Q26 | 1Q25 | % Change |
| Energy purchased on the free market | 1,781,732 | 1,511,636 | 17.9% |
| Energy purchased through auction in the regulated market | 1,260,776 | 963,255 | 30.9% |
| Distributed generation | 1,018,078 | 950,867 | 7.1% |
| Short-term energy | 593,620 | 319,240 | 85.9% |
| Energy from Itaipu Binacional | 271,131 | 306,415 | -11.5% |
| Firm energy quota contracts | 187,244 | 202,949 | -7.7% |
| Bilateral contracts | 26,328 | 121,982 | -78.4% |
| PROINFA | 108,403 | 134,839 | -19.6% |
| Quotas for the Angra I and II plants | 54,984 | 83,446 | -34.1% |
| PIS/Pasep and Cofins credits | -387,268 | -328,003 | 18.1% |
| Total | 4,915,028 | 4,266,626 | 15.2% |
Cemig | Earnings Release | 20 |
| |
The consolidated cost of energy purchased for resale was R$4.92 billion in 1Q26, up R$648.4 million YoY. This variation is mainly due to the following factors:
| · | Energy purchase costs in the free market, which represent the largest share of total energy purchase costs (R$1,781.7 million), increased by 17.9% YoY, reflecting the need to manage hydrological risk and to close short positions at higher prices. |
| · | Cost of short-term energy, which was up by R$274.4 million (+85.9%) YoY, mainly explained by higher exposure to the spot market in a scenario of higher PLD across all submarkets. |
| · | Cost of energy purchased in regulated market auctions, up by R$297.5 million (+30.9%) YoY, reflecting new contracts and annual IPCA-linked adjustments. |
| Cemig D (R$ thousand) | 1Q26 | 1Q25 | % Change |
| Energy purchased in regulated market auctions | 1,276,628 | 975,020 | 30.9% |
| Distributed generation | 1,018,078 | 950,867 | 7.1% |
| Short-term energy - CCEE | 328,894 | 164,403 | 100.1% |
| Itaipu Binacional Energy | 271,131 | 306,415 | -11.5% |
| Firm energy quota contracts | 191,504 | 207,353 | -7.6% |
| Bilateral contracts | 26,328 | 121,982 | -78.4% |
| PROINFA | 108,403 | 134,839 | -19.6% |
| Quotas for the Angra I and II plants | 49,970 | 83,446 | -40.1% |
| PIS/Pasep and Cofins credits | -197,993 | -174,270 | 13.6% |
| Total | 3,072,943 | 2,770,055 | 10.9% |
Cemig | Earnings Release | 21 |
| |
Gas purchased for resale
The cost of gas purchases was R$213.3 million in 1Q26, down 56.4% YoY, primarily due to lower gas purchase volumes for the regulated market, reflecting the migration of major industrial customers to the free gas market.
Third-party services
Expenses with third-party services increased by 15.8% (+R$81.3 million) YoY, primarily driven by the following increases: R$43.4 million (+24.8%) in maintenance, largely due to increased preventive maintenance, R$12.3 million (+17.9%) in information technology, and R$8.8 million (+39.0%) in tree trimming.
Expected credit losses (ECL)
The R$32.8 million YoY increase is partly explained by the change to the threshold for full loss recognition, extended from 24 to 36 months effective August 2024, with a reducing effect phased in over 12 months.
Provisions
Provisions for contingencies totaled R$84.0 million in 1Q26, down R$61.6 million YoY. The decrease is primarily driven by a lower level of labor-related provisions
Post-employment obligations
Expenses related to post-employment obligations decreased by R$52.2 million YoY, and by R$79.9 million excluding the non-recurring effect of the remeasurement of the obligation in 1Q25. This reduction reflects the termination of the health plan obligation, following an agreement with unions and retirees ratified by the Regional Labor Court (TRT) at the end of 2025.
Personnel
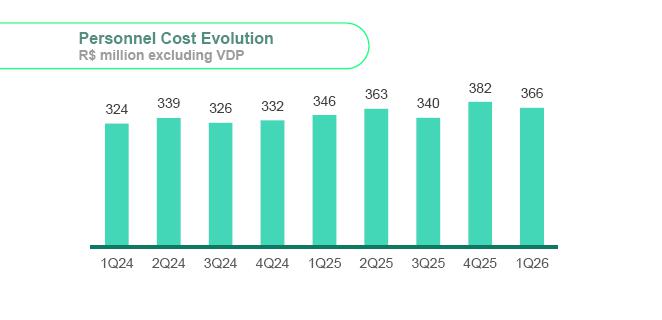
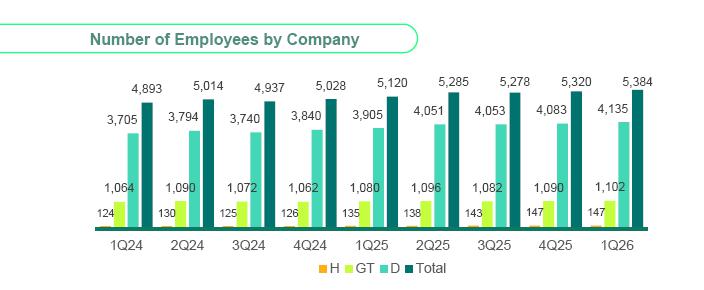
Personnel expenses totaled R$365.6 million in 1Q26, up R$19.3 million (+5.6%) YoY. Growth was mainly driven by an approximately 5% increase in the average number of employees between the periods, as well as the annual collective wage adjustment.
Cemig | Earnings Release | 22 |
| |
Employees and management profit sharing
The expense related to profit sharing was R$45.1 million in 1Q26, up R$1.8 million YoY.
Equity Income
| EQUITY INCOME (R$ thousand) | 1Q26 | 1Q25 | Change (R$ thousand) |
| Taesa | 74,184 | 76,084 | -1,900 |
| Cemig Sim | 0 | 4,894 | -4,894 |
| Paracambi | 4,098 | 3,571 | 527 |
| Cachoeirão HPP | 2,277 | 1,750 | 527 |
| Pipoca HPP | 404 | 3,760 | -3,356 |
| Guanhães Energy | 2,517 | 8,390 | -5,873 |
| Belo Monte (Aliança Norte and Amazônia Energia) | -31,155 | -56,330 | 25,175 |
| Total | 52,325 | 42,119 | 10,206 |
Equity income increased by R$10.2 million in 1Q26 vs. 1Q25. The main driver was the improvement in Belo Monte’s results, reflecting lower operating costs. In addition, following the asset unwinding at the end of 2025, Cemig Sim no longer reports equity income, as all assets are now fully owned.
Cemig | Earnings Release | 23 |
| |

| (1) | EBITDA is a non-GAAP measure prepared by the Company and reconciled to its consolidated financial statements in accordance with Circular Letter CVM/SNC/SEP No. 01/2007 and CVM Resolution No. 156, dated June 23, 2022. It is defined as net income adjusted for net financial results, depreciation and amortization, and income tax and social contribution. EBITDA is not recognized under Brazilian Accounting Standards or IFRS, has no standardized definition, and may not be comparable to similarly titled measures reported by other companies. The Company uses EBITDA to assess performance. It should not be considered in isolation or as a substitute for net income or operating income, nor as a measure of operating performance, cash flow, liquidity, or debt repayment capacity. The Company also adjusts EBITDA to exclude non-recurring items that do not reflect underlying cash generation, in line with CVM Resolution No. 156/2022. |
| Consolidated EBITDA 1Q26 | |||||||
| R$ thousand | Generation | Transmission | Trading | Distribution | Gas | Holding / Investments | Total |
| Net income for the period | 396,428 | 138,987 | -125,152 | 397,653 | 100,598 | 70,465 | 978,979 |
| Income tax and social contribution expense | 33,065 | 20,581 | -28,658 | 54,435 | 38,568 | -48,039 | 69,952 |
| Financial result | 23,619 | 14,414 | -7,243 | 283,611 | 21,138 | 2,885 | 338,424 |
| Depreciation and amortization | 79,143 | 4,610 | 3 | 274,697 | 32,437 | 10,431 | 401,321 |
| EBITDA in accordance with “CVM Res. 156” | 532,255 | 178,592 | -161,050 | 1,010,396 | 192,741 | 35,742 | 1,788,676 |
| Non-recurring and non-cash items | |||||||
| Net income attributable to non-controlling shareholders | - | - | - | - | -434 | - | -434 |
| Adjusted EBITDA | 532,255 | 178,592 | -161,050 | 1,010,396 | 192,307 | 35,742 | 1,788,242 |
| Consolidated EBITDA 1Q25 | |||||||
| R$ thousand | Generation | Transmission | Trading | Distribution | Gas | Holding / Investments | Total |
| Net income for the period | 393,883 | 163,510 | 64,065 | 311,162 | 114,384 | -8,264 | 1,038,740 |
| Income tax and social contribution expense | 82,732 | 33,592 | -23,540 | 58,606 | 57,975 | -34,339 | 175,026 |
| Financial result | 3,558 | 5,967 | -3,831 | 202,095 | 15,627 | 26,215 | 249,631 |
| Depreciation and amortization | 80,295 | 5,043 | 3 | 247,492 | 25,133 | 5,881 | 363,847 |
| EBITDA in accordance with “CVM Res. 156” | 560,468 | 208,112 | 36,697 | 819,355 | 213,119 | -10,507 | 1,827,244 |
| Non-recurring and non-cash items | |||||||
| Net income attributable to non-controlling shareholders | - | - | - | - | -492 | - | -492 |
| Remeasurement of post-employment liabilities | -2,829 | -1,747 | -400 | -21,599 | - | -1,122 | -27,697 |
| Adjusted EBITDA | 557,639 | 206,365 | 36,297 | 797,756 | 212,627 | -11,629 | 1,799,055 |
EBITDA of R$1,788.7 million in 1Q26 represented a 2.1% YoY decrease, while adjusted EBITDA decreased by 0.6%. The main effects in the comparison are as follows:
| · | R$191.0 million increase in Cemig D’s EBITDA, mainly driven by the positive impact of the tariff adjustment (average effect of 7.78%, effective May 2025), lower post-employment expenses, and improved performance in energy losses. |
| · | R$197.7 million decrease in EBITDA from the trading activity, reflecting higher costs to close short positions at elevated prices, partially offset by a less negative submarket effect than in 1Q25. |
| · | R$79.9 million reduction in adjusted post-employment expenses, excluding the R$27.7 million positive effect from the remeasurement held in 1Q25. The reduction is explained by the termination of the health plan obligation, following an agreement ratified by the Regional Labor Court (TRT) at the end of 2025. |
| · | R$49 million negative impact from lower GSF for the quarter (0.92 in 1Q26 vs. 1.08 in 1Q25) which led to higher energy purchases at elevated PLD levels |
Cemig | Earnings Release | 24 |
| |
| · | R$20.4 million YoY reduction in Gasmig’s EBITDA, reflecting a 3.4% decline in distributed gas volume and significant customer migration to the free market, which carries lower regulatory margins. |
| · | R$10.1 million YoY increase in Cemig Sim’s EBITDA, reaching R$19.5 million, due to increased installed capacity. |
Cemig D EBITDA
| Cemig D EBITDA - R$ thousand | 1Q26 | 1Q25 | % Change |
| Net income for the period | 397,653 | 311,158 | 27.8% |
| Income tax and social contribution expense | 54,435 | 58,607 | -7.1% |
| Net financial income | 283,611 | 202,096 | 40.3% |
| Amortization | 274,697 | 247,491 | 11.0% |
| EBITDA in accordance with “CVM Resolution 156” | 1,010,396 | 819,352 | 23.3% |
| Remeasurement of post-employment liabilities | - | -21,599 | - |
| Adjusted EBITDA | 1,010,396 | 797,753 | 26.7% |
| VNR | 65,278 | 53,203 | 22.7% |
| Adjusted EBITDA minus VNR | 945,118 | 744,550 | 26.9% |
Cemig D reported EBITDA of R$1,010.4 million, up 23.3% YoY. Adjusted EBITDA, in turn, grew 26.7% compared to the same period last year. The main effects on EBITDA in the quarters’ comparison are as follows:
| · | Tariff adjustment with an average effect of 7.78%, effective May 2025, offset by a market decline YoY |
| o | Distributed energy (excluding DG): -3.2% (comprising -4.0% in the captive market and -2.5% in the free market). The variation mainly reflects the migration to DG, lower industrial consumption (-6.2%), which was strongly influenced by the migration of two large customers to the basic grid, and the reduction in rural consumption (-6.4%), influenced by higher rainfall. Residential consumption, in turn, increased by 2.6% YoY |
| o | Total distributed energy, including DG-offset energy: -0.4% YoY |
| · | R$58.0 million reduction in adjusted post-employment obligation expenses, excluding the R$21.6 million positive effect from the remeasurement held in 1Q25. The reduction is explained by the termination of the health plan post-employment obligation, following an agreement ratified by the Regional Labor Court (TRT) at the end of 2025 |
| · | Good performance in energy losses, which stood at 11.41% over the 12-month window, below the regulatory coverage of 11.48%. In 1Q25, the change in the loss calculation methodology— whereby ANEEL began incorporating the effects of energy injected from distributed generation—had not yet taken effect, which have increased regulatory coverage |
| · | R$35.9 million YoY decrease in provision for contingencies |
| · | R$24.7 million YoY increase in expected credit losses, in addition to the recognition of expected losses on other receivables totaling R$34.5 million in 1Q26 |
| · | R$33.7 million increase in asset retirement expenses, partially offset by the proceeds from the sale of real estate totaling R$26.2 million |
| · | R$65.3 million in VNR in 1Q26, compared to R$53.2 million in 1Q25 |
Cemig | Earnings Release | 25 |
| |
Cemig GT EBITDA
| Cemig GT EBITDA - 1Q26 | |||||
| R$ thousand | Generation | Transmission | Sales | Investments | Total |
| Net income for the period | 395,359 | 136,979 | -104,746 | -34,872 | 392,720 |
| Income tax and social contribution expense | 33,066 | 19,478 | -18,147 | 2,504 | 36,901 |
| Financial result | 23,619 | 14,971 | -7,243 | 20,175 | 51,522 |
| Depreciation and amortization | 82,749 | 4,670 | 3 | 7,083 | 94,505 |
| EBITDA in accordance with “CVM Res 156” | 534,793 | 176,098 | -130,133 | -5,110 | 575,648 |
| Adjusted EBITDA | 534,793 | 176,098 | -130,133 | -5,110 | 575,648 |
| Cemig GT EBITDA - 1Q25 | |||||
| R$ thousand | Generation | Transmission | Sales | Investments | Total |
| Net income for the period | 393,597 | 163,169 | 27,543 | -43,032 | 541,277 |
| Income tax and social contribution expense | 82,433 | 33,102 | 2,271 | -9,541 | 108,265 |
| Financial result | 3,639 | 6,196 | -3,871 | 9,590 | 15,554 |
| Depreciation and amortization | 81,922 | 2,299 | 3 | - | 84,224 |
| EBITDA in accordance with “CVM Res 156” | 561,591 | 204,766 | 25,946 | -42,983 | 749,320 |
| Remeasurement of post-employment liabilities | -2,829 | -1,747 | -400 | -538 | -5,514 |
| Adjusted EBITDA | 558,762 | 203,019 | 25,546 | -43,521 | 743,806 |
Cemig GT’s EBITDA totaled R$575.6 million in 1Q26, down 23.2% YoY, while adjusted EBITDA decreased by 22.6%. The main effects on EBITDA in the quarter are as follows:
| · | R$49 million negative impact from lower GSF for the quarter (0.92 in 1Q26 vs. 1.08 in 1Q25) which led to higher energy purchases at elevated PLD levels |
| · | R$156.1 million decrease in EBITDA from the trading activity, reflecting higher costs to close short positions at elevated prices, partially offset by a less negative submarket effect than in 1Q25 |
| · | R$17.0 million improvement in equity income, mainly due to less negative equity income from Belo Monte (R$31.2 million in 1Q26 vs. R$56.3 million in 1Q25) |
| · | R$19.5 million EBITDA from Cemig Sim, reflecting its full consolidation following its acquisition by GT in late 2025 |
| · | R$16.9 million reduction in adjusted post-employment expense, excluding the positive effect of R$5.5 million from the remeasurement held in 1Q25. The reduction is explained by the termination of the post-employment health plan obligation, following an agreement ratified by the Regional Labor Court (TRT) at the end of 2025 |
Cemig | Earnings Release | 26 |
| |
Financial Income and Expenses
| (R$ thousand) | 1Q26 | 1Q25 | % Change |
| Financial Income | 257,960 | 193,537 | 33.3% |
| Financial expenses | -596,384 | -443,168 | 34.6% |
| Financial result | -338,424 | -249,631 | 35.6% |
The consolidated financial result in 1Q26 represented a net financial expense of R$338.4 million, up R$88.8 million YoY. This performance is mainly due to the following factors:
| · | R$143.6 million increase in financial expenses related to debentures charges, reflecting higher gross debt and a higher CDI rate during the period (3.4% in 1Q26 vs. 3.0% in 1Q25) |
| · | R$27.7 million increase in financial income from CVA variations, reflecting a higher balance of regulatory assets to be passed through in the next tariff adjustment, driven by energy purchase costs at Cemig D exceeding those approved in the 2025 tariff adjustment. |
Net Income
Cemig reported net income of R$979.0 million in 1Q26, compared to R$1,038.7 million in 1Q25. Adjusted net income was 4.1% lower than 1Q25, when it totaled R$1,020.1 million.
As discussed in the previous sections, net income was primarily impacted by the reduction in EBITDA from trading, partly offset by improved performance at the distribution unit. The financial result, in turn, was negative R$338 million, R$88.8 million higher than 1Q25, due to the increase in net debt. Offsetting this factor, the effective income tax rate was lower in 1Q26, influenced by higher declared IoC, amounting to R$658 million in 1Q26 and R$541 million in 1Q25.
| Reconciliation of Consolidated Recurring Net Income | ||
| R$ thousand | 1Q26 | 1Q25 |
| Net income for the period (IFRS) | 978,979 | 1,038,740 |
| Remeasurement of post-employment liabilities | - | -18,280 |
| Recurring Net Income | 978,979 | 1,020,460 |

Cemig | Earnings Release | 27 |
| |

Investments totaled R$1.48 billion in 1Q26, up 22% YoY.
The main highlights in 1Q26 were: (i) a R$1.28 billion investment by Cemig Distribuição connecting over 26,000 new customers, building 6 new and expanding 1 substations, constructing 765,000 km of low- and medium-voltage networks, and installing 92,000 smart meters; (ii) a R$103 million investment in transmission reinforcements and improvements, addition of 19 MWp of installed capacity in distributed photovoltaic generation, and the construction of 23.6 km of gas pipelines by Gasmig.
The execution of the largest investment program in Cemig’s history ensures the modernization and reliability of its electric system, in line with the Company’s strategic focus on Minas Gerais and its core businesses, while delivering an even better service to customers. Investments of R$43.70 billion are planned for 2026–2030, including R$6.72 billion in 2026.
Cemig | Earnings Release | 28 |
| |

| CONSOLIDATED (R$ thousand) | Mar/26 | 2025 | % Change |
| Gross Debt | 19,610,517 | 19,465,331 | 0.7% |
| Cash and cash equivalents + marketable securities | 1,792,522 | 2,661,338 | -32.6% |
| Net Debt | 17,817,995 | 16,803,993 | 6.0% |
| CEMIG GT (R$ thousand) | Mar/26 | 2025 | % Change |
| Gross Debt | 3,190,730 | 3,155,368 | 1.1% |
| Cash and cash equivalents + marketable securities | 764,837 | 463,891 | 64.9% |
| Net Debt | 2,425,893 | 2,691,477 | -9.9% |
| CEMIG D (R$ thousand) | Mar/26 | 2025 | % Change |
| Gross Debt | 14,982,925 | 14,892,088 | 0.6% |
| Cash and cash equivalents + marketable securities | 441,369 | 1,268,007 | -65.2% |
| Net Debt | 14,541,556 | 13,624,081 | 6.7 |
The Company maintains disciplined execution of its financial strategy, focused on optimizing cash flow, reducing the cost of capital, and extending its debt maturity profile.
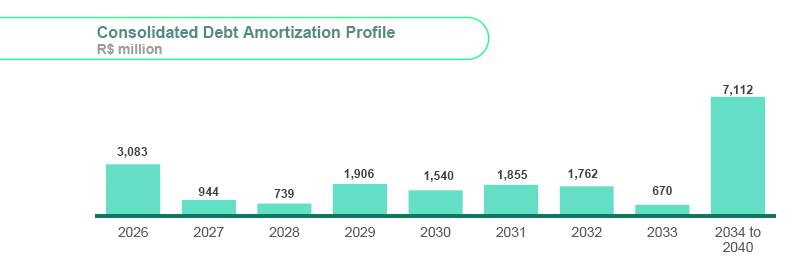
Average debt maturity reached 6.6 years at the end of 1Q26. Notably, 76% of total debt matures in 2029 or later, positioning repayments largely beyond upcoming Tariff Review processes for the distribution and transmission businesses, enhancing predictability and financial flexibility.
Resilience and Financial Flexibility
In a potentially more selective capital markets environment, the Company remains well positioned, supported by its strong credit ratings and the defensive nature of the electric power sector. The capital structure is further reinforced by pre-approved credit lines that can be rapidly deployed during periods of volatility. Management continuously monitors funding alternatives—including multilateral agencies, development banks, receivables discounting, and Law 4,131 loans—enabling the Company to access more favorable market windows. In scenarios of widening spreads, the impact on the overall cost of debt would be limited, as the current liability profile is not directly affected by secondary market movements or NTN-B yields.
Covenant Structure
The Company reiterates that its current covenant levels are appropriate for the maturity of its projects and aligned with industry peers, ensuring security for investors and supporting the sustainability of its operations.
Cemig | Earnings Release | 29 |
| |
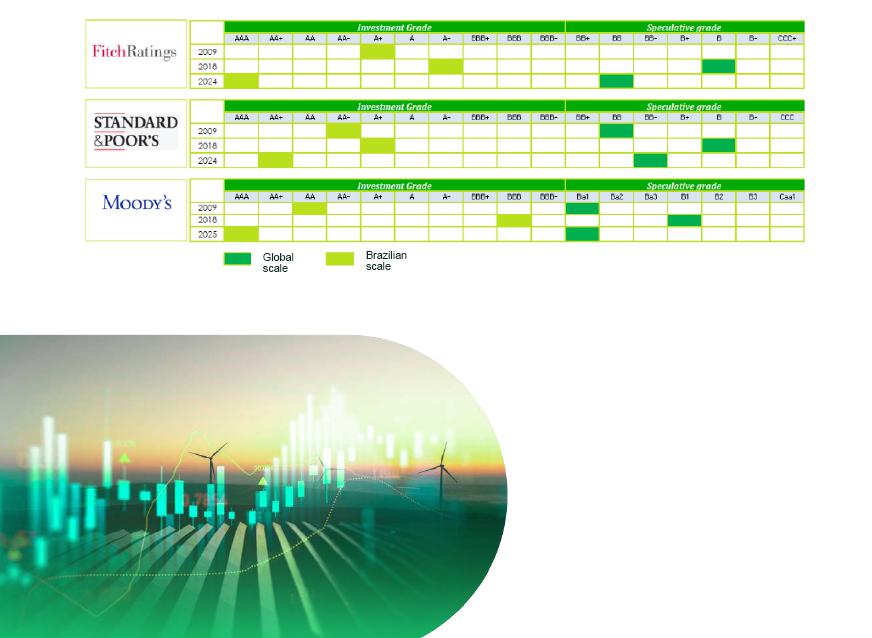
Cemig’s credit ratings have steadily improved in recent years, reaching the highest level in the Company’s history.
In 2025, the Company received an AAA rating from an additional credit rating agency, following a Moody's upgrade, further underscoring its financial strength, consistent performance, and disciplined capital allocation.
The evolution of ratings is shown below:
Cemig | Earnings Release | 30 |
| |

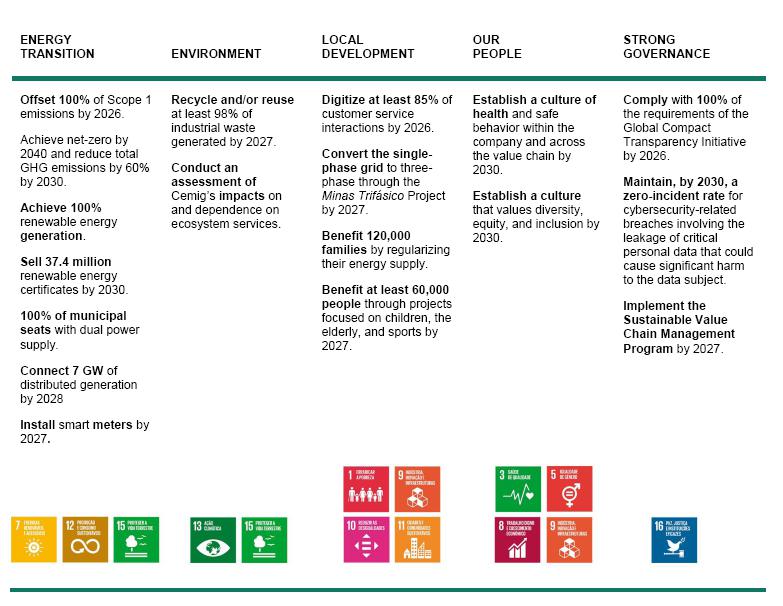
Cemig has established public sustainability commitments and is implementing strategic initiatives monitored through corporate KPIs and targets. These commitments are structured around five pillars: (i) Energy Transition, (ii) Environment, (iii) Local Development, (iv) Our People, and (v) Strong Governance.
Corporate Highlights
Energy Transition
Cemig reinforces its climate leadership by achieving 100% offsetting of Scope 1 emissions for 2024 ahead of schedule (with 2025 figures still pending) and expects to continue offsetting emissions in the coming years. In parallel, 700 municipalities are now served by dual power supply, in line with the goal of reaching full coverage of municipal seats under this system.
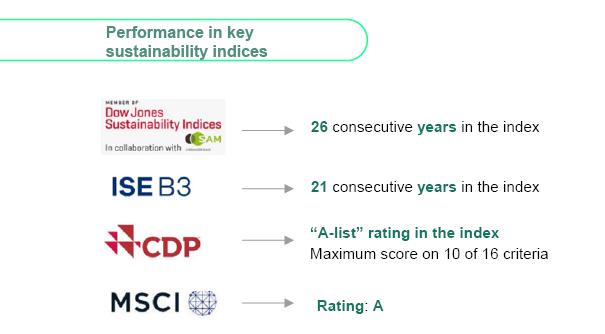
The company was once again selected for the CDP A List, achieving the maximum score in 10 of the 16 evaluated criteria, notably:
| · | Public commitment to net-zero emissions by 2040 |
| · | Development of low-carbon products |
| · | Strong initiatives to mitigate emissions and modernize the grid |
Cemig | Earnings Release | 31 |
| |
Environmental Highlight
The diagnosis of ecosystem services impacts and dependencies for Cemig has been completed. This assessment will support the development of internal strategies to mitigate negative impacts and reduce dependencies, contributing to improved operational processes and the promotion of biodiversity conservation.
Corporate Governance and Risk Management
In recent months, Cemig has advanced its governance practices. For the third consecutive year, the Company obtained the ISO 31000 Statement of Conformity, reinforcing the maturity of its risk management processes. In addition, the 2025–2026 Corporate Risk Matrix was approved, developed through a collaborative process and focused on consolidating key strategic risks under senior management oversight.
Sustainability indicators were reorganized to better align with Cemig’s new Materiality Matrix (pp. 6–7 of the Cemig Sustainability Report), which identifies eight material topics—three considered double material, four financially material, and one impact material. This reorganization strengthens the alignment between reported indicators and the Company’s priority themes, as well as those of its stakeholders.
Climate Change
| KPIs | 1Q26 |
| Renewable fuel consumption (GJ) – cumulative | 1,411 |
| Non-renewable fuel consumption (GJ) – cumulative | 30,812 |
| Basic grid loss rate (%) | 2 |
| Total distribution loss rate * | 11 |
| % of generation from renewable sources | 100 |
* ANEEL revised the methodology starting in 2Q25. Public Consultation No. 09/2024 requires the use of metered market data rather than billed data. Figures are calculated based on the average of the months in each quarter.
Renewable Energy
| KPIs | 1Q26 |
| I-RECs sold from renewable sources | 1,039,088 |
| Cemig RECs sold from renewable sources | 7,530,464 |
| Number of smart meters installed | 86,575 |
Water Resources
Cemig | Earnings Release | 32 |
| |
| KPIs | 1Q26 |
| Surface Water Monitoring Management Indicator (IGMAS) (%) | 100 |
People Health
| KPIs | 1Q26 |
| Accident frequency rate (direct and third-party employees) - cumulative | 3.31 |
| Number of fatal or non-fatal accidents involving the public - cumulative | 15 |
Local Communities
| KPIs | 1Q26 |
| Allocation to the Fund for Children and Adolescents (FIA) (R$) | 334,121 |
| Allocation to the Fund for the Elderly (R$) | 334,121 |
| Allocation via the Sports Incentive Law (R$) | 668,242 |
| Allocation to Culture (R$) | 94,675,653 |
Customer Satisfaction and Transparency
| KPIs | 1Q26 |
| DEC - Equivalent Interruption Duration per Customer (hours) | 8.75 |
| FEC – Equivalent Interruption Frequency per Customer (unit) | 4.94 |
Ethical Conduct and Integrity
| KPIs | 1Q26 |
| Total complaints received | 450 |
| Total valid or partially valid complaints resolved | 40 |
| Number of customers, consumers, and employees affected by significant harm due to violations related to Privacy and Personal Data Protection | 0 |
| Number of independent directors | 8 |
| % of shares held by members of the boards and executive management | 0 |

Cemig | Earnings Release | 33 |
| |

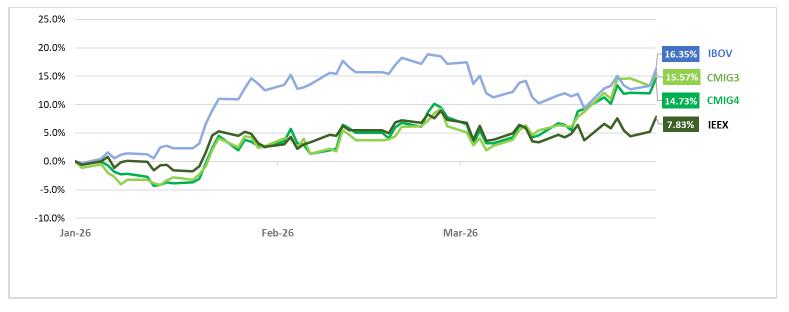
| Share Performance Name | Mar/26 | 2025 | % Change |
| Share price (2) | |||
| CMIG4 (PN) closing price (R$/share) | 12.61 | 10.99 | 14.73% |
| CMIG3 (ON) closing price (R$/share) | 16.75 | 14.49 | 15.57% |
| CIG (ADR PN) closing price (USD/share) | 2.39 | 2 | 19.35% |
| CIG.C (ADR ON) closing price (USD/share) | 3.28 | 2.61 | 25.67% |
| Average daily volume | |||
| CMIG4 (PN) (R$ million) | 157.89 | 127.52 | 23.82% |
| CMIG3 (ON) (R$ million) | 1.92 | 3.24 | -40.65% |
| CIG (ADR PN) (US$ million) | 13.42 | 5.49 | 144.17% |
| CIG.C (ADR ON) (US$ million) | 0.02 | 0.01 | 54.61% |
| Indices | |||
| IEE | 132,694 | 123,056 | 7.83% |
| IBOV | 187,462 | 161,125 | 16.35% |
| CDI | 10,614 | 10,258 | 3.47% |
| Indicators | |||
| Market value at period-end (R$ million) | 40,034 | 35,388 | 13.13% |
| Enterprise value (EV - R$ million) (1) | 56,843 | 48,488 | 17.23% |
| Dividend Yield CMIG4 (PN) (%) (3) | 13.41 | 14.74 | 1.45 p.p |
| Dividend Yield CMIG3 (ON) (%) (3) | 10.1 | 11.23 | 1.01 p.p |
| (1) EV = Market value (R$/share × number of shares) + consolidated net debt; | |||
| (2) Prices adjusted for distributions, including dividends | |||
| (3) Dividends distributed over the last four quarters / closing share price | |||
Considering trading volumes of common (ON) and preferred (PN) shares, Cemig ranked as the fifth most traded company in the Brazilian energy sector and among the most traded in the local capital market. On the New York Stock Exchange, trading volume of the Company’s preferred ADRs (CIG) totaled US$818.4 million in 2026, reflecting recognition from the investment market and reinforcing Cemig’s position as an attractive global investment option. The Ibovespa (the main benchmark index for the performance of B3, Brazil’s Stock Exchange) rose 16.35% during the period, while Cemig’s preferred and common shares gained 14.73% and 15.57%, respectively. The ADRs posted gains of 19.35% (preferred) and 25.67% (common).
Cemig | Earnings Release | 34 |
| |

| Power Plants | Company | Cemig Power (MW) | Cemig Firm Energy (MW) |
End of Concession | Type | Cemig Stake |
| Reversal | CEMIG GT | 1,192 | 475 | May/27 | HPP | 100.0% |
| Nova Ponte | CEMIG GT | 510 | 257 | Aug/27 | HPP | 100.0% |
| Três Marias | CEMIG GT | 396 | 227 | Jan/53 | HPP | 100.0% |
| Irapé | CEMIG GT | 399 | 198 | Oct/40 | HPP | 100.0% |
| Salto Grande | CEMIG GT | 102 | 74 | Jan/53 | HPP | 100.0% |
| Sá Carvalho | Sá Carvalho S.A | 78 | 54 | Aug/26 | HPP | 100.0% |
| Rosal | Rosal Energia S. A | 55 | 28 | Dec/35 | HPP | 100.0% |
| Itutinga | CEMIG G. ITUTINGA | 52 | 27 | Jan/53 | HPP | 100.0% |
| Boa Esperança | CEMIG GT | 85 | 25 | Aug/57 | PV | 100.0% |
| Camargos | CEMIG G. CAMARGOS | 46 | 22 | Jan/53 | HPP | 100.0% |
| Três Marias Jusante | CEMIG GT | 70 | 20 | Feb/58 | PV | 100.0% |
| Volta do Rio | CEMIG GT | 42 | 18 | Dec/31 | WIND | 100.0% |
| Poço Fundo | CEMIG GT | 30 | 17 | Jun/52 | SHPP | 100.0% |
| Pai Joaquim | CEMIG PCH S.A | 23 | 14 | Sep/41 | SHPP | 100.0% |
| Piau | CEMIG G. SUL | 18 | 14 | Jan/53 | HPP | 100.0% |
| Parajuru Beaches | CEMIG GT | 29 | 8 | Sep/32 | WIND | 100.0% |
| Locust | CEMIG G. OESTE | 14 | 7 | Jan/53 | HPP | 100.0% |
| Peti | CEMIG G. LESTE | 9 | 6 | Jan/53 | HPP | 100.0% |
| Joasal | CEMIG G. SUL | 8 | 5 | Jan/53 | HPP | 100.0% |
| Tronqueiras | CEMIG G. LESTE | 9 | 3 | Dec/46 | HPP | 100.0% |
| Queimado | CEMIG GT | 87 | 53 | Jun/41 | HPP | 82.5% |
| Belo Monte | Norte | 1,313 | 534 | Jul/46 | HPP | 11.7% |
| Paracambi | Lightger | 12 | 10 | Jan/34 | SHPP | 49.0% |
| Cachoeirão | Hidrelétrica Cachoeirão | 13 | 8 | Jan/46 | SHPP | 49.0% |
| Pipoca | Hidrelétrica Pipoca | 20 | 12 | Dec/34 | SHPP | 100.0% |
| Other | 59 | 31 | ||||
| Subtotal | 4,672 | 2,146 | ||||
| Distributed Generation | ||||||
| Cemig GT | Cemig GT | 14.5 | 3.6 | PV | 100.0% | |
| Cemig Sim | Cemig Sim | 113.0 | 29.8 | PV | 100.0% | |
| Subtotal | 127.5 | 33.4 | ||||
| Total | 4,799 | 2,179 |
Note: The firm energy for Boa Esperança and Jusante PVs reflects values certified by an independent certification company but not yet approved by ANEEL. For Cemig Sim’s plants, installed capacity is presented in MWac, and estimated generation was used as a proxy for the firm energy in the table.
Cemig Sim also sells energy from leased plants with total capacity of 283 MWp. Further details on expansion projects for Cemig Sim and Cemig GT are provided on the following page.
Cemig | Earnings Release | 35 |
| |
Expansion in Photovoltaic Generation
| Project | Company | Installed Capacity (MWac) | Capacity (MWp) |
Expected Generation (MWavg) | Expected Commissioning Date |
| Ouro Solar | Cemig Sim | 11.5 | 16.3 | 3.3 | Jun/26 to Aug/26 |
| Bloco Azul | Cemig Sim | 15.0 | 21.3 | 3.8 | Jun/26 to Aug/26 |
| Solar do Cerrado | Cemig Sim | 30.0 | 42.0 | 8.6 | Apr/26 to Nov/26 |
| Cemig GT - Sol Central | Cemig GT | 17.0 | 22.1 | 4.0 | Jul/26 |
| Total | 73.5 | 101.7 | 19.7 |
Cemig | Earnings Release | 36 |
| |

As of July, the RAP for the 2025/2026 cycle became effective, already incorporating effects of the RBSE remeasurement financial component for Cemig, as defined by ANEEL.
| REH - ANEEL RESOLUTION 3,481/2025 (2025/2026 cycle) | ||||
| R$ thousand | RAP | Adjustment Portion (PA) | Total | Due Date |
| Cemig | 1,245,408 | 60,207 | 1,305,615 | |
| Cemig GT | 1,164,296 | 62,435 | 1,226,731 | Dec/42 |
| Cemig Itajuba | 52,484 | -1,061 | 51,423 | Oct/30 |
| Centroeste | 16,078 | -1,017 | 15,061 | Mar/35 |
| Sete Lagoas | 12,550 | -150 | 12,401 | Jun/41 |
| Taesa (21.68% stake held by Cemig) | 956,249 | -35,288 | 920,961 | |
| TOTAL RAP | 2,226,576 | |||
| RBSE* COMPENSATION at June 2025 prices. Amount excluding charges | |||||
| Amounts in R$ thousand per Cycle | 2025–2026 | 2026–2027 | 2027–2028 | 2028–2029 | 2029 through 2033 |
| Economic | 112,434 | 112,434 | 112,434 | 35,253 | 35,253 |
| Financial | 298,669 | 298,669 | 298,669 | - | - |
| Total | 411,102 | 411,102 | 411,102 | 35,253 | 35,253 |
| **RBSE compensation amounts are included in Cemig’s RAP (first table) | |||||
Cemig has already obtained approval (Authorizing Resolution - REA) for large-scale Reinforcements and Improvements, totaling R$1,158.1 million in CAPEX, in addition to R$231.3 million related to Lot 1 of Auction No. 02/2022 (completion of works expected in 2028).
Note: The 2025 projected commissioning refers to projects already completed but not yet incorporated into RAP for the tariff adjustment effective July 2025.
| Projected commissioning | Capex (R$ thousand) | RAP (R$ thousand) |
| 2025 | 141,292 | 22,483 |
| 2026 | 478,422 | 76,916 |
| 2027 | 391,092 | 65,088 |
| 2028 | 309,186 | 32,233 |
| 2029 | 69,452 | 11,522 |
| Total | 1,319,992 | 196,705 |
Cemig | Earnings Release | 37 |
| |

| 1Q26 - Regulatory Revenue and EBITDA from Transmission | ||||
| Amounts in R$ thousand | Cemig GT | Centroeste | Sete Lagoas | Total |
| Revenue from electricity transmission operations | 442,464 | 2,821 | 3,452 | 448,737 |
| Taxes on revenue | -38,495 | -103 | -319 | -38,917 |
| Charges | -66,549 | -195 | -143 | -66,887 |
| Net revenue | 337,420 | 2,523 | 2,990 | 342,933 |
| Regulatory net income | 208,750 | 2,028 | 1,795 | 212,573 |
| Income tax and social contribution | 513 | 177 | 718 | 1,408 |
| Financial result | 13,890 | -263 | -557 | 13,070 |
| Depreciation and amortization | 44,310 | 366 | 609 | 45,285 |
| Regulatory EBITDA | 267,463 | 2,308 | 2,565 | 272,336 |
| 1Q25 - Regulatory Revenue and EBITDA from Transmission | ||||
| Amounts in R$ thousand | Cemig GT | Centroeste | Sete Lagoas | Total |
| Revenue from electricity transmission operations | 454,337 | 6,482 | 2,620 | 463,439 |
| Taxes on revenue | -39,808 | -237 | -242 | -40,287 |
| Charges | -84,718 | -213 | -114 | -85,045 |
| Net revenue | 329,811 | 6,032 | 2,264 | 338,107 |
| Regulatory net income | 189,792 | 2,595 | 1,041 | 193,428 |
| Income tax and social contribution | 11,711 | 259 | 381 | 12,351 |
| Financial result | 6,016 | -186 | -270 | 5,560 |
| Depreciation and amortization | 55,156 | 363 | 609 | 56,128 |
| Regulatory EBITDA | 262,675 | 3,031 | 1,761 | 267,467 |

Further details, financial statements, and spreadsheets can be found at the following link:
Results Center | Cemig IR
Cemig | Earnings Release | 38 |
| |

Certain statements and estimates contained in this material may constitute forward-looking statements regarding future events or results, which are subject to known and unknown risks and uncertainties. There can be no assurance that such expectations will materialize.
These statements are based on the assumptions and analyses of our management, considering its experience and other factors, including the macroeconomic environment, electricity market conditions, and expected future performance, many of which are beyond our control.
Factors that may cause actual results to differ materially from those expressed or implied in these forward-looking statements include, among others, our business strategy, Brazilian and global economic conditions, technological developments, our financial strategy, changes in the electricity sector, hydrological conditions, conditions in the financial and energy markets, and uncertainties related to our future operating results, plans, and objectives. Accordingly, actual results may differ materially from those indicated or implied herein.
The information and opinions contained herein should not be construed as a recommendation to potential investors, and no investment decision should be based on the accuracy, timeliness, or completeness of such information or opinions. Neither the Company, its officers, employees, affiliates, nor their representatives shall be liable for any losses arising from the use of the content of this presentation.
For a discussion of risks and uncertainties related to Cemig, as well as additional information on factors that could cause actual results to differ materially from those estimated by the Company, please refer to the Risk Factors section of the Reference Form filed with the Brazilian Securities and Exchange Commission (CVM) and the Form 20-F filed with the U.S. Securities and Exchange Commission (SEC).
Financial figures are presented in millions of Brazilian reais (R$), unless otherwise indicated. The financial information has been prepared in accordance with IFRS.
Cemig | Earnings Release | 39 |
| |
| 3. | Notice to the Market – Changes in relevant equity interest, dated May 20, 2026 |

COMPANHIA ENERGÉTICA DE MINAS GERAIS - CEMIG
PUBLICLY HELD COMPANY
CORPORATE TAXPAYER’S ID (CNPJ): 17.155.730/0001-64
COMPANY REGISTRY (NIRE): 31300040127
NOTICE TO THE MARKET
Change in relevant equity interest
COMPANHIA ENERGÉTICA DE MINAS GERAIS – CEMIG ("Cemig" or “Company"), a publicly held company with shares traded on B3 S.A. – Brasil, Bolsa, Balcão and the New York Stock Exchange (NYSE), hereby informs its shareholders and the market in general, pursuant to Article 12 of CVM Resolution 44, of August 23, 2021, that it has received a notice from Banco Clássico S.A. informing it of an increase in relevant equity interest in the Company’s share capital.
According to the notice received, as a result of a transaction carried out in the spot market on May 19, 2026, Banco Clássico S.A., through its exclusive fund Dinâmica Energia FIF Ações – Resp. Ltda. (Corporate Taxpayer’s ID (CNPJ) number 08.196.003/0001-54), acquired 7,400,000 preferred shares issued by the Company. Following the completion of this transaction, the aforementioned Investor now holds 313,988,379 (32.82%) common shares and 190,614,480 (10.00%) preferred shares.
Considering the total number of shares held, Banco Clássico S.A., through the aforementioned fund, now holds 17.63% of Cemig’s total share capital, according to the attached correspondence.
The Investor further stated that the transactions carried out are intended to diversify its investments in the electric energy sector and allocate part of its investments to the country’s infrastructure sector.
The Company remains available to its shareholders and the market for any additional clarifications that may be necessary.
Belo Horizonte, May 20, 2026.
Andrea Marques de Almeida
Vice President of Finance and Investor Relations
| 4. | Notice to the Market – Cemig SIM completes the acquisition of 11 DG photovoltaic plants, dated June 3, 2026 |
COMPANHIA ENERGÉTICA DE MINAS GERAIS - CEMIG
PUBLICLY HELD COMPANY
CORPORATE TAXPAYER’S ID (CNPJ): 17.155.730/0001-64
COMPANY REGISTRY (NIRE): 31300040127
NOTICE TO THE MARKET
Cemig SIM completes the acquisition of 11 DG photovoltaic plants
COMPANHIA ENERGÉTICA DE MINAS GERAIS – CEMIG (“CEMIG” or “Company”), a publicly held company with shares traded on the stock exchanges of São Paulo and New York, hereby informs its shareholders and the market in general that its wholly owned subsidiary CEMIG SOLUÇÕES INTELIGENTES EM ENERGIA S.A. (“Cemig SIM”) has completed, on this date, the acquisition of the entire share capital of three Special Purpose Entities holding 11 distributed generation (“DG”) photovoltaic plants (“PVPs”) with a total installed capacity of 26.2 MWp.
The acquisition price was R$155 million. The DG assets are connected to the grid in the municipalities of Riachinho, São Romão, Brasilândia de Minas, and Porteirinha, all located in the northern region of the State of Minas Gerais.
The energy generated by these 11 photovoltaic plants is sufficient to supply a municipality with 20,000 inhabitants and is equivalent to avoiding 2,028 tons of CO2 emissions per year.
This acquisition is in line with CEMIG’s Strategic Plan, seeks to optimize the portfolio of wholly owned assets and increase operational efficiency through the capture of commercial, administrative, and operational synergies.
CEMIG reaffirms its commitment to keeping its shareholders, the market in general, and other stakeholders duly and timely informed, in accordance with CVM regulations and applicable legislation.
Belo Horizonte, June 03, 2026.
Andrea Marques de Almeida
Vice President of Finance and Investor Relations
| 5. | Notice to Shareholders – Resolutions of the Annual Shareholders' Meeting - DIVIDENDS/IoE, dated April 30, 2026 |
COMPANHIA ENERGÉTICA DE MINAS GERAIS - CEMIG
PUBLICLY HELD COMPANY
CORPORATE TAXPAYER’S ID (CNPJ): 17.155.730/0001-64
COMPANY REGISTRY (NIRE): 31300040127
B3 (CMIG3, CMIG4)
NYSE (CIG, CIGC)
NOTICE TO SHAREHOLDERS
Resolutions of the ASM
DIVIDENDS/IoE
We hereby inform our shareholders that the Annual Shareholders’ Meeting (ASM), held today, resolved, among other matters, as follows:
Considering the net income for fiscal year 2025, of R$4,897,409 thousand, the amount of R$3,513,358 thousand shall be allocated as mandatory dividends to the Company’s shareholders, as follows:
| ü | To ratify the amount of R$2,837,219 thousand, already declared, comprising R$2,419,918 thousand in the form of interest on equity (“IoE”) and R$417,301 thousand in the form of dividends, according to the table below; |
| Description | Approval | Date With | Date Ex | Gross amount per common/preferred share | Total gross amount | Payment Date |
| (R$) | (R$ thousand) | |||||
| IoE | 03/20/2025 | 03/25/2025 | 03/26/2025 | 0.18911784746 | 541,006 | Two equal installments: 50% by 06/30/2026 and 50% by 12/30/2026 |
| 06/17/2025 | 06/23/2025 | 06/24/2025 | 0.20860690716 | 596,758 | ||
| 09/23/2025 | 09/29/2025 | 09/30/2025 | 0.21139610230 | 604,737 | ||
| 12/18/2025 | 12/23/2025 | 12/26/2025 | 0.23680263228 | 677,417 | ||
| Total IoE | 0.84592348920 | 2,419,918 | ||||
| Dividends | 12/17/2025 | 12/22/2025 | 12/23/2025 | 0.14587483160 | 417,301 | 12/30/2025 |
| Total Dividends | 0.14587483160 | 417,301 | ||||
| Total IoE/Dividends | 0.99179832080 | 2,837,219 | ||||
| ü | Declare R$676,139 thousand in the form of dividends, according to the table below; |
| Dividends | |
| Gross amount per share | R$0.23635588564 |
| Date “with rights” (1) | 04/30/2026 |
| Date “ex-rights” | 05/04/2026 |
| Payment date |
2 (two) equal installments:
|
| (1) | Common and preferred shareholders of record will be entitled to the payment. |
Shareholders whose shares are not held in custody at CBLC and whose registration data is outdated are advised to go to a branch of Banco Itaú Unibanco S.A. (the institution managing CEMIG’s Registered Share System) bearing their personal documents for the due update of their registration data.
Belo Horizonte, April 30, 2026.
Andrea Marques de Almeida
Vice President of Finance and Investor Relations