Please wait

Special note regarding forward-looking statements

Certain statements in this offering memorandum, including documents incorporated by reference herein, are “forward-looking statements” within the meaning of the Private Securities Litigation Reform Act of 1995. Forward-looking statements are usually identifiable by words such as “anticipate,” “believe,” “could,” “estimate,” “expect,” “forecast,” “guidance,” “intend,” “likely,” “may,” “plan,” “position,” “possible,” “potential,” “probable,” “project,” “should,” “strategy,” “target,” “will,” or similar language. All statements other than statements of historical fact are forward-looking statements, including, but not limited to, statements about our strategic initiatives, restructuring and asset optimization, financial objectives, including the refinancing of our existing $1.0 billion revolving credit facility (the “Existing Credit Facility”) with the ABL Facility and the redemption of the 2026 Notes (as defined herein) with the proceeds of this offering, operational plans and objectives, statements about our preliminary estimated results for the quarter ended July 12, 2025 (“Q2 2025”), statements about the status of, and capacity and utilization under, our supply chain financing (“SCF”) arrangements, statements about our future credit ratings and outlook, statements about the benefits of the Worldpac Sale (as defined herein) and use of proceeds therefrom, statements regarding expectations for economic conditions, future business and financial performance, including with respect to tariffs, as well as statements regarding underlying assumptions related thereto. Forward-looking statements reflect management’s views based on historical results, current information and assumptions related to future developments. Except as may be required by law, we undertake no obligation to update any forward-looking statements made herein. Forward-looking statements are subject to a number of risks and uncertainties that could cause actual results to differ materially from those projected or implied by the forward-looking statements. They include, among others, our ability to hire, train and retain qualified employees, the timing and implementation of strategic initiatives, risks associated with our restructuring and asset optimization plans, risks relating to the significant increase in our leverage as a result of this offering, risks relating to the refinancing of our Existing Credit Facility with the ABL Facility, our credit ratings or perceived creditworthiness, deterioration of general macroeconomic conditions, geopolitical factors including increased tariffs and trade restrictions, the highly competitive nature of the industry, demand for our products and services, risks relating to the impairment of assets, including intangible assets such as goodwill, access to financing on favorable terms, complexities in inventory and supply chain and challenges with transforming and growing our business. Please refer to “Risk factors” in this offering memorandum and the documents incorporated by reference herein for a description of these and other risks and uncertainties that could cause actual results to differ materially from those projected or implied by the forward-looking statements.


Summary

Our company

We are a leading automotive aftermarket parts provider in North America, serving both professional installers (“professional”) and “do-it-yourself” (“DIY”) customers, as well as independently-owned operators. Our stores offer a broad selection of brand names, original equipment manufacturer (“OEM”) and owned brand automotive replacement parts, accessories, batteries and maintenance items for domestic and imported cars, vans, sport utility vehicles and light and heavy duty trucks. As of April 19, 2025, we operated a total of 4,285 stores primarily within the United States, with additional locations in Canada, Puerto Rico and the U.S. Virgin Islands. In addition, as of April 19, 2025, we served 881 independently owned Carquest branded stores across the same geographic locations served by our stores in addition to Mexico and various Caribbean islands. Our stores operate primarily under the trade names “Advance Auto Parts” and “Carquest”.

We were founded in 1929 as Advance Stores Company, Incorporated and operated as a retailer of primarily general merchandise until the 1980s. During the 1980s, we began targeting the sale of automotive parts and accessories to DIY customers. We initiated the professional delivery program in 1996 and have grown significantly as a result of strategic acquisitions, new store openings and comparable store sales growth.

Advance Auto Parts, Inc. was incorporated in 2001 in conjunction with the acquisition of Discount Auto Parts, Inc. In 2014, we acquired General Parts International, Inc., a privately-held company that was a leading distributor and supplier of original equipment and aftermarket automotive replacement products for professional markets operating under the Carquest and Worldpac trade names.

In November 2024, we completed the sale of the Worldpac business (the “Worldpac Sale”) for net proceeds of approximately $1.47 billion after transaction costs and excluding the impact of taxes. The Worldpac Sale reflects a strategic shift in our business with increased focus on the Advance blended-box model.

In addition, in November 2024, our Board of Directors approved a restructuring and asset optimization plan (the “2024 Restructuring Plan”) designed to improve our profitability and growth potential and streamline our operations. The 2024 Restructuring Plan is supplemental to other ongoing initiatives to simplify our business and improve profitable growth and entails, among other items, certain store and independent location closures as well as headcount reductions and organizational design changes to align our workforce to the expected needs of our business. As of the date of this offering memorandum, we have completed our store footprint optimization with all intended store and independent location closures.

For LTM Q1 2025, our net sales were $8,905 million, net loss was $580 million and Adjusted EBITDAR was $911 million. For the definition of Adjusted EBITDAR and a reconciliation to net income, see “—Summary historical and other financial data—Other financial and operating data” and “Presentation of financial and other information—Non-GAAP financial measures.”


Our products

We offer a comprehensive portfolio of replacement parts, maintenance items, accessories and tools to support the full lifecycle of vehicles. With an expansive footprint and a wide assortment of products, we believe we are well-positioned to meet a broad range of customer needs in a highly fragmented, but stable and growing, industry. The following tables show some of the types of products we sell by major category:


Parts & Batteries


Accessories & Chemicals


Engine Maintenance

(63% of fiscal year 2024 net sales)    (22% of fiscal year 2024 net sales)    (14% of fiscal year 2024 net sales)

Batteries and battery accessories

Belts and hoses

Brakes and brake pads

Chassis parts

Climate control parts

Clutches and drive shafts

Engines and engine parts

Exhaust systems and parts

Hub assemblies

Ignition components and wire

Radiators and cooling parts

Starters and alternators

Steering and alignment parts


Air conditioning chemicals and accessories

Air fresheners

Antifreeze and washer fluid

Electrical wire and fuses

Electronics

Floor mats, seat covers and interior accessories

Hand and specialty tools

Lighting

Performance parts

Sealants, adhesives and compounds

Tire repair accessories

Vent shades, mirrors and exterior accessories

Washes, waxes and cleaning supplies

Wiper blades


Air filters

Fuel and oil additives

Fuel filters

Grease and lubricants

Motor oil

Oil filters

Part cleaners and treatments

Transmission fluid

We provide customers with quality products that are often offered at a good, better or best recommendation differentiated by price and quality.

Our customers

Our professional customers primarily consist of customers for whom we deliver products to their places of business, including garages, service stations and auto dealerships. Our professional sales (excluding Worldpac and independent retailers) represented approximately 50% of sales in each of 2024, 2023 and 2022. DIY customers are primarily served through our stores, but can also order online to pick up merchandise at a nearby store or have their purchases shipped directly to them. Except where prohibited, we also provide a variety of services at our stores free of charge to customers, including:


battery and wiper installation;


check engine light scanning;


electrical system testing, including batteries, starters and alternators;


oil and battery recycling; and


loaner tool programs.

We also serve customers online at www.AdvanceAutoParts.com or on the Advance Mobile App. Professional customers can conveniently place their orders electronically, including through MyAdvance.com, by phone or in-store, and we deliver products to their places of business.


Our industry

We operate in the growing and attractive auto aftermarket industry. The industry is currently valued at $200 billion and is supported by strong demand drivers, including the size of the car parc (or vehicles-in-operation), the average age of the car parc and vehicle miles driven. In the United States, the number of vehicles-in-operation continues to grow and is nearly 290 million vehicles today. Of those vehicles, approximately 85% are at least four years old, which is the age at which vehicles tend to require additional maintenance.

The average age of a vehicle on the road has increased from 11.8 years to 12.8 years from 2018 to 2024, as consumers continue to hold onto their cars longer. The average age of a vehicle is expected to increase for the foreseeable future due to, among other drivers, higher prevailing interest rates, increased new car prices, high insurance costs and recently enacted and/or proposed new global trade tariffs. Additionally, vehicle miles traveled annually has grown in recent years to above 3.3 trillion in 2024.

Furthermore, the automotive industry is resilient in times of macroenvironment uncertainty as demonstrated by the automotive aftermarket industry sales remaining flat during the Great Recession and increasing during the COVID-19 pandemic, as shown in the following chart.


LOGO

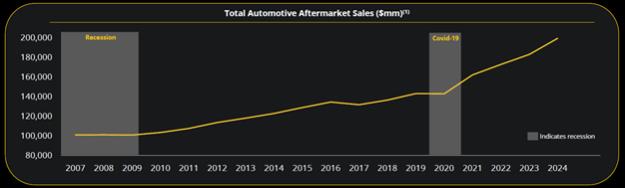
Source: Auto Care Association; (1) Includes automotive parts sold to DIY and professional customers in the United States

These strong demand drivers, coupled with the resilience of the automotive industry, contribute to healthy consumer spending on auto repair and maintenance, supporting demand for parts and accessories and creating a strong backdrop for growth.

Our competition

Our primary competitors are (i) both national and regional chains of automotive parts stores, including AutoZone, Inc., NAPA, O’Reilly Automotive, Inc., The Pep Boys-Manny, Moe & Jack and Auto Plus (formerly Uni-Select USA, Inc.); (ii) internet-based retailers; (iii) discount stores and mass merchandisers that carry automotive products; (iv) wholesalers or jobbers stores, including those associated with national parts distributors or associations; (v) independently-owned stores; and (vi) automobile dealers that supply parts. We believe that chains of automotive parts stores that, like us, have multiple locations in one or more markets have a competitive advantage in terms of customer service, marketing, inventory selection, purchasing and distribution compared with independent retailers and jobbers that are not part of a chain or associated with other retailers or jobbers. The principal methods of competition in the business include brand recognition, customer service, product offerings, availability, quality, service with speed, price and store location.


We maintain one of the largest footprints in the U.S. automotive aftermarket, serving both professionals and DIY customers through our 4,285 stores and 881 Carquest locations. Based on Auto Care Association estimates of total market size in 2024 for parts sold to DIY and professional customers in the United States, we estimate AAP’s total U.S. market share is 4.1% in a highly fragmented industry.

In our industry, inventory tends to turn approximately 1.5 times a year on average, given the significant diversification of the car parc by year, make and model. As a result, the largest players have competitive advantages against the many smaller competitors in the industry given the ability to invest in assets and technology. When coupled with a “need it now” mentality from the professional customer base, we believe that large industry players, such as ourselves, are well-positioned for increased share gains versus independent retailers.

Our recent priorities and strategic plan

The Worldpac Sale marked a pivotal moment in the simplification of our business model and enabled us to focus on actions to strengthen our blended-box business, getting back to the fundamentals of selling auto parts, which we believe will elevate the performance of our core operations and support our goal of delivering consistent profitable operating results and strengthened our balance sheet.

We are executing a comprehensive transformation plan. The plan is designed to drive sustainable operating improvements, margin expansion and long-term growth. Following the appointment of President and Chief Executive Officer Shane O’Kelly in August 2023, we have acted decisively to realign our cost structure, sharpen our strategic focus, and position our business to compete more effectively across the evolving auto aftermarket landscape. In November 2024, we identified opportunities that we believe, if executed successfully, would improve adjusted operating income margin by more than 500-basis points over three years.

The 2024 Restructuring Plan includes the closure of approximately 500 stores, approximately 200 independent locations and four distributions centers by mid-2025, each of which was completed during Q1 2025. In addition to a reduction in workforce, our plan streamlines our supply chain by configuring a multi-echelon approach by leveraging current assets and operating fewer, larger distribution centers.

Our strategic plan is anchored on the following three pillars:


  1.

Store operations. We have completed the optimization of our U.S. asset footprint and we intend to:


standardize our store operating model;


accelerate the pace of new store openings in key geographies with top store density; and


improve labor productivity to drive higher fixed cost leverage.


  2.

Merchandising excellence. We are transforming our merchandising organization to reestablish Advance as a long-term growth partner and redesigning our product assortment strategy to improve parts availability by:


joint business planning with vendors;


strategic sourcing to lower direct product costs;


assortment management to enhance availability of parts in Designated Market Areas (“DMAs”); and


pricing and promotions management to improve sales and gross margin.


  3.

Supply chain. We are transitioning to a multi-echelon supply chain by aiming to:


consolidate distribution centers to operate 12 large facilities in the United States by the end of fiscal year 2026, which are intended to create economies of scale;


increase market hub locations to 60 by mid-2027 to improve service and parts availability; and


optimize transportation routes and freight to lower costs and improve productivity.

Across these initiatives, we closely track, and have been delivering on, a defined set of Key Performance Indicators (“KPIs”). The table below outlines our key KPIs across the three pillars, our long-term targets and metrics for Q1 2025 versus fiscal year 2024.


KPI


Target


Q1 2025 (vs. Fiscal Year 2024)

Store operations


Time to serve (average)

   30 to 40 minutes    Under 40 minutes (vs. over 50
minutes in fiscal year 2024)

Merchandising excellence


Store availability

   High-90s% range    Mid-90s% range (vs. low-90%s
range in fiscal year 2024; +200bps
quarter-over-quarter)

Supply chain


Distribution center labor productivity

   Continuous improvement in product lines per hour    Up low-single digit % (vs. fiscal year 2024)

Store operations

We serve our professional and DIY customers through a variety of channels ranging from traditional “brick and mortar” store locations to self-service e-commerce sites. The key factors used in selecting sites and market locations in which we operate include population, demographics, traffic count, vehicle profile, number and strength of competitors’ stores and the cost of real estate.

We believe we are better able to meet our customers’ needs by operating under two trade names, which are as follows:


Advance Auto Parts — Advance Auto Parts stores are generally located in freestanding buildings with a focus on both professional and DIY customers. The average size of an Advance Auto Parts location (including stores, hubs and market hubs) is approximately 8,000 square feet. These stores carry a wide variety of products serving aftermarket auto part needs for both domestic and import vehicles with product offerings of approximately 23,600 stock keeping units (“SKUs”), consisting of a custom mix of products based on each store’s market. Supplementing the Company’s stores’ inventory on-hand, less common SKUs are also available on a same-day or next-day basis from any of the larger hub stores or market hub locations.


Carquest — Carquest stores are generally located in freestanding buildings with a primary focus on professional customers, but also serve DIY customers. The average size of a Carquest store is approximately 7,500 square feet. These stores carry a wide variety of products serving the aftermarket auto part needs for both domestic and import vehicles with a product offering of approximately 16,400 SKUs.

Along with the Worldpac Sale, we have pursued a comprehensive review of our remaining business to establish a strong foundation for long-term, profitable and sustainable growth. We have undertaken a comprehensive evaluation of all stores in our current network and have also analyzed opportunities to right size SG&A expenses given the Worldpac Sale and optimization of our store network. Our efforts have culminated in the reduction of over 500 corporate locations and 200 independent locations, focusing on areas where we can lower density and stores that have been less productive.


The following chart outlines our revised store footprint in the continental United States.


LOGO

As of the date of this offering memorandum, approximately 75% of our store footprint is concentrated in markets where we have the number one or number two position based on store density. Our goal is to open approximately 30 new stores and 10 new market hubs in 2025.

Merchandising excellence

We have a clear strategic mandate to drive merchandising excellence to enhance profitability and improve the customer experience across both retail and professional channels. We have made key hires who we believe have expertise in merchandising, assortment and operations with track records of success. Our merchandising work includes a focus on:


visibility to true cost to support negotiations;


improved assortment and depth/facing of products to drive sales;


greater data integrity; and


improved go-to-market execution for new products.

Beginning in the fourth fiscal quarter of 2024, we introduced a new assortment framework in a single DMA to improve parts coverage at the store level. We have created a top-down assortment plan for each store, hub and market hub in our DMA, which has led to a rebalancing of our SKUs to align our inventory to market-specific needs. During Q1 2025, we expanded this framework to 10 additional DMAs, for a total of 11 DMAs completed as of the end of the quarter. Following this rollout, we have observed an estimated nearly 50 basis points uplift in comparable sales growth within these DMAs.

We plan to complete the rollout in our top 50 DMAs by the end of fiscal year 2025, with 30 of the 50 markets expected to go-live by the end of August 2025. We intend for this rollout to cover more than 70% of our total sales and support our goal of improving store availability percentage to our target of a high-90s% range, compared to a mid-90s% range as of Q1 2025. For Q1 2025, we experienced an approximately 200 basis points sequential improvement in store availability.

Overall, we believe the modernization of our digital infrastructure, rollout of our DMAs and organizational changes in our merchandising department will yield operational excellence and margin expansion.


Supply chain efficiencies

We are executing a comprehensive redesign of our supply chain to drive efficiency, improve inventory availability and establish a scalable foundation to support merchandising precision and profitable growth. Historically, we have operated 38 distribution centers in the United States (excluding Worldpac), which has resulted in a fragmented distribution network. We expect to close six more distribution centers in the second half of 2025, which will allow us to meet our target to reduce our total number of U.S. distribution centers to 16 by the end of fiscal year 2025.

In addition to our distribution center consolidation plan, we are well-underway with our market hub strategy, and are on track to open 10 new market hubs in fiscal year 2025 for a target of 60 new hubs by 2027. In the Midwest, we opened two greenfield market hubs in May 2025, increasing our total to 21. A market hub with 75,000 to 85,000 SKUs expands our same day parts availability for a service area of approximately 60 to 90 stores. Through these market hubs, we have observed an estimated approximately 100 basis points uplift in comparable sales growth in those markets.

While we consolidate distribution centers and build new hubs, we are simultaneously pursuing opportunities to optimize our distribution center-to-store transportation routes, reduce costs and increase labor productivity in the distribution centers.

The following graphic highlights our multi-echelon supply chain strategy to create economics of scale, compete in-market with speed and operate more efficiently.


LOGO

Strategic priorities

We are focused on continued execution of our near-term strategic priorities. While the full benefit of our initiatives is expected to be realized over a multi-year horizon, we believe the actions we have taken to date have fundamentally improved our operations, as described in the following chart:


Area


Action


Status


Commentary

Strategic simplification    Worldpac Sale for approximately $1.47 billion after transaction costs and excluding the impact of taxes    Completed in Q4 2024    Proceeds used to strengthen balance sheet and fund strategic investments
Footprint rationalization    Closure of approximately 500 stores, approximately 200 independent locations and four distribution centers    Completed in Q1 2025    Approximately $70 million in operating cost savings


New store strategy    Approximately 30 new stores expected to be opened in 2025. Over 100 new stores expected to be opened through 2027    In-process    Targeted store openings to improve concentration in our strongest markets
Assortment planning and inventory management    Launch new assortment framework across top 50 DMAs    In-process    Completed 11 DMAs as of Q1 2025. Expect to complete all 50 DMAs by end of 2025
Supply chain transformation   

Consolidation from 38 distribution centers in the United States to 12 large distribution centers by year-end 2026


Open 60 market hubs by mid-2027

   In-process   

Closed ten distribution centers in 2024 in the U.S., ending the year with 28. Closed six distribution centers in the first half of 2025; expect to close another six distribution centers in the second half of 2025


Opened 19 market hubs through the end of 2024; Opening 10 in 2025


Optimization of transportation routes and freight to lower costs and improve distribution center labor productivity

Margin profile    Structurally improved margin profile    Early-stage   

Productivity review identified over 500 basis points of margin opportunity over the next three years


Cost optimization opportunities across merchandising, supply chain and store operations

Competitive strengths

Attractive scale and expansive presence in auto aftermarket industry with strong position in the professional channel

We operate within the $200 billion U.S. automotive aftermarket, one of the largest and most stable segments of the consumer economy. With approximately 4,300 stores, our expansive footprint enables comprehensive coverage across markets, supporting strong relationships with professional installers, a channel that represents approximately 50% of our revenue. This scale advantage enhances our purchasing power, improves inventory availability and positions us to capitalize on a highly fragmented market. With industry-wide inventory turns hovering at approximately 1.5 times a year on average given the significant diversification of the car parc by year, make and model, the largest players have a competitive advantage when compared to smaller competitors. When coupled with a “need it now” mentality from the professional customer base, in a highly fragmented market, we believe that large industry players, such as ourselves, are well-positioned for increased share gains versus independent retailers.


Stable, recession-resistant demand profile serving non-discretionary needs for consumers and supported by favorable industry tailwinds

We operate in a highly resilient industry supported by essential, non-discretionary vehicle maintenance and repair. There are approximately 290 million light-duty vehicles in operation across the United States, with approximately 85% of those vehicles at least four years old – an indicator of growing maintenance needs. The average age of light-duty vehicles in operation has reached an all-time high of 12.8 years, reflecting the consumer’s preference to keep cars longer amid elevated new vehicle prices and financing costs. Annual miles driven continue to recover, surpassing 3.3 trillion miles in 2024, underscoring the critical nature of vehicle reliability in daily life and further reinforcing consistent wear-and-tear parts sales. Favorable secular trends, including the continued aging of the car parc, stabilization of auto parts inflation and a robust flow of vehicles entering the 6 to 13-year prime repair age cohort, combine to create a stable and largely recession-resistant demand profile for essential maintenance and repairs, underpinning strong demand trends we believe will drive steady revenue and cash flow generation through economic cycles.

Strategic store footprint with sizable market share in defensive geographies

We maintain a strategically located store network, with approximately 75% of locations holding a number one or number two market position based on store density. With our recent restructuring actions, including targeted closures of underperforming stores and a strategic exit on the west coast, we have streamlined our footprint to focus on core markets with the strongest growth potential. This disciplined portfolio pruning has translated into a leaner, more profitable store base. This strategic initiative provides a solid foundation for steady profits and strong growth with a highly focused management team in our key geographies.

Experienced management team executing on its strategic priorities

We are led by a seasoned management team with deep operational expertise and a track record of driving transformational change. President and Chief Executive Officer, Shane O’Kelly, appointed in 2023, brings extensive leadership experience and has positioned us to execute on our strategic turnaround. Supporting this effort, Executive Vice President and Chief Financial Officer, Ryan Grimsland offers significant financial and operational expertise. Under the leadership of O’Kelly and Grimsland, further supported by an experienced management team with a combined over 250 years of relevant automotive and retail experience, we are well-poised to continue to take decisive actions to simplify our organization, optimize inventory and realign our commercial strategy.

Our strategy

Execute on reducing business complexity and return to the fundamentals of the business

We are committed to simplifying our business by sharpening our focus on the fundamentals that have historically defined our leadership in the automotive aftermarket. This strategy emphasizes delivering industry-leading parts availability, outstanding customer service and operational excellence across both DIY and professional channels. By concentrating on core categories and geographies, and leading inventory management, we aim to create a consistent, high-quality customer experience that drives loyalty and repeat business.

As part of this initiative, we are enhancing our store-level execution through clear priorities. We have completed the streamlining of our physical footprint to ensure resources align with our most attractive markets. We have conducted a thorough review of our store portfolio, have closed underperforming stores and have focused density in our preferred geographies. On the supply chain side, we are consolidating and modernizing our distribution center network to improve efficiency, reduce operating costs and enhance delivery speed to stores and customers. These efforts are designed to create a leaner, more strategically positioned footprint that supports superior service levels while contributing to margin improvement and long-term profitability. Finally, we are investing in systems and processes that will provide store and field teams with better tools and actionable data to manage daily operations effectively. These investments are designed to strengthen our ability to quickly respond to customer needs and local market conditions. Through our renewed commitment to the fundamentals, we expect to create a solid foundation for sustainable long-term growth.


Following completion of cost cutting initiatives, continue to focus on incremental margin improvement through supply chain optimization

We are executing a comprehensive plan to increase our margin profile by enhancing the efficiency of our supply chain and optimizing key cost drivers across the business, including a disciplined approach to SG&A expenses. We have completed $150 million in cost reductions and have reinvested $50 million in frontline team members. In addition to a reduction in workforce, this plan streamlines our supply chain by configuring a multi-echelon approach by leveraging current assets and operating fewer, more productive distribution centers that focus on replenishment and move more parts closer to the customer. To achieve this plan, we are in the process of converting certain distribution centers and stores into market hubs. In addition to providing replenishment to nearby stores, market hubs enhance retail operations through improved parts availability.

Drive sustainable free cash flow conversion with disciplined capital allocation to support growth

We have historically generated healthy operating cash flow, which we intend to return to through the completion of our strategic turnaround. Our capital allocation priorities include optimization of cost structure and asset base, improving margins through merchandising, supply chain and operational efficiencies, and investing for growth via capital expenditures. We believe these actions will improve our through-the-cycle stability, operation efficiency and margin performance and provide better visibility for free cash flow generation. We continue to demonstrate our commitment to reinvesting cash flows in the business to support capital expenditures. We believe our investment in capital expenditures, including new store openings in key geographies and maintenance and ongoing business needs, will support our long-term growth initiatives.

Maintain strong liquidity and strengthen the balance sheet

We are committed to maintaining a strong liquidity position, a healthy balance sheet and advantageous supplier financing programs. See “Description of other indebtedness—Supplier Financing Programs.” We will continue to prioritize maintaining ample liquidity through a combination of cash and availability under the ABL Facility. See “—Recent developments—ABL Facility.” On a go-forward basis, we believe we will position ourselves towards achieving meaningful balance sheet deleveraging, both through earnings growth and opportunistic debt repayments.

Recent developments

ABL Facility

In connection with the Refinancing Transactions (as defined below), we expect to enter into the ABL Facility, which will provide for a five-year senior secured first lien asset-based revolving credit facility of up to $1,000.0 million with an expected uncommitted accordion feature, subject to a borrowing base thereunder. The ABL Facility would have a first lien on substantially all of the accounts receivable, inventory, cash and related assets of the borrower and guarantors thereunder, and may under certain circumstances have a second lien on certain other assets of the borrower and guarantors thereunder in the future. We expect the ABL Facility borrower to be the issuer of notes offered hereby and the ABL guarantors to include each of the subsidiary guarantors of the notes offered hereby and certain of our Canadian subsidiaries (subject to customary exceptions). Obligations under the ABL Facility (as well as any obligation under, or in respect of, bank products with any of the lenders thereunder or their respective affiliates and certain hedging obligations) (collectively, the “ABL Obligations”) would be secured by the collateral assets described above.

As of the date of this offering memorandum, we have commitments for the full amount of the contemplated ABL Facility. Commitments received to date are subject to satisfactory documentation and certain other conditions.

Our ability to borrow and obtain letters of credit in U.S. dollars under the ABL Facility is expected to be limited to the lesser of (i) the borrowing base, equal to the sum of 90% of eligible credit card receivables, 85% of eligible trade accounts receivable, 85% of the net orderly liquidation value of eligible inventory and 100% of qualified cash (up to certain limits for the purpose of determining borrowing capacity), subject, in each case, to customary


reserves established by the collateral agent under the ABL Facility from time to time, including supply chain financing reserves and debt maturity reserves, and (ii) the aggregate revolving credit commitments. A portion of the net proceeds from this offering, together with cash on hand, is expected to be contributed as qualified cash to the initial borrowing base for the ABL Facility in an initial amount not to exceed $2.5 billion, which will be held in segregated deposit accounts subject to customary “springing” control agreements. In addition, the ABL Facility is expected to include a qualified cash dominion trigger based on, among other things, excess availability.

Our ability to obtain the ABL Facility is subject to prevailing market conditions and other events. There can be no assurance that the consummation of the ABL Facility will occur on the terms described herein or at all. In the event that the ABL Facility does not close concurrently with the issuance of the notes, we have received the requisite consents under the Existing Credit Facility to permit the issuance of the notes offered hereby. In the event that the ABL Facility is not consummated, the Existing Credit Facility will remain in place and the Company may be required to grant liens on deposit accounts, inventory and accounts receivables if credit ratings are downgraded below a minimum threshold. See “Description of other indebtedness—Existing Credit Facility” and “Risk factors.”

As of April 19, 2025, on an as adjusted basis after giving effect to the Refinancing Transactions, we would have had no outstanding borrowings and $115 million outstanding (but undrawn) letters of credit under the ABL Facility and $885 million of borrowing availability. For a more detailed description of the terms of the ABL Facility, which is based on the current drafts of the definitive agreements and final terms are subject to differ from the terms described herein, see “Description of other indebtedness—ABL Facility.”

This offering is not conditioned on the closing of the ABL Facility.

Existing Credit Facility

On November 9, 2021, the Company, as borrower, entered into a credit agreement (as amended, the “2021 Credit Agreement”) with Advance Stores Company, Incorporated, as a guarantor, the lenders party thereto, and Bank of America, N.A., as the administrative agent. The 2021 Credit Agreement provides for the $1.0 billion unsecured Existing Credit Facility and the issuance of letters of credit with a sublimit of $200.0 million.

Concurrently with the launch of this offering, the Company entered into Amendment No. 7 to the 2021 Credit Agreement (“Amendment No. 7”), which permits the issuance of the notes offered hereby in the event that the ABL Facility does not close concurrently with the closing of this offering. The Existing Credit Facility will be terminated concurrently with the entry into the ABL Facility.

In the event that the ABL Facility is not consummated, the Existing Credit Facility will remain in place and the Company may be required to grant liens on deposit accounts, inventory and accounts receivables if credit ratings are downgraded below a minimum threshold. See “Description of other indebtedness—Existing Credit Facility” and “Risk factors.”

Redemption of 2026 Notes

We intend to use a portion the net proceeds from this offering to redeem in full the $299 million aggregate principal amount of our outstanding 5.90% Senior Notes due March 9, 2026 (the “2026 Notes”). See “Use of proceeds.” In connection therewith, we expect to issue a notice of redemption concurrently with the pricing of this offering providing for the redemption of all of the outstanding 2026 Notes at a redemption price equal to 100% of the principal amount thereof plus a “make-whole” premium calculated in accordance with the terms of the indenture governing the 2026 Notes, plus accrued and unpaid interest thereon, if any, to, but excluding, the redemption date. The redemption of the 2026 Notes is not conditioned upon the consummation of a financing, including this offering. This offering is not conditioned upon the redemption of the 2026 Notes. For the avoidance of doubt, this offering memorandum does not constitute a redemption notice or an offer to redeem or sell any of the 2026 Notes.


Refinancing Transactions

The (i) issuance and sale of the notes, (ii) entry into the ABL Facility, (iii) termination of the Existing Credit Facility, (iv) use of the net proceeds from this offering as described in “Use of proceeds” and (v) payment of all fees and expenses related to such transactions referred to in this sentence are collectively referred to as the “Refinancing Transactions.” Unless indicated otherwise, this offering memorandum assumes that the ABL Facility is consummated, and the Existing Credit Facility is terminated, concurrently with this offering on the terms described herein. See “Use of proceeds.”

Preliminary Q2 2025 financial update (estimated and unaudited)

Our condensed consolidated financial statements for Q2 2025 are not yet available. Accordingly, the financial results we present below are preliminary estimates derived from our internal records and based on the most current information available to management, are subject to the closing and finalization of financial and accounting procedures for the period (which have yet to be performed) and should not be viewed as a substitute for our full financial statements prepared in accordance with GAAP. Our normal reporting processes with respect to the preliminary estimated financial data provided below have not been fully completed. As a result, these preliminary estimated results may differ from the actual results that will be reflected in our unaudited condensed consolidated financial statements for Q2 2025 when they are completed. While we believe that these estimates are based on reasonable assumptions, our actual results may vary, and such variations may be material.

Our expectations with respect to our unaudited results for the period discussed below are based upon management estimates and are the responsibility of management. The preliminary estimated financial data included in this offering memorandum has been prepared by, and is the responsibility of, management. Neither the Company’s independent auditors, nor any other independent accountants, have audited, reviewed, compiled or applied agreed-upon procedures with respect to the preliminary estimated financial data. Accordingly, neither the Company’s independent auditors, nor any other independent accountants, express an opinion or any other form of assurance with respect thereto.

You should not place undue reliance upon the preliminary discussion of our results for Q2 2025. Our condensed consolidated financial statements for Q2 2025 will not be available until after this offering is consummated, and therefore, will not be available to you prior to investing in this offering.

Based on currently available information, we expect revenue to be in the range of approximately $1.98 billion to $2.00 billion, comparable store sales to be in the range of approximately 0.0% to 0.1% and adjusted operating income margin to be in the range of approximately 2.8% to 3.0% for Q2 2025.

The preliminary estimates presented above are not necessarily indicative of any future period and should be read together with “Risk factors,” “—Summary historical and other financial data,” “Management’s discussion and analysis of financial condition and results of operations” and our financial statements and related notes included or incorporated by reference into this offering memorandum. The foregoing information constitutes forward-looking statements. Actual results of operations may differ materially from the information contained in these forward-looking statements based on a number of factors as of and for Q2 2025, including, without limitation, those set forth under “Special note regarding forward-looking statements.” The Company is not able to provide a reconciliation of adjusted operating income margin, a non-GAAP financial measure, for Q2 2025 because it is unable to predict with reasonable accuracy the value of certain adjustments given that the quarterly close process has not been completed, and as a result, the comparable GAAP measure is unavailable without unreasonable efforts.

Corporate information

Our principal executive offices are located at 4200 Six Forks Road, Raleigh, North Carolina 27609.


Our telephone number is (877) 238-2623 and our website is www.AdvanceAutoParts.com. Information posted on, or accessible through, our website is not incorporated into, and is not part of, this offering memorandum.

Our corporate structure

The following chart illustrates the simplified structure of the Company and the subsidiary guarantors as of April 19, 2025, after giving effect to the Refinancing Transactions. See “Description of certain other indebtedness” and “Use of proceeds.” The chart is provided for illustrative purposes only and does not represent all legal entities affiliated with, or all obligations of, the Company and the subsidiary guarantors.


LOGO

 
(1)

After giving effect to the Refinancing Transactions, the Company will be (i) the issuer of $1.5 billion aggregate principal amount of notes and (ii) the borrower under the ABL Facility. See “Description of other indebtedness” and “Capitalization.”

(2)

As of the Issue Date, our obligations under the notes will be fully and unconditionally guaranteed, jointly and severally, on an unsubordinated unsecured basis by all of our existing wholly-owned domestic subsidiaries that are expected to guarantee the ABL Facility. From and after the Issue Date, our obligations under the notes will be fully and unconditionally guaranteed, jointly and severally, on an unsubordinated unsecured basis by each of our existing and future wholly-owned domestic subsidiaries that in the future incurs or guarantees obligations under any of our or any of our subsidiaries’ Credit Facility Debt, including the ABL Facility, or Capital Markets Debt. See “—Recent developments—ABL Facility” and “Description of Notes—Subsidiary guarantees.” As of April 19, 2025, on an as adjusted basis after giving effect to the Refinancing Transactions, the subsidiary guarantors would have had no outstanding debt, excluding their guarantees of the notes offered hereby, the Existing Notes (as defined herein) and unused commitments under the ABL Facility.

(3)

The notes will not be guaranteed by certain of our subsidiaries, including our Canadian subsidiaries. For the twelve months ended April 19, 2025 (“LTM Q1 2025”), on an as adjusted basis after giving effect to the Refinancing Transactions, the non-guarantor subsidiaries would have represented (i) $320 million of our net sales; (ii) $56 million of our adjusted operating loss; and (iii) $43 million negative contribution to our Adjusted EBITDAR. As of April 19, 2025, on an as adjusted basis after giving effect to the Refinancing Transactions, the non-guarantor subsidiaries would have represented approximately 6% and 4% of our consolidated total assets and total liabilities, respectively.

(4)

The Existing Credit Facility will be terminated concurrently with the closing of the ABL Facility. See “—Recent developments—Existing Credit Facility,” “Description of other indebtedness—Existing Credit Facility” and “Use of proceeds.”

(5)

In connection with the Refinancing Transactions, we expect to enter into the ABL Facility, which will provide for a five-year senior secured first lien asset-based revolving credit facility of up to $1,000.0 million with an expected uncommitted accordion feature, subject to a borrowing base thereunder. The offering of the notes is not conditioned on the consummation of the ABL Facility. See “—Recent developments—ABL Facility,” “Description of other indebtedness—ABL Facility” and “Use of proceeds.”

(6)

We intend to use a portion of the net proceeds from this offering to redeem in full the 2026 Notes. See “—Recent developments—Redemption of 2026 Notes” and “Use of proceeds.”

(7)

Represents the aggregate principal amount of the notes offered hereby. We intend to use a portion of the net proceeds from this offering to redeem all of our outstanding 2026 Notes and for general corporate purposes. In addition, a portion of the net proceeds from this offering, together with cash on hand, is expected to be contributed as qualified cash to the initial borrowing base for the ABL Facility in an initial amount not to exceed $2.5 billion. See “—Recent developments—ABL Facility,” “Description of other indebtedness—ABL Facility” and “Use of proceeds.”


Summary historical and other financial data

The following summary historical condensed consolidated financial and operating data as of December 28, 2024 and December 30, 2023 and for 2024, 2023 and 2022 has been derived from, and should be read together with, our audited condensed consolidated financial statements and related notes, which is included in our 2024 10-K incorporated by reference herein, and the section entitled “Management’s discussion and analysis of financial condition and results of operations,” which is included in this offering memorandum.

The following summary historical condensed consolidated financial and operating data as of April 19, 2025 and for Q1 2025 and the sixteen weeks ended April 20, 2024 (“Q1 2024”) has been derived from, and should be read together with, our unaudited condensed consolidated financial statements and related notes, which is included in our Q1 2025, which is incorporated by reference herein, and the section entitled “Management’s discussion and analysis of financial condition and results of operations,” which is included in this offering memorandum. In the view of management, the unaudited condensed consolidated financial statements include all adjustments (consisting of normal recurring adjustments) necessary for a fair presentation of the financial information for the interim periods.

The following summary historical condensed consolidated financial and operating data for LTM Q1 2025 has been derived by adding the summary consolidated financial data for Q1 2025 to the summary historical condensed consolidated financial for fiscal year 2024, and then subtracting the summary consolidated financial data for Q1 2024. These historical results are not necessarily indicative of the results to be expected in the future, and operating results for Q1 2025 or LTM Q1 2025 are not necessarily indicative of the results that may be expected for fiscal 2025.

Consistent with the presentation in our 2024 10-K and our Q1 2025 10-Q, the summary historical and other financial data presented below, inclusive of comparative information, reflects the presentation of the Worldpac Sale as discontinued operations. See “Presentation of financial and other information.” Historical results are not necessarily indicative of the results to be expected for future periods. See “Where you can find more information.”

Condensed consolidated statements of operations


     Fiscal Year     Q1     LTM Q1
2025
 
     2024     2023     2022     2025     2024  
     (in millions)        

Net sales

   $ 9,094     $ 9,209     $ 9,149     $ 2,583     $ 2,772     $ 8,905  

Cost of sales

     5,686       5,349       4,916       1,474       1,568       5,592  


Gross profit

     3,408       3,860       4,233       1,109       1,204       3,313  

Selling, general and administrative expenses, exclusive of restructuring and related expenses

     3,812       3,805       3,708       1,122       1,151       3,783  

Restructuring and related expenses

     309       16             118             427  

Selling, general and administrative expenses

     4,121       3,821       3,708       1,240       1,151       4,210  


Operating (loss) income

     (713     39       525       (131     53       (897

Other, net:

       2          

Interest expense

     (81     (88     (51     (27     (25     (83

Loss on early redemption of senior unsecured notes

     —        —        (7     —        —        —   

Other income (expense), net

     26       2       (7     27       1       52  


Total other, net

     (55     (86     (65           (24     (31

(Loss) income before income taxes

     (768     (47     460       (131     29       (928

Income tax (benefit) expense

     (181     (17     100       (155     12       (348

Net (loss) income from continuing operations

     (587     (30     360       24       17       (580

Net income from discontinued operations

     251       60       104       —        23       228  


Net (loss) income

   $ (336   $ 30     $ 464     $ 24     $ 40     $ (352


Condensed consolidated balance sheets


     December 28,
2024
     December 30,
2023
     April 19, 2025  
            (in millions)         

Assets


Current assets:


Cash and cash equivalents

   $ 1,869      $ 488      $ 1,672  

Receivables, net

     544        610        494  

Inventories, net

     3,612        3,894        3,731  

Other current assets

     118        180        183  

Current assets held for sale

     —         1,205        —   


Total current assets

     6,143        6,377        6,080  

Property and equipment, net

     1,334        1,556        1,265  

Operating lease right-of-use assets

     2,243        2,347        2,185  

Goodwill

     598        601        600  

Other intangible assets, net

     406        419        404  

Other noncurrent assets

     74        86        83  

Noncurrent assets held for sale

     —         890        —   


Total assets

   $ 10,798      $ 12,276      $ 10,617  


Liabilities and Stockholders’ Equity


Current liabilities:


Accounts payable

     3,408        3,526        3,425  

Accrued expenses

     784        616        663  

Other current liabilities

     473        396        299  

Current liabilities held for sale

     —         769        406  


Total current liabilities

     4,665        5,307        4,793  

Long-term debt

     1,789        1,786        1,491  

Non-current operating lease liabilities

     1,897        2,040        1,881  

Deferred income taxes

     193        356        171  

Other long-term liabilities

     84        83        84  

Noncurrent liabilities held for sale

     —         184        —   


Total liabilities

     8,628        9,756        8,420  

Total stockholders’ equity

     2,170        2,520        2,197  


Total liabilities and stockholders’ equity

   $ 10,798      $ 12,276      $ 10,617  


Condensed consolidated statements of cash flows


     Fiscal Year     Q1     LTM Q1
2025
 
     2024     2023     2022     2025     2024  
     (in millions)        

Net cash provided by (used in) operating activities of continuing operations

   $ 141     $ 142     $ 623     $ (156   $ (3   $ (12

Net cash (used in) provided by operating activities of discontinued operations

     (56     146       114       —        6       (62

Net cash used in investing activities of continuing operations

     (167     (219     (400     (27     (36     (158

Net cash provided by (used in) investing activities of discontinued operations

     1,522       (17     (25     —        (3     1,525  

Net cash (used in) provided by financing activities

     (76     189       (620     (17     (25     (68

Effect of exchange rate changes on cash

     2       (8     (9     3       9       (4


Net increase (decrease) in cash and cash equivalents

   $ 1,366     $ 233     $ (317   $ (197   $ (52   $ 1,221  


Other financial and operating data(1)


     Fiscal Year     Q1     LTM Q1
2025
 
     2024     2023     2022     2025     2024  
     (in millions except % and ratios)  

Adjusted SG&A(2)

     3,805       3,804       3,708       1,117       1,148    

Adjusted operating income(3)

     35       56       525       (8     56    

Adjusted operating income margin(7)

     0.4     0.6     5.7     (0.3 )%      2.0  

Free cash flow(4)

     (40     (84     224       (198     (49  

Adjusted debt(5)

     4,148       4,209       3,832       4,069       4,239    

EBITDA(6)

     (395     310       759           (547

Adjusted EBITDAR(6)

     981       930       1,379           911  

Adjusted EBITDAR margin(7)

     11     10     15         10

Adjusted debt to Adjusted EBITDAR

     4.2     4.5     2.8         4.5
 
(1)

As a supplement to our GAAP financial results, this offering memorandum contains the following non-GAAP financial measures: adjusted SG&A expense, adjusted operating income, adjusted operating income margin, free cash flow, adjusted debt, EBITDA, adjusted EBITDA, adjusted EBITDAR and adjusted EBITDAR margin. The Company uses these non-GAAP financial measures to supplement the Company’s financial statements prepared and presented in accordance with GAAP and to understand and evaluate the Company’s core operating performance. These non-GAAP financial measures, which may be different than similarly titled measures used by other companies, are presented as the Company believes that such non-GAAP financial measures provide useful information about our financial performance, enhance the overall understanding of our past performance and future prospects, and allow for greater transparency with respect to important metrics used by management for financial and operational decision-making. The Company is presenting these non-GAAP metrics to provide investors insight to the information used by our management to evaluate our business and financial performance. The Company believes that these measures provide investors increased comparability of our core financial performance over multiple periods with other companies in our industry. These non-GAAP financial measures should not be used as a substitute for GAAP financial measures, or considered in isolation, for the purpose of analyzing operating performance, financial position or cash flows. See “Presentation of financial and other information—Non-GAAP financial measures.”

(2)

A reconciliation of SG&A expenses to adjusted SG&A expenses (defined as SG&A expenses less the SG&A adjustments set forth in footnote (3) below) is provided below:


     Fiscal Year      Q1  
     2024      2023      2022      2025      2024  
     (in millions)  

GAAP SG&A expenses

   $ 4,121      $ 3,821      $ 3,708      $ 1,240      $ 1,151  

SG&A adjustments

     316        17        —         123        3  


Adjusted SG&A expenses

   $ 3,805      $ 3,804      $ 3,708      $ 1,117      $ 1,148  


(3)

A reconciliation of operating (loss) income to adjusted operating income (defined as operating (loss) income plus the cost of sales adjustments and the SG&A adjustments set forth in the table below) is provided below:


     Fiscal Year      Q1  
     2024     2023      2022      2025     2024  
     (in millions)  

GAAP Operating (loss) income

   $ (713   $ 39      $ 525      $ (131   $ 53  


Cost of sales adjustments:


Transformation expenses:


Inventory write-down

     432       —         —         —        —   

SG&A adjustments:


Transformation expenses:


Restructuring and other related expenses(a)

     61       8        —         63       —   

Impairment and write-down of long-lived

assets(b)

     204       —         —         45       —   

Distribution network optimization(c)

     20       —         —         3       —   

Other expenses(d)

     31       9        —         12       3  


Adjusted operating (loss) income

   $ 35     $ 56      $ 525      $   (8)    $ 56  


(a)

Restructuring and other related expenses for 2024 and 2023 included transactional expenses due to incremental receivable reserves


  resulting from contract terminations with certain independents as part of the 2024 Restructuring Plan of $25 million, severance and other labor related costs of $15 million as part of the 2024 Restructuring Plan, and nonrecurring services rendered by third-party vendors assisting with the 2024 Restructuring Plan of $21 million. Restructuring and other related expenses for Q1 2025 included $30 million of nonrecurring services rendered by third-party vendors assisting with the 2024 Restructuring Plan, $15 million of severance and other labor related costs, $7 million related to incremental reserves on loan guarantees and $11 million of other related expenses associated with closures, including the transfer of assets.
(b)

During 2024, the Company recorded impairment charges for ROU assets and property and equipment of $171 million and incremental accelerated depreciation and amortization for property and equipment and ROU assets of $33 million. During Q1 2025, the Company recorded impairment charges for ROU assets and property and equipment of $9 million, net of gains on sale, and incremental accelerated depreciation and amortization for property and equipment and ROU assets of $36 million.

(c)

Distribution network optimization includes incremental depreciation as a result of accelerating long-lived assets over a shorter useful life of $5.0 million for 2024.

(d)

Other expenses include other professional service fees, Worldpac post transaction-related expenses, executive turnover, material weakness remediation and cybersecurity incident.


(4)

A reconciliation of cash flows used in operating activities from continuing operations to free cash flow (defined as cash flows used in operating activities from continuing operations less purchases of property and equipment) is provided below:


     Fiscal Year     Q1  
     2024     2023     2022     2025     2024  
     (in millions)  

Net cash flows provided by (used in) operating activities from continuing operations

   $ 141     $ 142     $ 623     $ (156   $ (3

Purchases of property and equipment

     (181     (226     (399     (42     (46


Free cash flow

   $ (40   $ (84   $ 224     $ (198   $ (49


(5)

A reconciliation of debt to adjusted debt (defined as long-term debt plus operating lease liabilities) is provided below. Adjusted debt does not give pro forma effect to the notes offered hereby.


     Fiscal Year      Q1  
     2024      2023      2022      2025(e)      2024  
     (in millions)  

GAAP Long-term debt

   $ 1,789      $ 1,786      $ 1,373      $ 1,790      $ 1,787  

Operating lease liabilities

     2,359        2,423        2,459        2,279        2,452  


Adjusted debt

   $ 4,148      $ 4,209      $ 3,832      $ 4,069      $ 4,239  


(e)

GAAP Long-term debt includes $299 million reflecting the current portion of long-term debt.


(6)

A reconciliation of net (loss) income from continuing operations to (i) EBITDA (defined as net income from continuing operations plus depreciation and amortization, interest expense and income tax expense (benefit)); (ii) adjusted EBITDA (defined as net income from continuing operations plus depreciation and amortization, interest expense, income tax expense (benefit), other expense (income), net, share-based compensation, other nonrecurring charges and transformation related charges); and (iii) adjusted EBITDAR (defined as net income from continuing operations plus depreciation and amortization, interest expense, income tax expense (benefit), other expense (income), net, share-based compensation, other nonrecurring charges, transformation related charges and rent expense) is provided below:


     Fiscal Year      LTM Q1
2025
 
     2024     2023     2022  

GAAP Net (loss) income from continuing operations

   $ (587   $ (30   $ 360      $ (580

Depreciation and amortization

     292       269       248        298  

Interest expense

     81       88       51        83  

Income tax expense (benefit)

     (181     (17     100        (348


EBITDA

   $ (395   $ 310     $ 759      $ (547


Other expense (income), net

     (26     (2     7        (52

Share-based compensation

     45       46       46        38  

Other nonrecurring charges (f)

     27       12       7        25  

Transformation related charges(g)

     742       30       37        842  


Adjusted EBITDA

   $ 393     $ 396     $ 856      $ 306  


Rent expense

     588       534       523        605  


     Fiscal Year      LTM Q1
2025
 
     2024      2023      2022  

Adjusted EBITDAR

   $ 981      $ 930      $ 1,379      $ 911  


(f)

The adjustments to Q1 LTM 2025 include expenses associated with the Company’s executive turnover and material weakness remediation efforts. The adjustments to 2024 include expenses associated with the Company’s material weakness remediation efforts and executive search charges. The adjustments to 2023 and 2022 represent charges incurred resulting from the early redemption of the Company’s senior unsecured notes due 2023.

(g)

Transformation related charges include transformation plans designed to improve the Company’s profitability and growth potential and streamline its operations. These charges primarily relate to inventory write-down charges and impairments on long-lived assets.


(7)

Calculated as a percentage of net sales.


Risk factors

Our significant level of indebtedness or a deterioration in the global credit markets could limit the cash flow available for operations and could adversely affect our ability to service our debt or obtain additional financing.

We have, and after the offering will continue to have, a significant amount of indebtedness. As of April 19, 2025, on an as adjusted basis after giving effect to the Refinancing Transactions, our total outstanding consolidated debt would have been approximately $2.97 billion (including the notes and the ABL Facility, but excluding unused commitments under the ABL Facility) and our adjusted debt to adjusted EBITDAR ratio would have been 5.8x.

Our significant level of indebtedness could restrict our operations and make it more difficult for us to satisfy our debt obligations, including with respect to the notes. For example, our level of indebtedness could, among other things:


affect our liquidity by limiting our ability to obtain additional financing for working capital;


limit our ability to obtain financing for capital expenditures and acquisitions or make any available financing more costly;


require us to dedicate all or a substantial portion of our cash flow to service our debt, which would reduce funds available for other business purposes, such as capital expenditures, dividends or acquisitions, or to invest in our turnaround;


limit our flexibility in planning for or reacting to changes in the markets in which we compete;


place us at a competitive disadvantage relative to our competitors who may have less indebtedness;


render us more vulnerable to general adverse economic and industry conditions;


make it more difficult for us to satisfy our financial obligations, including our obligations with respect to the notes; and


limit our ability to refinance our debt on terms as favorable as our existing debt or at all.

Furthermore, despite our current indebtedness levels, we may still incur significant additional indebtedness, which would increase the risks associated with our leverage. Although the indentures governing the Existing Notes, the Indenture, the 2021 Credit Agreement and the ABL Facility contain or will contain certain financial and other restrictive covenants, certain of such agreements restrict but do not completely prohibit us from incurring substantial additional indebtedness, including secured indebtedness, in the future. If new debt or other liabilities are added to our current debt levels, the related risks that we now face could intensify. Any failure to comply with the restrictive covenants in our debt instruments could result in an event of default which, if not cured or waived, could result in the acceleration of all of our debt, including the notes, and have a material adverse effect on our liquidity and operations.

Finally, conditions and events in the global credit markets could have a material adverse effect on our access to short- and long-term borrowings to finance our operations and the terms and cost of that debt. It is possible that one or more of the banks that provide us with financing under our Existing Credit Facility or will provide us with financing under the ABL Facility may fail to honor the terms of our Existing Credit Facility or the ABL Facility or be financially unable to provide the unused credit as a result of significant deterioration in such bank’s financial condition. Any inability to obtain sufficient financing at cost-effective rates could have a material adverse effect on our business, financial condition, results of operations and cash flows.