

Helping
Britain
Prosper
Lloyds Banking Group plc
Annual Report and Accounts 2025

 | Grow |  | Focus |  | Change | ||||
Drive revenue growth and diversification | Strengthen cost and capital efficiency | Maximise the potential of people, technology and data | |||||||
Market leader | Cost and capital leader | Digital and AI leader | ||||
#1 in key markets, enhancing growth as an integrated financial services provider. | Efficient scale model, building operating leverage. De-risked and optimised balance sheet. | Largest UK digital bank, leading across emerging technologies, reinforcing revenue and cost opportunity. |
Strengthening income | Growing balance sheet | Stronger, sustainable returns | Increasing shareholder distributions | ||||
7% Year-on-year net income growth | 5% Year-on-year loan growth | 12.9% Return on tangible equity | £3.9bn Dividend and share buyback |
...and well positioned for 2026 and beyond. |


Chair’s statement | |
Group Chief Executive’s review | |
Our business model | |
Our external environment | |
Our strategy | |
Our key performance indicators | |
Our colleagues | |
Risk overview | |
Section 172(1) statement | |
Task Force on Climate-related Financial Disclosures (TCFD) | |
Non-financial and sustainability information statement | |
Viability statement and going concern |
 |
Sir Robin Budenberg Chair, Lloyds Banking Group plc 13 February 2026 |

 | Register here to go paperless for 2026  |
Going paperless Help reduce our environmental impact by viewing shareholder documents, including the annual report, on our website . | |
Our reporting Our reporting suite helps us communicate clearly with a wide range of stakeholders. The annual report and accounts outlines our strategic direction, financial and operational performance, and environmental and social impact. It includes forward-looking statements on the Group’s future financial position, results and objectives. We use alternative performance measures to complement statutory results, with strategic report commentary on an underlying basis unless stated. Additional disclosures, including our sustainability report, are available online. |
 | See our full reporting suite including our sustainability report on the Investors page  of our website. |


Read full biography |
 | Shareholder returns | | ||
3.65p total ordinary dividend per share, up 15% | £3.9bn returned to shareholders for 2025 | |||
 |  | |||
|
Sir Robin Budenberg Chair |

Read full biography |
 |
Charlie Nunn Group Chief Executive |

 | Purpose in action | | ||||
Empowering customers for digital success The Consumer Digital Index is a comprehensive study of digital and financial lives. As the nation’s largest digital bank, we use our unique data and expertise to deliver powerful insights through this report. Our 2025 findings reveal a major shift, with more than 28 million adults now using AI tools to manage their money, from everyday budgeting and savings goals to financial education. Further information can be found on page 33 of our sustainability report . We’re committed to ensuring everyone has the tools, confidence and access to thrive in a digital-first economy. Through Lloyds Bank Academy, c.428,000 individuals have benefitted from our digital and financial skills programmes in 2025, empowering our customers with knowledge and building a more resilient, inclusive financial future. | ||||||
 |
Read our 2025 UK Consumer Digital Index |
Customers | Colleagues | Communities | Shareholders | ||||
 |  |  |  | ||||
c.28m customers with 23.6 million digitally active | >60,000 colleagues who take pride in working for an inclusive and diverse Group | >325 years of supporting individuals and communities throughout the UK | 2.1m shareholders, one of the UK’s most widely held companies | ||||
We’re Helping Britain Prosper whilst successfully delivering for all stakeholders in 2025 | |||||||
£17bn of lending to first time buyers, supporting greater access to home ownership | 40.4% of our executive senior roles were held by women | £1bn commitment to finance opportunities aligned to our Regional Impact Fund | |||||
£35bn committed in new finance to support companies investing and operating in the UK during 2026 | >30,000 customer facing colleagues actively using AI to enhance customer experiences | c.£36m donated to our Charitable Foundations, and more than £800 million donated over the last 40 years | Many UK pension funds hold Group shares, benefitting UK pensioners | ||||
£9.1bn interest paid to customers, of which around £8.2 billion was paid to savers | c.£31m invested in upskilling and training our colleagues for the future | £2.8bn cash taxes paid, one of the UK's largest corporate taxpayers | 147bps of capital generation, reinforcing stability and long-term returns | ||||
£5.4bn paid in salaries, investing in talent and driving performance | £4.4bn paid to suppliers and regulatory bodies, supporting our ability to serve customers effectively | £3.9bn in dividends and share buybacks to shareholders | |||||




Our structure | |||||||
We have three core divisions that have been structured to serve our customers’ needs effectively. | |||||||
 | |||
Retail | |||
Consumer relationships Current accounts Savings accounts Mass affluent proposition UK private bank | |||
Consumer lending Mortgages Credit cards Personal loans Motor finance | |||
 | |||
Insurance, Pensions and Investments | |||
Insurance Home, Motor, Health, Pet Protection | |||
Pensions and retirement Workplace pensions Direct to customer pensions Retirement | |||
Investments Ready-Made Investments Share dealing | |||
 | |||
Commercial Banking | |||
Business and commercial banking Business loans Transactional banking Working capital Merchant services | |||
Corporate and institutional banking Lending and debt capital markets Cash liquidity Risk management | |||
In addition, Equity Investments and Central Items includes the Group’s direct investments businesses. Read more on page 64 |
Our trusted brands | |||||||
With over 325 years’ heritage across our family of brands, we serve and support the evolving needs of our customers and clients across the UK. | |||||||
Our values | |||||||
These values are at the heart of everything we do – guiding our decisions, shaping our culture, and driving our purpose of Helping Britain Prosper. | |||||||
People-first We listen and care for people as individuals. | Bold We innovate and do things differently to better serve our customers and grow with purpose. | Inclusive We learn about and embrace our differences, and seek out diverse perspectives. | Sustainable We take responsibility for the impact of our actions on nature and Britain’s transition to net zero. | Trust We give each other the space and support to take things on and see them through. |

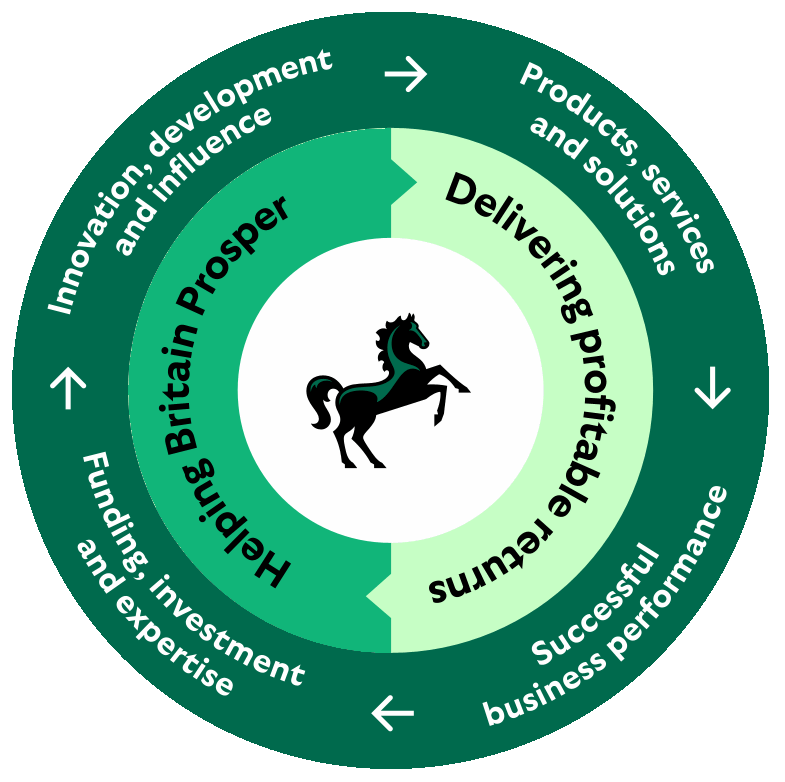
We deliver for our customers by focusing on their needs, continually innovating the products and services we offer, developing and investing in new solutions, and using our expertise and influence to create positive change. | |||
Innovation, development and influence | |||
Driving innovation through effective use of customer feedback, data and technology ensures we remain relevant to the customer whilst enhancing industry standards. Our commitment to digital transformation is critical for future growth and sustainability. | |||
Products, services and solutions | |||
Offering a comprehensive range of financial products and services, increasingly through digital channels. We tailor these offerings to meet individual and business needs, ensuring customers can access the right financial solutions. | |||
How we serve our customers | Successful business performance | ||
Delivering sustainable profit and growth based on financial strength ensures we can invest for the future, both in the business and customer propositions, whilst returning capital to our owners. | |||
Funding, investment and expertise | |||
Ongoing investment in the business ensures we can meet the evolving needs of our customers in a commercial way. Our significant funding helps people and businesses invest and grow whilst our expertise and tailored solutions help clients navigate financial challenges, fostering success and sustainable returns. | |||

Sustainable and inclusive growth | ||||||
Customers We provide financial services to over half of the UK adult population and more than one million businesses. By meeting our customers’ needs we’re unlocking sustainable growth. | Colleagues We are committed to building an inclusive and sustainable organisation that is truly representative of our customers. We recognise that colleagues who can be their authentic selves at work are central to our success. | Communities Our success is intrinsically linked with the success of all regions across the whole of the UK. When local people, local businesses and their communities prosper, so do we. | ||||
c.£14bn of sustainable finance provided for Commercial Banking customers in 2025 £7.5bn of new tax-free savings supported through ISA propositions in 2025 | 19.0% of our senior roles were held by colleagues with disabilities in 2025 17.5% of our executive roles held by Black, Asian or Minority Ethnic colleagues in 2025 | £3.2bn of new finance supported in the social housing sector in 2025 >£1.8m raised by our colleagues and customers to support Crisis and Simon Community in 2025 | ||||
Sustainable profit and returns | ||||||
Shareholders Our strategic progress, coupled with our financial results and continued investment, reinforces our confidence in achieving our 2026 guidance. The Group’s sustained strength in financial performance has delivered strong capital generation, enabling an increased dividend and a share buyback of up to £1.75 billion. | 3.65p total proposed ordinary dividend per share for 2025, up 15% £3.9bn returned to shareholders for 2025 | |||||


Economy | |||
Overview The UK economy proved resilient to global challenges in 2025. Although elevated inflation and pay growth resulted in slower interest rate cuts than in the US and Eurozone, real-wages grew and households’ spending growth rose. Lower inflation in 2026 is expected to allow further interest rate cuts to support the economy while the government continues to address its deficit. Low private sector indebtedness and high household savings provide resilience and capacity for improving growth. | |||
| |||
Link to strategy | |||
Customers | |||
Overview Most customers continue to prefer digital engagement channels which offer convenient and personalised financial solutions with frictionless journeys, to proactively manage their finances. AI is accelerating this shift by enabling customers to rapidly evaluate the market and seek advice on the best products to meet their needs. Alongside, financial health across most households and businesses is strengthening, supported by improving confidence and falling rates. | |||
| |||
Link to strategy | |||
UK economic growth % GDP growth | 1.4% | |||||||
1.1 | 1.4 | |||||||
8.5 | 5.1 | 0.3 | ||||||
2021 | 2022 | 2023 | 2024 | 2025 | ||||
Digitally active users m | 23.6m | |||||||
18.3 | 19.8 | 21.5 | 22.7 | 23.6 | ||||
2021 | 2022 | 2023 | 2024 | 2025 | ||||


Competitors | |||
Overview Competition remains intense with high street banks and building societies maintaining their focus on share growth, and building scale by consolidating smaller players. Alongside, neobanks and fintechs continue to gain momentum by leveraging their strong digital experiences and broadening their customer offering across Retail and Commercial segments. | |||
| |||
Link to strategy | |||
Technology and data | |||
Overview Rapidly evolving technology landscape, accelerated by developments in artificial intelligence and digital transformation. These shifts are enabling new engagement models, innovative propositions and greater cost efficiency. Gen AI is enhancing customer interactions through more personalised engagement, with digital asset innovation creating opportunities for greater customer control and faster, more efficient transactions. | |||
| |||
Link to strategy | |||
Mortgage market share total gross lending – flow | 18.9% | |||||||
18.5 | 17.2 | 16.9 | 19.9 | 18.9 | ||||
2021 | 2022 | 2023 | 2024 | 2025 | ||||
IT applications on cloud % | >50% | |||||||
1 | 2 | 7 | c.50 | >50 | ||||
2021 | 2022 | 2023 | 2024 | 2025 | ||||


Society and environment | |||
Overview Evolving environmental and societal issues, along with new regulations, require companies to clearly understand the related risks and opportunities. This includes recognising the role the Group can play through its products and services in helping customers and their communities respond to these developments. | |||
| |||
Link to strategy | |||
Regulation | |||
Overview The regulatory landscape continues to evolve rapidly to support growth of the UK economy and innovation. The Government’s Leeds Reforms, announced in July 2025, contained a number of proposals seeking to position the UK as the number one destination for financial services companies by 2035. The proposals announced by the Government and regulators span a range of areas directly relevant to the Group. | |||
| |||
Link to strategy | |||
Sustainable lending (active targets) and climate-aware investments |
Timeline of key regulatory changes | ||||||||
l | Progress | | | Target |
Early 2026 | HM Treasury’s ring-fencing review, conducted with the Bank of England and reporting into the Economic Secretary to the Treasury | |
Spring 2026 | Expected FCA Enhanced Accountability Rules | |
Q2 2026 | Ongoing consultation on ring-fencing rules | |
Q1 2027 | Basel 3.1 implementation |

Commercial Banking |
Mortgages |



2024/ 2025 | £24.5bn |
2025 | £5.3bn |
£30bn by 2026 |
£11bn by 2027 |
Motor |
Scottish Widows |

2025 | £2.8bn |
£81.3bn invested in climate-aware strategies | |
£10bn by 2027 |

Our purpose-driven strategy is focused on supporting the needs of our customers, colleagues and communities, whilst delivering long-term, sustainable returns and thereby creating value for our shareholders. | ||||||
Our strategic priorities | ||||||
| Grow Growth is a core focus of our strategy. Around two-thirds of our c.£3 billion strategic investment over 2022 to 2025 was aligned to growing and diversifying revenue. There are four primary pillars for growth. | | Focus We are investing to grow and diversify our revenue, alongside maintaining our disciplined approach to efficient cost and capital management. | | Change Delivering our strategy requires the Group to accelerate the intensity with which we use digital technologies and data to support customers. Our colleagues’ expertise and skills are instrumental to our success. | |
Our purpose pillars | ||||||||||
Our strategy is driven by our purpose, with each of the five pillars below woven into our core strategic priorities and helping deliver shareholder value. | ||||||||||
 |  |  |  |  | ||||||
Access to quality and affordable housing To help all UK households regardless of income or tenure | Empowering a prosperous future For our customers and businesses | Supporting regional development and communities As our success is intrinsically linked with their success | Building an inclusive organisation To better support our customers and communities | Supporting the UK transition By providing financial solutions and building resilience | ||||||
Increased confidence in delivering our 2026 strategic commitments | ||||||||
c.£2bn additional revenues from strategic initiatives | <50% cost:income ratio | >16% RoTE | >200bps capital generation | |||||

Supporting first time buyers As the UK’s largest mortgage lender we support first time buyers to get on the housing ladder, providing £17 billion of funding in 2025 to them. Our ‘First Time Buyer Boost’ proposition launched in August 2024, is helping more customers by enhancing the amount they can safely borrow by up to 22%. In 2025 we have made available £5 billion of lending through this proposition, helping 14,000 first time buyers borrow more than 4.5 times their income. In addition, our ‘Your Credit Score’ tool helped over 500,000 customers improve their credit score every quarter during 2025. We are equipping our customers with the tools to improve their financial wellbeing while gaining insights to generate sustainable growth. | £17bn of funding to first time buyers |
 |
Read more on how we're supporting the UK housing market |
Financing the transition in the North West In 2025 we acted as Mandated Lead Arranger in the provision of a £154 million debt commitment as part of a wider £2.5 billion financing package to support the HyNet CO₂ Transport and Storage Project in the North West of England and North Wales. Eni’s Liverpool Bay Carbon Capture and Storage project is the backbone of HyNet which will be critical in reducing emissions from essential but hard-to-abate sectors such as energy-from-waste, cement manufacturing, and low-carbon hydrogen production. Once operational, HyNet will play a significant role in the UK government’s net zero strategy. The project also expects to create over 2,000 jobs during its initial construction phase and thousands more through wider investment across the North West, demonstrating how finance can drive commercial growth and supporting regional development, aligned to our purpose of Helping Britain Prosper. |
Deepening our commitment to social housing We’ve supported over £22 billion of financing for social housing since 2018 – including £3.2 billion this year alone. In 2025, the Group announced a £100 million loan agreement to fund the sustainable retrofit of thousands of social homes across the South, West and East of England, with Sovereign Network Group (SNG), one of the UK’s leading housing associations. This lending formed part of our £500 million commitment to finance the retrofit of social housing in the UK. Social housing continues to be a source of lending growth for the Group. £100m loan agreement to fund sustainable retrofit of social homes with SNG |


Helping more people plan for the future The UK has the largest pension market in Europe, worth over £2 trillion, however our latest Scottish Widows retirement report shows that 39% of people will fail to meet basic living standards in retirement, notably those who are self-employed and younger workers. In 2024 we launched our Ready-Made Pension offering to help customers manage their pension savings and plan for retirement, with this offering now available to those who are not an existing customer through our Scottish Widows website. At the end of 2025 we now have over 7,000 accounts opened, with 27% of our customers aged 35 and under and approximately 41% self-employed. We are committed to designing products that directly address our customers’ needs and bridge gaps in the market, ensuring we play a vital role in supporting the prosperity and resilience of communities across the UK while growing our assets under management. |
 |
Read more on how we're supporting the UK transition to net zero |
 |
Read more in our Women and Retirement Report |

2025 progress | 2026 priorities | 2026 outcomes | |||||
Deepen and innovate in Consumer | •Completed a full redesign of the app experience across Lloyds, Bank of Scotland and Halifax with improved onboarding and servicing •Expanded lending through our new Ultra and Advance credit cards and tailored mortgage propositions for limited companies •Announced third-party Motor and Health insurance partnerships with Axa and Vitality | •Continue to build personalised, seamless experiences across all channels, driving customer value and simplifying interactions •Broaden and innovate across our product range to meet evolving customer needs and the competitive challenge •Accelerate our mobile-first approach while reimagining physical spaces to enhance efficiency and deepen engagement | 3% further increase in-depth of relationship (versus 2024) c.50% increase in active customers served per distribution FTE (versus 2021) | ||||
Create a new Mass Affluent offering | •Strengthened and grew relationships with Mass Affluent customers through Lloyds Premier, supporting customers who have a c.2 times greater depth of relationship with exclusive benefits, offers and optimised digital experiences •Strong uptake across our Direct-to-Consumer investment products with 84,000 accounts opened to-date | •Continue to enhance our Mass Affluent proposition, with improved digital experiences, supporting customers to achieve their financial goals •Integration of Schroders Personal Wealth, offering full advice propositions to Mass Affluent customers across Lloyds, Halifax, Bank of Scotland and Scottish Widows | >10% increase in Mass Affluent total relationship balances, including assets under administration | ||||
Digitise and diversify our BCB business | •Strong progress towards becoming a digital-first relationship bank, with over 50% of products originated and fulfilled digitally, and over 50% of key servicing interactions digitised, achieving our 2026 target a year early •Diversified our business, shifting sector mix and enhancing propositions across Merchant Services, Cards, Trade and FX to meet more client needs | •Deliver more personalised and engaging digital solutions through automating lending decisions, expanding our multi-currency capabilities, and introducing tailored nudges to support client goals •Provide greater client flexibility with enhanced data ingestion capabilities and connecting the Group to over 70 accounting software packages | Maintain small business deposit market share >50% of key servicing interactions digitised | ||||
Develop our Corporate and Institutional business (CIB) | •Awarded a landmark cash management and payments contract with the government to serve over 30 central departments and public sector bodies •Delivered c.21% year-on-year growth in foreign exchange volumes •Launched a market-leading foreign exchange algorithmic proposition | •Position ourselves as a broader CIB partner, providing an integrated Cash-Debt-Risk offering to meet all client needs •Disciplined expansion across key client markets in the US and Europe •Connect CIB clients to wider Group propositions to unlock greater value | c.45% increase in CIB other operating income (versus 2021) >5.25% income / average risk-weighted assets | ||||

2025 progress | 2026 priorities | 2026 outcomes | |||||
Strengthen cost and capital efficiency | •Disciplined cost management with a further c.£700 million gross cost savings delivered in 2025, contributing towards a total gross cost saving of £1.9 billion since 2021 •Investment in digital journeys continued to lower our cost to serve with a c.45% increase in customers served per distribution FTE compared to 2021 •Strong balance sheet management with risk-weighted assets optimisation of £24 billion since 2021, including over £5 billion in 2025 •Maintained strong capital generation of 147 basis points in 2025 | •Continued commitment to enhance productivity and cost saves through strategic investment in simplification and digitisation, driving an improved cost:income ratio of less than 50% in 2026 •Ongoing focus on growth of capital-lite revenue and other operating income from strategic initiatives •Maintain focus on risk-weighted asset optimisation supported by value-add securitisation opportunities | <50% cost:income ratio >200bps capital generation | ||||
2025 progress | 2026 priorities | 2026 outcomes | |||||||
Maximise the potential of people, technology and data | People •c.9,000 technology and data hires since 2021, supporting our growth and change delivery •Deployed Gen AI colleague tools at scale with over 30,000 Copilot licences distributed •Modernised our property estate, supporting improved ways of working | •Support strategic delivery by increasing the number of new hires in key skill areas •Continue to scale enterprise Gen AI support tools to enhance productivity of our colleagues •Ongoing commitments to building a more inclusive organisation | Maintain strong employee engagement index (versus 2024) | ||||||
Technology and data •Continued mobile app and digital journey investment, enabling more than 95% of Retail sales via digital channels •Greater change efficiency; c.30% gross reduction in run and change tech costs since 2021 •Developed Gen AI foundations | •Continue to accelerate legacy app decommissioning and cloud migration •Actively scale Gen AI in use cases to support customers and colleagues, including the deployment of the UK’s first large-scale, multi-feature agentic AI powered financial assistant | >30% applications on modern technology 35% gross reduction in run and change technology costs (versus 2021) | |||||||
Strategic progress and sustained strength in financial performance |
Financial |
 |  | ||
 | Key performance indicators that are directly linked to our remuneration are marked with this symbol. More information can be found within our directors’ | ||
 | We use a number of alternative performance measures in the description of our business performance and financial position. These measures are labelled with this symbol. | ||
 |  | ||
| | ||
1Expectation based on the Group’s current macroeconomic assumptions. 2Reported on a pro forma basis, reflecting declared share buybacks and any dividends received from the Insurance business in the subsequent quarter prior to the publication of the financial results. Excludes phased unwind of IFRS 9 relief. 3Capital generation excludes capital distributions and variable pension contributions but includes dividends received from the Insurance business in the subsequent quarter prior to the publication of the financial results. 4Excludes a decrease of 230 basis points related to regulatory changes that came into effect on 1 January 2022. 5Excludes a decrease of 21 basis points related to the acquisition of Tusker. | |||
| | ||


Statutory profit after tax £m |
4,757 |

5,885 | 3,923 | 5,518 | 4,477 | 4,757 | ||||
2021 | 2022 | 2023 | 2024 | 2025 |
Link to strategy | Statutory profit after tax of £4,757 million is 6% higher than 2024 with higher total income partially offset by higher operating expenses, a higher impairment charge and a higher tax expense. 2025 was impacted by a charge relating to motor finance commission arrangements of £800 million. Excluding the motor finance charge, statutory profit after tax was £5,428 million (2024: £5,035 million). |
Net income £m |
18,301 |

15,763 | 17,465 | 17,932 | 17,117 | 18,301 | ||||
2021 | 2022 | 2023 | 2024 | 2025 | ||||
Link to strategy | Net income of £18,301 million is 7% higher than 2024, with higher underlying net interest income, in line with guidance, and higher underlying other income, partially offset by increased operating lease depreciation. |
Return on tangible equity % |
12.9 |

13.8 | 9.8 | 15.8 | 12.3 | 12.9 | ||||
2021 | 2022 | 2023 | 2024 | 2025 |
Link to strategy | Return on tangible equity of 12.9%. Excluding the charge for motor finance commission arrangements, return on tangible equity was 14.8%, above guidance. This reflects the Group’s sustained strength in financial performance. 2026 guidance1: Return on tangible equity of greater than 16%. |
Operating costs £m |
9,761 |

8,312 | 8,672 | 9,140 | 9,442 | 9,761 | ||||
2021 | 2022 | 2023 | 2024 | 2025 |
Link to strategy | Operating costs of £9,761 million rose 3% versus 2024, reflecting strategic investment, business growth and inflationary pressures, partially offset by cost savings from investment and continued cost discipline. Delivery was in line with guidance excluding the full acquisition of Schroders Personal Wealth. 2026 guidance1: Cost:income ratio of less than 50% (including operating costs of less than £9.9 billion). |
Common equity tier 1 ratio (CET1) % |
13.2 |

16.3 | 14.1 | 13.7 | 13.5 | 13.2 | ||||
20212 | 20222 | 20232 | 20242 | 20252 |
Link to strategy | The pro forma CET1 ratio remains strong at 13.2%, after an increased recommended ordinary dividend and the announced share buyback of up to £1.75 billion. 2026 guidance1: Expect to pay down to a CET1 ratio of c.13.0% by end of 2026. |
Total shareholder return % |
87.9 |

35 | 0 | 10.9 | 21.2 | 87.9 | ||||
2021 | 2022 | 2023 | 2024 | 2025 |
Link to strategy | Total in-year shareholder return was 87.9%. The share price was 79.3% higher than one year earlier, with the remaining return being attributed to the ordinary dividend. |
Underlying profit £m |
6,777 |

7,536 | 7,028 | 7,809 | 6,343 | 6,777 | ||||
2021 | 2022 | 2023 | 2024 | 2025 |
Link to strategy | Underlying profit of £6,777 million in 2025 was 7% higher than in 2024 due to higher net income partially offset by higher operating costs and a higher underlying impairment charge. Excluding the motor finance charge, underlying profit was £7,577 million (2024: £7,043 million). |
Capital generation3 bps |
147 |

210 | 245 | 173 | 148 | 147 | ||||
2021 | 20224 | 20235 | 2024 | 2025 |
Link to strategy | The Group delivered strong capital generation of 147 basis points in 2025, in line with updated guidance (178 basis points excluding the motor finance provision). 2026 guidance1: Capital generation of greater than 200 basis points. |
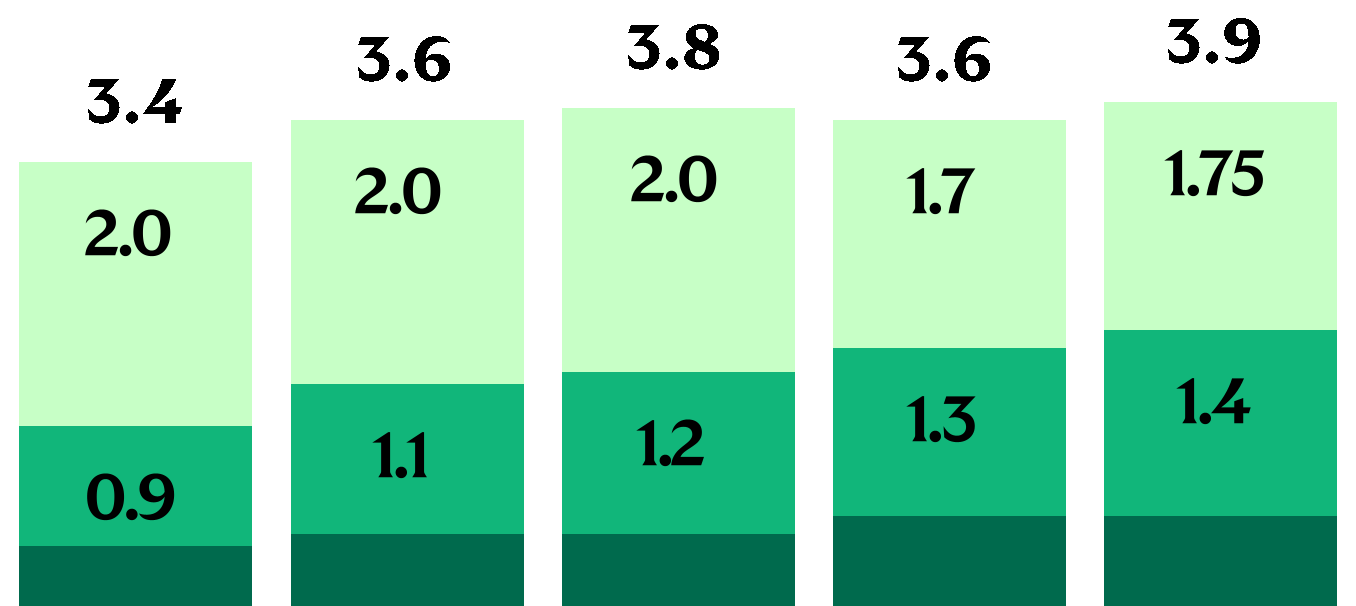
Shareholder distributions £bn |
3.9 |
2021 | 20224 | 20235 | 2024 | 2025 |
0.5 | 0.6 | 0.6 | 0.7 | 0.7 |
Link to strategy | l | Interim dividend | l | Final dividend | l | Buyback | ||
For 2025, total distributions amounted to £3.9 billion. This includes a total recommended ordinary dividend of 3.65 pence per share, up 15% versus last year and reflecting our progressive and sustainable ordinary dividend policy; this covers both interim and final dividends. The Group has also announced a share buyback of up to £1.75 billion. | ||||||||
Non-financial |
| Customer | |
Digitally active users m |
23.6 |

18.3 | 19.8 | 21.5 | 22.7 | 23.6 | ||||
2021 | 2022 | 2023 | 2024 | 2025 |
Link to strategy | The Group operates the largest digital bank in the UK and reflecting the pace of digital adoption, the number of active digital users increased in the year to 23.6 million, up 4% year-on-year. Within this we had c.21.5 million app users, which represents a 6% increase from last year. |
Customer satisfaction Relationship net promoter score |
16.1 |

17.2 | 19.7 | 16.1 | ||||||
20211 | 20221 | 2023 | 2024 | 2025 |
Link to strategy | In 2025, we transitioned from an all-channel net promoter score to a relationship net promoter score, which measures the customer likelihood of recommending us based on their overall experience. We believe the year-on-year decline is largely driven by changes to the mobile banking app, with customers telling us that there is more we can do to improve journeys and experience. Actions are in place to support improvement in 2026. |
Customer complaints FCA reportable complaints per 1,000 accounts |
4.84 |

2.60 | 2.57 | 3.33 | 5.10 | 4.84 | ||||
H1 2023 | H2 2023 | H1 2024 | H2 2024 | H1 2025 |
Link to strategy | We remain committed to delivering the highest level of service to our customers, with our colleagues working diligently to understand and address the concerns raised. Despite the ongoing impact of Motor commission complaints, overall volumes fell from the second half of 2024. Data for the second half of 2025 is not available at time of publishing. |
Group customer dashboard (GCD) (November YTD) Pts – 2024 to 2025 % – 2021 to 2023 |
65 |

79 | 80 | 86 | 83 | 65 | ||||
2021 | 2022 | 2023 | 20242 | 20252 |
Link to strategy | In 2025, the Group customer dashboard (GCD) score declined to 65. This was down year-on- year, in part due to a decline in our net promoter score and elevated customer complaints, as outlined on this page. While we improved or maintained performance on 64% of our GCD measures, we continue to strive to achieve more of our customer ambitions in 2026. |
| Climate | |
Operational carbon emissions tCO2e |
103,148 |

112,067 | 117,671 | 122,616 | 123,449 | 103,148 | ||||
20/21 | 21/22 | 22/233 | 23/243 | 24/254 |
Link to strategy | In 2024/25, our market-based carbon emissions that form part of the balanced scorecard were amended to exclude international travel. Compared to previously reported numbers there has been a 42% decrease since baseline year 2018/19 when market-based carbon emissions were 176,993 tCO2e and 16% decrease since 2023/24. Restating prior year comparatives to exclude international travel gives a reduction of 39% from baseline year and 10% from 2023/24. With the decrease from the prior period mainly driven by a reduction in domestic employee commuting. Further details of our market-based overall emissions including international travel can be found in the sustainability metrics datasheet . |
| Colleague | |
Employee engagement index % favourable |
75 |
Link to strategy | Our annual colleague survey, MyVoice, achieved a record participation rate of 85%5, indicating positive colleague sentiment. The employee engagement index of 75% improved by 4 percentage points. This increase was driven by career development opportunities, a supportive and inclusive culture and reward, putting us in a strong position to continue our transformation. |

72 | 78 | 66 | 71 | 75 | ||||
20213 | 2022 | 2023 | 2024 | 2025 |
Link to strategy |
Gender balance in executive roles6 % | 40.4 |



2025 | 40.4% |
l | Progress | ||
| | 2030 ambition range | ||
Black heritage colleagues in executive roles6 % | 4.3 |
2025 | 4.3% | |
l | Progress | ||
| | 2030 ambition range | ||
Black, Asian and Minority Ethnic colleagues in executive roles6 % | 17.5 |

2025 | 17.5% |
l | Progress | ||
| | 2030 ambition range | ||
Disability representation in senior roles by 20257 % | 19.0 |
2025 | 19.0% |
l | Progress | ||
| | 2025 ambition | ||
| | ||
| Key performance indicators that are directly linked to our remuneration are marked with this symbol. More information can be found within our directors’ | ||
| We use a number of alternative performance measures in the description of our business performance and financial position. These measures are labelled with this symbol. | ||
| | ||
| | ||
1Data for 2021 and 2022 is not available and has been excluded from the chart. 2Change in measurement approach from 2024, so comparison of 2024-2025 to prior years is not like-for-like. 3Restated data to improve the accuracy of reporting, using actual data to replace estimates and updates to historical emissions. 4Excludes international travel. 5Our annual survey (MyVoice) is sent to both UK and international colleagues. 6Executive roles include Grade X colleagues only. For gender, it includes UK and international based colleagues, excluding US and subject to local laws and regulations. For ethnicity it includes UK based colleagues only. 7Senior manager roles include grades F, G and X. | |||
| | ||

| Purpose in action | | |||
Upskilling colleagues on neuro-inclusion Since its launch in September 2024, over 54,000 colleagues have completed the ‘This is Me’ e-module and c.8,500 line managers have attended the workshop. This programme plays a pivotal role in helping us build a more disability and neuro-inclusive organisation, driving better outcomes for our colleagues, customers and communities. Our commitment to neurodiversity was also honoured globally at the 2025 Davos Neurodiversity Summit, where we received the Impact Award for Corporate Leadership in Neuro-inclusion. | |||||
 |
Read more from our colleagues |
| 2025 progress and performance on inclusion metrics | | ||||
Number 2025 | % 2025 | % 2024 | ||||
Gender1 (UK and international colleagues, excluding colleagues who are based in the US, subject to local laws and regulations) | Board members | Men | 5 | 50.0 | 50.0 | |
Women | 5 | 50.0 | 50.0 | |||
Senior positions on the Board2 | Men | 3 | 75.0 | 75.0 | ||
Women | 1 | 25.0 | 25.0 | |||
GEC3 | Men | 8 | 61.5 | 53.8 | ||
Women | 5 | 38.5 | 46.2 | |||
Executive roles4 | Men | 199 | 59.6 | 61.4 | ||
Women | 135 | 40.4 | 38.6 | |||
Senior managers5 | Men | 4,577 | 59.6 | 59.6 | ||
Women | 3,101 | 40.4 | 40.4 | |||
All colleagues | Men | 29,722 | 46.5 | 45.2 | ||
Women | 34,200 | 53.5 | 54.8 | |||
Ethnicity1 (UK based colleagues only) | Board members | White British or other White | 8 | 80.0 | 80.0 | |
Asian heritage | 1 | 10.0 | 10.0 | |||
Mixed/multiple ethnic groups | 1 | 10.0 | 10.0 | |||
Senior positions on the Board2 | White British or other White | 4 | 100.0 | 100.0 | ||
GEC3 | White British or other White | 11 | 84.6 | 84.6 | ||
Asian heritage | 2 | 15.4 | 15.4 | |||
Executive roles4 | Black, Asian and Minority Ethnic representation | 57 | 17.5 | 14.6 | ||
Black heritage | 14 | 4.3 | 3.3 | |||
Senior managers5 | Black, Asian and Minority Ethnic representation | 996 | 13.6 | 12.6 | ||
Black heritage | 139 | 1.9 | 1.8 | |||
Disability (UK based colleagues only) | Colleagues who disclose that they have a disability | 12,776 | 21.6 | 18.7 | ||
Senior managers4 who disclose that they have a disability | 1,388 | 19.0 | 16.1 | |||
Sexual orientation and gender identity (UK based colleagues only) | Colleagues who disclose their sexual orientation | 47,560 | 80.4 | 77.8 | ||
Colleagues who disclose that they are LGBTQ+ | 2,506 | 4.2 | 4.0 | |||
Colleagues who disclose their gender identity | 43,897 | 74.2 | 69.9 | |||

Risk management framework | |||
 | Group and risk management strategies •The Group strategy is driven by strategic priorities and informed by the Group’s risk profile, considering external economic, political and regulatory threats. This shapes risk appetite and risk management practices •The risk management strategy supports delivery of the Group strategy by ensuring principal risks are managed consistently within appetite and the target control environment | ||
 | Culture, values and behaviours •The RMF provides tools for colleagues to make the right decisions, balancing stakeholder needs, risks and trade-offs and encouraging a culture of intellectual curiosity, innovation and proactive risk management | ||
 | Risk governance •Designed to enable sound decision making in line with good corporate governance standards across all legal entities. Board and executive committees hold key decision-making authority, with clear responsibilities for risk management, delegated powers and reporting requirements | ||
 | Three lines of defence •Aligned with industry best practice, the Group applies a three lines of defence model, with all colleagues accountable for managing risk in daily activities and demonstrating behaviours consistent with the Group’s purpose, values and culture | ||
 | Risk function mandate •Clarifies Risk’s role as an oversight and control function within the three lines of defence, supporting the Chief Risk Officer in fulfilling accountabilities defined in their role profile and delegated by the Group Chief Executive and the Board | ||
 | Risk appetite •The type and level of risk the Group is willing to accept in pursuit of its strategic objectives, which must operate within Board-approved parameters. Set annually for the Group and its legal entities | ||
 | Risk architecture and approach •The Group’s risk architecture defines a consistent, unified approach and a common language for all principal risks. Risk principles and policies translate risk appetite into actionable risk management | ||
Our approach “We’re on an exciting transformation journey through our Resetting Risk programme, allowing us to further evolve our risk management approach and accelerate decision making to achieve improved outcomes for our customers.” | |
Stephen Shelley Chief Risk Officer |

Summary table for 2025 | |||
Capital |
Climate |
Compliance |
Conduct |
Credit |
Economic crime |
Insurance underwriting |
Liquidity |
Market |
Model |
Operational |
Capital risk | ||||
The Group continued to maintain its strong capital position in 2025 with a CET1 capital ratio of 13.2% on a pro forma basis (2024: 13.5% pro forma). This remains ahead of regulatory requirements and in excess of the Group’s ongoing target of c.13.0%, which includes a management buffer of around 1%. Banking business profits for the year and the receipt of dividends from the Insurance business, partially offset by risk- weighted asset (RWA) increases and regulatory headwinds, have continued to enable strong shareholder distributions. Downside risks and uncertainties arising from economic and regulatory headwinds, including in relation to Retail secured CRD IV RWA increases, continue to be closely monitored. | Mitigating actions •Capital management framework is in place, including the setting of capital risk appetite, capital planning and stress testing activities •Regular refresh and monitoring of early warning indicators and maintenance of a contingency framework to address emerging capital concerns •Robust risk management through prudent underwriting standards, balance sheet and portfolio management and capital optimisation | |||
Climate risk | ||||
Climate risk remains stable, with no material adjustments to the Group’s financial statements required for the impact from physical and transition risks, and ongoing monitoring of potential reputational impacts, including performance of emission reduction targets against broader UK progress. The Group has refined how it reflects the cross-cutting impacts of climate risk with other principal risks. Focus remains on embedding consideration of climate-related risks and enhancing capabilities for measuring and managing these, in line with evolving external expectations. | Mitigating actions •Guidance outlines the impacts of climate risk across other principal risks, supporting embedding within Group policies and procedures •This informs suitable consideration within the management of other principal risks, including client engagement, assessment informed by scenario analysis and relevant case management | |||
Compliance risk | ||||
The compliance risk profile remains stable. The Group continues to monitor compliance risk closely given the pace of regulatory and legislative change, a continued volume of regulatory data requests and to enable strategic business growth within risk appetite. | Mitigating actions •Policies and standards setting out clear requirements and controls that apply across the business, aligned to the Group’s risk appetite •Identification, assessment and implementation of regulatory and legal requirements by risk specialists and legal colleagues as needed •Local controls, processes, procedures and resources to ensure appropriate governance and compliance by business units | |||

Conduct risk | ||||
Conduct risk remained elevated in 2025, recognising areas of ongoing focus driven by legal decisions, regulatory changes and complaint trends. The Group continues to monitor the evolving situation in relation to motor finance commission arrangements and potential impacts to customers and its risk and control profile, liaising closely with regulatory bodies. Enhancements continue to be made to the Group’s control environment, with mitigating actions and controls in place to deliver good outcomes for customers, protect market integrity, prevent colleague misconduct and ensure effective management of concerns raised through whistleblowing. The Group remains focused on the treatment of vulnerable customers and complaints performance. | Mitigating actions •Policies and strategies are in place to prevent colleague misconduct and support good customer outcomes with ongoing focus on utilising root cause insights to support the management and mitigation of complaint volumes •Active engagement with regulatory bodies and key stakeholders to ensure that the Group’s strategic conduct focus continues to meet evolving stakeholder expectations •Strengthening policies, controls and reporting capabilities to demonstrate good outcomes for customers and markets | |||
Credit risk | ||||
Credit performance has remained strong and stable in 2025. In the Group’s retail portfolios, low and stable arrears have been observed. The Group’s commercial portfolio remains strong. The underlying impairment charge in 2025 was £795 million, up from £433 million in 2024, and includes a net charge from updates to the Group’s macroeconomic outlook of £74 million compared to a large release of £394 million in 2024. Excluding macroeconomic updates, the Group’s underlying impairment charge remains low and similar to 2024. The total underlying probability-weighted expected credit loss (ECL) allowance was lower in 2025 at £3,353 million (31 December 2024: £3,651 million). | Mitigating actions •Appropriate and robust credit processes, strategies and controls to ensure effective risk identification, management and oversight •Significant monitoring in place, including early warning indicators •Selective credit tightening reflective of forecast changes in the macroeconomic environment, including updates to affordability lending controls for forward-looking costs | |||
Economic crime risk | ||||
Economic crime remains a principal risk for the Group, reflecting the inherent risks within the external environment, driven by geopolitical instability and an evolving economic crime threat landscape. Controls are in place to address bribery and corruption, fraud, money laundering and sanction risks. In 2025, business units continued to deliver against action plans, which strengthened the control environment, reduced residual risk and responded to changing regulatory expectations. During the year, two new Board-level risk appetite metrics were introduced to further enhance oversight of sanctions and fraud. Protecting customers remains a key priority, with ongoing consideration of regulatory developments, data-sharing capabilities, and interventions across the economic crime lifecycle. | Mitigating actions •Robust economic crime policy and standards •Delivery of Group-wide Economic Crime Prevention Strategy, supported by periodic reviews to address emerging risks and regulatory developments •Sustained progress in remediation activities to strengthen the control environment and reduce residual risk •Continued enhancements of our industry-leading fraud detection capabilities to respond to evolving threats | |||
Insurance underwriting risk | ||||
Insurance underwriting risk remains stable. Life and Pensions present value of new business premium increased to £21.0 billion (2024: £18.2 billion), driven by higher contribution from workplace, protection and Scottish Widows platform businesses, partially offset by lower sales in the annuities business due to market conditions. Gross written premiums increased to £762 million (2024: £737 million). | Mitigating actions •Underwriting quality is the primary mechanism used to manage insurance risk •Robust processes are embedded for underwriting, reinsurance, claims management, pricing, product design and product management •Management through diversification and pooling of risks | |||

Liquidity risk | ||||
The Group maintained its strong liquidity and funding position with a loan to deposit ratio of 97% (2024: 95%). The Group’s liquid assets continue to exceed the regulatory minimum and internal risk appetite, with a monthly simple average over the previous 12-months’ liquidity coverage ratio (LCR) of 145% (2024: 146%). The Group maintains access to diverse sources and tenors of funding. | Mitigating actions •Maintenance of a portfolio of unencumbered high quality liquid assets in excess of regulatory requirements •Robust management and monitoring of liquidity risks to ensure systems and arrangements are adequate with regard to internal risk appetite, Group strategy and regulatory requirements •Significant customer deposit base, driven by inflows to trusted brands •Participation in term issuance programmes | |||
Market risk | ||||
Market conditions have remained stable in 2025. The Group remains well hedged, ensuring near-term interest rate exposure is appropriately managed. The Group’s structural hedge has increased to £244 billion in 2025 (2024: £242 billion) due to strong deposit growth. Following the agreements made as part of the Group's main defined benefit pension schemes triennial valuations at 31 December 2022, there are no further deficit contributions payable for this triennial period (to 31 December 2025). The IAS 19 accounting surplus has reduced to £2.6 billion at 31 December 2025 (2024: £2.9 billion). | Mitigating actions •Structural hedge programmes to stabilise earnings •Close monitoring of market risks and where appropriate, all asset and liability matching and hedging •Monitoring of the credit allocation in the defined benefit pension schemes, as well as the hedges in place against adverse movements in nominal rates, inflation and longevity | |||
Model risk | ||||
In 2025, the Group has made significant progress in strengthening its model risk management. The Group’s model risk operating framework continues to improve with investment in training and resources to support framework adoption and further development of our CRD IV models. The Group continues to anticipate and address regulatory requirements, embedding SS1/23 principles into our day-to-day risk management, including proactive engagement with regulators. The control environment for model risk continues to be enhanced, meeting both internal and regulatory requirements to support the safe and strategic development of AI and machine learning applications within the Group. Investment in model risk management remains a priority for the Group to further improve risk management and as an enabler to drive strategic developments. | Mitigating actions •Continued enhancement and embedding of the model risk management framework for managing and mitigating model risk •The Group’s independent model validation process provides ongoing, independent, and effective challenge to model development and use •Establishment of a governance framework for the management of AI model risks across principal risk categories •Introduction of a wider range of model status categories to provide more transparent and informative reporting of model risk | |||
Operational risk | ||||
Operational risk remained stable in 2025, with key risks relating to change execution risk, data and privacy, supplier risk, IT systems and information, cyber and physical security. Operational loss event volumes continue to be low, primarily relating to transaction and data processing, IT systems and change execution. The Group continues to demonstrate resilience in delivering strategic change safely, despite some IT outages occurring during the year. No material security breaches took place in 2025, though some events at third-party suppliers reinforced the need for vigilance and robust oversight. The Group places a strong emphasis on analysing progress against its strategic transformation delivery, using learnings to drive improvements and ensure effective management of change execution risk. | Mitigating actions •Deployment of a range of risk management strategies, such as avoidance, mitigation, transfer (including insurance) and acceptance •Ongoing focus on people risk measures including culture, capability and capacity to support strategic growth plans •The Group continues to invest strategically to mitigate operational risks, strengthen controls and to meet operational resilience regulatory requirements •Internal reviews and industry engagement on IT outages to drive control improvement and ensure effective supplier assurance | |||

Emerging and topical risk themes | |||||||
Consumer and market dynamics | Market offerings are increasingly personalised, simple and transparent through digital means. Increased competition from traditional and non-traditional competitors means brand loyalty is under pressure, and the influence of social media heightens the risk of poor customer outcomes against an uncertain societal backdrop. Similarly, digital exclusion, particularly among older or less digitally literate groups, requires balancing investment in innovation with inclusive service delivery. Rapid growth in new, often loss-leading financial products intensifies market competition, raising concerns around sustainability, mis-selling, data ethics and product suitability. | ||||||
Evolution of technology, AI and cybercrime | The accelerating pace of technological innovation, spanning AI, blockchain, cloud computing and digital currencies, is reshaping the financial landscape. While these developments offer significant opportunities to enhance customer experiences and operational efficiency, they also introduce new risks. Balancing the adoption of emerging technologies with the need to maintain digital sovereignty, protect against evolving cybercrime and uphold data privacy and ethical standards is increasingly complex. At the same time, cloud vulnerabilities and the rapid evolution of AI and tokenisation challenge traditional business models, requiring firms to remain agile, transparent and resilient in the face of disruption. | ||||||
Emerging and topical risk themes | |||||||
Principal risks | Geopolitical and economic environment | Global uncertainty continues to reshape the regulatory and operating environment, with shifting geopolitical alliances, economic fragmentation, and evolving health dynamics challenging traditional models of cross-border engagement. Organisations must navigate a complex web of international regulations, sanctions and trade compliance while responding to the impacts of extreme weather events, financial market volatility and unexpected events, in order to manage the impacts to operations, customers and suppliers. | |||||
Regulatory agenda and expectations | The regulatory landscape is evolving rapidly, shaped by political priorities, shifting expectations of regulatory bodies, and growing awareness of environmental and ethical responsibilities. Sudden market interventions, calls for enhanced consumer protections and the need for greater transparency in disclosures are encouraging firms to demonstrate compliance, ethical integrity and adaptability. New entrants, without legacy challenges and benefitting from lower regulatory constraints present competitive pressures. The increasing importance of responsible corporate behaviour is prompting a more proactive and thoughtful approach to governance, underpinned by a commitment to legal integrity and sustainable business practices. | ||||||
Strategic and operational adaptability | Disruption from supplier dependencies, infrastructure outages, or severe data loss can significantly impact service delivery and trust. Evolving business models, workforce transformation, and the need to attract and retain future-ready talent places pressure on organisational culture and capability. Balancing operational efficiency with colleague wellbeing, while adapting to a dynamic risk landscape shaped by network vulnerabilities, is critical to sustaining performance and delivering strong customer outcomes. Growing mental health concerns among customers and employees demand an adaptive, resilient and inclusive approach to risk management and strategic planning. | ||||||
Emerging and topical risk theme | Drivers | Key mitigating actions | |||||||
Consumer and market dynamics | •Ageing population •Changing and expanding customer base •Data ethics and privacy •Disinformation and social media •Market dynamics •Non-traditional competitive landscape •Societal expectations of financial services institutions •Societal polarisation | •Review of customer propositions, participation choices by business area. Continued focus on consumer duty, ESG and vulnerability •Periodic review of the Group’s strategy, including review of performance, key risks and external environment •Ongoing assessment of the impact of customer sentiment, complaint volumes and media coverage •Regular customer insight analysis and risk assessments undertaken to understand impacts of changing demographics | |||||||
Evolution of technology, AI and cybercrime | •Blockchain and tokenisation •Cloud vulnerabilities •Digital currencies and payments •Digital sovereignty •Emerging technologies •Evolution and scaling of AI •Evolution of cybercrime | •Regular updates on data and technology strategy, and deep dives completed on generative AI, cyber risk, technology risk and economic crime prevention at relevant committees •Partnership with Cambridge Spark to deliver ‘Leading with AI’ programme to over 200 senior leaders •Implemented a data ethics framework and Ethical AI framework within our Group data and model risk policies •Establishing feature teams focused on emerging technology trends such as tokenisation and exploring new partnerships to deliver new capabilities | |||||||
Geopolitical and economic environment | •Extreme weather events •Financial market volatility •Geopolitical influences •Quantitative tightening and fiscal restraints | •Quarterly review of the Group’s economic assumptions in response to the macroeconomic environment •Periodic intelligence scanning to detect and identify triggers and events which may impact the Group and its operations •Undertake stress testing to analyse the impact of different economic scenarios on the Group’s performance | |||||||
Regulatory agenda and expectations | •Compliance and legal integrity •Failing to ensure ethical corporate behaviour •Necessary regulatory reform •Regulatory disclosures and external disclosures | •Ongoing monitoring of regulatory developments through horizon scanning activity •Regular engagement by senior management and Board members with regulators on key topics and specific areas of regulatory focus, including responses to consultations •Legal and regulatory lens applied to cost and investment prioritisation •Organisational focus on meeting all relevant regulatory requirements and expectations | |||||||
Strategic and operational adaptability | •Business model evolution •Colleague conduct and wellbeing •Network and infrastructure blackouts •Operational efficiency challenges •Organisational culture and mindset •Physical and mental health impacts •Skills of the future •Strategic transformation •Supplier challenges and dependencies •Talent attraction and retention | •The Group implements playbooks if significant disruptive events occur, such as another pandemic or system outages, and these are refreshed at least annually to prepare for such events •The Group has strengthened measures to ensure that we are more prepared for significant disruption to supply chains •Enhanced business continuity plans to enable the majority of our colleagues to work remotely where possible, supported by ongoing cloud migration of applications •Regular reviews of the Group’s strategic workforce planning focused on short- medium- and long-term view of the skills composition required, alongside our culture, inclusion and diversity goals | |||||||

Section 172(1) statement for the purposes of the Companies Act 2006 (the Act), describing how the directors have had regard to the matters set out in section 172(1) (a) to (f) of the Act when performing their duty to promote the success of the Company under section 172. Further detail on key stakeholder interaction is The directors remain mindful in all their deliberations of the long-term consequences of their decisions, as well as the importance of Lloyds Banking Group plc (the Company) maintaining a reputation for high standards of business conduct and the Board engaging with, and taking account of the interests of, stakeholders. The three key Board decisions outlined in this section (Empowering customers through technology and innovation, Growing wealth strategy and unlocking bancassurance potential and Delivering financial reporting at greater pace) illustrate this in practice. |
Empowering customers through technology and innovation | |

Growing wealth strategy and unlocking bancassurance potential | |
Delivering financial reporting at greater pace | |
| TCFD and Climate-related financial disclosures cross-reference table | | ||
Recommendations | Reference (ARA unless specified otherwise) | |||
Strategy | ||||
A. Describe the climate-related risks and opportunities the organisation has identified over the short, medium and long term. (Companies Act 2006 – Sections 414CA and 414CB 2A (b) and (d)) | ||||
B. Describe the impact of climate-related risks and opportunities on the organisation’s business, strategy and financial planning. (Companies Act 2006 – Sections 414CA and 414CB 2A (e)) | ||||
C. Describe the resilience of the organisation’s strategy, taking into consideration different climate- related scenarios, including a 2°C or lower scenario. (Companies Act 2006 – Sections 414CA and 414CB 2A (f)) | ||||
Governance | ||||
A. Describe the Board’s oversight of climate-related risks and opportunities. (Companies Act 2006 – Sections 414CA and 414CB 2A (a)) | ||||
B. Describe management’s role in assessing and managing climate-related risks and opportunities. (Companies Act 2006 – Sections 414CA and 414CB 2A (a)) | ||||
Risk Management | ||||
A. Describe the organisation’s processes for identifying and assessing climate-related risks. (Companies Act 2006 – Sections 414CA and 414CB 2A (b) | ||||
B. Describe the organisation’s processes for managing climate-related risks. (Companies Act 2006 – Sections 414CA and 414CB 2A (b)) | ||||
C. Describe how processes for identifying, assessing, and managing climate-related risks are integrated into the organisation’s overall risk management. (Companies Act 2006 – Sections 414CA and 414CB 2A (c)) | ||||
Metrics and Targets | ||||
A. Disclose the metrics used by the organisation to assess climate-related risks and opportunities in line with its strategy and risk management process (Companies Act 2006 – Sections 414CA and 414CB 2A (h)) | ||||
B. Disclose Scope 1, Scope 2, and, if appropriate, Scope 3 greenhouse gas (GHG) emissions, and the related risks. (Companies Act 2006 – Sections 414CA and 414CB 2A (h)) | ||||
C. Describe the targets used by the organisation to manage climate‑related risks and opportunities and performance against targets. (Companies Act 2006 – Sections 414CA and 414CB 2A (g)) | ||||
| Non-financial and sustainability information reference table | | ||||
Statement | Information necessary to understand our Group and its impact, policies, due diligence and outcomes | Reference to the annual report and accounts | ||||
Business model | Our business model | |||||
Our approach to sustainability materiality and value chain | Page 38 | |||||
Our strategy | Page 36 | |||||
Progress and performance based on key non-financial metrics | ||||||
Principal risks | Risk overview including risk management framework | |||||
Climate risk | ||||||
Economic crime risk | ||||||
Operational risk | ||||||
Conduct risk | ||||||
Our stakeholders | Stakeholder engagement | |||||
Further information on how we support our stakeholders is included within the Code of ethics and responsibility and internal colleague policies including Colleague policy1, Health and Safety policy1 and Speak Up policy1 which are summarised in our sustainability report | ||||||
Climate and environmental sustainability | Supporting the UK transition and our progress on ambitions and targets | |||||
Identification, assessment and management of climate risk | ||||||
Task Force on Climate-related Financial Disclosures (TCFD) | Page 32 | |||||
Climate-related financial disclosures (CFD) | Page 32 | |||||
Policies which support our approach to environmental sustainability include our sector statements During 2025, we recorded no material environmental incidents or regulatory enforcement actions and reduced operational greenhouse gas emissions year-over-year | ||||||
Social matters | Social sustainability risk arises through operational, conduct and credit risk with identified risks and opportunities disclosed along with associated metrics | |||||
Core to our purpose, our sustainability strategy identified four social sustainability focus areas, where we can make the biggest difference, while creating opportunities for our future growth. Further detail is included in the sustainability report | ||||||
Anti-bribery and corruption | The Group has a dedicated Economic Crime Prevention (ECP) function. The ECP policy sets out the minimum requirements to which all Group businesses must comply across anti-bribery and corruption (ABC); anti-money laundering and counterterrorist financing (AML); fraud; sanctions; and tax evasion. Economic crime is treated as a principal risk. During the year, no bribery or corruption incidents were substantiated, and 99% of in‑scope employees completed anti‑bribery training | |||||
Further policies which support our approach include: Anti-bribery policy statement and Code of ethics and responsibility | ||||||
Respect for human rights | The Group is committed to operating in accordance with internationally accepted human rights standards and with all relevant legislation including the UK Modern Slavery Act 2015. The Group’s approach to human rights is supported by several Group policies and programmes including: Our Code of Supplier Responsibility which sets out the key social, ethical and environmental values and behaviours that we want our suppliers to abide by. Human rights policy statement , Modern slavery and human trafficking statement and our colleague policy1, data privacy policy1, data ethics policy1 and information, cyber and physical security policy1 which has been summarised within the sustainability report During 2025, we had no substantiated reports of modern slavery across our business and supply chain, and strengthened controls through training and assurance, including continued rollout of our group-wide modern slavery module and executive/Board training. | |||||
Topic is considered as part of conduct, economic crime and operational risk | ||||||
Activities to support our colleagues and promote Inclusion | ||||||
Governance | Key Board discussions and decisions | |||||
Sustainability governance | ||||||
| Going concern | | ||
The going concern of the Company and the Group is dependent on successfully funding their respective balance sheets and maintaining adequate levels of capital. In order to satisfy themselves that the Company and the Group have adequate resources to continue to operate for the foreseeable future, the directors have reviewed the Group’s operating plan and its funding and capital positions, including a consideration of the implications of climate change. | The directors have also taken into account the impact of further stress scenarios as well as a number of other key dependencies which are set out in the risk management section under principal directors have considered the capital and funding projections of the Company. Accordingly, the directors conclude that the Company and the Group have adequate resources to continue in operational existence for a period of at least 12 months from the date of the approval of the financial statements and therefore it is appropriate to continue to adopt the going concern basis in preparing the accounts. | |||
| | |||


Read full biography |


>£93m of benefits highlighted as payable to customers since the launch of our Benefits Calculator |
Championing sustainable infrastructure finance The Group played a pivotal role in supporting Tideway’s issuance of the first sterling corporate blue bond by a UK corporate, raising £250 million to finance the final stages of London’s Thames Tideway Tunnel. This innovative financing accelerates the UK’s environmental goals by reducing sewage pollution spills in the River Thames by around 95%, while generating returns for investors and the Group. By connecting institutional capital to critical infrastructure, Lloyds Bank helps ensure long-term water resilience, supports local jobs, and fosters a cleaner environment, demonstrating how sustainable finance can deliver both positive societal impact and robust financial outcomes for the UK. |

Group financing secures regional water supply The Haweswater Aqueduct Resilience Programme (HARP) demonstrates how collaboration across the Group delivers value for customers and sustainable returns. By leveraging expertise from multiple teams, the Group committed £100 million in long-term financing, as part of a £3 billion deal, a project to safeguard the daily supply of clean drinking water for up to 2.5 million people across Cumbria, Lancashire and Greater Manchester. The project will create up to 1,200 local jobs, and channels annuity customers’ investments into impactful projects. The result is a model that benefits communities, facilitates competitive pricing and generates sustainable returns. |
Partnerships to deliver more social and supported housing In 2025, the Group partnered with Homewards, a programme led by HRH The Prince of Wales and The Royal Foundation, to help make homelessness rare, brief and unrepeated in six locations across the UK. Aligned with the Group’s purpose of Helping Britain Prosper, we committed £50 million in new lending to support small and medium-sized housing providers and charities in the Homewards locations and Liverpool, including those offering wrap-around support for individuals with complex needs. This partnership will combine funding with sector expertise, increasing access to good quality housing. |
c.1,800 colleagues enrolled in new reskilling pathways to develop future skills |



We prioritise our material topics based on: | |||
| |||
The strategic importance of the issue to the Group | |||
| |||
The importance of the issue to our stakeholders | |||
| |||
The social, economic and environmental impact of each topic in relation to the core activities, products and services provided by the Group | |||
Our assessment has identified the following material topics: | |||||
•Artificial intelligence •Biodiversity and nature •Climate change and transition •Cyber security and data privacy •Diversity, equity and inclusion | •Financial crime •Financial inclusion and resilience •Governance and conduct •Health and wellbeing of colleagues •Human rights •Regional inequalities | ||||
Further details on these material topics and our responses to managing these areas can be found on page 2 in our sustainability report | |||||


| Purpose in action | |

| Risks | | |||||
Risk description | Principal risk | Driver | Time horizon | How this is monitored | Sustainability Material Topic | ||
Deterioration in customers’ creditworthiness, affordability or valuations of assets and investments from the transition towards a low-carbon economy and/or the impact of extreme weather events or natural hazards | Credit, Market |       | Short, Medium, Long | Elements of climate change incorporated into annual quantitative metrics across portfolios, for example, EPC ratings and flood risk for residential mortgages. Qualitative updates on nature, although measurement capability is still evolving | Climate change, Biodiversity and nature | ||
General insurance – greater losses from higher volume of home insurance claims | Insurance underwriting | | Short, Medium, Long | Defined risk appetite. For further details of insurance risk and policy, please see page 133 of our sustainability report | Climate change | ||
Life insurance – changes in mortality, morbidity and longevity risks driven by climate and environment, such as changes in air quality, temperature and vector-borne diseases | Insurance underwriting | | Short, Medium, Long | Deaths, critical illness, sickness inception and recovery rates, policy lapses and paid-up rates for material business lines are monitored and managed. Pricing and product terms and conditions are designed to reduce risk | Climate change, Biodiversity and nature | ||
Disruption to the Group’s supply chain or damage to premises due to increased frequency and severity of extreme weather events, such as floods and storms affecting services | Operational | | Short, Medium, Long | Invocation of Group Incident Management (GIM) Operational Framework. Incident reports reviewed monthly at Group Incident Operating Forum (GIOF) | Climate change, Biodiversity and nature | ||
Failure to deliver on our voluntary sustainability commitments including supporting the transition to net zero | Compliance |  | Short, Medium, Long | Climate change, Governance and conduct | |||
Material errors in external sustainability reporting, or failure to meet the relevant disclosure requirements | Operational | | Short, Medium | Climate change, Diversity, equity and inclusion, Human rights | |||
External perception of greenwashing in the Group’s disclosures, marketing or product communications | Conduct | | Short, Medium | Qualitative updates as part of executive governance on the Group’s communications strategy and associated policy framework | Governance and conduct | ||
Financial hardship as a result of macroeconomic pressures resulting in delinquencies | Credit, Market | | Short, Medium | Scenario updates are presented to executive | Financial inclusion and resilience | ||
Financial education gaps in society resulting in lower engagement with financial products and lower level of financial resilience | Credit, Conduct | | Short, Medium | Purpose pillar updates are provided to Responsible | Financial inclusion and resilience | ||
Artificial intelligence impacting customer service experience and presenting limitations for customers with accessibility needs | Conduct | | Short, Medium | Qualitative updates given to Board Risk Committee | Financial inclusion and resilience, Governance and conduct | ||
Colleague wellbeing – the failure to provide an appropriate colleague culture, reward, talent management and wellbeing policies and process | Operational | | Short, Medium | Diversity, equity and inclusion, Health and wellbeing of colleagues | |||
Changes in social sentiment and expectations of the Group in relation to sustainability topics | Conduct | | Medium, Long | Scenario updates are presented to executive | Financial inclusion and resilience, Health and wellbeing of colleagues | ||
Losses incurred by our customers and organisation due to economic crime. | Economic crime | | Short, Medium | Risks monitored through regular updates to executive committees, key indicators and risk | Financial crime | ||
Ineffective technology implementation could result in service disruption due to internal failure or cyber-attack, threatening business continuity and customer experience | Operational | | Short, Medium, Long | Qualitative updates given to Responsible Business | Cyber security and data privacy, Governance and conduct | ||
| Opportunities | | |||||
Opportunity description | Principal risk | Driver | Time horizon | How this is monitored | Sustainability Material Topic | ||
Reducing the emissions and improving the resilience of our own operations | Operational, Climate | | Short, Medium | Our own operational pledges. For further details, see page 70 of our sustainability report | Climate change | ||
Providing finance to support investment in climate-related technology and solutions | Market, Climate, Credit | | Short, Medium | Our Commercial Banking sustainable lending target | Climate change | ||
Develop products to support sustainable projects including loans and green bonds | Market, Credit | | Short, Medium | Our sustainable lending targets. For further details | Climate change, Regional inequalities | ||
Increasing consumer preference for sustainable products | Market | | Short, Medium | Our Scottish Widows Lifetime Investments default proposition for workplace customers includes funds that integrate ESG-tilts and apply our exclusions policy | Climate change, Regional inequalities, Financial inclusion and resilience | ||
Develop industry partnerships to help drive sustainable, low carbon and nature positive solutions for our customers to transition | Conduct, Climate | | Short, Medium | Our sustainable lending targets. For further details that support the UK transition see our website | Climate change, Biodiversity and nature, Regional inequalities | ||
Supporting nature recovery projects as a test and learning on how we can leverage green finance to support nature restoration in the future | Market, Credit | | Medium, Long | Internal KPIs set at a project level | Biodiversity and nature | ||
Transforming the inclusion of our business to support our colleagues and enable us to develop more inclusive and accessible products to serve our customers | Operational | | Short, Medium | and support provided to businesses owned by Black, disabled and women entrepreneurs, see page 28 of our sustainability report | Diversity, equity and inclusion, Human Rights | ||
Digital and artificial intelligence tools to support, empowering customers financial resilience and to identify customer vulnerabilities while ensuring good outcomes for customers | Conduct, Operational | | Short, Medium | Qualitative updates given to Responsible Business | Artificial Intelligence, Financial inclusion and resilience, Governance and conduct | ||
Opportunities to invest in the UK’s regions and develop products and services that support regeneration, job creation and productivity, collaborating with government | Conduct, Operational | | Short, Medium | Funding provided to support communities and regions within the UK. See pages 37 to 47 of our sustainability report | Regional inequalities | ||
Support the government ambitions increasing accessibility and availability of affordable quality and sustainable housing | Conduct, Operational | | Short, Medium, Long | First time buyer performance and sustainable or sustainability-linked social housing financing to the social housing sector. See page 14 of our sustainability report | Regional inequalities, Financial inclusion and resilience | ||
Develop products that support customer lifestyle needs (e.g. pension products; income protection) so the Group can support our customers to plan for the future, and grow our customer base and assets under management | Conduct, Operational | | Short, Medium | Our workplace pension, Ready-Made Pension, Ready-Made Investments and insurance offerings. See pages 31 to 32 of our sustainability report | Financial inclusion and resilience | ||

£633m | £3.2bn | >84,000 | |||||
financing for Sizewell C energy security project | of new finance supporting social housing in 2025 | customers empowered through our ready- made investments |

Progress in reduction of our Group’s emissions (MtCO2e)1 |
Bank financed |
Baseline year2 MtCO2e 29.2 |
2024 MtCO2e 18.6 |
Baseline year2 MtCO2e 12.5 |
Scottish Widows financed3 |
2024 MtCO2e 8.8 |
Baseline year2 MtCO2e 0.53 |
Supply chain4 |
2024/25 0.51 MtCO2e |
Own operations |
Baseline year2 MtCO2e 0.18 |
2024/25 0.11 MtCO2e |
1Based on 2024 data available for Bank and Scottish Widows financed emissions Scope 1 and 2 emissions only. 2024/25 period end data for supply chain emissions and own operations includes Scope 1, 2 and 3 categories and is reported on a market basis. 2Baseline year determined by ambition (2018 for Bank, 2019 for Scottish Widows, 2021/22 for Supply Chain and 2018/2019 for Own Ops) MtCO2e – Megatonnes Carbon Dioxide equivalents. difference to the amount shown in the diagram is due to rounding differences. 4Supply chain emissions are calculated from supplier spend totalling £4.4 billion (net of VAT). In addition there is a further £5.7 billion (gross spend) spread across other business areas. For further details on our methodology see sustainability metrics basis of reporting . |
1Baseline year determined by ambition (2018 for Bank, 2019 for Scottish Widows, 2021/22 for Supply Chain and 2018/2019 for Own Ops) MtCO2e – Megatonnes Carbon Dioxide equivalents. 2Based on 2024 data available for Bank and Scottish Widows financed emissions Scope 1 and 2 emissions only. 2024/25 period end data for supply chain emissions and own operations includes Scope 1, 2 and 3 categories and is reported on a market basis. 3Supply Chain emissions are calculated from supplier spend totalling £4.4 billion (net of VAT). In addition there is a further £5.7 billion (including VAT) spread across other business areas. Further details on our methodology see sustainability metrics basis of reporting 2025. Further details on our methodology see sustainability metrics basis of reporting 2025 . |

Bank Our ambition Work with customers, government and the market to help reduce the carbon emissions we finance by more than 50% by 2030 on the path to net zero by 2050 or sooner. 1From a 2018 baseline, covering Scope 1 and 2 emissions. | ||
Our progress | ||||||
MtCO2e reduction (%) | l | Progress  | l | 2030 ambition | ||

2018 Baseline |

Sector target summary | |||||||||
System and targets1 | Baseline year of target | Target baseline2 | 2024 Target progress | Divergence from pathway3 | |||||
Greening the built environment | |||||||||
UK mortgages – 35% reduction in emissions intensity to 30kgCO2e/m2 by 2030 | 2020 | 46kgCO2e/m2 | 42kgCO2e/m2 | 2.0% |  | ||||
Commercial and residential real estate (C&RRE) – 43% reduction in emissions intensity to 22kgCO2e/ m2 by 2030 | 2021 | 38kgCO2e/m2 | 34kgCO2e/m2 | 5.6% | | ||||
Low carbon transport | |||||||||
Retail motor (cars and LCVs) – 48% reduction in emissions intensity to 82gCO2e/km by 2030 | 2018 | 157gCO2e/km | 132gCO2e/km | (1.8%) |  | ||||
Road passenger transport – 47% reduction in emissions intensity to 67gCO2e/pkm by 2030 | 2019 | 125gCO2e/pkm | 109gCO2e/pkm | 0.6% | | ||||
Automotive (OEMs) – 47% reduction in emissions intensity to 131gCO2e/vkm by 2030 | 2020 | 246gCO2e/vkm | 234gCO2e/vkm | 18.7% | | ||||
Aviation – 31% reduction in emissions intensity to 788gCO2e/rtk by 2030 | 2019 | 1,143gCO2e/rtk | 743gCO2e/rtk | (24.4)% | | ||||
Sustainable farming and food | |||||||||
Agriculture – 23% reduction of absolute emissions to 5.1MtCO2e by 2030 | 2021 | 6.6MtCO2e | 5.4MtCO2e | (13.3)% | | ||||
Energy transition | |||||||||
Oil and gas – 50% reduction in absolute emissions to 3.6MtCO2e by 2030 | 2019 | 7.2MtCO2e | 1.6MtCO2e | (59.3)% | | ||||
Power generation – 81% reduction in emissions intensity to 51gCO2e/kWh by 2030 | 2020 | 264gCO2e/kWh | 6gCO2e/kWh | (96.4)% | | ||||
Thermal coal – Full exit of thermal coal power in the UK by 2023. Full exit from all entities that operate thermal coal facilities by 2030 | – | – | – | –% | |||||
1There are rounding differences between target baseline, percentage reduction and 2030 target. Targets cover on-balance sheet assets. The scope of our target has been defined within the sustainability metrics basis of reporting 2025 available at sustainability downloads . 2C&RRE, Retail motor, Road passenger transport, Automotive (OEMs), Aviation, Agriculture, Power and Oil and gas baselines have been updated due to methodology changes, correction of misstatements due to error and revised client data. 3Shows divergence between 2024 actual and 2024 reference pathway emission intensity. Arrow up – performance for 2024 ahead of reference pathway. Arrow down – performance for 2024 behind reference pathway. Retail motor divergence is based on divergence from scenario pathway as no reference pathway is available. | |||||||||






Sustainable financing and investment targets1 We have established sustainable finance and investment targets aligned to our core business areas. | ||
Our Sustainable finance and investment targets |
Group-wide sustainable finance Commercial Banking1,2,3 | ||||
 |  | |||
Total £45bn (cumulative target) | ||||
Mortgages1,4 | £40.3bn Current progress | |||
 |  | |||
| | |||
Total £21bn (cumulative target) | ||||
Motor1,5 | £18.5bn Current progress | |||
| | |||
| | |||
Total £18bn (cumulative target) | ||||
£12.1bn Current progress | ||||
| | |||
Total sustainable finance achieved since 2022 | £70.9bn | |||
l | Performance against previous target |  | Target outperformance | |
l | Performance against current target | Target |


Target | ||||||||
2022 | £15bn | t £15.8bn | ||||||
2024 | t £24.5bn £30bn | |||||||
Progress (£bn lending) | 2026 target | |||||||
 |

Target | ||||||||||
2022 | £10bn | t £13.3bn | ||||||||
2025 | t £5.3bn | £11bn | ||||||||
Progress (£bn lending) | 2027 target | |||||||||
|

Target | ||||||||||||
2022 | £8bn | t £9.4bn | ||||||||||
2025 | t £2.8bn | £10bn | ||||||||||
Progress (£bn lending) | 2027 target | |||||||||||
|
Scottish Widows6 | |||
Discretionary investment in climate-aware strategies | £81.3bn | ||

Scottish Widows Our ambition Achieving net zero emissions across our investment portfolio by 2050, with the interim target of halving our carbon footprint by 2030. | ||
To support our ambition we set ourselves the following targets: •Invest between £20 billion to £25 billion in climate-aware investment strategies1, with at least £1 billion invested into climate solutions investments by 2025 •Halving the carbon footprint2,3 of our investment portfolios by 2030 |
Our progress | ||||||||
tCO2e/£m invested | ||||||||
2024 | 20234 | Baseline4 | ||||||
Carbon footprint (where data is available) (tCO2e/£m) | 55.2 | 64.7 | 116.1 | |||||
1Climate-aware investment strategies: This refers to funds that have a focus on investment in companies that are either adapting their businesses to reduce carbon emissions or developing solutions to address climate change. We will invest in climate solution investments either within these strategies or other funds. For more information on our calculation methodology for these targets please see the sustainability metrics basis of reporting 2025 which is available on our sustainability downloads . 2From a 2019 baseline. 3Carbon footprint is a measure of carbon intensity calculated as absolute value of emissions applicable to an investment divided by the value of investment. The carbon footprint measured, where data is available, for year end 2024 was 55.2 tCO2e/£m against a 2019 baseline of 116.1 tCO2e/£m. 4The metrics for 2019 and 2023 have not been restated in the current period. | ||||||||
Supply chain Our ambition Reduce our supply chain emissions by 50% by 2030, on a path to net zero by 20501. | ||
Our progress | ||||||||
tCO2e | ||||||||
Current year 2024/25 | Restated2 2023/24 | Restated2 baseline year 2021/22 | ||||||
Scope 3 supply chain emissions GHG Protocol Categories 1,2,4 and 8 | 511,909 | 504,299 | 530,621 | |||||
1From a 2021/22 baseline. 2Our baseline and prior period comparative were restated due to methodology changes. | ||||||||

Our operations Our ambition Achieve net zero own operations by 2030, based on our 2018/19 baseline. | ||
The delivery of our ambition is supported by five pledges: •Reduce our direct carbon emissions by at least 90% by 20301 •Reduce total energy consumption across our operations by 50% by 20301 •Maintain travel-related carbon emissions below 50%1,2 •Zero waste by 2030 (includes our legacy waste reduction pledge)3 •Water neutrality by 20304 |
Our progress | ||||||
Net zero ambition progress | l | Progress | l | 2030 ambition | ||
Net zero carbon operations by 2030 | ||||||
1From a 2018/19 baseline. 2From 2023/24 our travel related carbon emissions pledge considers domestic travel only. 3Reduce operation waste by 80% by 2025 from a 2014/2015 baseline. Zero waste is defined as 90% diversion from landfill and incineration. 4Water neutrality across our buildings, reducing our water consumption as much as possible, and offsetting the residual volume. Includes water consumption across our full operational estate. | ||||||

2018/19 Baseline |
Net Zero |
| Intensity ratio | | ||
October 2024 to September 2025 | October 2023 to September 2024 | October 2022 to September 20231 | |
GHG emissions (CO2e) per £m of underlying income (location based) | 8.4 | 10.2 | 9.8 |
GHG emissions (CO2e) per £m of underlying income (market based) | 6.2 | 7.2 | 6.8 |
| Carbon emissions (tonnes CO2e) | | ||
October 2024 to September 2025 tonnes CO2e | October 2023 to September 2024 tonnes CO2e4 | October 2022 to September 2023 tonnesCO2e4 | |||
Total tCO2e (location based) | 154,198 | 174,230 | 176,372 | ||
Total tCO2e (market based) | 112,750 | 123,449 | 122,616 | ||
Total Scope 1 and 2 (location based) | 60,537 | 70,825 | 75,508 | ||
Of which: UK Scope 1 and 2 (location based) | 57,229 | 69,055 | 74,735 | ||
Total Scope 1 and 2 (market based) | 19,089 | 20,044 | 21,751 | ||
Of which: UK Scope 1 and 2 (market based) | 18,946 | 19,881 | 21,541 | ||
Total Scope 1 | 19,084 | 20,040 | 21,740 | ||
Total Scope 2 (market based) | 5 | 4 | 11 | ||
Of which: Electricity | – | – | – | ||
Total Scope 2 (location based) | 41,453 | 50,785 | 53,768 | ||
Total Scope 3 | 93,660 | 103,405 | 100,865 | ||
| Global energy use (kWhs) | |
October 2024 to September 2025 kWhs | October 2023 to September 2024 kWhs1 | October 2022 to September 2023 kWhs1 | |||
Total global energy use | 297,278,022 | 332,775,377 | 362,706,349 | ||
Of which: UK energy use | 290,342,633 | 327,700,875 | 358,791,923 | ||
Total building energy | 279,207,852 | 313,952,935 | 344,118,916 | ||
Total Company owned vehicle energy | 6,502,390 | 8,704,843 | 10,108,961 | ||
Total grey fleet2 vehicle energy | 4,632,390 | 5,043,096 | 4,564,047 | ||
 |  | |
Assessing our resilience to climate risk The risks associated with climate change and the transition to a low carbon economy can potentially expose the Group to financial losses and therefore present an important consideration for the resilience of the Group’s strategy. Our Assessment for 2025 continues to support our view that our strategy remains resilient to the challenges of climate risk. | ||
 |  | |




2025 £m | 2024 £m | Change % | |||
Underlying net interest income | 13,635 | 12,845 | 6 | ||
Underlying other income | 6,120 | 5,597 | 9 | ||
Operating lease depreciation | (1,454) | (1,325) | (10) | ||
Net income | 18,301 | 17,117 | 7 | ||
Operating costs | (9,761) | (9,442) | (3) | ||
Remediation | (968) | (899) | (8) | ||
Total costs | (10,729) | (10,341) | (4) | ||
Underlying profit before impairment | 7,572 | 6,776 | 12 | ||
Underlying impairment charge | (795) | (433) | (84) | ||
Underlying profit | 6,777 | 6,343 | 7 | ||
Restructuring | (46) | (40) | (15) | ||
Market and other volatility | 72 | (144) | |||
Amortisation of purchased intangibles | (86) | (81) | (6) | ||
Fair value unwind | (56) | (107) | 48 | ||
Volatility and other items | (70) | (332) | 79 | ||
Statutory profit before tax | 6,661 | 5,971 | 12 | ||
Tax expense | (1,904) | (1,494) | (27) | ||
Statutory profit after tax | 4,757 | 4,477 | 6 | ||
Earnings per share | 7.0p | 6.3p | 0.7p | ||
Dividends per share – ordinary | 3.65p | 3.17p | 15 | ||
Share buyback value | £1.75bn | £1.70bn | 3 | ||
Banking net interest marginA | 3.06% | 2.95% | 11bp | ||
Average interest-earning banking assetsA | £462.9bn | £451.2bn | 3 | ||
Cost:income ratioA | 58.6% | 60.4% | (1.8)pp | ||
Asset quality ratioA | 0.17% | 0.10% | 7bp | ||
Return on tangible equityA | 12.9% | 12.3% | 0.6pp |
At 31 Dec 2025 | At 31 Dec 2024 | Change % | |||
Underlying loans and advances to customersA | £481.1bn | £459.1bn | 5 | ||
Customer deposits | £496.5bn | £482.7bn | 3 | ||
Loan to deposit ratioA | 97% | 95% | 2pp | ||
CET1 ratio | 14.0% | 14.2% | (0.2)pp | ||
Pro forma CET1 ratioA,1 | 13.2% | 13.5% | (0.3)pp | ||
UK leverage ratio | 5.4% | 5.5% | (0.1)pp | ||
Risk-weighted assets | £235.5bn | £224.6bn | 5 | ||
Wholesale funding2 | £99.4bn | £92.5bn | 7 | ||
Wholesale funding <1 year maturity2 | £37.0bn | £31.3bn | 18 | ||
of which: money market funding <1 year maturity2 | £26.6bn | £16.9bn | 57 | ||
Liquidity coverage ratio – eligible assets3 | £131.4bn | £134.4bn | (2) | ||
Liquidity coverage ratio4 | 145% | 146% | (1)pp | ||
Net stable funding ratio5 | 124% | 129% | (5)pp | ||
Tangible net assets per shareA | 57.0p | 52.4p | 4.6p |
At 31 Dec 2025 £bn | At 30 Sep 2025 £bn | Change % | At 30 Jun 2025 £bn | Change % | At 31 Dec 2024 £bn | Change % | |||
UK mortgages | 323.1 | 321.0 | 1 | 317.9 | 2 | 312.3 | 3 | ||
Credit cards | 17.3 | 16.8 | 3 | 16.4 | 5 | 15.7 | 10 | ||
UK Retail unsecured loans | 10.5 | 10.3 | 2 | 9.9 | 6 | 9.1 | 15 | ||
UK Motor Finance1 | 16.4 | 16.1 | 2 | 16.0 | 3 | 15.3 | 7 | ||
Overdrafts | 1.3 | 1.2 | 8 | 1.2 | 8 | 1.2 | 8 | ||
Retail Europe2 | 20.4 | 19.9 | 3 | 19.0 | 7 | 16.8 | 21 | ||
Retail other2 | 1.3 | 1.4 | (7) | 1.2 | 8 | 1.1 | 18 | ||
Business and Commercial Banking | 28.3 | 28.8 | (2) | 29.1 | (3) | 29.7 | (5) | ||
Corporate and Institutional Banking | 62.0 | 61.3 | 1 | 59.7 | 4 | 57.9 | 7 | ||
Central Items3 | 0.5 | 0.3 | 67 | 0.6 | (17) | – | |||
Underlying loans and advances to customersA | 481.1 | 477.1 | 1 | 471.0 | 2 | 459.1 | 5 | ||
Retail current accounts | 102.8 | 101.8 | 1 | 100.6 | 2 | 101.3 | 1 | ||
Retail savings accounts | 212.5 | 212.4 | 213.1 | 208.2 | 2 | ||||
Wealth | 9.9 | 9.5 | 4 | 9.7 | 2 | 10.2 | (3) | ||
Commercial Banking | 171.1 | 172.6 | (1) | 170.2 | 1 | 162.6 | 5 | ||
Central Items | 0.2 | 0.4 | (50) | 0.3 | (33) | 0.4 | (50) | ||
Customer deposits | 496.5 | 496.7 | 493.9 | 1 | 482.7 | 3 | |||
Total assets | 944.1 | 937.5 | 1 | 919.3 | 3 | 906.7 | 4 | ||
Total liabilities | 896.2 | 891.8 | 872.4 | 3 | 860.8 | 4 | |||
Ordinary shareholders’ equity | 41.8 | 40.2 | 4 | 40.4 | 3 | 39.5 | 6 | ||
Other equity instruments | 5.9 | 5.2 | 13 | 6.3 | (6) | 6.2 | (5) | ||
Non-controlling interests | 0.2 | 0.2 | 0.2 | 0.2 | |||||
Total equity | 47.9 | 45.6 | 5 | 46.9 | 2 | 45.9 | 4 | ||
Ordinary shares in issue, excluding own shares | 58,799m | 59,196m | (1) | 59,938m | (2) | 60,491m | (3) |
2025 £m | 2024 £m | Change % | |||
Underlying net interest income | 13,635 | 12,845 | 6 | ||
Underlying other income | 6,120 | 5,597 | 9 | ||
Operating lease depreciation1 | (1,454) | (1,325) | (10) | ||
Net incomeA | 18,301 | 17,117 | 7 | ||
Banking net interest marginA | 3.06% | 2.95% | 11bp | ||
Average interest-earning banking assetsA | £462.9bn | £451.2bn | 3 |
2025 £m | 2024 £m | Change % | |||
Operating costsA | 9,761 | 9,442 | (3) | ||
Remediation | 968 | 899 | (8) | ||
Total costsA | 10,729 | 10,341 | (4) | ||
Cost:income ratioA | 58.6% | 60.4% | (1.8)pp |
2025 £m | 2024 £m | Change % | |||
Charges (credits) pre-updated MES1 | |||||
Retail | 734 | 789 | 7 | ||
Commercial Banking | (14) | 48 | |||
Other | 1 | (10) | |||
721 | 827 | 13 | |||
Updated economic outlook | |||||
Retail | – | (332) | |||
Commercial Banking | 74 | (62) | |||
74 | (394) | ||||
Underlying impairment chargeA | 795 | 433 | (84) | ||
Asset quality ratioA | 0.17% | 0.10% | 7bp |
Pro forma CET1 ratio as at 31 December 2024A,1 | 13.5% |
Banking build (bps)2 | 228 |
Insurance dividend (bps) | 9 |
Risk-weighted assets (bps) | (54) |
Other movements (bps)3 | 14 |
Retail secured CRD IV increases (bps)4 | (19) |
Capital generation excluding provision charge for motor finance commission arrangements (bps) | 178 |
Provision charge for motor finance commission arrangements (bps) | (31) |
Capital generation (bps) | 147 |
Ordinary dividend (bps) | (97) |
Share buyback accrual (bps) | (79) |
Pro forma CET1 ratio as at 31 December 2025A,1 | 13.2% |
2025 % | 2024 % | ||
Post-tax return on average assets | 0.51 | 0.50 |
2025 £m | 2024 £m | Change % | |||
Life and pensions sales (PVNBP)A,1 | 21,047 | 18,249 | 15 | ||
New business value of insurance and participating investment contracts recognised in the yearA,2 | |||||
of which: deferred to contractual service margin and risk adjustment | 93 | 126 | (26) | ||
of which: losses recognised on initial recognition | (13) | (15) | 13 | ||
80 | 111 | (28) | |||
Assets under administration (net flows)A,3 | £7.9bn | £5.7bn | 39 | ||
General insurance underwritten new gross written premiumsA | 175 | 197 | (11) | ||
General insurance underwritten total gross written premiumsA | 762 | 737 | 3 | ||
General insurance combined ratioA | 89% | 97% | (8)pp |
At 31 Dec 2025 | At 31 Dec 2024 | Change % | |
Insurance Solvency II ratio (pre-dividend)4 | 144% | 158% | (14)pp |
Total customer assets under administrationA,3 | £279.6bn | £247.1bn | 13 |
2025 | 2024 | ||||||||||||||||
Deferred profit release1 £m | Other in-year profit £m | Total £m | Deferred profit release1 £m | Other in-year profit £m | Total £m | ||||||||||||
Life open book (pensions, individual annuities, Wealth and protection) | 346 | 455 | 801 | 350 | 318 | 668 | |||||||||||
Non-life (General insurance) | – | 277 | 277 | – | 229 | 229 | |||||||||||
Other items2 | 67 | 135 | 202 | 69 | 190 | 259 | |||||||||||
Net incomeA | 413 | 867 | 1,280 | 419 | 737 | 1,156 | |||||||||||
Life open book £m | Other products2 £m | Bulk annuities3 £m | Total1 £m | ||||||||
Deferred profit at 1 January 2025 | 4,216 | 686 | 118 | 5,020 | |||||||
New business | 93 | – | – | 93 | |||||||
Release to income statement | (346) | (67) | – | (413) | |||||||
Other movements | 486 | 157 | (118) | 525 | |||||||
Deferred profit at 31 December 2025 | 4,449 | 776 | – | 5,225 | |||||||
Deferred profit at 1 January 2024 | 4,025 | 702 | 578 | 5,305 | |||||||
New business | 126 | – | – | 126 | |||||||
Release to income statement | (350) | (69) | – | (419) | |||||||
Other movements | 415 | 53 | (460) | 8 | |||||||
Deferred profit at 31 December 2024 | 4,216 | 686 | 118 | 5,020 |
2025 £m | 2024 £m | ||
Insurance volatility | 36 | (56) | |
Policyholder interests volatility | 256 | 162 | |
Total volatility | 292 | 106 | |
Insurance hedging arrangements | (537) | (442) | |
Total1 | (245) | (336) |
2025 | Retail £m | Commercial Banking £m | Insurance, Pensions and Investments £m | Equity Investments and Central Items £m | Group £m | ||||
Underlying net interest income | 9,637 | 3,670 | (151) | 479 | 13,635 | ||||
Underlying other income | 2,636 | 1,825 | 1,431 | 228 | 6,120 | ||||
Operating lease depreciation | (1,445) | (9) | – | – | (1,454) | ||||
Net income | 10,828 | 5,486 | 1,280 | 707 | 18,301 | ||||
Operating costs | (5,807) | (2,853) | (933) | (168) | (9,761) | ||||
Remediation | (931) | (27) | (15) | 5 | (968) | ||||
Total costs | (6,738) | (2,880) | (948) | (163) | (10,729) | ||||
Underlying profit before impairment | 4,090 | 2,606 | 332 | 544 | 7,572 | ||||
Underlying impairment (charge) credit | (734) | (60) | (2) | 1 | (795) | ||||
Underlying profit | 3,356 | 2,546 | 330 | 545 | 6,777 | ||||
Banking net interest marginA | 2.65% | 4.93% | 3.06% | ||||||
Average interest-earning banking assetsA | £384.6bn | £78.3bn | – | – | £462.9bn | ||||
Asset quality ratioA | 0.19% | 0.07% | 0.17% | ||||||
Underlying loans and advances to customersA,1 | £390.3bn | £90.3bn | – | £0.5bn | £481.1bn | ||||
Customer deposits | £325.2bn | £171.1bn | – | £0.2bn | £496.5bn | ||||
Risk-weighted assets | £130.4bn | £78.5bn | £0.5bn | £26.1bn | £235.5bn | ||||
2024 | Retail £m | Commercial Banking £m | Insurance, Pensions and Investments £m | Equity Investments and Central Items £m | Group £m | ||||
Underlying net interest income | 8,930 | 3,434 | (136) | 617 | 12,845 | ||||
Underlying other income2 | 2,354 | 1,815 | 1,292 | 136 | 5,597 | ||||
Operating lease depreciation | (1,319) | (6) | – | – | (1,325) | ||||
Net income | 9,965 | 5,243 | 1,156 | 753 | 17,117 | ||||
Operating costs2 | (5,566) | (2,752) | (924) | (200) | (9,442) | ||||
Remediation | (750) | (104) | (19) | (26) | (899) | ||||
Total costs | (6,316) | (2,856) | (943) | (226) | (10,341) | ||||
Underlying profit (loss) before impairment | 3,649 | 2,387 | 213 | 527 | 6,776 | ||||
Underlying impairment (charge) credit | (457) | 14 | 7 | 3 | (433) | ||||
Underlying profit | 3,192 | 2,401 | 220 | 530 | 6,343 | ||||
Banking net interest marginA | 2.54% | 4.51% | 2.95% | ||||||
Average interest-earning banking assetsA | £370.1bn | £81.1bn | – | – | £451.2bn | ||||
Asset quality ratioA | 0.12% | 0.00% | 0.10% | ||||||
Underlying loans and advances to customersA,1 | £371.5bn | £87.6bn | – | – | £459.1bn | ||||
Customer deposits | £319.7bn | £162.6bn | – | £0.4bn | £482.7bn | ||||
Risk-weighted assets | £125.1bn | £73.8bn | £0.4bn | £25.3bn | £224.6bn | ||||
At 31 Dec 2025 | At 31 Dec 2024 | ||
Retail | 27,781 | 29,734 | |
Commercial Banking | 8,126 | 8,850 | |
Insurance, Pensions and Investments | 6,254 | 5,882 | |
Group functions and services | 18,559 | 17,544 | |
60,720 | 62,010 | ||
Agency staff | (659) | (782) | |
Total number of employees | 60,061 | 61,228 |
At 31 Dec 2025 £m | At 31 Dec 2024 £m | ||
Underlying net interest expense | (132) | (109) | |
Underlying other income | 579 | 502 | |
Net income | 447 | 393 | |
Total costs | (96) | (78) | |
Underlying profit | 351 | 315 |


Directors’ report | ||
Chair’s statement | ||
UK Corporate Governance Code | ||
Our Board | ||
Our Board composition at a glance | ||
Boards of the Ring-Fenced Banks and Group Executive Committee | ||
Our governance structure and responsibilities | ||
Board activities | ||
Engaging with our stakeholders | ||
Our culture in action | ||
Sustainability governance | ||
Board performance | ||
Internal control | ||
Read full biography |
Board membership and attendance at scheduled meetings1 | ||
Sir Robin Budenberg | 10/10 | |
Charlie Nunn | 10/10 | |
William Chalmers | 10/10 | |
Cathy Turner | 10/10 | |
Nathan Bostock | 9/102 | |
Sarah Legg | 10/10 | |
Amanda Mackenzie | 10/10 | |
Harmeen Mehta | 10/10 | |
Chris Vogelzang | 5/53 | |
Scott Wheway | 8/84 | |
Catherine Woods | 10/10 | |
1Where a director is unable to attend a Board or Committee meeting he/she receives papers in advance and has the opportunity to provide comments to the Chair of the Board or to the relevant Committee Chair. 2Nathan Bostock was unable to attend one meeting due a commitment scheduled prior to Nathan joining the Board. 3Chris Vogelzang was appointed to the Board on 16 June 2025. 4Scott Wheway stepped down from the Board on 31 October 2025. Other attendees Nigel Hinshelwood (the Senior Independent Director of the Ring-Fenced Banks), Sarah Bentley and Brendan Gilligan (both independent non-executive directors of the Ring-Fenced Banks) attend meetings as observers to provide insight on the Ring-Fenced Banks when required. The Company Secretary and Chief Risk Officer also attend Board meetings. | ||



|
Sir Robin Budenberg Chair |
| UK Corporate Governance Code | |
Compliance statement The UK Corporate Governance Code 2024 (the Code) applied to the financial year ended 31 December 2025 with the exception of Provision 29, which applies to the Company’s financial year which began on 1 January 2026. The Company will report against Provision 29 of the Code in its annual report and accounts for the year ending 31 December 2026. Read more about the Group’s (2018 Code) applied to the financial year ended 31 December 2025. This directors’ report is set out in a way that helps shareholders and investors to evaluate how the Company has applied the principles and complied with the provisions of the Code during 2025. The table below signposts parts of the annual report and accounts which relate to the principles and provisions of the Code and provision 29 of the 2018 Code, including where the relevant information is not in the directors’ report. The Company confirms that it applied the principles and complied with all relevant provisions of the Code and with provision 29 of the 2018 Code throughout 2025. The Code is available at www.frc.org.uk. | ||
| | |
Principles of the Code | ||||
1 | Board leadership and company purpose | Pages | ||
A | Effective board | |||
B | Purpose, values and strategy | |||
Culture | ||||
C | Board decisions and outcomes | |||
D | Stakeholder engagement | |||
E | Workforce policies and practice | |||
2 | Division of responsibilities | |||
F | Role of Chair | |||
G | Independence | |||
Division of responsibilities | ||||
H | Role of non-executive directors and time commitments | |||
I | Policies, processes, information, time and resources | |||
3 | Composition, succession and evaluation | |||
J | Board appointments and succession plans | |||
K | Board skills, experience and knowledge | |||
L | Annual board performance review | |||
4 | Audit, risk and internal control | |||
M | External auditor and internal audit | |||
Integrity of financial reporting | ||||
N | Fair, balanced and understandable assessment | |||
O | Risk management framework | |||
Internal financial controls | ||||
5 | Remuneration | |||
P | Linking remuneration with purpose, values and strategy | |||
Q | Remuneration policy | |||
R | Performance outcomes in 2025 | |||

Sir Robin Budenberg CBE Chair | |||
Charlie Nunn Executive director and Group Chief Executive | |||
William Chalmers Executive director and Chief Financial Officer | |||
Cathy Turner Senior Independent Director | |||
Nathan Bostock Independent non- executive director and Chair of Lloyds Bank Corporate Markets plc and Lloyds Bank GmbH | |||
Sarah Legg Independent non-executive director | |||

Amanda Mackenzie LVO OBE Independent non-executive director | |||
Harmeen Mehta Independent non-executive director | |||
Chris Vogelzang Independent non-executive director | |||
Catherine Woods Independent non-executive director | |||
Kate Cheetham Chief Legal Officer and Company Secretary | |||
 | Audit Committee member |
 | Board Risk Committee member |
 | Nomination and Governance Committee member |
 | Remuneration Committee member |
 | Responsible Business Committee member |
 | Committee Chair |
Board changes during the year | ||||
16 June 2025 Chris Vogelzang joined the Board as a non-executive director | 31 October 2025 Scott Wheway retired as a non-executive director of the Board and as Chair of Scottish Widows Group3 | |||

| Our Board in 2025 | |
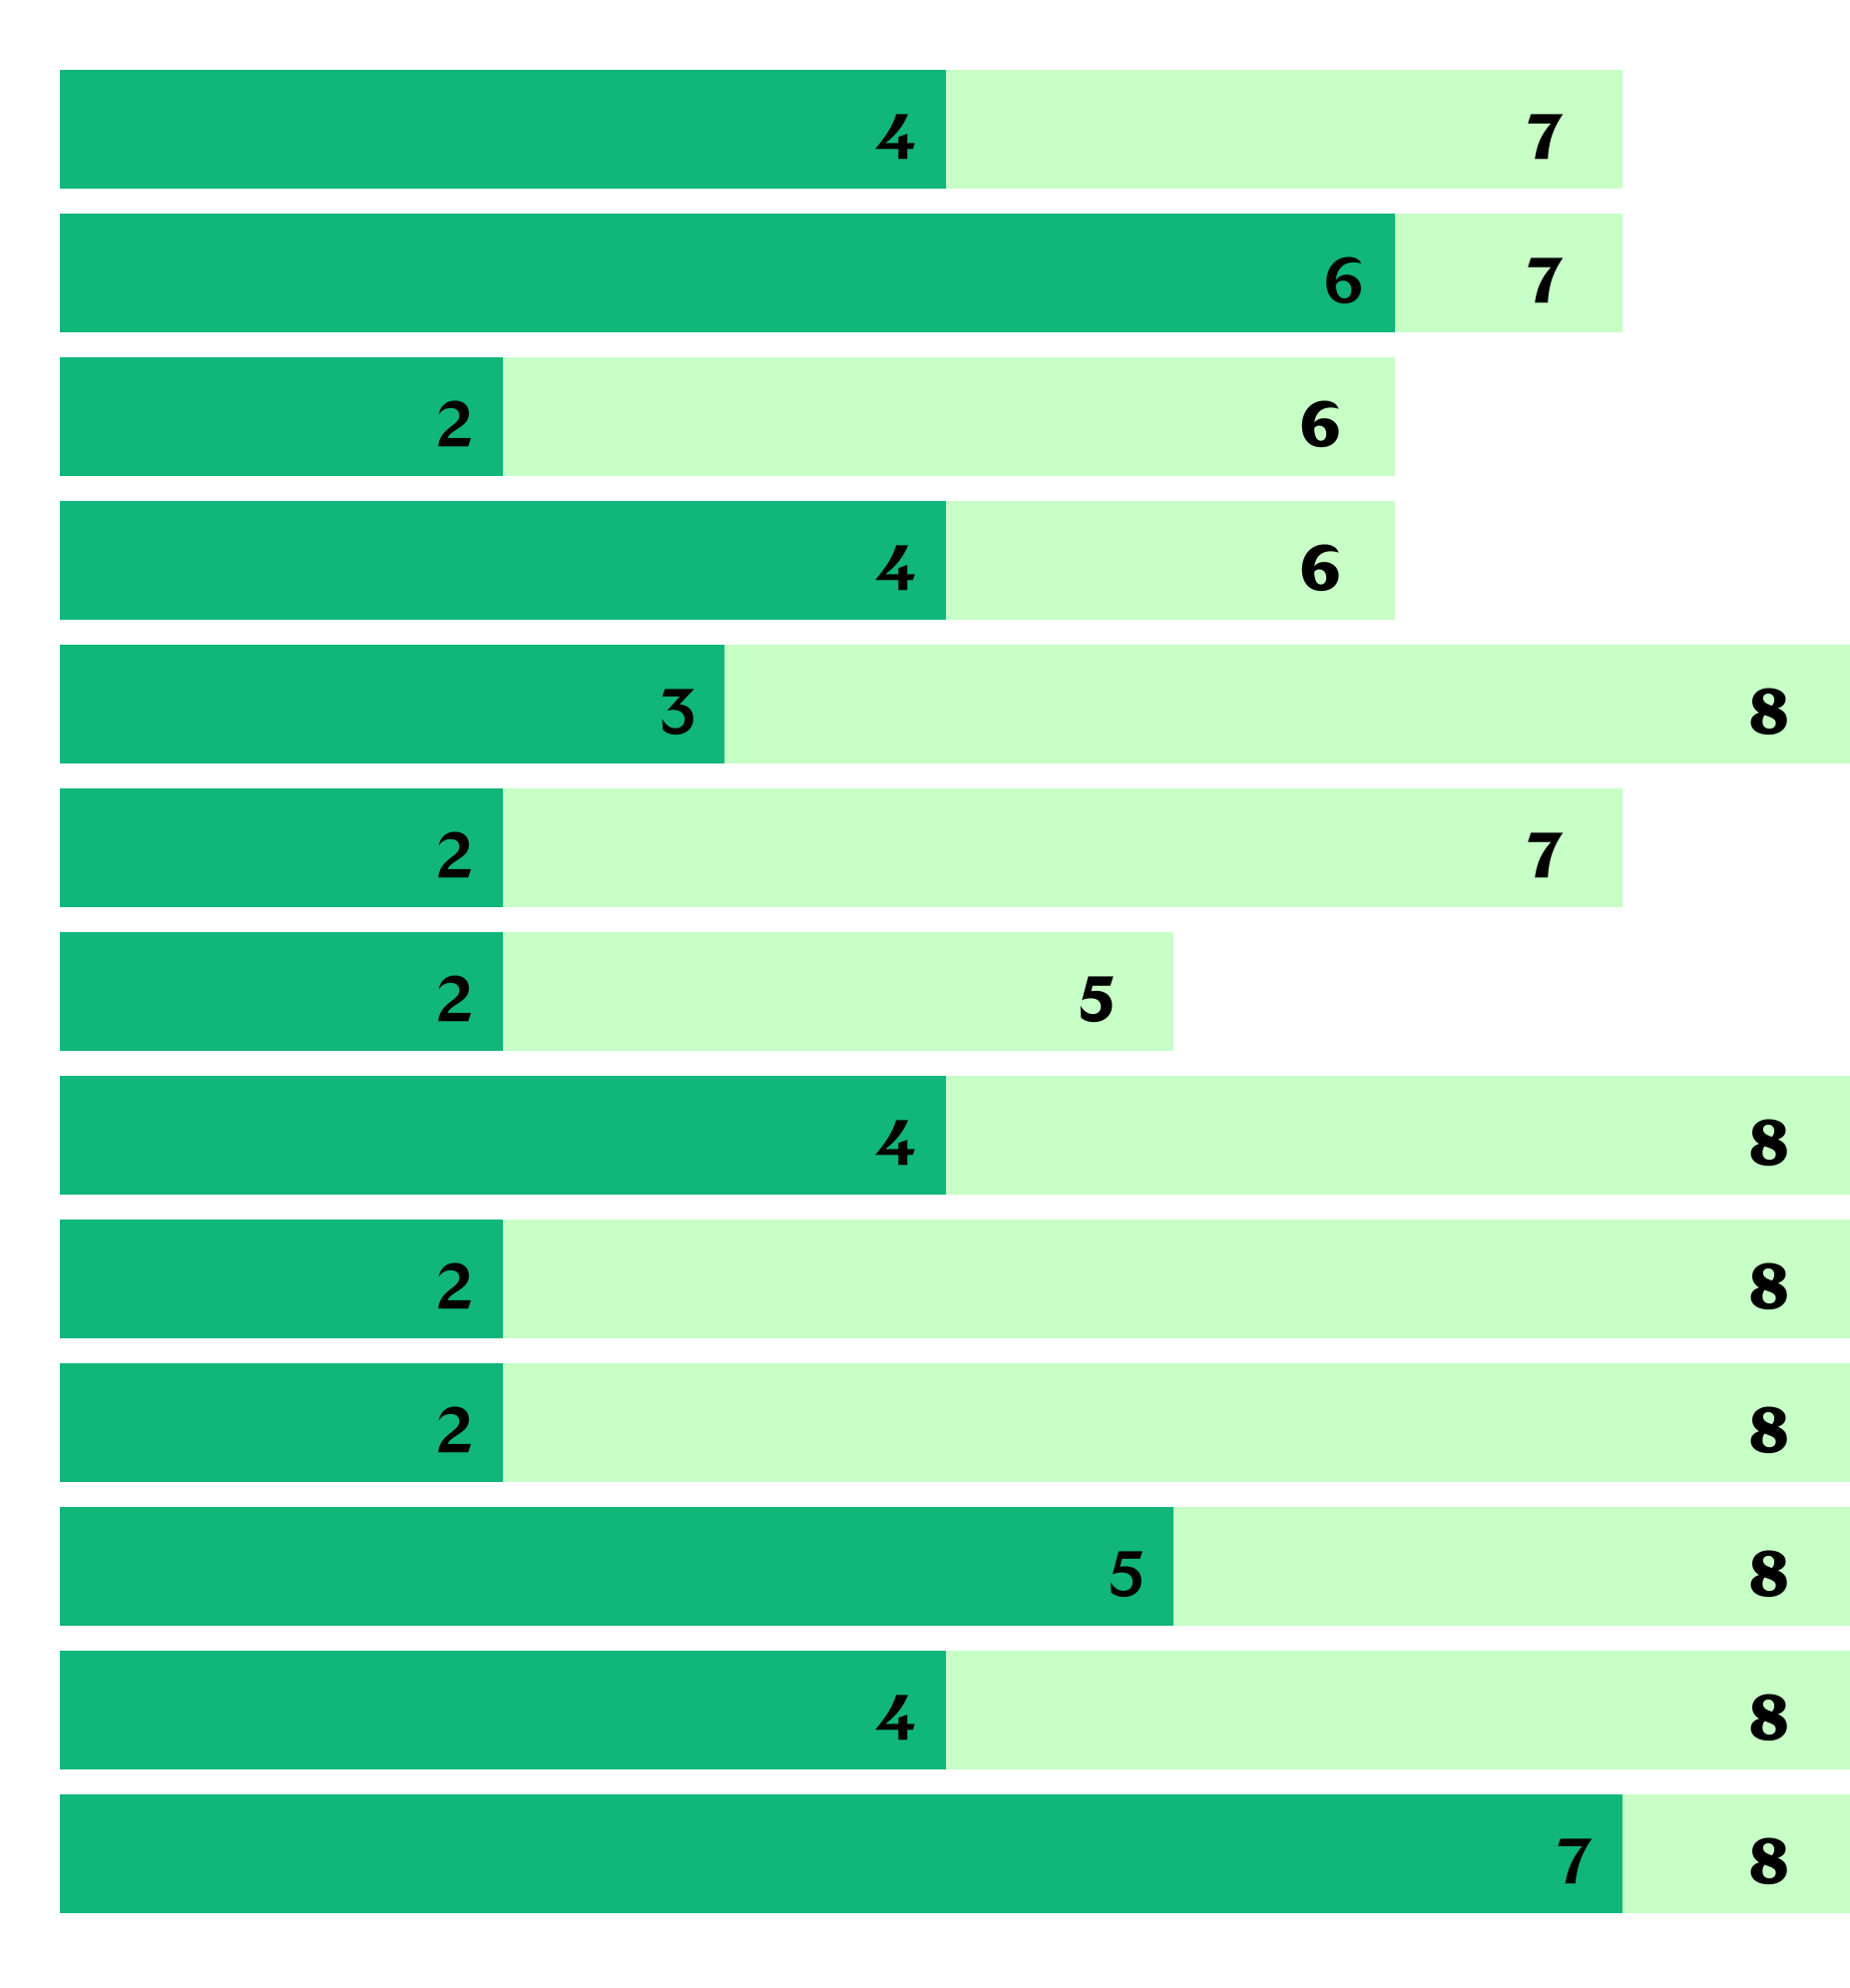
Retail/commercial banking | |
Financial markets/wholesale banking industry | |
Insurance | |
Audit and finance | |
Risk – in financial institutions | |
Technology/digital | |
Consumer/marketing/distribution | |
Major change programmes | |
ESG: environment, sustainability and climate change | |
ESG: social, inclusion and diversity, and governance | |
Government/regulator interface | |
Listed board governance, including investor relations and remuneration | |
Strategic thinking |
l | Number of non-executive directors (out of 8) with deep experience/distinctive strength |
l | Number of non-executive directors (out of 8) with deep experience/distinctive strength or with good experience and knowledge |
Gender balance2 A.Female – 5 (50%) B.Male – 5 (50%) |

Ethnicity2 A.Black, Asian or Minority Ethnic – 2 (20%) B.White – 8 (80%) |

Tenure2 A.0-2 years – 2 (20%) B.2-4 years – 1 (10%) C.4-6 years – 4 (40%) D.6-8 years – 3 (30%) |
Age2 A.51-55 – 2 (20%) B.56-60 – 2 (20%) C.61-65 – 5 (50%) D.66+ – 1 (10%) |
1Assessment by the Nomination and Governance Committee in respect of Board members in office as at 31 December 2025. 2As at 31 December 2025 and remains correct as at the date of publication of the annual report. |
Boards of the Ring-Fenced Banks |

Nigel Hinshelwood Senior Independent Director Lloyds Bank plc and Bank of Scotland plc |

Sarah Bentley Non-executive director Lloyds Bank plc and Bank of Scotland plc |

Brendan Gilligan Non-executive director Lloyds Bank plc and Bank of Scotland plc |
Our Group Executive Committee |




Charlie Nunn Executive director and Group Chief Executive Appointed: August 2021 | |
 |
William Chalmers Executive director and Chief Financial Officer Appointed: June 2019 | |
 |
Chirantan Barua Chief Executive Officer, Scottish Widows and Insurance, Pensions and Investments Appointed: May 2023 | |
|
Kate Cheetham Chief Legal Officer and Company Secretary Appointed: July 2017 | |
|




Elyn Corfield1 Chief Executive Officer, Business and Commercial Banking Appointed: July 2022 | |
|
Sharon Doherty Chief People and Places Officer Appointed: June 2022 | |
|
Ron van Kemenade Chief Operating Officer Appointed: June 2023 | |
|
Laura Needham Chief Internal Auditor Appointed: October 2022 | |
 |




Jayne Opperman Chief Executive Officer, Consumer Lending Appointed: January 2023 | |
|
Stephen Shelley Chief Risk Officer Appointed: September 2017 | |
|
Jasjyot Singh OBE Chief Executive Officer, Consumer Relationships Appointed: July 2022 | |
|
Andrew Walton Chief Sustainability Officer and Chief Corporate Affairs Officer Appointed: September 2018 | |
|


John Winter2 Chief Executive Officer, Corporate and Institutional Banking Appointed: September 2022 | |
|

Read the full biographies of the Group Executive Committee |

Our Board and governance structure | ||||
Lloyds Banking Group Board | |||||||||||||
      | |||||||||||||
Chair | Executive directors | Non-executive directors | Company Secretary | ||||||||||
Sir Robin Budenberg | Group Chief Executive: Charlie Nunn | Chief Financial Officer: William Chalmers | Senior Independent Director: Cathy Turner | Nathan Bostock Sarah Legg Amanda Mackenzie Harmeen Mehta Chris Vogelzang Catherine Woods | Kate Cheetham | ||||||||
Board Committees | ||||||||||||||
Nomination and Governance Committee | Audit Committee | Board Risk Committee | Remuneration Committee | Responsible Business Committee | ||||||||||
| | | | | ||||||||||
Responsible for keeping the Board’s governance arrangements under review, ensuring there is a formal, rigorous and transparent procedure for the appointment of new directors, ensuring Board and senior management succession plans are in place, leading the process for Board appointments and assisting the Board in ensuring its composition is regularly reviewed and refreshed. | Responsibilities include monitoring and reviewing the formal arrangements established by the Board in respect of the integrity of the financial reporting and narrative reporting of the Group and the Company, the independence and effectiveness of the internal and external audit functions and the effectiveness of the internal controls and the risk management framework. | Responsible for assisting the Board in fulfilling its risk governance and oversight responsibilities, including oversight of the development, implementation and maintenance of the Company’s risk appetite, risk principles and overall risk management and internal control framework. | Responsibilities include reviewing and approving the remuneration policy and framework for the directors of the Group and the overall remuneration policy for the Group and overseeing the implementation of those policies. | Responsibilities include providing oversight of and support for the Group’s strategy and plans for delivering the Company’s aspirations to become a truly purpose-driven organisation, considering and recommending to the Board for approval the Group’s reporting relating to purpose and sustainability matters, oversight of the Group’s Consumer Duty responsibilities and being the designated body for workforce engagement. | ||||||||||
See page 85 | See page 88 | See page 92 | See page 97 | |||||||||||
The terms of reference for the Board Committees can be found on our corporate governance page |


Read more about the roles of the Chair, the Senior Independent Director, the Group Chief Executive and the Board on our corporate governance page |
Group structure and ring-fencing governance arrangements | ||||
Since 1 January 2019, UK legislation has required large UK banks to separate personal banking services, such as current and savings accounts, from riskier activities, such as investment banking, in other parts of their business. This is called ring-fencing. The Group’s structure and governance arrangements meet these regulatory requirements. plc are the banks within the Group which have been included within the ring-fence (together, the Ring-Fenced Banks). The governance structure focuses on ensuring: •Independent decision making by the Ring-Fenced Banks’ boards – on any matters where there might be a conflict between the interests of the Ring-Fenced Banks and the interests of another part of the Group and that any such conflicts are identified and appropriately managed •Risks affecting the Ring-Fenced Banks are considered and managed from the Ring-Fenced Banks’ perspective – including maintenance of the capital adequacy and liquidity of the Ring-Fenced Banks •Clear and effective governance at both Ring-Fenced Bank level and Lloyds Banking Group plc level – including second and third lines of defence in respect of risk management | The subsidiaries in the Group are structured into the following sub-groups under Lloyds Banking Group plc, providing effective governance for the business undertaken in each sub-group: •Ring-Fenced Banks sub-group containing Lloyds Bank plc and Bank of Scotland plc (including the Halifax and MBNA businesses), serving both their personal and commercial customers •Non-Ring-Fenced Bank sub-group – Lloyds Bank Corporate Markets plc – which provides products and services to Group customers that are not allowed within the ring-fence, as well as serving financial institutions’ customers and holding certain of the Group’s subsidiaries and branches outside the UK •Insurance sub-group under Scottish Widows Group Limited (including Scottish Widows Limited) •Equity sub-group under LBG Equity Investments Limited (including Lloyds Development Capital (Holdings) Limited) The boards of the Ring-Fenced Banks comprise all of the Group directors plus three additional independent non-executive directors: Nigel Hinshelwood (Senior Independent Director), Sarah Bentley and Brendan Gilligan – read their biographies on of the management and the rest of the Group and their role is to act exclusively in the best interests of the Ring-Fenced Banks. They therefore play a crucial role in the governance structure, with an enhanced role in managing any potential conflicts between the Ring-Fenced Banks and the Group. | |||
Lloyds Banking Group plc simplified sub-group structure | ||||
Lloyds Banking Group plc Board |
Aligned boards Lloyds Bank plc1 HBOS plc Bank of Scotland plc1 1 Ring-Fenced Banks | Lloyds Bank Corporate Markets plc Non-Ring-Fenced Bank | Scottish Widows Group Limited Insurance | LBG Equity Investments Limited Equity Investments | |||




Board training During the year, Board members had the opportunity to attend training sessions, which were designed to keep the Board informed on a range of relevant topics and emerging focus areas. Training topics are selected and agreed through a collaborative process involving key executive teams, the Company Secretary and the Nomination and Governance Committee. For more detail on the training |


Topics key: | |
Strategy Customers and clients Purpose, culture and values Sustainability Risk management and regulatory Financial Governance Political and economic environment |





Customers and clients | How does that engagement impact Board decisions? •Hearing directly from customers and clients helps better determine the action the Group takes now and in the future to best support our customers’ needs •Direct engagement helps the Board in ensuring the Group can best meet its Consumer Duty obligations •Regular updates from the executive team help to identify opportunities for innovation and improvement to better support our customers and clients •Review of the Group customer dashboard gives the Board the opportunity to ensure meaningful changes are delivered to further improve customer outcomes | |||
Why does the Board engage? The Board’s engagement with customers is central to the Group’s customer-centric approach, including the Group’s ability to evolve to meet changing customer needs and support our customers in achieving their financial ambitions. How did the Board engage? •Sessions providing deeper insight into the issues faced by specific customer groups, including single person households, small businesses and later life including retirement •Holding events with clients in Edinburgh, Manchester and London to hear directly from them on the issues their businesses are facing •Regular updates to the Board by the executive team gave insight into the Group’s performance in delivering on its customer and client-related objectives, including customer insight sessions and ongoing consideration of the Group customer dashboard •Concerns relevant to customers and clients were identified for consideration in wider proposals put to the Board |

| Engagement in action | | ||
Pension engagement During the year, the Board and its Remuneration Committee consulted with colleagues on proposals to move the Group’s UK defined contribution pension provision from Your Tomorrow and Your Retirement Plan to the Scottish Widows Master Trust. The Board engaged with colleagues to understand their views through a comprehensive digital first consultation process. This included around 1,800 items of feedback formally submitted by colleagues across all grades, business units and age groups. Trade union partners, including Accord and Unite, were also consulted, along with the Group’s People Consultation Forum, allowing collective consultation and a number of relevant questions to be raised, resulting in no formal objections or requests for further action. The Board was pleased to have the opportunity to hear from colleagues and representatives so as to be able to take their views into account prior to making the decision to transfer the future pension provision of the Group’s UK colleagues to the Scottish Widows Master Trust from 2026. | ||||

Colleagues | •Helps the Board gain additional insight on matters which colleagues have raised as part of wider engagement activity and allows progress against matters raised to be monitored | |||
Why does the Board engage? The Board’s ambition is that the Group continues to be a place where people who are passionate about our purpose wish to work. Engagement with colleagues helps to understand better how they remain motivated to achieve our purpose with the skills needed to deliver on the Group’s wider strategic objectives. How did the Board engage? •Held a number of colleague engagement and recognition events with the opportunity to hear directly from colleagues and recognise their achievements in supporting our customers •Considered reports on key themes raised during colleague engagement activity, including the work of the People Forum, the People Consultation Forum and the Management Advisory Forum •Review by its Responsible Business Committee of findings from surveys of colleague sentiment and other colleague engagement reports How does that engagement impact board decisions? •Allows the Board to understand directly colleague views on the Group’s progress against its strategy, including what could improve this progress, and colleague observations from interacting with customers, further informing wider Board decision making |
| Engagement in action | | |||
Engaging with our workforce The Board’s Responsible Business Committee is the designated body for workforce engagement, providing focus, but with the Board retaining a commitment for individual Board members to engage with colleagues directly throughout the year. The Responsible Business Committee reports regularly to the Board on its colleague engagement agenda. The Board considers these arrangements to be effective as the work of the Responsible Business Committee combined with the other colleague engagement methods in this section allows engagement with diverse colleague groups. | |||||
Shareholders | •The Board’s Nomination and Governance Committee considered correspondence from institutional shareholders and non-governmental organisations along with market feedback. The Committee also reviewed initiatives aimed at enhancing shareholder processes to ensure they remain effective and aligned with regulatory and shareholder expectations •Directors engaged with shareholders at the Group’s annual general meeting and encouraged shareholder participation by inviting questions and facilitating open discussion How does that engagement impact Board decisions? •Shareholder feedback helped the Board to better understand investor sentiment, in turn informing relevant discussions and decision making, including in relation to the Group’s strategic progress •Feedback also helped to inform the ongoing development of the Group’s approach to communicating with external parties | |||
Why does the Board engage? With one of the largest shareholder bases in the UK, the Board remains committed to understanding the needs and expectations of our shareholders, both private and institutional, helping to further inform Board decision making. How did the Board engage? •Directors including the Chair, Group Chief Executive and Chief Financial Officer met regularly with institutional shareholders, both in the UK and internationally •Considered updates from Investor Relations on market views and shareholder sentiment, including an annual presentation from our corporate brokers on matters including perceptions of the Group |
Communities and environment | •The Board continues to be supported in environmental matters by its Responsible Business Committee, which considers stakeholder views on matters relating to the Group’s ambition to be a trusted, sustainable, inclusive and responsible business. How does that engagement impact Board decisions? •Engagement with the Group’s charitable partners allowed the Board to better understand the Group’s impact within local communities •The work of the Responsible Business Committee gives the Board deeper insight into its role as both an employer and a collaborator within the communities in which the Group is present | |||
Why does the Board engage? The Group’s presence in a large number of communities across the UK continues to reinforce the importance of engagement and action to help these communities prosper, while also helping to build a more sustainable and inclusive future. How did the Board engage? •Members of the Board met with representatives of charities and community groups supported by the Group’s charitable foundations |

Regulators and government | •Discussions included the Board’s role in oversight of the Group’s key risks and the execution of its strategy •The PRA and FCA attended a meeting of the Board during which progress against actions from their Periodic Summary Meeting and Firm Evaluation letters were discussed •Directors engaged with the Government during the year on matters relating to the impact of policy on the financial services sector How does that engagement impact Board decisions? •Ongoing direct discussions allow the Board to better understand the regulators’ and the Government’s priorities and how these are best acknowledged in the Board’s wider decision making | |||
Why does the Board engage? The Board recognises the importance of its ongoing constructive relationships and dialogue with both government and the regulatory authorities in markets in which the Group operates, in particular in achieving the Group’s strategic ambitions, and continuing to deliver for the Group’s wider stakeholders. How did the Board engage? •Directors held ongoing discussions with the FCA and PRA on various aspects of the regulatory agenda |
Suppliers | •The Board continued to oversee resilience in the supply chain ensuring the Group’s most important supplier relationships were not impacted by potential material events How does that engagement impact Board decisions? •Ensures the Group’s approach continues to meet wider industry standards on supplier management, in particular supplier payment practices •Allows a deeper understanding of our supply chain and the degree to which our suppliers’ operations align to the strategy and purpose of the Group | |||
Why does the Board engage? The Board recognises the importance of the partners the Group relies on for key aspects of the Group’s operations and strengthening these relationships to achieve both the Group’s and its suppliers’ wider ambitions. How did the Board engage? •The Audit Committee considered reports from the Group’s Sourcing and Finance teams on the efficiency of supplier payment practices, including those relating to the Group’s key suppliers |
Strategy discussions | ||||
While strategy was regularly discussed at Board meetings throughout the year, the Board also participated in two dedicated strategy sessions which were held offsite. These sessions provided the opportunity for iterative engagement on strategy between the Board and the executive team, enabling early input on emerging plans and ongoing dialogue as the strategy developed. The sessions also allowed the Board to test strategic assumptions from a stakeholder perspective. June Topics discussed at the June offsite session included the complex external environment, its potential evolution beyond 2026 and key considerations for the Group. The Board also discussed the development of the Group’s purpose ambitions and focus areas, scope for efficiencies in the Group’s operating model and the potential strategic vision beyond 2026 for the Group and specific businesses. | November At the offsite session in November, the Board continued to explore the potential strategic vision beyond 2026. Discussion topics included consideration of potential strategic focus areas for each of the Group’s business units as well as further refinement of the Group’s purpose outcomes. The Board also considered changes in the market and external environment since the offsite discussion in June, with a particular focus on the pace of development and impact of generative AI. | |||
| Grow | | Focus | | Change | ||||
Drive revenue growth and diversification | Strengthen cost and capital efficiency | Maximise the potential of people, technology and data |

How the Board monitors and assesses culture | ||
The directors continue to engage with colleagues to deepen their understanding of how culture is experienced across the Group. Colleague listening is a core part of the Group’s culture, using an ongoing feedback system to inform transformation and performance. Methods used by the Board to monitor and assess culture in 2025 included: •Board participation in quarterly ‘listening sessions’, part of the Group’s ‘Closer to Customers, Clients and Colleagues’ programme of engagement, where colleagues shared views with the Board on key topics such as culture, collaboration and risk. Groups of colleagues interacted with this year include Next Generation Talent, Leaders and Lloyds Technology Centre colleagues •Board consideration of the results of surveys (annual and regular pulse) designed to understand colleague sentiment and highlight any cultural issues focus areas such as simplification •Feedback from focus groups whereby colleagues shared views on our ways of working, inclusion, decision making and AI and technology •Branch visits and colleague breakfasts attended by non-executive directors and the Chair, which gave colleagues the opportunities to share their views •Review of the Group culture dashboard – read more below The Chair and Group Chief Executive have comprehensive colleague engagement programmes throughout the year. | ||
Outcomes of the Board’s monitoring and assessment | ||
Insights gained from the Board’s engagement with colleagues and from colleague feedback more generally are reviewed by the Responsible Business Committee as the designated workforce engagement body and key themes and results are shared with the Board on a quarterly basis. During 2025, these insights enabled the Board to consider progress on, and actions required to continue to advance towards, workforce and cultural transformation ambitions and also to satisfy itself that workforce engagement methods and associated updates remain appropriate and effective. As a result, the Board provided input into 2026 cultural focus areas across simplicity, accountability and performance and requested the executive establish a methodology and metrics to track the Group’s cultural and behavioural change. The 2025 Board listening sessions provided the Board with colleague views on crucial topics such as the Group’s approach to risk, collaboration between teams, use of AI and simplification. This feedback enabled the Board to input into the iteration of key transformation and culture programmes, for example helping shape the Group’s programme of work to remove barriers and blockers so we can deliver more value to customers at pace. The 2025 annual colleague survey demonstrated observable cultural outcomes whereby key metrics across all indices improved, including the Group’s employee engagement index improving and its colleague advocacy (net promoter) score increasing. | ||
Embedding the desired culture | ||
The Group culture dashboard is a key element of how the Group embeds the desired culture throughout the organisation. Introduced in November 2023 and shared twice yearly with the Board, the dashboard tracks insights related to performance, change and customer outcomes and identifies blockers to our cultural goals. The dashboard’s outcomes are a key input to culture plans, driving action towards cultural transformation and creating a strong culture that drives good customer outcomes. This, alongside our Group cultural framework, which aligns values throughout the organisation and promotes colleague listening activity and culture and people plans, plays a key role in embedding the Group’s culture. | ||

Our sustainability governance structure | |||||||||||
Board level | |||||||||||
Lloyds Banking Group plc Board1 | |||||||||||
Responsible Business Committee (RBC)2 | Board Risk Committee (BRC) | Audit Committee (AC) | Remuneration Committee (RemCo) | ||||||||
Executive level | |||||||||||
Group Sustainability Committee (GSC) | Group Risk Committee (GRC) | Group Disclosure Committee (GDC) | Group Executive Committee (GEC)1 | ||||||||
Business and functional level | |||||||||||
Divisional and functional-level climate and sustainability steering groups or committees | |||||||||||
1The Chair of the Scottish Widows Board (except for any Interim Chair) sits on the Lloyds Banking Group plc Board. The Scottish Widows CEO sits on the Group Executive Committee and updates the Group Executive Committee on relevant insurance matters which can include papers for Group Executive Committee consideration. 2The Chair of the Responsible Business Committee, Amanda Mackenzie, is a non- executive director on the Board, a member of the Remuneration Committee, the Nomination and Governance Committee and the Audit Committee. Amanda helps ensure that sustainability is discussed and considered by the Board. Amanda has extensive experience in ESG matters, including helping launch the United Nations Sustainable Development Goals. | |||||||||||
| Sustainability in action | | |||
Modern slavery Board training In 2025, the Group delivered targeted human rights and modern slavery training for senior leaders, including the Board and Group Executive Committee. The Board undertook a voluntary session on the evolving global legal landscape, highlighting financial sector responsibilities and the strategic importance of embedding human rights into core business practices. The training, supported by Unseen UK, explored risks across operations, supply chains, lending and investments, and it shared practical examples of how integration strengthens resilience and integrity. This initiative reinforces the Group’s commitment to responsible business conduct, equipping leaders to manage human rights risks and supporting long-term sustainability objectives. | |||||

Key sustainability topics discussed at the Board’s Committee meetings in 2025 | ||||
Across the Group’s governance structure, key areas of discussion at Board Committee level are detailed below in relation to the Group’s sustainability strategy, targets and approach to managing climate-related risk. These Committees meet at least quarterly with sustainability matters, including climate, discussed at a number of these meetings. There were 12 specific updates given to the Board in 2025 on climate-related matters. | ||||
Lloyds Banking Group plc Board | ||||
Committee | Sustainability topics discussed | |||
•The Committee recommended to the Board the Group’s updated Consumer Lending Sustainable Finance targets for Mortgages and Motor and restatement of the Group’s operational carbon targets ahead of publication of the 2024 Sustainability Report •Purpose pillar deep dives on regional development, inclusion, financial empowerment and environmental sustainability •Monitoring progress against climate ambitions, targets, pledges and strategic levers •Discussion on plans and progress across environmental sustainability strategy and our approach for nature •Recommended to the Board the approval of the external sector statement, modern slavery and human trafficking statement and annual Consumer Duty Board report •Review of sustainable finance framework updates •Review of colleague engagement strategy, feedback and outcomes •Discussion on community engagement | ||||
•Review of the key climate risks facing the Group, including uncertainty of the transition to a low-carbon economy, especially for sectors which are heavily dependent on technological development and government policy •Update on the PRA’s expectations for managing climate-related risks, as outlined in Consultation Paper 10/25, noting this aligns with the Group’s direction, including in relation to the development of internal scenario modelling and capabilities to assess these •Review of the Board climate risk appetite, while looking to ensure the Group avoids risks from potential economic and social misalignment in material sectors such as homes and agriculture •Wider sustainability topics included: the Group’s treatment of vulnerable customers, generative AI deep dive which outlined the Group’s AI ethics principles and how use cases are overseen via the Data and AI Ethics Committee, economic crime deep dive and key drivers of people risk and mitigating action | ||||
•Review of developments with regulations including UK Sustainability Reporting Standards, US and EU regulations, including Corporate Sustainability Reporting Directive •Activity to assess impacts of climate-related risks and opportunities on the financial statements including quantification of impacts of climate risk on Expected Credit Loss •Updates on the control environment embedded to support 2025 sustainability reporting, including assurance •Review of sustainability reporting approach and integrated sustainability disclosures for the Group in 2025 | ||||
•Review and approve performance measures, weightings and targets used in the scorecards that inform the remuneration of executive directors. Executive remuneration is linked to the successful delivery of the Group’s long-term strategy and considers measures relating to financial and non-financial performance, including sustainability measures aligned to our public commitments on climate change, promoting inclusion and diversity and colleague engagement •Regularly discuss Group performance, including relevant headwinds/tailwinds underlying that performance, in the context of both all-colleague and executive remuneration, ensuring reward outcomes appropriately properly reflect overall stakeholder experience | ||||

| Process for 2025 performance review | |

Appointed IBE following a competitive tender process | Evaluation brief provided to IBE | One-to-one interviews conducted | Board and Committee meetings observed by IBE | Observations discussed with the Group Chair and Committee chairs | Reports presented to the Board and Committees and actions agreed |
| Key findings from the 2025 performance review | |
Theme and link to strategy | Strengths | Areas for improvement/continued focus | |
Board composition, skills and relevance Grow | •The way in which the Group Chair orchestrates meetings and continues to deliver Board improvement •Executive directors who model transparency and collaboration and are considered exceptional leaders for the business •The quality and rigour demonstrated in the process for selecting new Board members | •Continue to consider Board skills against future needs of the Group, focusing on the next two to five years •Take a more fluid approach to non-executive director terms to match skills to strategy and keep relevance as the bar, not a nine-year term •Continue refining succession plans for the Board and executive directors, ensuring ideal sequencing and contingencies | |
Board culture, focus, engagement and agenda Focus | •The embedding of the Group’s purpose into Board thinking and how that is tested •The way in which the Group Chair fosters relationships to sustain boardroom culture •The Board’s remit and accountability and the way the agenda balances different stakeholder interests, supported by sound values to do the right thing •The progressive approach to Board development | •Consider Board and Committee meeting focus areas and agenda shape based on materiality and forward-looking matters •Assess the need for additional external data or input to inform Board or Committee discussions •Board members to role model performance culture by encouraging more in-room group discussion focused on challenge and accountability | |
Board governance Change | •The quality of the governance overall, including oversight through the rigour seen at Board Committees, which are considered to be very well chaired and to be effective in fulfilling their remit •Decision making processes are well handled and discussions well trailed •The support provided by the Corporate Governance team | •Implement short-form Board papers to support the Board’s focus on key areas •Continue to shape Board materials to ensure a balanced and relevant mix of content, including useful external perspectives •Consider further development of individualised induction and education plans, with dedicated budgets if needed |
| Progress against the 2024 evaluation | |
Theme and link to strategy | Feedback from the 2024 evaluation | Actions taken in 2025 | |
Board leadership and contribution Grow | •Explore opportunities to increase external perspectives and time for informal discussions to take place outside of Board meetings, enhancing the richness of content and views •Continue to consider Board composition and focus on skills required for future Board recruitment | •Opportunities to share external perspectives and engagement with the Board in a variety of formal and informal settings, including meetings, offsites and dinners covering such topics as private credit, geopolitical developments and market insights •Board composition and skills reviewed by the Nomination and Governance Committee, with priority skills for recruitment identified. The Board’s breadth of skills was enhanced through the appointment of Chris Vogelzang in June 2025 •Engaged Spencer Stuart to facilitate a Board development session involving a strategic discussion on digital assets in December 2025, building on the successful session delivered in November 2024 | |
Risk and control Focus | •Continue to enhance the quality of materials to the Board to ensure they highlight the key messages, risks, challenges and expected outcomes so as to optimise the efficiency of meetings •Expand the extent to which presentations demonstrate iterative thinking as well as lessons learned | •Following input from a wide variety of stakeholders, the Board paper template, guidance and training programme were reviewed. This guidance sets out the requirement for stakeholders to consider potential risks, how they will be addressed and that executives’ priorities are to be presented for discussion in a structured and consistent format •There was focus on the quality control of Board papers through ongoing guidance and training provided to stakeholders by the Corporate Governance team throughout the year •Board meetings provided time for Committee Chairs to highlight constructive challenge, feedback and outcomes from Committee meetings •Iterative thinking was demonstrated through management’s presentation of early views on a number of topics, such as the strategic vision beyond 2026 | |
Strategy Change | •Continued focus on both the opportunities and threats resulting from a fast-evolving external environment •Ensure customer and colleague perspectives and insights shared with the Board are presented in a comprehensive way, including as part of the strategy | •The Board has spent dedicated time on a range of fast-changing topics both at Board meetings and at the strategy offsite meetings in June and November. Topics included business unit strategy and competitive landscape, the fast-evolving external environment and its reputational, geopolitical and economic implications and data, digital assets, technology and use of artificial intelligence •The Board regularly received updates on customer and colleague perspectives during the year, including as part of strategy updates. The new Board paper template also reminds stakeholders to consider both customer and colleague impacts in their papers | |
People, culture and environment Change | •The Board to support and challenge management further on the implementation of cultural change throughout the organisation to deliver the right outcomes | •There were regular updates to the Board and relevant Committees from the People and Places function to understand colleague views and progress of the cultural transformation agenda •The Board had the opportunity to continue to develop a deeper understanding of customer and colleague views through various activities, including engagement and events at offsites and participation in the ‘Closer to Customers, Clients and Colleagues’ programme |

Audit and Risk Committee Forum for non-executive directors | |||
The audit and risk committee Forum is now an established annual event in the Board calendar and was most recently held in November 2025. Members of the Group, Insurance and Lloyds Bank Corporate Markets audit committees and board risk committees as well as colleagues from the business attended. The aims of this informal forum are to have interactive discussion to gain a shared understanding and appreciation of common areas of interest. The topics discussed were: •the Group’s approach to complying with provision 29 of the UK Corporate Governance Code 2024, which relates to the effectiveness of material controls •Political and economic environments and future implications for the Group •AI: use and opportunities across Audit, Risk and Finance and views of associated risks | |||
Read full biography |
Key activities in 2025 | |
•Board and senior executive succession planning •Board and Committee composition, skills and training •Board performance review outcomes •Shareholder relations •Corporate governance framework review •Subsidiary governance •Board Inclusion Policy |

Membership and attendance at scheduled meetings | ||
Sir Robin Budenberg (Committee Chair) | 5/5 | |
Amanda Mackenzie | 5/5 | |
Cathy Turner | 5/5 | |
Scott Wheway | 4/41 | |
1Scott Wheway stepped down from the Committee on 31 October 2025. Other attendees Nigel Hinshelwood, the Senior Independent Director of the Ring-Fenced Banks, attends meetings as an observer to provide insight on the Ring-Fenced Banks when required. The Group Chief Executive also attends as appropriate. | ||


| Appointment process – non-executive directors | |
The Committee oversees the process for appointing non- executive directors, providing recommendations to the Board for the selection of a preferred candidate. In early 2025, the Committee initiated a search to recruit for an additional non- executive director based on a role specification which included retail and commercial banking experience. The search involved open advertising as well as the appointment of Spencer Stuart, an executive search and leadership consulting firm. The search process resulted in a shortlist of potential candidates, who were interviewed by the Chair and other non-executive directors. Further interviews were then conducted with preferred candidates. Following this, a recommendation was made to the Committee and, in turn, the Committee recommended to the Board Chris Vogelzang’s appointment as a non-executive director. This formal, rigorous and transparent appointment process was based on merit and objective criteria and sought to promote diversity, inclusion and equal opportunity by considering a broad range of factors including gender balance, social and ethnic backgrounds, cognitive and personal strengths and the Group’s future strategic direction. Spencer Stuart, who were engaged in the recruitment that led to Chris Vogelzang’s appointment, have no connection with the Group or individual directors other than providing leadership search and succession planning services and facilitating Board development sessions. | ||
| | |
| Succession planning | |
Succession planning, at both Board level and across key senior management roles, remained a core area of focus for the Committee during 2025. Effective succession planning assists the Group in delivering on its long-term strategic objectives by ensuring the desired mix of knowledge, skills, experience and diversity of Board members and executives. Board succession planning The Committee supports the Chair in reviewing the composition of the Board and its Committees with attention given to the skills, diversity and tenure of members. The Committee gives consideration to further non-executive representation on the Board, keeping in view the current and future needs of the business. The promotion of inclusivity in gender, ethnicity, background and thought, as well as the outcomes of performance reviews, are also considered. assists the Committee in tracking individual member and Group strengths and identifying any gaps in the desired collective skills profile of the Board. As discussed on the prior page in relation to the appointment process, the Committee identified the desire for enhanced retail and commercial banking experience on the Board, resulting in the recruitment of Chris Vogelzang. The Committee has also identified the need for additional consumer, digital and insurance experience resulting in ongoing recruitment processes to address those needs. A search for Scott Wheway’s successor as a non-executive director of the Company and Chair of Scottish Widows Group was initiated following announcement of Scott’s decision to retire from the Group. The Committee reviewed the draft role specification at its meeting in November 2025 as part of the search. As part of the Committee’s formal succession planning approach, the Committee reviewed the rotation-based recruitment activity timetable, emergency cover plans and Board Succession Protocol (including the Emergency Succession Protocol for the Chair), with the aim of facilitating orderly transitions and mitigating risks from unexpected departures. Executive succession planning At an executive level, the Chair is responsible for developing and maintaining a succession plan for the Group Chief Executive who is, in turn, primarily responsible for developing and maintaining succession plans for key leadership positions in the senior executive team. As part of its oversight of succession planning for executive directors and members of the senior executive team, the Committee received and discussed regular updates from the Group Chief Executive covering executive succession arrangements. These discussions demonstrated the continuing effectiveness of the Group’s approach to executive succession planning, whereby the Board recognises the importance of the ongoing development of a diverse pipeline of current and future leaders across the Group’s executive and management levels. This is supported by a range of policies across the Group which promote the engagement of under- represented groups within the business to help continue to build a diverse talent pipeline. Further details can be found | ||
| | |

Training and development | ||||
To ensure the Board remains effective and able to continue to support the delivery of our strategy, it is essential that directors stay informed about recent and upcoming developments and maintain up-to-date knowledge and skills. The Board continued to focus on its development throughout the year with external insight and training sessions offered across a range of topics which complement the Board agenda, examples of which are set out below. In addition to the below topics, there was mandatory training, including on Speak Up (the Group’s whistleblowing programme) and on the Financial Conduct Authority’s Conduct Rules. At its meetings in November 2025 and January 2026, the Committee looked back at the 2025 Board training plan and also considered the learnings from the external Board performance review to help inform the 2026 training schedule. The Committee discussed priority areas and topics for Board training as well as what types of external inputs and stimulus would be most useful for Board members. | ||||
Q1 2025 •Generative AI: maximising opportunities while navigating the complexities around governance and risk | ||||
Q2 2025 •Resolution and recovery plan •Private credit •Geopolitical global developments | ||||
Q3 2025 •Environmental markets •Model risk •FCA redress schemes | ||||
Q4 2025 •Operational resilience (including cyber security risk) and third party implications •Modern slavery and human rights – read more on page 81 •Digital assets | ||||
Exceeded or met the UK Listing Rules targets1 | ||||||
50% of the board being women | One of the senior board positions being held by a woman2 | Two members of the board being from a minority ethnic background | ||||
1 UK Listing Rule 6.6.6(9) targets are at least 40% and, for the latter two targets, at least one. Data as at 31 December 2025 and remains correct as at the date of publication of the annual report. 2 Cathy Turner is the Senior Independent Director. | ||||||

Read full biography |
Key activities in 2025 | |
•Monitoring the integrity of the financial statements and non-financial (including narrative) reporting •Overseeing the continuous improvement in financial and regulatory reporting including associated controls •Reviewing the findings of the Group Internal Audit function and challenging the internal audit plan on a forward looking basis •Engaging with the subsidiary audit committees on their activities in the year |

Membership and attendance at scheduled meetings | ||
Sarah Legg (Committee Chair) | 7/7 | |
Nathan Bostock | 7/7 | |
Amanda Mackenzie | 7/7 | |
Catherine Woods | 7/7 | |
Other attendees Nigel Hinshelwood and Brendan Gilligan, the Senior Independent Director and an independent non-executive director respectively of the Ring-Fenced Banks, attend meetings as observers to provide insight on the Ring-Fenced Banks when required. The Group Chief Executive, the Chief Financial Officer, the Chief Risk Officer, the Group Financial Controller, the Chief Internal Auditor and the external auditor also attend meetings as appropriate. While the Committee’s membership comprises the non-executive directors noted above, all non-executive directors may attend meetings as agreed with the Chair of the Committee | ||


| Matters considered during 2025 | |
Jan | Feb | Apr | Jun | Jul | Oct | Dec | |
Reporting | |||||||
Review of external reporting documents | ò | ò | ò | Å | ò | ò | ò |
Significant accounting judgements | ò | ò | ò | ò | ò | ò | ò |
Going concern assumption/viability statement | Å | ò | Å | Å | ò | Å | Å |
Regulatory reporting | ò | Å | ò | ò | Å | ò | Å |
Sustainability-related reporting | Å | ò | Å | ò | Å | ò | Å |
Activities of subsidiary audit committees | ò | ò | Å | Å | ò | ò | Å |
Corporate governance and the Audit and Assurance Framework | Å | Å | ò | Å | Å | ò | Å |
Control environment | |||||||
Control update (including Sarbanes-Oxley) | ò | ò | ò | ò | ò | ò | ò |
Annual review of risk management framework and control effectiveness review summary | ò | Å | Å | Å | Å | Å | Å |
Jan | Feb | Apr | Jun | Jul | Oct | Dec | |
Group Audit | |||||||
Reports from Group Audit, including Speak Up (whistleblowing) | ò | Å | ò | ò | ò | ò | ò |
External audit | |||||||
Reports from the external auditor (including external audit plan) | ò | ò | ò | ò | ò | ò | ò |
Reappointment, remuneration, non-audit services and effectiveness | Å | ò | ò | Å | ò | Å | Å |
Other | |||||||
Audit committee effectiveness review | ò | Å | Å | Å | Å | ò | Å |
Finance strategy and transformation | Å | ò | ò | Å | Å | ò | Å |

| Areas of focus | |
Key issues | Committee review and conclusion | |
Allowance for impairments on loans and advances 31 December 2025: £3,228 million 31 December 2024: £3,481 million | The Group’s impairment provision is dependent on management’s judgements on matters such as future interest rates, house prices and unemployment rates, as well as its assessment of the current financial position of its customers. | During the year, the Committee has reviewed the level of provision held for expected credit losses (ECL) by the Group and the judgements and estimates used to calculate the provision. The Committee has monitored underlying credit performance trends and the evolution of the Group’s economic outlook and Multiple Economic Scenario (MES) approach in a year where ECL assessment has needed to respond quickly and appropriately to significant domestic and international events. The Committee has overseen further progress on ECL modelling and the corresponding reduction in the number of judgemental adjustments for model limitations where mitigated by model development. Note 21 to the financial statements includes details of the Group’s ECLs allowances, including those resulting from judgemental adjustments (31 December 2025: £224 million credit; 31 December 2024: £44 million debit). The Committee has reviewed management’s rationale for these provisions and has challenged whether their inclusion and quantification are appropriate. It also considered management’s assessment of climate risk impacts on ECL and the conclusion that no adjustment was required. Conclusion: The Committee was satisfied that the impairment provision and the disclosures provided in the financial statements were appropriate. |
Uncertain tax provisions | The Group has open tax matters which require it to make judgements about the most likely outcome for the purposes of calculating its tax position. | The Committee reviewed management’s assessment of the Group’s uncertain tax positions, which took into account the views of the relevant tax authorities and any external advice it received. In particular, following the conclusion of the First Tier Tribunal in favour of HMRC, it considered the Group's assessment of its continued likelihood of success in its claim for group relief of losses in its former Irish banking subsidiary. Conclusion: The Committee was satisfied that the provisions and disclosures made in respect of uncertain tax positions were appropriate. |
Retirement benefit obligations 31 December 2025: £26,571 million 31 December 2024: £27,118 million | The value of the Group’s defined benefit pension plan obligations is determined using both financial and demographic assumptions. | The Committee reviewed the process used by management to determine appropriate assumptions to calculate the Group’s defined benefit liabilities. These included the discount rate, the future rate of inflation and expected mortality rates. Conclusion: The Committee was satisfied that management had used appropriate assumptions that reflected the Group’s most recent experience and were consistent with market data and other information. |
| Areas of focus continued | |
Key issues | Committee review and conclusion | |
Insurance liabilities and participating investment contracts 31 December 2025: £135,284 million 31 December 2024: £127,332 million | Determining the value of the Group’s liabilities arising from insurance and participating investment contracts requires management to make significant estimates for both economic and non-economic actuarial assumptions. | The Committee considered updates from management and from the Group’s Insurance Audit Committee summarising its activities, which included a review of the economic and non-economic assumptions made by management to determine the carrying value of Group’s liabilities arising from insurance and participating investment contracts. The assumptions discussed were in respect of maintenance expenses, investment expenses allowance, lapse and paid-up assumptions on Workplace business and updated mortality projections. Conclusion: The Committee was satisfied that the assumptions used to calculate the Group’s liabilities arising from insurance and participating investment contracts were appropriate. |
Conduct risk provisions 31 December 2025: £2,276 million 31 December 2024: £1,600 million | Management judgement is used to determine the expected costs of remediation and, where appropriate, the related administration costs. | The Committee has received regular updates on the Group’s conduct risk matters and the progress it has made including updates in relation to the Supreme Court judgment handed down on 1 August 2025 on motor commission arrangements, the FCA consultation paper published on 7 October 2025 on an industry-wide redress scheme for motor finance, HBOS Reading and Responsible Lending. Conclusion: The Committee has considered management’s assessment of the Group’s provision for conduct-related matters and was satisfied that the provisions held at 31 December 2025 were appropriate. |
Going concern statement | The directors are required to confirm whether they have a reasonable expectation that the Company and the Group will be able to continue to operate and meet their liabilities as they fall due for a specified period. | The Committee assisted the Board in determining the appropriateness of adopting the going concern basis of accounting. This assessment was based on the Group’s operating, funding and capital plans which included consideration of climate-related matters on the Group’s performance and its projected funding and capital position. The Committee also took into account the results of the Group’s stress testing Conclusion: The Committee determined that the going concern basis of accounting was appropriate. |
Financial assets held at fair value through profit or loss classified as level 3 31 December 2025: £10,251 million 31 December 2024: £9,889 million | Determining the fair value of the Group’s financial assets classified as level 3 requires management to make significant estimates. | Financial assets held at fair value through profit or loss are classified into three levels according to the quality and reliability of information used to determine their fair values. Those classified as level 1 or level 2 are valued using observable market data, either directly or within models. Assets classified as level 3 are those where at least one input which could have a significant effect on the instrument’s valuation is not based on observable market data and as such involves significant judgement. During the year, the Committee reviewed the valuations of the Group’s level 3 financial assets held at fair value through profit or loss, the valuation techniques and the Group’s governance processes. Conclusion: The Committee was satisfied that the valuations and disclosures made in respect of the Group’s level 3 financial assets classified at fair value through profit or loss were appropriate. |

Read full biography |
Key activities in 2025 | |
•Oversight of enhancements to risk management and embedding of changes to the three lines of defence model •Ongoing oversight of operational resilience risks and continuous enhancements to controls, particularly in relation to cybersecurity, IT stability and supplier risk •Oversight and challenge of change management and execution risks, focusing on strategic transformation progress •Reviewed progress on strengthening economic crime prevention controls •Continued oversight and challenge on model and data risk, ensuring effective risk management of artificial intelligence •Considered management of climate risk, particularly greenwashing controls and scenario modelling capabilities •Reviewed management of capital, funding and liquidity risks, including structural hedge activity and provided challenge on stress testing design and execution •Ongoing assessment of emerging and topical risks | |


Membership and attendance at scheduled meetings | ||
Catherine Woods (Committee Chair) | 9/9 | |
Nathan Bostock | 8/91 | |
Sarah Legg | 9/9 | |
Cathy Turner | 9/9 | |
Scott Wheway | 6/71,2 | |
1Nathan Bostock and Scott Wheway were each unable to attend one meeting due to scheduling conflicts. 2Scott Wheway stepped down from the Committee on 31 October 2025. Other attendees Nigel Hinshelwood and Brendan Gilligan, the Senior Independent Director and an independent non-executive director respectively of the Ring-Fenced Banks, attend meetings as observers to provide insight on the Ring-Fenced Banks when required. The Chief Risk Officer has full access to the Committee and attends all meetings. The Chief Internal Auditor and members of the executive also attend meetings as appropriate. | ||

| Key activities for the year | |
Area of focus | Key role of Committee | Key outcomes |
Risk management framework | ||
•The Committee received regular updates on the effectiveness of the Group risk management framework to enable oversight of its development and ensure it aligns with emerging regulatory, corporate governance and industry best practice | •In January, the Committee recommended that the Board approve an enhanced risk management framework. The Committee received regular updates on its implementation across the Group throughout the year, driving clarity and consistency in the management of both financial and non-financial risks •The Committee has overseen enhancements made to the Group’s approach to risk appetite and operational risk management •The effectiveness of the Group risk management framework was supported in November | |
Risk and control profile | ||
•Significant time was spent reviewing the Group’s risk and control profile •Detailed insights were provided to the Committee throughout the year, with an enhanced consolidated Enterprise-Wide Risk Management report introduced to improve the Committee’s visibility of material risk and control issues | •The Group’s Risk and Control Self-Assessment approach has been enhanced. The new risk scoring assessment, which ensures a focus on the most significant risks was welcomed by the Committee •The Committee has been preparing for the introduction of Provision 29 of the UK Corporate Governance Code 2024 for our financial year that began on 1 January 2026 and supported the proposed approach •The Committee continued to review three-year risk and control improvement plans for both Business and Commercial Banking and Corporate and Institutional Banking, together with a deep dive on the markets control environment •In November, the Committee reviewed and supported the Risk function and Group Audit’s report on the effectiveness of internal controls required to manage risk | |
Non-financial risks | ||
Conduct and compliance | •The Committee is responsible for overseeing that effective controls are in place to ensure that good outcomes are realised for customers and that the Group complies with its existing regulatory obligations •Emphasising conduct and compliance’s importance to the Group and the scale of regulatory attention, the Committee requested more frequent updates | •Customer treatment has been the subject of a number of discussions at the Committee in 2025. Focus areas included: –The Group’s treatment of vulnerable customers, including outcomes from the FCA’s market survey and case study analysis –Complaints brought to the Financial Ombudsman Service (FOS), including understanding the root causes –Oversight of the delivery and reconciliation of critical communications to Retail customers ▪Detailed reports on legal developments and litigation risks were considered on a half-yearly basis ▪The Committee reviewed the Group’s ring-fencing arrangements in November, including implementation of near term reforms earlier in the year, and supported the Board in their confirmation of overall compliance with ring-fencing governance requirements |
Economic crime | •Recognising the significant external threat from economic crime to the Group and its customers, the Committee received updates on its exposure and prevention | •Sanctions, politically exposed persons (PEPs) payment and customer screening alerts were the focus of an update to the Committee in January •In April, the Committee considered an economic crime deep dive, which included progress updates on enhancing the control environment. The progress made to strengthen capability and capacity was recognised •The Committee reviewed the Money Laundering Reporting Officer’s annual report |
Strategic transformation oversight | •The Committee received quarterly updates on the performance of the Group’s extensive current and future strategic change agenda. This enabled the Committee to assess the impact of any material change programmes on the Group | •The Committee continued with its focus on ensuring effective management of change execution risk, with a strong emphasis on analysing strategic transformation delivery progress, challenging how the Group assesses the value derived and lessons learned from the platform-based operating model |
Operational resilience | •Oversight of operational resilience was a continued key focus area in 2025, with regular updates on IT service stability •A deep dive was undertaken on payments with a focus on the security and resilience of these core systems | •In March, the Committee reviewed the Group’s operational resilience self-assessment, which detailed scenario testing, recovery timeframes and regulatory expectations. The self-assessment was subsequently recommended to the Board for approval •The Committee covered IT service stability, particularly in response to outages experienced in the first half of the year, and oversaw improved performance •A comprehensive review of payment systems was conducted, focusing on the continuity and resilience of core operations |
| Key activities for the year continued | |
Area of focus | Key role of Committee | Key outcomes |
Non-financial risks continued | ||
Cybersecurity | •The Committee acknowledges the importance of cybersecurity and has received regular updates from the Group’s IT and Cyber Advisory Forum (ITCAF) | •In light of the increased threat landscape and market events in 2025, the Committee was briefed on cyber-related issues and efforts to reduce IT vulnerabilities and enhance the control environment |
Supplier risk management | •Close attention has been paid to the Group’s suppliers to ensure resilience of service to the Group’s customers | •In January, the Committee scrutinised a self-assessment of the Group’s supplier risk framework against the Prudential Regulation Authority’s Supervisory Statement 2/21 and questioned the status of compliance with new critical third-party regulations •A deep dive on supplier risk was conducted in October. The Committee emphasised the importance of ensuring all suppliers meet minimum resilience standards •Despite not having a significant impact on the Group, following the Amazon Web Services outage in October, the Committee discussed lessons learned to drive control enhancements |
People and health, safety and premises risks | •The performance and safety of colleagues is of utmost importance to the Committee, which has provided advice, oversight and challenge during the year | •Key drivers of people risk, mitigating actions and current and future areas of focus were considered by the Committee. Discussions focused on measuring culture, capability and capacity, and supporting strategic growth plans •The Committee recognised the progress made on health, safety and premises risk, noting improved automation of controls and data insights. Further focus is required given increasing levels of verbal abuse faced by branch colleagues |
Data and privacy risk | •Data and privacy risk is a continuing area of focus for the Committee •The Committee received updates on the data management risk profile and data privacy breaches | •A deep dive on the data and privacy risk profile was undertaken in July, with a follow-up in October. The Committee recognised that the Group is progressing towards a mature data management state with issues prioritised by impact, supported by AI-driven data quality monitoring •Alongside the deep dive, a proposal to revise the Group-wide Data Retention Schedule was noted •Compliance with the principles for effective risk data aggregation and risk reporting (BCBS 239) was discussed in July |
Financial risks | ||
Credit risk | •The Committee has frequently reviewed and challenged the performance of the Group’s commercial and consumer credit portfolios through regular credit management information and deep dives on portfolios requiring additional focus | •The Committee was pleased to note that the Group’s credit performance remained strong and stable in 2025 •A deep dive of the Group’s mortgages portfolio was completed, which considered an overview of the portfolio’s credit performance, market outlook and evolving risks. The Committee noted the material reduction in legacy assets that were originated before 2009 •A deep dive on the Group’s derivatives portfolio was undertaken, which included a sensitivity analysis. The overall high credit quality of the counterparties was noted by the Committee •A consumer lending credit risk deep dive highlighted the Group’s focus on sustainable growth. The Committee considered macroeconomic trends, performance and customers’ financial resilience •Infrastructure and project finance was also the focus of a deep dive, providing the Committee with a detailed overview of the business strategy and credit risks within the portfolio, such as concentration risk and growth in US exposures |
Motor finance | •With significant external factors impacting the motor finance sector, the Committee has carefully monitored the transport portfolio’s performance, its exposure to residual value risk and the evolving situation in relation to motor finance commission arrangements | •The Committee received a detailed update on motor finance residual value risk. The Committee noted the significant focus on building capabilities to mitigate residual value risk given ongoing volatility, particularly in relation to battery electric vehicles (BEVs) •The Group has considered the potential impact of the FCA’s motor finance commission redress scheme and will continue to assess developments following the announcement by the FCA of the final scheme rules |
| Key activities for the year continued | |
Area of focus | Key role of Committee | Key outcomes |
Financial risks continued | ||
Capital and liquidity | •The Committee has closely monitored the associated risks from capital, liquidity and funding | •After challenge and discussion from the Committee, the 2025 ICAAP was approved in March. The Committee was satisfied that the Group’s current and planned capital adequately covers the risk of financial loss it is, or might be, exposed to. During the year, the Committee also considered the approach and methodology for the 2026 ICAAP, including scrutinising the specific scenarios that help set operational risk capital for the Group •In April, the Committee approved the Group’s ILAAP. This included compliance with the PRA’s Overall Liquidity Adequacy Rules (OLAR) and refreshed Pillar 2 assessments •A capital optimisation deep dive took place in May, which focused on managing capital demand. The Committee expressed its support on plans and improvement of the Group’s capabilities •Updates on customer deposit trends and mix and the subsequent impacts this has for structural hedge activity were also provided to the Committee |
Other | ||
Model risk | •Model risk continued to be an area of significant internal and external focus, with the Committee overseeing the Group’s current model risk landscape and proposed improvements •The validation process for AI models also remained an area of importance in 2025 | •During 2025, the Committee continued its oversight of model risk management, with regular updates being provided •The Committee gave particular focus to the implementation of Capital Requirements Directive (CRD) IV models and embedding of the PRA’s Supervisory Statement 1/23 principles on Model Risk Management •November’s update included an assessment of the effectiveness of the model risk framework with details of future enhancements •A deep dive on generative and agentic AI took place in July, which outlined the development and implementation of an AI assurance framework |
Climate risk | •The Committee oversaw the impact of climate risk on the Group’s activities and considered the latest activity to assess and mitigate these risks | •A deep dive on climate risk was discussed in May. The Committee considered the Group’s key climate risks, the PRA’s Consultation Paper CP10/25 and continued development of internal climate scenario modelling capabilities |
Recovery plans and resolution | •Recovery planning and resolution remained an important area of focus for the Committee throughout 2025 •The Committee has periodically reviewed the Group’s recovery and resolution plans | •Prior to the Committee’s approval of the approach to the 2025 Recovery Plan, a dedicated training session on recovery and resolution was held. The recovery plan focused on updating the recovery stress scenarios and aligning these to recovery strategy to the stress scenarios used in the 2025 ICAAP •As part of the recovery plan, the Committee considered a comprehensive Trading Activity Wind Down (TWD) analysis, which uses the severe stress scenario to evaluate TWD stress •The approach to the Group’s Resolution Integrated Scenario Test was approved by the Committee in May 2025 and will take place in the first half of 2026 |
Emerging and topical risks | •Emerging risk and topical risk themes have been regularly monitored by the Committee during 2025 | •The Group’s approach to emerging risks has been refined further during 2025. In November, the Committee reviewed an updated register of emerging and topical risk themes |

Read full biography |
Key activities in 2025 | |
•Driving the Group’s ambitions to build a sustainable and inclusive future •Engaging our colleagues to deliver cultural change •Delivering on our duty to customers and stakeholders |

Membership and attendance at scheduled meetings | ||
Amanda Mackenzie (Committee Chair) | 4/4 | |
Sir Robin Budenberg | 4/4 | |
Sarah Legg | 4/4 | |
Chris Vogelzang | 1/11 | |
1Chris Vogelzang joined the Committee on 16 June 2025 Other attendees Sarah Bentley, an independent non-executive director of the Ring-Fenced Banks, attends meetings as an observer to provide insight on the Ring-Fenced Banks when required. The Group Chief Executive and, as appropriate, representatives from Group Audit also attend. | ||



Read full biography |
Key activities in 2025 | |
•Agreed a multi-year pay deal with a fixed award approach for the majority of our colleagues, which includes a £1,2001 pay award for 2026 and 2027 •Conducted a thorough review of the Directors’ Remuneration Policy to ensure it supports the Group’s strategic priorities •Completed an extensive shareholder consultation on executive remuneration |

Membership and attendance | ||
Cathy Turner (Committee Chair) | 6/6 | |
Sir Robin Budenberg | 6/6 | |
Amanda Mackenzie | 6/6 | |
Catherine Woods | 6/6 | |
Other attendees Nigel Hinshelwood and Sarah Bentley, the Senior Independent Director and an independent non-executive director respectively of the Ring-Fenced Banks, attend meetings as observers to provide insight on the Ring-Fenced Banks when required. In addition, the Committee engaged with and received updates from the Group Chief Executive, Chief People and Places Officer, Total Reward Director and the Chief Risk Officer. | ||


Reward structure change |

Group Chief Executive Charlie Nunn | Total maximum remuneration | ||
2025 | |||

100% | 140% | 300% | £9.1m | ||||
p | |||||||
£3.0m | |||||||

2026 | |||||||
300% | 500% | £13.9m | |||||
p | |||||||
£1.7m | |||||||
44% fixed pay reduction | |||||||
Chief Financial Officer William Chalmers | Total maximum remuneration | ||
2025 | |||

100% | 140% | 300% | £5.8m | ||||
p | |||||||
£1.9m | |||||||

2026 | ||||||||
250% | 450% | £8.0m | ||||||
p | ||||||||
£1.1m | ||||||||
44% fixed pay reduction | ||||||||
l | Base salary | l | Fixed share awards | l | Pension/ Benefits | l | Short term variable | l | Long term variable |
Group RoTE target progression within the LTIP |


2026 to 2028 | +2ppt | t 15% | 18% u |
2025 to 2027 | +1ppt | t 13% | 16% u |
2024 to 2026 | t 12% | 15% u |
ll | Performance range |
Group Chief Executive Charlie Nunn |




UK banking peer median | |
FTSE 30 peer median | |
LBG 2026 | |
LBG 2025 |
£1.8m | 260% | 520% |
£14.2m |
£11.0m |
£13.9m |
£9.1m |
£1.7m | 210% | 490% |
£1.7m | 300% | 500% |
£3.0m | 140% | 300% |
ll | Fixed pay | ll | Short-term variable | ll | Long-term variable | |||
Chief Financial Officer William Chalmers |

UK banking peer median | |
FTSE 30 peer median | |
LBG 2026 | |
LBG 2025 |
£1.2m | 235% | 435% |
£8.2m |
£5.9m |
£8.0m |
£5.8m |
£1.0m | 200% | 375% |
£1.1m | 250% | 450% |
£1.9m | 140% | 300% |
ll | Fixed pay | ll | Short-term variable | ll | Long-term variable | |||
 |
Cathy Turner Chair, Remuneration Committee |
Directors’ Remuneration Policy design process and approach to consultation | ||||||||||||||||
October to November 2024 | December 2024 | January 2025 | May to September 2025 | October to November 2025 | November 2025 | December 2025 | January to February 2026 | |||||||||

Consultation on 2025 fixed pay implementation |
Attendees Major institutional shareholders representing c.25% of the shareholder register Proxy rating agencies |
Board Governance Event |
Attendees Shareholders representing c.31% of the shareholder register attended the event |
Follow-up consultation on 2025 fixed pay implementation |
Attendees Proxy rating agencies |
Review of existing Policy and proposals for new Policy |
Consultation on 2026 proposed Policy |
Attendees Major institutional shareholders representing c.25% of the shareholder register Proxy rating agencies |
Remuneration Committee meeting to discuss investor feedback |
Letter issued setting out proposed Policy, feedback from initial consultation and inviting feedback |
Recipients Major institutional shareholders representing c.60% of the shareholder register |
Discuss further shareholder feedback and approve proposed Policy for shareholder vote at 2026 AGM |
Engaged with shareholders in response to feedback |

Strategy and Stakeholder key | ||||
Our reward outcomes reflect our strategic delivery and wider stakeholder experience as demonstrated by our Group balanced scorecard and Long Term Share Plan scorecard, as shown below. | ||||
2025 Single total figure of remuneration (£000) | ||||
Group Chief Executive Charlie Nunn | Chief Financial Officer William Chalmers | |||
The Group Chief Executive’s total remuneration for 2025 was £7.4 million, up 20% from 2024. The Chief Financial Officer’s total remuneration for 2025 was £5.0 million, an 18% increase from the previous year. The year-on-year increases were primarily driven by fixed pay changes implemented in 2025, described in detail on page 106, higher short-term variable reward outcomes of 74.0% of maximum compared to 68.1% in 2024 and finally the share price appreciation linked to the vesting of the long-term variable awards which benefitted from share price increase over the period from 52 to 91 pence. For full details please see page 109. | ||||
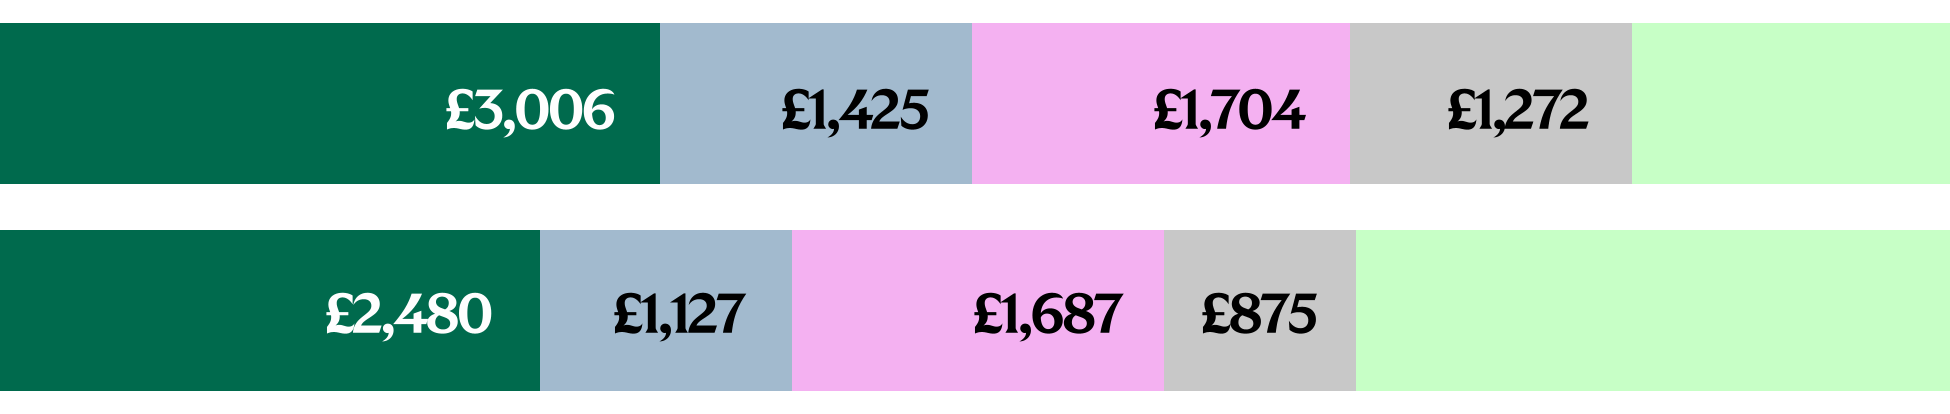

2025 |
2024 |
Total £7,407 |
Total £6,169 |
Total £4,976 |
Total £4,212 |
2025 |
2024 |
l | Fixed | l | Short Term Variable | l | Long Term Variable | l | Value from share price appreciation | |||
2025 Group balanced scorecard outcome | ||||||
Financial (60%) | Profit after tax | 21.8% / 25% | ||||
Return on tangible equity | 22.1% / 25% | |||||
Operating costs | 5.8% / 10% | |||||
Non-financial (40%) | Group customer dashboard | 13% / 20% | ||||
Reducing our operational carbon emissions | 5% / 5% | |||||
Increasing gender and ethnic representation in executive roles | 6.75% / 7.5% | |||||
Culture and colleague engagement | 7.5% / 7.5% | |||||
Mechanical balanced scorecard outcome | 81.9% | |||||
Discretionary Committee adjustment | -7.9 | |||||
Revised balanced scorecard outcome | 74.0% | |||||
2023 Long Term Share Plan outcome | ||||||
Financial (100%) | CET1 ratio – Group CET1 ratio above the guided management target each year, including all regulatory buffers | Met | ||||
RoTE – Group RoTE exceeds the average for UK peer banks over the three years | Met | |||||
Ordinary dividend – Increased ordinary dividend payments over the plan period | Met | |||||
Award (% max) vesting | 100% | |||||
2025 Group Performance Share pool | ||||
The underlying profitability of the Group is the key driver of our GPS pool, ensuring strong pay-for-performance alignment. The Group BSC is also considered in setting the pool and therefore the final outcome considers our strategic delivery and wider stakeholder experience. The Committee determined a pool for 2025 of £405 million, up 10% from 2024, recognising increased underlying performance. | ||||
10% |

2025 |
2024 |
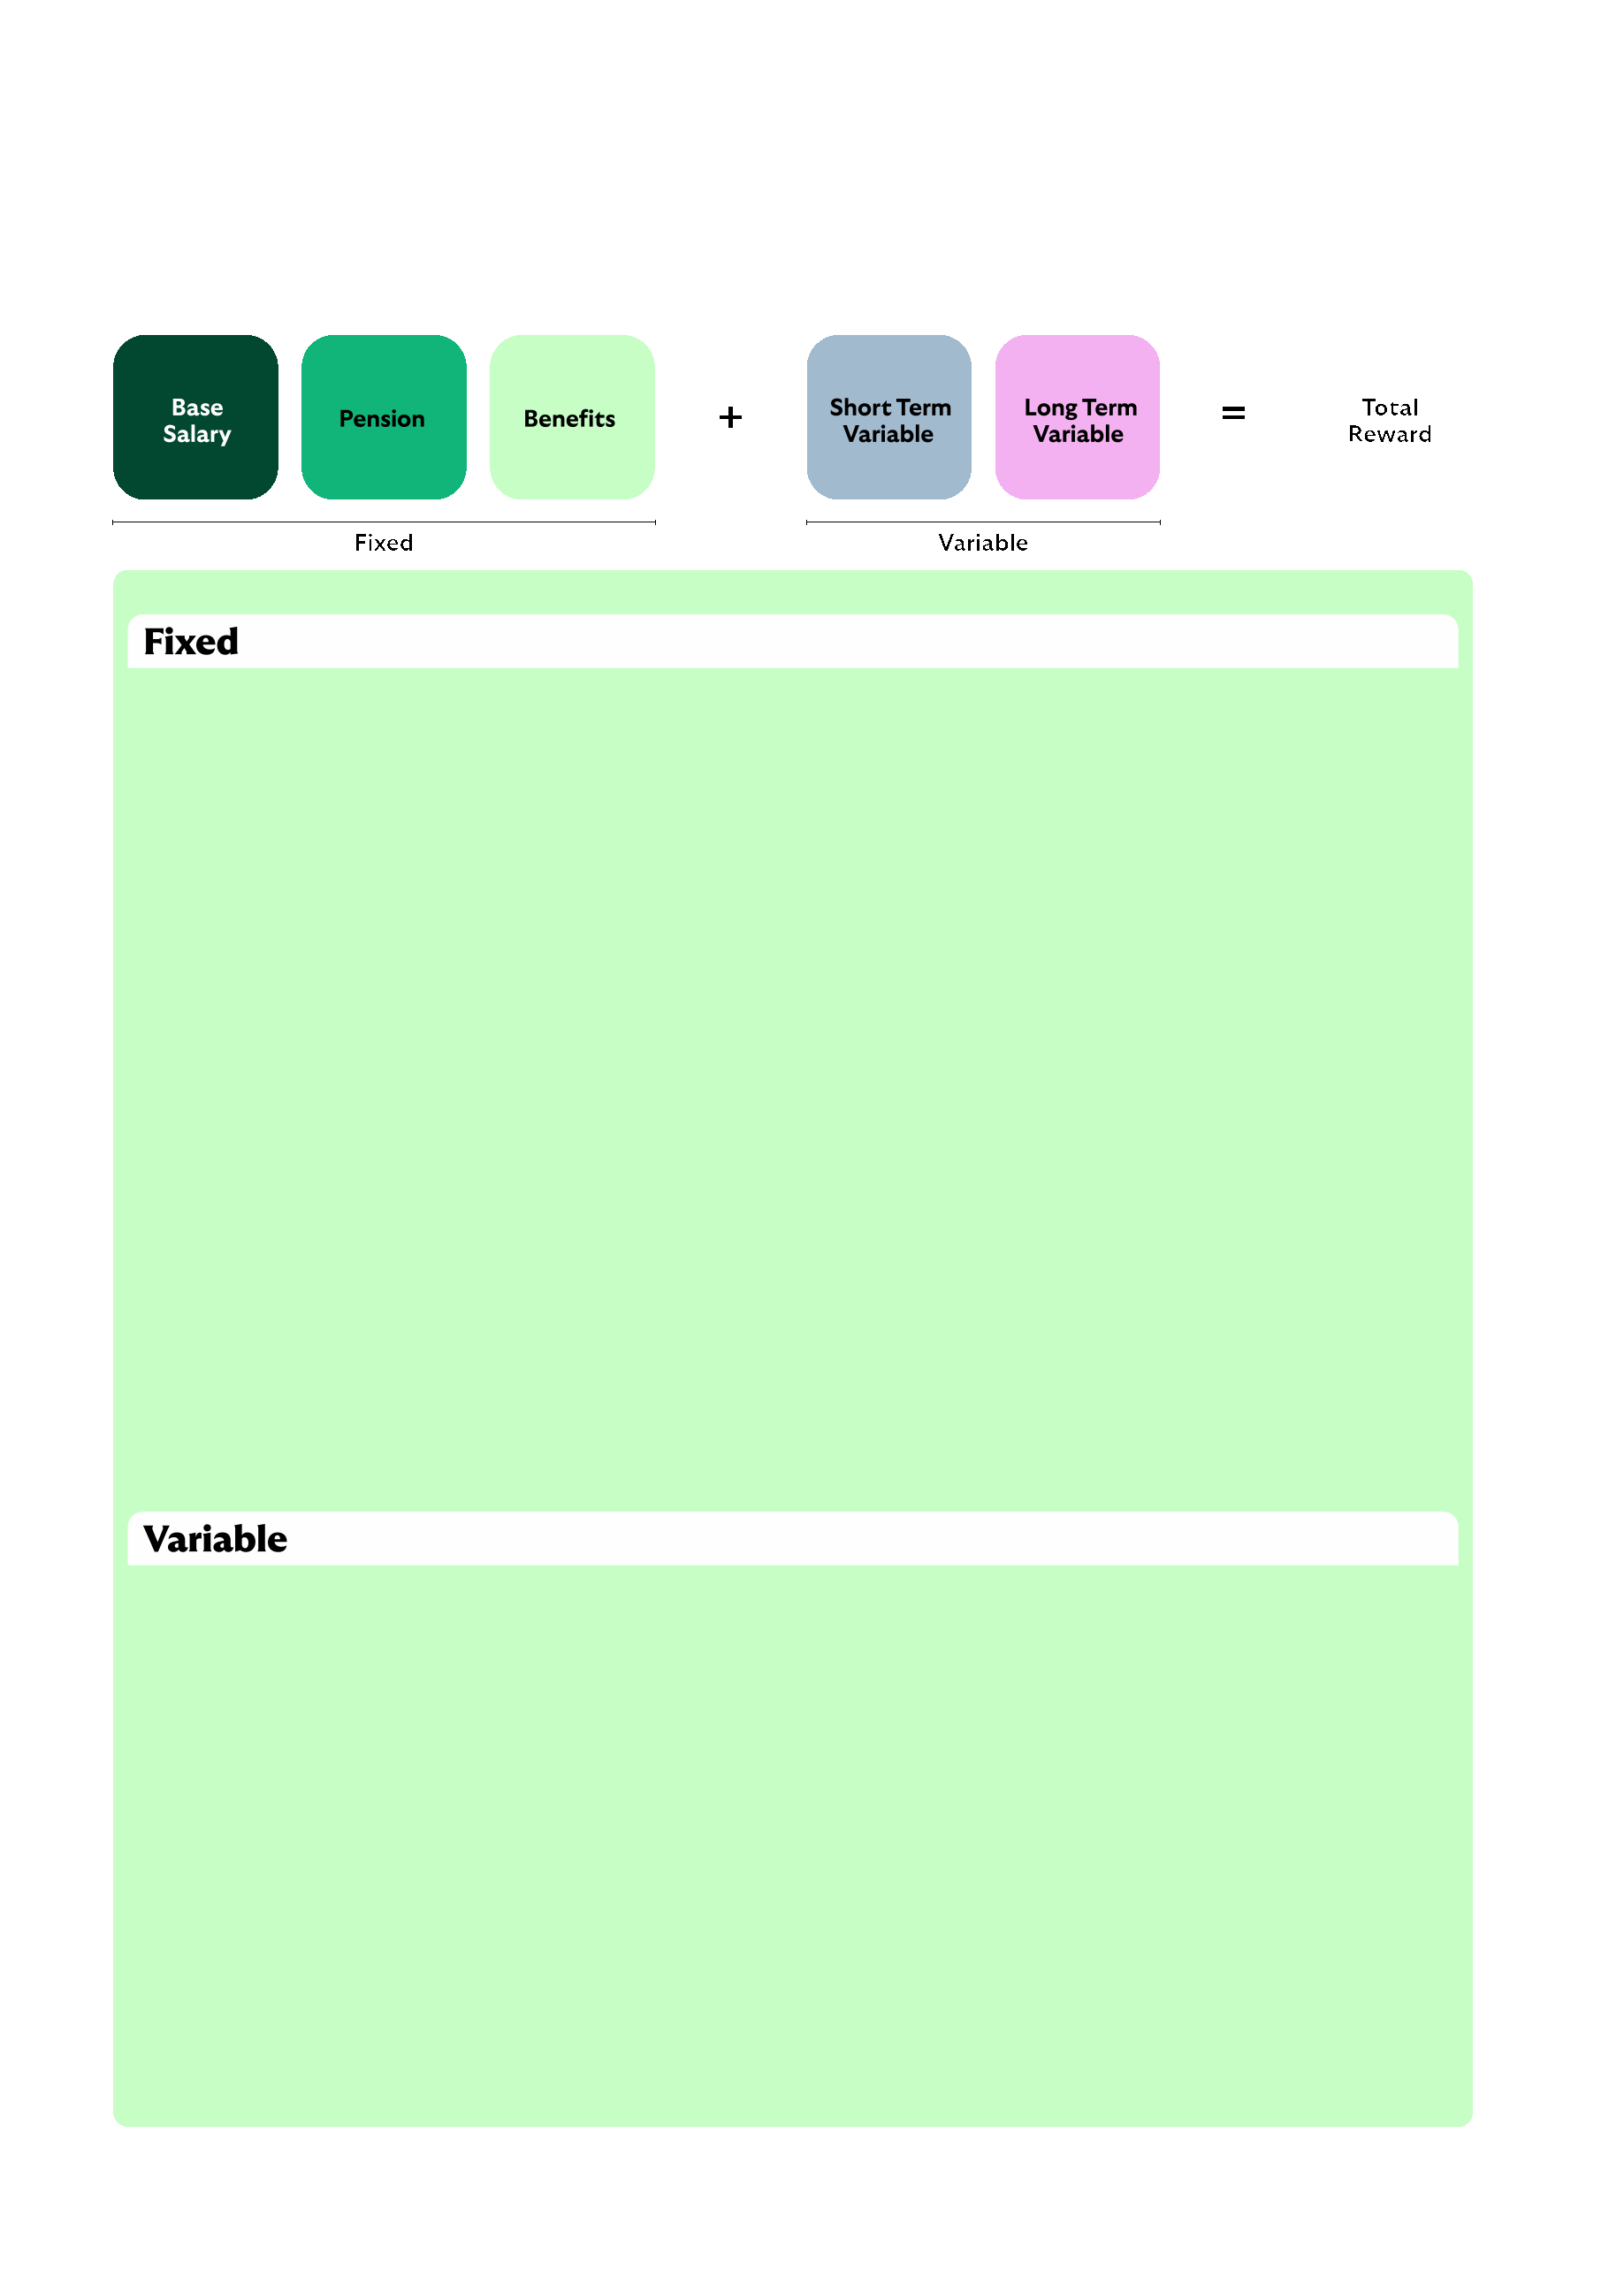
Current 2023 Policy | Proposed changes in 2026 Policy and rationale |
 Base Salary | •Reflective of individual role, taking account of responsibilities, experience and pay in the wider Group •Base salaries are typically reviewed annually with any increases normally taking effect from 1 April for executive directors | No change to Policy. | |||
 Fixed Share Award | •Delivered entirely in Lloyds Banking Group shares, released over three years with 33% being released annually following the year of the award •The maximum award is 100% of base salary | Change: •Fixed share awards have been removed from the 2026 Policy Why: To set fixed pay at an appropriate level in line with market standard for executive directors and further align executive remuneration with stakeholder experience. | |||
 Pension | •Provides cost-effective and market competitive retirement benefits •Maximum allowance for executive directors is 15% of salary, aligned with that available to the majority of the workforce | Change: •Maximum allowance of 10% of salary for executive directors Why: To set fixed pay at an appropriate level in line with market standard for executive directors. This will move from being in line with to less than the majority of the wider workforce. | |||
 Benefits | •Flexible benefit allowance of 4% of salary •Other benefits include medical insurance, car allowance and transportation | Change: •Flexible benefit allowance has been removed •Car allowance has been removed Why: To align executive director remuneration package with the wider workforce where these allowances were consolidated in previous years and to set fixed pay at an appropriate level. | |||
 Group Performance Share (Short Term Variable) | •Maximum opportunity of 140% of salary for executive directors, with normal target level at 50% of maximum opportunity •Performance adjustment including malus and clawback provisions apply | Change: •Maximum opportunity of 300% of salary for GCE and 250% for other executive directors Why: To place further emphasis on a high-performing culture and create a stronger link between performance, reward, and the creation of shareholder value. The increase in maximum variable reward opportunity should be considered alongside the reduction in fixed pay described above. | |||
 Long Term Incentive Plan (Long Term Variable) | •The maximum LTIP opportunity is 300% of salary for all executive directors •A minimum of 50% of the award being dependent on financial measures •Performance adjustment including malus and clawback provisions apply | Change: •Maximum opportunity of 500% of salary for GCE and 450% for other executive directors •A minimum of 75% of the award being dependent on financial measures Why: To place further emphasis on a high-performing culture and create a stronger link between performance, reward, and the creation of shareholder value. The increase in maximum variable reward opportunity should be considered alongside the reduction in fixed pay described above. |
| Committee activities in the year | | ||||
Jan | Feb | May | Sep | Nov | Dec | |
Executive directors’ remuneration | ||||||
Executive directors’ fixed pay proposals | l | ¡ | ¡ | l | ¡ | ¡ |
Executive directors’ performance and variable remuneration | l | l | ¡ | l | l | l |
Directors’ remuneration report | l | l | ¡ | ¡ | ¡ | l |
Directors’ Remuneration Policy design | ¡ | ¡ | ¡ | l | l | l |
All employee remuneration | ||||||
Fixed pay proposals | ¡ | ¡ | ¡ | l | l | ¡ |
Group performance and GPS pool | l | l | l | l | l | l |
Employee insights | ¡ | l | ¡ | ¡ | ¡ | ¡ |
Remuneration for other senior executives | l | l | ¡ | ¡ | ¡ | l |
Reward governance | ||||||
Consideration of policy and conduct matters | l | l | l | l | l | l |

| Statement of voting at annual general meeting | | ||||
The table below sets out the voting outcome at the annual general meeting in May 2025 in relation to the annual report on remuneration. The Directors' Remuneration Policy was subject to a binding vote at the annual general meeting in May 2023. | |||||||
Votes cast in favour | Votes cast against | Votes withheld | |||||
Number of shares (millions) | Percentage of votes cast | Number of shares (millions) | Percentage of votes cast | Number of shares (millions) | |||
2024 annual report on remuneration (advisory vote) | 37,913 | 94.23% | 2,323 | 5.77% | 28 | ||
Directors’ Remuneration Policy (binding vote in 2023) | 39,002 | 96.00% | 1,623 | 4.00% | 68 | ||
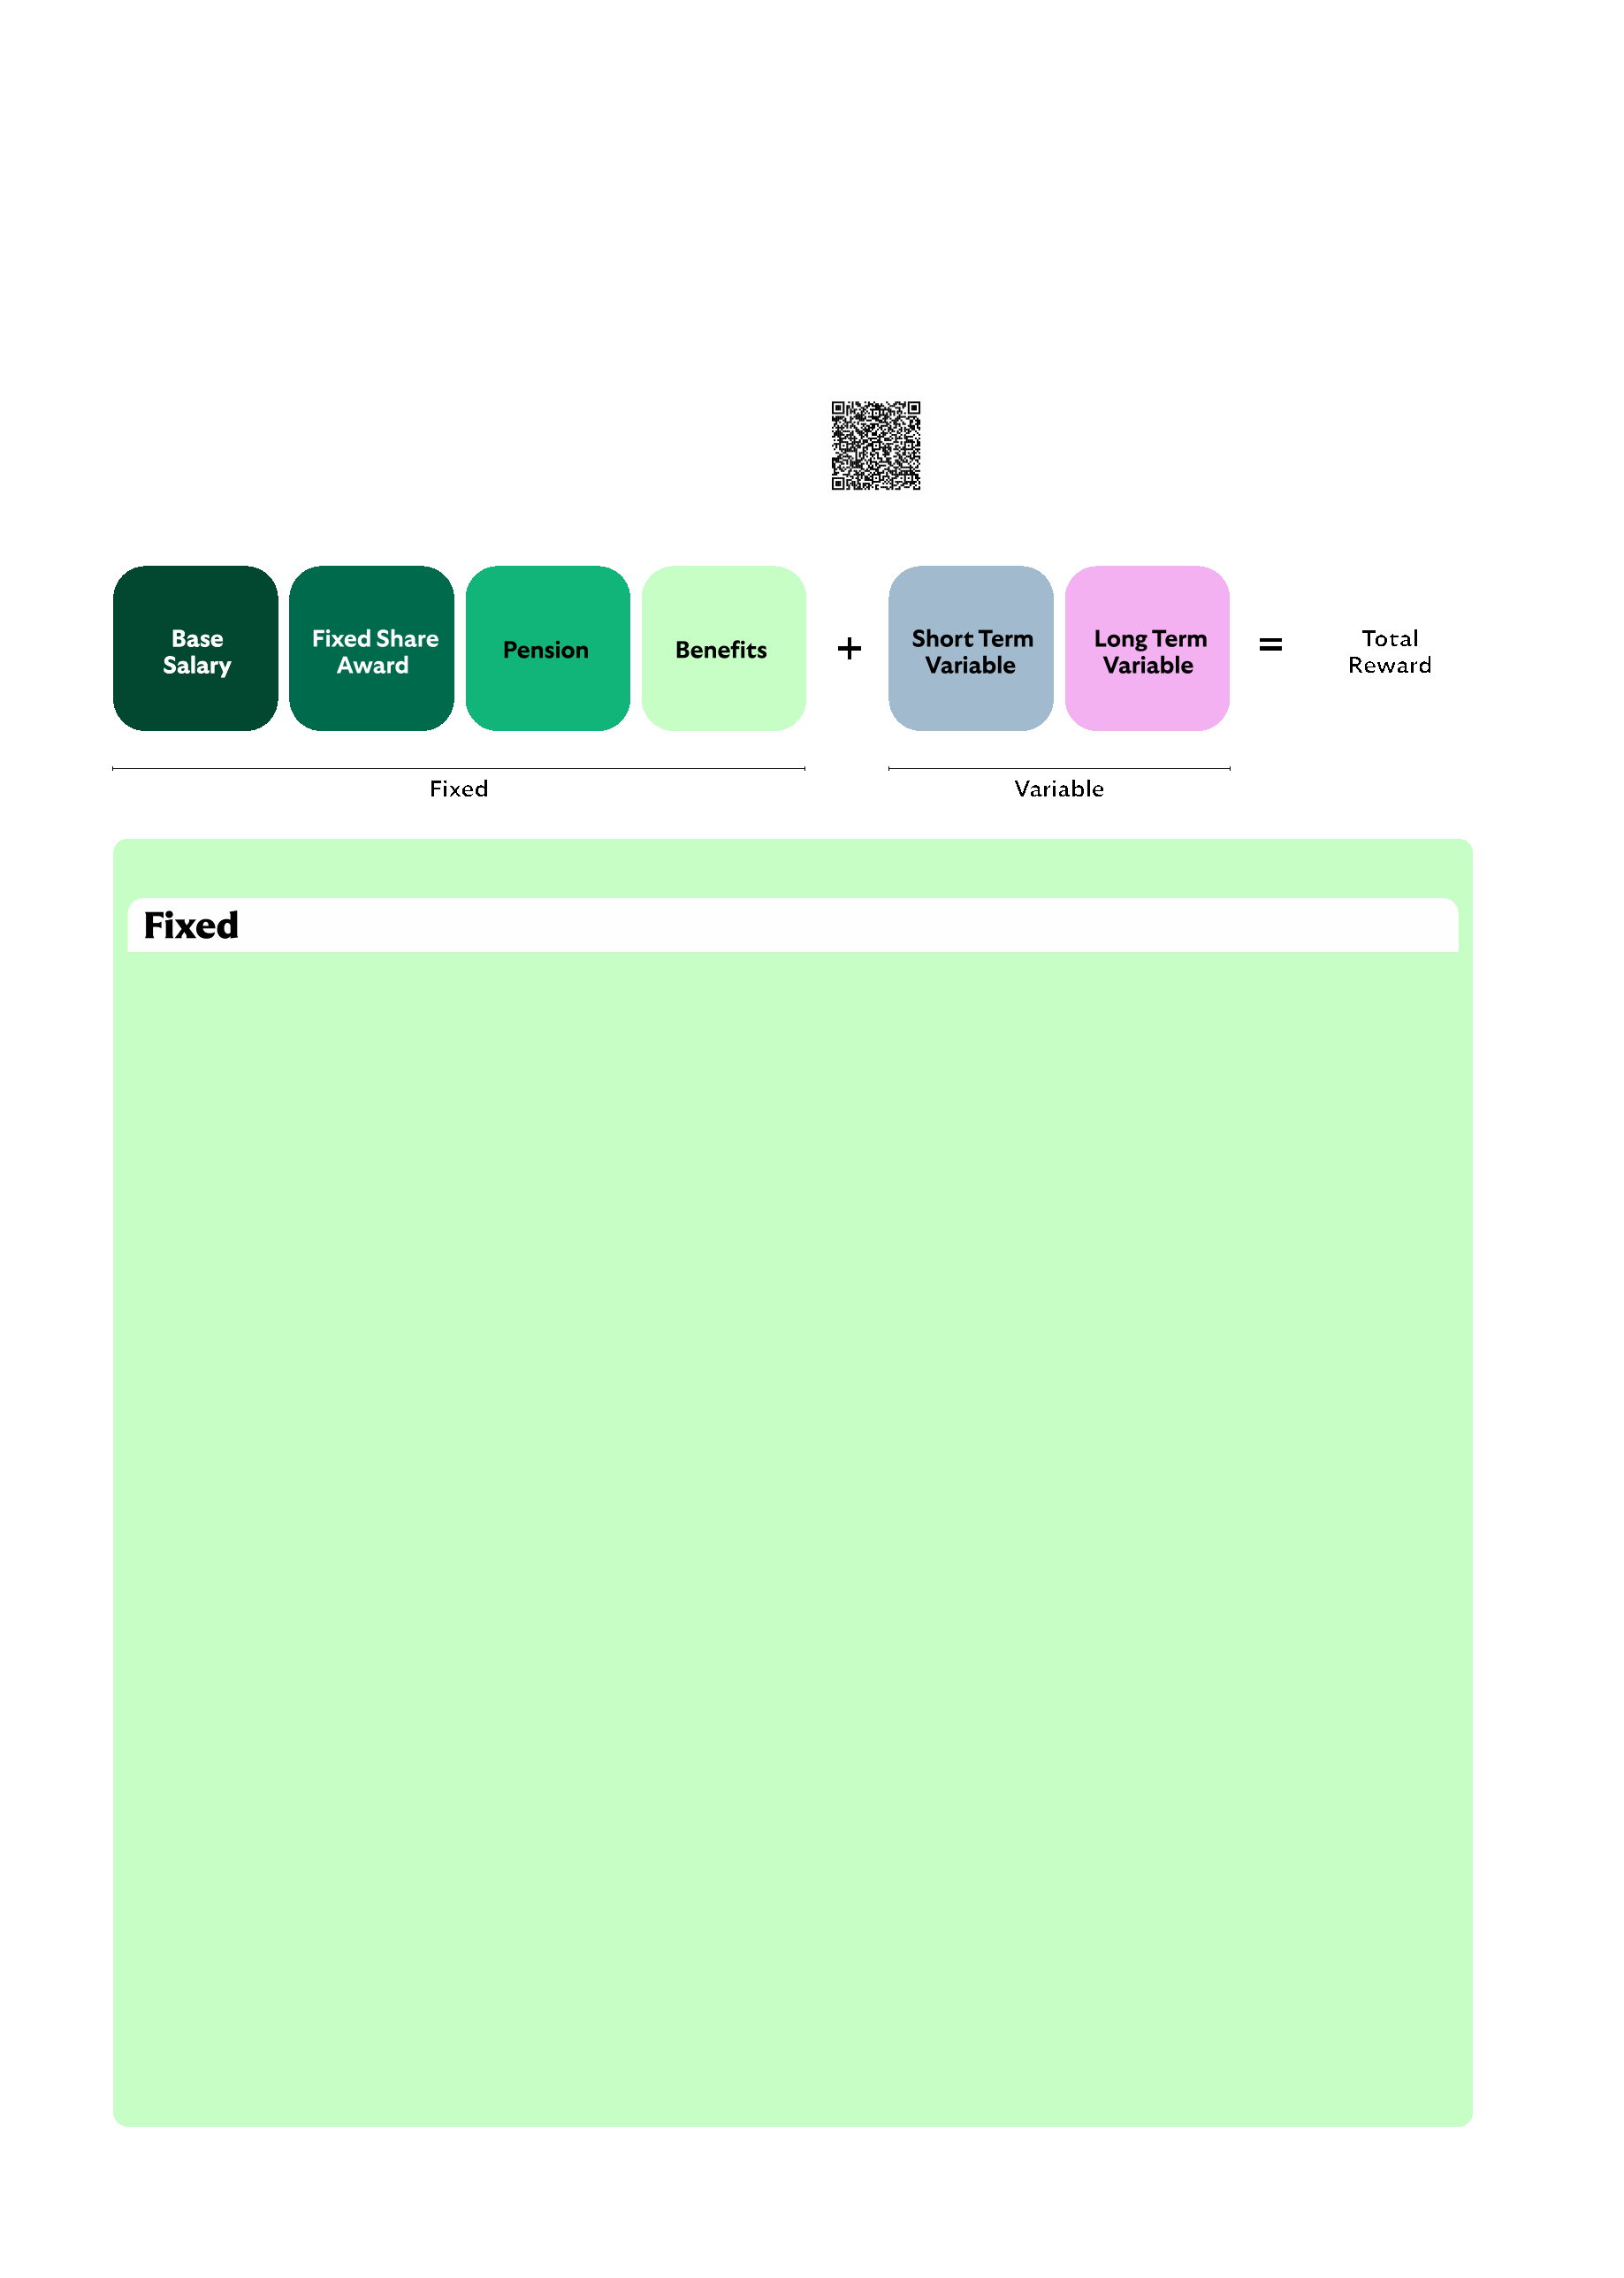
Read more 2023 Directors’ Remuneration Policy in full |
Directors’ remuneration | Wider workforce alignment |
Base Salary | •Base salaries are reviewed annually with increases typically taking effect from 1 April •Increases will normally be no more than the increase awarded to the overall employee population With effect from 1 January 2025, the 13% discount applied to the GCE’s salary on appointment was reversed, taking his salary to £1,335,321, and from 1 April 2025, salaries for the executive directors increased by 3%, less than the wider workforce, to £1,375,381 for the GCE and £877,254 for the CFO. | The pay deal for the wider workforce in 2025 reflected a 4.1% budget. The approach focused on lower paid colleagues with junior colleagues receiving a minimum £1,500 award in 2025 (pro-rated for reduced hours). | |||
Fixed Share Award | •Delivered entirely in Lloyds Banking Group shares, released over three years with 33% being released annually following the year of the award •The maximum award is 100% of base salary From 1 January 2025, fixed share awards were increased to align with the executive directors salaries. | To maintain an appropriate balance between fixed and variable remuneration, and to further align the interests of executive directors and shareholders, a portion of fixed pay was delivered in the form of shares. Fixed share awards were only granted to the GCE and the CFO. | |||
Pension | •The maximum allowance for executive directors is set at 15% of base salary •Any director may elect to receive some or all of their pension allowance as cash in lieu of pension Pension allowances for all executive directors for 2025 was set at 15% of base salary. | The maximum allowance for all executive directors for 2025 was set at 15% of base salary in line with the majority of the workforce. | |||
Benefits | Benefits may include those currently provided and disclosed in the annual report on remuneration. Core benefits include a company car or car allowance, private medical insurance, life insurance and other benefits that may be selected through the Group’s flexible benefits plan. Benefits for 2025 were unchanged from 2024. Executive directors received a flexible benefit allowance of 4% of base salary. The CFO also received a car allowance. | Flexible benefit allowance of 4% of base salary was consolidated into base salary in July 2023 for colleagues, simplifying their reward package and benefitting from pension contribution entitlement. |

Directors’ remuneration | Wider workforce alignment |
Group Performance Share (Short Term Variable) | •The normal ‘target’ level of the GPS is 50% of maximum opportunity •The maximum GPS opportunity is 140% of salary for the executive directors The GCE and CFO received 2025 GPS awards of 74.0% of maximum in line with The Group’s policy is to apply deferral to variable reward in line with minimum regulatory requirements. However, to recognise market practice and shareholder expectations for executive directors, we will apply deferral to 2025 annual bonus awards above our Policy minimum. Our default position is to award GPS 50% in cash and 50% in shares released over three years in equal tranches; however, as both executive directors have met their respective shareholding requirements we will award 75% in cash and 25% in shares released over three years in equal tranches. | All Group employees are eligible to receive an award through the Group Performance Share scheme. The Committee determined a GPS pool of £405 million for 2025. | |||
Long Term Incentive Plan (Long Term Variable) | •Awards will be granted in the form of conditional rights to shares in the Group •The maximum LTIP opportunity is 300% of salary for the executive directors 2025 LTIP awards were granted in March 2025 at 300% of salary for executive directors. Awards were deferred over seven years to be released in five equal tranches, each with a one-year hold. | The wider workforce are not eligible for LTIP awards, consistent with market practice. |
| | Deferral of variable remuneration and holding periods | ||||||
The GPS and LTIP are both considered variable remuneration for the purpose of regulatory and deferral requirements. Deferral levels are determined at the time of award in compliance with regulatory requirements which currently require that, for executive directors, at least 40% of the first £660,000 of total variable remuneration and 60% | of any excess to be deferred for up to four years with pro-rata vesting, at least 50% of total variable remuneration to be delivered in shares or equity-linked instruments and where a portion of variable remuneration is delivered upfront and in shares it is subject to a minimum one-year holding period. | |||||||
| | Performance adjustment | Judgement on individual performance adjustment is informed by taking into account the severity of the issue, the individual’s proximity to the issue and the individual’s behaviour in relation to the issue. Individual adjustment may be applied through adjustments to balanced scorecard assessments and/or through reducing the variable remuneration outcome. Awards are subject to clawback for a period of up to seven years after the date of award, which may be extended to ten years where there is an ongoing internal or regulatory investigation. The Committee has considered the time period of up to ten years and believes that is an appropriate length of time for performance adjustment to apply. The application of clawback will generally be considered when: •There is reasonable evidence of employee misbehaviour or material error •There is material failure of risk management at a Group, business area, division and/or business unit level | |||||
Performance adjustment may result in a reduction of up to 100% of the variable remuneration opportunity for the relevant period. It can be applied on a collective or individual basis. The application of malus will generally be considered when: •There is reasonable evidence of employee misbehaviour or material error or that they participated in conduct which resulted in losses for the Group or failed to meet appropriate standards of fitness and propriety •There is material failure of risk management •The Committee determines that the financial results for a given year do not support the level of variable remuneration awarded •Any other circumstances where the Committee consider adjustments should be made | ||||||||
| 2023 Directors’ Remuneration Policy and Group remuneration policy alignment | | ||||
Executive directors | Group Executive Committee | Other material risk takers | Other employees | |
Fixed | ||||
Base salary | l | l | l | l |
Fixed share award / Role-based allowance | l | l | l | ¡ |
Pension and benefits  | l | l | l | l |
Variable | ||||
Short term incentive | l | l | l | l |
Long term incentive | l | l | ¡ | ¡ |

Read more A guide to life at Lloyds Banking Group |
| Sharesave | |

| Sharematch | |
Sharematch allows our colleagues to invest in Lloyds Banking Group shares in a tax-efficient way. For every two shares bought, we give three matching shares completely free up to a maximum colleague investment of £30 per month. This allows our colleagues to share in the success of the Group through share price growth as well as dividend income. 59% of colleagues participate in Sharematch | ||
| | |
| Colleague Sustainable Cars | |
Colleague Sustainable Cars is a salary sacrifice scheme that enables colleagues to drive a brand-new Ultra Low Emission Vehicle (ULEV) through a reduction in salary. In 2025 we partnered with Tusker, the Group’s own specialist in salary sacrifice schemes, and will now offer only Zero Emission Vehicles (ZEV), further reducing our environmental impact and improving urban air quality in support of the Group’s sustainability ambitions. >4,200 cars As of 31 December 2025, the scheme has grown to 4,213 cars since its launch in 2021, making it one of the largest in the UK private sector | ||
| | |
| Colleague wellbeing including Bupa cover | |
| Colleague engagement survey – reward | |
We ask our colleagues a simple question each year – “Overall, I believe my reward package fairly reflects my role.” 67% of colleagues answered this favourably (up 3 points from 2024 and 19 points above the financial services industry average) | ||
| | |
| Executive director single total figure of remuneration (audited) | | |||||
Charlie Nunn | William Chalmers | ||||||
£000 | 2025 | 2024 | 2025 | 2024 | |||
Base salary | 1,365 | 1,170 | 871 | 844 | |||
Fixed share award1 | 1,365 | 1,082 | 871 | 519 | |||
Benefits | 71 | 52 | 48 | 63 | |||
Pension | 205 | 176 | 131 | 127 | |||
Total fixed pay | 3,006 | 2,480 | 1,921 | 1,553 | |||
Group Performance Share2 | 1,425 | 1,127 | 909 | 812 | |||
Long-term incentive3,4 | |||||||
–Value excluding share price appreciation | 1,704 | 1,687 | 1,228 | 1,216 | |||
–Share price appreciation | 1,272 | 875 | 917 | 631 | |||
Total variable pay | 4,401 | 3,689 | 3,054 | 2,659 | |||
Other remuneration5 | – | – | 1 | – | |||
Total remuneration | 7,407 | 6,169 | 4,976 | 4,212 | |||
Less: Performance adjustment6 | – | – | – | – | |||
Total remuneration less performance adjustment | 7,407 | 6,169 | 4,976 | 4,212 | |||
| 2025 pension and benefits (audited) | | |||
£ | Charlie Nunn | William Chalmers | |||
Pension/Benefits | |||||
Pension | 204,805 | 130,630 | |||
Car or car allowance1 | 14,718 | 12,000 | |||
Flexible benefits payments | 54,615 | 34,835 | |||
Private medical insurance | 1,205 | 1,205 | |||
Subtotal for Total Benefits less pension | 70,538 | 48,040 | |||

Our 2025 Group balanced scorecard |

Financial (60%) | Profit after tax1 | 25% | £4,054m | £5,712m | £5,428m | 87% | 21.8% | |||||||||
Return on tangible equity1 | 25% | 11% | 15.5% | 14.8% | 88% | 22.1% | ||||||||||
Operating costs2 | 10% | £9,411m | £9,132m | £9,288m | 58% | 5.8% | ||||||||||
Non-financial (40%) | Group customer dashboard | 20% | 25 | 100 | 65 | 65% | 13.0% | |||||||||
Reducing our operational carbon emissions3 | 5% | 27% | 36% | 39% | 100% | 5.0% | ||||||||||
Increasing our gender & ethnic representation in executive roles4 | 3.75% | 36.0% | 42.0% | 40.4% | 80% | 3.00% | ||||||||||
3.75% | 14.4% | 16.1% | 17.5% | 100% | 3.75% | |||||||||||
Culture and colleague engagement | 7.5% | 60% | 75% | 75% | 100% | 7.5% | ||||||||||
Mechanical balanced scorecard outcome | 81.9% | |||||||||||||||
Discretionary Committee adjustment | -7.9 | |||||||||||||||
Revised balanced scorecard outcome | 74.0% | |||||||||||||||
1Profit after tax and return on tangible equity measures exclude the £800 million provision in 2025 in relation to motor finance commission arrangements. 2Operating costs exclude remediation and in-year GPS expense. | 3Reducing our operational carbon emissions excludes international travel. 4Executive roles include grade X colleagues only, subject to local laws and regulation. | |||||||||||||||
Charlie Nunn – Group Chief Executive | |||
Maximum award | £1,925,533 | ||
Group balanced scorecard outcome | 74.0% | ||
Annual GPS award | £1,424,895 | ||
•Continued delivery of the Group’s strategy, financial targets, investment priorities, and market share growth in priority areas, which will set the Group up for success in 2026, the final year of the first strategic phase •Demonstrated strong leadership throughout another challenging year for consumers, proactively managing risk issues and the strategic direction of the Group •Worked closely with the UK Regulators and UK Government on several key areas (e.g. motor finance and UK growth ambitions) •Group financials remain robust, with the Group delivering 2025 and on-track for 2026, driven by strong income performance, strategic delivery, and effective risk management – contributing to the strong share price performance in 2025 | |||
William Chalmers – Chief Financial Officer | |||
Maximum award | £1,228,156 | ||
Group balanced scorecard outcome | 74.0% | ||
Annual GPS award | £908,835 | ||
•Played a critical role in the execution of the Group’s strategy and maintained positive engagement with investors and regulators on the Group’s performance and strategic direction •Strong financial and risk management, delivering the plan throughout 2025 and on-track for 2026 commitments, with continued focus on cost and investment management, alongside net interest income and other operating income growth •Sustained strength in financial performance and strong capital, funding, and balance sheet growth, enabling strong share price performance in 2025, a 15% increase in dividend and an increased buyback | |||

| Non-financial measures (40% weighting) commentary | | ||||
Measure | Link to strategy | Link to stakeholder | Commentary |
Group customer dashboard 20% weighting Our assessment of how effectively we are serving customers across our brands, products and services. It brings together survey based measures (such as net promoter score and customer satisfaction) and operational indicators (including digital engagement and performance of key customer journeys). | |  | •The 2025 dashboard contains 135 measures spanning products, services, customer segments and business areas, with 46 driving the overall outcome within the Group balanced scorecard •The 2025 score is 65, on a 0-100 scale, with the score moving up or down depending on how many measures exceed or fall short of stretching targets at an aggregated level. This means less favourable performance in some areas can be offset by strong performance in others, and vice versa •We have made good progress on our strategic transformation, with performance on 64% of measures improved or maintained year-on-year. However, we have seen an increase in customer complaints reflective of broader market changes and a small decline in our net promoter scores with customers telling us that there is more we can do to improve mobile app journeys and experiences, finding support when needed and making their money work harder for them |
 | |||
Reducing our operational carbon emissions 5% weighting Reported vs 2018/2019 baseline. Includes Scope 1, Scope 2 and Scope 3 carbon emissions, excluding international travel. Reporting year is October to September. | |  | •A 39% reduction has been achieved year to date from our 2018/19 baseline, demonstrating continued strong progress in reducing the Group’s operational carbon footprint •Performance has been supported by improved energy management practices, investment in more efficient office spaces and colleagues making conscious decisions to travel less frequently and in more sustainable, lower emission modes of transport •These actions underpin our pathway to net zero carbon operations by 2030 and our ambition to reduce energy use by 50% |
Increasing our gender and ethnic representation in executive roles 7.5% weighting Executive roles include grade X colleagues only, subject to local laws and regulation. | |  | •We have seen an increase in women in executive roles to 40.4% during 2025. This is against our ambition to achieve 45% to 55% women in executive roles by year end 2030 •Throughout 2025, we also saw continued improvement in the representation of Black, Asian and Minority Ethnic colleagues in executive positions. At year end, 17.5% of executive roles were held by Black, Asian and Minority Ethnic colleagues, representing strong progress toward our ambition of reaching 19% to 22% by 2030 |
Culture and colleague engagement 7.5% weighting Our employee engagement index score. | | | •Our employee engagement index (EEI) encompasses pride and satisfaction working for the Group, and also recommending the Group as a great place to work •Our 2025 EEI results highlight our supportive and inclusive culture, alongside the opportunities for learning, development and internal mobility that shape colleagues’ experiences at the Group. A key factor driving the year-on-year improvement in engagement was colleagues’ increased confidence in our reward and benefits package, which many cite as an important reason for staying with the Group |
Measuring customer experience across five priority pillars. | Across the Group’s trusted brands | |||||||||||||||||||||||||
How did customers feel about the brand? | Were our propositions compelling? | Did we deliver on service expectations? | Did we attract new customers? | Did we deepen relationships? | ||||||||||||||||||||||
Link to strategy | | Link to strategy | | Link to strategy | | Link to strategy | | Link to strategy | | |||||||||||||||||
See page 07 | ||||||||||||||||||||||||||

Pre-vest test – underpins |
Financial (100%) | CET1 ratio – Group CET1 ratio above the guided management target each year (c.13.5% by 2024 and c.13.0% by 2026), including all regulatory buffers | 2023 | 13.7% | Met | |||||
2024 | 13.5% | ||||||||
2025 | 13.2% | ||||||||
RoTE – Group RoTE exceeds the average for UK peer banks1 over the three years. Average RoTE for peer banks: 11.9% (2023), 11.6% (2024) and 11.8% (20252) | 2023 | 15.8% | Met | ||||||
2024 | 12.3% | ||||||||
2025 | 12.9% | ||||||||
Ordinary dividend – Increased ordinary dividend payments over the plan period (subject to any further sector-wide regulatory constraints). Starting point in 2022 was a dividend of 2.40p | 20233 | 2.76p | Met | ||||||
20243 | 3.17p | ||||||||
20253 | 3.65p | ||||||||
Award (% maximum) vesting | 100% |
1Peers: Barclays Group, HSBC Holdings, NatWest Group, Santander UK and Virgin Money UK. 22025 peer bank average based on latest company published consensus as of 5 February 2026 where full-year results not available. In October 2024, Nationwide completed its acquisition of Virgin Money; therefore no Virgin Money UK 2025 RoTE available. Instead, 2024 RoTE has been used as a proxy. 3Dividend shown includes both interim and final for the respective performance year. For 2025, this is the proposed final dividend. |
Pre-vest test – additional consideration by the Committee | |||||
In conjunction with the assessment of performance against the financial underpins above, the Committee considered the four questions below to satisfy itself that there is nothing known now which, had it been known at the time of grant, would have changed the initial award levels: | The Group continues to make meaningful progress in supporting the UK’s transition to a low carbon economy. Our progress is monitored through updates and deep dives at a Group Executive Committee and Board level providing visibility of achievements, learnings, and the external dependencies shaping the Group’s transition pathway and performance. Progress against our During the 2023 to 2025 performance period, there have been no serious external conduct matters or severe reputational damage. While there continues to be uncertainty around motor finance issue, the Committee has determined that it should not impact the 2023 LTSP vesting outcome. The Committee concluded that performance considered in the ‘pre-grant test’ has been sustainable and therefore no discretion has been applied. The 2023 LTSP awards will vest at 100%, as the outcome represents a fair reflection of performance during the period. | ||||
Q | Has the Bank lived up to its ambition to be the Best Bank for Customers? | ||||
Q | Do the Group’s financial results and capital position adequately reflect risk, conduct and any other non-financial considerations, including ESG? | ||||
Q | Has the Group made meaningful progress in supporting the UK’s transition to net zero? | ||||
Q | Has the Group suffered a serious conduct event or has severe reputational damage arisen from the Group not living its values? | ||||
A | The Group has maintained its strong capital position and delivery for customers, communities and shareholders since making awards in 2023. Risk management is essential to our business model and strategy, helping us to embrace opportunities responsibly and drive sustainable growth for the Group. | ||||
| Relative importance of spend on pay | | ||
Dividend and share buyback1 £bn |
7% |


2025 | ||
2024 |
Salaries and performance-based compensation2 £bn |
0% |

2025 | ||
2024 |
Historical TSR Performance Growth in the value of a hypothetical £100 holding since 31 December 2015 (to 31 December 2025) |
Lloyds Banking Group | FTSE 100 Index | ||
Value of £100 invested on 31 December 2015 | 250 | ||||||||||||
200 | |||||||||||||
150 | |||||||||||||
100 | |||||||||||||
50 | |||||||||||||
0 | |||||||||||||
| | | | | | | | | | | | | | | | | | | | | | |||
Dec 2015 | Dec 2016 | Dec 2017 | Dec 2018 | Dec 2019 | Dec 2020 | Dec 2021 | Dec 2022 | Dec 2023 | Dec 2024 | Dec 2025 | |||

| Group Chief Executive remuneration over the last ten years | | ||||
Group Chief Executive | Sir António Horta-Osório1 | William Chalmers2 | Charlie Nunn3,4 | |||||||||||||
Year | 2016 | 2017 | 2018 | 2019 | 2020 | 2021 | 2021 | 2021 | 2022 | 2023 | 2024 | 2025 | ||||
GCE single figure of remuneration £000 | 5,791 | 6,434 | 6,544 | 4,424 | 3,604 | 2,444 | 819 | 5,523 | 3,767 | 3,681 | 6,169 | 7,407 | ||||
Annual bonus/GPS payout (% of maximum opportunity) | 77% | 77% | 67.6% | n/a | n/a | 57.8% | 78.2% | 57.8% | 84.1% | 80.3% | 68.1% | 74.0% | ||||
Long-term incentive vesting (% of maximum opportunity) | 55% | 66.3% | 68.7% | 49.7% | 33.75% | 41.8% | n/a | n/a | n/a | n/a | 100% | 100% | ||||
| Single total figure of remuneration and shareholding for Chair and non-executive directors (audited) | | ||||||||||||
Fees (£000) | Benefits (£000)4 | Total (£000) | Total shareholding5 | |||||||||||
2025 | 2024 | 2025 | 2024 | 2025 | 2024 | at 31 December 2025 | ||||||||
Chair and non-executive directors | ||||||||||||||
Sir Robin Budenberg | 750 | 655 | 1 | 1 | 751 | 656 | 2,500,000 | |||||||
Nathan Bostock | 359 | 140 | 4 | – | 363 | 140 | 430 | |||||||
Sarah Legg | 254 | 232 | 6 | 13 | 260 | 245 | 200,000 | |||||||
Amanda Mackenzie | 239 | 219 | 3 | 3 | 242 | 222 | 63,567 | |||||||
Harmeen Mehta | 117 | 106 | 7 | 5 | 124 | 111 | 20,000 | |||||||
Cathy Turner | 285 | 277 | 3 | 2 | 288 | 279 | 424,113 | |||||||
Chris Vogelzang1 | 77 | – | 1 | – | 78 | – | 80,500 | |||||||
Scott Wheway2 | 407 | 475 | 18 | 17 | 425 | 492 | 168,356 | |||||||
Catherine Woods3 | 264 | 250 | 12 | (9) | 276 | 241 | 124,262 | |||||||
| Directors’ share interests and share awards (audited) | | ||||||||
Number of shares | Number of options | Total shareholding | ||||||||
Owned outright1 | Unvested subject to continued employment | Unvested subject to performance | Unvested subject to continued employment | Vested unexercised | Totals at 31 December 20252 | |||||
Executive directors3 | ||||||||||
Charlie Nunn | 10,140,467 | 2,987,208 | 20,208,631 | 2,599,919 | – | 35,936,225 | ||||
William Chalmers | 10,740,854 | 3,858,710 | 14,565,244 | 39,701 | – | 29,204,509 | ||||
| Outstanding share plan interests (audited) | | |||||||||
At 1 January 2025 | Granted/ awarded | Vested/ released/ exercised | Lapsed | At 31 December 2025 | Exercise price | Exercise periods | |||||
From | To | Notes | |||||||||
Charlie Nunn | |||||||||||
LTSP 2022 – 2024 | 3,588,364 | – | 717,672 | – | 2,870,692 | 2 | |||||
LTSP 2023 – 2025 | 3,283,896 | – | – | – | 3,283,896 | 2 | |||||
LTIP 2024 – 2026 | 10,376,712 | – | – | – | 10,376,712 | 2 | |||||
LTIP 2025 – 2027 | – | 6,548,023 | – | – | 6,548,023 | 2,3,4 | |||||
Deferred GPS awarded in 2023 (2022 GPS) | 335,442 | – | 218,926 | – | 116,516 | 5 | |||||
Deferred GPS awarded in 2025 (2024 GPS) | – | 788,076 | 788,076 | – | – | 6,7 | |||||
Share Buy-Out | 1,368,990 | – | 1,368,990 | – | – | – | 11/03/2025 | 10/03/2030 | 1 | ||
1,369,012 | – | – | – | 1,369,012 | – | 11/03/2026 | 10/03/2031 | 1 | |||
891,217 | – | – | – | 891,217 | – | 11/03/2027 | 10/03/2032 | 1 | |||
339,690 | – | – | – | 339,690 | – | 11/03/2028 | 10/03/2033 | 1 | |||
William Chalmers | |||||||||||
GOS 2020 – 2022 | 1,291,908 | – | 430,636 | – | 861,272 | 2 | |||||
LTSP 2021 – 2023 | 1,237,872 | – | 309,468 | – | 928,404 | 2 | |||||
LTSP 2022 – 2024 | 2,586,292 | – | 517,258 | – | 2,069,034 | 2 | |||||
LTSP 2023 – 2025 | 2,366,848 | – | – | – | 2,366,848 | 2 | |||||
LTIP 2024 – 2026 | 7,478,949 | – | – | – | 7,478,949 | 2 | |||||
LTIP 2025 – 2027 | – | 4,719,447 | – | – | 4,719,447 | 2,3,4 | |||||
Deferred GPS awarded in 2023 (2022 GPS) | 132,703 | – | 132,703 | – | – | 5 | |||||
Deferred GPS awarded in 2025 (2024 GPS) | – | 568,000 | 568,000 | – | – | 6,7 | |||||
2021 Sharesave | 17,177 | – | 17,177 | – | – | 39.40p | 01/01/2025 | 30/06/2025 | |||
2023 Sharesave | 20,171 | – | – | – | 20,171 | 38.55p | 01/01/2027 | 30/06/2027 | |||
2024 Sharesave | 19,530 | – | – | – | 19,530 | 52.35p | 01/01/2028 | 30/06/2028 | |||
| Outstanding cash awards (audited) | | |||||
At 1 January 2025 £ | Granted/ awarded £ | Vested / released / exercised £ | At 31 December 2025 £ | Notes | |||
Charlie Nunn | |||||||
Deferred GPS cash awarded in 2023 (2022 GPS) | 174,096 | – | 113,625 | 60,471 | 1 | ||
William Chalmers | |||||||
Deferred GPS cash awarded in 2023 (2022 GPS) | 68,874 | – | 68,874 | – | 1 | ||
| Shareholding requirement | | ||
£5.50m |


Charlie Nunn Actual: 656% of salary Requirement: 400% of salary by 15/08/26 |
31/12/25 |
31/12/24 |
1 |
£2.63m |

31/12/25 |
31/12/24 |
William Chalmers Actual: 1128% of salary Requirement: 300% of salary by 02/06/24 |

1 |
Requirement | l | Actual2 | l | Unvested subject to continued employment3 | l | Unvested subject to performance4 |



Read more Gender and Ethnicity Pay Gap Report April 2024 to April 2025 |
Gender pay gap – April 2024 to April 2025 | ||
Progress has continued to close the mean Gender pay gap; this has reduced 1.0 percentage point to 24.9%. As of April 2025, 38.8% of executive roles were held by women. Overview The Gender pay gap reflects the different representation of men and women across levels in the organisation. This does highlight a clear opportunity to keep strengthening career progression and representation, with a particular focus on supporting women to progress into more senior roles. What the data shows Continued progress has been made in closing the mean Gender pay gap, with the gap reducing by 1.0 percentage point to 24.9%. This improvement demonstrates that our actions are moving us in the right direction, however, we remain committed to accelerating our progress. Our commitments to gender inclusion Integrating inclusion into the way we run our business has been core to our success to date. Holding our Group executives to account is paramount. Our data led approach, which is grounded in key metrics and insight gathered through colleague feedback, allows our business area executives to identify opportunities to accelerate progress and to also address any gaps. How our executives bridge identified opportunities, forms a core part of performance conversations. We take active steps to drive inclusion through all stages of our colleague lifecycle from recruitment, to progression and retention. In 2025 we set a new ambition to reach and maintain a gender balance of between 45% to 55% in executive roles by the end of 2030. Setting this ambition for our leadership team is important in providing role modelling and inspiration for our colleagues and ensures more inclusive strategic decision making. It also supports greater innovation and adaptability, both vital as we continue to transform our business for the future. At the end of 2025, the number of women in executive level roles (X+) stands at 40.4%, putting us on track to meet our 2030 ambitions. We proudly co-sponsor the Government-backed FTSE Women Leaders Review which sets recommendations to increase the representation of women on boards and in leadership. We achieved all the Review’s recommendations in 2023, two years ahead of the deadline. In 2025 we achieved 13th place. In 2025, our continued commitment has once again been recognised externally, with our inclusion in the Times Top 50 Employers for Gender Equality for the 14th consecutive year. | ||
Mean pay gap % |
Ethnicity pay gap – April 2024 to April 2025 | ||
Continued progress has been made with the mean gap reducing by 1.3 percentage points from 3.0% to 1.7% from last year. Overview We remain committed to publishing our Ethnicity pay gap report on a voluntary basis. We have chosen to publish for the past six years because we recognise the importance of transparency in encouraging focus and inspiring purposeful, action-led change. It helps to hold us accountable to delivering on our commitment and we believe it will lead to sustainable positive change for our people. What the data shows As at April 2025, 91.5% of our colleagues have chosen to disclose their ethnicity with us, an encouraging increase from 88.2% in April 2023. Whilst we have more to do to close the gap, we have seen improvements within the representation of our senior leadership teams which has had a significant impact on gap closure to date. Our commitments to ethnic diversity In an increasingly multicultural society, we can only truly be the best bank for our customers if our workforce reflects the diversity of the UK population and ultimately our customers. Our goal is to increase our workforce diversity and unlock the full potential of our Black, Asian, and Minority Ethnic colleagues. We remain guided by the principles of our Race Action Plan, launched in 2020, which focuses on driving cultural change, improving recruitment and progression across the Group, and setting out the steps we are taking to deliver sustainable change for our people, customers, and the communities we serve. In 2025, we reset our UK ambition: to increase representation of Black, Asian, and Minority Ethnic colleagues in executive roles to between 19% and 22%, and to grow Black representation in executive positions to between 3.5% and 4% by the end of 2030. We have seen steady growth in ethnic representation across the Group, particularly at senior levels. To accelerate this progress, we launched a series of Regional Thought Leadership and Networking events. These are designed to build external professional communities with the skills, insights, and experience aligned to our business needs, centred around our strategic locations. This approach helps create a diverse talent pool for today and the future. Recognising opportunities to improve the progression of colleagues from Black heritage backgrounds, we continue to invest in career initiatives. These focus on understanding colleagues’ career experiences and aspirations, while promoting existing support that is available to all our colleagues such as mentorship and sponsorship opportunities. In addition, we remain committed to supporting Black business communities through our Black Entrepreneur Programme, where trust has more than doubled from 36% in 2022 to 84% today. At the 2025 Ethnicity Awards we were once again recognised overall ‘Outstanding Employer’ for the fourth time since the launch of the awards in 2018. | ||
Mean pay gap % |



2025 | |||
2024 |
2025 | |||
2024 |
| Percentage change in remuneration levels | | ||||||
The table below sets out the change in the directors’ base salary/fees, taxable benefits and annual bonus compared with the change in our UK-based colleagues’ pay. Lloyds Banking Group plc is not an employing entity, and therefore the disclosure below is made on a voluntary basis to compare any change with all employees of the wider Group based in the UK. This population has been chosen as the majority of our workforce are based in the UK and is considered to be the most appropriate group of employees. The same population is used for the purposes of the Chief Executive Officer pay ratio disclosure on page 119 of the report. | ||||||||
% change | 2020 to 2021 | 2021 to 2022 | 2022 to 2023 | 2023 to 2024 | 2024 to 2025 | |||
Base salary8 | ||||||||
Charlie Nunn2 | n/a | 1 | – | 3 | 17 | |||
William Chalmers3 | 12 | (9) | – | 3 | 3 | |||
All employees1 | 4 | 6 | 13 | 10 | 5 | |||
GPS4,8 | ||||||||
Charlie Nunn2 | n/a | 47 | (5) | (12) | 26 | |||
William Chalmers3 | n/a | (2) | 34 | (12) | 12 | |||
All employees1 | n/a | 12 | (14) | (4) | 10 | |||
Benefits6,8 | ||||||||
Charlie Nunn2 | n/a | 4 | (37) | 8 | 37 | |||
William Chalmers3 | 2 | 35 | – | 2 | (24) | |||
Sir Robin Budenberg | n/a | – | 100 | (50) | – | |||
All employees1 | 1 | 5 | (43) | (71) | (12) | |||
Fees5 | ||||||||
Sir Robin Budenberg | 243 | 1 | 1 | 4 | 15 | |||
Nathan Bostock10 | n/a | n/a | n/a | n/a | 3 | |||
Sarah Legg | 28 | 6 | 2 | 2 | 9 | |||
Amanda Mackenzie | (1) | 7 | 2 | 22 | 9 | |||
Harmeen Mehta | n/a | 2 | 4 | 4 | 10 | |||
Cathy Turner | n/a | n/a | 38 | 76 | 3 | |||
Chris Vogelzang7 | n/a | n/a | n/a | n/a | n/a | |||
Scott Wheway9 | n/a | n/a | 1 | 4 | 3 | |||
Catherine Woods | 43 | 4 | 2 | 2 | 6 | |||
| Chief Executive Officer pay ratio | | ||||||||
The Remuneration Committee views pay ratios as a useful reference point to inform policy-setting, but also takes into consideration a number of other factors. The table below shows the ratios of the GCE’s total remuneration to the remuneration of colleagues since 2017. The change in the pay ratios for 2025 is explained in more detail below. | ||||||||||
Total compensation | Fixed pay | |||||||||
Year | Methodology | P25 (Lower Quartile) | P50 (Median) | P75 (Upper Quartile) | P25 (Lower Quartile) | P50 (Median) | P75 (Upper Quartile) | |||
2025 | A | 205:1 | 141:1 | 81:1 | 87:1 | 60:1 | 34:1 | |||
2024 | A | 165:1 | 114:1 | 63:1 | 75:1 | 53:1 | 29:1 | |||
2023 | A | 112:1 | 80:1 | 45:1 | 76:1 | 54:1 | 31:1 | |||
2022 | A | 120:1 | 86:1 | 48:1 | 81:1 | 59:1 | 35:1 | |||
2021 | A | 316:1 | 225:1 | 120:1 | 93:1 | 66:1 | 38:1 | |||
2020 | A | 132:1 | 95:1 | 54:1 | 103:1 | 75:1 | 42:1 | |||
2019 | A | 179:1 | 128:1 | 71:1 | 114:1 | 82:1 | 47:1 | |||
2018 | A | 237:1 | 169:1 | 93:1 | 113:1 | 81:1 | 48:1 | |||
2017 | A | 245:1 | 177:1 | 97:1 | 113:1 | 82:1 | 48:1 | |||
Y-o-Y (2024 vs 2025) | 24% | 13% | ||||||||

Performance year | Year 1 | Year 2 | Year 3 | Year 4 | Year 5 | Year 6 | |||||||||
Base Salary | Paid in cash | ||||||||||||||
Pension/ Benefits | Paid in performance year | ||||||||||||||
Short Term Variable | Performance period | 75% in cash upfront | 25% paid in shares and released over three years in equal tranches | ||||||||||||
Long Term Variable | Pre-grant test | Performance period | 75% shares | Two-year holding period | |||||||||||
25% shares | One-year holding period | ||||||||||||||
How our remuneration is delivered |
Directors’ remuneration |
Base Salary | ||||
2026 Policy removes fixed share awards (currently set at 100% of salary), reduces executive director pension contributions from 15% to 10% of salary and removes the flexible benefits allowance and the CFO’s car allowance. The base salaries of our Group Chief Executive and Chief Financial Officer will be increased by 3% respectively effective 1 April 2026. Subject to approval of the Policy at the 2026 AGM, also effective 1 April 2026, salaries will be increased by an additional £112,531 and £82,684 to reflect the partial consolidation of fixed share awards and flexible benefits allowance. Taken together, these changes will reduce our executive director fixed pay by approximately 44%. | The on-cycle 3% annual increase, effective 1 April 2026, to the salary of both executive directors is in line with the 2026 3.1% budget as part of the pay deal for wider workforce. Salaries from 1 April 2026 will therefore be as follows: GCE: £1,416,642 CFO: £903,572 Subject to approval of the Policy at the 2026 AGM, salaries will be increased to the following, also effective 1 April 2026: GCE: £1,529,174 CFO: £986,256 |
Pension | ||||
Pension allowances for all executive directors are set at 10% of base salary. Around 52,000 colleagues participate in the Group’s Defined Contribution (DC) Pension scheme where the maximum opportunity for the workforce is 15% of base salary. | Executive directors’ employer pension contributions are therefore less than those available to the majority of the workforce. |
Benefits | ||||
As described above, the flexible benefit allowance of 4% of base salary has been removed as part of the 2026 Policy. The CFO’s car allowance has also been removed. Executive directors can continue to select benefits including life assurance and critical illness cover from the flexible benefits catalogue. | The cost of any selection will come from the executive directors’ base salary. Other benefits include transportation and private medical cover. |

Directors’ remuneration continued |
Group Performance Share (Short Term Variable) | ||||
Overview Maximum opportunities for executive directors for 2026 are 300% of base salary for the Group Chief Executive and 250% for the Chief Financial Officer. For the 2026 performance year, any GPS opportunity will be awarded in March 2027 in a combination of cash and shares. Individual awards as a percentage of maximum will directly relate to the overall Group balanced scorecard performance assessment outcome in the first instance. The Group’s policy is to apply deferral to variable reward in line with minimum regulatory requirements. However, we are mindful that additional considerations apply when it comes to executive director remuneration in the UK. We will set out our deferral position each year, at award, in the annual report on remuneration, taking into account shareholder expectations, market practice and emerging trends. Our 2026 Group balanced scorecard The performance measures for determining any individual 2026 GPS awards for executive directors are outlined in the table below. The measures and targets are set annually by the Committee to reflect the strategic priorities of the Group and take into account both the annual financial plan and operating plan against the backdrop of the rapidly evolving external economic and societal landscape. Performance measures and weightings The 2026 scorecard metrics have been reviewed alongside the 2026 LTIP there is minimal overlap which would risk duplication of outcomes. Whilst a RoTE measure is also included in the LTIP performance metrics, it is considered a fundamental indicator of Group performance and creation of shareholder value. The RoTE within the annual scorecard focuses on in-year performance while the LTIP assesses long-term performance. the longer-term nature of the Group’s ambitions on decarbonisation, the Committee will use the LTIP as the principal measure of the Group’s progress on environmental sustainability by moving the Reduction in our Operational Carbon Emissions measure from the short-term to the long-term scorecard for 2026. To recognise the importance of our customers and to ensure executive variable reward outcomes reflect their experience, the Group customer dashboard weighting will be increased to 25%. | To reflect the criticality of continued transformation of our workforce to enable delivery of Group strategy, our 2026 Group balanced scorecard will include a broader ‘People measure’ weighted 15%; this will retain our current focus on inclusion and colleague engagement but also include a wider range of people transformation metrics considered by the Board. These will include, for example, colleague upskilling and the adoption of AI, a first we believe amongst our peers. Targets and methodology Setting stretching targets is a key component of our demanding performance-driven culture. The Committee has undertaken a thorough exercise to ensure targets are sufficiently stretching, taking into consideration our operating plan and, where applicable, forward-looking guidance. The Committee agreed targets to evaluate performance in 2026 and these will be disclosed retrospectively in the 2026 annual report alongside the level of performance achieved, as the Committee considers such targets to be commercially sensitive. To recognise exceptional items are not budgeted, profit after tax, return on tangible equity and cost:income ratio measures will exclude these from 2026. Instead, the Committee will consider any impact on a case-by-case basis taking account of the impact on the full range of the Group’s stakeholders including its customers, colleagues, shareholders and communities. Discretion When determining the final outcome, the Committee may consider any personal or business area objectives and whether there has been effective, consistent and proactive risk management and conduct outcomes across all dimensions. When assessing performance, the Committee can exercise its judgement to determine the appropriate outcome. This helps to avoid any potential unintended outcomes that might arise from the application of formulaic performance criteria. 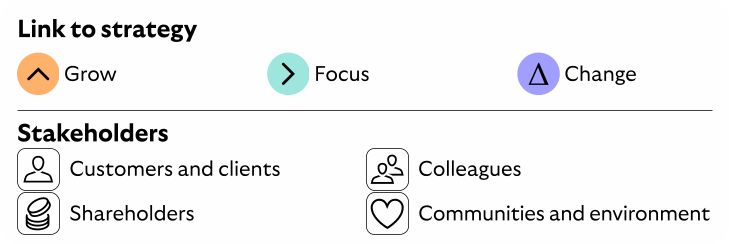 | |||
Our 2026 Group balanced scorecard |
Financial (60%) | Profit after tax1 | 25% | |||||
Return on tangible equity1 | 25% | ||||||
Cost:income ratio1 | 10% | ||||||
Non-financial (40%) | Customer Our assessment of how effectively we are serving customers across all brands, products and services as measured by our Group Customer Dashboard | 25% | |||||
People A holistic assessment of our gender and ethnic representation in executive roles2, culture and colleague engagement and a wider range of people transformation metrics | 15% |

Directors’ remuneration continued |
Long Term Incentive Plan (Long Term Variable) | ||||
Overview The Group’s demanding, high performance culture is critical to delivering our ambitious strategy. LTIP awards will be granted in relation to 2025 performance under the terms of the new 2026 Policy. The Committee concluded that 2025 performance, including assessment of our 2025 Group balanced scorecard and other factors, was at a level to make awards. This is known as the ‘pre-grant test’. To ensure strong alignment between variable reward outcomes and the creation of shareholder value, the Committee has determined that LTIP awards will be granted with a value of 500% of base salary to the GCE and 450% of base salary to the CFO to reflect the Group’s performance in 2025. LTIP grants are normally made in March. However, for 2026 for the executive directors the grants will be made, subject to approval of the 2026 Policy, shortly after the 2026 AGM, by reference to the same grant date, grant price and performance and vesting periods used in March 2026 for the Group's other LTIP participants. Performance measures and weightings block has been increased to 75% weight for 2026. Return on tangible equity emphasises the efficient use of capital and ensures focus on long- term value creation, capital generation recognises the importance of maintaining a strong financial foundation for the Group and prioritises capital-accretive decision making for the long term, and rTSR compares the value delivered to a shareholder in the Group over the performance period with the value delivered to shareholders by our peers. | A dedicated 15% weighting will assess our strategic delivery; the final stage of the current strategy in 2026; and the progress of our new strategy (which we look forward to setting out in July 2026) in 2027 and 2028. Finally, 10% weight is attributed to sustainability measures, reflecting that the transition to a low carbon economy is at the core of our strategy and aligns with our purpose of Helping Britain Prosper. For 2026 this will also include assessment of our operational carbon reduction. Recognising exceptional items are not budgeted, RoTE and capital generation will exclude these from 2026. Instead, the Committee will consider any impact on a case-by-case basis taking account of the impact on the full range of the Group’s stakeholders including its customers, colleagues, shareholders and communities. Target setting Setting targets is a critical focus area for the Committee and a rigorous exercise has been undertaken to ensure our targets are sufficiently stretching. We have taken into account our long-term strategic ambitions, commitments to our sustainability agenda, comparable industry returns and the higher variable reward opportunity available to our executive directors through our 2026 Policy. Operation Awards made in 2026 will be subject to the Group’s performance between January 2026 and December 2028. Awards will vest in two tranches; 75% after three years, subject to a two-year post-vesting retention period, 25% after four years subject to a one-year post-vesting retention period. | |||
2026-2028 LTIP scorecard |
Financial (75%) | Return on tangible equity (RoTE)1,2 – average over three years | 30% | 15% | 18% | ||||||
Capital generation1,3 – average over three years | 15% | 200 bps | 250 bps | |||||||
Relative Total Shareholder Return4 – cumulative over three years | 30% | Median of the peer group | Upper quartile of the peer group | |||||||
Strategic (15%) | Delivery of the Group’s strategic objectives by the end of 2028 | 15% | Assessment of the Group’s delivery against our current five-year strategic plan, ending in 2026, alongside the Group’s progress toward delivering on our next strategic cycle through 2028, which will be outlined in July 2026. The assessment will include, but not be limited by, how the Group continues to Grow, Focus and Change its business to achieve our purpose of Helping Britain Prosper. After undertaking this review, the Committee will exercise its judgement to determine the vesting outcome on a holistic basis. | |||||||
Sustainability5 (10%) | Sustainable finance and investment | 10% | The Committee will assess the Group’s performance against its publicly disclosed environmental targets aligned to cumulative sustainable finance and investment provided over the performance period, 2028 progress towards 2030 sector targets and Scottish Widows emissions reduction ambition, and our own operational carbon reduction. After this assessment the Committee will holistically determine a vesting outcome. | |||||||
Achievement of 2030 sector targets and Scottish Widows’ emissions reduction ambition | ||||||||||
Reducing our operational carbon emissions6 | ||||||||||

Directors’ remuneration continued |
 Chair and non-executive director fees and benefits | ||||||||
Any increases normally take effect from 1 January of a given year. The Committee is responsible for evaluating and approving the Chair’s fees. The Chair does not participate in these discussions. The GCE and the Chair are responsible for evaluating and making recommendations to the Board in relation to the fees of the non-executive directors (NEDs). The Chair receives an all-inclusive fee, which is reviewed periodically plus benefits including life insurance, medical insurance and transportation. The Committee retains the right to provide additional benefits depending on individual circumstances. NEDs are paid a basic fee plus additional fees for the Chair/ membership of Committees and for membership of Group company Boards, non-Board level committees and/or other specific responsibilities. | Additional fees are also paid to the Senior Independent Director to reflect additional responsibilities. The Chair and the NEDs are not entitled to receive any payment for loss of office (other than in the case of the Chair’s fees for the six-month notice period) and are not entitled to participate in the Group’s variable remuneration arrangements, all-employee share plan or pension arrangements. NEDs are reimbursed for expenses incurred in the course of their duties, such as travel and accommodation expenses, on a grossed-up basis (where applicable). Non-executive directors may receive more than one of the above fees. | |||||||
| Chair and non-executive director fees in 2026 | | ||||||
As set out in the 2024 directors’ remuneration report there is a £100,000 increase to the annual fee for the Chair from 1 January 2026 taking the fee to £850,000. This is step two of the two-stage increase announced last year. Following a detailed review of peer benchmarks and to ensure our non-executive directors are paid appropriately for the experience and time requirements required, the table below sets out changes to non-executive director fees from 1 January 2026. | ||||||||
2026 | 2025 | % change 2025 to 2026 | ||||||
Basic non-executive director fee | 95,000 | 92,200 | 3.0% | |||||
Senior Independent Director | 64,200 | 64,200 | —% | |||||
Audit Committee Chair | 79,180 | 77,250 | 2.5% | |||||
Remuneration Committee Chair | 79,180 | 77,250 | 2.5% | |||||
Risk Committee Chair | 79,180 | 77,250 | 2.5% | |||||
Responsible Business Committee Chair | 61,500 | 60,000 | 2.5% | |||||
IT and Cyber Advisory Forum Chair | 61,500 | 60,000 | 2.5% | |||||
Audit Committee member | 35,875 | 35,000 | 2.5% | |||||
Remuneration Committee member | 35,875 | 35,000 | 2.5% | |||||
Risk Committee member | 35,875 | 35,000 | 2.5% | |||||
Responsible Business Committee member | 25,625 | 25,000 | 2.5% | |||||
IT and Cyber Advisory Forum member | 25,625 | 25,000 | 2.5% | |||||
Nomination and Governance Committee member | 16,750 | 16,550 | 1.2% | |||||

| 2026 Directors’ Remuneration Policy and Group remuneration policy alignment | | ||||
Executive directors | Group Executive Committee | Other material risk takers | Other employees | |
Fixed1 | ||||
Base salary | l | l | l | l |
Pension | l | l | l | l |
Benefits | l | l | l | l |
Variable | ||||
Short term incentive | l | l | l | l |
Long term incentive | l | l | ¡ | ¡ |
Remuneration Policy table for executive directors |
Base Salary | ||||
Purpose and link to strategy To support the recruitment and retention of executive directors of the calibre required to develop and deliver the Group’s strategic priorities. Base salary reflects the role of the individual, taking account of market competitiveness, responsibilities and experience, and pay in the Group as a whole. Operation Base salaries are typically reviewed annually with any increases normally taking effect from 1 April for executive directors. When determining and reviewing base salary levels, the Committee takes into account base salary increases for employees throughout the Group and ensures that decisions are made within the following two parameters: •An objective assessment of the individual’s responsibilities and the size and scope of their role, using objective job-sizing methodologies •Pay for comparable roles in comparable publicly listed firms of a similar size Salary may be paid in pounds sterling (GBP) or other currency and at an exchange rate determined by the Committee. | Maximum potential The Committee will make no increase which it believes is inconsistent with the two parameters. Increases will normally be no more than the increase awarded to the overall employee population. However, a greater salary increase may be appropriate in certain circumstances, such as a new appointment made on a salary below a market competitive level, where phased increases are planned, or where there has been an increase in the responsibilities of an individual. Where increases are awarded in excess of the wider employee population, the Committee will provide an explanation in the relevant annual report on remuneration. Performance measures N/A Changes No change to Policy on base salary. To set fixed pay at an appropriate level in line with market standard for executive directors and further align executive remuneration with stakeholder experience, fixed share awards have been removed from the Policy. |
Pension | ||||
Purpose and link to strategy To provide cost effective and market competitive retirement benefits, supporting executive directors in building long-term retirement savings. Operation Executive directors are entitled to participate in the Group’s defined contribution scheme with company contributions set as a percentage of salary. An executive director may elect to receive some or all of their pension allowance as cash in lieu of pension contribution. | Maximum potential The maximum allowance for all executive directors is set at 10% of base salary, which is lower than that of the majority of the wider workforce. Performance measures N/A Changes To set fixed pay at an appropriate level in line with market standard for executive directors, maximum employer pension contribution available has been reduced from 15% to 10% of base salary. This will move the executive directors from being in line with, to less than the majority of the wider workforce. |

Remuneration Policy table for executive directors continued |
Benefits | ||||
Purpose and link to strategy To provide flexible benefits as part of a competitive remuneration package. Operation Benefits may include those currently provided and disclosed in the annual report on remuneration. Core benefits include private medical insurance, life insurance and other benefits that may be selected through the Group’s flexible benefits plan. In certain circumstances, the Committee may provide additional benefits to individuals, which may include, but are not limited to, accommodation, relocation, and travel support. | Maximum potential N/A Performance measures N/A Changes To align executive director remuneration package with the wider workforce where flex and car allowances were consolidated in previous years and to set fixed pay at an appropriate level, executive directors will no longer receive a flexible benefits allowance. Car allowance has also been removed as a benefit. |
All-employee plans | ||||
Purpose and link to strategy Executive directors are eligible to participate in HMRC tax advantaged share plans which promote share ownership by giving employees an opportunity to invest in Group shares. Operation Executive directors may participate in these plans in line with HMRC guidelines currently prevailing (where relevant), on the same basis as other eligible employees. Maximum potential Participation levels may be increased up to HMRC limits as amended from time to time. The monthly savings limits for Save As You Earn (SAYE) is currently £500. | The maximum value of shares that may be purchased under the Share Incentive Plan (SIP) in any year is currently £1,800 with a two-for-one match. Currently a three-for-two match is operated up to a maximum colleague investment of £30 per month. The maximum value of free shares that may be awarded in any year is £3,600. Performance measures N/A Changes No change to Policy. |

Remuneration Policy table for executive directors continued |
Group Performance Share (Short Term Variable) | ||||
Purpose and link to strategy To incentivise and reward the achievement of the Group’s annual financial and strategic targets whilst supporting the delivery of higher, more sustainable returns. Operation Measures and targets are set annually and awards are determined by the Committee after the year end based on performance against the targets set. The GPS may be delivered in cash, shares, notes or other debt instruments including contingent convertible bonds. Where all or part of any award is deferred, the Committee may adjust these deferred awards in the event of any variation of share capital, demerger, special dividend or distribution or amend the terms of the plan in accordance with the plan rules. Where an award or a deferred award is in shares or other share linked instrument, dividends or dividend equivalents may accrue over the vesting period and are payable in respect of awards that vest. These will be paid in shares unless the individual has met their shareholding requirement in which case they may be payable in cash at the discretion of the Committee. Where dividends or dividend equivalents are not accrued, the grant price of shares to be awarded may be discounted to reflect the lack of dividend equivalents. The Committee applies its judgement to determine the payout level commensurate with business and/or individual performance or other factors as determined by the Committee. The Committee may reduce the level of award (including to zero), apply additional conditions to the vesting or delay the vesting of deferred awards to a specified date or until conditions set by the Committee are satisfied, where it considers it appropriate. Awards may be subject to malus and clawback for a period of up to seven years after the date of award which may be extended to 10 years where there is an ongoing internal or regulatory investigation. | Maximum potential The maximum GPS opportunities are 300% of base salary for the Group Chief Executive and 250% of base salary for other executive directors. Performance measures Measures and targets are set annually by the Committee in line with the Group’s strategic business plan and further details are set out in the annual report on remuneration for the relevant year. Measures consist of both financial and non-financial measures and the weighting of these measures will be determined annually by the Committee. All assessments of performance are ultimately subject to the Committee’s judgement, but measures will not vest if threshold performance is not met. The payout for threshold performance will not exceed 25% of maximum. The normal ‘target’ level of the GPS is 50% of maximum opportunity. The Committee is committed to providing transparency in its decision making in respect of GPS awards and will disclose historic measures and target information together with information relating to how the Group has performed against those targets in the annual report on remuneration for the relevant year except to the extent that this information is deemed to be commercially sensitive, in which case it will be disclosed once it is deemed not to be sensitive. Changes The maximum GPS for the GCE has been increased from 140% to 300% of base salary and the maximum GPS for other executive directors has been increased from 140% to 250% of base salary. The Policy gives the Committee flexibility to permit dividends or dividend equivalents to be awarded on deferred awards. | |||
Remuneration Policy table for executive directors continued |
Long Term Incentive Plan (Long Term Variable) | ||||
Purpose and link to strategy To align executive directors’ long-term variable remuneration with the Group’s strategic ambitions, while ensuring alignment with shareholder interests. Operation Awards will be granted under the rules of the 2023 Long Term Incentive Plan, which was approved by shareholders at the 2023 AGM; awards will be granted in the form of conditional rights to shares in the Group. Dividends or dividend equivalents may accrue over the vesting period and are payable in respect of awards that vest. These will be paid in shares unless the individual has met their shareholding requirement in which case they may be payable in cash at the discretion of the Committee. Where dividends or dividend equivalents are not accrued, the grant price of shares to be awarded may be discounted to reflect the lack of dividend equivalents. The vesting and release of awards will comply with regulation and shareholder expectations, which is currently a performance period of at least three years, and a total performance and holding period of least five years. The Committee retains full discretion to amend the vesting levels should the outcome not reflect business and/or individual performance including risk and conduct outcomes. The Committee may reduce (including to zero) the level of the award, apply additional conditions to the vesting, or delay the vesting of awards to a specified date or until conditions set by the Committee are satisfied, where it considers it appropriate. Awards may be subject to malus and clawback for a period of up to seven years after the date of award which may be extended to ten years where there is an ongoing internal or regulatory investigation. | Maximum potential The maximum Long Term Incentive Plan opportunity is 500% of base salary for the Group Chief Executive and 450% of base salary for other executive directors. The actual award level granted will be determined with reference to a pre-grant test based on an assessment of performance by the Committee. Performance measures Awards will be subject to forward-looking performance measures based on financial and non-financial measures, such as strategic and sustainability, set out in the annual report on remuneration each year; performance will be measured over a period of not less than three years as determined by the Committee. The Committee has the discretion to change the measures or their weightings, from grant to grant, subject to a minimum of 75% of the award being dependent on financial measures. No more than 25% of the award will vest for threshold performance. 100% of the award will vest for achieving the maximum performance. Where performance falls between threshold and maximum levels, an intermediate number of awards will vest. Changes The maximum LTIP for the GCE has been increased from 300% to 500% of base salary and the maximum LTIP for other executive directors has been increased from 300% to 450% of base salary. The minimum weighting to financial performance measures has increased from 50% to 75%. To provide alignment to shareholders, the Policy allows for the grant of dividends or dividend equivalents to be awarded on deferred awards. | |||
Deferral of variable remuneration and holding periods | ||||
Operation Both the GPS and LTIP are treated as variable remuneration for purpose of applicable remuneration regulation. At award, payment and deferral levels must meet minimum rules for executive directors. The current minimum requirements are: •At least 40% of the first £660,000 of total variable remuneration and 60% of any excess to be deferred for up to four years with pro-rata vesting •At least 50% of total variable remuneration to be delivered in shares or equity-linked instruments •Where a portion of variable remuneration is delivered upfront and in shares it is subject to a minimum one-year holding period | Changes No change to Policy that payment and deferral levels and the operation of any holding period is determined annually at the time of the award. Additional context To maintain flexibility across the period of our Policy, we believe minimum regulatory requirements is the most appropriate Policy position. However, we are mindful that additional considerations apply when it comes to executive director remuneration in the UK. We will set out our deferral position each year in the annual report on remuneration, taking into account shareholder expectations, market practice and emerging trends. | |||

Remuneration Policy table for executive directors continued |
Performance adjustment | ||||
Performance adjustment is determined by the Remuneration Committee and may result in a reduction of up to 100% variable remuneration opportunity for the relevant period. It can be applied on a collective or individual basis. The application of malus will generally be considered when: •there is reasonable evidence of employee misbehaviour or material error or that they participated in conduct which resulted in losses for the Group or failed to meet appropriate standards of fitness and propriety •there is material failure of risk management at a Group, business area, division and/or business unit level •the Committee determines that the financial results for a given year do not support the level of variable remuneration awarded •any other circumstances where the Committee consider adjustments should be made | Judgement on individual performance adjustment is informed by taking into account the severity of the issue, the individual’s proximity to the issue and the individual’s behaviour in relation to the issue. Individual adjustment may be applied through adjustments to balanced scorecard assessments and/or through reducing the variable remuneration outcome. Awards are subject to clawback for a period of up to seven years after the date of award, which may be extended to ten years where there is an ongoing internal or regulatory investigation. The Committee has considered the time period of up to ten years and believes that is an appropriate length of time for performance adjustment to apply. The application of clawback will generally be considered when: •there is reasonable evidence of employee misbehaviour or material error •there is material failure of risk management at a Group, business area, division and/or business unit level | |||

Illustration of application of Remuneration Policy |
The charts below illustrate possible remuneration outcomes under the following four scenarios: 1The maximum that may be paid, assuming full GPS payout and full vesting under the new LTIP with a share price appreciation of 50% for the LTIP. The basis of the calculation of the share price appreciation is that the share price embedded in the calculation for the ‘maximum’ bar chart is assumed to increase by 50%. 2The maximum that may be paid, assuming full GPS payout and full vesting under the new LTIP with no share price appreciation. 3The expected value of remuneration for performance midway between threshold and maximum, assuming 50% of maximum Group Performance Share opportunity and 50% vesting of maximum Long Term Incentive Plan opportunity. 4The minimum that may be paid, where only the fixed element is paid (base salary, benefits and pension). Amounts are based on base salaries as at 1 April 2026, 10% pension allowance and private medical cover. Implementation of the Policy in 2026 is set out in the annual report on remuneration. |
Value of package | |||||
Charlie Nunn (GCE) | William Chalmers (CFO) | ||||
Maximum – with share price appreciation | Total | |||||
9% | t 1% | 26% | 43% | 22% | £17.7m | |
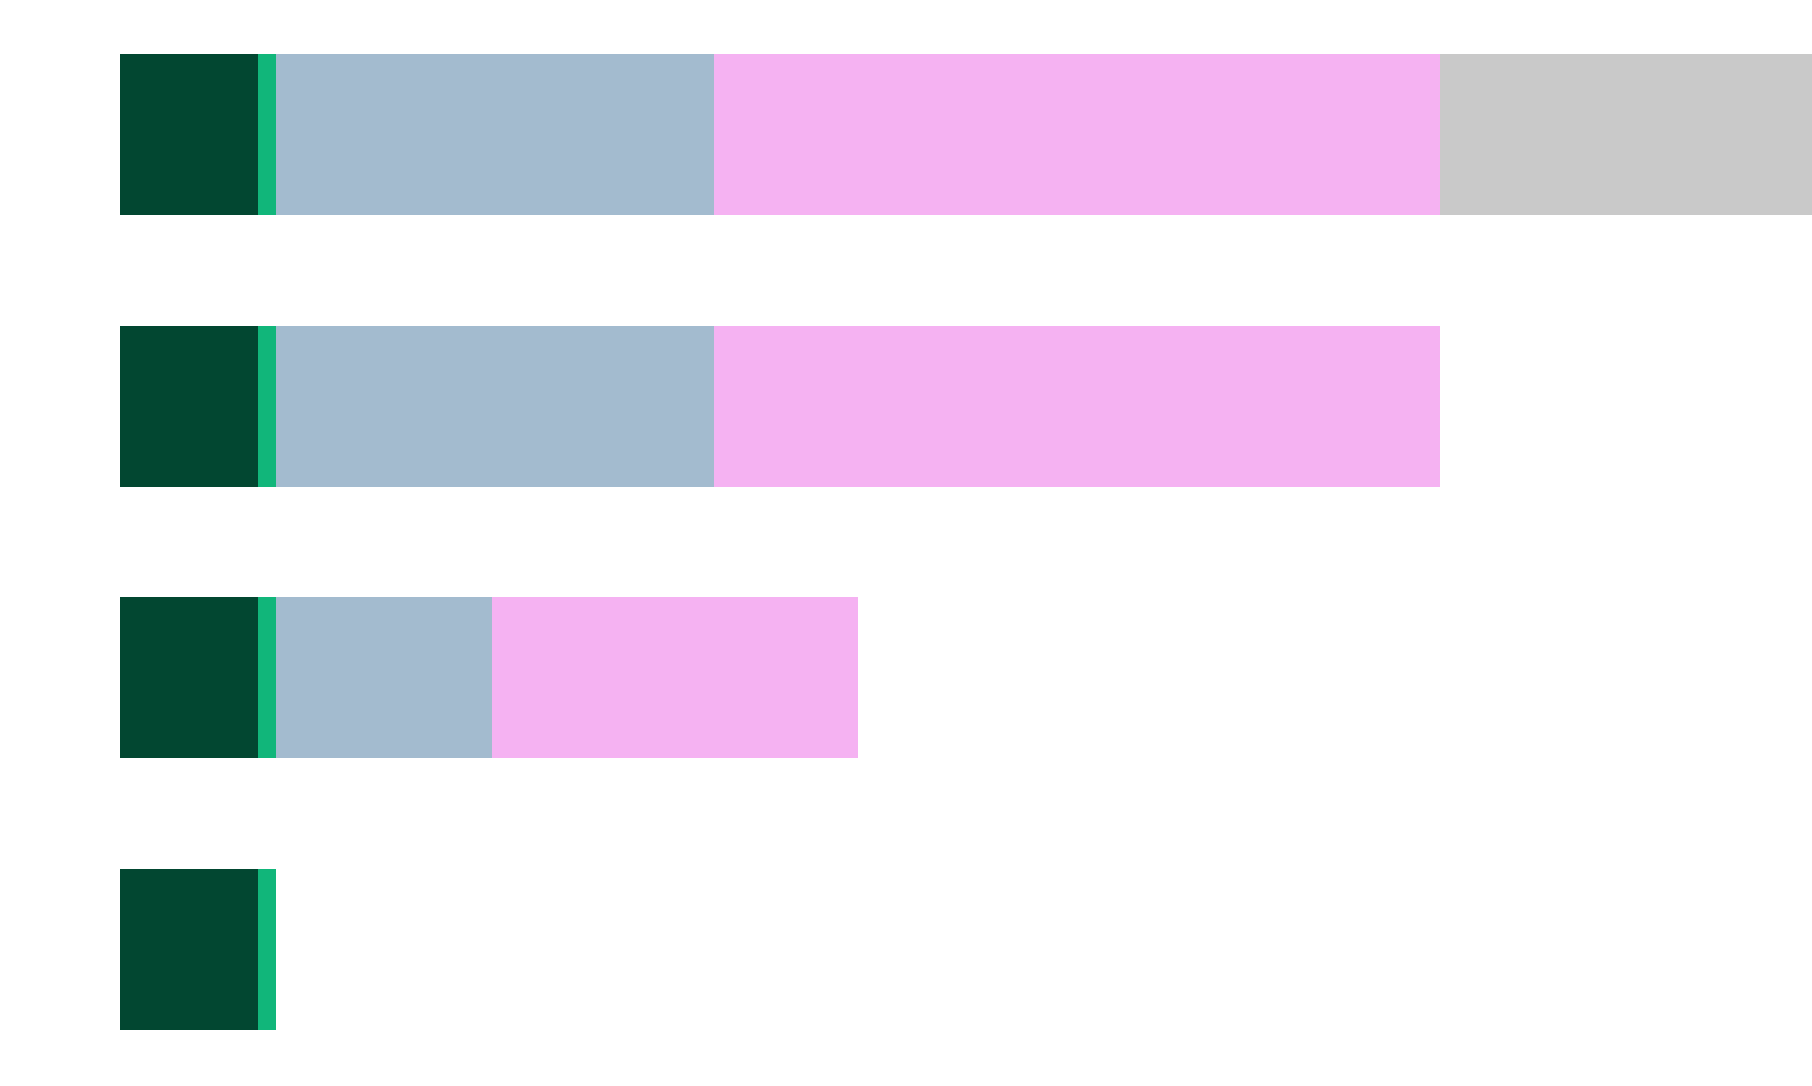
Maximum | ||||||
11% | t 1% | 33% | 55% | £13.9m | ||
Mid-performance | ||||||
20% t 2% | t 29% | t 49% | £7.8m | |||
Minimum | ||||||
91% t 9% | £1.7m | |||||
Maximum – with share price appreciation | Total | |||||
10% | t 1% | 24% | 43% | 22% | £10.2m | |
Maximum | ||||||
12% | t 1% | 31% | 56% | £8.0m | ||
Mid-performance | ||||||
22% | t 2% | t 27% | t 49% | £4.5m | ||
Minimum | ||||||
91% | t 9% | £1.1m | ||||
l | Salary | l | Pension/Benefits | l | Group Performance Share | l | Long Term Incentive Plan | l | Share price appreciation | ||||||
Notice to be given by the Group | Date of service agreement | |
Sir Robin Budenberg | 6 months | 04 July 2020 |
Charlie Nunn | 12 months | 29 November 2020 |
William Chalmers | 12 months | 15 March 2019 |
NED | Date of letter of appointment | Date of appointment |
Sir Robin Budenberg1 | 4 July 2020 | 1 October 2020 |
Nathan Bostock | 29 July 2024 | 1 August 2024 |
Sarah Legg | 21 October 2019 | 1 December 2019 |
Amanda Mackenzie | 17 April 2018 | 1 October 2018 |
Harmeen Mehta | 5 October 2021 | 1 November 2021 |
Cathy Turner | 11 October 2022 | 1 November 2022 |
Chris Vogelzang | 11 June 2025 | 16 June 2025 |
Scott Wheway | 26 July 2022 | 1 August 2022 |
Catherine Woods | 22 October 2019 | 1 March 2020 |
| Remuneration Policy table for non-executive directors | | ||
Chair and non-executive director fees and benefits | ||||
Purpose and link to strategy To provide an appropriate reward to attract and retain a high-calibre individual with the relevant skills, knowledge and experience, and to reflect the time commitment required to fulfil the role effectively. Operation The Committee is responsible for evaluating and approving the Chair’s fees. The Chair does not participate in these discussions. The Group Chief Executive and the Chair are responsible for evaluating and making recommendations to the Board in relation to the fees of the non-executive directors (NEDs). When determining and reviewing fee and benefit levels, the Committee ensures that decisions are made within the following parameters: •The individual’s skills and experience •An objective assessment of the individual’s responsibilities and the size and scope of their role, using objective sizing methodologies •Fees and benefits for comparable roles in comparable publicly listed firms of a similar size The Chair receives an all-inclusive fee, which is reviewed periodically plus benefits including life insurance, medical insurance and transportation. The Committee retains the right to provide additional benefits depending on individual circumstances. | NEDs are paid a basic fee plus additional fees for the Chair/ membership of Committees and for membership of Group company Boards, non-Board level committees and/or other specific responsibilities. An additional fee is also paid to the Senior Independent Director to reflect the additional responsibilities. Any increases normally take effect from 1 January of a given year. The Chair and the NEDs are not entitled to receive any payment for loss of office (other than in the case of the Chair’s fees for the six-month notice period) and are not entitled to participate in the Group’s variable remuneration arrangements, all-employee share plan or pension arrangements. NEDs are reimbursed for expenses incurred in the course of their duties, such as travel and accommodation expenses, on a grossed-up basis (where applicable). Maximum potential Any increase in fees or benefits currently provided will be consistent with the parameters above. Performance measures N/A Changes No change to Policy. | |||
| | |||
| Termination payments | | ||||
Base salary | Pension and benefits1 | |||
Resignation | Entitlement to base salary continues for full notice period. If employment is terminated prior to end of notice period, balance of notice pay is paid in monthly instalments, offset by earnings from any new employment during this period. If resignation is to take up a new employment, base salary would continue during any period of garden leave but may then cease if early release date agreed. | Paid until date of termination including any period of leave required by the Group (subject to individual benefit scheme rules). | ||
Redundancy or termination by mutual agreement | Entitlement to base salary continues for full notice period. If employment is terminated prior to end of notice period, balance of notice pay is paid in monthly instalments, offset by earnings from any new employment during this period. | Paid until date of termination including any period of leave required by the Group (subject to individual benefit scheme rules). | ||
Retirement/ill health, injury, permanent disability/death | Paid until date of retirement/death. For ill health, injury or permanent disability which results in the loss of employment, paid for the applicable notice period (including any period of leave required by the Group). | Paid until date of death/ retirement (subject to individual benefit scheme rules). For ill health, injury, permanent disability, paid for the notice period including any period of leave required by the Group (subject to individual benefit scheme rules). | ||
Change of control or merger | N/A | N/A | ||
Other reason where the Committee determines that the executive should be treated as a good leaver | Entitlement to base salary continues for full notice period. If employment is terminated prior to end of notice period, balance of notice pay is paid in monthly instalments, offset by earnings from any new employment during this period. | Paid until date of termination including any period of leave required by the Group (subject to individual benefit scheme rules). |
| Termination payments | | ||||
Group Performance Share (Annual bonus plan)1,2,5 | Long Term Incentive Plan (Long term variable reward plan)2,3,4,5 | |||
Resignation | Unvested deferred GPS awards and entitlement to be considered for in-year award are normally forfeited on resignation unless the Committee determines, in exceptional circumstances, to treat as a good leaver, as set out below. | Unvested awards normally lapse on date of leaving (or on notice of leaving) unless the Committee determines otherwise in exceptional circumstances that they will vest on the original vesting date (or exceptionally on the date of leaving). Where the award is to vest it will be subject to the original performance conditions and time pro-rating (for months worked in the performance period). Malus and clawback will apply. | ||
Redundancy or termination by mutual agreement | For cases of redundancy, unvested deferred GPS awards are retained and in-year GPS awards are accrued until the date of termination (or the commencement of garden leave if earlier). Such awards would be subject to deferral, malus and clawback. | Awards vest on the original vesting date (or exceptionally on the date of leaving). Vesting is subject to the performance conditions and time pro-rating (for months worked in the performance period). Malus and clawback provisions will continue to apply. | ||
Retirement/ill health, injury, permanent disability | Unvested deferred GPS awards are retained and in-year GPS awards are accrued until the date of termination (or the commencement of garden leave if earlier). Such awards would be subject to deferral, malus and clawback. | Awards vest on the original vesting date (or exceptionally on the date of leaving). Vesting is subject to the performance conditions and time pro-rating (for months worked in the performance period). Malus and clawback provisions will continue to apply. | ||
Death | Unvested deferred GPS awards are retained and in-year GPS awards are accrued until the date of death. Deferred GPS awards vest on death in cash, unless the Committee determines otherwise. | Awards vest in full on the date of death unless in exceptional circumstances the Remuneration Committee determines that the performance against targets set do not support full vesting. | ||
Change of control or merger | In-year GPS accrued up until date of change of control or merger (current year). Where there is a Corporate Event, deferred GPS awards vest to the extent and timing determined by the Committee in its absolute discretion. | Awards vest on date of event. Vesting is subject to the performance conditions and time pro-rating (for months worked in the performance period unless determined otherwise). The Committee may decide not to time pro-rate in its absolute discretion. Malus and clawback provisions will continue to apply. Instead of vesting, awards may be exchanged for equivalent awards over the shares of the acquiring company or another company or equivalent cash based awards. | ||
Other reason where the Committee determines that the executive should be treated as a good leaver | Unvested deferred GPS awards retained and in-year GPS awards are accrued until the date of termination (or the commencement of garden leave if earlier). Deferred GPS awards vest in line with normal timeframes and are subject to malus and clawback. The Committee may allow awards to vest early if it considers it appropriate. | Awards vest on the original vesting date (or exceptionally on the date of leaving). Vesting is subject to the performance conditions and time pro-rating (for months worked in the performance period). Malus and clawback provisions will continue to apply. |
Joined the Board | Left the Board | |
Chris Vogelzang | 16 June 2025 | |
Scott Wheway | 31 October 2025 |
Interest in shares | % of issued share capital with rights to vote in all circumstances at general meetings1 | |
BlackRock, Inc. | 3,668,756,7652 | 5.14% |
Norges Bank | 1,935,747,756 | 3.02% |
Content | Pages | |
Group results | Summary of Group results | 53 to 59 |
Ordinary dividends | Dividends on ordinary shares | 289 |
Directors’ emoluments | Directors’ remuneration report | 98 to 133 |
Internal control and financial risk management | Financial reporting risk | 141 |
Risk management | 24 to 29 137 to 197 | |
Financial instruments | 255 to 266 294 | |
Information included in the strategic report | Future developments | 1 to 29 |
Post balance sheet events | 2 and 3 | |
Environmental disclosures | 32 35 to 49 | |
Supporting disability | 22 | |
Engagement with colleagues | 22 and 77 | |
Engagement with customers, suppliers and others | 76 to 78 | |
Disclosures required under UK Listing Rule 6.6.1R | Significant contracts | 290 to 291 |
Dividend waivers | 289 to 290 | |
Principal risks and uncertainties | Funding and liquidity | 27 181 to 186 |
Capital position | 25 144 to 150 | |
Viability statement | Risk overview | 34 |
Going concern statement | Risk overview | 34 |
Share capital and control | Share capital and restrictions on the transfer of shares or voting rights | 287 |
Employee share schemes – exercise voting rights | 287 | |
Rights and obligations attaching to the Company’s issued share capital | 287 | |
Environmental disclosures | Carbon reporting | 47 to 48 |
Number of Board members | Percentage of the Board | Number of senior positions on the Board (CEO, CFO, SID and Chair) | Number in executive management (GEC) | Percentage in executive management (GEC) | |
Men | 5 | 50% | 3 | 8 | 61.5% |
Women | 5 | 50% | 1 | 5 | 38.5% |
Other categories | 0 | 0% | 0 | 0 | 0.0% |
Not specified/Prefer not to say | 0 | 0% | 0 | 0 | 0.0% |
Number of Board members | Percentage of the Board | Number of senior positions on the Board (CEO, CFO, SID and Chair) | Number in executive management (GEC) | Percentage in executive management (GEC) | |
White British or other white | 8 | 80% | 4 | 11 | 84.6% |
Mixed/Multiple ethnic groups | 1 | 10% | 0 | 0 | 0% |
Asian/Asian British | 1 | 10% | 0 | 2 | 15.4% |
Black/African/Caribbean/Black British | 0 | 0% | 0 | 0 | 0% |
Other ethnic group | 0 | 0% | 0 | 0 | 0% |
Not specified/prefer not to say | 0 | 0% | 0 | 0 | 0% |




 |
Group strategy and the risk management strategy |
 |
Culture, values and behaviours |
 |
Risk architecture and approach |
Risk management framework |
 |
Risk appetite |
 |
Risk governance |
 |
Risk function mandate |
 |
Three lines of defence |
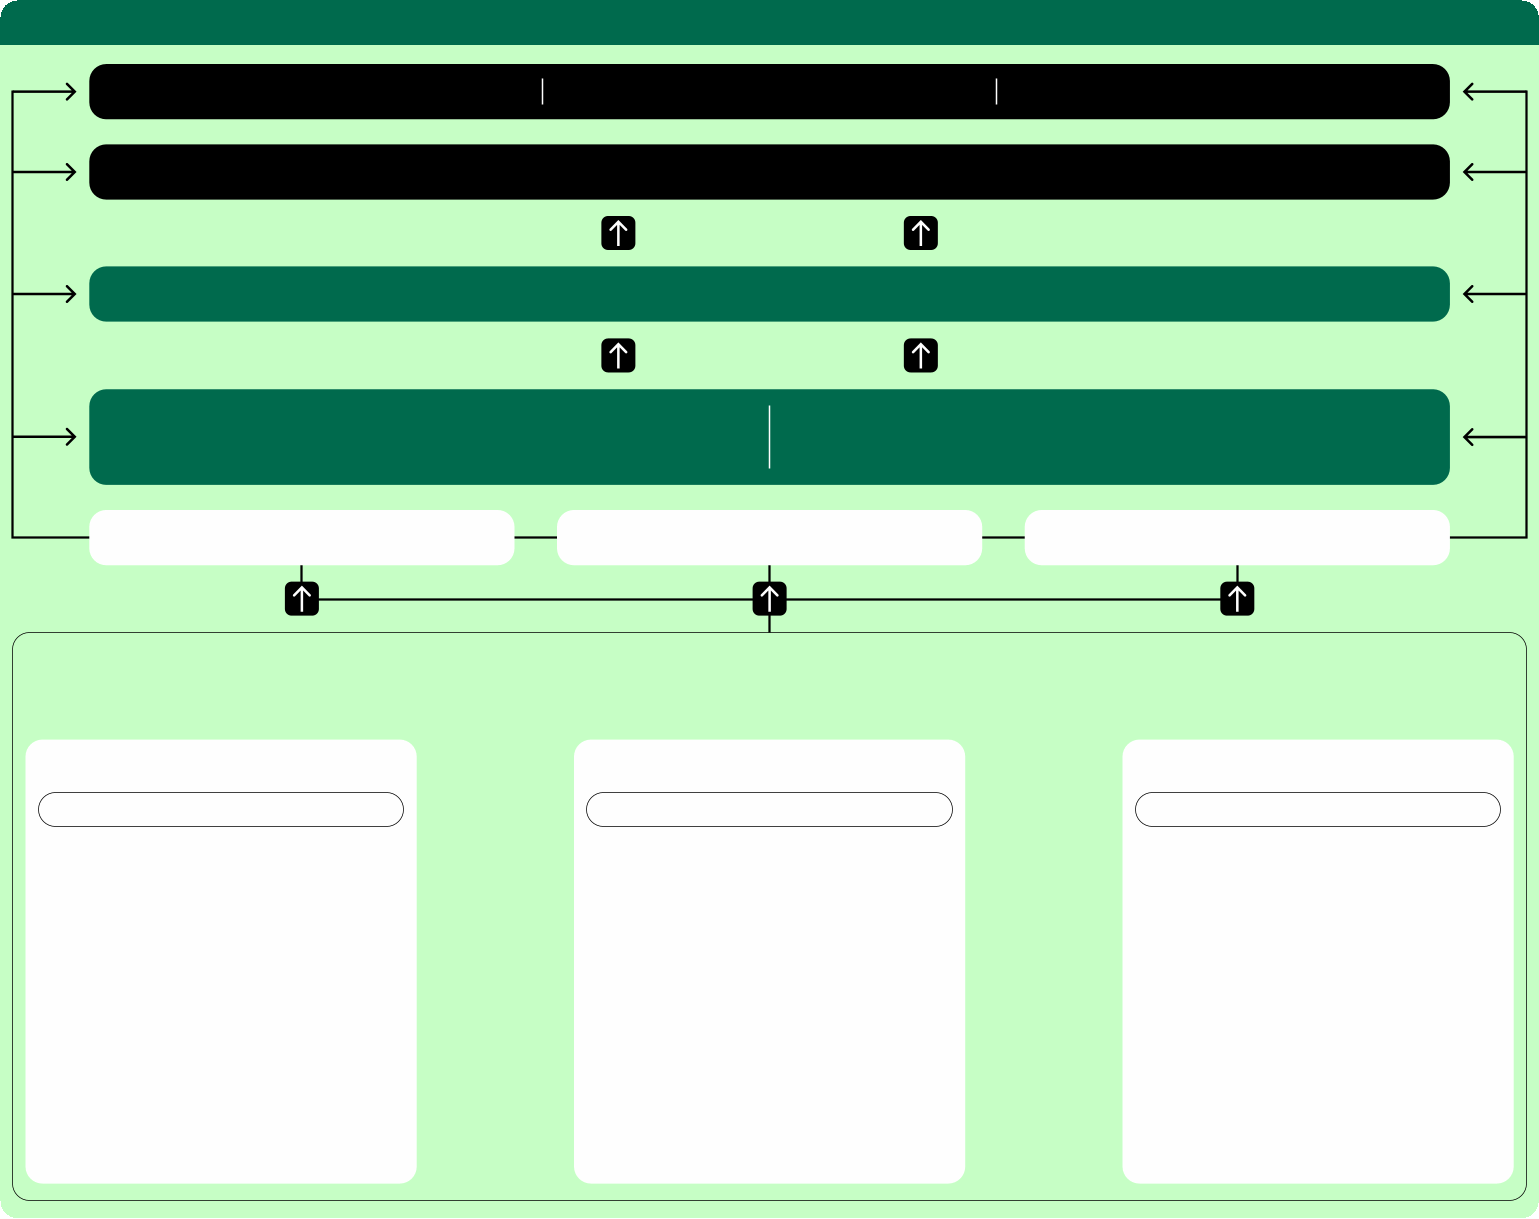
Risk governance structure |
Audit Committee | Board | Board Risk Committee | |||
Group Chief Executive | |||||
Primary escalation | |||||
Group and Ring-Fenced Banks Risk Committee | |||||
Primary escalation | |||||
Risk Function committees and governance | Business area principal enterprise risk committees | ||||
Aggregation | Reporting | Escalation |
Three lines of defence model The RMF establishes a ‘three lines of defence’ model defining clear responsibilities and accountabilities and ensuring effective independent oversight and assurance on key decisions, while ensuring appropriate risk resource and capabilities for each area: | ||||||
First line of defence |  Independent challenge of first line of defence | Second line of defence | Independent challenge of both first and second lines of defence | Third line of defence | ||
Risk management | Risk oversight | Risk assurance | ||||
Business areas have end-to-end accountability for risks in their processes and must ensure strong governance and controls, both internally and with third parties, to manage risks appropriately within Board-approved appetite parameters. They identify, assess, mitigate, monitor, and report risks, maintain risk management skills, and comply with Group policies and relevant regulations. | The Risk function, led by the Chief Risk Officer, is independent from the first line of defence. It advises on, monitors, challenges, approves, escalates, and reports to the Board and Group Chief Executive on first-line risk-taking. It oversees governance, risk management, controls and regulatory compliance, ensuring these align to the RMF and Board-set risk appetite. | Group Audit, led by the Chief Internal Auditor, provide independent assurance on the effectiveness of the first and second lines of defence’s management of risk, including assessing the design and operation of key controls and the adequacy and effectiveness of internal controls. Their scope of work is unrestricted based on their independent assessment of the Group’s key risks. | ||||
Board committees | Risk focus |
Board | Approves risk appetite and the RMF, identifies and monitors exposures including principal risks and emerging risks, reviews internal controls and the cascade of delegated authority |
Board Risk Committee | Oversees the RMF, its effectiveness, and that of internal controls; risk appetite, risk principles, stress testing, and approves ICAAP and ILAAP. Inputs into remuneration decisions |
Audit Committee | Oversees financial reporting, internal audit and whistleblowing |
Executive committees | |
Group Executive Committee | Supports the Group Chief Executive with risk, strategy, customer, colleague and operational matters, culture change and succession planning |
Group and Ring- Fenced Banks Risk Committee | Develops and monitors the RMF and material risk and control matters. Supported by business unit risk committees |
Risk and control cycle | |

Risk identification and assessment Risk identification is conducted on a continuous basis through the use of scenario analysis which considers the most material and emerging risks the Group faces, and identifies and assesses extreme, but plausible instances which may occur. | Risk management and mitigation Risks are then managed with appropriate controls or mitigation plans put in place, which are reviewed to ensure their effectiveness. Any risks which cannot be mitigated will then require risk acceptance via the appropriate risk governance. | |||
Risk reporting Risks are reported via appropriate Group, sub-Group and Divisional level risk reports and committees, allowing independent challenge by the Risk function. When thresholds for risk appetite are breached, committee minutes are clear on the actions and time frames required to address the risk and bring the exposure back within tolerance. | Risk monitoring Proactive monitoring or testing is established to ensure that controls continue to be effective, and that the Group remains within risk appetite. |
At 31 December 2025 | Retail £bn | Commercial Banking £bn | Insurance, Pensions and Investments1 £bn | Equity Investments and Central Items2 £bn | Group £bn |
Risk-weighted assets (RWAs) | |||||
Credit risk | 113.1 | 59.9 | 0.2 | 13.2 | 186.4 |
Counterparty credit risk3 | – | 5.9 | – | 1.0 | 6.9 |
Market risk | – | 3.8 | – | – | 3.8 |
Operational risk | 17.3 | 8.9 | 0.3 | 1.3 | 27.8 |
Total (excluding threshold) | 130.4 | 78.5 | 0.5 | 15.5 | 224.9 |
Threshold4 | – | – | – | 10.6 | 10.6 |
Total | 130.4 | 78.5 | 0.5 | 26.1 | 235.5 |
| Capital risk | |
Definition Capital risk is defined as the risk that an insufficient quantity or quality of capital is held to meet regulatory requirements or to support business strategy, an inefficient level of capital is held or that capital is inefficiently deployed across the Group. performance and key mitigating actions. | ||
| | |
| | |
Financial risk indicators •CET1 ratio: 14.0% (2024: 14.2%) •Total capital ratio: 18.9% (2024: 19.0%) •MREL ratio: 32.2% (2024: 32.2%) | ||
| | |
| | |
| | |

At 31 Dec 2025 £m | At 31 Dec 2024 £m | |
Common equity tier 1: instruments and reserves | ||
Share capital and share premium account | 24,686 | 24,782 |
Banking retained earnings1 | 20,671 | 19,582 |
Banking other reserves1 | 4,374 | 2,786 |
Adjustment to retained earnings for foreseeable dividends | (1,429) | (1,276) |
48,302 | 45,874 | |
Common equity tier 1: regulatory adjustments | ||
Cash flow hedge reserve | 2,062 | 3,755 |
Goodwill and other intangible assets | (5,996) | (5,679) |
Prudent valuation adjustment | (343) | (354) |
Excess of expected losses over impairment provisions and value adjustments | (631) | (270) |
Removal of defined benefit pension surplus | (1,968) | (2,215) |
Significant investments1 | (4,708) | (5,024) |
Deferred tax assets | (3,812) | (4,025) |
Other regulatory adjustments | 24 | (83) |
Common equity tier 1 capital | ||
Additional tier 1: instruments | ||
Other equity instruments | 5,923 | 6,170 |
Additional tier 1: regulatory adjustments | ||
Significant investments1 | (800) | (800) |
Total tier 1 capital | 38,053 | 37,349 |
Tier 2: instruments and provisions | ||
Subordinated liabilities | 7,489 | 6,366 |
Tier 2: regulatory adjustments | ||
Significant investments1 | (963) | (964) |
Total capital resources (audited) | 44,579 | 42,751 |
Ineligible AT1 and tier 2 instruments2 | (79) | (94) |
Amortised portion of eligible tier 2 instruments issued by Lloyds Banking Group plc | – | 891 |
Other eligible liabilities issued by Lloyds Banking Group plc3 | 31,232 | 28,675 |
Total MREL resources (unaudited) | 75,732 | 72,223 |
Risk-weighted assets (unaudited) | 235,513 | 224,632 |
Common equity tier 1 capital ratio (unaudited) | 14.0% | 14.2% |
Tier 1 capital ratio (unaudited) | 16.2% | 16.6% |
Total capital ratio (unaudited) | 18.9% | 19.0% |
MREL ratio (unaudited) | 32.2% | 32.2% |
Common equity tier 1 £m | |
At 31 December 2024 | 31,979 |
Banking business profits1 | 4,891 |
Movement in foreseeable dividend accrual2 | (153) |
Dividends paid on ordinary shares during the year | (2,000) |
Adjustment to reflect full impact of share buyback | (1,710) |
Dividends received from the Insurance business3 | 300 |
Movement in treasury shares and employee share schemes | 251 |
Deferred tax asset | 212 |
Goodwill and other intangible assets | (317) |
Excess regulatory expected losses | (361) |
Significant investments | 316 |
Distributions on other equity instruments | (463) |
Other movements | (15) |
At 31 December 2025 | 32,930 |
At 31 Dec 2025 £m | At 31 Dec 2024 £m | |
Foundation Internal Ratings Based (IRB) Approach | 47,782 | 43,366 |
Retail IRB Approach | 90,354 | 90,567 |
Other IRB Approach1 | 23,292 | 21,878 |
IRB Approach | 161,428 | 155,811 |
Standardised (STA) Approach1 | 27,166 | 22,532 |
Credit risk | 188,594 | 178,343 |
Counterparty credit risk2 | 6,835 | 7,046 |
Securitisation | 8,472 | 8,346 |
Market risk | 3,844 | 3,714 |
Operational risk | 27,768 | 27,183 |
Risk-weighted assets | 235,513 | 224,632 |
of which: threshold risk-weighted assets3 | 10,672 | 10,738 |
At 31 Dec 2025 £m | At 31 Dec 2024 £m | ||
Total tier 1 capital | 38,053 | 37,349 | |
Exposure measure | |||
Statutory balance sheet assets | |||
Derivative financial instruments | 19,727 | 24,065 | |
Securities financing transactions | 71,967 | 69,941 | |
Loans and advances and other assets | 852,378 | 812,691 | |
Total statutory balance sheet assets | 944,072 | 906,697 | |
Qualifying central bank claims | (56,231) | (62,396) | |
Deconsolidation adjustments1 | (210,617) | (190,988) | |
Derivatives adjustments | (283) | (6,254) | |
Securities financing transactions adjustments | 2,489 | 3,351 | |
Off-balance sheet items | 44,410 | 40,186 | |
Amounts already deducted from tier 1 capital | (12,622) | (12,395) | |
Other regulatory adjustments2 | (2,879) | (4,127) | |
Total exposure measure | 708,339 | 674,074 | |
Average exposure measure3 | 713,268 | ||
UK leverage ratio | 5.4% | 5.5% | |
Average UK leverage ratio3 | 5.3% | ||
Leverage exposure measure (including central bank claims) | 764,570 | 736,470 | |
Leverage ratio (including central bank claims) | 5.0% | 5.1% | |
Total MREL resources | 75,732 | 72,223 | |
MREL leverage ratio | 10.7% | 10.7% |
| | |
| | |
| Climate risk | |
Definition The Group defines climate risk as the risk from the impacts of climate change and the transition to net zero (‘inbound risk’), or a result of the Group’s response to tackling climate change and supporting the transition to net zero (‘outbound risk’). performance and key mitigating actions. | ||
| | |
| Compliance risk | |
Definition The risk of financial penalties, regulatory censure, criminal or civil enforcement action or customer detriment as a result of failure to identify, assess, correctly interpret, comply with, or manage regulatory and/or legal requirements. Level two risks Legal; Regulatory performance and key mitigating actions. | ||
| | |
| Conduct risk | |
Definition The risk of the Group’s activities, behaviours, strategy or business planning, having an adverse impact on outcomes for customers, undermining the integrity of the market or distort competition, which could lead to regulatory censure, reputational damage or financial loss. Level two risks Colleague; Customer; Market performance and key mitigating actions. | ||
| | |
| Credit risk | |
Definition Credit risk is defined as the risk that parties with whom the Group has contracted fail to meet their financial obligations (on and off-balance sheet). Level two risks performance and key mitigating actions. | ||
| | |
| | |
Financial risk indicators (underlying basisA) •Impairment charge: £795 million (2024: £433 million) •Expected credit loss: £3,353 million (2024: £3,651 million) •Loans and advances in Stage 2: 9.4% (2024: 10.4%) | ||
| | |
| | |
| | |
| | |
| | |
| | |
| | |
| | |
| | |
| | |
| | |
| | |
| | |
Loans and advances to customers £m | Loans and advances to banks £m | Debt securities £m | Financial assets at fair value through other comprehensive income £m | Other £m | Undrawn balances £m | 2025 £m | 2024 £m | ||||||||
UK mortgages | (59) | – | – | – | – | (1) | (60) | (194) | |||||||
Credit cards | 327 | – | – | – | – | (6) | 321 | 270 | |||||||
UK unsecured loans and overdrafts | 269 | – | – | – | – | (12) | 257 | 272 | |||||||
UK Motor Finance | 214 | – | – | – | – | (2) | 212 | 116 | |||||||
Other | 3 | – | – | – | – | 1 | 4 | (7) | |||||||
Retail | 754 | – | – | – | – | (20) | 734 | 457 | |||||||
Business and Commercial Banking | (53) | – | – | – | – | – | (53) | 47 | |||||||
Corporate and Institutional Banking | 166 | – | – | – | – | (53) | 113 | (61) | |||||||
Commercial Banking | 113 | – | – | – | – | (53) | 60 | (14) | |||||||
Insurance, Pensions and Investments | – | – | – | – | 2 | – | 2 | (9) | |||||||
Equity Investments and Central Items | – | – | – | (1) | – | – | (1) | (3) | |||||||
Total impairment charge (credit) | 867 | – | – | (1) | 2 | (73) | 795 | 431 | |||||||
Insurance, Pensions and Investments (underlying basis)A | – | – | – | – | 2 | – | 2 | (7) | |||||||
Total impairment charge (credit) (underlying basis)A | 867 | – | – | (1) | 2 | (73) | 795 | 433 | |||||||
Asset quality ratioA | 0.17% | 0.10% | |||||||||||||
At 31 Dec 2025 £m | At 31 Dec 2024 £m | ||
Customer related balances | |||
Drawn | 3,011 | 3,191 | |
Undrawn | 197 | 270 | |
3,208 | 3,461 | ||
Loans and advances to banks | 1 | 1 | |
Debt securities | 5 | 4 | |
Other assets | 14 | 15 | |
Total expected credit loss allowance | 3,481 | ||
Acquisition fair value adjustment | 125 | 170 | |
Total expected credit loss allowance (underlying basis)A | 3,353 | 3,651 | |
Of which: Customer related balances (underlying basis)A | 3,333 | 3,631 | |
Of which: Drawn (underlying basis)A | 3,136 | 3,361 |
Opening ECL at 31 Dec 2024 £m | Write-offs and other1 £m | Income statement charge (credit) £m | Net ECL increase (decrease) £m | Closing ECL at 31 Dec 2025 £m | |||||||
UK mortgages | 852 | (61) | (60) | (121) | |||||||
Credit cards | 674 | (392) | 321 | (71) | |||||||
UK unsecured loans and overdrafts | 523 | (282) | 257 | (25) | 498 | ||||||
UK Motor Finance | 360 | (142) | 212 | 70 | 430 | ||||||
Other | 67 | (8) | 4 | (4) | 63 | ||||||
Retail | 2,476 | (885) | 734 | (151) | 2,325 | ||||||
Business and Commercial Banking | 485 | (55) | (53) | (108) | 377 | ||||||
Corporate and Institutional Banking | 504 | (106) | 113 | 7 | 511 | ||||||
Commercial Banking | 989 | (161) | 60 | (101) | |||||||
Insurance, Pensions and Investments | 15 | (3) | 2 | (1) | 14 | ||||||
Equity Investments and Central Items | 1 | 1 | (1) | – | 1 | ||||||
Total2 | 3,481 | (1,048) | 795 | (253) | |||||||
UK mortgages (underlying basis)A | 1,022 | (106) | (60) | (166) | 856 | ||||||
Retail (underlying basis)A | 2,646 | (930) | 734 | (196) | 2,450 | ||||||
Insurance, Pensions and Investments (underlying basis)A | 15 | (3) | 2 | (1) | 14 | ||||||
Total (underlying basis)A | 3,651 | (1,093) | 795 | (298) | 3,353 | ||||||
Probability- weighted £m | Upside £m | Base case £m | Downside £m | Severe downside £m | |
UK mortgages | 731 | 341 | 510 | 937 | 1,943 |
Credit cards | 603 | 498 | 579 | 674 | 777 |
Other Retail | 991 | 922 | 969 | 1,036 | 1,126 |
Commercial Banking | 888 | 690 | 789 | 1,010 | 1,414 |
Other | 15 | 15 | 15 | 15 | 15 |
At 31 December 2025 | 3,228 | 2,466 | 2,862 | 3,672 | 5,275 |
UK mortgages (underlying basis)A | 856 | 466 | 635 | 1,062 | 2,068 |
At 31 December 2025 (underlying basis)A | 3,353 | 2,591 | 2,987 | 3,797 | 5,400 |
UK mortgages | 852 | 345 | 567 | 1,064 | 2,596 |
Credit cards | 674 | 518 | 641 | 773 | 945 |
Other Retail | 950 | 843 | 923 | 1,010 | 1,172 |
Commercial Banking | 989 | 745 | 889 | 1,125 | 1,608 |
Other | 16 | 16 | 16 | 16 | 17 |
At 31 December 2024 | 3,481 | 2,467 | 3,036 | 3,988 | 6,338 |
UK mortgages (underlying basis)A | 1,022 | 512 | 735 | 1,235 | 2,773 |
At 31 December 2024 (underlying basis)A | 3,651 | 2,634 | 3,204 | 4,159 | 6,515 |
Gross loans and advances to customers | Expected credit loss allowance on drawn balances | ||||||||||||||||||
Stage 1 £m | Stage 2 £m | Stage 3 £m | POCI £m | Total £m | Stage 1 £m | Stage 2 £m | Stage 3 £m | POCI £m | Total £m | ||||||||||
At 31 December 2025 | |||||||||||||||||||
Underlying basisA | 430,493 | 45,413 | 8,349 | – | 484,255 | 737 | 1,107 | 1,292 | – | 3,136 | |||||||||
POCI assets | (644) | (2,734) | (1,823) | 5,201 | – | – | (30) | (254) | 284 | – | |||||||||
Acquisition fair value adjustment | – | – | – | (125) | (125) | – | – | – | (125) | (125) | |||||||||
Continuing involvement asset | 344 | – | – | – | 344 | – | – | – | – | – | |||||||||
(300) | (2,734) | (1,823) | 5,076 | 219 | – | (30) | (254) | 159 | (125) | ||||||||||
Statutory basis | 430,193 | 42,679 | 6,526 | 5,076 | 484,474 | 737 | 1,077 | 1,038 | 159 | 3,011 | |||||||||
At 31 December 2024 | |||||||||||||||||||
Underlying basisA | 405,324 | 48,075 | 9,021 | – | 462,420 | 736 | 1,199 | 1,426 | – | 3,361 | |||||||||
POCI assets | (762) | (3,310) | (2,305) | 6,377 | – | – | (39) | (318) | 357 | – | |||||||||
Acquisition fair value adjustment | – | – | – | (170) | (170) | – | – | – | (170) | (170) | |||||||||
Continuing involvement asset | 798 | – | – | – | 798 | – | – | – | – | – | |||||||||
36 | (3,310) | (2,305) | 6,207 | 628 | – | (39) | (318) | 187 | (170) | ||||||||||
Statutory basis | 405,360 | 44,765 | 6,716 | 6,207 | 463,048 | 736 | 1,160 | 1,108 | 187 | 3,191 | |||||||||
At 31 December 2025 | Stage 1 £m | Stage 2 £m | Stage 3 £m | POCI £m | Total £m | Stage 2 as % of total | Stage 3 as % of total | ||||||
Loans and advances to customers | |||||||||||||
UK mortgages | 284,307 | 30,414 | 4,016 | 5,076 | 323,813 | 9.4 | 1.2 | ||||||
Credit cards | 15,258 | 2,326 | 274 | – | 17,858 | 13.0 | 1.5 | ||||||
UK unsecured loans and overdrafts | 10,601 | 1,397 | 193 | – | 12,191 | 11.5 | 1.6 | ||||||
UK Motor Finance | 14,222 | 2,786 | 141 | – | 17,149 | 16.2 | 0.8 | ||||||
Other | 21,245 | 392 | 145 | – | 21,782 | 1.8 | 0.7 | ||||||
Retail | 345,633 | 37,315 | 4,769 | 5,076 | 392,793 | 9.5 | 1.2 | ||||||
Business and Commercial Banking | 24,362 | 3,329 | 979 | – | 28,670 | 11.6 | 3.4 | ||||||
Corporate and Institutional Banking | 59,658 | 2,035 | 778 | – | 62,471 | 3.3 | 1.2 | ||||||
Commercial Banking | 84,020 | 5,364 | 1,757 | – | 91,141 | 5.9 | 1.9 | ||||||
Equity Investments and Central Items1 | 540 | – | – | – | 540 | – | – | ||||||
Total gross lending | 430,193 | 42,679 | 6,526 | 5,076 | 484,474 | 8.8 | 1.3 | ||||||
UK mortgages (underlying basis)A,2 | 284,951 | 33,148 | 5,839 | 323,938 | 10.2 | 1.8 | |||||||
UK Motor Finance (underlying basis)A,3 | 13,878 | 2,786 | 141 | 16,805 | 16.6 | 0.8 | |||||||
Retail (underlying basis)A | 345,933 | 40,049 | 6,592 | 392,574 | 10.2 | 1.7 | |||||||
Total gross lending (underlying basis)A | 430,493 | 45,413 | 8,349 | 484,255 | 9.4 | 1.7 | |||||||
Customer related ECL allowance (drawn and undrawn) | |||||||||||||
UK mortgages | 55 | 208 | 309 | 159 | |||||||||
Credit cards | 205 | 277 | 121 | – | |||||||||
UK unsecured loans and overdrafts | 172 | 214 | 112 | – | 498 | ||||||||
UK Motor Finance4 | 202 | 149 | 79 | – | 430 | ||||||||
Other | 17 | 11 | 35 | – | 63 | ||||||||
Retail | 651 | 859 | 656 | 159 | 2,325 | ||||||||
Business and Commercial Banking | 92 | 165 | 120 | – | 377 | ||||||||
Corporate and Institutional Banking | 107 | 136 | 263 | – | 506 | ||||||||
Commercial Banking | 199 | 301 | 383 | – | 883 | ||||||||
Equity Investments and Central Items | – | – | – | – | – | ||||||||
Total | 850 | 1,160 | 1,039 | 159 | 3,208 | ||||||||
UK mortgages (underlying basis)A,2 | 55 | 238 | 563 | 856 | |||||||||
UK Motor Finance (underlying basis)A,3 | 202 | 149 | 79 | 430 | |||||||||
Retail (underlying basis)A | 651 | 889 | 910 | 2,450 | |||||||||
Total (underlying basis)A | 850 | 1,190 | 1,293 | 3,333 | |||||||||
Customer related ECL allowance (drawn and undrawn) as a percentage of loans and advances to customers | |||||||||||||
Stage 1 % | Stage 2 % | Stage 3 % | POCI % | Total % | Adjusted Stage 35 % | Adjusted Total5 % | |||||||
UK mortgages | – | 0.7 | 7.7 | 3.1 | 0.2 | ||||||||
Credit cards | 1.3 | 11.9 | 44.2 | – | 3.4 | 45.7 | 3.4 | ||||||
UK unsecured loans and overdrafts | 1.6 | 15.3 | 58.0 | – | 4.1 | 60.5 | 4.1 | ||||||
UK Motor Finance | 1.4 | 5.3 | 56.0 | – | 2.5 | ||||||||
Other | 0.1 | 2.8 | 24.1 | – | 0.3 | ||||||||
Retail | 0.2 | 2.3 | 13.8 | 3.1 | 0.6 | 13.8 | 0.6 | ||||||
Business and Commercial Banking | 0.4 | 5.0 | 12.3 | – | 1.3 | 15.7 | 1.3 | ||||||
Corporate and Institutional Banking | 0.2 | 6.7 | 33.8 | – | 0.8 | 33.8 | 0.8 | ||||||
Commercial Banking | 0.2 | 5.6 | 21.8 | – | 1.0 | 24.9 | 1.0 | ||||||
Equity Investments and Central Items | – | – | – | – | – | ||||||||
Total | 0.2 | 2.7 | 15.9 | 3.1 | 0.7 | 16.5 | 0.7 | ||||||
UK mortgages (underlying basis)A,2 | – | 0.7 | 9.6 | 0.3 | |||||||||
UK Motor Finance (underlying basis)A,3 | 1.5 | 5.3 | 56.0 | 2.6 | |||||||||
Retail (underlying basis)A | 0.2 | 2.2 | 13.8 | 0.6 | 13.8 | 0.6 | |||||||
Total (underlying basis)A | 0.2 | 2.6 | 15.5 | 0.7 | 15.9 | 0.7 | |||||||
At 31 December 2024 | Stage 1 £m | Stage 2 £m | Stage 3 £m | POCI £m | Total £m | Stage 2 as % of total | Stage 3 as % of total | ||||||
Loans and advances to customers | |||||||||||||
UK mortgages | 269,760 | 32,995 | 4,166 | 6,207 | 313,128 | 10.5 | 1.3 | ||||||
Credit cards | 13,534 | 2,441 | 265 | – | 16,240 | 15.0 | 1.6 | ||||||
UK unsecured loans and overdrafts | 9,314 | 1,247 | 175 | – | 10,736 | 11.6 | 1.6 | ||||||
UK Motor Finance | 13,897 | 2,398 | 124 | – | 16,419 | 14.6 | 0.8 | ||||||
Other | 17,373 | 516 | 147 | – | 18,036 | 2.9 | 0.8 | ||||||
Retail | 323,878 | 39,597 | 4,877 | 6,207 | 374,559 | 10.6 | 1.3 | ||||||
Business and Commercial Banking | 25,785 | 3,172 | 1,197 | – | 30,154 | 10.5 | 4.0 | ||||||
Corporate and Institutional Banking | 55,692 | 1,996 | 642 | – | 58,330 | 3.4 | 1.1 | ||||||
Commercial Banking | 81,477 | 5,168 | 1,839 | – | 88,484 | 5.8 | 2.1 | ||||||
Equity Investments and Central Items1 | 5 | – | – | – | 5 | – | – | ||||||
Total gross lending | 405,360 | 44,765 | 6,716 | 6,207 | 463,048 | 9.7 | 1.5 | ||||||
UK mortgages (underlying basis)A,2 | 270,522 | 36,305 | 6,471 | 313,298 | 11.6 | 2.1 | |||||||
UK Motor Finance (underlying basis)A,3 | 13,099 | 2,398 | 124 | 15,621 | 15.4 | 0.8 | |||||||
Retail (underlying basis)A | 323,842 | 42,907 | 7,182 | 373,931 | 11.5 | 1.9 | |||||||
Total gross lending (underlying basis)A | 405,324 | 48,075 | 9,021 | 462,420 | 10.4 | 2.0 | |||||||
Customer related ECL allowance (drawn and undrawn) | |||||||||||||
UK mortgages | 55 | 275 | 335 | 187 | 852 | ||||||||
Credit cards | 210 | 331 | 133 | – | 674 | ||||||||
UK unsecured loans and overdrafts | 170 | 235 | 118 | – | 523 | ||||||||
UK Motor Finance4 | 173 | 115 | 72 | – | 360 | ||||||||
Other | 16 | 14 | 37 | – | 67 | ||||||||
Retail | 624 | 970 | 695 | 187 | 2,476 | ||||||||
Business and Commercial Banking | 132 | 187 | 166 | – | 485 | ||||||||
Corporate and Institutional Banking | 122 | 129 | 249 | – | 500 | ||||||||
Commercial Banking | 254 | 316 | 415 | – | 985 | ||||||||
Equity Investments and Central Items | – | – | – | – | – | ||||||||
Total | 878 | 1,286 | 1,110 | 187 | 3,461 | ||||||||
UK mortgages (underlying basis)A,2 | 55 | 314 | 653 | 1,022 | |||||||||
UK Motor Finance (underlying basis)A,3 | 173 | 115 | 72 | 360 | |||||||||
Retail (underlying basis)A | 624 | 1,009 | 1,013 | 2,646 | |||||||||
Total (underlying basis)A | 878 | 1,325 | 1,428 | 3,631 | |||||||||
Customer related ECL allowance (drawn and undrawn) as a percentage of loans and advances to customers | |||||||||||||
Stage 1 % | Stage 2 % | Stage 3 % | POCI % | Total % | Adjusted Stage 35 % | Adjusted Total5 % | |||||||
UK mortgages | – | 0.8 | 8.0 | 3.0 | 0.3 | ||||||||
Credit cards | 1.6 | 13.6 | 50.2 | – | 4.2 | ||||||||
UK unsecured loans and overdrafts | 1.8 | 18.8 | 67.4 | – | 4.9 | ||||||||
UK Motor Finance | 1.2 | 4.8 | 58.1 | – | 2.2 | ||||||||
Other | 0.1 | 2.7 | 25.2 | – | 0.4 | ||||||||
Retail | 0.2 | 2.4 | 14.3 | 3.0 | 0.7 | ||||||||
Business and Commercial Banking | 0.5 | 5.9 | 13.9 | – | 1.6 | 18.4 | 1.6 | ||||||
Corporate and Institutional Banking | 0.2 | 6.5 | 38.8 | – | 0.9 | 38.8 | 0.9 | ||||||
Commercial Banking | 0.3 | 6.1 | 22.6 | – | 1.1 | 26.9 | 1.1 | ||||||
Equity Investments and Central Items | – | – | – | – | – | ||||||||
Total | 0.2 | 2.9 | 16.5 | 3.0 | 0.7 | 17.3 | 0.7 | ||||||
UK mortgages (underlying basis)A,2 | – | 0.9 | 10.1 | 0.3 | |||||||||
UK Motor Finance (underlying basis)A,3 | 1.3 | 4.8 | 58.1 | 2.3 | |||||||||
Retail (underlying basis)A | 0.2 | 2.4 | 14.1 | 0.7 | |||||||||
Total (underlying basis)A | 0.2 | 2.8 | 15.8 | 0.8 | 16.4 | 0.8 | |||||||
Up-to-date | 1-30 days past due2 | Over 30 days past due | |||||||||||||||||||||
PD movements | Other1 | ||||||||||||||||||||||
Gross lending £m | ECL3 £m | As % of gross lending | Gross lending £m | ECL3 £m | As % of gross lending | Gross lending £m | ECL3 £m | As % of gross lending | Gross lending £m | ECL3 £m | As % of gross lending | ||||||||||||
At 31 December 2025 | |||||||||||||||||||||||
UK mortgages | 26,298 | 155 | 0.6 | 2,032 | 13 | 0.6 | 1,130 | 18 | 1.6 | 954 | 22 | 2.3 | |||||||||||
Credit cards | 2,048 | 202 | 9.9 | 144 | 36 | 25.0 | 94 | 23 | 24.5 | 40 | 16 | 40.0 | |||||||||||
UK unsecured loans and overdrafts | 666 | 116 | 17.4 | 559 | 53 | 9.5 | 129 | 31 | 24.0 | 43 | 14 | 32.6 | |||||||||||
UK Motor Finance | 1,325 | 69 | 5.2 | 1,293 | 40 | 3.1 | 136 | 29 | 21.3 | 32 | 11 | 34.4 | |||||||||||
Other | 62 | 2 | 3.2 | 305 | 6 | 2.0 | 11 | 1 | 9.1 | 14 | 2 | 14.3 | |||||||||||
Retail | 30,399 | 544 | 1.8 | 4,333 | 148 | 3.4 | 1,500 | 102 | 6.8 | 1,083 | 65 | 6.0 | |||||||||||
Business and Commercial Banking | 2,767 | 133 | 4.8 | 258 | 15 | 5.8 | 213 | 12 | 5.6 | 91 | 5 | 5.5 | |||||||||||
Corporate and Institutional Banking | 1,888 | 135 | 7.2 | 21 | – | – | 7 | 1 | 14.3 | 119 | – | 0.0 | |||||||||||
Commercial Banking | 4,655 | 268 | 5.8 | 279 | 15 | 5.4 | 220 | 13 | 5.9 | 210 | 5 | 2.4 | |||||||||||
Total | 35,054 | 812 | 2.3 | 4,612 | 163 | 3.5 | 1,720 | 115 | 6.7 | 1,293 | 70 | 5.4 | |||||||||||
UK mortgages (underlying basis)A | 28,460 | 172 | 0.6 | 2,163 | 19 | 0.9 | 1,373 | 21 | 1.5 | 1,152 | 26 | 2.3 | |||||||||||
Retail (underlying basis)A | 32,561 | 561 | 1.7 | 4,464 | 154 | 3.4 | 1,743 | 105 | 6.0 | 1,281 | 69 | 5.4 | |||||||||||
Total (underlying basis)A | 37,216 | 829 | 2.2 | 4,743 | 169 | 3.6 | 1,963 | 118 | 6.0 | 1,491 | 74 | 5.0 | |||||||||||
At 31 December 2024 | |||||||||||||||||||||||
UK mortgages | 28,909 | 191 | 0.7 | 1,869 | 38 | 2.0 | 1,240 | 22 | 1.8 | 977 | 24 | 2.5 | |||||||||||
Credit cards | 2,174 | 248 | 11.4 | 149 | 43 | 28.9 | 83 | 24 | 28.9 | 35 | 16 | 45.7 | |||||||||||
UK unsecured loans and overdrafts | 630 | 129 | 20.5 | 439 | 52 | 11.8 | 131 | 36 | 27.5 | 47 | 18 | 38.3 | |||||||||||
UK Motor Finance | 1,192 | 49 | 4.1 | 1,029 | 30 | 2.9 | 141 | 25 | 17.7 | 36 | 11 | 30.6 | |||||||||||
Other | 103 | 3 | 2.9 | 321 | 7 | 2.2 | 37 | 2 | 5.4 | 55 | 2 | 3.6 | |||||||||||
Retail | 33,008 | 620 | 1.9 | 3,807 | 170 | 4.5 | 1,632 | 109 | 6.7 | 1,150 | 71 | 6.2 | |||||||||||
Business and Commercial Banking | 2,445 | 154 | 6.3 | 426 | 18 | 4.2 | 176 | 10 | 5.7 | 125 | 5 | 4.0 | |||||||||||
Corporate and Institutional Banking | 1,903 | 125 | 6.6 | 45 | 1 | 2.2 | 6 | – | – | 42 | 3 | 7.1 | |||||||||||
Commercial Banking | 4,348 | 279 | 6.4 | 471 | 19 | 4.0 | 182 | 10 | 5.5 | 167 | 8 | 4.8 | |||||||||||
Total | 37,356 | 899 | 2.4 | 4,278 | 189 | 4.4 | 1,814 | 119 | 6.6 | 1,317 | 79 | 6.0 | |||||||||||
UK mortgages (underlying basis)A | 31,510 | 216 | 0.7 | 2,000 | 41 | 2.1 | 1,559 | 27 | 1.7 | 1,236 | 30 | 2.4 | |||||||||||
Retail (underlying basis)A | 35,609 | 645 | 1.8 | 3,938 | 173 | 4.4 | 1,951 | 114 | 5.8 | 1,409 | 77 | 5.5 | |||||||||||
Total (underlying basis)A | 39,957 | 924 | 2.3 | 4,409 | 192 | 4.4 | 2,133 | 124 | 5.8 | 1,576 | 85 | 5.4 | |||||||||||
Gross carrying amount | Allowance for expected credit losses | ||||||||||||||||||
Stage 1 £m | Stage 2 £m | Stage 3 £m | POCI £m | Total £m | Stage 1 £m | Stage 2 £m | Stage 3 £m | POCI £m | Total £m | ||||||||||
At 1 January 2025 | |||||||||||||||||||
Exchange and other adjustments1 | ( | ( | ( | ||||||||||||||||
Transfers to Stage 1 | ( | ( | ( | ( | |||||||||||||||
Transfers to Stage 2 | ( | ( | ( | ( | |||||||||||||||
Transfers to Stage 3 | ( | ( | ( | ( | |||||||||||||||
Net change in ECL due to transfers | ( | ||||||||||||||||||
Impact of transfers between stages2 | ( | ( | ( | ||||||||||||||||
Other changes in credit quality2 | ( | ||||||||||||||||||
Additions and repayments | ( | ( | ( | ( | ( | ( | ( | ( | |||||||||||
Charge (credit) to the income statement | ( | ( | |||||||||||||||||
Disposals and derecognition | |||||||||||||||||||
Advances written off | ( | ( | ( | ( | ( | ( | |||||||||||||
Recoveries of amounts previously written off | |||||||||||||||||||
At 31 December 2025 | |||||||||||||||||||
Allowance for expected credit losses | ( | ( | ( | ( | ( | ||||||||||||||
Net carrying amount | |||||||||||||||||||
Drawn ECL coverage3 (%) | |||||||||||||||||||
Gross carrying amount | Allowance for expected credit losses | ||||||||||||||||||
Stage 1 £m | Stage 2 £m | Stage 3 £m | POCI £m | Total £m | Stage 1 £m | Stage 2 £m | Stage 3 £m | POCI £m | Total £m | ||||||||||
At 1 January 2024 | |||||||||||||||||||
Exchange and other adjustments1 | ( | ( | ( | ( | ( | ( | |||||||||||||
Transfers to Stage 1 | ( | ( | ( | ( | |||||||||||||||
Transfers to Stage 2 | ( | ( | ( | ( | |||||||||||||||
Transfers to Stage 3 | ( | ( | ( | ( | |||||||||||||||
Net change in ECL due to transfers | ( | ||||||||||||||||||
Impact of transfers between stages2 | ( | ( | ( | ||||||||||||||||
Other changes in credit quality2 | ( | ( | |||||||||||||||||
Additions and repayments | ( | ( | ( | ( | ( | ( | ( | ( | |||||||||||
Charge (credit) to the income statement | ( | ( | ( | ||||||||||||||||
Disposals and derecognition3 | ( | ( | ( | ( | ( | ( | ( | ( | ( | ( | |||||||||
Advances written off | ( | ( | ( | ( | ( | ( | |||||||||||||
Recoveries of amounts previously written off | |||||||||||||||||||
At 31 December 2024 | |||||||||||||||||||
Allowance for expected credit losses | ( | ( | ( | ( | ( | ||||||||||||||
Net carrying amount | |||||||||||||||||||
Drawn ECL coverage4 (%) | |||||||||||||||||||
2025 £m | 2024 £m | |
Agriculture, forestry and fishing | ||
Construction1 | ||
Energy and water supply | ||
Financial, business and other services | ||
Manufacturing | ||
Mining and Quarrying | ||
Personal: | ||
Mortgages1 | ||
Lease financing2 | ||
Other | ||
Postal and telecommunications | ||
Property companies | ||
Transport, distribution and hotels | ||
Total loans and advances to customers before allowance for impairment losses | ||
Allowance for impairment losses (note 21 to the consolidated financial statements, page 272) | ( | ( |
Total loans and advances to customers |
Retail | Commercial | |||
Quality classification | IFRS 9 PD range | Quality classification | IFRS 9 PD range | |
RMS 1–3 | CMS 1–5 | |||
RMS 4–6 | CMS 6–10 | |||
RMS 7–9 | CMS 11–14 | |||
RMS 10 | CMS 15–18 | |||
RMS 11–13 | CMS 19 | |||
RMS 14 | CMS 20–23 |
Drawn exposures | Allowance for expected credit losses | ||||||||||||||||||
Gross drawn exposures and expected credit loss allowance (audited) | Stage 1 £m | Stage 2 £m | Stage 3 £m | POCI £m | Total £m | Stage 1 £m | Stage 2 £m | Stage 3 £m | POCI £m | Total £m | |||||||||
At 31 December 2025 | |||||||||||||||||||
Retail – UK mortgages | |||||||||||||||||||
RMS 1–3 | |||||||||||||||||||
RMS 4–6 | |||||||||||||||||||
RMS 7–9 | |||||||||||||||||||
RMS 10 | |||||||||||||||||||
RMS 11–13 | |||||||||||||||||||
RMS 14 | |||||||||||||||||||
Retail – credit cards | |||||||||||||||||||
RMS 1–3 | |||||||||||||||||||
RMS 4–6 | |||||||||||||||||||
RMS 7–9 | |||||||||||||||||||
RMS 10 | |||||||||||||||||||
RMS 11–13 | |||||||||||||||||||
RMS 14 | |||||||||||||||||||
Retail – UK unsecured loans and overdrafts | |||||||||||||||||||
RMS 1–3 | |||||||||||||||||||
RMS 4–6 | |||||||||||||||||||
RMS 7–9 | |||||||||||||||||||
RMS 10 | |||||||||||||||||||
RMS 11–13 | |||||||||||||||||||
RMS 14 | |||||||||||||||||||
Retail – UK Motor Finance | |||||||||||||||||||
RMS 1–3 | |||||||||||||||||||
RMS 4–6 | |||||||||||||||||||
RMS 7–9 | |||||||||||||||||||
RMS 10 | |||||||||||||||||||
RMS 11–13 | |||||||||||||||||||
RMS 14 | |||||||||||||||||||
Retail – other | |||||||||||||||||||
RMS 1–3 | |||||||||||||||||||
RMS 4–6 | |||||||||||||||||||
RMS 7–9 | |||||||||||||||||||
RMS 10 | |||||||||||||||||||
RMS 11–13 | |||||||||||||||||||
RMS 14 | |||||||||||||||||||
Total Retail | |||||||||||||||||||
Commercial Banking | |||||||||||||||||||
CMS 1–5 | |||||||||||||||||||
CMS 6–10 | |||||||||||||||||||
CMS 11–14 | |||||||||||||||||||
CMS 15–18 | |||||||||||||||||||
CMS 19 | |||||||||||||||||||
CMS 20–23 | |||||||||||||||||||
Other1 | |||||||||||||||||||
Total loans and advances to customers | |||||||||||||||||||
Drawn exposures | Allowance for expected credit losses | ||||||||||||||||||
Gross drawn exposures and expected credit loss allowance (audited) | Stage 1 £m | Stage 2 £m | Stage 3 £m | POCI £m | Total £m | Stage 1 £m | Stage 2 £m | Stage 3 £m | POCI £m | Total £m | |||||||||
At 31 December 2024 | |||||||||||||||||||
Retail – UK mortgages | |||||||||||||||||||
RMS 1–3 | |||||||||||||||||||
RMS 4–6 | |||||||||||||||||||
RMS 7–9 | |||||||||||||||||||
RMS 10 | |||||||||||||||||||
RMS 11–13 | |||||||||||||||||||
RMS 14 | |||||||||||||||||||
Retail – credit cards | |||||||||||||||||||
RMS 1–3 | |||||||||||||||||||
RMS 4–6 | |||||||||||||||||||
RMS 7–9 | |||||||||||||||||||
RMS 10 | |||||||||||||||||||
RMS 11–13 | |||||||||||||||||||
RMS 14 | |||||||||||||||||||
Retail – UK unsecured loans and overdrafts | |||||||||||||||||||
RMS 1–3 | |||||||||||||||||||
RMS 4–6 | |||||||||||||||||||
RMS 7–9 | |||||||||||||||||||
RMS 10 | |||||||||||||||||||
RMS 11–13 | |||||||||||||||||||
RMS 14 | |||||||||||||||||||
Retail – UK Motor Finance | |||||||||||||||||||
RMS 1–3 | |||||||||||||||||||
RMS 4–6 | |||||||||||||||||||
RMS 7–9 | |||||||||||||||||||
RMS 10 | |||||||||||||||||||
RMS 11–13 | |||||||||||||||||||
RMS 14 | |||||||||||||||||||
Retail – other | |||||||||||||||||||
RMS 1–3 | |||||||||||||||||||
RMS 4–6 | |||||||||||||||||||
RMS 7–9 | |||||||||||||||||||
RMS 10 | |||||||||||||||||||
RMS 11–13 | |||||||||||||||||||
RMS 14 | |||||||||||||||||||
Total Retail | |||||||||||||||||||
Commercial Banking | |||||||||||||||||||
CMS 1–5 | |||||||||||||||||||
CMS 6–10 | |||||||||||||||||||
CMS 11–14 | |||||||||||||||||||
CMS 15–18 | |||||||||||||||||||
CMS 19 | |||||||||||||||||||
CMS 20–23 | |||||||||||||||||||
Other1 | |||||||||||||||||||
Total loans and advances to customers | |||||||||||||||||||
| | |
| | |
Gross carrying amount | Allowance for expected credit losses | ||||||||||||||||||
Stage 1 £m | Stage 2 £m | Stage 3 £m | POCI £m | Total £m | Stage 1 £m | Stage 2 £m | Stage 3 £m | POCI £m | Total £m | ||||||||||
Retail – UK mortgages | |||||||||||||||||||
At 1 January 2025 | |||||||||||||||||||
Exchange and other adjustments1 | ( | ( | |||||||||||||||||
Transfers to Stage 1 | ( | ( | ( | ( | |||||||||||||||
Transfers to Stage 2 | ( | ( | ( | ( | |||||||||||||||
Transfers to Stage 3 | ( | ( | ( | ||||||||||||||||
Net change in ECL due to transfers | ( | ||||||||||||||||||
Impact of transfers between stages2 | ( | ( | |||||||||||||||||
Other changes in credit quality2 | ( | ( | |||||||||||||||||
Additions and repayments | ( | ( | ( | ( | ( | ( | ( | ||||||||||||
Charge (credit) to the income statement | ( | ( | ( | ( | |||||||||||||||
Advances written off | ( | ( | ( | ( | ( | ( | |||||||||||||
Recoveries of amounts previously written off | |||||||||||||||||||
At 31 December 2025 | |||||||||||||||||||
Allowance for expected credit losses | ( | ( | ( | ( | ( | ||||||||||||||
Net carrying amount | |||||||||||||||||||
Drawn ECL coverage3 (%) | |||||||||||||||||||
Gross carrying amount | Allowance for expected credit losses | ||||||||||||||||||
Stage 1 £m | Stage 2 £m | Stage 3 £m | POCI £m | Total £m | Stage 1 £m | Stage 2 £m | Stage 3 £m | POCI £m | Total £m | ||||||||||
Retail – UK mortgages | |||||||||||||||||||
At 1 January 2024 | |||||||||||||||||||
Exchange and other adjustments1 | |||||||||||||||||||
Transfers to Stage 1 | ( | ( | ( | ( | |||||||||||||||
Transfers to Stage 2 | ( | ( | ( | ( | |||||||||||||||
Transfers to Stage 3 | ( | ( | ( | ||||||||||||||||
Net change in ECL due to transfers | ( | ||||||||||||||||||
Impact of transfers between stages2 | ( | ( | ( | ||||||||||||||||
Other changes in credit quality2 | ( | ( | ( | ||||||||||||||||
Additions and repayments | ( | ( | ( | ( | ( | ( | ( | ( | |||||||||||
Charge (credit) to the income statement | ( | ( | ( | ( | |||||||||||||||
Disposals and derecognition3 | ( | ( | ( | ( | ( | ( | ( | ( | ( | ( | |||||||||
Advances written off | ( | ( | ( | ( | ( | ( | |||||||||||||
Recoveries of amounts previously written off | |||||||||||||||||||
At 31 December 2024 | |||||||||||||||||||
Allowance for expected credit losses | ( | ( | ( | ( | ( | ||||||||||||||
Net carrying amount | |||||||||||||||||||
Drawn ECL coverage4 (%) | |||||||||||||||||||
At 31 December 2025 | At 31 December 20241 | ||||||||
Mainstream | Buy-to-let | Specialist | Total | Mainstream | Buy-to-let | Specialist | Total | ||
UK mortgages loans and advances to customers (£m) | 273,106 | 47,858 | 2,849 | 323,813 | 261,630 | 47,984 | 3,514 | 313,128 | |
UK mortgages greater than 3 months in arrears2 | |||||||||
Number of cases | 17,070 | 3,351 | 2,208 | 22,629 | 20,112 | 4,511 | 2,818 | 27,441 | |
Total mortgages accounts (%) | 1.0 | 1.0 | 8.6 | 1.1 | 1.2 | 1.2 | 9.2 | 1.3 | |
Value of loans3 (£m) | 2,518 | 486 | 397 | 3,401 | 2,850 | 623 | 504 | 3,977 | |
Total mortgage balances (%) | 0.9 | 1.0 | 13.9 | 1.1 | 1.1 | 1.3 | 14.3 | 1.3 | |
Loan to value | |||||||||
Less than 60% | 52.0 | 64.1 | 90.0 | 54.2 | 55.6 | 68.5 | 89.4 | 57.9 | |
60% to 70% | 15.4 | 21.4 | 6.4 | 16.2 | 16.7 | 21.1 | 6.9 | 17.2 | |
70% to 80% | 15.5 | 14.4 | 2.0 | 15.2 | 14.1 | 10.3 | 2.0 | 13.4 | |
80% to 90% | 14.4 | 0.1 | 0.9 | 12.2 | 11.9 | 0.1 | 0.9 | 10.0 | |
90% to 100% | 2.7 | – | 0.4 | 2.2 | 1.7 | – | 0.5 | 1.5 | |
Greater than 100% | – | – | 0.3 | – | – | – | 0.3 | – | |
Total (%) | 100.0 | 100.0 | 100.0 | 100.0 | 100.0 | 100.0 | 100.0 | 100.0 | |
Average loan to value4 | |||||||||
Stock of residential mortgages (%) | 44.7 | 48.2 | 32.0 | 45.0 | 43.2 | 47.3 | 32.9 | 43.6 | |
New residential lending in the period (%) | 64.7 | 58.8 | n/a | 64.1 | 64.1 | 56.4 | n/a | 63.2 | |
At 31 Dec 2025 | At 31 Dec 2024 | |
Interest-only balances (£m) | 31,319 | 33,023 |
Stage 1 (%) | 46.8 | 39.4 |
Stage 2 (%)1 | 39.0 | 44.5 |
Stage 3 (%) | 5.2 | 5.5 |
Purchased or originated credit-impaired (%) | 9.0 | 10.6 |
Average loan to value (%) | 37.5 | 36.5 |
Maturity profile (£m) | ||
Due | 1,198 | 1,541 |
Within 1 year | 970 | 1,012 |
2 to 5 years | 7,740 | 8,209 |
6 to 10 years | 9,085 | 10,772 |
Greater than 10 years | 12,326 | 11,489 |
Past term interest-only balances (£m)2 | 1,196 | 1,490 |
Stage 1 (%) | 0.5 | 0.3 |
Stage 2 (%) | 8.4 | 8.6 |
Stage 3 (%) | 52.2 | 51.8 |
Purchased or originated credit-impaired (%) | 38.9 | 39.3 |
Average loan to value (%) | 36.9 | 35.2 |
Negative equity (%) | 2.2 | 2.5 |
At 31 December 2025 | At 31 December 2024 | ||||||||||
Stage 1 (£m) | Stage 2 (£m) | Stage 3 (£m) | POCI (£m) | Total (£m) | Stage 1 (£m) | Stage 2 (£m) | Stage 3 (£m) | POCI (£m) | Total (£m) | ||
Gross drawn exposures | |||||||||||
Less than 60% | |||||||||||
60% to 70% | |||||||||||
70% to 80% | |||||||||||
80% to 90% | |||||||||||
90% to 100% | |||||||||||
Greater than 100% | |||||||||||
Total | |||||||||||
Allowance for expected credit losses | |||||||||||
Less than 60% | |||||||||||
60% to 70% | |||||||||||
70% to 80% | |||||||||||
80% to 90% | |||||||||||
90% to 100% | |||||||||||
Greater than 100% | |||||||||||
Total | |||||||||||
EPC profile | A £m | B £m | C £m | D £m | E £m | F £m | G £m | Unrated properties £m | Total |
At 31 December 2025 | |||||||||
At 31 December 2024 |
Gross carrying amount | Allowance for expected credit losses | ||||||||||||||
Stage 1 £m | Stage 2 £m | Stage 3 £m | Total £m | Stage 1 £m | Stage 2 £m | Stage 3 £m | Total £m | ||||||||
Retail – credit cards | |||||||||||||||
At 1 January 2025 | |||||||||||||||
Exchange and other adjustments | ( | ( | |||||||||||||
Transfers to Stage 1 | ( | ( | ( | ( | |||||||||||
Transfers to Stage 2 | ( | ( | ( | ( | |||||||||||
Transfers to Stage 3 | ( | ( | ( | ( | |||||||||||
Net change in ECL due to transfers | ( | ||||||||||||||
Impact of transfers between stages1 | ( | ( | |||||||||||||
Other changes in credit quality1 | ( | ( | |||||||||||||
Additions and repayments | ( | ( | ( | ( | |||||||||||
Charge to the income statement | ( | ( | |||||||||||||
Advances written off | ( | ( | ( | ( | |||||||||||
Recoveries of amounts previously written off | |||||||||||||||
At 31 December 2025 | |||||||||||||||
Allowance for expected credit losses | ( | ( | ( | ( | |||||||||||
Net carrying amount | |||||||||||||||
Drawn ECL coverage2 (%) | |||||||||||||||
Gross carrying amount | Allowance for expected credit losses | ||||||||||||||
Stage 1 £m | Stage 2 £m | Stage 3 £m | Total £m | Stage 1 £m | Stage 2 £m | Stage 3 £m | Total £m | ||||||||
Retail – credit cards | |||||||||||||||
At 1 January 2024 | |||||||||||||||
Exchange and other adjustments | ( | ( | |||||||||||||
Transfers to Stage 1 | ( | ( | |||||||||||||
Transfers to Stage 2 | ( | ( | ( | ( | |||||||||||
Transfers to Stage 3 | ( | ( | ( | ( | |||||||||||
Net changes in ECL due to transfers | ( | ||||||||||||||
Impact of transfers between stages | ( | ( | |||||||||||||
Other changes in credit quality | ( | ( | |||||||||||||
Additions and repayments | ( | ( | ( | ( | ( | ||||||||||
Charge to the income statement | ( | ( | |||||||||||||
Advances written off | ( | ( | ( | ( | |||||||||||
Recoveries of amounts previously written off | |||||||||||||||
At 31 December 2024 | |||||||||||||||
Allowance for expected credit losses | ( | ( | ( | ( | |||||||||||
Net carrying amount | |||||||||||||||
Drawn ECL coverage1 (%) | |||||||||||||||
Gross carrying amount | Allowance for expected credit losses | ||||||||||||||
Stage 1 £m | Stage 2 £m | Stage 3 £m | Total £m | Stage 1 £m | Stage 2 £m | Stage 3 £m | Total £m | ||||||||
Commercial Banking | |||||||||||||||
At 1 January 2025 | |||||||||||||||
Exchange and other adjustments | ( | ( | ( | ( | ( | ( | |||||||||
Transfers to Stage 1 | ( | ( | ( | ( | |||||||||||
Transfers to Stage 2 | ( | ( | ( | ||||||||||||
Transfers to Stage 3 | ( | ( | ( | ( | |||||||||||
Net change in ECL due to transfers | ( | ||||||||||||||
Impact of transfers between stages1 | ( | ||||||||||||||
Other changes in credit quality1 | ( | ( | |||||||||||||
Additions and repayments | ( | ( | ( | ( | ( | ||||||||||
Charge to the income statement | ( | ||||||||||||||
Advances written off | ( | ( | ( | ( | |||||||||||
Recoveries of amounts previously written off | |||||||||||||||
At 31 December 2025 | |||||||||||||||
Allowance for expected credit losses | ( | ( | ( | ( | |||||||||||
Net carrying amount | |||||||||||||||
Drawn ECL coverage2 (%) | |||||||||||||||
Gross carrying amount | Allowance for expected credit losses | ||||||||||||||
Stage 1 £m | Stage 2 £m | Stage 3 £m | Total £m | Stage 1 £m | Stage 2 £m | Stage 3 £m | Total £m | ||||||||
Commercial Banking | |||||||||||||||
At 1 January 2024 | |||||||||||||||
Exchange and other adjustments | ( | ( | ( | ( | ( | ( | ( | ||||||||
Transfers to Stage 1 | ( | ( | ( | ( | |||||||||||
Transfers to Stage 2 | ( | ( | ( | ( | |||||||||||
Transfers to Stage 3 | ( | ( | ( | ( | |||||||||||
Net changes in ECL due to transfers | ( | ||||||||||||||
Impact of transfers between stages1 | ( | ( | |||||||||||||
Other changes in credit quality1 | ( | ( | |||||||||||||
Additions and repayments | ( | ( | ( | ( | ( | ( | ( | ||||||||
Charge to the income statement | ( | ( | |||||||||||||
Advances written off | ( | ( | ( | ( | |||||||||||
Recoveries of amounts previously written off | |||||||||||||||
At 31 December 2024 | |||||||||||||||
Allowance for expected credit losses | ( | ( | ( | ( | |||||||||||
Net carrying amount | |||||||||||||||
Drawn ECL coverage2 (%) | |||||||||||||||
At 31 December 2025 | At 31 December 2024 | ||||||||
Stage 1 and 2 £m | Stage 3 £m | Total £m | Total % | Stage 1 and 2 £m | Stage 3 £m | Total £m | Total % | ||
Less than 60% | 8,894 | 65 | 8,959 | 84.6 | 8,621 | 34 | 8,655 | 84.5 | |
60% to 70% | 712 | 21 | 733 | 6.9 | 815 | 49 | 864 | 8.4 | |
70% to 80% | 53 | 16 | 69 | 0.7 | 166 | 5 | 171 | 1.7 | |
80% to 100% | 40 | 21 | 61 | 0.6 | 40 | 69 | 109 | 1.1 | |
100% to 120% | 5 | 47 | 52 | 0.5 | 7 | 32 | 39 | 0.4 | |
120% to 140% | 1 | — | 1 | – | 5 | — | 5 | – | |
Greater than 140% | 4 | 76 | 80 | 0.8 | 11 | 81 | 92 | 0.9 | |
Unsecured2 | 630 | — | 630 | 6.0 | 303 | — | 303 | 3.0 | |
Subtotal | 10,339 | 246 | 10,585 | 100.0 | 9,968 | 270 | 10,238 | 100.0 | |
Other3 | 721 | 45 | 766 | 525 | 67 | 592 | |||
Total investment | 11,060 | 291 | 11,351 | 10,493 | 337 | 10,830 | |||
Development | 607 | 19 | 626 | 731 | 8 | 739 | |||
Government supported lending4 | 56 | 2 | 58 | 87 | 2 | 89 | |||
Business Banking5 | 528 | 7 | 535 | 704 | 9 | 713 | |||
Total gross | 12,251 | 319 | 12,570 | 12,015 | 356 | 12,371 | |||
Significant Risk Transfer | (2,585) | (3,109) | |||||||
Total net | 9,985 | 9,262 | |||||||
2025 | 2024 | ||||||||||
Investment grade1 £m | Other £m | Total £m | Investment grade1 £m | Other £m | Total £m | ||||||
Other financial assets mandatorily at fair value through profit or loss: | |||||||||||
Debt securities: | |||||||||||
Government securities | |||||||||||
Other public sector securities | |||||||||||
Bank and building society certificates of deposit | |||||||||||
Asset-backed securities | |||||||||||
Corporate and other debt securities | |||||||||||
Treasury and other bills | |||||||||||
Contracts held with reinsurers | |||||||||||
Total other financial assets mandatorily held at fair value through profit or loss (excluding loans and advances and equity shares) | |||||||||||
2025 | 2024 | ||||||||||
Investment grade1 £m | Other £m | Total £m | Investment grade1 £m | Other £m | Total £m | ||||||
Trading and other | |||||||||||
Hedging | |||||||||||
Total derivative financial instruments | |||||||||||
2025 £m | 2024 £m | |
Financial assets at fair value through profit or loss | ||
Financial assets at fair value through other comprehensive income | ||
Total |
| Economic crime risk | |
Definition Economic crime risk is defined as the risk that the Group implements ineffective policies, systems, processes and controls to prevent, detect and respond to the risk of fraud and/or financial crime resulting in increased losses, regulatory censure, fines and/or adverse publicity in the UK or other jurisdictions in which the Group operates. Level two risks Anti-bribery; Anti-money laundering; Fraud; Sanctions risk performance and key mitigating actions. | ||
| | |
| Insurance underwriting risk | |
Definition Insurance underwriting risk is defined as the risk of adverse developments in liabilities due to timing, frequency and severity of claims for insured/ underwritten events, customer behaviour and expense costs. underwriting risk performance and key mitigating actions. | ||
| | |
| | |
| | |
| | |
Financial risk indicators •Life and Pensions sales (present value of new business premiums)A: £21,047 million (2024: £18,249 million) •General insurance underwritten total gross written premiumsA: £762 million (2024: £737 million) | ||
| | |
| Liquidity risk | |
Definition Liquidity risk is the risk that the Group has insufficient financial resources to meet its commitments as they fall due or can only secure them at excessive cost. Level two risks Funding; Liquidity performance and key mitigating actions. | ||
| | |
| | |
Financial risk indicators •Liquidity coverage ratio: 145% (2024: 146%) •Net stable funding ratio: 124% (2024: 129%) •Loan to deposit ratio: 97% (2024: 95%) | ||
| | |
| | |
| | |
| | |
| | |
At 31 Dec 2025 £bn | At 31 Dec 2024 £bn | Change % | |||
Group funding position | |||||
Total Group assets | 944.1 | 906.7 | 4 | ||
Less other liabilities1 | (261.7) | (247.8) | (6) | ||
Funding requirements | 682.4 | 658.9 | 4 | ||
Customer deposits | 496.5 | 482.7 | 3 | ||
Wholesale funding2 | 99.4 | 92.5 | 7 | ||
Repurchase agreements at amortised cost: | |||||
Repurchase agreements – non-trading | 29.8 | 15.9 | 87 | ||
Term Funding Scheme with additional incentives for SMEs (TFSME) | 8.8 | 21.9 | (60) | ||
38.6 | 37.8 | 2 | |||
Total equity | 4 | ||||
Funding sources | 682.4 | 658.9 | 4 |
At 31 December 2025 | At 31 December 2024 | ||||||||||||||
Included in funding analysis £bn | Cash collateral received1 £bn | Fair value and other accounting methods £bn | Balance sheet £bn | Included in funding analysis £bn | Cash collateral received1 £bn | Fair value and other accounting methods £bn | Balance sheet £bn | ||||||||
Deposits from banks | ( | ||||||||||||||
Debt securities in issue | ( | ( | |||||||||||||
Subordinated liabilities | ( | ( | |||||||||||||
Total wholesale funding | |||||||||||||||
Customer deposits | – | – | |||||||||||||
Repurchase agreements at amortised cost | – | – | |||||||||||||
Total equity | – | – | |||||||||||||
Funding Sources | |||||||||||||||
Up to 1 month £bn | 1 to 3 months £bn | 3 to 6 months £bn | 6 to 9 months £bn | 9 to 12 months £bn | 1 to 2 years £bn | 2 to 5 years £bn | Over five years £bn | Total at 31 Dec 2025 £bn | Total at 31 Dec 2024 £bn | ||||||||||
Deposits from banks | 1.6 | 0.4 | 0.8 | 0.9 | 0.1 | – | – | – | 3.8 | 3.1 | |||||||||
Debt securities in issue: | |||||||||||||||||||
Certificates of deposit issued | 0.2 | 1.3 | 2.3 | 1.9 | 1.1 | 0.5 | – | – | 7.3 | 5.5 | |||||||||
Commercial paper | – | 7.0 | 6.3 | 2.3 | 0.3 | – | – | – | 15.9 | 8.3 | |||||||||
Senior unsecured notes issued | – | 0.8 | 2.2 | 1.6 | 0.8 | 9.6 | 15.9 | 12.1 | 43.0 | 46.5 | |||||||||
Covered bonds | – | 0.9 | 0.8 | 0.1 | 1.0 | 3.0 | 4.6 | 0.8 | 11.2 | 11.6 | |||||||||
Securitisation notes | – | – | – | 0.2 | 0.5 | 1.7 | 3.5 | 0.6 | 6.5 | 5.3 | |||||||||
0.2 | 10.0 | 11.6 | 6.1 | 3.7 | 14.8 | 24.0 | 13.5 | 83.9 | 77.2 | ||||||||||
Subordinated liabilities | – | 1.1 | – | 0.5 | – | – | 4.4 | 5.7 | 11.7 | 12.2 | |||||||||
Total wholesale funding | 1.8 | 11.5 | 12.4 | 7.5 | 3.8 | 14.8 | 28.4 | 19.2 | 99.4 | 92.5 |
Sterling £bn | US dollar £bn | Euro £bn | Other currencies £bn | Total £bn | |
At 31 December 2025 | 21.6 | 46.4 | 25.1 | 6.3 | 99.4 |
At 31 December 2024 | 21.0 | 41.5 | 22.6 | 7.4 | 92.5 |
Sterling £bn | US dollar £bn | Euro £bn | Other currencies £bn1 | Total £bn | |
Securitisation2 | 0.8 | – | 0.6 | – | 1.4 |
Covered bonds | 1.0 | – | 0.4 | – | 1.4 |
Senior unsecured notes | 0.8 | 3.7 | 2.5 | 0.7 | 7.7 |
Subordinated liabilities | – | 0.9 | 0.9 | – | 1.8 |
Additional tier 1 | 0.7 | 0.8 | – | – | 1.5 |
Total issuance | 3.3 | 5.4 | 4.4 | 0.7 | 13.8 |
Average1 | Change % | ||
2025 £bn | 2024 £bn | ||
Cash and central bank reserves | 59.3 | 62.0 | (4) |
High quality government/MDB/agency bonds2 | 64.0 | 63.6 | 1 |
High quality covered bonds | 2.5 | 2.9 | (14) |
Level 1 | 125.8 | 128.5 | (2) |
Level 23 | 5.6 | 5.9 | (5) |
Total LCR eligible assets | 131.4 | 134.4 | (2) |
Sterling £bn | US dollar £bn | Euro £bn | Other currencies £bn | Total £bn | |
At 31 December 2025 | |||||
Level 1 | 87.5 | 21.9 | 16.4 | – | 125.8 |
Level 2 | 2.6 | 1.0 | 1.1 | 0.9 | 5.6 |
Total1 | 90.1 | 22.9 | 17.5 | 0.9 | 131.4 |
At 31 December 2024 | |||||
Level 1 | 89.8 | 21.0 | 17.7 | – | 128.5 |
Level 2 | 2.6 | 1.7 | 1.1 | 0.5 | 5.9 |
Total1 | 92.4 | 22.7 | 18.8 | 0.5 | 134.4 |
Up to 1 month £m | 1 to 3 months £m | 3 to 12 months £m | 1 to 5 years £m | Over 5 years £m | Total £m | ||||||
At 31 December 2025 | |||||||||||
Deposits from banks | |||||||||||
Customer deposits | |||||||||||
Repurchase agreements at amortised cost | |||||||||||
Financial liabilities at fair value through profit or loss | |||||||||||
Notes in circulation | |||||||||||
Debt securities in issue at amortised cost | |||||||||||
Liabilities arising from non-participating investment contracts | |||||||||||
Lease liabilities | |||||||||||
Subordinated liabilities | |||||||||||
Total non-derivative financial liabilities | |||||||||||
Derivative financial liabilities | |||||||||||
Gross settled derivatives – outflows | |||||||||||
Gross settled derivatives – inflows | ( | ( | ( | ( | ( | ( | |||||
Gross settled derivatives – net flows | |||||||||||
Net settled derivative liabilities | |||||||||||
Total derivative financial liabilities |
Up to 1 month £m | 1 to 3 months £m | 3 to 12 months £m | 1 to 5 years £m | Over 5 years £m | Total £m | ||||||
At 31 December 2024 | |||||||||||
Deposits from banks | |||||||||||
Customer deposits | |||||||||||
Repurchase agreements at amortised cost | |||||||||||
Financial liabilities at fair value through profit or loss | |||||||||||
Notes in circulation | |||||||||||
Debt securities in issue at amortised cost | |||||||||||
Liabilities arising from non-participating investment contracts | |||||||||||
Lease liabilities | |||||||||||
Subordinated liabilities | |||||||||||
Total non-derivative financial liabilities | |||||||||||
Derivative financial liabilities | |||||||||||
Gross settled derivatives – outflows | |||||||||||
Gross settled derivatives – inflows | ( | ( | ( | ( | ( | ( | |||||
Gross settled derivatives – net flows | |||||||||||
Net settled derivative liabilities | |||||||||||
Total derivative financial liabilities |
Less than 1 year £m | 1 to 2 years £m | 2 to 3 years £m | 3 to 4 years £m | 4 to 5 years £m | Over 5 years £m | Total £m | |
At 31 December 2025 | |||||||
Liabilities arising from insurance and participating investment contracts | ( | ( | ( | ( | ( | ( | ( |
Reinsurance contract liabilities | |||||||
Total | ( | ( | ( | ( | ( | ( | ( |
At 31 December 2024 | |||||||
Liabilities arising from insurance and participating investment contracts | ( | ( | ( | ( | ( | ( | ( |
Reinsurance contract liabilities | |||||||
Total | ( | ( | ( | ( | ( | ( | ( |
2025 | 2024 | ||||
Amounts payable on demand £m | Carrying amount £m | Amounts payable on demand £m | Carrying amount £m | ||
Life | |||||
Non-life | |||||
Total | |||||
Up to 1 month £m | 1 to 3 months £m | 3 to 6 months £m | 6 to 9 months £m | 9 to 12 months £m | 1 to 3 years £m | 3 to 5 years £m | Over 5 years £m | Total £m | |
At 31 December 2025 | |||||||||
Acceptances and endorsements | |||||||||
Other contingent liabilities | |||||||||
Total contingent liabilities | |||||||||
Lending commitments and financial guarantees | |||||||||
Other commitments | |||||||||
Total commitments and financial guarantees | |||||||||
Total contingents, commitments and financial guarantees | |||||||||
At 31 December 2024 | |||||||||
Acceptances and endorsements | |||||||||
Other contingent liabilities | |||||||||
Total contingent liabilities | |||||||||
Lending commitments and financial guarantees | |||||||||
Other commitments | |||||||||
Total commitments and financial guarantees | |||||||||
Total contingents, commitments and financial guarantees |
| Market risk | |
Definition Market risk is defined as the risk that the Group’s capital or earnings profile are adversely affected by changes in market rates or prices, including, but not limited to, interest rates, foreign exchange, equity prices and credit spreads. Level two risks performance and key mitigating actions. | ||
| | |
| | |
Financial risk indicators •Structural hedge: £244 billion (2024: £242 billion) •Average 95% 1-day trading VaR: £2.2 million (2024: £2.4 million) | ||
| | |
Banking | |||||||||
2025 | Total £m | Trading book1 £m | Non- trading £m | Insurance £m | Primary market risk factor | ||||
Assets | |||||||||
Cash and balances at central banks | 56,661 | – | 56,661 | – | Interest rate | ||||
Financial assets at fair value through profit or loss | 240,413 | 25,537 | 5,331 | 209,545 | Interest rate, foreign exchange, credit spread, equity | ||||
Derivative financial instruments | 19,727 | 16,278 | 2,329 | 1,120 | Interest rate, foreign exchange, credit spread | ||||
Financial assets at amortised cost | |||||||||
Loans and advances to banks | 7,236 | – | 7,145 | 91 | Interest rate | ||||
Loans and advances to customers | 481,463 | – | 481,463 | – | Interest rate | ||||
Reverse repurchase agreements | 50,986 | – | 50,986 | – | Interest rate | ||||
Debt securities | 13,987 | – | 13,987 | – | Interest rate, credit spread | ||||
Financial assets at amortised cost | 553,672 | – | 553,581 | 91 | |||||
Financial assets at fair value through other comprehensive income | 36,320 | – | 36,320 | – | Interest rate, foreign exchange, credit spread | ||||
Other assets | 37,279 | – | 30,880 | 6,399 | Interest rate, credit spread | ||||
Total assets | 944,072 | 41,815 | 685,102 | 217,155 | |||||
Liabilities | |||||||||
Deposit from banks | 5,779 | – | 5,779 | – | Interest rate | ||||
Customer deposits | 496,457 | – | 496,457 | – | Interest rate | ||||
Repurchase agreements at amortised cost | 38,570 | – | 38,570 | – | Interest rate | ||||
Financial liabilities at fair value through profit or loss | 27,909 | 23,666 | 4,243 | – | Interest rate, foreign exchange | ||||
Derivative financial instruments | 16,132 | 11,196 | 3,772 | 1,164 | Interest rate, foreign exchange, credit spread | ||||
Debt securities in issue at amortised cost | 78,271 | – | 77,383 | 888 | Interest rate, credit spread | ||||
Liabilities arising from insurance and investment contracts | 196,924 | – | – | 196,924 | Interest rate, credit spread, equity | ||||
Subordinated liabilities | 9,894 | – | 9,382 | 512 | Interest rate, foreign exchange | ||||
Other liabilities | 26,269 | – | 12,084 | 14,185 | Interest rate, credit spread | ||||
Total liabilities | 896,205 | 34,862 | 647,670 | 213,673 | |||||
2025 | 2024 | ||||||||
Up 25bps £m | Down 25bps £m | Up 100bps £m | Down 100bps £m | Up 25bps £m | Down 25bps £m | Up 100bps £m | Down 100bps £m | ||
Sterling | 22.8 | (23.0) | 89.6 | (93.7) | 4.7 | (4.7) | 17.9 | (19.5) | |
US dollar | (3.6) | 3.6 | (14.1) | 14.6 | (1.4) | 1.4 | (5.4) | 5.7 | |
Euro | (3.7) | (0.4) | (14.5) | (1.6) | (1.4) | (2.3) | (5.1) | (9.4) | |
Other | (1.6) | 1.6 | (6.3) | 6.4 | (1.0) | 1.0 | (3.6) | 4.3 | |
Total | 13.9 | (18.2) | 54.7 | (74.3) | 0.9 | (4.6) | 3.8 | (18.9) | |
2025 | 2024 | ||||
Steepener £m | Flattener £m | Steepener £m | Flattener £m | ||
Sterling | 2.7 | (3.2) | (1.4) | 0.3 | |
US dollar | 1.8 | (1.8) | (0.6) | 0.5 | |
Euro | (9.1) | (1.3) | (12.8) | 3.2 | |
Other | 3.3 | (3.3) | (2.4) | 3.1 | |
Total | (1.3) | (9.6) | (17.2) | 7.1 | |
2025 | 2024 | ||||||
Year 1 £m | Year 2 £m | Year 3 £m | Year 1 £m | Year 2 £m | Year 3 £m | ||
Up 50bps | 216 | 376 | 660 | 234 | 357 | 591 | |
Up 25 bps | 109 | 189 | 331 | 117 | 179 | 296 | |
Down 25bps | (131) | (192) | (336) | (150) | (181) | (297) | |
Down 50bps | (261) | (386) | (673) | (302) | (364) | (595) | |
| | |
| | |
| | |
| | |
| | |
| | |
At 31 December 2025 | At 31 December 2024 | ||||||||
Close £m | Average £m | Maximum £m | Minimum £m | Close £m | Average £m | Maximum £m | Minimum £m | ||
Interest rate risk | 1.1 | 2.2 | 4.2 | 0.9 | 4.0 | 2.4 | 5.5 | 1.2 | |
Foreign exchange risk | 0.1 | 0.2 | 0.7 | 0.1 | 0.1 | 0.2 | 0.7 | 0.1 | |
Equity risk | – | – | – | – | – | – | – | – | |
Credit spread risk | 0.2 | 0.3 | 0.5 | 0.1 | 0.2 | 0.3 | 0.4 | 0.2 | |
Inflation risk | 0.1 | 0.2 | 1.7 | 0.1 | 0.1 | 0.3 | 0.7 | 0.1 | |
All risk factors before diversification | 1.5 | 2.9 | 4.8 | 1.5 | 4.4 | 3.2 | 6.2 | 2.0 | |
Portfolio diversification | (0.4) | (0.7) | – | – | (0.6) | (0.8) | – | – | |
Total VaR | 1.1 | 2.2 | 4.3 | 1.0 | 3.8 | 2.4 | 5.1 | 1.3 | |
| Model risk | |
Definition Model Risk is defined as the potential for adverse consequences from model errors or the inappropriate use of modelled outputs to inform business decisions. Adverse consequences could lead to a deterioration in the prudential position, non- compliance with applicable laws and/or regulations, or damage to the Group’s reputation. Model risk can also lead to financial loss, as well as qualitative limitations such as the imposition of restrictions on business activities. performance and key mitigating actions. | ||
| | |
| Operational risk | |
Definition Operational risk is defined as the risk of actual or potential impact to the Group (financial and/or non- financial) resulting from inadequate or failed internal processes, people and systems or from external events. Resilience is core to the management of operational risk within Lloyds Banking Group to ensure that business processes (including those that are outsourced) can withstand operational risks and can respond to and meet customer and stakeholder needs when continuity of operations is compromised. Level two risks Business continuity; Change execution; Data and privacy; Financial reporting and tax; Health, safety and premises; Information, cyber and physical security; Internal and external supplier; IT systems; Payments and transaction execution; People performance and key mitigating actions. | ||
| | |
% of total volume | % of total losses | ||||
2025 | 20242 | 2025 | 20242 | ||
Business disruption and system failures | 0.54 | 1.24 | 0.09 | 0.92 | |
Clients, products and business practices3 | 2.00 | 1.87 | 81.10 | 83.50 | |
Damage to physical assets | 0.03 | 0.16 | – | 0.02 | |
Employee practices and workplace safety | 0.28 | 0.59 | 0.04 | 0.24 | |
Execution, delivery and process management | 5.94 | 12.51 | 9.72 | 6.30 | |
External fraud4 | 91.08 | 83.37 | 9.05 | 9.01 | |
Internal fraud4 | 0.13 | 0.26 | – | 0.01 | |
Total | 100.00 | 100.00 | 100.00 | 100.00 | |

Independent auditors’ report | ||
Consolidated financial statements | ||
Consolidated income statement | ||
Consolidated statement of comprehensive income | ||
Consolidated balance sheet | ||
Consolidated statement of changes in equity | ||
Consolidated cash flow statement | ||
Notes to the consolidated financial statements | ||
1. | Basis of preparation | |
2. | Accounting policies | |
3. | Critical accounting judgements and key sources of estimation uncertainty | |
4. | Segmental analysis | |
5. | Net interest income | |
6. | Net fee and commission income | |
7. | Net trading income | |
8. | Insurance business | |
9. | Other operating income | |
10. | Operating expenses | |
11. | Share-based payments | |
12. | Retirement benefit obligations | |
13. | Auditors’ remuneration | |
14. | Impairment | |
15. | Tax | |
16. | Measurement basis of financial assets and liabilities | |
17. | Fair values of financial assets and liabilities | |
18. | Maturities of assets and liabilities | |
19. | Derivative financial instruments | |
20. | Loans and advances to customers | |
21. | Allowance for expected credit losses | |
22. | Finance lease receivables | |
23. | Goodwill and other intangible assets | |
24. | Other assets | |
25. | Lessee disclosures | |
26. | Debt securities in issue | |
27. | Other liabilities | |
28. | Provisions | |
29. | Subordinated liabilities | |
30. | Share capital | |
31. | Earnings per share | |
32. | Other reserves | |
33. | Other equity instruments | |
34. | Dividends on ordinary shares | |
35. | Related party transactions | |
36. | Contingent liabilities, commitments and financial guarantees | |
37. | Structured entities | |
38. | Transfers of financial assets | |
39. | Financial risk management | |
40. | Cash flow statement | |
41. | Events since the balance sheet date | |
Parent company financial statements | ||
Parent company income statement | ||
Parent company balance sheet | ||
Parent company statement of changes in equity | ||
Parent company cash flow statement | ||
Notes to the parent company financial statements | ||
1. | Basis of preparation and accounting policies | |
2. | Measurement basis of financial assets and liabilities | |
3. | Fair values of financial assets and liabilities | |
4. | Derivative financial instruments | |
5. | Deferred tax | |
6. | Debt securities in issue at amortised cost | |
7. | Subordinated liabilities | |
8. | Share capital and other equity instruments | |
9. | Related party transactions | |
10. | Financial risk management | |
The Group has adopted the UK Finance Code for Financial Reporting Disclosure and these 2025 financial statements have been prepared in compliance with its principles. | ||

Note | 2025 £m | 20241 £m | 20231 £m | ||||
Interest income | |||||||
Interest expense | ( | ( | ( | ||||
Net interest income | 5 | ||||||
Fee and commission income | |||||||
Fee and commission expense | ( | ( | ( | ||||
Net fee and commission income | 6 | ||||||
Net trading income | 7 | ||||||
Insurance revenue | |||||||
Insurance service expense | ( | ( | ( | ||||
Net expense from reinsurance contracts held | ( | ( | |||||
Insurance service result | 8 | ||||||
Net investment return on assets held to back insurance and investment contracts | |||||||
Net finance expense in respect of insurance and investment contracts | ( | ( | ( | ||||
Net investment return and finance result in respect of insurance and investment contracts | ( | ( | ( | ||||
Other operating income | 9 | ||||||
Other income | |||||||
Total income | |||||||
Operating expenses | 10 | ( | ( | ( | |||
Impairment | 14 | ( | ( | ( | |||
Profit before tax | |||||||
Tax expense | 15 | ( | ( | ( | |||
Profit for the year | |||||||
Profit attributable to ordinary shareholders | |||||||
Profit attributable to other equity holders | |||||||
Profit attributable to equity holders | |||||||
Profit attributable to non-controlling interests | |||||||
Profit for the year | |||||||
Basic earnings per share | 31 | ||||||
Diluted earnings per share | 31 |
2025 £m | 20241 £m | 20231 £m | |||
Profit for the year | |||||
Other comprehensive income | |||||
Items that will not subsequently be reclassified to profit or loss: | |||||
Post-retirement defined benefit scheme remeasurements: | |||||
Remeasurements before tax | ( | ( | ( | ||
Current tax | |||||
Deferred tax | |||||
( | ( | ( | |||
Movements in revaluation reserve in respect of equity shares held at FVOCI: | |||||
Change in fair value | ( | ||||
Deferred tax | ( | ||||
( | |||||
Gains and losses attributable to own credit risk: | |||||
Losses before tax | ( | ( | ( | ||
Deferred tax | |||||
( | ( | ( | |||
( | ( | ( | |||
Items that may subsequently be reclassified to profit or loss: | |||||
Movements in revaluation reserve in respect of debt securities held at FVOCI: | |||||
Change in fair value | ( | ( | |||
Current tax | |||||
Deferred tax | ( | ||||
( | ( | ||||
Income statement transfers in respect of disposals | ( | ( | ( | ||
Deferred tax | |||||
( | ( | ( | |||
Income statement transfers in respect of impairment | ( | ( | ( | ||
( | ( | ||||
Movements in cash flow hedge reserve: | |||||
Effective portion of changes in fair value taken to other comprehensive income | ( | ||||
Deferred tax | ( | ( | |||
( | |||||
Net income statement transfers | |||||
Deferred tax | ( | ( | ( | ||
Movements in foreign currency translation reserve: Currency translation differences (tax: £ | ( | ( | |||
( | |||||
Total other comprehensive income (loss) for the year, net of tax | ( | ||||
Total comprehensive income for the year | |||||
Total comprehensive income attributable to ordinary shareholders | |||||
Total comprehensive income attributable to other equity holders | |||||
Total comprehensive income attributable to equity holders | |||||
Total comprehensive income attributable to non-controlling interests | |||||
Total comprehensive income for the year |
Note | 2025 £m | 2024 £m | |||
Assets | |||||
Cash and balances at central banks | |||||
Financial assets at fair value through profit or loss | 17 | ||||
Derivative financial instruments | 19 | ||||
Loans and advances to banks | |||||
Loans and advances to customers | 20 | ||||
Reverse repurchase agreements | |||||
Debt securities | |||||
Financial assets at amortised cost | |||||
Financial assets at fair value through other comprehensive income | 17 | ||||
Goodwill and other intangible assets | 23 | ||||
Current tax recoverable | |||||
Deferred tax assets | 15 | ||||
Retirement benefit assets | 12 | ||||
Other assets | 24 | ||||
Total assets | |||||
Liabilities | |||||
Deposits from banks | |||||
Customer deposits | |||||
Repurchase agreements at amortised cost | |||||
Financial liabilities at fair value through profit or loss | 17 | ||||
Derivative financial instruments | 19 | ||||
Notes in circulation | |||||
Debt securities in issue at amortised cost | 26 | ||||
Liabilities arising from insurance and participating investment contracts | 8 | ||||
Liabilities arising from non-participating investment contracts | |||||
Other liabilities | 27 | ||||
Retirement benefit obligations | 12 | ||||
Current tax liabilities | |||||
Deferred tax liabilities | 15 | ||||
Provisions | 28 | ||||
Subordinated liabilities | 29 | ||||
Total liabilities | |||||
Equity | |||||
Share capital | 30 | ||||
Share premium account | |||||
Other reserves | 32 | ||||
Retained profits | |||||
Ordinary shareholders’ equity | |||||
Other equity instruments | 33 | ||||
Total equity excluding non-controlling interests | |||||
Non-controlling interests | |||||
Total equity | |||||
Total equity and liabilities |
| |  |
Sir Robin Budenberg Chair | Charlie Nunn Group Chief Executive | William Chalmers Chief Financial Officer |
Attributable to ordinary shareholders | Other equity instruments £m | Non- controlling interests £m | Total £m | |||||||||||||
Share capital3 £m | Share premium3 £m | Other reserves £m | Retained profits4 £m | Total £m | ||||||||||||
At 1 January 2025 | ||||||||||||||||
Comprehensive income | ||||||||||||||||
Profit for the year | – | – | – | |||||||||||||
Other comprehensive income | ||||||||||||||||
Post-retirement defined benefit scheme remeasurements, net of tax | – | – | – | ( | ( | – | – | ( | ||||||||
Movements in revaluation reserve in respect of FVOCI assets, net of tax: | ||||||||||||||||
Debt securities | – | – | – | – | – | |||||||||||
Equity shares | – | – | – | – | – | |||||||||||
Gains and losses attributable to own credit risk, net of tax | – | – | – | ( | ( | – | – | ( | ||||||||
Movements in cash flow hedge reserve, net of tax | – | – | – | – | – | |||||||||||
Movements in foreign currency translation reserve, net of tax | – | – | – | – | – | |||||||||||
Total other comprehensive income (loss) | – | – | ( | – | – | |||||||||||
Total comprehensive income1 | – | – | ||||||||||||||
Transactions with owners | ||||||||||||||||
Dividends (note 34) | – | – | – | ( | ( | – | ( | ( | ||||||||
Distributions on other equity instruments | – | – | – | – | – | ( | – | ( | ||||||||
Issue of ordinary shares | – | – | – | – | ||||||||||||
Share buyback (note 32) | ( | – | ( | ( | – | – | ( | |||||||||
Issue of other equity instruments (note 33) | – | – | – | ( | ( | – | ||||||||||
Repurchases and redemptions of other equity instruments (note 33) | – | – | – | – | – | ( | – | ( | ||||||||
Movement in treasury shares | – | – | – | – | – | |||||||||||
Value of employee services | – | – | – | – | ||||||||||||
Changes in non-controlling interests | – | – | – | – | ( | |||||||||||
Total transactions with owners | ( | ( | ( | ( | ( | ( | ||||||||||
Realised gains and losses on FVOCI equity shares | – | – | ( | – | – | – | ||||||||||
At 31 December 20252 | ||||||||||||||||
Attributable to ordinary shareholders | Other equity instruments £m | Non- controlling interests £m | Total £m | |||||||||||||
Share capital1 £m | Share premium1 £m | Other reserves £m | Retained profits2 £m | Total £m | ||||||||||||
At 1 January 2024 | ||||||||||||||||
Comprehensive income | ||||||||||||||||
Profit for the year | – | – | – | |||||||||||||
Other comprehensive income | ||||||||||||||||
Post-retirement defined benefit scheme remeasurements, net of tax | – | – | – | ( | ( | – | – | ( | ||||||||
Movements in revaluation reserve in respect of FVOCI assets, net of tax: | ||||||||||||||||
Debt securities | – | – | ( | – | ( | – | – | ( | ||||||||
Equity shares | – | – | – | – | – | |||||||||||
Gains and losses attributable to own credit risk, net of tax | – | – | – | ( | ( | – | – | ( | ||||||||
Movements in cash flow hedge reserve, net of tax | – | – | – | – | – | |||||||||||
Movements in foreign currency translation reserve, net of tax | – | – | ( | – | ( | – | – | ( | ||||||||
Total other comprehensive loss | – | – | ( | ( | ( | – | – | ( | ||||||||
Total comprehensive (loss) income | – | – | ( | |||||||||||||
Transactions with owners | ||||||||||||||||
Dividends (note 34) | – | – | – | ( | ( | – | ( | ( | ||||||||
Distributions on other equity instruments | – | – | – | – | – | ( | – | ( | ||||||||
Issue of ordinary shares | – | – | – | – | ||||||||||||
Share buyback | ( | – | ( | ( | – | – | ( | |||||||||
Redemption of preference shares | – | ( | – | – | – | – | ||||||||||
Issue of other equity instruments (note 33) | – | – | – | ( | ( | – | ||||||||||
Repurchases and redemptions of other equity instruments (note 33) | – | – | – | ( | ( | ( | – | ( | ||||||||
Movement in treasury shares | – | – | – | ( | ( | – | – | ( | ||||||||
Value of employee services | – | – | – | – | – | |||||||||||
Changes in non-controlling interests | – | – | – | – | – | – | ( | ( | ||||||||
Total transactions with owners | ( | ( | ( | ( | ( | ( | ||||||||||
Realised gains and losses on equity shares held at FVOCI | – | – | – | – | – | – | – | |||||||||
At 31 December 2024 | ||||||||||||||||
Attributable to ordinary shareholders | Other equity instruments £m | Non- controlling interests £m | Total £m | |||||||||||||
Share capital1 £m | Share premium1 £m | Other reserves £m | Retained profits2 £m | Total £m | ||||||||||||
At 1 January 2023 | ||||||||||||||||
Comprehensive income | ||||||||||||||||
Profit for the year | – | – | – | |||||||||||||
Other comprehensive income | ||||||||||||||||
Post-retirement defined benefit scheme remeasurements, net of tax | – | – | – | ( | ( | – | – | ( | ||||||||
Movements in revaluation reserve in respect of FVOCI assets, net of tax: | ||||||||||||||||
Debt securities | – | – | ( | – | ( | – | – | ( | ||||||||
Equity shares | – | – | ( | – | ( | – | – | ( | ||||||||
Gains and losses attributable to own credit risk, net of tax | – | – | – | ( | ( | – | – | ( | ||||||||
Movements in cash flow hedge reserve, net of tax | – | – | – | – | – | |||||||||||
Movements in foreign currency translation reserve, net of tax | – | – | ( | – | ( | – | – | ( | ||||||||
Total other comprehensive income (loss) | – | – | ( | – | – | |||||||||||
Total comprehensive income | – | – | ||||||||||||||
Transactions with owners | ||||||||||||||||
Dividends (note 34) | – | – | – | ( | ( | – | ( | ( | ||||||||
Distributions on other equity instruments | – | – | – | – | – | ( | – | ( | ||||||||
Issue of ordinary shares | – | – | – | – | ||||||||||||
Share buyback | ( | – | ( | ( | – | – | ( | |||||||||
Issue of other equity instruments (note 33) | – | – | – | ( | ( | – | ||||||||||
Repurchases and redemptions of other equity instruments (note 33) | – | – | – | – | – | ( | – | ( | ||||||||
Movement in treasury shares | – | – | – | – | – | |||||||||||
Value of employee services | – | – | – | – | – | |||||||||||
Changes in non-controlling interests | – | – | – | – | – | – | – | |||||||||
Total transactions with owners | ( | ( | ( | ( | ( | |||||||||||
Realised gains and losses on equity shares held at FVOCI | – | – | – | – | – | – | – | |||||||||
At 31 December 2023 | ||||||||||||||||
Note | 2025 £m | 2024 £m | 2023 £m | ||||
Cash flows (used in) provided by operating activities | |||||||
Profit before tax | |||||||
Adjustments for: | |||||||
Change in operating assets | 40(A) | ( | ( | ( | |||
Change in operating liabilities | 40(B) | ||||||
Non-cash and other items | 40(C) | ||||||
Tax paid | 15 | ( | ( | ( | |||
Tax refunded | 15 | ||||||
Net cash provided by (used in) operating activities | ( | ||||||
Cash flows used in investing activities | |||||||
Purchase of financial assets | ( | ( | ( | ||||
Proceeds from sale and maturity of financial assets | |||||||
Purchase of property, plant and equipment | ( | ( | ( | ||||
Purchase of other intangible assets | ( | ( | ( | ||||
Proceeds from sale of property, plant and equipment | |||||||
Proceeds from sale of goodwill and other intangible assets | |||||||
Acquisition of businesses and joint ventures, net of cash acquired | 40(D) | ( | ( | ||||
Net cash used in investing activities | ( | ( | ( | ||||
Cash flows used in financing activities | |||||||
Dividends paid to ordinary shareholders | 34 | ( | ( | ( | |||
Distributions in respect of other equity instruments | ( | ( | ( | ||||
Distributions in respect of non-controlling interests | ( | ( | ( | ||||
Interest paid on subordinated liabilities | ( | ( | ( | ||||
Proceeds from issue of subordinated liabilities | |||||||
Proceeds from issue of other equity instruments | |||||||
Proceeds from issue of ordinary shares | |||||||
Share buyback | ( | ( | ( | ||||
Repayment of subordinated liabilities | ( | ( | ( | ||||
Repurchases and redemptions of other equity instruments | ( | ( | ( | ||||
Change in stake of non-controlling interests | ( | ||||||
Net cash used in financing activities | ( | ( | ( | ||||
Effects of exchange rate changes on cash and cash equivalents | ( | ( | ( | ||||
Change in cash and cash equivalents | ( | ( | ( | ||||
Cash and cash equivalents at beginning of year | |||||||
Cash and cash equivalents at end of year | 40(E) |
Year ended 31 December 2025 | Retail £m | Commercial Banking £m | Insurance, Pensions and Investments £m | Other £m | Total £m | ||||
Underlying net interest income | ( | ||||||||
Underlying other income | |||||||||
Total underlying income | |||||||||
Operating lease depreciation1 | ( | ( | ( | ||||||
Net income | |||||||||
Operating costs | ( | ( | ( | ( | ( | ||||
Remediation | ( | ( | ( | ( | |||||
Total costs | ( | ( | ( | ( | ( | ||||
Underlying impairment (charge) credit | ( | ( | ( | ( | |||||
Underlying profit before tax | |||||||||
External income | ( | ||||||||
External operating lease depreciation1 | ( | ( | ( | ||||||
Inter-segment (expense) income | ( | ( | |||||||
Net income | |||||||||
Loans and advances to customers2 | |||||||||
External assets | |||||||||
Customer deposits | |||||||||
External liabilities | |||||||||
Analysis of underlying other income: | |||||||||
Consumer lending | |||||||||
Consumer relationships | |||||||||
Business and Commercial Banking | |||||||||
Corporate and Institutional Banking | |||||||||
Life, Pensions and Investments | |||||||||
General insurance | |||||||||
Venture capital | |||||||||
Other | ( | ( | |||||||
Underlying other income | |||||||||
Other items reflected in income statement above: | |||||||||
Depreciation and amortisation | |||||||||
Defined benefit scheme credit | ( | ( | |||||||
Non-income statement items: | |||||||||
Additions to fixed assets | |||||||||
Investments in joint ventures and associates at end of year | |||||||||
Year ended 31 December 2024 | Retail £m | Commercial Banking £m | Insurance, Pensions and Investments £m | Other £m | Total £m | ||||
Underlying net interest income | ( | ||||||||
Underlying other income1 | |||||||||
Total underlying income | |||||||||
Operating lease depreciation2 | ( | ( | ( | ||||||
Net income | |||||||||
Operating costs1 | ( | ( | ( | ( | ( | ||||
Remediation | ( | ( | ( | ( | ( | ||||
Total costs | ( | ( | ( | ( | ( | ||||
Underlying impairment (charge) credit | ( | ( | |||||||
Underlying profit before tax | |||||||||
External income | ( | ||||||||
External operating lease depreciation2 | ( | ( | ( | ||||||
Inter-segment (expense) income | ( | ( | |||||||
Net income | |||||||||
Loans and advances to customers3 | |||||||||
External assets4 | |||||||||
Customer deposits | |||||||||
External liabilities4 | |||||||||
Analysis of underlying other income: | |||||||||
Consumer lending | |||||||||
Consumer relationships | |||||||||
Business and Commercial Banking | |||||||||
Corporate and Institutional Banking | |||||||||
Life, Pensions and Investments | |||||||||
General insurance | |||||||||
Venture capital | |||||||||
Other | ( | ( | |||||||
Underlying other income | |||||||||
Other items reflected in income statement above: | |||||||||
Depreciation and amortisation | |||||||||
Defined benefit scheme charge (credit) | ( | ( | |||||||
Non-income statement items: | |||||||||
Additions to fixed assets | |||||||||
Investments in joint ventures and associates at end of year | |||||||||
Year ended 31 December 2023 | Retail £m | Commercial Banking £m | Insurance, Pensions and Investments £m | Other £m | Total £m | ||||
Underlying net interest income | ( | ||||||||
Underlying other income | |||||||||
Total underlying income | |||||||||
Operating lease depreciation1 | ( | ( | ( | ||||||
Net income | |||||||||
Operating costs | ( | ( | ( | ( | ( | ||||
Remediation | ( | ( | ( | ( | ( | ||||
Total costs | ( | ( | ( | ( | ( | ||||
Underlying impairment (charge) credit | ( | ( | |||||||
Underlying profit before tax | |||||||||
External income | |||||||||
External operating lease depreciation1 | ( | ( | ( | ||||||
Inter-segment (expense) income | ( | ( | |||||||
Net income | |||||||||
Loans and advances to customers2 | ( | ||||||||
External assets | |||||||||
Customer deposits | |||||||||
External liabilities | |||||||||
Analysis of underlying other income: | |||||||||
Consumer lending | |||||||||
Consumer relationships | |||||||||
Business and Commercial Banking | |||||||||
Corporate and Institutional Banking | |||||||||
Life, Pensions and Investments | |||||||||
General insurance | |||||||||
Venture capital | |||||||||
Other | ( | ( | |||||||
Underlying other income | |||||||||
Other items reflected in income statement above: | |||||||||
Depreciation and amortisation | |||||||||
Defined benefit scheme charge (credit) | ( | ( | |||||||
Non-income statement items: | |||||||||
Additions to fixed assets | |||||||||
Investments in joint ventures and associates at end of year | |||||||||
Removal of: | ||||||
Year ended 31 December 2025 | Lloyds Banking Group statutory basis £m | Volatility, and other items1 £m | Insurance gross up2 £m | Underlying basis £m | ||
Net interest income | Underlying net interest income | |||||
Other income | ( | Underlying other income | ||||
( | ( | Operating lease depreciation3 | ||||
Total income | ( | Net income | ||||
Operating expenses3 | ( | ( | ( | Total costs | ||
Impairment charge | ( | ( | Underlying impairment charge | |||
Profit before tax | Underlying profit | |||||
Removal of: | ||||||
Year ended 31 December 2024 | Lloyds Banking Group statutory basis £m | Volatility, and other items1 £m | Insurance gross up2 £m | Underlying basis £m | ||
Net interest income | ( | Underlying net interest income | ||||
Other income | ( | Underlying other income | ||||
( | ( | Operating lease depreciation3 | ||||
Total income | ( | Net income | ||||
Operating expenses3 | ( | ( | ( | Total costs | ||
Impairment charge | ( | ( | ( | Underlying impairment charge | ||
Profit before tax | Underlying profit | |||||
Removal of: | ||||||
Year ended 31 December 2023 | Lloyds Banking Group statutory basis £m | Volatility, and other items1 £m | Insurance gross up2 £m | Underlying basis £m | ||
Net interest income | ( | Underlying net interest income | ||||
Other income | ( | Underlying other income | ||||
( | ( | Operating lease depreciation3 | ||||
Total income | ( | Net income | ||||
Operating expenses3 | ( | ( | ( | Total costs | ||
Impairment charge | ( | ( | ( | Underlying impairment charge | ||
Profit before tax | Underlying profit | |||||
2025 £m | 2024 £m | 2023 £m | |
Interest income: | |||
Loans and advances to banks | |||
Loans and advances to customers | |||
Reverse repurchase agreements | |||
Debt securities | |||
Financial assets held at amortised cost | |||
Financial assets at fair value through other comprehensive income | |||
Total interest income1 | |||
Interest expense: | |||
Deposits from banks | ( | ( | ( |
Customer deposits | ( | ( | ( |
Repurchase agreements at amortised cost | ( | ( | ( |
Debt securities in issue at amortised cost2 | ( | ( | ( |
Lease liabilities | ( | ( | ( |
Subordinated liabilities | ( | ( | ( |
Total interest expense | ( | ( | ( |
Net interest income |
Year ended 31 December 2025 | Retail £m | Commercial Banking £m | Insurance, Pensions and Investments £m | Other £m | Total £m | ||||
Fee and commission income: | |||||||||
Current accounts | |||||||||
Credit and debit card fees | |||||||||
Commercial banking and treasury fees | |||||||||
Unit trust and insurance broking | |||||||||
Factoring | |||||||||
Other fees and commissions | |||||||||
Total fee and commission income | |||||||||
Fee and commission expense | ( | ( | ( | ( | ( | ||||
Net fee and commission income | ( | ||||||||
Year ended 31 December 2024 | Retail £m | Commercial Banking £m | Insurance, Pensions and Investments £m | Other £m | Total £m | ||||
Fee and commission income: | |||||||||
Current accounts | |||||||||
Credit and debit card fees | |||||||||
Commercial banking and treasury fees | |||||||||
Unit trust and insurance broking | |||||||||
Factoring | |||||||||
Other fees and commissions | |||||||||
Total fee and commission income | |||||||||
Fee and commission expense | ( | ( | ( | ( | ( | ||||
Net fee and commission income | |||||||||
Year ended 31 December 2023 | Retail £m | Commercial Banking £m | Insurance, Pensions and Investments £m | Other £m | Total £m | ||||
Fee and commission income: | |||||||||
Current accounts | |||||||||
Credit and debit card fees | |||||||||
Commercial banking and treasury fees | |||||||||
Unit trust and insurance broking | |||||||||
Factoring | |||||||||
Other fees and commissions | |||||||||
Total fee and commission income | |||||||||
Fee and commission expense | ( | ( | ( | ( | ( | ||||
Net fee and commission income | |||||||||
2025 £m | 20241 £m | 20231 £m | |||
Net gains on financial assets and liabilities at fair value through profit or loss: | |||||
Net gains on financial instruments held for trading2 | |||||
Net gains on other financial instruments mandatorily held at fair value through profit or loss | |||||
Net losses on financial liabilities designated at fair value through profit or loss | ( | ( | ( | ||
Foreign exchange | |||||
Investment property gains (losses) | ( | ||||
Net trading income |
2025 £m | 2024 £m | 2023 £m | |||
Insurance revenue | |||||
Amounts relating to the changes in liabilities for remaining coverage: | |||||
CSM recognised for services provided | |||||
Change in risk adjustments for non-financial risk for risk expired | |||||
Expected claims and other insurance service expenses | |||||
Charges to funds in respect of policyholder tax and other | |||||
Recovery of insurance acquisition cash flows | |||||
Total life | |||||
Total non-life | |||||
Total insurance revenue | |||||
Insurance service expense | |||||
Incurred claims and other insurance service expenses | ( | ( | ( | ||
Changes that relate to past service: adjustment to liabilities for incurred claims | ( | ||||
Changes that relate to future service: (losses) reversal of losses on onerous contracts | ( | ( | |||
Amortisation of insurance acquisition cash flows | ( | ( | ( | ||
Total life excluding net impairment loss on insurance acquisition assets | ( | ( | ( | ||
Net impairment loss on insurance acquisition assets | ( | ( | |||
Total life | ( | ( | ( | ||
Total non-life1 | ( | ( | ( | ||
Total insurance service expense | ( | ( | ( | ||
Net (expense) income from reinsurance contracts held | ( | ( | |||
Insurance service result |
2025 | |||||
Life £m | Non-life £m | Total £m | |||
Net gains on financial assets and liabilities at fair value through profit or loss | |||||
Foreign exchange | ( | ( | |||
Investment property losses | ( | ( | |||
Net investment return on assets held to back insurance and participating investment contracts | |||||
Net investment return on assets held to back third party interests in consolidated funds | |||||
Net investment return on assets held to back non-participating investment contracts | |||||
Investment return on assets held to back insurance and investment contracts1 | |||||
Changes in fair value of underlying items of direct participating contracts | ( | ( | |||
Effects of risk mitigation option | |||||
Interest accreted | ( | ( | ( | ||
Effect of changes in interest rates and other financial assumptions | |||||
Effect of changes in fulfilment cash flows at current rates when CSM is unlocked at locked-in rates | |||||
Net finance expense from insurance and participating investment contracts | ( | ( | ( | ||
Net finance income from reinsurance contracts held | |||||
Net finance expense from insurance, participating investment and reinsurance contracts | ( | ( | ( | ||
Movement in third party interests in consolidated funds | ( | ||||
Change in non-participating investment contracts | ( | ||||
Net finance expense arising from insurance and investment contracts | ( | ||||
Net investment return and finance result in respect of insurance and investment contracts | ( | ||||
2024 | |||||
Life £m | Non-life £m | Total £m | |||
Net gains on financial assets and liabilities at fair value through profit or loss | |||||
Foreign exchange | |||||
Investment property losses | ( | ( | |||
Net investment return on assets held to back insurance and participating investment contracts | |||||
Net investment return on assets held to back third party interests in consolidated funds | |||||
Net investment return on assets held to back non-participating investment contracts | |||||
Net investment return on assets held to back insurance and investment contracts1 | |||||
Changes in fair value of underlying items of direct participating contracts | ( | ( | |||
Effects of risk mitigation option | |||||
Interest accreted | ( | ( | ( | ||
Effect of changes in interest rates and other financial assumptions | |||||
Effect of changes in fulfilment cash flows at current rates when CSM is unlocked at locked-in rates | |||||
Net finance expense from insurance and participating investment contracts | ( | ( | ( | ||
Net finance income from reinsurance contracts held | |||||
Net finance expense from insurance, participating investment and reinsurance contracts | ( | ( | ( | ||
Movement in third party interests in consolidated funds | ( | ||||
Change in non-participating investment contracts | ( | ||||
Net finance expense arising from insurance and investment contracts | ( | ||||
Net investment return and finance result in respect of insurance and investment contracts | ( | ||||
2023 | |||||
Life £m | Non-life £m | Total £m | |||
Net gains on financial assets and liabilities at fair value through profit or loss | |||||
Foreign exchange | |||||
Investment property losses | ( | ( | |||
Net investment return on assets held to back insurance and participating investment contracts | |||||
Net investment return on assets held to back third party interests in consolidated funds | |||||
Net investment return on assets held to back non-participating investment contracts | |||||
Net investment return on assets held to back insurance and investment contracts1 | |||||
Changes in fair value of underlying items of direct participating contracts | ( | ( | |||
Effects of risk mitigation option | |||||
Interest accreted | ( | ( | ( | ||
Effect of changes in interest rates and other financial assumptions | ( | ( | |||
Effect of changes in fulfilment cash flows at current rates when CSM is unlocked at locked-in rates | ( | ( | |||
Net finance expense from insurance and participating investment contracts | ( | ( | ( | ||
Net finance expense from reinsurance contracts held | |||||
Net finance expense from insurance, participating investment and reinsurance contracts | ( | ( | ( | ||
Movement in third party interests in consolidated funds | ( | ||||
Change in non-participating investment contracts | ( | ||||
Net finance income arising from insurance and investment contracts | ( | ||||
Net investment return and finance result in respect of insurance and investment contracts | ( | ||||
2025 | 2024 | ||||||
Life £m | Non-life £m | Total £m | Life £m | Non-life £m | Total £m | ||
Insurance contract assets | |||||||
Liabilities arising from insurance and participating investment contracts1 | ( | ( | ( | ( | ( | ( | |
Other liabilities2 | ( | ( | |||||
Net liability | ( | ( | ( | ( | ( | ( | |
Insurance acquisition assets | |||||||
Insurance and participating investment contacts net liability | ( | ( | ( | ( | ( | ( | |
2025 | 2024 | |||||||||
Liabilities for remaining coverage | Liability for incurred claims £m | Liabilities for remaining coverage | Liability for incurred claims £m | |||||||
Life | Excluding loss component £m | Loss component £m | Total £m | Excluding loss component £m | Loss component £m | Total £m | ||||
Net liability at 1 January1 | ( | ( | ( | ( | ( | ( | ( | ( | ||
Contracts under the fair value transition approach | ||||||||||
Other contracts | ||||||||||
Insurance revenue | ||||||||||
Insurance service expenses2 | ( | ( | ( | ( | ( | ( | ( | ( | ||
Insurance service result | ( | ( | ( | ( | ||||||
Net finance expense from insurance and participating investment contracts | ( | ( | ( | ( | ( | ( | ( | ( | ||
Exchange differences | ( | ( | ||||||||
Total change in profit or loss | ( | ( | ( | ( | ( | ( | ( | ( | ||
Investment components | ( | ( | ||||||||
Premiums received | ( | ( | ( | ( | ||||||
Claims and other insurance service expenses paid | ||||||||||
Insurance acquisition cash flows | ||||||||||
Cash flows | ( | ( | ||||||||
Derecognition Consideration3 | ||||||||||
Transfer to other items in the balance sheet | ( | ( | ||||||||
Net liability at 31 December1 | ( | ( | ( | ( | ( | ( | ( | ( | ||
2025 | 2024 | |||||||||
Liabilities for remaining coverage | Liability for incurred claims £m | Liabilities for remaining coverage | Liability for incurred claims £m | |||||||
Non-life | Excluding loss component £m | Loss component £m | Total £m | Excluding loss component £m | Loss component £m | Total £m | ||||
Net liability at 1 January1 | ( | ( | ( | ( | ( | ( | ||||
Contracts under the fair value transition approach | ||||||||||
Other contracts | ||||||||||
Insurance revenue | ||||||||||
Insurance service expenses2 | ( | ( | ( | ( | ( | ( | ||||
Insurance service result | ( | ( | ||||||||
Net finance income (expense) from insurance and participating investment contracts | ( | ( | ( | ( | ||||||
Total change in profit or loss | ( | ( | ||||||||
Premiums received | ( | ( | ( | ( | ||||||
Claims and other insurance service expenses paid | ||||||||||
Insurance acquisition cash flows | ||||||||||
Cash flows | ( | ( | ( | ( | ||||||
Net liability at 31 December1 | ( | ( | ( | ( | ( | ( | ||||
2025 | 2024 | ||||||
Life £m | Non-life £m | Total £m | Life £m | Non-life £m | Total £m | ||
CSM on insurance and participating investment contracts1 | |||||||
CSM on reinsurance contracts2 | ( | ( | ( | ( | |||
Total CSM | |||||||
Risk adjustment on insurance and participating investment contracts1 | |||||||
Risk adjustment on reinsurance contracts2 | ( | ( | ( | ( | ( | ||
Total risk adjustment | |||||||
Total | |||||||
2025 | ||||||||||||
Contractual service margin (CSM) | ||||||||||||
Life | Present value of future cash flows £m | Risk adjustment for non- financial risk £m | Contracts measured under the fair value approach £m | Other contracts £m | Total CSM £m | Total £m | ||||||
Net liability at 1 January1 | ( | ( | ( | ( | ( | ( | ||||||
Relating to current services | ||||||||||||
Contracts initially recognised in the year | ( | ( | ( | ( | ( | |||||||
Changes in estimates that adjust the CSM | ( | ( | ( | |||||||||
Changes in estimates that result in losses and reversal of losses on onerous contracts | ( | |||||||||||
Relating to future services | ( | ( | ( | ( | ||||||||
Relating to past services | ( | |||||||||||
Insurance service result | ( | |||||||||||
Net finance expense from insurance and participating investment contracts | ( | ( | ( | ( | ||||||||
Exchange differences | ( | ( | ( | ( | ( | |||||||
Total change in profit or loss | ( | ( | ( | |||||||||
Premiums received | ( | ( | ||||||||||
Claims and other insurance service expenses paid | ||||||||||||
Insurance acquisition cash flows | ||||||||||||
Cash flows | ||||||||||||
Derecognition Consideration2 | ||||||||||||
Transfer to other items in the balance sheet | ||||||||||||
Net liability at 31 December1 | ( | ( | ( | ( | ( | ( | ||||||
2024 | ||||||||||||
Contractual service margin (CSM) | ||||||||||||
Life | Present value of future cash flows £m | Risk adjustment for non- financial risk £m | Contracts measured under the fair value approach £m | Other contracts £m | Total CSM £m | Total £m | ||||||
Net liability at 1 January1 | ( | ( | ( | ( | ( | ( | ||||||
Relating to current services | ||||||||||||
Contracts initially recognised in the year | ( | ( | ( | ( | ||||||||
Changes in estimates that adjust the CSM | ( | ( | ( | |||||||||
Changes in estimates that result in losses and reversal of losses on onerous contracts | ( | |||||||||||
Relating to future services | ( | ( | ( | ( | ||||||||
Relating to past services | ( | ( | ( | |||||||||
Insurance service result | ( | ( | ||||||||||
Net finance (expense) income from insurance and participating investment contracts | ( | ( | ( | ( | ( | |||||||
Exchange differences | ||||||||||||
Total change in profit or loss | ( | ( | ( | ( | ||||||||
Premiums received | ( | ( | ||||||||||
Claims and other insurance service expenses paid | ||||||||||||
Insurance acquisition cash flows | ||||||||||||
Cash flows | ||||||||||||
Derecognition Consideration | ||||||||||||
Transfer to other items in the balance sheet | ( | ( | ||||||||||
Net liability at 31 December1 | ( | ( | ( | ( | ( | ( | ||||||
2025 | 2024 | ||||||
Life | Profitable contracts issued £m | Onerous contracts issued £m | Total £m | Profitable contracts issued £m | Onerous contracts issued £m | Total £m | |
Insurance and participating investment contracts | |||||||
Insurance acquisition cash flows | |||||||
Claims and other directly attributable expenses | |||||||
Estimates of the present value of future cash outflows | |||||||
Estimates of the present value of future cash inflows | ( | ( | ( | ( | ( | ( | |
Risk adjustment for non-financial risk | |||||||
Contractual service margin | |||||||
Losses recognised on initial recognition | |||||||
At 31 December 2025 | Less than 1 year £m | 1 to 2 years £m | 2 to 3 years £m | 3 to 4 years £m | 4 to 5 years £m | 5 to 10 years £m | Over 10 years £m | Total £m |
Pensions and investments | ( | ( | ( | ( | ( | ( | ( | ( |
Annuities, protection and other | ( | ( | ( | ( | ( | ( | ( | ( |
Insurance and participating investment contracts | ( | ( | ( | ( | ( | ( | ( | ( |
Reinsurance contracts held | ||||||||
Total | ( | ( | ( | ( | ( | ( | ( | ( |
At 31 December 2024 | Less than 1 year £m | 1 to 2 years £m | 2 to 3 years £m | 3 to 4 years £m | 4 to 5 years £m | 5 to 10 years £m | Over 10 years £m | Total £m |
Pensions and investments | ( | ( | ( | ( | ( | ( | ( | ( |
Annuities, protection and other1 | ( | ( | ( | ( | ( | ( | ( | ( |
Insurance and participating investment contracts | ( | ( | ( | ( | ( | ( | ( | ( |
Reinsurance contracts held2 | ||||||||
Total | ( | ( | ( | ( | ( | ( | ( | ( |
Critical judgements: | Determining the characteristics which make a product illiquid, the level of illiquidity premium to apply to the discount rate of different products and how the illiquidity premium is determined |
Key sources of estimation uncertainty: | Increase in illiquidity premia and widening of credit default spreads |
2025 | 2024 | |||||
Change in variable | Increase (reduction) in profit before tax £m | Increase (reduction) in equity £m | Increase (reduction) in profit before tax £m | Increase (reduction) in equity £m | ||
Key sources of estimation uncertainty | ||||||
Risk free rate, including illiquidity premia | ||||||
( | ( | ( | ( | |||
Widening of credit default spreads on corporate bonds and other credit risky assets | ( | ( | ( | ( | ||
Other market exposure | ||||||
Equity | ||||||
( | ( | ( | ( | |||
Inflation | ( | ( | ( | ( | ||
Other accounting estimates | ||||||
Annuitant mortality | ||||||
( | ( | ( | ( | |||
Future maintenance and investment expenses | ||||||
( | ( | ( | ( | |||
Non-annuitant mortality and morbidity | ||||||
( | ( | ( | ( | |||
Lapse rates | ||||||
( | ( | ( | ( | |||
1 year | 5 year | 10 year | 20 year | 30 year | |
2025 | |||||
2024 |
2025 £m | 2024 £m | 2023 £m | |||
Operating lease rental income | |||||
Rental income from investment properties (note 24) | |||||
Other1 | |||||
Total other operating income |
2025 £m | 2024 £m | 2023 £m | |||
Staff costs: | |||||
Salaries and social security costs1 | |||||
Pensions and other retirement benefit schemes (note 12) | |||||
Restructuring and other staff costs | |||||
Premises and equipment costs2 | |||||
Depreciation and amortisation3 | |||||
UK bank levy | |||||
Regulatory and legal provisions (note 28) | |||||
Other | |||||
Operating expenses before adjustment for: | |||||
Amounts attributable to the acquisition of insurance and participating investment contracts | ( | ( | ( | ||
Amounts reported within insurance service expenses | ( | ( | ( | ||
Total operating expenses |
2025 | 2024 | 2023 | |
UK | |||
Overseas | |||
Total |
Performance-based compensation expense | Performance-based compensation expense deferred until later years | ||||||
2025 £m | 2024 £m | 2023 £m | 2025 £m | 2024 £m | 2023 £m | ||
Awards made in respect of the year ended 31 December | |||||||
Awards made in respect of earlier years | |||||||
2025 £m | 2024 £m | 2023 £m | |||
Deferred bonus plan | |||||
Options and shares granted in the year | |||||
Options and shares granted in prior years | |||||
Total charge to the income statement |
2025 | 2024 | ||||
Number of options | Weighted average exercise price (pence) | Number of options | Weighted average exercise price (pence) | ||
Outstanding at 1 January | |||||
Granted | |||||
Exercised | ( | ( | |||
Forfeited | ( | ( | |||
Cancelled | ( | ( | |||
Expired | ( | ( | |||
Outstanding at 31 December | |||||
Exercisable at 31 December | |||||
2025 | 2024 | ||||
Number of options | Weighted average exercise price (pence) | Number of options | Weighted average exercise price (pence) | ||
Outstanding at 1 January | |||||
Granted | |||||
Exercised | ( | ( | |||
Forfeited | ( | ( | |||
Lapsed | ( | ||||
Outstanding at 31 December | |||||
Exercisable at 31 December | |||||
2025 Number of options | 2024 Number of options | |
Outstanding at 1 January | ||
Exercised | ( | ( |
Outstanding at 31 December |
2025 Number of shares | 2024 Number of shares | |
Outstanding at 1 January | ||
Vested | ( | ( |
Forfeited | ( | |
Dividend award | ||
Outstanding at 31 December |
2025 Number of shares | 2024 Number of shares | |
Outstanding at 1 January | ||
Vested | ( | ( |
Forfeited | ( | ( |
Outstanding at 31 December |
2025 Number of shares | 2024 Number of shares | |
Outstanding at 1 January | ||
Granted | ||
Outstanding at 31 December |
2025 | 2024 | ||
Number of shares | Number of shares | ||
Outstanding at 1 January | |||
Granted | |||
Vested | ( | ( | |
Outstanding at 31 December |
SAYE | Executive Share Plans | Long Term Share Plan | |
Weighted average risk-free interest rate | |||
Weighted average expected life | |||
Weighted average expected volatility | |||
Weighted average expected dividend yield | |||
Weighted average share price | £ | £ | £ |
Weighted average exercise price | £ |
Key sources of estimation uncertainty: | Discount rate applied to future cash flows |
Expected lifetime of the schemes’ members | |
Expected rate of future inflationary increases |
2025 £m | 2024 £m | 2023 £m | |
Charge (credit) to the income statement | |||
Defined benefit pension schemes | ( | ( | ( |
Other retirement benefit schemes | |||
Total defined benefit schemes | ( | ( | ( |
Defined contribution pension schemes | |||
Total charge to the income statement (note 10) |
2025 £m | 2024 £m | |
Amounts recognised in the balance sheet | ||
Retirement benefit assets | ||
Retirement benefit obligations | ( | ( |
Total amounts recognised in the balance sheet |
2025 £m | 2024 £m | |
Defined benefit pension schemes | ||
Other retirement benefit schemes | ( | ( |
Total amounts recognised in the balance sheet |
2025 £m | 2024 £m | |
Amount included in the balance sheet | ||
Present value of funded obligations | ( | ( |
Fair value of scheme assets | ||
Net amount recognised in the balance sheet |
2025 £m | 2024 £m | |
Net amount recognised in the balance sheet | ||
At 1 January | ||
Net defined benefit pension credit | ||
Actuarial gains on defined benefit obligation | ||
Return on plan assets | ( | ( |
Employer contributions | ||
At 31 December |
2025 £m | 2024 £m | |
Movements in the defined benefit obligation | ||
At 1 January | ( | ( |
Current service cost | ( | ( |
Interest expense | ( | ( |
Remeasurements: | ||
Actuarial gains – demographic assumptions | ||
Actuarial (losses) gains – experience | ( | |
Actuarial gains – financial assumptions | ||
Benefits paid | ||
Past service cost | ( | ( |
Settlements | ||
Exchange and other adjustments | ( | |
At 31 December | ( | ( |
2025 £m | 2024 £m | |
Analysis of the defined benefit obligation | ||
Active members | ( | ( |
Deferred members | ( | ( |
Dependants | ( | ( |
Pensioners | ( | ( |
At 31 December | ( | ( |
2025 £m | 2024 £m | |
Changes in the fair value of scheme assets | ||
At 1 January | ||
Return on plan assets excluding amounts included in interest income | ( | ( |
Interest income | ||
Employer contributions | ||
Benefits paid | ( | ( |
Settlements | ( | ( |
Administrative costs paid | ( | ( |
Exchange and other adjustments | ( | |
At 31 December |
2025 £m | 2024 £m | 2023 £m | |
Current service cost | |||
Net interest amount | ( | ( | ( |
Past service cost – plan amendments | |||
Plan administration costs incurred during the year | |||
Total defined benefit pension credit | ( | ( | ( |
2025 | 2024 | ||||||||||
Quoted £m | Unquoted £m | Total £m | Quoted £m | Unquoted £m | Total £m | ||||||
Debt instruments1: | |||||||||||
Fixed interest government bonds | |||||||||||
Index-linked government bonds | |||||||||||
Corporate and other debt securities | |||||||||||
Asset-backed securities | |||||||||||
Pooled investment vehicles | |||||||||||
Property | |||||||||||
Equity instruments | |||||||||||
Money market instruments, cash, derivatives and other assets and liabilities | ( | ( | ( | ( | |||||||
At 31 December | ( | ( | |||||||||
2025 £m | 2024 £m | |
Alternative credit funds | ||
Bond and debt funds | ||
Equity funds | ||
Hedge and mutual funds | ||
Infrastructure funds | ||
Liquidity funds | ||
Property funds | ||
Other | ||
At 31 December |
2025 % | 2024 % | |
Discount rate | ||
Rate of inflation: | ||
Retail Price Index (RPI) | ||
Consumer Price Index (CPI) | ||
Rate of salary increases | ||
Weighted average rate of increase for pensions in payment |
Men | Women | ||||
2025 Years | 2024 Years | 2025 Years | 2024 Years | ||
Life expectancy for average member aged 60, on the valuation date | |||||
Life expectancy for average member aged 60, 15 years after the valuation date | |||||
Effect of reasonably possible alternative assumptions | |||||
Increase (decrease) in the income statement charge | Increase (decrease) in the net defined benefit pension scheme surplus | ||||
2025 £m | 2024 £m | 2025 £m | 2024 £m | ||
Inflation (including pension increases)1: | |||||
Increase of 0.25% | ( | ( | |||
Decrease of 0.25% | ( | ( | |||
Discount rate2: | |||||
Increase of 0.25% | ( | ( | |||
Decrease of 0.25% | ( | ( | |||
Expected life expectancy of members: | |||||
Increase of one year | ( | ( | |||
Decrease of one year | ( | ( | |||
2025 Years | 2024 Years | |
Duration of the defined benefit obligation |
2025 £m | 2024 £m | |
Within 12 months | ||
Between 1 and 2 years | ||
Between 2 and 5 years | ||
Between 5 and 10 years | ||
Between 10 and 15 years | ||
Between 15 and 25 years | ||
Between 25 and 35 years | ||
Between 35 and 45 years | ||
In more than 45 years |
2025 £m | 2024 £m | |
At 1 January | ( | ( |
Actuarial gains | ||
Insurance premiums paid | ||
Charge for the year | ( | ( |
At 31 December | ( | ( |
2025 £m | 2024 £m | 2023 £m | |||
Fees payable for the: | |||||
– audit of the Company’s current year annual report | |||||
– audits of the Company’s subsidiaries | |||||
– total audit fees in respect of the statutory audit of Group entities1 | |||||
– services normally provided in connection with statutory and regulatory filings or engagements | |||||
Total audit fees2 | |||||
Other audit-related fees2 | |||||
All other fees2 | |||||
Total non-audit services3 | |||||
Total fees payable to the Company’s auditors by the Group |
2025 £m | 2024 £m | 2023 £m | |
Audits of Group pension schemes | |||
Audits of the unconsolidated Open-Ended Investment Companies managed by the Group |
Year ended 31 December 2025 | Stage 1 £m | Stage 2 £m | Stage 3 £m | POCI £m | Total £m | ||||
Loans and advances to banks | |||||||||
Loans and advances to customers | ( | ( | |||||||
Debt securities | |||||||||
Financial assets at amortised cost | ( | ( | |||||||
Financial assets at fair value through other comprehensive income | ( | ( | |||||||
Other assets | |||||||||
Loan commitments and financial guarantees | ( | ( | ( | ||||||
Total impairment (credit) charge | ( | ( | ( |
Year ended 31 December 2024 | Stage 1 £m | Stage 2 £m | Stage 3 £m | POCI £m | Total £m | ||||
Loans and advances to banks | ( | ( | |||||||
Loans and advances to customers | ( | ( | ( | ||||||
Debt securities | ( | ( | ( | ||||||
Financial assets at amortised cost | ( | ( | ( | ||||||
Financial assets at fair value through other comprehensive income | ( | ( | |||||||
Other assets | ( | ( | |||||||
Loan commitments and financial guarantees | ( | ( | ( | ||||||
Total impairment (credit) charge | ( | ( | ( |
Year ended 31 December 2023 | Stage 1 £m | Stage 2 £m | Stage 3 £m | POCI £m | Total £m | ||||
Loans and advances to banks | ( | ( | ( | ||||||
Loans and advances to customers | ( | ( | |||||||
Debt securities | |||||||||
Financial assets at amortised cost | ( | ( | |||||||
Financial assets at fair value through other comprehensive income | ( | ( | |||||||
Other assets | ( | ( | |||||||
Loan commitments and financial guarantees | ( | ( | |||||||
Total impairment charge (credit) | ( | ( |
2025 £m | 2024 £m | 2023 £m | |||
UK corporation tax: | |||||
Current tax on profit for the year | ( | ( | ( | ||
Adjustments in respect of prior years | |||||
( | ( | ( | |||
Foreign tax: | |||||
Current tax on profit for the year | ( | ( | ( | ||
Adjustments in respect of prior years | ( | ||||
( | ( | ( | |||
Current tax expense | ( | ( | ( | ||
Deferred tax: | |||||
Current year | ( | ( | ( | ||
Adjustments in respect of prior years | ( | ||||
Deferred tax (expense) credit | ( | ( | ( | ||
Tax expense | ( | ( | ( |
Tax (expense) credit attributable to policyholders | ( | ( | |||
Shareholder tax expense | ( | ( | ( | ||
Tax expense | ( | ( | ( |
2025 £m | 2024 £m | 2023 £m | |
Profit before tax | |||
UK corporation tax thereon | ( | ( | ( |
Impact of surcharge on banking profits | ( | ( | ( |
Non-deductible costs: conduct charges | ( | ( | ( |
Non-deductible costs: bank levy | ( | ( | ( |
Other non-deductible costs1 | ( | ( | ( |
Non-taxable income1 | |||
Tax relief on coupons on other equity instruments | |||
(Non-deductible) non-taxable foreign exchange (losses) gains1 | ( | ( | |
Tax-exempt gains on disposals | |||
Tax losses where no deferred tax recognised | ( | ( | ( |
Remeasurement of deferred tax due to rate changes | ( | ||
Differences in overseas tax rates | ( | ( | |
Policyholder tax in respect of the life assurance business | ( | ( | ( |
Deferred tax in respect of life assurance policyholder tax | ( | ( | |
Adjustments in respect of prior years | |||
Tax effect of share of results of joint ventures | ( | ( | |
Provision for Pillar 2 current income taxes | ( | ||
Tax expense | ( | ( | ( |
Statutory position | 2025 £m | 2024 £m | Tax disclosure | 2025 £m | 2024 £m | |
Deferred tax assets | Deferred tax assets | |||||
Deferred tax liabilities | ( | ( | Deferred tax liabilities | ( | ( | |
Net deferred tax asset at 31 December | Net deferred tax asset at 31 December |
Deferred tax assets | Tax losses £m | Property, plant and equipment £m | Provisions £m | Long-term assurance business £m | Share- based payments £m | Pension liabilities £m | Derivatives £m | Asset revaluations1 £m | Other temporary differences £m | Total £m |
At 1 January 2024 | ||||||||||
Charge to the income statement | ( | ( | ( | ( | ( | ( | ( | ( | ( | |
(Charge) credit to other comprehensive income | ( | |||||||||
Transfer to disposal group | ( | ( | ||||||||
Other charge to equity | ( | ( | ||||||||
At 31 December 2024 | ||||||||||
(Charge) credit to the income statement | ( | ( | ( | ( | ( | ( | ( | ( | ||
Credit (charge) to other comprehensive income | ( | ( | ( | |||||||
Other credit to equity | ||||||||||
At 31 December 2025 |
Deferred tax liabilities | Property, plant and equipment £m | Capitalised software enhancements £m | Long-term assurance business £m | Acquisition fair value £m | Pension assets £m | Derivatives £m | Other temporary differences £m | Total £m |
At 1 January 2024 | ( | ( | ( | ( | ( | ( | ||
(Charge) credit to the income statement | ( | ( | ||||||
Credit to other comprehensive income | ||||||||
Exchange and other adjustments | ||||||||
At 31 December 2024 | ( | ( | ( | ( | ( | ( | ||
(Charge) credit to the income statement | ( | ( | ||||||
Credit to other comprehensive income | ||||||||
Acquisitions | ( | ( | ||||||
Exchange and other adjustments | ( | |||||||
At 31 December 2025 | ( | ( | ( | ( | ( | ( | ( | ( |
Critical judgement: | The Group believes that its interpretation of the tax rules on group relief are correct |
Derivatives designated as hedging instruments £m | Mandatorily held at fair value through profit or loss | Designated at fair value through profit or loss £m | At fair value through other comprehensive income £m | Held at amortised cost £m | Insurance- related contracts £m | ||||||||||
At 31 December 2025 | Held for trading £m | Other £m | Total £m | ||||||||||||
Financial assets | |||||||||||||||
Cash and balances at central banks | – | – | – | – | – | – | |||||||||
Financial assets at fair value through profit or loss | – | – | – | – | – | ||||||||||
Derivative financial instruments | – | – | – | – | – | ||||||||||
Loans and advances to banks | – | – | – | – | – | – | |||||||||
Loans and advances to customers | – | – | – | – | – | – | |||||||||
Reverse repurchase agreements | – | – | – | – | – | – | |||||||||
Debt securities | – | – | – | – | – | – | |||||||||
Financial assets at amortised cost | – | – | – | – | – | – | |||||||||
Financial assets at fair value through other comprehensive income | – | – | – | – | – | – | |||||||||
Other | – | – | – | – | – | ||||||||||
Total financial assets | – | ||||||||||||||
Financial liabilities | |||||||||||||||
Deposits from banks | – | – | – | – | – | – | |||||||||
Customer deposits | – | – | – | – | – | – | |||||||||
Repurchase agreements at amortised cost | – | – | – | – | – | – | |||||||||
Financial liabilities at fair value through profit or loss | – | – | – | – | – | ||||||||||
Derivative financial instruments | – | – | – | – | – | ||||||||||
Notes in circulation | – | – | – | – | – | – | |||||||||
Debt securities in issue at amortised cost | – | – | – | – | – | – | |||||||||
Liabilities arising from insurance and participating investment contracts | – | – | – | – | – | – | |||||||||
Liabilities arising from non-participating investment contracts | – | – | – | – | – | – | |||||||||
Other | – | – | – | – | – | ||||||||||
Subordinated liabilities | – | – | – | – | – | – | |||||||||
Total financial liabilities | – | – | |||||||||||||
Related amounts where set off in the balance sheet not permitted1 | Potential net amounts if offset of related amounts permitted £m | ||||||||||||
At 31 December 2025 | Gross amounts of assets and liabilities £m | Amount offset in the balance sheet2 £m | Net amounts presented in the balance sheet £m | Cash collateral (received)/ pledged £m | Non-cash collateral (received)/ pledged £m | Master netting and similar agreements £m | |||||||
Derivative assets | ( | ( | ( | ( | |||||||||
Derivative liabilities | ( | ( | ( | ||||||||||
Net position | ( | ||||||||||||
Reverse repurchase agreements held at fair value | ( | ( | ( | ||||||||||
Repurchase agreements held at fair value | ( | ( | ( | ( | |||||||||
Net position | ( | ( | ( | ||||||||||
Reverse repurchase agreements held at amortised cost | ( | ( | |||||||||||
Repurchase agreements held at amortised cost | ( | ( | ( | ||||||||||
Net position | ( | ( | |||||||||||
Derivatives designated as hedging instruments £m | Mandatorily held at fair value through profit or loss | Designated at fair value through profit or loss £m | At fair value through other comprehensive income £m | Held at amortised cost £m | Insurance- related contracts £m | ||||||||||
At 31 December 2024 | Held for trading £m | Other £m | Total £m | ||||||||||||
Financial assets | |||||||||||||||
Cash and balances at central banks | – | – | – | – | – | – | |||||||||
Financial assets at fair value through profit or loss | – | – | – | – | – | ||||||||||
Derivative financial instruments | – | – | – | – | – | ||||||||||
Loans and advances to banks | – | – | – | – | – | – | |||||||||
Loans and advances to customers | – | – | – | – | – | – | |||||||||
Reverse repurchase agreements | – | – | – | – | – | – | |||||||||
Debt securities | – | – | – | – | – | – | |||||||||
Financial assets at amortised cost | – | – | – | – | – | – | |||||||||
Financial assets at fair value through other comprehensive income | – | – | – | – | – | – | |||||||||
Other | – | – | – | – | – | ||||||||||
Total financial assets | – | ||||||||||||||
Financial liabilities | |||||||||||||||
Deposits from banks | – | – | – | – | – | – | |||||||||
Customer deposits | – | – | – | – | – | – | |||||||||
Repurchase agreements at amortised cost | – | – | – | – | – | – | |||||||||
Financial liabilities at fair value through profit or loss | – | – | – | – | – | ||||||||||
Derivative financial instruments | – | – | – | – | – | ||||||||||
Notes in circulation | – | – | – | – | – | – | |||||||||
Debt securities in issue at amortised cost | – | – | – | – | – | – | |||||||||
Liabilities arising from insurance and participating investment contracts | – | – | – | – | – | – | |||||||||
Liabilities arising from non-participating investment contracts | – | – | – | – | – | – | |||||||||
Other | – | – | – | – | – | ||||||||||
Subordinated liabilities | – | – | – | – | – | – | |||||||||
Total financial liabilities | – | – | |||||||||||||
Amount offset in the balance sheet2 £m | Related amounts where set off in the balance sheet not permitted1 | Potential net amounts if offset of related amounts permitted £m | |||||||||||
At 31 December 2024 | Gross amounts of assets and liabilities £m | Net amounts presented in the balance sheet £m | Cash collateral (received)/ pledged £m | Non-cash collateral (received)/ pledged £m | Master netting and similar agreements £m | ||||||||
Derivative assets | ( | ( | ( | ( | |||||||||
Derivative liabilities | ( | ( | ( | ||||||||||
Net position | ( | ( | ( | ( | |||||||||
Reverse repurchase agreements held at fair value | ( | ( | |||||||||||
Repurchase agreements held at fair value | ( | ( | ( | ||||||||||
Net position | ( | ( | ( | ( | |||||||||
Reverse repurchase agreements held at amortised cost | ( | ( | |||||||||||
Repurchase agreements held at amortised cost | ( | ( | ( | ||||||||||
Net position | ( | ||||||||||||
Level 1 £m | Level 2 £m | Level 3 £m | Total £m | ||||
At 31 December 2025 | |||||||
Trading assets | |||||||
Loans and advances to customers | |||||||
Reverse repurchase agreements | |||||||
Debt securities: | |||||||
Government securities | |||||||
Asset-backed securities | |||||||
Corporate and other debt securities | |||||||
Total trading assets | |||||||
Other financial assets mandatorily held at fair value through profit or loss | |||||||
Loans and advances to banks | |||||||
Loans and advances to customers | |||||||
Debt securities: | |||||||
Government securities | |||||||
Other public sector securities | |||||||
Bank and building society certificates of deposit | |||||||
Asset-backed securities | |||||||
Corporate and other debt securities | |||||||
Treasury and other bills | |||||||
Equity shares | |||||||
Contracts held with reinsurers | |||||||
Total other financial assets mandatorily held at fair value through profit or loss1 | |||||||
Total financial assets at fair value through profit or loss | |||||||
Financial assets at fair value through other comprehensive income | |||||||
Debt securities: | |||||||
Government securities | |||||||
Asset-backed securities | |||||||
Corporate and other debt securities | |||||||
Equity shares | |||||||
Total financial assets at fair value through other comprehensive income | |||||||
Total financial assets (excluding derivatives) at fair value |
Level 1 £m | Level 2 £m | Level 3 £m | Total £m | ||||
At 31 December 2024 | |||||||
Trading assets | |||||||
Loans and advances to customers | |||||||
Reverse repurchase agreements | |||||||
Debt securities: | |||||||
Government securities | |||||||
Asset-backed securities | |||||||
Corporate and other debt securities | |||||||
Total trading assets | |||||||
Other financial assets mandatorily held at fair value through profit or loss | |||||||
Loans and advances to banks | |||||||
Loans and advances to customers | |||||||
Debt securities: | |||||||
Government securities | |||||||
Other public sector securities | |||||||
Bank and building society certificates of deposit | |||||||
Asset-backed securities | |||||||
Corporate and other debt securities | |||||||
Treasury and other bills | |||||||
Equity shares | |||||||
Contracts held with reinsurers | |||||||
Total other financial assets mandatorily held at fair value through profit or loss1 | |||||||
Total financial assets at fair value through profit or loss | |||||||
Financial assets at fair value through other comprehensive income | |||||||
Debt securities: | |||||||
Government securities | |||||||
Asset-backed securities | |||||||
Corporate and other debt securities | |||||||
Equity shares | |||||||
Total financial assets at fair value through other comprehensive income | |||||||
Total financial assets (excluding derivatives) at fair value |
2025 | 2024 | ||||||
Financial assets at fair value through profit or loss £m | Financial assets at fair value through other comprehensive income £m | Total level 3 financial assets (excluding derivatives) at fair value, recurring basis £m | Financial assets at fair value through profit or loss £m | Financial assets at fair value through other comprehensive income £m | Total level 3 financial assets (excluding derivatives) at fair value, recurring basis £m | ||
At 1 January | |||||||
Exchange and other adjustments | ( | ( | ( | ||||
Gains recognised in the income statement within other income | |||||||
(Losses) gains recognised in other comprehensive income within the revaluation reserve in respect of financial assets at fair value through other comprehensive income | – | ( | ( | – | |||
Purchases/increases to customer loans | |||||||
Sales/repayments of customer loans | ( | ( | ( | ( | ( | ( | |
Transfers into the level 3 portfolio | |||||||
Transfers out of the level 3 portfolio | ( | ( | ( | ( | |||
At 31 December | |||||||
Gains (losses) recognised in the income statement, within other income, relating to the change in fair value of those assets held at 31 December | ( | ||||||
Level 1 £m | Level 2 £m | Level 3 £m | Total £m | ||||
At 31 December 2025 | |||||||
Trading liabilities | |||||||
Liabilities in respect of securities sold under repurchase agreements | |||||||
Short positions in securities | |||||||
Total trading liabilities | |||||||
Debt securities in issue designated at fair value through profit or loss | |||||||
Total financial liabilities (excluding derivatives) at fair value | |||||||
At 31 December 2024 | |||||||
Trading liabilities | |||||||
Liabilities in respect of securities sold under repurchase agreements | |||||||
Short positions in securities | |||||||
Total trading liabilities | |||||||
Debt securities in issue designated at fair value through profit or loss | |||||||
Total financial liabilities (excluding derivatives) at fair value |
2025 £m | 2024 £m | |
At 1 January | ||
(Gains) losses recognised in the income statement within other income | ( | |
Redemptions | ( | ( |
Transfers out of the level 3 portfolio | ( | |
At 31 December | ||
(Gains) losses recognised in the income statement, within other income, relating to the change in fair value of those liabilities held at 31 December | ( |
2025 | 2024 | ||||||||
Level 1 £m | Level 2 £m | Level 3 £m | Total £m | Level 1 £m | Level 2 £m | Level 3 £m | Total £m | ||
Derivative assets | |||||||||
Derivative liabilities | ( | ( | ( | ( | ( | ( | ( | ( | |
2025 | 2024 | ||||
Derivative assets £m | Derivative liabilities £m | Derivative assets £m | Derivative liabilities £m | ||
At 1 January | ( | ( | |||
Exchange and other adjustments | ( | ( | |||
(Losses) gains recognised in the income statement within other income | ( | ( | |||
Purchases (additions) | ( | ( | |||
(Sales) redemptions | ( | ( | |||
Transfers into the level 3 portfolio | ( | ||||
Transfers out of the level 3 portfolio | ( | ||||
At 31 December | ( | ( | |||
(Losses) gains recognised in the income statement, within other income, relating to the change in fair value of those assets or liabilities held at 31 December | ( | ( | |||
Adjustment | 2025 £m | 2024 £m |
Credit Valuation Adjustment | ||
Debit Valuation Adjustment | ( | ( |
Funding Valuation Adjustment | ||
Liquidity Adjustment | ||
Other | ||
Total |
Key sources of estimation uncertainty: | Interest rate spreads, credit spreads, earnings multiples, interest rate volatility and recovery rates |
2025 | 2024 | ||||||||||||
Effect of reasonably possible alternative assumptions1 | Effect of reasonably possible alternative assumptions1 | ||||||||||||
Valuation techniques | Significant unobservable inputs2 | Carrying value £m | Favourable changes £m | Unfavourable changes £m | Carrying value £m | Favourable changes £m | Unfavourable changes £m | ||||||
Financial assets at fair value through profit or loss | |||||||||||||
Loans and advances to customers | Discounted cash flows | Interest rate spreads (+/- | ( | ( | |||||||||
Debt securities | Discounted cash flows | Credit spreads (+/- | ( | ( | |||||||||
Equity and venture capital investments | Market approach | Earnings multiple (+/- | ( | ( | |||||||||
Underlying asset/net asset fair value (incl. property prices) | n/a | ( | ( | ||||||||||
Unlisted equities, debt securities and property partnerships in the life funds | Underlying asset/net asset fair value (incl. property prices), broker quotes or discounted cash flows | n/a | ( | ( | |||||||||
Financial assets at fair value through other comprehensive income | |||||||||||||
Asset-backed securities | Lead manager or broker quote/ consensus pricing | n/a | ( | ( | |||||||||
Equity and venture capital investments | Underlying asset/net asset fair value (incl. property prices) | n/a | ( | ( | |||||||||
Derivative financial assets | |||||||||||||
Interest rate options | Option pricing model | Interest rate volatility ( | ( | ( | |||||||||
Interest rate derivatives | Discounted cash flows | (+/- uncertainty of recovery rates7 | ( | ( | |||||||||
Level 3 financial assets carried at fair value | |||||||||||||
Financial liabilities at fair value through profit or loss | |||||||||||||
Securitisation notes and other | Discounted cash flows | Interest rate spreads (+/– | ( | ( | |||||||||
Derivative financial liabilities | |||||||||||||
Interest rate derivatives | Option pricing model | Interest rate volatility ( | ( | ( | |||||||||
Level 3 financial liabilities carried at fair value | |||||||||||||
Carrying value £m | Fair value £m | Valuation hierarchy | |||||||
Level 1 £m | Level 2 £m | Level 3 £m | |||||||
At 31 December 2025 | |||||||||
Loans and advances to banks | |||||||||
Loans and advances to customers | |||||||||
Reverse repurchase agreements | |||||||||
Debt securities | |||||||||
At 31 December 2024 | |||||||||
Loans and advances to banks | |||||||||
Loans and advances to customers | |||||||||
Reverse repurchase agreements | |||||||||
Debt securities | |||||||||
Carrying value £m | Fair value £m | Valuation hierarchy | ||||
Level 1 £m | Level 2 £m | Level 3 £m | ||||
At 31 December 2025 | ||||||
Deposits from banks | ||||||
Customer deposits | ||||||
Repurchase agreements at amortised cost | ||||||
Debt securities in issue at amortised cost | ||||||
Subordinated liabilities | ||||||
At 31 December 2024 | ||||||
Deposits from banks | ||||||
Customer deposits | ||||||
Repurchase agreements at amortised cost | ||||||
Debt securities in issue at amortised cost | ||||||
Subordinated liabilities | ||||||
Up to 1 month £m | 1 to 3 months £m | 3 to 6 months £m | 6 to 9 months £m | 9 to 12 months £m | 1 to 2 years £m | 2 to 5 years £m | Over 5 years £m | Total £m | |||||||||
At 31 December 2025 | |||||||||||||||||
Assets | |||||||||||||||||
Cash and balances at central banks | |||||||||||||||||
Financial assets at fair value through profit or loss | |||||||||||||||||
Derivative financial instruments | |||||||||||||||||
Loans and advances to banks | |||||||||||||||||
Loans and advances to customers | |||||||||||||||||
Reverse repurchase agreements | |||||||||||||||||
Debt securities | |||||||||||||||||
Financial assets at amortised cost | |||||||||||||||||
Financial assets at fair value through other comprehensive income | |||||||||||||||||
Other assets | |||||||||||||||||
Total assets | |||||||||||||||||
Liabilities | |||||||||||||||||
Deposits from banks | |||||||||||||||||
Customer deposits | |||||||||||||||||
Repurchase agreements at amortised cost | |||||||||||||||||
Financial liabilities at fair value through profit or loss | |||||||||||||||||
Derivative financial instruments | |||||||||||||||||
Debt securities in issue at amortised cost | |||||||||||||||||
Liabilities arising from insurance and participating investment contracts | |||||||||||||||||
Liabilities arising from non-participating investment contracts | |||||||||||||||||
Other liabilities | |||||||||||||||||
Subordinated liabilities | |||||||||||||||||
Total liabilities |
Up to 1 month £m | 1 to 3 months £m | 3 to 6 months £m | 6 to 9 months £m | 9 to 12 months £m | 1 to 2 years £m | 2 to 5 years £m | Over 5 years £m | Total £m | |||||||||
At 31 December 2024 | |||||||||||||||||
Assets | |||||||||||||||||
Cash and balances at central banks | |||||||||||||||||
Financial assets at fair value through profit or loss | |||||||||||||||||
Derivative financial instruments | |||||||||||||||||
Loans and advances to banks | |||||||||||||||||
Loans and advances to customers | |||||||||||||||||
Reverse repurchase agreements | |||||||||||||||||
Debt securities | |||||||||||||||||
Financial assets at amortised cost | |||||||||||||||||
Financial assets at fair value through other comprehensive income | |||||||||||||||||
Other assets | |||||||||||||||||
Total assets | |||||||||||||||||
Liabilities | |||||||||||||||||
Deposits from banks | |||||||||||||||||
Customer deposits | |||||||||||||||||
Repurchase agreements at amortised cost | |||||||||||||||||
Financial liabilities at fair value through profit or loss | |||||||||||||||||
Derivative financial instruments | |||||||||||||||||
Debt securities in issue at amortised cost | |||||||||||||||||
Liabilities arising from insurance and participating investment contracts | |||||||||||||||||
Liabilities arising from non-participating investment contracts | |||||||||||||||||
Other liabilities | |||||||||||||||||
Subordinated liabilities | |||||||||||||||||
Total liabilities |
2025 | 2024 | ||||||||||
Contract/ notional amount £m | Fair value | Contract/ notional amount £m | Fair value | ||||||||
Assets £m | Liabilities £m | Assets £m | Liabilities £m | ||||||||
Trading and other | |||||||||||
Exchange rate contracts | |||||||||||
Interest rate contracts | |||||||||||
Credit derivatives | |||||||||||
Equity, commodity and other contracts | |||||||||||
Total derivative assets/liabilities – trading and other | |||||||||||
Hedging | |||||||||||
Interest rate | |||||||||||
Currency swaps | |||||||||||
Interest rate swaps | |||||||||||
Designated as fair value hedges | |||||||||||
Foreign exchange | |||||||||||
Currency swaps | |||||||||||
Interest rate | |||||||||||
Interest rate swaps | |||||||||||
Designated as cash flow hedges | |||||||||||
Total derivative assets/liabilities – hedging | |||||||||||
Total recognised derivative assets/liabilities | |||||||||||
Carrying amount of the hedged item | Accumulated amount of fair value adjustment on the hedged item | Change in fair value of hedged item for ineffectiveness assessment £m | Hedge ineffectiveness recognised in the income statement4 £m | ||||||||
Fair value hedges | Assets £m | Liabilities £m | Assets £m | Liabilities £m | |||||||
At 31 December 2025 | |||||||||||
Interest rate | |||||||||||
Fixed rate mortgages1 | ( | ( | |||||||||
Fixed rate issuance2 | ( | ||||||||||
Fixed rate bonds3 | ( | ( | |||||||||
Total | ( | ( | |||||||||
At 31 December 2024 | |||||||||||
Interest rate | |||||||||||
Fixed rate mortgages1 | ( | ( | ( | ||||||||
Fixed rate issuance2 | ( | ( | |||||||||
Fixed rate bonds3 | ( | ( | ( | ||||||||
Total | ( | ( | ( | ||||||||
Gain (loss) recognised in other comprehensive income £m | Amounts reclassified from reserves to net interest income as: | Cash flow hedge reserve | Change in fair value of hedged item for ineffectiveness assessment £m | Hedge ineffectiveness recognised in the income statement1 £m | |||||||||
Cash flow hedges | Hedged cash flows that will no longer occur £m | Hedged item affected income statement £m | Continuing hedges £m | Discontinued hedges £m | |||||||||
At 31 December 2025 | |||||||||||||
Foreign exchange | |||||||||||||
Foreign currency issuance2 | ( | ( | ( | ||||||||||
Customer deposits3 | |||||||||||||
Interest rate | |||||||||||||
Customer loans4 | ( | ( | ( | ||||||||||
Central bank balances5 | ( | ( | ( | ||||||||||
Customer deposits3 | ( | ( | ( | ||||||||||
Total | ( | ( | ( | ||||||||||
At 31 December 2024 | |||||||||||||
Foreign exchange | |||||||||||||
Foreign currency issuance2 | ( | ( | |||||||||||
Customer deposits3 | |||||||||||||
Interest rate | |||||||||||||
Customer loans4 | ( | ( | ( | ( | |||||||||
Central bank balances5 | ( | ( | ( | ( | |||||||||
Customer deposits3 | ( | ( | |||||||||||
Total | ( | ( | ( | ( | |||||||||
Maturity | Changes in fair value used for calculating hedge ineffectiveness £m | ||||||||||||
Fair value hedges | Up to 1 month £m | 1 to 3 months £m | 3 to 12 months £m | 1 to 5 years £m | Over 5 years £m | Total £m | |||||||
At 31 December 2025 | |||||||||||||
Interest rate | |||||||||||||
Cross currency swap | |||||||||||||
Notional | |||||||||||||
Average fixed interest rate | |||||||||||||
Average EUR/GBP exchange rate | |||||||||||||
Interest rate swap | |||||||||||||
Notional | ( | ||||||||||||
Average fixed interest rate | |||||||||||||
( | |||||||||||||
Cash flow hedges | |||||||||||||
At 31 December 2025 | |||||||||||||
Foreign exchange | |||||||||||||
Currency swap | |||||||||||||
Notional | ( | ||||||||||||
Average EUR/GBP exchange rate | |||||||||||||
Average USD/GBP exchange rate | |||||||||||||
Interest rate | |||||||||||||
Interest rate swap | |||||||||||||
Notional | |||||||||||||
Average fixed interest rate | |||||||||||||
Total | |||||||||||||
Fair value hedges | |||||||||||||
At 31 December 2024 | |||||||||||||
Interest rate | |||||||||||||
Cross currency swap | |||||||||||||
Notional | |||||||||||||
Average fixed interest rate | |||||||||||||
Average EUR/GBP exchange rate | |||||||||||||
Interest rate swap | |||||||||||||
Notional | |||||||||||||
Average fixed interest rate | |||||||||||||
Cash flow hedges | |||||||||||||
At 31 December 2024 | |||||||||||||
Foreign exchange | |||||||||||||
Currency swap | |||||||||||||
Notional | |||||||||||||
Average EUR/GBP exchange rate | |||||||||||||
Average USD/GBP exchange rate | |||||||||||||
Interest rate | |||||||||||||
Interest rate swap | |||||||||||||
Notional | ( | ||||||||||||
Average fixed interest rate | |||||||||||||
( | |||||||||||||
Total | |||||||||||||
At 31 December 2025 | At 31 December 2024 | |||||||||||||||||||
Allowance for expected credit losses | Stage 1 £m | Stage 2 £m | Stage 3 £m | POCI £m | Total £m | Stage 1 £m | Stage 2 £m | Stage 3 £m | POCI £m | Total £m | ||||||||||
In respect of: | ||||||||||||||||||||
Loans and advances to banks | ||||||||||||||||||||
UK mortgages | ||||||||||||||||||||
Credit cards | ||||||||||||||||||||
Other | ||||||||||||||||||||
Retail | ||||||||||||||||||||
Commercial Banking | ||||||||||||||||||||
Other | ||||||||||||||||||||
Loans and advances to customers | ||||||||||||||||||||
Debt securities | ||||||||||||||||||||
Financial assets at amortised cost | ||||||||||||||||||||
Other assets | ||||||||||||||||||||
Provisions in relation to loan commitments and financial guarantees | ||||||||||||||||||||
Total | ||||||||||||||||||||
Expected credit loss in respect of financial assets at fair value through other comprehensive income (memorandum item) | ||||||||||||||||||||
Critical judgements: | Determining an appropriate definition of default against which a probability of default, exposure at default and loss given default parameter can be evaluated |
Establishing the criteria for a significant increase in credit risk (SICR) | |
The individual assessment of material cases and the use of judgemental adjustments made to impairment modelling processes that adjust inputs, parameters and outputs to reflect risks not captured by models | |
Key source of estimation uncertainty: | Base case and multiple economic scenarios (MES) assumptions, including the rate of unemployment and the rate of change of house prices, required for creation of MES scenarios and forward-looking credit parameters |
RMS grade | 1 | 2 | 3 | 4 | 5 | 6 | 7 | 8 | 9 | 10 | 11 | 12 | 13 | 14 |
PD boundary1 (%) |
At 31 December 2025 | At 31 December 2024 | ||||||||||||||
Modelled ECL £m | Individually assessed £m | Judgemental adjustments £m | Total £m | Modelled ECL £m | Individually assessed £m | Judgemental adjustments £m | Total £m | ||||||||
UK mortgages | |||||||||||||||
Credit cards | ( | ||||||||||||||
Other Retail | |||||||||||||||
Commercial Banking | ( | ( | |||||||||||||
Other | |||||||||||||||
Total | ( | ||||||||||||||
At 31 December 2025 | 2025 % | 2026 % | 2027 % | 2028 % | 2029 % | 2025 to 2029 average % | Start to peak % | Start to trough % |
Upside | ||||||||
Gross domestic product growth | ||||||||
Unemployment rate | ||||||||
House price growth | ( | |||||||
Commercial real estate price growth | ||||||||
UK Bank Rate | ||||||||
CPI inflation | ||||||||
Base case | ||||||||
Gross domestic product growth | ||||||||
Unemployment rate | ||||||||
House price growth | ( | |||||||
Commercial real estate price growth | ||||||||
UK Bank Rate | ||||||||
CPI inflation | ||||||||
Downside | ||||||||
Gross domestic product growth | ( | ( | ||||||
Unemployment rate | ||||||||
House price growth | ( | ( | ( | ( | ( | ( | ||
Commercial real estate price growth | ( | ( | ( | ( | ( | ( | ||
UK Bank Rate | ||||||||
CPI inflation | ||||||||
Severe downside | ||||||||
Gross domestic product growth | ( | ( | ( | |||||
Unemployment rate | ||||||||
House price growth | ( | ( | ( | ( | ( | ( | ||
Commercial real estate price growth | ( | ( | ( | ( | ( | ( | ||
UK Bank Rate | ||||||||
CPI inflation | ( | ( | ||||||
Probability-weighted | ||||||||
Gross domestic product growth | ||||||||
Unemployment rate | ||||||||
House price growth | ( | ( | ||||||
Commercial real estate price growth | ( | ( | ( | ( | ( | ( | ||
UK Bank Rate | ||||||||
CPI inflation |
Base case scenario by quarter1 At 31 December 2025 | First quarter 2025 % | Second quarter 2025 % | Third quarter 2025 % | Fourth quarter 2025 % | First quarter 2026 % | Second quarter 2026 % | Third quarter 2026 % | Fourth quarter 2026 % |
Gross domestic product growth | ||||||||
Unemployment rate | ||||||||
House price growth | ||||||||
Commercial real estate price growth | ||||||||
UK Bank Rate | ||||||||
CPI inflation |
At 31 December 2024 | 2024 % | 2025 % | 2026 % | 2027 % | 2028 % | 2024 to 2028 average % | Start to peak % | Start to trough % |
Upside | ||||||||
Gross domestic product growth | ||||||||
Unemployment rate | ||||||||
House price growth | ||||||||
Commercial real estate price growth | ( | |||||||
UK Bank Rate | ||||||||
CPI inflation | ||||||||
Base case | ||||||||
Gross domestic product growth | ||||||||
Unemployment rate | ||||||||
House price growth | ||||||||
Commercial real estate price growth | ( | |||||||
UK Bank Rate | ||||||||
CPI inflation | ||||||||
Downside | ||||||||
Gross domestic product growth | ( | ( | ||||||
Unemployment rate | ||||||||
House price growth | ( | ( | ( | ( | ( | |||
Commercial real estate price growth | ( | ( | ( | ( | ( | ( | ||
UK Bank Rate | ||||||||
CPI inflation | ||||||||
Severe downside | ||||||||
Gross domestic product growth | ( | ( | ( | ( | ||||
Unemployment rate | ||||||||
House price growth | ( | ( | ( | ( | ( | ( | ||
Commercial real estate price growth | ( | ( | ( | ( | ( | ( | ||
UK Bank Rate – modelled | ||||||||
UK Bank Rate – adjusted1 | ||||||||
CPI inflation – modelled | ( | |||||||
CPI inflation – adjusted1 | ||||||||
Probability-weighted | ||||||||
Gross domestic product growth | ||||||||
Unemployment rate | ||||||||
House price growth | ( | ( | ||||||
Commercial real estate price growth | ( | ( | ( | ( | ||||
UK Bank Rate – modelled | ||||||||
UK Bank Rate – adjusted1 | ||||||||
CPI inflation – modelled | ||||||||
CPI inflation – adjusted1 |
Base case scenario by quarter1 At 31 December 2024 | First quarter 2024 % | Second quarter 2024 % | Third quarter 2024 % | Fourth quarter 2024 % | First quarter 2025 % | Second quarter 2025 % | Third quarter 2025 % | Fourth quarter 2025 % |
Gross domestic product growth | ||||||||
Unemployment rate | ||||||||
House price growth | ||||||||
Commercial real estate price growth | ( | ( | ( | |||||
UK Bank Rate | ||||||||
CPI inflation |
At 31 December 2025 | At 31 December 2024 | ||||||||||
Probability- weighted £m | Upside £m | Base case £m | Downside £m | Severe downside £m | Probability- weighted £m | Upside £m | Base case £m | Downside £m | Severe downside £m | ||
UK mortgages | |||||||||||
Credit cards | |||||||||||
Other Retail | |||||||||||
Commercial Banking | |||||||||||
Other | |||||||||||
ECL allowance | |||||||||||
At 31 December 2025 | At 31 December 20241 | ||||
1pp increase in unemployment £m | 1pp decrease in unemployment £m | 1pp increase in unemployment £m | 1pp decrease in unemployment £m | ||
UK mortgages | ( | ( | |||
Credit cards | ( | ( | |||
Other Retail | ( | ( | |||
Commercial Banking | ( | ( | |||
ECL impact | ( | ( | |||
At 31 December 2025 | At 31 December 20241 | ||||
10pp increase in HPI £m | 10pp decrease in HPI £m | 10pp increase in HPI £m | 10pp decrease in HPI £m | ||
ECL impact | ( | ( | |||
Assessment | Nature of risk assessed | Portfolios assessed | ECL impact At 31 December 2025 | ECL impact At 31 December 2024 |
Macroeconomic impact from climate scenario | Scenario risk – macro level | Retail | < £ | < £ |
Sector level impacts from climate scenario | Scenario risk – sector level | Commercial Banking (excluding Business Banking) | < £ | < £ |
Retrofitting cost to meet EPC regulation | Transition risk | UK mortgages | < £ | < £ |
Flood risk | Physical risk | UK mortgages | < £ | < £ |
2025 £m | 2024 £m | |
Not later than 1 year | ||
Later than 1 year and not later than 2 years | ||
Later than 2 years and not later than 3 years | ||
Later than 3 years and not later than 4 years | ||
Later than 4 years and not later than 5 years | ||
Later than 5 years | ||
Gross investment | ||
Unearned future finance income | ( | ( |
Rentals received in advance | ( | ( |
Net investment |
2025 £m | 2024 £m | |
Electric vehicles | ||
Internal combustion engine vehicles | ||
Self-charging hybrid vehicles | ||
Plug-in hybrid vehicles | ||
Other | ||
Net investment |
Goodwill £m | Brands £m | Purchased credit card relationships £m | Customer- related intangibles £m | Acquired value of in-force business £m | Capitalised software enhancements £m | Total £m | |
Cost1: | |||||||
At 1 January 2024 | |||||||
Exchange and other adjustments | ( | ( | |||||
Additions and acquisitions | |||||||
Disposals and write-offs2 | ( | ( | ( | ( | |||
At 31 December 2024 | |||||||
Exchange and other adjustments | ( | ( | |||||
Additions and acquisitions | |||||||
Disposals and write-offs | ( | ( | |||||
At 31 December 2025 | |||||||
Accumulated amortisation: | |||||||
At 1 January 2024 | |||||||
Exchange and other adjustments | ( | ( | |||||
Charge for the year3 | |||||||
Disposals and write-offs | ( | ( | ( | ||||
At 31 December 2024 | |||||||
Exchange and other adjustments | ( | ( | |||||
Charge for the year3 | |||||||
Disposals and write-offs | ( | ( | |||||
At 31 December 2025 | |||||||
Balance sheet amount at 31 December 2025 | |||||||
Balance sheet amount at 31 December 2024 |
2025 £m | 2024 £m | ||
Insurance contract assets | |||
Reinsurance contract assets2 | |||
Investment in joint ventures and associates | |||
Property, plant and equipment: | |||
Investment properties (see below) | |||
Premises | |||
Equipment | |||
Operating lease assets (see below) | |||
Right-of-use assets (note 25) | |||
Prepayments | |||
Disposal group assets1: | |||
Deferred tax assets | |||
Goodwill | |||
Reinsurance contract assets2 | |||
Other assets | |||
Total other assets |
2025 £m | 2024 £m | |
At 1 January | ||
Acquisition of new properties | ||
Additional expenditure on existing properties | ||
Change in fair value | ||
Disposals and other movements | (79) | ( |
At 31 December |
Within 1 year £m | 1 to 2 years £m | 2 to 3 years £m | 3 to 4 years £m | 4 to 5 years £m | Over 5 years £m | Total £m | |
At 31 December 2025 | |||||||
At 31 December 2024 |
2025 £m | 2024 £m | |
Electric vehicles | ||
Internal combustion engine vehicles | ||
Self-charging hybrid vehicles | ||
Plug-in hybrid vehicles | ||
Other | ||
Total operating lease assets |
2025 £m | 2024 £m | |
At 1 January | ||
Exchange and other adjustments | ( | |
Additions | ||
Disposals | ( | ( |
Depreciation charge for the year | ( | ( |
At 31 December |
2025 | 2024 | ||||||
At fair value through profit or loss £m | At amortised cost £m | Total £m | At fair value through profit or loss £m | At amortised cost £m | Total £m | ||
Senior unsecured notes issued | |||||||
Covered bonds | |||||||
Certificates of deposit issued | |||||||
Securitisation notes | |||||||
Commercial paper | |||||||
Total debt securities in issue | |||||||
2025 £m | 2024 £m | |
Third party interests in consolidated funds1 | ||
Lease liabilities | ||
Disposal group liabilities: | ||
Liabilities arising from insurance contracts | ||
Other creditors and accruals2 | ||
Total other liabilities |
Critical judgement: | Determining whether a present obligation exists and whether it is more likely than not that an outflow of resources will be required to settle that obligation |
Key sources of estimation uncertainty: | Populations impacted, level of remediation and response rates |
Provisions for financial commitments and guarantees £m | Regulatory and legal provisions £m | Other £m | Total £m | |
At 1 January 2025 | ||||
Exchange and other adjustments | ( | |||
Provisions applied | ( | ( | ( | |
(Release) charge for the year | ( | |||
At 31 December 2025 | ||||
Preference shares £m | Undated £m | Dated £m | Total £m | ||||
At 1 January 2024 | |||||||
Issued during the year1: | |||||||
Floating Rate Dated Subordinated Notes 2034 (A$ | |||||||
Repurchases and redemptions during the year1: | |||||||
( | ( | ||||||
( | ( | ||||||
( | ( | ( | |||||
Foreign exchange movements | ( | ( | ( | ||||
Other movements (cash and non-cash)2 | ( | ( | ( | ||||
At 31 December 2024 | |||||||
Issued during the year1: | |||||||
Repurchases and redemptions during the year1: | |||||||
( | ( | ||||||
( | ( | ||||||
( | ( | ||||||
( | ( | ||||||
( | ( | ||||||
( | ( | ||||||
( | ( | ( | |||||
Foreign exchange movements | ( | ( | ( | ||||
Other movements (cash and non-cash)2 | ( | ||||||
At 31 December 2025 |
Number of shares | |||
2025 | 2024 | 2023 | |
Total | |||
2025 | 2024 | 2023 | |||||||||
£m | % of share capital | £m | % of share capital | £m | % of share capital | ||||||
GBP | |||||||||||
GBP | |||||||||||
shares of USD | |||||||||||
shares of USD | |||||||||||
Total | |||||||||||
Number of shares | |||
Ordinary shares of 10p (formerly 25p) each | 2025 | 2024 | 2023 |
At 1 January | |||
Issued under employee share schemes | |||
Share buyback programme (note 32) | ( | ( | ( |
At 31 December | |||
2025 | 2024 | 2023 | |||||||||
Ordinary shares of 10p (formerly 25p) each | £m | % of share capital | £m | % of share capital | £m | % of share capital | |||||
At 31 December | |||||||||||
2025 £m | 2024 £m | 2023 £m | |
Profit attributable to ordinary shareholders – basic and diluted |
2025 million | 2024 million | 2023 million | |
Weighted average number of ordinary shares in issue – basic | |||
Adjustment for share options and awards | |||
Weighted average number of ordinary shares in issue – diluted | |||
Basic earnings per share | |||
Diluted earnings per share |
2025 £m | 2024 £m | 2023 £m | |
Merger reserve | |||
At 1 January | |||
Redemption of preference shares (note 29)1 | ( | ||
At 31 December | |||
Capital redemption reserve | |||
At 1 January | |||
Redemption of preference shares (note 29)1 | |||
Shares cancelled under share buyback programme (see below) | |||
At 31 December | |||
Revaluation reserve in respect of debt securities held at fair value through other comprehensive income | |||
At 1 January | ( | ( | |
Movements recognised in other comprehensive income | ( | ( | |
At 31 December | ( | ( | ( |
Revaluation reserve in respect of equity shares held at fair value through other comprehensive income | |||
At 1 January | |||
Movements recognised in other comprehensive income | ( | ||
Realised gains and losses transferred to retained profits | ( | ||
At 31 December | |||
Cash flow hedge reserve | |||
At 1 January | ( | ( | ( |
Movements recognised in other comprehensive income | |||
At 31 December | ( | ( | ( |
Foreign currency translation reserve | |||
At 1 January | ( | ( | ( |
Movements recognised in other comprehensive income | ( | ( | |
At 31 December | ( | ( | ( |
Total other reserves at 31 December |
2025 £m | 2024 £m | 2023 £m | |||
At 1 January | |||||
Issued during the year: | |||||
£ Securities callable 2030 | |||||
$ Securities callable 2035 | |||||
$ Securities Callable 2031 | |||||
$ Securities Callable 2029 | |||||
£ Securities Callable 2028 | |||||
Repurchases and redemptions during the year: | |||||
€ Securities Callable 2020 | ( | ||||
$ Securities Callable 2025 | ( | ||||
$ Securities | ( | ||||
£ Securities Callable 2024 | ( | ||||
£ Securities Callable 2023 | ( | ||||
( | ( | ( | |||
Profit for the year attributable to other equity holders | |||||
Distributions on other equity instruments | ( | ( | ( | ||
At 31 December |
2025 pence per share | 2024 pence per share | 2023 pence per share | 2025 £m | 2024 £m | 2023 £m | |
Final dividend recommended by directors at previous year end | ||||||
Interim dividend paid in the year | ||||||
Compensation | 2025 £m | 2024 £m | 2023 £m |
Salaries and other short-term benefits | |||
Share-based payments | |||
Total compensation |
Share plans | ||||
2025 million | 2024 million | 2023 million | ||
At 1 January | ||||
Granted, including certain adjustments (includes entitlements of appointed key management personnel) | ||||
Exercised/lapsed (includes entitlements of former key management personnel) | ( | ( | ( | |
At 31 December | ||||
Loans | 2025 £m | 2024 £m | 2023 £m |
At 1 January | |||
Advanced (includes loans to appointed key management personnel) | |||
Repayments (includes loans to former key management personnel) | ( | ( | ( |
At 31 December |
Deposits | 2025 £m | 2024 £m | 2023 £m |
At 1 January | |||
Placed (includes deposits of appointed key management personnel) | |||
Withdrawn (includes deposits of former key management personnel) | ( | ( | ( |
At 31 December |
Total assets of structured entities | ||||
Type of entity | Nature and purpose of structured entities | Interest held by the Group | 2025 £bn | 2024 £bn |
Collective investment vehicles and limited partnerships | These vehicles are primarily financed by investments from investors in the vehicles and are matched by policyholder liabilities in the Insurance division. | •Interests in units issued by the vehicles •Fees from management of vehicles | ||
Securitisation vehicles | These vehicles issue asset-backed notes to investors and facilitate the management of the Group’s balance sheet. | •Interest in notes issued by the vehicles •Fees for loan servicing | ||
Carrying amount | Recognised within; | 2025 £m | 2024 £m |
Collective investment vehicles and limited partnerships | Financial assets at fair value through profit or loss | ||
Notes held in securitisation vehicles | Financial assets at fair value through profit or loss; and Financial assets at amortised cost | ||
Interest rate derivatives provided to securitisation vehicles | Derivative financial instruments assets; and Derivative financial instruments (liabilities) |
2025 | 2024 | ||||
Assets £m | Liabilities £m | Assets £m | Liabilities £m | ||
Repurchase and securities lending transactions | |||||
Financial assets at fair value through profit or loss | |||||
Debt securities held at amortised cost | |||||
Financial assets at fair value through other comprehensive income | |||||
Securitisation programmes | |||||
Financial assets at amortised cost: | |||||
Loans and advances to customers1 | |||||
2025 £m | 2024 £m | 2023 £m | |
Change in financial assets held at amortised cost | ( | ( | |
Change in financial assets at fair value through profit or loss | ( | ( | ( |
Change in derivative financial instruments | ( | ||
Change in other operating assets | ( | ( | |
Change in operating assets | ( | ( | ( |
2025 £m | 2024 £m | 2023 £m | |
Change in deposits from banks | ( | ( | |
Change in customer deposits | ( | ||
Change in repurchase agreements | ( | ||
Change in financial liabilities at fair value through profit or loss | |||
Change in derivative financial instruments | ( | ( | |
Change in debt securities in issue at amortised cost | ( | ||
Change in insurance contracts1 | |||
Change in investment contract liabilities | |||
Change in other operating liabilities2 | ( | ( | |
Change in operating liabilities |
2025 £m | 2024 £m | 2023 £m | |
Interest expense and hedging valuation adjustments on subordinated liabilities1 | |||
Accretion of discounts and amortisation of premiums and issue costs | ( | ||
Revaluation of investment properties | ( | ( | |
Net gain on sale of financial assets at fair value through other comprehensive income | ( | ( | ( |
Share of post-tax results of associates and joint ventures | ( | ||
Profit on derecognition of joint ventures and associates | ( | ||
Loss/(profit) on disposal of tangible fixed assets | ( | ( | |
Net credit in respect of defined benefit schemes | ( | ( | ( |
Depreciation and amortisation | |||
Regulatory and legal provisions | |||
Other provision movements | ( | ( | ( |
Allowance for loan losses | |||
Write-off of allowance for loan losses, net of recoveries | ( | ( | ( |
Impairment credit on undrawn balances | ( | ( | |
Impairment credit on financial assets at fair value through other comprehensive income | ( | ( | ( |
Transactions in own shares | ( | ||
Transfers to income statement from reserves | |||
Foreign exchange impact on balance sheet2 | |||
Other non-cash items | |||
Total non-cash items | |||
Contributions to defined benefit schemes | ( | ( | ( |
Payments in respect of regulatory and legal provisions | ( | ( | ( |
Other | |||
Total other items | ( | ( | ( |
Non-cash and other items |
2025 £m | 2024 £m | 2023 £m | |||
Net assets acquired: | |||||
Cash and cash equivalents | |||||
Tangible fixed assets | |||||
Intangible assets (excluding goodwill) | |||||
Other assets | |||||
Deferred tax | ( | ( | |||
Other liabilities | ( | ( | |||
Goodwill arising on acquisition | |||||
Non cash consideration | ( | ||||
Cash consideration | |||||
Less cash and cash equivalents acquired | ( | ( | |||
Net cash (inflow)/outflow arising from acquisition of subsidiaries and businesses | ( | ||||
Acquisition of and additional investment in joint ventures | |||||
Net cash (inflow)/outflow from acquisitions in the year | ( |
2025 £m | 2024 £m | 2023 £m | |||
Cash and balances at central banks | |||||
Less mandatory reserve deposits1 | ( | ( | ( | ||
Loans and advances to banks and reverse repurchase agreements with banks | |||||
Less amounts with a maturity of three months or more | ( | ( | ( | ||
Total cash and cash equivalents2 |
2025 £m | 2024 £m | 2023 £m | ||||
Interest income | 804 | 800 | 632 | |||
Interest expense | (1,031) | (1,096) | (1,129) | |||
Net interest expense | (227) | (296) | (497) | |||
Net trading (losses) income | (129) | 61 | 71 | |||
Dividends from subsidiaries | 2,990 | 5,187 | 5,024 | |||
Other operating income | 893 | 701 | 672 | |||
Other income | 3,754 | 5,949 | 5,767 | |||
Total income | 3,527 | 5,653 | 5,270 | |||
Operating expenses | (164) | (216) | (225) | |||
Impairment credit | 3 | 3 | 10 | |||
Profit before tax | 3,366 | 5,440 | 5,055 | |||
Tax credit | 23 | 48 | 84 | |||
Profit for the year | 3,389 | 5,488 | 5,139 | |||
Profit attributable to ordinary shareholders | 2,926 | 4,990 | 4,612 | |||
Profit attributable to other equity holders | 463 | 498 | 527 | |||
Profit for the year | 3,389 | 5,488 | 5,139 |
Note | 2025 £m | 2024 £m | |||
Assets | |||||
Cash and cash equivalents | 8 | 22 | |||
Financial assets at fair value through profit or loss | 3 | 19,703 | 23,370 | ||
Derivative financial instruments | 3 | 298 | 519 | ||
Debt securities | 1,623 | 2,354 | |||
Loans to subsidiaries | 9 | 16,949 | 17,068 | ||
Investment in subsidiaries | 9 | 54,567 | 51,334 | ||
Current tax recoverable | 6 | 75 | |||
Deferred tax assets | 5 | 85 | 23 | ||
Other assets | 7 | 14 | |||
Total assets | 93,246 | 94,779 | |||
Liabilities | |||||
Due to subsidiaries | 150 | 3 | |||
Financial liabilities at fair value through profit or loss | 3 | 22,433 | 24,896 | ||
Derivative financial instruments | 3 | 579 | 939 | ||
Debt securities in issue at amortised cost | 6 | 9,941 | 8,310 | ||
Other liabilities | 80 | 142 | |||
Subordinated liabilities | 7 | 9,970 | 9,720 | ||
Total liabilities | 43,153 | 44,010 | |||
Equity | |||||
Share capital | 8 | 5,889 | 6,062 | ||
Share premium account | 18,797 | 18,720 | |||
Merger reserve | 6,759 | 6,759 | |||
Capital redemption reserve | 5,971 | 5,751 | |||
Retained profits | 6,730 | 7,282 | |||
Shareholders’ equity | 44,146 | 44,574 | |||
Other equity instruments | 8 | 5,947 | 6,195 | ||
Total equity | 50,093 | 50,769 | |||
Total equity and liabilities | 93,246 | 94,779 |
| | |
Sir Robin Budenberg Chair | Charlie Nunn Group Chief Executive | William Chalmers Chief Financial Officer |
Attributable to ordinary shareholders | ||||||||||||||||
Share capital1 £m | Share premium1 £m | Merger reserve2 £m | redemption reserve3 £m | Retained profits £m | Total £m | Other equity instruments £m | Total £m | |||||||||
At 1 January 2023 | 6,729 | 18,504 | 6,806 | 4,932 | 5,222 | 42,193 | 5,297 | 47,490 | ||||||||
Total comprehensive income | – | – | – | – | 4,612 | 4,612 | 527 | 5,139 | ||||||||
Transactions with owners | ||||||||||||||||
Dividends4 | – | – | – | – | (1,651) | (1,651) | – | (1,651) | ||||||||
Distributions on other equity instruments | – | – | – | – | – | – | (527) | (527) | ||||||||
Issue of ordinary shares | 67 | 64 | – | – | – | 131 | – | 131 | ||||||||
Share buyback | (438) | – | – | 438 | (1,993) | (1,993) | – | (1,993) | ||||||||
Issue of other equity instruments | – | – | – | – | (13) | (13) | 1,778 | 1,765 | ||||||||
Repurchase and redemptions of other equity instruments | – | – | – | – | – | – | (135) | (135) | ||||||||
Movement in treasury shares | – | – | – | – | 103 | 103 | – | 103 | ||||||||
Value of employee services | – | – | – | – | 227 | 227 | – | 227 | ||||||||
Total transactions with owners | (371) | 64 | – | 438 | (3,327) | (3,196) | 1,116 | (2,080) | ||||||||
At 31 December 2023 | 6,358 | 18,568 | 6,806 | 5,370 | 6,507 | 43,609 | 6,940 | 50,549 | ||||||||
Total comprehensive income | – | – | – | – | 4,990 | 4,990 | 498 | 5,488 | ||||||||
Transactions with owners | ||||||||||||||||
Dividends4 | – | – | – | – | (1,828) | (1,828) | – | (1,828) | ||||||||
Distributions on other equity instruments | – | – | – | – | – | – | (498) | (498) | ||||||||
Issue of ordinary shares | 73 | 117 | – | – | – | 190 | – | 190 | ||||||||
Share buyback | (369) | – | – | 369 | (2,011) | (2,011) | – | (2,011) | ||||||||
Redemption of preference shares | – | 35 | (47) | 12 | – | – | – | – | ||||||||
Issue of other equity instruments | – | – | – | – | (6) | (6) | 763 | 757 | ||||||||
Repurchase and redemptions of other equity instruments | – | – | – | – | (316) | (316) | (1,508) | (1,824) | ||||||||
Movement in treasury shares | – | – | – | – | (173) | (173) | – | (173) | ||||||||
Value of employee services | – | – | – | – | 119 | 119 | – | 119 | ||||||||
Total transactions with owners | (296) | 152 | (47) | 381 | (4,215) | (4,025) | (1,243) | (5,268) | ||||||||
At 31 December 2024 | 6,062 | 18,720 | 6,759 | 5,751 | 7,282 | 44,574 | 6,195 | 50,769 | ||||||||
Total comprehensive income | – | – | – | – | 2,926 | 2,926 | 463 | 3,389 | ||||||||
Transactions with owners | ||||||||||||||||
Dividends4 | – | – | – | – | (2,000) | (2,000) | – | (2,000) | ||||||||
Distributions on other equity instruments | – | – | – | – | – | – | (463) | (463) | ||||||||
Issue of ordinary shares | 47 | 77 | – | – | – | 124 | – | 124 | ||||||||
Share buyback | (220) | – | – | 220 | (1,710) | (1,710) | – | (1,710) | ||||||||
Issue of other equity instruments | – | – | – | – | (10) | (10) | 1,511 | 1,501 | ||||||||
Repurchase and redemptions of other equity instruments | – | – | – | – | – | – | (1,759) | (1,759) | ||||||||
Movement in treasury shares | – | – | – | – | 38 | 38 | – | 38 | ||||||||
Value of employee services | – | – | – | – | 204 | 204 | – | 204 | ||||||||
Total transactions with owners | (173) | 77 | – | 220 | (3,478) | (3,354) | (711) | (4,065) | ||||||||
At 31 December 2025 | 5,889 | 18,797 | 6,759 | 5,971 | 6,730 | 44,146 | 5,947 | 50,093 | ||||||||
2025 £m | 2024 £m | 2023 £m | |
Cash flows from operating activities | |||
Profit before tax | 3,366 | 5,440 | 5,055 |
Adjustments for: | |||
Fair value and exchange adjustments and other non-cash items | 311 | (83) | 744 |
Change in other assets | 4,405 | (1,850) | (1,317) |
Change in other liabilities and other items | (747) | 4,523 | (555) |
Dividends received | (2,990) | (5,187) | (5,024) |
Distributions on other equity instruments received | (680) | (541) | (505) |
Tax refunded | 84 | 115 | 4 |
Net cash provided by (used in) operating activities | 3,749 | 2,417 | (1,598) |
Cash flows from investing activities | |||
Return of capital contribution | 1 | 1 | 1 |
Dividends received | 2,990 | 5,187 | 5,024 |
Distributions on other equity instruments received | 680 | 541 | 505 |
Acquisitions of and capital injections to subsidiaries | (5,288) | (1,309) | (1,496) |
Return of capital by subsidiaries | 2,054 | 800 | 278 |
Amounts advanced to subsidiaries | (6,118) | (4,340) | (4,563) |
Repayment of loans to subsidiaries | 5,796 | 2,055 | 3,556 |
Interest received on loans to subsidiaries | 610 | 386 | 410 |
Net cash provided by investing activities | 725 | 3,321 | 3,715 |
Cash flows from financing activities | |||
Dividends paid to ordinary shareholders | (2,000) | (1,828) | (1,651) |
Distributions on other equity instruments | (463) | (498) | (527) |
Interest paid on subordinated liabilities | (638) | (509) | (466) |
Proceeds from issue of subordinated liabilities | 1,757 | 812 | 1,416 |
Proceeds from issue of other equity instruments | 1,501 | 757 | 1,765 |
Proceeds from issue of ordinary shares | 99 | 187 | 86 |
Share buyback | (1,710) | (2,011) | (1,993) |
Repayment of subordinated liabilities | (1,275) | (819) | (643) |
Repurchase and redemptions of other equity instruments | (1,759) | (1,824) | (135) |
Net cash used in financing activities | (4,488) | (5,733) | (2,148) |
Change in cash and cash equivalents | (14) | 5 | (31) |
Cash and cash equivalents at beginning of year | 22 | 17 | 48 |
Cash and cash equivalents at end of year | 8 | 22 | 17 |
Derivatives designated as hedging instruments £m | Mandatorily held at fair value through profit or loss | Designated at fair value through profit or loss £m | Held at amortised cost £m | ||||||||
Held for trading £m | Other £m | Total £m | |||||||||
At 31 December 2025 | |||||||||||
Financial assets | |||||||||||
Cash and cash equivalents | – | – | – | – | 8 | 8 | |||||
Financial assets at fair value through profit or loss | – | – | 19,703 | – | – | 19,703 | |||||
Derivative financial instruments | 29 | 269 | – | – | – | 298 | |||||
Debt securities | – | – | – | – | 1,623 | 1,623 | |||||
Loans to subsidiaries | – | – | – | – | 16,949 | 16,949 | |||||
Total financial assets | 29 | 269 | 19,703 | – | 18,580 | 38,581 | |||||
Financial liabilities | |||||||||||
Due to subsidiaries | – | – | – | – | 150 | 150 | |||||
Financial liabilities at fair value through profit or loss | – | – | – | 22,433 | – | 22,433 | |||||
Derivative financial instruments | 322 | 257 | – | – | – | 579 | |||||
Debt securities in issue at amortised cost | – | – | – | – | 9,941 | 9,941 | |||||
Subordinated liabilities | – | – | – | – | 9,970 | 9,970 | |||||
Total financial liabilities | 322 | 257 | – | 22,433 | 20,061 | 43,073 | |||||
At 31 December 2024 | |||||||||||
Financial assets | |||||||||||
Cash and cash equivalents | – | – | – | – | 22 | 22 | |||||
Financial assets at fair value through profit or loss | – | – | 23,370 | – | – | 23,370 | |||||
Derivative financial instruments | 38 | 481 | – | – | – | 519 | |||||
Debt securities | – | – | – | – | 2,354 | 2,354 | |||||
Loans to subsidiaries | – | – | – | – | 17,068 | 17,068 | |||||
Total financial assets | 38 | 481 | 23,370 | – | 19,444 | 43,333 | |||||
Financial liabilities | |||||||||||
Due to subsidiaries | – | – | – | – | 3 | 3 | |||||
Financial liabilities at fair value through profit or loss | – | – | – | 24,896 | – | 24,896 | |||||
Derivative financial instruments | 442 | 497 | – | – | – | 939 | |||||
Debt securities in issue at amortised cost | – | – | – | – | 8,310 | 8,310 | |||||
Subordinated liabilities | – | – | – | – | 9,720 | 9,720 | |||||
Total financial liabilities | 442 | 497 | – | 24,896 | 18,033 | 43,868 | |||||
2025 | 2024 | ||||||||||
Carrying value £m | Fair value £m | Valuation hierarchy | Carrying value £m | Fair value £m | Valuation hierarchy | ||||||
Level 2 £m | Level 3 £m | Level 2 £m | Level 3 £m | ||||||||
Financial assets at fair value through profit or loss | 19,703 | 19,703 | 19,703 | – | 23,370 | 23,370 | 23,370 | – | |||
Derivative financial instruments | 298 | 298 | 298 | – | 519 | 519 | 519 | – | |||
Debt securities | 1,623 | 1,593 | 1,593 | – | 2,354 | 2,240 | 2,240 | – | |||
Loans to subsidiaries | 16,949 | 16,949 | 16,949 | – | 17,068 | 17,068 | 17,068 | – | |||
Total financial assets | 38,573 | 38,543 | 38,543 | – | 43,311 | 43,197 | 43,197 | – | |||
Due to subsidiaries | 150 | 150 | 150 | – | 3 | 3 | 3 | – | |||
Financial liabilities at fair value through profit or loss | 22,433 | 22,433 | 22,433 | – | 24,896 | 24,896 | 24,896 | – | |||
Derivative financial instruments | 579 | 579 | 579 | – | 939 | 939 | 939 | – | |||
Debt securities in issue at amortised cost | 9,941 | 9,976 | 9,976 | – | 8,310 | 8,140 | 8,140 | – | |||
Subordinated liabilities | 9,970 | 10,505 | 10,505 | – | 9,720 | 10,038 | 10,038 | – | |||
Total financial liabilities | 43,073 | 43,643 | 43,643 | – | 43,868 | 44,016 | 44,016 | – | |||
Preference shares £m | Undated £m | Dated £m | Total £m | ||||
At 1 January 2024 | 329 | 10 | 9,368 | 9,707 | |||
Issued in the year1: | |||||||
4.375% Fixed Rate Reset Dated Subordinated Notes 2034 (€500 million) | – | – | 427 | 427 | |||
5.788% Fixed-to-Floating Rate Dated Subordinated Notes 2034 (A$250 million) | – | – | 128 | 128 | |||
Floating Rate Dated Subordinated Notes 2034 (A$500 million) | – | – | 257 | 257 | |||
– | – | 812 | 812 | ||||
Repurchases and redemptions during the year1: | |||||||
6.475% Non-cumulative Preference Shares callable 2024 (£186 million) | (47) | – | – | (47) | |||
4.5% Dated Subordinated Notes 2024 ($1,000 million) | – | – | (772) | (772) | |||
(47) | – | (772) | (819) | ||||
Foreign exchange and other movements (cash and non-cash) | 1 | – | 19 | 20 | |||
At 31 December 2024 | 283 | 10 | 9,427 | 9,720 | |||
Issued in the year1: | |||||||
4.00% Fixed Rate Reset Dated Subordinated Notes 2035 (€1,000 million) | – | – | 840 | 840 | |||
6.068% Fixed-to-Floating Rate Dated Subordinated Notes 2036 ($1,250 million) | – | – | 917 | 917 | |||
– | – | 1,757 | 1,757 | ||||
Repurchases and redemptions during the year1: | |||||||
4.50% Fixed Rate Step-up Subordinated Notes 2030 (€309 million) | – | – | (260) | (260) | |||
4.582% Fixed Rate Dated Subordinated Notes 2025 ($1,328 million) | – | – | (996) | (996) | |||
4.582% Fixed Rate Dated Subordinated Notes 2025 ($25.6 million) | (19) | (19) | |||||
– | – | (1,275) | (1,275) | ||||
Foreign exchange and other movements (cash and non-cash) | 3 | – | (235) | (232) | |||
At 31 December 2025 | 286 | 10 | 9,674 | 9,970 |
2025 £m | 2024 £m | ||
At 1 January | 51,334 | 50,826 | |
Additions and capital injections | 5,137 | 1,167 | |
Capital contributions | 151 | 142 | |
Return of capital contributions | (1) | (1) | |
Capital repayments and redemptions | (2,054) | (800) | |
At 31 December | 54,567 | 51,334 |
Up to 1 month £m | 1 to 3 months £m | 3 to 12 months £m | 1 to 5 years £m | Over 5 years £m | Total £m | ||||||
At 31 December 2025 | |||||||||||
Financial liabilities at fair value through profit or loss | 105 | 806 | 3,373 | 14,721 | 6,811 | 25,816 | |||||
Debt securities in issue at amortised cost | 20 | 57 | 396 | 10,498 | 80 | 11,051 | |||||
Subordinated liabilities | 24 | 1,169 | 919 | 5,991 | 6,698 | 14,801 | |||||
Total non-derivative financial liabilities | 149 | 2,032 | 4,688 | 31,210 | 13,589 | 51,668 | |||||
Derivative financial liabilities | |||||||||||
Gross settled derivatives – outflows | 2,091 | 2,475 | 4,260 | 3,587 | – | 12,413 | |||||
Gross settled derivatives – inflows | (2,073) | (2,462) | (4,219) | (3,586) | – | (12,340) | |||||
Gross settled derivatives – net flows | 18 | 13 | 41 | 1 | – | 73 | |||||
Net settled derivative liabilities | 381 | – | – | – | – | 381 | |||||
Total derivative financial liabilities | 399 | 13 | 41 | 1 | – | 454 |
Up to 1 month £m | 1 to 3 months £m | 3 to 12 months £m | 1 to 5 years £m | Over 5 years £m | Total £m | ||||||
At 31 December 2024 | |||||||||||
Financial liabilities at fair value through profit or loss | 874 | 1,786 | 2,958 | 17,090 | 6,149 | 28,857 | |||||
Debt securities in issue at amortised cost | 22 | 1,076 | 1,369 | 6,375 | 75 | 8,917 | |||||
Subordinated liabilities | 25 | 324 | 1,344 | 3,990 | 6,070 | 11,753 | |||||
Total non-derivative financial liabilities | 921 | 3,186 | 5,671 | 27,455 | 12,294 | 49,527 | |||||
Derivative financial liabilities | |||||||||||
Gross settled derivatives – outflows | 2,213 | 2,675 | 5,543 | 2,194 | 267 | 12,892 | |||||
Gross settled derivatives – inflows | (2,164) | (2,530) | (5,302) | (1,950) | – | (11,946) | |||||
Gross settled derivatives – net flows | 49 | 145 | 241 | 244 | 267 | 946 | |||||
Net settled derivative liabilities | 175 | – | – | – | – | 175 | |||||
Total derivative financial liabilities | 224 | 145 | 241 | 244 | 267 | 1,121 |


Available format | |||||
Report/Communication | Month | Online | Email | RNS | Paper |
Preliminary results | Jan | ü | ü | ü | |
Publication of annual report | Feb | ü | ü | ü | |
Pillar 3 report | Feb/Aug | ü | |||
Mailing of annual report and annual review | Mar | ü | ü | ü | |
Notice of AGM and voting materials | Mar | ü | ü | ü | |
Q1 interim management statement | Apr | ü | ü | ü | |
Country analysis1 | May | ü | |||
Half-year results | Jul | ü | ü | ü | |
Q3 interim management statement | Oct | ü | ü | ü | |
Service Provider | Telephone Dealing | Internet Dealing |
Bank of Scotland Share Dealing | 0345 606 1188 | https://www.bankofscotland.co.uk/investing.html |
Halifax Share Dealing | 0345 722 5525 | https://www.halifax.co.uk/investing.html |
Lloyds Bank Direct Investments | 0345 606 0560 | https://www.lloydsbank.com/investing.html |
Scottish Widows Share Dealing | 0345 070 7129 | https://www.scottishwidows.co.uk/investing.html |
9 April 2026 | Shares quoted ex-dividend |
10 April 2026 | Record date |
27 April 2026 | Final date for joining or leaving the dividend reinvestment plan |
29 April 2026 | Q1 interim management statement |
14 May 2026 | Annual general meeting |
19 May 2026 | Dividend paid |
30 July 2026 | Half-year results |
29 October 2026 | Q3 interim management statement |

Balance ranges | Total number of holdings | Percentage of holders | Total number of shares | Percentage issued capital |
1–999 | 1,679,803 | 81.9% | 487,563,992 | 0.8% |
1,000–9,999 | 318,898 | 15.6% | 846,637,657 | 1.4% |
10,000–99,999 | 48,824 | 2.4% | 1,250,595,306 | 2.1% |
100,000–999,999 | 2,228 | 0.1% | 519,003,450 | 0.9% |
1,000,000–4,999,999 | 473 | 0.0% | 1,170,340,552 | 2.0% |
5,000,000–9,999,999 | 146 | 0.0% | 1,044,624,243 | 1.8% |
10,000,000–49,999,999 | 234 | 0.0% | 5,609,956,584 | 9.5% |
50,000,000–99,999,999 | 80 | 0.0% | 5,744,461,475 | 9.8% |
100,000,000–499,999,999 | 68 | 0.0% | 14,903,704,082 | 25.3% |
500,000,000–999,999,999 | 14 | 0.0% | 9,774,960,052 | 16.6% |
1,000,000,000–99,999,999,999 | 7 | 0.0% | 17,533,896,209 | 29.8% |
Totals | 2,050,775 | 100.0% | 58,885,743,602 | 100.0% |
Important shareholder and registrar information |
Company website www.lloydsbankinggroup.com | |
Shareholder information help.shareview.co.uk (from here you will be able to email your query securely) | |
Registrar Equiniti Limited, Aspect House, Spencer Road, Lancing, West Sussex BN99 6DA | |
Shareholder helpline +44 (0) 371 384 2990* (please use the country code when contacting Equiniti Limited from outside the UK) *Lines are open 8:30am to 5:30pm (UK time), Monday to Friday (excluding public holidays in England and Wales). For deaf and speech impaired customers, we welcome calls via Relay UK. See www.relayuk.bt.com for more information. The company registrar is Equiniti Limited. They provide a shareholder service, including a telephone helpline and shareview, which is a free secure portfolio service. |
Your communications, your choice – go digital! •Receive company communications like this by email •Buy and sell shares •Manage your shareholding online | ||
Step 1 Register at www.shareview.co.uk/info/register or by scanning the QR code | ||
Step 2 Follow the on-screen instructions to complete your registration | ||
Step 3 Log on and update your communications choice | ||
Asset quality ratio | The underlying impairment charge or credit for the period in respect of loans and advances to customers, both drawn and undrawn, expressed as a percentage of average gross loans and advances to customers for the period. This measure is useful in assessing the credit quality of the loan book. |
Assets under administration (AuA) | AuA represents all assets managed or administered by or on behalf of the Group’s subsidiaries. It includes assets that are reported within the Group statutory balance sheet and those that are reported independently. It is a useful measure as it impacts potential earnings arising from Asset Management Charges and the relative size of the business. |
Assets under administration (net flows) | AuA (net flows) measures the net position of inflows and outflows to AuAs and is a useful measure of growth in AuA. Inflows include net premiums and deposits and other funds received from customers included in AuA. Outflows include net claims, redemptions and surrenders under other funds withdrawn by customers from AuA. Net flows exclude market movements. |
Banking net interest margin | Banking net interest income on customer and product balances in the banking businesses as a percentage of average gross interest-earning banking assets for the period. This measure is useful in assessing the banking profitability. |
Cost:income ratio | Total costs as a percentage of net income calculated on an underlying basis. This measure is useful in assessing the profitability of the Group’s operations before the effects of the underlying impairment credit or charge. |
General insurance combined ratio | General insurance combined ratio is a key metric used in the insurance industry to assess an insurer's profitability and operational efficiency, with a ratio below 100% indicating profitability. It is calculated as incurred claims, and earned commission or earned expenses, expressed as a percentage of net insurance revenue. |
Gross written premiums | Gross written premiums is a measure of the volume of General Insurance business written during the period. This measure is useful for assessing the growth of the General Insurance business. |
Life and pensions sales (present value of new business premiums) | Present value of regular premiums plus single premiums from new business written in the current period. This measure is useful for assessing sales in the Group’s life, pensions and investments insurance business. |
Loan to deposit ratio | Underlying loans and advances to customers divided by customer deposits. |
Operating costs | Operating expenses adjusted to remove the impact of operating lease depreciation, remediation, restructuring costs, the amortisation of purchased intangibles, the insurance gross up and other statutory items. |
New business value | This represents the value added to the contractual service margin and risk adjustment at the initial recognition of new contracts, net of acquisition expenses (derived from the statutory balance sheet movements) and any loss component on onerous contracts (which is recognised directly in the income statement) but does not include existing business increments. |
Pro forma CET1 ratio | CET1 ratio adjusted for the effect of the full impact of the announced ordinary share buyback programme. Where disclosed, the ratio is further adjusted for the effect of any dividend paid up by the Insurance business in the subsequent quarter prior to the publication of the financial results. |
Return on tangible equity | Profit attributable to ordinary shareholders, annualised and divided by average tangible net assets. This measure is useful in providing a consistent basis with which to measure the Group’s performance. |
Tangible net assets per share | Net assets excluding intangible assets such as goodwill and acquisition-related intangibles divided by the number of ordinary shares in issue. This measure is useful in assessing shareholder value. |
Underlying profit before impairment | Underlying profit adjusted to remove the underlying impairment credit or charge. This measure is useful in allowing for a comparable representation of the Group’s performance before the effects of the forward-looking underlying impairment credit or charge. |
Underlying profit | Statutory profit before tax adjusted for certain items as detailed above. This measure allows for a comparable representation of the Group’s performance by removing the impact of certain items including volatility caused by market movements outside the control of management. |
Statutory basis | Removal of: | Underlying basisA | |||||||
2025 | £m | Volatility and other items1,2 £m | Insurance gross up3 £m | £m | |||||
Net interest income | 13,230 | 403 | 2 | 13,635 | Underlying net interest income | ||||
Other income | 6,192 | (326) | 254 | 6,120 | Underlying other income | ||||
(1,454) | – | (1,454) | Operating lease depreciation4 | ||||||
Total income | 19,422 | (1,377) | 256 | 18,301 | Net income | ||||
Operating expenses4 | (11,966) | 1,493 | (256) | (10,729) | Total costs | ||||
Impairment charge | (795) | – | – | (795) | Underlying impairment charge | ||||
Profit before tax | 6,661 | 116 | – | 6,777 | Underlying profit | ||||
2024 | |||||||||
Net interest income | 12,277 | 578 | (10) | 12,845 | Underlying net interest income | ||||
Other income | 5,726 | (375) | 246 | 5,597 | Underlying other income | ||||
(1,325) | – | (1,325) | Operating lease depreciation4 | ||||||
Total income | 18,003 | (1,122) | 236 | 17,117 | Net income | ||||
Operating expenses4 | (11,601) | 1,496 | (236) | (10,341) | Total costs | ||||
Impairment charge | (431) | (2) | – | (433) | Underlying impairment charge | ||||
Profit before tax | 5,971 | 372 | – | 6,343 | Underlying profit | ||||
2025 | 2024 | |
Underlying impairment charge (£m) | (795) | (433) |
Remove non-customer underlying impairment charge (credit) (£m) | 1 | (23) |
Underlying customer related impairment charge (£m) (a) | (794) | (456) |
Loans and advances to customers (£bn) | 481.5 | 459.9 |
Remove finance lease gross-up1 (£bn) | (0.4) | (0.8) |
Underlying loans and advances to customersA (£bn) | 481.1 | 459.1 |
Expected credit loss allowance (drawn, statutory basis) (£bn) | 3.0 | 3.2 |
Acquisition related fair value adjustments (£bn) | 0.1 | 0.1 |
Underlying gross loans and advances to customers (£bn) | 484.2 | 462.4 |
Averaging (£bn) | (9.8) | (3.5) |
Average underlying gross loans and advances to customers (£bn) (b) | 474.4 | 458.9 |
Asset quality ratioA = (a) / (b) | 0.17% | 0.10% |
2025 £m | 2024 £m | |
Total Insurance assets (£m) | 217,155 | 197,135 |
Adjustment for: | ||
Assets not backing customer products within AuA | (5,483) | (10,423) |
Structured entities consolidated under IFRS 10 | (12,756) | (11,309) |
Assets backing Insurance and annuity products not considered AuA | (15,446) | (14,849) |
Investment products and share dealing business managed by Insurance, Pensions and Investments, but not on IFRS balance sheet | 99,087 | 89,858 |
Other | (2,934) | (3,281) |
Total customer assets under administrationA (£m) | 279,623 | 247,131 |
2025 | 2024 | |
Underlying net interest incomeA (£m) | 13,635 | 12,845 |
Remove non-banking underlying net interest expense (£m) | 515 | 469 |
Banking underlying net interest incomeA (£m) (a) | 14,150 | 13,314 |
Underlying gross loans and advances to customers (£bn) | 484.2 | 462.4 |
Adjustment for non-banking and other items: | ||
Fee-based loans and advances (£bn) | (11.3) | (10.0) |
Other (£bn) | (0.1) | 2.0 |
Interest-earning banking assets (£bn) | 472.8 | 454.4 |
Averaging (£bn) | (9.9) | (3.2) |
Average interest-earning banking assetsA (£bn) (b) | 462.9 | 451.2 |
Banking net interest marginA (%) = (a) / (b) | 3.06% | 2.95% |
2025 £m | 2024 £m | |
Operating costsA | 9,761 | 9,442 |
Remediation | 968 | 899 |
Total costs (a) | 10,729 | 10,341 |
Net income (b) | 18,301 | 17,117 |
Cost:income ratioA = (a) / (b) | 58.6% | 60.4% |
At 31 Dec 2025 | At 31 Dec 2024 | |
Underlying loans and advances to customersA (a) | 481.1 | 459.1 |
Customer deposits (b) | 496.5 | 482.7 |
Loan to deposit ratioA = (a) / (b) | 97% | 95% |
2025 £m | 2024 £m | |
Premiums received | 10,620 | 10,679 |
Investment sales | 13,715 | 10,986 |
Effect of capitalisation factor | 4,047 | 3,609 |
Effect of annualisation | 526 | 401 |
Gross premiums from existing long-term business | (7,861) | (7,426) |
Life and pensions sales (present value of new business premiums)A | 21,047 | 18,249 |
2025 £m | 2024 £m | |
Contractual service margin | 18 | 61 |
Risk adjustment for non-financial risk | 60 | 65 |
Losses recognised on initial recognition | (92) | (93) |
(14) | 33 | |
Impacts of reinsurance contracts recognised in the year | 46 | 39 |
Roll forward of new business to end of period including increments, single premiums and transfers, of contracts initially recognised in the year | 48 | 35 |
Amounts relating to contracts modified to add a drawdown feature and recognised as new contracts | – | 4 |
New business value of insurance and participating investment contracts recognised in the yearA | 80 | 111 |
2025 £m | 2024 £m | |
Insurance revenue | 752 | 655 |
Adjustment for: | ||
Allocation of reinsurance premiums | (49) | (47) |
Net insurance revenue (b) | 703 | 608 |
Total incurred claims | 376 | 344 |
Total expenses | 217 | 221 |
Insurance service expense | 593 | 565 |
Adjustment for: | ||
Amounts recoverable from reinsurers for incurred claims | (4) | (6) |
Other operating expenses | 38 | 33 |
Total commission and expenses (a) | 627 | 592 |
General insurance combined ratio (%)A – (a) / (b) | 89% | 97% |
2025 £m | 2024 £m | |
Operating expenses | 11,966 | 11,601 |
Adjustment for: | ||
Operating lease depreciation | (1,454) | (1,325) |
Remediation | (968) | (899) |
Restructuring | (46) | (40) |
Amortisation of purchased intangibles | (86) | (81) |
Insurance gross up | 256 | 236 |
Other | 93 | (50) |
Operating costsA | 9,761 | 9,442 |
At 31 Dec 2025 % | At 31 Dec 2024 % | |
CET1 ratio | 14.0% | 14.2% |
Insurance dividend and share buyback accrual1 | (0.8)% | (0.7)% |
Pro forma CET1 ratioA | 13.2% | 13.5% |
2025 | 2024 | |
Profit attributable to ordinary shareholders (£m) (a) | 4,196 | 3,923 |
Average shareholders’ equity (£bn) | 40.5 | 40.0 |
Average goodwill and other intangible assets (£bn) | (7.8) | (8.0) |
Average tangible equity (£bn) (b) | 32.7 | 32.0 |
Return on tangible equity (%)A = (a) / (b) | 12.9% | 12.3% |
At 31 Dec 2025 £m | At 31 Dec 2024 £m | |
Ordinary shareholders’ equity | 41,721 | 39,521 |
Remove goodwill and other intangible assets | (8,593) | (8,188) |
Deferred tax and other adjustments | 366 | 350 |
Tangible net assets (a) | 33,494 | 31,683 |
Ordinary shares in issue, excluding own shares (b) | 58,799m | 60,491m |
Tangible net assets per shareA = (a) / (b) | 57.0p | 52.4p |
2025 £m | 2024 £m | |
Statutory profit before tax | 6,661 | 5,971 |
Remove impairment charge | 795 | 431 |
Remove volatility and other items including restructuring | 116 | 374 |
Underlying profit before impairmentA | 7,572 | 6,776 |
Name of undertaking | Notes |
A G Finance Ltd | 20 ii iii |
A.C.L. Ltd | 1 i |
ACL Autolease Holdings Ltd | 1 i |
Alex Lawrie Factors Ltd | 9 i |
Alex. Lawrie Receivables Financing Ltd | 9 i |
Alpha Trustees Ltd | 20 i |
Amberdate Ltd | 1 i v |
Anglo Scottish Utilities Partnership 1 | + * |
Aquilus Ltd | 13 i ‡ |
Automobile Association Personal Finance Ltd | 4 i |
Avalon Investment Services (Nominees) Ltd | 20 i |
Avalon SIPP Trustees Ltd | 20 i |
Bank of Scotland (B G S) Nominees Ltd | 5 * |
Bank of Scotland Branch Nominees Ltd | 5 i |
Bank of Scotland Central Nominees Ltd | 5 * |
Bank of Scotland Edinburgh Nominees Ltd | 5 * |
Bank of Scotland Equipment Finance Ltd | 13 i ‡ |
Bank of Scotland plc | 5 i v |
Bank of Scotland Structured Asset Finance Ltd | 1 i |
Bank of Scotland Transport Finance 1 Ltd | 13 i ‡ |
Bank of Wales Ltd | 13 i ‡ |
Barents Leasing Ltd | 1 i |
Birchcrown Finance Ltd | 1 v xiii |
Black Horse (TRF) Ltd | 1 i |
Black Horse Finance Holdings Ltd | 1 ii iii |
Black Horse Group Ltd | 1 i v |
Black Horse Ltd | 1 i |
Black Horse Offshore Ltd | 7 i |
Boltro Nominees Ltd | 1 i |
BOS (Shared Appreciation Mortgages (Scotland)) Ltd | 4 i |
BOS (Shared Appreciation Mortgages (Scotland) No. 2) Ltd | 4 i |
BOS (Shared Appreciation Mortgages (Scotland) No. 3) Ltd | 4 i |
BOS (Shared Appreciation Mortgages) No. 1 plc | 4 # i |
BOS (Shared Appreciation Mortgages) No. 2 plc | 4 # i |
BOS (Shared Appreciation Mortgages) No. 3 plc | 4 # i |
BOS (Shared Appreciation Mortgages) No. 4 plc | 4 # i |
BOS (Shared Appreciation Mortgages) No. 5 plc | 4 i |
BOS (Shared Appreciation Mortgages) No. 6 plc | 4 i |
BOS (USA) Fund Investments Inc. | 11 xiv |
BOS (USA) Inc. | 11 i |
BOS Personal Lending Ltd | 4 ii iii |
Name of undertaking | Notes |
BOSSAF Rail Ltd | 1 i |
British Linen Leasing (London) Ltd | 5 i |
British Linen Leasing Ltd | 5 i |
British Linen Shipping Ltd | 5 i |
Capital Bank Leasing 12 Ltd | 5 i |
Capital Bank Leasing 3 Ltd | 13 i ‡ |
Capital Bank Leasing 5 Ltd | 47 i |
Capital Bank Property Investments (3) Ltd | 47 i ‡ |
Capital Personal Finance Ltd | 4 i |
Cardnet Merchant Services Ltd | 1 # ^ iii iv |
Cashfriday Ltd | 9 i |
Cavendish Online Ltd | 21 i |
Cawley (Chester) Ltd | 47 ii iii viii |
CF Asset Finance Ltd | 13 i ‡ |
Charterhall Nominees Ltd | 20 i |
Cheltenham & Gloucester plc | 12 i |
Citra Development Company (No. 1) Ltd | 1 i |
Citra Development Company (No. 2) Ltd | 1 i |
Citra Living British Waterways Ltd | 1 i |
Citra Living Broadside Limited | 30 i |
Citra Living Investments Ltd | 1 i |
Citra Living Lease Company (No. 1) Ltd | 1 i |
Citra Living Ltd | 1 i |
Citra Living Nexus Ltd | 1 i |
Citra Living Oldham Road Ltd | 30 i |
Citra Living Operating Company (No. 1) Ltd | 1 i |
Citra Living Properties (No. 1) Ltd | 1 i |
Citra Living Properties (No. 2) Ltd | 1 i |
Citra Living Properties (No. 3) Ltd | 1 i |
Citra Living Properties (No. 4) Ltd | 1 i |
Citra Living Properties (No. 5) Ltd | 1 i |
Citra Living The Rise Cardiff Ltd | 1 i |
Citra Living Unit Holder (No. 1) Ltd | 1 i |
Citra Living Unit Holder (No. 2) Ltd | 1 i |
Citra Living Wharf Street Ltd | 1 i |
Citra Pathways Ltd | 1 i |
Clerical Medical Finance Ltd | 20 i |
Clerical Medical Investment Fund Managers Ltd | 4 i |
Clerical Medical Non Sterling Property Company Sàrl | 22 i |
Cloak Lane Funding Sàrl | 23 i |
Cloak Lane Investments Sàrl | 23 i |
Conquest Securities Ltd | 1 v xiii |
Corbiere Asset Investments Ltd | 1 ii iii |
Dalkeith Corporation | 24 i ‡ |
Dunstan Investments (UK) Ltd | 1 i |
E.B.S. Pensioneer Trustees Ltd | 20 i |
EBS Pensions Ltd | 20 i |
EBS Self-Administered Personal Pension Plan Trustees Ltd | 20 i |
Embark Corporate Services Ltd | 20 ii |
Embark Group Ltd | 20 i |
Embark Investment Services Ltd | 20 i |
Embark Investment Services Nominees Ltd | 20 i |
Embark Investments Ltd | 20 i |
Embark Pensions Trustees Ltd | 20 i |
Embark Services Ltd | 20 i |
Embark Trustees Ltd | 20 i |
Eurolead Services Holdings Ltd | 9 i |
Name of undertaking | Notes |
First Retail Finance (Chester) Ltd | 4 i |
Forthright Finance Ltd | 47 i |
France Industrial Premises Holding Company | 28 i |
General Reversionary and Investment Company | 20 i # |
Gresham Nominee 1 Ltd | 1 i |
Gresham Nominee 2 Ltd | 1 i |
Halifax Financial Brokers Ltd | 4 i |
Halifax Financial Services (Holdings) Ltd | 4 i |
Halifax Financial Services Ltd | 4 i |
Halifax General Insurance Services Ltd | 4 i |
Halifax Leasing (March No.2) Ltd | 1 i |
Halifax Leasing (September) Ltd | 1 i |
Halifax Life Ltd | 4 i |
Halifax Loans Ltd | 4 i |
Halifax Pension Nominees Ltd | 1 i |
Halifax Share Dealing Ltd | 4 i |
Halifax Vehicle Leasing (1998) Ltd | 4 i |
Hamsard 3352 Ltd | 14 i |
Hamsard 3353 Ltd | 14 i |
HBOS Financial Services Ltd | 20 i |
HBOS Investment Fund Managers Ltd | 4 i |
HBOS plc | 5 i v vi |
HBOS Social Housing Covered Bonds LLP | 47 * |
HBOS UK Ltd | 5 i |
Heidi Finance Holdings (UK) Ltd | 1 i |
HGP III Ltd | 1 i |
Hill Samuel Finance Ltd | 1 v xix |
Hill Samuel Leasing Co. Ltd | 1 i |
Home Shopping Personal Finance Ltd | 4 i |
Horizon Capital 2000 Ltd | 5 i |
Hornbuckle Mitchell Trustees Ltd | 20 i |
Housing Growth Partnership GP LLP | 1 * |
Housing Growth Partnership II GP LLP | 1 * |
Housing Growth Partnership III GP LLP | 1 * |
Housing Growth Partnership III LP | 1 * |
Housing Growth Partnership Manager Ltd | 1 i |
HSDL Nominees Ltd | 4 i |
HVF Ltd | 1 i |
Hyundai Car Finance Ltd | 20 i |
International Motors Finance Ltd | 20 ii # |
Katrine Leasing Ltd | 39 i ‡ |
Landau Finance Ltd | 44 i |
LB Healthcare Trustee Ltd | 1 i |
LBCF Ltd | 9 i |
LBG Brasil Administração LTDA | 38 i |
LBG Equity Investments Ltd | 1 i ^ |
LBI Leasing Ltd | 1 i |
LDC (General Partner) Ltd | 40 i |
LDC (Managers) Ltd | 40 i |
LDC (Nominees) Ltd | 40 i |
LDC GP LLP | 41 * |
LDC I LP | 41 * |
LDC II LP | 41 * |
LDC IV LP | 41 * |
LDC V LP | 41 * |
LDC VI LP | 41 * |
LDC VII LP | 41 * |
LDC VIII LP | 40 * |
LDC IX LP | 40 * |
Name of undertaking | Notes |
LDC Parallel (Nominees) Ltd | 40 i |
LDC Parallel XV LP | 41 * |
LDC X LP | 40 * |
LDC XI LP | 40 * |
LDC XII LP | 40 * |
LDC XIII LP | 41 * |
LDC XIV LP | 41 * |
LDC XV LP | 41 * |
Legacy Renewal Company Ltd | 5 i |
LEIL Virgo Holdco Ltd | 1 i |
Lex Autolease (CH) Ltd | 1 i |
Lex Autolease (VC) Ltd | 1 i |
Lex Autolease Carselect Ltd | 1 i |
Lex Autolease Ltd | 1 i |
Lex Vehicle Leasing (Holdings) Ltd | 13 ii iii xi ‡ |
Lex Vehicle Leasing Ltd | 13 i ‡ |
Lime Street (Funding) Ltd | 13 i ‡ |
Lloyds (Gresham) Ltd | 13 i xi ‡ |
Lloyds (Nimrod) Specialist Finance Ltd | 1 i |
Lloyds America Securities Corporation | 11 xiv |
Lloyds Asset Leasing Ltd | 1 i |
Lloyds Bank (Colonial & Foreign) Nominees Ltd | 1 i |
Lloyds Bank (I.D.) Nominees Ltd | 1 i |
Lloyds Bank Asset Finance Ltd | 1 i |
Lloyds Bank Commercial Finance Ltd | 9 i |
Lloyds Bank Commercial Finance Scotland Ltd | 43 i |
Lloyds Bank Corporate Asset Finance (HP) Ltd | 1 i |
Lloyds Bank Corporate Asset Finance (No.1) Ltd | 1 i |
Lloyds Bank Corporate Asset Finance (No.2) Ltd | 1 i |
Lloyds Bank Corporate Asset Finance (No.3) Ltd | 1 i |
Lloyds Bank Corporate Asset Finance (No.4) Ltd | 1 i |
Lloyds Bank Corporate Markets plc | 1 i ^ |
Lloyds Bank Corporate Markets Wertpapierhandelsbank GmbH | 17 i |
Lloyds Bank Covered Bonds (LM) Ltd | 6 i |
Lloyds Bank Covered Bonds LLP | 6 * |
Lloyds Bank Equipment Leasing (No. 7) Ltd | 13 i ‡ |
Lloyds Bank Equipment Leasing (No. 9) Ltd | 1 i |
Lloyds Bank Financial Services (Holdings) Ltd | 1 i v |
Lloyds Bank General Insurance Holdings Ltd | 1 i |
Lloyds Bank General Insurance Ltd | 1 i |
Lloyds Bank General Leasing (No. 3) Ltd | 13 i ‡ |
Lloyds Bank General Leasing (No. 5) Ltd | 13 i ‡ |
Lloyds Bank GmbH | 29 i |
Lloyds Bank Insurance Services Ltd | 1 i |
Lloyds Bank Leasing (No. 6) Ltd | 1 i |
Lloyds Bank Leasing Ltd | 1 i |
Lloyds Bank Maritime Leasing (No. 10) Ltd | 1 i |
Lloyds Bank MTCH Ltd | 1 i |
Lloyds Bank Nominees Ltd | 1 i |
Lloyds Bank Offshore Pension Trust Ltd | 33 i |
Lloyds Bank Pension ABCS (No. 1) LLP | 1 * |
Lloyds Bank Pension ABCS (No. 2) LLP | 1 * |
Lloyds Bank Pensions Property (Guernsey) Ltd | 34 ii iii |
Lloyds Bank plc | 1 ^ i vii |
Lloyds Bank Property Company Ltd | 1 i |
Lloyds Bank S.F. Nominees Ltd | 1 i |
Lloyds Bank Subsidiaries Ltd | 1 i |
Name of undertaking | Notes |
Lloyds Bank Trustee Services Ltd | 1 i |
Lloyds Banking Group Pensions Trustees Ltd | 1 i |
Lloyds Development Capital (Holdings) Ltd | 40 i |
Lloyds Far East Sàrl | 23 i |
Lloyds General Leasing Ltd | 1 i |
Lloyds Hypotheken B.V. | 37 i |
Lloyds Industrial Leasing Ltd | 1 i |
Lloyds International Management Services (Jersey) Ltd | 7 i |
Lloyds International Pty Ltd | 8 i |
Lloyds Leasing (North Sea Transport) Ltd | 1 i |
Lloyds Leasing Developments Ltd | 13 i ‡ |
Lloyds Offshore Global Services Private Ltd | 48 i |
Lloyds Plant Leasing Ltd | 1 i |
Lloyds Portfolio Leasing Ltd | 1 i |
Lloyds Project Leasing Ltd | 1 i |
Lloyds Property Investment Company No. 4 Ltd | 13 i ‡ |
Lloyds Secretaries Ltd | 1 i |
Lloyds Securities Inc. | 11 xiv |
Lloyds TSB Pacific Ltd | 26 i |
Lloyds UDT Asset Rentals Ltd | 13 i ‡ |
Lloyds UDT Leasing Ltd | 1 i |
Lloyds UDT Ltd | 13 i ‡ |
Loans.co.uk Ltd | 47 i |
London Taxi Finance Ltd | 1 ii iii |
Lotus Finance Ltd | 20 ii iii |
LTGP Limited Partnership Incorporated | 34 * |
Maritime Leasing (No. 19) Ltd | 13 i ‡ |
MBNA Europe Finance Ltd | 46 i |
MBNA Europe Holdings Ltd | 47 i |
MBNA Ltd | 47 i |
MBNA R & L Sàrl | 49 i |
MBNA Receivables Ltd | 32 i |
Membership Services Finance Ltd | 4 i |
Mitre Street Funding Sàrl | 23 i |
NWS Trust Ltd | 5 i |
Pacific Leasing Ltd | 13 i ‡ |
Pensions Management (S.W.F.) Ltd | 5 * |
Perry Nominees Ltd | 1 i |
PIPS Asset Investments Ltd | 1 ii iii |
Prestonfield Investments Ltd | 5 i |
Proton Finance Ltd | 20 ii iii |
R.F. Spencer and Company Ltd | 9 i |
Raleigh Street (Walsall) Management Company Ltd | 1 * |
Ranelagh Nominees Ltd | 1 i |
Retail Revival (Burgess Hill) Investments Ltd | 1 i |
Saint Michel Holding Company No1 | 28 i |
Saint Michel Investment Property | 28 i |
Saint Witz 2 Holding Company No1 | 28 i |
Saint Witz 2 Investment Property | 28 i |
Savban Leasing Ltd | 1 i |
Scotland International Finance B.V. | 35 i |
Scottish Widows Administration Services (Nominees) Ltd | 5 i |
Scottish Widows Administration Services Ltd | 1 i |
Scottish Widows Auto Enrolment Services Ltd | 1 i |
Scottish Widows Europe | 27 i |
Scottish Widows Financial Services Holdings | 5 i |
Name of undertaking | Notes |
Scottish Widows’ Fund and Life Assurance Society | 5 * |
Scottish Widows Group Ltd | 5 ii ^ |
Scottish Widows Industrial Properties Europe B.V. | 18 i |
Scottish Widows Ltd | 1 i |
Scottish Widows Schroder Personal Wealth (ACD) Ltd | 1 i |
Scottish Widows Schroder Personal Wealth Ltd | 1 i |
Scottish Widows Schroder Wealth Holdings Ltd | 1 i |
Scottish Widows Services Ltd | 5 i |
Scottish Widows Trustees Ltd | 5 i |
Scottish Widows Unit Funds Ltd | 5 i |
Scottish Widows Unit Trust Managers Ltd | 1 i |
Seaspirit Leasing Ltd | 1 i |
Share Dealing Nominees Ltd | 4 i |
Shogun Finance Ltd | 20 i |
St Andrew’s Group Ltd | 20 i ‡ |
St Andrew’s Insurance plc | 20 i |
St Andrew’s Life Assurance Ltd | 20 i |
Standard Property Investment (1987) Ltd | 5 ii # |
Sterling ISA Managers (Nominees) Ltd | 20 i |
Sterling ISA Managers Ltd | 20 i |
Sussex County Homes Ltd | 4 i |
Suzuki Financial Services Ltd | 20 ii # |
SW Funding plc | 5 i # |
The Adviser Centre Ltd | 20 i |
The Agricultural Mortgage Corporation plc | 45 i |
The British Linen Company Ltd | 5 i |
The Mortgage Business plc | 4 i |
Thistle Leasing | + * |
Tranquility Leasing Ltd | 1 i |
TuskerDirect Ltd | 14 i |
Uberior (Glasgow) Limited | 5 ii iii |
Uberior (Moorfield) Ltd | 5 i |
Uberior (West) Limited | 5 ii iii |
Uberior ENA Ltd | 5 i |
Uberior Equity Ltd | 5 i |
Uberior Europe Ltd | 5 i |
Uberior Fund Investments Ltd | 5 i |
Uberior Infrastructure Investments Ltd | 31 i ‡ |
Uberior Infrastructure Investments (No 2) Ltd | 1 i |
Uberior Investments Ltd | 5 i |
Uberior Trading Ltd | 5 i |
Uberior Ventures Ltd | 31 i ‡ |
UDT Budget Leasing Ltd | 13 i ‡ |
UK PRS (Jersey) Properties I Ltd | 36 i |
UK PRS 2 Limited Partnership | 1 * |
UK PRS GP 2 Ltd | 1 i |
UK PRS GP Ltd | 1 i |
UK PRS Lettings I LLP | 1 * |
UK PRS Limited Partnership | 1 * |
UK PRS Member Limited | 1 i |
UK PRS Nominee 2 Limited | 1 i |
UK PRS Nominee Limited | 1 i |
United Dominions Leasing Ltd | 1 i |
United Dominions Trust Ltd | 1 i |
Vine Street XV LP | 41 * |
Ward Nominees (Abingdon) Ltd | 1 i |
Waymark Asset Investments Ltd | 1 ii iii |
Name of undertaking | Notes |
West Craigs Ltd | 5 i |
Wood Street Leasing Ltd | 1 i |
Name of undertaking | Notes |
Addison Social Housing Holdings Ltd | 36 |
Cancara Asset Securitisation Ltd | 32 |
Candide Financing 2021-1 B.V. | 19 |
Candide Financing 2024-1 B.V | 19 |
Candide Financing 2025-1 B.V | 19 |
Cardiff Auto Receivables Securitisation 2022-1 plc | 16 ‡ |
Cardiff Auto Receivables Securitisation 2024-1 plc | 6 |
Cardiff Auto Receivables Securitisation Holdings Ltd | 6 |
Cardiff Auto Receivables Securitisation Holdings No. 2 Ltd | 6 |
Elland RMBS 2018 plc | 6 |
Elland RMBS Holdings Ltd | 6 |
Fontwell II Securities 2020 DAC | 42 |
Fontwell Securities 2016 Ltd | 36 |
Gresham Receivables (No. 10) Ltd | 32 |
Gresham Receivables (No. 13) UK Ltd | 25 |
Gresham Receivables (No. 20) Ltd | 32 |
Gresham Receivables (No. 24) Ltd | 32 |
Gresham Receivables (No.27) UK Ltd | 25 |
Gresham Receivables (No. 32) UK Ltd | 25 |
Gresham Receivables (No. 34) UK Ltd | 25 |
Gresham Receivables (No.35) Ltd | 32 |
Gresham Receivables (No.36) UK Ltd | 25 |
Gresham Receivables (No.37) UK Ltd | 25 |
Gresham Receivables (No.38) UK Ltd | 25 |
Gresham Receivables (No.39) UK Ltd | 10 ‡ |
Gresham Receivables (No.40) UK Ltd | 25 |
Gresham Receivables (No.41) UK Ltd | 25 |
Gresham Receivables (No.44) UK Ltd | 10 ‡ |
Gresham Receivables (No.45) UK Ltd | 25 |
Gresham Receivables (No.46) UK Ltd | 10 ‡ |
Gresham Receivables (No.47) UK Ltd | 25 |
Gresham Receivables (No.48) UK Ltd | 25 |
Guildhall Asset Purchasing Company (No.11) UK Ltd | 25 |
Housing Association Risk Transfer 2019 DAC | 42 |
Lloyds Bank Covered Bonds (Holdings) Ltd | 6 |
Molineux RMBS 2016-1 plc | 16 ‡ |
Molineux RMBS Holdings Ltd | 6 |
Otium Lifetime Funding (No. 1) Ltd | 6 |
Penarth Asset Securitisation Holdings Ltd | 6 |
Penarth Funding 1 Ltd | 6 |
Penarth Funding 2 Ltd | 6 |
Penarth Master Issuer plc | 6 |
Penarth Receivables Trustee Ltd | 6 |
Permanent Funding (No. 1) Ltd | 6 |
Name of undertaking | Notes |
Permanent Funding (No. 2) Ltd | 6 |
Permanent Holdings Ltd | 6 |
Permanent Master Issuer plc | 6 |
Permanent Mortgages Trustee Ltd | 6 |
Permanent PECOH Holdings Ltd | 6 |
Permanent PECOH Ltd | 6 |
Salisbury Securities 2015 Ltd | 36 |
Salisbury II Securities 2016 Ltd | 36 |
Salisbury II-A Securities 2017 Ltd | 36 |
Salisbury III Securities 2019 DAC | 42 |
Syon Securities 2019 DAC | 42 |
Syon Securities 2020 DAC | 42 |
Syon Securities 2020-2 DAC | 42 |
Thistle Investments (AMC) Ltd | 6 |
Wetherby II Securities 2018 DAC | 3 ‡ |
Wetherby III Securities 2019 DAC | 42 |
Wilmington Cards 2021-1 plc | 6 |
Wilmington Cards Holdings Ltd | 6 |
Wilmington Receivables Trustee Ltd | 6 |
Yakima Funding No. 1 Ltd | 6 |
Bank of Scotland Foundation • | 5 |
Lloyds Bank Foundation for England & Wales • | 2 |
Lloyds Bank Foundation for the Channel Islands • | 2 |
MBNA General Foundation • | 47 |
The Halifax Foundation for Northern Ireland • | 15 |
Name of undertaking | % of share class held by immediate parent company (or by the Group where this varies) | Registered office address | Notes |
00SC Ltd | 50% | 2 Pemberton Street, Nottingham, NG1 1GS | ii |
239 Kingsway Hove Ltd | 50% | 168 Church Road, Hove, BN3 2DL | ii |
4755AS Ltd | 50% | Kingsnorth House, Blenheim Way, Birmingham, West Midlands, England, B44 8LS | ii |
Addison Social Housing Ltd | 20% | 18a Capricorn Centre, Cranes Farm Road, Basildon, Essex, SS14 3JJ | i ‡ |
Agentis Health Group Ltd | 99% | Unit 4, 74 Dyke Road Mews, Brighton, BN1 3JD | ii & |
Airline Services And Components Group Ltd | 94.45% | Squire Patton Boggs (UK) LLP (Ref: Csu), Rutland House, 148 Edmund Street, Birmingham, B3 2JR | ii & |
Albany Bidco Ltd | 75.32% | Acora House, Albert Drive, Burgess Hill, West Sussex, United Kingdom, RH15 9TN | ii & |
Aldreth Developments Ltd | 50% | No 1 Railshead Road, St Margarets, Isleworth, Middlesex, United Kingdom, TW7 7EP | ii ∞ |
Alfred Homes Properties LLP | n/a | The New Barn, Church Farm Woodman Lane, Sparsholt, Winchester, Hampshire, United Kingdom, SO21 2FR | * |
Alfred Investment Properties Ltd | 50% | The New Barn, Church Farm Woodman Lane, Sparsholt, Winchester, Hampshire, United Kingdom, SO21 2FR | i |
Alfred Investments LLP | n/a | The New Barn, Church Farm Woodman Lane, Sparsholt, Winchester, Hampshire, United Kingdom, SO21 2FR | * |
Alfreton Road JV Ltd | 100% | 85 Buckingham Gate, London, England, SW1E 6PD | ii |
Allan Water Homes (Chryston) Ltd | 50% | 24B Kenilworth Road, Bridge Of Allan, Stirling, Scotland, FK9 4DU | ii |
Alphabet Bidco Ltd | 99.25% | Phoenix House, Smeaton Close, Rabans Lane Industrial Area, Aylesbury, Buckinghamshire, United Kingdom, HP19 8UW | ii & |
Angus International Safety Group Ltd | 88.93% 88.93% | Station Road, High Bentham, Near Lancaster, LA2 7NA | xvii & xviii |
Artisan Blythswood Quarter Ltd | 100% | 61 Bridge Street, Kington, HR5 3DJ | ii |
Avantis Education Group Ltd | 99.25% | Unit 2 And 3, Jessop Court, Waterwells Business Park, Quedgeley, Gloucester, United Kingdom, GL2 2AP | xviii & |
Azul Holdco Ltd | 99.25% | 3rd Floor, One New Change, London, England, EC4M 9AF | xviii & |
Backhouse (Castle Cary) JV Ltd | 50% | Number One Welcome Building, Avon Street, Bristol, BS2 0PS | ii |
Backhouse (Westbury) JV Ltd | 50% | Number One Welcome Building, Avon Street, Bristol, BS2 0PS | ii |
Balia Ltd | 50% | 85 Buckingham Gate, London, England, SW1E 6PD | i |
Bar Bidco Ltd | 99.25% | Equity House, Blackbrook Park Avenue, Taunton, England, TA1 2PX | ii & |
BCIS Holdings Ltd | 99.25% | Royal House 110 Station Parade, Harrogate, HG1 1EP | ii & |
Beckstones (Rheda Park) Ltd | 50% | Agricola House, Cowper Road, Gilwilly Industrial Estate, Penrith, CA11 9BN | ii |
Bergamot Ventures Ltd | 100% | C/O Milsted Langdon Llp Winchester House, Deane Gate Avenue, Taunton, United Kingdom, TA1 2UH | iii ~ |
BH Stoke Golding Property LLP | n/a | Grovelands Business Park, West Haddon Road, East Haddon, Northampton, NN6 8FB | * |
BH Sutton Ltd | 50% | Grovelands Business Park, West Haddon Road, East Haddon, Northampton, NN6 8FB | ii |
BH Woodville Ltd | 50% | Grovelands Business Park, West Haddon Road, East Haddon, Northampton, NN6 8FB | ii |
Biozone Scientific Group Ltd | 99.25% | Unit 5a, Compass Business Park, Pacific Road, Cardiff, CF24 5HL | ii & |
Blue Bay Travel Group Ltd | 99.17% | A4 Bellringer Road, Trentham Business Quarter, Stoke-On-Trent, ST4 8GB | xviii & |
BoS Mezzanine Partners Fund LP | n/a | Fourth Floor, 7 Castle Street, Edinburgh, EH2 3AH | * |
Bowbridge Homes (Frisby) Ltd | 50% | Unit 4, Shieling Court, Corby, England, NN18 9QD | ii |
Bowland Fold (Halton) Ltd | 25% | Agricola House, Cowper Road, Gilwilly Industrial Estate, Penrith, England, CA11 9BN | i |
Bramble Foods Group Ltd | 99.25% 99.25% | Crosby Road, Market Harborough, Leicestershire, England, LE16 9EE | ii & xvi |
Briar Homes (Barrhead) Ltd | 50% | Radleigh House, 1 Golf Road, Clarkston, Glasgow, G76 7HU | i |
Briar Homes (Gladsmuir) Ltd | 50% | Radleigh House, 1 Golf Road, Clarkston, Glasgow, G76 7HU | i |
Briar Homes (Howwood) Ltd | 50% | Radleigh House, 1 Golf Road, Clarkston, Glasgow, G76 7HU | ii |
Briar Homes (Investments) Ltd | 100% | Radleigh House, 1 Golf Road, Clarkston, Glasgow, G76 7HU | ii |
Briar Homes (Kennoway) Ltd | 50% | Radleigh House, 1 Golf Road, Clarkston, Glasgow, G76 7HU | i |
Briar Homes (Newmains) Ltd | 50% | Radleigh House, 1 Golf Road, Clarkston, Glasgow, G76 7HU | ii |
Briar Homes (Tillycairn) Ltd | 50% | Radleigh House, 1 Golf Road, Clarkston, Glasgow, G76 7HU | i |
Bunnyhomes Church Lane at Cheriton Bishop Ltd | 25% | 22 Chancery Lane, London, England, WC2A 1LS | i |
Bunnyhomes Primrose Fields At Appledore Ltd | 25% | 22 Chancery Lane, London, England, WC2A 1LS | i |
BRICS (Earnley) LLP | n/a | 3rd Floor 22 Old Bond Street, London, W1S 4PY | * |
Cayuga 013 LLP | n/a | Cayuga House, 2a Addison Road, Hove, England, BN3 1TN | * |
Cayuga 018 LLP | n/a | 168 Church Road, Hove, BN3 2DL | * |
Cheriton Bishop Holding Ltd | 50% | 22 Chancery Lane, London, England, WC2A 1LS | ii |
City & General Securities Ltd | 100% | 10 Upper Berkeley Street, London, W1H 7PE | iii & |
Name of undertaking | % of share class held by immediate parent company (or by the Group where this varies) | Registered office address | Notes |
Coba Technology Ltd | 27.95% | 78 Cannon Street, London, EC4N 6HL | ii |
Columbus UK Holdings Ltd | 99% | 1 Fore Street Avenue, Moorgate, London, United Kingdom, EC2Y 9DT | ii & |
Connect Health Group Ltd | 99% 99% | The Light Box, Quorum Business Park, Benton Lane, Newcastle Upon Tyne, United Kingdom, NE12 8EU | ii & xvii |
Cora Health Group Ltd | 99.25% | The Light Box, Quorum Business Park, Benton Lane, Newcastle Upon Tyne, United Kingdom, NE12 8EU | ii & |
Crossco (1462) Ltd | 99.25% 99.25% | 23a Falcon Court, Preston Farm Industrial Estate, Stockton-On-Tees, United Kingdom, TS18 3TX | ii xviii & |
Crossco (1473) Ltd | 99.25% | Pipewell Quay, Pipewellgate, Gateshead, NE8 2BJ | xviii & |
Cruden Homes (Aberlady) Ltd | 50% | 16 Walker Street, Edinburgh, EH3 7LP | ii |
Cruden Homes (Barnton Avenue) Ltd | 50% | 16 Walker Street, Edinburgh, EH3 7LP | i |
Cruden Homes (Longniddry South) Ltd | 50% | 16 Walker Street, Edinburgh, EH3 7LP | i |
Cruden Homes (West Craigs) Ltd | 50% | 16 Walker Street, Edinburgh, EH3 7LP | i |
Cruden Ventures Ltd | 100% | 16 Walker Street, Edinburgh, EH3 7LP | ii |
D.U.K.E. Real Estate Ltd | 100% | Cromwell Property Group Spaces, Lochrin Square, 1 Lochrin Square, 92-98 Fountainbridge, Edinburgh, United Kingdom, EH3 9QA | iii ~ ‡ |
Derwent Rise (Seaton) Ltd | 25% | Agricola House, Cowper Road, Gilwilly Industrial Estate, Penrith, England, CA11 9BN | i |
Devonshire Homes (Halwill) Ltd | 25% | Gotham House, Hammett Square, Phoenix Lane, Tiverton, Devon, EX16 6LT | ii |
Devonshire Homes (Ilfracombe) Ltd | 100% | Gotham House, Hammett Square, Phoenix Lane, Tiverton, Devon, EX16 6LT | ii |
Devonshire Homes (RGI) Ltd | 50% | Gotham House, Hammett Square, Phoenix Lane, Tiverton, Devon, EX16 6LT | ii |
Devonshire Homes (St Austell) Ltd | 50% | Gotham House, Hammett Square, Phoenix Lane, Tiverton, Devon, EX16 6LT | ii |
Devonshire Homes (Wincanton) Ltd | 25% | Gotham House, Hammett Square, Phoenix Lane, Tiverton, Devon, EX16 6LT | ii |
Downtown Manchester BTR Ltd | 100% | 1 St. Georges Court, Altrincham Business Park, Altrincham, England, WA14 5UA | ii |
Downtown Manchester Opco Ltd | 50% | 1 St. Georges Court, Altrincham Business Park, Altrincham, England, WA14 5UA | i |
Downtown Manchester Propco Ltd | 50% | 1 St. Georges Court, Altrincham Business Park, Altrincham, England, WA14 5UA | i |
Duchy Homes (Chapelgarth) Ltd | 50% | 3125 Century Way, Thorpe Park, Leeds, LS15 8ZB | ii |
Duchy Homes (Elwick) Ltd | 50% | Middleton House, Westland Road, Leeds, United Kingdom, LS11 5UH | ii |
Duncan and Todd Holdings Ltd | 89.25% | Unit 4 Kirkhill Commercial Park, Dyce Avenue, Dyce, Aberdeen, AB21 0LQ | ii & |
Dundashill 4A Ltd | 50% | 305 Gray’s Inn Road, London, United Kingdom, WC1X 8QR | i |
Durkan (Onslow) Ltd | 25% | Unit 4, Elstree Way, Borehamwood, England, WD6 1JD | i |
Durkan Growth Ltd | 50% | Unit 4, Elstree Way, Borehamwood, England, WD6 1JD | ii |
Eamont Chase (Penrith) Ltd | 25% | Agricola House, Cowper Road, Gilwilly Industrial Estate, Penrith, England, CA11 9BN | i |
Eden Gardens (Etterby) Ltd | 25% | Agricola House, Cowper Road, Gilwilly Industrial Estate, Penrith, England, CA11 9BN | i |
Edwards Homes (Hollybrook Park) Ltd | 50% | Edwards House Lakeside Business Village, St. Davids Park, Ewloe, United Kingdom, CH5 3XA | ii |
EFG Holdco (CW) Ltd | 100% | 9th Floor, 80 Mosley Street, Manchester, M2 3FX | ii |
Eiger Bidco Ltd | 99.25% | 4 Webster Court, Carina Park, Westbrook, Warrington, United Kingdom, WA5 8WD | ii & |
Elovate Group Ltd | 100% | York House, Wetherby Road, Long Marston, YO26 7NH | xviii & |
Ensco 1322 Ltd | 99% | Newbury House, 20 Kings Road West, Newbury, Berkshire, RG14 5XR | ii & |
Ensco 1327 Ltd | 99% | 131 Finsbury Pavement, London, EC2A 1NT | ii & |
Ensco 1337 Ltd | 99% | 41 Churchill Way, Lomeshaye Industrial Estate, Nelson, Lancashire, BB9 6RT | ii & |
Ensco 1506 Ltd | 73.08% | Broadfield Law UK LLP, One Bartholomew Close, London, EC1A 7BL | ii & |
Ettrickhaugh Development Company Ltd | 100% | Priorwood House, High Road, Melrose, Scottish Borders, Scotland, TD6 9EF | ii |
Eudoros Bidco Ltd | 99.25% | 5 Soho Street, London, England, W1D 3DG | xviii & |
Europa Property Company (Northern) Ltd | 100% | Europa House, 20 Esplanade, Scarborough, North Yorkshire, YO11 2AQ | viii |
Eutopia Exeter 4 Ltd | 50% | The Stables, Little Coldharbour Farm, Tong Lane, Lamberhurst, Tunbridge Wells, Kent, England, TN3 8AD | ii |
Eutopia Exeter Gateway Ltd | 50% | The Stables, Little Coldharbour Farm, Tong Lane, Lamberhurst, Tunbridge Wells, Kent, England, TN3 8AD | ii |
Name of undertaking | % of share class held by immediate parent company (or by the Group where this varies) | Registered office address | Notes | |||
Express Engineering Group Holdings Ltd | 99% | Kingsway North, Team Valley Trading Estate, Gateshead, NE11 0EG | ii & | |||
Farries Field (Stainburn) Ltd | 50% | Agricola House, Cowper Road, Gilwilly Industrial Estate, Penrith, Cumbria, CA11 9BN | ii | |||
FDL Salterns Ltd | 50% | 2 Poole Road, Bournemouth, BH2 5QY | ii | |||
Fitz&Knox Ltd | 100% | 33-35 Southernhay East, Exeter, EX1 1NX | ii | |||
Generate Topco Ltd | 99.25% | Boxpark Unit 37-41 Boxpark Shoreditch, 2-10 Bethnal Green Road, London, E1 6GY | xviii & | |||
Global Autocare Holding Ltd | 99% | The Hub, Gelderd Lane, Leeds, England, LS12 6AL | ii & | |||
GPSEC LLP | n/a | 2a Addison Road, Hove, England, BN3 1TN | * | |||
Grove Crescent Stratford Ltd | 50% | 3 Llys Y Bont, Parc Menai, Bangor, United Kingdom, LL57 4BN | i | |||
Hamsard 3667 Ltd | 99.25% | Park House, Clifton Park, York, North Yorkshire, YO30 5PB | ii & | |||
Hamsard 3731 Ltd | 85.21% | 55 Whitefriargate, Hull, HU1 2HU | ii & | |||
Hamsard 3751 Ltd | 99.25% | Unit 17-20 Glacier Buildings, Harrington Road, Brunswick Business Park, Liverpool, England, L3 4BH | ii & | |||
Hamsard 3796 Ltd | 99.25% | The Harley Building, 77-79 New Cavendish Street, London, England, W1W 6XB | ii & | |||
Hartfell Developments (Harker) Ltd | 100% | Langlands, Pallet Hill, Penrith, CA11 0BY | ii | |||
Hazel Newco Ltd | 99.25% | Bradwood Court, St Crispin Way, Haslingden, Rossendale, Lancashire, United Kingdom, BB4 4PW | xviii & | |||
HB Developments (NW) Ltd | 50% | 116 Duke Street, Liverpool, Merseyside, England, L1 5JW | ii | |||
Hercules Topco Ltd | 99.25% | 5th Floor, The Grange, 100 High Street, Southgate, London, N14 6BN | ii & | |||
HG Developments (NW) Ltd | 45% | 116 Duke Street, Liverpool, Merseyside, England, L1 5JW | ii & | |||
HGP II Ltd | 50% | 25 Gresham Street, London, EC2V 7HN | i | |||
HGP Torsion Holdco Ltd | 50% | 1280 Century Way, Thorpe Park, Leeds, West Yorkshire, United Kingdom, LS15 8ZB | ii | |||
HH (AG) Ltd | 100% | 17 Mann Island, Liverpool, England, L3 1BP | ii | |||
Highcross Street Holdings Ltd | 50% | 18 St Christopher's Way, Pride Park, Derby, Derbyshire, DE24 8JY | ii | |||
Highlands Bidco Ltd | 99% | Commsworld House, Queen Anne Drive, Newbridge, EH28 8LH | ii & | |||
HJ Topco Ltd | 99.25% | Cavendish House, 39-41 Waterloo Street, Birmingham, B2 5PP | ii & | |||
Hollins Homes (Bartle) Ltd | 25% | 22 Regent Street, Nottingham, NG1 5BQ | i ‡ | |||
Hollins Homes (Galgates) Ltd | 25% | Riverside House, Irwell Street, Manchester, M3 5EN | i Δ | |||
Hollins Homes (Loveclough) Ltd | 50% | C/O Grant Thornton Uk Llp 11th Floor, Landmark St Peter's Square, 1 Oxford Street, Manchester, M1 4PB | ii ‡ | |||
Hollins Homes (Utopia) Ltd | 50% | Riverside House, Irwell Street, Manchester, M3 5EN | ii Δ | |||
Horse Health Wessex Holdings Ltd | 99.25% | Copied Hall Farm Winsor Road, Winsor, Southampton, Hampshire, United Kingdom, SO40 2HE | ii & | |||
Housing Growth Partnership II LP | n/a | 25 Gresham Street, London, EC2V 7HN | * | |||
Housing Growth Partnership Ltd | 50% 50% | 25 Gresham Street, London, EC2V 7HN | ii iii | |||
Housing Growth Partnership LP | n/a | 25 Gresham Street, London, EC2V 7HN | * | |||
HPD (Conwy) Ltd | 100% | 20 George Street, Alderley Edge, England, SK9 7EJ | ii | |||
Hylyfe Leicester Ltd | 50% | 2 Pemberton Street, Nottingham, England, NG1 1GS | i | |||
IDSL Group Holdings Ltd | 99.25% | Magma House, 16 Davy Court Castle Mound Way, Rugby, Warwickshire, United Kingdom, CV23 0UZ | ii & | |||
IEG Group Ltd | 99.25% | Christian Douglass Accountants Limited, 2 Jordan Street, Knott Mill, Manchester, M15 4PY | ii & | |||
IPE Roundway Ltd | 100% | 22 Gilbert Street, London, England, W1K 5HD | ii | |||
Indigo 123 Ltd | 99.25% | 1 Caspian Way, Cardiff, Wales, CF10 4DQ | ii & | |||
JRL Property (Castle Street) Holdings Ltd | 100% | 4 Elstree Way, Borehamwood, Hertfordshire, England, WD6 1RN | ii | |||
JRL Property (Castle Street) Ltd | 50% | 4 Elstree Way, Borehamwood, Hertfordshire, England, WD6 1RN | i | |||
JRL Property (Castle Street) Opco Ltd | 50% | 4 Elstree Way, Borehamwood, Hertfordshire, England, WD6 1RN | i | |||
James Taylor Homes (Brighton) Ltd | 25% | James Taylor House, St. Albans Road East, Hatfield, United Kingdom, AL10 0HE | i | |||
James Taylor Homes (Investment) Ltd | 50% | James Taylor House, St. Albans Road East, Hatfield, United Kingdom, AL10 0HE | ii | |||
James Taylor Homes (Newton Longville) Ltd | 50% | James Taylor House, St. Albans Road East, Hatfield, United Kingdom, AL10 0HE | ii | |||
James Taylor Homes (Verulamium) Ltd | 25% | James Taylor House, St. Albans Road East, Hatfield, United Kingdom, AL10 0HE | i | |||
Kenmore Capital 3 Ltd | 100% | Grant Thornton UK LLP, 110 Queen Street, Glasgow, G1 3BX | iii ~ | |||
Kier HGP Devco 2 LLP | n/a | 2nd Floor, Optimum House, Clippers Quay, Salford, England, M50 3XP | * | |||
Kier HGP Holdings LLP | n/a | 2nd Floor, Optimum House, Clippers Quay, Salford, England, M50 3XP | * | |||
Kier HGP Holdings 2 Ltd | 50% | 2nd Floor, Optimum House, Clippers Quay, Salford, England, M50 3XP | i | |||
Kier HGP Tunbridge Wells LLP | n/a | 2nd Floor, Optimum House, Clippers Quay, Salford, England, M50 3XP | * |
Name of undertaking | % of share class held by immediate parent company (or by the Group where this varies) | Registered office address | Notes | |||
Kingmead Homes (Warwick) Ltd | 50% 50% 50% 50% | 168 Church Road, Hove, East Sussex, United Kingdom, BN3 2DL | ii iii viii xvi | |||
Kingmead Homes Housing Growth LLP | n/a | 168 Church Road, Hove, East Sussex, United Kingdom, BN3 2DL | * | |||
Kingswood Mobility Group Ltd | 99.25% | Browne Jacobson Llp (Cs) Mowbray House, Castle Meadow Road, Nottingham, England, NG2 1BJ | xviii & | |||
Kite Topco Ltd | 89.25% 22.13% | Floor 7, The Future Works, Brunel Way, Slough, Berkshire, England, SL1 1FQ | xvii & xvi | |||
Kruger Topco Ltd | 99.25% | Rhino House, Deans Road, Ellesmere Port, United Kingdom, CH65 4DR | ii & | |||
L-L-O Orpington Ltd | 50% | 1st Floor, Arthur Stanley House, 40-50 Tottenham Street, London, W1T 4RN | ii | |||
LMX Holdco Ltd | 99.25% | 1650 Parkway, Whiteley, Fareham, England, PO15 7AH | xviii & | |||
Lucida Broking Holdings Ltd | 89.25% 89.25% | St James House, 27-43 Eastern Road, Romford, Essex, United Kingdom, RM1 3NH | ii & ix | |||
Lunesdale Rise (Kirkby Lonsdale) Ltd | 25% | Agricola House, Cowper Road, Gilwilly Industrial Estate, Penrith, England, CA11 9BN | i | |||
M&GP (No. 2) Ltd | 50% | 10 Old Houghton Road, Hartford, Huntingdon, PE29 1YB | ii | |||
MADE Partnership LLP | n/a | Barratt House, Cartwright Way, Forest Business Park, Bardon Hill, Coalville, Leicestershire, United Kingdom, LE67 1UF | * | |||
Meadow Rigg (Burneside Road) Ltd | 25% | Agricola House, Cowper Road, Gilwilly Industrial Estate, Penrith, Cumbria CA11 9BN | i | |||
Measured Identity Hub Ltd | 97.92% | 3 Long Acre Willow Farm Business Park, Castle Donington, Derbyshire, England, DE74 2UG | ii & | |||
Montague Centre (GPSEC) Ltd | 50% | 168 Church Road, Hove, BN3 2DL | i | |||
Mortgage Brain Holdings Ltd | 16.67% 20% | 6 The Courtyard, Buntsford Gate, Buntsford Drive, Bromsgrove, Worcestershire, B60 3DJ | ii iii | |||
Motability Operations Group plc | 39.98% | 22 Bishopsgate, Level 6, 22 Bishopsgate, London, EC2N 4BQ | i | |||
Neilson Active Holidays Group Ltd | 89.25% | Locksview, Brighton Marina, Brighton, BN2 5HA | ii & | |||
Newday JVCO Ltd | 100% | 27 Esplanade, St. Helier, Jersey, JE1 1SG | x | |||
North Kensington Gate HGP Ltd | 100% | Regina House, 124 Finchley Road, London, United Kingdom, NW3 5JS | ii | |||
North Kensington Gate Ltd | 50% | Regina House, 124 Finchley Road, London, United Kingdom, NW3 5JS | i | |||
Omniplex Learning Topco Ltd | 99.25% | Omniplex Learning, 45 Grosvenor Road, St Albans, Hertfordshire, United Kingdom, AL1 3AW | ii & | |||
Onapp (Topco) Ltd | 82.5% 82.5% | 3MC Middlemarch Business Park, Siskin Drive, Coventry, United Kingdom, CV3 4FJ | xvii & xviii | |||
Origin (Topco) Ltd | 50% | Agricola House, 5 Cowper Road, Gilwilly Industrial Estate, Penrith, Cumbria, CA11 9BN | ii | |||
Orwell (Basildon) JV Ltd | 50% | 1st Floor, 73-81 Southwark Bridge Road, London, SE1 0NQ | ii | |||
Orwell (Basildon) Ltd | 25% | 1st Floor, 73-81 Southwark Bridge Road, London, SE1 0NQ | i | |||
Osprey Aviation Services (UK) Ltd | 89.25% 89.25% | Blackwood House, Union Grove Lane, Aberdeen, AB10 6XU | xvii & xviii & | |||
PACE Group Holding Ltd | 97.19% | Building 29 Pensnett Trading Estate, Dandy Bank Road, Kingswinford, United Kingdom, DY6 7TU | ii & | |||
PAM Healthcare Ltd | 99.25% | 9 Lakeside Drive, (Also Known as 820 Mandarin Court) Centre Park, Warrington WA1 1GG | ii & | |||
Pennine View (Calthwaite) Ltd | 25% | 5 Cowper Road, Gilwilly Industrial Estate, Penrith, Cumbria, CA11 9BN | i | |||
PFP-Igloo Developments Ltd | 100% | 305 Gray’s Inn Road, London, United Kingdom, WC1X 8QR | ii | |||
PFP-Igloo Fruitmarket Ltd | 50% | C/O Igloo Regeneration Limited Huckletree Ancoats, The Express Building, 9 Great Ancoats Street, Manchester, Greater Manchester, United Kingdom, M4 5AD | i | |||
PL & HGP Ltd | 50% | 3rd Floor, Tower House, 10 Southampton Street, London, United Kingdom, WC2E 7HA | ii | |||
Plaistow Development Partners Ltd | 100% | 4th Floor 95 Gresham Street, London, EC2V 7AB | ii | |||
Platform Leeds BTR1 OPCO Ltd | 50% | Marble Arch House, 66 Seymour Street, London, United Kingdom, W1H 5BT | i | |||
Platform Leeds BTR1 PROPCO Ltd | 50% | Marble Arch House, 66 Seymour Street, London, United Kingdom, W1H 5BT | i | |||
Platform Leeds Commercial Inn PROPCO Ltd | 50% | Marble Arch House, 66 Seymour Street, London, United Kingdom, W1H 5BT | i | |||
Platform Leeds P1 DEVCO Ltd | 50% | Marble Arch House, 66 Seymour Street, London, United Kingdom, W1H 5BT | i | |||
Platform Leeds P1 JVCO Ltd | 100% | Marble Arch House, 66 Seymour Street, London, United Kingdom, W1H 5BT | ii | |||
Primrose Fields Holding Ltd | 50% | 22 Chancery Lane, London, England, WC2A 1LS | ii | |||
Project Acorn Topco Ltd | 99.25% | Bridgford House, Heyes Lane, Alderley Edge, SK9 7JP | ii & | |||
Project Airscope Bidco Ltd | 99.25% | CTI Digital, Suite 2A and 2B, South Central, 11 Peter Street, Manchester, M2 5QR | xviii & |
Name of undertaking | % of share class held by immediate parent company (or by the Group where this varies) | Registered office address | Notes |
Project Atlantic Topco Ltd | 99.25% | Linhay House Linhay Business Park, Ashburton, Devon, TQ13 7UP | ii & |
Project Bridgerton Bidco Ltd | 99.25% | 54 Charlotte Street, London, England, W1T 2NS | ii & |
Project Bridgetown Ltd | 99.25% | Xyz Building, 3 Hardman Boulevard, Spinningfields, Manchester, United Kingdom, M3 3AQ | ii & |
Project Drive Topco Ltd | 99.25% | Unit 1, Chalfont House Boundary Way, Hemel Hempstead Industrial Estate, Hemel Hempstead, Hertfordshire, United Kingdom, HP2 7SJ | xviii & |
Project Galaxy UK Topco Ltd | 99.25% | 3rd Floor, Q5 Quorum Business Park, Benton Lane, Newcastle Upon Tyne, United Kingdom, NE12 8BS | ii & |
Project Juno Topco Ltd | 99.25% | C/O Panthera Biopartners Limited, 228 Garstang Road, Fulwood, Preston, PR2 9QB | xviii & |
Project Penny Ltd | 99.25% | 115 Victoria Road, Ferndown, United Kingdom, BH22 9HU | ii & |
Project Sharp Topco Ltd | 99.25% | 1 Atlas Road, Hermitage Industrial Estate, Coalville, Leicestershire, LE67 3FQ | ii & |
Project Sketch Ltd | 88.3% | 11 Vantage Way, Erdington, Birmingham, B24 9GZ | ii & |
Project Stratos Topco Ltd | 99.25% | Birchin Court, 20 Birchin Lane, London, United Kingdom, EC3V 9DU | xviii & |
Project Sutton Bidco Ltd | 99.25% | Chawston House, Chawston Lane, Chawston, Bedford, Bedfordshire, United Kingdom, MK44 3BH | ii & |
Project Venus Ltd | 99.25% | Lyndean House, 43-46 Queens Road, Brighton, East Sussex, BN1 3XB | ii & |
Project Volta Topco Ltd | 99.25% 99.25% | Units 1 – 7 Dukeries Court, Medenside, Meden Vale, Mansfield, Nottinghamshire, United Kingdom, NG20 9QU | xviii & xii |
Ramco Pipetech Holdings Ltd | 99.35% | Kingshill View, Prime Four Business Park, Kingswells, Aberdeen, AB15 8PU | ii & ‡ |
RDIL 2021 Ltd | 99.25% | Old Printers Yard, 156 South Street, Dorking, Surrey, United Kingdom, RH4 2HF | xviii & |
ROK Group (Exeter) Ltd | 100% | 26a Old Elvet, Durham, DH1 3HN | ii |
Rocket Science Holdings Ltd | 99.17% | 20 St. Andrew Street, London, EC4A 3AG | xviii & ‡ |
Safari Bidco Ltd | 99.25% | Upper Floor, The Granary, Stanley Grange, Ormskirk Road, Knowsley, Prescot, Merseyside, England, L34 4AT | ii & |
Sandsfield Way (Carlisle) Ltd | 25% | Agricola House, Cowper Road, Gilwilly Industrial Estate, Penrith, CA11 9BN | i & |
ScarlettAbbott (Topco) Ltd | 99.25% | The Bonding Warehouse, Terry Avenue, York, YO1 6FA | ii & |
Scenic Topco Ltd | 89.25% | Unit 1B, Pentwyn Business Centre, Wharfedale Road, Cardiff, Wales, CF23 7HB | ii & |
Scotia (Brechin) Ltd | 100% | Ca’D’Oro Building, 45 Gordon Street, Glasgow, Scotland, G1 3PE | ii |
Seahawk Bidco Ltd | 89.25% | Unit 2, Springfield Court, Summerfield Road, Bolton, United Kingdom, BL3 2NT | xviii & |
Seahouses Topco Ltd | 99.25% | Unit J, Gildersome Spur, Leeds, United Kingdom , LS27 7JZ | xviii & |
Sedex Information Exchange Ltd | 99.25% 99.25% | 18 St. Swithin's Lane, London, EC4N 8AD | iii & xv |
Shore Station (Edinburgh) JV LLP | n/a | 6 Duke Street, St James's, London, United Kingdom, SW1Y 6BN | * |
Shore Station (Edinburgh) Company Ltd | 50% | 6 Duke Street, St James's, London, United Kingdom, SW1Y 6BN | i |
Shore Station (Edinburgh) Development LLP | n/a | 6 Duke Street, St James's, London, United Kingdom, SW1Y 6BN | * |
Solais Topco Ltd | 99.25% | Solais House, 19 Phoenix Crescent, Strathclyde Business Park, Bellshill, United Kingdom, ML4 3NJ | ii & |
SOLO Topco Ltd | 99% | Onecom House, 4400 Parkway, Whiteley, Fareham, Hampshire, PO15 7FJ | ii & |
Southwark Estates (One) Ltd | 100% | Brock House, 19 Langham Street, London, W1W 6BP | ii |
Stancliffe Homes (Bentley) Ltd | 50% | Office 3, Markham Lane, Markham Vale, Chesterfield, England, S44 5HY | ii |
Star Live TopCo Ltd | 99.25% | 7 Fitzhamon Court, Wolverton Mill, Milton Keynes, England MK12 6LB | xviii & |
Stratus (Holdings) Ltd | 82.5% 82.5% | 3MC Middlemarch Business Park, Siskin Drive, Coventry, West Midlands, England, CV3 4FJ | xvii xviii & |
The EMS Group Ltd | 99.25% | The Refinery, South Road, Ellesmere Port, United Kingdom, CH65 4LE | xviii & |
The Exceed Partnership LP | n/a | C/O DWF Company Secretarial Services Limited, 1 Scott Place, 2 Hardman Street, Manchester, United Kingdom, M3 3AA | * |
The Woodlands (Carlisle) Ltd | 25% | Agricola House, Cowper Road, Gilwilly Industrial Estate, Penrith, Cumbria, CA11 9BN | i |
Timec 1863 Ltd | 99.25% | Floor 2 Equinox House, 3.2 Silver Fox Way, Cobalt Business Park, Newcastle upon Tyne, England, NE27 0QJ | ii & |
Tolia Bidco Ltd | 99.25% | First Floor, 6 Dowgate Hill, London, England, EC4R 2SU | ii & |
Topco Coffee Ltd | 99.25% | Lodge Farm Barn, Elvetham Park Estate, Hartley Wintney, Hampshire, United Kingdom, RG27 8AS | xviii & |
Torsion Developments Ltd | 50% | 1280 Century Way Thorpe Park, Leeds, West Yorkshire, United Kingdom, LS15 8ZB | ii |
Two (PBSA) Holding LLP | n/a | 22b Court Street, Haddington, EH41 3JA | * |
United House Group Holdings Ltd | 81.5% | C/O Interpath Ltd, 4th Floor, Tailors Corner, Thirsk Row, Leeds, LS1 4DP | ii & ‡ |
Urban Centric (KC) Ltd | 50% | 33-35 Southernhay East, Exeter, EX1 1NX | i |
Urban Centric (Trafalgar) Holdings Ltd | 100% | 33-35 Southernhay East, Exeter, EX1 1NX | ii |
Urban Centric (Trafalgar) Ltd | 50% | 33-35 Southernhay East, Exeter, EX1 1NX | i |
Villafont (The Barns) Ltd | 25% | 1 St. George's Court, Altrincham Business Park, Altrincham, United Kingdom, WA14 5UA | i |
Villafont (Garstang) Ltd | 25% | 1 St. George's Court, Altrincham Business Park, Altrincham, United Kingdom, WA14 5UA | i |
Villafont (Galgate) Ltd | 25% | 1 St. George's Court, Altrincham Business Park, Altrincham, United Kingdom, WA14 5UA | i |
Villafont (Herne Bay) Ltd | 100% | 1 St. Georges Court, Altrincham Business Park, Altrincham, United Kingdom, WA14 5UA | ii |
Villafont (Lancashire) JVCO Ltd | 50% | 1 St. George's Court, Altrincham Business Park, Altrincham, United Kingdom, WA14 5UA | ii |
Villas for Travel Ltd | 27.95% | 14 Hemmells, Laindon, Essex, SS15 6ED | ii |
Wakefield Gardens (Lazonby) Ltd | 25% | Agricola House, Cowper Road, Gilwilly Industrial Estate, Penrith, Cumbria, CA11 9BN | i |
Walker Warwick Land Ltd | 50% | 168 Church Road, Hove, England, BN3 2DL | i |
Walker Warwick Ltd | 50% | 168 Church Road, Hove, England, BN3 2DL | i |
Walnut Newco Ltd | 99.25% | c/o Roxburgh Milkins Limited, Merchants House North, Wapping Road, Bristol, United Kingdom, BS1 4RW | ii & |
Water Sustainability Ltd | 99.25% | Dominican House, St John's Street, Chichester, United Kingdom, PO19 1TU | ii & |
Watford Way Developments Ltd | 100% | 4th Floor, 95 Gresham Street, London, EC2V 7AB | ii |
Watkin Jones (Grove Crescent) Holdings Ltd | 100% | 3 Llys Y Bont, Parc Menai, Bangor, Wales, LL57 4BN | ii |
WCCTV Group Ltd | 99.25% | James Watt House, James Watt Drive, Kingsway Business Park, Rochdale, England, OL16 4UG | ii & |
Whiteburn Allanbank Ltd | 50% | 1 Jackson's Entry, Edinburgh, Scotland, EH8 8PJ | i |
Whiteburn March Street Ltd | 50% | 1 Jackson's Entry, Edinburgh, Scotland, EH8 8PJ | i |
Whiteburn Residential (March Street) Ltd | 50% | 1 Jackson's Entry, Edinburgh, Scotland, EH8 8PJ | i |
Whiteburn Residential Ltd | 100% | 1 Jackson's Entry, Edinburgh, Scotland, EH8 8PJ | ii |
Whiteburn Viewforth Development Ltd | 100% | 1 Jackson's Entry, Edinburgh, Scotland, EH8 8PJ | ii |
Whittington Facilities Ltd | 100% | c/o Teneo Financial Advisory Limited, The Colmore Building, 20 Colmore Circus Queensway, Birmingham, B4 6AT | xv Δ |
Wind Bidco Ltd | 99.25% | Westcott House, Hesslewood Office Park, Ferriby Road, Hessle East, Yorkshire, HU13 0LH | ii & |
Name of undertaking | % of fund held by immediate parent (or by the Group where this varies) | Notes |
ABRDN OEIC I | 1 | |
abrdn European Real Estate Share Fund | 50.07% | |
ABRDN OEIC VI | 1 | |
abrdn Emerging Markets Equity Enhanced Index Fund | 71.82% | |
ABSOLUTE INSIGHT FUNDS P.L.C. | 2 | |
Insight Broad Opportunities Fund | 36.52% | |
ACS POOLED PROPERTY | 3 | |
Scottish Widows Pooled Property ACS Fund 1 | 100% | |
Scottish Widows Pooled Property ACS Fund 2 | 100% | |
BAILLIE GIFFORD INVESTMENT FUNDS ICVC | 4 | |
Baillie Gifford Diversified Growth Fund | 56.42% | |
BLACKROCK AUTHORISED CONTRACTUAL SCHEME I | 5 | |
ACS 30:70 Global Equity Tracker Fund | 33.84% | |
ACS Climate Transition World Equity Fund | 93.32% | |
ACS World Multifactor Equity Tracker Fund | 73.23% | |
BLACKROCK COLLECTIVE INVESTMENT FUNDS | 5 | |
BlackRock Global Corporate ESG Insights Bond Fund | 24.99% | |
BLACKROCK FIXED INCOME DUBLIN FUNDS | 5 | |
iShares Emerging Markets Local Government Bond Index Fund (IE) | 82.26% | |
BLACKROCK FIXED INCOME DUBLIN FUNDS PLC | 6 | |
iShares Emerging Markets Government Bond Index Fund (IE) | 73.32% | |
BNY MELLON GLOBAL FUNDS PLC | 7 | |
BNY Mellon Global Leaders Fund | 80.77% | |
BNY MELLON INVESTMENT FUNDS | 8 | |
BNY Mellon Global Absolute Return Fund | 76.1% | |
BNY Mellon Global Dynamic Bond Fund | 26.7% |
Name of undertaking | % of fund held by immediate parent (or by the Group where this varies) | Notes |
BNY Mellon Global Equity Fund | 27.28% | |
BNY Mellon Global Multi-Strategy Fund | 42.31% | |
BNY Mellon UK Opportunities Fund (Responsible) | 69.39% | |
BNY Mellon UK Income Fund | 20.84% | |
CG SCOTTISH WIDOWS LTAF | 9 | |
CG Scottish Widows Diversified Credit LTAF | 100% | |
CG Scottish Widows Growth LTAF | 100% | |
FRANKLIN TEMPLETON GLOBAL FUNDS PLC | 10 | |
FTGF Western Asset Multi-Asset Credit Fund | 55.36% | |
HBOS INTERNATIONAL INVESTMENT FUNDS ICVC | 11 | |
International Growth Fund | 62.89% | |
HBOS PROPERTY INVESTMENT FUNDS ICVC | 11 | |
UK Property Fund | 54.27% | |
HBOS SPECIALISED INVESTMENT FUNDS ICVC | 11 | |
Cautious Managed Fund | 48.02% | |
HBOS UK INVESTMENT FUNDS ICVC | 11 | |
UK Equity Tracker Fund | 54.14% | |
HLE ACTIVE MANAGED PORTFOLIO AUSGEWOGEN | 12 | |
HLE Active Managed Portfolio Ausgewogen | 48.93% | |
HLE ACTIVE MANAGED PORTFOLIO DYNAMISCH | 12 | |
HLE Active Managed Portfolio Dynamisch | 37.85% | |
HLE ACTIVE MANAGED PORTFOLIO KONSERVATIV | 12 | |
HLE Active Managed Portfolio Konservativ | 37.2% | |
INVESCO AMERICAN INVESTMENT SERIES | 13 | |
Invesco US Equity Fund | 35.7% | |
INVESCO FIXED INTEREST INVESTMENT SERIES | 13 | |
Invesco Global Bond Fund | 31.97% | |
LAZARD INVESTMENT FUNDS | 14 | |
Lazard Developing Markets Fund | 97.81% | |
MGI FUNDS PLC | 15 | |
Mercer Diversified Retirement Fund | 71.23% | |
Mercer Long Term Growth Fund | 54.23% | |
Mercer Multi Asset Defensive Fund | 39.25% | |
Mercer Multi Asset Growth Fund | 55.27% |
Name of undertaking | % of fund held by immediate parent (or by the Group where this varies) | Notes |
Mercer Multi Asset High Growth Fund | 48.82% | |
Mercer Multi Asset Moderate Growth Fund | 58.05% | |
Mercer Passive Sustainable Global Equity Feeder Fund | 59.83% | |
MORGAN STANLEY INVESTMENT FUNDS | 16 | |
Global Credit Fund | 46.72% | |
NORDEA 1, SICAV | 17 | |
Nordea 1 – GBP Diversified Return Fund | 29.02% | |
RETAIL AUTHORISED UNIT TRUSTS | 5 | |
BlackRock Balanced Growth Portfolio Fund | 37.6% | |
ROYAL LONDON EQUITY FUNDS ICVC | 18 | |
Royal London UK Equity Income Fund | 20.62% | |
SCHRODER FUNDS ICAV | 19 | |
Schroder Sterling Liquidity Fund | 93% | |
Schroder Sterling Short Duration Bond Fund | 97.83% | |
SCHRODER INTERNATIONAL SELECTION FUND | 20 | |
Emerging Market Bond | 65.41% | |
Sustainable Emerging Market Synergy | 28.36% | |
SCHRODER UNIT TRUSTS LIMITED | 21 | |
Schroder Global ex UK Equity Tracker Component Fund | 27.34% | |
SCOTTISH WIDOWS INCOME AND GROWTH FUNDS ICVC | 3 | |
Balanced Growth Fund | 29.16% | |
Corporate Bond 1 Fund | 82.56% | |
Corporate Bond PPF Fund | 100% | |
ESG-Tilted Sterling Corporate Bond Fund | 81.87% | |
Global Tactical Asset Allocation 1 Fund | 84.67% | |
Progressive Growth Fund | 41.79% | |
UK Index Linked Gilt Fund | 100% | |
SCOTTISH WIDOWS INVESTMENT SOLUTIONS FUNDS ICVC | 3 | |
Corporate Bond Fund | 69.2% | |
Developed Asia Pacific (ex Japan ex Korea) Equity Tracker Fund | 100% | |
Developed Europe (ex UK) Equity Tracker Fund | 95.96% | |
Developed Government Bond Tracker Fund | 73.96% | |
Developed Markets Tilted Equity Tracker Fund | 72.69% | |
Emerging Markets Tilted Equity Tracker Fund | 94.56% | |
Fundamental Index Emerging Markets Equity Fund | 94.57% | |
Fundamental Index Global Equity Fund | 92.5% | |
Gilt Fund | 94.93% | |
Global Environmental Solutions Fund | 93.64% | |
High Income Bond Fund | 65.99% | |
Japan Equity Fund | 99.19% | |
Strategic Income Fund | 67.04% | |
US Equity Fund | 97.09% | |
SCOTTISH WIDOWS MANAGED INVESTMENT FUNDS ICVC | 3 | |
Balanced Growth Portfolio | 26.8% | |
Cash Fund | 99.59% | |
International Equity Tracker Fund | 78.14% | |
Progressive Growth Portfolio 1 | 45.07% | |
SCOTTISH WIDOWS OVERSEAS GROWTH INVESTMENT FUNDS ICVC | 3 | |
Global Growth Fund | 76.22% | |
Global Select Growth Fund | 50.69% |
Name of undertaking | % of fund held by immediate parent (or by the Group where this varies) | Notes |
SCOTTISH WIDOWS TRACKER AND SPECIALIST INVESTMENT FUNDS ICVC | 3 | |
Emerging Markets Fund | 77.55% | |
UK Equity Tracker Fund | 66.64% | |
UK Fixed Interest Tracker Fund | 62.05% | |
UK Index-Linked Tracker Fund | 52.05% | |
UK Tracker Fund | 42.11% | |
SCOTTISH WIDOWS UK AND INCOME INVESTMENT FUNDS ICVC | 3 | |
Environmental Investor Fund | 75.41% | |
SEI GLOBAL ASSETS FUND PLC | 22 | |
The SEI Core Fund | 71.48% | |
The SEI Defensive Fund | 60.66% | |
The SEI Moderate Fund | 83.28% | |
SEI GLOBAL MASTER FUND PLC | 23 | |
The SEI Factor Allocation Global Equity Fund | 92.7% | |
SPW INVESTMENT PORTFOLIO ICVC | 24 | |
Schroders Personal Wealth IPS Growth Portfolio | 49.86% | |
Schroders Personal Wealth IPS Income Portfolio | 55.61% | |
SSGA | 25 | |
State Street AUT Emerging Market Screened Index Equity Fund | 99.63% | |
THE SVS LEVITAS FUNDS | 26 | |
SVS Levitas A Fund | 88.84% | |
SVS Levitas B Fund | 85.74% | |
UNIVERSE, THE CMI GLOBAL NETWORK FUND | 27 | |
CMI Continental European Equity | 97.68% | |
CMI Pacific Basin Enhanced Equity | 79.29% | |
CMI UK Equity | 73.03% | |
CMI US Enhanced Equity | 91.87% | |
CMI US Equity Index Tracking | 44.95% | |
CMIG Access 70% Flexible | 100% | |
CMIG Access 80% | 100% | |
CMIG Access 80% Flexible | 100% | |
CMIG Access 90% Flexible | 100% | |
CMIG Focus Euro Bond | 100% | |
WS RUFFER MANAGED FUNDS | 28 | |
WS Ruffer Diversified Return Fund | 23.17% |
 | ||
 |
