
Indicate by check mark whether the registrant by furnishing the information contained in this Form is also thereby furnishing the information to the Commission pursuant to Rule 12g3-2(b) under the Securities Exchange Act of 1934.
Yes _______ No ___X____.
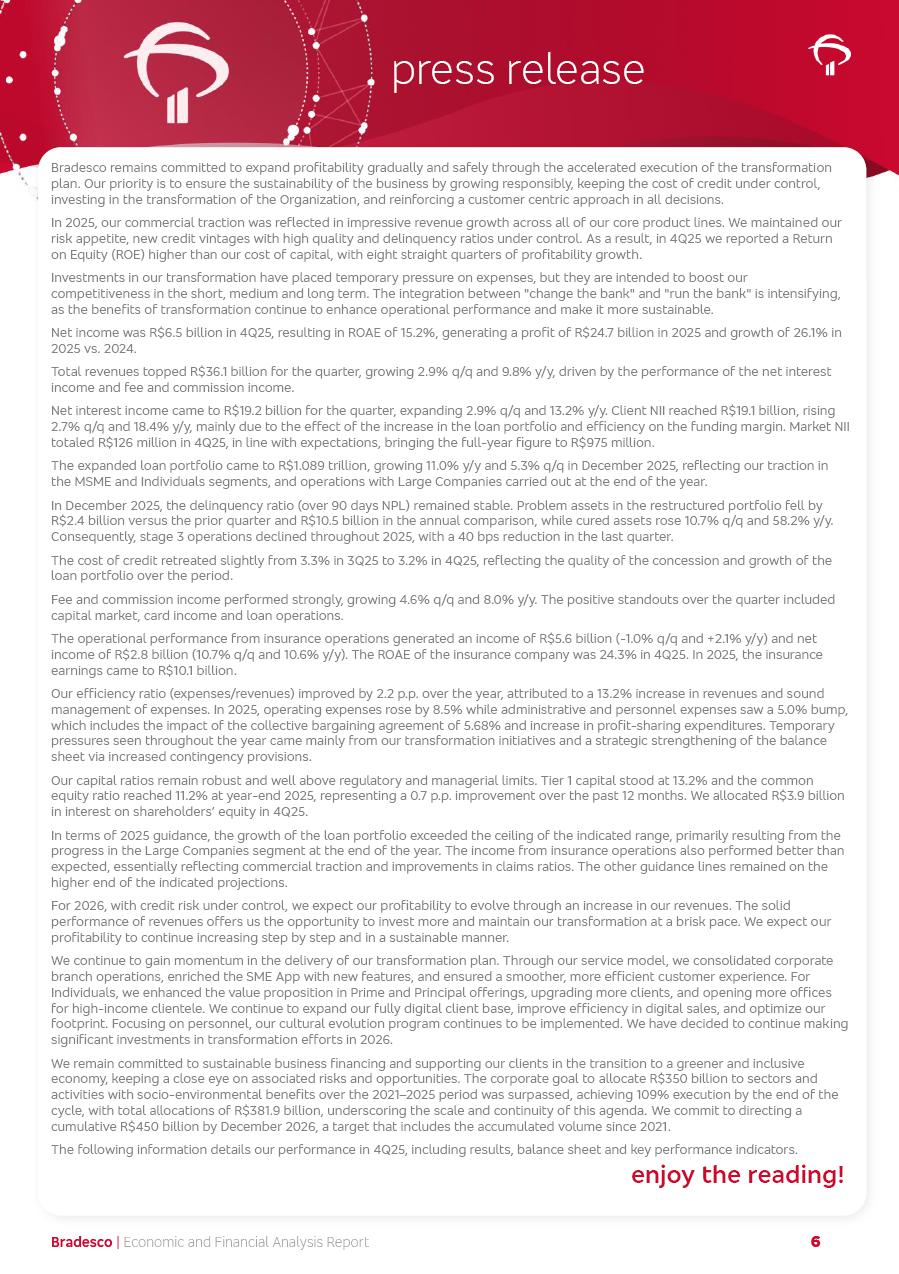
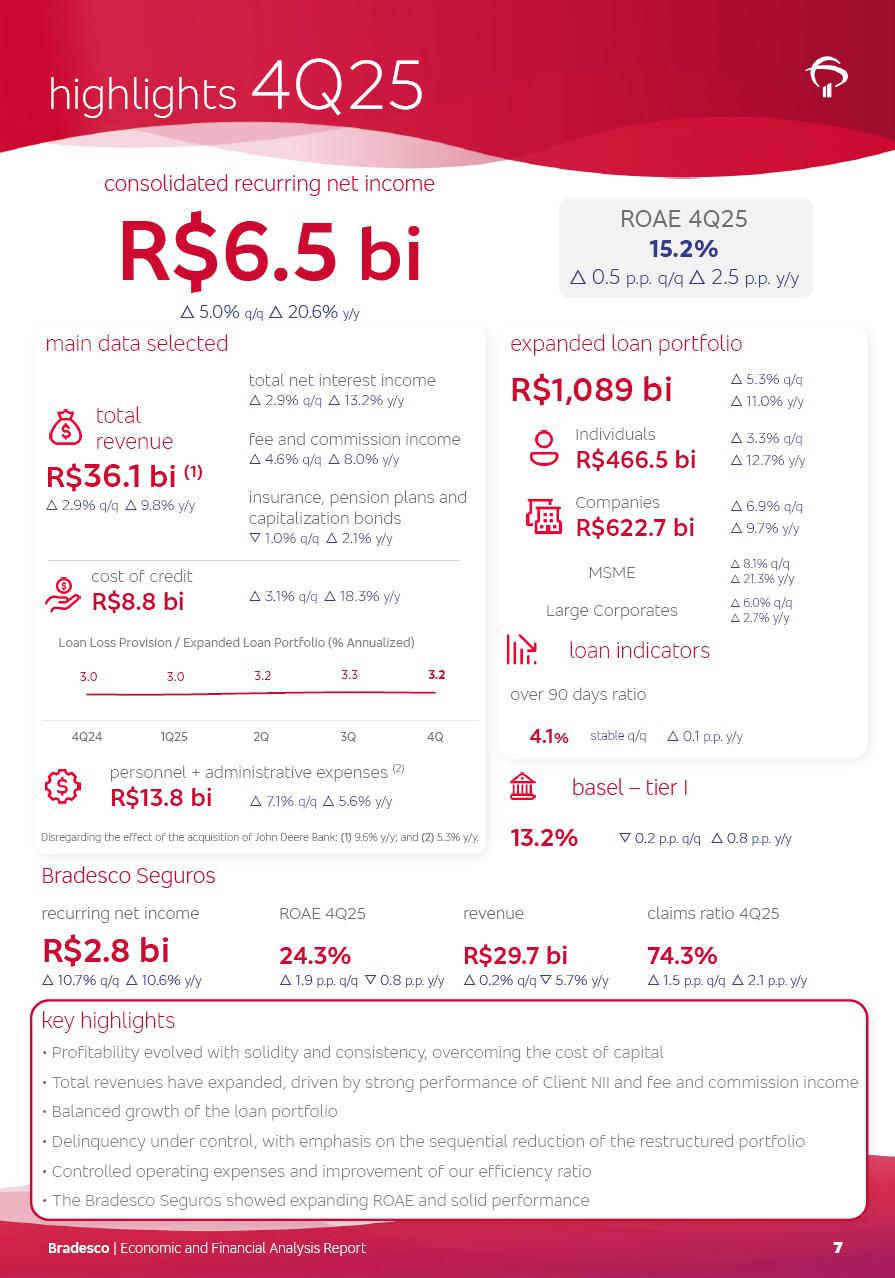
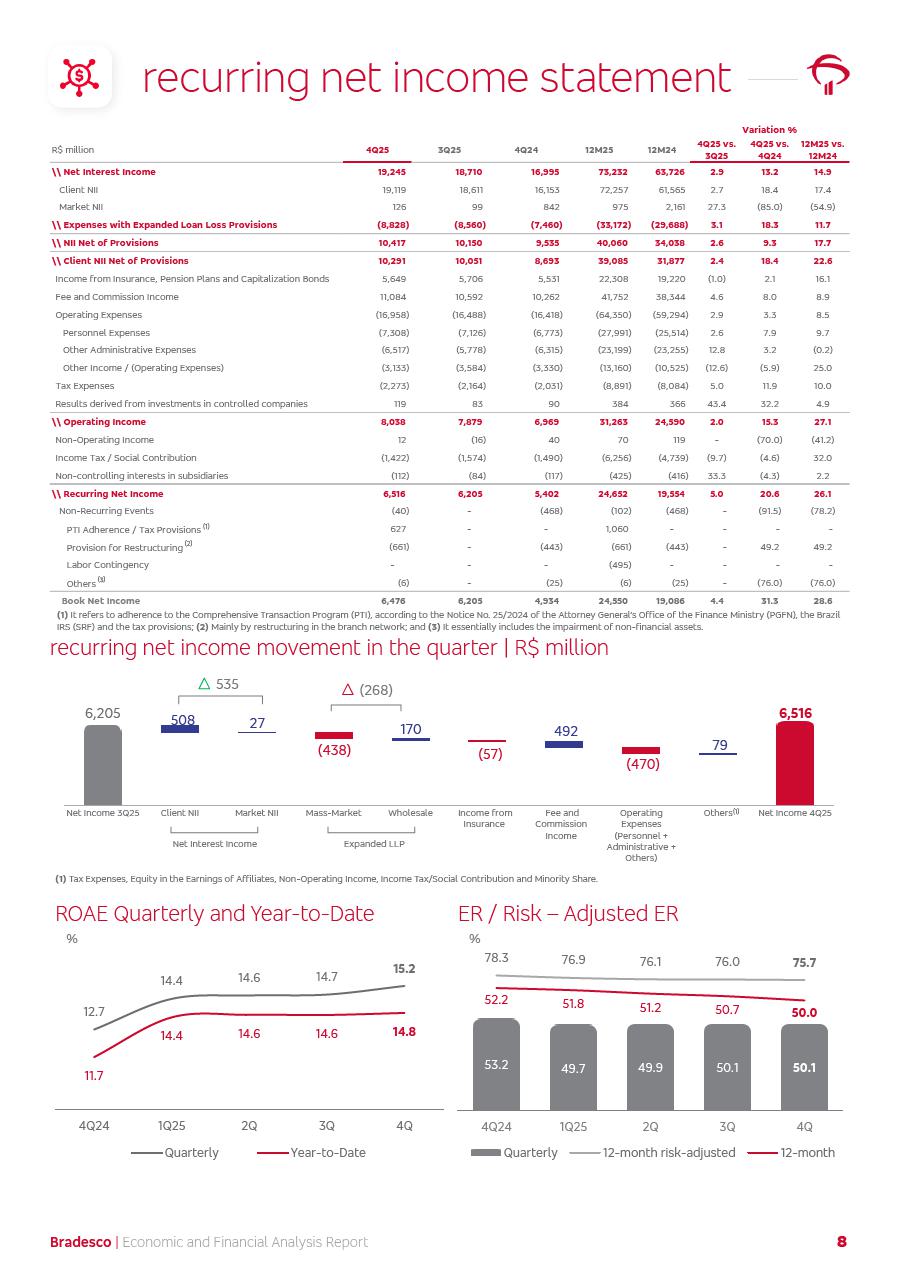
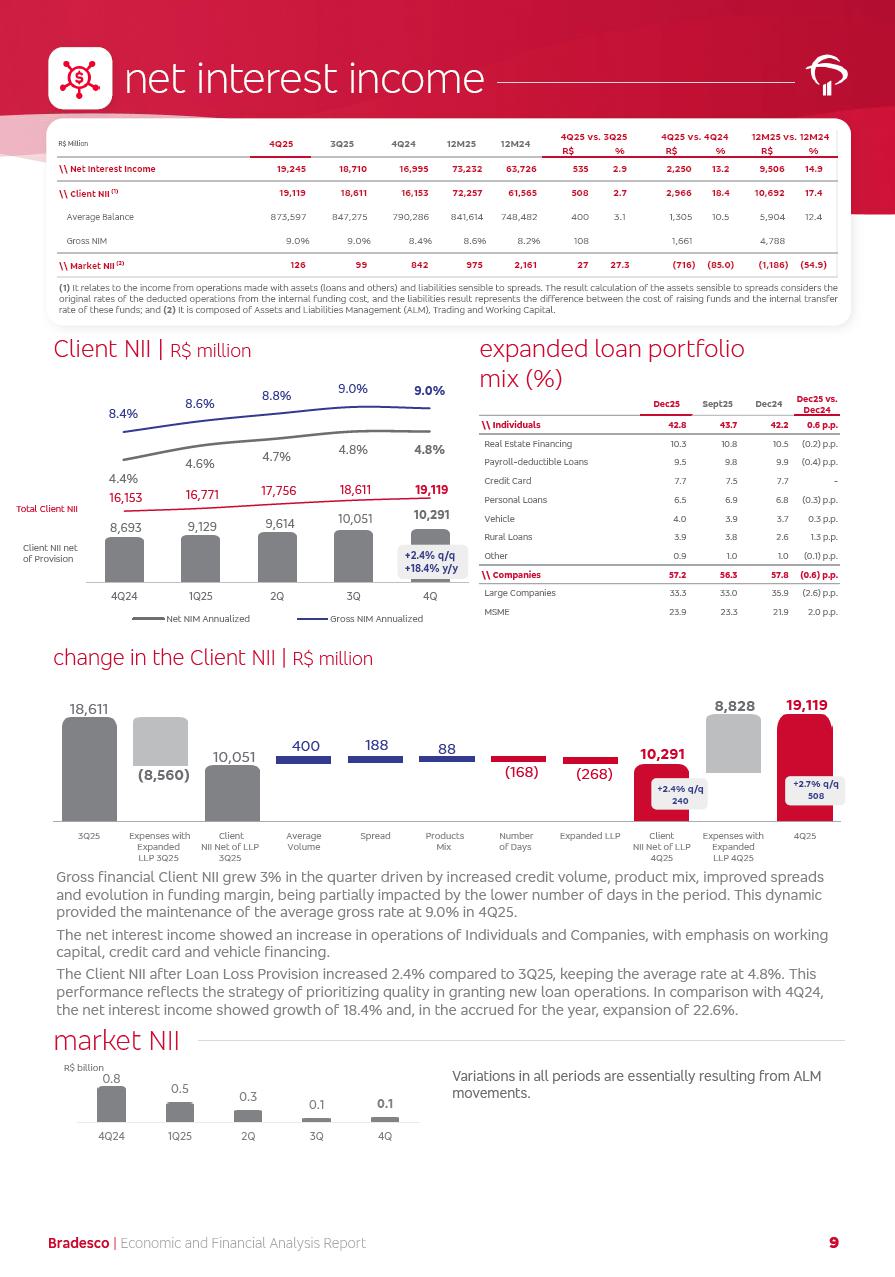
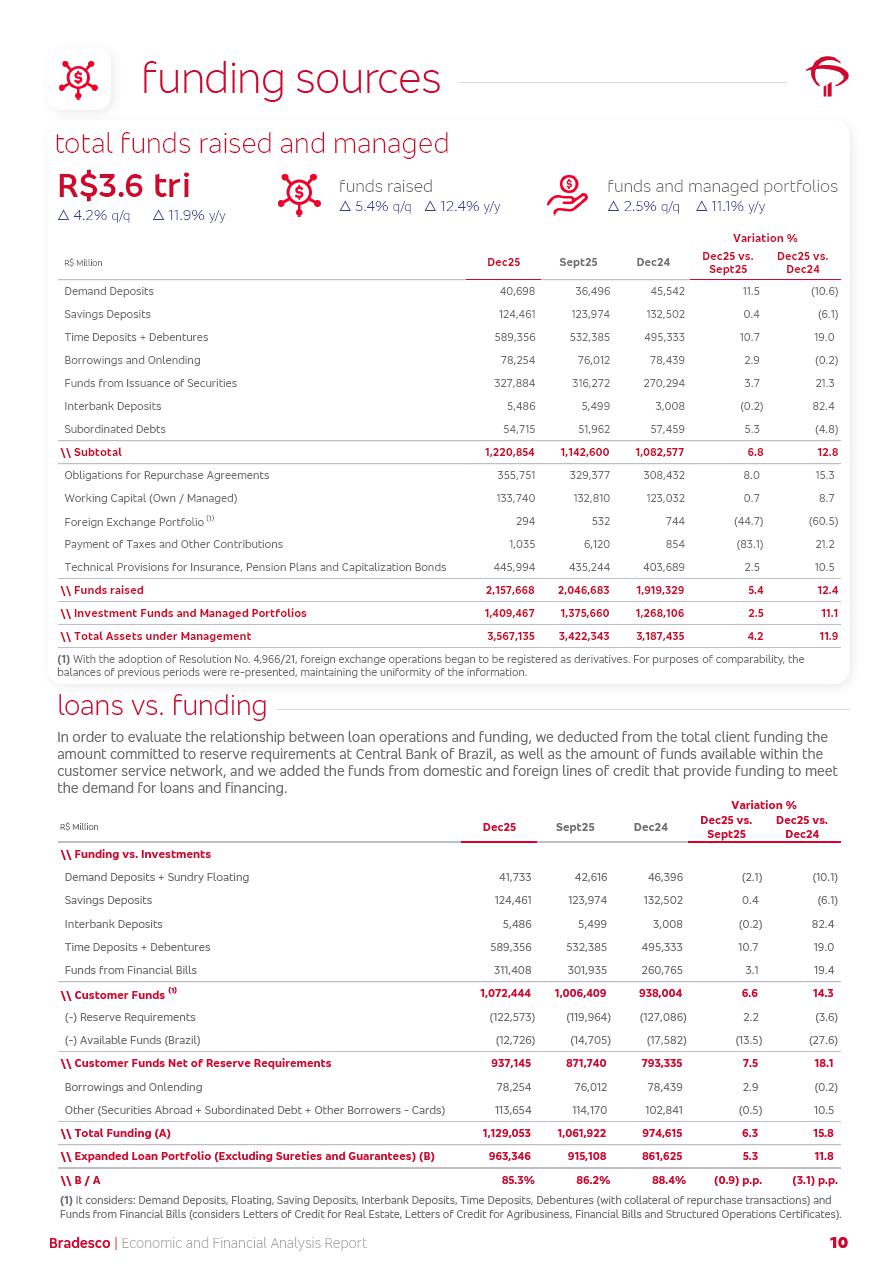
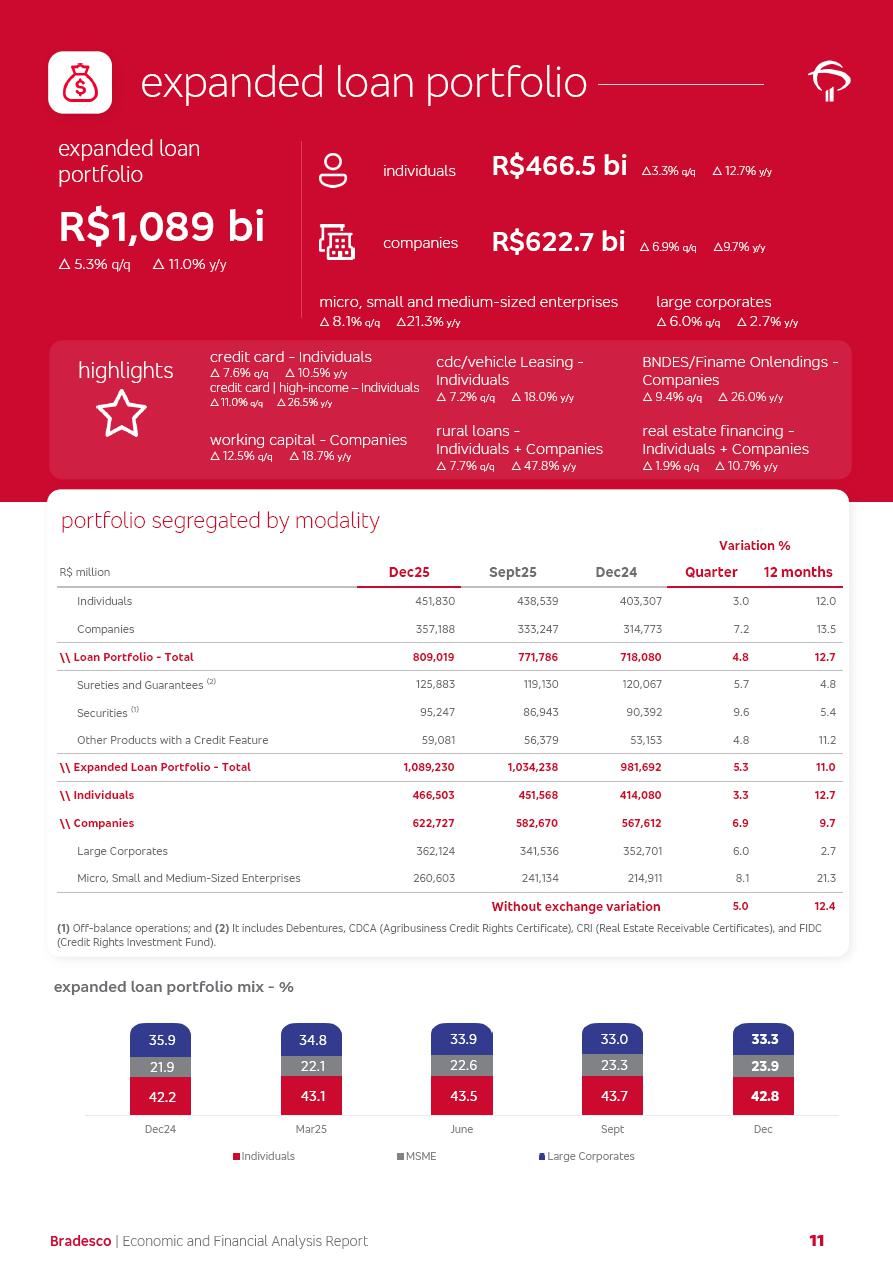
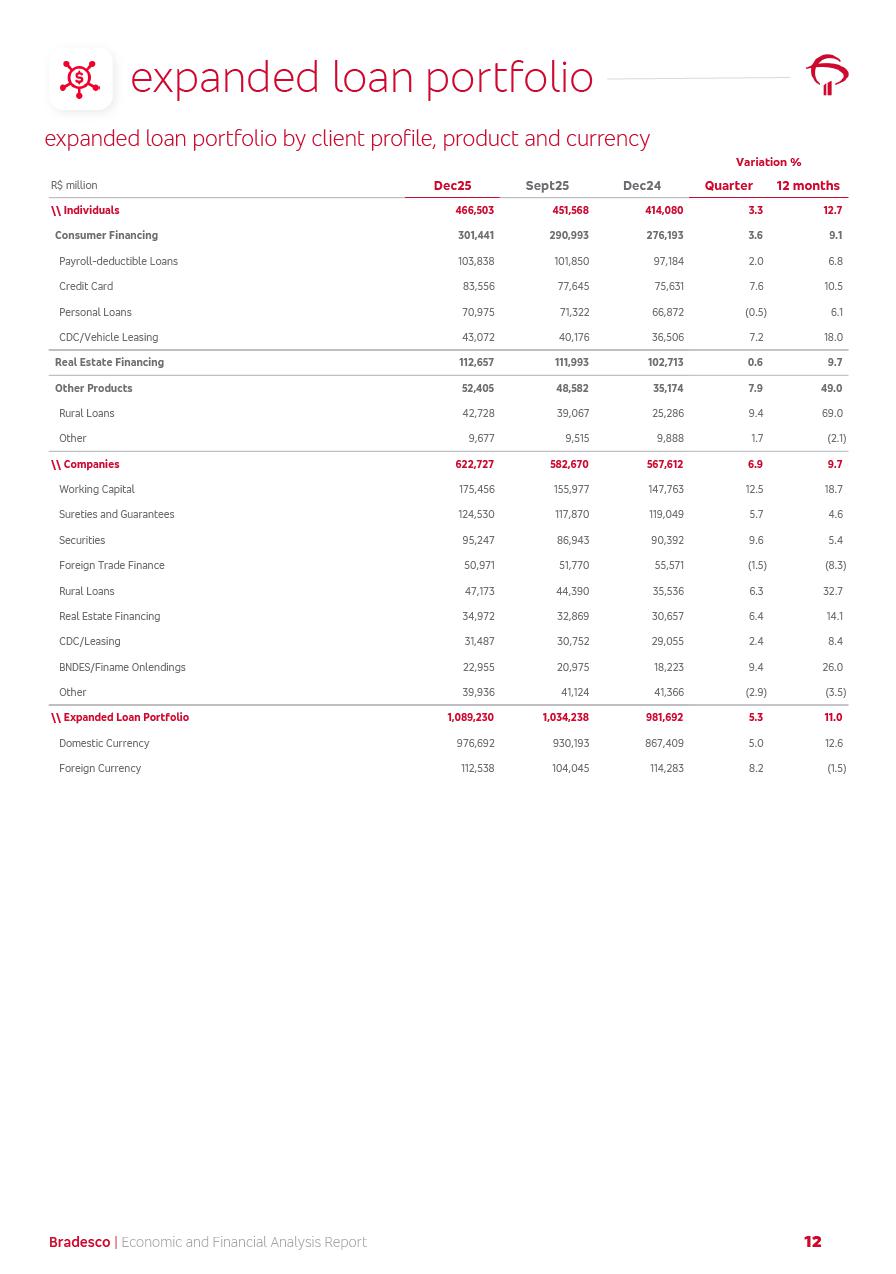
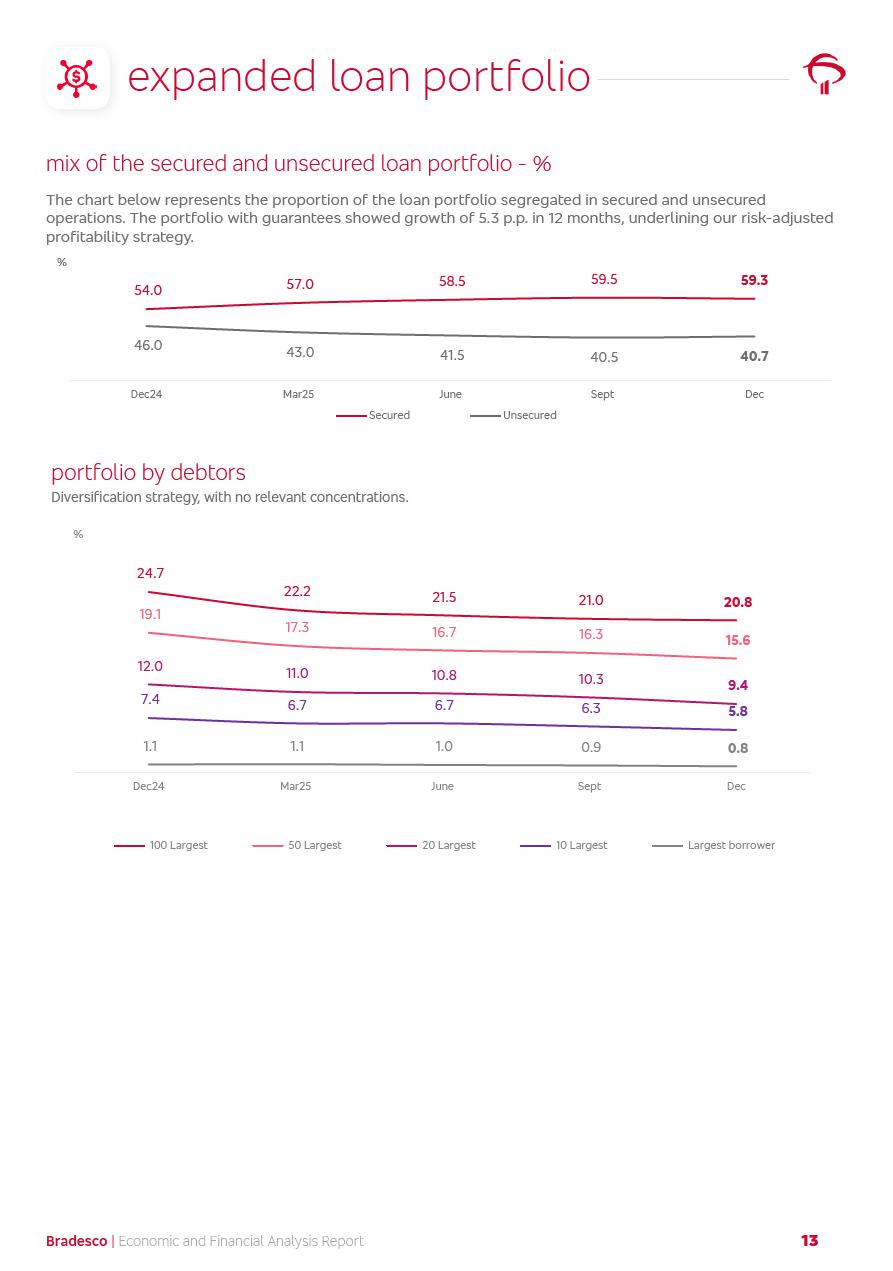
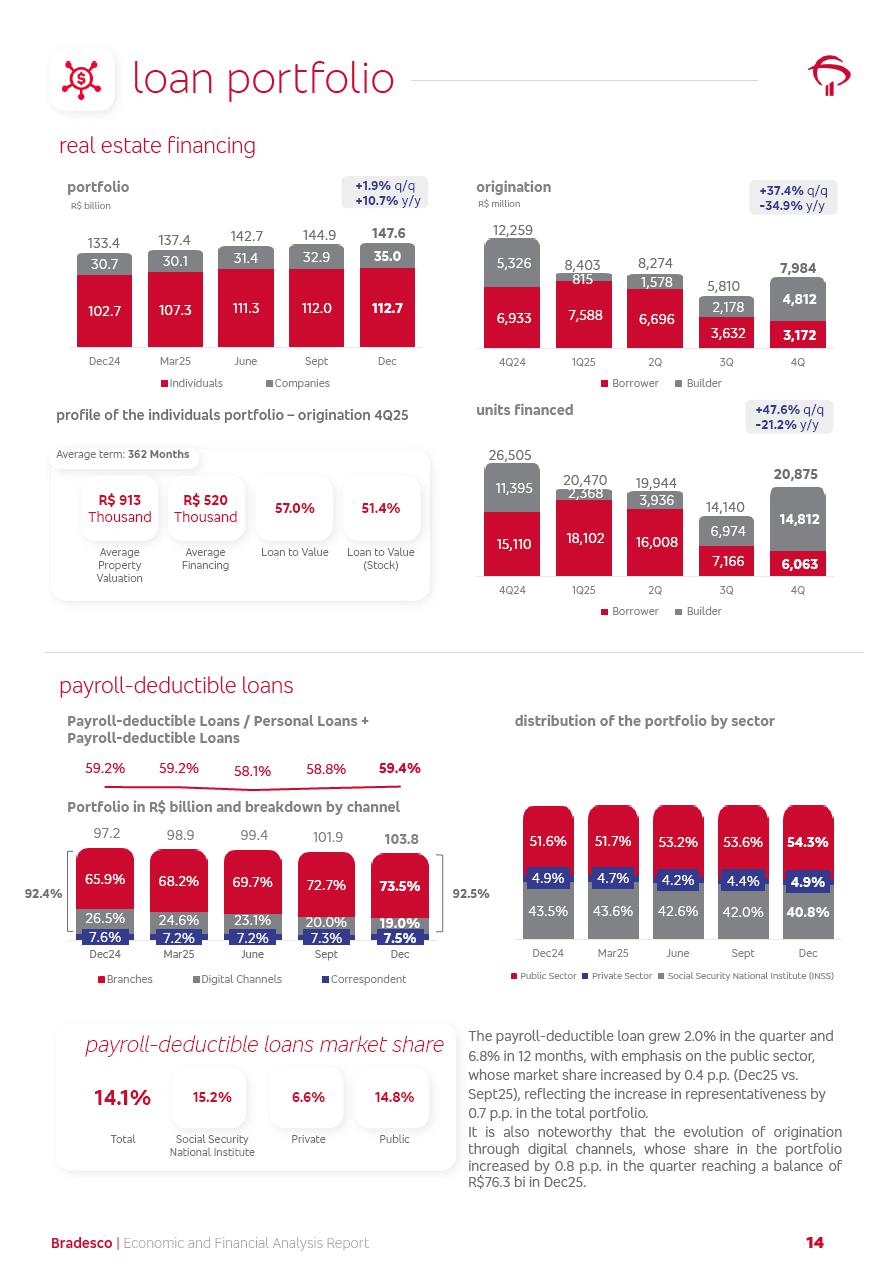
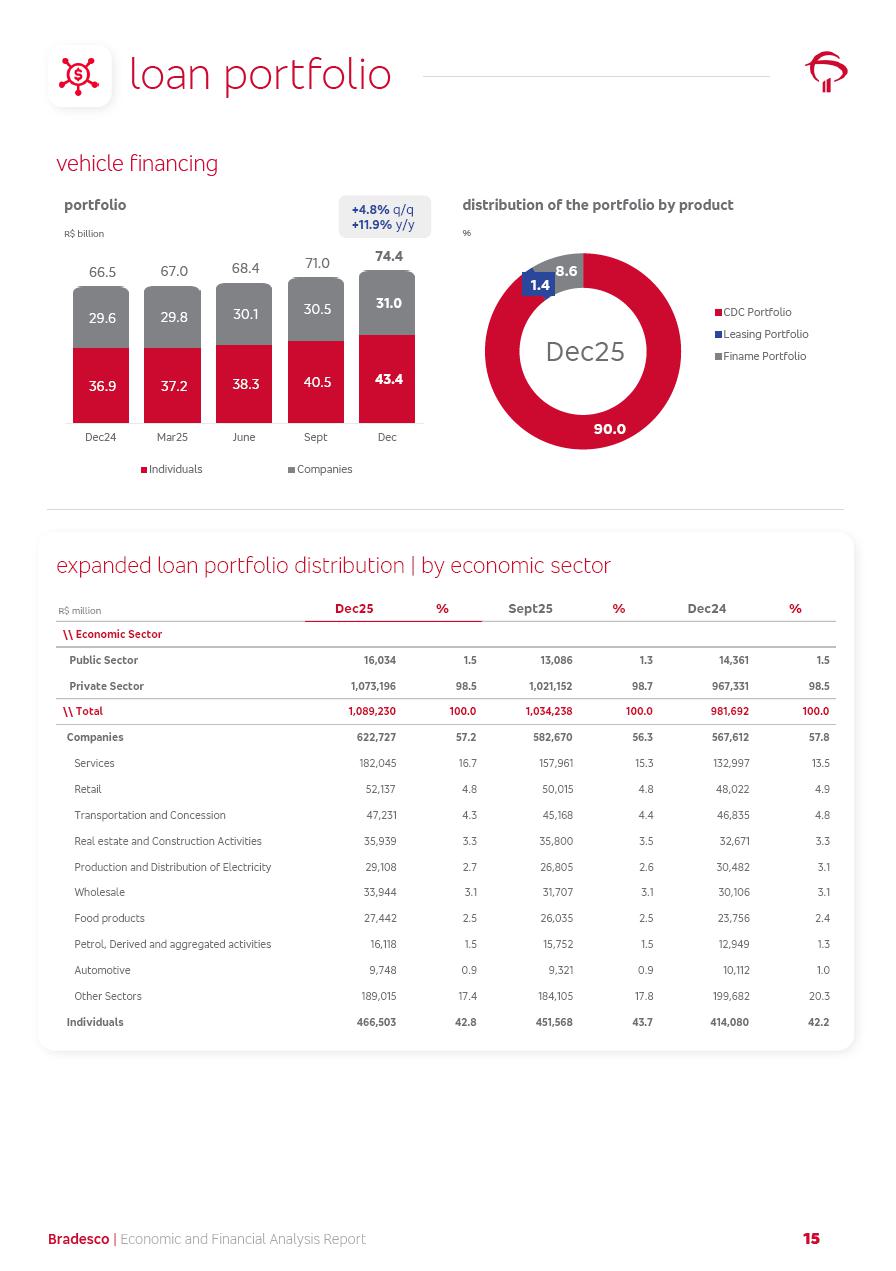
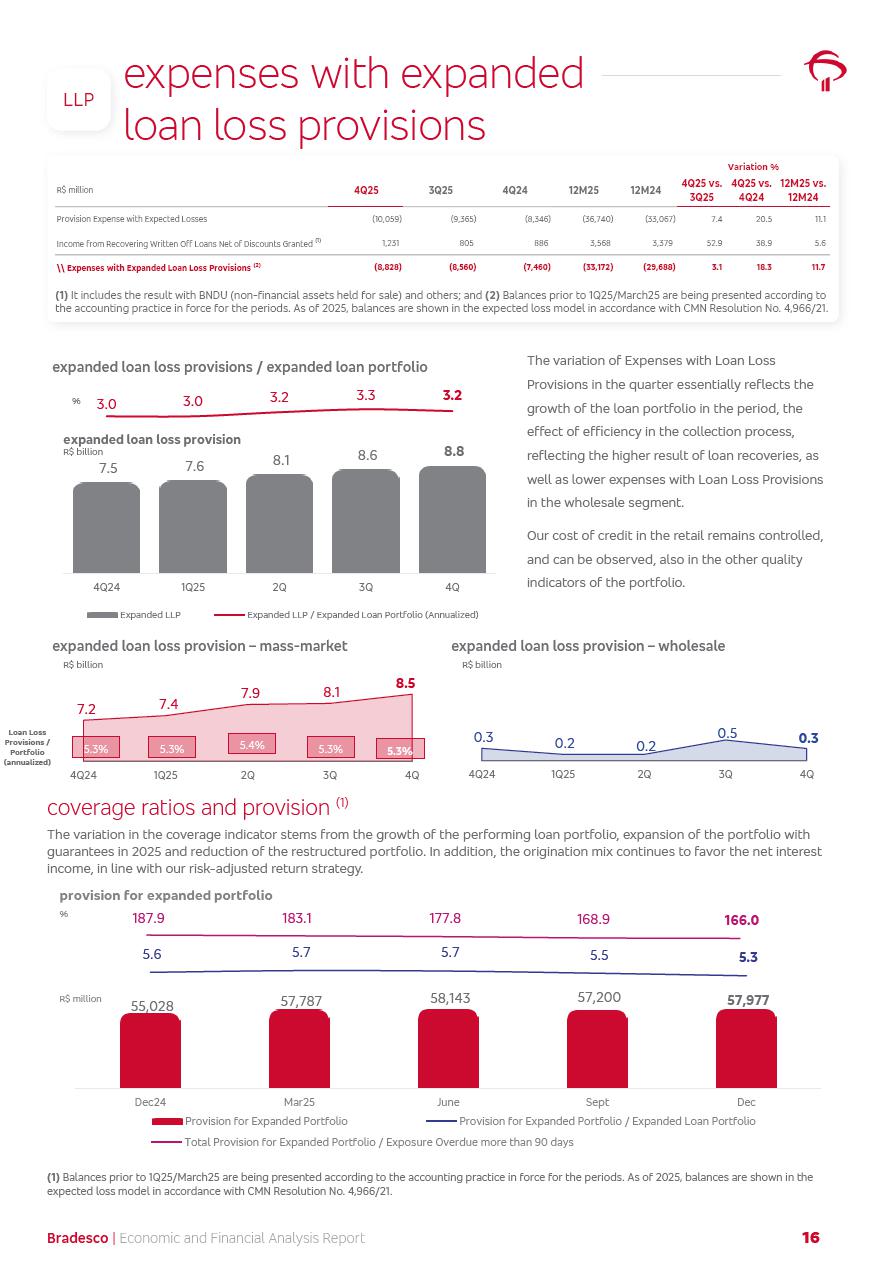
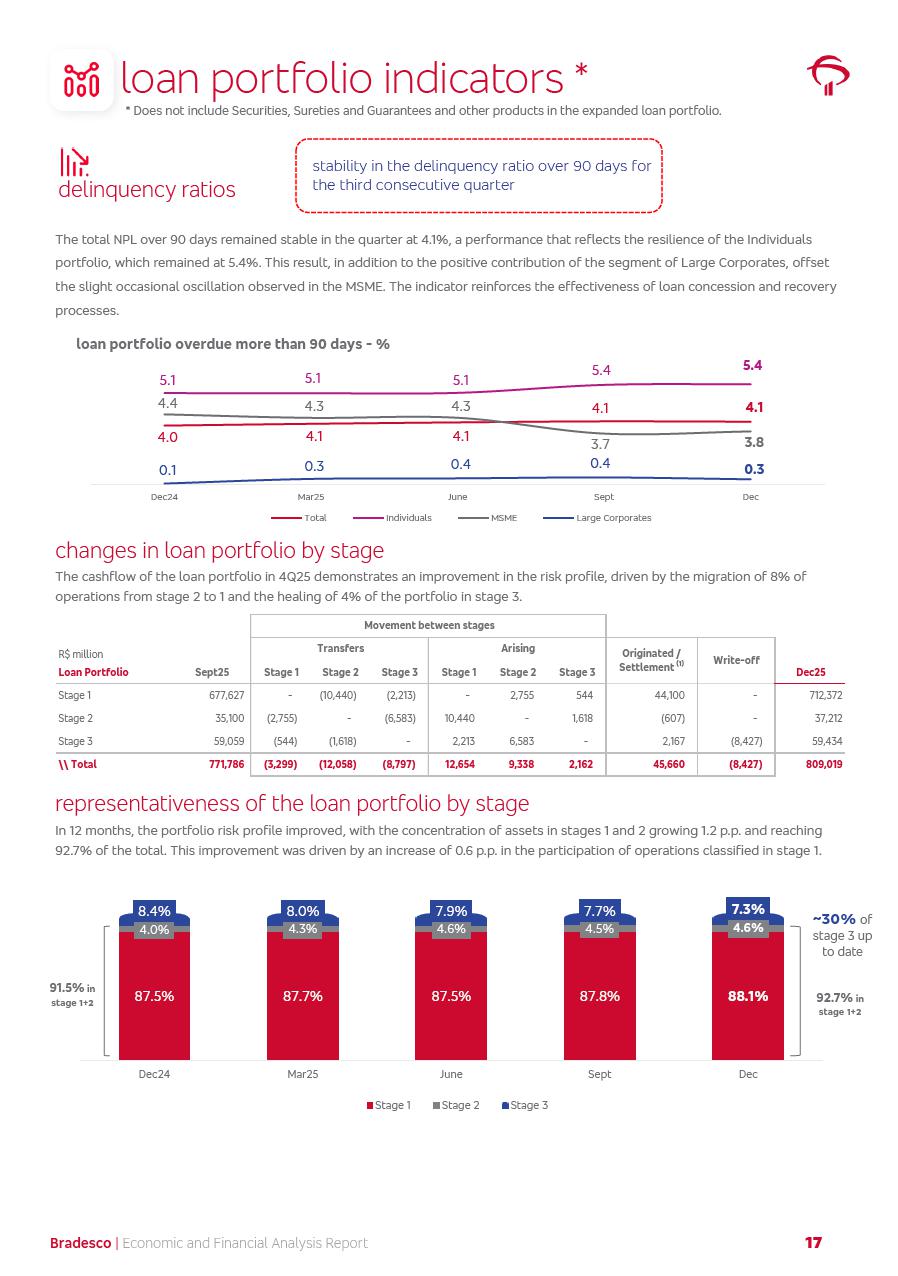
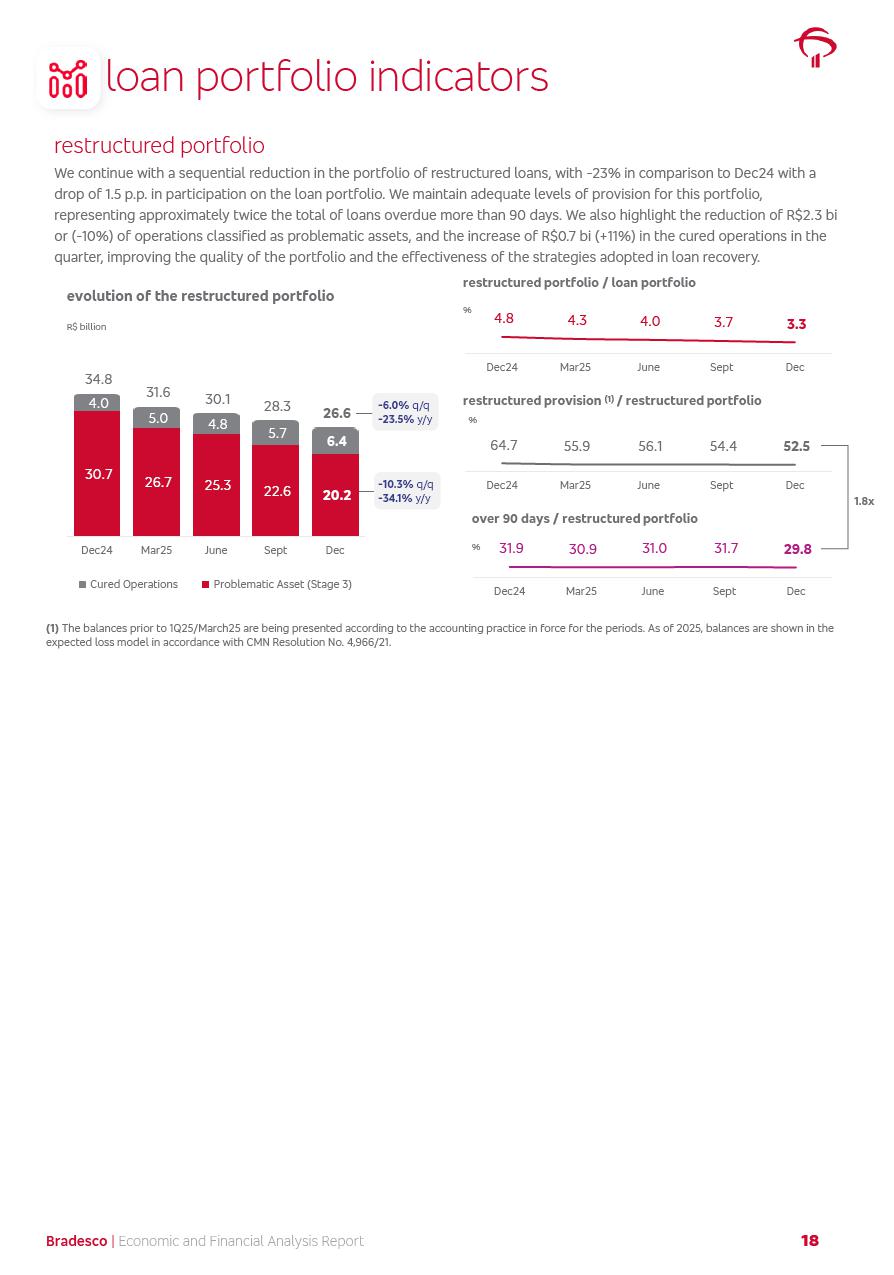
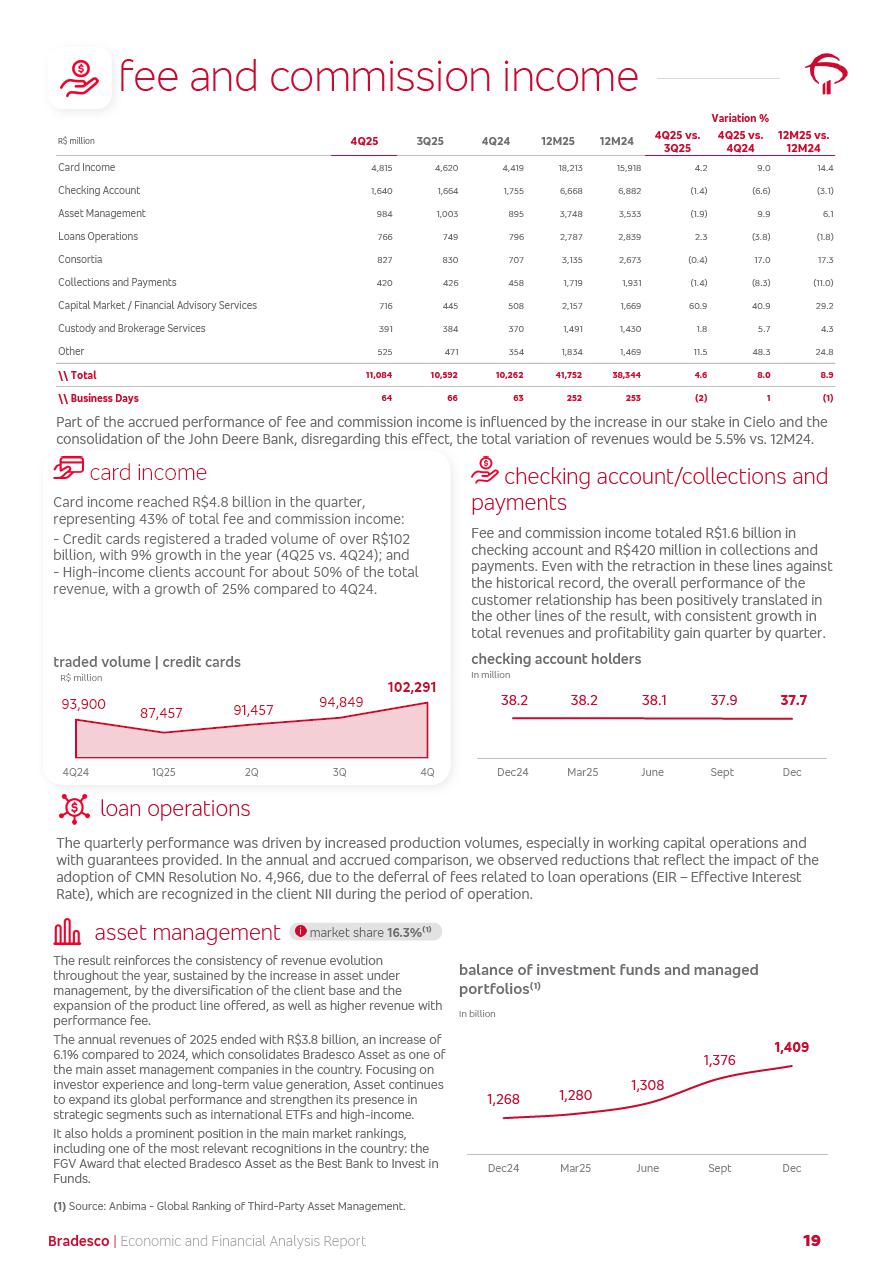
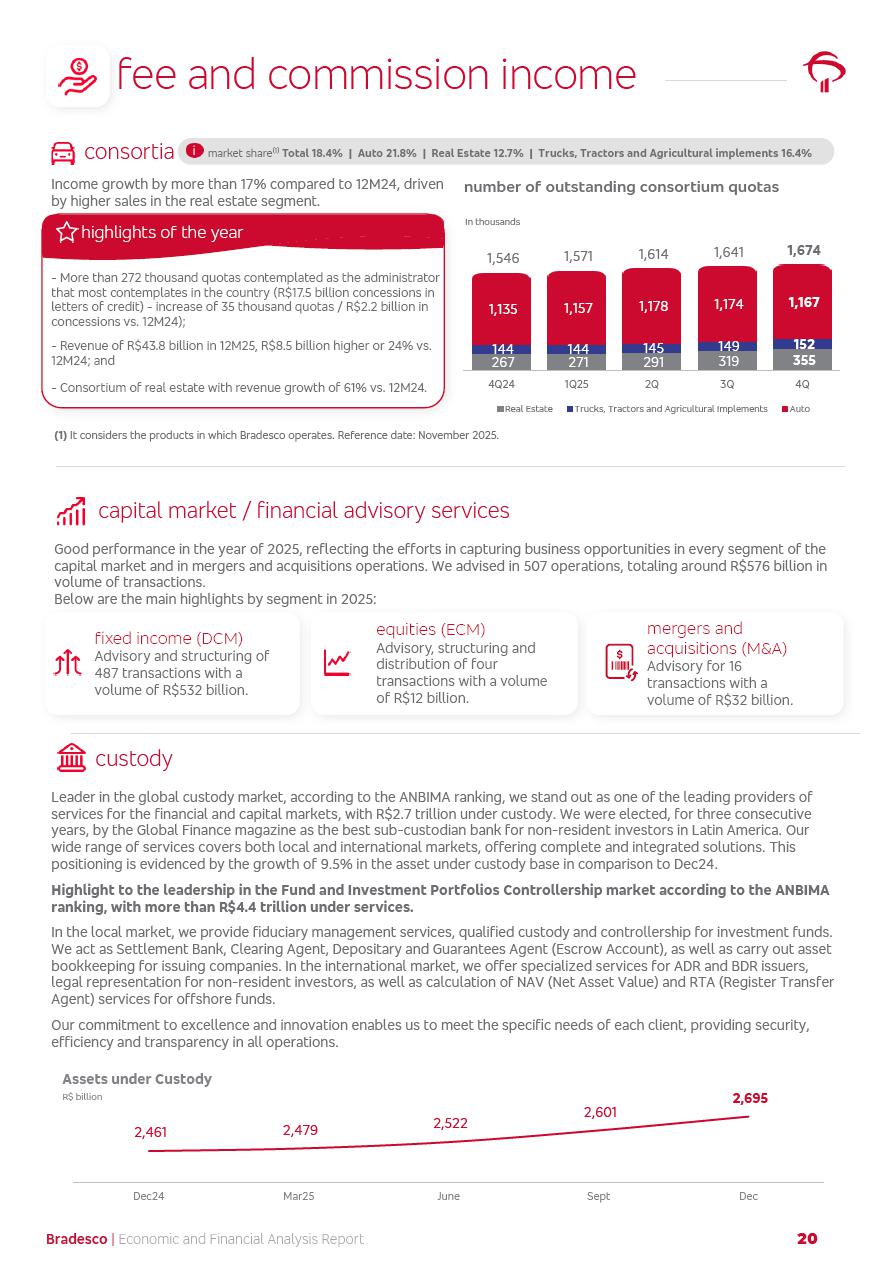
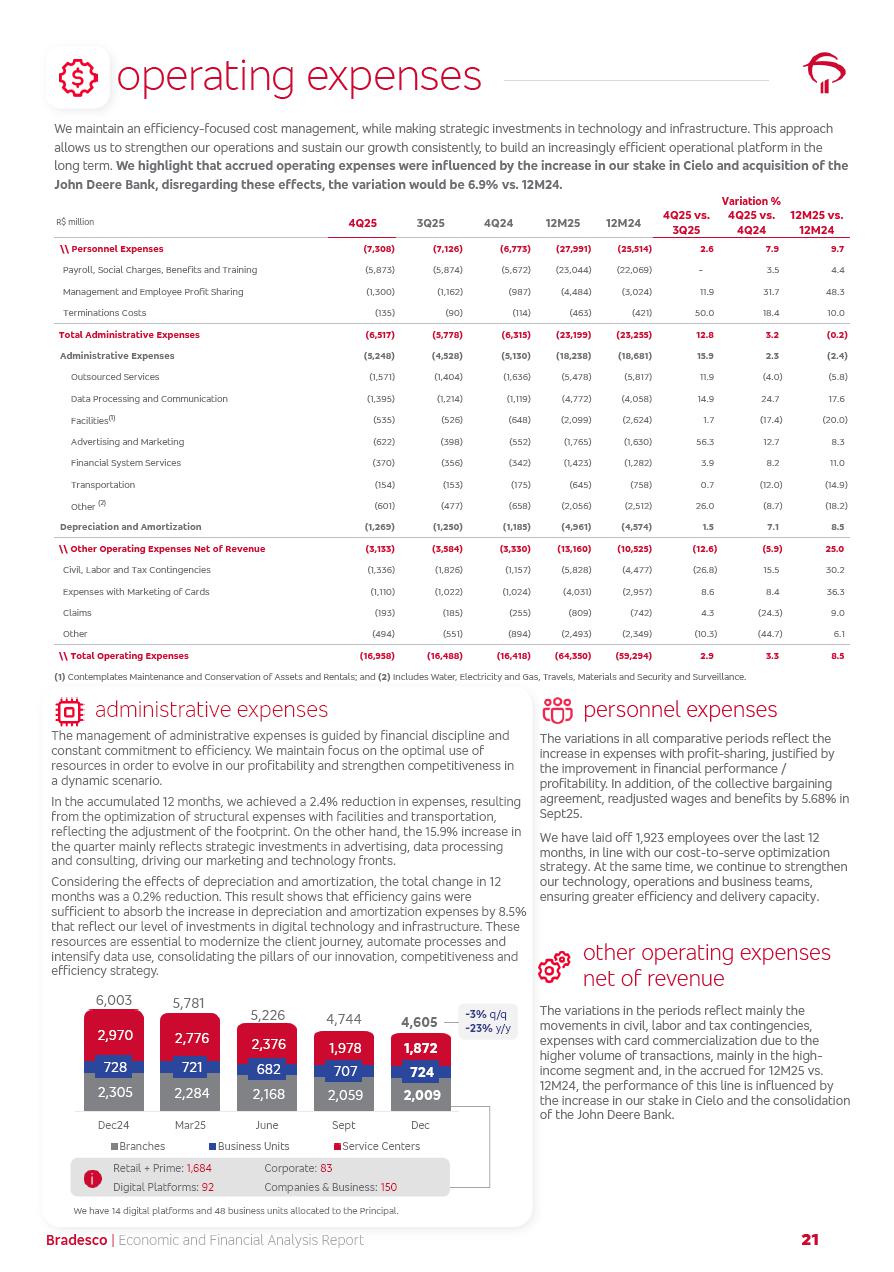
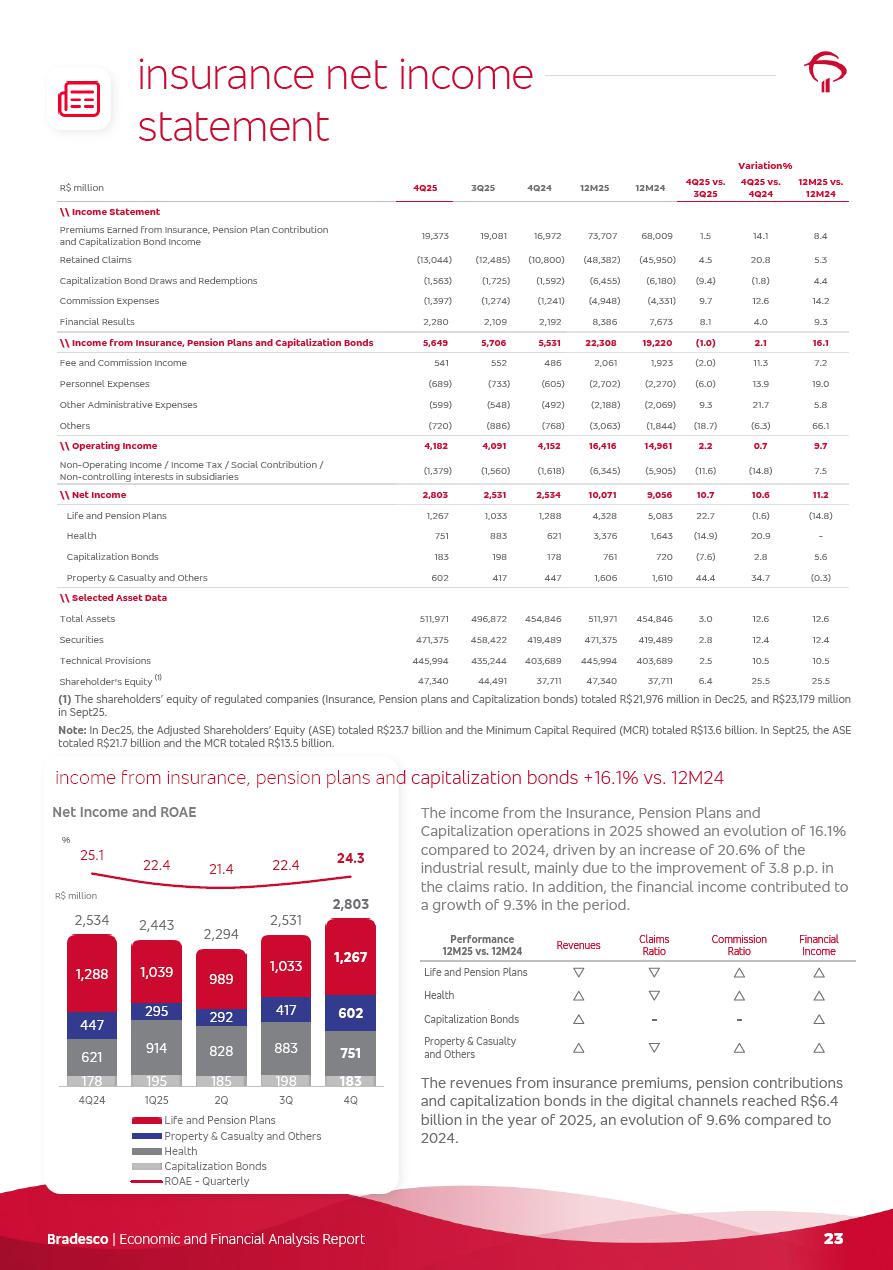
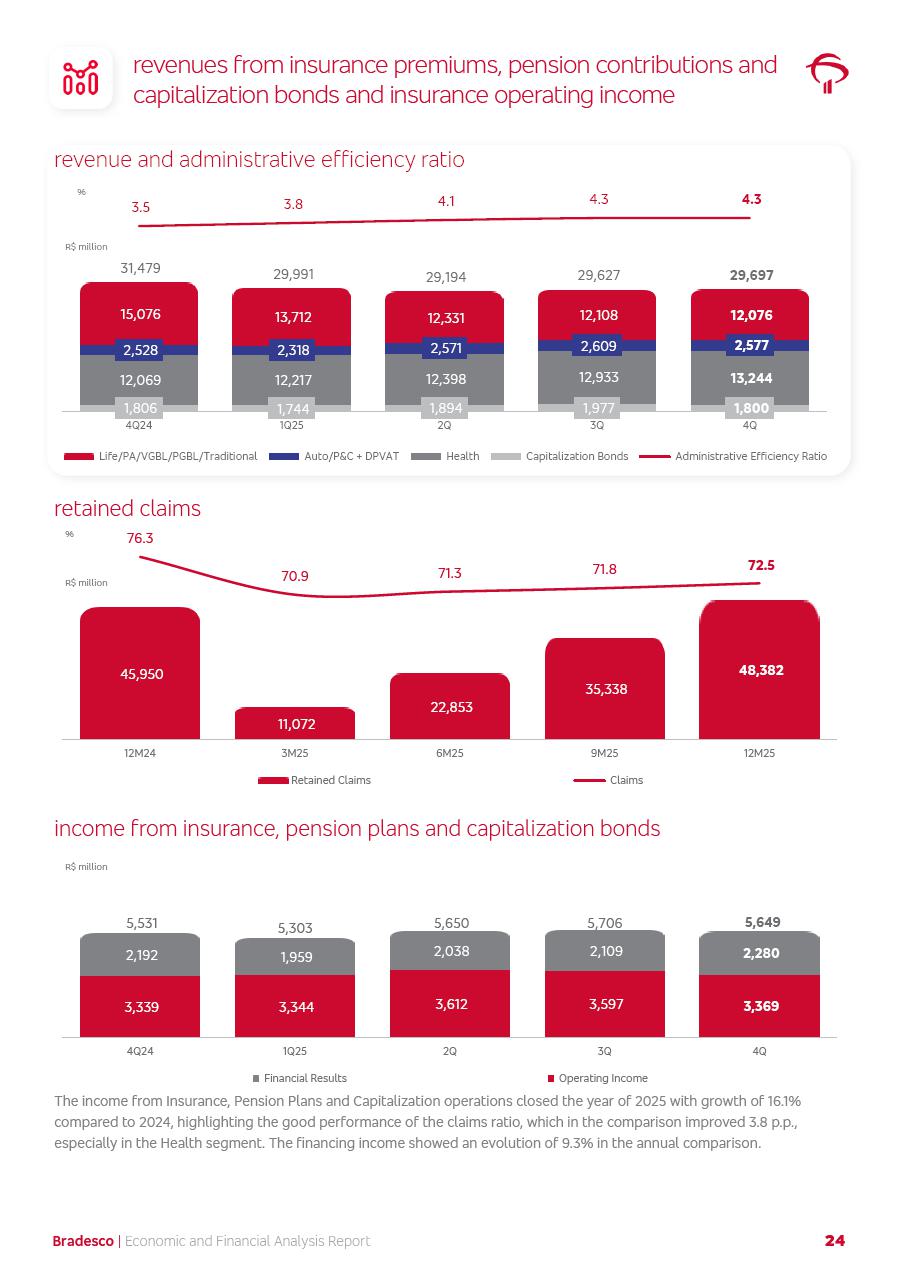
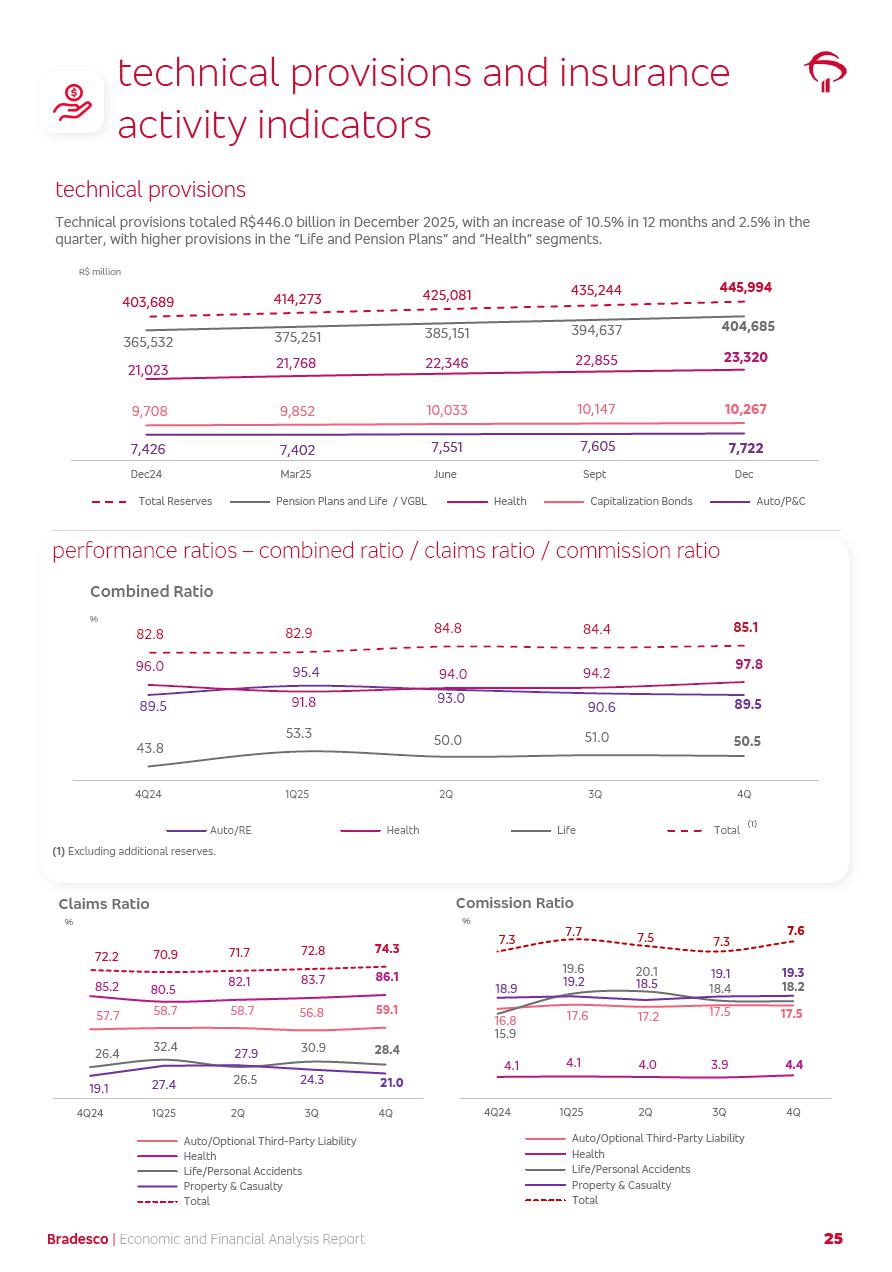
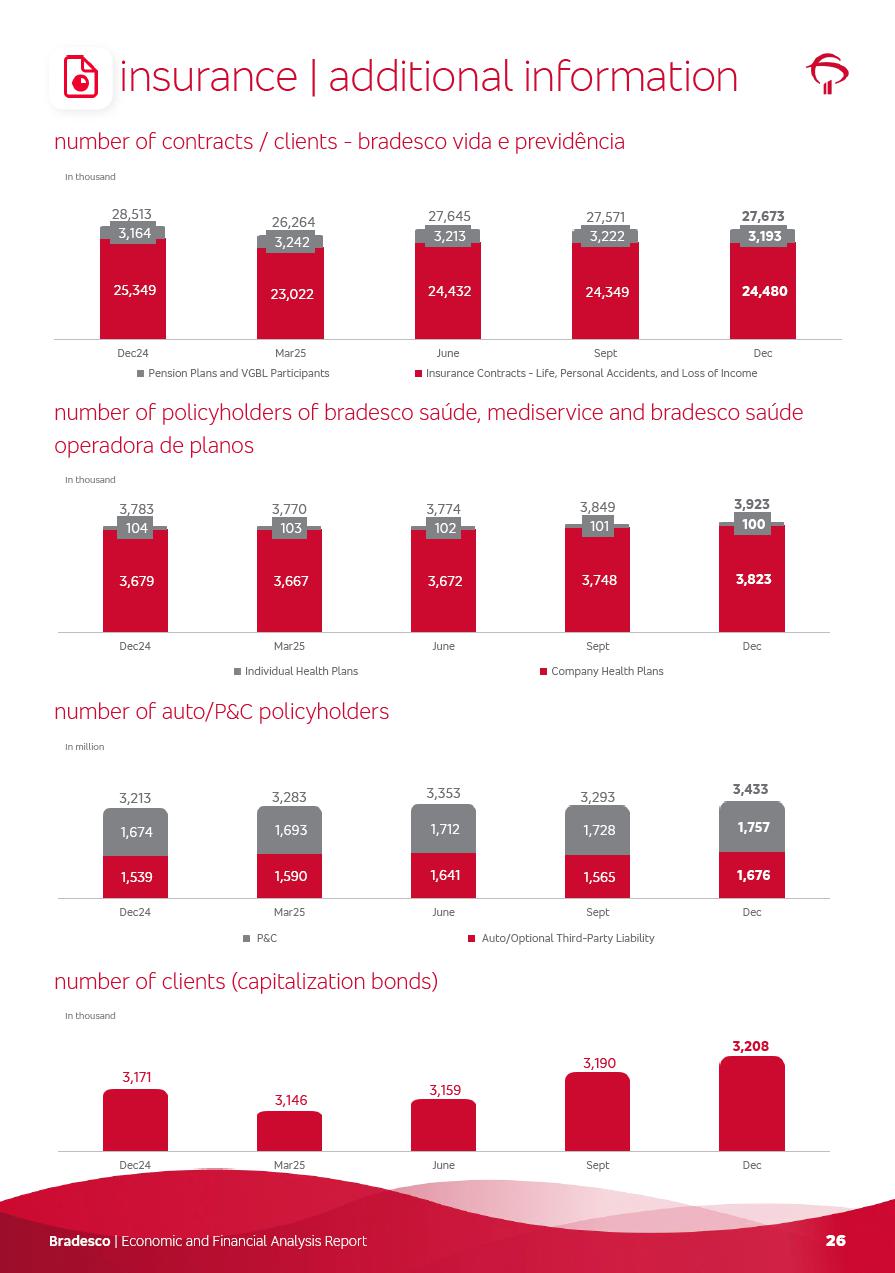
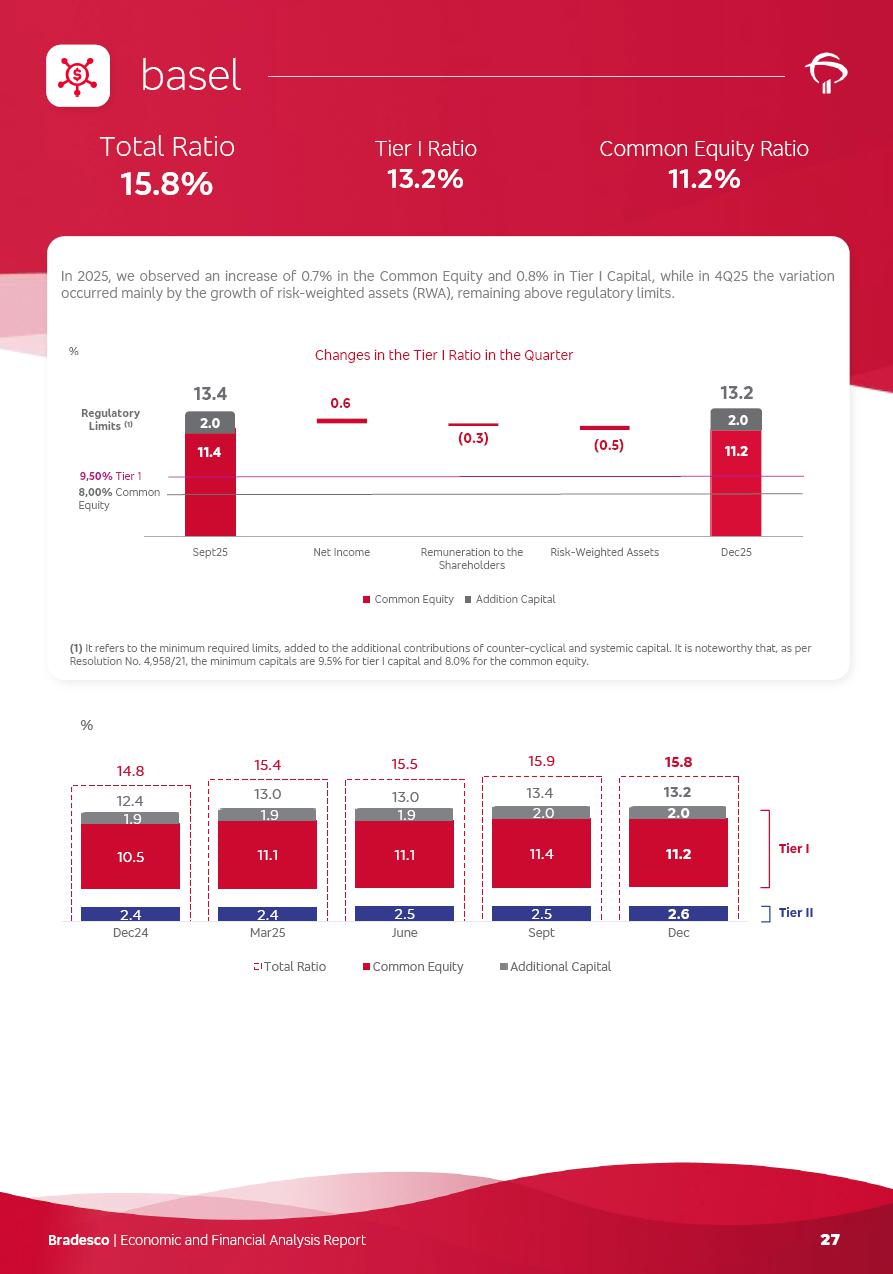
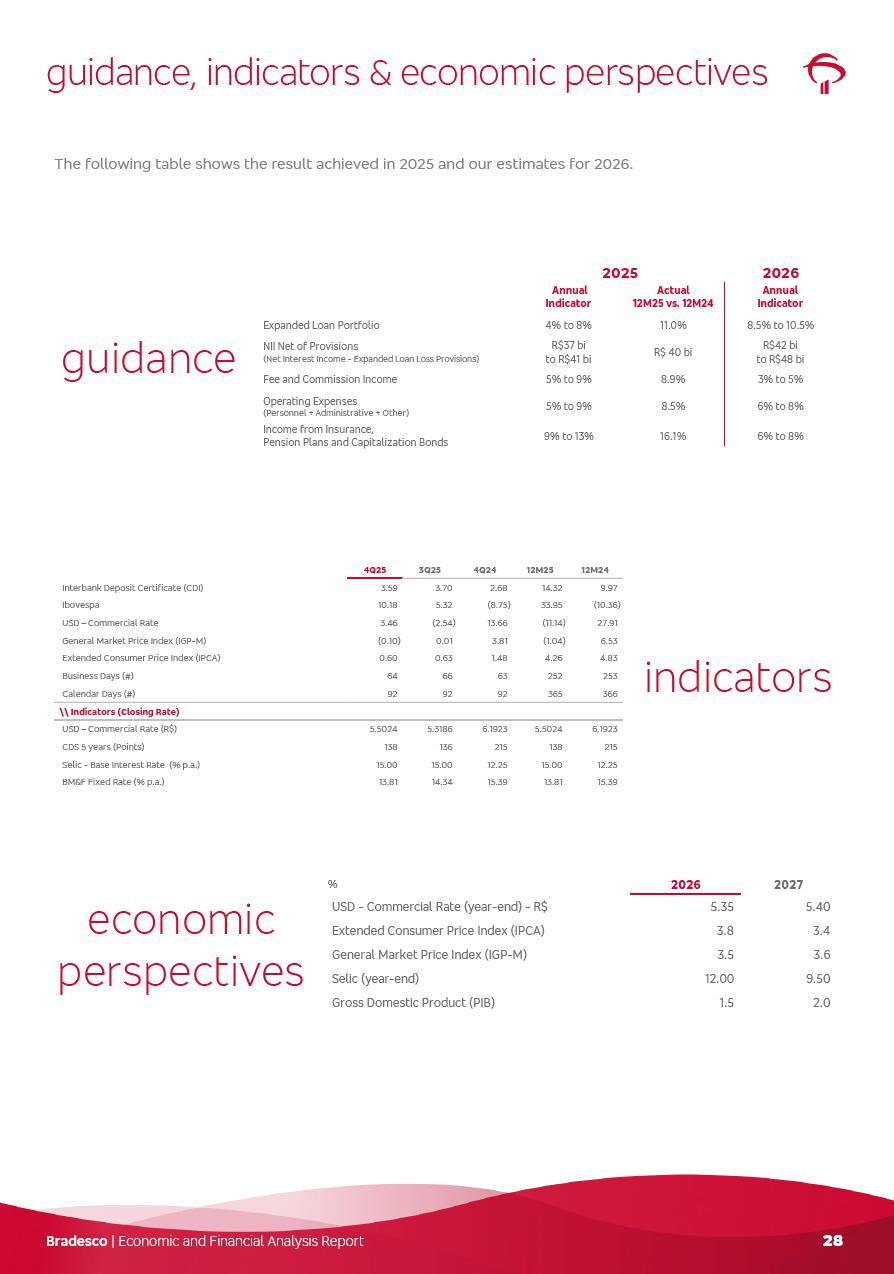
Managerial Analysis of Results Bradesco | Economic and Financial Analysis Report 6 press release Bradesco remains committed to expand profitability gradually and safely through the accelerated execution of the transformation plan. Our priority is to ensure the sustainability of the business by growing responsibly, keeping the cost of credit under control, investing in the transformation of the Organization, and reinforcing a customer centric approach in all decisions. In 2025, our commercial traction was reflected in impressive revenue growth across all of our core product lines. We maintained our risk appetite, new credit vintages with high quality and delinquency ratios under control. As a result, in 4Q25 we reported a Return on Equity (ROE) higher than our cost of capital, with eight straight quarters of profitability growth. Investments in our transformation have placed temporary pressure on expenses, but they are intended to boost our competitiveness in the short, medium and long term. The integration between "change the bank" and "run the bank" is intensifying, as the benefits of transformation continue to enhance operational performance and make it more sustainable. Net income was R$6.5 billion in 4Q25, resulting in ROAE of 15.2%, generating a profit of R$24.7 billion in 2025 and growth of 26.1% in 2025 vs. 2024. Total revenues topped R$36.1 billion for the quarter, growing 2.9% q/q and 9.8% y/y, driven by the performance of the net interest income and fee and commission income. Net interest income came to R$19.2 billion for the quarter, expanding 2.9% q/q and 13.2% y/y. Client NII reached R$19.1 billion, rising 2.7% q/q and 18.4% y/y, mainly due to the effect of the increase in the loan portfolio and efficiency on the funding margin. Market NII totaled R$126 million in 4Q25, in line with expectations, bringing the full-year figure to R$975 million. The expanded loan portfolio came to R$1.089 trillion, growing 11.0% y/y and 5.3% q/q in December 2025, reflecting our traction in the MSME and Individuals segments, and operations with Large Companies carried out at the end of the year. In December 2025, the delinquency ratio (over 90 days NPL) remained stable. Problem assets in the restructured portfolio fell by R$2.4 billion versus the prior quarter and R$10.5 billion in the annual comparison, while cured assets rose 10.7% q/q and 58.2% y/y. Consequently, stage 3 operations declined throughout 2025, with a 40 bps reduction in the last quarter. The cost of credit retreated slightly from 3.3% in 3Q25 to 3.2% in 4Q25, reflecting the quality of the concession and growth of the loan portfolio over the period. Fee and commission income performed strongly, growing 4.6% q/q and 8.0% y/y. The positive standouts over the quarter included capital market, card income and loan operations. The operational performance from insurance operations generated an income of R$5.6 billion (-1.0% q/q and +2.1% y/y) and net income of R$2.8 billion (10.7% q/q and 10.6% y/y). The ROAE of the insurance company was 24.3% in 4Q25. In 2025, the insurance earnings came to R$10.1 billion. Our efficiency ratio (expenses/revenues) improved by 2.2 p.p. over the year, attributed to a 13.2% increase in revenues and sound management of expenses. In 2025, operating expenses rose by 8.5% while administrative and personnel expenses saw a 5.0% bump, which includes the impact of the collective bargaining agreement of 5.68% and increase in profit-sharing expenditures. Temporary pressures seen throughout the year came mainly from our transformation initiatives and a strategic strengthening of the balance sheet via increased contingency provisions. Our capital ratios remain robust and well above regulatory and managerial limits. Tier 1 capital stood at 13.2% and the common equity ratio reached 11.2% at year-end 2025, representing a 0.7 p.p. improvement over the past 12 months. We allocated R$3.9 billion in interest on shareholders’ equity in 4Q25. In terms of 2025 guidance, the growth of the loan portfolio exceeded the ceiling of the indicated range, primarily resulting from the progress in the Large Companies segment at the end of the year. The income from insurance operations also performed better than expected, essentially reflecting commercial traction and improvements in claims ratios. The other guidance lines remained on the higher end of the indicated projections. For 2026, with credit risk under control, we expect our profitability to evolve through an increase in our revenues. The solid performance of revenues offers us the opportunity to invest more and maintain our transformation at a brisk pace. We expect our profitability to continue increasing step by step and in a sustainable manner. We continue to gain momentum in the delivery of our transformation plan. Through our service model, we consolidated corporate branch operations, enriched the SME App with new features, and ensured a smoother, more efficient customer experience. For Individuals, we enhanced the value proposition in Prime and Principal offerings, upgrading more clients, and opening more offices for high-income clientele. We continue to expand our fully digital client base, improve efficiency in digital sales, and optimize our footprint. Focusing on personnel, our cultural evolution program continues to be implemented. We have decided to continue making significant investments in transformation efforts in 2026. We remain committed to sustainable business financing and supporting our clients in the transition to a greener and inclusive economy, keeping a close eye on associated risks and opportunities. The corporate goal to allocate R$350 billion to sectors and activities with socio-environmental benefits over the 2021–2025 period was surpassed, achieving 109% execution by the end of the cycle, with total allocations of R$381.9 billion, underscoring the scale and continuity of this agenda. We commit to directing a cumulative R$450 billion by December 2026, a target that includes the accumulated volume since 2021. The following information details our performance in 4Q25, including results, balance sheet and key performance indicators. enjoy the reading! Bradesco | Economic and Financial Analysis Report 7 highlights 4Q25 consolidated recurring net income R$6.5 bi △ 5.0% q/q △ 20.6% y/y ROAE 4Q25 15.2% △ 0.5 p.p. q/q △ 2.5 p.p. y/y main data selected expanded loan portfolio total revenue R$36.1 bi (1) △ 2.9% q/q △ 9.8% y/y total net interest income △ 2.9% q/q △ 13.2% y/y R$1,089 bi △ 5.3% q/q △ 11.0% y/y fee and commission income △ 4.6% q/q △ 8.0% y/y Individuals R$466.5 bi △ 3.3% q/q △ 12.7% y/y insurance, pension plans and capitalization bonds ▽ 1.0% q/q △ 2.1% y/y Companies R$622.7 bi △ 6.9% q/q △ 9.7% y/y cost of credit R$8.8 bi △ 3.1% q/q △ 18.3% y/y MSME △ 8.1% q/q △ 21.3% y/y Large Corporates △ 6.0% q/q △ 2.7% y/y loan indicators over 90 days ratio 4.1% stable q/q △ 0.1 p.p. y/y personnel + administrative expenses (2) R$13.8 bi △ 7.1% q/q △ 5.6% y/y basel – tier I Disregarding the effect of the acquisition of John Deere Bank: (1) 9.6% y/y; and (2) 5.3% y/y. 13.2% ▽ 0.2 p.p. q/q △ 0.8 p.p. y/y Bradesco Seguros recurring net income ROAE 4Q25 revenue claims ratio 4Q25 R$2.8 bi △ 10.7% q/q △ 10.6% y/y 24.3% △ 1.9 p.p. q/q ▽ 0.8 p.p. y/y R$29.7 bi △ 0.2% q/q ▽ 5.7% y/y 74.3% △ 1.5 p.p. q/q △ 2.1 p.p. y/y key highlights • Profitability evolved with solidity and consistency, overcoming the cost of capital • Total revenues have expanded, driven by strong performance of Client NII and fee and commission income • Balanced growth of the loan portfolio • Delinquency under control, with emphasis on the sequential reduction of the restructured portfolio • Controlled operating expenses and improvement of our efficiency ratio • The Bradesco Seguros showed expanding ROAE and solid performance 3.0 3.0 3.2 3.3 3.2 4Q24 1Q25 2Q 3Q 4Q Loan Loss Provision / Expanded Loan Portfolio (% Annualized) Bradesco | Economic and Financial Analysis Report 8 recurring net income statement (1) It refers to adherence to the Comprehensive Transaction Program (PTI), according to the Notice No. 25/2024 of the Attorney General’s Office of the Finance Ministry (PGFN), the Brazil IRS (SRF) and the tax provisions; (2) Mainly by restructuring in the branch network; and (3) It essentially includes the impairment of non-financial assets. recurring net income movement in the quarter | R$ million (1) Tax Expenses, Equity in the Earnings of Affiliates, Non-Operating Income, Income Tax/Social Contribution and Minority Share. ROAE Quarterly and Year-to-Date ER / Risk – Adjusted ER R$ million4Q253Q254Q2412M2512M244Q25 vs. 3Q254Q25 vs. 4Q2412M25 vs. 12M24\\ Net Interest Income19,245 18,710 16,995 73,232 63,726 2.913.214.9Client NII19,119 18,611 16,153 72,257 61,565 2.718.417.4Market NII126 99 842 975 2,161 27.3(85.0)(54.9)\\ Expenses with Expanded Loan Loss Provisions(8,828) (8,560) (7,460) (33,172) (29,688) 3.118.311.7\\ NII Net of Provisions10,417 10,150 9,535 40,060 34,038 2.69.317.7\\ Client NII Net of Provisions10,291 10,051 8,693 39,085 31,877 2.418.422.6Income from Insurance, Pension Plans and Capitalization Bonds5,649 5,706 5,531 22,308 19,220 (1.0)2.116.1Fee and Commission Income11,084 10,592 10,262 41,752 38,344 4.68.08.9Operating Expenses(16,958) (16,488) (16,418) (64,350) (59,294) 2.93.38.5Personnel Expenses(7,308) (7,126) (6,773) (27,991) (25,514) 2.67.99.7Other Administrative Expenses(6,517) (5,778) (6,315) (23,199) (23,255) 12.83.2(0.2)Other Income / (Operating Expenses)(3,133) (3,584) (3,330) (13,160) (10,525) (12.6)(5.9)25.0Tax Expenses(2,273) (2,164) (2,031) (8,891) (8,084) 5.011.910.0Results derived from investments in controlled companies119 83 90 384 366 43.432.24.9\\ Operating Income8,038 7,879 6,969 31,263 24,590 2.015.327.1Non-Operating Income12 (16) 40 70 119 -(70.0)(41.2)Income Tax / Social Contribution(1,422) (1,574) (1,490) (6,256) (4,739) (9.7)(4.6)32.0Non-controlling interests in subsidiaries(112) (84) (117) (425) (416) 33.3(4.3)2.2\\ Recurring Net Income6,516 6,205 5,402 24,652 19,554 5.020.626.1Non-Recurring Events(40) - (468) (102) (468) - (91.5)(78.2)PTI Adherence / Tax Provisions (1)627 - - 1,060 - - - - Provision for Restructuring (2)(661) - (443) (661) (443) - 49.249.2Labor Contingency- - - (495) - - - - Others (3)(6) - (25) (6) (25) - (76.0)(76.0) Book Net Income6,476 6,205 4,934 24,550 19,086 4.431.328.6Variation % 6,205 508 27 6,516 (438) 170 (57) 492 (470) 79 Net Income 3Q25 Client NII Market NII Mass-Market Wholesale Income from Insurance Fee and Commission Income Operating Expenses (Personnel + Administrative + Others) Others Net Income 4Q25 Expanded LLP Net Interest Income ▲535 ▲(268) 15.2 14.4 14.6 14.7 12.7 14.4 14.6 14.6 14.8 11.7 4Q24 1Q25 2Q 3Q 4Q Quarterly Year-to-Date % 53.2 49.7 49.9 50.1 50.1 78.3 76.9 76.1 76.0 75.7 52.2 51.8 51.2 50.7 50.0 4Q24 1Q25 2Q 3Q 4Q Quarterly 12-month risk-adjusted 12-month % (1) z Bradesco | Economic and Financial Analysis Report 9 net interest income (1) It relates to the income from operations made with assets (loans and others) and liabilities sensible to spreads. The result calculation of the assets sensible to spreads considers the original rates of the deducted operations from the internal funding cost, and the liabilities result represents the difference between the cost of raising funds and the internal transfer rate of these funds; and (2) It is composed of Assets and Liabilities Management (ALM), Trading and Working Capital. Client NII | R$ million expanded loan portfolio mix (%) change in the Client NII | R$ million Gross financial Client NII grew 3% in the quarter driven by increased credit volume, product mix, improved spreads and evolution in funding margin, being partially impacted by the lower number of days in the period. This dynamic provided the maintenance of the average gross rate at 9.0% in 4Q25. The net interest income showed an increase in operations of Individuals and Companies, with emphasis on working capital, credit card and vehicle financing. The Client NII after Loan Loss Provision increased 2.4% compared to 3Q25, keeping the average rate at 4.8%. This performance reflects the strategy of prioritizing quality in granting new loan operations. In comparison with 4Q24, the net interest income showed growth of 18.4% and, in the accrued for the year, expansion of 22.6%. market NII Variations in all periods are essentially resulting from ALM movements. R$%R$%R$%\\ Net Interest Income19,245 18,710 16,995 73,232 63,726 535 2.92,250 13.29,506 14.9\\ Client NII (1)19,119 18,611 16,153 72,257 61,565 508 2.72,966 18.410,692 17.4Average Balance873,597 847,275 790,286 841,614 748,482 400 3.11,305 10.55,904 12.4Gross NIM9.0%9.0%8.4%8.6%8.2%108 1,661 4,788 \\ Market NII (2)126 99 842 975 2,161 27 27.3(716) (85.0)(1,186) (54.9)R$ Million4Q25 vs. 3Q254Q25 vs. 4Q244Q2512M25 vs. 12M243Q254Q2412M2512M24 Dec25Sept25Dec24Dec25 vs. Dec24\\ Individuals42.8 43.7 42.2 0.6 p.p.Real Estate Financing10.3 10.8 10.5 (0.2) p.p.Payroll-deductible Loans9.5 9.8 9.9 (0.4) p.p.Credit Card7.7 7.5 7.7 -Personal Loans6.5 6.9 6.8 (0.3) p.p.Vehicle4.0 3.9 3.7 0.3 p.p.Rural Loans3.9 3.8 2.6 1.3 p.p.Other0.9 1.0 1.0 (0.1) p.p.\\ Companies57.2 56.3 57.8 (0.6) p.p.Large Companies33.3 33.0 35.9 (2.6) p.p.MSME23.9 23.3 21.9 2.0 p.p. 18,611 10,051 10,291 8,828 19,119 (8,560) 400 188 88 (168) (268) 3Q25 Expenses with Expanded LLP 3Q25 Client NII Net of LLP 3Q25 Average Volume Spread Products Mix Number of Days Expanded LLP Client NII Net of LLP 4Q25 Expenses with Expanded LLP 4Q25 4Q25 0.1 0.1 0.3 0.5 0.8 4Q24 1Q25 2Q 3Q 4Q R$ billion 4.8% 4.8% 4.7% 4.6% 4.4% 9.0% 9.0% 8.8% 8.6% 8.4% Net NIM Annualized Gross NIM Annualized 8,693 9,129 9,614 10,051 10,291 16,153 16,771 17,756 18,611 19,119 4Q24 1Q25 2Q 3Q 4Q Total Client NII Client NII net of Provision +2.4% q/q 240 +2.7% q/q 508 +2.4% q/q +18.4% y/y Bradesco | Economic and Financial Analysis Report 10 funding sources total funds raised and managed R$3.6 tri △ 4.2% q/q △ 11.9% y/y funds raised △ 5.4% q/q △ 12.4% y/y funds and managed portfolios △ 2.5% q/q △ 11.1% y/y (1) With the adoption of Resolution No. 4,966/21, foreign exchange operations began to be registered as derivatives. For purposes of comparability, the balances of previous periods were re-presented, maintaining the uniformity of the information. loans vs. funding In order to evaluate the relationship between loan operations and funding, we deducted from the total client funding the amount committed to reserve requirements at Central Bank of Brazil, as well as the amount of funds available within the customer service network, and we added the funds from domestic and foreign lines of credit that provide funding to meet the demand for loans and financing. (1) It considers: Demand Deposits, Floating, Saving Deposits, Interbank Deposits, Time Deposits, Debentures (with collateral of repurchase transactions) and Funds from Financial Bills (considers Letters of Credit for Real Estate, Letters of Credit for Agribusiness, Financial Bills and Structured Operations Certificates). R$ MillionDec25Sept25Dec24Dec25 vs. Sept25Dec25 vs. Dec24Demand Deposits40,698 36,496 45,542 11.5 (10.6) Savings Deposits124,461 123,974 132,502 0.4 (6.1) Time Deposits + Debentures589,356 532,385 495,333 10.7 19.0 Borrowings and Onlending78,254 76,012 78,439 2.9 (0.2) Funds from Issuance of Securities327,884 316,272 270,294 3.7 21.3 Interbank Deposits5,486 5,499 3,008 (0.2) 82.4 Subordinated Debts54,715 51,962 57,459 5.3 (4.8) \\ Subtotal1,220,854 1,142,600 1,082,577 6.812.8Obligations for Repurchase Agreements355,751 329,377 308,432 8.0 15.3 Working Capital (Own / Managed)133,740 132,810 123,032 0.7 8.7 Foreign Exchange Portfolio (1)294 532 744 (44.7) (60.5) Payment of Taxes and Other Contributions1,035 6,120 854 (83.1) 21.2 Technical Provisions for Insurance, Pension Plans and Capitalization Bonds445,994 435,244 403,689 2.5 10.5 \\ Funds raised2,157,668 2,046,683 1,919,329 5.412.4\\ Investment Funds and Managed Portfolios1,409,467 1,375,660 1,268,106 2.511.1\\ Total Assets under Management 3,567,135 3,422,343 3,187,435 4.211.9Variation % R$ MillionDec25Sept25Dec24Dec25 vs. Sept25Dec25 vs. Dec24\\ Funding vs. InvestmentsDemand Deposits + Sundry Floating41,733 42,616 46,396 (2.1) (10.1) Savings Deposits124,461 123,974 132,502 0.4 (6.1) Interbank Deposits5,486 5,499 3,008 (0.2) 82.4 Time Deposits + Debentures589,356 532,385 495,333 10.7 19.0 Funds from Financial Bills311,408 301,935 260,765 3.1 19.4 \\ Customer Funds (1)1,072,444 1,006,409 938,004 6.6 14.3 (-) Reserve Requirements(122,573) (119,964) (127,086) 2.2 (3.6) (-) Available Funds (Brazil)(12,726) (14,705) (17,582) (13.5) (27.6) \\ Customer Funds Net of Reserve Requirements937,145 871,740 793,335 7.5 18.1 Borrowings and Onlending78,254 76,012 78,439 2.9 (0.2) Other (Securities Abroad + Subordinated Debt + Other Borrowers - Cards)113,654 114,170 102,841 (0.5) 10.5 \\ Total Funding (A)1,129,053 1,061,922 974,615 6.3 15.8 \\ Expanded Loan Portfolio (Excluding Sureties and Guarantees) (B)963,346 915,108 861,625 5.3 11.8 \\ B / A85.3%86.2%88.4% (0.9) p.p. (3.1) p.p.Variation % financiamento imob. | PF Bradesco | Economic and Financial Analysis Report 11 expanded loan portfolio expanded loan portfolio R$1,089 bi △ 5.3% q/q △ 11.0% y/y individuals R$466.5 bi △3.3% q/q △ 12.7% y/y companies R$622.7 bi △ 6.9% q/q △9.7% y/y micro, small and medium-sized enterprises △ 8.1% q/q △21.3% y/y large corporates △ 6.0% q/q △ 2.7% y/y highlights credit card - Individuals △ 7.6% q/q △ 10.5% y/y credit card | high-income – Individuals △ 11.0% q/q △ 26.5% y/y cdc/vehicle Leasing - Individuals △ 7.2% q/q △ 18.0% y/y BNDES/Finame Onlendings - Companies △ 9.4% q/q △ 26.0% y/y working capital - Companies △ 12.5% q/q △ 18.7% y/y rural loans - Individuals + Companies △ 7.7% q/q △ 47.8% y/y real estate financing - Individuals + Companies △ 1.9% q/q △ 10.7% y/y portfolio segregated by modality (1) Off-balance operations; and (2) It includes Debentures, CDCA (Agribusiness Credit Rights Certificate), CRI (Real Estate Receivable Certificates), and FIDC (Credit Rights Investment Fund). expanded loan portfolio mix - % R$ millionDec25Sept25Dec24Quarter12 monthsIndividuals451,830 438,539 403,307 3.0 12.0 Companies357,188 333,247 314,773 7.2 13.5 \\ Loan Portfolio - Total809,019 771,786 718,080 4.8 12.7 Sureties and Guarantees (2)125,883 119,130 120,067 5.7 4.8 Securities (1)95,247 86,943 90,392 9.6 5.4 Other Products with a Credit Feature59,081 56,379 53,153 4.8 11.2 \\ Expanded Loan Portfolio - Total1,089,230 1,034,238 981,692 5.3 11.0 \\ Individuals466,503 451,568 414,080 3.3 12.7 \\ Companies622,727 582,670 567,612 6.9 9.7 Large Corporates362,124 341,536 352,701 6.0 2.7 Micro, Small and Medium-Sized Enterprises260,603 241,134 214,911 8.1 21.3 Without exchange variation5.0 12.4 Variation % 42.2 43.1 43.5 43.7 42.8 21.9 22.1 22.6 23.3 23.9 35.9 34.8 33.9 33.0 33.3 Dec24 Mar25 June Sept Dec Individuals MSME Large Corporates Bradesco | Economic and Financial Analysis Report 12 expanded loan portfolio expanded loan portfolio by client profile, product and currency R$ millionDec25Sept25Dec24Quarter12 months\\ Individuals466,503 451,568 414,080 3.3 12.7 Consumer Financing 301,441 290,993 276,193 3.6 9.1 Payroll-deductible Loans103,838 101,850 97,184 2.0 6.8 Credit Card83,556 77,645 75,631 7.6 10.5 Personal Loans70,975 71,322 66,872 (0.5) 6.1 CDC/Vehicle Leasing 43,072 40,176 36,506 7.2 18.0 Real Estate Financing112,657 111,993 102,713 0.6 9.7 Other Products52,405 48,582 35,174 7.9 49.0 Rural Loans42,728 39,067 25,286 9.4 69.0 Other9,677 9,515 9,888 1.7 (2.1) \\ Companies622,727 582,670 567,612 6.9 9.7 Working Capital175,456 155,977 147,763 12.5 18.7 Sureties and Guarantees124,530 117,870 119,049 5.7 4.6 Securities95,247 86,943 90,392 9.6 5.4 Foreign Trade Finance50,971 51,770 55,571 (1.5) (8.3) Rural Loans47,173 44,390 35,536 6.3 32.7 Real Estate Financing34,972 32,869 30,657 6.4 14.1 CDC/Leasing 31,487 30,752 29,055 2.4 8.4 BNDES/Finame Onlendings22,955 20,975 18,223 9.4 26.0 Other39,936 41,124 41,366 (2.9) (3.5) \\ Expanded Loan Portfolio1,089,230 1,034,238 981,692 5.3 11.0 Domestic Currency976,692 930,193 867,409 5.0 12.6 Foreign Currency112,538 104,045 114,283 8.2 (1.5) Variation % Bradesco | Economic and Financial Analysis Report 13 expanded loan portfolio mix of the secured and unsecured loan portfolio - % The chart below represents the proportion of the loan portfolio segregated in secured and unsecured operations. The portfolio with guarantees showed growth of 5.3 p.p. in 12 months, underlining our risk-adjusted profitability strategy. portfolio by debtors Diversification strategy, with no relevant concentrations. 54.0 57.0 58.5 59.5 59.3 46.0 43.0 41.5 40.5 40.7 Dec24 Mar25 June Sept Dec Secured Unsecured % 22.2 21.5 21.0 20.8 24.7 17.3 16.7 16.3 15.6 19.1 11.0 10.8 10.3 9.4 12.0 7.4 6.7 6.7 6.3 5.8 1.1 1.1 1.0 0.9 0.8 Dec24 Mar25 June Sept Dec 100 Largest 50 Largest 20 Largest 10 Largest Largest borrower % Bradesco | Economic and Financial Analysis Report 14 loan portfolio real estate financing profile of the individuals portfolio – origination 4Q25 Average term: 362 Months R$ 913 Thousand R$ 520 Thousand 57.0% 51.4% Average Property Valuation Average Financing Loan to Value Loan to Value (Stock) payroll-deductible loans payroll-deductible loans market share The payroll-deductible loan grew 2.0% in the quarter and 6.8% in 12 months, with emphasis on the public sector, whose market share increased by 0.4 p.p. (Dec25 vs. Sept25), reflecting the increase in representativeness by 0.7 p.p. in the total portfolio. It is also noteworthy that the evolution of origination through digital channels, whose share in the portfolio increased by 0.8 p.p. in the quarter reaching a balance of R$76.3 bi in Dec25. 14.1% 15.2% 6.6% 14.8% Total Social Security National Institute Private Public 102.7 107.3 111.3 112.0 112.7 30.7 30.1 31.4 32.9 35.0 133.4 137.4 142.7 144.9 147.6 Dec24 Mar25 June Sept Dec Individuals Companies +1.9%q/q +10.7% y/y portfolio R$ billion 3,632 3,172 6,933 7,588 6,696 4,812 2,178 815 1,578 5,326 7,984 5,810 8,403 8,274 12,259 4Q24 1Q25 2Q 3Q 4Q Borrower Builder origination R$ million +37.4%q/q -34.9% y/y 7,166 6,063 15,110 18,102 16,008 14,812 6,974 3,936 11,395 2,368 20,875 14,140 20,470 19,944 26,505 4Q24 1Q25 2Q 3Q 4Q Borrower Builder units financed +47.6%q/q -21.2% y/y 7.6% 7.2% 7.2% 7.3% 7.5% 26.5% 24.6% 23.1% 20.0% 19.0% 65.9% 68.2% 69.7% 72.7% 73.5% 97.2 98.9 99.4 101.9 103.8 59.2% 59.2% 58.1% 58.8% 59.4% Dec24 Mar25 June Sept Dec Branches Digital Channels Correspondent Payroll-deductible Loans / Personal Loans + Payroll-deductible Loans Portfolio in R$ billion and breakdown by channel 43.5% 43.6% 42.6% 42.0% 40.8% 4.9% 4.7% 4.2% 4.4% 4.9% 51.6% 51.7% 53.2% 53.6% 54.3% Dec24 Mar25 June Sept Dec Public Sector Private Sector Social Security National Institute (INSS) distribution of the portfolio by sector 92.5% 92.4%%%% Bradesco | Economic and Financial Analysis Report 15 loan portfolio vehicle financing expanded loan portfolio distribution | by economic sector 36.9 37.2 38.3 40.5 43.4 29.6 29.8 30.1 30.5 31.0 74.4 66.5 67.0 68.4 71.0 Dec24 Mar25 June Sept Dec Individuals Companies +4.8%q/q +11.9% y/y portfolio R$ billion 90.0 1.4 8.6 CDC Portfolio Leasing Portfolio Finame Portfolio distribution of the portfolio by product % Dec25 R$ million\\ Economic Sector Public Sector16,034 1.5 13,086 1.3 14,361 1.5 Private Sector1,073,196 98.5 1,021,152 98.7 967,331 98.5 \\ Total1,089,230 100.0 1,034,238 100.0 981,692 100.0 Companies622,727 57.2 582,670 56.3 567,612 57.8 Services182,045 16.7 157,961 15.3 132,997 13.5 Retail 52,137 4.8 50,015 4.8 48,022 4.9 Transportation and Concession47,231 4.3 45,168 4.4 46,835 4.8 Real estate and Construction Activities35,939 3.3 35,800 3.5 32,671 3.3 Production and Distribution of Electricity29,108 2.7 26,805 2.6 30,482 3.1 Wholesale33,944 3.1 31,707 3.1 30,106 3.1 Food products27,442 2.5 26,035 2.5 23,756 2.4 Petrol, Derived and aggregated activities16,118 1.5 15,752 1.5 12,949 1.3 Automotive9,748 0.9 9,321 0.9 10,112 1.0 Other Sectors189,015 17.4 184,105 17.8 199,682 20.3 Individuals466,503 42.8 451,568 43.7 414,080 42.2 Dec24%Sept25%Dec25% Bradesco | Economic and Financial Analysis Report 16 expenses with expanded loan loss provisions (1) It includes the result with BNDU (non-financial assets held for sale) and others; and (2) Balances prior to 1Q25/March25 are being presented according to the accounting practice in force for the periods. As of 2025, balances are shown in the expected loss model in accordance with CMN Resolution No. 4,966/21. expanded loan loss provisions / expanded loan portfolio The variation of Expenses with Loan Loss Provisions in the quarter essentially reflects the growth of the loan portfolio in the period, the effect of efficiency in the collection process, reflecting the higher result of loan recoveries, as well as lower expenses with Loan Loss Provisions in the wholesale segment. Our cost of credit in the retail remains controlled, and can be observed, also in the other quality indicators of the portfolio. expanded loan loss provision – mass-market expanded loan loss provision – wholesale coverage ratios and provision (1) The variation in the coverage indicator stems from the growth of the performing loan portfolio, expansion of the portfolio with guarantees in 2025 and reduction of the restructured portfolio. In addition, the origination mix continues to favor the net interest income, in line with our risk-adjusted return strategy. (1) Balances prior to 1Q25/March25 are being presented according to the accounting practice in force for the periods. As of 2025, balances are shown in the expected loss model in accordance with CMN Resolution No. 4,966/21. R$ million 4Q25 3Q25 4Q24 12M25 12M24 4Q25 vs. 3Q25 4Q25 vs. 4Q24 12M25 vs. 12M24 Provision Expense with Expected Losses (10,059) (9,365) (8,346) (36,740) (33,067) 7.4 20.5 11.1 Income from Recovering Written Off Loans Net of Discounts Granted (1) 1,231 805 886 3,568 3,379 52.9 38.9 5.6 \\ Expenses with Expanded Loan Loss Provisions (2) (8,828) (8,560) (7,460) (33,172) (29,688) 3.1 18.3 11.7 Variation % 7.5 7.6 8.1 8.6 8.8 3.0 3.0 3.2 3.3 3.2 4Q24 1Q25 2Q 3Q 4Q Expanded LLP Expanded LLP / Expanded Loan Portfolio (Annualized) % expanded loan loss provision R$ billion 8.5 7.9 8.1 7.2 7.4 4Q24 1Q25 2Q 3Q 4Q R$ billion 5.3% 5.3% 5.4% 5.3% 5.3% 0.5 0.3 0.3 0.2 0.2 4Q24 1Q25 2Q 3Q 4Q R$ billion 55,028 57,787 58,143 57,200 57,977 5.6 5.7 5.7 5.5 5.3 Dec24 Mar25 June Sept Dec Provision for Expanded Portfolio Provision for Expanded Portfolio / Expanded Loan Portfolio provision for expanded portfolio % R$ million 187.9 183.1 177.8 168.9 166.0 Total Provision for Expanded Portfolio / Exposure Overdue more than 90 days LL P Loan Loss Provisions / Portfolio (annualized) Bradesco | Economic and Financial Analysis Report 17 ~30% of stage 3 up to date loan portfolio indicators * * Does not include Securities, Sureties and Guarantees and other products in the expanded loan portfolio. delinquency ratios stability in the delinquency ratio over 90 days for the third consecutive quarter The total NPL over 90 days remained stable in the quarter at 4.1%, a performance that reflects the resilience of the Individuals portfolio, which remained at 5.4%. This result, in addition to the positive contribution of the segment of Large Corporates, offset the slight occasional oscillation observed in the MSME. The indicator reinforces the effectiveness of loan concession and recovery processes. changes in loan portfolio by stage The cashflow of the loan portfolio in 4Q25 demonstrates an improvement in the risk profile, driven by the migration of 8% of operations from stage 2 to 1 and the healing of 4% of the portfolio in stage 3. representativeness of the loan portfolio by stage In 12 months, the portfolio risk profile improved, with the concentration of assets in stages 1 and 2 growing 1.2 p.p. and reaching 92.7% of the total. This improvement was driven by an increase of 0.6 p.p. in the participation of operations classified in stage 1. 4.1 4.1 4.0 4.1 4.1 5.4 5.4 5.1 5.1 5.1 3.7 3.8 4.4 4.3 4.3 0.1 0.3 0.4 0.4 0.3 Dec24 Mar25 June Sept Dec Total Individuals MSME Large Corporates loan portfolio overdue more than 90 days -% R$ millionLoan Portfolio Sept25 Stage 1 Stage 2 Stage 3 Stage 1 Stage 2 Stage 3 Dec25 Stage 1677,627 - (10,440)(2,213)- 2,75554444,100- 712,372Stage 235,100 (2,755)- (6,583)10,440- 1,618(607)- 37,212Stage 359,059 (544)(1,618)- 2,2136,583- 2,167(8,427)59,434\\ Total771,786 (3,299)(12,058)(8,797)12,6549,3382,16245,660(8,427)809,019Originated / Settlement (1)Write-off Movement between stages Transfers Arising 87.5% 87.7% 87.5% 87.8% 88.1% 4.0% 4.3% 4.6% 4.5% 4.6% 8.4% 8.0% 7.9% 7.7% 7.3% Dec24 Mar25 June Sept Dec Stage 1 Stage 2 Stage 3 92.7% in stage 1+2 91.5% in stage 1+2 Bradesco | Economic and Financial Analysis Report 18 loan portfolio indicators restructured portfolio We continue with a sequential reduction in the portfolio of restructured loans, with -23% in comparison to Dec24 with a drop of 1.5 p.p. in participation on the loan portfolio. We maintain adequate levels of provision for this portfolio, representing approximately twice the total of loans overdue more than 90 days. We also highlight the reduction of R$2.3 bi or (-10%) of operations classified as problematic assets, and the increase of R$0.7 bi (+11%) in the cured operations in the quarter, improving the quality of the portfolio and the effectiveness of the strategies adopted in loan recovery. (1) The balances prior to 1Q25/March25 are being presented according to the accounting practice in force for the periods. As of 2025, balances are shown in the expected loss model in accordance with CMN Resolution No. 4,966/21. 26.7 25.3 22.6 20.2 30.7 6.4 5.7 5.0 4.8 4.0 26.6 28.3 31.6 30.1 34.8 Dec24 Mar25 June Sept Dec Cured Operations Problematic Asset (Stage 3) evolution of the restructured portfolio R$ billion 4.8 4.3 4.0 3.7 3.3 Dec24 Mar25 June Sept Dec restructured portfolio / loan portfolio % 64.7 55.9 56.1 54.4 52.5 Dec24 Mar25 June Sept Dec restructured provision (1) / restructured portfolio % 31.9 30.9 31.0 31.7 29.8 Dec24 Mar25 June Sept Dec over 90 days / restructured portfolio % 1.8x -10.3% q/q -34.1% y/y -6.0% q/q -23.5% y/y Bradesco | Economic and Financial Analysis Report 19 fee and commission income Part of the accrued performance of fee and commission income is influenced by the increase in our stake in Cielo and the consolidation of the John Deere Bank, disregarding this effect, the total variation of revenues would be 5.5% vs. 12M24. card income Card income reached R$4.8 billion in the quarter, representing 43% of total fee and commission income: - Credit cards registered a traded volume of over R$102 billion, with 9% growth in the year (4Q25 vs. 4Q24); and - High-income clients account for about 50% of the total revenue, with a growth of 25% compared to 4Q24. traded volume | credit cards checking account/collections and payments Fee and commission income totaled R$1.6 billion in checking account and R$420 million in collections and payments. Even with the retraction in these lines against the historical record, the overall performance of the customer relationship has been positively translated in the other lines of the result, with consistent growth in total revenues and profitability gain quarter by quarter. checking account holders loan operations The quarterly performance was driven by increased production volumes, especially in working capital operations and with guarantees provided. In the annual and accrued comparison, we observed reductions that reflect the impact of the adoption of CMN Resolution No. 4,966, due to the deferral of fees related to loan operations (EIR – Effective Interest Rate), which are recognized in the client NII during the period of operation. asset management market share 16.3%(1) The result reinforces the consistency of revenue evolution throughout the year, sustained by the increase in asset under management, by the diversification of the client base and the expansion of the product line offered, as well as higher revenue with performance fee. The annual revenues of 2025 ended with R$3.8 billion, an increase of 6.1% compared to 2024, which consolidates Bradesco Asset as one of the main asset management companies in the country. Focusing on investor experience and long-term value generation, Asset continues to expand its global performance and strengthen its presence in strategic segments such as international ETFs and high-income. It also holds a prominent position in the main market rankings, including one of the most relevant recognitions in the country: the FGV Award that elected Bradesco Asset as the Best Bank to Invest in Funds. balance of investment funds and managed portfolios(1) (1) Source: Anbima - Global Ranking of Third-Party Asset Management. R$ million4Q253Q254Q2412M2512M244Q25 vs. 3Q254Q25 vs. 4Q2412M25 vs. 12M24Card Income4,815 4,620 4,419 18,213 15,918 4.29.014.4Checking Account1,640 1,664 1,755 6,668 6,882 (1.4)(6.6)(3.1)Asset Management984 1,003 895 3,748 3,533 (1.9)9.96.1Loans Operations766 749 796 2,787 2,839 2.3(3.8)(1.8)Consortia827 830 707 3,135 2,673 (0.4)17.017.3Collections and Payments420 426 458 1,719 1,931 (1.4)(8.3)(11.0)Capital Market / Financial Advisory Services716 445 508 2,157 1,669 60.940.929.2Custody and Brokerage Services391 384 370 1,491 1,430 1.85.74.3Other525 471 354 1,834 1,469 11.548.324.8\\ Total11,084 10,592 10,262 41,752 38,344 4.68.08.9\\ Business Days64 66 63 252 253 (2)1(1)Variation % 102,291 94,849 87,457 91,457 93,900 4Q24 1Q25 2Q 3Q 4Q R$million 38.2 38.2 38.1 37.9 37.7 Dec24 Mar25 June Sept Dec Inmillion 1,409 1,376 1,308 1,268 1,280 Dec24 Mar25 June Sept Dec In billion Bradesco | Economic and Financial Analysis Report 20 fee and commission income consortia Income growth by more than 17% compared to 12M24, driven by higher sales in the real estate segment. highlights of the year - More than 272 thousand quotas contemplated as the administrator that most contemplates in the country (R$17.5 billion concessions in letters of credit) - increase of 35 thousand quotas / R$2.2 billion in concessions vs. 12M24); - Revenue of R$43.8 billion in 12M25, R$8.5 billion higher or 24% vs. 12M24; and - Consortium of real estate with revenue growth of 61% vs. 12M24. number of outstanding consortium quotas (1) It considers the products in which Bradesco operates. Reference date: November 2025. capital market / financial advisory services Good performance in the year of 2025, reflecting the efforts in capturing business opportunities in every segment of the capital market and in mergers and acquisitions operations. We advised in 507 operations, totaling around R$576 billion in volume of transactions. Below are the main highlights by segment in 2025: fixed income (DCM) Advisory and structuring of 487 transactions with a volume of R$532 billion. equities (ECM) Advisory, structuring and distribution of four transactions with a volume of R$12 billion. mergers and acquisitions (M&A) Advisory for 16 transactions with a volume of R$32 billion. custody Leader in the global custody market, according to the ANBIMA ranking, we stand out as one of the leading providers of services for the financial and capital markets, with R$2.7 trillion under custody. We were elected, for three consecutive years, by the Global Finance magazine as the best sub-custodian bank for non-resident investors in Latin America. Our wide range of services covers both local and international markets, offering complete and integrated solutions. This positioning is evidenced by the growth of 9.5% in the asset under custody base in comparison to Dec24. Highlight to the leadership in the Fund and Investment Portfolios Controllership market according to the ANBIMA ranking, with more than R$4.4 trillion under services. In the local market, we provide fiduciary management services, qualified custody and controllership for investment funds. We act as Settlement Bank, Clearing Agent, Depositary and Guarantees Agent (Escrow Account), as well as carry out asset bookkeeping for issuing companies. In the international market, we offer specialized services for ADR and BDR issuers, legal representation for non-resident investors, as well as calculation of NAV (Net Asset Value) and RTA (Register Transfer Agent) services for offshore funds. Our commitment to excellence and innovation enables us to meet the specific needs of each client, providing security, efficiency and transparency in all operations. 267 271 291 319 355 144 144 145 149 152 1,135 1,157 1,178 1,174 1,167 1,546 1,571 1,614 1,641 1,674 4Q24 1Q25 2Q 3Q 4Q Real Estate Trucks, Tractors and Agricultural Implements Auto In thousands 2,695 2,601 2,461 2,479 2,522 Dec24 Mar25 June Sept Dec R$ billion Assets under Custody market share(1) Total 18.4% | Auto 21.8% | Real Estate 12.7% | Trucks, Tractors and Agricultural implements 16.4% ‘ Bradesco | Economic and Financial Analysis Report 21 operating expenses We maintain an efficiency-focused cost management, while making strategic investments in technology and infrastructure. This approach allows us to strengthen our operations and sustain our growth consistently, to build an increasingly efficient operational platform in the long term. We highlight that accrued operating expenses were influenced by the increase in our stake in Cielo and acquisition of the John Deere Bank, disregarding these effects, the variation would be 6.9% vs. 12M24. (1) Contemplates Maintenance and Conservation of Assets and Rentals; and (2) Includes Water, Electricity and Gas, Travels, Materials and Security and Surveillance. administrative expenses The management of administrative expenses is guided by financial discipline and constant commitment to efficiency. We maintain focus on the optimal use of resources in order to evolve in our profitability and strengthen competitiveness in a dynamic scenario. In the accumulated 12 months, we achieved a 2.4% reduction in expenses, resulting from the optimization of structural expenses with facilities and transportation, reflecting the adjustment of the footprint. On the other hand, the 15.9% increase in the quarter mainly reflects strategic investments in advertising, data processing and consulting, driving our marketing and technology fronts. Considering the effects of depreciation and amortization, the total change in 12 months was a 0.2% reduction. This result shows that efficiency gains were sufficient to absorb the increase in depreciation and amortization expenses by 8.5% that reflect our level of investments in digital technology and infrastructure. These resources are essential to modernize the client journey, automate processes and intensify data use, consolidating the pillars of our innovation, competitiveness and efficiency strategy. personnel expenses The variations in all comparative periods reflect the increase in expenses with profit-sharing, justified by the improvement in financial performance / profitability. In addition, of the collective bargaining agreement, readjusted wages and benefits by 5.68% in Sept25. We have laid off 1,923 employees over the last 12 months, in line with our cost-to-serve optimization strategy. At the same time, we continue to strengthen our technology, operations and business teams, ensuring greater efficiency and delivery capacity. other operating expenses net of revenue The variations in the periods reflect mainly the movements in civil, labor and tax contingencies, expenses with card commercialization due to the higher volume of transactions, mainly in the high-income segment and, in the accrued for 12M25 vs. 12M24, the performance of this line is influenced by the increase in our stake in Cielo and the consolidation of the John Deere Bank. Retail + Prime: 1,684 Corporate: 83 Digital Platforms: 92 Companies & Business: 150 We have 14 digital platforms and 48 business units allocated to the Principal. R$ million4Q253Q254Q2412M2512M244Q25 vs. 3Q254Q25 vs. 4Q2412M25 vs. 12M24\\ Personnel Expenses(7,308) (7,126) (6,773) (27,991) (25,514) 2.6 7.9 9.7 Payroll, Social Charges, Benefits and Training(5,873) (5,874) (5,672) (23,044) (22,069) - 3.5 4.4 Management and Employee Profit Sharing(1,300) (1,162) (987) (4,484) (3,024) 11.9 31.7 48.3 Terminations Costs(135) (90) (114) (463) (421) 50.0 18.4 10.0 Total Administrative Expenses (6,517) (5,778) (6,315) (23,199) (23,255) 12.8 3.2 (0.2) Administrative Expenses(5,248) (4,528) (5,130) (18,238) (18,681) 15.9 2.3 (2.4) Outsourced Services(1,571) (1,404) (1,636) (5,478) (5,817) 11.9 (4.0) (5.8) Data Processing and Communication(1,395) (1,214) (1,119) (4,772) (4,058) 14.9 24.7 17.6 Facilities(1)(535) (526) (648) (2,099) (2,624) 1.7 (17.4) (20.0) Advertising and Marketing(622) (398) (552) (1,765) (1,630) 56.3 12.7 8.3 Financial System Services(370) (356) (342) (1,423) (1,282) 3.9 8.2 11.0 Transportation(154) (153) (175) (645) (758) 0.7 (12.0) (14.9) Other (2)(601) (477) (658) (2,056) (2,512) 26.0 (8.7) (18.2) Depreciation and Amortization(1,269) (1,250) (1,185) (4,961) (4,574) 1.5 7.1 8.5 \\ Other Operating Expenses Net of Revenue (3,133) (3,584) (3,330) (13,160) (10,525) (12.6) (5.9) 25.0 Civil, Labor and Tax Contingencies(1,336) (1,826) (1,157) (5,828) (4,477) (26.8) 15.5 30.2 Expenses with Marketing of Cards(1,110) (1,022) (1,024) (4,031) (2,957) 8.6 8.4 36.3 Claims(193) (185) (255) (809) (742) 4.3 (24.3) 9.0 Other(494) (551) (894) (2,493) (2,349) (10.3) (44.7) 6.1 \\ Total Operating Expenses (16,958) (16,488) (16,418) (64,350) (59,294) 2.9 3.3 8.5 Variation % 2,305 2,284 2,168 2,059 2,009 728 721 682 707 724 2,970 2,776 2,376 1,978 1,872 5,226 4,744 4,605 6,003 5,781 Dec24 Mar25 June Sept Dec Branches Business Units Service Centers -3% q/q -23% y/y Bradesco | Economic and Financial Analysis Report 22 dynamics of the insurance business 12M25 revenues from insurance premiums, pension contributions and capitalization bonds R$118.5 bi ▽ 2.1% 25 vs. 24 (excluding VGBL △ 6.9%) net income R$10.1 bi △ 11.2% 25 vs. 24 ROAE 21.9% ▽ 0.5 p.p. 25 vs. 24 Bradesco Seguros achieved a net income of R$10.1 billion in 2025 (+11.2% vs. 2024), with an ROAE of 21.9%. In 4Q25, the net income reached R$2.8 billion (+10.6% vs. 4Q24). Revenues from insurance premiums, pension contributions and capitalization bonds reached R$118.5 billion in the year. The income from insurance, pension plans and capitalization operations showed an evolution of 16.1% (vs. 2024), adding R$22.3 billion, driven by an increase of 20.6% in the industrial result, mainly due to an improvement of 3.8 p.p. in the claims ratio. The financial income also contributed to this performance, with a growth of 9.3% in the period. Technical Provisions totaled R$446 billion (+10.5%), and the Financial Assets totaled R$471.4 billion (+12.4%). In 2025, the Insurance Group returned to Society, as indemnities and benefits, R$60.7 billion (+7.3% vs. 12M24). In 4Q25, Bradesco Saúde (Health) expanded its presence in strategic cities, with the launch of the Efetivo Plus, a more affordable option of a health plan with national coverage, reinforcing the expansion and diversification of its portfolio to meet the needs of clients of various profiles. Aimed at companies with three or more lives, the new product, already available in São Paulo, Rio Grande do Sul and the Federal District, offers differentials in network and coverage. In the quarter, the company had a net balance of 74 thousand lives - and 140 thousand in the year. Atlântica Hospitais e Participações, in turn, reached 21 units in operation, totaling more than 2.2 thousand hospital beds. In the last four months, the company announced the incorporation of two new reference hospital units: Hospital and Maternity Glória D’Or (RJ) and Maternity São Luiz Star (SP). Bradesco Vida e Previdência (Life & Pension) has advanced strategically in the portfolio of Life and Travel Insurances, and Loan Protection Insurance. The highlight is the net balance of 131 thousand new lives registered in the segment in the quarter. In Private Pension, a high-income VGBL product was launched with exemption of the administration fee and offers loyalty benefits. In the Auto segment, the Emergency Operation for Claims Treatment, created by Bradesco Seguros to provide quick and effective support to policyholder in natural disasters throughout Brazil, completed ten years in 2025. In the quarter, there was a growth of 111 thousand items. In Property & Casualty, Bradesco Seguro Residencial Pet was launched, an initiative that reinforces its performance in the ecosystem of well-being and convenience. The new product combines traditional residential coverage with a complete portfolio of pet health services. It is also worth mentioning the addition of about 440 thousand new policies in the Residential segment. Bradesco Capitalização (Capitalization) achieved a 20.2% growth in revenue through digital channels in the quarter. Highlight for the launch of the seasonal product Max Virada do Milhão (Millionaire Draw), marketed until December, and that allowed the client to compete for prizes worth up to R$1 million, in addition to participating in the monthly draws. Bradesco | Economic and Financial Analysis Report 23 insurance net income statement (1) The shareholders’ equity of regulated companies (Insurance, Pension plans and Capitalization bonds) totaled R$21,976 million in Dec25, and R$23,179 million in Sept25. Note: In Dec25, the Adjusted Shareholders’ Equity (ASE) totaled R$23.7 billion and the Minimum Capital Required (MCR) totaled R$13.6 billion. In Sept25, the ASE totaled R$21.7 billion and the MCR totaled R$13.5 billion. income from insurance, pension plans and capitalization bonds +16.1% vs. 12M24 Net Income and ROAE The income from the Insurance, Pension Plans and Capitalization operations in 2025 showed an evolution of 16.1% compared to 2024, driven by an increase of 20.6% of the industrial result, mainly due to the improvement of 3.8 p.p. in the claims ratio. In addition, the financial income contributed to a growth of 9.3% in the period. The revenues from insurance premiums, pension contributions and capitalization bonds in the digital channels reached R$6.4 billion in the year of 2025, an evolution of 9.6% compared to 2024. Performance 12M25 vs. 12M24 Revenues Claims Ratio Commission Ratio Financial Income Life and Pension Plans Health Capitalization Bonds - - Property & Casualty and Others R$ million4Q253Q254Q2412M2512M244Q25 vs. 3Q254Q25 vs. 4Q2412M25 vs. 12M24\\ Income StatementPremiums Earned from Insurance, Pension Plan Contribution and Capitalization Bond Income19,373 19,081 16,972 73,707 68,009 1.514.18.4Retained Claims(13,044) (12,485) (10,800) (48,382) (45,950) 4.520.85.3Capitalization Bond Draws and Redemptions(1,563) (1,725) (1,592) (6,455) (6,180) (9.4)(1.8)4.4Commission Expenses(1,397) (1,274) (1,241) (4,948) (4,331) 9.712.614.2Financial Results2,280 2,109 2,192 8,386 7,673 8.14.09.3\\ Income from Insurance, Pension Plans and Capitalization Bonds5,649 5,706 5,531 22,308 19,220 (1.0)2.116.1Fee and Commission Income541 552 486 2,061 1,923 (2.0)11.37.2Personnel Expenses(689) (733) (605) (2,702) (2,270) (6.0)13.919.0Other Administrative Expenses(599) (548) (492) (2,188) (2,069) 9.321.75.8Others(720) (886) (768) (3,063) (1,844) (18.7)(6.3)66.1\\ Operating Income4,182 4,091 4,152 16,416 14,961 2.20.79.7Non-Operating Income / Income Tax / Social Contribution / Non-controlling interests in subsidiaries(1,379) (1,560) (1,618) (6,345) (5,905) (11.6)(14.8)7.5\\ Net Income2,803 2,531 2,534 10,071 9,056 10.710.611.2Life and Pension Plans1,267 1,033 1,288 4,328 5,083 22.7(1.6)(14.8)Health751 883 621 3,376 1,643 (14.9)20.9-Capitalization Bonds183 198 178 761 720 (7.6)2.85.6Property & Casualty and Others602 417 447 1,606 1,610 44.434.7(0.3)\\ Selected Asset DataTotal Assets511,971 496,872 454,846 511,971 454,846 3.012.612.6Securities471,375 458,422 419,489 471,375 419,489 2.812.412.4Technical Provisions445,994 435,244 403,689 445,994 403,689 2.510.510.5Shareholder's Equity (1)47,340 44,491 37,711 47,340 37,711 6.425.525.5Variation% 178 195 185 198 183 914 828 883 751 621 417 602 295 292 447 1,267 1,033 989 1,288 1,039 2,803 2,531 2,294 2,534 2,443 24.3 22.4 21.4 22.4 25.1 4Q24 1Q25 2Q 3Q 4Q Life and Pension Plans Property & Casualty and Others Health Capitalization Bonds ROAE - Quarterly R$ million % Bradesco | Economic and Financial Analysis Report 24 revenues from insurance premiums, pension contributions and capitalization bonds and insurance operating income revenue and administrative efficiency ratio retained claims income from insurance, pension plans and capitalization bonds The income from Insurance, Pension Plans and Capitalization operations closed the year of 2025 with growth of 16.1% compared to 2024, highlighting the good performance of the claims ratio, which in the comparison improved 3.8 p.p., especially in the Health segment. The financing income showed an evolution of 9.3% in the annual comparison. 1,806 1,744 1,894 1,977 1,800 12,069 12,217 12,398 12,933 13,244 2,528 2,318 2,571 2,609 2,577 15,076 13,712 12,331 12,108 12,076 31,479 29,991 29,194 29,627 29,697 3.5 3.8 4.1 4.3 4.3 4Q24 1Q25 2Q 3Q 4Q Life/PA/VGBL/PGBL/Traditional Auto/P&C + DPVAT Health Capitalization Bonds Administrative Efficiency Ratio R$ million % 48,382 35,338 22,853 11,072 45,950 70.9 71.3 71.8 72.5 76.3 12M24 3M25 6M25 9M25 12M25 Retained Claims Claims R$ million % 3,339 3,344 3,612 3,597 3,369 2,192 1,959 2,038 2,109 2,280 5,531 5,303 5,650 5,706 5,649 4Q24 1Q25 2Q 3Q 4Q Financial Results Operating Income R$ million Bradesco | Economic and Financial Analysis Report 25 (1) technical provisions and insurance activity indicators technical provisions Technical provisions totaled R$446.0 billion in December 2025, with an increase of 10.5% in 12 months and 2.5% in the quarter, with higher provisions in the “Life and Pension Plans” and “Health” segments. performance ratios – combined ratio / claims ratio / commission ratio (1) Excluding additional reserves. 403,689 414,273 425,081 435,244 445,994 365,532 375,251 385,151 394,637 404,685 21,023 21,768 22,346 22,855 23,320 9,708 9,852 10,033 10,147 10,267 7,426 7,402 7,551 7,605 7,722 Dec24 Mar25 June Sept Dec Total Reserves Pension Plans and Life / VGBL Health Capitalization Bonds Auto/P&C R$ million 90.6 89.5 93.0 95.4 89.5 97.8 94.0 94.2 91.8 96.0 50.0 51.0 50.5 53.3 43.8 82.8 82.9 84.8 84.4 85.1 4Q24 1Q25 2Q 3Q 4Q Combined Ratio Auto/RE Health Life Total % 57.7 58.7 58.7 56.8 59.1 82.1 83.7 86.1 85.2 80.5 30.9 28.4 26.5 32.4 26.4 24.3 21.0 27.9 19.1 27.4 72.2 70.9 71.7 72.8 74.3 4Q24 1Q25 2Q 3Q 4Q Claims Ratio Auto/Optional Third-Party Liability Health Life/Personal Accidents Property & Casualty Total % 16.8 17.6 17.2 17.5 17.5 4.1 4.1 4.0 3.9 4.4 18.4 18.2 19.6 20.1 15.9 19.1 19.3 19.2 18.5 18.9 7.6 7.5 7.3 7.7 7.3 4Q24 1Q25 2Q 3Q 4Q Comission Ratio Auto/Optional Third-Party Liability Health Life/Personal Accidents Property & Casualty Total % Bradesco | Economic and Financial Analysis Report 26 insurance | additional information number of contracts / clients - bradesco vida e previdência number of policyholders of bradesco saúde, mediservice and bradesco saúde operadora de planos number of auto/P&C policyholders number of clients (capitalization bonds) 25,349 23,022 24,432 24,349 24,480 3,242 3,213 3,222 3,193 3,164 26,264 27,645 27,571 27,673 28,513 Dec24 Mar25 June Sept Dec Pension Plans and VGBL Participants Insurance Contracts - Life, Personal Accidents, and Loss of Income In thousand 3,679 3,667 3,672 3,748 3,823 104 103 102 101 100 3,783 3,770 3,774 3,849 3,923 Dec24 Mar25 June Sept Dec Individual Health Plans Company Health Plans In thousand 1,539 1,590 1,641 1,565 1,676 1,674 1,693 1,712 1,728 1,757 3,433 3,213 3,283 3,353 3,293 Dec24 Mar25 June Sept Dec P&C Auto/Optional Third-Party Liability Inmillion 3,208 3,190 3,159 3,146 3,171 Dec24 Mar25 June Sept Dec In thousand Bradesco | Economic and Financial Analysis Report 27 basel Total Ratio 15.8% Tier I Ratio 13.2% Common Equity Ratio 11.2% In 2025, we observed an increase of 0.7% in the Common Equity and 0.8% in Tier I Capital, while in 4Q25 the variation occurred mainly by the growth of risk-weighted assets (RWA), remaining above regulatory limits. (1) It refers to the minimum required limits, added to the additional contributions of counter-cyclical and systemic capital. It is noteworthy that, as per Resolution No. 4,958/21, the minimum capitals are 9.5% for tier I capital and 8.0% for the common equity. 11.2 0.6 (0.3) (0.5) Sept25 Net Income Remuneration to the Shareholders Risk-Weighted Assets Dec25 Changes in the Tier I Ratio in the Quarter Common Equity Addition Capital Regulatory Limits (1) 9,50% Tier 1 8,00% Common Equity % 2.0 11.4 2.0 - = 13.4 13.2 14.8 15.4 15.5 15.9 15.8 2.4 2.4 2.5 2.5 2.6 10.5 11.1 11.1 11.4 11.2 1.9 1.9 1.9 2.0 2.0 Dec24 Mar25 June Sept Dec % Total Ratio Common Equity Additional Capital Tier I 12.4 13.0 13.0 13.4 13.2 Tier II Bradesco | Economic and Financial Analysis Report 28 guidance, indicators & economic perspectives The following table shows the result achieved in 2025 and our estimates for 2026. guidance indicators economic perspectives 2026 AnnualIndicator Actual12M25 vs. 12M24AnnualIndicatorExpanded Loan Portfolio4% to 8%11.0%8.5% to 10.5%NII Net of Provisions(Net Interest Income - Expanded Loan Loss Provisions)R$37 bi to R$41 biR$ 40 biR$42 bi to R$48 biFee and Commission Income5% to 9%8.9%3% to 5%Operating Expenses(Personnel + Administrative + Other)5% to 9%8.5%6% to 8%Income from Insurance, Pension Plans and Capitalization Bonds9% to 13%16.1%6% to 8%2025 4Q253Q254Q2412M2512M24Interbank Deposit Certificate (CDI)3.59 3.70 2.68 14.32 9.97 Ibovespa10.18 5.32 (8.75) 33.95 (10.36) USD – Commercial Rate3.46 (2.54) 13.66 (11.14) 27.91 General Market Price Index (IGP-M)(0.10) 0.01 3.81 (1.04) 6.53 Extended Consumer Price Index (IPCA)0.60 0.63 1.48 4.26 4.83 Business Days (#)64 66 63 252 253 Calendar Days (#)92 92 92 365 366 \\ Indicators (Closing Rate)USD – Commercial Rate (R$)5.5024 5.3186 6.1923 5.5024 6.1923 CDS 5 years (Points)138 136 215 138 215 Selic - Base Interest Rate (% p.a.)15.00 15.00 12.25 15.00 12.25 BM&F Fixed Rate (% p.a.)13.81 14.34 15.39 13.81 15.39 %20262027USD - Commercial Rate (year-end) - R$5.35 5.40 Extended Consumer Price Index (IPCA)3.8 3.4 General Market Price Index (IGP-M)3.5 3.6 Selic (year-end)12.00 9.50 Gross Domestic Product (PIB)1.5 2.0
|
BANCO BRADESCO S.A. | ||
|
By: |
/S/André Costa Carvalho
| |
| André Costa Carvalho Investor Relations Officer | ||
This press release may contain forward-looking statements. These statements are statements that are not historical facts, and are based on management's current view and estimates of future economic circumstances, industry conditions, company performance and financial results. The words "anticipates", "believes", "estimates", "expects", "plans" and similar expressions, as they relate to the company, are intended to identify forward-looking statements. Statements regarding the declaration or payment of dividends, the implementation of principal operating and financing strategies and capital expenditure plans, the direction of future operations and the factors or trends affecting financial condition, liquidity or results of operations are examples of forward-looking statements. Such statements reflect the current views of management and are subject to a number of risks and uncertainties. There is no guarantee that the expected events, trends or results will actually occur. The statements are based on many assumptions and factors, including general economic and market conditions, industry conditions, and operating factors. Any changes in such assumptions or factors could cause actual results to differ materially from current expectations.