Indicate by check mark whether the registrant by furnishing the information contained in this Form is also thereby furnishing the information to the Commission pursuant to Rule 12g3-2(b) under the Securities Exchange Act of 1934.
Yes _______ No ___X____.
Consolidated Financial Statements 2025 in accordance with International Financial Reporting Standards (IFRS) issued by the International Accounting Standards Boards (IASB) Management Report BRADESCO | Management Report | Consolidated Financial Statements in IFRS 2 Message to Shareholders Throughout our trajectory, we have maintained a firm commitment to serve with excellence, strengthening the brand and reaffirming the relationship of partnership and trust with millions of Brazilians. In 2025, a year marked by a still challenging economic environment and constant changes in the market, our adaptability, resilience and strategic focus were essential. With the commitment and dedication of the teams, we moved forward with consistency in meeting the objectives, preserving the solidity of the operations and expanding initiatives that contribute to the sustainable development of the Country. We believe in the potential of Brazil and the strength of its people, which, with determination, continues to drive economic and social growth. In line with the commitment to transparency and democratization of information, we present in this report a detailed view of the main developments and results achieved in the fiscal year, reinforcing our ethical posture and corporate responsibility. To our shareholders, clients and partners, we thank you for the continued support, the trust in our decisions and the preference that motivates us to move forward, always focusing on delivering value and building an even more promising future. Cidade de Deus, February 04, 2026 Board of Directors and Board of Executive Officers Management Report BRADESCO | Management Report | Consolidated Financial Statements in IFRS 3 Dear Shareholders, We hereby present the Consolidated Financial Statements of Banco Bradesco S.A. related to 2025. We follow all International Financial Reporting Standards (IFRS) practices issued by the International Accounting Standards Board (IASB). Economic Comment The Brazilian economy slowed down in the second half of 2025. The household consumption lost traction throughout the year, responding to the restrictive monetary policy. One-off factors may lead to some re-acceleration of the GDP at the beginning of the year, but our projections indicate a weaker growth in 2026. Inflation closed 2025 within the target range two years above it, with important contributions from exchange rate valuation and accommodation of the economic activity. We believe that deflation will continue in the coming months, allowing the Central Bank of Brazil to start cutting the basic interest rate later this quarter. Uncertainties remain high on the international scene. While the US economy remains resilient, doubts about the US economic policy represent an important risk vector for the global economy. This context is aggravated by geopolitical disputes around the world. Highlights in the period In November 2025, Banco Bradesco S.A. (“Bradesco”) noticed to its shareholders and the market in general the Notice to the Market that Atlântica Hospitais and Participações S.A., a company focused on investment in hospitals, indirectly controlled by Bradesco and Bradseg Participações S.A., firmed an Investment Agreement with Rede D’Or São Luiz S.A. Group for the inclusion of Maternidade São Luiz Star, thus expanding the partnership firmed with Rede D’Or. The expansion of the Partnership is aligned with the strategy of Atlântica to invest in the health sector value chain through partnerships with players established in the operation of hospitals. In December 2025, Bradesco noticed to its shareholders and the market in general, through a Relevant Fact, that the proposal of the Company’s Board of Directors was approved for the payment of complementary interest on own equity, in the total amount of R$3,9 billion, of which R$0.351190748 per common share and R$0.386309823 per preferred share. Closing the fourth quarter of 2025, the Annual Calendar of Corporate Events for 2026 was released and, through a Notice to Shareholders, the planned schedule of the monthly payment of interest on own equity for the fiscal year of 2026, in accordance with the Systematic Monthly Payment of Interest on Own Equity. The disclosure of both documents reinforces Bradesco’s commitment to transparency, predictability and strategic alignment with shareholders and other stakeholders. BRADESCO | Management Report | Consolidated Financial Statements in IFRS 4 . highlighted information 2025 TOTAL DEPOSITS (Dec25 vs. Dec24) R$728.0 bi (+12.2%) R$23.9 bi R$178.4 bi +5.9% y/y EARNINGS PER SHARE BOOK VALUE PER SHARE BOOK NET INCOME R$2.13 common R$2.35 preferred R$16.87 SHAREHOLDERS’ EQUITY (1) MARKET VALUE TIER I CAPITAL R$178.7 bi 13.2% SECURITIES (Dec25 vs. Dec24) R$925.4 bi (+19.4%) FVPL: R$526.9 bi (+49.7%) FVOCI: R$139.0 bi (-11.1%) Amortized Cost: R$259.5 bi (-2.8%) EXPANDED LOAN PORTFOLIO (Dec25 vs. Dec24) R$1,089.2 bi (+11.0%) INDIVIDUALS: R$466.5 bi (+12.7%) COMPANIES: R$622.7 bi (+9.7%) ALLOWANCE FOR EXPANDED LOANS (Dec25 vs. Dec24) R$56.8 bi (-2.6%) INTEREST ON SHAREHOLDERS’ EQUITY R$14.5 bi (gross) +36.4% y/y (1) Equity attributable to shareholders of the parente. +0.8% y/y BRADESCO | Management Report | Consolidated Financial Statements in IFRS 5 Technology and innovation In two years of transformation, technology has become the core value leverage at Bradesco, providing more fluid and personalized customer experience, scalable operational efficiency with agility, security with cyber resilience and real-time prevention. With Agile@Scale, co-managed tribes between business and IT have increased efficiency, quality and value deliveries. In the period, we reduced the lead time by 43% and increased productivity by increasing the volume of deliveries to the business by 118% (vs. Dec23). The implementation of the AI First plan and the consolidation of the Bridge platform have democratized the use of GenAI in products and channels, with governance, security and efficiency at scale. BIA Clients is 100% available to clients and non-clients on the App and WhatsApp, with ~87% resolution in the chat, expanding journeys such as Pix Inteligente and credit and investment support; BIA Corporativa supports 100% of employees; and BIA Tech supports productivity with 70% story writing efficiency and more than a thousand automatic code reviews per month. In addition, we have seen the expansion in the use of AI through various business and support areas, with cases that have shown a real benefit. On Individual App, we have evolved journeys of autonomy and convenience. We have delivered the new bank payment slip search engine, improved navigation and in the Balance/Statement area, we launched payment with balance from other banks without leaving the App through Open Finance and we integrated My Account with the digital wallets. We attribute more precision to interactions with the Digital Profile (algorithm that identifies the preferred channel of the Individual client with a recency, frequency and volume methodology, considering loan purchases), preparing offers and omnichannel service with CRM + BIA. In real estate loans by the App, we have multiple simulation scenarios for amortization and direct debit. Contactless Pix and Automatic Pix have reduced friction in everyday life. Credit card Pix enables transfers using the card limit, credit at the time to the recipient and billing on the next invoice, with a security window in the period between 10pm and 6am and protection reinforcement. In the management of cards through the App, we offer post-purchase spread payment, invoice pre-payment, tracking of the delivery date and checking of points. In cards, we reinforced the digital control. The virtual card was expanded to American Express® and Mastercard (in addition to Visa and ELO), with a new CVV every 48 hours (kept for recurrences) and identification of purchases on the invoice by the last 4 digits. In the App, taking out a loan had the credit analysis in advance and with digital acceptance. In investments, we expanded autonomy and sophistication, providing several products of Ágora on the Bradesco App. The new home brings an always up-to-date portfolio, goals by objectives and smart simulations; accounts opened by the App become automatic Easy Invest (Invest Fácil), and the investment statement has been improved. For our advisors, Cockpit 360 offers unified portfolio checking, integrated management via WhatsApp and expert support. For Corporate clients, we extended investment and withdrawal times (CDB DI, Automatic Redemption, CDB Fácil (Easy) on Net Empresa. The Enterprise and Business platform, in cloud, consolidates payments, programmed payments, overdraft adjustments, sharing of proof of payment and direct debit, with BIA integrated to the service. We have evolved MEI onboarding on Android/iOS with more convenience and security. Tap Bradesco turns the mobile into a Cielo machine with equivalent security; Net Empresa has digital proxy for managing permissions and approving profiles (it does not replace the notary service), and BIA started to generate bank payment slips by WhatsApp with immediate sharing. In foreign exchange, the App offers international transfer, receipt of remittances, purchase of dollar/euro in cash and quotation alert and My Account follows as an international account with debit card accepted in 195 countries, multi-currency panel and automatic exchange. In digital assets, we conducted remittance pilot program with stablecoins and we offer crypto funds in Ágora. To sustain the pace of delivery, we strengthened our techbra community, which integrates the Tech Academy (development platform with upskilling and reskilling audit trails, hands-on content, mentoring, certifications and technical communities), Bradesco.io, a blog that shares the technical knowledge of teams with the market, and an ongoing agenda of Meetups with expert professionals. In parallel, we strengthened strategic partnerships with DIO and The Developer's Conference to attract new talents. There have been more than 2.9 thousand hirings, with reinforcement in the pool of developers. BRADESCO | Management Report | Consolidated Financial Statements in IFRS 6 We closed the last quarter of 2025 with recognitions that reflect consistency and leadership: “Winner in the Americas” at the Gartner Eye on Innovation Awards for Banking & Investing and first place at the Qorus Banking Innovation Awards, both with IDBra, our decentralized blockchain-based digital identity, and the highlight “Champion of the Decade in the Banking Sector” at the 100 Open Startups. For 2026, we continue to evolve with the transformation movement: an AI Powered, more agile, safe and people-centered Bradesco. Products and services for the public sector Exclusive structures serve the Public Sector throughout the country with Business Managers trained to offer products, services and solutions with quality and security to the Executive, Legislative and Judicial branches, federal, state and municipal authorities, as well as municipalities, public foundations, state-owned and mixed capital companies and the Armed and Auxiliary Forces. Every month, more than 10.8 million retirees and pensioners of the INSS receive their benefits at Bradesco, making it the highest payer among all the banks in the country. We have twelve Specialized Structures to assist governments, state capitals, courts, chambers, public prosecutor’s offices, public defender’s offices, and the Brazilian municipalities with the highest GDP. We also have twenty-six Retail Structures serving other municipalities and bodies. Find out more on bradescopoderpublico.com.br. People, Culture & Performance Human Capital is one of the strategic pillars of the Organization, as an important foundation for conducting business. Our Human Capital Management model is based on respect, transparency and continuous investment in employee development. We keep our teams motivated through career growth opportunities, recognitions, training, remuneration and differentiated benefits, as well as valuing diversity and the balance between professional and personal life. Much more than policies and practices, we consolidate a culture of respect disseminated by the awareness of the value of people, their identities and competences. At the end of the period, the Organization had 82,095 employees, 70,550 of Banco Bradesco and 11,545 of Affiliated and foreign companies. The number and proportion of women on the Board of Directors of the company remained stable, with x women (18.2%) occupying these positions, both in 2025 and in 2024. Much more than policies and practices, we consolidate a culture of respect disseminated by the awareness of the value of people, their identities and competences. In line with recent changes in corporate legislation, we reinforce our commitment to gender transparency and equity, presenting detailed information on female representativeness in our organizational structure and the evolution of diversity indicators. Female employees by hierarchical level in Brazil On December 31, 2025 On December 31, 2024 Total % Total % Board of Directors and Executive Board 28 17.7 22 15.1 Superintendence 100 24.0 86 26.5 Management 2,192 33.4 3,480 34.2 Coordenation/Supervision 2,014 43.1 2,651 47.8 Administrative 22,914 49.3 22,594 50.7 Operational 12,789 56.7 12,742 57.5 Apprentice 341 56.8 367 69.9 Intern 1,112 49.2 1,253 49.2 BRADESCO | Management Report | Consolidated Financial Statements in IFRS 7 Gender total remuneration ratio by hierarchical level in Brazil On December 31, 2025 On December 31, 2024 Board of Directors and Executive Board 0.77 0.78 Superintendence 0.91 0.96 Management 0.89 0.90 Coordenation/Supervision 0.96 0.89 Administrative 0.86 0.88 Operational 0.96 0.97 Apprentice 1.00 1.00 Intern 1.00 1.00 Note: In accordance with Law No. 15,177, which establishes the demonstration of the proportionality of compensation between men and women, we inform: (I) Total compensation for 2025 includes estimates for variable compensation to be awarded; (II) The calculated ratios consider the total compensation by hierarchical level, in accordance with the compensation components required by the legislation; (III) The proportion of the compensation presented reflects the current composition of the staff, which varies between areas, hierarchical levels and functions. Thus, the observed differences may result from this distribution, not allowing isolated conclusions on unequal treatment, in line with the company's commitment to equity and transparency; and (IV) The working hours of apprentices and interns were adjusted to enable a more accurate assessment of the gender gap. For more information on People, Culture & Performance, visit the Human Capital Report, available on bradescori.com.br. Sustainability for Bradesco Sustainability is one of our strategic drivers, also expressed in our Statement of Purpose. We believe that consistent performance in governance, management and engagement in environmental, social and governance (ESG) aspects are fundamental to sustainable growth and the generating long-term value for all our stakeholders. Our Sustainability Strategy is aligned with the Sustainable Development Goals (ONU), and it is based on ESG management and transparency. We remain committed to sustainable business financing and supporting our clients in the transition to a greener and inclusive economy, keeping a close eye on associated risks and opportunities. The corporate goal to allocate R$350 billion to sectors and activities with socio-environmental benefits over the 2021–2025 period was surpassed, achieving 109% execution by the end of the cycle, with total allocations of R$381.9 billion, underscoring the scale and continuity of this agenda. We commit to directing a cumulative R$450 billion by December 2026, a target that includes the accumulated volume since 2021. During COP30, we announced the creation of Ecora, a Brazilian carbon credit certification company, in partnership with the BNDES and EcoGreen fund, with technical support from Aecom. The initiative represents an investment in future capacity, aimed at strengthening the infrastructure of the carbon market in Brazil. Our performance in sustainability has been recognized in the main national and international indexes and ratings, such as the Dow Jones Sustainability Index of the New York Stock Exchange and the Corporate Sustainability Index (ISE) of B3. These indexes reflect our management and performance in long-term economic, environmental and social criteria. To keep up with our initiatives, visit bradescori.com.br / bradescosustentabilidade.com.br. Corporate Governance Bradesco observes and encourages good corporate governance practices, based mainly on legal and market demands, in order to ensure the interests of shareholders and other stakeholders. Our structure is well defined, enabling the guarantee and viability of adopting best practices. Thus, we make every effort to always be in compliance with such standards, seeking to generate sustainable value for our Organization. The Shareholders’ Meeting is the most important corporate event of our governance. In this meeting, the shareholders elect the members of the Board of Directors for a single two-year term of office. It is composed of eleven members, four of which are independent members. The body is responsible for establishing, supervising and monitoring the Banco Bradesco’s corporate strategy, whose responsibility for implementation is of the Board of Executive Officers, in addition to reviewing the business action plans and BRADESCO | Management Report | Consolidated Financial Statements in IFRS 8 policies. The positions of Chairman of the Board of Directors and Chief Executive Officer, under the Company’s Bylaws, are not cumulative. Assisted by a Governance Department, the Board of Directors ordinarily meets twelve times a year, and extraordinarily, when the interests of the company so require. We also have Global Internal Audit, which is reports to the Board of Directors, in addition to seven committees, which also report to them. Of these, two are the statutory ones, which are the Audit and Remuneration Committees; and five are non-statutory ones, which are the Integrity & Ethical Conduct, Risks, Sustainability & Diversity, Nomination & Succession, and Strategy Committees. Banco Bradesco’s Board is the body responsible for representing the Organization, and the Board of Executive Officers is responsible for coordinating the execution of the strategy approved by the Board of Directors. It holds regular meetings every fortnight and special meetings whenever necessary, deliberating all subjects and matters essential to the fulfillment of our objectives and attributions. Executive Committees assist in the activities of the Board of Executive Officers, all regulated by their own bylaws. In the role of Supervisory Body for the acts of the managers, and with permanent performance, we have the Fiscal Council, also elected by the shareholders and with a single term of one year. It is composed of five effective members, two of them are elected by minority shareholders and their respective alternates. Our Organization is listed in Level 1 of Corporate Governance of B3 – Brazilian Exchange & OTC, and our practices attest to our commitment to the generation of value for shareholders, employees and society. Further information on corporate governance is available on the Investor Relations website (bradescori.com.br – Corporate Governance section). Internal Audit It is the responsibility of the Global Internal Audit Department, which is subordinate and reports functionally, administrative and operationally to the Board of Directors of Banco Bradesco S.A., to consider, in the scope of its examinations/analyses, the effectiveness of corporate governance and risk management and controls; the reliability, effectiveness and integrity of management and operational information systems and processes; compliance with the legal, infralegal, regulatory framework, internal rules and codes of conduct applicable to members of the staff of the Organization; and the safeguarding of assets against their strategic goals and objectives. The work is based on adherence to the mandatory elements of the International Standards for Auditing Practice (IPPF - International Professional Practices Framework) of The Institute of Internal Auditors (IIA), the Code of Sector Ethics of the Internal Auditors of the Bradesco Organization and the internal guidelines defined by the Internal Audit within the scope of the Bradesco Organization and, where applicable, of third parties/suppliers. Policy for distribution of dividends and interest on shareholders’ equity As minimum mandatory dividends, shareholders are entitled to 30% of the net income after legal deductions, in addition to the Tag Along of 100% for the common shares and of 80% for the preferred shares. Also, granted to the preferred shares are dividends 10% higher than those given to the common shares. Bradesco’s Shares, with high level of liquidity (BBDC4), accounted for 3.9% of Ibovespa as of December 31, 2025. Our shares are also traded abroad, on the New York Stock Exchange, by means of ADR – American Depositary Receipt – Level 2, and on the Stock Exchange of Madrid, Spain, through DRs, which integrate the Latibex Index. Bradesco’s securities also took part in other important indexes, such as the Special Tag-Along Stock Index (ITAG), the Special Corporate Governance Stock Index (IGC), and the Brazil Indexes (IBrX50 and IBr100). Bradesco’s presence in these indexes strengthens our constant search for the adoption of good practices of corporate governance, economic efficiency, socio-environmental ethics and responsibility. BRADESCO | Management Report | Consolidated Financial Statements in IFRS 9 Corporate Risk Management Corporate risk management occurs in an integrated and independent manner, preserving and valuing collegiate decisions, developing and implementing methodologies, models and measurement and control tools. Adverse impacts may result from multiple factors and are reduced through the framework of risks and a sound governance structure, which involves the Integrated Risk Management and Capital Allocation Committee, the Risk Committee and the Board of Directors. The Bradesco Organization has extensive operations in all segments of the market, and, like any large institution, is exposed to various risks. Thus, risk management is strategically highly important due to the increasing complexity of the products and services and, also, the globalization of our business. We constantly adopt mechanisms of identification and monitoring, making it possible to anticipate the development and implementation of actions to minimize any adverse impacts. According to the list of risks, the relevant risks for the Organization are: Solvency and Profitability, Liquidity, Credit, Market, Operational, Compliance, Cybersecurity, Strategy, Social, Environmental, Climate, Model, Contagion, Reputation and Subscription. In an attempt to precipitate or reduce effects, in case they occur, we seek to identify and monitor any emerging risks, among them, issues related to global growth, international geopolitical issues and the economic and fiscal situation of Brazil. We also consider the risks posed by technological innovation in financial services. Independent Evaluation of Models Models are quantitative tools that provide a synthesis of complex issues, the standardization and automation of decision making, and the possibility of reusing internal and external information. This improves efficiency both by reducing the costs associated with manual analysis and decision making and by increasing accuracy. Its use is an increasingly widespread practice, especially due to technological advances and new artificial intelligence techniques. We use models to support the decision-making process and to provide predictive information in various areas of the business, such as risk management, capital calculation, stress testing, pricing, as well as other estimates from models to assess financial or reputation impacts. When it comes to simplifications of reality, models are subject to risks, which can lead to adverse consequences due to decisions based on incorrect or obsolete estimates or even inappropriate use. In order to identify and mitigate these risks, the Independent Model Validation Area (AVIM), with subordination to the Chief Financial Officer (CFO), it monitors the limitations and weaknesses of the models and respective action plans. Creates reports for the respective managers, the Internal Audit, and the Commission Models and Risk Committees. Concurrently, plays an active role in strengthening model usage by fostering a modeling culture and promoting the dissemination of best practices across the organization. Compliance, Integrity, Ethics and Competition Seen as foundations of our values and drivers of daily interactions and decisions, the Compliance, Integrity and Competition Programs cover the entire Bradesco Organization, also extending to suppliers, services providers, business partners and correspondents in Brazil, and subsidiaries, elucidating the high standards of compliance, integrity, conduct and ethical principles that we have. These principles are supported by policies, internal standards and training programs for professionals by aggregating excellence in procedures and controls and seeking prevention, identification, and reporting of Compliance Risks and any actions considered as a violation of the Code of Ethical Conduct, and/or indications of illegal activities, aimed at the adoption of appropriate measures. The control methodologies and procedures are objects of evaluation and constant improvement, in accordance with current and applicable laws and regulations, as well as with the best market practices and the support of the Organization’s Board of Directors. BRADESCO | Management Report | Consolidated Financial Statements in IFRS 10 Independent Audit In compliance with the CVM Resolution No. 162/22 the Bradesco Organization has an Independent Audit Hiring Policy with guidelines in line with the applicable laws and regulations. The Bradesco Organization hired services from KPMG Auditores Independentes Limited not related to the Financial Statements Consolidated Audit. These non-audit services do not constitute a conflict of interest or loss of independence in the execution of the audit work of the financial statements, in accordance with the Organization’s internal policies, as well as with the auditor's independence rules. Information related to the audit fees is made available annually in our Reference Form. Social Investments FUNDAÇÃO BRADESCO Founded in 1956, Fundação Bradesco is the largest private social investment project in the country. Since it was established, it has invested in education as the cornerstone of the comprehensive development of children and young people throughout the country by promoting free education and standards of excellence on a wide range of levels. All 40 school units are proprietary and are distributed in the 26 Brazilian states and the Federal District. They have primarily been set up in regions where there is severe socioeconomic vulnerability, helping to develop the region through the transformational impact on the lives of students and the communities around them, thereby shifting the educational reality of the entire country. Fundação Bradesco supports each of its Basic Education students for approximately 13 years, equipping them with all the items needed to ensure equal learning in all regions of Brazil. These investments will enable: Recognitions 4Q25 • Bradesco Asset é a única gestora tripremiada pela FGV, nas categorias: Melhor gestora do Brasil, Melhor banco para investir em fundos e Melhor gestora de previdência privada. • Bradesco é o banco mais bem avaliado na categoria gestão de fundos, pelo Guia FGV de Fundos de investimentos. • O Bradesco, a 3° empresa brasileira a ser reconhecida pelo ranking global da Forbes, foi destaque como World’s Top Companies For Women, que reconhece as empresas com o maior compromisso com a equidade de gênero. • O Bradesco foi reconhecido como destaque nacional no Prêmio Transformação Digital Brasil – Ozires Silva, conquistanto a categoria Ouro em Desempenho com o case “IA e agilidade ampliam a centralidade no cliente”. R$1.2 billion are allocated for Activity Expenses. SCHOOL NETWORK Over 42,000 students will benefit primarily in Basic Education – Early Childhood Education to High School and Technical Professional Education throughout Brazil. VIRTUAL SCHOOL Around 2.0 million users are expected to complete at least one of the free crash courses available on the portal. R$258 million are for investments in infrastructure and Educational Technology. R$ 1.4 billion Investment made in 2025 BRADESCO | Management Report | Consolidated Financial Statements in IFRS 11 • Pela 6° vez, e a segunda consecutiva, a Bradesco Asset Management foi eleita a melhor gestora de fundos, pela FGV. • O Bradesco foi reconhecido pelo Banking Innovation Awards 2025 na categoria Products & Services. O prêmio destaca iniciativas consistentes e inovadoras. • O Teatro Bradesco foi reconhecido pela Folha de S.Paulo como o teatro mais confortável da cidade. • O Bradesco foi eleito como um Lugares Mais Incríveis para Trabalhar pela FIA Business School e pelo ESTADÃO. • O Bradesco foi o vencedor da edição 2025 do Gartner Eye on Innovation Awards for Banking & Investing, conquistando o primeiro e segundo lugar entre as 74 soluções inovadoras selecionadas em todo o continente americano. Acknowledgements The results presented in the third quarter confirm that the Bradesco Organization’s strategy is aligned with the challenges and transformations of the current market. Every accomplishment achieved is the result of the dedication of our employees and the trust of our shareholders and clients. It is this solid partnership that drives us to move forward, with responsibility, innovation and commitment to excellence. Thank you all. Cidade de Deus, February 04, 2026 Board of Directors and Board of Executive Officers BRADESCO | Consolidated Financial Statements in IFRS 12 Consolidated Financial Statements in IFRS | Table of Contents Consolidated Statements of Financial Position ................................................................................................................................................... 13 Consolidated Statements of Income ..................................................................................................................................................................... 14 Consolidated Statements of Comprehensive Income ....................................................................................................................................... 15 Consolidated Statements of Changes in Equity ............................................................................................................................................ 16-17 Consolidated Statements of Cash Flows ........................................................................................................................................................ 18-19 Notes to the Consolidated Financial Statements ...................................................................................................................................... 20-153 Independent Auditor’s Report....................................................................................................................................................................... 155-162 Audit Committee Report ....................................................................................................................................................................................... 163 Fiscal Council’s Report ........................................................................................................................................................................................... 164 Index of Notes to the Consolidated Financial Statements 1) GENERAL INFORMATION ....................................................... 20 2) MATERIAL ACCOUNTING POLICIES ..................................... 20 3) NEW STANDARDS AND AMENDMENTS AND INTERPRETATIONS OF EXISTING STANDARDS .................. 47 4) ESTIMATES AND JUDGMENTS .............................................. 49 5) CASH, CASH EQUIVALENTS AND BALANCES WITH BANKS .................................................................................................... 51 6) FINANCIAL ASSETS AND LIABILITIES MEASURED AT FAIR VALUE THROUGH PROFIT OR LOSS .................................... 52 7) DERIVATIVE FINANCIAL INSTRUMENTS ............................. 52 8) FINANCIAL ASSETS MEASURED AT FAIR VALUE THROUGH OTHER COMPREHENSIVE INCOME ...................................... 60 9) BONDS AND SECURITIES AT AMORTIZED COST ................ 61 10) LOANS AND ADVANCES TO FINANCIAL INSTITUTIONS ... 62 11) LOANS AND ADVANCES TO CUSTOMERS .......................... 63 12) NON-CURRENT ASSETS HELD FOR SALE ........................... 73 13) INVESTMENTS IN ASSOCIATES AND JOINT VENTURES ... 74 14) PROPERTY AND EQUIPMENT ................................................ 76 15) INTANGIBLE ASSETS AND GOODWILL ................................ 78 16) OTHER ASSETS ....................................................................... 79 17) DEPOSITS FROM BANKS ....................................................... 79 18) DEPOSITS FROM CUSTOMERS ............................................. 79 19) FUNDS FROM SECURITIES ISSUED ...................................... 80 20) SUBORDINATED DEBT ............................................................ 81 21) INSURANCE CONTRACTS ...................................................... 82 22) PROVISIONS, CONTINGENTS ASSETS AND LIABILITIES ... 89 23) OTHER LIABILITIES ................................................................. 92 24) LOAN COMMITMENTS, FINANCIAL GUARANTEES AND SIMILAR INSTRUMENTS…………………………………………………….93 25) EQUITY ..................................................................................... 94 26) EARNINGS PER SHARE ........................................................... 96 27) NET INTEREST INCOME ......................................................... 97 28) FEE AND COMMISSION INCOME .......................................... 97 29) NET GAINS/(LOSSES) ON FINANCIAL ASSETS AND LIABILITIES MEASURED AT FAIR VALUE THROUGH PROFIT OR LOSS ................................................................................... 98 30) NET GAINS/(LOSSES) ON FINANCIAL ASSETS MEASURED AT FAIR VALUE THROUGH OTHER COMPREHENSIVE INCOME .................................................................................... 98 31) NET GAINS/(LOSSES) ON FOREIGN CURRENCY TRANSACTIONS ...................................................................... 98 32) GROSS PROFIT FROM INSURANCE AND PENSION PLANS ……… .......................................................................................... 98 33) PERSONNEL EXPENSES ......................................................... 98 34) OTHER ADMINISTRATIVE EXPENSES .................................. 98 35) DEPRECIATION AND AMORTIZATION ................................. 99 36) OTHER OPERATING INCOME/(EXPENSES) ......................... 99 37) INCOME TAX AND SOCIAL CONTRIBUTION ..................... 100 38) OPERATING SEGMENTS ...................................................... 104 39) TRANSACTIONS WITH RELATED PARTIES ....................... 108 40) RISK MANAGEMENT .............................................................. 110 41) SUPPLEMENTARY PENSION PLANS ................................... 148 42) OTHER INFORMATION .......................................................... 152 BRADESCO | Consolidated Financial Statements in IFRS 13 Consolidated Financial Statements in IFRS | Consolidated Statements of Financial Position R$ thousands Note On December 31, 2025 On December 31, 2024 Assets Cash and balances with banks 5 137,031,197 146,614,670 Financial assets measured at fair value through profit or loss 6a 547,789,769 371,883,348 Financial assets measured at fair value through other comprehensive income 8 138,998,105 156,292,584 Financial assets at amortized cost 1,312,915,509 1,216,802,612 - Loans and advances to financial institutions, net of provision for expected credit losses 10 235,485,054 196,233,298 - Loans and advances to customers, net of provision for expected credit losses 11 744,457,062 672,382,105 - Securities, net of provision for expected credit losses 9 259,546,571 266,991,967 - Other financial assets 16 73,426,822 81,195,242 Non-current assets held for sale and discontinued operations 12 3,757,502 3,494,950 Investments in associates and joint ventures 13 13,283,440 11,029,012 Property and equipment 14 9,405,491 10,220,444 Intangible assets and goodwill 15 25,739,659 23,749,208 Current income and other tax assets 12,884,446 11,764,176 Deferred income tax assets 37 111,237,606 101,808,543 Other assets 16 17,284,492 15,824,815 Total assets 2,330,327,216 2,069,484,362 Liabilities Financial liabilities at amortized cost - Deposits from banks 17 427,099,494 361,818,310 - Deposits from customers 18 721,274,151 644,338,463 - Securities issued 19 306,260,682 257,977,344 - Subordinated debt 20 54,714,526 57,458,927 - Other financial liabilities 23 117,391,205 101,086,011 Financial liabilities measured at fair value through profit or loss 6c 18,268,330 16,240,611 Other financial instruments with credit risk exposure - Loan Commitments 11 1,815,386 2,447,791 - Financial guarantees 11 1,266,804 1,257,645 Insurance contract liabilities 21 419,715,476 378,792,820 Other provisions 20,563,201 20,033,774 Current income tax liabilities 2,003,486 2,043,616 Deferred income tax liabilities 37c 1,895,931 1,664,666 Other liabilities 23 59,109,914 55,381,892 Total liabilities 2,151,378,586 1,900,541,870 Equity 25 Capital 87,100,000 87,100,000 Treasury shares (168,625) (568,728) Capital reserves 35,973 35,973 Profit reserves 90,644,101 84,532,203 Additional paid-in capital 70,496 70,496 Accumulated other comprehensive income/(loss) 804,043 (250,645) Retained (losses) (70,835) (2,509,646) Equity attributable to shareholders of the parent 178,415,153 168,409,653 Non-controlling interests 533,477 532,839 Total equity 178,948,630 168,942,492 Total equity and liabilities 2,330,327,216 2,069,484,362 The Notes are an integral part of the Consolidated Financial Statements. BRADESCO | Consolidated Financial Statements in IFRS 14 Consolidated Financial Statements in IFRS | Consolidated Statements of Income R$ thousands Note Years ended December 31 2025 2024 2023 Interest and similar income 267,113,345 211,733,717 211,458,474 Interest and similar expenses (193,843,753) (144,279,153) (156,376,055) Net interest income 27 73,269,592 67,454,564 55,082,419 Fee and commission income 28 31,073,646 28,336,487 26,956,763 Net gains/(losses) on financial assets and liabilities measured at fair value through profit or loss 29 3,165,516 (2,249,836) 10,895,796 Net gains/(losses) on financial assets measured at fair value through other comprehensive income (99,338) 1,031,353 1,841,022 Net gains/(losses) on foreign currency transactions 3,583 2,704,502 262,501 Insurance services result 32 11,331,343 8,942,260 5,235,711 - Insurance and pension income 61,111,265 57,340,928 51,252,827 - Insurance and pension expenses (49,779,922) (48,398,668) (46,017,116) Other operating income 14,401,104 10,428,279 18,235,030 Expected credit losses on loans and advances 11 (28,677,857) (26,636,777) (30,176,989) Expected credit losses on other financial assets 8 and 9 (930,103) (889,156) (1,940,035) Personnel expenses 33 (24,442,062) (22,277,310) (20,814,458) Other administrative expenses 34 (16,072,374) (16,582,966) (16,286,260) Depreciation and amortization 35 (7,063,267) (6,371,096) (6,025,244) Other operating income/(expenses) 36 (22,696,722) (18,093,096) (16,924,556) Operating expenses (99,882,385) (90,850,401) (92,167,542) Income before income taxes and share of profit of associates and joint ventures 18,861,957 15,368,929 8,106,670 Share of profit of associates and joint ventures 13 2,162,627 1,531,585 2,101,681 Income before income taxes 21,024,584 16,900,514 10,208,351 Income tax benefit/(expense) 37 2,900,052 641,639 4,294,414 Net income 23,924,636 17,542,153 14,502,765 Attributable to shareholders: Shareholders of the parent 23,672,706 17,252,900 14,251,329 Non-controlling interests 251,930 289,253 251,436 Basic and diluted earnings per share based on the weighted average number of shares outstanding (expressed in R$ per share): – Earnings per common share 26 2.13 1.55 1.27 – Earnings per preferred share 26 2.35 1.71 1.41 The Notes are an integral part of the Consolidated Financial Statements. BRADESCO | Consolidated Financial Statements in IFRS 15 Consolidated Financial Statements in IFRS | Consolidated Statements of Other Comprehensive Income Note R$ thousands Years ended December 31 2025 2024 2023 Net income 23,924,636 17,542,153 14,502,765 Items that are or may be reclassified to the consolidated statement of income Financial assets measured at fair value through other comprehensive income - Net change in fair value 1,678,554 (9,562,432) 7,174,835 - Gains/(Losses) reclassified to statement of income 30 (99,338) 1,031,353 1,841,022 - Tax effect (608,851) 3,611,789 (3,713,554) Unrealized gains/(losses) on hedge 7 - Cash flow hedge (368,425) 973,180 738,831 - Hedge of investment abroad 328,791 (833,498) (5,799) - Tax effect 8,889 (47,218) (343,838) Foreign currency translation differences of foreign operations (172,692) 417,975 11,915 Items that will not be reclassified to the consolidated statement of income Net change in fair value of equity instruments measured at fair value through other comprehensive income (864,846) (2,225,375) (956,499) Tax effect 306,222 787,343 331,966 Other 846,384 2,436,465 (1,200,819) Total other comprehensive income/(loss) 1,054,688 (3,410,418) 3,878,060 Total comprehensive income 24,979,324 14,131,735 18,380,825 Attributable to shareholders: Shareholders of the parent 24,727,394 13,842,482 18,129,389 Non-controlling interests 251,930 289,253 251,436 The Notes are an integral part of the Consolidated Financial Statements. BRADESCO | Consolidated Financial Statements in IFRS 16 Consolidated Financial Statements in IFRS | Consolidated Statements of Changes in Equity R$ thousands Capital Treasury shares Capital reserves Profit reserves Additional paid-in capital Other comprehensive income/(loss) Retained (losses) Equity attributable to controlling shareholders of the parent Noncontrolling shareholders Total Legal Statutory Balance on January 1, 2023 87,100,000 (224,377) 35,973 12,584,615 60,558,807 70,496 (718,287) 127,704 159,534,931 475,906 160,010,837 Net income - - - - - - - 14,251,329 14,251,329 251,436 14,502,765 Financial assets measured at fair value through other comprehensive income and gains and losses on hedge - - - - - - 5,066,964 - 5,066,964 - 5,066,964 Foreign currency translation adjustment - - - - - - 11,915 - 11,915 - 11,915 Other - - - - - - (1,200,819) (22,551) (1,223,370) - (1,223,370) Comprehensive income - - - - - - 3,878,060 14,228,778 18,106,838 251,436 18,358,274 Increase of non-controlling shareholders' interest - - - - - - - - - (23,183) (23,183) Transfers to reserves - - - 756,090 3,054,908 - - (3,810,998) - - - Cancellation of treasury shares - 224,377 - - (224,377) - - - - - - Interest on equity - - - - - - - (11,310,804) (11,310,804) (21,000) (11,331,804) Balance on December 31, 2023 87,100,000 - 35,973 13,340,705 63,389,338 70,496 3,159,773 (765,320) 166,330,965 683,159 167,014,124 Net income - - - - - - - 17,252,900 17,252,900 289,253 17,542,153 Financial assets measured at fair value through other comprehensive income and gains and losses on hedge - - - - - - (6,264,858) - (6,264,858) - (6,264,858) Foreign currency translation adjustment - - - - - - 417,975 - 417,975 - 417,975 Other - - - - - - 2,436,465 88,222 2,524,687 - 2,524,687 Comprehensive income/(loss) - - - - - - (3,410,418) 17,341,122 13,930,704 289,253 14,219,957 Increase of non-controlling shareholders' interest - - - - - - - - - (4,002) (4,002) Transfers to reserves - - - 954,273 6,847,887 - - (7,802,160) - - - Acquisition of treasury shares - (568,728) - - - - - - (568,728) - (568,728) Interest on equity - - - - - - - (11,283,288) (11,283,288) (435,571) (11,718,859) Balance on December 31, 2024 87,100,000 (568,728) 35,973 14,294,978 70,237,225 70,496 (250,645) (2,509,646) 168,409,653 532,839 168,942,492 Net income - - - - - - - 23,672,706 23,672,706 251,930 23,924,636 Financial assets measured at fair value through other comprehensive income and gains and losses on hedge - - - - - - 380,996 - 380,996 - 380,996 Foreign currency translation adjustment - - - - - - (172,692) - (172,692) - (172,692) Other - - - - - - 846,384 - 846,384 - 846,384 Comprehensive income/(loss) - - - - - - 1,054,688 23,672,706 24,727,394 251,930 24,979,324 BRADESCO | Consolidated Financial Statements in IFRS 17 Consolidated Financial Statements in IFRS | Consolidated Statements of Changes in Equity R$ thousands Capital Treasury shares Capital reserves Profit reserves Additional paid-in capital Other comprehensive income/(loss) Retained (losses) Equity attributable to controlling shareholders of the parent Noncontrolling shareholders Total Legal Statutory Increase of non-controlling shareholders' interests - - - - - - - - - (251,292) (251,292) Transfers to reserves - - - 1,061,695 5,672,927 - - (6,734,622) - - - Acquisition of treasury shares - (222,621) - - - - - - (222,621) - (222,621) Cancellation of treasury shares - 622,724 - - (622,724) - - - - - - Interest on equity - - - - - - - (14,499,273) (14,499,273) - (14,499,273) Balance on December 31, 2025 87,100,000 (168,625) 35,973 15,356,673 75,287,428 70,496 804,043 (70,835) 178,415,153 533,477 178,948,630 The Notes are an integral part of the Consolidated Financial Statements. BRADESCO | Consolidated Financial Statements in IFRS 18 Consolidated Financial Statements in IFRS | Consolidated Statements of Cash Flows R$ thousands Years ended December 31 2025 2024 2023 Operating activities Income before income taxes 21,024,584 16,900,515 10,208,351 Adjustments to reconcile income before income tax to net cash flow from operating activities: Expected credit losses on loans and advances 28,677,857 26,636,776 30,176,989 Change in insurance contract liabilities 38,744,724 36,983,145 42,456,177 Net (gains)/losses on financial assets measured at fair value through other comprehensive income 99,338 (1,031,353) (1,841,022) Expenses with provisions and provisions and legal proceedings 8,651,252 5,962,311 6,339,505 Impairment of financial assets 930,103 889,156 1,940,035 Depreciation 2,445,475 2,624,029 2,626,085 Amortization of intangible assets 4,617,792 4,110,451 3,894,031 Share of profit of associates and joint ventures (2,162,627) (1,531,585) (2,101,681) (Gains)/losses on disposal of non-current assets held for sale and discontinued operations (183,210) 4,610 (69,294) (Gains)/Losses from disposal of property and equipment 128,824 (206,129) (139,024) (Gains)/Losses on the sale of investments in associates (75,760) 9,572 14,350 Effect of changes in foreign exchange rates on cash and cash equivalents 88,334 305,225 (239,325) (Increase) in assets (477,695,664) (243,462,720) (280,034,814) Compulsory deposits with the Central Bank (1,593,070) (269,843) (15,544,506) Loans and advances to financial institutions (42,394,365) 34,811,727 (35,005,630) Loans and advances to customers (222,988,685) (222,987,244) (111,830,757) Financial assets measured at fair value through profit or loss (179,396,550) 10,561,049 (85,699,349) Other assets (31,322,994) (65,578,409) (31,954,572) Increase in Liabilities 305,928,405 187,376,170 180,319,296 Deposits from banks 115,125,195 75,764,307 79,263,662 Deposits from customers 133,119,132 65,790,467 82,532,445 Financial liabilities measured at fair value through profit or loss 2,027,719 698,391 2,200,896 Insurance contract liabilities 2,177,932 (2,982,547) (2,419,920) Other provisions (8,121,825) (8,266,381) (6,649,634) Other liabilities 61,600,252 56,371,933 25,391,847 Cash generated by/(used in) operations (68,780,573) 35,570,173 (6,450,341) Interest received 119,910,827 102,544,122 102,617,786 Interest paid (106,027,455) (80,755,464) (88,961,324) Income tax and social contribution paid (7,636,799) (7,130,346) (7,383,749) Net cash provided by/(used in) operating activities (62,534,000) 50,228,485 (177,628) Investing activities (Acquisitions) of subsidiaries, net of cash and cash equivalents - (211,140) (84,767) (Acquisition) of financial assets measured at fair value through other comprehensive income (106,441,298) (82,179,390) (61,444,346) Disposal of financial assets measured at fair value through other comprehensive income 114,540,219 59,625,006 112,549,913 Maturity of financial assets at amortized cost 118,844,153 73,546,725 41,071,327 (Acquisition) of financial assets at amortized cost (106,760,956) (75,033,463) (47,841,394) Disposal of non-current assets held for sale and discontinued operations 1,120,065 614,125 640,484 (Acquisitions) of investments in associates (2,889,926) (1,160,720) (14,333) Disposal of investments in associates 65,458 - - Dividends and interest on equity received 401,192 479,427 978,932 (Acquisition) of property and equipment (5,022,225) (2,296,075) (1,953,063) Proceeds from sale of property and equipment 1,135,547 590,570 1,350,060 (Acquisition) of intangible assets (6,608,243) (5,752,383) (7,187,567) Interest received on financial assets at FVTPL and amortized cost 51,446,230 26,763,769 45,540,986 Net cash provided by / (used in) investing activities 59,830,216 (5,013,549) 83,606,232 Financing activities Funds from securities issued 156,468,949 54,734,757 105,259,934 Payments on securities issued (110,395,146) (56,728,025) (87,026,367) BRADESCO | Consolidated Financial Statements in IFRS 19 Consolidated Financial Statements in IFRS | Consolidated Statements of Cash Flows R$ thousands Years ended December 31 2025 2024 2023 Funds from subordinated debt issued 8,059,200 9,000,300 1,129,800 Payments on subordinated debt (12,484,908) (5,313,269) (3,569,094) Lease payments (1,538,211) (1,403,269) (1,665,781) Non-controlling shareholders (251,292) (439,572) (44,182) Interest paid on financing liabilities (39,516,788) (16,416,686) (28,219,163) Interest on equity/dividends paid (11,834,032) (6,541,998) (8,927,917) Acquisition of treasury shares (222,621) (568,728) - Net cash provided by/(used in) financing activities (11,714,849) (23,676,490) (23,062,770) (Decrease)/increase in cash and cash equivalents (14,418,633) 21,538,446 60,365,834 Cash and cash equivalents At the beginning of the period 208,023,801 186,790,580 126,185,421 Effect of changes in foreign exchange rates on cash and cash equivalents (88,334) (305,225) 239,325 At period end 193,516,834 208,023,801 186,790,580 Increase in cash and cash equivalents (14,418,633) 21,538,446 60,365,834 The Notes are an integral part of the Consolidated Financial Statements. BRADESCO | Consolidated Financial Statements in IFRS 20 Consolidated Financial Statements in IFRS | Notes to the Consolidated Financial Statements 1) GENERAL INFORMATION Banco Bradesco S.A. (“Bradesco”, the “Bank”, the “Company” or, together with its subsidiaries, the “Organization”) is a publicly traded company established according to the laws of the Federative Republic of Brazil with headquarters in the city of Osasco, state of São Paulo, Brazil. Bradesco is a bank that provides multiple services within two segments: banking and insurance. The Bank is subject to the Brazilian banking regulations and operates throughout all of Brazil. The banking segment includes a range of banking activities, serving individual and corporate customers in the following operations: investment banking, national and international banking operations, investment fund management and consortium administration. The insurance segment covers life, pension, health and non-life portfolio. The retail banking products include demand deposits, savings deposits, time deposits, mutual funds, foreign exchange services and a range of loans and advances, including overdrafts, credit cards and loans with repayments in installments. The services provided to corporate entities include fund management and treasury services, foreign exchange operations, corporate finance and investment banking services, hedge and finance operations including working capital financing, lease and loans with repayments in installments. These services are provided, mainly, in domestic markets, but also include international services on a smaller scale. The Company was originally listed on the São Paulo Stock Exchange (“B3”) and then subsequently on the New York Stock Exchange (“NYSE”). The consolidated financial statements were approved by the Board of Directors on February 04, 2026. 2) MATERIAL ACCOUNTING POLICIES These consolidated financial statements were prepared in accordance with International Financial Reporting Standards Accounting Standards as issued by the International Accounting Standards Board (IFRS Accounting Standards). The preparation of the consolidated financial statements requires the use of estimates and assumptions which affect the reported amounts of assets and liabilities, as well as the disclosure of contingent assets and liabilities at the date of the consolidated financial statements, and the profit and loss amounts for the year. The consolidated financial statements also reflect various estimates and assumptions including, but not limited to: adjustments to the provision for expected credit losses associated with the credit risk of financial assets and liabilities; estimates of the fair value of financial instruments; depreciation and amortization rates; impairment losses on non-financial assets; the useful life of intangible assets; evaluation of the realization of deferred tax assets; assumptions for the calculation of insurance contract liabilities; provisions for contingencies and provisions for potential losses arising from fiscal and tax uncertainties. The areas involving a higher degree of judgment or complexity or areas where assumptions and estimates are significant to the consolidated financial statements, are disclosed in Note 4. The accounting policies described below have been applied in all periods presented and by all entities within the Organization, including equity-accounted investees. BRADESCO | Consolidated Financial Statements in IFRS 21 Consolidated Financial Statements in IFRS | Notes to the Consolidated Financial Statements Some numbers included in these consolidated financial statements have been subject to rounding adjustments. Therefore, the values indicated as totals in some tables may not be the arithmetic sum of the numbers that precede them. BRADESCO | Consolidated Financial Statements in IFRS 22 Consolidated Financial Statements in IFRS | Notes to the Consolidated Financial Statements a) Consolidation The consolidated financial statements include the financial statements of Bradesco and those of its direct and indirect subsidiaries, including exclusive mutual funds and special purpose entities. The main subsidiaries included in the consolidated financial statements are as follows: Headquarters' location Activity Equity interest Total participation of the Voting Capital On December 31, 2025 On December 31, 2024 On December 31, 2025 On December 31, 2024 Financial Sector – Brazil Ágora Corretora de Títulos e Valores Mobiliários S.A. São Paulo - Brazil Brokerage 100.00% 100.00% 100.00% 100.00% Banco Bradescard S.A. São Paulo - Brazil Credit Card 100.00% 100.00% 100.00% 100.00% Banco Bradesco BBI S.A. São Paulo - Brazil Investment bank 100.00% 100.00% 100.00% 100.00% Banco Bradesco BERJ S.A. São Paulo - Brazil Banking 100.00% 100.00% 100.00% 100.00% Banco Bradesco Financiamentos S.A. São Paulo - Brazil Banking 100.00% 100.00% 100.00% 100.00% Banco Losango S.A. Banco Múltiplo Rio de Janeiro - Brazil Banking 100.00% 100.00% 100.00% 100.00% Bradesco Administradora de Consórcios Ltda. São Paulo - Brazil Consortium management 100.00% 100.00% 100.00% 100.00% Bradesco Leasing S.A. Arrendamento Mercantil São Paulo - Brazil Leases 100.00% 100.00% 100.00% 100.00% Bradesco-Kirton Corretora de Câmbio S.A. São Paulo - Brazil Exchange Broker 99.97% 99.97% 99.97% 99.97% Bradesco S.A. Corretora de Títulos e Valores Mobiliários São Paulo - Brazil Brokerage 100.00% 100.00% 100.00% 100.00% Kirton Bank S.A. Banco Múltiplo São Paulo - Brazil Banking 100.00% 100.00% 100.00% 100.00% Banco Digio S.A. São Paulo - Brazil Digital Bank 100.00% 100.00% 100.00% 100.00% Tivio Capital Distribuidora de Títulos e Valores Mobiliários S.A. São Paulo - Brazil Asset management 61.56% 51.00% 61.56% 51.00% Tempo Serviços Ltda. Minas Gerais - Brazil Services 100.00% 100.00% 100.00% 100.00% Financial Sector – Overseas Banco Bradesco Europa S.A. (1) Luxembourg - Luxembourg Banking 100.00% 100.00% 100.00% 100.00% Banco Bradesco S.A. Grand Cayman Branch (1) Georgetown - Cayman Islands Banking 100.00% 100.00% 100.00% 100.00% Banco Bradesco S.A. New York Branch (1) New York - United States Banking 100.00% 100.00% 100.00% 100.00% Bradesco Securities, Inc. (1) New York - United States Brokerage 100.00% 100.00% 100.00% 100.00% Bradesco Securities, UK. Limited (1) London - United Kingdom Brokerage 100.00% 100.00% 100.00% 100.00% Bradesco Securities, Hong Kong Limited (1) Hong Kong - China Brokerage 100.00% 100.00% 100.00% 100.00% Bradescard México, Sociedad de Responsabilidad Limitada (2) Jalisco - Mexico Credit Card 100.00% 100.00% 100.00% 100.00% Bradesco Bank (3) Florida - United States Banking 100.00% 100.00% 100.00% 100.00% Insurance, Pension Plan and Capitalization Bond Sector - In Brazil Bradesco Auto/RE Companhia de Seguros Rio de Janeiro - Brazil Insurance 100.00% 100.00% 100.00% 100.00% Bradesco Capitalização S.A. São Paulo - Brazil Capitalization bonds 100.00% 100.00% 100.00% 100.00% Bradesco Saúde S.A. Rio de Janeiro - Brazil Insurance/health 100.00% 100.00% 100.00% 100.00% Bradesco Seguros S.A. São Paulo - Brazil Insurance 99.96% 99.96% 99.96% 99.96% Bradesco Vida e Previdência S.A. São Paulo - Brazil Pension plan/Insurance 100.00% 100.00% 100.00% 100.00% Odontoprev S.A. (4) São Paulo - Brazil Dental care 53.54% 52.89% 53.54% 52.89% BRADESCO | Consolidated Financial Statements in IFRS 23 Consolidated Financial Statements in IFRS | Notes to the Consolidated Financial Statements Headquarters' location Activity Equity interest Total participation of the Voting Capital On December 31, 2025 On December 31, 2024 On December 31, 2025 On December 31, 2024 Insurance - Overseas Bradesco Argentina de Seguros S.A. (1) (4) Buenos Aires - Argentina Insurance 99.98% 99.98% 99.98% 99.98% Other Activities - Brazil Andorra Holdings S.A. São Paulo - Brazil Holding 100.00% 100.00% 100.00% 100.00% Bradseg Participações S.A. São Paulo - Brazil Holding 100.00% 100.00% 100.00% 100.00% Nova Paiol Participações Ltda. São Paulo - Brazil Holding 100.00% 100.00% 100.00% 100.00% Bradescor Corretora de Seguros Ltda. São Paulo - Brazil Insurance Brokerage 100.00% 100.00% 100.00% 100.00% BSP Empreendimentos Imobiliários S.A. São Paulo - Brazil Real estate 100.00% 100.00% 100.00% 100.00% Cia. Securitizadora de Créditos Financeiros São Paulo - Brazil Credit acquisition 100.00% 100.00% 100.00% 100.00% Investment Funds (5) Bradesco FIC FI RF Cred Priv Premium PGBL/VGBL São Paulo - Brazil Investment Fund 100.00% 100.00% 100.00% 100.00% Brad Priv Performance FICFI RF Cred PRIV PGBL/VGBL São Paulo - Brazil Investment Fund 100.00% 100.00% 100.00% 100.00% Brad Private PB FIC FI RF Cred Priv PGBL/VGBL São Paulo - Brazil Investment Fund 100.00% 100.00% 100.00% 100.00% Bradesco Ultra PGBL/VGBL FIC FI RF Cred Priv São Paulo - Brazil Investment Fund 100.00% 100.00% 100.00% 100.00% Bradesco FIC de FI Renda Fixa A PGBL/VGBL São Paulo - Brazil Investment Fund 100.00% 100.00% 100.00% 100.00% Bradesco FI Referenciado DI União São Paulo - Brazil Investment Fund 92.86% 92.90% 92.86% 92.90% Alpha Fundo de Investimento Multimercado Crédito Privado Investimento no Exterior São Paulo - Brazil Investment Fund 100.00% 100.00% 100.00% 100.00% Bradesco FIC FI R.F. PGBL/VGBL Fix Plus São Paulo - Brazil Investment Fund 100.00% 100.00% 100.00% 100.00% Bradesco Fundo de Investimento RF Memorial São Paulo - Brazil Investment Fund 100.00% 100.00% 100.00% 100.00% Bradesco Multigestores CRPR Prev PGBL/VGBL FIC FIM São Paulo - Brazil Investment Fund 100.00% 100.00% 100.00% 100.00% (1) The functional currency of these companies abroad is the Brazilian Real; (2) The functional currency of this company is the Mexican Peso; (3) The functional currency of this company is the US Dollar; (4) Accounting information used with date lag of up to 60 days; and (5) The investment funds in which Bradesco assumes or substantially retains the risks and benefits were consolidated. BRADESCO | Consolidated Financial Statements in IFRS 24 Consolidated Financial Statements in IFRS | Notes to the Consolidated Financial Statements i. Subsidiaries Subsidiaries are all companies over which the Organization has control. The Organization has control over an investee if it is exposed to, or has rights to, variable returns from its involvement with the investee and has the ability to affect those returns through its power over the investee. The subsidiaries are fully consolidated from the date at which the Organization obtains control over its activities until the date this control ceases. For acquisitions meeting the definition of a business combination, the acquisition method of accounting is used. The cost of acquisition is measured as the fair value of the consideration, including assets given, equity instruments issued and liabilities incurred or assumed at the date of exchange. Identifiable assets acquired and liabilities and contingent liabilities assumed in a business combination are measured initially at their fair values at the acquisition date, irrespective of the extent of any non-controlling interest. The excess of the consideration given over the fair value of the Company’s share of the identifiable net assets and noncontrolling interest acquired is recorded as goodwill. Any goodwill arising from business combinations is tested for impairment at least once a year and whenever events or changes in circumstances may indicate the need for an impairment writedown. If the cost of acquisition is less than the fair value of the Company’s share of the net assets acquired, the difference is recognized directly in the consolidated statement of income. For acquisitions not meeting the definition of a business combination, the Organization allocates the cost between the individual identifiable assets and liabilities. The cost of acquired assets and liabilities is determined by (a) recognizing financial assets and liabilities at their fair value at the acquisition date; and (b) allocating the remaining balance of the cost of purchasing assets and assuming liabilities to individual assets and liabilities, other than financial instruments, based on their relative fair values of these instruments at the acquisition date. ii. Associates Companies are classified as associates if the Organization has significant influence, but not control, over the operating and financial management policy decisions. Normally significant influence is presumed when the Organization holds in excess of 20%, but no more than 50%, of the voting rights. Even if less than 20% of the voting rights are held, the Organization could still have significant influence through its participation in the management of the investee or representations on its Board of Directors, providing it has executive power; i.e. voting power. Investments in associates are recorded in the Organization’s consolidated financial statements using the equity method and are initially recognized at cost. The investments in associates include goodwill (net of any impairment losses) identified at the time of acquisition. iii. Joint ventures The Organization has contractual agreements in which two or more parties undertake activities subject to joint control. Joint control is the contractual sharing of control over an activity and it exists only if strategic, financial and operating decisions are made on a unanimous basis by the parties. A joint venture is a BRADESCO | Consolidated Financial Statements in IFRS 25 Consolidated Financial Statements in IFRS | Notes to the Consolidated Financial Statements collaborative arrangement in which the Organization, along with other parties, holding joint control, have rights to the net assets resulting from the agreement they have established. Investments in joint ventures are recorded in the consolidated financial statements of the Organization using the equity method. iv. Structured entities Structured entities are consolidated when the Organization has control. The Organization has control over a structured entity if it is exposed to, or has rights to, variable returns from its involvement with the structured entity and has the ability to affect those returns through its power over the structured entity. v. Transactions with and interests of non-controlling shareholders The Organization applies a policy of treating transactions with non-controlling interests as transactions with equity owners of the Bank. For purchases of equity from non-controlling interests, the difference between any consideration paid and the share of the carrying value of net assets of the subsidiary acquired is recorded in equity. Gains or losses on sales to non-controlling shareholders are also recorded in equity. Profits or losses attributable to non-controlling interests are presented in the consolidated statements of income under this title. vi. Balances and transactions eliminated in the consolidation Intra-Organization transactions and balances (except for foreign currency transaction gains and losses) are eliminated in the consolidation process, including any unrealized profits or losses resulting from operations between the companies except when unrealized losses indicate an impairment loss of the asset transferred which should be recognized in the consolidated financial statements. Consistent accounting policies as well as similar valuation methods for similar transactions, events and circumstances are used throughout the Organization for the purposes of consolidation. b) Foreign currency translation i. Functional and presentation currency Items included in the consolidated financial statements of each of the Organization’s entities are measured using the currency of the primary economic environment in which the entity operates (the functional currency). The consolidated financial statements are presented in Brazilian Reais (R$), which is the Company’s presentation currency. The domestic and foreign subsidiaries use the Real as their functional currency, except for the subsidiary in Mexico, which has the Mexican Peso as its functional currency, and Bradesco Bank, which has the US dollar as its functional currency. ii. Transactions and balances Foreign currency transactions, which are denominated or settled in a foreign currency, are translated into the functional currency using the exchange rates prevailing on the dates of the transactions. BRADESCO | Consolidated Financial Statements in IFRS 26 Consolidated Financial Statements in IFRS | Notes to the Consolidated Financial Statements Monetary items denominated in foreign currency are translated at the closing exchange rate as at the reporting date. Non-monetary items measured at historical cost denominated in a foreign currency are translated at exchange rate on the date of initial recognition; non-monetary items in a foreign currency that are measured at fair value are translated using the exchange rates on the date when the fair value was determined. Foreign exchange gains and losses resulting from the settlement of foreign currency transactions and from the translation at each period exchange rates of monetary assets and liabilities denominated in foreign currencies are recognized in the consolidated statement of income as “Net gains/(losses) of foreign currency transactions”. In the case of changes in the fair value of monetary assets denominated in foreign currency classified as financial assets at fair value through other comprehensive income, a distinction is made between translation differences resulting from changes in amortized cost of the security and other changes in the carrying amount of the security. Translation differences related to changes in the amortized cost are recognized in the consolidated statement of income, and other changes in the carrying amount, except impairment, are recognized in equity. iii. Foreign operations The results and financial position of all foreign operations (none of which has the currency of a hyperinflationary economy) that have a functional currency different from the presentation currency are translated into the presentation currency as follows: • Assets and liabilities for each consolidated statement of financial position presented are translated at the closing rate at the reporting date; • Income and expenses for each consolidated statement of income are translated at average exchange rates (unless this average is not a reasonable approximation of the cumulative effect of the rate prevailing on the transaction dates, in which case income and expenses are translated at the rates in effect on the dates of the transactions); and • All resulting exchange differences are recognized in other comprehensive income. Exchange differences arising from the above process are presented in equity as “Foreign currency translation adjustment”. On consolidation, exchange differences arising from the translation of the net investment in foreign entities are taken to “Other comprehensive income”. If the operation is a non-wholly owned subsidiary, then the relevant proportion of the transaction difference is allocated to the non-controlling interest. When a foreign operation is partially sold or disposed, such exchange differences, which were recognized in equity, are recognized in the consolidated statement of income as part of the gain or loss on sale. BRADESCO | Consolidated Financial Statements in IFRS 27 Consolidated Financial Statements in IFRS | Notes to the Consolidated Financial Statements c) Cash and cash equivalents Cash and cash equivalents include: cash, bank deposits, unrestricted balances held with the Central Bank of Brazil and other highly liquid short-term investments, with original maturities of three months or less and which are subject to insignificant risk of changes in fair value, used by the Company to manage its short-term commitments. See Note 5 (a) – “Cash and cash equivalents”. d) Financial assets and liabilities i. Financial assets The Company classifies and measures financial assets based on the business model for the management of financial assets, as well as on the characteristics of contractual cash flow of the financial asset. The Company classifies financial assets into three categories: (i) measured at amortized cost; (ii) measured at fair value through other comprehensive income (FVOCI); and (iii) measured at fair value through profit or loss (FVTPL). - Business model: it relates to the way in which the Company manages its financial assets to generate cash flows. The objective (business model) of management in relation to each portfolio is defined as either: (i) to maintain the assets to receive contractual cash flows; (ii) to maintain the assets to receive the contractual cash flows and sales; or (iii) any other model. When the financial assets conform to the business models (i) and (ii) the SPPI test (Solely Payment of Principal and Interest) is applied. Financial assets held under business model (iii) are measured at FVTPL. - SPPI Test: the purpose of this test is to assess the contractual terms of the financial instruments to determine if they give rise to cash flows at specific dates that conform only to the payment of the principal and interest on the principal amount. In this context, the principal refers to the fair value of the financial asset at the initial recognition and interest refers to the consideration for the time value of money, the credit risk associated with the principal amount outstanding for a specific period of time and other risks and borrowing costs. Financial instruments that do not meet the SPPI test are measured at FVTPL, such as derivatives. • Measured at fair value through profit or loss All financial assets that do not meet the criteria of measurement at amortized cost or at FVOCI are classified as measured at FVTPL, in addition to those assets that in the initial recognition are irrevocably designated at FVTPL, if this eliminates or significantly reduces asset-liability mismatches. Financial assets measured at FVTPL are initially recorded at fair value with subsequent changes to the fair value recognized immediately in profit or loss. Financial assets are initially recognized in the consolidated statement of financial position at fair value and the transaction costs are recorded directly in the consolidated statement of income. Subsequent changes to the fair value are recognized immediately in profit or loss. BRADESCO | Consolidated Financial Statements in IFRS 28 Consolidated Financial Statements in IFRS | Notes to the Consolidated Financial Statements Gains and losses arising from changes in fair value of non-derivative assets are recognized directly in the consolidated statement of income under “Net gains/(losses) on financial assets and liabilities at fair value through profit or loss”. Interest income on financial assets measured at FVTPL is included in “Interest and similar income”. For the treatment of derivative assets see Note 2(d)(iii). • Measured at fair value through other comprehensive income They are financial assets that meet the criterion of the SPPI test, which are held in a business model whose objective is both to maintain the assets to receive the contractual cash flows as well as for sale. These financial assets are initially recognized at fair value, plus any transaction costs that are directly attributable to their acquisition or their issuance and are, subsequently, measured at fair value with gains and losses being recognized in other comprehensive income, except for impairment losses and foreign exchange gains and losses on debt securities, until the financial asset is derecognized. The expected credit losses are recorded in the consolidated statement of income. Interest income is recognized in the consolidated statement of income using the effective interest method. Dividends on equity instruments are recognized in the consolidated statement of income in ‘Dividend income’, within “Net Gains/(losses) on financial assets at fair value through other comprehensive income” when the Company’s right to receive payment is established. Gains or losses arising out of exchange variation on investments in debt securities classified as FVOCI are recognized in the consolidated statement of income. See Note 2(d)(viii) for more details of the treatment of the expected credit losses. The Organization can also make an irrevocable designation of an equity instrument for when there is no trading strategy for the category of Fair Value through Other Comprehensive Income. In this case, there is no record of any effects on the Consolidated Statement of Income of subsequent events related to this asset, except for dividends that represent the investment result itself. • Measured at amortized cost Financial assets that meet the criterion of the SPPI test and which are held in a business model whose objective is to maintain the assets to receive the contractual cash flows. These financial assets are recognized initially at fair value including direct and incremental costs, and are subsequently recorded at amortized cost, using the effective interest rate method. Interest is recognized in the consolidated statement of income and presented as “Interest and similar income”. In the case of expected credit loss, it is reported a deduction from the carrying value of the financial asset and is recognized in the consolidated statement of income. BRADESCO | Consolidated Financial Statements in IFRS 29 Consolidated Financial Statements in IFRS | Notes to the Consolidated Financial Statements ii. Financial liabilities The Organization classifies its financial liabilities as subsequently measured at amortized cost, using the effective interest rate method, except in cases of trading financial liabilities. Financial liabilities for trading recognized by the Organization are derivative financial instruments that are recorded and measured at fair value, with the respective changes in fair value recognized immediately in profit or loss. The Organization does not have any financial liabilities designated at fair value through profit or loss. For more details on the treatment of derivatives, see Note 2(d) (iii). • Financial guarantee contracts and loan commitments Financial guarantees are contracts that require the Organization to make specific payments under the guarantee for a loss incurred when a specific debtor fails to make a payment when due in accordance with the terms of the debt instrument. Financial guarantees are initially recognized in the statement of financial position at fair value on the date the guarantee was given. After initial recognition, the Organization’s obligations under such guarantees are measured by the higher value between (i) the value of the provision for expected losses and (ii) the value initially recognized, minus, if appropriate, the accumulated value of the revenue from the service fee. The fee income earned is recognized on a straight-line basis over the life of the guarantee. Any increase in the liability relating to guarantees is reported in the consolidated statement of income within “Other operating income/ (expenses)”. The expected credit losses, referring to loan commitments, are recognized in liabilities and are calculated, as described in Note 40.2. – Credit Risk. iii. Derivative financial instruments and hedge transactions Derivatives are initially recognized at fair value on the date the respective contract is signed and are, subsequently, re-measured at their fair values with the changes recognized in the statement of income under “Net gains or losses on financial assets at fair value through profit or loss”. Fair values are obtained from quoted market prices in active markets (for example, for exchange-traded options), including recent market transactions, and valuation techniques (for example for swaps and foreign currency transactions), such as discounted cash-flow models and options-pricing models, as appropriate. In the calculation of fair value, the counterparty’s and the entity’s own credit risk are considered. Certain derivatives embedded in other financial instruments are treated as separate derivatives when their economic characteristics and risks are not closely related to those of the host contract and the host contract is not recorded at fair value through profit or loss. These embedded derivatives are separately BRADESCO | Consolidated Financial Statements in IFRS 30 Consolidated Financial Statements in IFRS | Notes to the Consolidated Financial Statements accounted for at fair value, with changes in fair value recognized in the consolidated statement of income. The Organization has structures of cash flow hedges, whose objective is to protect the exposure to variability in cash flows attributable to a specific risk associated with all the assets or liabilities recognized, or a component of it. The details of these structures are presented in Note 40.3 – Market risk. iv. Recognition Initially, the Organization recognizes deposits, securities issued and subordinated debts and other financial assets and liabilities on the trade date, in accordance with the contractual provisions of the instrument. v. Derecognition Financial assets are derecognized when there is no reasonable expectation of recovery, when the contractual rights to receive the cash flows from these assets have ceased to exist or the assets have been transferred and substantially all the risks and rewards of ownership of the assets are also transferred. Financial liabilities are derecognized when they have been discharged, paid, redeemed, cancelled or expired. If a renegotiation or modification of terms of an existing financial asset is such that the cash flows of the modified asset are substantially different from those of the original unmodified asset, then the original financial asset is derecognized and the modified financial asset is recognized as a new financial asset and initially measured at fair value. vi. Offsetting financial instruments Financial assets and liabilities are offset and the net amount reported in the consolidated statement of financial position when, the Organization has the intention and the legally enforceable right to offset the recognized amounts on a net basis or realize the asset and settle the liability simultaneously. vii. Determination of fair value The determination of the fair value for the majority of financial assets and liabilities is based on the market price or quotes of security dealers for financial instruments traded in an active market. The fair value for other instruments is determined using valuation techniques. The valuation techniques which include use of recent market transactions, discounted cash flow method, comparison with other instruments similar to those for which there are observable market prices and valuation models. For more commonly used instruments, the Organization uses widely accepted valuation models that consider observable market data in order to determine the fair value of financial instruments. For more complex instruments, the Organization uses its own models that are usually developed from standard valuation models. Some of the information included in the models may not be observable in the market and is derived from market prices or rates or may be estimated on the basis of assumptions. The value produced by a model or by a valuation technique is adjusted to reflect BRADESCO | Consolidated Financial Statements in IFRS 31 Consolidated Financial Statements in IFRS | Notes to the Consolidated Financial Statements various factors, since the valuation techniques do not necessarily reflect all of the factors that market participants take into account during a transaction. The valuations are adjusted to consider the risks of the models, differences between the buy and sell price, credit and liquidity risks, as well as other factors. Management believes that such valuation adjustments are necessary and appropriate for the correct evaluation of the fair value of the financial instruments recorded in the consolidated statement of financial position. More details on the calculation of the fair value of financial instruments are available in Note 40.4. – Liquidity risk. viii. Expected credit losses The Organization calculates the expected credit losses for financial instruments measured at amortized cost and at FVOCI (except for investments in equity instruments), financial guarantees and loan commitments. Expected credit losses on financial instruments are measured as follows: Financial assets: it is the present value of the difference between contractual cash flows and the cash flows that the Organization expects to recover discounted at the effective interest rate of the operation; Financial guarantees: it is the present value of the difference between the expected payments to reimburse the holder of the guarantee and the values that the Organization expects to recover discounted at a rate that reflects the market conditions; and Loan commitments: it is the present value of the difference between the contractual cash flows that would be due if the commitment was used and the cash flows that the Organization expects to recover discounted at a rate that reflects the market conditions. Expected credit losses are measured on one of the following basis: − Credit losses expected for 12 months, i.e., credit losses as a result of possible events of delinquency within 12 months after the reporting date; and − Credit Losses expected for the whole of lifecycle, i.e., credit losses that result from all possible events of delinquency throughout the expected lifecycle of a financial instrument. The measurement of expected losses for the whole lifecycle is applied when a financial asset, on the reporting date, has experienced a significant increase in credit risk since its initial recognition and the measurement of expected credit loss for 12 months is applied when the credit risk has not increased significantly since its initial recognition. The Company assumes that the credit risk of a financial asset has not increased significantly when the asset has a low credit risk on the reporting date. With respect to Brazilian government bonds, the Organization has internally developed a study to assess the credit risk of these securities, which does not expect any loss for the next 12 months, that is, no provision is recorded for credit losses. BRADESCO | Consolidated Financial Statements in IFRS 32 Consolidated Financial Statements in IFRS | Notes to the Consolidated Financial Statements For loans, the amount of loss is measured as the difference between the asset’s carrying amount and the present value of estimated future cash flows (excluding future credit losses that have not been incurred) discounted at the financial asset’s original effective interest rate. The asset’s carrying amount is reduced through provisions and the amount of the loss is recognized in the consolidated statement of income. The calculation of the present value of the estimated future cash flows of a collateralized financial asset reflects the cash flows that may result from foreclosure less costs for obtaining and selling the collateral. The methodology and assumptions used for estimating future cash flows are reviewed regularly to mitigate any differences between loss estimates and actual loss experience. Following the recognition of expected credit loss, interest income is recognized using the effective rate of interest, which was used to discount the future cash flows, on the accounting value gross of provision, except for assets with problem of credit recovery, in which, the rate stated is applied at the net book value of the provision. The whole or part of a financial asset is written off against the related credit loss expected when there is no reasonable expectation of recovery. Such loans are written off after all the relevant collection procedures have been completed and the amount of the loss has been determined. Subsequent recoveries of amounts previously written off are credited to the consolidated statement of income. The criteria used to calculate the expected credit loss and to determine the significantly increased credit risk are detailed in Note 40.2. – Credit risk. e) Interest Income from financial assets measured at amortized cost and at FVOCI and interest costs from liabilities classified at amortized cost are recognized on an accrual basis in the consolidated statement of income, using the effective interest rate method, except equity instruments measured at cost. The effective interest rate is the rate that discounts estimated future cash payments and receipts throughout the expected life of the financial asset or liability (or, when appropriate, a shorter period) to the carrying amount of the financial asset or liability. When calculating the effective rate, the Company estimates future cash flows considering all contractual terms of the financial instrument, but not future loan losses. The calculation of the effective interest rate includes all commissions, transaction costs, discounts or bonuses which are an integral part of such rate. Transaction costs are incremental costs directly attributable to the acquisition, issuance or disposal of a financial asset or liability. f) Non-current assets held for sale Under certain circumstances, property is repossessed following foreclosure of loans that are in default. Repossessed properties are measured at the lower of their carrying amount or fair value less the costs to sell and are included within non-current assets BRADESCO | Consolidated Financial Statements in IFRS 33 Consolidated Financial Statements in IFRS | Notes to the Consolidated Financial Statements held for sale. g) Property and equipment i. Recognition and valuation Property and equipment are measured at cost less accumulated depreciation and accumulated impairment losses (see Note 2(i) below), if any. The cost includes expenses directly attributable to the acquisition of an asset. The cost of assets internally produced includes the cost of materials and direct labor, as well as any other costs that can be directly allocated and that are necessary for them to function. When parts of an item have different useful lives, and separate control is practical, they are recorded as separate items (main components) comprising the property and equipment. Useful lives and residual values are reassessed at each reporting date and adjusted, if appropriate. Gains and losses from the sale of property and equipment are determined by comparing proceeds received with the carrying amount of the asset and are recorded in the consolidated statement of income under the heading “Other operating income/(expenses)”. ii. Subsequent costs Expenditure on maintenance and repairs of property and equipment items is recognized as an asset when it is probable that future economic benefits associated with the items will flow to the Organization for more than one year and the cost can be measured reliably. All other repairs and maintenance costs are charged to the consolidated statement of income during the reporting period in which they are incurred. iii. Depreciation Depreciation is recognized in the consolidated statement of income using the straight-line basis and taking into consideration the estimated useful economic life of the assets. The depreciable amount is the gross-carrying amount, less the estimated residual value at the end of the useful economic life. Land is not depreciated. Useful lives and residual values are reassessed at each reporting date and adjusted, if appropriate. h) Intangible assets Intangible assets are composed of non-monetary items, without physical substance that are separately identifiable. They may arise from business combinations, such as goodwill and other intangible assets purchased in business combinations, or from other transactions, such as software licenses and the acquisition of exclusive rights. These assets are recognized at cost. The cost of an intangible asset acquired in a business combination is its fair value on the acquisition date. Intangible assets with finite useful lives are amortized over their estimated economic useful lives. Intangible BRADESCO | Consolidated Financial Statements in IFRS 34 Consolidated Financial Statements in IFRS | Notes to the Consolidated Financial Statements assets with an indefinite useful life are not amortized. Generally, the identified intangible assets of the Organization have a definite useful life. At each reporting date, intangible assets are reviewed for indications of impairment or changes in estimated future economic benefits – see Note 2(i) below. i. Goodwill Goodwill (or bargain purchase gain) arises on the acquisition of subsidiaries, associates and joint ventures and is allocated to Cash Generating Unit (CGU) or Organizations of CGUs that are expected to benefit from the synergies of the acquisitions. Goodwill reflects the excess of the cost of acquisition in relation to the Organization’s share of the fair value of net identifiable assets or liabilities of an acquired subsidiary, associate or joint venture on the date of acquisition. Goodwill originated from the acquisition of subsidiaries is recognized as “Intangible Assets”, and the goodwill from acquisition of associates and joint ventures is included in the carrying amount of the investment. When the difference between the cost of acquisition and the Organization’s share of the fair value of net identifiable assets or liabilities is negative (bargain purchase gain), it is immediately recognized in the consolidated statement of income as a gain on the acquisition date. Goodwill is tested annually or whenever a trigger event has been observed, for impairment. Gains and losses realized in the sale of an entity include consideration of the carrying amount of goodwill relating to the entity sold. ii. Software Software acquired by the Organization is recorded at cost, less accumulated amortization and accumulated impairment losses, if any. Internal software-development expenses are recognized as assets when the Organization can demonstrate its intention and ability to complete the development and use the software in order to generate future economic benefits. The capitalized costs of internally developed software include all costs directly attributable to development and are amortized over their useful lives. Internally developed software is recorded at its capitalized cost less amortization and impairment losses (see Note 2(i) below). Subsequent software expenses are capitalized only when they increase the future economic benefits incorporated in the specific asset to which it relates. All other expenses are recorded as expenses as incurred. Amortization is recognized in the consolidated statement of income using the straight-line method over the estimated useful life of the software, beginning on the date that it becomes available for use. The estimated useful life of software is from two to five years from the date of its availability for use. Useful life and residual values are reviewed at each reporting date and adjusted, if necessary. iii. Other intangible assets Other intangible assets refer basically to the customer portfolio and acquisition of banking service rights. They are recorded at cost less amortization and impairment BRADESCO | Consolidated Financial Statements in IFRS 35 Consolidated Financial Statements in IFRS | Notes to the Consolidated Financial Statements losses, if any, and are amortized for the period in which the asset is expected to contribute, directly or indirectly, to the future cash flows. These intangible assets are reviewed annually, or whenever events or changes in circumstances occur which could indicate that the carrying amount of the assets cannot be recovered. If necessary, the write-off or impairment (see Note 2(i) below) is immediately recognized in the consolidated statement of income. i) Company lease (lessee) As a lessee, the Organization assesses at contract inception whether a contract is, or contains, a lease. That is, if the contract conveys the right to control the use of an identified asset for a period in exchange for consideration. The Organization applies a single recognition and measurement approach for all leases, except for short-term leases and leases of low-value assets. The Company recognizes lease liabilities to make lease payments and right-of-use assets representing the right to use the underlying assets. At the beginning of a lease, the Organization recognizes a “lease liability” and a right of use asset. The expenses with interest on the lease liability and expenses of depreciation of the right of use asset are recognized separately. The right of use asset is measured initially at cost value and is subsequently reduced by the accumulated depreciation and any accumulated impairment losses, when applicable. The right of use will also be adjusted in case of re-measurement of the lease liability. The depreciation is calculated in a linear fashion by the term of the leases. The lease term is defined as the non-cancellable term of the lease, together with (i) periods covered by the option to extend the lease, if the lessee is reasonably certain to exercise that option; and (ii) periods covered by the option to terminate the lease, if the lessee is reasonably certain that it will not exercise that option. The Organization has a descriptive policy for the property lease terms, which considers the business plan and management expectations, extension options and local laws and regulations. The lease liability is measured initially at the present value of the future lease payments, discounted by the incremental rate applied to each contract in accordance with the leasing term. The lease payments include fixed payments, less any lease incentives receivable, and variable lease payments that depend on an index or a rate. Variable lease payments that do not depend on an index or a rate are recognized as expenses in the period in which the event or condition that triggers the payment occurs. The incremental rate applied by the Organization considers the funding rate free of risk adjusted by the credit spread. Subsequently, the lease liability is adjusted to reflect the interest levied on the payment flows, re-measured to reflect any revaluation or modifications of leasing and reduced to reflect the payments made. Financial charges are recognized as “Interest and similar expenses” and are adjusted in accordance with the term of the contracts, considering the incremental rate. BRADESCO | Consolidated Financial Statements in IFRS 36 Consolidated Financial Statements in IFRS | Notes to the Consolidated Financial Statements The contracts and leases of properties with an indefinite period are not considered in the scope of IFRS 16 – Leases, because they are leases in which the contract can be terminated at any time without a significant penalty. In this way, the rental contract is not considered as executable. Short-term leases and leases of low-value assets The Organization applies the short-term lease recognition exemption to its short-term leases (leases that have a lease term of 12 months or less from the commencement date and do not contain a purchase option). It also applies the lease of low-value assets recognition exemption to leases that are considered to be low value. Lease payments on short-term leases and leases of low-value assets are recognized as expense over the lease term. j) Impairment losses on non-financial assets (except for deferred tax assets) Assets that have an indefinite useful life such as goodwill are not subject to amortization and are tested, at least, annually to verify the existence of impairment. Assets, which are subject to amortization or depreciation, are reviewed to evaluate for impairment whenever events or changes in circumstances indicate that the carrying amount may not be recoverable. An impairment loss is recognized based on the excess the carrying amount of the asset or the cash generating unit (CGU) over its estimated recoverable amount. The recoverable amount of an asset or CGU is the greater of its fair value, less costs to sell, and its value in use. For the purpose of impairment testing, the assets that cannot be tested individually are Organizationed together into the smallest Organization of assets that generates cash inflows from continuing use that are largely independent of the cash inflows of other assets or CGUs. Subject to a ceiling of the operating segments, for the purpose of goodwill impairment testing, CGUs to which goodwill has been allocated are aggregated so that the level at which impairment testing is performed reflects the lowest level at which goodwill is monitored for internal reporting purposes. When assessing the value in use, future profitability based on business plans and budgets are used, and the estimated future cash flows are discounted to their present value using a discount rate that reflects the current market conditions of the time value of money and the specific risks of the asset or CGU. The Organization’s corporate assets do not generate separate cash inflows and are utilized by more than one CGU. Corporate assets are allocated to CGUs on a reasonable and consistent basis and tested for impairment as part of the testing of the CGU to which the corporate asset is allocated. Impairment losses are recognized in the consolidated Statement of Income. Impairment losses recognized in respect of CGUs are allocated first to reduce the carrying amount of any goodwill allocated to the CGU (or Organization of CGUs) and then to reduce the carrying amount of the other assets in the CGU (or Organization of CGUs) on a pro rata basis. An impairment of goodwill cannot be reversed. With regard to other assets, an impairment loss recognized in previous periods is reassessed at each reporting date for any indications that the impairment has decreased or no longer exists. An BRADESCO | Consolidated Financial Statements in IFRS 37 Consolidated Financial Statements in IFRS | Notes to the Consolidated Financial Statements impairment loss will be reversed if there has been a change in the estimates used to determine the recoverable amount or to the extent that the carrying amount of the asset does not exceed the carrying amount that would have been determined, net of depreciation and amortization, if no impairment had been recognized. k) Provisions, contingent assets and liabilities and legal obligations A provision is recognized when, as a result of a past event, the Organization has a present legal or constructive obligation that can be reliably estimated and it is probable that an outflow of resources will be required to settle the obligation. Provisions are determined by discounting the expected future cash flows at a pre-tax rate that reflects current market assessments of the time value of money and the risks specific to the liability. Provisions were established by Management whenever it considers that there is a probable loss taking into account the opinion of their legal advisors; the nature of the actions; the similarity to previous cases; the complexity and the positioning of the Courts. Contingent liabilities are not recognized, since their existence will only be confirmed by the occurrence or not of one or more future and uncertain events that are not totally under the control of the Management. Contingent liabilities do not meet the criteria for recognition, since they are considered as possible losses and are disclosed in explanatory notes, when relevant. Obligations classified as remote are neither provisioned nor disclosed. Contingent assets are recognized only when there are actual guarantees or definitive favorable court rulings, over which there are no more resources, characterizing the gain as practically certain. Contingent assets, whose expectation of success is probable, are only disclosed in the consolidated financial statements, when relevant. Legal obligations arise from legal proceedings, the object of which is its legality or constitutionality, which, independently of the assessment of the likelihood of success, have their amounts fully recognized in the consolidated financial statements. l) Insurance Contracts Contracts that meet the definition of insurance contracts, including insurance and reinsurance contracts issued and reinsurance contracts held, and investment contracts with discretionary participation issued by an insurance company must be measured applying IFRS 17 - Insurance Contracts. An insurance contract is one in which one party accepts significant insurance risk from another party. Insurance risk, as defined by the standard, is the risk, other than financial risk, transferred from the holder of a contract to the issuer. An investment contract with discretionary participation is a financial instrument under which the holder receives an additional payment, the value or term of which is contractually at the discretion of the issuer. After classifying contracts within the scope of IFRS 17, the Organization must assess whether these contracts have any embedded derivatives, distinct investment components or a distinct good or service unrelated to insurance. An investment component is distinct if it is not highly interrelated with the insurance contract and if the policyholder can purchase a contract with equivalent terms and conditions in the same jurisdiction. A non-insurance-related good or service is distinct if the policyholder BRADESCO | Consolidated Financial Statements in IFRS 38 Consolidated Financial Statements in IFRS | Notes to the Consolidated Financial Statements can benefit from the good or service alone or in conjunction with other readily available resources for the policyholder. The following is a summary of the Organization's products that are within the scope of IFRS 17 – Insurance Contracts: • The Life portfolio is divided into three Organizations: Life Short-Term Risk, Life Long-Term Risk and Life Capitalization portfolios. o The Life Short-Term Risk portfolio includes products with coverage of mortality, disability and morbidity risks with a maximum duration of three years; o The Life Long-Term Risk portfolio includes products with coverage of mortality, disability and morbidity risks. The duration of this portfolio is associated with the life expectancy of policyholders or has a duration of more than three years; o Whole Life portfolio includes products with coverage of mortality, disability and morbidity risks, as well as redemption options. The duration of this portfolio is associated with the life expectancy of the policyholder. • The Pension Portfolio is divided into three Organizations: Defined Benefit Pension, Traditional Pension and PGBL/VGBL. o The Defined Benefit Pension portfolio covers products that guarantee a defined future payment when the policyholder reaches the retirement date. The duration of this portfolio is associated with the life expectancy of the policyholder; o The Traditional Pension portfolio covers products that guarantee a minimum interest rate and / or inflation adjustment both in the investment and benefit phases. The duration of this portfolio is associated with the life expectancy of the policyholder; o The PGBL/VGBL portfolio includes products that guarantee interest rate and / or inflation adjustments only in the benefit phase. The duration of this portfolio is associated with the life expectancy of the policyholder. • The Health portfolio is divided into two Organizations: Health and Dental Health. o The Health portfolio considers products with complete health coverage. These products may be offered, as eligibility, individually (Individual Health) or hired collectively (Collective Health). Individual products have their duration associated with the life expectancy of the insured, while collective products last for one year, with renewal for an indefinite period from the second year onwards; o The Dental Health portfolio only includes products with Dental Health coverage. These products may be contracted individually (Individual Dental Health) or collectively (Collective Dental Health). Individual products have their duration associated with the life expectancy of policyholders and collective products have a maximum duration of three years. • The Non-Life portfolio is divided into two Organizations: Long-Term Non-Life and Short-Term Non-Life. BRADESCO | Consolidated Financial Statements in IFRS 39 Consolidated Financial Statements in IFRS | Notes to the Consolidated Financial Statements o The Long-Term Non-Life portfolio includes two products: (i) consortium insurance (a product that protects self-funding pool agreements from default by its members); and (ii) home loan; o The Short-term Non-Life portfolio includes all other Non-Life insurance products, such as (but not limited to): vehicle, residential, equipment, and civil liability. Aggregation level For measurement purposes, the Organization aggregates insurance contracts based on similar risks that are managed together, which must be segregated by cohorts and then divided into three categories: Organizations of contracts that are onerous on initial recognition, Organizations of contracts that, on initial recognition, have no significant possibility of becoming onerous in the future and a Organization of remaining contracts in the portfolio, if any. These aggregations are referred to as Organizations of Contracts. Contract limits Cash flows are within the insurance contract boundary if cash flows from rights and obligations that exist during the reporting period under which the Organization may require the policyholder to pay premiums or the Organization may be required to provide insurance coverage to the policyholder. For contracts with discretionary participation features, cash flows are within the boundary of the contract if they arise from the Organization's substantive obligation to deliver cash at a present or future date. Initial Recognition The Organization recognizes Organizations of insurance contracts issued upon the occurrence of the first of the following facts: • The beginning of the coverage period of the Organization of contracts; • The maturity date of the first payment of a policyholder in the Organization; or • The date when a Organization of contracts becomes onerous. New contracts are included in the Organization when they satisfy the recognition criteria within the reporting period, until such time as all the contracts expected to be included in the Organization have been recognized. Measurement approach To measure the liability for the remaining coverage of its insurance contracts, the Organization applies the General Measurement Model/Building Block Approach (GMM/BBA), the Variable Fee Approach (VFA) and the Premium Allocation Approach (PAA), detailed below. In the General Measurement Model (GMM/BBA), insurance contracts issued are measured at initial recognition at the total of: (i) estimated future cash flows, adjusted for the time value of money, and an explicit risk adjustment related to the non-financial risk; and (ii) the Contractual Service Margin (CSM). The Organization applies the general model to the following portfolios: Long-Term Risk Life, Whole Life, Defined Benefit Pension, Traditional Pension, Individual Health, Individual Dental Health and Long-Term Non-Life. As a variation of the General Measurement Model (GMM/BBA), the Variable Fee Approach (VFA) follows the same principles as the General Measurement Model BRADESCO | Consolidated Financial Statements in IFRS 40 Consolidated Financial Statements in IFRS | Notes to the Consolidated Financial Statements (GMM/BBA), but the subsequent measurement differs in relation to the measurement of the CSM. The VFA is applied to direct participation contracts, which are contracts that are substantially investment-related service contracts. Additionally, for these types of contracts, the liability to policyholders is linked to underlying items. “Underlying items” are defined as "Items that determine some of the amounts that an insurer will pay under an insurance contract". Underlying items can comprise any number of items; for example, a reference portfolio of assets, the Organization's net assets, or a specified subset of the Organization's net assets. The Organization applied this methodology to the Traditional Pension, PGBL and VGBL portfolios as, during the investment phase, the policyholders' return is directly linked to assets held in specified investments funds. The simplified Premium Allocation Approach (PAA) is applicable to contracts with a coverage period of one year or less and contracts for which the Organization reasonably expects that the resulting measurement will not differ materially from that under the General Measurement Model (GMM/BBA). The Organization applies the Premium Allocation Approach (PAA) to the Life Short-Term Risk, Collective Health, Collective Dental Health and Short-Term Non-Life portfolios, because these portfolios have coverage periods equal to or less than one year or were submitted to a ’similarity test’ carried out by the Organization to confirm if the value of the liabilities of these contracts measured according to the simplified model is equal or similar to the value of the liabilities of these contracts measured by the General Measurement Model (GMM/BBA). The Organization does not issue reinsurance contracts; however, it has ceded contracts to reinsurers and applies the Premium Allocation Approach (PAA) to measure the ceded reinsurance contracts, as they have a duration of one year or less. The Organization measures the liabilities for incurred claims using an estimate of the cash flows to be fulfilled, discounted to present value. Discount rate The Organization uses the Bottom-Up rate for all its portfolios measured under IFRS 17 – Insurance Contracts. The discount rate is the rate used to reflect the time value of money for future cash flows. In the Bottom-Up methodology, the calculation of the discount rate is based on a risk-free rate. A liquidity risk is added to the risk-free rate to obtain the final discount rate. The liquidity risk reflects the compensation that an investor would require for the differences in liquidity between the insurance contracts, considering all surrender options, and the reference bond portfolio. The Organization has chosen to recognize the effect of changes in discount rates in relation to initial recognition and subsequent measurements in other comprehensive income. Risk Adjustment (RA) The Risk Adjustment (RA) is the adjustment made by the Organization to the estimate of the present value of future cash flows to reflect the compensation it would require to bear the risk of uncertainty in the value and timing of cash flows arising from nonfinancial risks. The Organization opted to use the cost of capital methodology for the Life, Pension and Dental Health portfolios, and the confidence level methodology for the Health portfolio. For the Non-Life portfolio, the confidence level methodology is used for the Remaining Coverage Provision (PCR) and for the Incurred Claims Provision (PSI). BRADESCO | Consolidated Financial Statements in IFRS 41 Consolidated Financial Statements in IFRS | Notes to the Consolidated Financial Statements Under the cost of capital methodology, the RA is determined by multiplying the risk capital the insurance contract is expected to require by a cost of capital. The risk capital that the insurance contract is expected to require is obtained through an approximation methodology that multiplies the current risk capital by the duration of the insurance cash flows. The cost of capital is the minimum return that shareholders will require from a portfolio and is obtained through the Capital Asset Pricing Model (CAPM) methodology. The confidence level methodology is based on recalculating the contract's cash flows in a defined stress scenario. In this case, the risk adjustment will be the difference between the insurance cash flows in the defined stress scenario and the insurance cash flow in the base scenario. The equivalent percentile to the non-financial risk adjustment is 60% for the Life and Pension portfolios. In the Non-Life portfolio, the percentile corresponding to the non‑financial risk adjustment is 75%, and for Dental the confidence level is 56%. To calculate the confidence level for the Health portfolio, the Organization uses an internal risk model where it calculates the confidence for the insurance contracts in its portfolio, 60% of percentile for the Liability for Remaining Coverage (LRC) and 70% of percentile for the Liability for Incurred Claims (LIC). Allocation of Contractual Service Margin (CSM) The Contractual Service Margin (CSM) for each Organization of insurance contracts is recognized in the statement of income for each period to reflect the insurance coverage provided. The amount of the Contractual Service Margin (CSM) recognized in each period is determined by identifying the coverage units, allocating the Contractual Service Margin (CSM) at the end of the period (before recognizing any release to profit or loss to reflect the services provided in that period), equally to each coverage unit provided in the current period and expected to be provided in the future and recognizing in profit or loss the amount allocated to units of coverage provided in the period. For Organizations of contracts measured by the General Measurement Model (GMM/BBA) and the Variable Fee Approach (VFA), the allocation of the Contractual Service Margin (CSM) is calculated over the life of the Organization of contracts in a way that systematically reflects the transfer of insurance benefits and/or investment under the contract. The Organization has applied judgment and considered all relevant facts and circumstances to determine a systematic and rational method for estimating the insurance contract coverages provided for each Organization of contracts and therefore the coverage units. For Life Long Term Risk and Traditional Pension, the recognition of CSM is based on the projection of the value of the insurance liabilities of the insurance contract portfolios. For PGBL and VGBL Pension contracts it is based on the portfolio management fee. For the Long-Term Non-Life insurance, the recognition of the portion of the Contractual Service Margin (CSM) in profit or loss is based on the expectation of premiums of the portfolio. BRADESCO | Consolidated Financial Statements in IFRS 42 Consolidated Financial Statements in IFRS | Notes to the Consolidated Financial Statements For the Individual Health portfolio, the recognition of the portion of the Contractual Service Margin (CSM) in profit or loss is based on the flow of people exposed to health risk projected for future periods. Method for measuring and evaluating fulfillment cash flows When estimating fulfillment cash flows included within the scope of the contract, the Organization considers the range of all possible results, specifying the amount of cash flows, timing and probability of each scenario reflecting conditions existing on the date of measurement, using a probability-weighted average expectation, which represents the average of all possible scenarios. In determining possible scenarios, the Organizations uses all reasonable and supportable information available without undue cost or effort, which includes information about past events, current conditions, and future forecasts. When estimating future cash flows, the following elements are included within the contract boundaries: • Premiums and any additional cash flows resulting from those premiums such as acquisition costs and future claims; • Reported claims that have not yet been paid, claims incurred but have not yet been reported, expected future policy claims and potential cash inflows from future claims recoveries covered by existing insurance contracts; • An allocation of the insurance acquisition cash flows attributable to the portfolio to which the issued contract belongs; • An allocation of fixed and variable overheads directly attributable to the performance of insurance contracts, including indirect costs such as accounting, human resources, IT and support, building depreciation, rent, maintenance, and utilities; • Other costs specifically chargeable to the policyholder under the contract. Cash flow estimates include directly observable market variables and unobservable variables such as mortality rates, accident rates, average claims costs and probabilities of serious claims. When applying the mortality table for Organizations of policyholders, the Organization uses the parameters as a reference to project the number of benefits to be paid to policyholders. The estimated amounts to be paid are incorporated into the measurement of the entity’s insurance contracts. For the calculation of the mortality rate to be used for the measurement of insurance contracts, the Organization uses a number of mortality tables. The use of different mortality tables is done to reflect the probability of lifespan of certain Organizations of policyholders. The Organization also uses the persistence index as an assumptions in the measurement of fulfillment cash flows. The persistence index aims to capture the average time that the policyholder will remain party to the contract considering the possibility of cancellation. The Organization calculates the changes in fulfillment cash flows at the end of each reporting period. This occurs for changes in non-financial and financial assumptions, and discount rates. The Organization first calculates the changes in discount rates and BRADESCO | Consolidated Financial Statements in IFRS 43 Consolidated Financial Statements in IFRS | Notes to the Consolidated Financial Statements financial assumptions on fulfillment cash flows (as expected at the beginning of the period) and then calculates the changes in these cash flows from the change in nonfinancial assumptions. Acquisition cash flow The Organization includes insurance acquisition cash flows in measuring a Organization of insurance contracts if they are directly attributable to individual contracts in that Organization, the Organization itself or the portfolio of insurance contracts to which the Organization belongs. As such, an expense related to the acquisition cash flow is recognized in profit or loss against an increase in the Liability for Remaining Coverage (LRC) related to the insurance contracts. Separation of components The Organization evaluates its products to determine whether it is comprised of components which are distinct and need to be separated and accounted for by applying other accounting standards. When these non-insurance components are not distinct, they are accounted for jointly with the insurance component. The Organization evaluated the contracts under the scope and concluded that there are no components to be separated. Components of investments and underlying assets The Organization defines an investment component as the amount that the insurance contract requires the entity to repay to the policyholder in all circumstances, regardless of the occurrence of an insured event. The Organization also defines an underlying asset as the item that determines some of the amounts payable to the policy holder. Underlying items may comprise any number of items: for example, a reference portfolio of assets, the entity's net assets, or a specific subset of the entity's net assets. Nevertheless, the Organization has no distinct investment component in its insurance portfolio as stated above, it has insurance products with non-distinct investment company. The Organization also has contracts with obligations linked to the underlying assets. The Organization portfolios that fall under both categories are: the Pension Portfolio, including Traditional Pension, PGBL and VGBL portfolios. Income from Insurance The Organization writes insurance contracts and in recognizing income from these contracts, reduces its Liability for Remaining Coverage (LRC). For Organizations of insurance contracts measured under the General Measurement Model (GMM/BBA) and the Variable Fee Approach (VFA), income from insurance is composed of the sum of the changes in Liability for Remaining Coverage (LRC) due to: • Expenses from insurance coverage incurred in the period; • Changes in risk adjustment for non-financial risk; • The amount to be released from the Contractual Service Margin (CSM) for the coverage provided in the period; • Other amounts, such as experience adjustments for premium receipts related to the current or past period, if any. BRADESCO | Consolidated Financial Statements in IFRS 44 Consolidated Financial Statements in IFRS | Notes to the Consolidated Financial Statements Income from insurance also includes the portion of premiums related to the recovery of insurance acquisition cash flows included in expenses from insurance coverage in each period. Both values are measured systematically based on the passage of time. In applying the Premium Allocation Approach (PAA), the Organization recognizes insurance income for the period based on the passage of time, allocating expected premium receipts, including experience adjustments to premiums for each coverage period. Insurance Contract Expenses Expenses from insurance coverage arising from a Organization of insurance contracts issued consist of: • Changes in the Liability for Incurred Claims (LIC) related to claims and expenses incurred in the period, excluding the reimbursement of investment components; • Changes in the Liability for Incurred Claims (LIC) related to claims and expenses incurred in previous periods (related to past coverages); • Other directly attributable expenses from insurance coverage incurred in the period; • Amortization of insurance acquisition costs; • Loss component of onerous Organizations of contracts initially recognized in the period; • Changes in the Liability for Remaining Coverage (LRC) related to future coverage that do not adjust the Contractual Service Margin (CSM), as they are changes in the loss component in the Organizations of onerous contracts. Financial Revenues and Expenses The Organization adopts the segregation of financial income and expenses, recognizing the interest related to insurance contracts in the Statement of Income and the amount related to changes in financial fees and assumptions in other comprehensive income, for all portfolio measured by PAA and GMM/BBA methodology. The financial income and expenses for VFA portfolio is entirely allocated in the Statement of Income. m) Capitalization bonds The liability for capitalization bonds is registered in the line item “Other liabilities”. Financial liabilities and revenues from capitalization bonds are recognized at the time bonds are issued. The bonds are issued according to the types of payments, monthly or in a single payment. Each bond has a nominal value, which is indexed to the Referential Rate index (TR) plus a spread until the redemption or cancellation of the bond. Amounts payable are recognized in the line item “Other Liabilities – Capitalizations Bonds”. Capitalization bond beneficiaries are eligible for a prize draw. At the end of a certain period that is determined at the time the capitalization bond is issued, a beneficiary may redeem the nominal value paid plus the accumulated interest. These products are regulated by the insurance regulator in Brazil; however, they do not meet the definition of an insurance contract and, therefore, are classified as financial liabilities. Unclaimed amounts from “capitalization plans” are derecognized when the obligation legally expires. BRADESCO | Consolidated Financial Statements in IFRS 45 Consolidated Financial Statements in IFRS | Notes to the Consolidated Financial Statements n) Employee benefits Bradesco recognizes, prospectively the surplus or deficit of its defined benefit plans and post-retirement plans as an asset or an obligation in its consolidated statement of financial position, and recognizes the changes in the financial condition during the year in which the changes occurred, in profit or loss. i. Defined contribution plan Bradesco and its subsidiaries sponsor Pension Plans for their employees and Management. Contribution obligations for defined contribution Pension Plans are recognized as expenses in profit or loss as incurred. Once the contributions are paid, Bradesco, in the capacity of employer, has no obligation to make any additional payment. ii. Defined benefit plans The Company’s net obligation, in relation to the defined benefit plans, refers exclusively to institutions acquired and is calculated separately for each plan, estimating the future defined benefit that the employees will be entitled to after leaving the Company or at the time of retirement. Bradesco’s net obligation for defined benefit plans is calculated on the basis of an estimate of the value of future benefits that employees receive in return for services rendered in the current and prior periods. This value is discounted at its current value and is presented net of the fair value of any plan assets. The calculation of the obligation of the defined benefit plan is performed annually by a qualified actuary, using the projected unit credit method. Remeasurement of the net obligation, which include: actuarial gains and losses, the return of the assets of the plan other than the expectation (excluding interest) and the effect of the asset ceiling (if any, excluding interest), are recognized immediately in other comprehensive income. Net interest and other expenses related to defined benefit plans are recognized in the statement of income. iii. Termination benefits Severance benefits are accrued when the employment relationship is terminated by the Company before the employee’s normal date of retirement or whenever the employee accepts voluntary redundancy in return for such benefits. Benefits which are payable 12 months or more after the reporting date are discounted to their present value. iv. Short-term benefits Benefits such as wages, salaries, social security contributions, paid annual leave and paid sick leave, profit sharing and bonuses (which are all payable within 12 months of the reporting date) and non-monetary benefits such as health care, etc. are recorded as expenses in the consolidated statement of income, without any BRADESCO | Consolidated Financial Statements in IFRS 46 Consolidated Financial Statements in IFRS | Notes to the Consolidated Financial Statements discount to present value, if the Company has a present legal or constructive obligation to pay the amount as a result of past service provided by the employee and the obligation can be reliably estimated. o) Fees and commissions Fees and commission income and expense which are part of and are directly allocable to the effective interest rate on a financial asset or liability are included in the calculation of the effective interest rate. Other fee and commission income, substantially composed by account service fees, asset management fees, credit card annual charges, and collection and consortium fees are recognized, to the extent that the obligations of performance are fulfilled. The price is allocated to the provision of the monthly service, and the revenue is recognized in the result in the same manner. Other fee and commission expense relate mainly to transaction as the services are received. p) Income tax and social contribution Deferred tax assets, calculated on income tax losses, social contribution losses and temporary differences, are recognized in “Deferred tax assets” and the deferred tax liabilities on tax differences in lease asset depreciation (applicable only for income tax), fair value adjustments on securities, inflation adjustment of judicial deposits, among others, are recognized in “Deferred tax liabilities”. Deferred tax assets on temporary differences are realized when the difference between the accounting treatment and the income tax treatment reverses. Deferred tax assets on carried forward income tax and social contribution losses are realizable when taxable income is generated, up to the 30% limit of the taxable profit for the period. Deferred tax assets are recognized based on current expectations of realization considering technical studies and analyses carried out by Management. The provision for income tax is calculated at the base rate of 15% of taxable income, plus an additional 10%. The social contribution on net income (CSLL) for financial, insurance and similar companies is calculated at the rate of 15%, 9% for other companies and 20% for banks. Provisions were recognized for income tax and social contribution in accordance with specific applicable legislation. The breakdown of income tax and social contribution, showing the calculations, the origin and expected use of deferred tax assets, as well as unrecognized deferred tax assets, is presented in Note 37 – Income Tax and Social Contribution. q) Segment reporting Information for operating segments is consistent with the internal reports provided to the Executive Officers (being the Chief Operating Decision Makers), which are comprised by the Chief Executive Officer, Executive Vice-Presidents, Managing Officers and Deputy Officers. The Company operates in the banking and insurance segments. The banking operations include operations in retail, middle market and corporate activities, lease, international bank operations, investment banking and private banking. The Company’s banking activities are performed through its own branches located throughout the country, in branches abroad and through BRADESCO | Consolidated Financial Statements in IFRS 47 Consolidated Financial Statements in IFRS | Notes to the Consolidated Financial Statements subsidiaries, as well as by means of our shareholding interest in other companies. The insurance segment consists of insurance operations, Pension Plans and capitalization plans which are undertaken through a subsidiary, Bradesco Seguros S.A., and its subsidiaries. r) Equity Preferred shares - non-subordinated (“preferred”) have no voting rights, but have priority over common shares in reimbursement of capital, in the event of liquidation, up to the amount of the capital represented by such preferred shares, and the right to receive a minimum dividend per share that is ten percent (10%) higher than the dividend distributed per share to the holders of common shares. i. Share issuance costs Incremental costs directly attributable to the issuance of shares are shown net of taxes in shareholders’ equity, thus reducing the initial book value. ii. Earnings per share The Company presents basic and diluted earnings per share data. Basic earnings per share is calculated by allocating the net income attributable to shareholders between that attributable to common shareholders and that attributable to preferred shareholders and dividing this by the weighted average number of common and preferred shares, respectively, outstanding during the year. Diluted earnings per share are the same as basic earnings per share, as there are no potentially dilutive instruments. iii. Dividends payable Dividends on shares are paid and provisioned during the year. In the Shareholders’ Meeting are approved at least the equivalent of 30% of the annual adjusted net income, in accordance with the Company’s Bylaws. Dividends approved and declared after the reporting date of the consolidated financial statements, are disclosed in the notes as subsequent events. iv. Capital transactions Capital transactions are transactions between shareholders. These transactions modify the equity held by the controlling shareholder in a subsidiary. If there is no loss of control, the difference between the amount paid and the fair value of the transaction is recognized directly in the shareholders’ equity. 3) NEW STANDARDS AND AMENDMENTS AND INTERPRETATIONS OF EXISTING STANDARDS a) Standards, amendments and interpretations of standards adopted from January 1, 2025 Amendments IAS 21 – Lack of convertibility between currencies Issued in August 2023, the amendments require that useful and complete information be provided in a company's financial statements when one currency cannot be translated into BRADESCO | Consolidated Financial Statements in IFRS 48 Consolidated Financial Statements in IFRS | Notes to the Consolidated Financial Statements another. The standard establishes that companies adopt a uniform approach when evaluating the possibility of conversion between different currencies. If conversion is not possible, the regulation requires the companies to determine an exchange rate to be used and to disclose this situation appropriately. These changes are effective as of January 1, 2025 and the Organization has concluded that there were no impacts with the application of this standard. b) Standards, amendments and interpretations of standards issued but not yet effective Amendments to IFRS 9 and IFRS 7 - Classification and Measurement of Financial Instruments The amendments, issued in May 2024, clarify the classification of financial assets with environmental, social and corporate governance (ESG) and similar characteristics, in addition to addressing criteria for the settlement of liabilities through electronic payment systems. These amendments are effective as of January 1, 2026 and the Organization concluded that there will be no initial impacts with the application of this standard. New IFRS 18 - Presentation and Disclosure in Financial Statements The new standard, issued in April 2024, replaces IAS 1 - Presentation of Financial Statements and introduces new requirements to improve disclosure of the financial performance of companies, including: Three categories defined for income and expenses – operating, investments and financing – and new defined subtotals, including operating income; Disclosure of information on company-specific indicators related to the statement of income, called performance measures defined by management; Improved guidance on the aggregation of information and whether it should be provided in the primary financial statements or in the notes; Greater transparency for operating expenses; and specific requirements on how companies, such as banks and insurance companies, classify revenues and expenses in the operating category. IFRS 18 will go into effect on January 1, 2027. The Organization is reviewing the impacts of the new standard. New IFRS 19 – Subsidiaries without Public Accountability The new standard, issued in May 2024, allows eligible subsidiaries to use IFRS accounting standards with reduced disclosures. This will reduce the costs of preparing financial statements for these subsidiaries, while maintaining the usefulness of the information for users of their financial statements. IFRS 19 will go into effect on January 1, 2027. The Organization concluded that there will be no initial impacts from the application of this standard. Amendments to IAS 21 – Hyperinflationary Presentation Currency The IASB has proposed amendments to IAS 21 to address the lack of guidance on how to translate financial statements when an entity presents its financial statements in a hyperinflationary presentation currency but has a non‑hyperinflationary functional currency or foreign operations in that condition. The proposal requires translation using the closing rate for all amounts, with disclosure on the adoption of this approach and the presentation of summarized information on affected foreign operations. The amendments will be effective on January 1, 2027. The Organization is assessing the impacts of the new standard. BRADESCO | Consolidated Financial Statements in IFRS 49 Consolidated Financial Statements in IFRS | Notes to the Consolidated Financial Statements 4) ESTIMATES AND JUDGMENTS The Organization adopts estimates and judgments that may affect the reported carrying amounts of assets, liabilities, income and expenses in the next year, and the assumptions are determined in accordance with the applicable standard. Estimates and judgements are reviewed on an ongoing basis and are consistent with the Organization’s risk management. Estimate revisions are recognized prospectively. Judgments Information about judgments made in applying accounting policies that have the most significant effects on the amounts recognized in the consolidated financial statements are included in the following notes: - Note 13 Consolidation: whether the Organization has de facto control over the investee; and equity-accounted investees: whether the Organization has significant influence over the investee; and - Note 21 - Measurement of insurance liabilities: Methodologies are used considering all relevant facts and circumstances to determine a systematic and rational method for estimating insurance contract coverage in accordance with the Premium Allocation Model (PAA), General Measurement Model (GMM/BBA) and Variable Rate Model (VFA). Estimates Estimates that carry a significant risk as they may have a material impact on the values of assets and liabilities in the next year, and the actual results may be different from those previously established. The table below includes the significant accounting estimates and their respective notes: Accounting estimates Note ● Fair value of financial instruments (Level II and III) 6 / 8 / 29 / 30 and 40.5 ● Expected credit loss 10 / 11 and 40.2 ● Impairment of intangible assets and goodwill 15 ● Insurance contract liabilities 21 ● Other provisions 22 ● Realization of deferred income tax 37 Fair value of financial instruments Financial instruments recognized at fair value in our consolidated financial statements consist primarily of financial assets measured at fair value through profit or loss, including derivatives and financial assets classified as measured at fair value through other comprehensive income. The fair value of a financial instrument is the price that would be received to sell an asset or paid to transfer a liability in an orderly transaction between market participants at the reporting date. These financial instruments are categorized within a hierarchy based on the lowest level of input that is significant to the fair value measurement. For instruments classified as level 3, we have to apply a significant amount of our own judgment in arriving at the fair value measurement. We base our judgment decisions on our knowledge and observations of the markets relevant to the individual assets and liabilities, and those judgments may vary based on market conditions. In applying our judgment, we look at a range of third-party prices and transaction volumes to understand and assess the extent of market benchmarks available and the judgments or modeling required in third-party processes. Based on these factors, we determine whether the fair values are observable in active markets or whether the markets are inactive. BRADESCO | Consolidated Financial Statements in IFRS 50 Consolidated Financial Statements in IFRS | Notes to the Consolidated Financial Statements Imprecision in estimating unobservable market inputs can impact the amount of revenue or loss recorded for a particular position. Furthermore, while we believe our valuation methods are appropriate and consistent with those of other market participants, the use of different methodologies or assumptions to determine the fair value of certain financial instruments could result in a different estimate of fair value on the reporting date. For a detailed discussion about the determination of fair value of financial instruments, see Note 40.5. - fair value of financial assets and liabilities. Expected credit loss The measurement of the provision for expected credit losses on financial assets measured at amortized cost and at fair value through other comprehensive income, as well as on loan commitments and financial guarantees, requires the use of complex quantitative models and assumptions about future economic conditions and credit behavior. Several significant judgments are also required to apply the accounting requirements for the measurement of the expected credit loss, such as: • Determine the criteria in order to identify the significant increase of credit risk; • Select quantitative models and suitable assumptions; • Establish several prospective scenarios and assumptions; • Organization similar financial assets; and • Define the expected time frame of exposure to credit risk for instruments without the contractual maturity defined. The process to determine the level of provision for expected credit loss requires estimates and the use of judgment; it is possible that actual losses presented in subsequent periods will differ from those calculated according to current estimates and assumptions. The explanation of assumptions and estimation techniques used in the measurement of expected credit loss is further detailed in Note 40.2. - credit risk. Impairment of intangible assets and goodwill The Organization analyzes, at least annually, whether the carrying value of intangible assets and goodwill (including goodwill identified in the acquisition of associates and joint ventures) is impaired. The first step of the process requires the identification of independent Cash-Generating Units and the allocation of goodwill to these units. The carrying amount of the CGU, including the allocated goodwill, is compared to its recoverable amount to determine whether any impairment exists. If the value in use of a cash-generating unit is less than its carrying value, goodwill will be impaired. Detailed calculations may need to be carried out taking into consideration changes in the market in which a business operates (e.g., competitive activity, regulatory change). The value in use is based upon discounting expected pre-tax cash flows at a risk-adjusted interest rate appropriate to the operating unit, the determination of both requires one to exercise one’s judgment. While forecasts are compared with actual performance and external economic data, expected cash flows naturally reflect the Organization’s view of future performance. Realization of deferred income tax The determination of the amount of our income tax liability is complex, and our assessment is related to our analysis of our deferred tax assets and liabilities and income tax payable. In general, our evaluation requires that we estimate future amounts of current and BRADESCO | Consolidated Financial Statements in IFRS 51 Consolidated Financial Statements in IFRS | Notes to the Consolidated Financial Statements deferred taxes. Our assessment of the possibility that deferred tax assets are realized is subjective and involves assessments and assumptions that are inherently uncertain in nature. The underlying support for our assessments and assumptions could change over time as a result of unforeseen events or circumstances, affecting our determination of the amount of our tax liability. Significant judgment is required in determining whether it is more likely than not that an income tax position will be sustained upon examination, even after the outcome of any related administrative or judicial proceedings based on technical merits. Further judgment is then required to determine the amount of benefit eligible for recognition in our consolidated financial statements. In addition, we have monitored the interpretation of tax laws by, and decisions of, the tax authorities and Courts so that we can adjust any prior judgment of accrued income taxes. These adjustments may also result from our own income tax planning or resolution of income tax controversies and may be material to our operating results for any given period. For additional information about income tax, see Note 37 – Income tax and social contribution. Insurance contract liabilities Insurance contract liabilities are liabilities constituted to honor future commitments to or on behalf of our policyholders – see Note 2(k). These commitments are based in assumptions that are derived from the Organization's portfolio experience and are periodically reviewed. Other provisions The provisions are regularly reviewed and constituted, where the loss is deemed probable, taking into consideration the opinion of the Organization’s legal counsel, the nature of the lawsuit, similarity to previous lawsuits, complexity and the courts standing. 5) CASH, CASH EQUIVALENTS AND BALANCES WITH BANKS a) Cash, cash equivalents and balances with banks R$ thousands On December 31, 2025 On December 31, 2024 Cash and due from banks in domestic currency 12,518,263 17,384,505 Cash and due from banks in foreign currency 2,833,485 2,143,785 Reverse repurchase agreements (1) (a) 167,865,086 171,195,511 Discretionary deposits at the Central Bank 10,300,000 17,300,000 Cash and cash equivalents 193,516,834 208,023,801 Compulsory deposits with the Central Bank (2) 111,379,449 109,786,380 Cash, cash equivalents and balances with banks (b) 304,896,283 317,810,181 Cash and balances with banks (b) - (a) 137,031,197 146,614,670 (1) Refers to operations whose maturity on the effective investment date is equal to or less than 90 days and present an insignificant risk of change. In the Consolidated Statements of Financial Position these are presented as ‘loans and advances to financial institutions’ – refer to note 10; and (2) Compulsory deposits with the Central Bank of Brazil (Bacen) refers to a minimum balance that financial institutions must maintain at the Central Bank of Brazil based on a percentage of deposits received from third parties. BRADESCO | Consolidated Financial Statements in IFRS 52 Consolidated Financial Statements in IFRS | Notes to the Consolidated Financial Statements 6) FINANCIAL ASSETS AND LIABILITIES MEASURED AT FAIR VALUE THROUGH PROFIT OR LOSS a) Financial assets measured at fair value through profit or loss R$ thousands On December 31, 2025 On December 31, 2024 Financial assets Brazilian government bonds 395,031,887 263,224,363 Bank debt securities 43,367,217 36,983,297 Corporate debt and marketable equity securities 69,444,655 41,637,680 Mutual funds 18,840,361 9,368,468 Brazilian sovereign bonds 188,999 366,034 Foreign governments securities 66,555 468,521 Derivative financial instruments 20,850,095 19,834,985 Total 547,789,769 371,883,348 b) Maturity R$ thousands On December 31, 2025 On December 31, 2024 Maturity of up to one year 104,436,644 53,549,658 Maturity of one to five years 324,982,243 228,464,602 Maturity of five to 10 years 63,317,857 57,839,535 Maturity of over 10 years 12,676,571 8,119,026 No stated maturity 42,376,454 23,910,527 Total 547,789,769 371,883,348 The financial instruments pledged as collateral classified as “Financial assets measured at fair value through profit or loss”, totaled R$81,235,231 thousand on December 31, 2025 (R$15,626,382 thousand on December 31, 2024), being composed primarily of Brazilian government bonds. c) Liabilities measured at fair value through profit or loss R$ thousands On December 31, 2025 On December 31, 2024 Derivative financial instruments 18,268,330 16,240,611 Total 18,268,330 16,240,611 7) DERIVATIVE FINANCIAL INSTRUMENTS Bradesco carries out transactions with derivative financial instruments, which are recognized in the consolidated statements of financial position, to meet its own needs in managing its global exposure. These operations involve a range of derivatives, such as interest rate and currency swaps, futures, options, forward contracts and credit derivative instruments. BRADESCO | Consolidated Financial Statements in IFRS 53 Consolidated Financial Statements in IFRS | Notes to the Consolidated Financial Statements Bradesco’s risk management policy is based on the utilization of derivative financial instruments mainly to mitigate the risks from operations carried out by the Bank and its subsidiaries. Derivative financial instruments are measured at fair value and classified in the fair value through profit or loss (FVTPL) category. Fair value is generally determined based on quoted market prices or quotations for assets or liabilities with similar characteristics. When such quotations are not available, fair value is estimated on information from market operators, pricing models, discounted cash flow, or similar techniques. In these cases, determining fair value may require significant judgment or estimation by Management. The fair value of swaps is determined using discounted cash flow modeling techniques, utilizing yield curves that reflect appropriate risk factors. These curves are applied to the pricing of currency swaps, interest rate swaps, and swaps with other risk factors. The information used to construct yield curves is obtained primarily from B3 and the domestic and international secondary markets. The fair value of futures and forward contracts is determined based on market price quotations for exchange-traded derivatives or using methodologies similar to those used in pricing swaps. The fair value of options is determined based on mathematical models, such as Black & Scholes, using yield curves, implied volatilities and the fair value of the underlying assets. The fair value of credit derivative instruments is determined based on market price quotations or obtained from specialized entities. Current market prices are used to calculate volatility. To estimate the fair value of over-the-counter derivatives, the credit quality of each counterparty is also taken into account, thus associating an expected credit losses for each derivative portfolio (Credit valuation adjustment). The derivative financial instruments held by Bradesco in Brazil primarily consist of swaps, options and futures, and are registered with B3. Derivatives held abroad refer to swaps, forwards, options, credit derivative instruments and futures transactions carried out, substantially, on the Chicago and New York Stock Exchanges, as well as on the overthe- counter market. Macro strategies are defined for the Trading (proprietary) and Banking portfolios. Trading Portfolio transactions, including derivatives, seek gains from directional movements in prices and/or rates, arbitrage, hedge and market-maker strategies that may be fully or partially settled before the originally stipulated maturity date. The Banking Portfolio focuses on commercial transactions and their hedges. Portfolio risk is controlled using information consolidated by risk factor; effective portfolio risk management requires joint use of derivatives with other instruments, including stocks and bonds. BRADESCO | Consolidated Financial Statements in IFRS 54 Consolidated Financial Statements in IFRS | Notes to the Consolidated Financial Statements R$ thousands On December 31, 2025 On December 31, 2024 Notional value Fair Value Notional value Fair Value Futures contracts Purchase commitments: 232,864,244 (450,905) 211,703,083 313,498 - Interbank market 150,634,305 17,542 178,029,255 133,681 - Foreign currency 54,344,313 (471,042) 22,985,640 140,203 - Other 27,885,626 2,595 10,688,188 39,614 Sale commitments: 165,612,193 523,762 161,641,895 (174,595) - Interbank market (1) 111,724,128 (21,535) 95,605,090 (107,908) - Foreign currency (2) 30,741,161 530,151 48,246,297 (29,358) - Other 23,146,904 15,146 17,790,508 (37,329) Option contracts Purchase commitments: 783,864,910 1,828,145 685,622,189 1,178,745 - Interbank market 718,584,779 106,261 528,190,365 504,563 - Foreign currency 9,616,237 1,121,228 3,949,723 113,072 - Other 55,663,894 600,656 153,482,101 561,110 Sale commitments: 790,685,040 (2,645,067) 672,980,325 (1,656,652) - Interbank market 721,019,609 (113,341) 513,818,125 (440,226) - Foreign currency 15,908,308 (947,331) 6,870,683 (400,855) - Other 53,757,123 (1,584,395) 152,291,517 (815,571) Forward contracts Purchase commitments: 76,859,205 (200,542) 64,273,935 2,528,685 - Foreign currency 64,714,131 (1,459,502) 62,442,929 2,569,853 - Other 12,145,074 1,258,960 1,831,006 (41,168) Sale commitments: 53,889,171 456,033 47,310,325 (1,117,059) - Foreign currency (2) 45,530,533 520,221 46,463,548 (1,522,017) - Other 8,358,638 (64,188) 846,777 404,958 Swap contracts Assets (long position): 928,071,044 9,550,875 1,080,360,424 13,634,425 - Interbank market 75,975,089 4,695,032 57,567,711 4,561,085 - Fixed rate 315,081,578 454,827 692,873,598 379,570 - Foreign currency 521,032,423 2,485,099 319,020,245 7,472,073 - IGPM (General Index of market pricing) 31,221 29,994 41,362 41,865 - Other 15,950,733 1,885,923 10,857,508 1,179,832 BRADESCO | Consolidated Financial Statements in IFRS 55 Consolidated Financial Statements in IFRS | Notes to the Consolidated Financial Statements R$ thousands On December 31, 2025 On December 31, 2024 Notional value Fair Value Notional value Fair Value Liabilities (short position): 873,497,122 (6,480,535) 934,060,342 (10,973,770) - Interbank market 32,343,513 (1,378,695) 246,185,275 (2,408,270) - Fixed rate 470,848,308 (725,508) 477,454,859 (314,670) - Foreign currency 355,159,513 (2,649,262) 202,546,445 (7,527,737) - IGPM (General Index of market pricing) 103,000 (116,300) 103,000 (158,893) - Other 15,042,788 (1,610,770) 7,770,763 (564,200) Total 3,905,342,929 2,581,766 3,857,952,518 3,733,277 Derivatives include operations maturing in D+1 (day after reporting date). (1) Includes: (i) accounting cash flow hedges to protect DI-indexed funding totaling R$100,113,669 thousand (R$59,956,404 thousand on December 31, 2024); and (ii) accounting cash flow hedges to protect DI-indexed (Interbank Deposit Rate) investments totaling R$6,034,612 thousand (R$24,468,458 thousand on December 31, 2024); and (2) Includes specific hedges to protect assets and liabilities, arising from foreign investments. Investments abroad total R$10,625,523 thousand (R$42,019,674 thousand on December 31, 2024). Swaps include contracts of interest rates, foreign currency and cross currency and interest rates in which payments of interest or the principal or in one or two different currencies are exchanged for a contractual period. The risks of swap contracts refer to the potential inability or unwillingness of the counterparties to comply with the contractual terms and the risk associated with changes in market conditions due to changes in the interest rates and the currency exchange rates. The interest rate and currency futures and the forward contracts of interest rates call for subsequent delivery of an instrument at a specific price or specific profitability. The reference values constitute a nominal value of the respective instrument whose variations in price are settled daily. The credit risk associated with futures contracts is minimized due to these daily settlements. Futures contracts are also subject to risk of changes in interest rates or in the value of the respective instruments. BRADESCO | Consolidated Financial Statements in IFRS 56 Consolidated Financial Statements in IFRS | Notes to the Consolidated Financial Statements Credit Default Swap – CDS In general, these represent a bilateral contract in which one of the counterparties buys protection against a credit risk of a particular financial instrument (it’s risk is transferred). The counterparty that sells the protection receives a remuneration that is usually paid linearly over the life of the operation. In the event of a default, the counterparty who purchased the protection will receive a payment, the purpose of which is to compensate for the loss of value in the financial instrument. In this case, the counterparty that sells the protection normally will receive the underlying asset in exchange for said payment. R$ thousands On December 31, 2025 (1) On December 31, 2024 Risk received in credit swaps - Notional 1,840,305 1,954,290 - Debt securities issued by companies 1,195,369 783,357 - Brazilian government bonds 644,936 714,560 - Foreign government bonds - 456,373 Risk transferred in credit swaps - Notional (137,560) (1,120,806) - Companies bonds (137,560) (154,807) - Brazilian government bonds - (705,922) - Foreign government bonds - (260,077) (1) The adjustment to the fair value of credit swaps for risk received is R$(233,593) thousand and for risk transferred R$(54,998) thousand. The contracts related to credit derivative transactions described above are due in 2032. There were no credit events, as defined in the agreements, during the period. Hedge Accounting Hedge accounting is a practice that uses derivative financial instruments with the objective of reducing or eliminating the accounting mismatches that exist in a hedging relationship between a hedging instrument and a hedged item. In other words, this methodology seeks to offset, in whole or in part, the risks arising from exposures to specific factors that may affect the Organization’s statements of income or other comprehensive income. The hedge effectiveness may be impacted primarily when, during the hedging relationship period, changes occur in the market risk environment or in the counterparty’s credit risk. As of December 31, 2025, Bradesco maintained hedge positions, composed of: Cash Flow Hedges The financial instruments classified in this category, aim to reduce exposure to future changes in interest and foreign exchange rates. The effective portion of the changes in fair value of these instruments, is recognized in a separate account of shareholders' equity, net of tax effects and is only transferred to the income statement in two situations: (i) in case of ineffectiveness of the hedge; or (ii) when the hedged item is settled. The ineffective portion of the respective hedge is recognized directly in the statement of income. BRADESCO | Consolidated Financial Statements in IFRS 57 Consolidated Financial Statements in IFRS | Notes to the Consolidated Financial Statements With respect to the DI floating interest rate risk, the hedge accounting strategies designated for the instruments classified in this category make use of DI Futures contracts traded on B3, swaps, and Fed Funds. The maturity terms extend through 2032, converting the cash flows into fixed rates. The effectiveness measured in the hedge portfolio complies with the applicable regulatory requirements. Strategy R$ thousands Object Instrument Hedge object (carrying amount) Hedge instrument (nominal value) Fair value adjustment in shareholder's equity * (effective portion) Fair value adjustments in shareholders' equity (net of tax effects) On December 31, 2025 Asset Interest receipts from investments in securities 11,034,575 10,625,523 (39,611) (21,786) Liabilities Funding Hedge - interest payments 102,370,447 100,113,669 (238,820) (131,650) On December 31, 2024 Asset Interest receipts from investments in securities 24,913,057 24,468,458 (147,831) (81,307) Liabilities Funding Hedge - interest payments 61,308,525 59,956,404 258,194 142,045 * Gross tax effects. Changes in the value of the hedged item used as a basis for recognizing hedge ineffectiveness for the period are reflected in the fair value of the instrument through an effectiveness test. In December 2021, Bradesco terminated some hedge accounting instruments to protect cash flows. The fair value changes of these hedging instruments, recorded in accumulated OCI, is appropriated to statement of income, according to the result of the hedged item. In the year ended December 31, 2025, the amount of R$9,979 thousand was reclassified to the statement of income, net of tax effects. The accumulated balance in OCI as of December 31, 2025 is R$5,468 thousand, this amount will be appropriated to statement of income until the year 2027. There were no other reclassifications to the statement of income of amounts recorded in other comprehensive income for the year ended December 31, 2025. The ineffective portion is recognized directly in statement of income. During the year ended December 31, 2025, there was no ineffectiveness. Fair value hedge The financial instruments classified in this category are intended to offset the risks arising from exposure to changes in the fair value of the hedged item. The effective portion of the gains or losses on the instrument is measured by variation of adjustment to the fair value of the instruments and is recognized in statement of income, net of tax effects. With respect to fixed-rate funding risk, the hedge accounting strategies designated for the instruments classified in this category make use of DI Futures contracts, with maturities extending through 2032. The hedge effectiveness measured in the portfolio is in compliance with the applicable regulatory requirements. BRADESCO | Consolidated Financial Statements in IFRS 58 Consolidated Financial Statements in IFRS | Notes to the Consolidated Financial Statements Strategy R$ thousands Instrument Object Hedge instrument (fair value) Fair value adjustment Hedge object (carrying amount) Fair value adjustment in statement of income * (effective portion) Fair value adjustments in statement of income (net of tax effects) Asset Financial bill hedge 79,938 (1,405) 79,857 1,489 819 Total on December 31, 2025 79,938 (1,405) 79,857 1,489 819 * Gross tax effects. The ineffectiveness portion is recognized directly in statement of income. During the year ended December 31, 2025, there was no ineffectiveness. Hedge of investments abroad The financial instruments classified in this category, have the objective of reducing the exposure to foreign exchange variation of investments abroad, whose functional currency is different from the Brazilian real, which impacts the net income of the Organization. The effective portion of the valuations or devaluations of these instruments, is evaluated using the variation comparison methodology exchange rate of the object and hedging instrument, being recognized in a separate account of shareholders' equity, net of tax effects and is only transferred to the statement of income in two situations: (i) hedge ineffectiveness; or (ii) in the disposal or partial sale of the foreign operation. With respect to foreign currency risk, for which the functional currency differs from the Brazilian real, the hedge accounting strategies designated for the instruments classified in this category make use of Forward contracts and U.S. Dollar Futures contracts, with the hedged item being the foreign investment referenced in MXN (Mexican Peso) and USD (U.S. Dollar). The hedge effectiveness measured in the portfolio complies with the applicable regulatory requirements. Strategy R$ thousands Object Instrument Hedge object (carrying amount) Hedge instrument (nominal value) Fair value adjustments in shareholders' equity * (effective portion) Fair value adjustments in shareholders' equity (net of tax effects) Asset Currency exchange rate hedge for investment abroad 5,177,416 5,876,575 (1,207,436) (633,209) Total on December 31, 2025 5,177,416 5,876,575 (1,207,436) (633,209) Currency exchange rate hedge for investment abroad 5,166,624 5,603,750 (1,536,225) (805,635) Total on December 31, 2024 5,166,624 5,603,750 (1,536,225) (805,635) * Gross tax effects. Changes in the value of the hedged item used as a basis for recognizing hedge ineffectiveness for the period are reflected in the fair value of the instrument through an effectiveness test. The ineffective portion of the respective hedge is recognized directly in statement of income. BRADESCO | Consolidated Financial Statements in IFRS 59 Consolidated Financial Statements in IFRS | Notes to the Consolidated Financial Statements Unobservable gains on initial recognition When the valuation depends on unobservable data any initial gain or loss on financial instruments is deferred over the life of the contract or until the instrument is redeemed, transferred, sold or the fair value becomes observable. All derivatives which are part of the hedge relationships are valued on the basis of observable market data. The nominal values do not reflect the actual risk assumed by the Organization, since the net position of these financial instruments arises from compensation and/or combination thereof. The net position is used by the Organization particularly to protect interest rates, the price of the underlying assets or exchange risk. The result of these financial instruments is recognized in “Net gains/(losses) on financial assets and liabilities measured at fair value through profit or loss”, in the consolidated statement of income. Offsetting of financial assets and liabilities A financial asset and a financial liability are offset and their net value presented in the consolidated statements of financial position when, and only when, there is a legally enforceable right to offset the amounts recognized and the Organization intends to settle them on a net basis, or to realize the asset and settle the liability simultaneously. The right of offset is exercised upon the occurrence of certain events, such as the default of bank loans or other credit events. Given the non-occurrence of these events, as of December 31, 2025 and December 31, 2024, Bradesco did not offset any financial assets and financial liabilities in its consolidated statements of financial position. The table below presents financial assets and liabilities subject to net settlement: R$ thousands On December 31, 2025 On December 31, 2024 Gross amount Related amount offset in the consolidated statements Net amount Gross amount Related amount offset in the consolidated statements Net amount Financial assets Interbank investments 218,329,819 - 218,329,819 178,260,906 - 178,260,906 Derivative financial instruments 20,850,095 - 20,850,095 19,834,985 - 19,834,985 Financial liabilities Securities sold under agreements to repurchase 160,636,183 - 160,636,183 165,916,852 - 165,916,852 Derivative financial instruments 18,268,330 - 18,268,330 16,240,611 - 16,240,611 BRADESCO | Consolidated Financial Statements in IFRS 60 Consolidated Financial Statements in IFRS | Notes to the Consolidated Financial Statements 8) FINANCIAL ASSETS MEASURED AT FAIR VALUE THROUGH OTHER COMPREHENSIVE INCOME a) Financial assets measured at fair value through other comprehensive income R$ thousands Amortized cost Unrealized positive fair value adjustments Unrealized negative fair value adjustments Fair Value Brazilian government bonds 112,830,390 291,814 (6,405,576) 106,716,628 Corporate debt securities 8,721,363 25,793 (90,252) 8,656,904 Bank debt securities 1,781,089 10,854 (3,193) 1,788,750 Brazilian government bonds issued abroad 7,818,067 70,339 (71,589) 7,816,817 Foreign governments securities 8,167,066 16,372 (5,507) 8,177,931 Mutual funds 90,743 31,365 - 122,108 Marketable equity securities and other stocks 6,583,814 394,761 (1,259,608) 5,718,967 Balance on December 31, 2025 145,992,532 841,298 (7,835,725) 138,998,105 Brazilian government bonds 130,816,058 499,809 (7,486,852) 123,829,015 Corporate debt securities 1,668,220 50,109 (68,505) 1,649,824 Bank debt securities 4,058,853 2,427 (48,983) 4,012,297 Brazilian government bonds issued abroad 8,898,238 193,226 (131,131) 8,960,333 Foreign governments securities 8,309,452 15,206 - 8,324,658 Mutual funds 4,928,849 22,948 (3) 4,951,794 Marketable equity securities and other stocks 6,781,513 271,002 (2,487,852) 4,564,663 Balance on December 31, 2024 165,461,183 1,054,727 (10,223,326) 156,292,584 b) Maturity R$ thousands On December 31, 2025 On December 31, 2024 Amortized cost Fair Value Amortized cost Fair Value Due within one year 28,535,677 28,429,036 51,518,105 51,438,404 From 1 to 5 years 47,427,746 46,441,083 38,658,601 37,659,332 From 5 to 10 years 36,627,270 34,985,787 36,055,172 34,657,222 Over 10 years 26,727,282 23,301,124 27,518,943 23,021,169 No stated maturity 6,674,557 5,841,075 11,710,362 9,516,457 Total 145,992,532 138,998,105 165,461,183 156,292,584 The financial instruments pledged as collateral, classified as financial assets measured at fair value through other comprehensive income, totalled R$27,494,154 thousand on December 31, 2025 (R$31,880,243 thousand on December 31, 2024), being composed mostly of Brazilian government bonds. c) Investments in equity instruments designated measured at fair value through other comprehensive income R$ thousands Cost Adjustments to Fair Value Fair Value Marketable equity securities and other stocks 6,583,814 (864,847) 5,718,967 Total on December 31, 2025 6,583,814 (864,847) 5,718,967 Marketable equity securities and other stocks 6,781,513 (2,216,850) 4,564,663 Total on December 31, 2024 6,781,513 (2,216,850) 4,564,663 BRADESCO | Consolidated Financial Statements in IFRS 61 Consolidated Financial Statements in IFRS | Notes to the Consolidated Financial Statements The Bank adopted the option of designating equity instruments measured at fair value through other comprehensive income upon initial recognition due to the particularities of IFRS 17 – insurance contracts. d) Reconciliation of expected credit losses of financial assets at FVOCI: R$ thousands Stage 1 Stage 2 Stage 3 Total Expected credit losses of financial assets at FVOCI on December 31, 2023 41,160 2,979 92,745 136,884 New assets originated / (Assets settled or paid)/Remeasurement of expected credit losses (31,520) (1,436) (89,622) (122,578) Expected credit losses of financial assets at FVOCI on December 31, 2024 9,640 1,543 3,123 14,306 New assets originated / (Assets settled or paid)/Remeasurement of expected credit losses 9,594 (1,543) - 8,051 Expected credit losses of financial assets at FVOCI on December 31, 2025 (1) 19,234 - 3,123 22,357 (1) There was no movement between stages. 9) DEBT INSTRUMENTS AT AMORTIZED COST a) Securities at amortized cost R$ thousands Amortized cost Gross unrealized gains (1) Gross unrealized losses (1) Fair Value Securities: Brazilian government bonds 135,339,275 505,190 (6,159,482) 129,684,983 Bank debt securities and corporate debt securities 124,207,296 1,842,639 (4,526,832) 121,523,103 Balance on December 31, 2025 259,546,571 2,347,829 (10,686,314) 251,208,086 Securities: Brazilian government bonds 145,278,232 3,032,908 (8,559,744) 139,751,396 Bank debt securities and corporate debt securities 121,713,735 23,020 (392,053) 121,344,702 Balance on December 31, 2024 266,991,967 3,055,928 (8,951,797) 261,096,098 (1) Unrealized gains and losses on assets at amortized cost have not been recognized in comprehensive income. b) Maturity R$ thousands On December 31, 2025 On December 31, 2024 Amortized cost Fair Value Amortized cost Fair Value Due within one year 54,891,298 54,651,238 60,043,632 59,988,685 From 1 to 5 years 138,622,149 137,128,315 148,260,712 147,475,479 From 5 to 10 years 41,306,602 37,109,312 32,891,366 32,474,161 Over 10 years 24,726,522 22,319,221 25,796,257 21,157,773 Total 259,546,571 251,208,086 266,991,967 261,096,098 The financial instruments pledged as collateral, classified as financial assets at amortized cost, totalled R$51,575,375 thousand on December 31, 2025 (R$75,296,338 thousand on December 31, 2024), being composed mostly of Brazilian government bonds. BRADESCO | Consolidated Financial Statements in IFRS 62 Consolidated Financial Statements in IFRS | Notes to the Consolidated Financial Statements c) Reconciliation of expected credit losses of financial assets at amortized cost R$ thousands Stage 1 Stage 2 Stage 3 Total (1) Expected credit losses of financial assets at amortized cost on December 31, 2023 370,902 186,825 4,587,539 5,145,266 Transferred to Stage 1 - (19,638) (2,113) (21,751) Transferred to Stage 2 (1,291) - (390) (1,681) Transferred to Stage 3 (21,207) (34,942) - (56,149) Transfer from Stage 1 - 1,291 21,207 22,498 Transfer from Stage 2 19,638 - 34,942 54,580 Transfer from Stage 3 2,113 390 - 2,503 New assets originated / (Assets settled or paid)/Remeasurement of expected credit losses 333,678 (83,815) 761,871 1,011,734 Expected credit losses of financial assets at amortized cost on December 31, 2024 703,833 50,111 5,403,056 6,157,000 Transferred to Stage 1 - (1,740) (4,970) (6,710) Transferred to Stage 2 (13,372) - (60,084) (73,456) Transferred to Stage 3 (103,901) (20,530) - (124,431) Transfer from Stage 1 - 13,372 103,901 117,273 Transfer from Stage 2 1,740 - 20,530 22,270 Transfer from Stage 3 4,970 60,084 - 65,054 New assets originated / (Assets settled or paid)/Remeasurement of expected credit losses 32,296 150,206 (2,775,010) (2,592,508) Expected credit losses of financial assets at amortized cost on December 31, 2025 625,566 251,503 2,687,423 3,564,492 (1) The expected credit losses expense is recorded as “Expected Credit Losses on Other Financial Assets” in the Consolidated Statement of Income. 10) LOANS AND ADVANCES TO FINANCIAL INSTITUTIONS MEASURED AT AMORTIZED COST R$ thousands On December 31, 2025 On December 31, 2024 Reverse repurchase agreements (1) 218,329,819 178,260,906 Loans to financial institutions 17,155,248 18,160,221 Expected credit losses (13) (187,829) Total 235,485,054 196,233,298 (1) On December 31, 2025, it included financial investments given in guarantee in the amount of R$159,547,767 thousand (R$151,175,863 thousand on December 31, 2024). BRADESCO | Consolidated Financial Statements in IFRS 63 Consolidated Financial Statements in IFRS | Notes to the Consolidated Financial Statements 11) LOANS AND ADVANCES TO CUSTOMERS MEASURED AT AMORTIZED COST a) Loans and advances to customers by type of product R$ thousands On December 31, 2025 On December 31, 2024 Companies 350,445,791 316,936,343 - Financing and On-lending 137,576,819 132,471,486 - Financing and export 34,763,790 40,904,095 - Housing loans 34,911,156 30,655,876 - On-lending BNDES/Finame 24,475,073 20,475,116 - Vehicle loans 23,074,448 21,934,635 - Import 12,986,200 12,505,529 - Leases 7,366,152 5,996,235 - Borrowings 195,880,958 169,958,833 - Working capital 143,640,424 100,012,698 - Rural loans 13,324,492 11,811,476 - Other 38,916,042 58,134,659 - Limit operations (1) 16,988,014 14,506,024 Individuals 441,022,363 403,303,243 - Financing and On-lending 161,548,810 144,876,576 - Housing loans 112,626,278 102,627,589 - Vehicle loans 41,797,766 34,962,102 - On-lending BNDES/Finame 6,616,649 6,927,661 - Other 508,117 359,224 - Borrowings 189,710,201 177,325,731 - Personal credit 165,277,140 140,843,129 - Rural loans 17,680,946 15,530,021 - Other 6,752,115 20,952,581 - Limit operations (1) 89,763,352 81,100,936 Total portfolio 791,468,154 720,239,586 Expected credit losses (47,011,092) (47,857,481) Total of net loans and advances to customers 744,457,062 672,382,105 (1) Refers to outstanding operations with pre-established limits linked to current account and credit card, whose credit limits are automatically recomposed as the amounts used are paid. b) Finance Lease Receivables Loans and advances to customers include the following finance lease receivables. R$ thousands On December 31, 2025 On December 31, 2024 Gross investments in finance lease receivables: Up to one year 296,547 2,247,876 From one to five years 6,041,176 3,791,737 Over five years 1,296,410 196,239 Impairment loss on finance lease receivables (114,049) (54,241) Net investment 7,520,084 6,181,611 Net investments in finance lease: Up to one year 291,293 2,227,115 From one to five years 5,952,651 3,760,889 Over five years 1,276,140 193,607 Total 7,520,084 6,181,611 BRADESCO | Consolidated Financial Statements in IFRS 64 Consolidated Financial Statements in IFRS | Notes to the Consolidated Financial Statements c) Reconciliation of the gross book value of loans and advances to customers Stage 1 R$ thousands Balance on December 31, 2024 Transfer to Stage 2 Transfer to Stage 3 Transfer from Stage 2 Transfer from Stage 3 Originated Maturities/Early Settlements (Write off) Balance on December 31, 2025 Companies 284,237,991 (4,468,832) (3,884,782) 698,839 408,417 184,254,333 (145,544,269) - 315,701,697 - Financing 125,114,754 (1,474,567) (917,207) 184,185 82,925 59,726,132 (53,000,739) - 129,715,483 - Borrowings 146,737,983 (2,714,895) (2,840,003) 453,602 305,971 119,643,384 (89,906,141) - 171,679,901 - Revolving 12,385,254 (279,370) (127,572) 61,052 19,521 4,884,817 (2,637,389) - 14,306,313 Individuals 347,118,719 (8,578,207) (5,922,695) 3,021,912 2,124,940 154,675,235 (110,680,010) - 381,759,894 - Financing 132,000,312 (4,319,775) (2,114,956) 1,293,018 338,579 47,277,523 (28,231,856) - 146,242,845 - Borrowings 149,534,314 (2,768,929) (3,609,760) 1,226,064 1,327,474 87,818,313 (71,404,814) - 162,122,662 - Revolving 65,584,093 (1,489,503) (197,979) 502,830 458,887 19,579,399 (11,043,340) - 73,394,387 Total 631,356,710 (13,047,039) (9,807,477) 3,720,751 2,533,357 338,929,568 (256,224,279) - 697,461,591 Stage 2 R$ thousands Balance on December 31, 2024 Transfer to Stage 1 Transfer to Stage 3 Transfer from Stage 1 Transfer from Stage 3 Originated Maturities/Early Settlements (Write off) Balance on December 31, 2025 Companies 6,946,383 (698,839) (980,903) 4,468,832 1,083,425 5,625,961 (4,835,380) - 11,609,479 - Financing 1,861,939 (184,185) (232,953) 1,474,567 16,695 652,851 (1,100,599) - 2,488,315 - Borrowings 4,363,096 (453,602) (709,386) 2,714,895 1,044,751 4,445,432 (3,249,280) - 8,155,906 - Revolving 721,348 (61,052) (38,564) 279,370 21,979 527,678 (485,501) - 965,258 Individuals 21,911,700 (3,021,912) (2,120,554) 8,578,207 1,486,976 9,110,534 (10,513,689) - 25,431,262 - Financing 8,443,459 (1,293,018) (1,139,080) 4,319,775 197,647 1,450,117 (2,547,305) - 9,431,595 - Borrowings 9,169,428 (1,226,064) (863,141) 2,768,929 1,156,186 4,936,120 (5,072,922) - 10,868,536 - Revolving 4,298,813 (502,830) (118,333) 1,489,503 133,143 2,724,297 (2,893,462) - 5,131,131 Total 28,858,083 (3,720,751) (3,101,457) 13,047,039 2,570,401 14,736,495 (15,349,069) - 37,040,741 BRADESCO | Consolidated Financial Statements in IFRS 65 Consolidated Financial Statements in IFRS | Notes to the Consolidated Financial Statements Stage 3 R$ thousands Balance on December 31, 2024 Transfer to Stage 1 Transfer to Stage 2 Transfer from Stage 1 Transfer from Stage 2 Originated Maturities/Early Settlements (Write off) Balance on December 31, 2025 Companies 25,751,969 (408,417) (1,083,425) 3,884,782 980,903 11,392,197 (6,940,573) (10,442,821) 23,134,615 - Financing 5,494,795 (82,925) (16,695) 917,207 232,953 370,211 (962,246) (580,276) 5,373,024 - Borrowings 18,857,751 (305,971) (1,044,751) 2,840,003 709,386 9,723,894 (6,197,172) (8,537,794) 16,045,346 - Revolving 1,399,423 (19,521) (21,979) 127,572 38,564 1,298,092 218,845 (1,324,751) 1,716,245 Individuals 34,272,824 (2,124,940) (1,486,976) 5,922,695 2,120,554 19,548,998 (428,567) (23,993,381) 33,831,207 - Financing 4,432,804 (338,579) (197,647) 2,114,956 1,139,080 874,378 (1,221,104) (929,520) 5,874,368 - Borrowings 18,621,969 (1,327,474) (1,156,186) 3,609,760 863,141 9,363,748 639,941 (13,894,668) 16,720,231 - Revolving 11,218,051 (458,887) (133,143) 197,979 118,333 9,310,872 152,596 (9,169,193) 11,236,608 Total 60,024,793 (2,533,357) (2,570,401) 9,807,477 3,101,457 30,941,195 (7,369,140) (34,436,202) 56,965,822 Consolidated - All stages R$ thousands Balance on December 31, 2024 Originated Maturities/Early Settlements (Write off) Balance on December 31, 2025 Companies 316,936,343 201,272,491 (157,320,222) (10,442,821) 350,445,791 - Financing 132,471,488 60,749,194 (55,063,584) (580,276) 137,576,822 - Borrowings 169,958,830 133,812,710 (99,352,593) (8,537,794) 195,881,153 - Revolving 14,506,025 6,710,587 (2,904,045) (1,324,751) 16,987,816 Individuals 403,303,243 183,334,767 (121,622,266) (23,993,381) 441,022,363 - Financing 144,876,575 49,602,018 (32,000,265) (929,520) 161,548,808 - Borrowings 177,325,711 102,118,181 (75,837,795) (13,894,668) 189,711,429 - Revolving 81,100,957 31,614,568 (13,784,206) (9,169,193) 89,762,126 Total 720,239,586 384,607,258 (278,942,488) (34,436,202) 791,468,154 BRADESCO | Consolidated Financial Statements in IFRS 66 Consolidated Financial Statements in IFRS | Notes to the Consolidated Financial Statements Stage 1 R$ thousands Balance on December 31, 2023 Transfer to Stage 2 Transfer to Stage 3 Transfer from Stage 2 Transfer from Stage 3 Originated Maturities/Early Settlements (Write off) Balance on December 31, 2024 Companies 230,134,580 (2,916,216) (2,710,348) 1,246,997 154,248 181,188,473 (122,859,743) - 284,237,991 - Financing 97,907,233 (1,323,740) (708,918) 373,026 19,783 66,259,620 (37,412,250) - 125,114,754 - Borrowings 121,553,604 (1,344,456) (1,662,157) 784,061 129,848 110,636,823 (83,359,740) - 146,737,983 - Revolving 10,673,743 (248,020) (339,273) 89,910 4,617 4,292,030 (2,087,753) - 12,385,254 Individuals 298,686,536 (6,602,772) (6,661,202) 3,794,654 874,761 171,752,006 (114,725,264) - 347,118,719 - Financing 114,370,195 (3,538,512) (1,490,449) 2,092,373 172,320 52,071,113 (31,676,728) - 132,000,312 - Borrowings 126,474,656 (1,731,143) (2,599,174) 971,337 591,272 99,333,906 (73,506,540) - 149,534,314 - Revolving 57,841,685 (1,333,117) (2,571,579) 730,944 111,169 20,346,987 (9,541,996) - 65,584,093 Total 528,821,116 (9,518,988) (9,371,550) 5,041,651 1,029,009 352,940,479 (237,585,007) - 631,356,710 Stage 2 R$ thousands Balance on December 31, 2023 Transfer to Stage 1 Transfer to Stage 3 Transfer from Stage 1 Transfer from Stage 3 Originated Maturities/Early Settlements (Write off) Balance on December 31, 2024 Companies 12,538,317 (1,246,997) (3,212,486) 2,916,216 263,379 3,230,759 (7,542,805) - 6,946,383 - Financing 1,909,771 (373,026) (253,708) 1,323,740 25,790 449,416 (1,220,044) - 1,861,939 - Borrowings 9,848,560 (784,061) (2,872,448) 1,344,456 230,002 2,533,070 (5,936,483) - 4,363,096 - Revolving 779,986 (89,910) (86,330) 248,020 7,587 248,273 (386,278) - 721,348 Individuals 22,711,786 (3,794,654) (2,449,308) 6,602,772 873,928 8,644,761 (10,677,585) - 21,911,700 - Financing 9,342,632 (2,092,373) (915,436) 3,538,512 89,680 1,821,471 (3,341,027) - 8,443,459 - Borrowings 8,719,543 (971,337) (945,892) 1,731,143 724,482 5,422,959 (5,511,470) - 9,169,428 - Revolving 4,649,611 (730,944) (587,980) 1,333,117 59,766 1,400,331 (1,825,088) - 4,298,813 Total 35,250,103 (5,041,651) (5,661,794) 9,518,988 1,137,307 11,875,520 (18,220,390) - 28,858,083 BRADESCO | Consolidated Financial Statements in IFRS 67 Consolidated Financial Statements in IFRS | Notes to the Consolidated Financial Statements Stage 3 R$ thousands Balance on December 31, 2023 Transfer to Stage 1 Transfer to Stage 2 Transfer from Stage 1 Transfer from Stage 2 Originated Maturities/Early Settlements (Write off) Balance on December 31, 2024 Companies 26,748,453 (154,248) (263,379) 2,710,348 3,212,486 13,496,446 (6,069,813) (13,928,324) 25,751,969 - Financing 4,912,796 (19,783) (25,790) 708,918 253,708 641,571 590,574 (1,567,199) 5,494,795 - Borrowings 19,843,042 (129,848) (230,002) 1,662,157 2,872,448 12,440,323 (6,982,626) (10,617,743) 18,857,751 - Revolving 1,992,615 (4,617) (7,587) 339,273 86,330 414,552 322,239 (1,743,382) 1,399,423 Individuals 38,867,027 (874,761) (873,928) 6,661,202 2,449,308 15,685,811 (2,992,744) (24,649,091) 34,272,824 - Financing 4,052,392 (172,320) (89,680) 1,490,449 915,436 911,455 (1,002,640) (1,672,288) 4,432,804 - Borrowings 20,411,507 (591,272) (724,482) 2,599,174 945,892 11,281,620 (3,691,827) (11,608,643) 18,621,969 - Revolving 14,403,128 (111,169) (59,766) 2,571,579 587,980 3,492,736 1,701,723 (11,368,160) 11,218,051 Total 65,615,480 (1,029,009) (1,137,307) 9,371,550 5,661,794 29,182,257 (9,062,557) (38,577,415) 60,024,793 Consolidated - All stages R$ thousands Balance on December 31, 2023 Originated Maturities/Early Settlements (Write off) Balance on December 31, 2024 Companies 269,421,350 197,915,678 (136,472,361) (13,928,324) 316,936,343 - Financing 104,729,800 67,350,607 (38,041,720) (1,567,199) 132,471,488 - Borrowings 151,245,206 125,610,216 (96,278,849) (10,617,743) 169,958,830 - Revolving 13,446,344 4,954,855 (2,151,792) (1,743,382) 14,506,025 Individuals 360,265,349 196,082,578 (128,395,593) (24,649,091) 403,303,243 - Financing 127,765,219 54,804,039 (36,020,395) (1,672,288) 144,876,575 - Borrowings 155,605,706 116,038,485 (82,709,837) (11,608,643) 177,325,711 - Revolving 76,894,424 25,240,054 (9,665,361) (11,368,160) 81,100,957 Total 629,686,699 393,998,256 (264,867,954) (38,577,415) 720,239,586 BRADESCO | Consolidated Financial Statements in IFRS 68 Consolidated Financial Statements in IFRS | Notes to the Consolidated Financial Statements d) Reconciliation of expected credit losses from loans and advances to customers (Includes expected credit losses on loans, commitments to be released and financial guarantees provided) Stage 1 R$ thousands Balance on December 31, 2024 Transfer to Stage 2 Transfer to Stage 3 Transfer from Stage 2 Transfer from Stage 3 Originated Constitution/ (Reversion) (1) (Write off) Balance on December 31, 2025 Companies 3,745,866 (118,034) (120,475) 67,104 363,412 1,822,905 (2,524,802) - 3,235,976 - Financing 1,503,946 (24,415) (17,434) 17,547 38,105 412,466 (776,010) - 1,154,205 - Borrowings 1,669,722 (81,136) (97,220) 46,133 315,136 1,203,569 (1,581,706) - 1,474,498 - Revolving 572,198 (12,483) (5,821) 3,424 10,171 206,870 (167,086) - 607,273 Individuals 7,257,404 (219,071) (215,722) 286,340 1,036,097 3,243,381 (3,789,382) - 7,599,047 - Financing 374,887 (28,164) (24,133) 41,539 79,521 240,966 (186,039) - 498,577 - Borrowings 3,461,557 (122,101) (173,012) 211,741 749,624 2,144,110 (2,433,389) - 3,838,530 - Revolving 3,420,960 (68,806) (18,577) 33,060 206,952 858,305 (1,169,954) - 3,261,940 Total 11,003,270 (337,105) (336,197) 353,444 1,399,509 5,066,286 (6,314,184) - 10,835,023 Stage 2 R$ thousands Balance on December 31, 2024 Transfer to Stage 1 Transfer to Stage 3 Transfer from Stage 1 Transfer from Stage 3 Originated Constitution/ (Reversion) (1) (Write off) Balance on December 31, 2025 Companies 1,015,120 (67,104) (163,469) 118,034 644,503 710,708 (914,577) - 1,343,215 - Financing 258,842 (17,547) (44,988) 24,415 7,891 99,472 (103,965) - 224,120 - Borrowings 620,261 (46,133) (113,420) 81,136 628,395 466,187 (721,385) - 915,041 - Revolving 136,017 (3,424) (5,061) 12,483 8,217 145,049 (89,227) - 204,054 Individuals 3,200,306 (286,340) (420,849) 219,071 785,417 2,243,170 (1,900,194) - 3,840,581 - Financing 404,722 (41,539) (119,299) 28,164 48,875 181,708 98 - 502,729 - Borrowings 2,107,776 (211,656) (277,460) 122,296 679,648 1,390,225 (1,345,335) - 2,465,494 - Revolving 687,808 (33,145) (24,090) 68,611 56,894 671,237 (554,957) - 872,358 Total 4,215,426 (353,444) (584,318) 337,105 1,429,920 2,953,878 (2,814,771) - 5,183,796 BRADESCO | Consolidated Financial Statements in IFRS 69 Consolidated Financial Statements in IFRS | Notes to the Consolidated Financial Statements Stage 3 R$ thousands Balance on December 31, 2024 Transfer to Stage 1 Transfer to Stage 2 Transfer from Stage 1 Transfer from Stage 2 Originated Constitution/ (Reversion) (1) (Write off) Balance on December 31, 2025 Companies 15,492,712 (363,412) (644,503) 120,475 163,469 5,530,824 2,904,118 (10,442,821) 12,760,862 - Financing 2,149,523 (38,105) (7,891) 17,434 44,988 208,917 (97,512) (580,276) 1,697,078 - Borrowings 12,483,496 (315,136) (628,395) 97,220 113,420 4,486,131 2,227,456 (8,537,794) 9,926,398 - Revolving 859,693 (10,171) (8,217) 5,821 5,061 835,776 774,174 (1,324,751) 1,137,386 Individuals 20,851,509 (1,036,097) (785,417) 215,722 420,849 12,772,323 12,868,093 (23,993,381) 21,313,601 - Financing 1,710,662 (79,521) (48,875) 24,133 119,299 476,260 1,298,384 (929,520) 2,570,822 - Borrowings 12,317,493 (749,622) (679,645) 173,013 277,460 6,314,435 7,841,495 (13,894,668) 11,599,961 - Revolving 6,823,354 (206,954) (56,897) 18,576 24,090 5,981,628 3,728,214 (9,169,193) 7,142,818 Total 36,344,221 (1,399,509) (1,429,920) 336,197 584,318 18,303,147 15,772,211 (34,436,202) 34,074,463 Consolidated - All stages R$ thousands Balance on December 31, 2024 Originated Constitution/ (Reversion) (1) (Write off) Balance on December 31, 2025 Companies 20,253,698 8,064,437 (535,261) (10,442,821) 17,340,053 - Financing 3,912,311 720,855 (977,487) (580,276) 3,075,403 - Borrowings 14,773,479 6,155,887 (75,635) (8,537,794) 12,315,937 - Revolving 1,567,908 1,187,695 517,861 (1,324,751) 1,948,713 Individuals 31,309,219 18,258,874 7,178,517 (23,993,381) 32,753,229 - Financing 2,490,271 898,934 1,112,443 (929,520) 3,572,128 - Borrowings 17,886,826 9,848,770 4,062,771 (13,894,668) 17,903,699 - Revolving 10,932,122 7,511,170 2,003,303 (9,169,193) 11,277,402 Total 51,562,917 26,323,311 6,643,256 (34,436,202) 50,093,282 (1) Relates to early settlements, maturities and modifications. BRADESCO | Consolidated Financial Statements in IFRS 70 Consolidated Financial Statements in IFRS | Notes to the Consolidated Financial Statements Stage 1 R$ thousands Balance on December 31, 2023 Transfer to Stage 2 Transfer to Stage 3 Transfer from Stage 2 Transfer from Stage 3 Originated Constitution/ (Reversion) (1) (Write off) Balance on December 31, 2024 Companies 3,710,730 (116,449) (134,318) 166,683 63,654 2,411,870 (2,356,304) - 3,745,866 - Financing 1,269,857 (29,252) (13,511) 68,404 6,305 620,597 (418,454) - 1,503,946 - Borrowings 1,919,049 (74,163) (103,007) 91,372 53,871 1,596,733 (1,814,133) - 1,669,722 - Revolving 521,824 (13,034) (17,800) 6,907 3,478 194,540 (123,717) - 572,198 Individuals 6,245,565 (185,973) (259,775) 272,766 334,396 3,875,327 (3,024,902) - 7,257,404 - Financing 437,273 (37,461) (23,115) 82,535 38,354 183,386 (306,085) - 374,887 - Borrowings 2,457,473 (76,558) (108,329) 141,655 238,173 2,472,719 (1,663,576) - 3,461,557 - Revolving 3,350,819 (71,954) (128,331) 48,576 57,869 1,219,222 (1,055,241) - 3,420,960 Total 9,956,295 (302,422) (394,093) 439,449 398,050 6,287,197 (5,381,206) - 11,003,270 Stage 2 R$ thousands Balance on December 31, 2023 Transfer to Stage 1 Transfer to Stage 3 Transfer from Stage 1 Transfer from Stage 3 Originated Constitution/ (Reversion) (1) (Write off) Balance on December 31, 2024 Companies 2,407,449 (166,683) (558,573) 116,449 109,540 510,283 (1,403,345) - 1,015,120 - Financing 277,782 (68,404) (37,072) 29,252 15,227 66,023 (23,966) - 258,842 - Borrowings 1,968,250 (91,372) (510,770) 74,163 90,757 386,785 (1,297,552) - 620,261 - Revolving 161,417 (6,907) (10,731) 13,034 3,556 57,475 (81,827) - 136,017 Individuals 3,073,021 (272,766) (379,103) 185,973 313,107 1,747,141 (1,467,067) - 3,200,306 - Financing 468,003 (82,535) (71,207) 37,461 20,459 155,931 (123,390) - 404,722 - Borrowings 1,860,757 (141,655) (239,411) 76,558 265,398 1,297,469 (1,011,340) - 2,107,776 - Revolving 744,261 (48,576) (68,485) 71,954 27,250 293,741 (332,337) - 687,808 Total 5,480,470 (439,449) (937,676) 302,422 422,647 2,257,424 (2,870,412) - 4,215,426 BRADESCO | Consolidated Financial Statements in IFRS 71 Consolidated Financial Statements in IFRS | Notes to the Consolidated Financial Statements Stage 3 R$ thousands Balance on December 31, 2023 Transfer to Stage 1 Transfer to Stage 2 Transfer from Stage 1 Transfer from Stage 2 Originated Constitution/ (Reversion) (1) (Write off) Balance on December 31, 2024 Companies 17,045,918 (63,654) (109,540) 134,318 558,573 7,338,511 4,516,910 (13,928,324) 15,492,712 - Financing 2,405,662 (6,305) (15,227) 13,511 37,072 326,738 955,271 (1,567,199) 2,149,523 - Borrowings 13,348,041 (53,871) (90,757) 103,007 510,770 6,786,917 2,497,132 (10,617,743) 12,483,496 - Revolving 1,292,215 (3,478) (3,556) 17,800 10,731 224,856 1,064,507 (1,743,382) 859,693 Individuals 21,179,127 (334,396) (313,107) 259,775 379,103 9,908,384 14,421,714 (24,649,091) 20,851,509 - Financing 1,380,788 (38,354) (20,459) 23,115 71,207 406,606 1,560,047 (1,672,288) 1,710,662 - Borrowings 10,928,409 (238,173) (265,398) 108,329 239,411 7,272,869 5,880,689 (11,608,643) 12,317,493 - Revolving 8,869,930 (57,869) (27,250) 128,331 68,485 2,228,909 6,980,978 (11,368,160) 6,823,354 Total 38,225,045 (398,050) (422,647) 394,093 937,676 17,246,895 18,938,624 (38,577,415) 36,344,221 Consolidated - All stages R$ thousands Balance on December 31, 2023 Originated Constitution/ (Reversion) (1) (Write off) Balance on December 31, 2024 Companies 23,164,097 10,260,664 757,261 (13,928,324) 20,253,698 - Financing 3,953,301 1,013,358 512,851 (1,567,199) 3,912,311 - Borrowings 17,235,340 8,770,435 (614,553) (10,617,743) 14,773,479 - Revolving 1,975,456 476,871 858,963 (1,743,382) 1,567,908 Individuals 30,497,713 15,530,852 9,929,745 (24,649,091) 31,309,219 - Financing 2,286,064 745,923 1,130,572 (1,672,288) 2,490,271 - Borrowings 15,246,639 11,043,057 3,205,773 (11,608,643) 17,886,826 - Revolving 12,965,010 3,741,872 5,593,400 (11,368,160) 10,932,122 Total 53,661,810 25,791,516 10,687,006 (38,577,415) 51,562,917 (1) Relates to early settlements, maturities and modifications. BRADESCO | Consolidated Financial Statements in IFRS 72 Consolidated Financial Statements in IFRS | Notes to the Consolidated Financial Statements e) Sensitivity analysis The measurement of expected credit losses incorporates prospective information based on projections of economic scenarios, which are developed by a team of specialists and approved in accordance with the Organization's risk governance. Each economic scenario has the evolution over time of a list of macroeconomic variables, among which are: inflation indices (IPCA), economic activity indices (GDP, unemployment, etc.), Brazilian interest rates and currencies, reflecting the expectations and assumptions of each scenario. Projections are reviewed at least annually, being more timely in cases of material events that may materially alter future prospects. The estimate of the expected credit losses is made by combining multiple scenarios, which are weighted according to the probability assigned to each scenario, with the base scenario being the most reasonably possible. In order to determine possible oscillations in the expected credit losses resulting from economic projections, simulations were carried out by changing the weighting of the scenarios used in the calculation of the expected credit losses. The table below shows the probabilities attributed to each scenario and the impacts: On December 31, 2025 - R$ thousands Weighting Constitution/ Base (Reversion) Scenario Optimistic Scenario* Pessimistic Scenario** Simulation 1 100% - - (320,747) Simulation 2 - 100% - (624,285) Simulation 3 - - 100% 813,197 * Scenario in which the economy grows more than expected. ** Scenario in which the economy grows less than expected. f) Expected credit losses on loans and advances R$ thousands Year ended December 31 2025 2024 2023 Amount recorded 34,438,405 36,478,523 34,849,384 Amount recovered (5,760,548) (9,841,746) (4,672,395) Expected credit losses on loans and advances 28,677,857 26,636,777 30,176,989 g) Loans and advances to customers restructured The total balance of “Loans and advances with expected credit losses” includes restructured loans and advances to customers. Such loans contemplate extension of loan payment terms, grace periods, reductions in interest rates, and/or, in some cases, the forgiveness (write-off) of part of the loan principal amount. Restructured loans may occur after a default event or when the Company has information about a significant deterioration in the client’s creditworthiness. The purpose of such restructuring is to adapt the loan to reflect the client’s actual payment capacity. BRADESCO | Consolidated Financial Statements in IFRS 73 Consolidated Financial Statements in IFRS | Notes to the Consolidated Financial Statements The following table presents the changes made and our analysis of our portfolio of restructured loans and advances to customers: R$ thousands On December 31, 2025 On December 31, 2024 Opening balance 34,755,068 39,111,735 Amount restructured 18,414,187 26,780,598 Amount received/Others (1) (13,955,482) (18,853,221) Write-offs (12,601,134) (12,284,044) Closing balance 26,612,639 34,755,068 Expected credit losses on loans and advances (13,582,459) (19,091,460) Total restructured loans and advances to customers, net of expected credit losses 13,030,180 15,663,608 Expected credit losses of restructured loans and advances as a percentage of restructured portfolio 51.0% 54.9% Total restructured loans and advances as a percentage of the total loan portfolio 3.4% 4.8% Total restructured loans and advances as a percentage of the total loans portfolio, net of expected credit losses 3.6% 5.2% (1) Includes the settlement of restructured contracts through new operations. At the time a loan is modified, Management considers the new loan’s conditions and restructured maturity, and it is no longer considered past due. From the date of modification, restructured interest begins to accrue, using the effective interest rate method, taking into consideration the client’s capacity to pay the loan based on the analysis made by Management. If the customer fails to maintain the new restructured terms, management considers ceasing accrual from that point. These instruments have their revenue recognition suspended (stop-accrual) and are accounted for solely upon cash receipt. This approach also applies to any potential gains arising from restructurings. Any gains resulting from restructuring are recognized only when effectively received, regardless of whether they relate to performing operations or recoveries of previously written-off assets. 12) NON-CURRENT ASSETS HELD FOR SALE AND DISCONTINUED OPERATIONS R$ thousands On December 31, 2025 On December 31, 2024 Non-current assets held for sale and discontinued operations Real estate 1,184,225 1,082,436 Vehicles and similar 426,895 343,948 Machinery and equipment 1,742 546 Other (1) 2,144,640 2,068,020 Total 3,757,502 3,494,950 (1) Includes R$ 2,060,445 thousand of shares in publicly held companies received as payment, intended for disposal and available for sale. The properties or other non-current assets received in total or partial settlement of the payment obligations of debtors are considered as non-operating assets held for sale in auctions, which normally occur in up to one year. Non-current assets held for sale and discontinued operations are those for which selling expectation, in their current condition, is highly probable to occur within a year. BRADESCO | Consolidated Financial Statements in IFRS 74 Consolidated Financial Statements in IFRS | Notes to the Consolidated Financial Statements 13) INVESTMENTS IN ASSOCIATES AND JOINT VENTURES a) Breakdown of investments in associates and joint ventures Companies R$ thousands On December 31, 2025 Year ended on December 31, 2025 Equity interest Shareholding interest with voting rights Investment carrying amount Associates and joint ventures current assets Associates and joint ventures non - current assets Associates and joint ventures current liabilities Associates and joint ventures non - current liabilities Share of profit (loss) of associates and jointly controlled entities (1) Revenue (2) Associates and joint ventures net income (loss) for the year Haitong Banco de Investimento do Brasil S.A. 20.00% 20.00% 109,290 5,862,399 2,236,478 5,255,969 2,299,487 13,635 995,371 68,175 Tecnologia Bancária S.A. (3) 24.55% 24.32% 249,118 766,711 2,473,255 668,796 1,579,574 7,841 254,190 31,939 Swiss Re Corporate Solutions Brasil (3) 40.00% 40.00% 534,853 3,075,599 2,171,323 3,187,083 959,644 20,053 2,718,632 50,133 Elo Participações Ltda. (4) 50.01% 50.01% 1,242,721 1,433,582 6,152,357 597,993 4,375,461 1,020,208 762,567 2,040,008 Others (5) 11,147,458 1,100,890 Total on December 31, 2025 13,283,440 2,162,627 (1) The adjustments resulting from the evaluation consider the results determined, periodically, by the companies and include equity variations of the investees not resulting from results, as well as adjustments due to the equalization of accounting practices, when applicable; (2) Revenue from financial intermediation or revenue from the provision of services; (3) Companies with equity accounting using balance sheets with a reporting date delay in relation to the base date of the consolidated financial statements, permitted by regulation; (4) Brazilian company, provider of services related to credit and debit cards and other means of payment; and (5) Primarily includes investments in Cielo S.A., Fleury S.A. and Banco John Deere. Organization received dividends and/or interest on equity of R$123,957 thousand in the year ended December 31, 2025 from Cielo S.A. and R$237,235 thousand from other companies. BRADESCO | Consolidated Financial Statements in IFRS 75 Consolidated Financial Statements in IFRS | Notes to the Consolidated Financial Statements Companies R$ thousands On December 31, 2024 Year ended on December 31, 2024 Equity interest Shareholding interest with voting rights Investment carrying amount Associates and joint ventures current assets Associates and joint ventures non - current assets Associates and joint ventures current liabilities Associates and joint ventures non - current liabilities Share of profit (loss) of associates and jointly controlled entities (1) Revenue (2) Associates and joint ventures net income (loss) for the year Haitong Banco de Investimento do Brasil S.A. 20.00% 20.00% 98,243 5,099,950 1,945,607 4,559,541 1,994,799 (4,715) 668,016 (23,575) Tecnologia Bancária S.A. (3) 24.55% 24.32% 241,277 854,080 2,354,233 774,316 1,471,727 3,710 2,783,255 15,255 Swiss Re Corporate Solutions Brasil (3) 40.00% 40.00% 552,687 2,667,390 2,356,236 3,026,387 854,949 37,633 2,252,238 94,083 Elo Participações Ltda. (4) 50.01% 50.01% 2,263,011 963,331 4,746,612 965,266 91,253 784,391 1,813,170 1,566,669 Others (5) (6) 7,873,794 710,566 Total on December 31, 2024 11,029,012 Total on December 31, 2024 1,531,585 (1) The adjustments resulting from the evaluation consider the results determined, periodically, by the companies and include equity variations of the investees not resulting from results, as well as adjustments due to the equalization of accounting practices, when applicable; (2) Revenue from financial intermediation or revenue from the provision of services; (3) Companies with equity accounting using statement of financial position with a reporting date delay of up to 60 days. In the year ended December 31, 2024, the Organization received dividends of R$2,204 thousand from Empresa Tecnologia Bancária S.A.; (4) In August 2024, the auction of the unified tender offering for the acquisition of common shares issued by Cielo S.A. was held to convert its registration as a publicly-held company from category “A” to “B” with the Brazilian securities and Exchange Comission (CVM) and exit from the New segment Market of B3 S.A., with this, the Organization's total equity interest in Cielo S.A. increased to 50.72%, with 30.61% direct participation and 20.11% indirect participation, through the companies of the Elopar Organization (as of December 31, 2023, total equity interest was 31.41%, with direct participation being 30.06%). The Organization received from Cielo S.A, interest on equity of R$151,453 thousand, in the year ended December 31, 2024. More information in Note 42; (5) Primarily includes investment in publicly held companies and Cielo S.A.; and (6) Brazilian company, provider of services related to credit and debit cards and other means of payment. The Organization received dividends of R$64,922 thousand in the year ended December 31, 2024 from Empresa Elo Participações Ltda. BRADESCO | Consolidated Financial Statements in IFRS 76 Consolidated Financial Statements in IFRS | Notes to the Consolidated Financial Statements The Organization does not have contingent liabilities from investments in associated companies, which it is partially or totally responsible for. b) Changes in associates and joint ventures R$ thousands 2025 2024 Initial balances 11,029,012 9,616,840 Acquisitions 2,800,124 1,159,572 Disposal of investments in associates (65,458) - Share of profit of associate and joint ventures 2,162,627 1,531,585 Dividends/Interest on equity (2,533,771) (1,695,067) Other (109,094) 416,082 Balance on December 31 13,283,440 11,029,012 14) PROPERTY AND EQUIPMENT a) Composition of property and equipment by class R$ thousands Depreciation rate Cost Accumulated depreciation Carrying amount Buildings 4% 4,483,554 (1,609,574) 2,873,980 Land - 857,826 - 857,826 Installations, property and equipment for use 10% 5,896,736 (2,949,984) 2,946,752 Security and communication systems 10% to 20% 387,701 (262,853) 124,848 Data processing systems 20% to 40% 7,699,621 (5,290,697) 2,408,924 Transportation systems 10% to 20% 338,092 (144,931) 193,161 Balance on December 31, 2025 (1) (2) 19,663,530 (10,258,039) 9,405,491 Buildings 4% 8,251,334 (5,391,615) 2,859,719 Land - 871,952 - 871,952 Installations, property and equipment for use 10% 5,573,061 (2,866,228) 2,706,833 Security and communication systems 10% to 20% 386,802 (267,132) 119,670 Data processing systems 20% to 40% 13,641,163 (10,208,530) 3,432,633 Transportation systems 10% to 20% 367,431 (137,794) 229,637 Balance on December 31, 2024 (1) 29,091,743 (18,871,299) 10,220,444 (1) Includes underlying assets identified in lease contracts recognized under the scope of IFRS 16; and (2) In 2025, fully depreciated assets were derecognised. The Organization enters into lease agreements as a lessee, primarily, for data processing and property and equipment, which are recorded as buildings and equipment leased in property and equipment. See Note 23 for disclosure of the obligation. BRADESCO | Consolidated Financial Statements in IFRS 77 Consolidated Financial Statements in IFRS | Notes to the Consolidated Financial Statements b) Changes in property and equipment by class R$ thousands Buildings Land Installations, property and equipment for use Security and communications systems Data processing systems Transportation systems Total (1) Balance on December 31, 2023 3,610,211 912,088 3,074,492 126,350 3,305,062 89,806 11,118,009 Additions / (reductions) (190,906) (40,136) 7,551 23,881 1,750,744 175,330 1,726,464 Depreciation (2) (559,586) - (374,968) (30,293) (1,621,935) (35,499) (2,622,281) Impairment - - (242) (268) (1,238) - (1,748) Balance on December 31, 2024 2,859,719 871,952 2,706,833 119,670 3,432,633 229,637 10,220,444 Additions / (reductions) 641,496 (14,126) 1,269,771 33,436 (248,520) 4,043 1,686,100 Depreciation (2) (627,235) - (1,029,489) (28,253) (774,159) (40,519) (2,499,655) Impairment - - (363) (5) (1,030) - (1,398) Balance on December 31, 2025 2,873,980 857,826 2,946,752 124,848 2,408,924 193,161 9,405,491 (1) Includes right of use assets recognized; and (2) The difference of R$54,180 thousand (2024 - R$58,952 thousand) in relation to the amount presented in note 35 refers to expenses attributable to insurance contracts which are presented in the Statement of income in the caption "Insurance and pension income". BRADESCO | Consolidated Financial Statements in IFRS 78 Consolidated Financial Statements in IFRS | Notes to the Consolidated Financial Statements 15) INTANGIBLE ASSETS AND GOODWILL a) Change in intangible assets and goodwill by class R$ thousands Goodwill Intangible Assets Acquisition of financial service rights (1) Software (1) Customer portfolio (1) Other (1) Total Balance on December 31, 2023 6,596,649 5,811,168 8,463,216 1,115,481 120,632 22,107,146 Additions / (reductions) 133,993 1,556,377 3,649,518 114,230 334,371 5,788,489 Impairment - (498) (35,478) - - (35,976) Amortization (2) - (1,831,669) (1,789,426) (253,491) (235,865) (4,110,451) Balance on December 31, 2024 6,730,642 5,535,378 10,287,830 976,220 219,138 23,749,208 Additions / (reductions) (125,639) 1,999,869 4,946,676 63,025 52,624 6,936,555 Impairment - (22,470) (1,772) - - (24,242) Amortization (2) - (1,853,479) (2,791,502) (180,253) (96,628) (4,921,862) Balance on December 31, 2025 6,605,003 5,659,298 12,441,232 858,992 175,134 25,739,659 (1) Rate of amortization: acquisition of rights to provide financial services, customer portfolio and others in accordance with contract agreement and software – up to 10%; and (2) The difference of R$304,070 thousand (2024 - R$304,431 thousand) in relation to the amount presented in note 35 refers to expenses attributable to insurance contracts which are presented in the Statement of income in the caption "Insurance and pension income". BRADESCO | Consolidated Financial Statements in IFRS 79 Consolidated Financial Statements in IFRS | Notes to the Consolidated Financial Statements b) Composition of goodwill by segment R$ thousands On December 31, 2025 On December 31, 2024 Banking 6,101,977 6,230,002 Insurance 503,026 500,640 Total 6,605,003 6,730,642 The Cash Generation Units (CGUs) containing goodwill in the banking segment and the insurance segment are tested annually for impairment. We did not incur any goodwill impairment losses in the years ended December 31, 2025 and 2024. 16) OTHER ASSETS R$ thousands On December 31, 2025 On December 31, 2024 Financial assets (1) (2) 73,426,822 81,195,242 Foreign exchange transactions (3) 31,881,934 44,132,289 Debtors for guarantee deposits (4) 23,808,198 21,743,293 Securities trading 6,014,189 5,848,323 Trade and credit receivables 5,904,620 6,032,514 Receivables 5,817,881 3,438,823 Other assets 17,284,492 15,824,815 Other debtors 5,170,650 5,777,906 Prepaid expenses 5,081,590 3,568,136 Interbank and interdepartmental accounts 139,613 224,343 Other (5) 6,892,639 6,254,430 Total 90,711,314 97,020,057 (1) Financial assets accounted for at amortized cost; (2) In the year ended December 31, 2025 and in the year ended December 31, 2024, there were no expected credit losses for other financial assets; (3) Mainly refers to purchases in foreign currency made by the Organization on behalf of customers and rights in the institution’s domestic currency, resulting from exchange sale operations; (4) Refers to deposits resulting from legal or contractual requirements, including guarantees provided in cash, such as those made for the filing of appeals in departments or courts and those made to guarantee services of any nature; and (5) Primarily includes material in inventory, amounts receivable, other advances, advances and payments to be reimbursed and investment property. 17) DEPOSITS FROM BANKS Financial liabilities called “Deposits from banks” are initially measured at fair value and, subsequently, at amortized cost, using the effective interest rate method. a) Composition by nature R$ thousands On December 31, 2025 On December 31, 2024 Demand deposits 1,203,130 1,419,303 Interbank deposits 5,485,877 3,008,439 Securities sold under agreements to repurchase 349,702,217 283,049,765 Borrowings 38,999,650 46,769,666 On-lending 31,708,620 27,571,137 Total 427,099,494 361,818,310 BRADESCO | Consolidated Financial Statements in IFRS 80 Consolidated Financial Statements in IFRS | Notes to the Consolidated Financial Statements 18) DEPOSITS FROM CUSTOMERS Financial liabilities called “Deposits from customers” are initially measured at fair value and subsequently at amortized cost, using the effective interest rate method. R$ thousands On December 31, 2025 On December 31, 2024 Demand deposits 36,792,675 44,119,254 Savings deposits 124,461,404 132,502,157 Time deposits 560,020,072 467,717,052 Total 721,274,151 644,338,463 19) FUNDS FROM SECURITIES ISSUED a) Composition by type of security issued and location R$ thousands On December 31, 2025 On December 31, 2024 Instruments Issued – Brazil: - Real estate credit notes 75,321,675 55,865,741 Agribusiness notes 54,287,950 46,738,613 Financial bills 135,672,973 106,220,794 Covered Bonds 23,600,199 35,805,829 Subtotal 288,882,797 244,630,977 Securities – Overseas: - MTN Program Issues (1) 11,423,465 9,529,345 Subtotal 11,423,465 9,529,345 Structured Operations Certificates 5,954,420 3,817,022 Total 306,260,682 257,977,344 (1) Issuance of securities on the international market to invest in foreign exchange transactions, pre-export financing, import financing and working capital financing, predominately in the medium and long-term. b) Changes in securities issued R$ thousands 2025 2024 Opening balances on January 1 257,977,344 244,966,258 Issuance 156,468,949 54,734,757 Interest accrued 32,907,338 27,427,073 Settlement and interest payments (143,196,203) (70,199,968) Exchange variation and others 2,103,254 1,049,224 Closing balance on December 31 306,260,682 257,977,344 BRADESCO | Consolidated Financial Statements in IFRS 81 Consolidated Financial Statements in IFRS | Notes to the Consolidated Financial Statements 20) SUBORDINATED DEBT a) Composition of subordinated debt Maturity R$ thousands Original term in years Nominal amount On December 31, 2025 On December 31, 2024 In Brazil: Financial bills: 2025 7 - - 6,659,038 2027 7 13,000 24,005 640,590 2025 8 - - 3,693,797 2026 8 694,800 1,380,842 1,193,335 2028 8 - - 88,658 2030 8 2,368,200 3,923,963 3,365,783 2025 9 - - 755,966 2027 9 89,700 187,469 163,973 2025 10 - - 648,219 2026 10 196,196 655,486 571,365 2027 10 256,243 586,866 523,757 2028 10 248,300 567,279 505,316 2030 10 124,500 213,615 210,044 2031 10 7,270,000 13,246,380 11,319,069 2032 10 5,378,500 8,884,021 7,606,668 2033 10 531,000 700,964 626,578 2035 10 2,503,500 2,519,653 - 2026 11 2,500 4,531 4,337 2027 11 47,046 118,795 102,990 2028 11 74,764 176,548 159,193 Perpetual - 19,064,300 21,524,109 18,620,251 Total (1) 54,714,526 57,458,927 (1) Includes the amount of R$50,648,748 thousand (R$43,096,504 thousand on December 31, 2024), referring to subordinated debt recognized in “Eligible Debt Capital Instruments” for regulatory capital purpose. b) Changes in subordinated debt R$ thousands 2025 2024 Opening balances on January 1 57,458,927 50,337,854 Issuance 8,059,200 9,000,300 Interest accrued 8,397,038 6,378,786 Settlement and interest payments (19,200,639) (8,258,013) Closing balance on December 31 54,714,526 57,458,927 BRADESCO | Consolidated Financial Statements in IFRS 82 Consolidated Financial Statements in IFRS | Notes to the Consolidated Financial Statements 21) INSURANCE CONTRACTS a) Insurance contract liabilities R$ thousands On December 31, 2025 On December 31, 2024 PAA BBA/VFA Total PAA BBA/VFA Total Liability for remaining coverage (LRC) 2,705,391 400,033,295 402,738,686 3,413,117 359,997,742 363,410,859 - Present value of future estimated cash flows on Best Estimated Liability (BEL) - 376,309,243 376,309,243 - 333,588,968 333,588,968 Non-financial risk adjustment (RA) - 1,419,950 1,419,950 - 1,713,661 1,713,661 - Contractual service margin (CSM) - 22,304,102 22,304,102 - 24,695,113 24,695,113 - Premium allocation approach (PAA) 2,705,391 - 2,705,391 3,413,117 - 3,413,117 Liability for incurred claims 15,034,052 1,942,738 16,976,790 13,527,747 1,854,214 15,381,961 - Present value of future estimated cash flows on Best Estimated Liability (BEL) 14,602,721 1,875,947 16,478,668 13,109,372 1,788,775 14,898,147 Non-financial risk adjustment (RA) 431,331 66,791 498,122 418,375 65,439 483,814 Total Insurance contract liabilities 17,739,443 401,976,033 419,715,476 16,940,864 361,851,956 378,792,820 b) Remaining coverage for general model (BBA)/variable fee approach (VFA) R$ thousands On December 31, 2025 On December 31, 2024 Non-Onerous Contracts Onerous contracts Total Non-Onerous Contracts Onerous contracts Total Present value of estimated future cash outflows 442,481,502 29,420,780 471,902,282 415,934,920 32,862,946 448,797,866 - Acquisition costs 4,114,779 94.408 4,209,187 3,789,618 119.449 3,909,067 - Claims and other directly attributable expenses 438,366,723 29,326,372 467,693,095 412,145,302 32,743,497 444,888,799 Present value of estimated future cash inflows (91,025,507) (4,567,532) (95,593,039) (109,275,236) (5,933,662) (115,208,898) Non-financial risk adjustment 792.866 627.084 1,419,950 926.022 787.639 1,713,661 Contractual Service Margin 22,189,750 114.352 22,304,102 24,594,993 100.120 24,695,113 Total remaining coverage of the general model/variable rate model 374,438,611 25,594,684 400,033,295 332,180,699 27,817,043 359,997,742 c) Realization of contractual service margin R$ thousands Due within one year 1 to 2 years 2 to 3 years 3 to 4 years 4 to 5 years More than 5 years Total Issued Insurance Contracts - Insurance Contract 3,096,388 2,627,326 2,196,746 1,874,844 1,905,095 10,603,703 22,304,102 General model/variable fee approach on December 31, 2025 3,096,388 2,627,326 2,196,746 1,874,844 1,905,095 10,603,703 22,304,102 Issued Insurance Contracts - Insurance Contract 2,450,329 2,180,759 1,840,336 1,603,463 1,410,985 15,209,241 24,695,113 General model/variable fee approach on December 31, 2024 2,450,329 2,180,759 1,840,336 1,603,463 1,410,985 15,209,241 24,695,113 BRADESCO | Consolidated Financial Statements in IFRS 83 Consolidated Financial Statements in IFRS | Notes to the Consolidated Financial Statements d) Changes of the liability for remaining coverage (LCR) and claims incurred Recognized values for coverage R$ thousands BBA/VFA PAA Excluding Loss Component Total Loss Component TOTAL BBA/VFA -Premium allocation BEL AR CSM BEL approach Opening balances on January 1 326,129,277 1,713,661 24,695,113 7,459,691 359,997,742 3,413,117 363,410,859 Changes related to current period (Insurance revenue) (5,574,087) (183,388) (1,777,555) - (7,535,030) (53,576,235) (61,111,265) Total retrospective method contracts (558,471) (23,137) (554,386) - (1,135,994) - (1,135,994) Fair value method contracts (3,925,741) (111,194) (470,583) - (4,507,518) - (4,507,518) Issuance of contracts after transition (Other contracts) (1,071,914) (49,057) (752,586) - (1,873,557) - (1,873,557) Appropriation related to best output estimate (17,961) - - - (17,961) - (17,961) Appropriation relating to contracts premium allocation approach - - - - - (53,576,235) (53,576,235) Technical changes related to future periods 6,852,561 (258,151) (1,861,042) 2 4,733,370 (3,923,166) 810,204 Changes in estimates that adjust the contractual service margin 9,089,018 (396,880) (8,714,884) 2 (22,744) - (22,744) Changes in estimates that do not adjust the contractual service margin (OCI) (1,417,395) (47,963) - - (1,465,358) - (1,465,358) Appropriation/constitution regarding best output estimate 5,488 - 903,627 - 909,115 - 909,115 Contracts initially recognized in the period (824,550) 186,692 5,950,215 - 5,312,357 (3,923,166) 1,389,191 Insurance expenses 254,253 - - 247,134 501,387 4,454,622 4,956,009 Constitution of onerous contracts - - - 247,134 247,134 - 247,134 Acquisition cost 254,253 - - - 254,253 4,454,622 4,708,875 Financial expenses 45,340,000 147,828 1,247,586 61,345 46,796,759 - 46,796,759 Financial expenses of insurance contracts 45,340,000 147,828 1,247,586 61,345 46,796,759 - 46,796,759 Cash flows (4,460,933) - - - (4,460,933) 52,337,053 47,876,120 Premiums received 43,647,318 - - - 43,647,318 56,622,055 100,269,373 Investment component (47,689,292) - - - (47,689,292) - (47,689,292) Insurance acquisition costs cash flow (418,959) - - - (418,959) (4,285,002) (4,703,961) Balance on December 31, 2025 368,541,071 1,419,950 22,304,102 7,768,172 400,033,295 2,705,391 402,738,686 BRADESCO | Consolidated Financial Statements in IFRS 84 Consolidated Financial Statements in IFRS | Notes to the Consolidated Financial Statements Recognized values for coverage R$ thousands BBA/VFA PAA Excluding Loss Component Total Loss Component TOTAL BBA/VFA -Premium allocation BEL AR CSM BEL approach Opening balances on January 1 295,007,749 1,832,047 24,414,758 6,637,197 327,891,751 3,256,881 331,148,632 Changes related to current period (Insurance revenue) (5,297,914) (168,464) (2,328,612) - (7,794,990) (49,545,938) (57,340,928) Total retrospective method contracts (596,582) (30,954) (947,502) - (1,575,038) - (1,575,038) Fair value method contracts (3,979,828) (114,747) (858,995) - (4,953,570) - (4,953,570) Issuance of contracts after transition (Other contracts) (678,657) (22,763) (522,115) - (1,223,535) - (1,223,535) Appropriation related to best output estimate (42,847) - - - (42,847) - (42,847) Appropriation relating to contracts premium allocation approach - - - - - (49,545,938) (49,545,938) Technical changes related to future periods (1,221,520) (71,048) 1,736,361 (512,188) (68,395) (618,023) (686,418) Changes in estimates that adjust the contractual service margin 4,826,038 (128,048) (4,692,900) (512,188) (507,098) - (507,098) Changes in estimates that do not adjust the ontractual service margin (OCI) (3,443,788) (106,907) - - (3,550,695) - (3,550,695) Appropriation/constitution regarding best output estimate 3,219 - 1,620,038 - 1,623,257 - 1,623,257 Contracts initially recognized in the period (2,606,989) 163,907 4,809,223 - 2,366,141 (618,023) 1,748,118 Insurance expenses 224,162 - - 1,334,682 1,558,844 3,838,715 5,397,559 Constitution of onerous contracts - - - 1,334,682 1,334,682 - 1,334,682 Acquisition cost 224,162 - - - 224,162 3,838,715 4,062,877 Financial expenses 28,159,122 121,126 872,606 - 29,152,854 - 29,152,854 Financial expenses of insurance contracts 28,159,122 121,126 872,606 - 29,152,854 - 29,152,854 Cash flows 9,257,678 - - - 9,257,678 46,481,482 55,739,160 Premiums received 51,516,743 - - - 51,516,743 50,320,197 101,836,940 Investment component (41,788,964) - - - (41,788,964) - (41,788,964) Insurance acquisition costs cash flow (470,101) - - - (470,101) (3,838,715) (4,308,816) Balance on December 31, 2024 326,129,277 1,713,661 24,695,113 7,459,691 359,997,742 3,413,117 363,410,859 BRADESCO | Consolidated Financial Statements in IFRS 85 Consolidated Financial Statements in IFRS | Notes to the Consolidated Financial Statements e) Changes in liabiltiy for incurred claims (LIC) R$ thousands LIC - BBA e VFA LIC - PAA TOTAL LIC BEL RA Total liability for incurred claims - BBA and VFA BEL RA Total liability for incurred - claims - PAA Closing balance on December 31, 2023 1,302,911 71,949 1,374,860 11,847,652 421,079 12,268,731 13,643,591 Costs of providing insurance 5,017,325 (8,627) 5,008,698 35,831,413 (5,539) 35,825,874 40,834,572 Claims incurred and other insurance expenses 5,017,325 (8,627) 5,008,698 35,831,413 (5,539) 35,825,874 40,834,572 Liability adjustments for incurred claims 47,381 - 47,381 (60,730) - (60,730) (13,349) Financial expenses of insurance contracts 113,966 6,708 120,674 837,611 30,374 867,985 988,659 Changes recognized in other comprehensive income (43,788) (4,591) (48,379) (289,739) (27,539) (317,278) (365,657) Estimated cash flows (4,649,020) - (4,649,020) (35,056,836) - (35,056,836) (39,705,856) Claims and other insurance costs paid (4,649,020) - (4,649,020) (35,056,836) - (35,056,836) (39,705,856) Closing balance on December 31, 2024 1,788,775 65,439 1,854,214 13,109,371 418,375 13,527,746 15,381,960 Costs of providing insurance 4,567,752 (7,945) 4,559,807 37,640,301 (32,150) 37,608,151 42,167,958 Claims incurred and other insurance expenses 4,567,752 (7,945) 4,559,807 37,640,301 (32,150) 37,608,151 42,167,958 Liability adjustments for incurred claims (116,836) - (116,836) (2,253) - (2,253) (119,089) Financial expenses of insurance contracts 180,693 8,245 188,938 1,292,003 43,205 1,335,208 1,524,146 Changes recognized in other comprehensive income (4,997) 1,052 (3,945) (31,013) 1,901 (29,112) (33,057) Estimated cash flows (4,539,440) - (4,539,440) (37,405,688) - (37,405,688) (41,945,128) Claims and other insurance costs paid (4,539,440) - (4,539,440) (37,405,688) - (37,405,688) (41,945,128) Closing balance on December 31, 2025 1,875,947 66,791 1,942,738 14,602,721 431,331 15,034,052 16,976,790 BRADESCO | Consolidated Financial Statements in IFRS 86 Consolidated Financial Statements in IFRS | Notes to the Consolidated Financial Statements f) Contractual service margin R$ thousands Year ended December 31 2025 2024 Contracts measured at fair value in transition Contracts measured the full retrospective method Issuance of contracts after transition (Other contracts) Total Contracts measured at fair value in transition Contracts measured the full retrospective method Issuance of contracts after transition (Other contracts) Total Opening balances 7,921,046 9,192,926 7,581,141 24,695,113 11,313,062 8,591,633 4,510,063 24,414,758 Changes from the current period (470,583) (554,386) (752,586) (1,777,555) (858,995) (947,502) (522,115) (2,328,612) - Contractual service margin recognized in the period (470,583) (554,386) (752,586) (1,777,555) (858,995) (947,502) (522,115) (2,328,612) Changes in relation to future periods (1,843,864) (1,246,122) 1,228,944 (1,861,042) (2,586,246) 1,126,523 3,196,084 1,736,361 - Contracts initially recognized 255,242 134,585 5,560,388 5,950,215 136,643 53,780 4,618,800 4,809,223 - Changes in estimates that adjust the contractual service margin (2,099,106) (1,380,707) (4,331,444) (7,811,257) (2,722,889) 1,072,743 (1,422,716) (3,072,862) Total technical changes (2,314,447) (1,800,508) 476,358 (3,638,597) (3,445,241) 179,021 2,673,969 (592,251) Insurance finance income/(expense) 32,886 392,804 821,896 1,247,586 53,225 422,272 397,109 872,606 Balance on December 31 5,639,485 7,785,222 8,879,395 22,304,102 7,921,046 9,192,926 7,581,141 24,695,113 g) Changes in other comprehensive income R$ thousands Year ended December 31 2025 2024 Opening balances 3,614,624 1,265,455 Changes in other comprehensive income 901,156 2,349,169 Income and expenses recognized in the period in Other comprehensive income 1,498,415 3,916,352 Deferred taxes (597,259) (1,567,183) Balance on December 31 4,515,780 3,614,624 BRADESCO | Consolidated Financial Statements in IFRS 87 Consolidated Financial Statements in IFRS | Notes to the Consolidated Financial Statements h) Insurance income R$ thousands Year ended December 31 2025 2024 2023 Amounts related to changes in liabilities for remaining coverage (LRC) 61,111,265 57,340,928 51,252,827 Outputs related to general model contracts 5,574,087 5,296,714 4,806,022 Expected claims incurred and Expenses 5,301,873 5,029,705 4,701,972 - Recovery of Acquisition Cash Flow 254,253 224,162 116,814 - Experience Adjustments 17,961 42,847 (12,764) Non-financial risk adjustment change 183,388 169,664 171,746 Contractual service margin recognized for general model and variable rate 1,777,555 2,328,612 1,656,674 Income related to contracts measured under premium allocation approach 53,576,235 49,545,938 44,618,385 Insurance Revenue 61,111,265 57,340,928 51,252,827 i) Insurance financial expense R$ thousands Year ended December 31 2025 2024 2023 Changes in obligation to pay arising from return on investment (14,160,134) (8,459,749) 11,547,973 Interest on monetary adjustment of insurance liabilities (34,160,771) (21,681,764) 22,338,084 Amounts recognized in statements of income (48,320,905) (30,141,513) 33,886,057 Effect of changes in interest rates 1,498,415 3,916,352 1,871,540 Amounts recognized in other comprehensive income 1,498,415 3,916,352 1,871,540 Financial expenses of insurance contracts (46,822,490) (26,225,161) 35,757,597 BRADESCO | Consolidated Financial Statements in IFRS 88 Consolidated Financial Statements in IFRS | Notes to the Consolidated Financial Statements j) Claims development The claims development table is intended to illustrate the inherent insurance risk, comparing claims paid with their respective provisions, starting from the year in which the claim was reported. The upper part of the table shows the variation in the provision over the years. The provision varies as more accurate information regarding the frequency and severity of claims is obtained. The lower part of the table demonstrates the reconciliation of the amounts with the account balances. Occurrence/Payment R$ thousands Payment year 1 Payment year 2 Payment year 3 Payment year 4 Payment year 5 Payment year 6 Payment year 7 Payment year 8 Payment year 9 Payment year 10 Year of occurrence 1 3,350,667 3,604,249 3,274,280 3,273,808 3,296,445 3,306,163 3,318,327 3,311,737 3,324,954 3,331,002 Year of occurrence 2 3,452,361 3,847,199 3,494,977 3,508,883 3,521,591 3,526,705 3,539,966 3,542,422 3,551,502 - Year of occurrence 3 3,181,843 3,499,560 3,174,162 3,184,224 3,205,116 3,207,657 3,222,305 3,234,388 - - Year of occurrence 4 3,095,780 3,459,562 3,207,486 3,223,295 3,242,090 3,253,282 3,262,688 - - - Year of occurrence 5 3,082,673 3,487,210 3,078,953 3,071,630 3,091,574 3,115,309 - - - - Year of occurrence 6 4,454,289 4,325,114 4,010,617 4,012,414 4,034,607 - - - - - Year of occurrence 7 4,566,465 5,038,121 4,812,415 4,857,834 - - - - - - Year of occurrence 8 4,918,706 5,294,584 5,056,597 - - - - - - - Year of occurrence 9 5,364,165 5,696,584 - - - - - - - - Year of occurrence 10 5,516,396 - - - - - - - - - Payments accumulated up to December 31, 2025 5,516,396 5,696,584 5,056,597 4,857,834 4,034,607 3,115,309 3,262,688 3,234,388 3,551,502 3,331,002 Estimate of claims on December 31, 2025 19,900,189 7,198,107 5,613,467 5,140,266 4,267,857 3,244,240 3,346,298 3,298,429 3,598,850 3,331,002 Estimated claims payable on December 31, 2025 14,383,793 1,501,523 556,870 282,432 233,250 128,931 83,610 64,041 47,348 - R$ thousands Estimated claims payable 17,281,798 Adjustment to present value (1,288,563) Adjustment for non-financial risk 238,737 Other estimates 744,818 Liabilities for claims incurred on December 31, 2025 16,976,790 BRADESCO | Consolidated Financial Statements in IFRS 89 Consolidated Financial Statements in IFRS | Notes to the Consolidated Financial Statements 22) PROVISIONS, CONTINGENT ASSETS AND LIABILITIES a) Contingent assets Bradesco is engaged in administrative and judicial disputes regarding possible overpayments or undue payments of federal taxes and contributions. Contingent assets related to the taxes in dispute, as well as the estimated amounts to be recovered, when applicable, are only recognized when the outcome of the lawsuit and the corresponding credit are virtually certain. b) Provisions classified as probable losses The Company is a party to a number of labor, civil and tax lawsuits, arising from the normal course of business. Management recognized provisions where, based on their opinion and that of their legal counsel, the nature of the lawsuit, similarity to previous lawsuits, complexity and the courts standing, the loss is deemed probable. Management considers that the provision is sufficient to cover the future losses generated by the respective lawsuits. I) Labor claims These are claims brought by former employees and outsourced employees seeking indemnifications. In the year ended December 31, 2025, the Company refined the model of the measurement parameters for recording the provision, which is constituted considering the following factors, among others: date of receipt of the proceedings (before or after the labor reform of November 2017), the average calculated value of payments made for labor complaints before and after the labor reform, propensity for loss and monetary correction of the averages calculated, in addition to individual assessment in specific cases. II) Civil claims These are claims for indemnification primarily related to banking products and services and the inflation indexation alleged to have been lost resulting from economic plans. These lawsuits are individually controlled through a system and provisioned. In the year ended December 31, 2025, the measurement parameters used to record these provisions were refined, with specific criteria applied to each specific type, which may involve the average value of the processes or individual assessment, whenever the loss is determined to be probable, considering the opinion of legal advisors, nature of the actions, similarity with previous processes, complexity and positioning of courts. In relation to the legal claims that are pleading alleged differences in the adjustment of inflation on savings account balances and due to the implementation of economic plans that were part of the federal government’s economic policy to reduce inflation in the 80s and 90s, Bradesco, despite being confident it complied with the law and regulation in force at the time, has provisioned certain proceedings, taking into consideration the claims in which they were mentioned and the perspective of loss of each demand, in view of the decisions and subjects still under analysis in the Superior Court of Justice (STJ). BRADESCO | Consolidated Financial Statements in IFRS 90 Consolidated Financial Statements in IFRS | Notes to the Consolidated Financial Statements In December 2017, with the mediation of the Attorney’s General Office (AGU) and intervention of the Central Bank of Brazil (BCB), the entities representing the bank and the savings accounts, entered into an agreement related to litigation of economic plans, with the purpose of closing these claims, in which conditions and schedule were established for savings accounts holders to accede to the agreement. This agreement was approved by the Federal Supreme Court (STF) on March 1, 2018. On March 11, 2020, the signatory entities signed an amendment extending the collective agreement for a period of 5 (five) years, the Federal Supreme Court approved the extension of the agreement for 30 months. On December 16, 2022, the Federal Supreme Court (STF) approved the request to extend the agreement for another 30 months. On May 23, 2025, the Federal Supreme Court (STF) issued a decision recognizing the constitutionality of the economic plans, but also validated the agreement signed between savings accounts holders, banks, and the entities for the payment of monetary correction differences, extending the period for adhesion by another 24 months from the date of the judgment. Considering that it is a voluntary agreement, which does not oblige the customer to adhere, there is no estimate of how many customers will do so. III) Provision for tax risks The Organization has been discussing judicially the legality and constitutionality of certain taxes and contributions (“legal obligations”) which have been fully provisioned. These cases have their procedural evolution through the Judiciary and administrative spheres, monitored regularly. The most significant are: - PIS and Cofins - R$3,467,535 thousand (R$3,263,824 thousand on December 31, 2024): Bradesco is requesting to calculate and pay contributions to PIS and Cofins only on the sale of goods/rendering of services (billing), excluding financial income from the calculation base; - PIS and Cofins - R$951,899 thousand (R$838,178 thousand on December 31, 2024): Bradesco is requesting to calculate and pay contributions to PIS and Cofins under the cumulative regime (3.65% rate on sales of goods/installment services); and - INSS – Contribution to SAT – R$560,495 thousand (R$527,030 thousand on December 31, 2024): In an ordinary lawsuit filed by the Brazilian Federation of Banks – Febraban, since April 2007, on behalf of its members, in which the classification of banks at the highest level of risk is questioned, with respect to Work Accident Risk – RAT, which raised the rate of the respective contribution from 1% to 3%, in accordance with Decree No. 6,042/07; - Pension Contributions – R$11,293 thousand (R$1,989,629 thousand on December 31, 2024): related to the pension contributions made to private pension plans, referring to previous periods, considered by the authorities to be employee compensation. During the period, there were cases included in the Integral Transaction Program (PTI) created by MF Ordinance No. 1,384/2024. In general, the duration of the lawsuits in the Brazilian judicial system are unpredictable, which is why there is no disclosure of the expected date for judgment of these lawsuits. BRADESCO | Consolidated Financial Statements in IFRS 91 Consolidated Financial Statements in IFRS | Notes to the Consolidated Financial Statements IV) Change in provisions by nature R$ thousands Labor Civil Tax Total Balance on December 31, 2023 4,622,138 8,587,613 7,059,304 20,269,055 Adjustment for inflation 386,536 467,504 391,955 1,245,995 Provisions, net of (reversals and write-offs) 2,272,455 2,355,332 88,529 4,716,316 Payments (4,667,726) (3,583,198) (82,628) (8,333,552) Balance on December 31, 2024 2,613,403 7,827,251 7,457,160 17,897,814 Adjustment for inflation 224,294 422,466 626,644 1,273,404 Provisions, net of (reversals and write-offs) 4,953,345 2,087,918 336,585 7,377,848 Payments (3,429,390) (3,418,776) (1,670,547) (8,518,713) Balance on December 31, 2025 4,361,652 6,918,859 6,749,842 18,030,353 c) Contingent liabilities classified as possible losses The Organization maintains a system to monitor all administrative and judicial proceedings in which its Organization companies is plaintiff or defendant and, considering, amongst other things the opinion of legal counsel, classifies the lawsuits according to the expectation of loss. Case law trends are periodically analyzed and, if necessary, the related risk is reclassified. In this respect, contingent lawsuits deemed to have a possible risk of loss are not recognized as a liability in the consolidated financial statements and totaled, on December 31, 2025, R$ 1,456,696 thousand for labor claims, R$11,124,335 thousand (R$11,570,068 thousand on December 31, 2024) for civil claims and R$43,095,893 thousand (R$46,932,523 thousand on December 31, 2024) for tax proceedings. The main tax proceedings with this classification are: - IRPJ and CSLL deficiency note – 2012 to 2015 – R$11,141,274 thousand (R$12,239,074 thousand on December 31, 2024): due to the disallowance of interest expenses (CDI), related to certain investments and deposits between the companies of the Organization; - COFINS – 1999 to 2014 – R$10,475,878 thousand (R$9,906,689 thousand on December 31, 2024): assessments and disallowances of offsetting Cofins credits, launched after a favorable decision was made in a judicial proceeding, where the unconstitutionality of the expansion of the intended calculation base for income other than revenue was discussed (Law No. 9,718/98); - IRPJ and CSLL – 2006 to 2020 – R$7,749,082 thousand (R$9,429,961 thousand on December 31, 2024), relating to goodwill amortization being disallowed on the acquisition of investments; - IRPJ and CSLL deficiency note – 2008 to 2019 – R$3,502,232 thousand (R$3,216,302 thousand on December 31, 2024): relating to disallowance of expenses with credit losses; - PIS and COFINS notifications and disallowances of compensations – R$1,967,940 thousand (R$1,919,536 thousand on December 31, 2024): relates to the constitutionality of the expansion of the calculation base to other revenues other than billing (Law No. 9,718/98) in acquired companies; BRADESCO | Consolidated Financial Statements in IFRS 92 Consolidated Financial Statements in IFRS | Notes to the Consolidated Financial Statements - Interest on Own Capital (TJLP) – Base year 2019 and 2021 – R$933,359 thousand (R$196,906 thousand on December 31, 2024): IRPJ/CSLL assessments relating to the year 2019 questioning the deductibility in the tax calculation bases above the expense related to Interest on Own Capital (TJLP); and - IRPJ and CSLL deficiency note – 2000 to 2014 – R$835,865 thousand (R$1,280,106 thousand on December 31, 2024): relating to disallowance of exclusions and expenses, differences in depreciation expenses, insufficient depreciation expenses, expenses with depreciation of leased assets, operating expenses and income and disallowance of tax loss compensation; and - PLR - Profit Sharing - Base years from 2009 to 2011 - R$202,467 thousand (R$192,607 thousand on December 31, 2024): assessments for the social security contribution on amounts paid to employees as profit sharing, for alleged failure to comply with the rules contained in Law No. 10,101/00. 23) OTHER LIABILITIES a) Other liabilities R$ thousands On December 31, 2025 On December 31, 2024 Financial liabilities 117,391,205 101,086,011 Credit card transactions (1) 49,053,015 35,852,340 Foreign exchange transactions (2) 32,050,063 41,677,829 Loan assignment obligations 3,488,479 3,846,323 Capitalization bonds 10,266,997 9,707,588 Securities trading 19,285,262 6,852,160 Lease liabilities (Note 23b) 3,247,389 3,149,771 Other liabilities 59,109,914 55,381,892 Third party funds in transit (3) 6,130,263 9,417,841 Provision for payments 14,897,313 13,036,420 Sundry creditors 7,717,585 6,591,177 Social and statutory 9,111,650 8,628,253 Other taxes payable 2,272,401 1,827,943 Liabilities for acquisition of assets and rights 625,933 929,055 Taxes and contributions 1,030,874 853,978 Obligations for quotas of investment funds 3,799,034 2,868,334 Other (4) 13,524,861 11,228,891 Total 176,501,119 156,467,903 (1) Refers to amounts payable to merchants; (2) Primarily refers to Bradesco’s sales in foreign currency to customers and its rights in domestic currency, resulting from exchange sale operations; (3) Primarily refers to payment orders issued domestically and the amount of payment orders in foreign currency coming from overseas; and (4) Includes credits for resources to be released and obligations for payment resources. BRADESCO | Consolidated Financial Statements in IFRS 93 Consolidated Financial Statements in IFRS | Notes to the Consolidated Financial Statements b) Lease liabilities R$ thousands Closing balance on December 31, 2023 3,619,393 Remeasurement and new contracts 443,933 Payments (1,403,269) Appropriation of financial charges 489,714 Balance on December 31, 2024 3,149,771 Remeasurement and new contracts 1,300,638 Payments (1,538,211) Appropriation of financial charges 335,191 Balance on December 31, 2025 3,247,389 Maturity of the leases The maturity of these financial liabilities as of December 31, 2025 is divided as follows: R$730,937 thousand up to one year (R$830,847 thousand up to 1 year as of December 31, 2024), R$1,730,439 thousand between 1 and 5 years (R$2,010,127 thousand between one to five years as of December 31, 2024) and R$495,566 thousand over 5 years (R$282,065 thousand for more than five years as of December 31, 2024). 24) LOAN COMMITMENTS AND FINANCIAL GUARANTEE CONTRACTS The table below summarizes the total risk represented by loan commitments and financial guarantee contracts: R$ thousands On December 31, 2025 On December 31, 2024 Loan commitments (1) 358,376,828 341,763,232 Financial guarantees (2) 125,119,738 119,229,609 Letters of credit for imports 356,071 897,221 Total 483,852,637 461,890,062 (1) Includes available lines of credit, limits for credit cards, personal loans, housing loans and overdrafts; and (2) Refers to guarantees mostly provided for Corporate customers. Financial guarantees are conditional commitments for loans issued to ensure the performance of a customer in an obligation to a third party. There is usually the right of recourse against the customer to recover any amount paid under these guarantees. Moreover, we can retain cash or other highly liquid funds to counter-guarantee these commitments. The contracts are subject to the same credit evaluations as other loans and advances. Letters of credit are issued mainly to endorse public and private debt issue agreements including commercial paper, securities financing and similar transactions. The letters of credit are subject to customer credit evaluation by the Management. We issue letters of credit in connection with foreign trade transactions to guarantee the performance of a customer with a third party. These instruments are short-term commitments to pay the third-party beneficiary under certain contractual terms for the shipment of products. The contracts are subject to the same credit evaluation as other loans and advances. BRADESCO | Consolidated Financial Statements in IFRS 94 Consolidated Financial Statements in IFRS | Notes to the Consolidated Financial Statements 25) EQUITY a) Capital and shareholders’ rights i. Composition of share capital in number of shares The share capital, which is fully subscribed and paid, is divided into registered shares with no par value. On December 31, 2025 On December 31, 2024 Common 5,303,870,781 5,330,304,681 Preferred 5,288,141,247 5,311,865,547 Subtotal 10,592,012,028 10,642,170,228 Treasury (common shares) (1) (7,500,000) (23,843,100) Treasury (preferred shares) (1) (7,500,000) (21,344,200) Total outstanding shares 10,577,012,028 10,596,982,928 (1) In January 2025, 4,970,900 Treasury shares were acquired. On February 7, 2025, the cancellation of 50,158,200 Treasury shares issued by the Company was approved (item d). In the first quarter of 2025, there was an acquisition of 15,000,000 shares to be held in Treasury. All the shareholders are entitled to receive, in total, a mandatory dividend of at least 30% of Bradesco’s annual net income, as shown in the statutory accounting records, adjusted by transfers to reserves. The Company has no obligation that is exchangeable for or convertible into shares. As a result, its diluted earnings per share is the same as the basic earnings per share. In occurring any operation that changes the number of shares, simultaneously with the transaction in the Brazilian market, and with the same timeframes, an identical procedure is adopted in the international market, for the ADRs/GDRs traded in New York, USA, and Madrid, Spain. b) Reserves Capital reserves The capital reserve consists mainly of premiums paid by the shareholders upon subscription of shares. The capital reserve is used for (i) absorption of any losses in excess of accumulated losses and revenue reserves, (ii) redemption, reimbursement of purchase of shares, (iii) redemption of founders’ shares, (iv) transfer to share capital, and (v) payment of dividends to preferred shares, when this privilege is granted to them. Revenue reserves In accordance with Corporate Legislation, Bradesco and its Brazilian subsidiaries must allocate 5% of their annual corporate profit (as presented in the consolidated financial statements prepared in accordance with accounting practices adopted in Brazil (BRGAAP), applicable to institutions authorized to operate by the Central Bank of Brazil), after absorbing accumulated losses, to a legal reserve, the distribution of which is subject to certain limitations. The reserve can be used to increase capital or absorb losses but cannot be distributed in the form of dividends. The Statutory Reserve aims to maintain an operating margin that is compatible with the development of the Company’s active operations and may be formed by up to 100% of net income remaining after statutory allocations if proposed by the Board of Executive Officers, approved by the Board of Directors and ratified at the Shareholders’ Meeting, BRADESCO | Consolidated Financial Statements in IFRS 95 Consolidated Financial Statements in IFRS | Notes to the Consolidated Financial Statements with the accumulated value limited to 95% of the Company’s paid-in capital share amount. c) Interest on equity/Dividends The distribution of income is calculated on adjusted net income, as presented in the consolidated financial statements prepared in accordance with accounting practices adopted in Brazil, applicable to institutions authorized to operate by the Central Bank of Brazil. At a meeting of the Board of Directors on March 20, 2025, the Board of Directors approved the proposal for the payment of interest on shareholders' equity, related to the first quarter of 2025, in the amount of R$2,300,000 thousand, of which R$0.207112492 per common share and R$0. 2278223742 per preferred share, whose payment occurred on October 31, 2025. At a meeting of the Board of Directors on June 18, 2025, the Board of Directors approved the proposal for the payment of interest on shareholders' equity, related to the first half of 2025, in the amount of R$3,000,000 thousand, which represents R$0.270146729 per common share and R$0.297161402 per preferred share, whose payment occurred on January 30, 2026. At a meeting of the Board of Directors held on September 18, 2025, the Board of Directors approved the proposal for the payment of interest on shareholders' equity, related to the second half of 2025, in the amount of R$3,000,000 thousand, which represents R$0.270146729 per common share and R$0.297161402 per preferred share, whose payment will occur until April 30, 2026. At a meeting of the Board of Directors on December 18, 2025, the Board of Directors approved the proposal for the additional interest on shareholders equity related to the second half of 2025, in the amount of R$3,900,000 thousand, of which R$0.351190748 per common share and R$0.386309823 per preferred share, whose payment will occur until July 31, 2026. Interest on shareholders’ equity for the year ended December 31, 2025, is calculated as follows: R$ thousands % (1) Adjusted net income, as presented in the consolidated financial statements prepared in accordance with accounting practices adopted in Brazil 24,549,089 (-) Legal reserve 1,061,695 Adjusted calculation basis 23,487,394 Monthly and intermediary interest on shareholders’ equity (gross), paid 2,299,273 Provisioned intermediary interest on shareholders’ equity (gross) 5,300,000 Intermediary interest on shareholders’ equity (gross) paid 3,000,000 Additional provisioned interest on equity (gross) 3,900,000 Withholding income tax on interest on shareholders' equity (2,174,891) Interest on shareholders' equity (net) accumulated on December 31, 2025 12,324,382 52.47 Interest on shareholders' equity (net) accumulated on December 31, 2024 9,590,795 52.90 (1) Percentage of interest on shareholders’ equity/the adjusted calculation basis. BRADESCO | Consolidated Financial Statements in IFRS 96 Consolidated Financial Statements in IFRS | Notes to the Consolidated Financial Statements Interest on equity was paid or recognized in provisions, as follows: Description R$ thousands Per share (gross) Gross amount provisioned/ paid Withholding Income Tax (IRRF) (15%) Net amount provisioned/ paid Common Preferred Monthly interest on shareholders’ equity paid 0.206998 0.227698 2,307,588 (346,138) 1,961,450 Intermediary interest paid on shareholders’ equity 0.359141 0.395055 4,000,000 (600,000) 3,400,000 Intermediary interest provisioned on shareholders’ equity 0.179571 0.197528 2,000,000 (300,000) 1,700,000 Supplementary interest on shareholders’ equity provisioned 0.267251 0.293976 2,975,700 (446,355) 2,529,345 Total year ended on December 31, 2024 1.012961 1.114257 11,283,288 (1,692,493) 9,590,795 Monthly interest on shareholders’ equity paid 0.206998 0.227698 2,299,273 (344,891) 1,954,382 Intermediary interest paid on shareholders’ equity (1) 0.477259 0.524985 5,300,000 (795,000) 4,505,000 Intermediary interest provisioned on shareholders’ equity (2) 0.270147 0.297161 3,000,000 (450,000) 2,550,000 Supplementary interest on shareholders’ equity provisioned 0.351191 0.386310 3,900,000 (585,000) 3,315,000 Total year ended on December 31, 2025 1.305595 1.436154 14,499,273 (2,174,891) 12,324,382 (1) Paid on October 31, 2025 and January 30, 2026; and (2) To be paid by April 30, 2026. d) Treasury shares On May 07, 2025, the Board of Directors resolved to institute a new buyback program that authorizes Bradesco's Board of Executive Officers to acquire, in the period from May 08, 2025 to November 08, 2026, up to 106,584,881 book-entry, registered shares, with no par value, with up to 53,413,506 common shares and up to 53,171,375 preferred shares, to be held in treasury and subsequently cancelled, without reducing the capital stock. On December 31, 2025, 7,500,000 commmon share and 7,500,000 preferred shares remained in treasury, amounting to R$168,625 thousand. The minimum, average and maximum cost per ordinary share (ON) is R$10.65, R$10.73 and R$10.85 and per preferred share (PN) is R$11.53, R$11.75 and R$11.96 respectively. 26) EARNINGS PER SHARE a) Basic earnings per share The basic earnings per share was calculated based on the weighted average number of common and preferred shares outstanding, as shown in the calculations below: Year ended December 31 2025 2024 2023 Net earnings attributable to the Organization's common shareholders (R$ thousand) 11,272,719 8,215,667 6,786,352 Net earnings attributable to the Organization’s preferred shareholders (R$ thousand) 12,399,987 9,037,233 7,464,977 Weighted average number of common shares outstanding (thousands) 5,297,305 5,315,458 5,330,305 Weighted average number of preferred shares outstanding (thousands) 5,281,575 5,298,682 5,311,866 Basic earnings per share attributable to common shareholders of the Organization (in Reais) 2.13 1.55 1.27 Basic earnings per share attributable to preferred shareholders of the Organization (in Reais) 2.35 1.71 1.41 b) Diluted earnings per share Diluted earnings per share are the same as basic earnings per share since there are no potentially dilutive instruments. BRADESCO | Consolidated Financial Statements in IFRS 97 Consolidated Financial Statements in IFRS | Notes to the Consolidated Financial Statements 27) NET INTEREST INCOME R$ thousands Year ended December 31 2025 2024 2023 Interest and similar income Loans and advances to financial institutions 36,244,964 27,775,382 28,323,764 Loans and advances to customers: - Loans 119,109,898 101,676,019 102,035,197 - Leases 800,929 868,103 582,589 Financial assets: - Measured at fair value through profit or loss 52,873,127 27,842,234 28,363,663 - Fair value through other comprehensive income 13,719,216 24,537,302 16,906,668 - At amortized cost 32,407,932 20,118,794 25,277,210 Compulsory deposits with the Central Bank 11,905,271 8,894,336 9,943,391 Other financial interest income 52,008 21,547 25,992 Total 267,113,345 211,733,717 211,458,474 Interest and similar expenses Deposits from banks: - Interbank deposits (521,525) (1,115,457) (1,943,998) - Funding in the open market (38,659,676) (29,159,155) (31,529,801) - Borrowings and on-lending (7,858,916) (7,768,802) (5,834,892) Deposits from customers: - Savings accounts (9,041,498) (7,977,114) (9,017,597) - Time deposits (47,141,946) (35,409,570) (42,262,374) Securities issued (32,910,202) (26,420,100) (25,887,914) Subordinated debt (8,397,038) (6,378,786) (7,007,236) Liabilities of insurance contracts (48,480,520) (29,398,557) (32,173,621) Technical capitalization provisions (832,432) (651,612) (718,622) Total (193,843,753) (144,279,153) (156,376,055) Net interest income 73,269,592 67,454,564 55,082,419 28) FEE AND COMMISSION INCOME R$ thousands Year ended December 31 2025 2024 2023 Fee and commission income Credit card income 10,314,150 9,751,730 9,469,889 Current accounts 6,663,008 6,885,129 7,026,304 Collections 1,349,286 1,540,117 1,717,627 Loans 2,809,149 1,335,952 1,163,831 Asset management 1,538,038 1,394,247 1,485,465 Consortium management 3,135,339 2,673,025 2,289,698 Custody and brokerage services 1,490,464 1,429,362 1,234,554 Capital Markets / Financial Advisory Services 2,158,120 1,668,543 1,222,074 Payments 369,284 389,389 430,208 Other 1,246,808 1,268,993 917,113 Total 31,073,646 28,336,487 26,956,763 BRADESCO | Consolidated Financial Statements in IFRS 98 Consolidated Financial Statements in IFRS | Notes to the Consolidated Financial Statements 29) NET GAINS/(LOSSES) ON FINANCIAL ASSETS AND LIABILITIES MEASURED AT FAIR VALUE THROUGH PROFIT OR LOSS R$ thousands Year ended December 31 2025 2024 2023 Investments in securities 729,533 (3,150,222) 8,862,367 Derivative financial instruments 2,435,983 900,386 2,033,429 Total 3,165,516 (2,249,836) 10,895,796 30) NET GAINS/(LOSSES) ON FINANCIAL ASSETS MEASURED AT FAIR VALUE THROUGH OTHER COMPREHENSIVE INCOME Net gains and losses on financial assets at FVOCI consist primarily of changes in the fair value of financial assets mainly fixed income securities. 31) NET GAINS/(LOSSES) ON FOREIGN CURRENCY TRANSACTIONS Net gains and losses on foreign currency transactions primarily consist mainly of gains or losses from currency trading and translation of monetary items from a foreign currency into the functional currency. 32) INSURANCE SERVICE RESULT R$ thousands Year ended December 31 2025 2024 2023 Revenue from PAA contracts 53,576,235 49,545,938 44,618,387 Revenue from BBA contracts 7,450,972 7,781,746 6,331,612 Revenue from VFA contracts 84,058 13,244 302,828 Insurance and pension plans revenue 61,111,265 57,340,928 51,252,827 Claims incurred (41,200,237) (39,763,947) (38,789,671) Acquisition costs (4,708,875) (4,062,877) (3,515,668) Administrative expenses (3,601,469) (3,273,232) (3,606,269) Onerous contracts (247,134) (1,334,682) (70,204) Reinsurance result (22,207) 36,070 (35,304) Insurance contract expenses (49,779,922) (48,398,668) (46,017,116) Insurance services result from insurance and pension plans 11,331,343 8,942,260 5,235,711 33) PERSONNEL EXPENSES R$ thousands Year ended December 31 2025 2024 2023 Salaries (12,834,443) (11,094,886) (10,319,187) Benefits (5,035,853) (5,519,234) (5,270,848) Social security charges (4,377,868) (3,938,917) (3,738,015) Employee profit sharing (2,074,010) (1,585,405) (1,384,381) Training (119,888) (138,868) (102,027) Total (24,442,062) (22,277,310) (20,814,458) BRADESCO | Consolidated Financial Statements in IFRS 99 Consolidated Financial Statements in IFRS | Notes to the Consolidated Financial Statements 34) OTHER ADMINISTRATIVE EXPENSES R$ thousands Year ended December 31 2025 2024 2023 Outsourced services (4,645,744) (5,063,242) (4,621,396) Communication (651,461) (667,275) (859,605) Data processing (2,952,896) (2,485,590) (2,245,256) Advertising and marketing (1,287,243) (1,178,882) (1,094,300) Asset maintenance (1,216,104) (1,394,827) (1,361,129) Financial system (1,565,474) (1,456,682) (1,625,586) Rental (98,853) (138,169) (50,968) Security and surveillance (463,084) (535,032) (588,602) Transport (609,484) (700,702) (747,356) Water, electricity and gas (280,484) (343,500) (332,342) Supplies (113,387) (140,124) (122,965) Travel (178,934) (142,942) (108,158) Other (2,009,226) (2,335,999) (2,528,597) Total (16,072,374) (16,582,966) (16,286,260) 35) DEPRECIATION AND AMORTIZATION R$ thousands Year ended December 31 2025 2024 2023 Amortization expenses (4,617,792) (3,806,020) (3,463,989) Depreciation expenses (2,445,475) (2,565,076) (2,561,255) Total (7,063,267) (6,371,096) (6,025,244) 36) OTHER OPERATING INCOME/(EXPENSES) R$ thousands Year ended December 31 2025 2024 2023 Tax expenses (8,089,531) (6,874,960) (7,343,849) Legal provision (8,655,168) (5,953,971) (6,351,410) Income from sales of non-current assets, investments, and property and equipment, net 130,146 191,948 193,968 Card sales expenses (4,466,598) (4,240,502) (3,544,693) Other (1) (1,615,571) (1,215,611) 121,428 Total (22,696,722) (18,093,096) (16,924,556) (1) Composed mainly of operating income and expenses whose balances are not individually relevant and have no specific classification. BRADESCO | Consolidated Financial Statements in IFRS 100 Consolidated Financial Statements in IFRS | Notes to the Consolidated Financial Statements 37) INCOME TAX AND SOCIAL CONTRIBUTION a) Calculation of income tax and social contribution charges R$ thousands Year ended December 31 2025 2024 2023 Income before income taxes 21,024,584 16,900,514 10,208,351 Total burden of income tax (25%) and social contribution (20%) at the current rates (9,461,063) (7,605,231) (4,593,758) Effect of additions and exclusions in the tax calculation: Share of profit of associates and joint ventures 973,182 689,213 945,756 Non‑taxable income net of non‑deductible expenses (1) 3,046,366 1,026,745 1,152,929 Interest on shareholders' equity 6,524,673 5,077,509 5,089,859 Other amounts (2) 1,816,894 1,453,403 1,699,628 Income tax and social contribution for the period 2,900,052 641,639 4,294,414 (1) Amounts related to enrollment in the Integral Transaction Program (PTI) (2) Primarily, includes: (i) effect of tax rates in foreign jurisdictions and subsidiaries with different applicable tax rates except banks, insurance companies and non-financial companies; and (ii) the incentivized deductions. b) Composition of income tax and social contribution in the consolidated statement of income R$ thousands Year ended December 31 2025 2024 2023 Current taxes: Income tax and social contribution expense (7,061,716) (7,414,511) (6,622,719) Deferred taxes: Constitution/realization in the period on temporary additions and exclusions 10,034,914 8,194,223 11,152,253 Use of opening balances of: Social contribution loss (454,315) (168,131) (148,548) Income tax loss (351,064) (202,260) (176,932) Constitution: Social contribution loss 209,295 69,624 34,413 Income tax loss 522,938 162,694 55,947 Total deferred tax benefit 9,961,768 8,056,150 10,917,133 Income tax benefit 2,900,052 641,639 4,294,414 c) Deferred income tax and social contribution presented in the consolidated statement of financial position R$ thousands Balance on December 31, 2024 Amount recorded Amount realized Balance on December 31, 2025 Expected credit losses associated with credit risk 71,073,481 27,594,707 (16,948,286) 81,719,902 Civil provisions 3,427,730 463,454 (903,478) 2,987,706 Tax provisions 3,428,498 538,174 (1,252,195) 2,714,477 Labor provisions 1,165,970 961,001 (183,121) 1,943,850 Non-current assets held for sale and discontinued operations 699,334 214,299 (273,408) 640,225 Adjustment to fair value of financial assets measured at fair value through profit or loss and derivatives 15,813 21,773 (3,481) 34,105 Other 6,276,457 4,634,250 (4,502,865) 6,407,842 Total deductible taxes on temporary differences 86,087,283 34,427,658 (24,066,834) 96,448,107 Income tax and social contribution losses in Brazil and overseas 18,755,350 732,233 (805,379) 18,682,204 Subtotal 104,842,633 35,159,891 (24,872,213) 115,130,311 Adjustment to fair value of securities measured at fair value through other comprehensive income 2,356,352 225,640 (989,610) 1,592,382 Total deferred tax assets (1) 107,198,985 35,385,531 (25,861,823) 116,722,693 Deferred tax liabilities (1) 7,055,108 1,100,043 (774,133) 7,381,018 Net deferred taxes (1) 100,143,877 34,285,488 (25,087,690) 109,341,675 BRADESCO | Consolidated Financial Statements in IFRS 101 Consolidated Financial Statements in IFRS | Notes to the Consolidated Financial Statements R$ thousands Balance on December 31, 2023 Amount recorded Amount realized Balance on December 31, 2024 Expected credit losses associated with credit risk 59,099,785 16,581,669 (8,155,178) 67,526,276 Civil provisions 3,778,419 355,631 (706,320) 3,427,730 Tax provisions 3,241,356 290,403 (103,261) 3,428,498 Labor provisions 2,068,011 278,344 (1,180,385) 1,165,970 Impairment of securities and investments 3,249,695 1,586,509 (1,288,999) 3,547,205 Non-current assets held for sale and discontinued operations 735,678 193,066 (229,410) 699,334 Adjustment to fair value of securities 270,017 3,592 (257,796) 15,813 Other 5,760,081 3,305,650 (2,789,274) 6,276,457 Total deductible taxes on temporary differences 78,203,042 22,594,864 (14,710,623) 86,087,283 Income tax and social contribution losses in Brazil and overseas 18,893,423 232,318 (370,391) 18,755,350 Subtotal 97,096,465 22,827,182 (15,081,014) 104,842,633 Adjustment to fair value of financial assets measured at fair value through profit or loss and derivatives 1,180,023 4,810,633 (3,634,304) 2,356,352 Total deferred tax assets (1) 98,276,488 27,637,815 (18,715,318) 107,198,985 Deferred tax liabilities (1) 7,365,091 663,702 (973,685) 7,055,108 Net deferred taxes (1) 90,911,397 26,974,113 (17,741,633) 100,143,877 (1) Deferred income and social contribution tax assets and liabilities are offset in the statement of financial position within each taxable entity, which was a total of R$(5,485,087) thousand in 2025 (R$(5,548,220) thousand in 2024). d) Expected realization of deferred tax assets on temporary differences and carryforward tax losses On December 31, 2025 - R$ thousands Temporary differences Carry-forward tax losses Total Income tax Social contribution Income tax Social contribution 2026 9,621,727 7,519,719 151,279 43,152 17,335,877 2027 8,627,534 6,826,894 165,918 60,867 15,681,213 2028 7,286,429 5,768,848 281,828 156,461 13,493,566 2029 6,583,736 5,216,181 603,812 407,804 12,811,533 2030 5,720,605 4,414,712 935,804 679,480 11,750,601 2031 3,730,116 2,949,911 1,539,679 1,150,859 9,370,565 2032 3,281,096 2,587,352 1,772,660 1,396,868 9,037,976 2033 3,066,360 2,422,614 2,149,245 1,709,662 9,347,881 2034 3,156,306 2,443,013 2,302,591 1,834,036 9,735,946 2035 2,925,831 2,299,123 419,912 920,287 6,565,153 Total 53,999,740 42,448,367 10,322,728 8,359,476 115,130,311 The projection of realization of tax credits is an estimate and is not directly related to the expectation of accounting profits and contemplates the rules for deductibility of credit losses, established by Laws No. 14,467/22 and No. 15,078/24. BRADESCO | Consolidated Financial Statements in IFRS 102 Consolidated Financial Statements in IFRS | Notes to the Consolidated Financial Statements e) Deferred tax liabilities R$ thousands Balance on December 31, 2024 Amount recorded Amount realized Balance on December 31, 2025 Fair value adjustment to securities and derivative financial instruments 443,139 258,277 (227,301) 474,115 Difference in depreciation 726,203 329,534 - 1,055,737 Monetary adjustment of judicial deposits 2,008,528 331,827 (118,186) 2,222,169 Other 3,877,238 180,405 (428,646) 3,628,997 Total deferred tax liabilities 7,055,108 1,100,043 (774,133) 7,381,018 R$ thousands Balance on December 31, 2023 Amount recorded Amount realized Balance on December 31, 2024 Fair value adjustment to securities and derivative financial instruments 1,150,588 60,628 (768,077) 443,139 Difference in depreciation 616,829 190,634 (81,260) 726,203 Monetary adjustment of judicial deposits 1,787,400 251,639 (30,511) 2,008,528 Other 3,810,274 160,801 (93,837) 3,877,238 Total deferred tax liabilities 7,365,091 663,702 (973,685) 7,055,108 BRADESCO | Consolidated Financial Statements in IFRS 103 Consolidated Financial Statements in IFRS | Notes to the Consolidated Financial Statements f) Income tax and social contribution on adjustments recognized directly in other comprehensive income R$ thousands On December 31, 2025 On December 31, 2024 Before tax Tax (expense)/ benefit Net of tax Before tax Tax (expense)/ benefit Net of tax Debt instruments measured at fair value through other comprehensive income 674,736 (293,740) 380,996 (10,616,772) 4,351,914 (6,264,858) Exchange differences on translations of foreign operations (313,985) 141,293 (172,692) 759,955 (341,980) 417,975 Insurance contracts 1,498,415 (597,259) 901,156 4,271,216 (1,922,047) 2,349,169 Other (99,585) 44,813 (54,772) 158,720 (71,424) 87,296 Total 1,759,581 (704,893) 1,054,688 (5,426,881) 2,016,463 (3,410,418) BRADESCO | Consolidated Financial Statements in IFRS 104 Consolidated Financial Statements in IFRS | Notes to the Consolidated Financial Statements 38) OPERATING SEGMENTS The Company operates mainly in the banking and insurance segments. Our banking operations include operations in the retail, middle-market and corporate sectors, lease, international bank operations, investment bank operations and as a private bank. The Company also conducts banking segment operations through its branches located throughout the country, in branches abroad and through subsidiaries as well as by means of shareholding interests in other companies. Additionally, we are engaged in insurance, supplemental Pension Plans and capitalization bonds through our subsidiary, Bradesco Seguros S.A. and its subsidiaries. The following segment information was prepared based on reports made available to Management to evaluate performance and make decisions regarding the allocation of resources for investments and other purposes. Our Management uses accounting information prepared in accordance with the accounting practices adopted in Brazil applicable to institutions authorized to operate by Central Bank for the purposes of making decisions about allocation of resources to the segments and assessing their performance. The information of the segments shown in the following tables considers the specific procedures and other provisions of the Brazilian Financial Institutions Accounting Plan which includes the proportional consolidation of associates and joint ventures and the non-consolidation of exclusive funds. The main assumptions for the segmentation of income and expenses include (i) surplus cash invested by the entities operating in insurance, supplemental pension and capitalization bonds are included in this segment, resulting in an increase in net interest income; (ii) salaries and benefits and administrative costs included in the insurance, supplemental pension and capitalization bonds segment consist only of cost directly related to these operations, and (iii) costs incurred in the banking operations segment related to the infrastructure of the branch network and other general indirect expenses have not been allocated between segments. Our operations are substantially conducted in Brazil. Additionally, we have one branch in New York (USA), one branch in Grand Cayman (UK), and one branch in London (England), mainly to complement our banking services and assist in import and export operations for Brazilian customers. Moreover, we also have subsidiaries abroad, namely: Banco Bradesco Europa S.A. (Luxembourg, LUX), Bradesco Securities, Inc. (New York, USA), Bradesco Securities UK Limited (London, UK), Cidade Capital Markets Ltd. (Grand Cayman, UK), Bradesco Securities Hong Kong Limited (Hong Kong, CHN), Bradesco Trade Services Limited (Hong Kong, CHN), Bradescard Mexico, Sociedad de Responsabilidad Limitada (Mexico City, MEX) and Bradesco Bank (Florida, USA). No revenue from transactions with a single customers or counterparty represented 10% or more of the Company’s revenue for the year ended in 2025 and 2024. All transactions between operating segments are conducted on an arm’s length basis, with intra-segment revenue and costs being eliminated in “Other operations, adjustments and eliminations”. Income and expenses directly associated with each segment are included in determining business-segment performance. BRADESCO | Consolidated Financial Statements in IFRS 105 Consolidated Financial Statements in IFRS | Notes to the Consolidated Financial Statements As of and for the year ended December 31, 2025 - R$ thousands Banking Insurance, pension and capitalization bonds Other Activities Eliminations Managerial Income Statement Proportionately consolidated (1) Consolidation adjustments (2) Adjustments (3) Consolidated in accordance with IFRS Revenue from financial intermediation (4) 235,516,116 8,506,979 355,635 (286,293) 244,092,437 (5,190,067) (5,505,872) 36,786,608 270,183,106 Expenses from financial intermediation (154,883,751) (18,430) - 428,749 (154,473,432) 1,530,732 8,416,250 (49,317,303) (193,843,753) Financial margin 80,632,365 8,488,549 355,635 142,456 89,619,005 (3,659,335) 2,910,378 (12,530,695) 76,339,353 Expected credit losses associated with credit risk (36,370,035) - - - (36,370,035) 1,069,096 - 5,692,979 (29,607,960) Gross income from financial intermediation 44,262,330 8,488,549 355,635 142,456 53,248,970 (2,590,239) 2,910,378 (6,837,716) 46,731,393 Other income from insurance, pension plans and capitalization bonds - 13,887,736 - 33,747 13,921,483 - - (1,709,037) 12,212,446 Fee and commission income and income from banking fees 39,563,634 2,061,017 142,372 (133,187) 41,633,836 (8,008,985) (2,469,449) (81,756) 31,073,646 Personnel /Administrative Expenses (5) (46,173,552) (5,138,904) (133,738) 274,376 (51,171,818) 2,410,916 (403,143) 1,586,342 (47,577,703) Tax expenses (7,520,187) (1,484,930) (22,812) - (9,027,929) 899,826 - 38,572 (8,089,531) Share of profit (loss) of associates and jointly controlled entities (225,416) 610,771 - - 385,355 1,776,372 - 900 2,162,627 IR/CSI and Other income/expenses (15,496,030) (8,354,473) (272,913) (317,392) (24,440,808) 5,512,110 (37,786) 6,378,242 (12,588,242) Net Income for the year ended on December 31, 2025 14,410,779 10,069,766 68,544 - 24,549,089 - - (624,453) 23,924,636 Total assets 2,036,011,553 507,789,849 3,278,326 ( 164,478,058) 2,382,601,670 (29,930,004) (45,943,903) 23,599,453 2,330,327,216 Investments in associates and joint ventures 86,292,770 5,612,184 318,322 (86,267,687) 5,955,589 7,392,844 - (64,993) 13,283,440 Total liabilities 1,820,238,662 463,807,578 191,759 (78,210,371) 2,206,027,628 (29,930,004) (45,943,903) 21,224,865 2,151,378,586 (1) Refers to: adjustments to exclude the effects of consolidation, originating from proportionally consolidated companies (Grupo Cielo, Grupo EloPar, Crediare, etc.); (2) Consolidation adjustments originating from the “non-consolidation” of exclusive funds; (3) Adjustments due to the differences of the accounting standards used in the management reports and in the consolidated financial statements of the Company that were prepared in accordance with IFRS. The main adjustments refer to the expected credit losses for financial assets, business combinations and insurance contracts; (4) Includes, in the Consolidated Financial Statements, the balances referring to “Net gains / (losses) on financial assets and liabilities measured at fair value through profit or loss”, “Net gains / (losses) on financial assets measured at fair value through other comprehensive income” and “Net gains / (losses) from operations in foreign currency”; and (5) Includes, in the Consolidated Financial Statements, the balances referring to depreciation and amortization. BRADESCO | Consolidated Financial Statements in IFRS 106 Consolidated Financial Statements in IFRS | Notes to the Consolidated Financial Statements As of and for the year ended December 31, 2024 - R$ thousands Banking Insurance, pension and capitalization bonds Other Activities Eliminations Managerial Income Statement Proportionately consolidated (1) Consolidation adjustments (2) Adjustments (3) Consolidated in accordance with IFRS Revenue from financial intermediation (4) 169,745,125 37,327,260 318,644 (408,624) 206,982,405 (1,550,303) (2,959,039) 10,746,673 213,219,736 Expenses from financial intermediation (98,810,413) (30,050,169) - 412,038 (128,448,544) 607,296 5,490,039 (21,927,944) (144,279,153) Financial margin 70,934,712 7,277,091 318,644 3,414 78,533,861 (943,007) 2,531,000 (11,181,271) 68,940,583 Expected credit losses associated with credit risk (33,123,621) - - - (33,123,621) - - 5,597,688 (27,525,933) Gross income from financial intermediation 37,811,091 7,277,091 318,644 3,414 45,410,240 (943,007) 2,531,000 (5,583,583) 41,414,650 Other income from insurance, pension plans and capitalization bonds - 11,520,350 - 27,238 11,547,588 - - (1,788,424) 9,759,164 Fee and commission income and income from banking fees 36,213,830 1,923,437 81,549 (68,529) 38,150,287 (6,170,251) (2,325,142) (1,318,407) 28,336,487 Personnel /Administrative Expenses (5) (44,525,627) (4,571,572) (71,301) 393,183 (48,775,317) 2,228,548 (276,322) 1,591,719 (45,231,372) Tax expenses (6,313,204) (1,391,406) (18,380) - (7,722,990) 848,030 - - (6,874,960) Share of profit (loss) of associates and jointly controlled entities 121,511 243,403 843 - 365,757 1,164,800 - 1,028 1,531,585 IR/CSI and Other income/expenses (13,425,161) (5,945,008) (164,642) (355,306) (19,890,117) 2,871,880 70,464 5,554,372 (11,393,401) Net Income for the year ended on December 31, 2024 9,882,440 9,056,295 146,713 - 19,085,448 - - (1,543,295) 17,542,153 Total assets 1,811,529,557 451,777,909 2,712,775 (138,098,385) 2,127,921,856 (14,081,367) (60,714,873) 16,358,746 2,069,484,362 Investments in associates and joint ventures 79,828,981 4,727,047 1,413 (79,218,884) 5,338,557 5,756,348 - (65,893) 11,029,012 Total liabilities 1,607,412,734 416,694,321 33,384 (58,879,501) 1,965,260,938 (14,081,367) (60,714,873) 10,077,172 1,900,541,870 (1) Refers to: adjustments for excluding the effects of consolidation, originating from proportionally consolidated companies (Grupo Cielo, Grupo EloPar, etc.); (2) Consolidation adjustments originating from the “non-consolidation” of exclusive funds; (3) Adjustments due to differences in accounting standards used in management reports and in the consolidated financial statements of the Company that were prepared in IFRS. The main adjustments refer to the expected credit losses of financial assets, business combinations and insurance contracts; (4) Includes, in the Consolidated Financial Statements, the balances referring to “Net gains / (losses) on financial assets and liabilities measured at fair value through profit or loss”, “Net gains / (losses) on financial assets measured at fair value through other comprehensive income” and “Net gains / (losses) from operations in foreign currency”; and (5) Includes, in the Consolidated Financial Statements, the balances referring to depreciation and amortization. BRADESCO | Consolidated Financial Statements in IFRS 107 Consolidated Financial Statements in IFRS | Notes to the Consolidated Financial Statements As of and for the year ended December 31, 2023 - R$ thousands Banking Insurance, pension and capitalization bonds Other Activities Eliminations Managerial Income Statement Proportionately consolidated (1) Consolidation adjustments (2) Adjustments (3) Consolidated in accordance with IFRS Revenue from financial intermediation (4) 164,122,043 39,941,507 481,208 (670,653) 203,874,105 (2,864,178) (4,249,260) 27,697,126 224,457,793 Expenses from financial intermediation (97,495,630) (32,892,243) (18) 685,410 (129,702,481) 552,467 6,914,030 (34,140,071) (156,376,055) Financial margin 66,626,413 7,049,264 481,190 14,757 74,171,624 (2,311,711) 2,664,770 (6,442,945) 68,081,738 Expected credit loss associated with credit risk (37,110,675) - - - (37,110,675) - - 4,993,651 (32,117,024) Gross income from financial intermediation 29,515,738 7,049,264 481,190 14,757 37,060,949 (2,311,711) 2,664,770 (1,449,294) 35,964,714 Other income from insurance, pension plans and capitalization bonds - 9,800,620 - 32,469 9,833,089 - - (3,788,649) 6,044,440 Fee and commission income and income from banking fees 34,269,254 1,164,685 4,899 (33,100) 35,405,738 (5,340,755) (1,879,319) (1,228,901) 26,956,763 Personnel expenses/Other administrative expenses (5) (42,122,774) (4,717,591) (46,488) 423,907 (46,462,946) 1,905,911 (618,004) 2,049,077 (43,125,962) Tax expenses (6,582,213) (1,436,686) (22,734) - (8,041,633) 697,784 - - (7,343,849) Share of profit (loss) of associates and jointly controlled entities 151,414 421,723 - - 573,137 1,527,554 - 990 2,101,681 IR/CSI and Other income/expenses (9,198,676) (3,468,750) (141,073) (438,033) (13,246,532) 3,521,217 (167,447) 3,797,740 (6,095,022) Net Income for the year ended on December 31, 2023 6,032,743 8,813,265 275,794 - 15,121,802 - - (619,037) 14,502,765 Total assets 1,661,529,233 409,370,722 3,277,809 ( 110,126,067) 1,964,051,697 (10,074,444) (38,502,618) 12,048,614 1,927,523,249 Investments in associates and joint ventures 73,163,988 3,028,413 1,105 (72,298,485) 3,895,021 5,792,357 - (70,538) 9,616,840 Total liabilities 1,468,271,968 370,561,631 68,561 (37,827,582) 1,801,074,578 (10,074,444) (38,502,618) 8,011,609 1,760,509,125 (1) Refers to: consolidation adjustments, originating from proportionally consolidated companies (Grupo Cielo, Grupo EloPar, Crediare, etc.); (2) Consolidation adjustments originating from the “non-consolidation” of exclusive funds; (3) Adjustments due to differences in accounting standards used in management reports and in the Organization's consolidated financial statements that were prepared in IFRS. The main adjustments refer to the expected loss of financial assets, business models, effective interest rate, business combination and insurance contracts; (4) Includes, in the Consolidated Financial Statements, the balances referring to “Net gains/(losses) on financial assets and liabilities at fair value through profit or loss”, “Net gains / (losses) on financial assets at fair value through other comprehensive income” and “Net gains/(losses) from operations in foreign currency”; and (5) Includes, in the Consolidated Financial Statements, the balances referring to depreciation and amortization. As shown in the table and note (3) above, the adjustments arising from the differences between the criteria, procedures and rules used to prepare the operating segments in accordance with the accounting practices adopted in Brazil applicable to institutions authorized to operate by Bacen and the IFRS Accounting Standards as issued by the IASB. The main adjustments to equity and statements of income respectively are: (i) expected credit losses of financial assets – R$636 million (2024 – R$(1,823 million) – R$(498) million (2024 – R$(1,974) million); (ii) others – R$(1,080) million (2024 – R$3,103 million) – R$0 (2024 – R$8 million); (iii) insurance contracts – R$1,663 million (2024 – R$1,835 million) – R$(528) million (2024 – R$(19) million); and (iv) business combination - R$4,956 million (2024 – R$4,807 million) – R$149 million (2024 – R$153 million). BRADESCO | Consolidated Financial Statements in IFRS 108 Consolidated Financial Statements in IFRS | Notes to the Consolidated Financial Statements 39) TRANSACTIONS WITH RELATED PARTIES The Company has a policy for transactions with related parties. The transactions are carried out under conditions and at rates consistent with those entered into with third parties at that time. The transactions are as follows: R$ thousands Shareholders of the parent (1) Associates and jointly controlled companies (2) Key Management Personnel (3) Total On December 31, 2025 On December 31, 2024 On December 31, 2025 On December 31, 2024 On December 31, 2025 On December 31, 2024 On December 31, 2025 On December 31, 2024 Assets Securities and derivative financial instruments - - 15,086 569,106 - - 15,086 569,106 Loans and other assets 11 9 4,515,700 2,850,123 185,425 168,778 4,701,136 3,018,910 Liabilities Customer and financial institution resources 5,434,015 3,984,694 1,171,315 1,135,148 400,505 457,928 7,005,835 5,577,770 Securities and subordinated debt securities issued 28,982,300 22,980,518 - - 912,486 711,521 29,894,786 23,692,039 Other liabilities (4) 3,171,676 2,873,187 13,786,032 13,384,216 1,991 1,527 16,959,699 16,258,930 Year ended on December 31 - R$ thousands Shareholders of the parent (1) Associates and jointly controlled companies (2) Key Management Personnel (3) Total 2025 2024 2025 2024 2025 2024 2025 2024 Revenue and expenses Net interest income (4,477,481) (2,955,759) (202,736) 116,185 (202,548) (134,856) (4,882,765) (2,974,430) Income from services provided 132 120 434,790 165,045 345 85 435,267 165,250 Other expenses net of other operating revenues 193,150 108,791 (2,689,489) (2,599,747) (59,636) (18,356) (2,555,975) (2,509,312) (1) Cidade de Deus Cia. Coml. de Participações, Fundação Bradesco, NCF Participações S.A., BBD Participações S.A., Nova Cidade de Deus Participações S.A. and NCD Participações Ltda.; (2) Companies listed in Note 13; (3) Members of the Board of Directors and the Board of Executive Officers; and (4) Includes interest on equity. BRADESCO | Consolidated Financial Statements in IFRS 109 Consolidated Financial Statements in IFRS | Notes to the Consolidated Financial Statements a) Remuneration of key management personnel The following is established each year at the Annual Shareholders’ Meeting: • The annual total amount of management compensation, set forth at the Board of Directors’ Meeting, to be paid to Board members and members of the Board of Executive Officers, as determined by the Company’s Bylaws; and • The amount allocated to finance Management Supplementary Pension Plans, within the Employee and Management pension plan of the Bradesco Company (Bradesco S.A. and other companies in the conglomerate). For 2025, the maximum amount of R$1,185,662 thousand was determined for the remuneration of the Directors, and part of this refers to the social security contribution to the INSS, which is an obligation of the Company, and R$53,824 thousand to cover supplementary pension plan defined contributions. The current policy on Management compensation sets forth that 50% of net variable compensation, if any, must be allocated to the acquisition of PNB (class B preferred shares) shares issued by BBD Participações S.A. and/or PN (preferred shares) shares issued by Banco Bradesco S.A., which vest in three equal, annual and successive installments, the first of which is in the year following the payment date. This procedure complies with CMN Resolutions No. 5,177/24 and No. 432/24, which sets forth a management compensation policy for financial institutions. The Company has no long-term benefits for the termination of employment contracts or for remuneration based on shares for its key Management personnel. R$ thousands Year ended December 31 2025 2024 2023 Short, medium and long-term remuneration 1,166,743 611,936 647,189 Post-employment - Pension Plans 51,586 547,789 613,100 Total 1,218,329 1,159,725 1,260,289 b) Equity participation The members of the Board of Directors and the Board of the Executive Officers had, together directly, the following shareholding in Bradesco: Direct ownership On December 31, 2025 On December 31, 2024 Common shares 0.32% 0.32% Preferred shares 1.05% 0.93% Total shares (1) 0.69% 0.63% (1) On December 31, 2025, direct and indirect shareholding of the members of the Board of Directors and the Board of Executive Officers in Bradesco totaled 2.10% of common shares, 1.09% of preferred shares and 1.59% of all shares (on December 31, 2024 – 1.62% of common shares, 0.96% of preferred shares and 1.29% of all shares). BRADESCO | Consolidated Financial Statements in IFRS 110 Consolidated Financial Statements in IFRS | Notes to the Consolidated Financial Statements 40) RISK MANAGEMENT The risk management activity is highly strategic due to the increasing complexity of products and services and the globalization of the Company's business. The dynamism of the markets leads the Company to constantly seek to improve this activity. The Company carries out a corporate risk control in an integrated and independent manner, preserving and giving value to a collective decision-making environment, developing and implementing methodologies, models and tools for measurement and control. It promotes the dissemination of the risk culture to all employees, at all hierarchical levels, from the business areas to the Board of Directors. Scope of Risk Management The Organization established procedures are based on market practices and ongoing acculturation, to keep risks at acceptable levels. This management allows for the achievement of strategic objectives, business sustainability, timeliness and effectiveness in resource allocation decisions, in addition to preparing the Organization to face sudden changes in the economic, regulatory or technological scenario. The scope of the Organization's risk management allows the risks of the Economic- Financial Consolidation1 to be managed by the Corporate Risk Management Process. The main risks monitored by the Organization are: solvency, liquidity, credit, market, social and environmental, climate, model, operational, strategy, contagion, cybersecurity, compliance and reputational. Risk Appetite Statement (RAS) The risk appetite refers to the types and levels of risks that the Company is willing to accept in the conduct of its business and purposes. The Risk Appetite Statement – RAS is an important instrument to reinforce the risk culture of the Company. The Risk Appetite Statement is reviewed on annual basis, or whenever necessary, by the Board of Directors and permanently monitored by forums of the Senior Management and business and control areas. Appetite monitoring is carried out by monitoring the established indicators, through effective control processes, in which managers are informed about risk exposures and the respective use of current limits. Reporting is carried out through an alert system, which facilitates communication and highlights any exceptions that require adjustment measures, permeating all areas of the Organization, supporting Senior Management in assessing whether the results are consistent with the risk appetite. 1 Includes the regulatory scope of the Prudential Conglomerate and other Consolidated companies. BRADESCO | Consolidated Financial Statements in IFRS 111 Consolidated Financial Statements in IFRS | Notes to the Consolidated Financial Statements Dimensions of Risk Appetite For the many types of risks, whether measurable or not, the Company established control approaches, observing the main global dimensions: Solvency, Liquidity, Profitability, Credit, Market, Operational, Cyber Security, Social, Environmental, Climate, Reputation, Model and Qualitative Risks. Risk and Capital Management Structures The risk and capital management structure are made up of several committees, commissions and areas that support the Board of Directors, the Executive Officer, the Risk Officer and the Board of Executive Officers of the Company in strategic decision making. Among the governance forums related to the topic, the following stand out: ▪ The Board of Directors approves and reviews risk management strategies, policies and risk and capital management frameworks, including the appetite and exposure limits by type of risk, as well as the stress testing program, its results and the scenarios and assumptions applied; ▪ Risk Committee is responsible for assess the structure of the Company’s risk management and occasionally propose improvements and challenge the Organization’s risk structure in the face of new trends and threats, as well as to advise the Board of Directors in the performance of its assignments related to the management and control of risks and capital; ▪ The Integrity and Ethical Conduct Committee aims to propose actions regarding the dissemination and compliance with the Organization's Codes of Ethical Conduct, corporate and sectoral, and the rules of conduct related to integrity, anticorruption and competition issues, in order to ensure their efficiency and effectiveness; ▪ The Audit Committee reviews the integrity of the consolidated financial statements and recommends to the Executive Board correction or improvement of policies, practices and procedures identified within the scope of its attributions; ▪ Integrated Risk Management and Capital Allocation Committee – COGIRAC, which aims to advise the CEO in the performance of his duties related to the management and control of all risks and the Organization’s capital. Risk Management Corporate Process Corporate Risk and Control Management methodology is aligned with the main international risk management Frameworks, enabling proactive identification, measurement, mitigation, monitoring and reported of risks. Given the complexity of the products and services offered and the nature of the Organization’s activities, it is necessary to establish a robust risk management structure. In this context, operations are conducted through the Three Lines Model, ensuring that everyone contributes to providing reasonable assurance that the specified objectives will be achieved: ▪ First line, represented by businesses and support areas, responsible for identifying, responding to, reporting and managing inherent risks as part of daily activities, keep risks within acceptable levels; BRADESCO | Consolidated Financial Statements in IFRS 112 Consolidated Financial Statements in IFRS | Notes to the Consolidated Financial Statements ▪ Second line, represented by monitoring areas, responsible for establishing risk management policies and compliance procedures for development and/or monitoring of first line, as well as independent model validation; ▪ Third line, represented by Global Internal Audit Department, which is responsible for independently assessing the effectiveness of risk management and internal controls, including how the first and second lines achieve their objectives, reporting the results of their work to the Board of Directors, Audit Committee, Fiscal Council and Senior Management. Stress Test Program The risk management structure has a stress testing program characterized by a set of processes and routines, which include methodologies, documentation and governance, whose main objective is to identify potential vulnerabilities of the institution. The stress testing program, prospective assessment exercises are carried out on the potential impacts of specific events and circumstances in capital, liquidity, or the value of a particular portfolio of the Organization and are used as a tool for risk management. Stress tests are forward‑looking assessment exercises of the potential impacts of specific events and circumstances on the Organization’s capital, liquidity, or the value of a particular portfolio, and are used as a tool for risk management. The results of the stress tests serve as inputs for assessing the institution’s capital and liquidity levels, for the preparation of the respective contingency plans, for evaluating capital adequacy, and for the recovery plan. In the Stress Testing Program, the scenarios and results are validated by COGIRAC, evaluated by the Risk Committee and deliberated by the Board of Directors, which is also responsible for approving the program and the guidelines to be followed. 40.1. Capital Management The Organization manages capital covering the control and business areas, according to the guidelines of the Executive Board and the Board of Directors. Its governance structure is composed of Commissions and Committees, with the Board of Directors as the highest body. The Organization has a structure dedicated to complying with the determinations of the Central Bank of Brazil related to capital management. In addition, it provides Senior Management with analyses and projections on the availability and need for capital, identifying threats and opportunities that contribute to planning the sufficiency and optimization of capital levels. Capital Management Corporate Process The Capital Management provides the conditions required to meet the Company’s strategic goals to support the risks inherent to its activities. The Organization adopts a three-year forward-looking approach when preparing its capital plan, anticipating needs and establishing contingency procedures and actions for adverse BRADESCO | Consolidated Financial Statements in IFRS 113 Consolidated Financial Statements in IFRS | Notes to the Consolidated Financial Statements scenarios. This considers possible changes in the regulatory, economic and business conditions in which it operates. To manage sound capital composition to support the development of its activities and to ensure adequate coverage of risks incurred, the Organization performs a periodic monitoring of capital projections considering a managerial capital margin (buffer), which is added to the minimum regulatory requirements. The management buffer is in line with the regulatory requirements, observing aspects such as additional impacts generated by stress scenarios, qualitative risks and risks not captured by the regulatory model. The results from the Organization’s capital projections are submitted to the Senior Management, pursuant to the governance established. In addition, the Company’s regulatory capital sufficiency is monitored by periodically calculating the Basel Ratio, Tier I Ratio and Common Equity Ratio. Details of Reference Equity (PR), Capital and Liquidity Ratios The following table presents the main metrics established by prudential regulation (orders financial institutions to comply with requirements to cope with risks associated with their financial activities), such as regulatory capital, leverage ratio and liquidity indicators: Calculation basis - Basel Ratio R$ thousands Basel III On December 31, 2025 On December 31, 2024 Prudential Conglomerate Regulatory capital - values Common equity 124,320,006 106,012,668 Level I 145,844,118 124,632,919 Reference Equity - RE 174,968,754 149,109,173 Risk-weighted assets (RWA) - amounts Total RWA 1,108,961,848 1,008,667,813 Regulatory capital as a proportion of RWA Index of Common equity - ICP 11.2% 10.5% Tier I Capital 13.2% 12.4% Basel Ratio 15.8% 14.8% Additional Common Equity (ACP) as a proportion of RWA Additional Common Equity Conservation - ACPConservation 2.50% 2.50% Additional Contracyclic Common Equity - ACPContracyclic 0.00% 0.00% Additional Systemic Importance of Common Equity - Systemic ACPS 1.00% 1.00% Total ACP (1) 3.50% 3.50% Excess Margin of Common Equity 3.21% 2.51% Leverage Ratio (AR) Total exposure 2,141,573,090 1,860,789,433 AR 6.8% 6.7% Short Term Liquidity Indicator (LCR) Total High Quality Liquid Assets (HQLA) 253,255,892 184,606,844 Total net cash outflow 160,033,728 130,795,356 LCR 158.3% 141.1% Long Term Liquidity Indicator (NSFR) Available stable funding (ASF) 1,136,032,540 991,711,546 Stable resources required (RSF) 925,369,687 818,326,687 NSFR 122.8% 121.2% (1) Failure to comply with ACP (public civil action) rules would result in restrictions on the payment of dividends and interest on equity, net surplus, share buyback, reduction of capital stock, and variable compensation to its managers. BRADESCO | Consolidated Financial Statements in IFRS 114 Consolidated Financial Statements in IFRS | Notes to the Consolidated Financial Statements 40.2. Credit risk Credit risk refers to the possibility of losses associated with the borrower’s or counterparty’s failure to comply with their financial obligations under the terms agreed, as well as the fall in value of loan agreements resulting from deterioration in the borrower’s risk rating, the reduction in gains or remunerations, benefits granted to borrowers in renegotiations, recovery costs and other costs related to the counterparty’s noncompliance with the financial obligations. Additionally, it includes the concentration risk and the country/transfer risk. Credit risk management in the Company is a continuous and evolving process of mapping, development, assessment and diagnosis through the use of models, instruments and procedures that require a high degree of discipline and control during the analysis of transactions in order to preserve the integrity and autonomy of the processes. The Company controls the exposure to credit risk which comprises mainly loans and advances, loan commitments, financial guarantees provided, securities and derivatives. With the objective of not compromising the quality of the portfolio, aspects inherent to credit concession, concentration, guarantee requirements and terms, among others, are observed. The Company maps the activities that could possibly generate exposure to credit risk, classifying them by their probability and magnitude, identifying their managers and mitigation plans. Counterparty Credit Risk The counterparty credit risk to which the Company is exposed includes the possibility of losses due to the non-compliance by counterparties with their obligations relating to the settlement of financial asset trades involving bilateral flows, including the settlement of derivative financial instruments. The Company exercises control over the replacement cost and potential future exposures from operations where there is counterparty credit risk. Thereby, each counterparty’s exposure referring to this risk is treated in the same way and is part of general credit limits granted by the Company’s to its customers. In short, the Counterparty Credit Risk management covers the modeling and monitoring (i) of the consumption of the credit limit of the counterparties, (ii) of the portion of the adjustment at fair value of the portfolio of credit derivatives (CVA – Credit Value Adjustment), segregated by counterparty, and (iii) of the respective regulatory and economic capital. The methodology adopted by the Company establishes that the credit exposure of the portfolio to certain counterparty can be calculated based on the Replacement Cost (RC) of its operations in different scenarios of the financial market, which is possible through the Monte Carlo simulation process. In the context of risk management, the Company conducts studies of projection of capital, for example of the Stress Test of the ICAAP (Evaluation of Capital Adequacy) and TEBU (Bottom-Up Stress Test). These are multidisciplinary programs involving minimally the areas of Business and Economic Departments, of Budget/Result and Risk. BRADESCO | Consolidated Financial Statements in IFRS 115 Consolidated Financial Statements in IFRS | Notes to the Consolidated Financial Statements Regarding the forms of mitigating the counterparty credit risk that the Company is exposed to, the most usual is the composition of guarantees as margin deposits and disposal of public securities, which are made by the counterparty with the Company or with other trustees, whose counterparty’s risks are also appropriately evaluated. Credit-Risk Management Process The credit risk management process is conducted in a corporation-wide manner. This process involves several areas with specific duties, ensuring an efficient structure. Credit risk measurement and control are conducted in a centralized and independent manner. Both the governance process and limits are validated by the Integrated Risk and Capital Allocation Management Committee, submitted for approval by the Board of Directors, and reviewed at least once a year. In Management's view, the credit risk management structure performs a fundamental role in the Organization's second line, actively participating in the process of improving customer risk classification models, periodically monitoring major risks by main default events, level of provisioning in view of expected and unexpected losses. This structure reviews the internal processes, including the roles and responsibilities and training and requirements, as well as conducts periodic reviews of risk evaluation processes to incorporate new practices and methodologies. In Management's view, the attributions of the credit risk management structure faithfully follow the compliance precepts defined by the Organization. Integration with other lines occurs continuously and frequently, enabling assertiveness in the identification, measurement and control of credit risk. Credit Concession The Company’s strategy is to maintain a wide client base and a diversified credit portfolio, both in terms of products and segments, commensurate with the risks undertaken and appropriate levels of provisioning and concentration. Under the responsibility of the Credit Area, lending procedures are based on the Company’s credit policy emphasizing the security, quality and liquidity of the lending. The process is guided by the risk management governance and complies with the rules of the Central Bank of Brazil. The methodologies adopted value business agility and profitability, with targeted and appropriate procedures oriented to the granting of credit transactions and establishment of operating limits. In the evaluation and classification of customers or economic Organizations, the quantitative (economic and financial indicators) and qualitative (personal data, behaviors and transactional) aspects associated with the customers capacity to honor their obligations are considered. All business proposals are subject to operational limits, which are included in the Loan Guidelines and Procedures. At branches, the delegation of power to the submission of BRADESCO | Consolidated Financial Statements in IFRS 116 Consolidated Financial Statements in IFRS | Notes to the Consolidated Financial Statements proposals depends on its size, the total exposure to the Company, the guarantees offered, the level of restriction and their credit risk score/rating. All business proposals are subject to technical analysis and approval of by the Credit Area. In its turn, the Executive Credit Committees was created to decide, within its authority, on queries about the granting of limits or loans proposed by business areas, previously analyzed and with opinion from the Credit Area. Depending on the financial amount, the proposed operations/limits of this Committee may be submitted to the Board of Directors for deliberation. Loan proposals pass through an automated system with parameters set to provide information for the analysis, granting and subsequent monitoring of loans, minimizing the risks inherent in the operations. There are exclusive Credit and Behavior Scoring systems for the assignment of high volume, low principal loans in the Retail segment, meant to provide speed and reliability, while standardizing the procedures for loan analysis and approval. Business is diversified wide-spread and aimed at individuals and legal entities with a proven payment capacity and solvency, seeking to support them with guarantees that are adequate to the risk assumed, considering the amounts, objectives and the maturities of loan granted. Credit Risk Rating The Organization has governance, practices and follow-up process. Among these practices, the Governance of Concessions and Credit Recovery Levels, which, depending on the size of the operation or the total exposure of the counterparty, require approval at the CEO or Board of Directors level. In addition, frequent portfolio monitoring is evaluated, with assessments of its evolution, defaults, provisions, vintage studies, capital, among others. In addition to the process and governance levels of approval for credit and recovery operations, the risk appetite defined by the Organization is followed by concentration limits of operations for Economic Organization, Economic Activity Sector and Transfer (concentration by countries). Besides concentration indicators, Indicators of the quality of new credits, delinquency levels, problematic assets, economic capital margin, and provision expense for expected losses were also established within the risk appetite framework. The credit risk assessment methodology, in addition to providing data to establish the minimum parameters for lending and risk management, also enables the definition of special Credit Rules and Procedures according to customer characteristics and size. Thus, the methodology provides the basis not only for the correct pricing of operations, but also for defining the appropriate guarantees. The methodology used also follows the requirements established by National Monetary Council (CMN) Resolution 4,945/21 and includes analysis of social and environmental risks in projects, aimed at evaluating customers’ compliance with related laws and the Equator Principles, a set of rules that establish the minimum social and environmental criteria, which must be met for lending. BRADESCO | Consolidated Financial Statements in IFRS 117 Consolidated Financial Statements in IFRS | Notes to the Consolidated Financial Statements In accordance with its commitment to the continuous improvement of methodologies, the credit risk rating of operations contracted is distributed into homogeneous risk Organizations according to the criteria established by CMN Resolution No. 4,966/21 for the purpose of constituting provisions for expected losses associated with credit risk. In a simplified way, the operations risk ratings are determined according to the credit quality of the economic Organizations/customers defined by the Customer risk Rating, contract guarantees, credit product characteristics, late due behavior, notes/restrictions and the contracted credit face value, among other characteristics of the operation. The customer risk ratings for economic Organizations are based on parameterized statistical procedures, using quantitative and qualitative information and judgments. Classifications are made by economic Organization and periodically monitored to preserve loan portfolio quality. With respect to individuals, customer risk ratings are generally defined based also on statistical procedures and analysis of variables that discriminate risk behavior. This is made by applying statistical models for credit assessment. The customer risk rating is used, in sets with several decision variables, for concession and/or renewal analysis of operations and credit limits, as well as for monitoring the customers' risk profile deterioration. Control and Monitoring The credit risk is controlled and monitored by and independent area which calculates the risk of open positions, consolidates the results, and performs the reporting as determined by the existing Governance process. This area holds monthly meetings with all product and segment executives and officers, with a view to informing them about the evolution of the loan portfolio, delinquency, problematic assets, restructurings, adequacy of provisions for expected credit losses, loan recoveries, losses, portfolio limits and concentrations, regulatory and economic capital allocation, among others. It also monitors any internal or external event that may cause a significant impact on the Organization’s credit risk, such as mergers, bankruptcies, and crop failures, in addition to monitoring industries in which the company is exposed to significant risks. Internal Report Credit risk is monitored on a timely basis in order to maintain the risk levels within the limits established by the Company. Managerial reports on risk control are provided to all levels of business, from branches to Senior Management. With the objective of highlighting the risk situations, that could result in the customers’ inability to honor its obligations as contracted, the credit risk monitoring area provides daily reports, to the branches, national managers, business segments, as well as the lending and loan recovery areas. This system provides timely information about the loan portfolios and credit bureau information of customers, in addition to enabling comparison of past and current information, highlighting points requiring a more inBRADESCO | Consolidated Financial Statements in IFRS 118 Consolidated Financial Statements in IFRS | Notes to the Consolidated Financial Statements depth analysis by managers, such as assets by segment, product, region, risk classification, delinquency and expected and unexpected losses, among others, providing both a macro-level and detailed view of the information, and also enabling a specific loan operation to be viewed. The information is viewed and delivered via dashboards, allowing queries at several levels such as business segment, divisions, managers, regions, products, employees and customers, and under several aspects (exposure, delinquency, stage, provision, write-off, restriction levels, guarantees, portfolio quality by rating, among others). Measurement of Credit Risk Periodically, the Company evaluates the expected credit losses from financial assets by means of quantitative models, considering the historical experience of credit losses of the different types of portfolio (which can vary from 2 to 7 years), the current quality and characteristics of customers, operations, and mitigating factors, according to processes and internal governance. The actual loss experience has been adjusted to reflect the differences between the economic conditions during the period in which the historical data was collected, current conditions and the vision of the Company about future economic conditions, which are incorporated into the measurement by means of econometric models that capture the current and future effects of estimates of expected losses. The main macroeconomic variables used in this process are the Brazilian interest rates, unemployment rates, inflation rates and economic activity indexes. The estimate of expected loss of financial assets is divided into three categories (stages): • Stage 1: Financial assets with no significant increase in credit risks; • Stage 2: Financial assets with significant increase in credit risks; and • Stage 3: Financial assets that are credit impaired. The significant increase of credit risk is evaluated based on different indicators for classification in stages according to the customers’ profile, the product type and the current payment status, as shown below: Retail Portfolios: • Stage 1: Financial assets whose obligations are current or less than 30 days past due and which have a low internal credit risk rating; • Stage 2 (Significant increase in credit risk): Financial assets that are overdue obligations between 31 and 90 days or whose internal credit risk rating migrated from low risk to medium or high risk; • Stage 3 (Defaulted or “impaired”): Financial assets whose obligations are overdue for more than 90 days or that present bankruptcy events, judicial recovery and restructuring of debt; • Re-categorization from stage 3 to stage 2: Financial assets that settled overdue amounts and whose internal ratings migrated to medium risk; • Re-categorization from stage 2 to stage 1: Financial assets that settled overdue amounts and whose internal ratings migrated to low risk; and • Re-categorization from stage 3 to stage 1: Financial assets that returned regular payment leading to reclassification as low risk. BRADESCO | Consolidated Financial Statements in IFRS 119 Consolidated Financial Statements in IFRS | Notes to the Consolidated Financial Statements Wholesale Portfolios: • Stage 1: Financial assets whose obligations are current or less than 30 days past due and which have a low internal credit risk rating; • Stage 2 (Significant increase in credit risk): Financial assets that are overdue obligations between 31 and 90 days or whose internal credit risk rating migrated from low risk to medium or high risk; • Stage 3 (Defaulted or “impaired”): Financial assets that have their relevant obligations overdue for more than 90 days or that have presented bankruptcy events, judicial recovery, debt restructuring or the need to execute guarantees; • Re-categorization from stage 3 to stage 2: Financial assets that did not meet stage 3 criteria and internal ratings migrated to medium risk; • Re-categorization from stage 2 to stage 1: Financial assets that settled overdue amounts and whose internal ratings migrated to low risk; and • Re-categorization from stage 3 to stage 1: Financial assets that returned regular payment leading to reclassification as low risk. The expected losses are based on the multiplication of credit risk parameters: Probability of default (PD), Loss due to default (LGD) and Exposure at default (EAD). The PD parameter refers to the probability of default perceived by the Company regarding the customer, according to the internal models of evaluation, which, in retail, use statistical methodologies based on the characteristics of the customer, such as the internal rating and business segment, and the operation, such as product and guarantee and, in the case of wholesale, they use specialist models based on financial information and qualitative analyses. The LGD refers to the percentage of loss in relation to exposure in case of default, considering all the efforts of recovery, according to the internal model of evaluation that uses statistical methodologies based on the characteristics of the operation, such as product and guarantee. Customers with significant exposure have estimates based on individual analyses, which are based on the structure of the operation and expert knowledge, aiming to capture the complexity and the specifics of each operation. EAD is the exposure (gross book value) of the customer in relation to the Company at the time of estimation of the expected loss. In the case of commitments or financial guarantees provided, the EAD will have the addition of the expected value of the commitments or financial guarantees provided that they will be converted into credit in case of default of the loan or credit rather than the customer. BRADESCO | Consolidated Financial Statements in IFRS 120 Consolidated Financial Statements in IFRS | Notes to the Consolidated Financial Statements Credit Risk Exposure We present below the maximum credit risk exposure of the financial instruments: R$ thousands On December 31, 2025 On December 31, 2024 Gross value Expected credit losses Gross value Expected credit losses Financial assets Cash and balances with banks (Note 5) 137,031,197 - 146,614,670 - Financial assets measured at fair value through profit or loss (Note 6) 551,306,606 (3,516,837) 371,883,348 - Financial assets measured at fair value through other comprehensive income (Note 8) (1) 138,998,105 (22,357) 156,292,584 (14,306) Loans and advances to financial institutions (Note 10) 235,485,067 (13) 196,421,127 (187,829) Loans and advances to customers (Note 11) 791,468,154 (47,011,092) 720,239,586 (47,857,481) Securities at amortized cost (Note 9) 263,111,062 (3,564,491) 273,148,967 (6,157,000) Other assets (Note 16) 73,426,822 - 81,195,242 - Commitments to extend credit - off balance (Note 11 and 24) 358,376,828 (1,815,386) 342,660,453 (2,447,791) Financial guarantees - off balance (Note 11 and 24) 125,119,738 (1,266,804) 119,229,609 (1,257,645) Total risk exposure 2,674,323,579 (57,196,980) 2,407,685,586 (57,922,052) (1) Financial assets measured at fair value through other comprehensive income are not reduced by the allowance for losses. Loans and advances to customers Concentration of credit risk R$ thousands On December 31, 2025 On December 31, 2024 Largest borrower 0.5% 0.7% 10 largest borrowers 3.5% 4.4% 20 largest borrowers 5.4% 7.0% 50 largest borrowers 8.7% 10.9% 100 largest borrowers 11.5% 14.0% By Economic Activity Sector The credit-risk concentration analysis presented below is based on the economic activity sector in which the counterparty operates. R$ thousands On December 31, 2025 % On December 31, 2024 % Public sector 9,695,176 1.2 6,853,540 1.0 Private sector 781,772,978 98.8 713,386,046 99.0 Total 791,468,154 100.0 720,239,586 100.0 Companies 350,445,791 44.3 316,936,343 44.0 Real estate and construction activities 25,188,642 3.2 23,610,490 3.3 Retail 41,304,495 5.2 37,709,778 5.2 Services 115,073,789 14.5 79,995,896 11.1 Transportation and concession 28,635,592 3.6 28,680,534 4.0 Automotive 7,228,928 0.9 7,553,422 1.0 Food products 15,258,682 1.9 13,677,857 1.9 Wholesale 20,564,676 2.6 20,378,978 2.8 Production and distribution of electricity 10,541,406 1.3 8,633,777 1.2 Oil, derivatives and aggregate activities 5,568,769 0.7 6,918,329 1.0 Other industries 81,080,812 10.2 89,777,282 12.5 Individuals 441,022,363 55.7 403,303,243 56.0 BRADESCO | Consolidated Financial Statements in IFRS 121 Consolidated Financial Statements in IFRS | Notes to the Consolidated Financial Statements Credit Risk Mitigation Potential credit losses are mitigated using a variety of types of collateral formally stipulated through legal instruments, such as conditional sales, liens and mortgages, by guarantees such as third-party sureties or guarantees, and also by financial instruments such as credit derivative instruments, or netting arrangements. The efficiency of these instruments is evaluated considering the time to recover and realize an asset given as collateral, its fair value, the guarantors’ counterparty risk and the legal safety of the agreements. The main types of collateral include: term deposits; financial investments and securities; residential and commercial properties; movable properties such as vehicles, aircraft. Additionally, collateral may include commercial bonds such as invoices, checks and credit card bills. Sureties and guarantees may also include bank guarantees. Credit derivative instruments are bilateral contracts in which one counterparty hedges credit risk on a financial instrument – its risk is transferred to the counterparty selling the hedge. Normally, the latter is remunerated throughout the period of the transaction. In the case default by the borrower, the buying party will receive a payment intended to compensate for the loss in the financial instrument. In this case, the seller receives the underlying asset in exchange for said payment. The table below shows the fair value of guarantees of loans and advances to customers. R$ thousands On December 31, 2025 On December 31, 2024 Book value (1) Fair Value of Guarantees Book value (1) Fair Value of Guarantees Companies 350,445,791 248,842,209 316,936,343 177,693,556 Stage 1 315,701,697 225,184,657 284,237,991 167,357,458 Stage 2 11,609,479 8,416,815 6,946,383 5,014,721 Stage 3 23,134,615 15,240,737 25,751,969 5,321,377 Individuals 441,022,363 417,170,096 403,303,243 278,052,177 Stage 1 381,759,894 380,871,896 347,118,719 248,932,254 Stage 2 25,431,262 21,377,870 21,911,700 18,284,746 Stage 3 33,831,207 14,920,330 34,272,824 10,835,177 Total 791,468,154 666,012,305 720,239,586 455,745,733 (1) Of the total balance of loan operations, R$324,425,508 thousand (December 31, 2024 – R$438,532,231 thousand) refers to operations without guarantees. 40.3. Market risk Market risk is represented by the possibility of financial loss due to fluctuating prices and market interest rates of the Company’s financial instruments, such as your asset and liability transactions that may have mismatched amounts, maturities, currencies and indexes. Market risk is identified, measured, mitigated, controlled and reported. The Company’s exposure to market risk profile is in line with the guidelines established by the governance process, with limits monitored on a timely basis independently of the business areas. All transactions that expose the Company to market risk are identified, measured and classified according to probability and magnitude, and the whole process is approved BRADESCO | Consolidated Financial Statements in IFRS 122 Consolidated Financial Statements in IFRS | Notes to the Consolidated Financial Statements by the governance structure. In line with the best Corporate Governance practices, with the objective of preserving and strengthening the management of market risk in the Organization, as well as complying with the provisions of Resolution No. 4,557 of the National Monetary Council, the Board of Directors approved the Market Policy, which is reviewed at least annually by the competent Committees and by the Board of Directors, providing the main guidelines for accepting, controlling and managing market risk. In addition to this policy, the Organization has specific rules to regulate the market risk management process, as follows: • Classification of Operations; • Reclassification of Operations; • Trading of Public or Private Securities; • Use of Derivatives; and • Hedging. Market Risk Management Process The market risk management process is a corporation wide process, comprising from business areas to the Board of Directors; it involves various areas, each with specific duties in the process. The measurement and control of market risk is conducted in a centralized and independent manner. This process permits that the Company be the first financial institution in the country authorized by the Central Bank of Brazil to use its internal market risk models to calculate regulatory capital requirements since January 2013. This process is also revised at least once a year by the Committees and approved the Board of Directors itself. Determination of Limits Proposed market-risk limits of Trading Portfolio are validated by specific Committees and submitted for approval by the Integrated Risk and Capital Allocation Management Committee, and then for approval by the Board of Directors. Trading Portfolio: it comprises all financial assets at fair value through profit or loss, including derivatives, or used to hedge other instruments in the Trading Portfolio, which have no trading restrictions. Held-for-trading operations are those intended for resale, to obtain benefits from actual or expected price variations, or for arbitrage. The risks of this portfolio are monitored through: • Value at Risk (VaR); • Stress Analysis (measurement of negative impact of extreme events, based on historical and prospective scenarios); • Income; and • Financial Exposure/Concentration. Banking Portfolio: it comprises operations not classified in the Trading Portfolio, arising from Organization’s other businesses and their respective hedges. Portfolio risks in these cases are monitored by: • Variation of economic value due to the variation in the interest rate – ΔEVE (Economic Value of Equity); and BRADESCO | Consolidated Financial Statements in IFRS 123 Consolidated Financial Statements in IFRS | Notes to the Consolidated Financial Statements • Variation of the net revenue of interest due to the variation in the rate of interest – ΔNII (Net Interest Income). Market-Risk Measurement Models Market risk is measured and controlled using Stress, Value at Risk (VaR) and Sensitivity Analysis methodologies, as well as limits for the Management of Results and Financial Exposure. The use of different methodologies for measuring and evaluating risks is important, as they are always complementary and their combined use allows the capture of different scenarios and situations. Trading and Regulatory Portfolio Trading Portfolio risks are mainly controlled by the Stress and VaR methodologies. The Stress methodology quantifies the negative impact of extreme economic shocks and events that are financially unfavorable to the Company’s positions. The analysis uses stress scenarios prepared by the Market Risk area and the Company’s economists based on historical and prospective data for the risk factors in which the Company portfolio. The methodology adopted to calculate VaR is the Delta-Normal, with a confidence level of 99% and considering the number of days necessary to unwind the existing exposures. The methodology is applied to the Trading and Regulatory Portfolio (Trading Portfolio positions plus Banking Portfolio foreign currency and commodities exposures). It should be noted that for the measurement of all the risk factors of the portfolio of options are applied the historical simulation models and Delta-Gamma- Vega, prevailing the most conservative between the two. A minimum 252-businessday period is adopted to calculate volatilities, correlations and historical returns. For regulatory purposes, the capital requirements relating to shares held in the Banking Portfolio are determined on a credit risk basis, as per Central Bank of Brazil resolution, i.e., are not included in the market risk calculation. Risk of Interest Rate in the Banking Portfolio The measurement and control of the interest-rate risk in the Banking Portfolio area is mainly based on the Economic Value of Equity (EVE) and Net Interest Income (NII) methodologies, which measure the economic impact on the positions and the impact in the Company’s income, respectively, according to scenarios prepared prepared by specialist areas and evaluated by the Organization’s Technical Stress Testing Committee - COTES. These scenarios determine the positive and negative movements of interest rate curves that may affect Company’s investments and capital-raising. The EVE methodology consists of repricing the portfolio exposed to interest rate risk, taking into account the scenarios of increases or decreases of rates, by calculating the impact on present value and total term of assets and liabilities. The economic value of the portfolio is estimated on the basis of market interest rates on the analysis date and of scenarios projected. Therefore, the difference between the values obtained for the portfolio will be the Delta EVE. In the case of the NII – Interest Earning Portion, the methodology intends to calculate the Company’s variation in the net interest income (gross margin) due to eventual variations in the interest rate level, that is, the difference between the calculated NII in BRADESCO | Consolidated Financial Statements in IFRS 124 Consolidated Financial Statements in IFRS | Notes to the Consolidated Financial Statements the base scenario and the calculated NII in the scenarios of increase or decrease of the interest rate will be Delta NII. For the measurement of interest rate risk in the Banking Portfolio, behavioral premises of the customers are used whenever necessary. As a reference, in the case of deposits and savings, which have no maturity defined, studies for the verification of historical behaviors are carried out as well as the possibility of their maintenance. Through these studies, the stable amount (core portion) as well as the criterion of allocation over the years are calculated. Financial Instrument Pricing The Mark-to-Market Commission (CMM) is responsible for approving or submitting fair value models to the Market and Liquidity Risk Commission. The CMM is made up of representatives from the business, back-office and risk areas, with the risk area being responsible for coordinating the Commission and submitting the matters assessed for approval in accordance with the established governance, as appropriate. Whenever possible, the Bank uses prices and quotes from the securities, commodities and futures exchange and the secondary markets. Failing to find such market references, prices made available by other sources (such as Bloomberg, Reuters and Brokerage Firms) are used. As a last resort, proprietary models are used to price the instruments, which also follow the same CMM approval procedure and are submitted to the Company’s validation and assessment processes. Fair value criteria are periodically reviewed, according to the governance process, and may vary due to changes in market conditions, creation of new classes of instruments, establishment of new sources of data or development of models considered more appropriate. Financial instruments to be included in the Trading Portfolio must be approved by the Treasury or Products, Services and Partnerships Executive Committee and have their pricing criteria defined by the CMM. The following principles for the fair value process are adopted by the Company: • Commitment: the Company is committed to ensuring that the prices used reflect the fair value of the operations. Should information not be found, the Company uses its best efforts to estimate the fair value of the financial instruments; • Frequency: the formalized fair value criteria are applied on a daily basis; • Formality: the CMM is responsible for ensuring the methodological quality and the formalization of the fair value criteria; • Consistency: the process to gather and apply prices should be carried out consistently, to guarantee equal prices for the same instrument within the Company; and • Transparency: the methodology must be accessible by the Internal and External Audit, Independent Model Validation Areas – AVIM and by Regulatory Agencies. Control and Follow-Up Market risk is controlled and monitored by an independent area which, on a daily basis, measures the risk of outstanding positions, consolidates results and prepares reports BRADESCO | Consolidated Financial Statements in IFRS 125 Consolidated Financial Statements in IFRS | Notes to the Consolidated Financial Statements required by the existing governance process. In addition to daily reports, Trading Portfolio positions are discussed once every fifteen days by the Treasury Executive Committee, in this meetings, results and risks are assessed and strategies are discussed. Both the governance process and the existing thresholds are ratified by the Integrated Risk Management and Capital Allocation Management Committee and submitted to approval of the Board of Directors, which are revised at least once a year. In the event of a breach of any of these limits, the business unit’s executive management responsible for the position and the COGIRAC are promptly informed of the limit consumption for decision‑making purposes. If an increase in the limit and/or an adjustment or maintenance of the positions is required, the Board of Directors is convened to deliberate on the new limit or the revision of the position strategy. Internal Communication The market risk area provides daily managerial control reports on the positions to the business areas and Senior Management, in addition to weekly reports and periodic presentations to the Board of Directors. Reporting is conducted through an alert system, which determines the addressees of risk reports as previously determined risk threshold percentage is reached; therefore, the higher the risk threshold consumption, more Senior Management members receive the reports. Hedging and Use of Derivatives In order to standardize the use of financial instruments as hedges of transactions and the use of derivatives by the Treasury area, the Company created specific procedures that were approved by the competent Committees. The hedge transactions executed by Organization’s Treasury area must necessarily cancel or mitigate risks related to unmatched quantities, terms, currencies or indexes of the positions in the Treasury books, and must use assets and derivatives authorized to be traded in each of their books to: • control and classify the transactions, respecting the exposure and risk limits in effect; • alter, modify or revert positions due to changes in the market and to operational strategies; and • reduce or mitigate exposures to transactions in inactive markets, in conditions of stress or of low liquidity. For derivatives classified in the “hedge accounting” category, there is a monitoring of: (i) strategy effectiveness, through prospective and retrospective effectiveness tests, and (ii) mark-to-market of hedge instruments. Cash flow Hedge Bradesco maintains cash flow hedges. See more details in Note 7. Standardized and “Continuous Use” Derivatives BRADESCO | Consolidated Financial Statements in IFRS 126 Consolidated Financial Statements in IFRS | Notes to the Consolidated Financial Statements Company’s Treasury area may use standardized (traded on an exchange) and “continuous use” (traded over the counter) derivatives for the purpose of obtaining income or as hedges. The derivatives classified as “continuous use” are those habitually traded over-the-counter, such as vanilla swaps (interest rates, currencies, Credit Default Swap, among others), forward operations (currencies, for example) and vanilla options (currency, Bovespa Index), among others. Non-standardized derivatives that are not classified as “continuous use” or structured operations cannot be traded without the authorization of the applicable Committee. Evolution of Exposures In this section are presented the evolution of financial exposure, the VaR calculated using the internal model and its backtesting and the Stress Analysis. Financial Exposure – Trading Portfolio (Fair Value) Risk factors R$ thousands On December 31, 2025 On December 31, 2024 Assets Liabilities Assets Liabilities Fixed rates 76,704,911 38,242,679 124,477,896 10,549,194 IGP-M (General Index of market pricing) / IPCA (Consumer price index) 12,020,758 10,982,367 2,438,885 2,010,863 Exchange coupon 341,370 - 668,191 - Foreign Currency 9,035,717 8,638,662 14,134,242 13,689,527 Equities 24,558,158 24,644,617 10,344,471 9,979,524 Sovereign/Eurobonds and Treasuries 22,300,246 20,512,300 21,988,976 19,627,310 Other 10,799,051 128,243 2,839,750 235,287 Total 155,760,211 103,148,868 176,892,411 56,091,705 VaR Internal Model – Trading Portfolio The 1-day VaR of Trading Portfolio net of tax effects was R$14,814 thousand as of December 31, 2025, with the options risk factor classified in the IGP-M/IPCA rates Organization as the largest share of the Portfolio’s risk. Risk factors R$ thousands On December 31, 2025 On December 31, 2024 Fixed rates 8,265 1,395 IGPM/IPCA 6,902 5,403 Exchange coupon 67 181 Foreign Currency 4,031 4,580 Sovereign/Eurobonds and Treasuries 7,055 4,112 Equities 1,940 2,829 Other 1,378 7,155 Correlation/diversification effect (14,825) (9,480) VaR at the end of the year 14,813 16,175 Average VaR in the year 26,386 14,916 Minimum VaR in the year 9,836 4,982 Maximum VaR in the year 61,733 45,150 VaR Internal Model – Regulatory Portfolio The capital is calculated by the normal delta VaR model based in Regulatory Portfolio, composed by Trading Portfolio and the Foreign Exchange Exposures and the Commodities Exposure of the Banking Portfolio. In addition, the historical simulation BRADESCO | Consolidated Financial Statements in IFRS 127 Consolidated Financial Statements in IFRS | Notes to the Consolidated Financial Statements and the Delta–Gamma–Vega models of risk are applied to measure all risk factors to an options portfolio, whereby this risk of options is added to the VaR of the portfolio. In this model, risk value is extrapolated to the regulatory horizon 2 (the highest between 10 days and the horizon of the portfolio) by the ‘square root of time’ method. VaR and Stressed VaR shown below refer to a ten-day horizon and are net of tax effects. Risk factors R$ thousands On December 31, 2025 On December 31, 2024 VaR Stressed VaR Stressed Interest rate 45,660 56,835 20,444 23,846 Exchange rate 16,876 31,998 24,497 21,405 Commodity price (Commodities) 13,284 76,852 995 2,247 Equities 7,697 18,547 23,212 30,064 Correlation/diversification effect (36,598) (79,430) (19,896) (28,643) VaR at the end of the year 46,919 104,802 49,252 48,919 Average VaR in the year 76,840 95,545 67,082 98,963 Minimum VaR in the year 33,671 26,010 32,264 33,126 Maximum VaR in the year 195,304 243,961 124,674 272,495 Note: Ten-day horizon VaR net of tax effects. To calculate regulatory capital requirement according to the internal model, it is necessary to take into consideration the rules described by Central Bank Circular Letters No. 3,646/13 and No. 3,674/13, such as the use of VaR and Stressed VaR net of tax effects, the average in the last 60 days and its multiplier. VaR Internal Model – Backtesting The risk methodology applied is continuously assessed using backtesting techniques, which compare the one-day period VaR with the hypothetical statement of income, obtained from the same positions used in the VaR calculation, and with the effective statement of income, also considering the intraday operations for which VaR was estimated. The main purpose of backtesting is to monitor, validate and assess the adherence of the VaR model, and the number of exceptions that occurred must be compatible with the number of exceptions accepted by the statistical tests conducted and the confidence level established. Another objective is to improve the models used by the Company, through analyses carried out with different observation periods and confidence levels, both for Total VaR and for each risk factor. The daily actual and hypothetical results for the last 250 business days did not exceed the respective VaR at the 99% confidence level at any time during the year ended December 31, 2025. Likewise, in September 2025, the daily actual and hypothetical results for the last 250 business days also did not exceed the corresponding VaR for the same confidence level. According to the document published by the Basel Committee on Banking Supervision, breakouts would be classified as “Bad luck or the markets moved in a way not predicted by the model”, that is, the volatility was significantly higher than the 2 The maximum amount between the book’s holding period and ten days, which is the minimum regulatory horizon required by Central Bank of Brazil, is adopted. BRADESCO | Consolidated Financial Statements in IFRS 128 Consolidated Financial Statements in IFRS | Notes to the Consolidated Financial Statements expected and/or correlations were different from those assumed by the model. Stress Analysis – Trading Portfolio The Company also assesses on a daily basis the possible impacts on statement of income in stress scenarios considering a holding period of 20 business days, ie, how much prices or interest rates can change in 20 business days based on historical data and prospective scenarios. This metric is monitored with limits established in the governance process. The scenarios are defined for each risk factor and they are represented as a shock or discount factors which are applied to the trading book position, thus, the value calculated represents a possible loss of the trading book in a stress scenario: R$ thousands On December 31, 2025 On December 31, 2024 At the end of the year 191,803 124,714 Average in the year 143,694 238,134 Minimum in the year 51,893 98,257 Maximum in the year 354,628 473,851 Note: Values net of tax effects. Sensitivity Analysis of Financial Exposures The sensitivity analysis of the Company’s financial exposures (Trading and Banking Portfolios) is performed on a quarterly basis and carried out based on the scenarios prepared for the respective dates, always taking into consideration market inputs available at the time and scenarios that would adversely impact our positions as shown in the examples below: Scenario 1: Based on market information (B3, Anbima, etc.), stresses were applied for 1 basis point on the interest rate, being 1.0% variation on prices; Scenario 2: 25.0% stresses were determined based on market information; and Scenario 3: 50.0% stresses were determined based on market information. The results show the impact for each scenario on a static portfolio position. The dynamism of the market and portfolios means that these positions change continuously and do not necessarily reflect the position demonstrated here. In addition, the Company has a continuous market risk management process, which is always searching for ways to mitigate the associated risks, according to the strategy determined by Management. Therefore, in cases of deterioration indicators in a certain position, proactive measures are taken to minimize any potential negative impact, aimed at maximizing the risk/return ratio for the Company. BRADESCO | Consolidated Financial Statements in IFRS 129 Consolidated Financial Statements in IFRS | Notes to the Consolidated Financial Statements Sensitivity Analysis – Trading Portfolio R$ thousands Trading Portfolio (1) On December 31, 2025 On December 31, 2024 Scenarios Scenarios 1 2 3 1 2 3 Interest rate in Reais (2) Exposure subject to variations in fixed interest rates and interest rate coupons (318) (102,871) (195,792) (69) (24,757) (50,192) Price indexes Exposure subject to variations in price index coupon rates (294) (54,032) (102,722) (110) (9,118) (16,071) Exchange coupon Exposure subject to variations in foreign currency coupon rates (2) (347) (688) (5) (670) (1,330) Foreign currency Exposure subject to exchange rate variations (2,184) (54,595) (109,190) (2,401) (60,037) (120,073) Equities Exposure subject to variation in stock prices 476 11,888 23,776 (1,971) (49,268) (98,536) Sovereign/Eurobonds and Treasuries Exposure subject to variations in the interest rate of securities traded on the international market 83 6,687 13,058 (26) (6,451) (13,634) Other Exposure not classified in other definitions (13) (320) (640) (61) (1,515) (3,029) Total excluding correlation of risk factors (2,252) (193,590) (372,198) (4,643) (151,816) (302,865) (1) Values net of taxes; and (2) As a reference for the shocks applied to the 1-year vertex, the values were approximately 335 bps and 651 bps (scenarios 2 and 3 respectively) on December 31, 2025 (on December 31, 2024 - the values were approximately 372 bps and 722 bps in scenarios 2 and 3 respectively). Sensitivity Analysis – Trading and Banking Portfolios R$ thousands Trading and Banking Portfolios (1) On December 31, 2025 On December 31, 2024 Scenarios Scenarios 1 2 3 1 2 3 Interest rate in Reais (2) Exposure subject to variations in fixed interest rates and interest rate coupons (10,533) (3,584,634) (7,069,069) (10,217) (4,085,285) (7,975,990) Price indexes Exposure subject to variations in price index coupon rates (17,802) (2,747,631) (4,869,645) (12,890) (2,209,541) (3,908,207) Exchange coupon Exposure subject to variations in foreign currency coupon rates (1,899) (231,410) (447,013) (1,834) (262,983) (507,774) Foreign currency Exposure subject to exchange rate variations (4,244) (106,104) (212,207) (5,335) (133,384) (266,768) Equities Exposure subject to variation in stock prices (35,194) (879,844) (1,759,689) (32,045) (801,129) (1,602,258) Sovereign/Eurobonds and Treasuries Exposure subject to variations in the interest rate of securities traded on the international market 2,442 239,377 465,818 2,296 272,371 525,099 Other Exposure not classified in other definitions 935 23,368 46,735 (45) (1,115) (2,230) Total excluding correlation of risk factors (66,295) (7,286,878) (13,845,070) (60,070) (7,221,066) (13,738,128) (1) Values net of taxes; and (2) As a reference for the shocks applied to the 1-year vertex, the values were approximately 335 bps and 653, bps (scenarios 2 and 3 respectively) on December 31, 2025 (on December 31, 2024 - the values were approximately 372 bps and 726 bps in scenarios 2 and 3 respectively). BRADESCO | Consolidated Financial Statements in IFRS 130 Consolidated Financial Statements in IFRS | Notes to the Consolidated Financial Statements Market Risk - Insurance In Item 40.6 – Insurance/Underwriting Risk in consolidated financial statements, the sensitivity analysis related to the discount rate applied in calculating the present value of future obligations is presented. The effects of this sensitivity on insurance liabilities are directly linked to the Yield Curve (ETTJ), which fluctuates as a result of interest rates and inflation. In this context, its inclusion in this section would be possible. However, considering that such sensitivity directly affects the measurement of the actuarial liability, its presentation is considered more appropriate in Item 40.6 – Insurance/Underwriting Risk, as that section already includes the other sensitivity analyses related to the liability. 40.4. Liquidity risk The Liquidity Risk is represented by the possibility of the institution not being able to efficiently meet its obligations, without affecting its daily operations and incurring significant losses, as well as the possibility of the institution to fail to trade a position at market price, due to its larger size as compared to the volume usually traded or in view of any market interruption. The understanding and monitoring of this risk are crucial to enable the Company to settle operations in a timely manner. Control and Monitoring The liquidity risk management of the Company is performed using tools developed on platforms and validated by independent areas of the Company. Among the key metrics and indicators considered in the framework of liquidity risk, are: • Information on the Liquidity Coverage Ratio (LCR): A measure of the sufficiency of liquid instruments to honor the cash outflows of the Company within the next thirty days in a scenario of stress; • Net Stable Funding Ratio (NSFR): A measure of the sufficiency of structural funding to finance long-term assets in the statement of financial position of the Company; • Loss of deposits to different time horizons; • Maps of concentration of funding in different visions (product, term and counterpart); and • Integrated stress exercises where different dimensions of risk are addressed. Limits were established for the main metrics, which can be strategic (approved up to the level of the Board of Directors) or operational (approved by Executive Committee), based on flags, which trigger different levels of governance according to the percentage of use (consumption) of their respective limits. Liquidity Risk Mitigation The governance established for the liquidity risk management includes a series of recommendations to mitigate the risk of liquidity, among the main strategies, are: • Diversification of funding as to the counterpart, product and term; • Adoption of managerial limits of liquidity, in addition to those required by the BRADESCO | Consolidated Financial Statements in IFRS 131 Consolidated Financial Statements in IFRS | Notes to the Consolidated Financial Statements regulator; • Prior analysis of products which may affect the liquidity before their implementation; and • Simulations of stress of liquidity of the portfolio. Stress Tests Due to the dynamics and criticality of this theme, the management and control of liquidity risk should happen every day and be based on stress scenarios. In this way, the main metric used for the monitoring of the liquidity risk of the Prudential Conglomerate is the Short-term Liquidity Coverage Ratio (LCR), which measures the adequacy of liquid resources to honor the commitments in the next thirty days considering a scenario of stress. Therefore, the daily management is performed through the stress test. In addition to the LCR and other metrics of monitoring, simulations of stress scenarios in the long-term are performed, within the integrated stress test program (ICAAP for example), also to evaluate a possible deterioration of liquidity indicators for different time horizons. Internal communication Internal communication about liquidity risk, both between areas and between the different layers of internal governance are done through internal reports, committees and the Company's senior management. Additionally, reports are distributed daily to the areas involved in management and control, as well as to senior management. Several analysis instruments are part of this process and are used to monitor liquidity, such as: • Daily distribution of liquidity control instruments; • Automatic intraday update of liquidity reports for the proper management of the Treasury area; • Preparation of reports with past and future movements, based on scenarios; • Daily verification of compliance with the minimum liquidity level; • Preparation of complementary reports in which the concentration of funding is presented by type of product, term and counterparty; and • Weekly reports to senior management with behavior and expectations regarding the liquidity situation. The liquidity risk management process has an alert system, which determines the appropriate level of reporting of risk reports according to the percentage of use of the established limits. Thus, the lower the liquidity ratios, the higher levels of management of the Company receive the reports. BRADESCO | Consolidated Financial Statements in IFRS 132 Consolidated Financial Statements in IFRS | Notes to the Consolidated Financial Statements Undiscounted cash flows of financial liabilities and insurance contracts The table below presents the cash flows payable for non-derivative financial liabilities and insurance contracts, covering the remaining contractual period to maturity as from the date of the consolidated statements of financial position. The values disclosed in this table represent the undiscounted contractual cash flows. R$ thousands Up to 1 month From 1 to 3 months From 3 months to 1 year From 1 to 5 years More than 5 years Total on December 31, 2025 Total on December 31, 2024 Deposits from banks 261,433,270 16,974,480 40,810,535 24,320,616 5,696,705 349,235,606 353,942,812 Deposits from customers 182,454,287 31,337,461 135,375,260 312,088,318 660,278 661,915,604 617,308,449 Funds from securities issued 14,712,077 6,983,022 61,872,772 214,804,075 10,022,934 308,394,880 254,136,285 Subordinated debt 14,720 390,535 1,783,125 10,221,028 85,893,990 98,303,398 106,160,891 Insurance contract liabilities 562,119,491 14,143,799 8,427,420 29,882,220 82,520,029 697,092,959 852,353,171 Other financial liabilities (1) 58,032,775 41,212,188 10,522,773 7,110,100 513,369 117,391,205 101,086,011 Total liabilities on December 31, 2025 1,078,766,620 111,041,485 258,791,885 598,426,357 185,307,305 2,232,333,652 Total liabilities on December 31, 2024 1,232,136,722 107,755,472 272,535,530 469,141,649 203,418,246 2,284,987,619 (1) Includes credit card transactions, foreign exchange transactions, negotiation and intermediation of securities, leases and capitalization bonds. The assets available to meet all the obligations and cover the outstanding commitments include cash and cash equivalents, financial assets, loans and advances. Management may also cover unexpected cash outflows by selling securities and by having access to sources of additional funds, such as asset-backed-markets. The cash flows that the Company estimates for these instruments may vary significantly from those presented. For example, it is expected that demand deposits of customers will maintain a stable or increasing balance, and it is not expected that these deposits will be withdrawn immediately. In the Company, liquidity-risk management involves a series of controls, mainly related to the establishment of technical limits, with the ongoing evaluation of the positions assumed and the financial instruments used. BRADESCO | Consolidated Financial Statements in IFRS 133 Consolidated Financial Statements in IFRS | Notes to the Consolidated Financial Statements Undiscounted cash flows for derivatives All the derivatives of the Company are settled at net value, and include: • Foreign currency derivatives – over-the-counter currency options, currency futures, and currency options traded on an exchange; and • Interest rate derivatives – interest rate swaps, forward rate contracts, interest rate options, other interest rate contracts, interest rate futures traded on an exchange and interest rate options traded on an exchange. The table below analyzes the derivative financial liabilities that will be settled at net value, Organizationed based on the period remaining from the reporting date to the respective maturity date. The values disclosed in the table are undiscounted cash flows. R$ thousands Up to 1 month From 1 to 3 months From 3 months to 1 year From 1 to 5 years More than 5 years Total on December 31, 2025 Total on December 31, 2024 Differential of swaps payable 1,278,422 6,950 1,114,530 126,479 13,443,688 15,970,069 15,833,154 Non-deliverable forwards 5,488,324 460,875 1,207,137 162,460 - 7,318,796 3,015,522 Purchased 2,821,652 401,040 1,128,318 156,333 - 4,507,343 255,209 Sold 2,666,672 59,835 78,819 6,127 - 2,811,453 2,760,313 Premiums of options 896,675 73,265 374,303 1,249,227 40,007 2,633,477 1,656,654 Other 1,408,550 451,799 1,137,646 332,434 - 3,330,429 2,504,000 Total of derivative liabilities on December 31, 2025 9,071,971 992,889 3,833,616 1,870,600 13,483,695 29,252,771 Total of derivative liabilities on December 31, 2024 3,251,465 986,235 2,573,578 4,008,358 12,189,694 23,009,330 BRADESCO | Consolidated Financial Statements in IFRS 134 Consolidated Financial Statements in IFRS | Notes to the Consolidated Financial Statements Consolidated statements of financial position by maturities The tables below show the financial assets and liabilities and insurance contract liabilities of the Organization segregated by maturities used for the management of liquidity risks, in accordance with the remaining contractual maturities on the reporting date: R$ thousands Current Non-current Total on December 31, 2025 Total on December 31, 1 to 30 days 2024 31 to 180 days 181 to 360 days 1 to 5 years More than 5 years No stated maturity Assets Cash and balances with banks 137,031,197 - - - - - 137,031,197 146,614,670 Financial assets measured at fair value through profit or loss 530,580,191 3,533,128 2,294,280 7,234,164 4,148,006 - 547,789,769 371,883,348 Debt instruments measured at fair value through other comprehensive income 9,185,740 18,252,721 6,831,650 46,441,083 58,286,911 - 138,998,105 156,292,584 Loans and advances to customers, net of impairment 162,908,322 152,968,753 103,909,969 215,517,705 109,152,313 - 744,457,062 672,382,105 Loans and advances to financial institutions, net of impairment 186,589,622 40,311,106 6,410,950 2,173,376 - - 235,485,054 196,233,298 Securities, net of provision for expected credit losses 17,808,782 14,206,301 22,876,215 138,622,149 66,033,124 - 259,546,571 266,991,967 Other financial assets (1) 39,932,064 15,626,624 7,313,008 8,245,307 2,309,819 - 73,426,822 81,195,242 Total financial assets on December 31, 2025 1,084,035,918 244,898,633 149,636,072 418,233,784 239,930,173 - 2,136,734,580 Total financial assets on December 31, 2024 910,635,292 197,604,624 124,564,422 451,709,544 207,079,332 - 1,891,593,214 Liabilities Deposits from financial institutions 327,014,095 56,709,308 20,169,509 21,273,661 1,932,921 - 427,099,494 361,818,310 Deposits from customers (2) 208,009,606 66,066,548 102,249,281 344,688,780 259,936 - 721,274,151 644,338,463 Securities issued 16,357,292 25,082,829 45,445,374 209,382,550 9,992,637 - 306,260,682 257,977,344 Subordinated debt 14,708 385,063 1,641,087 5,798,538 25,351,021 21,524,109 54,714,526 57,458,927 Other financial liabilities (3) 58,032,775 41,212,188 10,522,773 7,110,100 513,369 - 117,391,205 101,086,011 Financial liabilities measured at fair value through profit or loss 2,081,928 4,807,769 3,251,792 6,865,717 1,261,124 - 18,268,330 16,240,611 Expected credit losses - Loan Commitments 399,154 809,769 482,777 78,040 45,646 - 1,815,386 2,447,791 Financial guarantees 49,250 47,722 103,581 28,125 1,038,126 - 1,266,804 1,257,645 Liabilities of insurance contracts (2) 350,974,072 13,770,963 7,966,651 23,762,581 23,241,209 - 419,715,476 378,792,820 Total financial liabilities on December 31, 2025 962,932,880 208,892,159 191,832,825 618,988,092 63,635,989 21,524,109 2,067,806,054 Total financial liabilities on December 31, 2024 885,388,340 180,580,649 214,445,408 459,523,561 62,859,713 18,620,251 1,821,417,922 (1) Includes, primarily, foreign exchange operations, debtors for guarantee deposits and trading and intermediation of values; (2) Demand and savings deposits and insurance contract liabilities, represented by “VGBL” and “PGBL” products, are classified within a period of 1 to 30 days, without considering the historical average turnover; and (3) Primarily includes credit card operations, foreign exchange operations, trading and intermediation of securities, financial leasing and capitalization plans. BRADESCO | Consolidated Financial Statements in IFRS 135 Consolidated Financial Statements in IFRS | Notes to the Consolidated Financial Statements The tables below show the assets and liabilities of the Company segregated by current and non-current, in accordance with the remaining contractual maturities on the reporting date: R$ thousands Current Non-current Total on December 31, 2025 Total on December 31, 2024 Assets Total financial assets 1,478,570,623 658,163,957 2,136,734,580 1,891,593,214 Non-current assets held for sale and discontinued operations 3,757,502 - 3,757,502 3,494,950 Investments in associated companies - 13,283,440 13,283,440 11,029,012 Property and equipment - 9,405,491 9,405,491 10,220,444 Intangible assets and goodwill - 25,739,659 25,739,659 23,749,208 Current income and other tax assets 2,985,740 9,898,706 12,884,446 11,764,176 Deferred income tax assets 29,940,580 81,297,026 111,237,606 101,808,543 Other assets 13,715,226 3,569,266 17,284,492 15,824,815 Total non-financial assets 50,399,048 143,193,588 193,592,636 177,891,148 Total assets on December 31, 2025 1,528,969,671 801,357,545 2,330,327,216 Total assets on December 31, 2024 1,292,074,023 777,410,339 2,069,484,362 Liabilities Total financial liabilities 1,363,657,864 704,148,190 2,067,806,054 1,821,417,922 Other provisions 6,335,334 14,227,867 20,563,201 20,033,774 Current income tax liabilities 2,003,486 - 2,003,486 2,043,616 Deferred income tax liabilities - 1,895,931 1,895,931 1,664,666 Other liabilities 54,408,571 4,701,343 59,109,914 55,381,892 Total non-financial liabilities 62,747,391 20,825,141 83,572,532 79,123,948 Total shareholders’ equity - 178,948,630 178,948,630 168,942,492 Total shareholders' equity and liabilities on December 31, 2025 1,426,405,255 903,921,961 2,330,327,216 Total shareholders' equity and liabilities on December 31, 2024 1,339,534,649 729,949,713 2,069,484,362 40.5. Fair value of financial assets and liabilities The tables below present the composition of the financial assets and liabilities measured at fair value, classified using the hierarchical levels: R$ thousands On December 31, 2025 Level 1 Level 2 Level 3 Fair Value Financial assets measured at fair value through profit or loss 462,536,378 60,865,737 3,537,559 526,939,674 Brazilian government bonds 395,031,887 - - 395,031,887 Corporate debt and marketable equity securities 48,387,660 17,519,436 3,537,559 69,444,655 Bank debt securities 20,916 43,346,301 - 43,367,217 Mutual funds 18,840,361 - - 18,840,361 Foreign government securities 66,555 - - 66,555 Brazilian government bonds issued abroad 188,999 - - 188,999 Derivatives (333,439) 3,689,752 (774,548) 2,581,765 Derivative financial instruments (assets) 9,266,882 11,309,553 273,660 20,850,095 Derivative financial instruments (liabilities) (9,600,321) (7,619,801) (1,048,208) (18,268,330) Debt instruments measured at fair value through other comprehensive income 135,065,868 3,051,953 880,284 138,998,105 Brazilian government bonds 106,709,836 - 6,792 106,716,628 Corporate debt securities 6,617,424 2,039,480 - 8,656,904 Bank debt securities 776,277 1,012,473 - 1,788,750 Brazilian government bonds issued abroad 7,816,817 - - 7,816,817 Foreign governments securities 8,177,931 - - 8,177,931 Mutual funds 122,108 - - 122,108 Marketable equity securities and other stocks 4,845,475 - 873,492 5,718,967 Total 597,268,807 67,607,442 3,643,295 668,519,544 BRADESCO | Consolidated Financial Statements in IFRS 136 Consolidated Financial Statements in IFRS | Notes to the Consolidated Financial Statements R$ thousands On December 31, 2024 Level 1 Level 2 Level 3 Fair Value Financial assets measured at fair value through profit or loss 308,064,812 41,731,862 2,251,689 352,048,363 Brazilian government bonds 263,224,363 - - 263,224,363 Corporate debt and marketable equity securities 30,626,530 8,759,461 2,251,689 41,637,680 Bank debt securities 4,010,896 32,972,401 - 36,983,297 Mutual funds 9,368,468 - - 9,368,468 Foreign government securities 468,521 - - 468,521 Brazilian government bonds issued abroad 366,034 - - 366,034 Derivatives (2,537,088) 6,551,467 (420,005) 3,594,374 Derivative financial instruments (assets) 3,199,679 16,497,753 137,553 19,834,985 Derivative financial instruments (liabilities) (5,736,767) (9,946,286) (557,558) (16,240,611) Debt instruments measured at fair value through other comprehensive income 152,116,761 3,061,706 1,114,117 156,292,584 Brazilian government bonds 123,817,265 - 11,750 123,829,015 Corporate debt securities 1,467,682 182,142 - 1,649,824 Bank debt securities 1,115,295 2,879,564 17,438 4,012,297 Brazilian government bonds issued abroad 8,960,333 - - 8,960,333 Foreign governments securities 8,324,658 - - 8,324,658 Mutual funds 4,951,794 - - 4,951,794 Marketable equity securities and other stocks 3,479,734 - 1,084,929 4,564,663 Total 457,644,485 51,345,035 2,945,801 511,935,321 Reconciliation of securities and derivative financial instruments measured at fair value on a recurring basis using significant unobservable inputs (Level 3): R$ thousands Financial assets measured at fair value through profit or loss Financial assets measured at fair value through other comprehensive income Derivative assets Derivative liabilities Total On December 31, 2023 801,331 1,564,028 152,986 (529,396) 1,988,949 Included in statement of income (196,056) (138,588) - - (334,644) Included in other comprehensive income - - - - - Acquisitions 1,690,098 9,342 - (28,162) 1,671,278 Maturities/sales (43,684) (56,600) (15,433) - (115,717) Transfer between categories - (248,782) - - (248,782) Transfers (to)/from other levels (1) - (15,283) - - (15,283) On December 31, 2024 2,251,689 1,114,117 137,553 (557,558) 2,945,801 Included in statement of income 566,624 2,152 - - 568,776 Included in other comprehensive income - (200,831) - - (200,831) Acquisitions 1,672,199 - 136,107 (490,650) 1,317,656 Maturities/sales (899,235) (17,716) - - (916,951) Transfer between categories 17,438 (17,438) - - - Transfers (to)/from other levels (1) (71,156) - - - (71,156) On December 31, 2025 3,537,559 880,284 273,660 (1,048,208) 3,643,295 (1) These securities were reclassified between levels 2 and 3, as there was an increase in credit risk and the spread curve has unobservable parameters. BRADESCO | Consolidated Financial Statements in IFRS 137 Consolidated Financial Statements in IFRS | Notes to the Consolidated Financial Statements The tables below show the gains/(losses) due to changes in fair value and interest income, including the realized and unrealized gains and losses, recorded in the consolidated statement of income for Level 3 assets and liabilities: R$ thousands Financial assets measured at fair value through profit or loss Financial assets measured at fair value through other comprehensive income Total Interest and similar income 37,698 30,616 68,314 Net trading gains/(losses) realized and unrealized (233,754) (169,204) (402,958) Total on December 31, 2024 (196,056) (138,588) (334,644) Interest and similar income 452,988 2,152 455,140 Net trading gains/(losses) realized and unrealized 113,636 (200,831) (87,195) Total on December 31, 2025 566,624 (198,679) 367,945 Sensitivity analysis for financial assets classified as Level 3 R$ thousands On December 31, 2025 Impact on income (1) Impact on shareholders’ equity (1) 1 2 3 1 2 3 Interest rate in Reais (28) (9,841) (19,247) - (77) (151) Price indexes - - - - - - Exchange coupon (54) (6,508) (12,485) - - - Foreign currency 1,469 36,729 73,459 - - - Equities 10,321 258,037 516,075 4,804 120,105 240,211 (1) Values net of taxes. R$ thousands On December 31, 2024 Impact on income (1) Impact on shareholders’ equity (1) 1 2 3 1 2 3 Interest rate in Reais - - - (1) (326) (624) Price indexes - - - - - - Exchange coupon - - - (1) (189) (371) Foreign currency - - - 94 2,354 4,708 Equities 4,632 115,811 231,622 10,672 266,793 533,585 The sensitivity analyses were carried out based on the scenarios prepared for the dates shown, always taking into consideration market inputs available at the time and scenarios that would adversely impact our positions, in accordance with the scenarios below: Scenario 1: Based on market information (B3, Anbima, etc.), stresses were applied for 1 basis point on the interest rate and 1.0% variation on prices; Scenario 2: 25.0% stresses were determined based on market information; and Scenario 3: 50.0% stresses were determined based on market information. Financial instruments not measured at fair value The table below summarizes the carrying amounts and the fair values of the financial assets and liabilities that were not presented in the consolidated statements of financial position at their fair value, classified using the hierarchical levels: BRADESCO | Consolidated Financial Statements in IFRS 138 Consolidated Financial Statements in IFRS | Notes to the Consolidated Financial Statements R$ thousands On December 31, 2025 Fair Value Book value Level 1 Level 2 Level 3 Total Financial assets (1) Loans and advances · Financial Institutions - 235,513,370 - 235,513,370 235,485,054 · Customers - - 617,337,432 617,337,432 635,182,964 Securities at amortized cost 139,327,089 104,670,553 5,262,708 249,260,350 263,111,062 Financial liabilities Deposits from banks - - 427,535,327 427,535,327 427,099,494 Deposits from customers - - 718,421,538 718,421,538 721,274,151 Securities issued - - 306,537,715 306,537,715 306,260,682 Subordinated debt - - 56,371,225 56,371,225 54,714,526 R$ thousands On December 31, 2024 Fair Value Book value Level 1 Level 2 Level 3 Total Financial assets (1) Loans and advances · Financial Institutions - 196,235,524 - 196,235,524 196,233,298 · Customers - - 727,760,109 727,760,109 720,239,586 Securities at amortized cost 151,449,296 98,794,868 10,067,466 260,311,630 273,148,967 Financial liabilities Deposits from banks - - 374,212,384 374,212,384 361,818,310 Deposits from customers - - 644,856,874 644,856,874 644,338,463 Securities issued - - 259,054,688 259,054,688 257,977,344 Subordinated debt - - 58,990,729 58,990,729 57,458,927 (1) The amounts of loans and advances are presented net of the allowance for impairment losses. 40.6. Insurance/Underwriting risk Underwriting risk is the risk related to a possible loss event that may occur in the future and for which there is uncertainty over the amount of damages that result from it. The risk arises from an economic situation not matching the Company’s expectations at the time of issuing its underwriting policy with regard to the uncertainties existing both in the definition of actuarial assumptions and in the measurement of compliance cash flows, as well as for pricing and calculating premiums and contributions. In short, it refers to the risk of the frequency or severity of loss events or benefits exceeding the Company’s estimates. Historical experience shows that the larger the Organization of contracts with similar risks, the lower the variability in cash flows. In that way, the risk management process seeks to diversify insurance operations, aiming to excel at balancing the portfolio, and is based on the Organizationing of risks with similar characteristics in order to reduce the impact of individual risks. Risk underwriting management is carried out by the Technical Superintendence and the policies of underwriting and acceptance of risks are periodically evaluated. Uncertainties over estimated future claim payments Claims are due as they occur, and the Organization must compensate all covered claims that occur during the term of the contract. The estimated cost of claims includes the direct expenses to be incurred in their settlement. Therefore, considering the uncertainties inherent to the process, the final settlement may be different from BRADESCO | Consolidated Financial Statements in IFRS 139 Consolidated Financial Statements in IFRS | Notes to the Consolidated Financial Statements that initially planned. Asset and liability management (ALM) The Company periodically analyzes future cash flows on assets and liabilities held in portfolio ALM – Asset Liability Management. The method used for ALM analysis is to observe the sufficiency or insufficiency of the present value of the stream of assets in relation to the present value of the stream of liabilities, and the duration of assets in relation to that of liabilities. The aim is to verify that the situation of the portfolio of assets and liabilities is balanced in order to honor the Company’s future commitments to its insured persons. The actuarial assumptions used to generate the flow of liabilities are in line with international actuarial practices and also with the characteristics of the Company’s product portfolio. Risk management by product The continuous monitoring the insurance contract portfolio enables us to track and adjust premiums practiced, as well as to assess the need for alterations. Other monitoring tools in use include: (i) sensitivity analysis, and (ii) algorithmic checks and corporate system notifications (underwriting, issuance and claims). The main risks associated with Non-Life The risks associated with Non-Life include, among others: • Oscillations in the incidence, frequency and severity of the claims and the indemnifications of claims in relation to the expectations; • Unpredictable claims arising from an isolated risk; • Inaccurate pricing or inadequate underwriting of risks; • Inadequate reinsurance policies or risk transfer techniques; and • Insufficient or excessive technical provisions. Generally, the Non-Life insurance underwritten by the Company is of short duration. The underwriting strategies and goals are adjusted by management and informed through internal guidelines and practice and procedure manuals. The main risks inherent to the main Non-Life business lines are summarized as follows: • Auto insurance includes, among other things, physical damage to the vehicle, loss of the insured vehicle, third-party liability insurance for vehicles and personal accident for passengers; and • Business, home and miscellaneous insurance includes, among other things, fire risks (e.g. fire, explosion and business interruption), natural disasters (e.g., earthquakes, storms and floods), as well as liability insurance. The main risks associated with life insurance and pension plans Life insurance and Private Pension Plans are generally long-term in nature and, accordingly, various actuarial assumptions are used to manage and estimate the risks involved, such as: assumptions about returns on investments, longevity, mortality and persistence rates in relation to each business unit. Estimates are based on historical experience and on actuarial expectations. BRADESCO | Consolidated Financial Statements in IFRS 140 Consolidated Financial Statements in IFRS | Notes to the Consolidated Financial Statements The risks associated with life insurance and pension plans include: • Biometric risks, which includes mortality experience, adverse morbidity, longevity and disability. The mortality risk may refer to policyholders living longer than expected (longevity) or passing away before expected. This is because some products pay a lump sum if the person dies, and others pay regular amounts while the policyholder is alive; • Policyholder’s behavior risks, which includes persistence rate experience. Low persistence rates for certain products may result in less policies/private pension plan agreements remaining contracted to help cover fixed expenses and may reduce future positive cash flows of the underwritten business. A low persistence rate may affect liquidity of products which carry a redemption benefit. On the other hand, high persistence rates for deficit products can increase future losses of these products; • Organization Life-insurance risk results from exposure to mortality and morbidity rates and to operational experience worse than expected on factors such as persistence levels and administrative expenses; and • Some Life and Pension Plan products have pre-defined yield guarantees, and thereby face risk from changes in financial markets, returns on investments and interest rates that are managed as a part of market risk. The main risks associated with health insurance The risks associated with health insurance include, among others: • Variations in cause, frequency and severity of indemnities of claims compared to expectations; • Unforeseen claims resulting from isolated risk; • Incorrect pricing or inadequate subscription of risks; and • Insufficient or overvalued technical provisions. For individual health insurance, for which certain provisions are calculated based on expected future cash flows (difference between expected future claims and expected future premiums), there are a number of risks, in addition to those cited above, such as biometric risk, including mortality and longevity experience and the insured’s behavioral risk, which covers persistency experience, as well as interest-rate risk that is managed as a part of market risk. Risk management of non-life, life insurance and pension plans and health insurance The Board for Risk Management monitors and evaluates risk exposure and is responsible for the development, implementation and review of policies that cover subscription. The implementation of these policies, the treatment of claims, reinsurance and the constitution of technical provisions of these risks are performed by the Technical Superintendent of Actuary and Statistics. The Technical Superintendent developed mechanisms, such as the analysis of possible accumulations of risks based on monthly reports, which identify, quantify and manage accumulated exposure in order to keep it within the limits defined by internal policies. For life insurance, pension plans and health insurance, the longevity risk is carefully monitored using the most recent data and tendencies of the environment in which the Company operates. Management monitors exposure to this risk and its capital BRADESCO | Consolidated Financial Statements in IFRS 141 Consolidated Financial Statements in IFRS | Notes to the Consolidated Financial Statements implications in order to manage possible impacts, as well as the funding that the future business needs. Management adopts assumptions of continuous improvement in the future longevity of the population for the calculation of technical provisions, in order to anticipate and thus be covered by possible impacts generated by the improvement in the life expectancy of the insured/assisted population. Persistency risk is managed through the frequent management of the Company’s historical experience. Management has also established guidelines for the management of persistency in order to monitor and implement specific initiatives, when necessary, to improve retention of policies. The risk of elevated expenses is primarily monitored through the evaluation of the profitability of business units and the frequent monitoring of expense levels. Specifically, for life insurance and pension plans, mortality and morbidity risks are mitigated through the assignment of catastrophe reinsurance. Risk Concentration The Company operates throughout the national territory, and potential exposures to risk concentration are monitored through management reports where the results of insurance contracts sold by branch are observed. The table below shows the concentration of types of risks insured: Insurance liabilities R$ thousands On December 31 2025 2024 Gross Reinsurance Net of tax Gross Reinsurance Net of tax Life 25,973,963 29,021 25,944,942 23,171,925 36,481 23,135,444 Pension plans 371,419,090 - 371,419,090 335,365,124 - 335,365,124 Non-Life 3,680,736 38,510 3,642,226 3,603,722 49,327 3,554,396 Health (Health and Dental) 18,641,687 - 18,641,687 16,651,963 - 16,651,963 Sensitivity test The purpose of the sensitivity test is to measure the impacts on the Organization´s results, in the event of isolated, reasonably possible changes in assumptions inherent to the operations that may be affected due to the risk underwriting process and that are considered relevant on the balance sheet date. As risk factors, the following premises were elected: • Risk-free interest rate – represents the minimum level of profitability that can be taken for granted by the Organization. The test evaluated the impact of an increase in the risk-free interest rate curve; • Income Conversion – The test evaluated the impact of an increase in the income conversion ratio for annuity contracts; • Longevity (Improvement) – represents an individual's life expectancy, based on their year of birth, their current age, and other demographic factors, including gender. The test evaluated the impact of an increase in the estimate of improvement in life expectancy for annuity contracts; • Discount rate – represents the rate applied in calculating the present value of future obligations. The test assessed the impact of an increase and a decrease in the discount rate; and • Loss ratio – is the main indicator of insurance contracts and is equivalent to the ratio between the expenses and the income that the Organization received for the contract. The test assessed the impact of an increase in claims. BRADESCO | Consolidated Financial Statements in IFRS 142 Consolidated Financial Statements in IFRS | Notes to the Consolidated Financial Statements Sensitivity test results The table below shows the impact on the Company's results in insurance liabilities for life insurance with survivorship coverage, pension plans and individual life insurance, considering variations in the risk factor: On December 31, 2025 - R$ thousand Interest Rate - Variation of +5% (*) Results in the insurance liabilities (**) Pension Plans (222,505) (*) To better reflect the interest rate risk, the projected profitability of balances was sensitized and the bottom-up rate, used to discount flows, was not sensitized. On December 31, 2025 - R$ thousand Longevity (Improvement) - Variation of +0.2% Results in the insurance liabilities (**) Pension Plans (123,072) (**) Reinsurance is not subject to the application of the shock, as it is a non-proportional and immaterial contract. The sensitivity tests for Conversion and Income of the Pension product and for Longevity of the Life product were not presented as they resulted in zero impact. With respect to insurance risk, the table below presents the effects of sensitivity to the discount rate (bottom-up, risk-free rate, illiquidity premium) on insurance liabilities, segregated by line of business. The risk-free rate used to discount the liabilities to present value is the Yield Curve (ETTJ) published by Ambima/SUSEP. The DV01 (Dollar Value of 1 basis point) was selected as the shock factor, as it is a metric widely used in the financial market to measure interest rate risk and facilitates comparisons across different instruments, since it expresses sensitivity in monetary terms. The results of this sensitivity analysis are presented both in statement of income and in Equity; however, the Company has established as an accounting policy that the adjustments arising from changes in interest rates are recognized directly in Equity, reinforcing the consistency and comparability of the consolidated financial statements. Discount rate R$ thousand On December 31, 2024 Income Equity Official Lower (-1%) Upper (+1%) Official Lower (-1%) Upper (+1%) Life and Pension Plans 3,956,551 3,918,652 3,997,692 7,751,092 7,534,736 7,956,746 Non-Life 837,096 921,705 921,677 2,007,872 2,100,354 2,094,096 Health (Health and Dental) 1,873,524 1,874,060 1,872,988 8,756,460 8,722,887 8,789,476 Discount rate On December 31, 2025 Income Equity Official Lower (-1%) Upper (+1%) Official Lower (-1%) Upper (+1%) Life and Pension Plans 2,987,896 2,954,938 3,020,711 7,459,983 7,273,532 7,639,164 Non-Life 750,983 749,097 749,080 1,978,010 1,985,027 1,973,621 Health (Health and Dental) 3,098,623 3,099,198 3,098,047 8,240,677 8,205,431 8,275,426 For non-life insurance, collective life and health including dental insurance, the table below shows the impact in expenses with claims on the Organization's statements of income, if there was an increase of 1 percentage point in the accident rate, in the last year of the calculation base date: BRADESCO | Consolidated Financial Statements in IFRS 143 Consolidated Financial Statements in IFRS | Notes to the Consolidated Financial Statements Sensitivity - 1% Variation R$ thousands Gross of reinsurance Net of reinsurance On December 31, 2025 On December 31, 2024 On December 31, 2025 On December 31, 2024 Non-Life (59,208) (56,151) (58,954) (55,887) Life (40,389) (38,389) (40,143) (38,185) Health (Health and Dental) (248,572) (226,001) (248,572) (226,001) The effect of this sensitivity is linear. Considering the loss ratio recorded for the period from October 2024 to September 2025, variations were observed in Non‑Life of –1 and +5 percentage points for the lower and upper scenarios, respectively; in Life of –3 and +5 percentage points for the lower and upper scenarios, respectively; and in Health of –2 and +2 percentage points for the lower and upper scenarios, respectively. It should be noted that such variations are continuously monitored. Limitations of sensitivity analysis Sensitivity analyses show the effect of a change in certain assumptions while other assumptions remain unchanged. Sensitivity analyses do not take account of the fact that assets and liabilities are highly managed and controlled. Additionally, the Company’s financial position may vary with any movement occurring in the market. For example, the risk management strategy aims to manage exposure to fluctuations in the market. As investment markets move through various levels, management initiatives may include sales of investments, altered portfolio allocations, and other protective measures. Other limitations of the sensitivity analyses include the use of hypothetical market movements to show the potential risk, which only represents Management’s view of possible market changes in the near future, which cannot be foreseen with certainty, and they also assume that all interest rates move in the same manner. Credit risk Credit risk consists of the possible occur of losses in value of financial assets and reinsurance assets, because of noncompliance, by the counterparty, of its financial obligations according to agreed terms the Company and its subsidiaries, as well as the devaluation of contracts, resulting from the deterioration in the counterparty's risk classification. This risk may materialize in different ways, among others. • Losses arising from delinquency, due to lack of payment of the premium or of the installments by the insured person; • Possibility of any issuer of financial asset not making the payment on the due date or the amortizations provided for each security; and • Inability or unfeasibility of recovery of commissions paid to brokers when policies are canceled. Credit risk management The Company performs various sensitivity analyses and stress tests as tools for management of financial risks. The results of these analyses are used for risk mitigation and to understand the impact on the results and the shareholders’ equity of the Company in normal conditions and in conditions of stress. These tests take into BRADESCO | Consolidated Financial Statements in IFRS 144 Consolidated Financial Statements in IFRS | Notes to the Consolidated Financial Statements account historical scenarios and scenarios of market conditions provisioned for future periods, and their results are used in the process of planning and decision making, as well as the identification of specific risks arising on financial assets and liabilities held by the Company. The management of credit risk for reinsurance operations includes monitoring of exposures to credit risk of individual counterparts in relation to credit ratings by risk assessment companies, such as AM Best, Fitch Ratings and Standard & Poor’s and Moody’s. The reinsurers are subject to a process of analysis of credit risk on an ongoing basis to ensure that the goals of the mitigation of credit risk will be achieved. In that sense, credit risk management in the Company is a continuous and evolving process including the mapping, development, evaluation and diagnosis of existing models, instruments and procedures that requires a high level of discipline and control in the analysis of operations to preserve the integrity and independence of processes. It is a process carried out at the corporate level using structured, independent internal procedures based on proprietary documentation and reports, assessed by the risk management structures of the Company, and based on the gradual deployment of internal models for the determination, measurement and calculation of capital. Meetings are held quarterly of the Executive Committee for Risk Management of Grupo Bradesco Seguros, of the Executive Committee of Investments and, monthly, of the Internal Meeting of Asset Allocation by the area of Investment Management of Bradesco Seguros S.A. for the deliberative negotiations, possessing the functions, which are necessary for the regulatory/improvement requirement in the processes of management. Reinsurance policy No matter how conservative and selective insurers are in the choice of their partners, the purchase of reinsurance presents, naturally embedded in its operation, a credit risk. The Bradesco Company’s policy for purchasing reinsurance and approval of reinsurers are the responsibility of the Board of Executive Officers, observing to the minimum legal requirements and regulations, some of them aimed at minimizing the credit risk intrinsic to the operation, and considering the shareholders’ equity consistent with amounts transferred. Another important aspect of managing reinsurance operations is the fact that the Company aims to work within its contractual capacity, thereby avoiding the frequent purchases of coverages in optional agreements and higher exposures to the credit risk. Practically, all property damage portfolios, except automotive, are hedged by reinsurance which, in most cases, is a combination of proportional and nonproportional plans by risk and/or by event. Currently, part of the reinsurance contracts (proportional and non-proportional) are transferred to IRB Brasil Resseguros S.A. Some admitted reinsurers participate with lower individual percentages, but all have minimum capital and rating higher than the minimum established by the Brazilian legislation, which, in Management’s judgment, reduces the credit risk. BRADESCO | Consolidated Financial Statements in IFRS 145 Consolidated Financial Statements in IFRS | Notes to the Consolidated Financial Statements Exposure to insurance credit risk Management believes that maximum exposure to credit risk arising from premiums to be paid by insured parties is low, since, in some cases, coverage of claims may be canceled (under Brazilian regulations), if premiums are not paid by the due date. Exposure to credit risk for premium receivables differs between risks yet to be incurred and risks incurred, since there is higher exposure on incurred-risk lines for which coverage is provided in advance of payment of the insurance premium. The Company is exposed to concentrations of risk with individual reinsurance companies, due to the nature of the reinsurance market and strict layer of reinsurance companies with acceptable loan ratings. The Company manages the exposures of its reinsurance counterparties, limiting the reinsurance companies that may be used, and regularly assessing the default impact of the reinsurance companies. Operational risk Operational risk is the possibility of losses resulting from failure, deficiency or inadequacy of internal processes, people and systems, or resulting from fraud or external events, including legal risk and excluding risks arising from strategic decisions and image of the Organization. Operational risk management The Organization approaches operational risk management as a process of continuous improvement, aiming to monitor the dynamic evolution of the business and minimize the existence of gaps that could compromise the quality of this management. The entire Corporate Governance process for operational risk management is monitored quarterly by the executive committees of Grupo Bradesco Seguros, having, among others, the following responsibilities: • Periodic assessment of operational risks faced and the adequacy of controls and procedures to address the identified risks and their mitigation; • Development of the Operational Loss Database (DOLD) for reporting operational losses and corrective actions; • Training and dissemination of the internal control culture; • Ensure compliance with the Organization's operational risk management and business continuity policies; • Ensure the effectiveness of the Organization's operational risk and business continuity management process; • Approve and review definitions and criteria, mathematical and statistical modeling and calculations relating to the amount of capital allocation; • Evaluate and submit for validation by the Executive Risk Management Committee, with reporting to specific committees, the policy, structure, roles, procedures and responsibilities of the dependencies involved in the process, as well as the reviews carried out annually; and • Ensure compliance with ethical standards. Within this scenario, the Organization has mechanisms for evaluating its Internal Controls system to provide reasonable security regarding the achievement of its objectives in order to avoid the possibility of loss caused by non-observance, violation or non-compliance with internal rules and instructions. The internal control BRADESCO | Consolidated Financial Statements in IFRS 146 Consolidated Financial Statements in IFRS | Notes to the Consolidated Financial Statements environment also contributes to operational risk management, in which the risk map is regularly updated based on self-assessments of risks and controls. Procedures for Continuous Control and Monitoring • Identify, together with the Company’s internal and external departments, loss events arising from operational risk, ensuring the appropriate treatment of such events based on their origins/causes, for the purposes of evaluating, monitoring, and controlling the process, thereby enabling the reduction of impacts at the lowest possible cost; and • Hold meetings with managers and executives regarding the treatment of losses within the respective areas, aiming at continuous improvement and the implementation of corrective and preventive actions related to Operational Risk. 40.7. Operational risk Operational risk is represented by the possibility of losses resulting from external events or failure, deficiency, or inadequacy of internal processes, people, or systems. This definition includes the legal risk associated with inadequacy or deficiency in contracts signed by the Organization, sanctions due to non-compliance with legal provisions and compensation for damages to third parties arising from the activities carried out by the Organization. Operational Risk Management Process The Operational Risk Management Policy establishes the principles, guidelines, and responsibilities that ensure the effective identification and management of operational risk, supporting the maintenance of a framework that is appropriate and commensurate with the nature and complexity of the Organization’s activities. The policy guides the monitoring of risk exposures, defines acceptable loss thresholds, and supports the proper allocation of capital. It also promotes the dissemination of a risk‑aware culture among employees and third parties, ensuring that they understand their roles and responsibilities in the identification, assessment, monitoring, control, and mitigation of operational risk, in line with applicable regulatory requirements. Additionally, the policy encompasses mechanisms for assessing risks associated with new products, services, processes, and systems. Operational risk management is conducted on a corporate basis and involves different areas with specific responsibilities, ensuring an efficient structure that enables the proper assessment of risks and supports managers and Senior Management in the decision‑making process. The process comprises stages such as identifying, assessing, and continuously monitoring the operational risks inherent to the Organization’s activities. The management process also considers the regulatory environment, with its main results and aspects reported periodically to Senior Management and the Regulator. These procedures are supported by an internal control system that is independently certified regarding its effectiveness and execution, ensuring compliance with the Organization’s established risk appetite. Operational loss events are analyzed and discussed with the parties involved, including Senior Management, as they not only represent challenges but also provide insights for the continuous improvement of BRADESCO | Consolidated Financial Statements in IFRS 147 Consolidated Financial Statements in IFRS | Notes to the Consolidated Financial Statements processes. These analyses contribute to strengthening risk management and enhancing the Organization’s operational resilience. Operational Risk Measurement Methodology In compliance with BCB Resolution No. 356/23, the Organization calculates the portion of risk‑weighted assets related to Operational Risk using the standardized approach (RWAopad). In addition, it uses internal operational loss data as inputs for determining the economic capital for operational risk based on an internal model. In this context, operational risk events are classified as follows: Operational Risk Events Internal Fraud Damage to physical assets owned or in use by the institution External Fraud Failures in information technology (IT) systems, processes or infrastructure Employment practices and workplace safety Failures in the execution, in meeting deadlines or in the management of the institution's activities Inappropriate practices regarding customers, products and services Situations that lead to the institution's activities interruption or the discontinuance of the services provided Control and Monitoring Operational risk is measured through a structured and centralized system designed to capture, store, consolidate, and manage operational loss data. This solution supports both quantitative and qualitative analyses, impact assessments, management reporting, and the identification of historical patterns, while also serving as an input for the calculation of economic and regulatory capital. Additionally, the Organization uses an integrated risk‑management solution that documents risk analyses, controls, and mitigating actions that support the management of relevant incidents and the review of scenarios used in internal models, contributing to methodological consistency and the prioritization of mitigation initiatives. Internal Communication The preparation and submission of management reports follow the standards established by applicable regulatory requirements and are presented to the Executive Board through risk commissions and committees, as well as to the Board of Directors. These materials consolidate the institutional view of operational risk exposure and support strategic decision‑making. BRADESCO | Consolidated Financial Statements in IFRS 148 Consolidated Financial Statements in IFRS | Notes to the Consolidated Financial Statements This information is reported monthly and includes the monitoring of the Operational Risk Appetite Indicator (RAS), the comparison of budgeted versus actual operational losses, and the analysis of material incidents, in accordance with the materiality criteria set forth in Article 6 of BCB Normative Instruction No. 33/20. Additionally, the results of regulatory and economic capital measurements are submitted to the governance bodies. This process reinforces regulatory adherence and supports the integrated assessment of the level of capital required for adequate risk coverage. Operational Risk Mitigation Strategies For the mitigation of operational risk, the Organization adopts an integrated set of practices that involves the continuous dissemination of risk culture through training, internal campaigns, and capacity‑building initiatives, including for third‑party service providers. This process is complemented by the design and implementation of preventive and predictive controls aligned with the mapping and assessment of critical risks associated with areas, processes, and products. Mitigating actions are conducted in a risk‑oriented manner, supporting decision‑making. Systematic monitoring of the impacts on the Risk Appetite (RAS) is performed through specialized assessments and root‑cause analysis, ensuring an understanding of key drivers and timely corrections. Additionally, the Organization conducts periodic reviews of management processes, strengthening its ability to prevent and detect incidents. The process of capturing, recording, reconciling, and monitoring operational losses ensures traceability, data accuracy, and compliance with applicable regulatory requirements. In 2025, the Organization implemented the RBA – Risk‑Based Approach with the objective of identifying and prioritizing risks, allowing Risk Areas to focus efforts and resources on the most critical topics/processes requiring greater depth. This methodology aims to revise the operational model of Compliance/Internal Controls, promoting operational efficiency and predictive and preventive action, increasing staff seniority with a focus on risk management, business, and data analysis for more assertive decision‑making, as well as integrating the Business Analytics unit to enable greater coverage, expansion of data‑based testing, and more accurate and timely diagnostics. 41) SUPPLEMENTARY PENSION PLANS Bradesco and its subsidiaries sponsor a private defined contribution pension for its employees, including management, that allows financial resources to be accumulated by participants throughout their careers by means of employee and employer contributions and invested in an Exclusive Investment Fund (FIE). The plan is managed by Bradesco Vida e Previdência S.A. and Banco Bradesco S.A. is responsible for the financial management of the FIEs funds. BRADESCO | Consolidated Financial Statements in IFRS 149 Consolidated Financial Statements in IFRS | Notes to the Consolidated Financial Statements The supplementary pension plan counts on contributions from employees and managers of Bradesco and its subsidiaries equivalent to at least 4% of the salary by employees and, 5% of the salary, plus the percentage allocated to covers of risk benefits (invalidity and death) by the company. Actuarial obligations of the defined contribution plan are fully covered by the plan assets of the corresponding FIE. In addition to the plan, in 2001, participants who chose to migrate from the defined benefit plan are guaranteed a proportional deferred benefit, corresponding to their accumulated rights in that plan. For the active participants, retirees and pensioners of the defined benefit plan, now closed to new members, the present value of the actuarial obligations of the plan is fully covered by guarantee assets. Kirton Bank S.A. Banco Múltiplo and Ágora Corretora de Seguros S.A. sponsor supplementary pension plans in the variable contribution and defined benefit modalities, through the Baneb Social Security Foundation – Bases, for Baneb employees. Banco Bradesco S.A. sponsors a supplementary pension plan in the variable contribution format, through Caixa de Assistência e Aposentadoria dos Funcionários do Banco do Estado do Maranhão (Capof), to employees originating from Banco BEM S.A. Banco Bradesco S.A. sponsors a supplementary pension plan in the defined benefit format through Caixa de Previdência Privada Bec – Cabec for employees of Banco do Estado do Ceará S.A. Banco Bradesco S.A., Kirton Bank S.A. Banco Múltiplo, Bradesco Capitalização S.A., Bradescor Corretora de Seguros Ltda., Bradesco Kirton Corretora de Câmbio S.A. and Bradesco Seguros S.A. sponsor a supplementary pension plan in the defined benefit modality, through Multibra Fundo de Pensão, for employees from Banco Bamerindus do Brasil S.A.. Banco Bradesco S.A. also took on the obligations of Kirton Bank S.A. Banco Múltiplo with regard to Life Insurance, Health Insurance Plans, and Retirement Compensation for employees coming from Banco Bamerindus do Brasil S.A., as well the Health Plan of employees from Lloyds. Bradesco and its subsidiaries, as sponsors of these plans, considering economic and actuarial studies, calculated their actuarial commitments using the real interest rate and acknowledged in their financial statements the obligation due. The assets of Pension Plans are invested in compliance with the applicable legislation (government securities and private securities, listed company shares and real estate properties). Below are the main assumptions used by the independent actuary in the actuarial assessment of our plans: Risk factors On December 31 2025 2024 Nominal discount rate 3.50% - 11.32% p.a. 3.50% - 10.94% p.a. Nominal rate of future salary increases 3.50% p.a. 3.50% p.a. Nominal growth rate of social security benefits and plans 3.50% p.a. 3.50% p.a. Initial rate of growth of medical costs 6.92% - 7.64% p.a. 7.23% - 7.64% p.a. Inflation rate 3.50% p.a. 3.50% p.a. Biometric table of overall mortality AT 2000 and BR-EMS AT 2000 and BR-EMS Biometric table of entering disability Per plan Per plan Expected turnover rate - - Probability of entering retirement 100% in the 1ª eligibility to a benefit by the plan 100% in the 1ª eligibility to a benefit by the plan BRADESCO | Consolidated Financial Statements in IFRS 150 Consolidated Financial Statements in IFRS | Notes to the Consolidated Financial Statements Considering the above assumptions, the present value of the actuarial obligations of the benefit plans and of its assets to cover these obligations, is represented below: R$ thousands Retirement Benefits Other post-employment benefits Year ended on December 31 Year ended on December 31 2025 2024 2025 2024 (i) Projected benefit obligations: At the beginning of the year 2,556,966 2,794,954 819,725 857,347 Cost of current service 327 1,179 - - Interest cost 258,434 249,162 83,635 78,223 Participant’s contribution 467 465 - - Actuarial gain/(loss) (1) (11,271) (218,019) 10,232 (65,504) Transfers - (278) - - Past service cost - plan changes (18,286) - - - Early elimination of obligations - (1,284) - - Benefit paid (262,798) (269,280) (52,264) (50,341) At the end of the year 2,523,839 2,556,899 861,328 819,725 (ii) Plan assets at fair value: At the beginning of the year 2,416,615 2,402,006 - - Expected earnings 245,129 214,092 - - Actuarial gain/(loss) (1) (98,294) (125,943) - - Contributions received: - - Employer 56,179 195,343 - - - Employees 467 465 - - Transfers - (134) - - Early elimination of obligations - - - - Benefit paid (262,288) (269,281) - - At the end of the year 2,357,808 2,416,548 - - (iii) Changes in the unrecoverable surplus: At the beginning of the year 62,210 57,939 - - Interest on the irrecoverable surplus 6,642 5,471 - - Change in irrecoverable surplus (1) 986 (1,200) - - At the end of the year 69,838 62,210 - - (iv) Financed position: Deficit plans (2) 235,869 202,561 861,328 819,725 Net balance 235,869 202,561 861,328 819,725 (1) In the year ended December 31, 2025, the remeasurement effects recognized in Other Comprehensive Income, totaled R$(54,773) thousand, (R$87,297 thousand in 2024), net of tax effects; and (2) Bradesco and its subsidiaries, as sponsors of said plans, considering an economic and actuarial study, calculated their actuarial commitments and recognize in their consolidated financial statements the actuarial obligation due. The net cost/(benefit) of the Pension Plans recognized in the consolidated statement of income includes the following components: R$ - thousand Year ended on December 31 2025 2024 Projected benefit obligations: Cost of service (17,958) 977 Cost of interest on actuarial obligations 341,787 327,252 Expected earnings from the assets of the plan (244,914) (214,085) Interest on irrecoverable surplus 6,642 5,469 Net cost/(benefit) of the pension plans 85,557 119,613 As of December 31, 2025, the maturity profile of the present value of the obligations of the defined benefit plans for the next years: BRADESCO | Consolidated Financial Statements in IFRS 151 Consolidated Financial Statements in IFRS | Notes to the Consolidated Financial Statements R$ thousands Retirement Benefits Other postemployment benefits Weighted average duration (years) 7.91 9.53 2026 277,251 65,693 2027 292,614 68,711 2028 295,969 72,796 2029 298,759 76,963 2030 300,824 81,159 After 2031 1,506,457 467,572 In 2026, contributions to defined-benefit plans are expected to total R$23,972 thousand. The long-term rate of return on plan assets is based on the following: - Medium to long-term expectations of the asset managers; and - Public and private securities, with short to long-term maturities which represent a significant portion of the investment portfolios of our subsidiaries, the return on which is higher than inflation plus interest. The assets of pension plans are invested in compliance with the applicable legislation (government securities and private securities, listed company shares and real estate properties) and the weighted-average allocation of the pension plan’s assets by category is as follows: On December 31 Assets of the Alvorada Plan Assets of the Bradesco Plan Assets of the Kirton Plan 2025 2024 2025 2024 2025 2024 Asset categories Equities - - 1.6% 4.9% - - Fixed income 95.6% 95.2% 95.6% 90.5% 100.0% 100.0% Real estate 3.4% 3.8% 1.7% 2.3% - - Other 1.0% 1.0% 1.1% 2.3% - - Total 100.0% 100.0% 100.0% 100.0% 100.0% 100.0% Below is the sensitivity analysis of the benefits plan obligations, showing the impact on the actuarial exposure (6.92% – 11.32% p.a.) assuming a change in the discount rate and medical inflation by 1 b.p.: Rate Discount rate/Medical inflation rate Sensitivity Analysis Effect on actuarial liabilities Effect on the present value of the obligations Discount rate 11.72% - 12.32% Increase of 1 p.p. reduction (237,741) Discount rate 9.72% - 10.32% Decrease of 1 p.p. increase 272,395 Medical Inflation 7.92% - 8.64% Increase of 1 p.p. increase 70,578 Medical Inflation 5.92% - 6.64% Decrease of 1 p.p. reduction (61,359) Bradesco, in its offices abroad, provides pension plans for its employees and managers, in accordance with the standards established by the local authorities, which allows the accrual of financial resources during the professional career of the participant. Total contributions made, in the year ended December 31, 2025, were R$346,851 thousand (R$1,007,631 thousand in 2024). BRADESCO | Consolidated Financial Statements in IFRS 152 Consolidated Financial Statements in IFRS | Notes to the Consolidated Financial Statements 42) OTHER INFORMATION a) On January 16, 2025, Complementary Law No. 214/2025 was enacted, resulting from the conversion of Bill of Complementary Law (PLP) No. 68/2024. This law forms part of the regulatory framework of Constitutional Amendment No. 132/2023, which introduced the Consumption Tax Reform in Brazil. Among other matters, this law provides for the creation of the Goods and Services Tax (Imposto sobre Bens e Serviços – IBS), the Goods and Services Contribution (Contribuição sobre Bens e Serviços – CBS), and the Selective Tax (Imposto Seletivo – IS), representing an important milestone in the reform of consumption taxation. On January 13, 2026, Complementary Law No. 227, derived from PLP No. 108/2024, was enacted, establishing the IBS Management Committee (Comitê Gestor do IBS – CGIBS) and setting forth the general rules for its governance, supervision, collection, and distribution of tax revenues. The standard also established the IBS/CBS tax rates applicable to financial services between 2027 and 2033, providing for a progressive increase from 10.85% to 12.50%. For fees currently subject to ISS, a reduction in the tax rate from 2% to 1.2% is expected over the same period. The Bank continues to monitor the development of the regulatory framework and awaits the issuance of supplementary rules and general regulations by the Brazilian Federal Revenue Service (Receita Federal do Brasil) and the IBS Management Committee, which are necessary for the full implementation of the new tax model. At this stage, it is not possible to reliably measure the impacts arising from these changes. b) On August 8, 2024, we, through our direct subsidiaries, entered into an Investment Agreement with John Deere Brasil S.A. (John Deere Brasil), a wholly owned subsidiary of Deere & Company (USA), one of the global leaders in the supply of agricultural, construction and forestry equipment. Through this agreement, we hold a 50% stake in Banco John Deere S.A. This strategic partnership aims to further strengthen our position in the agribusiness and construction sectors by expanding the supply of financing and financial services to clients and dealers in the acquisition of John Deere Organization’s equipment, parts and services. On February 10, 2025, after fullfilling the usual, legal, and regulatory precedent conditions, the investment was completed. c) On September 1, 2025, Banco Bradesco S.A. (“Bradesco”) announced to its shareholders and the market in general that Atlântica Hospitais e Participações S.A. (“Atlântica”), a company focused on investing in hospitals, an indirect subsidiary of Bradesco and Bradseg Participações S.A., the latter controlling company of the Bradesco Seguros Organization, entered into, on that date, an Investment Agreement with the Rede D’Or São Luiz S.A. Organization (“Rede D’Or”) for the inclusion of Hospital Glória D'Or in the “Atlântica D’Or” hospital network (“Transaction”), thus expanding the partnership entered into with Rede D’Or, announced to the market on May 8 and November 1, 2024 (“Partnership”), maintaining the existing corporate structure, with a 50.01% interest for Rede D’Or and 49.99% for Atlântica. The medical management of Hospital Glória D'Or will be the responsibility of Rede D'Or. The completion of the transaction is subject to the fulfillment of certain conditions precedent, typical of transactions of this nature, including the necessary regulatory approvals. d) On November 10, 2025, Banco Bradesco S.A. (“Bradesco”) announced to its shareholders and the market in general that Atlântica Hospitais e Participações S.A. (“Atlântica”), entered into an Investment Agreement with Grupo Rede D’Or São Luiz S.A. (“Rede D’Or”) for the inclusion of Maternidade São Luiz Star, located in the city of São Paulo/SP, in the BRADESCO | Consolidated Financial Statements in IFRS 153 Consolidated Financial Statements in IFRS | Notes to the Consolidated Financial Statements ‘Atlântica D’Or’ structure (“Transaction”), while maintaining the existing corporate structure, with a shareholding interest of 50.01% for Rede D’Or and 49.99% for Atlântica. The medical management of Maternidade São Luiz Star will remain under Rede D’Or’s responsibility. The completion of the Transaction is subject to the fulfillment of certain customary conditions precedent for transactions of this nature, including the required regulatory approvals. BRADESCO | Consolidated Financial Statements in IFRS 154 Conso lidated Financial Statements | Management Bodies Reporting Date February 4, 2026 Board of Directors Chairman Luiz Carlos Trabuco Cappi Vice Chairman Alexandre da Silva Glüher Members Denise Aguiar Alvarez Maurício Machado de Minas Rubens Aguiar Alvarez Rogério Pedro Câmara Independent Members Samuel Monteiro dos Santos Junior Walter Luís Bernardes Albertoni Paulo Roberto Simões da Cunha Denise Pauli Pavarina Board of Executive Officers Chief Executive Officer Marcelo de Araújo Noronha Executive Vice-Presidents Cassiano Ricardo Scarpelli José Ramos Rocha Neto Guilherme Muller Leal Bruno D´Avila Melo Boetger Executive Officers Roberto de Jesus Paris Oswaldo Tadeu Fernandes Juliano Ribeiro Marcílio André Luís Duarte de Oliveira Cintia Scovine Barcelos de Souza Fernando Freiberger José Augusto Ramalho Miranda Marcos Valério Tescarolo Renata Geiser Mantarro Vinicius Urias Favarão Silvana Rosa Machado Túlio Xavier de Oliveira Francesco Di Marcello Júlio César Bueno Alexandre Panico Carlos Henrique Villela Pedras Officers Affonso Correa Taciro Junior Afranio Carlos Camargo Dantzger Alessandro Zampieri *Alex de Brito Bonifácio Alexandre Cesar Pinheiro Quercia Ana Luisa Rodela Blanco André Costa Carvalho André David Marques André Ferreira Gomes Antonio Campanha Junior Bráulio Miranda Oliveira Bruno Funchal Bruno Rosa Cardoso Clayton Neves Xavier Cristiano Adjuto e Campos Cristina Coelho de Abreu Pinna Daniela Pinheiro de Castro Danilo Luís Damasceno Fábio Monteiro Chehab Fabio Suzigan Dragone Fernando Antônio Tenório Fernando Honorato Barbosa Fernando Julião de Souza Amaral Francisco Armando Aranda *Francisco Henrique França Fernandes *Henrique Leme Pinto Jeferson Ricardo Garcia Honorato José Leandro Borges Juliana Laham Julio Cardoso Paixão Júlio César de Almeida Guedes Leandro José Diniz Leandro Karam Correa Leite Leandro Marçal Araújo Letícia Cardelli Buso Gomes Lucas Nogueira e Nogueira Luís Claudio de Freitas Coelho Pereira Luiz Philipe Roxo Biolchini Manoel Guedes de Araujo Neto Marcelo Souza Ramos Márcio Renato Ribeiro Silva Marco Aurélio Galicioli Marcos Alexandre Pina Cavagnoli Marcos Daniel Boll Marina Bauab Carvalho Werebe Marina Claudia González Martin de Carvalho Marina Gravina Veasey Mateus Pagotto Yoshida Nairo José Martinelli Vidal Júnior Nathalia Lobo Garcia Miranda Patrícia Kessler de Assumpção *Patrícia Soares Martil Rafael Forte Araújo Cavalcanti Rafael Padilha de Lima Costa *Régis Eduardo Prenhaça Carreira *Renato Camargo Nascimento Junior *Ricardo Barbieri de Andrade Ricardo Eleutério da Silva Roberto França Roberto Medeiros Paula Romero Gomes de Albuquerque Rubia Becker Ruy Celso Rosa Filho Soraya Bahde Telma Maria dos Santos Calura Vinícius Panaro Regional Officers Altair Luiz Guarda Amadeu Emilio Suter Neto César Cabús Berenguer Silvany Deborah D’Avila Pereira Campani Santana Edmir José Domingues Hebercley Magno dos Santos Lima José Roberto Guzela Marcelo Magalhães Marcos Alberto Willemann Nelson Pasche Junior Welder Coelho de Oliveira Committees Subordinated to the Board of Directors Statutory Committees Audit Committee Paulo Ricardo Satyro Bianchini – Coordinator Amaro Luiz de Oliveira Gomes – Qualified Member *Rogério Pedro Câmara - Membro Antônio José da Barbara - Member Samuel Monteiro dos Santos Junior - Member Remuneration Committee Alexandre da Silva Glüher - Coordinator Maurício Machado de Minas Samuel Monteiro dos Santos Junior Fabio Augusto Iwasaki (Non-Manager) Non-Statutory Committees Ethics Integrity and Conduct Committee Alexandre da Silva Glüher - Coordinator Maurício Machado de Minas Walter Luís Bernardes Albertoni Rubens Aguiar Alvarez Rogério Pedro Câmara Marcelo de Araújo Noronha Cassiano Ricardo Scarpelli José Ramos Rocha Neto Vinicius Urias Favarão Silvana Rosa Machado Ivan Luiz Gontijo Júnior Affonso Correa Taciro Junior Risk Committee Maurício Machado de Minas - Coordinator Paulo Roberto Simões da Cunha Rogério Pedro Câmara Nomination and Succession Planning Committee Luiz Carlos Trabuco Cappi - Coordinator Alexandre da Silva Glüher Maurício Machado de Minas Marcelo de Araújo Noronha Sustainability and Diversity Committee Rogério Pedro Câmara - Coordinator Alexandre da Silva Glüher Denise Aguiar Alvarez Maurício Machado de Minas Walter Luís Bernardes Albertoni Denise Pauli Pavarina Marcelo de Araújo Noronha Bruno D’Avila Melo Boetger Juliano Ribeiro Marcílio Silvana Rosa Machado André Costa Carvalho Fabiana Costa Tolentino Strategic Committee Alexandre da Silva Glüher - Coordinator Maurício Machado de Minas Samuel Monteiro dos Santos Junior Denise Pauli Pavarina Marcelo de Araújo Noronha Vinicius Urias Favarão Committee Subordinated to the Chief Executive Officer Disclosure Executive Committee André Costa Carvalho - Coordinator Marcelo de Araújo Noronha Cassiano Ricardo Scarpelli José Ramos Rocha Neto Guilherme Muller Leal Roberto de Jesus Paris Oswaldo Tadeu Fernandes Vinicius Urias Favarão Ivan Luiz Gontijo Júnior Antonio Campanha Junior Marina Claudia González Martin de Carvalho Vinícius Panaro Fiscal Council Sitting Members José Maria Soares Nunes Joaquim Caxias Romão Vicente Carmo Santo Ludmila de Melo Souza Ava Cohn Deputy Members Frederico William Wolf Artur Padula Omuro Luiz Eduardo Nobre Borges Mônica Pires da Silva Marcos Aparecido Galende Ombudsman Department Marcos Daniel Boll - Ombudsman General Accounting Department Vinícius Panaro Accountant – CRC 1SP324844/O-6 * election pending approval by BACEN, consequently they did not take office appointment/election pending approval by they did not take office KPMG Auditores Independentes Ltda., uma sociedade simples brasileira, de responsabilidade limitada e firma-membro da organização global KPMG de firmas-membro independentes licenciadas da KPMG International Limited, uma empresa inglesa privada de responsabilidade limitada. KPMG Auditores Independentes Ltda., a Brazilian limited liability company and a member firm of the KPMG global organization of independent member firms affiliated with KPMG International Limited, a private English company limited by guarantee. 1 KPMG Auditores Independentes Ltda. Rua Verbo Divino, 1400, Conjunto Térreo ao 801 - Parte, Chácara Santo Antônio, CEP 04719-911, São Paulo - SP Caixa Postal 79518 - CEP 04707-970 - São Paulo - SP - Brasil Telefone +55 (11) 3940-1500 kpmg.com.br Independent Auditors’ Report on the Audit of the Consolidated Financial Statements To The Board of Directors and Shareholders of Banco Bradesco S.A. Osasco – SP Opinion We have audited the consolidated financial statements of Banco Bradesco S.A. and its subsidiaries (“Bank” or “Bradesco”), which comprise the consolidated statement of financial position as of December 31, 2025, the consolidated statements of income, comprehensive income, changes in equity and cash flows for the year then ended, and notes, comprising material accounting policies and other explanatory information. In our opinion, the accompanying consolidated financial statements present fairly, in all material respects, the consolidated financial position of Bradesco as of December 31, 2025, and its consolidated financial performance and its consolidated cash flows for the year then ended in accordance with IFRS Accounting Standards as issued by the International Accounting Standards Board (IFRS Accounting Standards). Basis for opinion We conducted our audit in accordance with Brazilian and International Standards on Auditing. Our responsibilities under those standards are further described in the “Auditors’ Responsibilities for the Audit of the consolidated financial statements” section of our report. We are independent of Bradesco in accordance with the relevant ethical requirements included in the Accountant´s Professional Ethics Code and the professional standards issued by the Brazilian Federal Accounting Council, applicable to audits of consolidated financial statements of public interest entities in Brazil and wee have fulfilled our other ethical responsibilities in accordance with these requirements. We believe that the audit evidence we have obtained is sufficient and appropriate to provide a basis for our opinion. Key Audit Matters Key audit matters are those matters that, in our professional judgment, were of most significance in our audit of the consolidated financial statements of the current year. These matters were addressed in the context of our audit of the consolidated financial statements as a whole, and in forming our opinion thereon, and we do not provide a separate opinion on these matters. KPMG Auditores Independentes Ltda., uma sociedade simples brasileira, de responsabilidade limitada e firma-membro da organização global KPMG de firmas-membro independentes licenciadas da KPMG International Limited, uma empresa inglesa privada de responsabilidade limitada. KPMG Auditores Independentes Ltda., a Brazilian limited liability company and a member firm of the KPMG global organization of independent member firms affiliated with KPMG International Limited, a private English company limited by guarantee. 2 Assessment of the allowance for expected credit losses on financial assets As discussed in notes 2d viii, 4, 8d, 9c, 10, 11, 38 and 40.2 to the consolidated financial statements, the Bank has R$ 57,196,980 thousand of allowance for expected credit losses (ECL) related to financial assets contracts as of December 31, 2025, as detailed in note 40.2. The Bank recognizes a lifetime ECL for those contracts that have experienced a Significant Increase in Credit Risk (SICR) subsequent to the initial recognition or are credit impaired (stage 2 and 3, respectively), and a 12-month ECL for all other contracts (stage 1). The Bank calculates ECL either on a collective basis, using models, or, for certain significant exposures, on an individual basis, estimating the future cash flows including the value of related collateral. To calculate ECL on a collective basis the Bank segregates the portfolio of contracts on the basis of shared credit risk characteristics and uses models to estimate the Probability of Default (PD), the Loss Given Default (LGD) and the Exposure at Default (EAD) as well as to identify relevant macroeconomic variables and estimate the impact of projections of those macroeconomic variables. The Bank forecasts multiple economic scenarios for these macroeconomic variables and considers each scenario according to the probability assigned to them. We identified the assessment of the allowance for ECL as a key audit matter, since the ECL estimate involves significant measurement uncertainty, primarily as a result of the complexity of the models and the subjectivity of the assumptions. These uncertainties included: (i) the overall ECL methodology, inclusive of the models used to estimate the PDs , EADs and LGDs and the segmentation of contracts by shared credit risk characteristics; (ii) the projections for the macroeconomic variables in the future economic scenarios and the respective weighting of each scenario according to the probability assigned to them; (iii) the definition of a SICR (stage 2) and financial assets that are credit impaired (stage 3); and, (iv) for ECL calculated on an individual basis, the expected cash flows including the related collateral valuation. How our audit approached this matter The following are the primary procedures we performed to address this key audit matter: • We evaluated the design and tested the operating effectiveness of certain internal controls related to the Bank’s ECL process. This included controls related to: (i) the overall design of the ECL methodology, including the Bank´s definition of a SICR (stage 2) and financial assets that are credit impaired (stage 3); (ii) the design of the models and assumptions used to estimate PD, EAD, LGD, including the determination of the basis for segregation of contracts by shared credit risk characteristics within these models, and the models used to identify the relevant macroeconomic variables and estimate their quantitative impact; (iii) the independent validation of models and definition of probability of each scenario used to calculate the ECL; (iv) the calculation of the ECL estimate; and (v) the projection of expected cash flows, including related collateral values, for ECL calculated on an individual basis; KPMG Auditores Independentes Ltda., uma sociedade simples brasileira, de responsabilidade limitada e firma-membro da organização global KPMG de firmas-membro independentes licenciadas da KPMG International Limited, uma empresa inglesa privada de responsabilidade limitada. KPMG Auditores Independentes Ltda., a Brazilian limited liability company and a member firm of the KPMG global organization of independent member firms affiliated with KPMG International Limited, a private English company limited by guarantee. 3 • We involved professionals with specialized skills and knowledge in credit risk, who assisted in: (i) evaluating the overall ECL methodology through the review of the models based on the technical requirements and in compliance with IFRS Accounting Standards; (ii) testing the accuracy of the Bank´s PDs, EADs and LGDs in identifying relevant macroeconomic variables and estimating their quantitative impact, by inspecting the model documentation to determine whether they are suitable for their intended use; (iii) evaluating the Bank's definition of a SICR by assessing relevant Company-specific metrics and comparing it to the applicable industry and regulatory practices; (iv) checking the accuracy of the Bank’s estimates of PDs, EADs and LGDs using the Bank’s historical data and defined methodologies; (v) evaluating the basis for the segregation of contracts by shared credit risk characteristics used in the estimation of PD, EAD, LGD by observing historical correlations; (vi) evaluating the reasonableness of the macroeconomic variables considered in the future scenarios by regression analysis of the historical correlation of these variables and credit risk and (vii) reperformance of the quantitative assessment applying the percentage impact of each scenario that were independently validated; • We compared the macroeconomic variables projected by the Bank in the future economic scenarios with independent third-party projections. For a selection of contracts with ECL calculated on an individual basis, we assessed the assumptions and inspected the related documentation used by the Bank to determine the expected cash flows, including those from collateral; and • For a sample of financial asset contracts, we assessed adherence to internal policies on the identification of significant increase in credit risk and the classification of financial instruments in stages 2 and 3. Based on the evidence obtained through the procedures summarized above, we consider adequate the allowance for expected credit losses on financial assets, in the context of the consolidated financial statements taken as a whole, for the year ended December 31, 2025. Evaluation of the measurement of provisions and the disclosure of contingent liabilities As discussed in notes 2k, 4 and 22 to the consolidated financial statements, the Bank is a defendant in tax, civil and labor legal matters for which it has provisions of R$ 6,749,842 thousand, R$ 6,918,859 thousand and R$ 4,361,652 thousand and disclosure of contingent liabilities classified as possible losses in the amount of R$ 43,095,893 thousand, R$ 11,124,335 thousand and R$ 1,456,696 thousand, respectively, as of December 31, 2025. In determining provisions for legal matters, such as those related to the legality and constitutionality of certain taxes, indemnity claims for alleged moral and economic damages arising from the Bank’s actions in the course of providing banking products and services, including the submission of information about non-payment by debtors to credit bureaus, adjustments for inflation on savings account balances due to the implementation of economic plans by the Federal Government, certain other specific civil legal matters and labor legal matters filed by former employees and third parties seeking compensation, in each case, the Bank applies judgment to determine the likelihood of loss and estimate the amount involved. KPMG Auditores Independentes Ltda., uma sociedade simples brasileira, de responsabilidade limitada e firma-membro da organização global KPMG de firmas-membro independentes licenciadas da KPMG International Limited, uma empresa inglesa privada de responsabilidade limitada. KPMG Auditores Independentes Ltda., a Brazilian limited liability company and a member firm of the KPMG global organization of independent member firms affiliated with KPMG International Limited, a private English company limited by guarantee. 4 We identified the evaluation of the measurement of provisions and the disclosure of contingent liabilities for legal matters as a key audit matter. The evaluation required challenging auditor judgment due to the subjective nature of the estimates and judgments made by the Bank in determining the likelihood of loss and estimating the amount of any such loss. How our audit approached this matter The following are the primary procedures we performed to address this key audit matter: • We evaluated the design and tested the operating effectiveness of certain internal controls related to the evaluation and measurement of the provisions and disclosures for legal matters. This included controls related to the assessment of information received from external and internal legal advisors on legal matters; • We obtained and read letters received directly from the Bank’s external legal counsel for certain tax legal matters, and the documentation prepared by the internal legal counsel for certain civil and labor legal matters, which included an assessment of the likelihood of loss and an estimate of the amount of such loss. For other civil and labor legal matters, we assessed the reasonableness of the assumptions used to classify the probability of loss. We compared these assessments and estimates with those used by the Bank, and considered historical data and information related to the legal matters in question in order to evaluate the provisions and disclosures made in relation to these matters; and • We involved tax professionals with specialized skills and knowledge, who assisted in the assessment of the likelihood and estimate of loss of certain specific tax legal matters based on the technical merits of the Bank’s position and the supporting documentation. Based on the evidence obtained through the procedures summarized above, we consider the measurement of provisions and the disclosure of contingent liabilities to be adequate, in the context of the consolidated financial statements taken as a whole, for the year ended December 31, 2025. Assessment of the recoverability of deferred tax assets As discussed in notes 2p, 4 and 37c to the consolidated financial statements, the Bank has R$ 116,722,693 thousand of deferred tax assets as of December 31, 2025. The Bank recognizes these deferred tax assets to the extent that it is probable that future taxable profits will be available against which the deferred tax assets can be utilized. The Bank’s estimates of future taxable profits are based on its business plans and budgets which require the Bank to make a number of assumptions related to future events and conditions. Changes in certain assumptions about the future, such as growth rates of the principal lines of business, interest rates and foreign exchange rates, could have a significant impact on these estimates and, consequently, on the recoverability of deferred tax assets. We identified the assessment of the recoverability of deferred tax assets as a key audit matter. The evaluation of the estimates of future taxable profit and the underlying assumptions, required subjective auditor judgment because of the sensitivity of the estimate to minor changes in the assumptions and the degree of subjectivity associated with those assumptions. KPMG Auditores Independentes Ltda., uma sociedade simples brasileira, de responsabilidade limitada e firma-membro da organização global KPMG de firmas-membro independentes licenciadas da KPMG International Limited, uma empresa inglesa privada de responsabilidade limitada. KPMG Auditores Independentes Ltda., a Brazilian limited liability company and a member firm of the KPMG global organization of independent member firms affiliated with KPMG International Limited, a private English company limited by guarantee. 5 How our audit approached this matter The following are the primary procedures we performed to address this key audit matter: • We evaluated the design and tested the operating effectiveness of certain internal controls over the process to estimate future taxable profits. This included controls related to the development and approval of key assumptions for the budget and the final estimates of future taxable profits; and • We involved professionals with specialized skills and knowledge in corporate finance, who assisted in assessing the assumptions, including the growth rates of the principal lines of business, interest rates and foreign exchange rates underlying the Bank’s estimate of future taxable profits as of December 31, 2025. We evaluated the Bank’s ability to accurately project taxable profits by comparing the estimated taxable profits for the year ended December 31, 2025 made in the prior year with actual taxable profits in 2025. Based on the evidence obtained through the procedures summarized above, we consider the assessment of the recoverability of deferred tax assets to be adequate in the context of the consolidated financial statements taken as a whole, for the year ended December 31, 2025. Measurement of certain liabilities from insurance contracts issued under the general measurement and the variable fee approach model As disclosed in notes 2l, 4 and 21 to the consolidated financial statements, the Bank has R$ 400,033,295 thousand of insurance liabilities measured under the general measurement model (BBA) and the variable fee approach (VFA) as of December 31, 2025. These insurance liabilities are measured as the sum of the fulfillment cash flows and, when applicable, the contractual service margin. The fulfillment cash flows comprise an estimate of the expected cash flows that will arise within the boundaries of the insurance contract, including for the payment of claims and benefits, adjusted for the time value of money and an explicit risk adjustment related to the non-financial risk. Insurance liabilities are the output of a complex set of models. The estimation of the fulfillment cash flows are determined using models and actuarial methodologies which require assumptions including those related to longevity, income conversion, discount rates and expected future loss ratios. We identified the evaluation of the measurement of insurance liabilities measured under the general measurement model (BBA) and the variable fee approach (VFA) as a key audit matter. Complex auditor judgment was required to evaluate the measurement of these insurance liabilities as they involve significant measurement uncertainties as a result of the complexity of the models and actuarial methodologies, specifically those used to determine longevity, income conversion, discount rates and expected future loss ratios. Minor changes in these assumptions could result in significant changes in the measurement of these insurance liabilities. In addition, the audit effort associated with the evaluation of the measurement of these insurance liabilities required the involvement of professionals with specialized skills and knowledge of actuarial science. KPMG Auditores Independentes Ltda., uma sociedade simples brasileira, de responsabilidade limitada e firma-membro da organização global KPMG de firmas-membro independentes licenciadas da KPMG International Limited, uma empresa inglesa privada de responsabilidade limitada. KPMG Auditores Independentes Ltda., a Brazilian limited liability company and a member firm of the KPMG global organization of independent member firms affiliated with KPMG International Limited, a private English company limited by guarantee. 6 How our audit addressed this matter The following are the primary procedures we performed to address this key audit matter: • We evaluated the design and tested the operating effectiveness of certain internal controls related to the measurement of insurance liabilities measured under the general measurement model (BBA) and the variable fee approach (VFA). This included controls related to the development and approval of the models and methodologies for determining longevity, income conversion, discount rates and expected future loss ratio. • We involved professionals with specialized skills and knowledge of actuarial science who assisted in: (i) evaluating the overall methodology for the measurements of insurance contracts liabilities for compliance with IFRS Accounting Standards; (ii) assessing the conceptual soundness of the models and modelling techniques, including those assumptions used to determine longevity, income conversion, discount rates and expected future loss ratios by inspecting the model documentation to determine whether the models are suitable for their intended use; (iii) testing the reasonableness of the assumptions related to expected future loss ratios by using independently developed models and the Bank’s historic data to estimate these assumptions and comparing them to the Bank’s assumptions; (iv) checking the accuracy of the Bank’s models to estimate longevity, discount rates and income conversion rates; and (v) evaluating the reasonableness of the assumptions regarding longevity, discount rates and income conversion rates by comparing them to the applicable industry and regulatory practices. Based on the evidence obtained through the above procedures, we consider to be adequate the measurement of certain liabilities from insurance contracts issued under the general measurement and the variable fee approach model in the context of the consolidated financial statements taken as a whole, for the year ended December 31, 2025 Other information that accompanies the consolidated financial statements and the auditors’ report Bradesco’s management is responsible for the other information. The other information comprises the Management´s Report. Our opinion on the consolidated financial statements does not cover other information, and we do not express any form of assurance conclusion thereon. In connection with our audit of the consolidated financial statements, our responsibility is to read the other information and, in doing so, consider whether the other information is materially inconsistent with the consolidated financial statements or our knowledge obtained in the audit, or otherwise appears to be materially misstated. If, based on the work we have performed, we conclude that there is a material misstatement of this other information, we are required to report that fact. We have nothing to report in this regard. KPMG Auditores Independentes Ltda., uma sociedade simples brasileira, de responsabilidade limitada e firma-membro da organização global KPMG de firmas-membro independentes licenciadas da KPMG International Limited, uma empresa inglesa privada de responsabilidade limitada. KPMG Auditores Independentes Ltda., a Brazilian limited liability company and a member firm of the KPMG global organization of independent member firms affiliated with KPMG International Limited, a private English company limited by guarantee. 7 Responsibilities of Management and those charged with governance for the consolidated financial statements Management is responsible for the preparation and fair presentation of the consolidated financial statements in accordance with IFRS Accounting Standards, as issued by the International Accounting Standards Board (“IASB”) and for such internal controls as management determines is necessary to enable the preparation of consolidated financial statements that are free from material misstatement whether due to fraud or error. In preparing the consolidated financial statements, Management is responsible for assessing Bradesco’s ability to continue as a going concern, disclosing, as applicable, matters related to going concern and using the going concern basis of accounting, unless management either intends to liquidate Bradesco or to cease operations, or has no realistic alternative but to do so. Those charged with governance are responsible for overseeing Bradesco´s financial reporting process. Auditors’ responsibilities for the audit of the consolidated financial statements Our objectives are to obtain reasonable assurance about whether the consolidated financial statements as a whole are free from material misstatement, whether due to fraud or error, and to issue an auditors’ report that includes our opinion. Reasonable assurance is a high level of assurance but is not a guarantee that an audit conducted in accordance with Brazilian and International Standards on Auditing will always detect a material misstatement when it exists. Misstatements can arise from fraud or error and are considered material if, individually or in the aggregate, they could reasonably be expected to influence the economic decisions of users taken on the basis of these consolidated financial statements. As part of an audit in accordance with Brazilian and International Standards on Auditing, we exercise professional judgment and maintain professional skepticism throughout the audit. We also: • identify and assess the risks of material misstatement of the consolidated financial statements, whether due to fraud or error, design and perform audit procedures responsive to those risks, and obtain audit evidence that is sufficient and appropriate to provide a basis for our opinion. The risk of not detecting material misstatement resulting from fraud is higher than for one resulting from error, as fraud may involve collusion, forgery, intentional omissions, misrepresentations, or the override of internal controls. • obtain an understanding of internal control relevant to the audit in order to design audit procedures that are appropriate in the circumstances, but not for the purpose of expressing an opinion on the effectiveness of Bradesco´s internal control. • evaluate the appropriateness of accounting policies used and the reasonableness of accounting estimates and related disclosures made by Management. KPMG Auditores Independentes Ltda., uma sociedade simples brasileira, de responsabilidade limitada e firma-membro da organização global KPMG de firmas-membro independentes licenciadas da KPMG International Limited, uma empresa inglesa privada de responsabilidade limitada. KPMG Auditores Independentes Ltda., a Brazilian limited liability company and a member firm of the KPMG global organization of independent member firms affiliated with KPMG International Limited, a private English company limited by guarantee. 8 • conclude on the appropriateness of management’s use of the going concern basis of accounting and, based on the audit evidence obtained, whether a material uncertainty exists related to events or conditions that may cast significant doubt on Bradesco’s ability to continue as a going concern. If we conclude that a material uncertainty exists, we are required to draw attention in our auditor’s report to the related disclosures in the consolidated financial statements, or if such disclosures are inadequate, to modify our opinion. Our conclusions are based on the audit evidence obtained up to the date of our auditors’ report. However, future events or conditions may cause Bradesco to cease to continue as a going concern. • evaluate the overall presentation, structure and content of the consolidated financial statements, including the disclosures, and whether the consolidated financial statements represent the underlying transactions and events in a manner that achieves fair presentation. • plan and perform the group audit to obtain sufficient appropriate audit evidence regarding the financial information of the entities or business units within the group as a basis for forming an opinion on the group consolidated financial statements. We are responsible for the direction, supervision and review of the audit work performed for purposes of the group audit. We remain solely responsible for our audit opinion. We communicate with those charged with governance regarding, among other matters, the planned scope and timing of the audit and significant audit findings, including any significant deficiencies in internal control that we identify during our audit. We also provide those charged with governance with a statement that we have complied with relevant ethical requirements regarding independence and communicate with them all relationships and other matters that may reasonably be thought to bear on our independence, and where applicable, actions taken to eliminate threats or safeguards applied. From the matters communicated with those charged with governance, we determine those matters that were of most significance in the audit of the consolidated financial statements of the current year and are therefore the key audit matters. We describe these matters in our auditors’ report unless law or regulation precludes public disclosure about the matter or when, in extremely rare circumstances, we determine that a matter should not be communicated in our report because the adverse consequences of doing so would reasonably be expected to outweigh the public interest benefits of such communication. São Paulo, February 04, 2026 KPMG Auditores Independentes Ltda. CRC 2SP-014428/O-6 Original report in Portuguese signed by Cláudio Rogélio Sertório Accountant CRC 1SP212059/O-0 BRADESCO | Consolidated Financial Statements in IFRS 163 Consolidated Financial Statements in IFRS | Audit Committee Report Bradesco Conglomerate Audit Committee’s Report on the Consolidated Financial Statements prepared in the Fiscal Year ended on December 31, 2025, in accordance with the International Financial Reporting Standards (IFRS) In addition to the Audit Committee’s Report related to the Consolidated Financial Statements of Banco Bradesco S.A. of the Fiscal Year ended on December 31, 2025, prepared in conformity with accounting rules adopted in Brazil, applicable to institutions authorized by the Central Bank of Brazil, issued on February 4, 2026, we have also analyzed the complete set of Consolidated Financial Statements, prepared in accordance with the International Financial Reporting Standards (IFRS) issued by the International Accounting Standards Board (IASB). As mentioned in the report referred to above, our analysis has taken into consideration the work carried out by the independent auditors and the internal controls systems maintained by the various areas of the Bradesco Conglomerate, mainly the Global Internal Audit, Financial Risk Management, Compliance and Non-Financial Risk Management, Cyber Risk and Operational Resilience and Corporate Risk Management areas. The Management has the responsibility of defining and implementing accounting and management information systems used to prepare the financial statements of the companies that comprise the Bradesco Conglomerate, in compliance with Brazilian and international accounting practices. The Management is also responsible for the processes, policies and procedures for internal controls that ensure the safeguarding of assets, timely recognition of liabilities and risk management of transactions of the Bradesco Organization. The Independent Audit is responsible for examining the Consolidated Financial Statements, in compliance with the requirements established in the Brazilian and international auditing standards and issuing a report on the proper presentation of the Consolidated Financial Statements, in all relevant aspects, in accordance with the applicable IFRS. It is the responsibility of the Global Internal Audit to assess the quality of Bradesco Organization’s internal control systems and the adequacy of the policies and procedures defined by the Management, including those used to prepare accounting and financial reports. The Audit Committee is responsible for evaluating the quality and effectiveness of the Internal and Independent audits, and the fitting of the internal control systems, as well as for analyzing the set of the financial statements in order to issue, when applicable, pertinent recommendations. Based on the review and discussions mentioned above, the Audit Committee recommends to the Board of Directors the approval of the Consolidated Financial Statements audited by KPMG Auditores Independentes, related to the Fiscal Year ended on December 31, 2025, prepared according to the International Financial Reporting Standards (IFRS). Cidade de Deus, Osasco, SP, February 4, 2026 PAULO RICARDO SATYRO BIANCHINI (Coordinator) AMARO LUIZ DE OLIVEIRA GOMES (Financial Specialist) ANTONIO JOSÉ DA BARBARA (Member) SAMUEL MONTEIRO DOS SANTOS JUNIOR (Member) BRADESCO | Consolidated Financial Statements in IFRS 164 Consolidated Financial Statements in IFRS | Fiscal Council’s Report The Fiscal Council’s members, in the exercise of their legal and statutory attributes, have examined the Management Report and the Consolidated Financial Statements of Banco Bradesco S.A. (Bradesco), related to the fiscal year ended on December 31, 2025 and, based on the information received in meetings with: (i) administrators and area managers; (ii) Audit Committee and in its reports; and (iii) KPMG Auditores Independentes and in its reports, concluded that the cited documents examined adequately reflect Bradesco's equity and financial situation and that internal controls are appropriate to the size and complexity of their businesses. In view of the report, the Fiscal Council’s members give their opinion that the Management Report and Consolidated Financial Statements of Bradesco, for the fiscal year ended December 31, 2025, are in suitable conditions to be assessed by its shareholders at the next Annual Shareholders’ Meeting. Cidade de Deus, Osasco, SP, February 4, 2026 José Maria Soares Nunes Joaquim Caxias Romão Vicente Carmo Santo Ludmila de Melo Souza Ava Cohn For further information, please contact: André Carvalho Investor Relations Officer investors@bradesco.com.br Cidade de Deus, s/n – Red Building – 2nd floor Osasco-SP Brazil banco.bradesco/ri
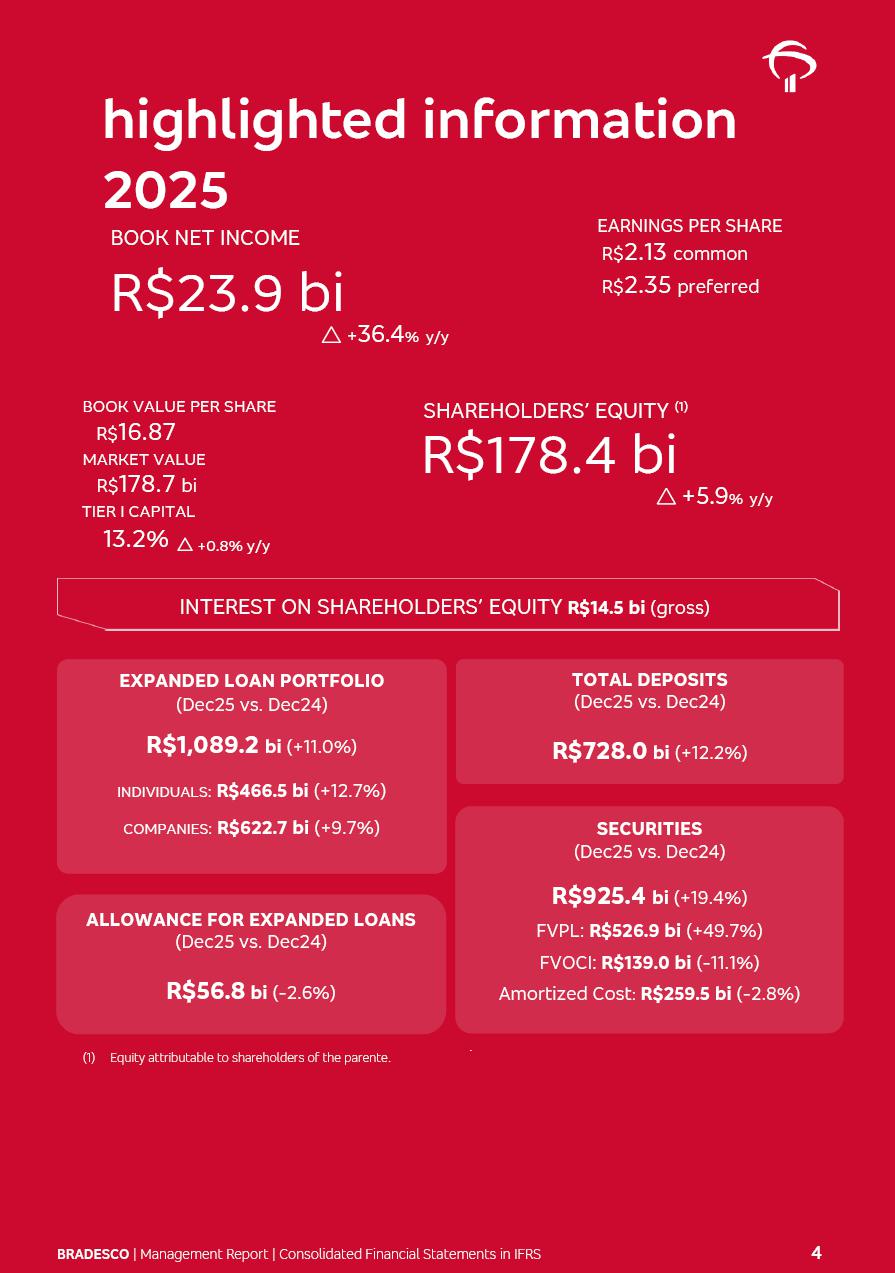
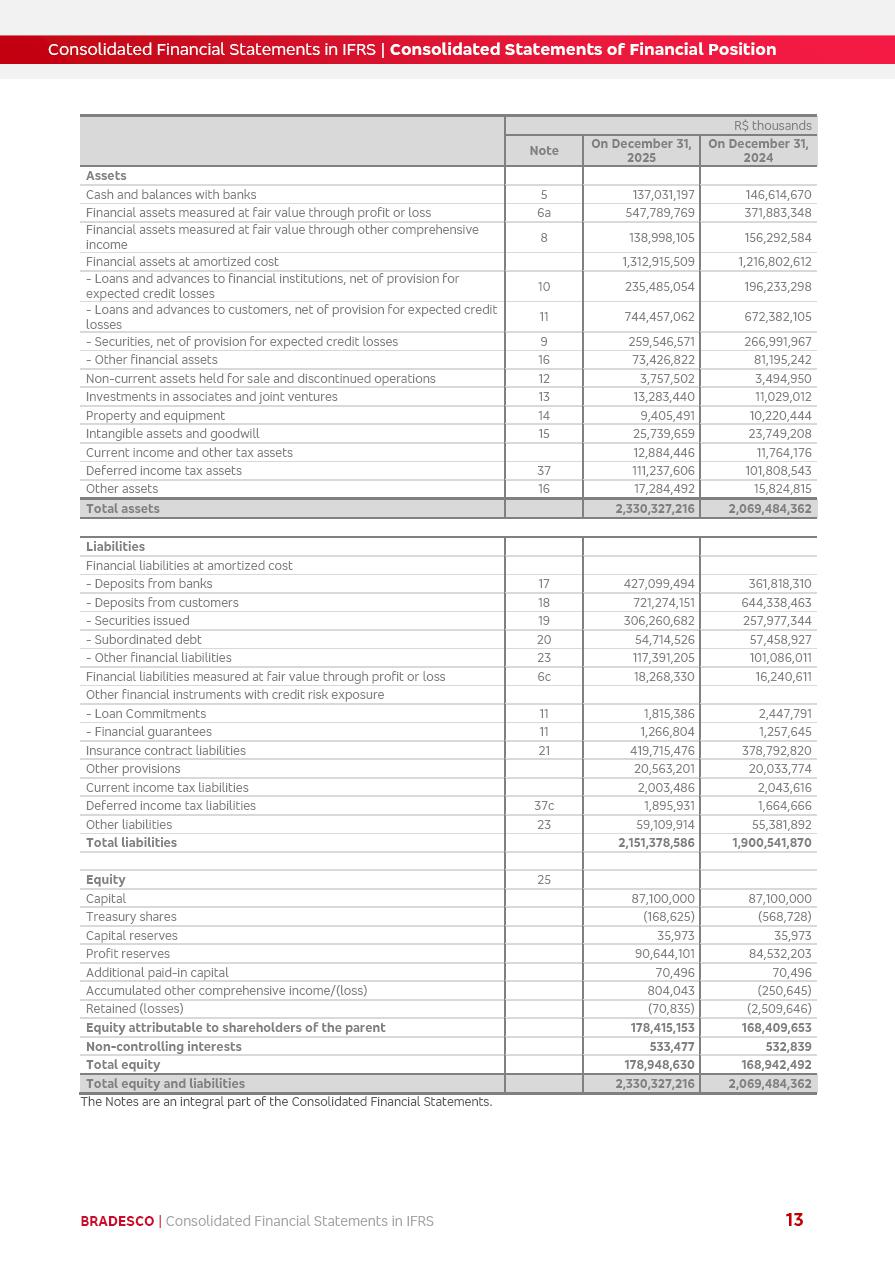
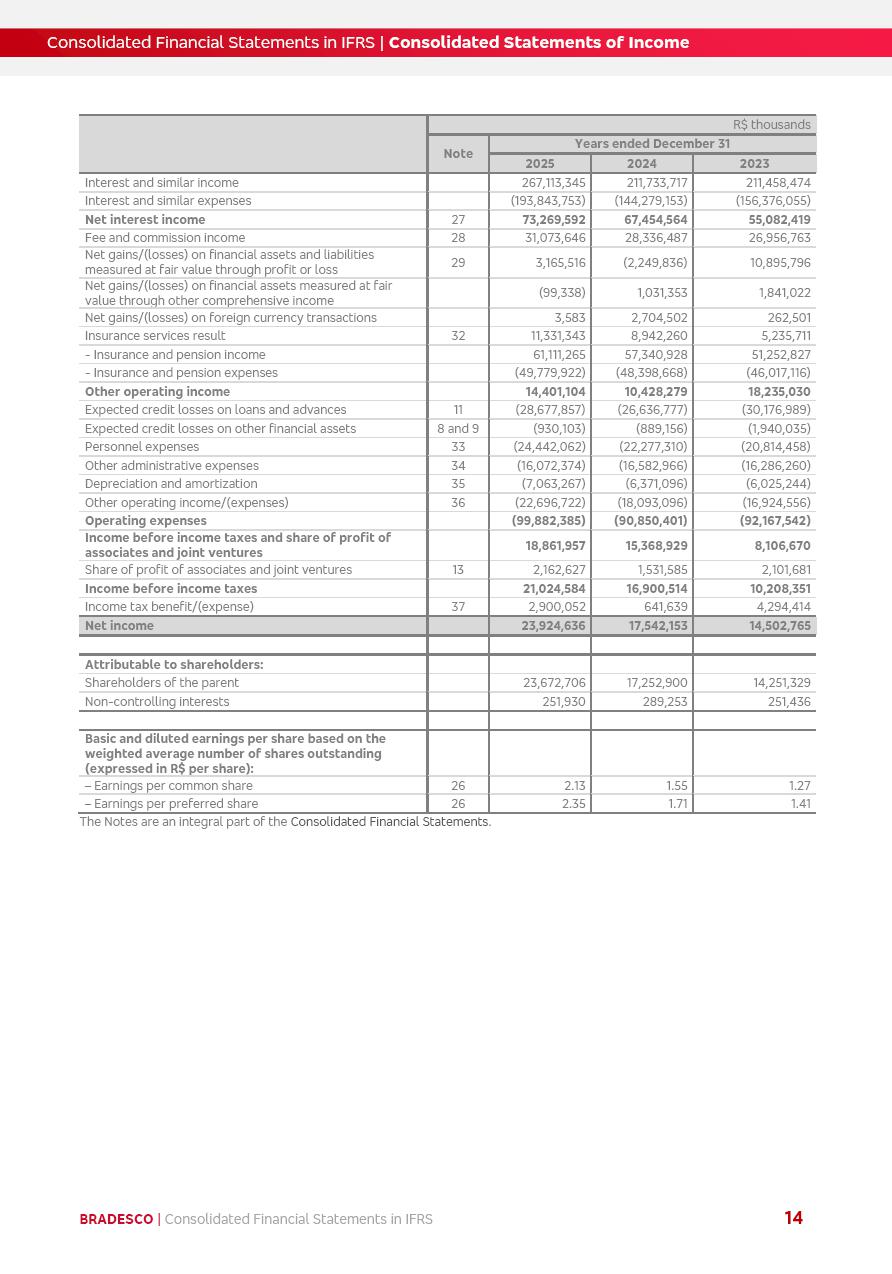
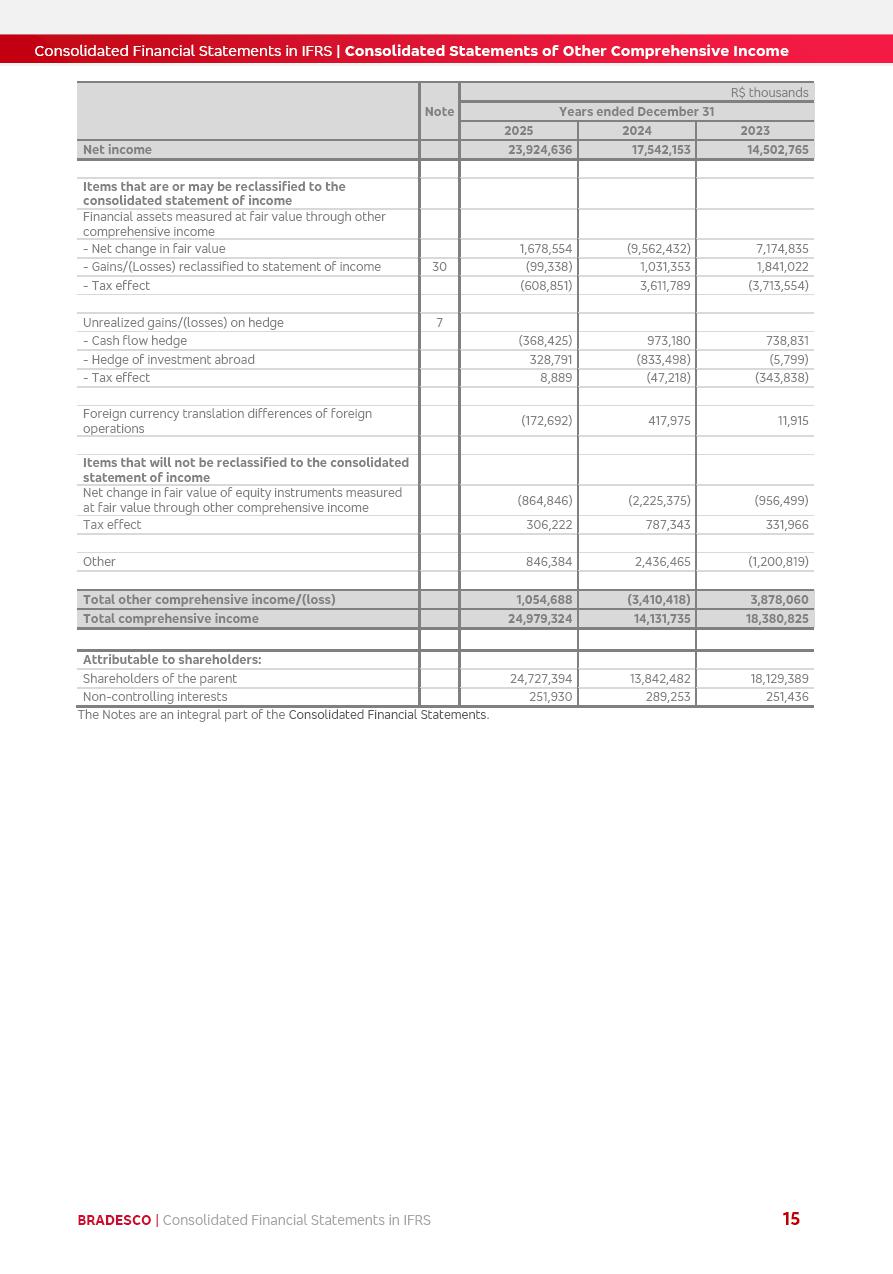
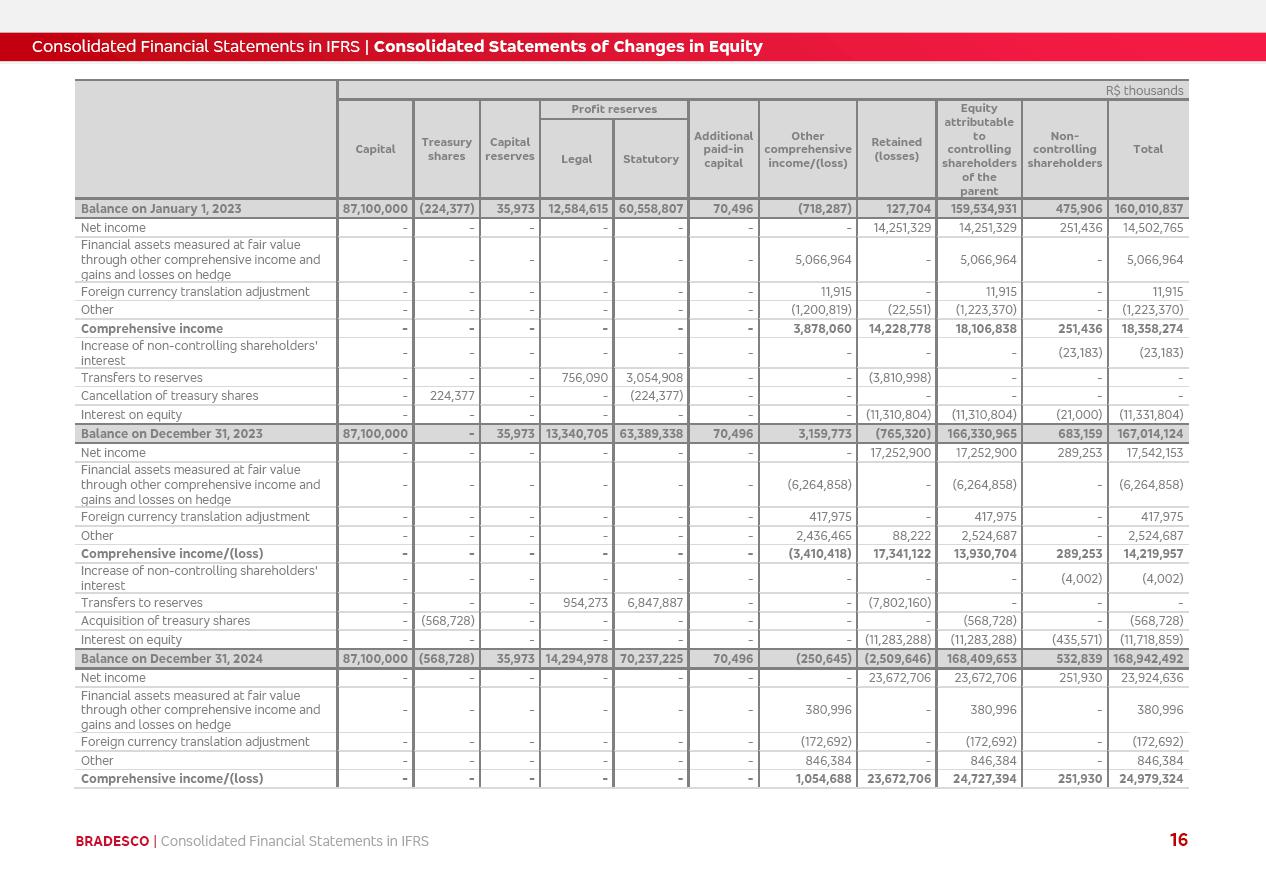
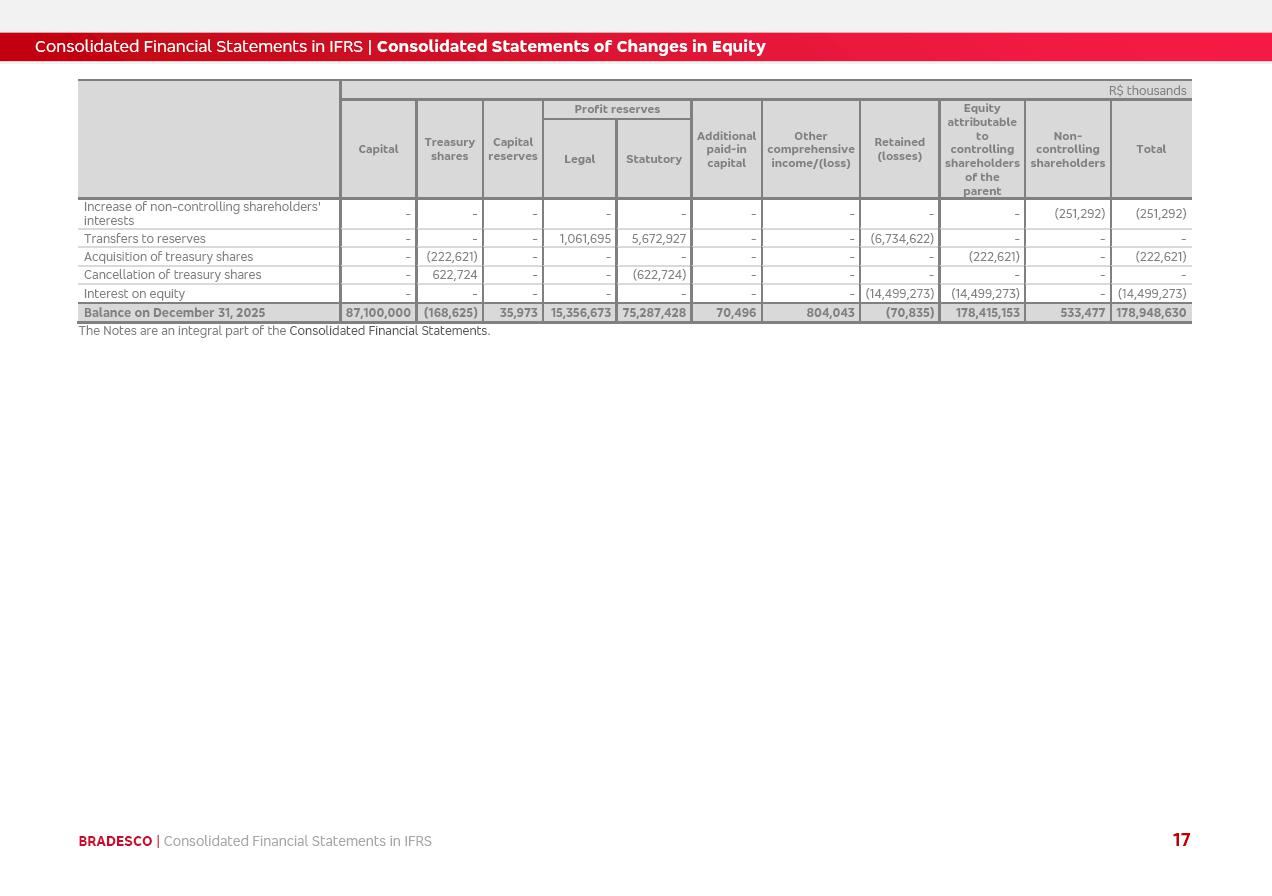
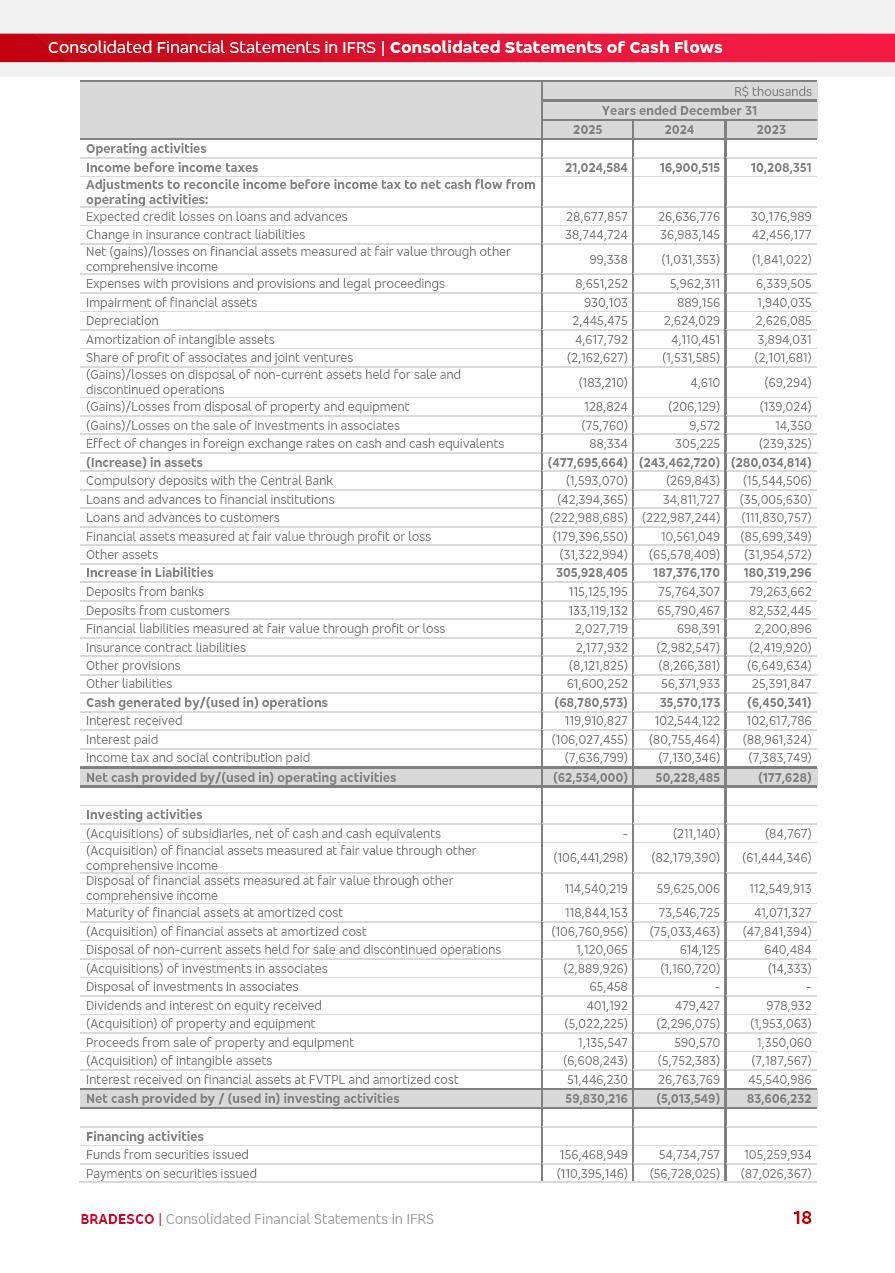
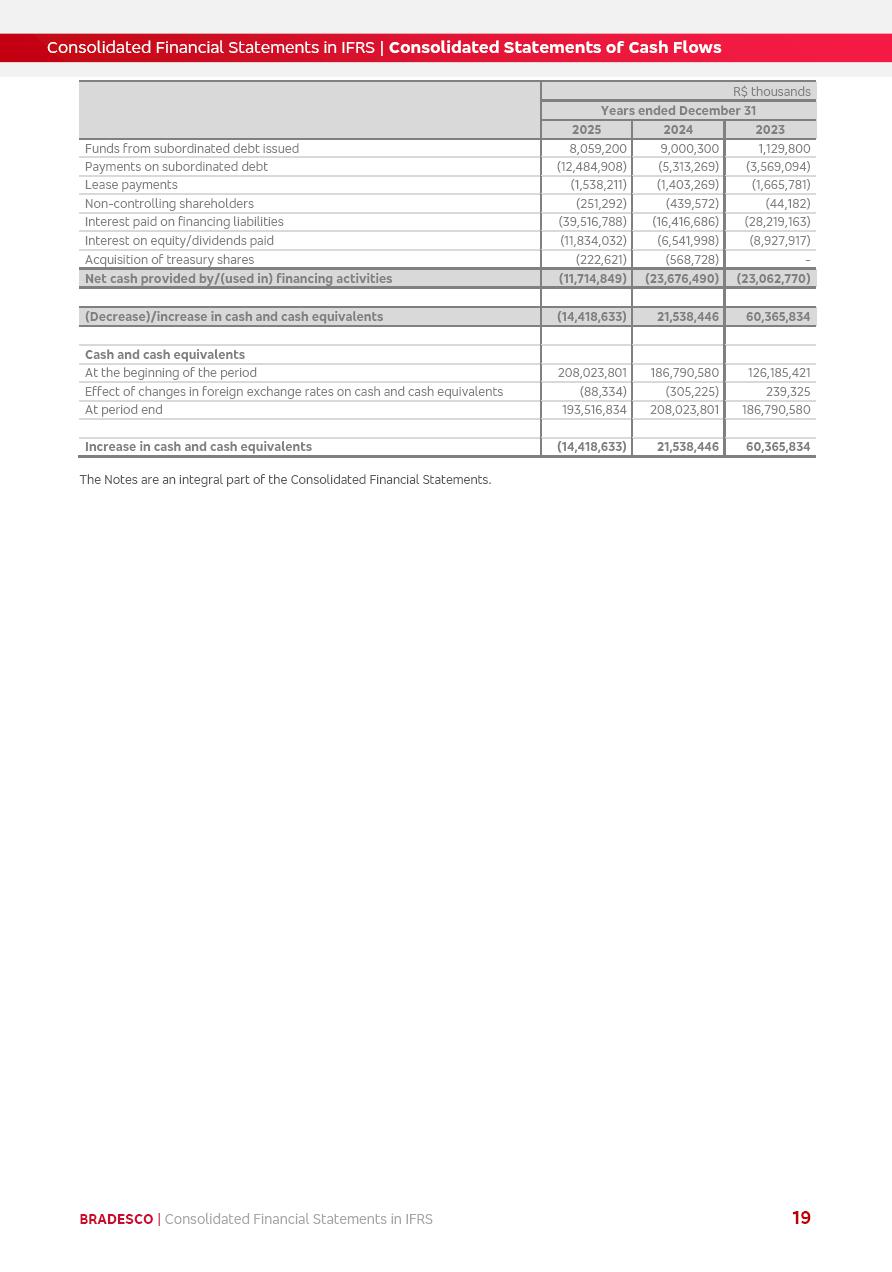
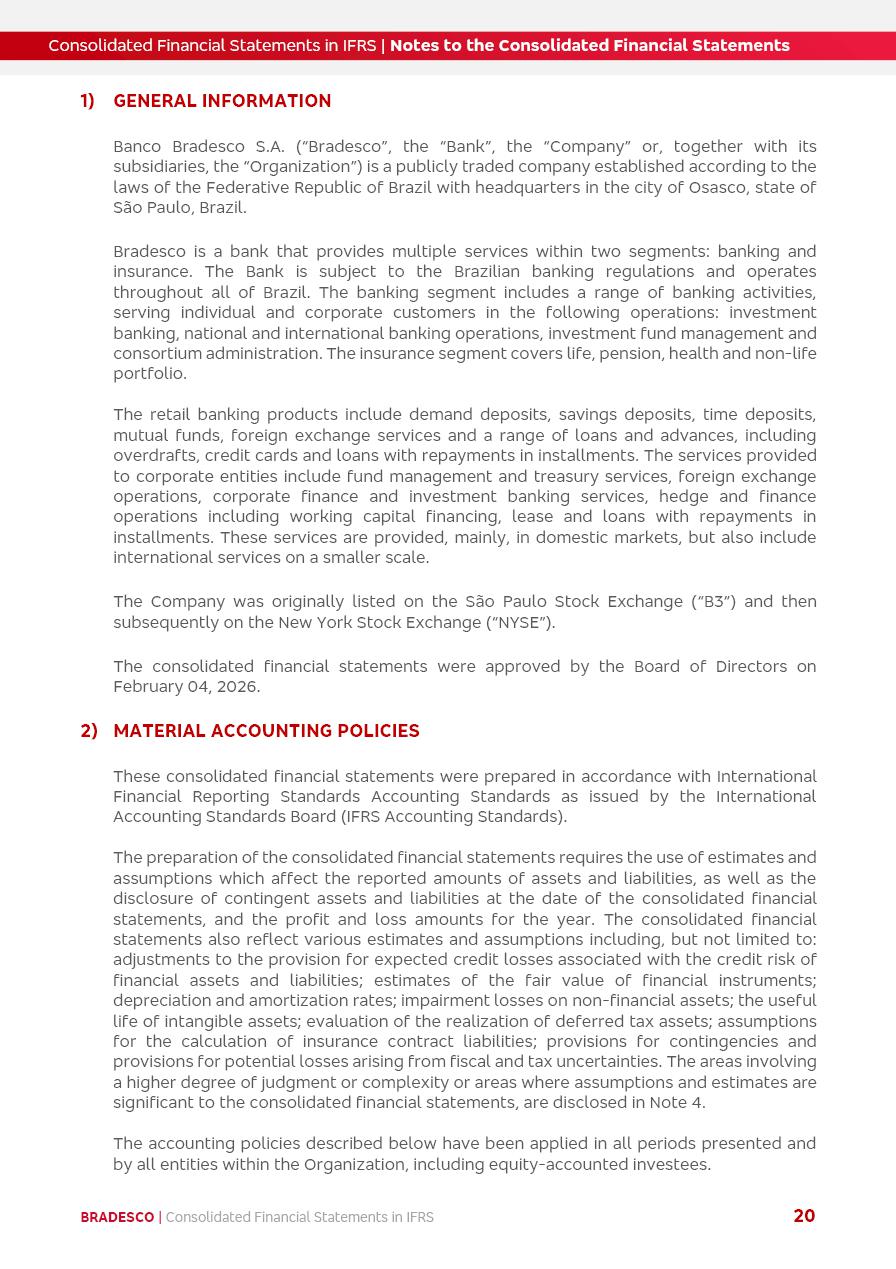
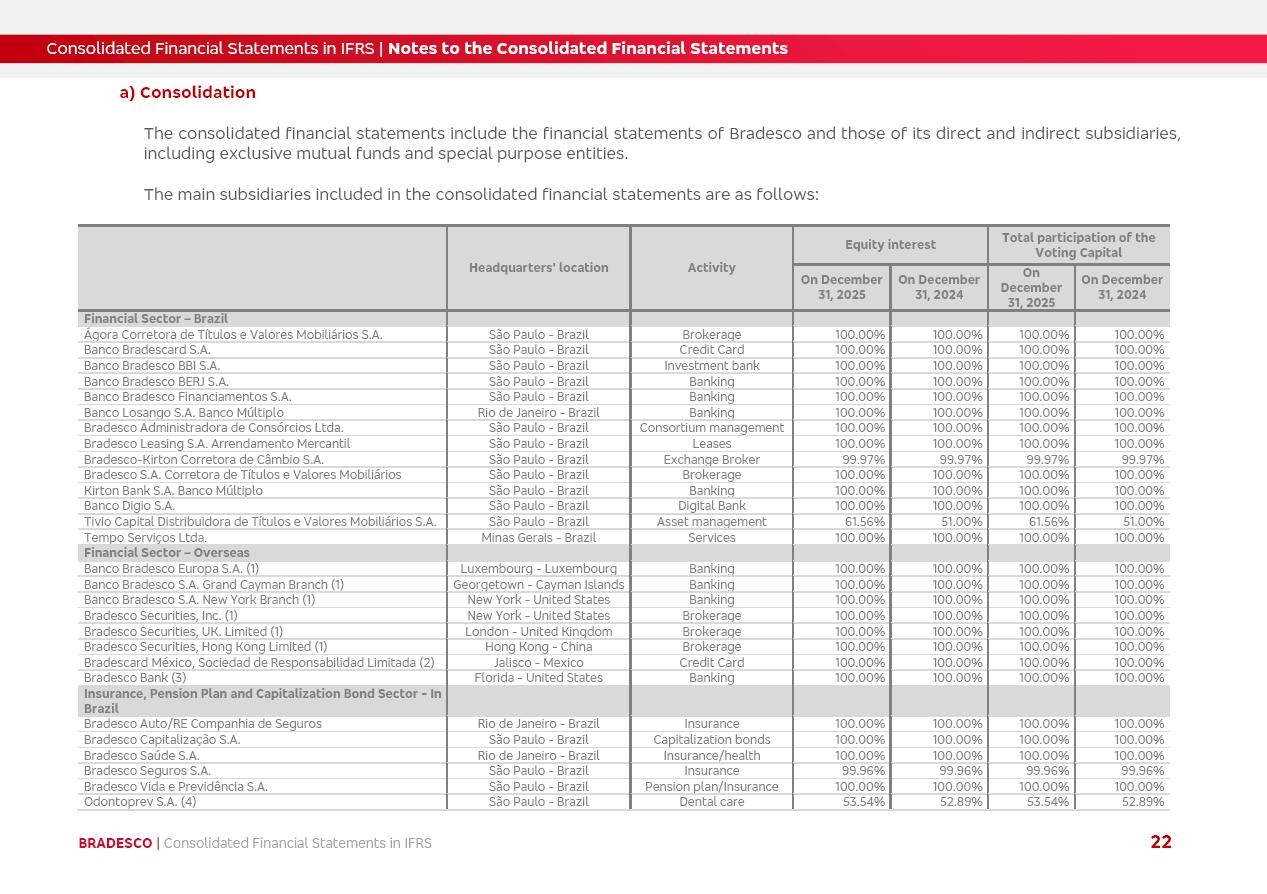
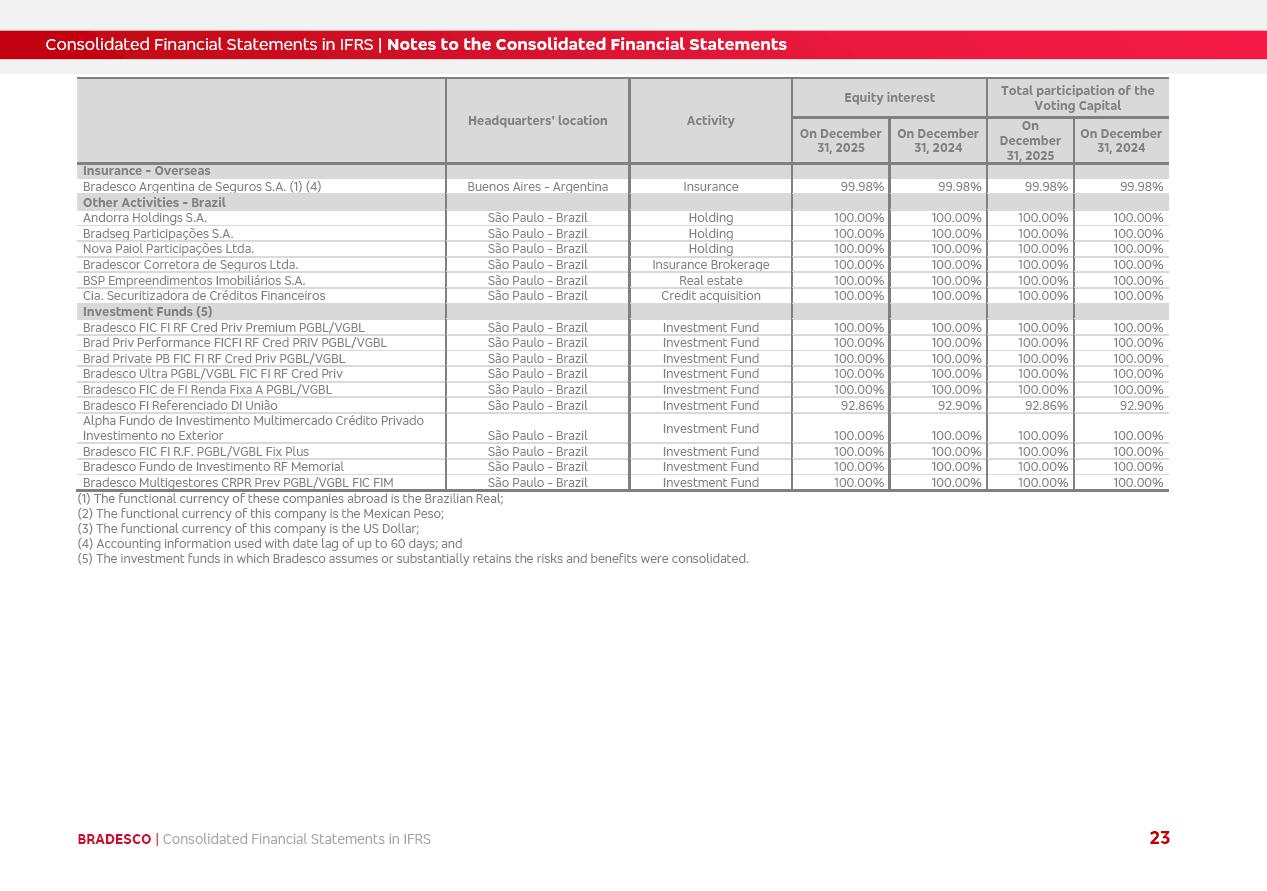
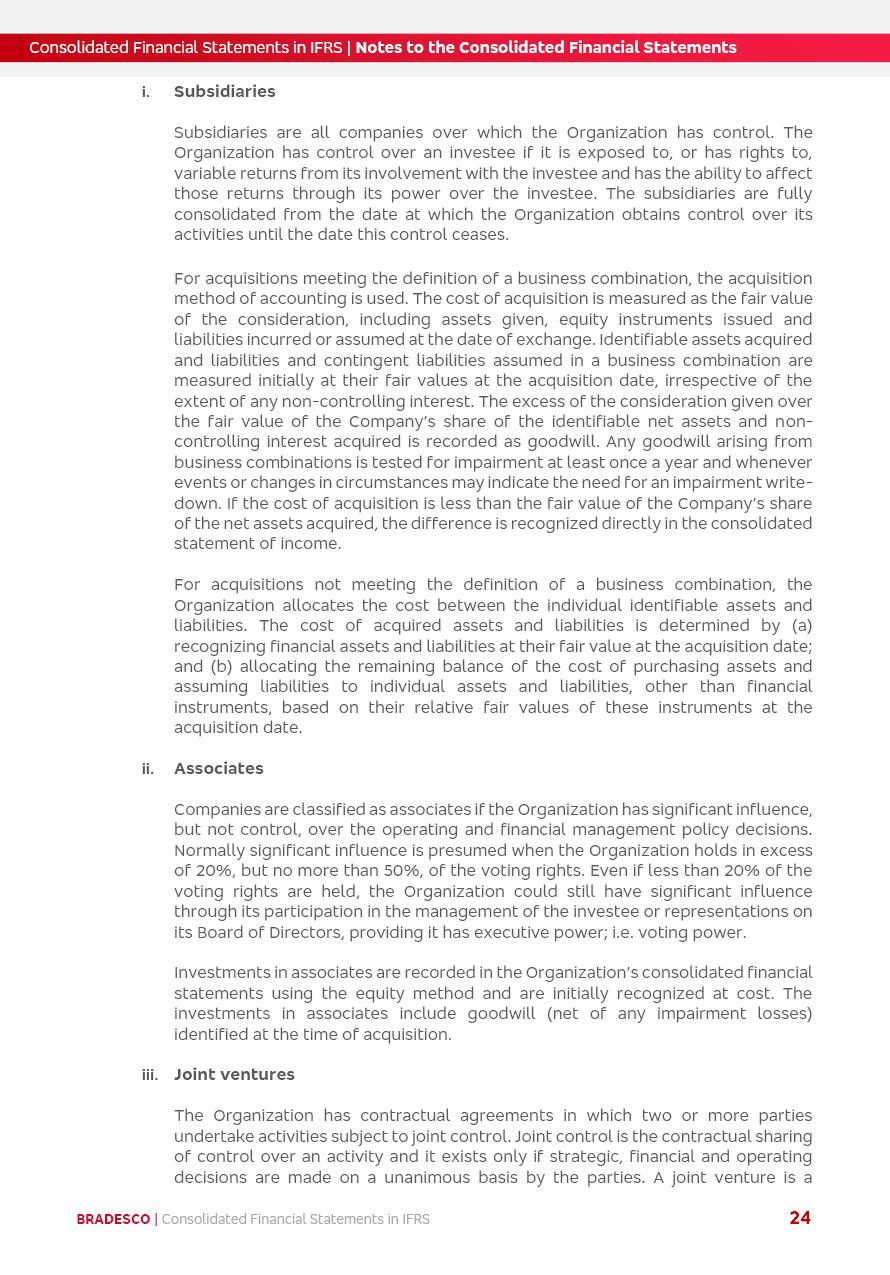
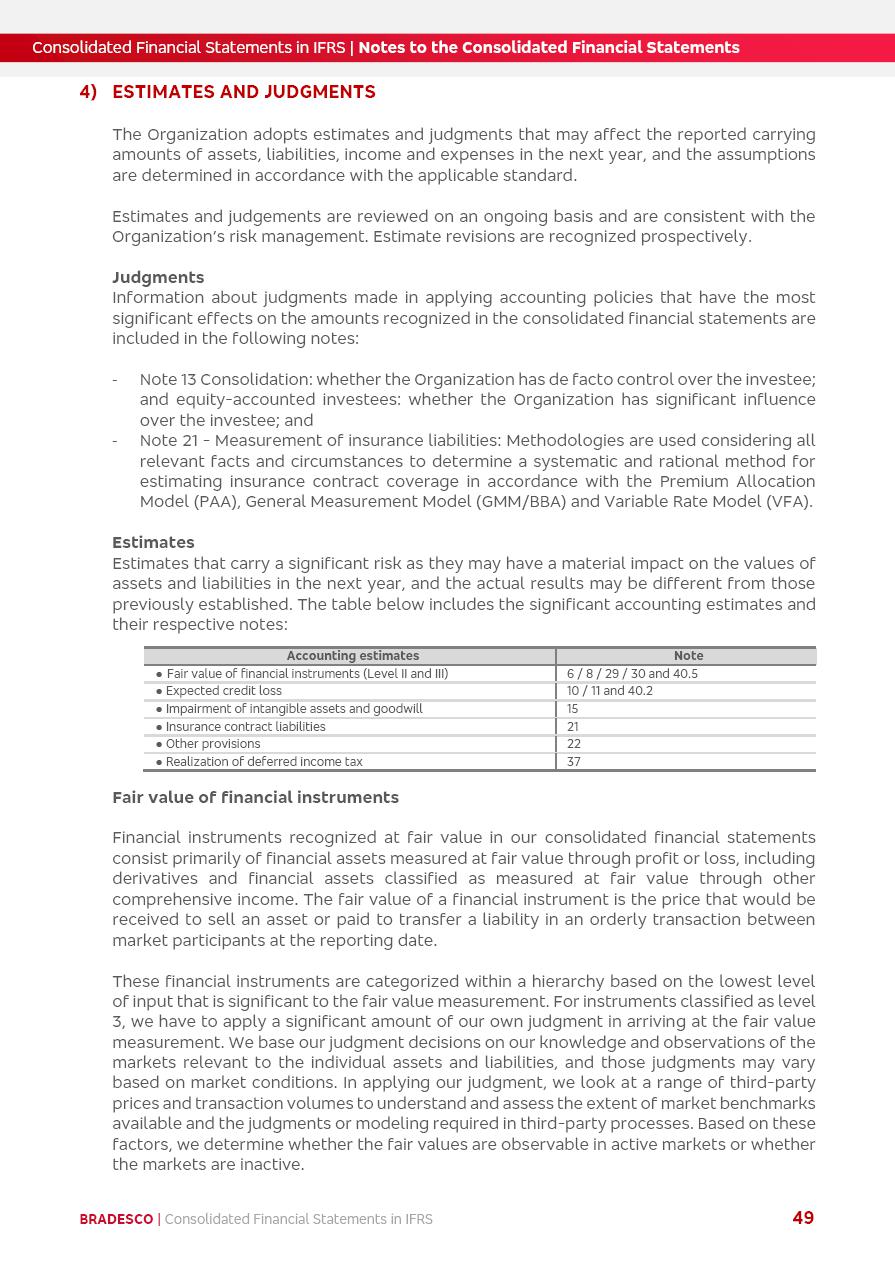
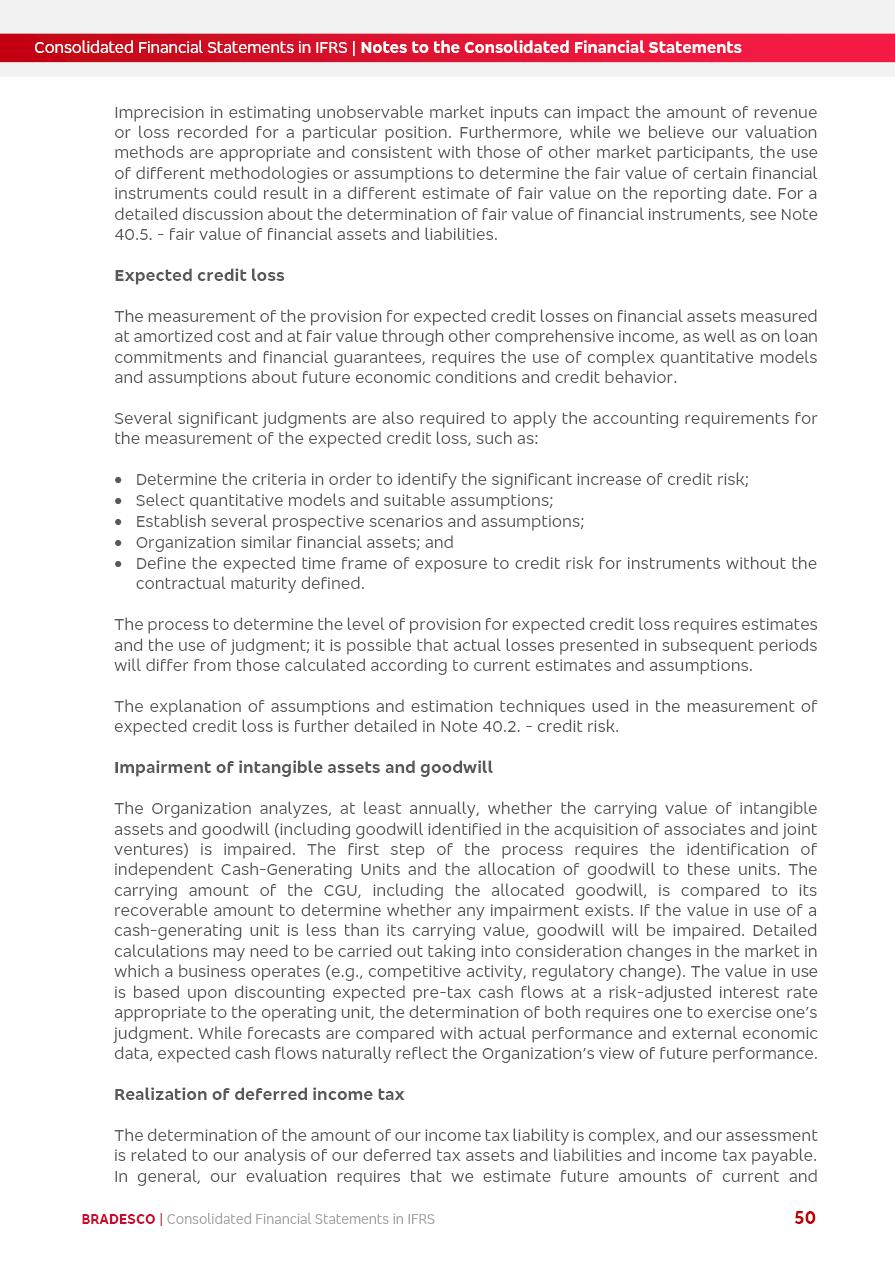
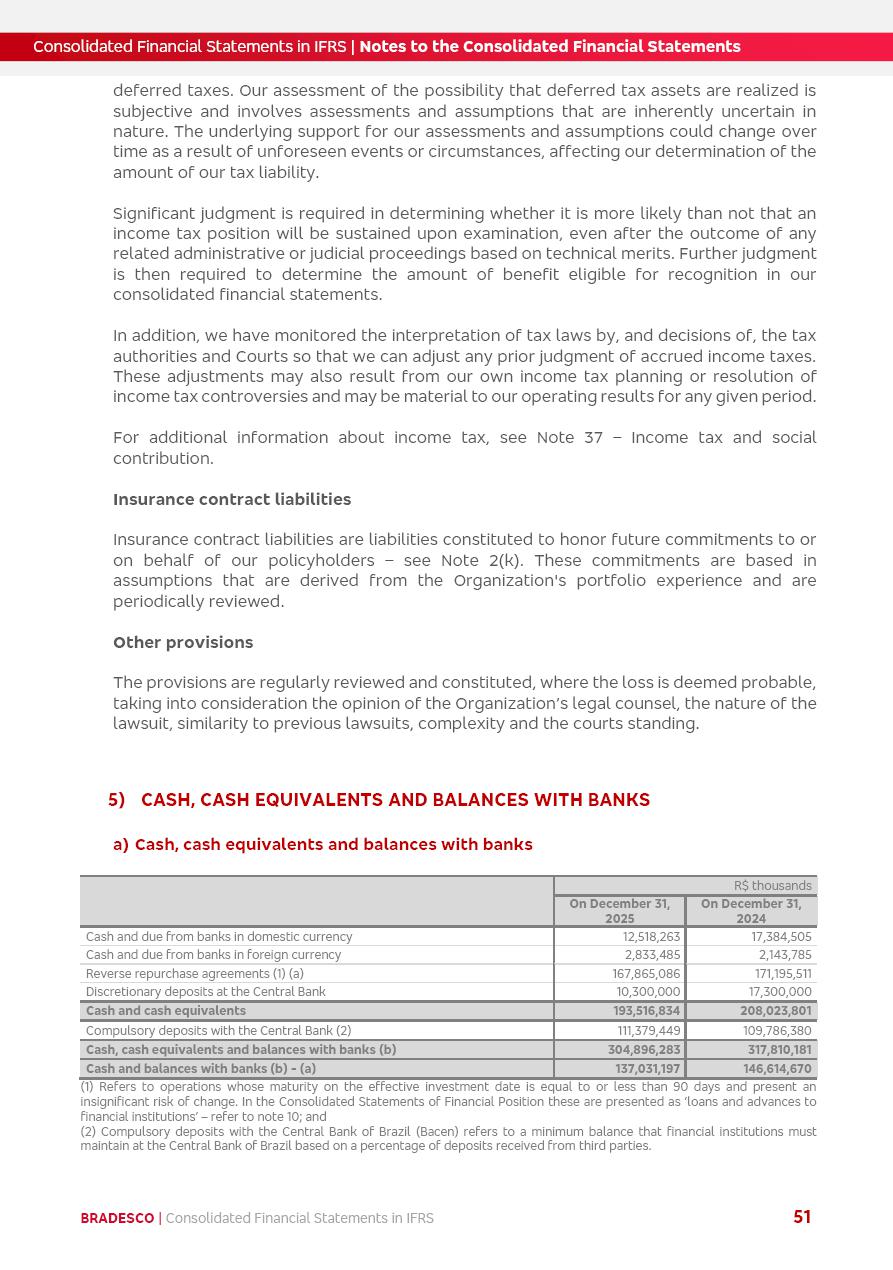
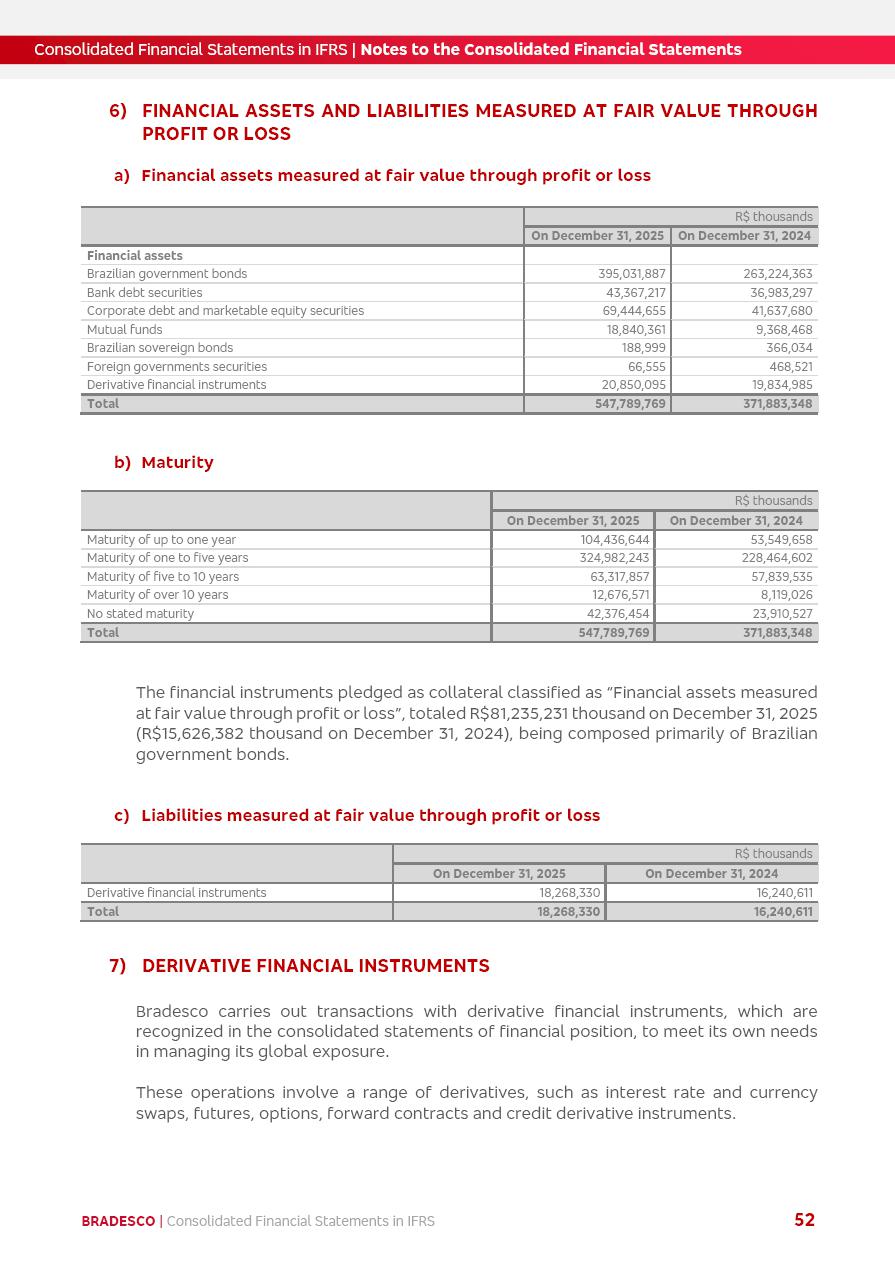
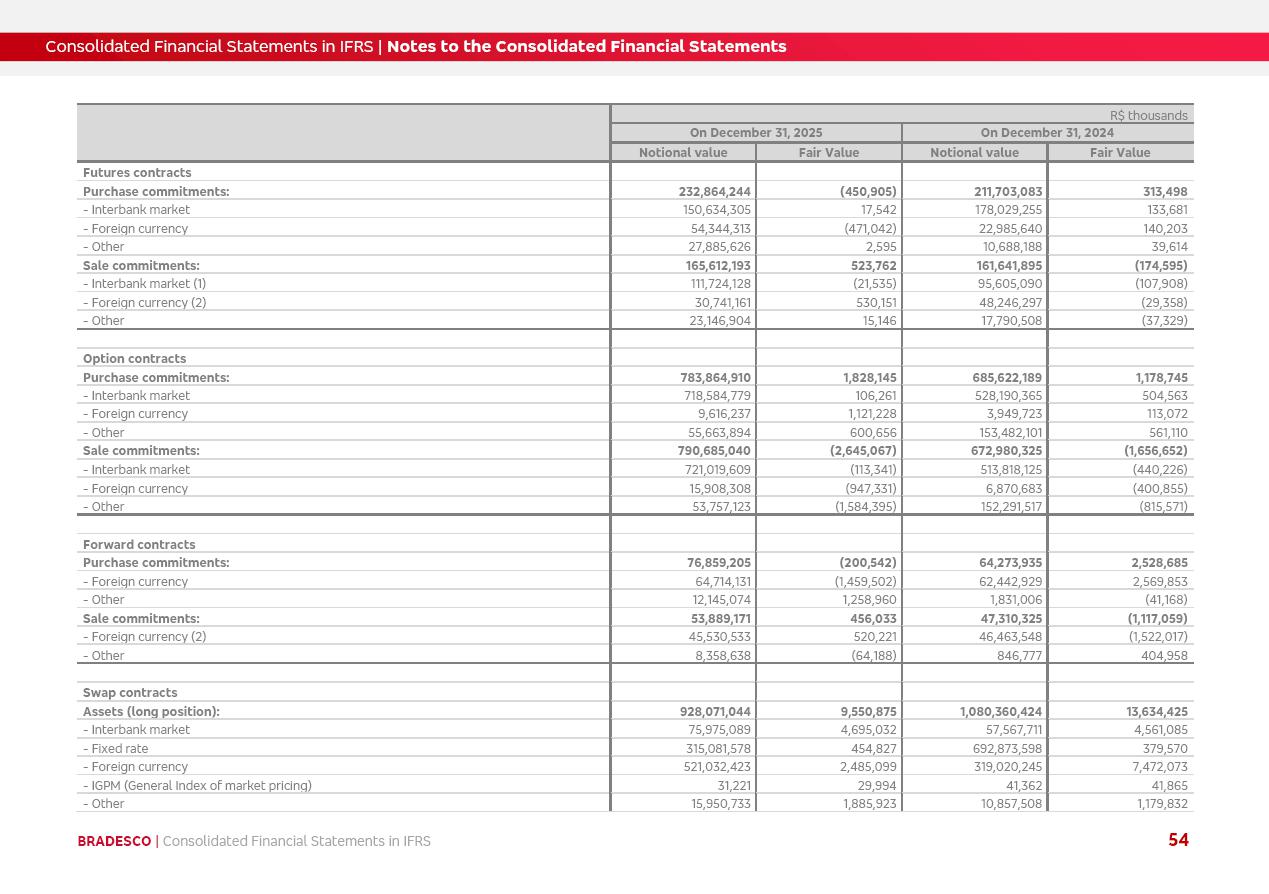
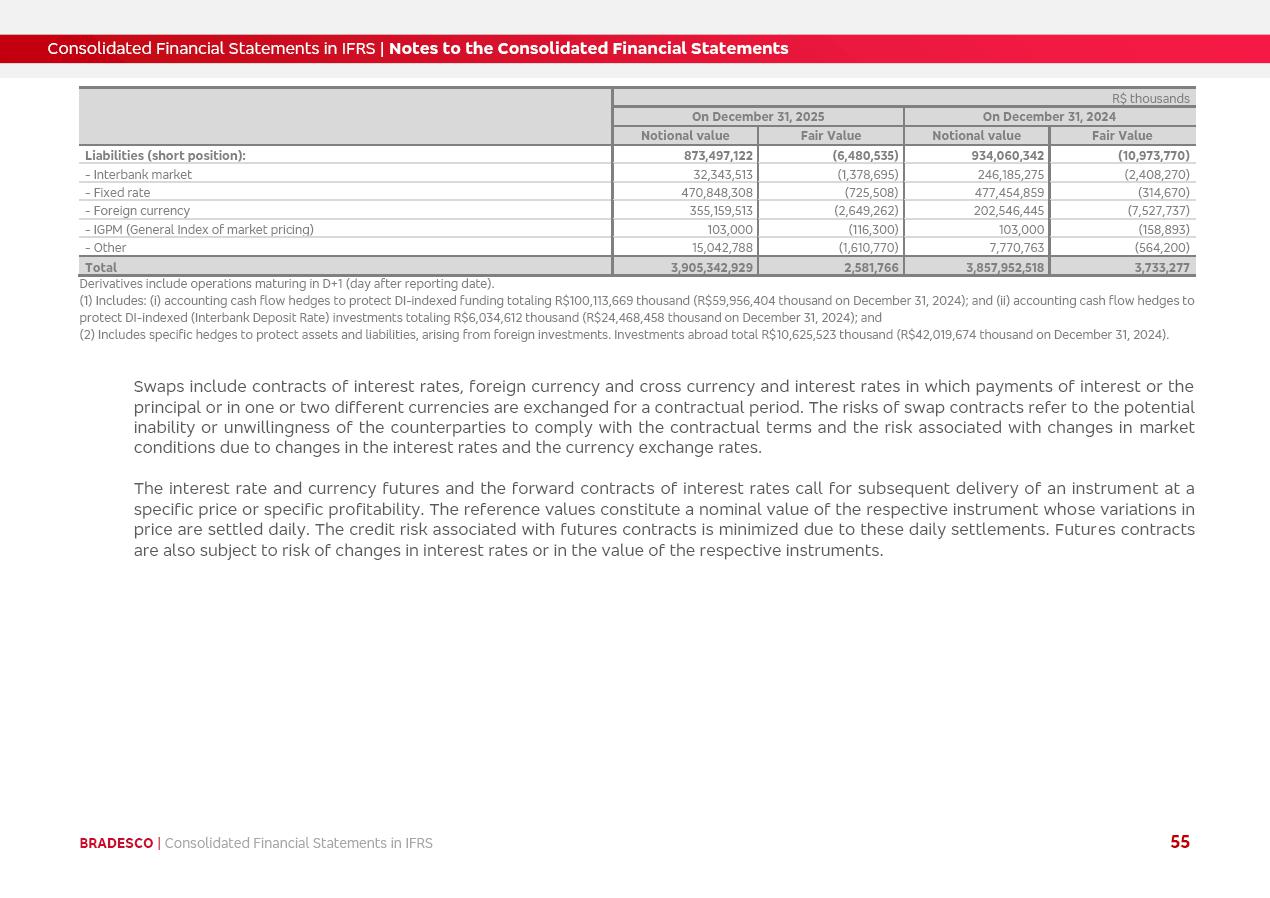
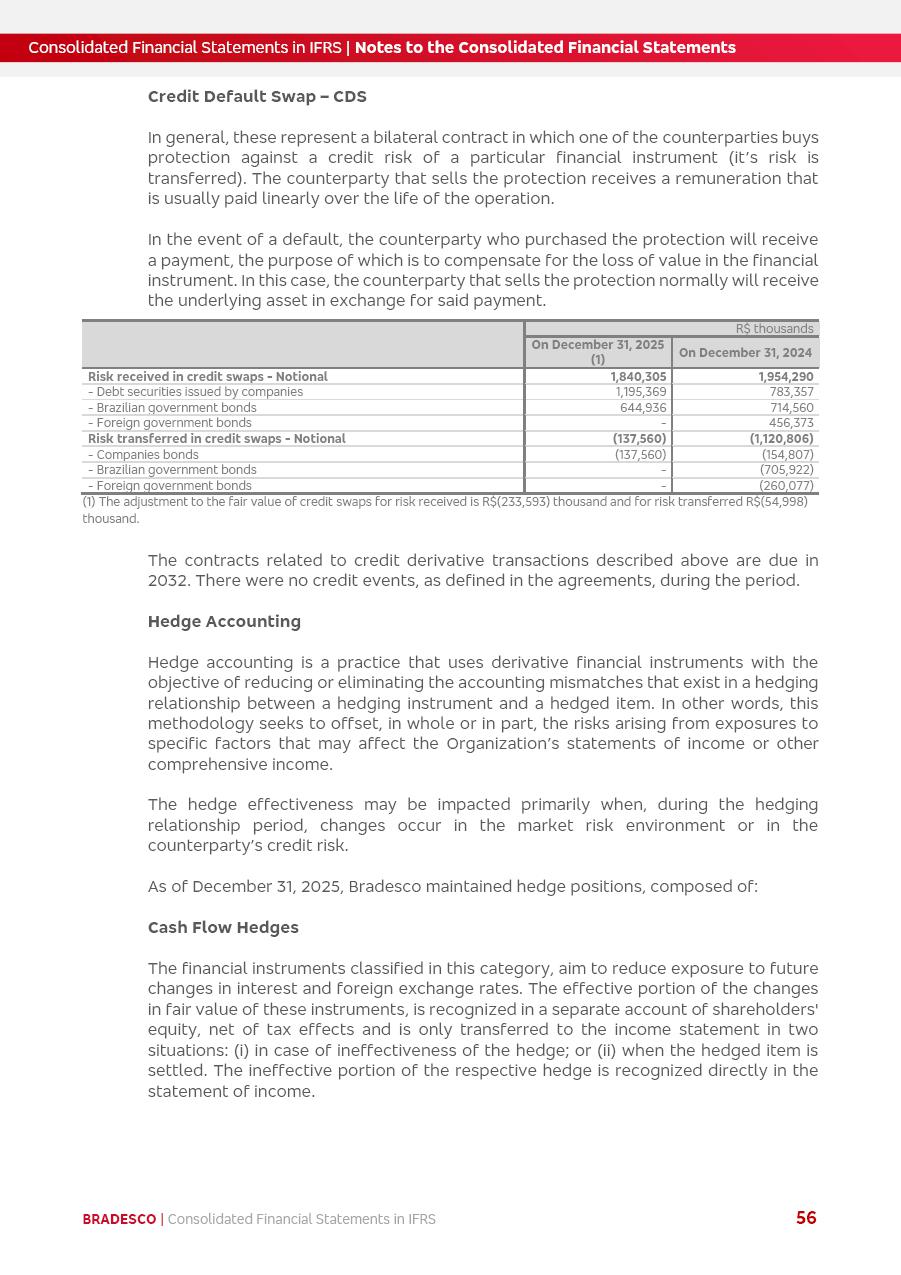
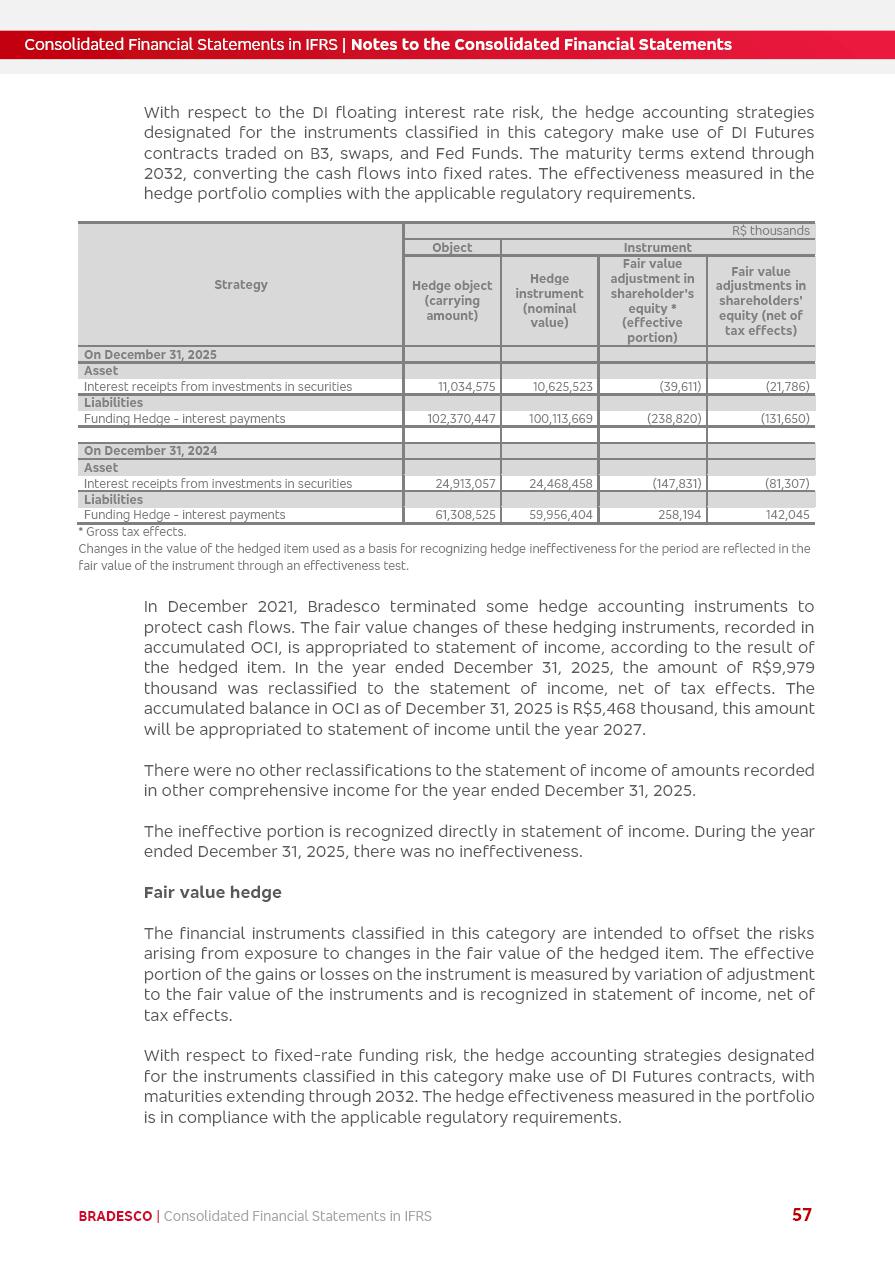
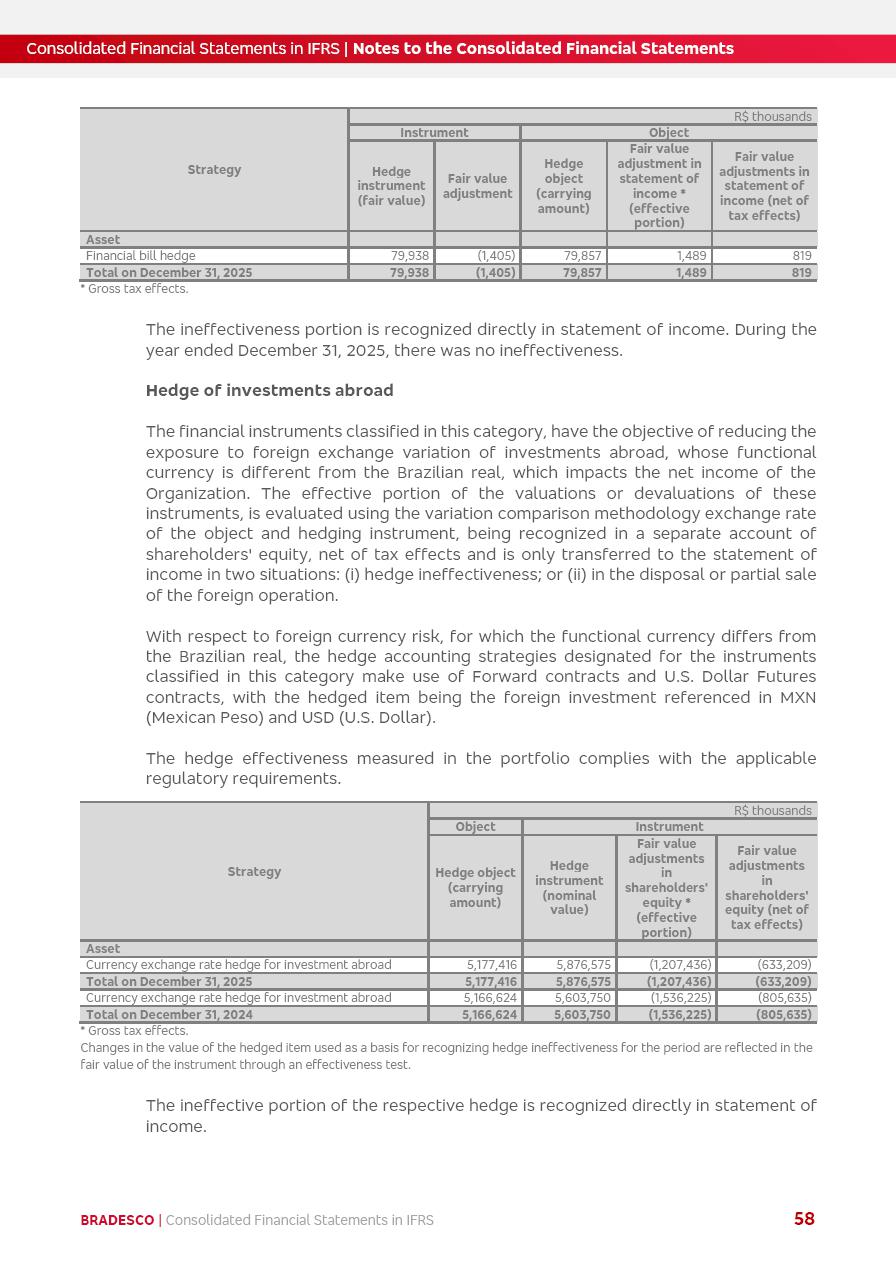
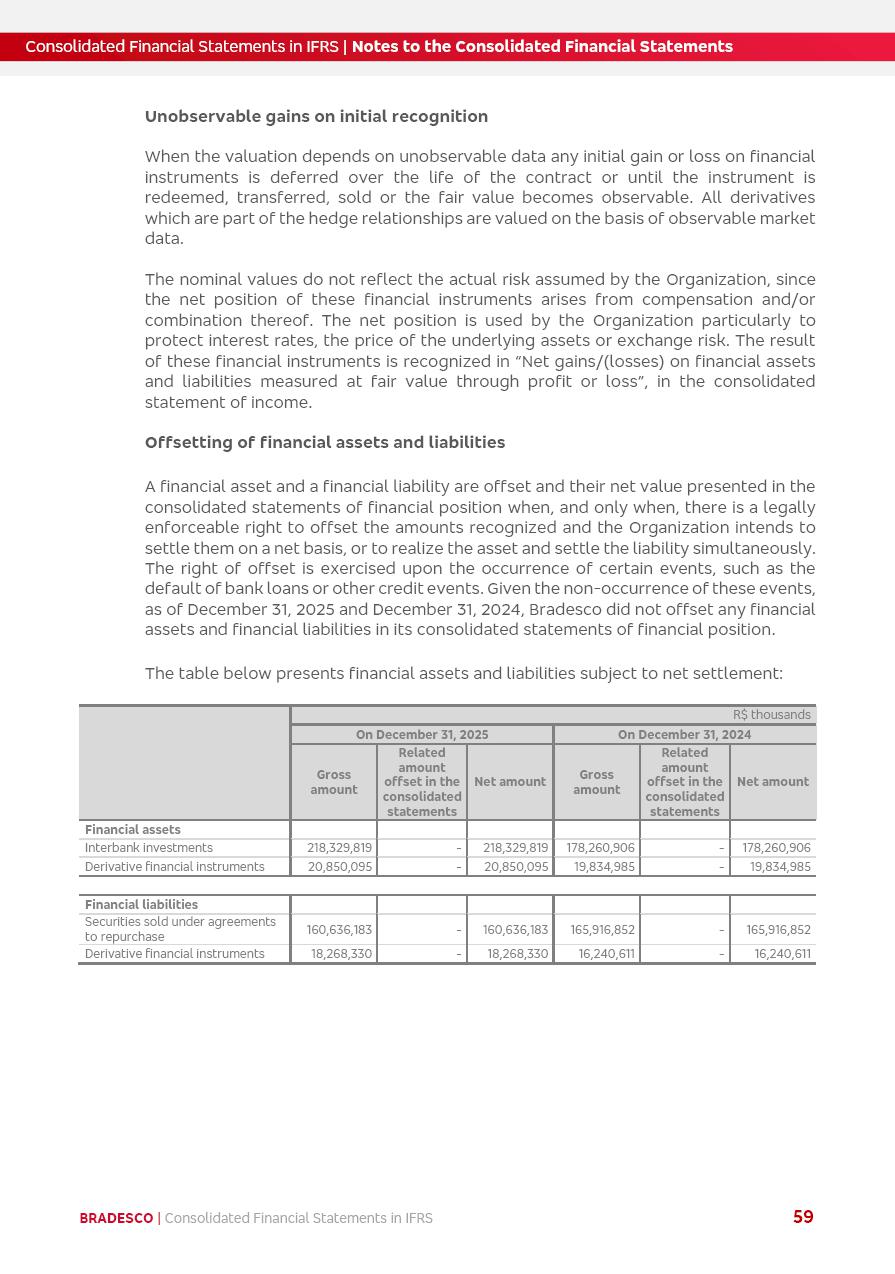
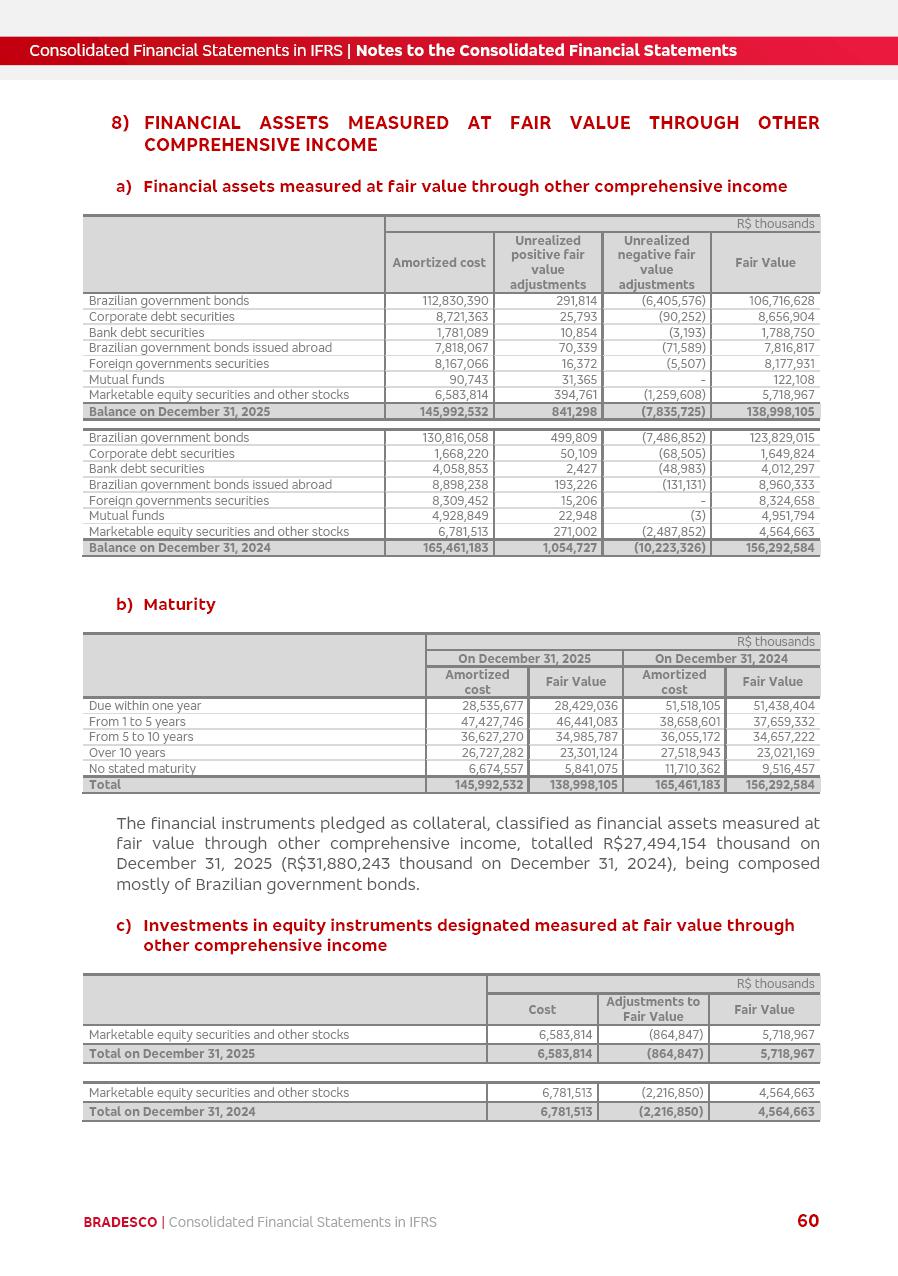
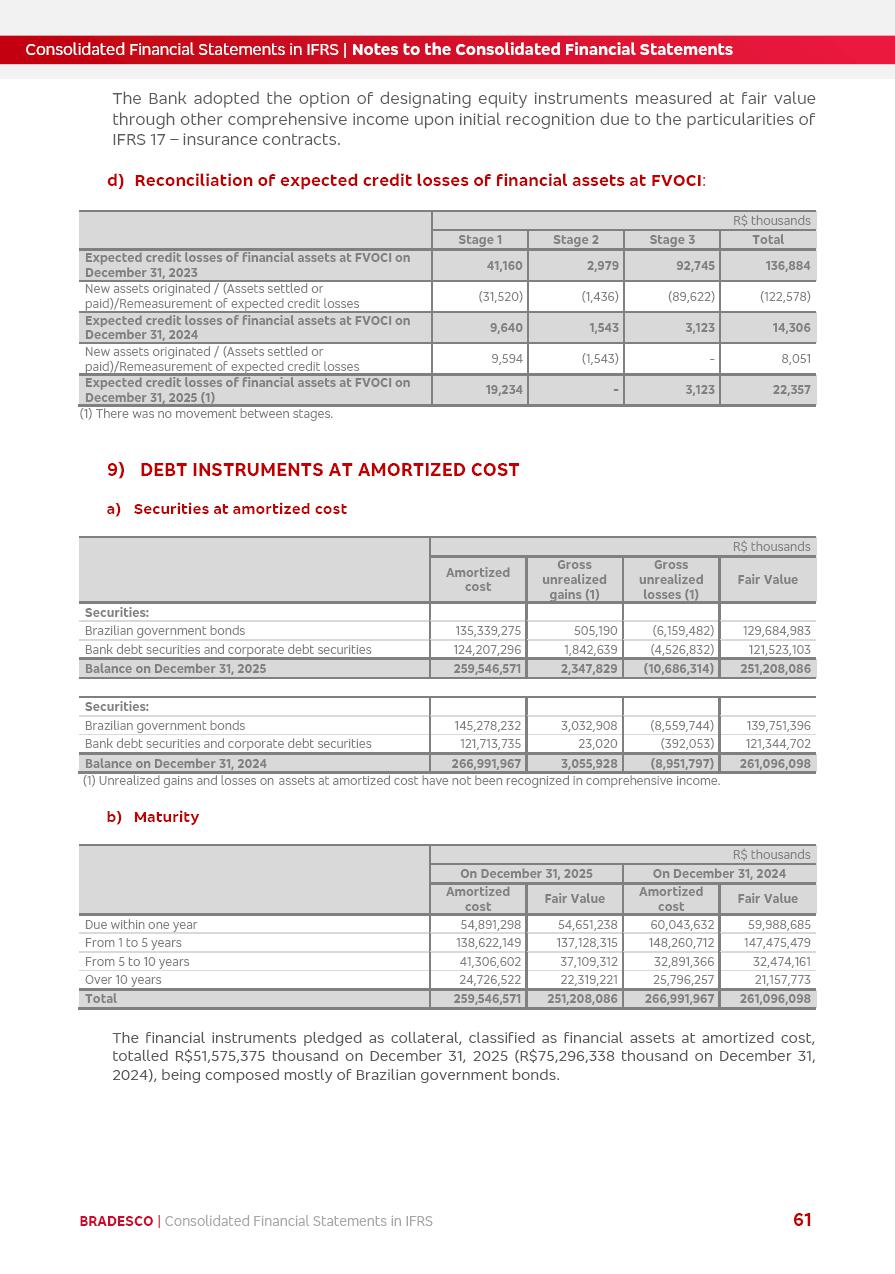
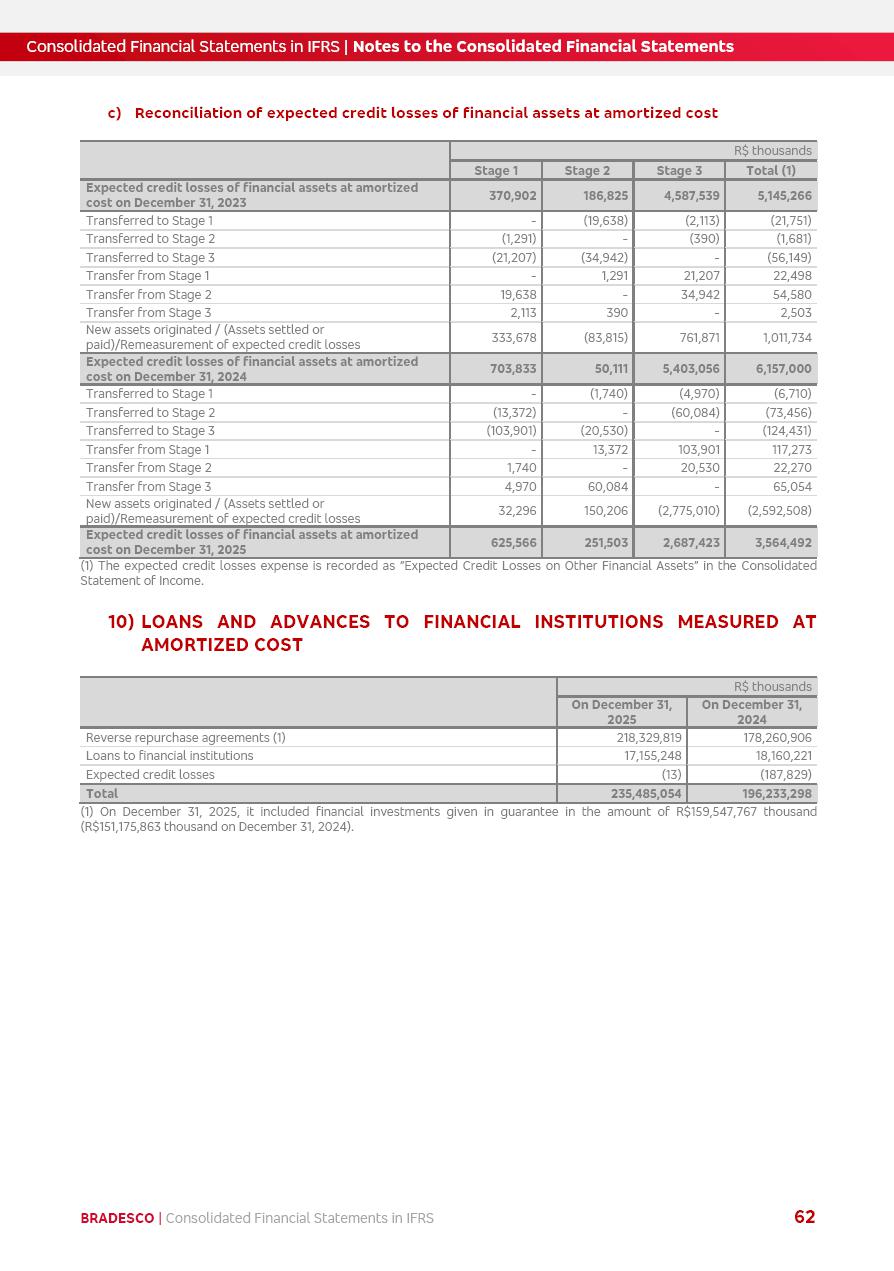
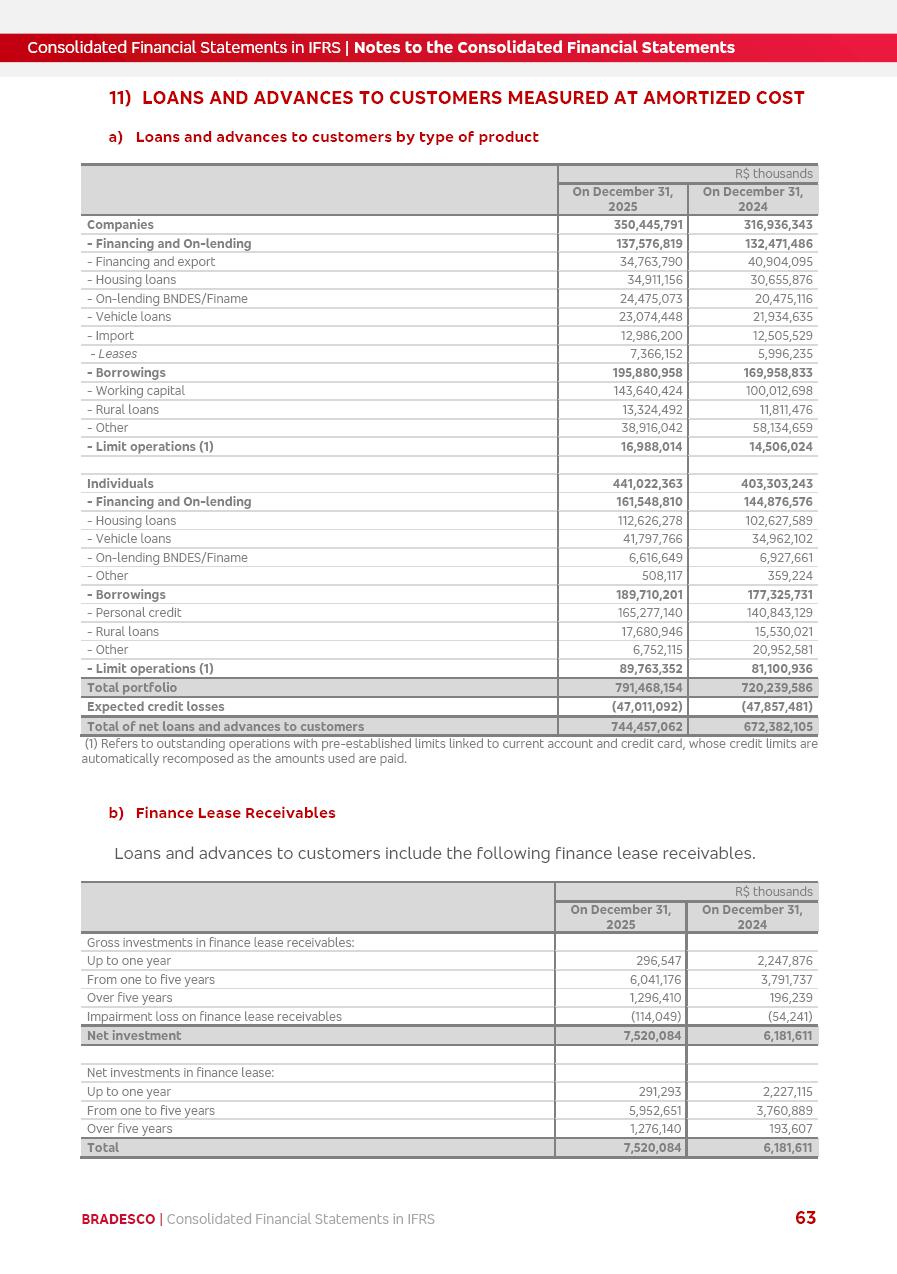
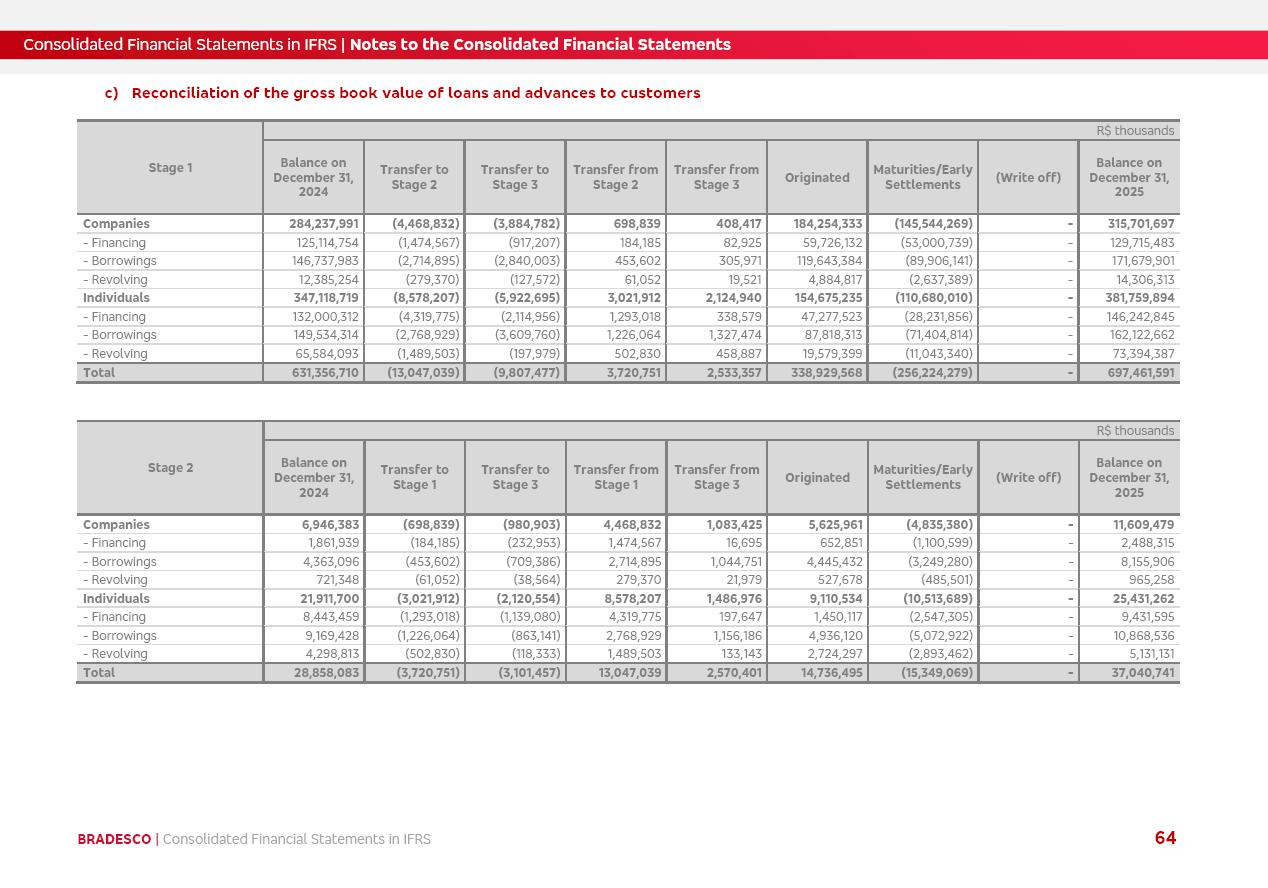
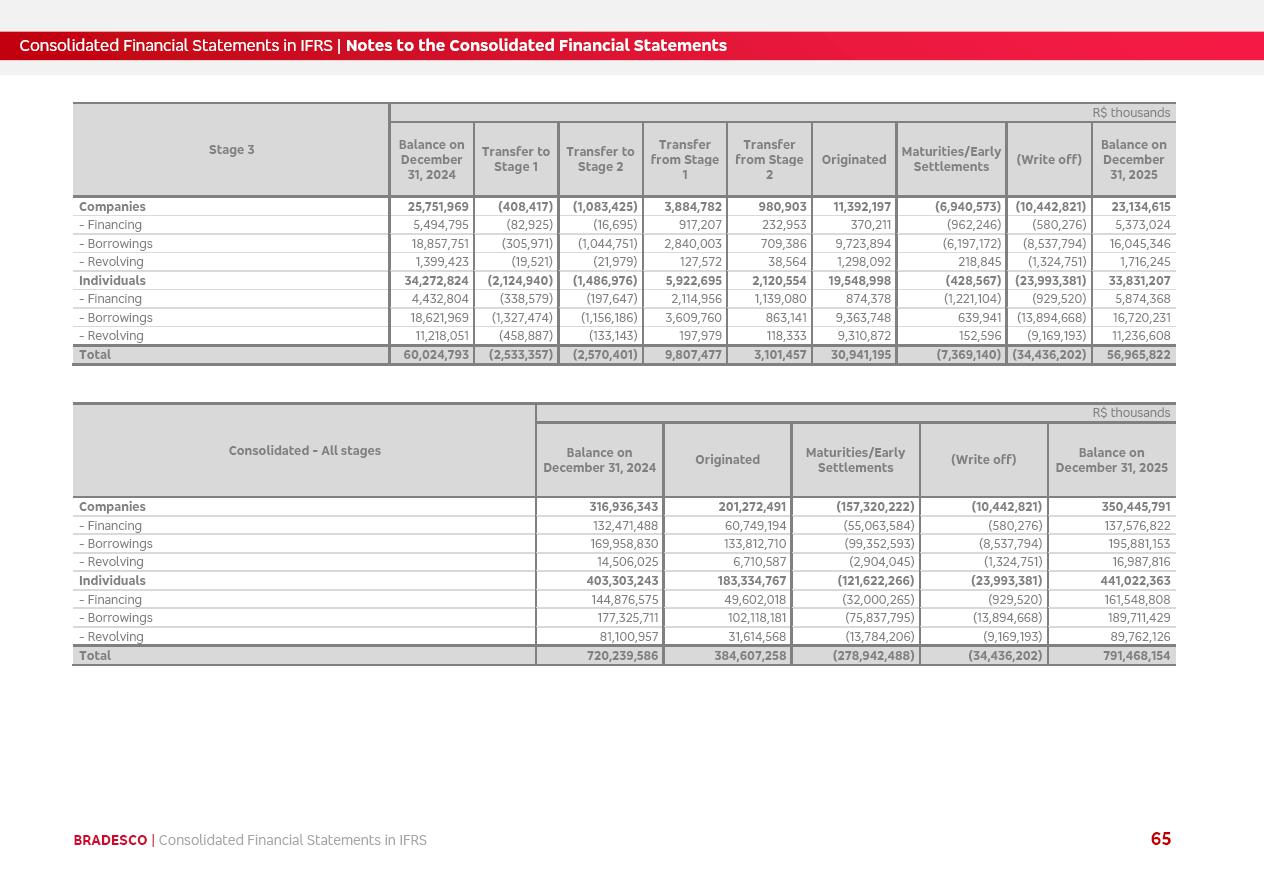
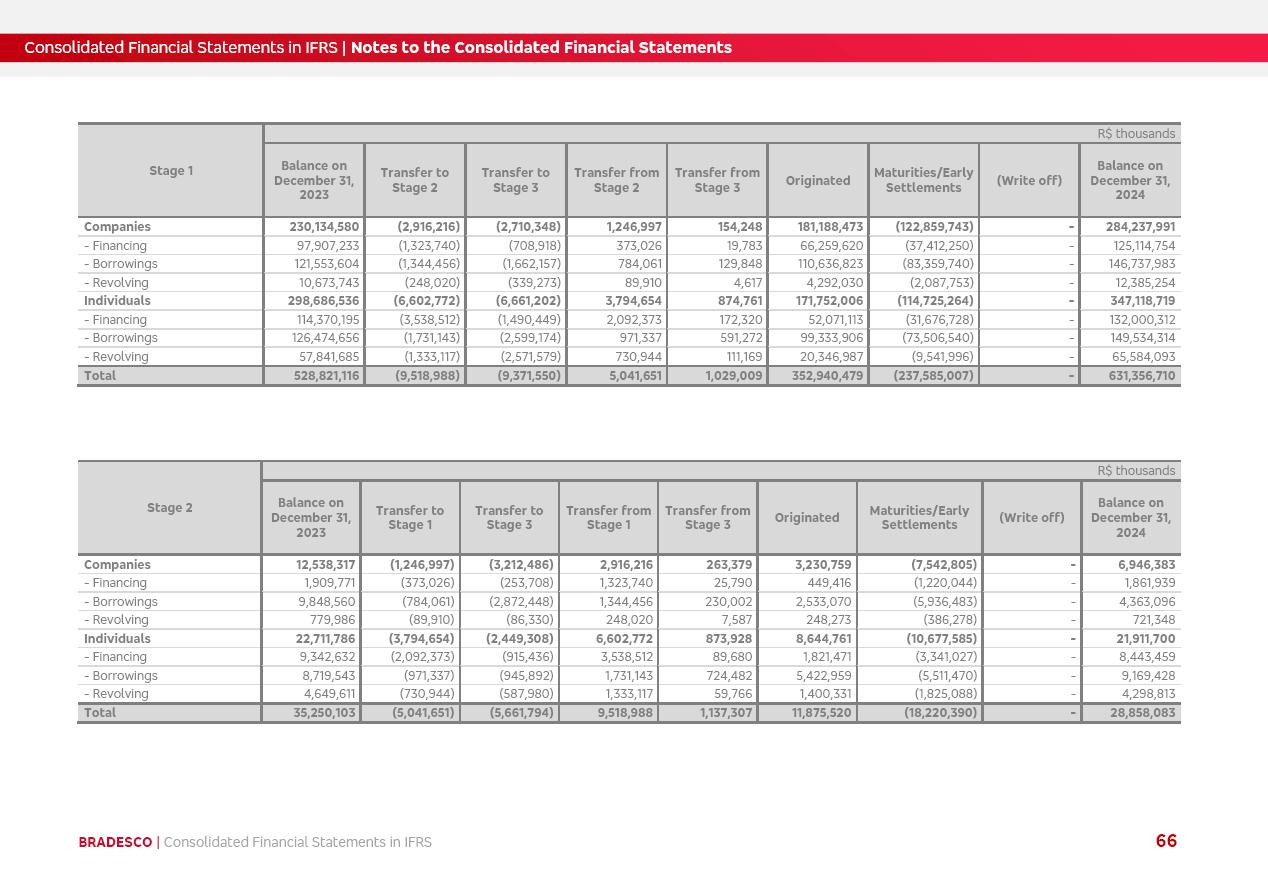
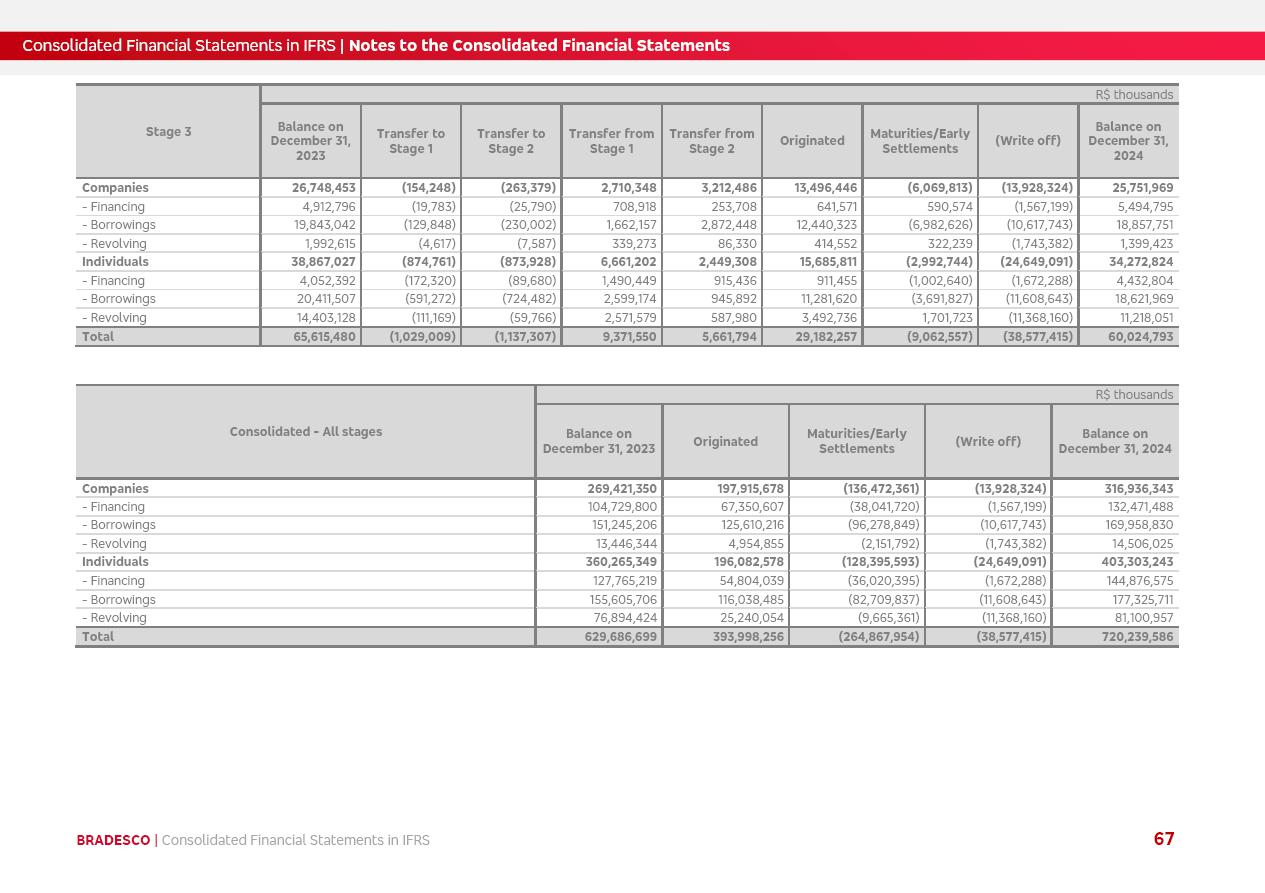
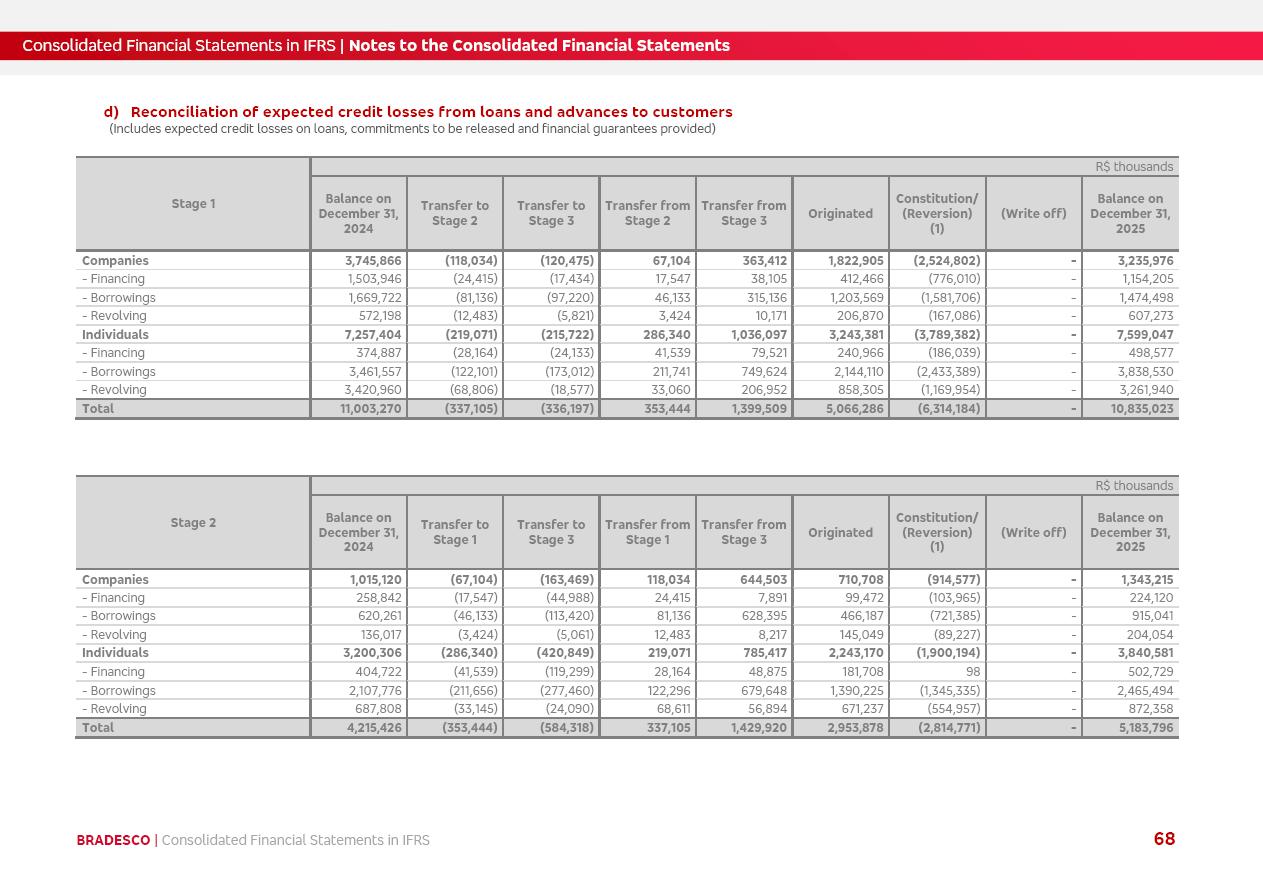
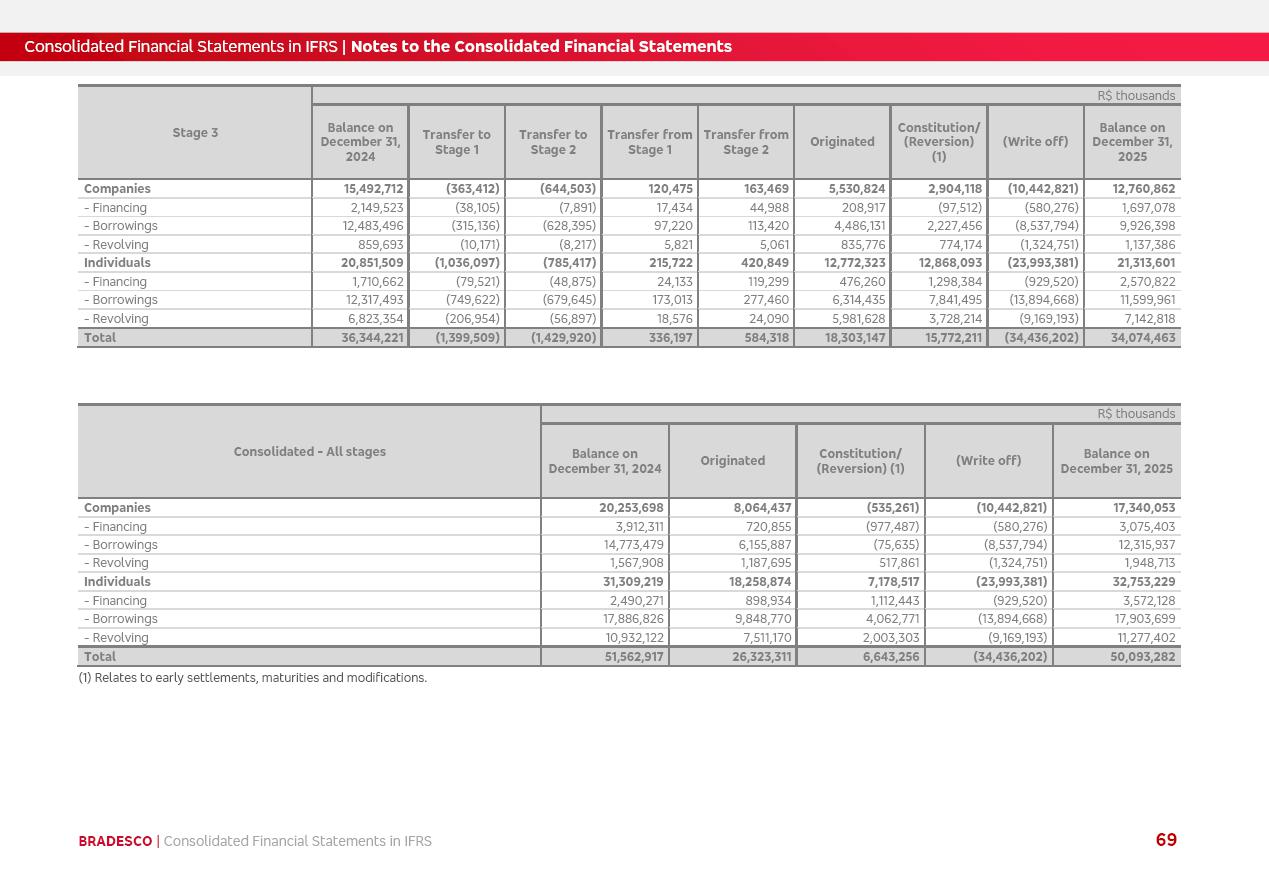
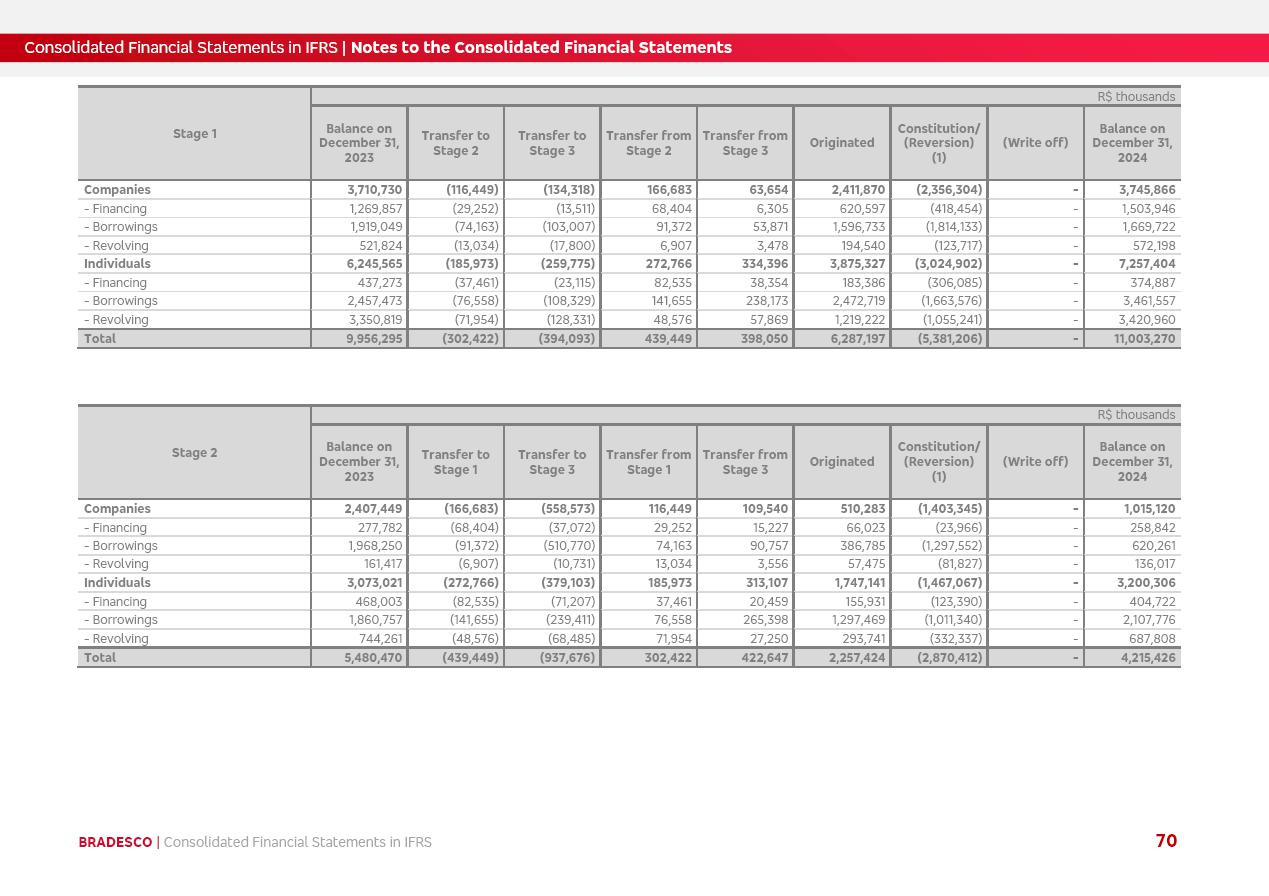
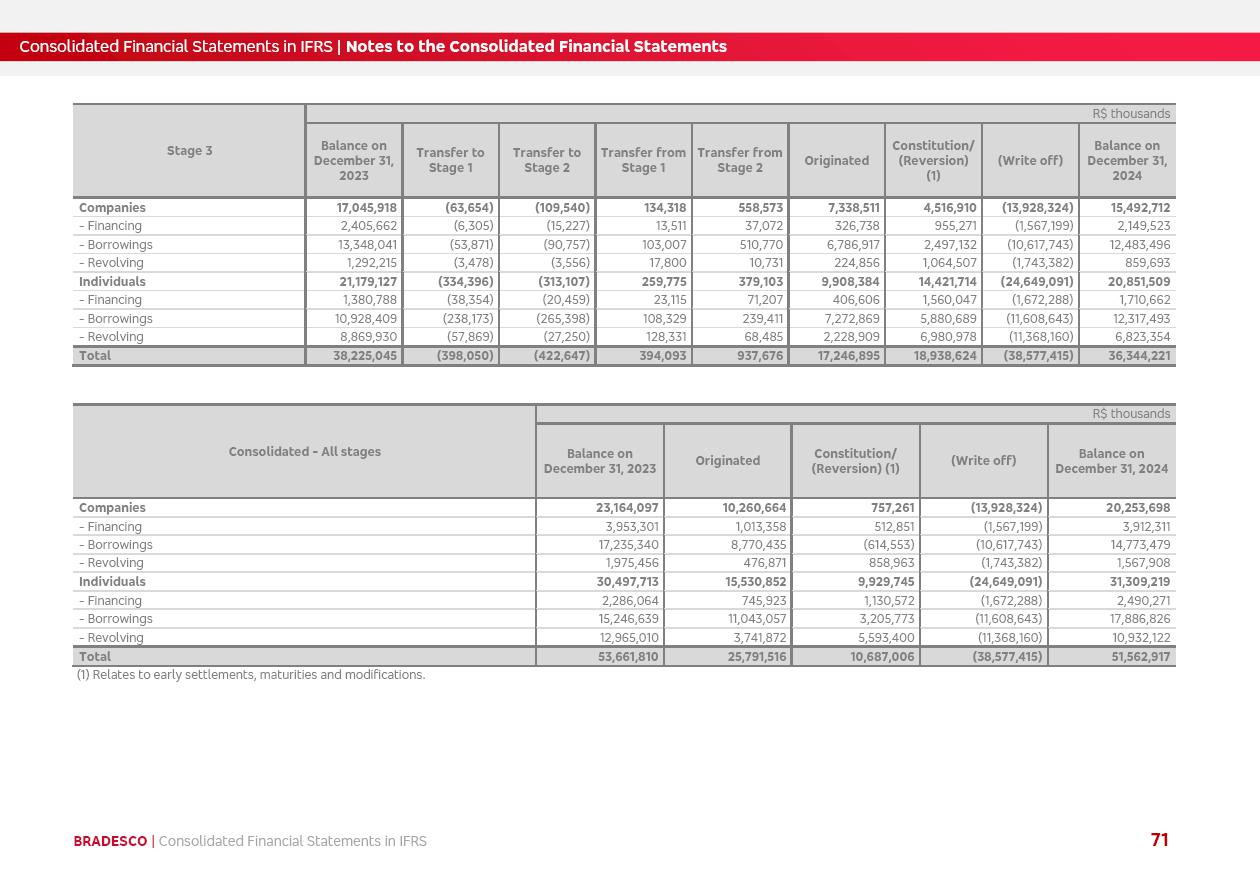
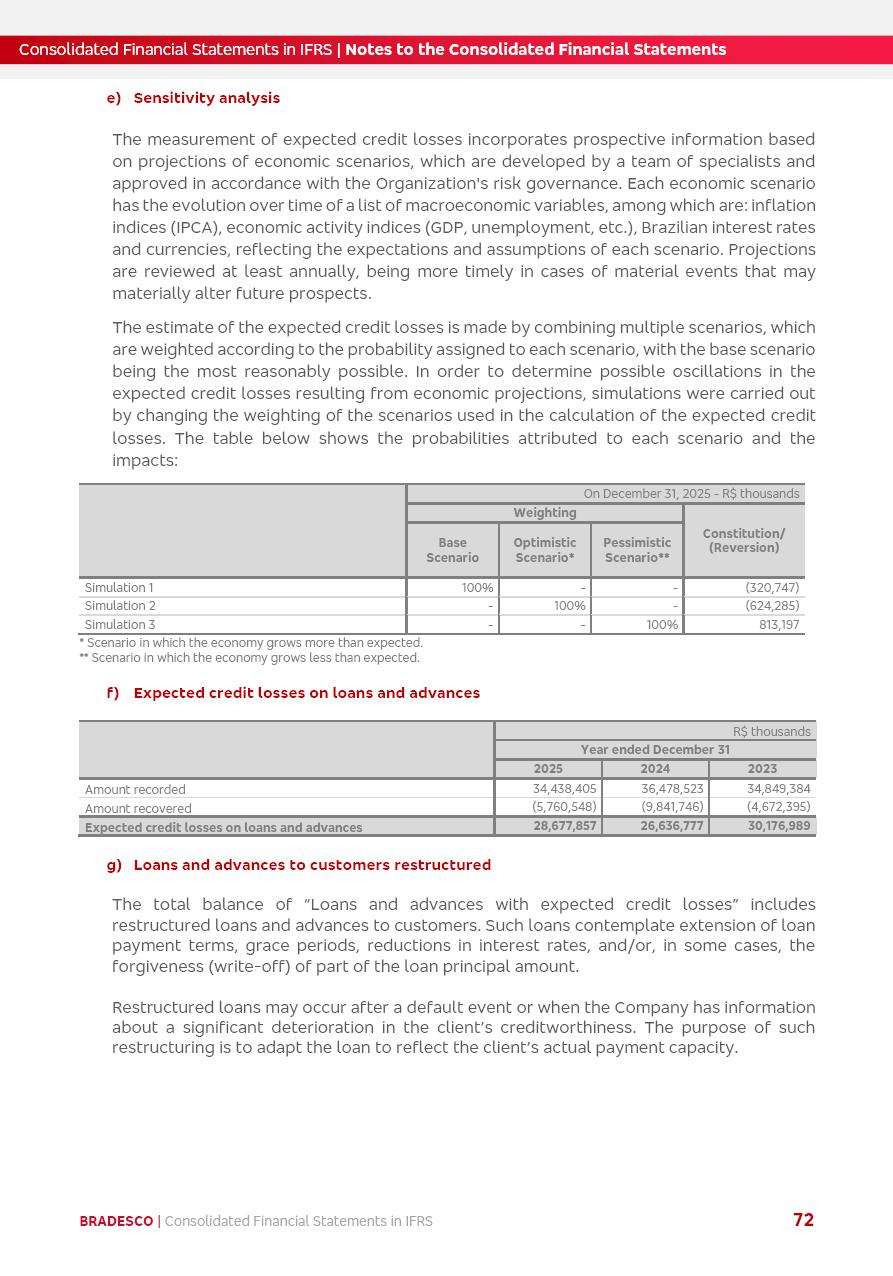
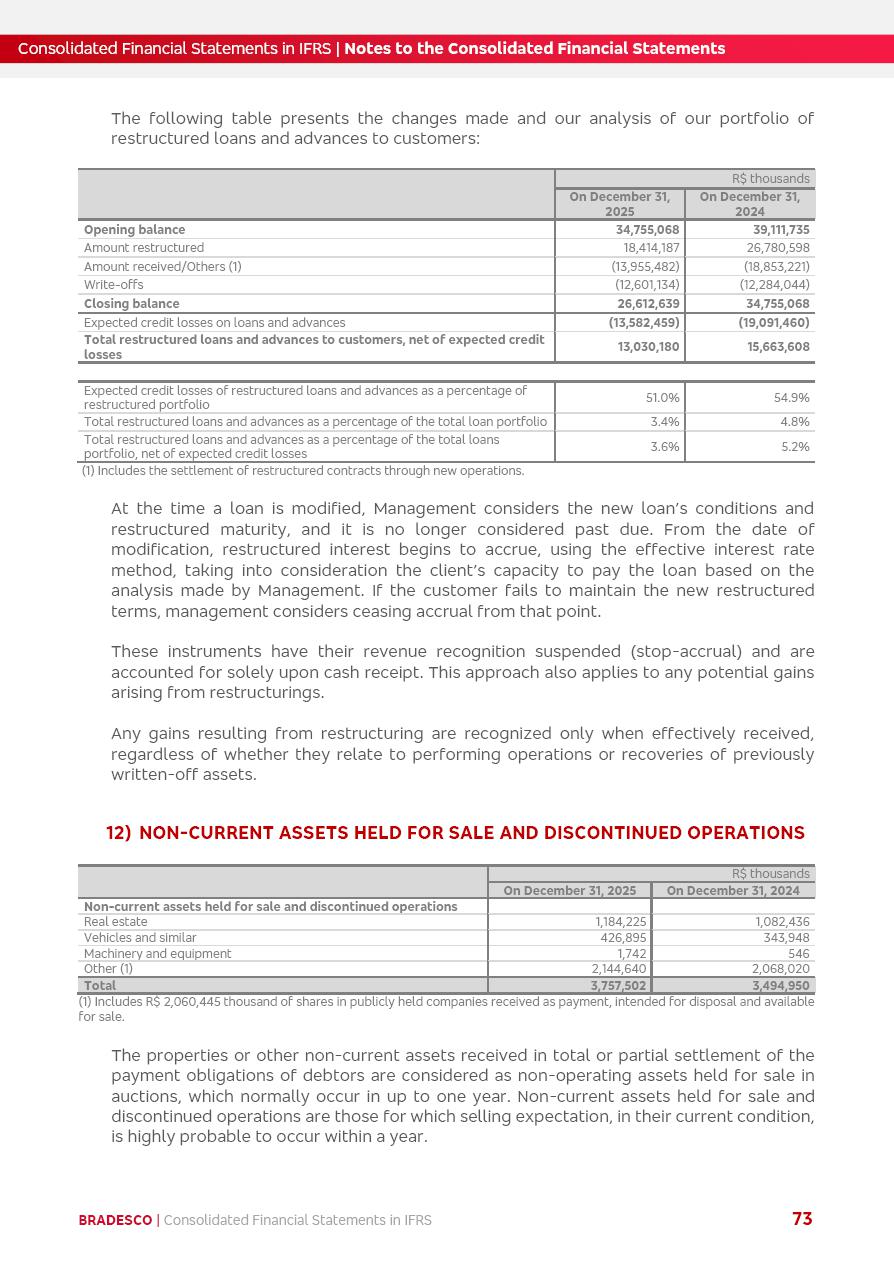
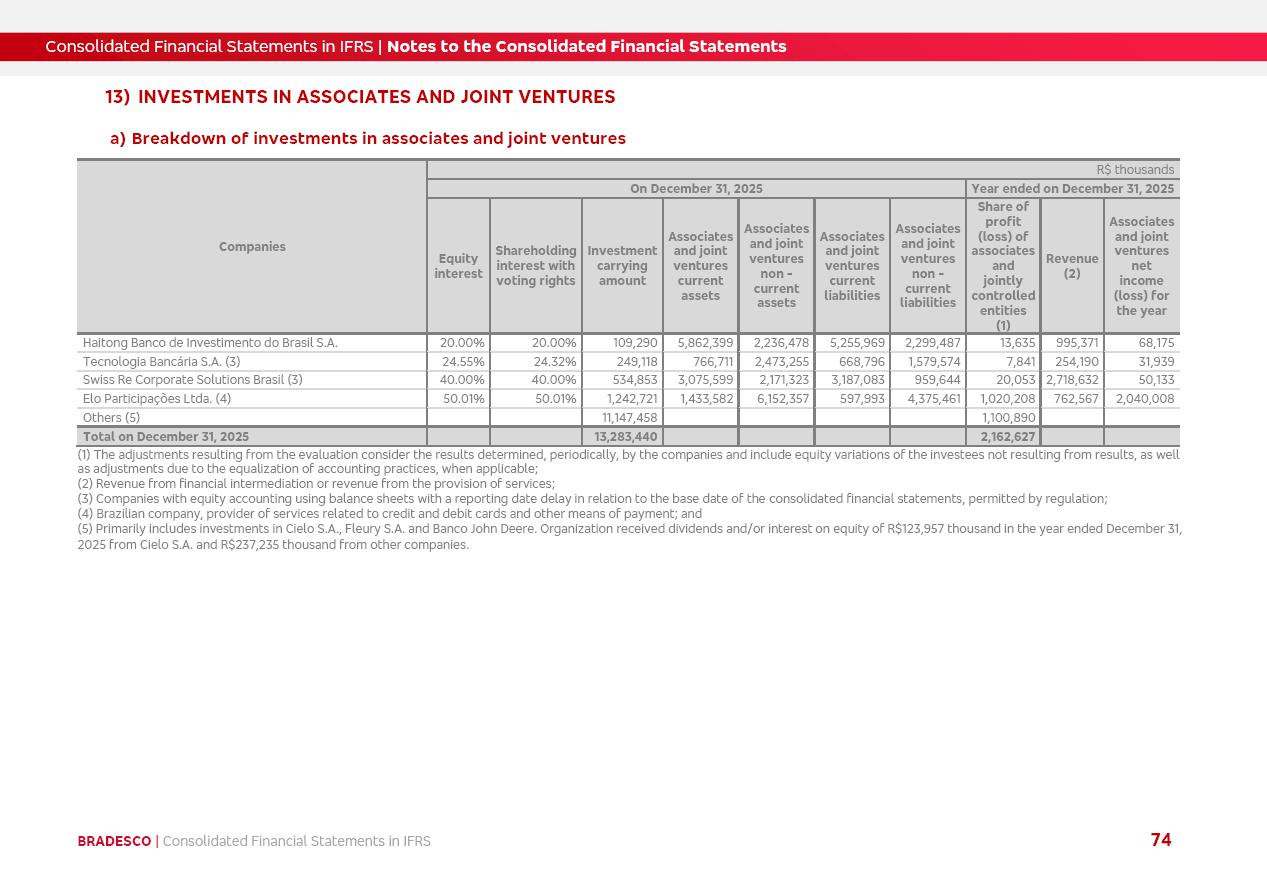
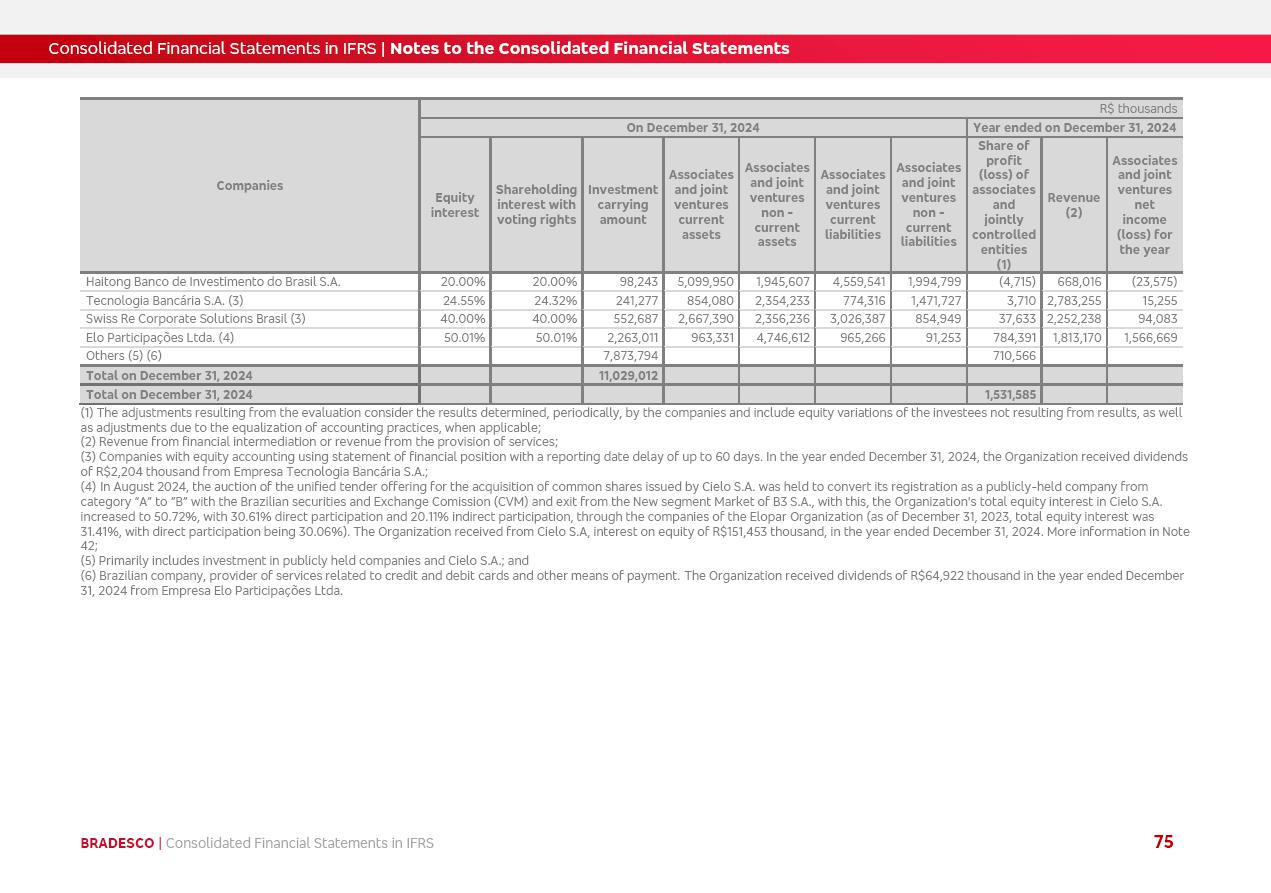
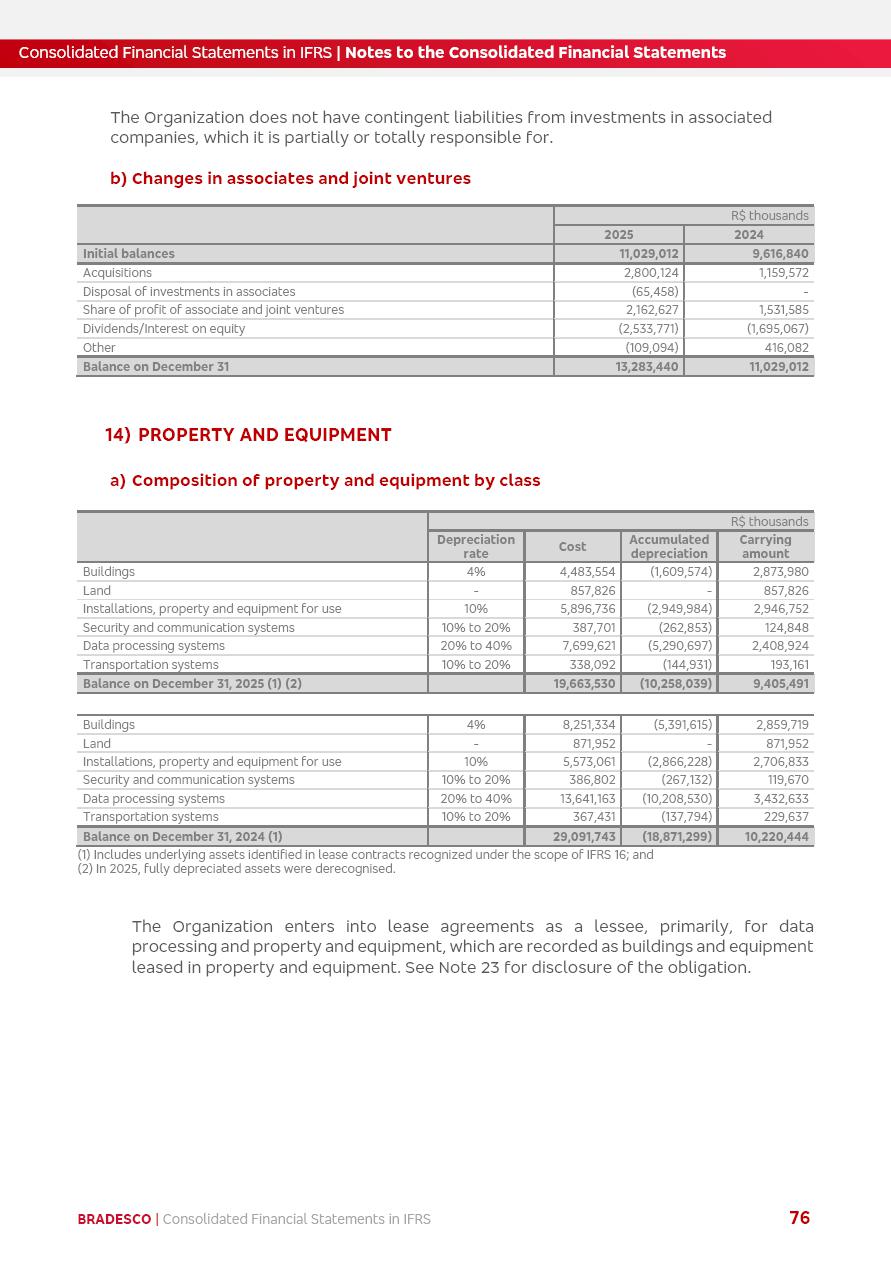
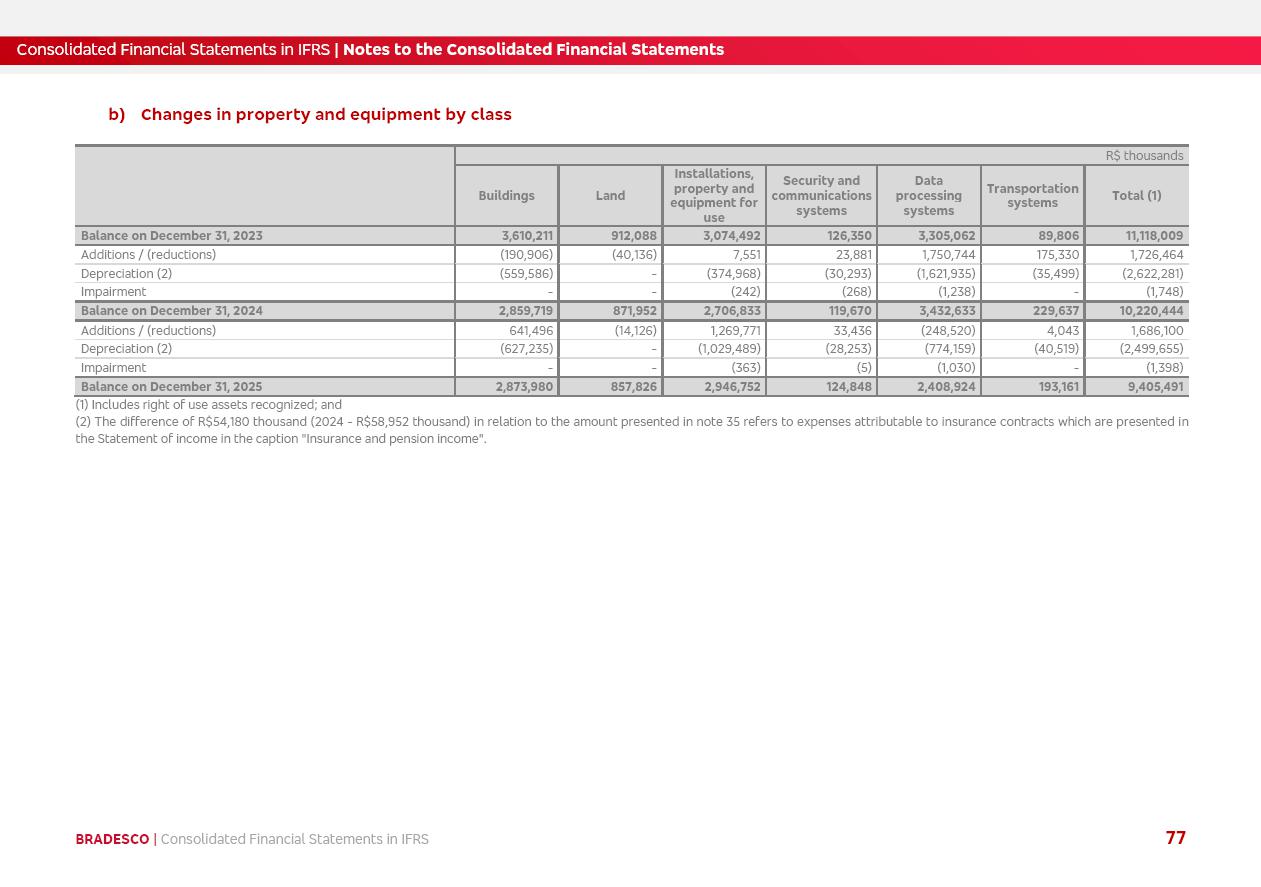
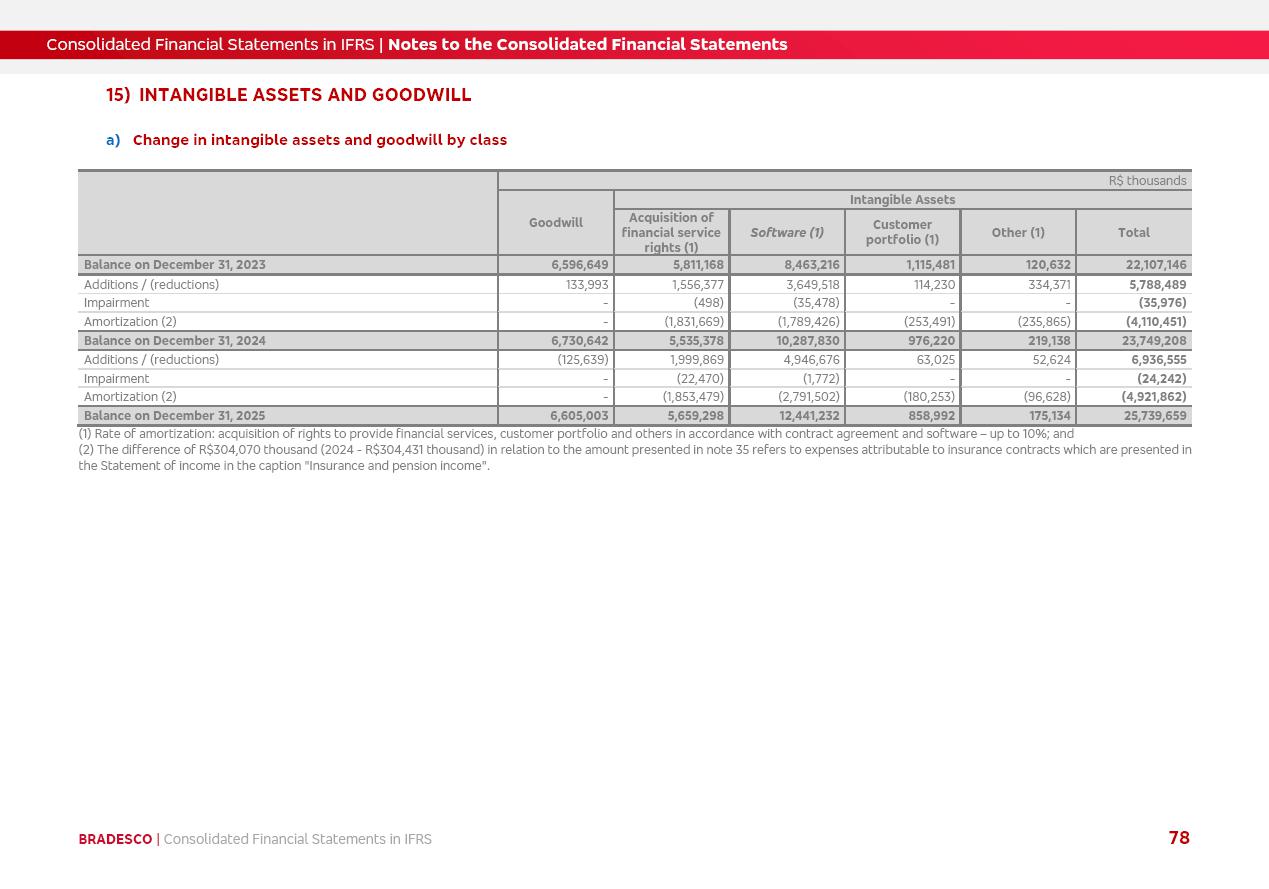
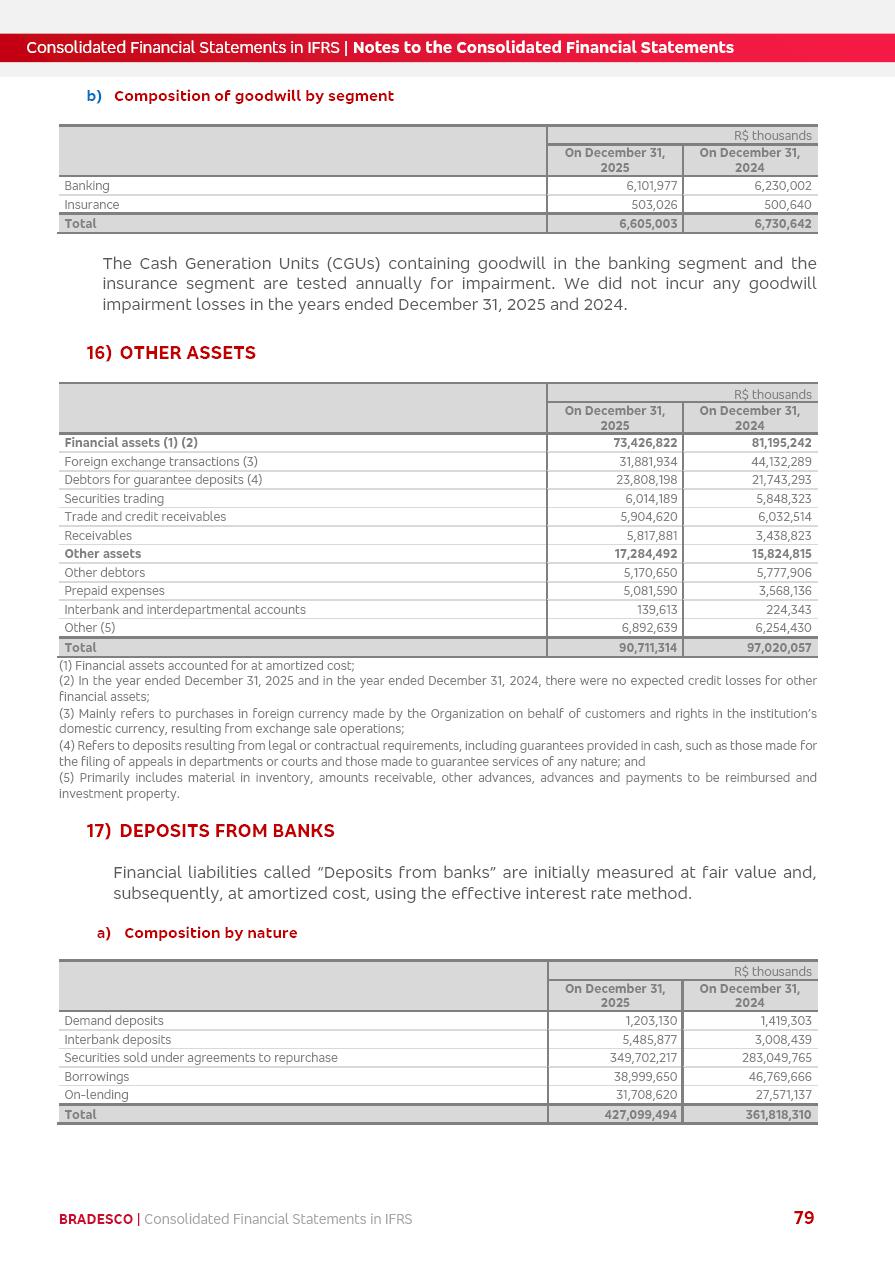
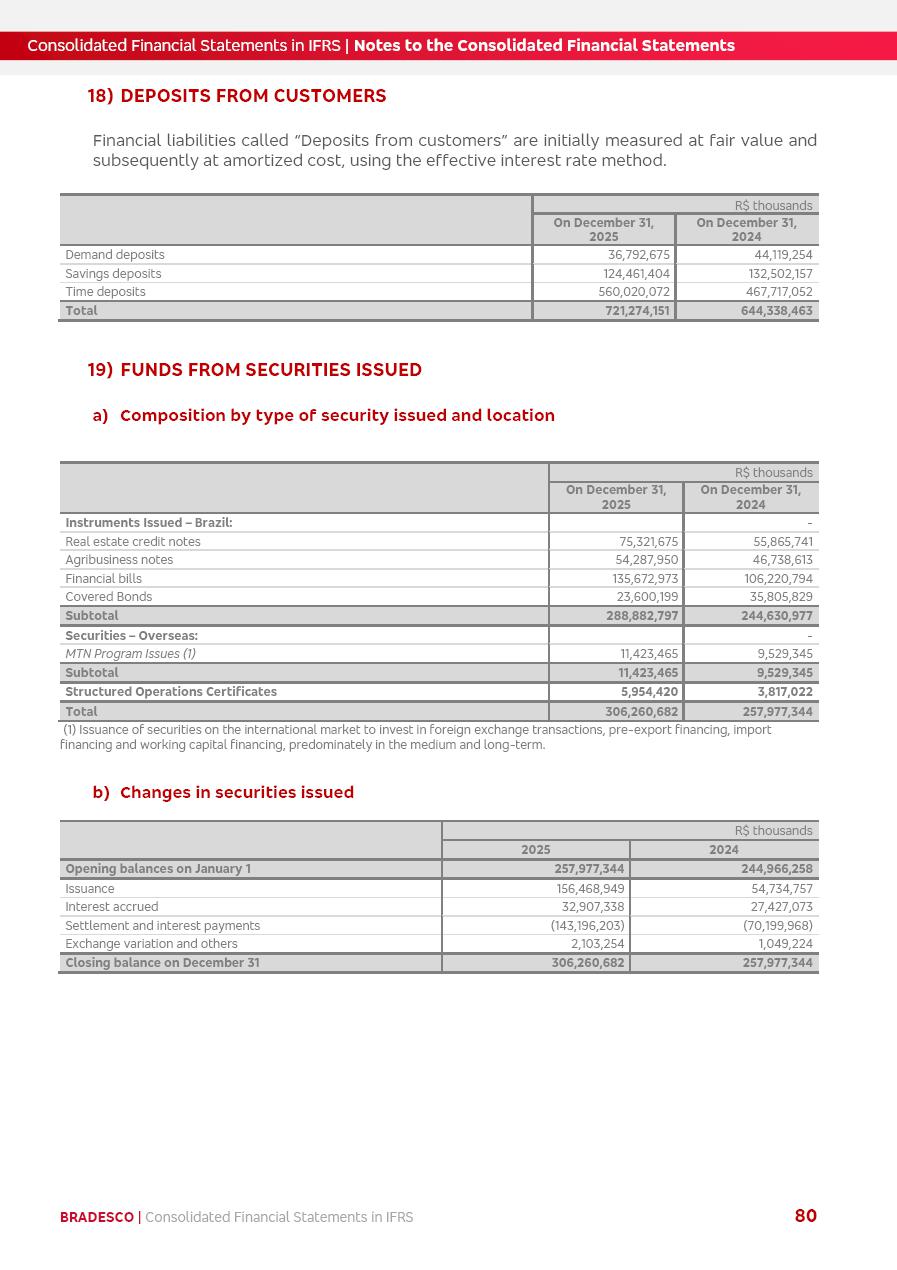
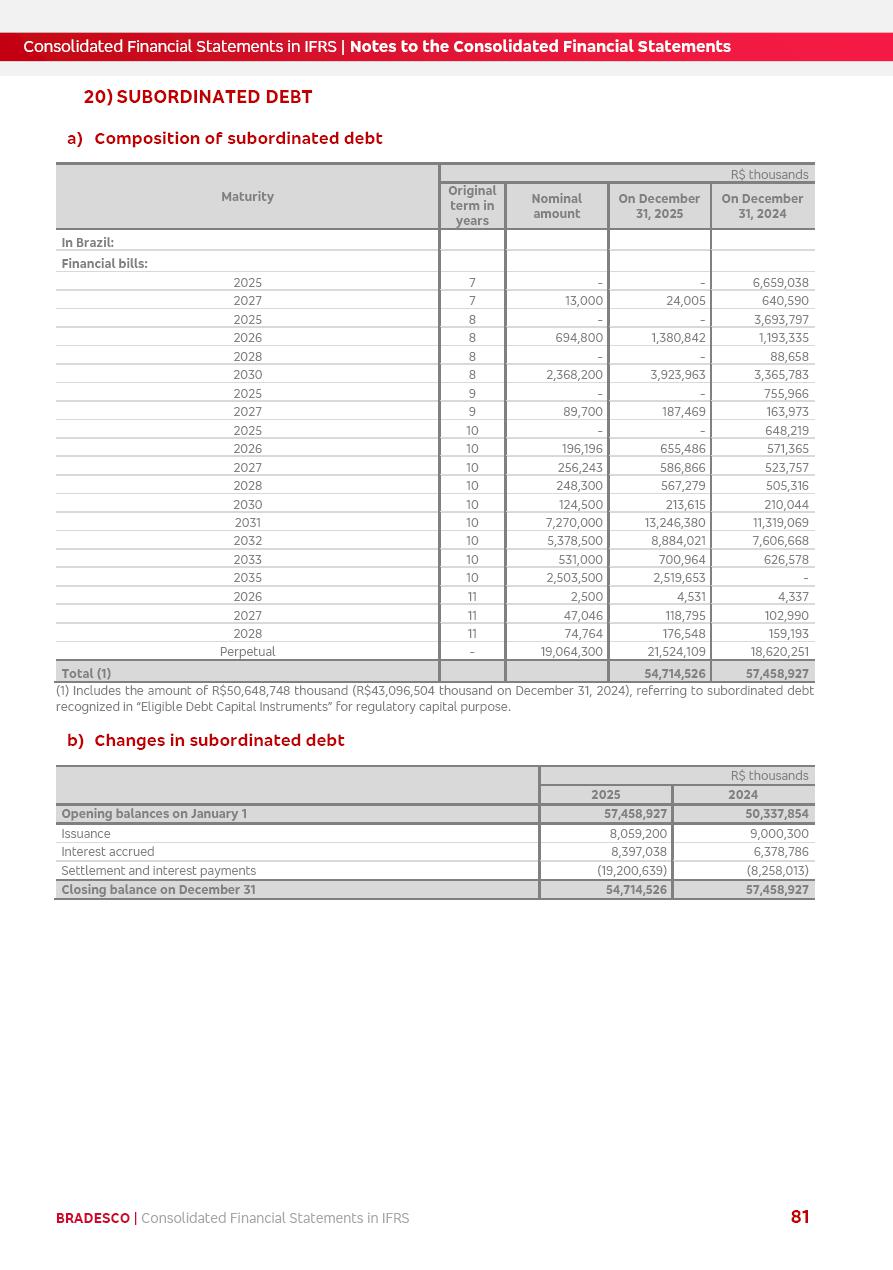
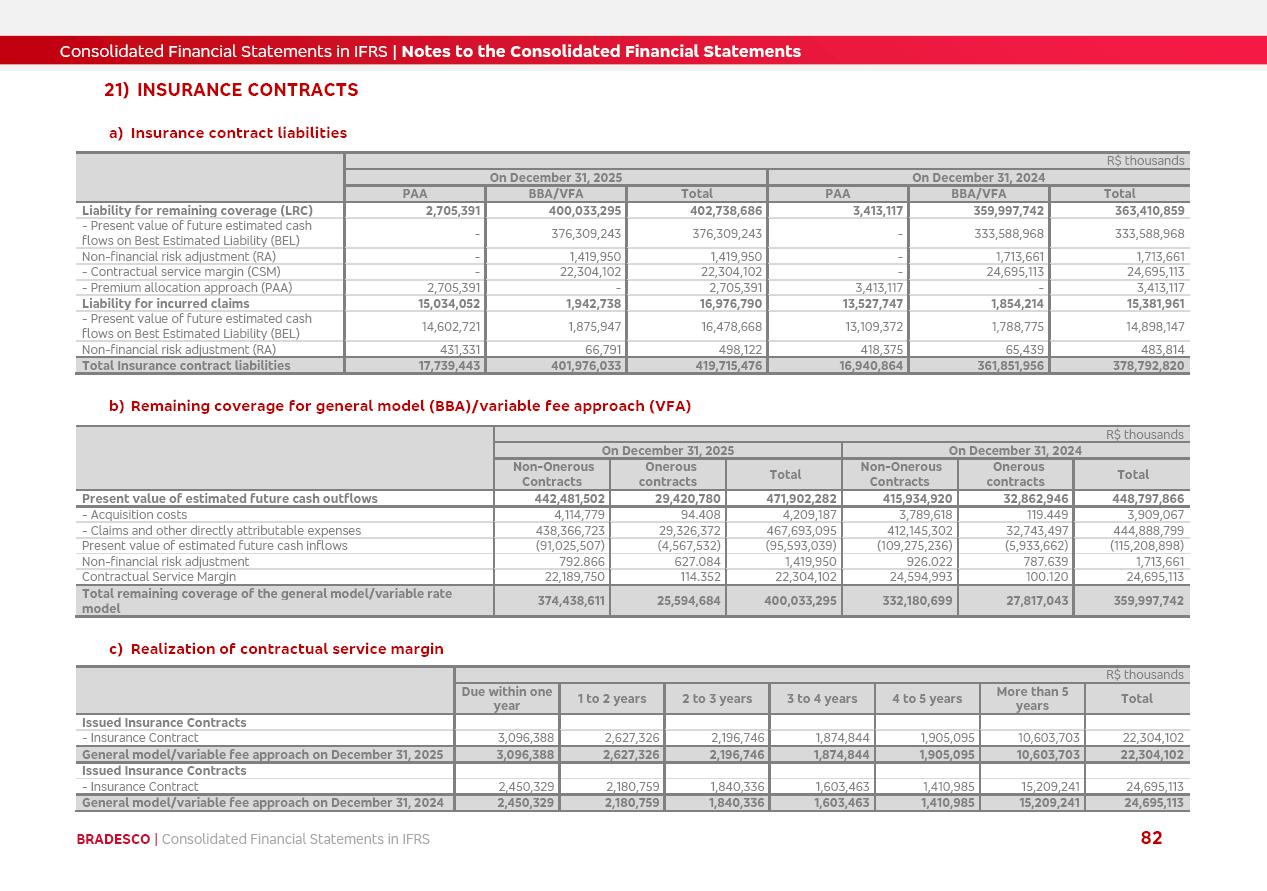
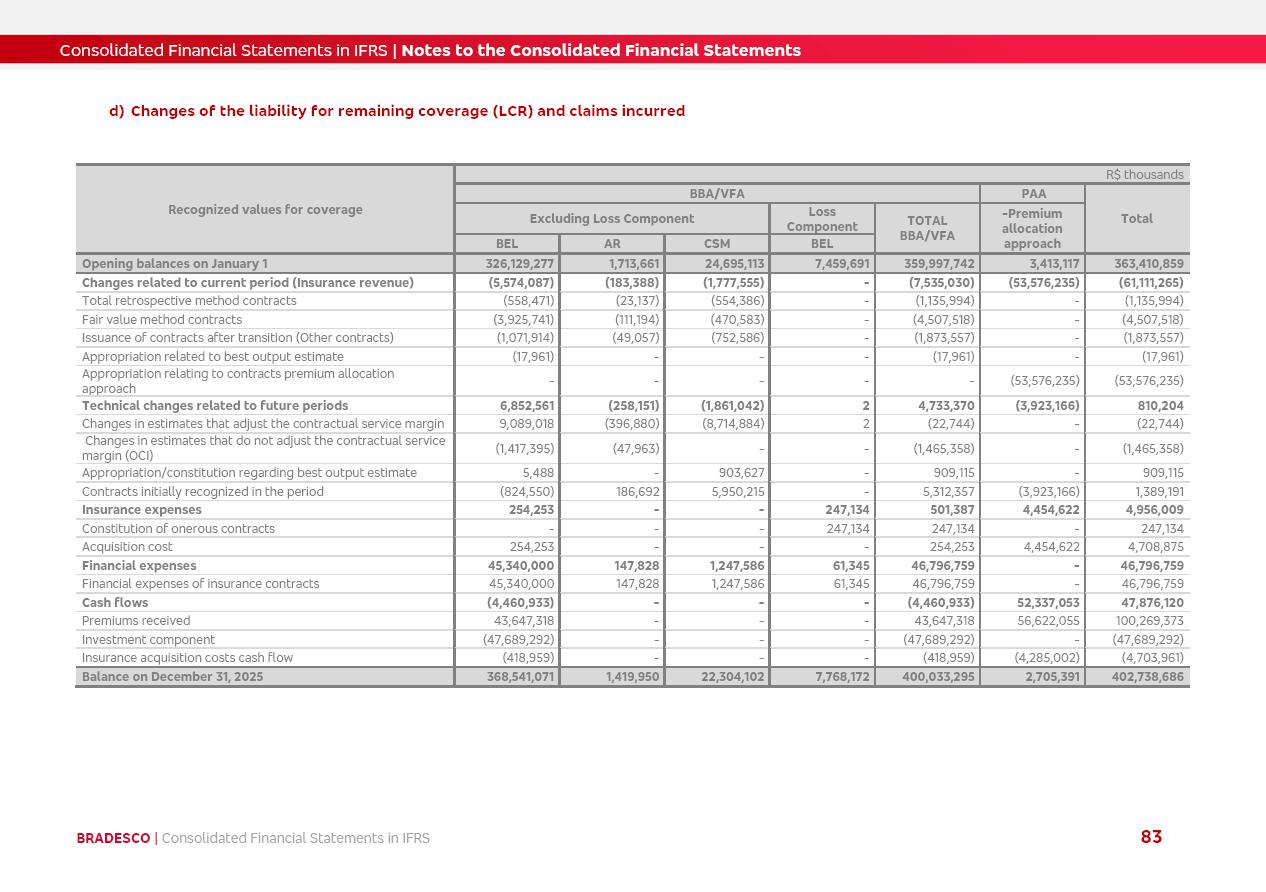
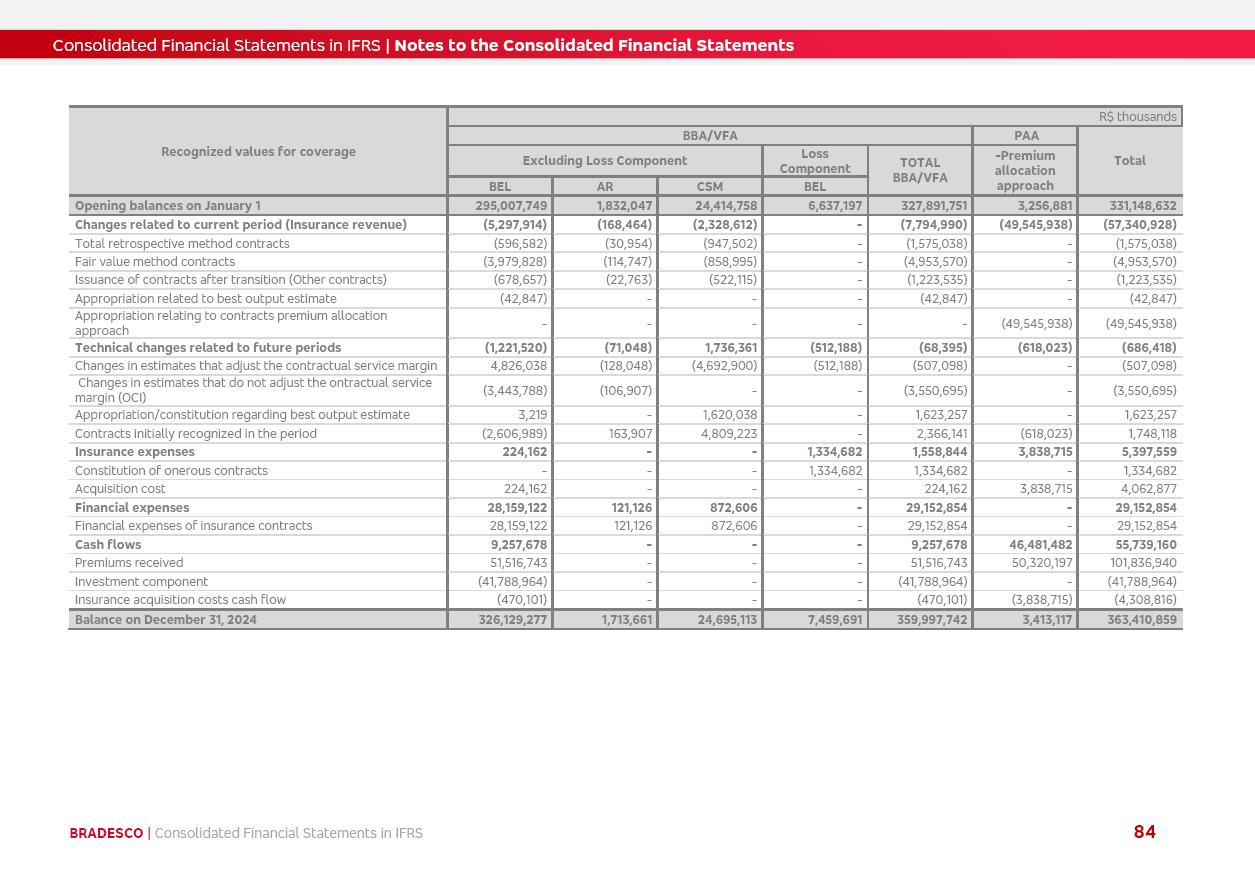
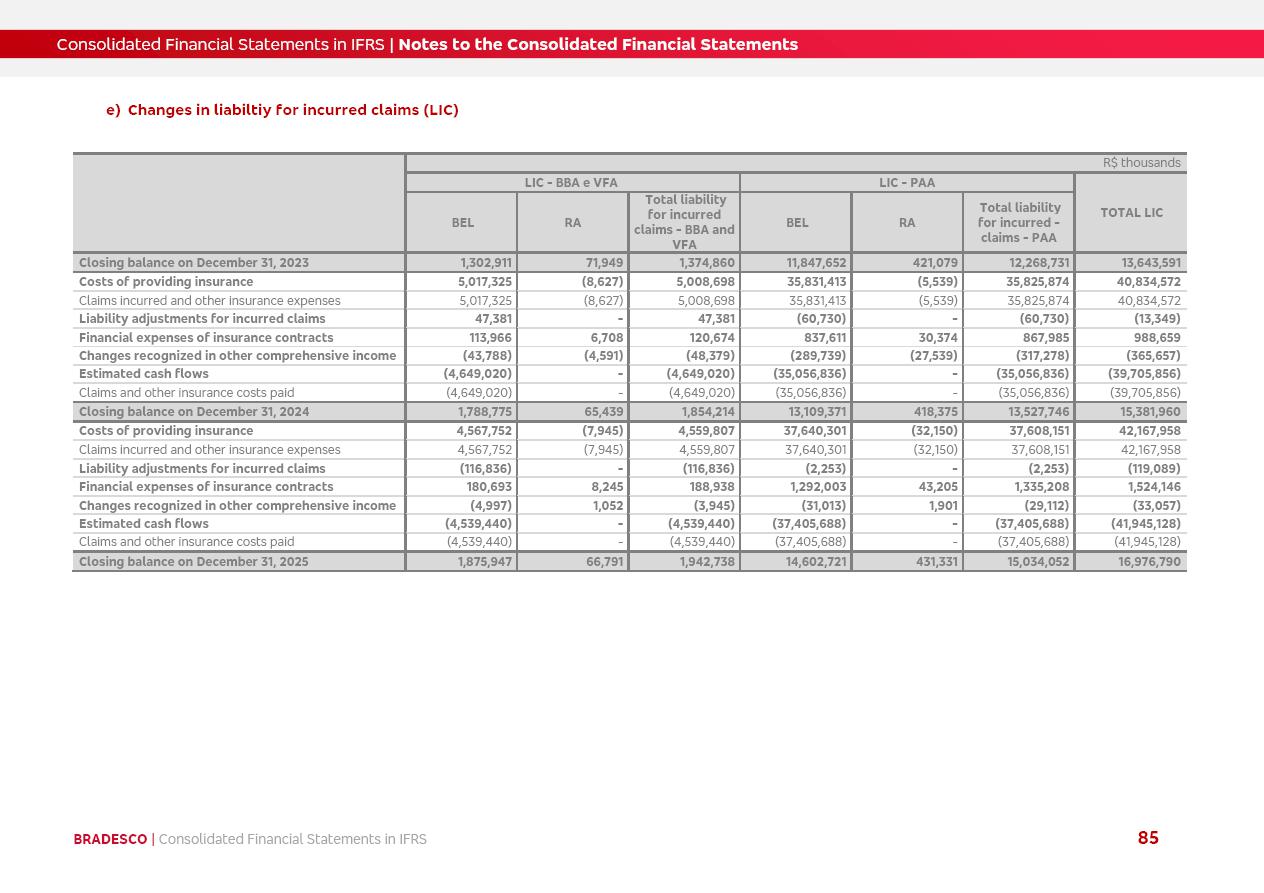
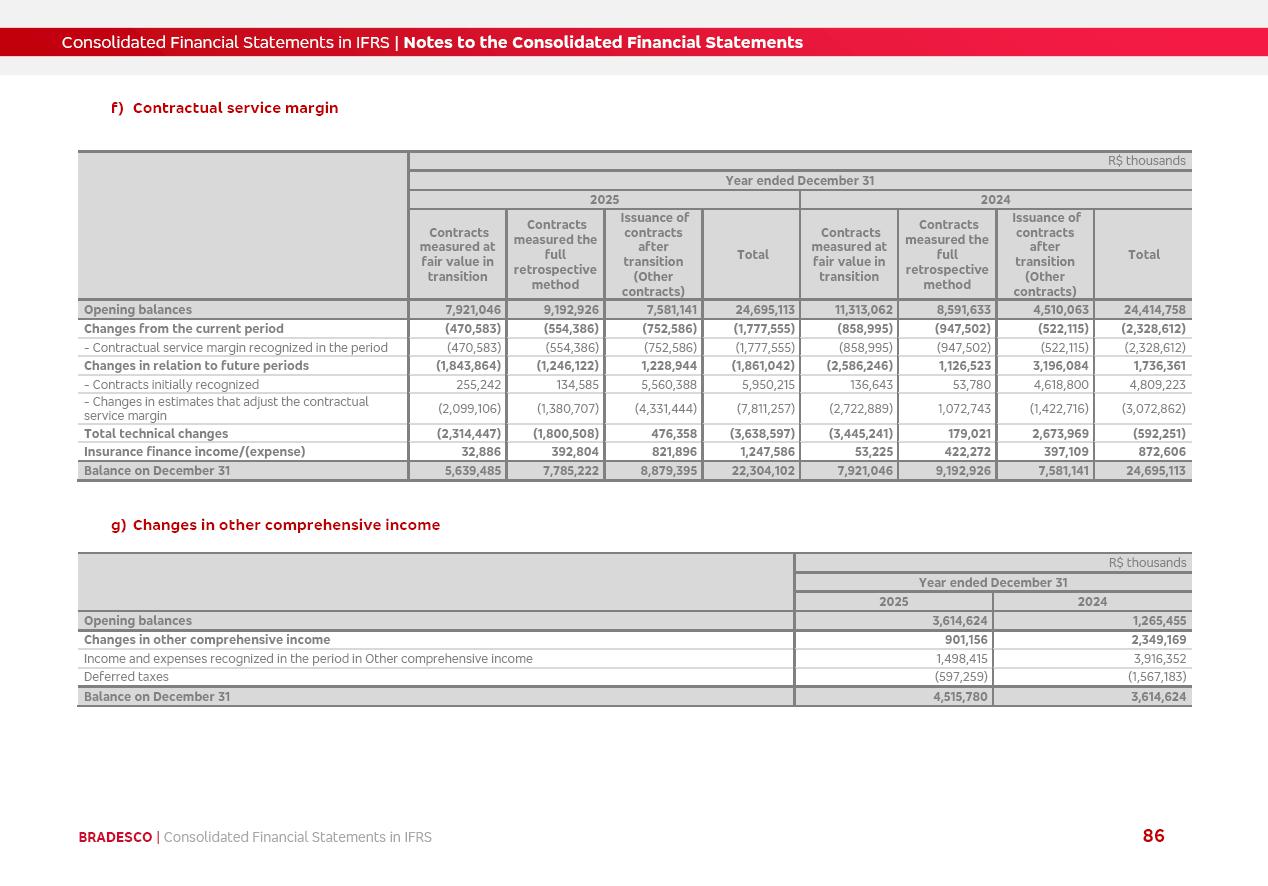
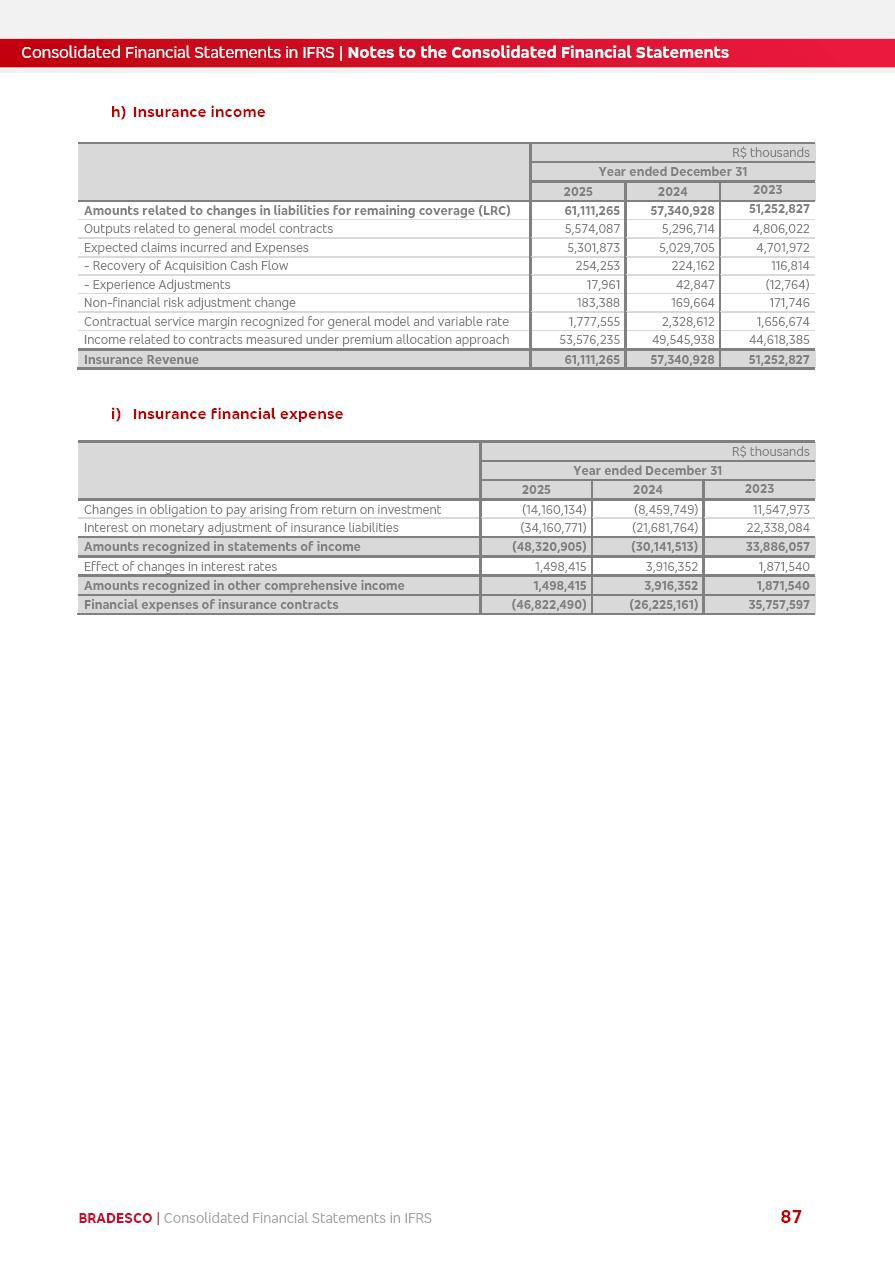
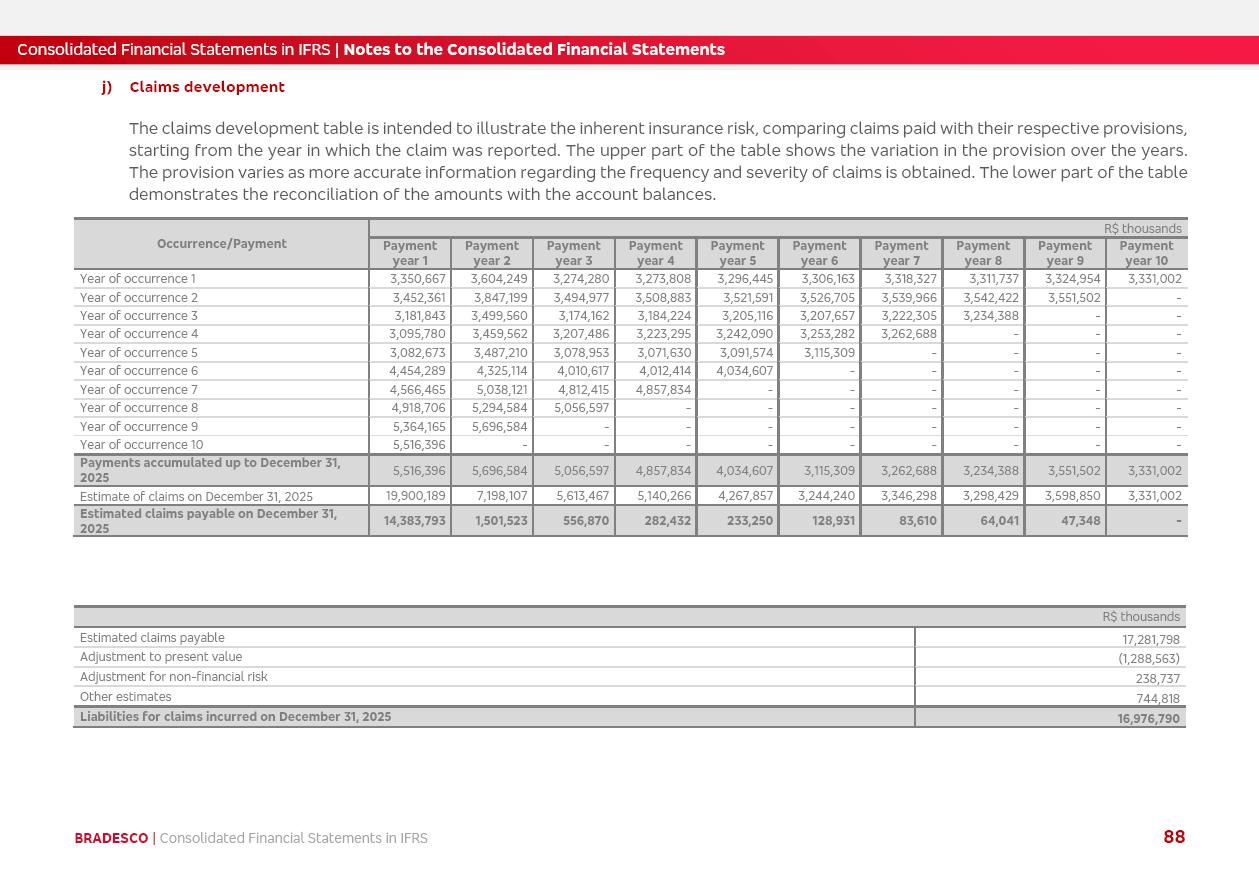
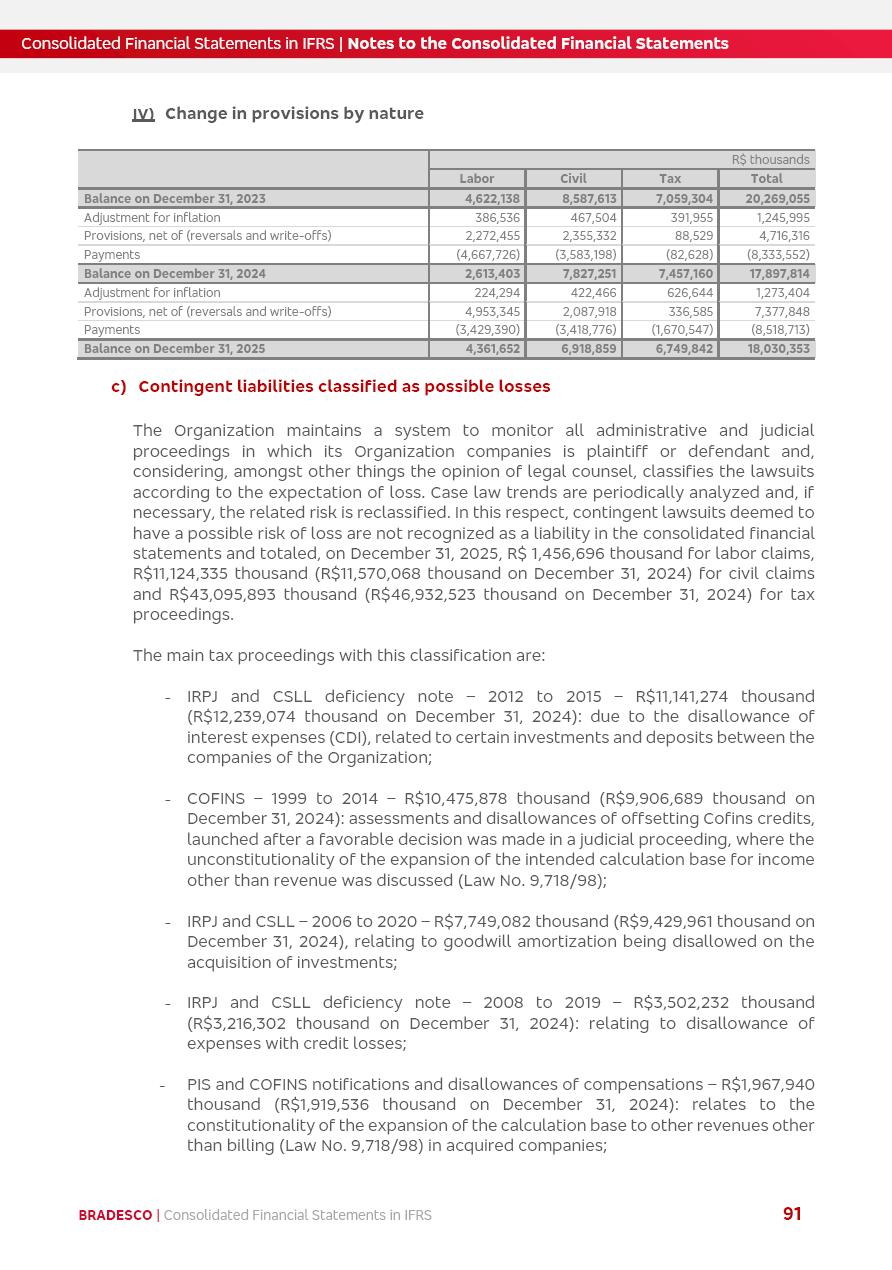
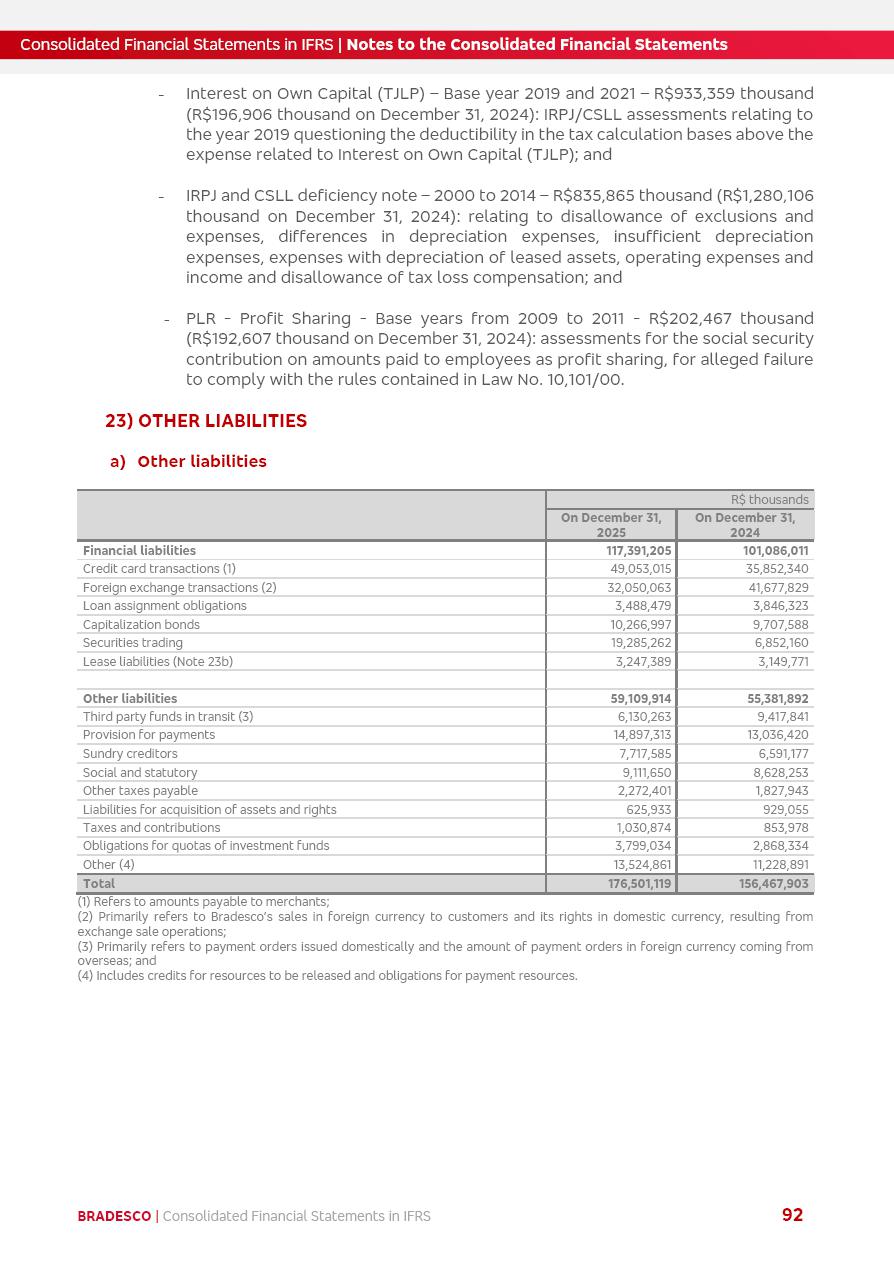
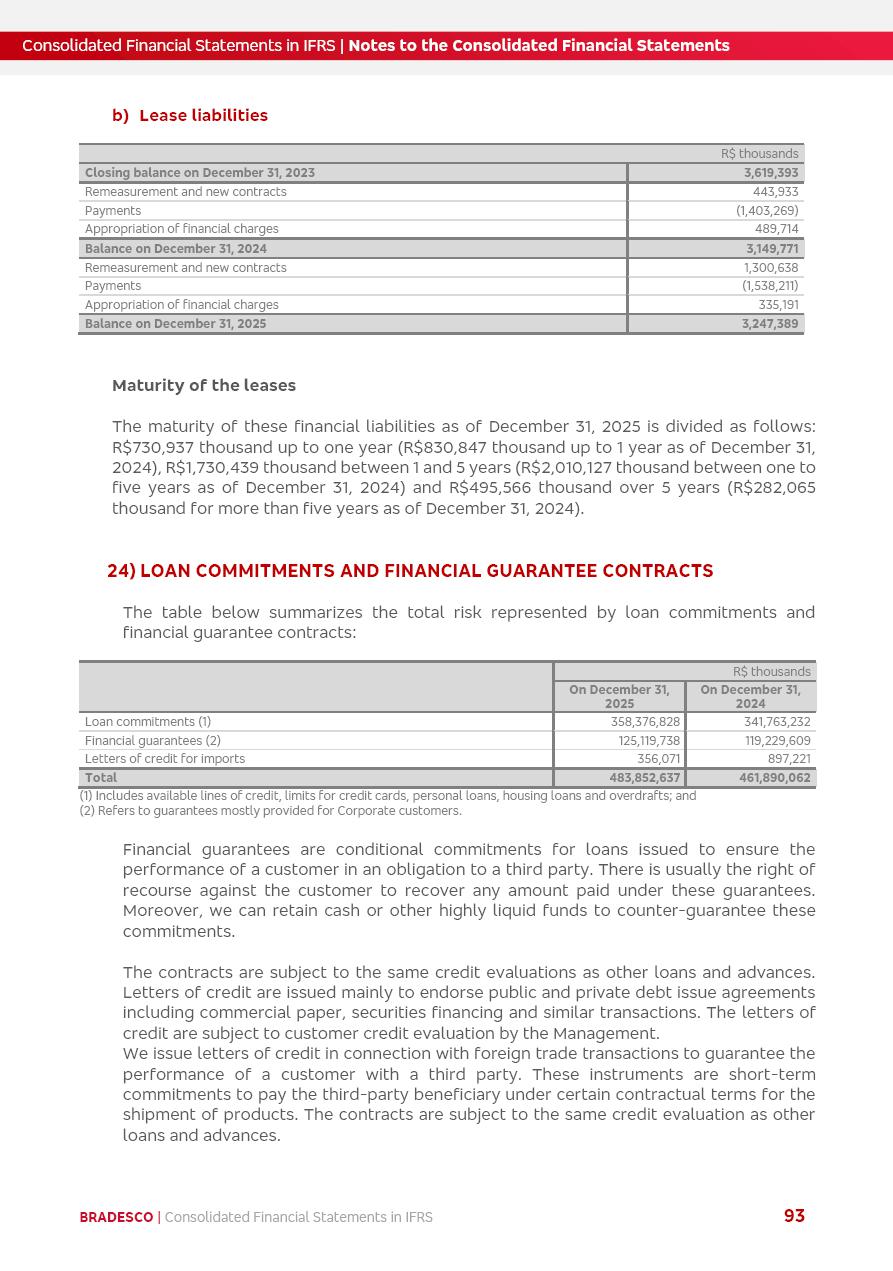
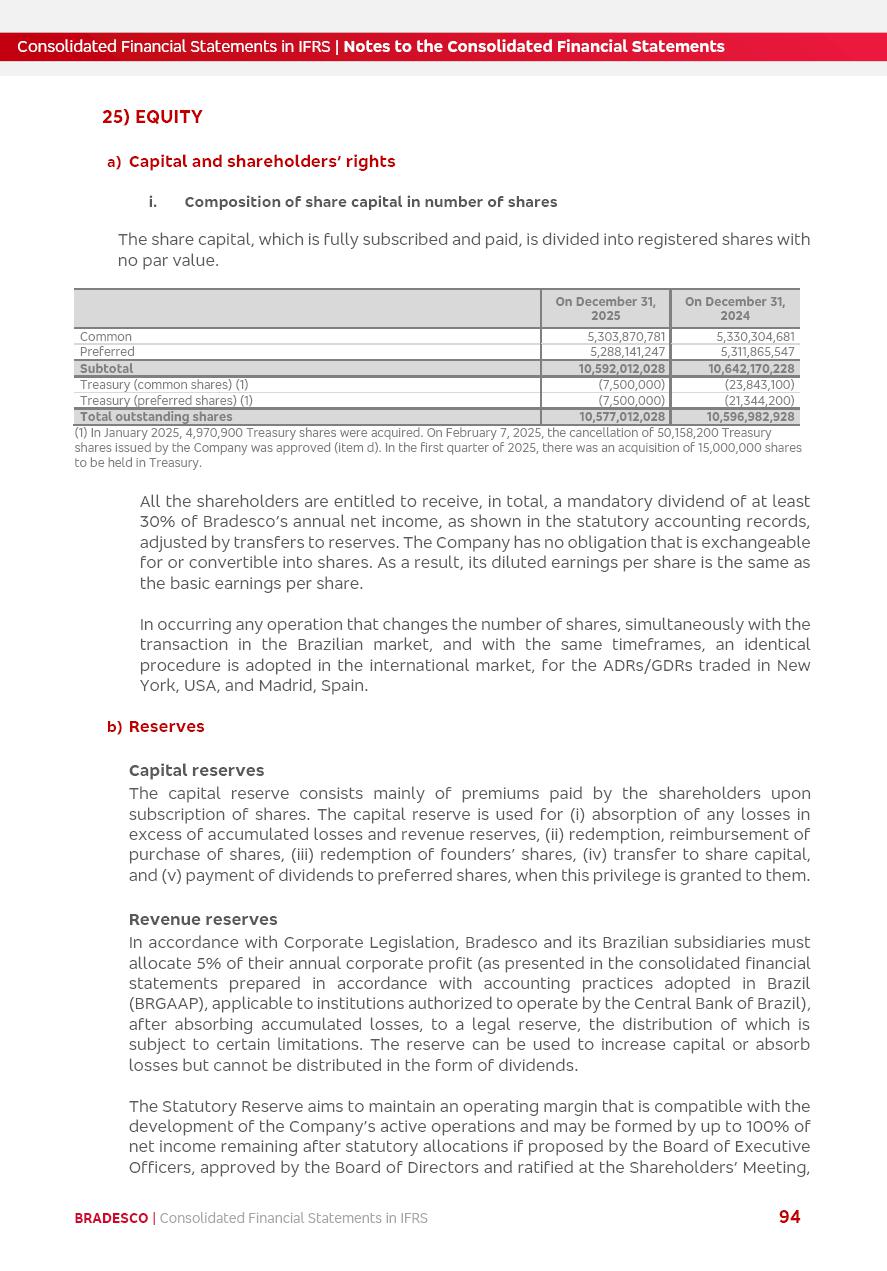
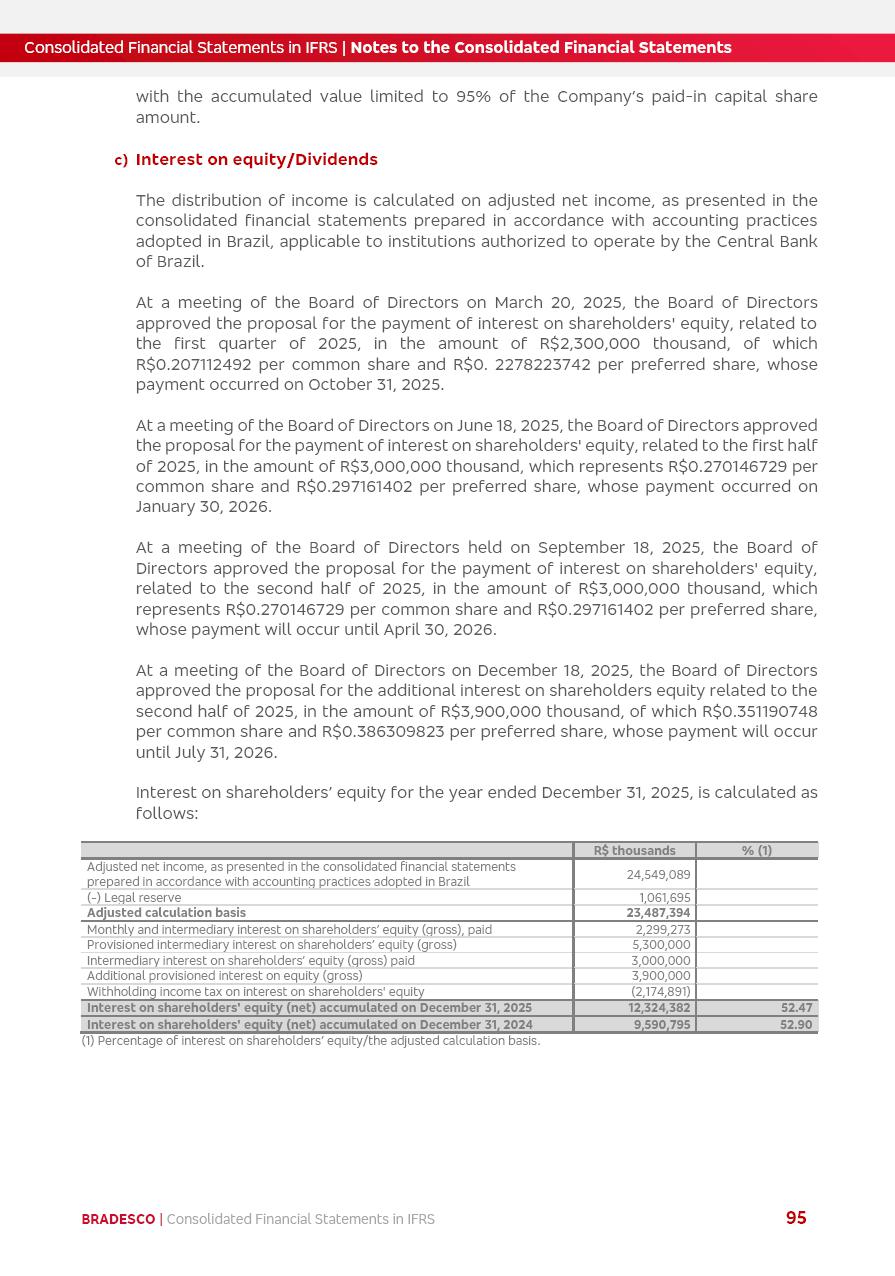
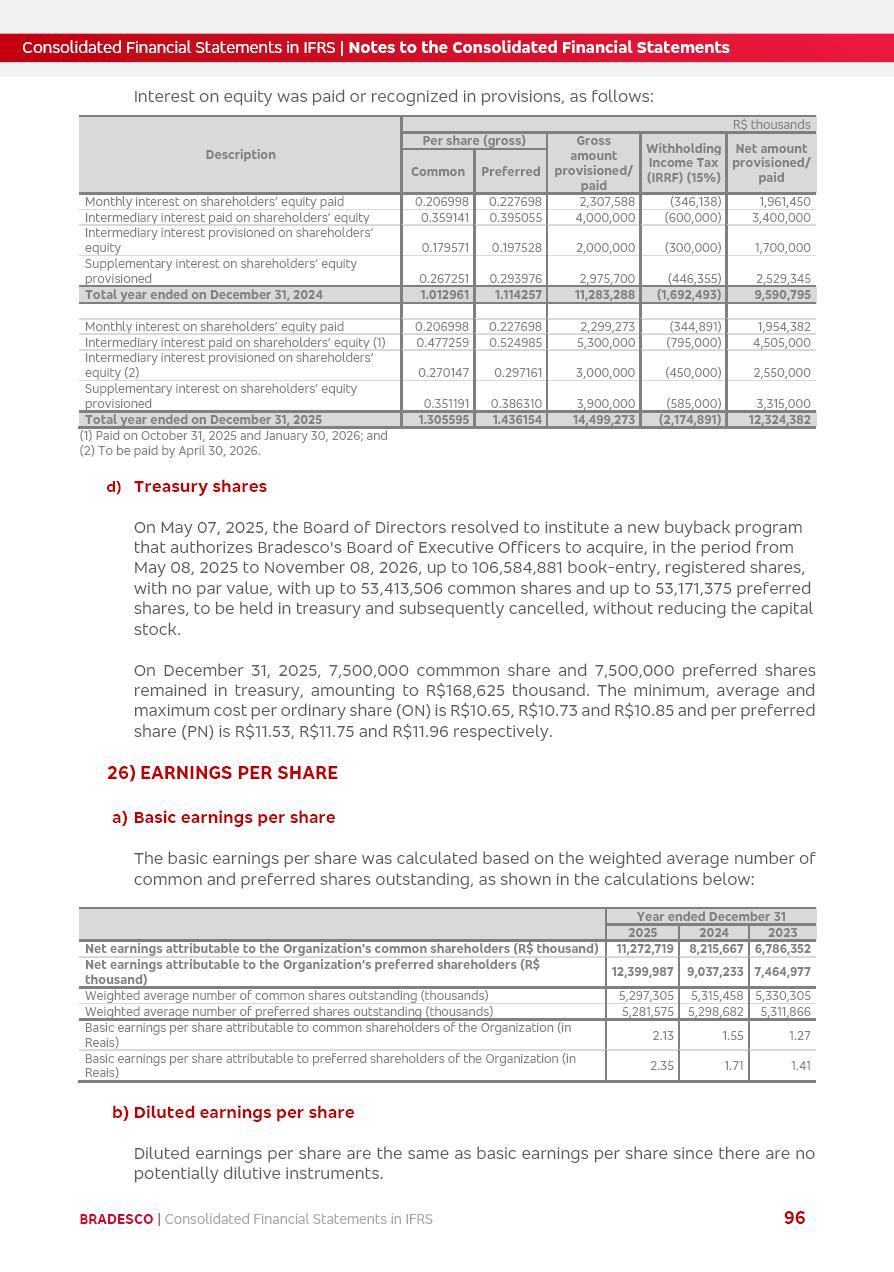
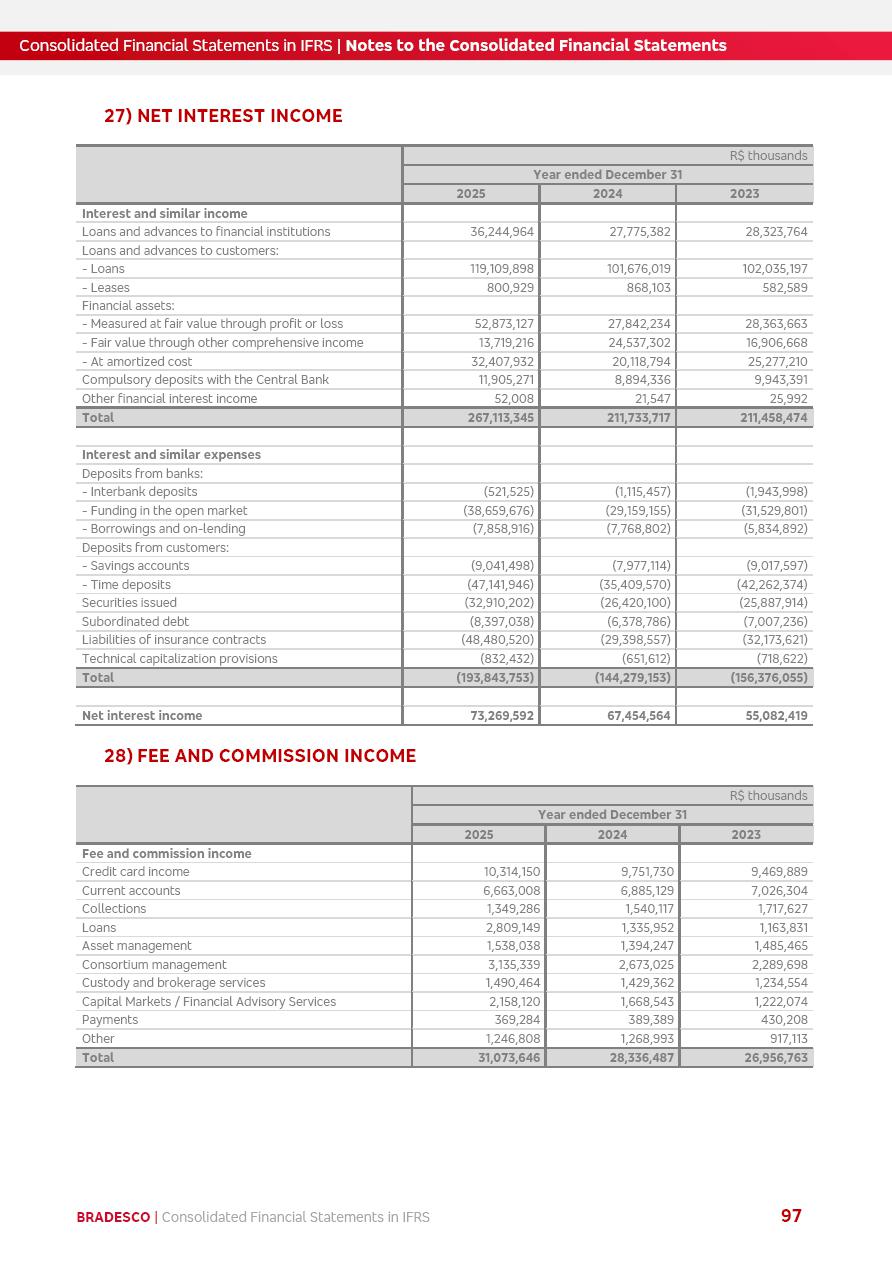
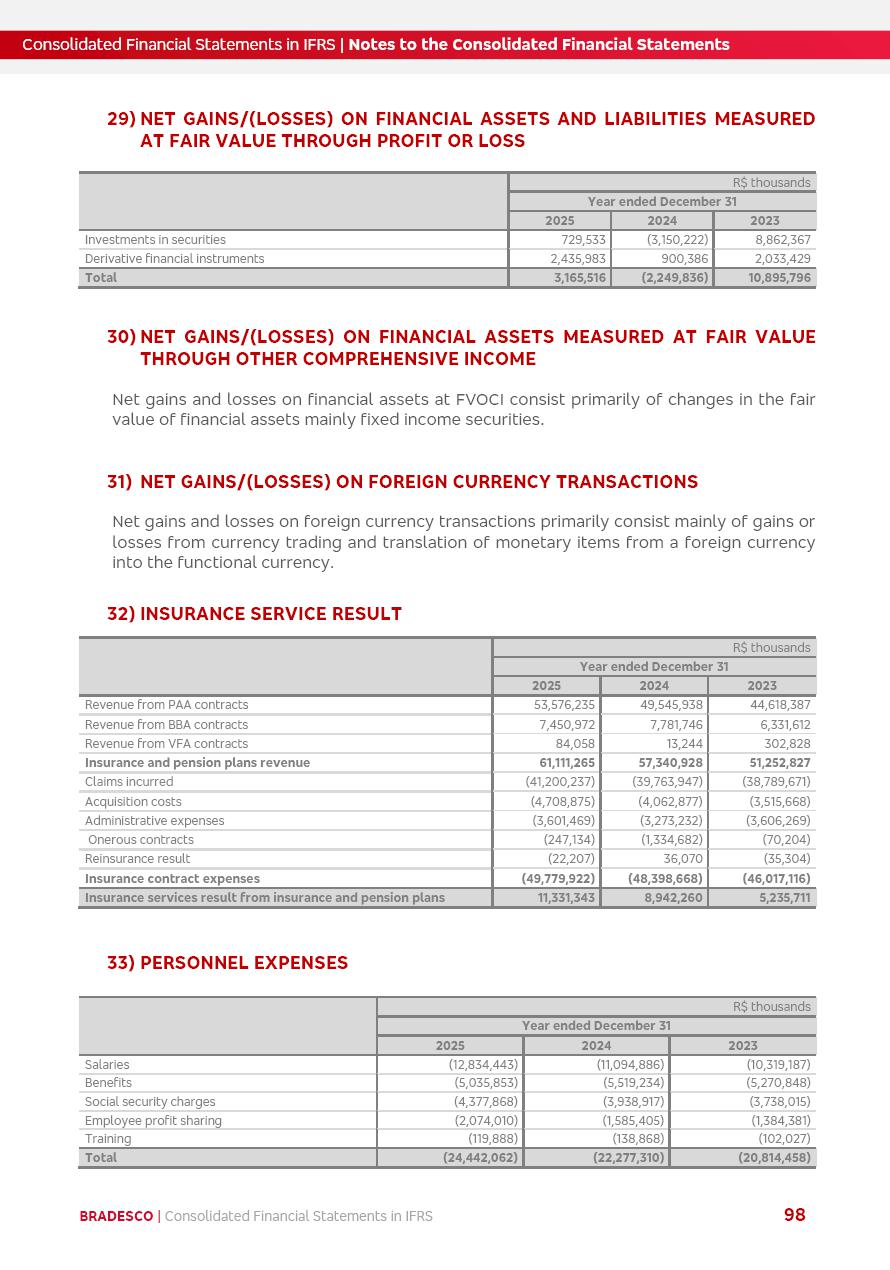
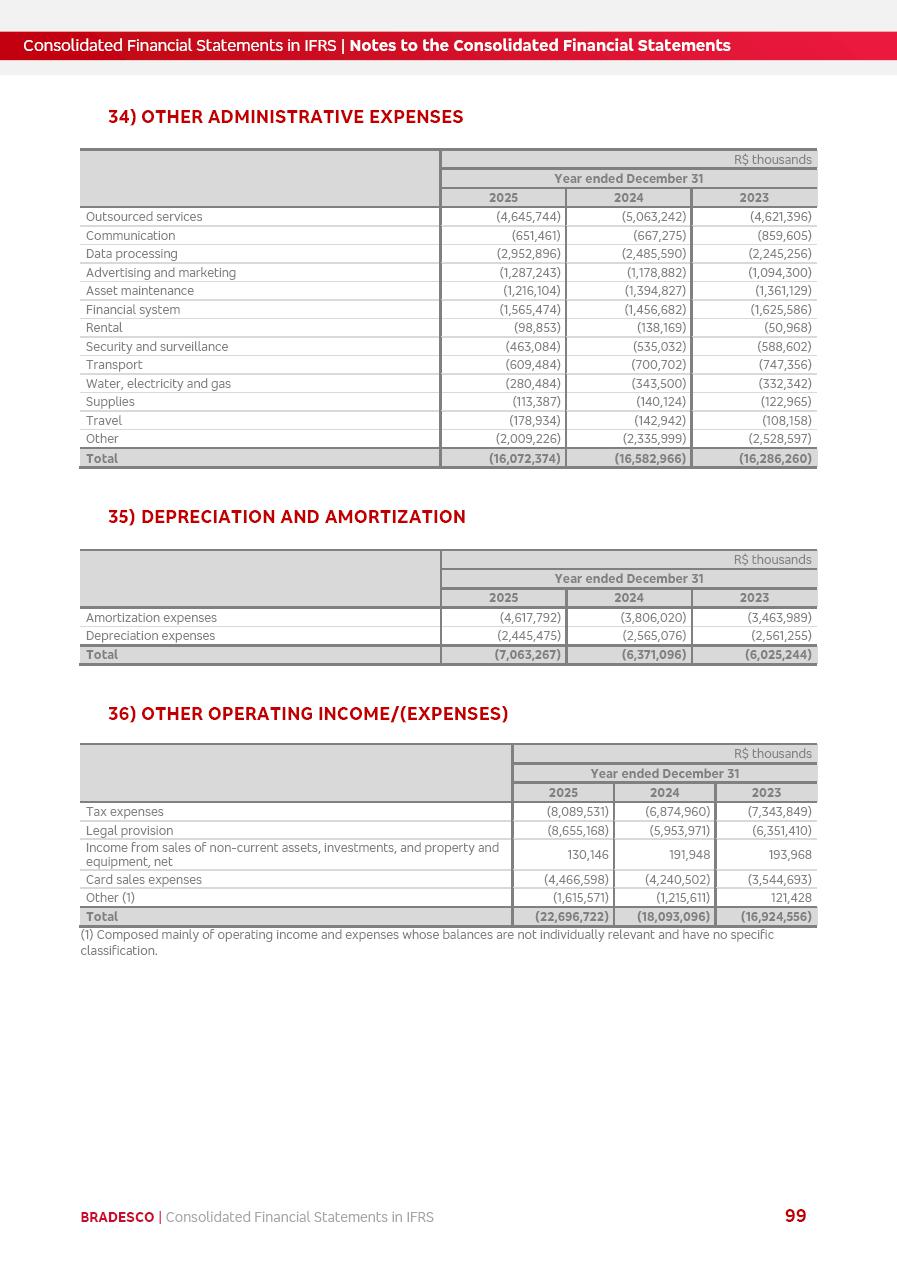
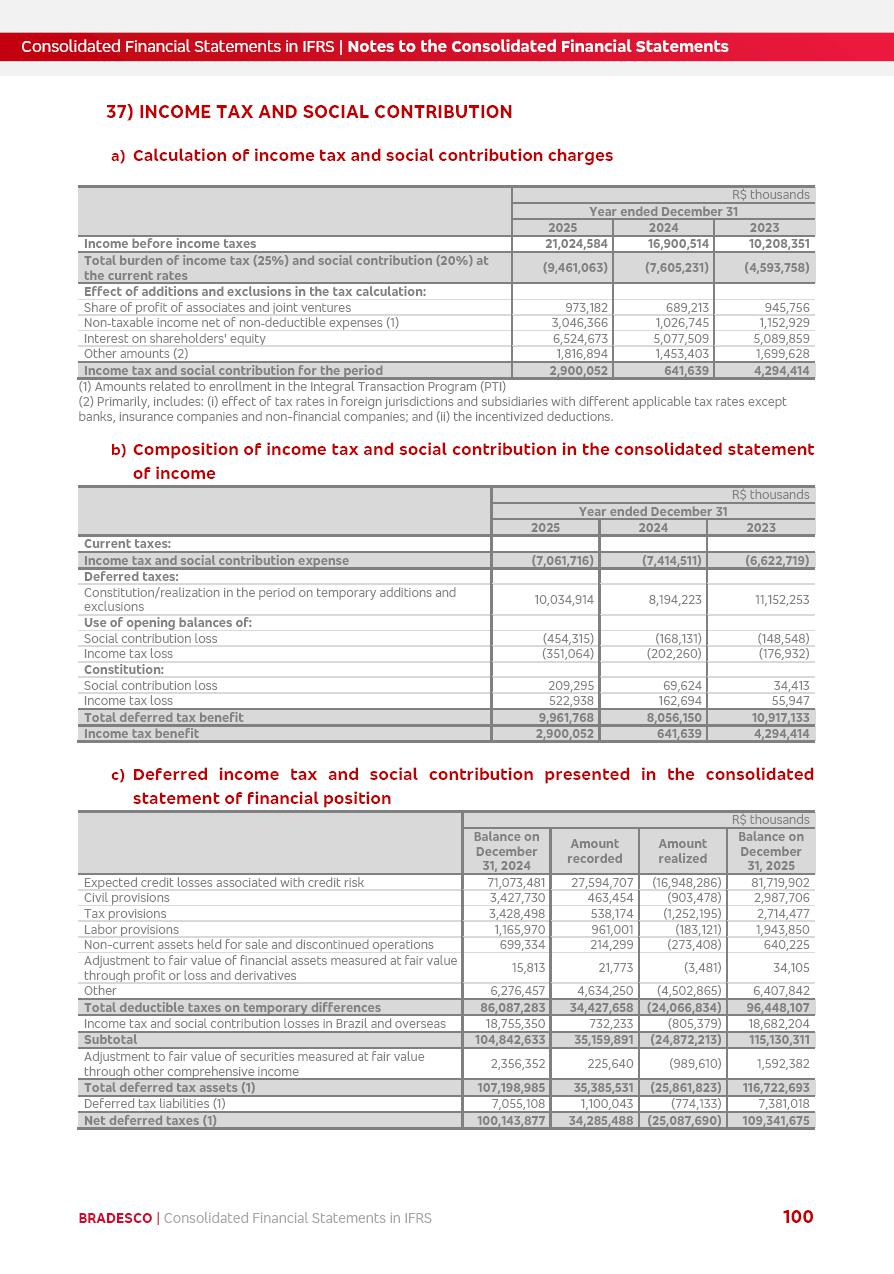
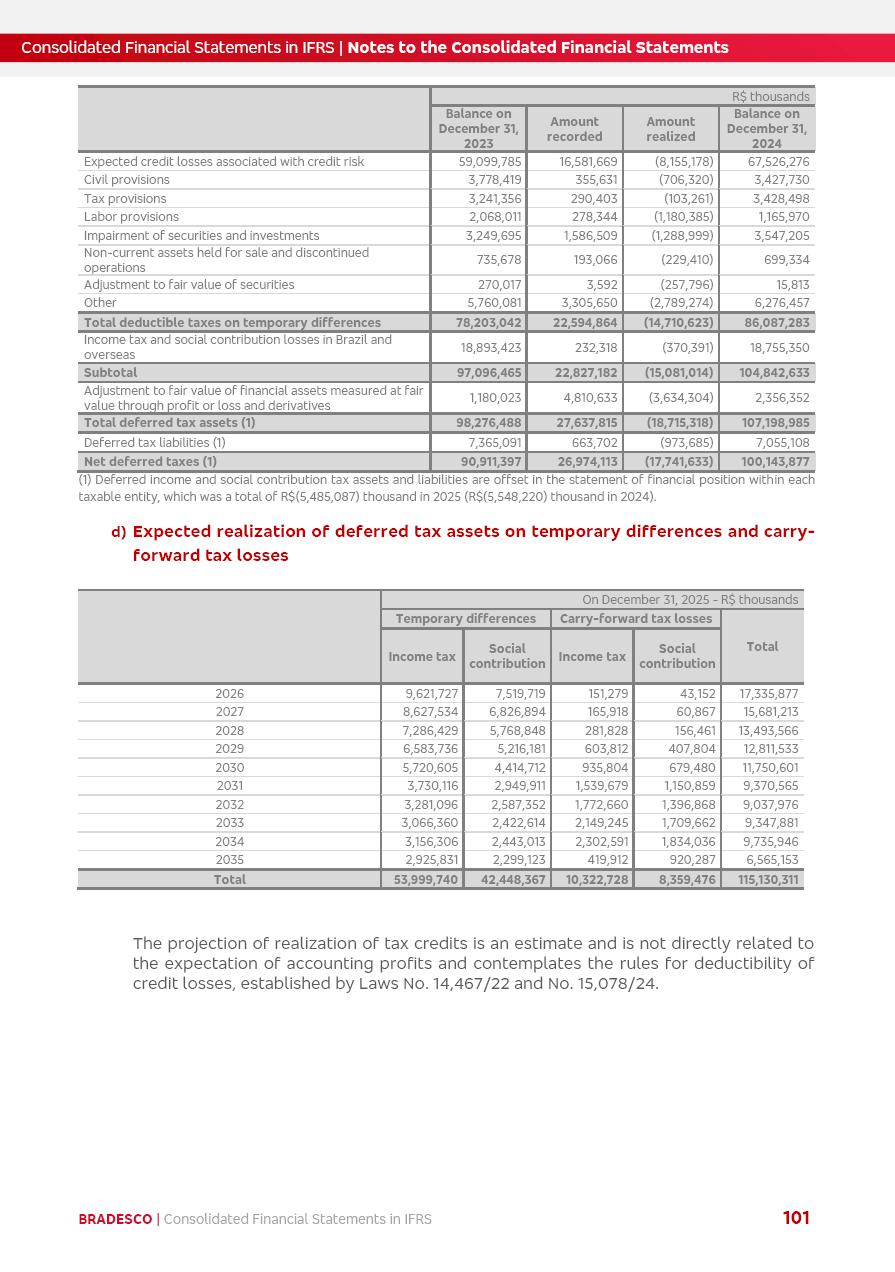
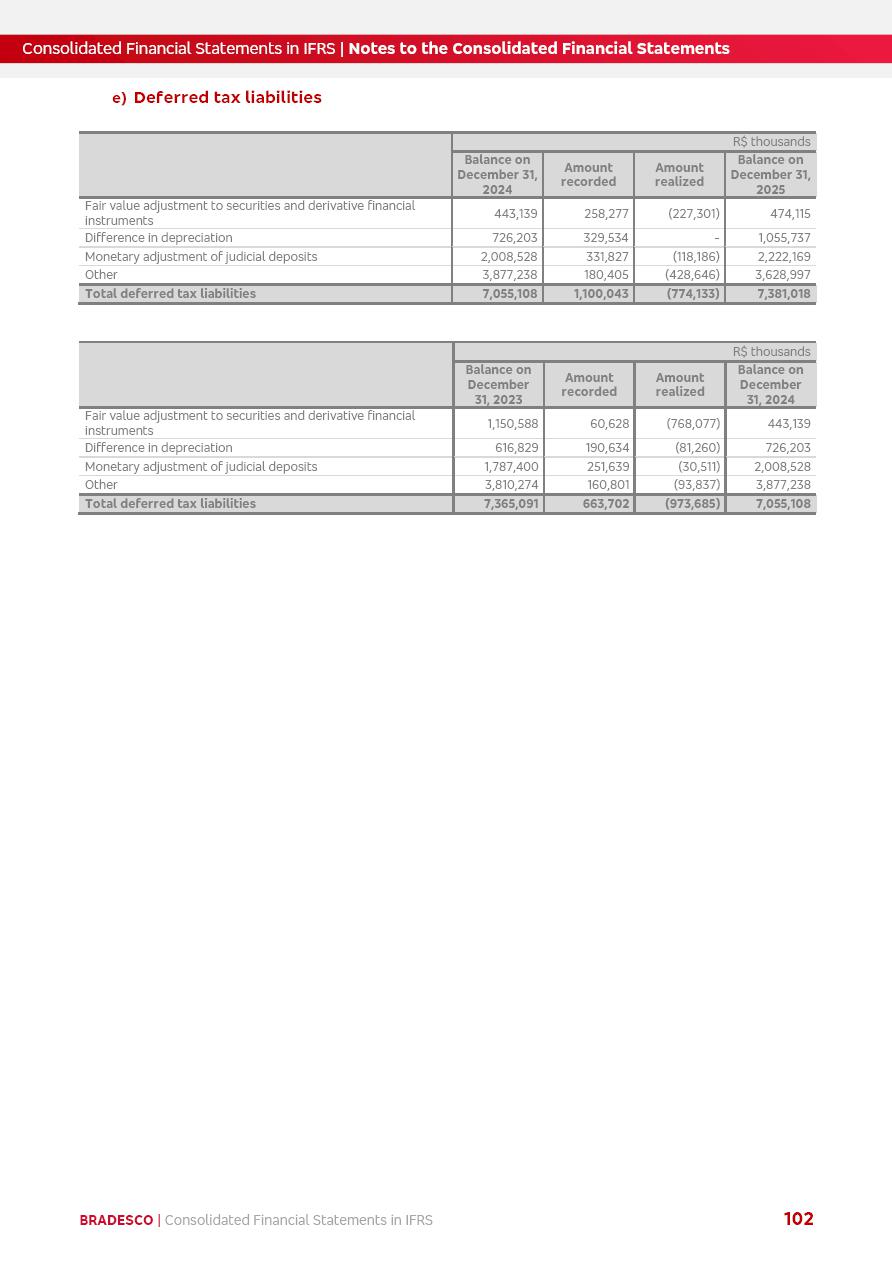
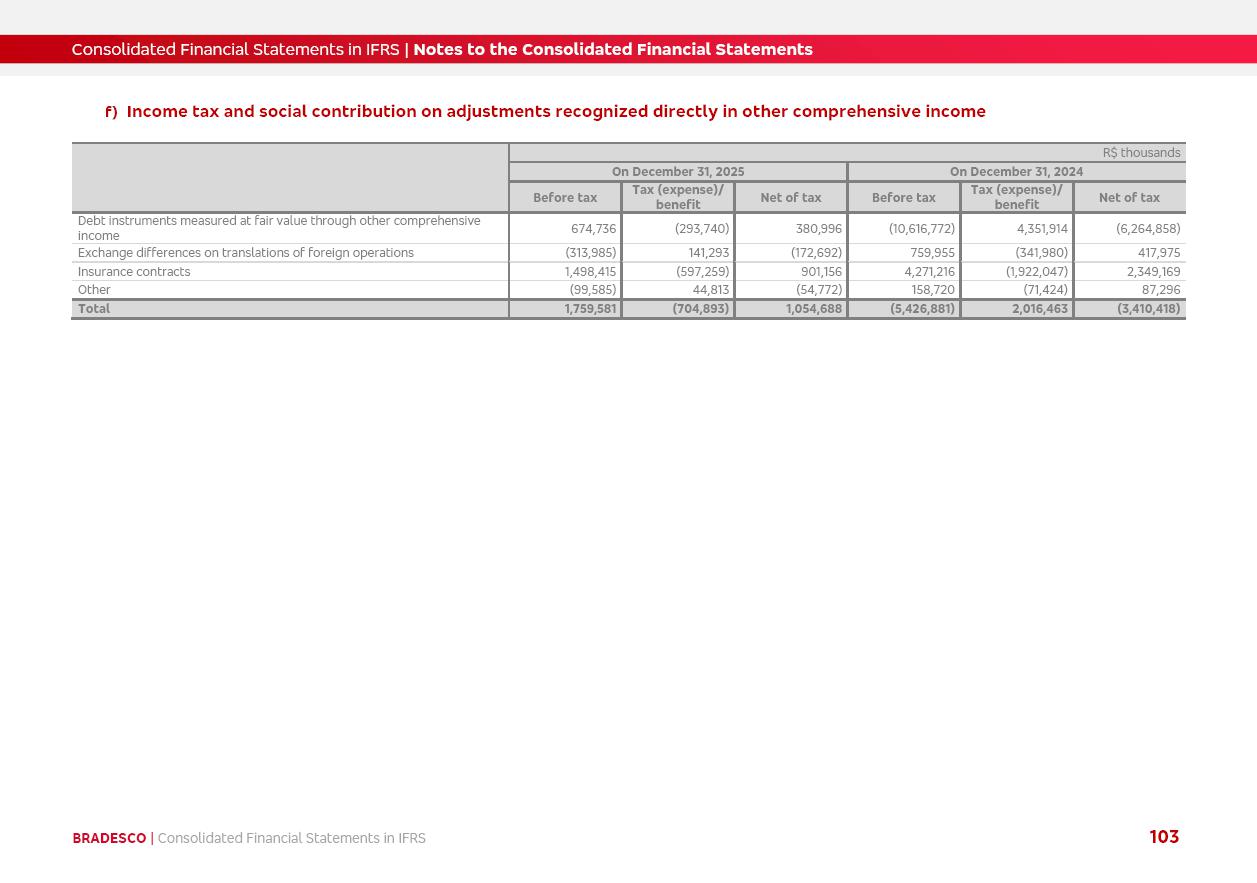
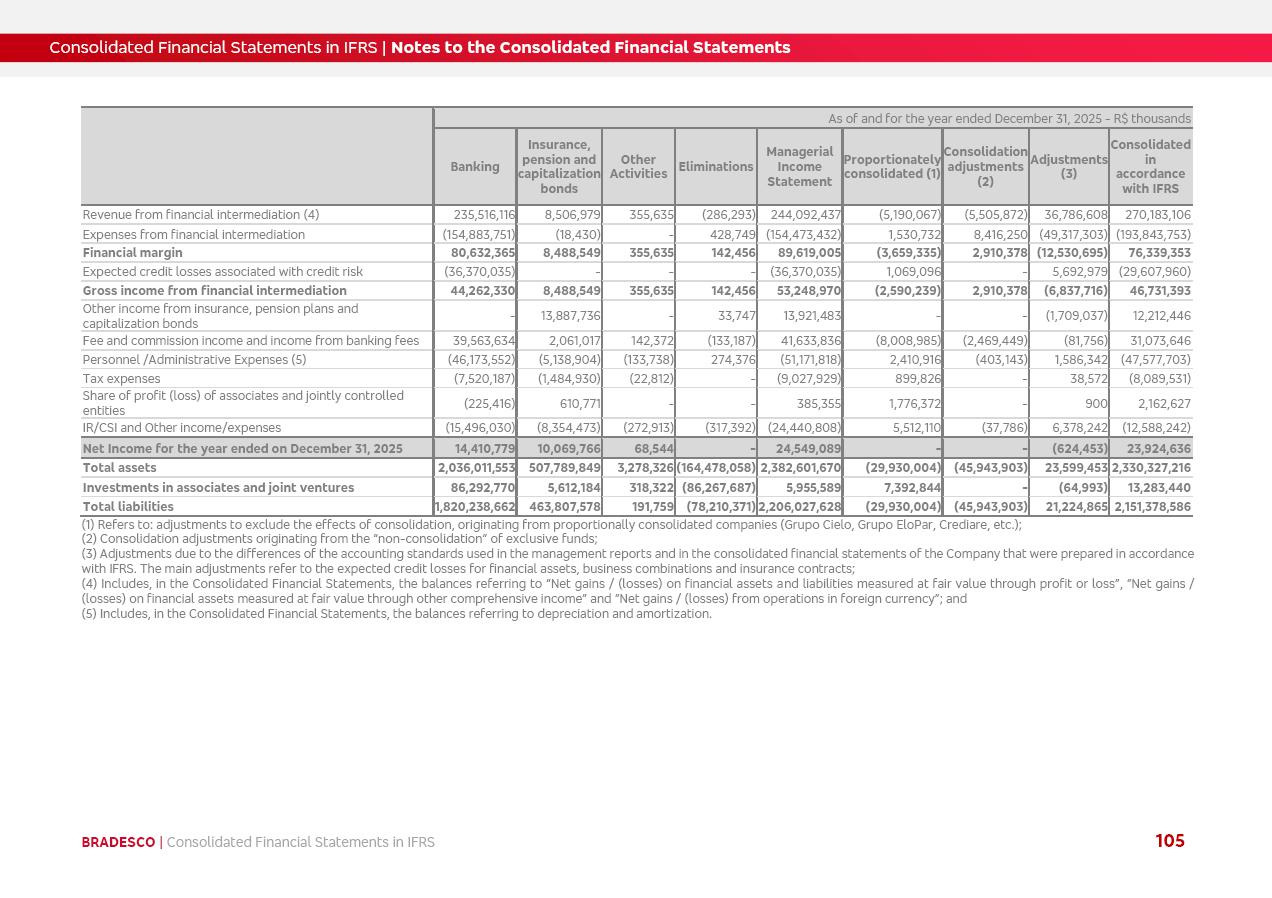
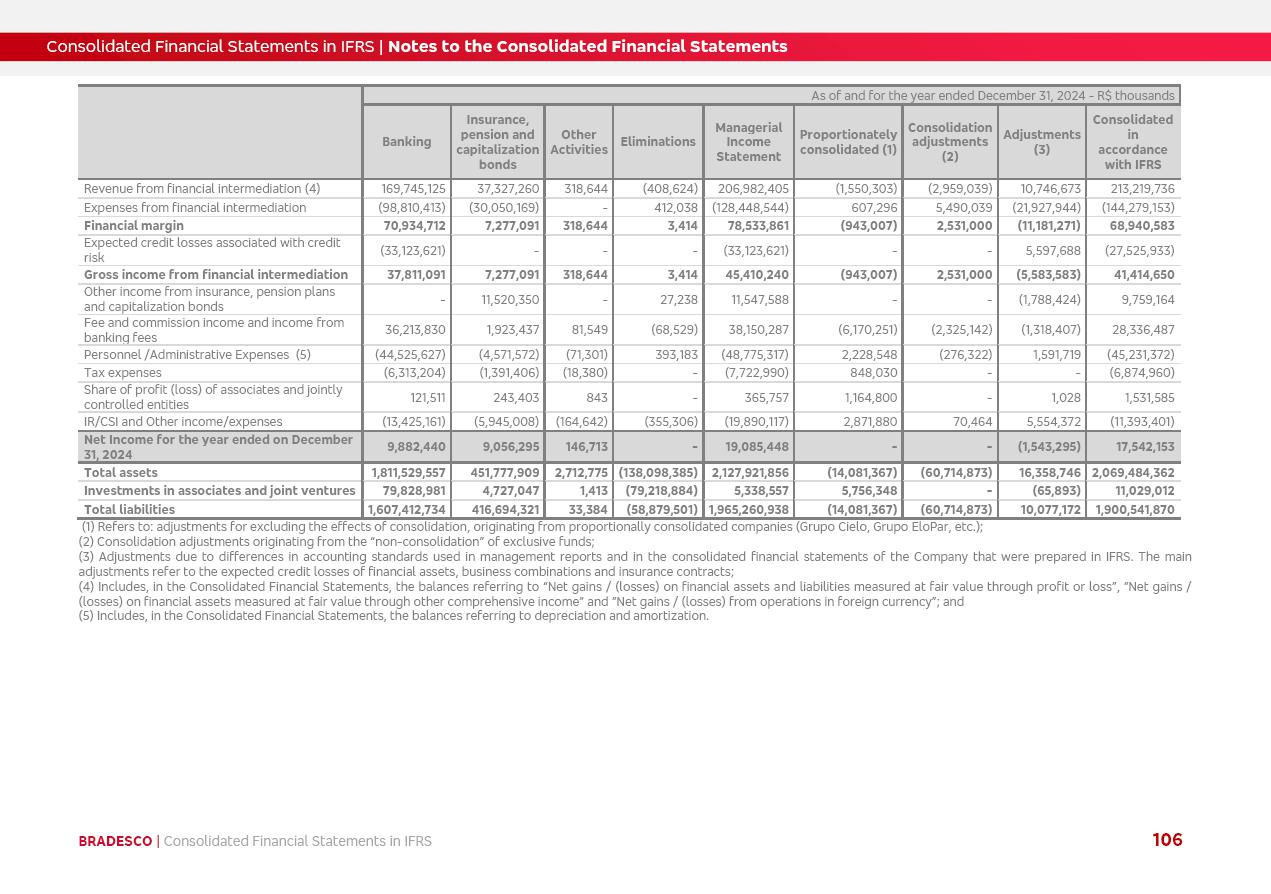
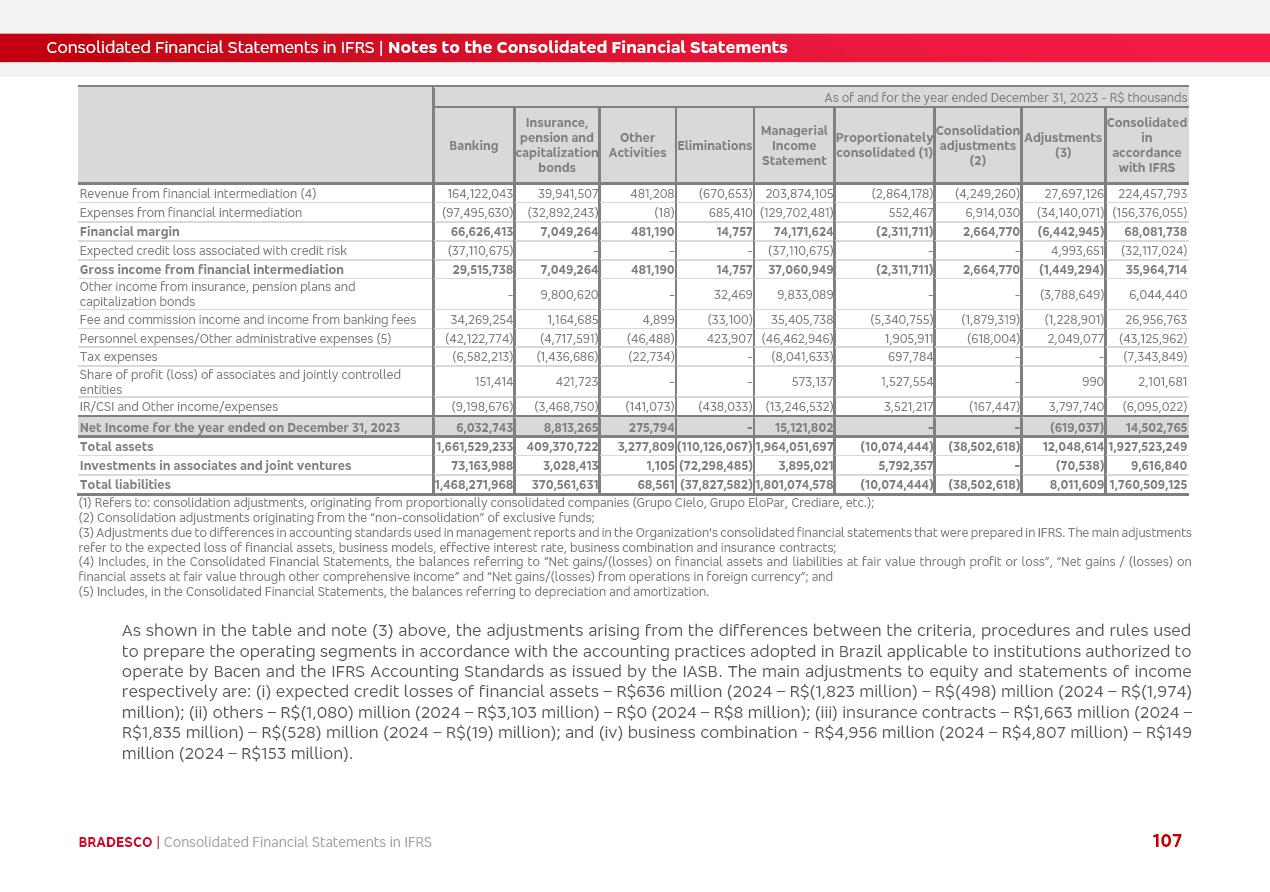
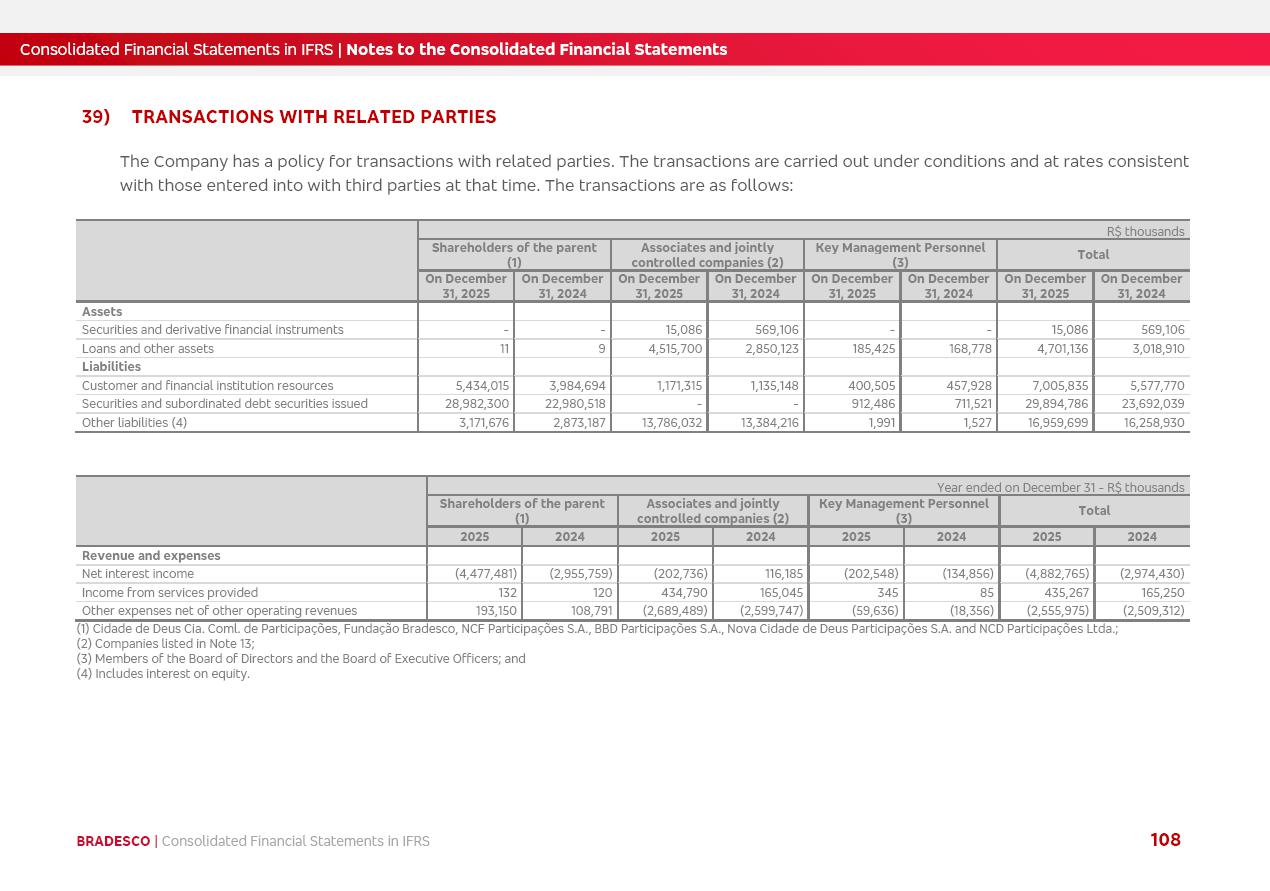
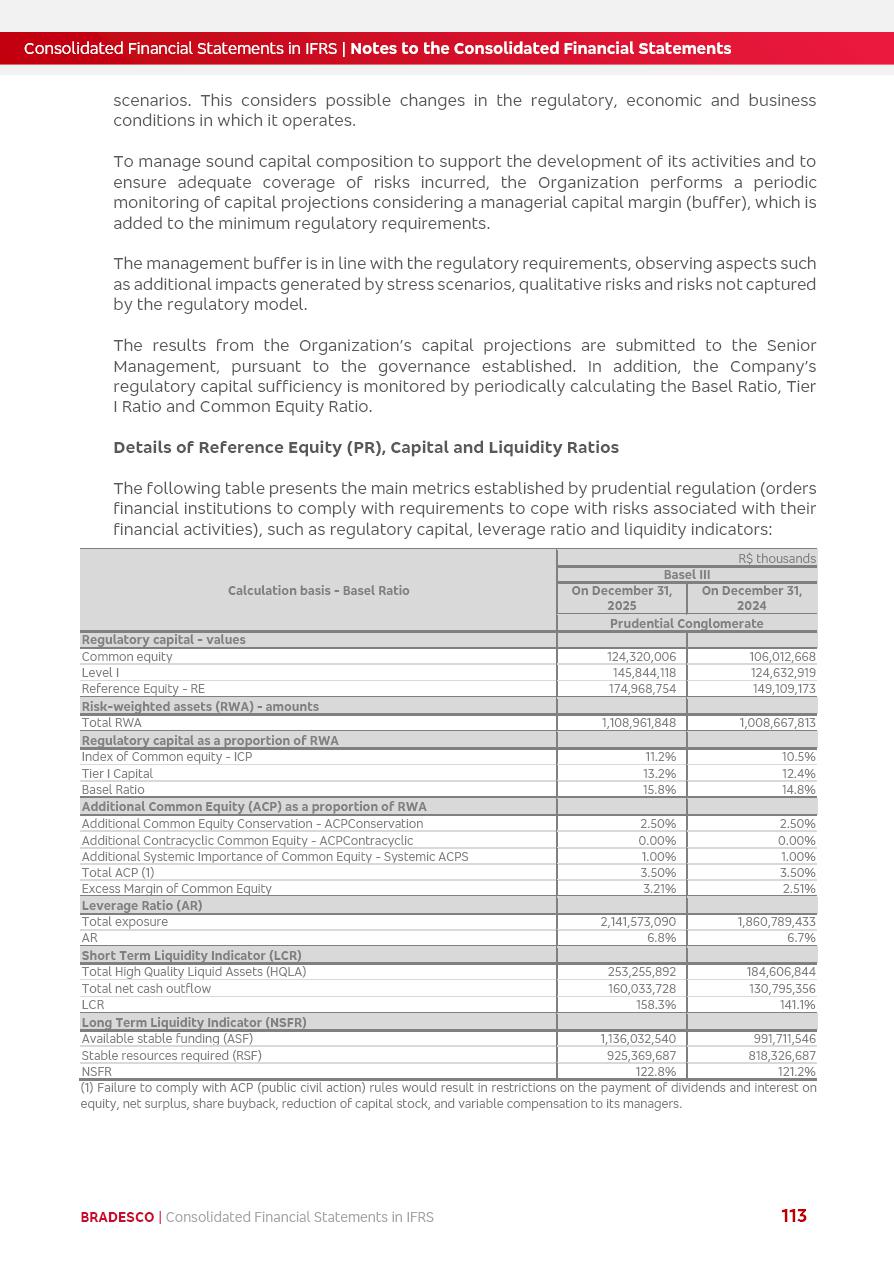
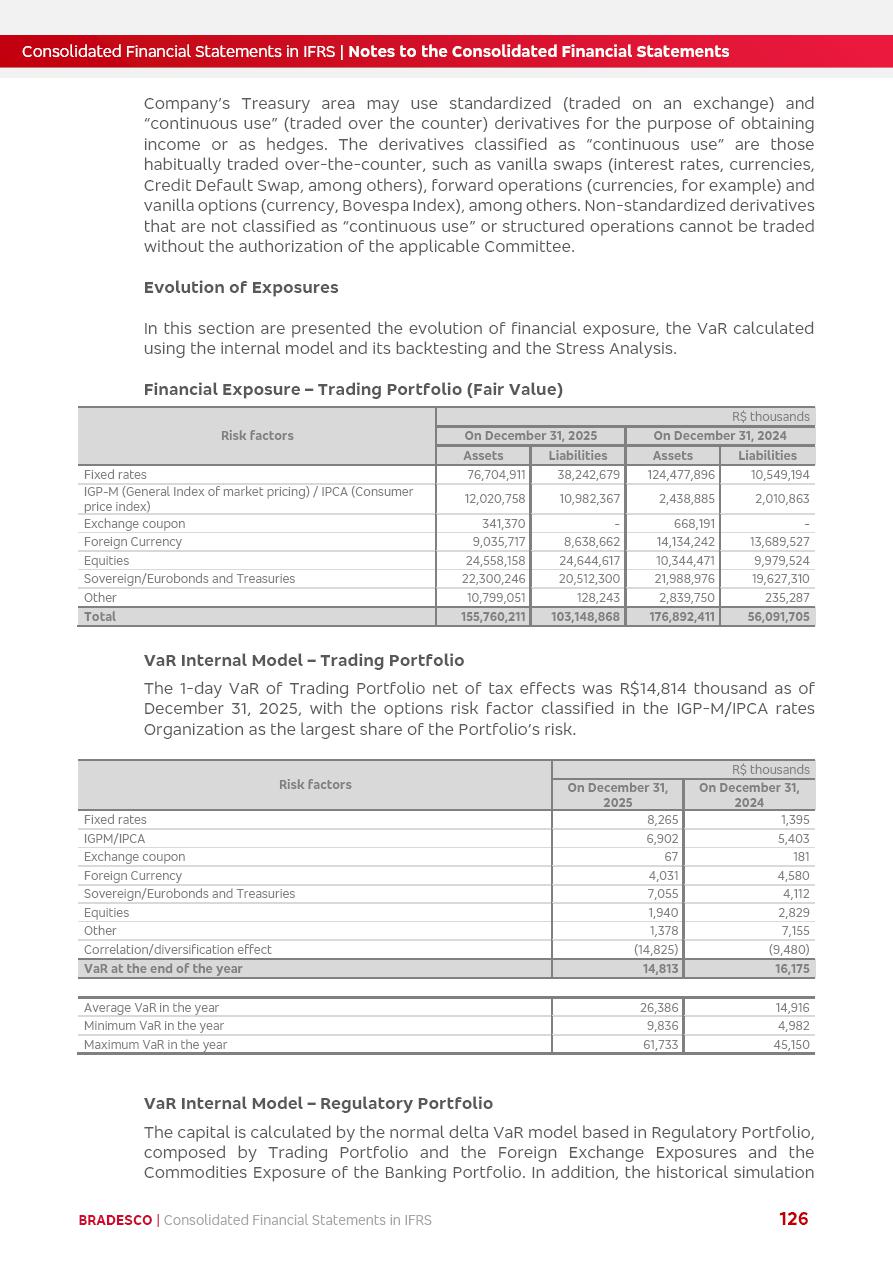
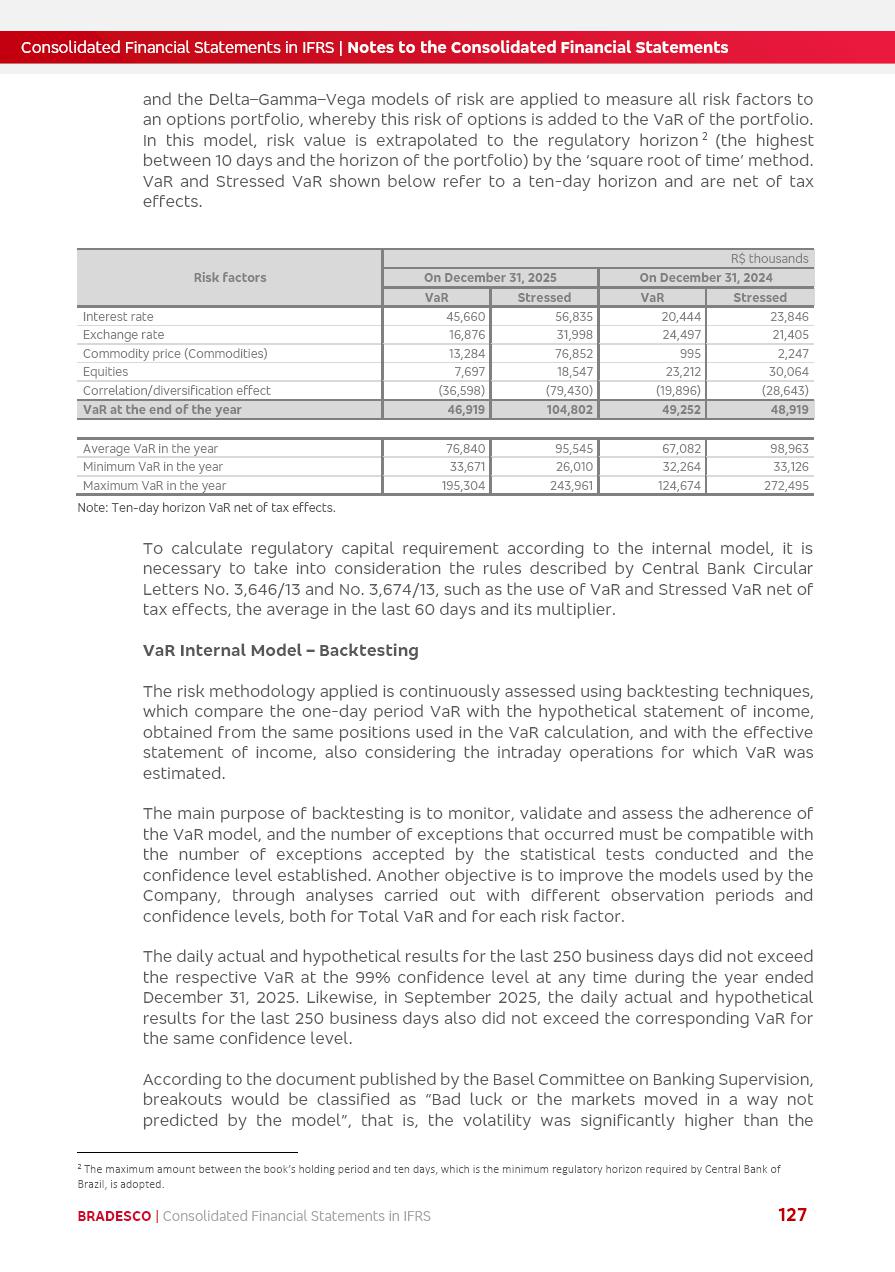
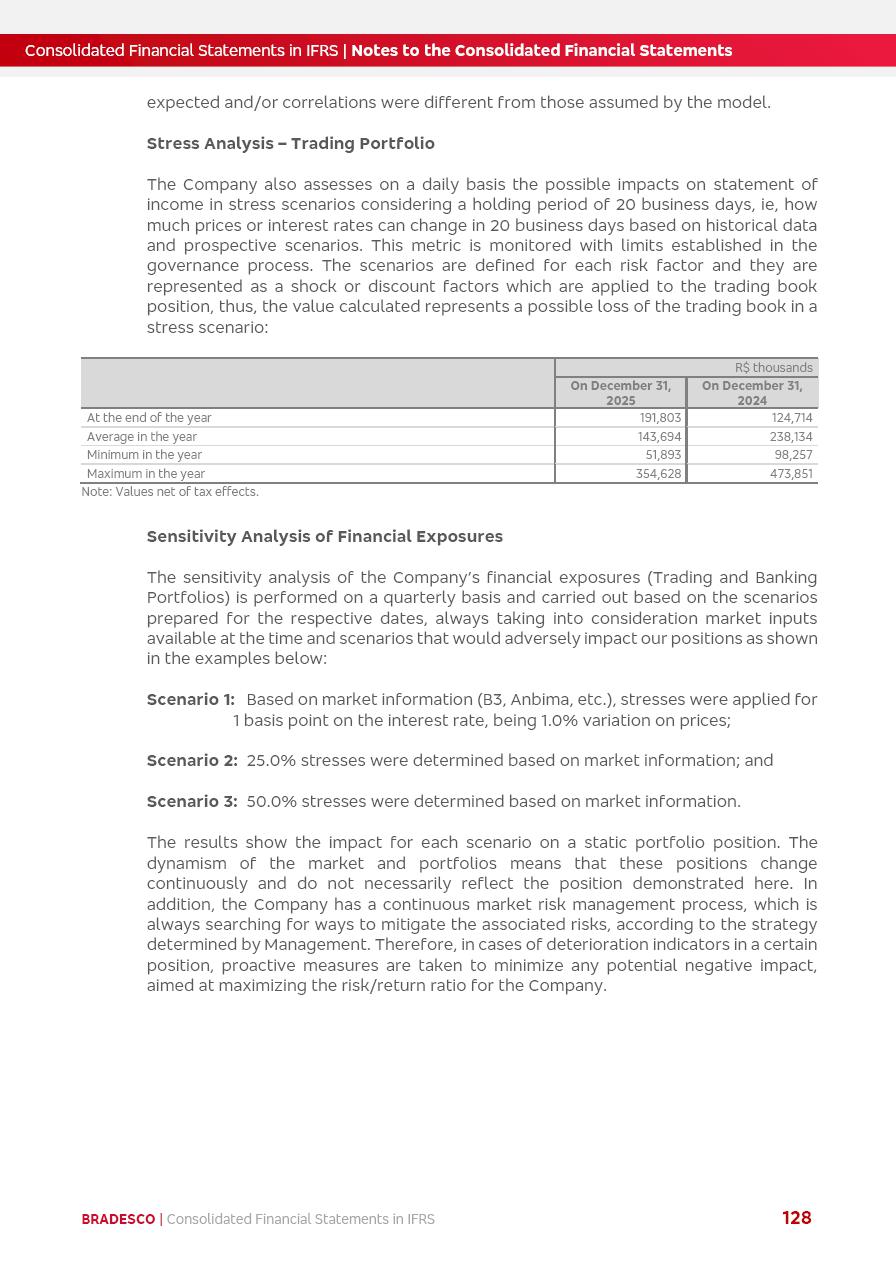
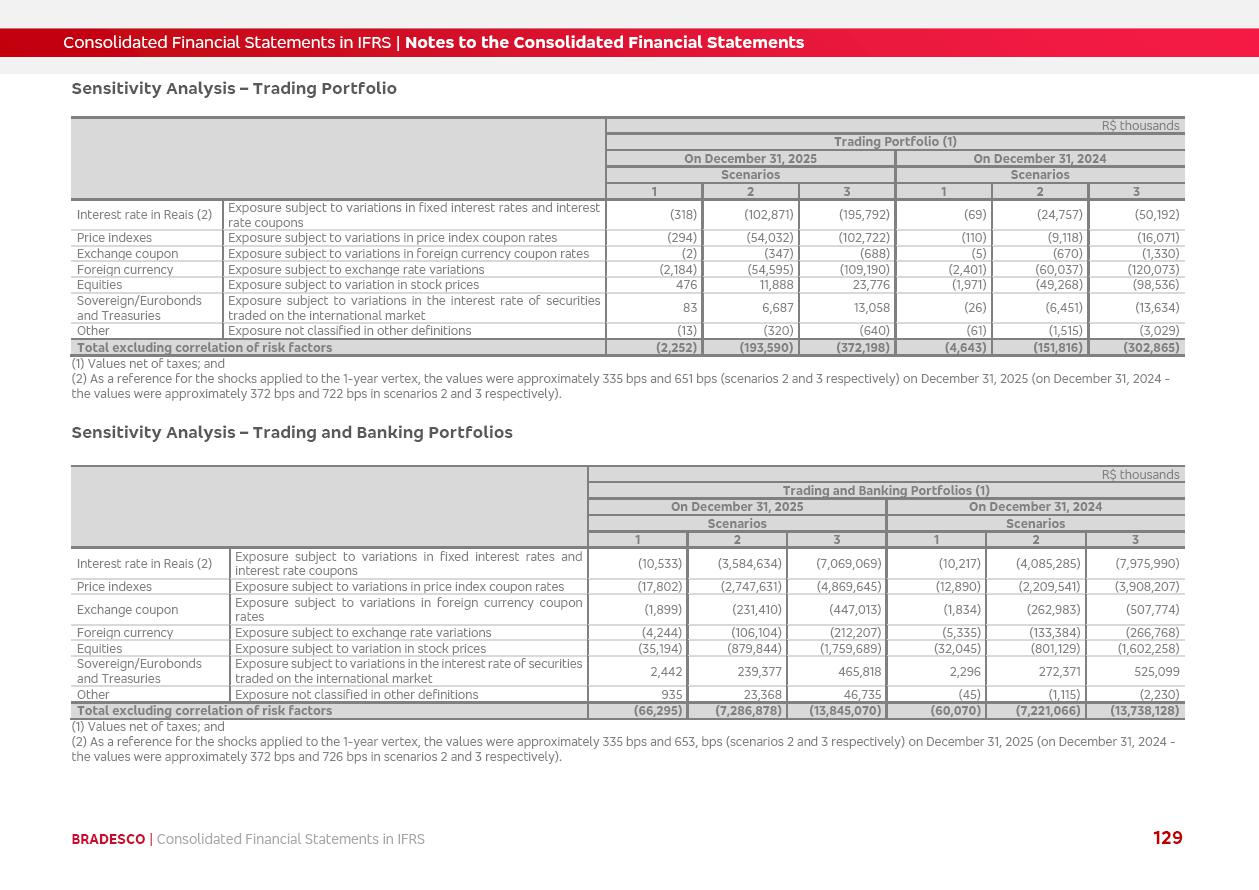
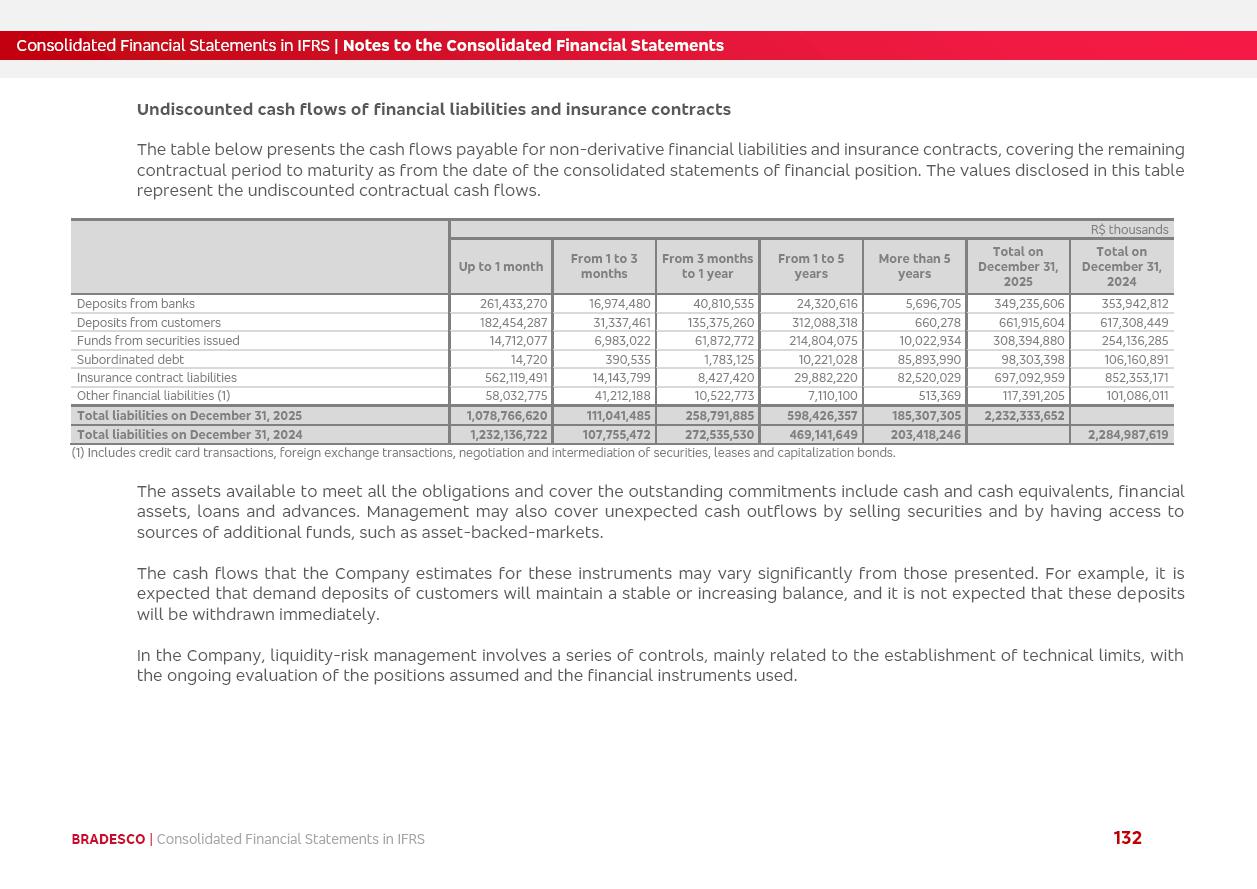
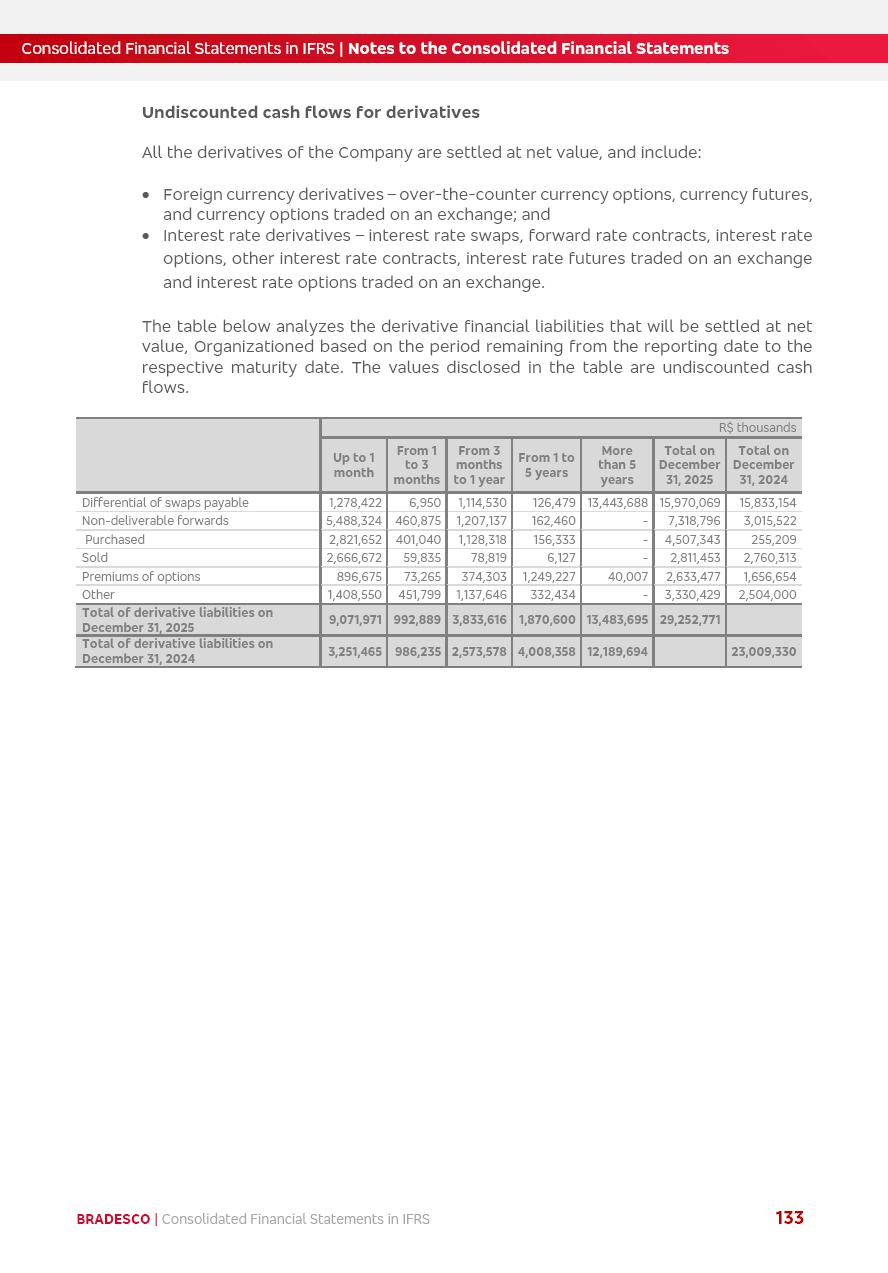
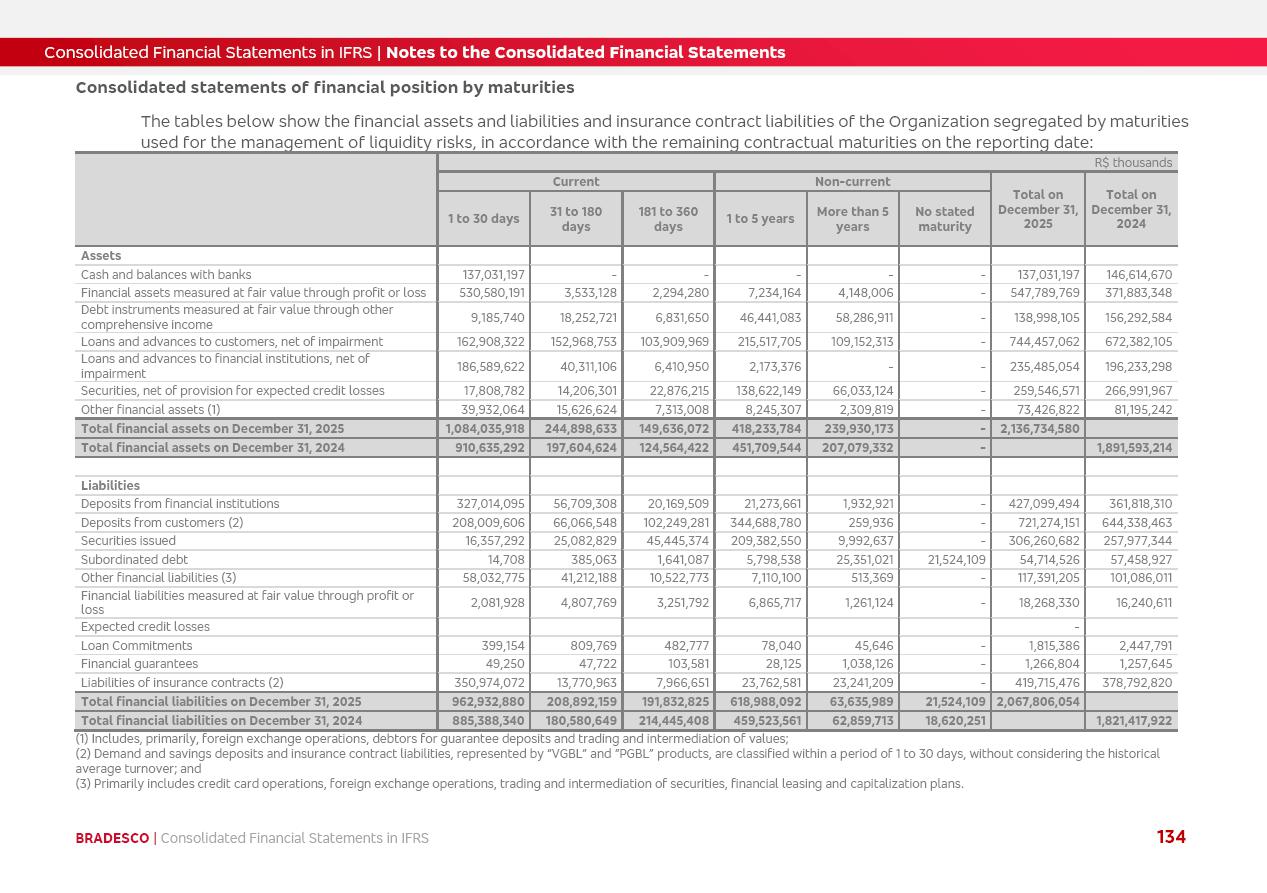
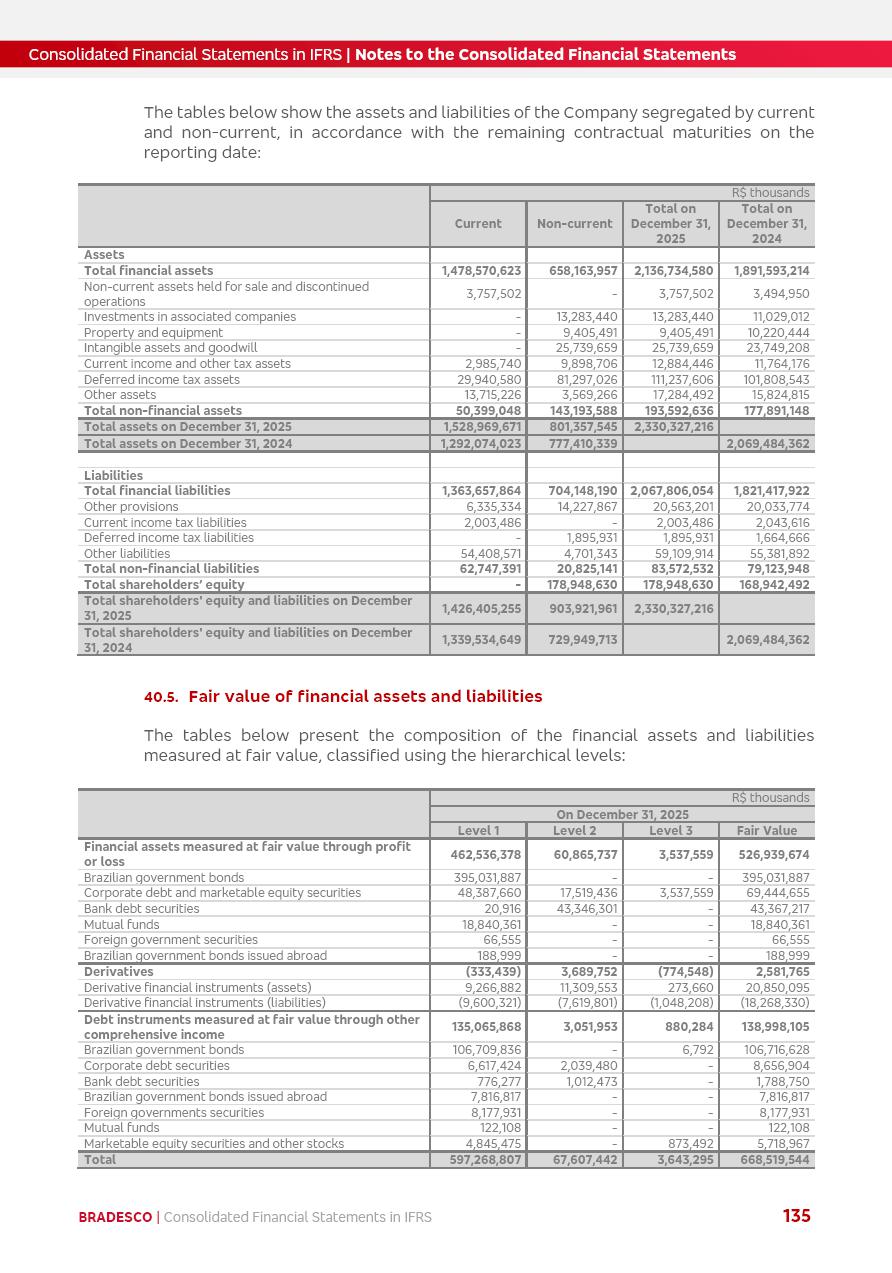
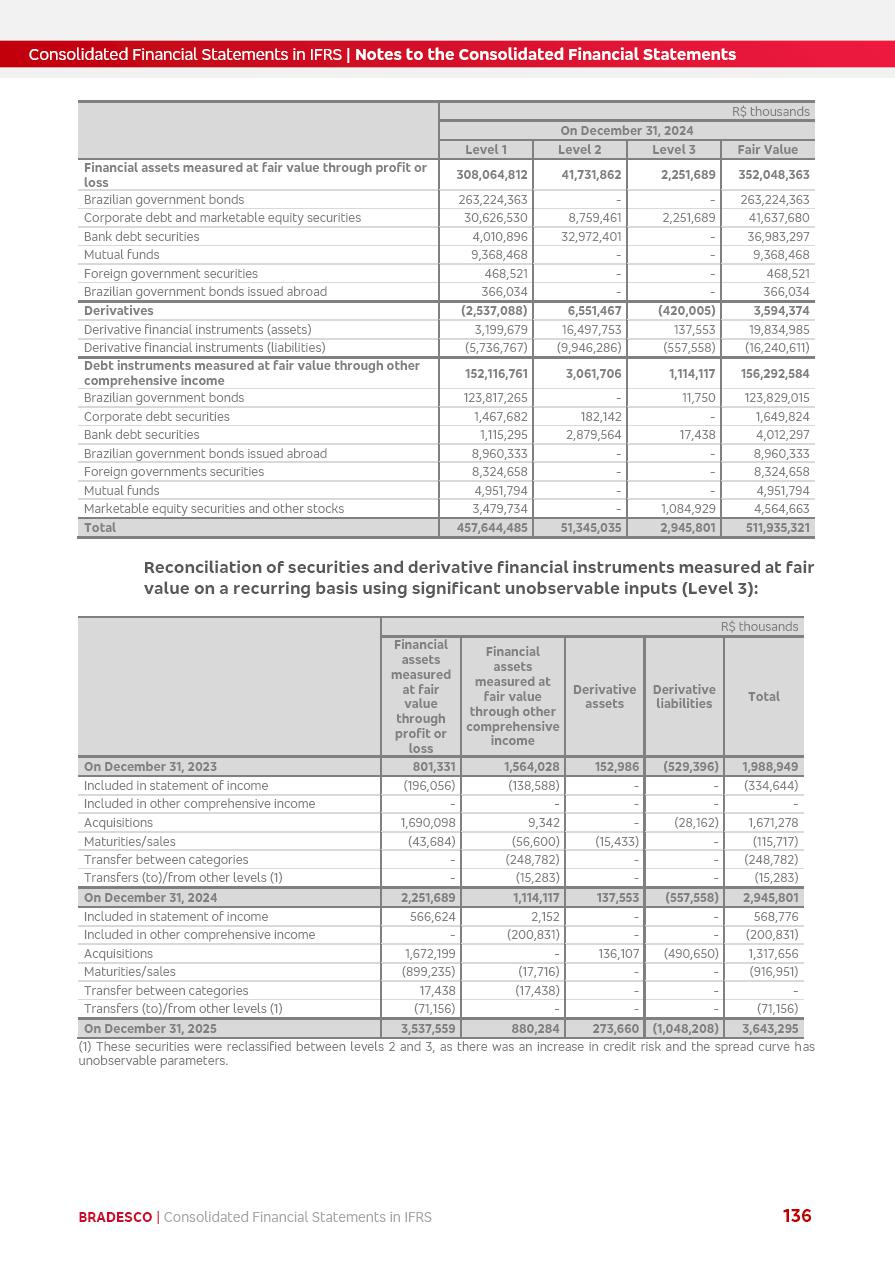
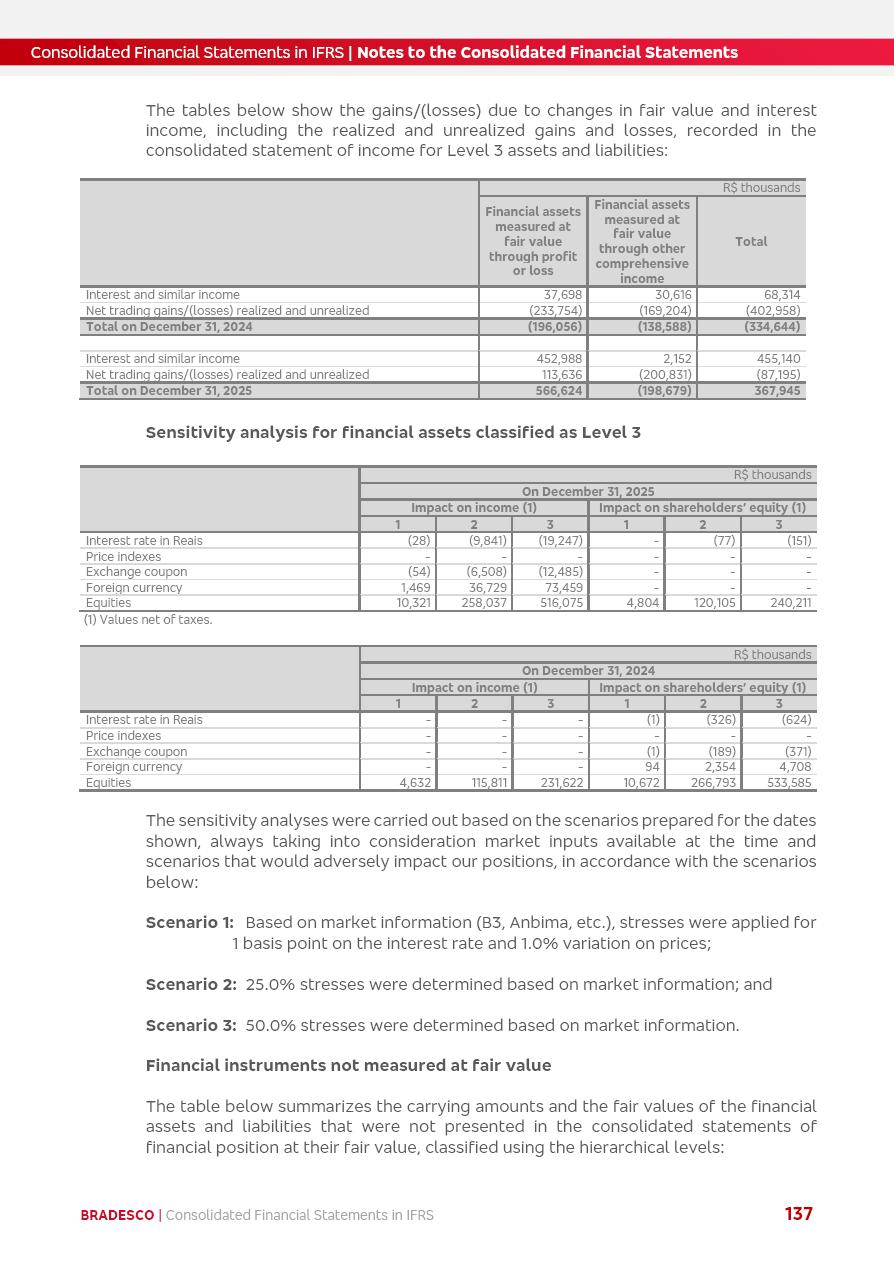
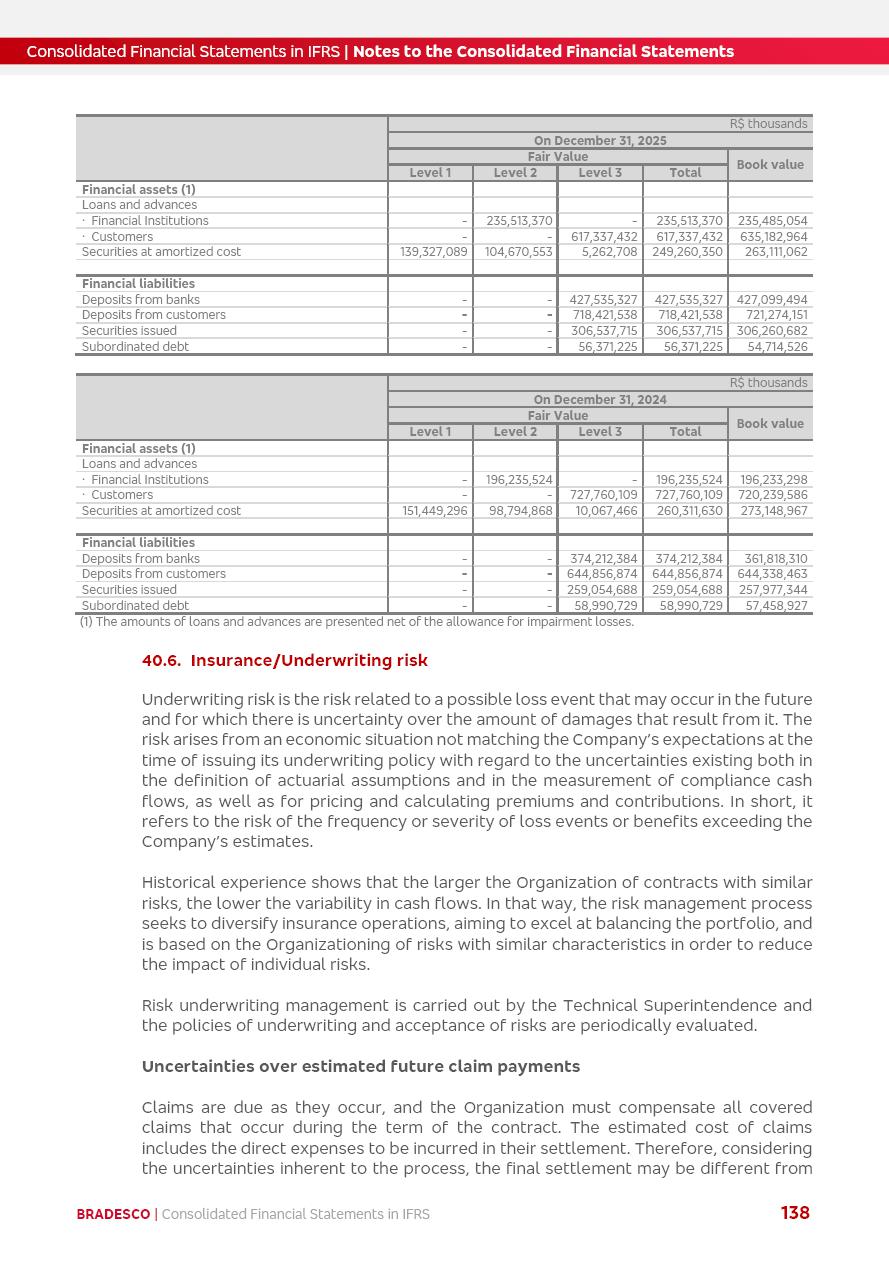
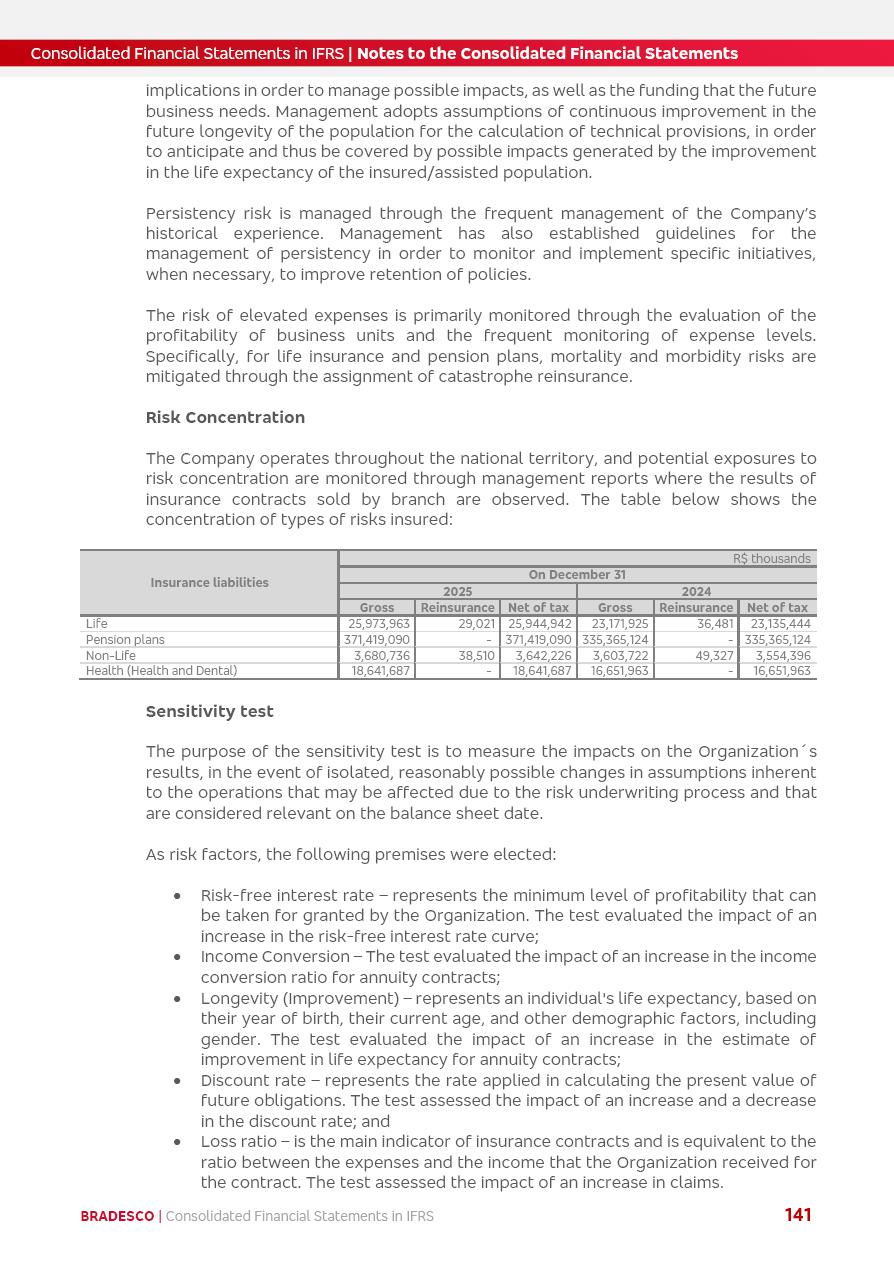
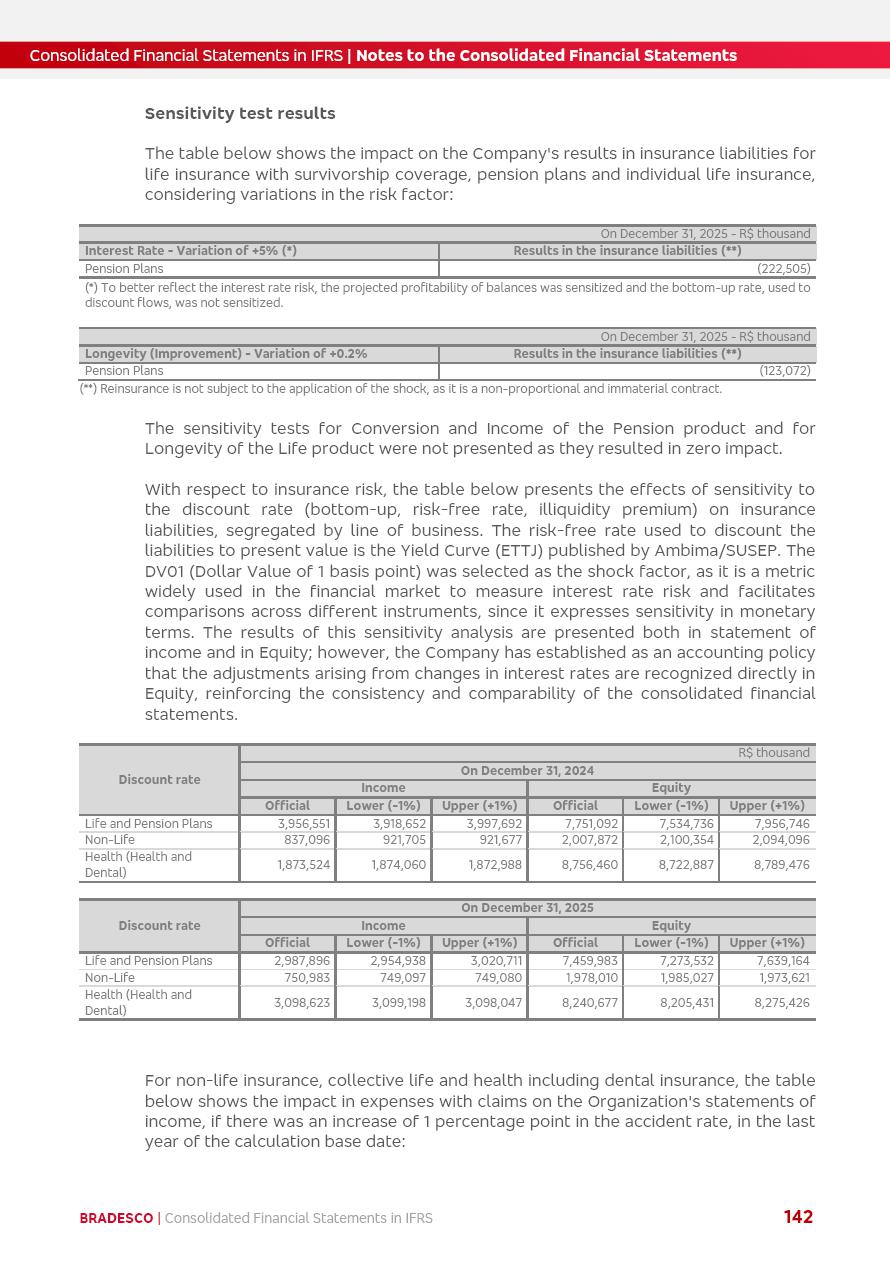
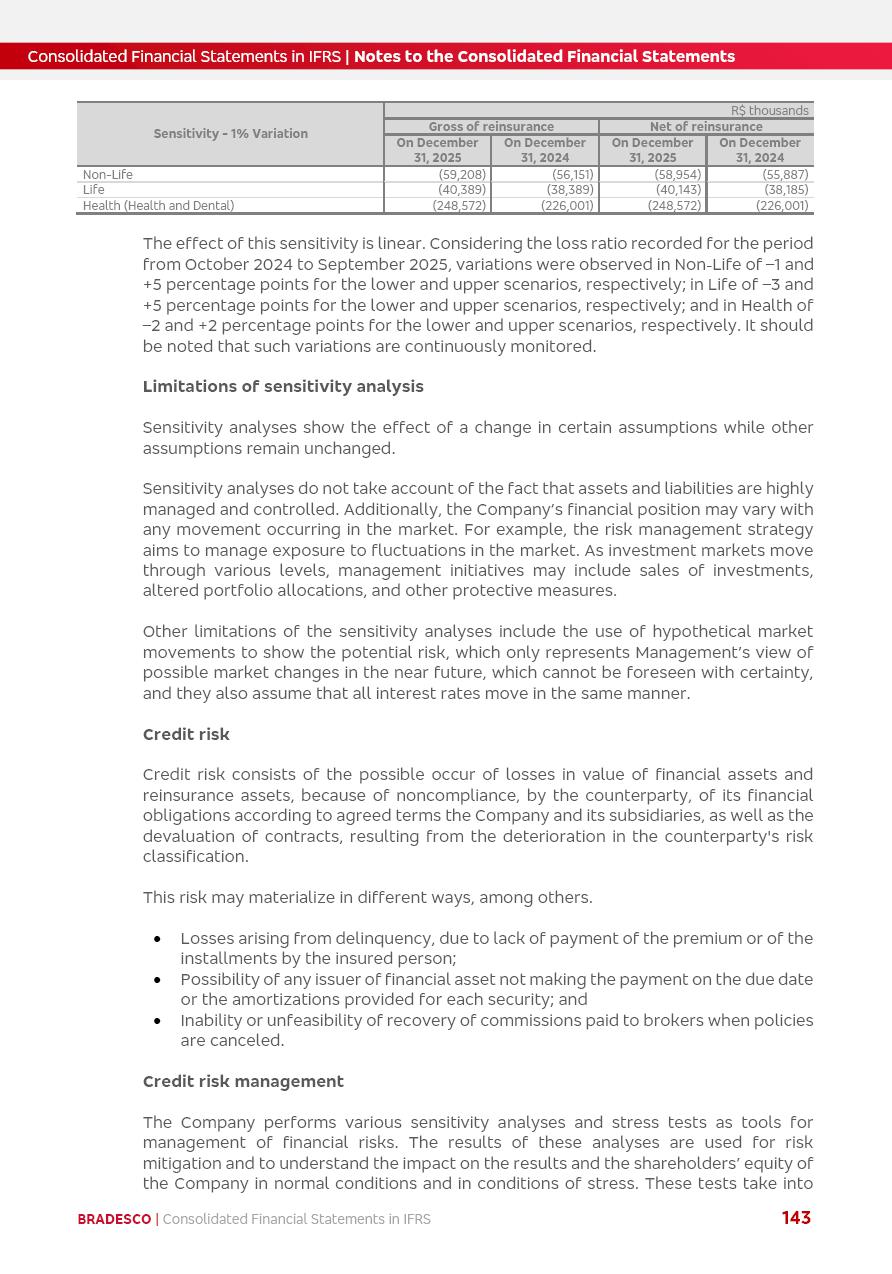

|
BANCO BRADESCO S.A. | ||
|
By: |
/S/André Costa Carvalho
| |
| André Costa Carvalho Investor Relations Officer | ||
This press release may contain forward-looking statements. These statements are statements that are not historical facts, and are based on management's current view and estimates of future economic circumstances, industry conditions, company performance and financial results. The words "anticipates", "believes", "estimates", "expects", "plans" and similar expressions, as they relate to the company, are intended to identify forward-looking statements. Statements regarding the declaration or payment of dividends, the implementation of principal operating and financing strategies and capital expenditure plans, the direction of future operations and the factors or trends affecting financial condition, liquidity or results of operations are examples of forward-looking statements. Such statements reflect the current views of management and are subject to a number of risks and uncertainties. There is no guarantee that the expected events, trends or results will actually occur. The statements are based on many assumptions and factors, including general economic and market conditions, industry conditions, and operating factors. Any changes in such assumptions or factors could cause actual results to differ materially from current expectations.