Please wait
Table of Contents


FORM 6-K

U.S. SECURITIES AND EXCHANGE COMMISSION

Washington, D.C. 20549

Report of Foreign Private Issuer

Pursuant to Rule 13a-16 or 15d-16 of

the Securities Exchange Act of 1934

Commission File Number: 1-15270

For the month of July 2026

NOMURA HOLDINGS, INC.

(Translation of registrant’s name into English)

13-1, Nihonbashi 1-chome

Chuo-ku, Tokyo 103-8645

Japan

(Address of principal executive offices)

Indicate by check mark whether the registrant files or will file annual reports under cover Form 20-F or Form 40-F.

Form 20-F  X   Form 40-F    

Indicate by check mark if the registrant is submitting the Form 6-K in paper as permitted by Regulation S-T Rule 101(b)(1):    

Indicate by check mark if the registrant is submitting the Form 6-K in paper as permitted by Regulation S-T Rule 101(b)(7):    


Table of Contents

On June 22, 2026, Nomura Holdings, Inc. filed its Annual Securities Report for the year ended March 31, 2026 with the Director of the Kanto Local Finance Bureau of the Ministry of Finance pursuant to the Financial Instruments and Exchange Act.

Information furnished on this form:

EXHIBITS

Exhibit Number


1.

English translation of certain items disclosed in the Annual Securities Report pursuant to the Financial Instruments and Exchange Act for the fiscal year ended March 31, 2026.


2.

English translation of Management’s Report on Internal Control over Financial Reporting and Confirmation Letter.


Table of Contents

SIGNATURE

Pursuant to the requirements of the Securities Exchange Act of 1934, the registrant has duly caused this report to be signed on its behalf by the undersigned, thereunto duly authorized.


    NOMURA HOLDINGS, INC.
Date: July 17, 2026   By:  

 /s/ Akito Bato

     Akito Bato
     Senior Managing Director


Table of Contents

EXHIBIT 1

Annual Securities Report Pursuant to the Financial Instruments and Exchange Act for the Fiscal Year Ended March 31, 2026

Table of Contents


     Page  

PART I  Corporate Information

     2  

Item 1. Information on the Company and Its Subsidiaries and Affiliates

     2  

1. Selected Financial Data

     2  

2. History and Development of the Company and Its Subsidiaries and Affiliates


3. Business Overview

     4  

4. Subsidiaries and Affiliates


Item 2. Operating and Financial Review

     5  

1. Management Challenges and Strategies

     5  

2. View on Sustainability and Efforts

     9  

3. Risk Factors

     18  

4. Operating, Financial and Cash Flow Analyses by Management

     33  

5. Significant Contracts

     70  

6. Research and Development, Patent and Licenses, etc.


Item 3. Property, Plants and Equipment


1. Results of Capital Expenditure


2. Our Properties


3. Prospects of New Capital Expenditure, Abandonment and Other


Item 4. Company Information

     71  

1. Share Capital Information

     71  

2. Stock Repurchase

     77  

3. Dividend Policy

     78  

4. Status of Corporate Governance and Other*

     79  

5. Employees

     129  

Item 5. Financial Information

     131  

1. Consolidated Financial Statements and Other

     132  

2. Unconsolidated Financial Statements

     272  

Item 6. Information on Share Handling, etc.


Item 7. Reference Information


PART II  Information on Guarantor of the Company


Report of Independent Auditors

     285  
 

An English translation of the underlined items above is included in this document.

* Status of Directors and Senior Management in Item 4.4. Status of Corporate Governance and Other is not translated.


1


Table of Contents

PART I Corporate Information

Item 1. Information on the Company and Its Subsidiaries and Affiliates

1. Selected Financial Data.

(1) Selected consolidated financial data for the latest five fiscal years.


Year ended March 31

   2022     2023     2024     2025     2026  

Total revenue (millions of yen)

     1,593,999       2,486,726       4,157,294       4,736,743       4,758,486  

Net revenue (millions of yen)

     1,363,890       1,335,577       1,562,000       1,892,485       2,167,713  

Income before income taxes (millions of yen)

     226,623       149,474       273,850       471,964       539,821  

Net income attributable to Nomura Holdings, Inc.
(“NHI”) shareholders (millions of yen)

     142,996       92,786       165,863       340,736       362,129  

Comprehensive income attributable to NHI shareholders
(millions of yen)

     309,113       283,267       307,393       328,560       462,542  

Total equity (millions of yen)

     2,972,803       3,224,142       3,448,513       3,580,999       3,854,915  

Total assets (millions of yen)

     43,412,156       47,771,802       55,147,203       56,802,170       62,645,925  

Shareholders’ equity per share (yen)

     965.80       1,048.24       1,127.72       1,174.10       1,277.99  

Net income attributable to NHI common

shareholders per share—basic (yen)

     46.68       30.86       54.97       115.30       123.08  

Net income attributable to NHI common

shareholders per share—diluted (yen)

     45.23       29.74       52.69       111.03       118.99  

Total NHI shareholders’ equity as a percentage of total assets (%)

     6.7       6.6       6.1       6.1       5.9  

Return on shareholders’ equity (%)

     5.10       3.06       5.10       9.99       10.09  

Price/earnings ratio (times)

     11.04       16.52       17.78       7.88       9.78  

Cash flows from operating activities (millions of yen)

     (862,832     (694,820     132,640       (678,611     (842,960

Cash flows from investing activities (millions of yen)

     (593,182     (233,225     (887,938     (848,647     (1,498,923

Cash flows from financing activities (millions of yen)

     1,112,718       1,283,937       1,012,850       1,679,697       2,095,851  

Cash, cash equivalents, restricted cash and restricted cash equivalents at end of the year (millions of yen)

     3,316,408       3,820,852       4,299,022       4,425,441       4,318,722  

Number of staffs

     26,585       26,775       26,850       27,242       28,677  

[Average number of temporary staffs, excluded from above]

     [4,339     [4,420     [4,234     [4,268     [4,105
 
1

The selected financial data of Nomura Holdings, Inc. and its consolidated subsidiaries (“Nomura”) were stated in accordance with the accounting principles generally accepted in the United States of America (“U.S. GAAP”).


2

Shareholders’ equity per share, Total NHI shareholders’ equity as a percentage of total assets, Return on shareholders’ equity are calculated using Total NHI shareholders’ equity.


3

Certain contract employees are included in Number of staffs.


2


Table of Contents
(2)

Selected stand-alone financial data for the latest five fiscal years


Year ended March 31,

   2022     2023     2024     2025     2026  

Operating revenue (millions of yen)

     355,487       472,321       557,326       665,643       704,491  

Ordinary income (millions of yen)

     114,577       121,963       83,720       140,679       161,379  

Net income (loss) (millions of yen)

     176,470       174,264       90,548       132,675       132,964  

Common stock (millions of yen)

     594,493       594,493       594,493       594,493       594,493  

Number of issued shares (thousands of shares)

      3,233,563        3,233,563       3,163,563       3,163,563       3,088,563  

Shareholders’ equity (millions of yen)

     2,546,193       2,578,102       2,540,897       2,576,011       2,482,323  

Total assets (millions of yen)

     8,985,161       9,514,679        10,626,780        11,082,445       11,992,174  

Shareholders’ equity per share (yen)

     843.62       858.21       855.20       871.28       855.47  

Dividend per share (yen)

     22.00       17.00       23.00       57.00       51.00  

[Interim dividend per share](yen)

     [8.00     [5.00     [8.00     [23.00     [27.00

Net income (loss) per share (yen)

     57.60       57.95       30.01       44.89       45.19  

Net income per share—diluted (yen)

     55.86       55.95       28.79       43.26       43.72  

Shareholders’ equity as a percentage of total assets (%)

     28.3       27.1       23.9       23.2       20.7  

Return on shareholders’ equity (%)

     7.00       6.81       3.54       5.19       5.26  

Price/earnings ratio (times)

     9.22       9.11       33.96       20.99       27.54  

Payout ratio (%)

     37.98       29.30       75.85       127.00       111.95  

Dividend on shareholders’ equity (%)

     2.64       1.98       2.70       6.54       6.00  

Number of staffs

     187       167       185       177       204  

[Average number of temporary staffs, excluded from above]

     [—     [—     [—     [—     [—

Total Shareholder Return (%)

     92.4       94.4       178.8       176.7       236.3  

[Comparison index with the above : TOPIX Total Return Index]

     [102.0     [107.9     [152.5     [150.2     [202.2

Highest stock price (yen)

     614.8       573.9       1,006.0       1,080.0       1,506.5  

Lowest stock price (yen)

     460.3       464.3       476.7       656.8       672.0  
 
1

The dividend per share for the fiscal year ended March 31, 2025 includes a commemorative dividend of 10 yen for the 100th anniversary of the company’s founding.


2

Number of staffs represents staffs who work at the Company.


3

Stock prices are quoted on the Tokyo Stock Exchange (First Section or Prime Market of the Tokyo Stock Exchange).


3


Table of Contents

3. Business Overview.

The Company and its 1,554 consolidated subsidiaries and variable interest entities primarily operate investment and financial services business focusing on securities business as their core business. Nomura provides wide-ranging services to customers for both of financing and investment through the operations in Japan and other major financial capital markets in the world. Such services include securities trading and brokerage, underwriting and distribution, arrangement of public offering and secondary distribution, arrangement of private placement, principal investment, asset management, banking, and other securities and financial business. There are also 15 companies accounted for under the equity method as of March 31, 2026.

The reporting of the business operations and results of the Company and its consolidated subsidiaries are based on business segments referred in Note 23 “Segment and geographic information” in our consolidated financial statements included in this annual report. Please refer to the table below in the organizational structure listing the main companies by business segments.

Organizational Structure

The following table lists Nomura Holdings, Inc. and its significant subsidiaries and affiliates by business segments.

Nomura Holdings, Inc.

Wealth Management Division

(Domestic)

Nomura Securities Co., Ltd. and others

Investment Management Division

(Domestic)

Nomura Asset Management Co., Ltd.

(Overseas)

Nomura Asset Management International Inc.

Delaware Management Company and others

Wholesale Division

(Domestic)

Nomura Securities Co., Ltd.

Nomura Financial Products & Services, Inc.

Nomura Asia Pacific Holdings Co., Ltd. and others

(Overseas)

Nomura Holding America Inc.

Nomura Securities International, Inc.

Nomura America Mortgage Finance, LLC

Instinet, Incorporated

Nomura Europe Holdings plc

Nomura International plc

Nomura International (Hong Kong) Limited

Nomura Singapore Limited and others

Banking Division

(Domestic)

The Nomura Trust & Banking Co., Ltd. and others

Others

(Domestic)

Nomura Properties, Inc.

Nomura Global Finance Co., Ltd.

Nomura Research Institute, Ltd.(1)

Nomura Real Estate Holdings, Inc.(1)

(Overseas)

Nomura International Funding Pte. Ltd. and others


  (1)

Affiliates


4


Table of Contents

Item 2. Operating and Financial Review

1. Management Challenges and Strategies

All matters relating to the future in the sections below are based on the current views as of the date of filing this Securities Report.

(1) Fundamental Management Policy

1. Fundamental Management Policy

In Fundamental Management Policy formulated by the Board of Directors, our company has set the following Management Vision and Basic Vision of Group Management.

Fundamental Management Policy of Nomura Holdings, Inc.


(Management Vision)
 
Nomura Group’s management vision is to enhance its corporate value by deepening society’s trust in the firm and increasing satisfaction of stakeholders, including that of shareholders and clients.
 
As a global investment bank, the Company will provide high value-added solutions to clients globally, and recognizing its wider social responsibility, the Company will continue to contribute to the economic growth and development of society.
 
To enhance its corporate value, the Company utilizes return on equity (“ROE”) as a management indicator and will strive for sustainable business transformation.
 
(Basic Vision of Group Management)
 
(1) Nomura Group will establish its modernized growth model by itself through realizing expansion of its business in new domains. Nomura Group will also establish an earning structure not subject to market condition with proper cost control and risk management.
 
(2) Nomura Group will aim to serve its customers at the highest level in every investment, by paying thorough attention to the needs of its customers and the market and by providing its customers with highly value-added solutions in financial and capital markets.
 
(3) Nomura Group will emphasize compliance with applicable laws and regulations and proper corporate behavior to carry out compliance and conduct risk management in daily business operations. Each company of Nomura Group shall respect customers’ interests and comply with applicable laws and regulations relating to the business.
 
(4) Nomura Group seeks to ensure effective management oversight and increase management transparency.
 
(5) Nomura Group will contribute to expanding securities markets through daily business and continuously engage in educational activities regarding investment in order to broaden participation in the securities market.

2. Purpose

Nomura Group celebrated its 100th anniversary in December 2025. As we look to the next one hundred years, Nomura Group has established a Group Purpose to underpin group management in April 2024. Nomura Group is dedicated to the tenets embodied in its Founder’s Principles and the unwavering values ingrained in its Corporate Philosophy:


Purpose
 
We aspire to create a better world by harnessing the power of financial markets

Since its founding, Nomura Group has strived to contribute to the development of financial markets. Amid a complex and rapidly changing environment, Nomura Group will continue to leverage its knowledge and expertise to deliver added value and create a better world through the financial markets. The Group Purpose articulates Nomura Group’s strong resolve to work together with various stakeholders to build a better future, and its determination to continue taking on new challenges to become the best company for its clients and other stakeholders.

3. Management Vision

In May 2024, we formulated a new Management Vision for fiscal year 2030, “Reaching for Sustainable Growth”, with the aim of promoting management strategies in line with our Purpose. Nomura Group continues to engage in the development of the financial and capital markets and the provision of optimal solutions to our clients by facilitating the circulation of risk capital through the provision of a wide range of financial services.


5


Table of Contents

(2) Business Environment

During the year ended March 31, 2026, while the global economy as a whole remained on a recovery track, major sources of market volatility affecting Nomura included U.S. tariff policy; a mix of optimism and concern surrounding the AI-related sector; political events in Japan; and geopolitical developments such as the situation involving Iran.

On April 2, 2025, the U.S. government announced the planned imposition of “reciprocal tariffs” targeting countries worldwide, triggering a sharp global equity sell-off and heightening concerns over a potential shift away from dollar-denominated assets. However, the following week a “90-day suspension” of the measures was announced, and markets turned to a V-shaped recovery. AI-related stocks in particular led the U.S. equity market through summer 2025, while from early autumn 2025 signs of caution about overheating also began to emerge. In the foreign exchange market, the yen appreciated to ¥140 per U.S. dollar in April 2025 amid wariness of U.S. tariff policy, but thereafter weakened; since January 2026, despite heightened volatility, the exchange rate has generally remained within the ¥152–161 range.

In Japan, Prime Minister Ishiba announced his resignation in September 2025, and in October 2025, the Takaichi cabinet was formed following the presidential election of the Liberal Democratic Party (“LDP”). As the new government advocated “responsible proactive fiscal policy,” Japan saw a stronger trend towards rising stock prices, higher interest rates and a weaker yen. Prime Minister Takaichi further dissolved the House of Representatives in January 2026. In the general election held in February, the LDP won more than two-thirds of the seats on its own, attracting attention from overseas investors. Although the impact of tariffs became visible in certain industries, Japanese equities overall continued an upward trend as companies managed to secure profit growth, repeatedly setting new record highs; in October 2025, the Nikkei Stock Average surpassed ¥50,000. The index has remained at a high level in the ¥58,000–71,000 range since mid-April 2026.

With respect to monetary policy, the U.S. economy showed signs of a modest slowdown in employment, and the Federal Reserve announced rate cuts in each of September, October, and December 2025. In Japan, after confirming in its view that the impact of the U.S.-imposed tariffs was not significant, the Bank of Japan decided in December 2025 to raise interest rates for the first time since January 2025. Japan’s 10-year government bond yield strengthened its upward trend—surpassing 2% in December 2025—as markets priced in Japan’s exit from deflation and the continuation of rate hikes that would accompany it. Furthermore, since the end of February 2026, crude oil prices have risen sharply due to heightened instability in the Middle East, and, affected by this development, the yield on 10-year Japanese government bonds also rose, reaching 2.5% from the end of March through April and rising to 2.8% on May 18.

On the geopolitical front, events such as the Israeli and U.S. airstrikes on Iranian nuclear facilities in June 2025; U.S. military action in Venezuela in January 2026 (resulting in the capture of the Venezuelan President); and Israeli and U.S. airstrikes on Iran commencing in February 2026 (resulting in the death of the Iranian Supreme Leader) have contributed to market instability.

(3) Management Challenges and Strategies

Our business environment is undergoing significant changes. We will seek to continue to respond to these changes flexibly while maintaining an appropriate financial standing and effectively utilizing management resources through improved capital efficiency. In addition, we aim to constantly implement new initiatives with the aim of expanding existing businesses and providing value-added services to clients.

1. Medium-to Long-term Priority Issues

We are pursuing sustainable growth across the entire group and working on building a business portfolio that focuses on stable and diversified revenue and improving capital efficiency.

Our vision is to advance Nomura Group to the next stage. To realize this, we launched a strategy of expanding into private markets to complement our businesses in the public markets. Based on this strategy, we have been working on promoting our Wealth Management business, strengthening the Investment Management Division and the Banking Division, and fostering growth and stability in the wholesale business. Additionally, we have been exploring and enhancing new areas such as Digital Financial Services including the digital asset business and sustainability sector including sustainable finance. We are promoting company-wide cost control through structural reforms. In addition, we are advancing the sophistication and efficiency of the corporate functions that form the basis of these businesses, strengthening the governance structure and risk management, evolving the human resource management strategies, further embedding our code of conduct and compliance, and promoting initiatives related to enhancing services and improving operational efficiency using AI and digital technologies and enhancing cybersecurity. For more information on the strategies in each division, please refer to “2. Issues in Each Division.”

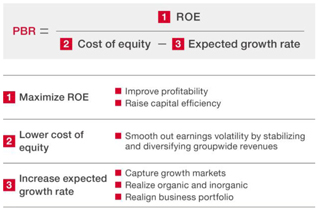
We have set a management vision, “Reaching for Sustainable Growth”, as an indication of the direction of management toward fiscal year 2030, and have set management quantitative targets of ROE of 10-12%+ and an income before income taxes of over ¥750 billion. We will focus on the following areas to achieve these goals: (i) deepen global strategy leveraging our Japan franchise, (ii) accelerate growth of stable revenues, and (iii) further promote our strategy to provide platforms. In addition, we break down the Price Book-value ratio (“PBR”) as shown in the figure below. Maximizing the absolute level of ROE is one of its key elements. Through addressing medium- to long-term priority issues, we aim to enhance our corporate value.


6


Table of Contents

LOGO

2. Issues in Each Division

The challenges and strategies in each division are as follows:


Wealth Management Division

As a result of the continuous initiatives to overhaul our business model to further help clients manage their assets, the Wealth Management Division has steadily accumulated recurring revenue assets, resulting in significant growth in recurring revenue. To contribute to the improvement in the ratio of securities to the total financial assets among Japanese households, our challenge is to respond to diversifying wealth management needs. By providing comprehensive wealth management services through Nomura Securities Co., Ltd.’s nationwide network of branches, as well as its digital services, we aim to assist our clients in achieving their goals. We will continue working on improving the skills of our partners (sales representatives) while maximizing our comprehensive strengths to enhance our wide range of products and services in order to advance the wealth management business.


Investment Management Division

Our Investment Management Division provides solutions that meet the diversifying investment needs of our broad client base through a wide range of asset classes and services spanning both traditional and alternative assets. We aim to realize a virtuous cycle of investment that contributes to the resolution of social issues by providing high-quality investment products meeting the diverse investment needs of clients. We regard the following trends as growth opportunities: Japan’s abundant individual financial assets and the tailwind of the government’s plan for promoting Japan as a leading asset management center, the growth of investment in private assets, and high levels of funding demand for and investor awareness of sustainability-related investments. Amid continued downward pressure on management fees, we are working to improve our investment capabilities, increase our assets under management and increase the value added by our products and services in our public market businesses, expand our business platforms in alternative assets and other high-fee growth areas, and realize greater efficiency and cost control.

In December 2025, we acquired the U.S. and European public asset management business of Macquarie Group Limited in order to increase our assets under management and to both diversify and strengthen our investment management platform and products to our clients.


Wholesale Division

Our Wholesale Division faces challenges presented by increasingly sophisticated client needs and technological advancement, coupled with uncertainty in the market and macroeconomic environment. To ensure continuity of service as well as adding value to clients, we will continue to enhance collaboration across business lines, regions and divisions while further diversifying our business portfolio to stabilize revenues. We will continue to allocate financial resources in a disciplined and selective manner toward high growth opportunities, while also focusing on cost optimization.


7
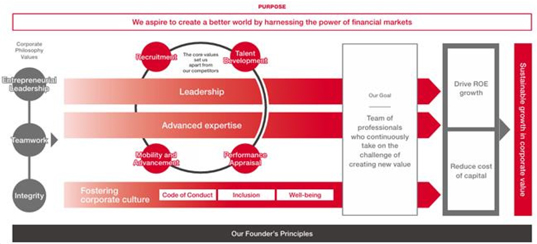

Table of Contents

Global Markets aims to provide liquidity to our clients while reinforcing risk control and governance. Additionally, we aim to further diversify our business portfolio, reinforce global connectivity and cross-sell across our global client franchise leveraging our solid business foundation in Japan and competitive global products to pursue growth opportunities such as Structured Financing and Solution business, International Wealth Management business as well as Global Equities, and continue to build on the strength of our Flow Macro businesses.

Investment Banking aims to provide seamless client experiences as we target to accelerate advisory services and financing to domestic and cross-border restructurings and industry-wide consolidations, as well as interest rate and foreign exchange solutions as volatile business environments have an impact on our clients’ businesses. We have leveraged our Japanese strengths and focus on expanding our global advisory business, while also maintaining focus on sustainability in light of its importance within the industry and to our clients. Additionally, we will accelerate group-wide collaborations as we develop tailored advice for the benefit of our clients across a range of products and services.


Banking Division

Amid overall trends such as rising inflation, a shifting interest-rate environment, and initiatives toward the realization of Japanese government’s “Policy Plan for Promoting Japan as a Leading Asset Management Center,” we determined it is important to strengthen efforts to deliver more diverse, higher-quality services by leveraging Nomura’s banking and trust capabilities. Accordingly, the Banking Division was established in April 2025. The Banking Division seeks to leverage the strengths of The Nomura Trust and Banking Co., Ltd. and Nomura Bank (Luxembourg) S.A. in private markets and bespoke products and meet the diverse needs of clients in areas such as asset building and estate planning.

The Nomura Trust and Banking Co., Ltd. completed a core banking system renewal in May 2025, enhancing and expanding its foundational banking systems. In April 2026, we launched a deposit sweep service that automatically transfers funds between accounts for customers who hold accounts with both Nomura Securities Co., Ltd. and The Nomura Trust and Banking Co., Ltd., improving client convenience by adding banking functionality to securities accounts and offering a financial hybrid service.

Going forward, we will continue to pursue our strategy focused on three pillars: client interaction, products and services, and systems.


Risk Management and Compliance, etc.

We have defined our risk appetite in our Risk Appetite Statement which includes the types and level of risk that the Nomura Group is willing to assume in pursuit of our strategic objectives and business plans. Further, we continue to develop our risk management framework in a way that is strategically aligned to our business plans and incorporates decision-making by senior management, thereby securing capital soundness and enhancing our corporate value.

We have explicitly defined in our Risk Appetite Statement that all executives and employees must actively engage in risk management through our Three Lines of Defense framework. We also continuously provide training to all executives and employees, including those in our group companies, to increase our knowledge about risks as financial professionals and to develop a corporate culture that emphasizes the proper identification, assessment and management of risks.

With regard to compliance, we continue to focus on improving the management structure to comply with local laws and regulations in the countries where we operate. We also continue to review our internal systems and rules so that all executives and employees can work autonomously with high ethical standards.

So that all directors, officers and employees not only comply with laws and regulations, but also maintain a strong sense of ethics, and aiming to be a company that is truly trusted by society, we have established the “Nomura Group Code of Conduct” as the guidelines for the actions to be taken by all Nomura Group directors, officers, and employees. Through associated trainings and other measures, we are working to promote appropriate actions (“Conduct”) based on the Code of Conduct. At the annual “Nomura Founding Principles and Corporate Ethics Day” held every August, we reaffirm the lessons learned from past incidents and renew our determination to prevent recurrence in order to maintain and build the trust of society and our clients. As part of this initiative, we hold discussions on appropriate conduct based on reflections on past incidents and ask participants to make a pledge to comply with the Code of Conduct. Since its implementation in December 2019, the Code of Conduct has been reviewed periodically to better respond to changes in social and economic conditions surrounding Nomura Group and to the expectations of stakeholders. Ahead of its 100th anniversary, we established the Nomura Group Purpose in 2024: “We aspire to create a better world by harnessing the power of financial markets.” By putting the Nomura Group Purpose into action, we aim to realize the Nomura Group Corporate Philosophy and further embed the Code of Conduct.

By addressing and resolving the above issues, we will strive for the stability and further development of financial markets as well as the sustainable growth of the Nomura Group.


8


Table of Contents

2. View on Sustainability and Efforts

(1) Nomura’s Approach to Sustainability (Strategy)

Since its founding, Nomura has contributed to the development of the financial and capital markets through the provision of a broad range of financial services, and has worked to create not only economic but also social value by providing optimal solutions to clients.

Nomura sees sustainability from two perspectives: “activities to support stakeholders through the pursuit of business” and “activities to ensure that Nomura itself and society are sustainable.”


Activities to support stakeholders through the pursuit of business

As a financial services group, our core role is to support clients through the flow of funds and capital. We are committed to promoting the sustainable circulation of capital by underwriting green, social, and sustainable bonds issued by sovereigns, supranationals, and agencies (SSAs), corporates and financial institutions, providing M&A advisory services, and offering ESG-related investment products to individual investors in Japan. Nomura views these activities as business opportunities that allow us to provide a variety of services and solutions.

We also leverage our long-cultivated strengths to address social issues by providing support for business succession, promoting innovation in regional revitalization, agriculture and healthcare, and drawing on our expertise and insight in research and analysis.


Activities to ensure that Nomura itself and society are sustainable

Nomura recognizes that addressing environmental issues and improving financial literacy in Japan are among the essential elements in the realization of a sustainable society.

Nomura recognizes climate change as one of the most important global issues and aligns its efforts with the Paris Agreement, aiming to limit global temperature increases to well below 2°C, and striving for 1.5°C, above pre-industrial levels. Nomura has announced its goal of achieving net zero greenhouse gas (“GHG”) emissions for its own operations by 2030, and net zero GHG emissions attributable to its lending and investment portfolios by 2050. As a global financial services group that supports sustainability efforts of its clients and stakeholders, we will continue to promote initiatives to reduce its environmental impact in order to remain a sustainable company.

Nomura has been one of the frontrunners in providing financial and economic education to people of all ages, from elementary school students to adults, for more than 20 years starting in the 1990s. As the Japanese government pursues its “Policy Plan for Promoting Japan as a Leading Asset Management Center” and aims to realize a virtuous cycle of growth and distribution, in which household savings are directed toward investment and the benefits of improved corporate value are returned to households, leading to further investment and consumption, improving financial literacy in Japan is a very important issue. In addition to financial education centered on schools, we also actively work to support asset building through the workplace for working generations, contribute to improving financial literacy throughout society, and help develop financial and capital markets through the sustainable circulation of capital.

Furthermore, to mark its 100th anniversary and as one of the foundations supporting value creation for the next 100 years, Nomura established the Nomura Well-Growing Institute in April 2026. “Well-Growing” is a new concept that refers to the ongoing process of learning, taking on challenges, and continuing to grow in order to improve well-being. The Institute is committed to supporting people who take on challenges and continue to grow, with the aim of realizing “a better world” in which people can experience long-term well-being.

Nomura places at the center of its human resources management strategy the enhancement of corporate value by enabling diverse talent to fully demonstrate their capabilities and by fostering an environment in which employees can support and inspire one another. To respond to an increasingly volatile environment, Nomura emphasizes the development of talent with expertise and leadership, as well as the cultivation of an inclusive and sound corporate culture in which everyone can thrive.

To this end, Nomura has introduced the “Leadership Behaviors Model”, strengthened specialized training and the hiring of external talent, and promoted a distinctive human resources management approach that integrates recruitment, talent development, performance appraisal, and mobility and advancement. Nomura is also seeking to enhance its human capital value through the embedding of the Code of Conduct and the promotion of employee well-being. (For details, see “(5) Human Capital Initiatives.”)

(2) Nomura’s Sustainability-Related Governance

As a Company with Three Board Committees, NHI has separated management oversight from business execution. This separation of duties strengthens the oversight functions and transfers authority regarding business execution from the Board of Directors to the Executive Officers with a view to accelerating the Group’s decision-making process. The oversight function and the executive side play respective roles in recognizing climate change risks and opportunities, promoting various measures, and managing risks.


9


Table of Contents

① Board of Directors

The “Nomura Holdings Corporate Governance Guidelines” set forth a sustainability policy which states: “The Company, in accordance with the Nomura Group Corporate Philosophy, together with contributing to the development of capital markets through various business activities, shall actively engage in activities aimed at the Company’s sustainable growth, solving social issues, and the realization of a sustainable society.” Based on this policy, the Board of Directors supervises and offers advice on sustainability-related reports prepared by the Executive Officers. In the year ended March 31, 2026, the Board of Directors dealt with topics such as Nomura Group’s Materiality and the disclosure of sustainability-related information.

② Sustainability Committee

NHI has established the Sustainability Committee to deliberate and decide strategies related to sustainability initiatives. The Committee is chaired by the Group CEO and consists of members designated by the Group CEO, including members of the Executive Management Board. The Chief Sustainability Officer leads discussions at the Sustainability Committee to consolidate our sustainability expertise and accelerate the formulation and implementation of strategies. In the year ended March 31, 2026, the Committee addressed topics such as Nomura Group’s Materiality, initiatives toward net zero and the establishment of the Green Bond Framework for Financing the Nihonbashi New Headquarters.

③ Sustainability Forum

In order to ensure opportunities for more flexible and substantive discussions on sustainability, the Sustainability Forum, a forum for discussion by executives from across divisions and regions, was established in the year ended March 31, 2024. This forum is divided into the Sustainability Business Forum, which deals with topics more closely related to business activities, and the Sustainability Corporate Forum, which deals with information disclosure and policy formulation. The forum has a flexible structure, including the invitation of additional members depending on the topics covered. In the year ended March 31, 2026, the forum discussed the sustainability-related regulations and disclosures, GHG emissions associated with our investments and loans, monitoring of procedures for interim targets, and sustainable finance targets.

(3) Nomura’s Risk Management on Sustainability


ESG Risk Management Approach

Nomura has developed the “ESG Risk Management Policy” which articulates the governance and framework for managing environmental, social and governance (ESG) risks, in line with the Nomura Group’s Risk Appetite Statement and the Sustainability Statement. ESG risks are not recognized as an independent risk but are understood to be risk factors affecting various risk areas. In response to these risks, Nomura has built an integrated risk management framework that manages the risks caused by ESG risk drivers by adding new controls into the existing risk management frameworks (financial and non-financial).


Risk Management Associated with Climate Change

There are two types of risks associated with climate change: the risk of loss or damage due to long term shifts in climate patterns or extreme weather events such as large typhoons, droughts, and intense heat (chronic and acute physical risks respectively), and the risks associated with decarbonization, such as the inability or cost to respond to changes in government policies and/or carbon prices, and rapid technological innovation (transition risk). These are some of the key physical and transition risks associated with climate change that Nomura recognizes.

At Nomura, we conduct scenario analysis in order to analyze the impact of climate change on our portfolio. To assess financial resilience to climate risks, we use “scenarios”, published by Network for Greening the Financial System (NGFS), to estimate the impact of climate change in the short term on our capital and risk assets for both market risk and credit risk. We also assess a number of climate risk concentration measures to determine how much of the credit portfolio is vulnerable to climate related risks. As the scenario impact and the exposures to the climate risk concentration measures, as a proportion of our company’s portfolio, are relatively low we believe that the impact of climate change on our company’s finances will be limited.

(4) Metrics and Targets

Nomura Group uses metrics related to GHG emissions to measure and manage the risks and opportunities associated with climate change, with the approval of the Sustainability Committee, as well as to steadily implement initiatives to align with the Paris Agreement and achieve net zero. The progress is also reported regularly to the Board of Directors. The result for each metric for the year ended March 2026 will be disclosed in the “Nomura Sustainability Report (tentative title),” and the integrated report scheduled to be issued in summer 2026.


10


Table of Contents
#    Metrics    Target    Results (FY2023/24)    Results (FY2024/25)
1    GHG emissions from its own operations (Scopes 1 and 2) (*1)    Net Zero by FY2030/31   

Scope 1: 2,423 t-CO2e

Scope 2: 19,504 t-CO2e


Scope 1: 2,513 t-CO2e

Scope 2: 17,488 t-CO2e

2    GHG emissions from its lending and investment portfolios (Scope 3, Category 15)    Net Zero by FY2050/51   

Power generation sector GHG emissions:

4,516 kt CO2e

Economic emission intensity: 2,477 t-CO2e/$m


(As of the end of March 2024)


Power generation sector GHG emissions:

1,754 kt CO2e

Economic emission intensity: 1,069 t-CO2e/$m


(As of the end of March 2025)

3    Sustainable financing (*2)    US$125bn in sustainable financing over the five-year period from April 2021 to March 2026    US$28.5 bn    US$21.5 bn


(*1)

Scope 2 emissions are calculated using the market-based method based on the GHG Protocol. The market-based method is a method of calculating Scope 2 emissions reflecting companies’ electricity contract. As the emission factor is based on the contractual terms, if a company purchases low-carbon electricity, such as from renewable energy sources, the effect can be reflected.


(*2)

This target includes financing transactions involving publicly and privately offered equity, bonds and mezzanine debt, as well as infrastructure project finance transactions. The cumulative amount from the year ended March 31, 2022 to the year ended March 31, 2025 was US$96.5 bn.

(Factors considered in each goal setting)


Regarding the GHG emissions from its own operations, targets are set based on comprehensive consideration of the results of energy conservation efforts, the spread of renewable energy, and the ratio of installed renewable energy.


Regarding the GHG emissions from its lending and investment portfolios, targets are set by referring to the International Energy Agency’s NZE scenarios and the emission factor database provided by PCAF.


Regarding the Sustainable financing, target is set by referring to the assumed market size of sustainable finance provided by external vendors.

(5) Human Capital Initiatives

① Nomura’s Human Capital Management and Management Strategy

Nomura believes that, in today’s rapidly changing society, continuously pursuing future-oriented transformation is essential to enhancing corporate value. This transformation requires each employee to possess a high level of expertise and demonstrate strong leadership. It is also important for teams to create a force greater than the sum of their individual members. To achieve this, fostering a sound corporate culture is indispensable. Based on this thinking, Nomura has defined its desired future state as “a team of professionals who continuously take on the challenge of creating new value,” and has positioned this as the vision for its human capital management strategy.

To realize this vision, Nomura has introduced a leadership behavior model and is working to optimize its human capital management cycle, which consists of recruitment, talent development, performance appraisal, mobility and advancement, thereby enhancing the leadership and expertise of each employee. Nomura has also conducted the Nomura Group Employee Survey and uses the PDCA cycle to assess the effectiveness of its human capital management strategy and drive continuous improvement. In addition, Nomura is fostering a sound corporate culture by embedding its code of conduct, creating an inclusive workplace environment, and promoting employee well-being.

Nomura has set forth its management vision and targets for fiscal year 2030 and is working on multiple priority themes to achieve them (See Item 2. “Operating and Financial Review 1. Management Challenges and Strategies”). It is also strategically strengthening the human capital necessary for this purpose. Specifically, to achieve “dramatic growth in stable earnings,” Nomura is strengthening specialized talent capable of advancing new initiatives within existing businesses and creating added value across divisions. In addition, to realize “deepening of its global strategy,” Nomura is focusing on securing and developing global talent that can take the lead in connecting the strengths cultivated in Japan, such as its strong franchise, with overseas markets that are growing rapidly and offer large fee pools.

Accordingly, we recruit and retain talent that aligns with Nomura’s corporate philosophy and values and seek to enhance such talent’s expertise and leadership through talent development, performance appraisal, mobility and advancement. Through these initiatives, we aim to increase the value of our human capital and contribute to the sustained enhancement of corporate value.


11


Table of Contents

LOGO

② Nomura’s Talent Management Cycle

With a view to realizing its human capital management strategy, Nomura introduced the “Leadership Behaviors Model” in April 2025, replacing the former competency framework, following the establishment of the Purpose. This model consists of five behavioral items— “Explore Insights and Visions,” “Make Strategic Decisions,” “Inspire Entrepreneurship in People,” “Elevate Organizational Capability,” and “Inclusion”—and is intended to promote future-oriented leadership transformation across the Nomura Group. Regardless of role or corporate title, all employees are expected to think about and put into practice the leadership required in their respective positions, and to visualize each person’s strengths and areas for improvement and encourage objective discussion. This model is closely linked to each process of the talent management cycle consisting of recruitment, talent development, performance appraisal, mobility and advancement. The main points are as follows.

a. Recruitment

Our recruitment strategy focuses on attracting talent that shares our values of “Entrepreneurial Leadership,” “Teamwork” and “Integrity,” in order to put the Nomura Group’s Purpose into practice. We also seek individuals who possess a strong risk culture, which forms the foundation of effective risk management. To acquire and develop professional talent that consistently takes on the challenge of creating new value, we implement departmental or job-specific recruitment across all regions, including Japan, for both new graduate and mid-career hiring.

We also place significant emphasis on mid-career hiring, recognizing the need for diverse talent with advanced knowledge and expertise in specialized areas. In the past few years, over half of our new hires have been mid-career professionals.

Furthermore, in January 2023, we launched a system to network with Nomura alumni (former employees) and to deepen engagement with alumni active outside the Nomura Group while actively encouraging alumni re-employment. As of March 31, 2026, approximately 350 individuals had registered on the network site, an increase of about 60 from the previous year, and we are continuing to enhance the use of this network.

b. Talent Development

Under the Basic Policy of Talent Development listed below, we are committed to developing our talent.

<Basic Policy of Talent Development>

In order to put into action our Group Purpose, “we aspire to create a better world by harnessing the power of financial markets,” we aim for Nomura Group people to differentiate themselves by being a professional group that continually takes on challenges to create new added value.

We aim to create a decentralized organization in which every employee possesses a high level of expertise and leadership. Toward this end, we have reorganized hierarchical training into programs for new employees, instructors and managers, and are working to enhance departmental training to deepen specialized expertise and self-selection training to promote autonomous career development. As an example of self-selection training, in fiscal year 2023 we launched our digital talent development program, “Digital IQ University,” which provides learning opportunities enabling many employees, not limited to those engaged in IT operations, to systematically acquire a broad range of digital knowledge and skills. In addition, as examples of departmental training, we conduct a 36-month program for the Wealth Management Division and global analyst training programs for the Wholesale Division, thereby establishing a framework for employees to acquire specialized knowledge required for their work and apply it in practice.


12


Table of Contents

We also implement various selective training programs for the strategic development of potential management leaders. These include study abroad programs, which have been offered every year for more than 60 years on a self-application and selection basis; cross-border learning experiences such as startup secondment programs; Nomura Keiei-juku, our flagship program for future management leaders; and leadership development programs provided by external institutions in Japan and overseas, including Nomura Management School, thereby providing opportunities to gain new perspectives beyond everyday work.

c. Performance Appraisal

To deliver on the Nomura Group Purpose, in all regions including Japan, and across all departments and roles, we are making further efforts to enhance our performance-based compensation system, through ensuring the fairness of performance appraisal and benchmarking employee productivity against external market data. All managers in Japan are paid by job type.

We have also introduced 360-degree feedback globally, and by engaging in dialogue between the target and the evaluators regarding the results, we are supporting the growth and leadership development of the target. Additionally, to instill the Code of Conduct throughout the Nomura Group and enhance risk management, we have implemented the ERCC rating (1).


(1)

Evaluation of Ethics, Risk Management, Compliance and Conduct.

d. Mobility and Advancement

We respect employees’ entrepreneurial mindsets and encourage autonomous career development. While we had a global internal job posting system in place before, we significantly expanded the scope of this system in Japan starting from the year ended March 31, 2021. Regardless of corporate title, many employees have actively applied to this system across departmental boundaries, enabling them to pursue new career opportunities through job rotations.

Additionally, from the perspective of appointing talent to key positions within the group and developing successors for such positions, we globally manage a talent pool of individuals with the potential to assume critical roles. Assessments are conducted for these talent pools, and various leadership development programs are provided to the respective employees based on their leadership potential.

③ Fostering a Sound Corporate Culture

We are committed to enhancing employee engagement and fostering a sound corporate culture by embedding the Code of Conduct and promoting Inclusion and Well-being. In April 2025, we established the Culture & Engagement Department, which plays a central role in these efforts.

a. Code of Conduct

We not only comply with laws and regulations, but also maintain a strong sense of ethics, aiming to be a company that is truly trusted by society. To this end, we have established the “Nomura Group Code of Conduct” as the guidelines for actions to be taken by all Nomura Group directors, officers, and employees. Through associated trainings and other measures, we are working to promote appropriate actions (“Conduct”) based on the Code of Conduct. At the annual “Nomura Founding Principles and Corporate Ethics Day” held every August, all directors, officers and employees of the Nomura Group, regardless of region, reaffirm the lessons learned from past incidents and renew our determination to prevent recurrence in order to maintain and build the trust of society and our clients. As part of this initiative, we hold discussions of appropriate conduct based on reflections of past incidents and ask participants to make a pledge to comply with the Code of Conduct. Since its implementation in December 2019, the Code of Conduct has been reviewed periodically to better respond to changes in social and economic conditions surrounding Nomura Group and to the expectations of stakeholders.

b. Inclusion

We believe that diversity among our employees at Nomura, which operates globally, strengthens our competitiveness, drives innovation, and supports advanced risk management. Our employees bring a wide range of backgrounds, including gender, nationality, race, sexual orientation, gender identity, disability, as well as education, experience, capabilities, and values. Since adopting its position on diversity and inclusion in 2016, we have continued to foster an inclusive workplace where every employee has a sense of belonging and can thrive as their authentic selves and achieve their full potential. To advance inclusion, our Working Group, centered on management, leads initiatives through a top-down approach. At the same time, our Employee Networks serve as the core of our bottom-up initiatives. Together, these two approaches drive our efforts.


13


Table of Contents

Starting in fiscal year 2024, the promotion of inclusion has been incorporated into the performance evaluation criteria for all officers and employees worldwide, encouraging contributions to a more inclusive workplace environment. In Japan, we also continue to require approximately 15,000 employees to complete the “Nomura Group Inclusion Training,” which covers topics such as human rights, balancing work with childcare and caregiving, harassment, and psychological safety, to deepen understanding and foster inclusive practices in the workplace.

At Nomura Securities Co., Ltd. and other domestic subsidiaries in Japan (with certain exceptions, such as joint ventures), we are enhancing the workplace environment so that employees planning for childbirth and childcare can continue their careers without concern, regardless of gender. As part of these efforts, we have introduced a “Parental Leave Incentive Bonus.” In addition, managers’ performance evaluations reflect their efforts to support employees in balancing work and family responsibilities and to encourage childcare leave, thereby helping to foster a workplace culture that makes it easier to balance work and childcare. As a result, in August 2025, Nomura Securities Co., Ltd. received the highest, third-level certification under the “Eruboshi” certification program based on the Act on Promotion of Women’s Participation and Advancement in the Workplace. We also continue to improve the workplace environment with the goal of achieving a 100% rate of childcare leave and related leave, regardless of gender. Most male employees take childcare leave, and the average number of days of childcare leave taken by male employees increased from 31.5 days in fiscal year 2024 to 38.6 days in fiscal year 2025. Through these initiatives, balancing work and childcare is becoming more firmly established.

In addition, in fiscal year 2025, we also promoted disability inclusion initiatives. We joined “Valuable 500” and sponsored the Tokyo 2025 Deaflympics. In recognition of our continued implementation of inclusion training and our efforts to advance these initiatives, we were selected in March 2026 as a “Barrier-Free Mindset” good practice company by the Tokyo Metropolitan Government. We will continue working to enhance the workplace environment so that each employee can achieve their full potential.

c. Well-being

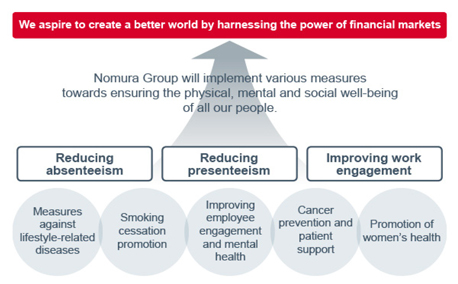
We recognize the importance of our employees’ physical, emotional, mental and financial well-being so that they can realize their full potential, stay motivated and excel in the performance of their duties. We seek to improve our employee welfare programs, such as childcare and nursing care support, as well as to maintain and promote employee health, so that employees can continue to work with enthusiasm, including the development of appropriate working conditions and a comfortable working environment.

We also recognize the need to reduce Absenteeism (1) and Presenteeism (2), and improve Work Engagement (3) and have set the following measurements in order to monitor employee well-being:


14


Table of Contents

LOGO

(Indicators and Targets)


Indicators    Measurements (4)     

Targets (4)

(Year ending
March 31, 2030)

 
   Year ended
March 31, 2024
     Year ended
March 31, 2025
     Year ended
March 31, 2026
 

Absenteeism (millions of yen) (1)

     794.7        759.7        705.4        —   

Presenteeism (%) (2)

     16.4        17.9        16.8        15  

Work Engagement (3)

     53.3        53.7        53.5        55  
 
1

Absenteeism: The impact of absenteeism is measured by financial losses due to absence from work caused by injury or illness, calculated by multiplying the average compensation of employees for such financial year by the number of employees and the utilization rate of sick leave. While our objective is to reduce this by promoting well-being initiatives, it is also essential to establish an environment where employees can easily take leave when experiencing health issues. Therefore, at this stage, we will refrain from setting specific targets and will instead focus on careful monitoring.


2

Presenteeism: A condition in which individuals go to work despite being ill or experiencing symptoms of illness, with negative impacts on business execution and productivity. The figure is calculated based on responses to the SPQ (Single-Item Presenteeism Question, University of Tokyo 1-Item Version), a measurement scale developed by the University of Tokyo. Specifically, it is determined by averaging the responses obtained from the health awareness survey and subtracting this average from 100%.


3

Work Engagement: A positive, fulfilling, work-related state of mind. This is measured based on deviation from the results of the national average of annual stress assessment, which is an annual mandatory workplace program in Japan to screen for mental health issues in workers.


4

The Target figures are for the Nomura Group, and the Measurement figures are for NSC, our major consolidated subsidiary.

For Absenteeism, we have not set a specific target because it is important to create an environment where our employees can be absent from work when they feel unwell. We will continuously evaluate and introduce new well-being initiatives to improve this metric. We set our targets for Presenteeism and Work Engagement, 15 (i.e., no more than a 10% productivity loss rate) and 55 (with the national average being 50), respectively by the year ended March 31, 2031. Currently these measurements are only applicable to employees of NSC, but we will continue to evaluate our implementation plan and extend the initiatives to other subsidiaries, potentially expanding the coverage to the Nomura Group as a whole.


15


Table of Contents

We also support the financial well-being of our employees by offering various programs that contribute to asset formation, such as an employee stock ownership plan, a defined contribution pension plan, and Workplace Tsumitate NISA. We have implemented an incentive system for contributions to the employee stock ownership plan and Workplace Tsumitate NISA. To enable employees to make more effective use of these systems, we began providing video content (Nomura Financial Wellness Program) in fiscal year 2023 through NSC, and in fiscal year 2024 through other domestic subsidiaries, allowing employees to quickly deepen their understanding of retirement benefits and pension systems. Furthermore, in October 2024, we established a department dedicated to supporting employees’ asset formation and have further strengthened our efforts by enhancing the dissemination of information to employees and providing investment consultations. As a result of these initiatives, the number of employees using the employee stock ownership plan and Workplace Tsumitate NISA has steadily increased.

④ Governance Related to Human Capital

As a Company with Three Board Committees, Nomura separates supervision of management from the execution of business in order to enhance corporate governance. The recognition of risks and opportunities related to human capital, the promotion of various initiatives, and risk management are also addressed appropriately through the respective roles of supervision and execution.

At the Board of Directors, the basic management policies are formulated and the execution of duties by directors and executive officers is supervised. The Board also establishes, amends and abolishes important provisions relating to human capital, such as the Code of Conduct.

On the execution side, the Management Committee chaired by the Group CEO and the Human Resources Committee delegated by the Management Committee discuss and decide important matters related to Nomura’s personnel system, human capital strategy, compensation and promotion. In particular, governance relating to compensation is described in Item 4. “Company Information 4. Status of Corporate Governance and Other (4) Compensation for Statutory Officers 1. Compensation Policy.” In addition, under the CHRO appointed by the Management Committee, business plans are formulated and executed based on the decided basic policies and key strategies, and the status of execution of such business plans is reported to the Management Committee.

⑤ Risk Management Related to Human Capital

Nomura recognizes human capital-related issues as material risks affecting the execution of its management strategy and the enhancement of corporate value. The principal risks are as follows:


Risks related to personnel and workplace environments, such as discrimination and harassment, and violations of laws and regulations in each region


Business operation risks arising from talent acquisition or development not progressing as expected


Risks of profit pressure due to increased spending related to talent acquisition


Risks that talent development and corporate culture building will take longer than expected

(For details, please see Item 2. “3. Risk Factors 22.”)

To manage these risks appropriately, Nomura’s business divisions, regions, group companies and human resources functions identify issues based on hiring trends, turnover trends, employee survey results, whistleblowing reports and compliance incidents. Identified issues are then evaluated based on their potential impact on management, likelihood of occurrence and urgency of response, and corresponding measures are reflected in relevant initiatives. Through these efforts, Nomura seeks to appropriately manage human capital-related risks.

⑥ Indicators and Targets

Nomura views PBR (price-to-book ratio) as comprising three components: ROE, shareholders’ equity cost and expected growth rate (for details, please see Item 2. “Operating and Financial Review 1.Management Challenges and Strategies”)

Based on this view, Nomura has established and monitors indicators under its human capital management strategy in the three areas set forth in the table below: Value Creation, Stability and Resilience, and Well Growing. These are positioned as factors that contribute to enhancing corporate value over the medium to long term through the strengthening of human capital. To assess the impact of initiatives under each key theme on the Company’s sustainable value creation, indicators have been established and are monitored. These indicators are reviewed as necessary to ensure the quantitative and appropriate measurement of progress in its initiatives.


16


Table of Contents

LOGO

(Note) The above framework is not intended to mechanically calculate PBR, shareholders’ equity cost or any other financial indicator, but rather to conceptually illustrate the relationship between Nomura’s human capital management and the medium- to long-term enhancement of corporate value. Value Creation represents improvements in profitability and capital efficiency through employees fully demonstrating their capabilities and improving productivity. Stability and Resilience represents strengthening the stability of the business foundation and resilience through ensuring diversity, retaining talent and developing a workplace environment in which diverse talent can continue to demonstrate their capabilities, and is positioned as a factor that contributes to reducing earnings volatility and uncertainties in business execution and, ultimately, to containing shareholders’ equity cost. Well Growing represents an increase in future growth expectations through talent development, skills enhancement and the promotion of autonomous career development.


     Metric  

FY2025


FY2026


Target

Value Creation

   Labor productivity*1 (revenue / number of employees)  

¥ 69.5 million


¥ 75.6 million

  — 

Stability and Resilience

   Ratio of outside directors*3   67%  

64% (Note 1)

  — 
   Ratio of foreign directors*3   33%  

27% (Note 1)

  — 
   Ratio of female directors*3   25%  

27% (Note 1)

  — 
   Disability employment rate*2   2.54%   2.71%  

2.70%

(Note 2)

   Ratio of female managers*1   22.4%   23.8%  

30%

(Note 3)

   Ratio of female branch managers*4   10.3%   10.3%  

10%

(Note 4)

   Ratio of mid-career hiring*4   61.9%   58.6%   — 
   Turnover rate*1 (Note 5)   6.5%   6.3%   — 
   Paid leave utilization rate*4   71.6%   73.2%   70%
   Ratio of male employees’ childcare leave and related leave*4   100.0%   94.8%   100.0%

Well Growing


Strengthening Sustainable Growth

Training hours per employee*1


15.5 hours


14.4 hours

  — 
   Training expenses per employee*1   ¥133,333   ¥ 113,805   — 
   Number of employees learned at Digital IQ University*1  

Approx. 5,000


Approx. 5,500

  — 
   Number of employees transferred through the internal job posting system*1   180   188   — 


Scope:

*1 the Company and its consolidated subsidiaries; *2 the Company and its domestic subsidiaries; *3 the Company; *4 Nomura Securities Co., Ltd.


1

Structure after the June 2026 shareholders’ meeting.


2

New statutory employment rate under the revised Act on Employment Promotion of Persons with Disabilities in July 2026.


3

The target period for the proportion of female managers is through the year ending March 31, 2031.


4

Action plan for the period from May 1, 2020 to April 30, 2025, under the Act on Promotion of Women’s Participation and Advancement in the Workplace.


5

Voluntary turnover rate.


17


Table of Contents

3. Risk Factors

You should carefully consider the risks described below before making an investment decision. If any of the risks described below actually occur, our business, financial condition, results of operations or cash flows could be adversely affected. In that event, the trading prices of securities of NHI could decline, and you may lose all or part of your investment. In addition to the risks listed below, risks not currently known to us or that we now deem immaterial may also harm us and affect your investment.

INDEX

Risks Relating to the Business Environment


1

Our business may be materially affected by financial markets, economic conditions and market fluctuations in Japan and elsewhere around the world, including the ones caused by geopolitical events


  (1)

Governmental fiscal and monetary policy changes in Japan, or in any other countries or regions where we conduct business may affect our business, financial condition and results of operations


  (2)

Extended market declines and decreases in market participants can reduce liquidity and lead to material losses


  (3)

Natural disasters, geopolitical events and infectious diseases could adversely affect our business


2

The financial services industry faces intense competition


  (1)

Competition with other financial firms and financial services by non-financial companies is increasing


  (2)

Increased consolidation and reorganization, business alliance and cooperation in the financial services industry mean increased competition for us


  (3)

Strategic alliances and investments and the launching of new businesses may subject us to significant impact


  (4)

Our global business continues to face intense competition and may require further revisions of our business model


3

Event risk, including the ones caused by geopolitical events, may cause losses in our trading and investment assets as well as market and liquidity risk


4

Sustainability factors including climate change and broader associated policy changes in each jurisdiction could adversely affect our business

Risks Relating to Our Businesses


5

Our business may incur losses due to various factors in the conduct of its operations


  (1)

We may incur significant losses from our trading and investment activities


  (2)

Holding large and concentrated positions of securities and other assets may expose us to significant losses


  (3)

Our hedging strategies may not prevent losses


  (4)

Our risk management policies and procedures may not be fully effective in managing risks


  (5)

Market risk may increase other risks that we face


  (6)

Our brokerage and asset management revenues may decline


  (7)

Our investment banking revenues may decline


6

We may be exposed to losses when third parties do not perform their obligations to us


  (1)

Defaults by a large financial institution could adversely affect the financial markets generally and us specifically


  (2)

There can be no assurance as to the accuracy of the information about our credit risk, or the sufficiency of the collateral we use in managing it


  (3)

Our clients and counterparties may be unable to perform their obligations to us as a result of political or economic conditions


7

We are exposed to model risk, i.e., risk of financial loss, incorrect decision making, or damage to our credibility arising from model errors or incorrect or inappropriate model application


8

NHI is a holding company and depends on payments from its subsidiaries


9

We may not be able to realize gains we expect, and may even suffer losses, on our investments in equity securities and non-trading debt securities


10

We may face an outflow of clients’ assets due to losses incurred within cash reserve funds or debt securities we offer to clients


18


Table of Contents

Risks Relating to Our Financial Position


11

We may have to recognize impairment losses with regard to the amount of goodwill, tangible assets and intangible assets recognized on our consolidated balance sheets


12

Liquidity risk could impair our ability to fund operations and jeopardize our financial condition


  (1)

We may be unable to access unsecured or secured funding


  (2)

We may be unable to sell assets


  (3)

Lowering of our credit ratings could impact our funding


13

Equity investments in affiliates and other investees accounted for under the equity method in our consolidated financial statements may decline significantly over a period of time and result in us recognizing impairment losses

Risks Relating to Legal, Compliance and Other Operational Issues


14

Operational risk could adversely affect our business


15

Reputational risk could adversely affect our business


16

We may identify a material weakness in our internal control over financial reporting, indicating that our internal control over financial reporting may not be effective


17

Misconduct, fraud or other criminal activity by an employee, director or officer, or any third—party, could occur, and our reputation in the market and our relationships with clients could be harmed


18

A failure to identify and appropriately address conflicts of interest could adversely affect our business


19

Our business is subject to substantial legal and regulatory risks


  (1)

Legal liability related to our business may occur and could adversely affect our business, financial condition and results of operations


  (2)

Extensive regulation of our businesses limits our activities and may subject us to significant penalties and losses


  (3)

Tightening of regulations applicable to the financial system and financial industry could adversely affect our business, financial condition and results of operations


  (4)

Deferred tax assets may be impacted due to a change in business condition or in laws and regulations, resulting in an adverse effect on our operating results and financial condition


  (5)

Defects in our anti-money laundering and counter-terrorism financing measures could have serious consequences, such as administrative penalties or punitive fines


20

Unauthorized disclosure or misuse of personal information held by us may adversely affect our business


21

System failure, information leakage and cost of maintaining sufficient cybersecurity could adversely affect our business, financial condition and results of operations


22

Our business may be adversely affected if we are unable to hire, retain and develop qualified personnel


19


Table of Contents

Risks Relating to the Business Environment

1. Our business may be materially affected by financial markets, economic conditions and market fluctuations in Japan and elsewhere around the world, including the ones caused by geopolitical events

Our business and revenues may be affected by any adverse changes or volatility in the Japanese and global economic environments and financial markets. In addition to purely economic factors, events such as military disputes, acts of terrorism, economic or political sanctions, pandemics, natural disasters and other actual or anticipated geopolitical risks and geopolitical events could have an effect on the financial markets and economies of each country. If any adverse events including those discussed above were to occur, a market or economic downturn may last for a long period of time, which could adversely affect our business and business continuity readiness, and could result in us incurring substantial losses. In addition to conditions in financial markets, social conditions such as the long-term trends of population aging and population decline faced by Japan are expected to continue to put downward pressure on demand in the businesses in which we operate. The following are certain risks related to the financial markets and economic conditions for our specific businesses.

(1) Governmental fiscal and monetary policy changes in Japan, or in any other countries or regions where we conduct business may affect our business, financial condition and results of operations

We engage in our business globally through domestic and international offices. Governmental fiscal, monetary and other policy changes in Japan, or in any other countries or regions where we conduct business, may affect our business, financial condition and results of operations. In particular, any changes to the monetary policy of the Bank of Japan or central banks in major economies worldwide, which could potentially lead to volatility in interest rates or yields, may negatively affect our ability to provide asset management products to our clients as well as our trading and investment activities or lead to increased interest expenses. In 2025, following the Bank of Japan’s policy rate hikes in both January and December, Japan’s 10-year government bond yield rose by approximately 1 percentage point over the course of the year. In addition, around the February 2026 Japanese House of Representatives election, there were periods of volatility in the Japanese government bond market as major political parties broadly campaigned on lowering the consumption tax rate, and, in April 2026, Japanese government bonds reached their highest yields in nearly 30 years following the collapse of peace talks between the U.S. and Iran. Uncertainty surrounding fiscal policy under the current U.S. administration is also a factor that has contributed to, and may continue to contribute to, increased market volatility.

(2) Extended market declines and decreases in market participants can reduce liquidity and lead to material losses

Extended market declines can reduce the level of market activity and the liquidity of the assets traded in those markets in which we operate. Market liquidity may also be affected by decreases in market participants, for example, if financial institutions scale back market-related businesses due to increasing regulation or other reasons. As a result, it may be difficult for us to sell, hedge or value such assets. In the event that a market is unable to price such assets, it will be difficult to estimate their values. If we cannot properly close out or hedge our associated positions in a timely manner or in full, particularly with respect to Over-The-Counter (“OTC”) derivatives, we may incur substantial losses. Further, if the liquidity of a market significantly decreases and the market becomes unable to price financial instruments held by us, this could lead to unanticipated losses.

We have established a risk management system that measures these market risk and liquidity risk on a daily basis and takes immediate actions if the pre-set limits are exceeded.

(3) Natural disasters, geopolitical events and infectious diseases could adversely affect our business

Unexpected events such as natural disasters, geopolitical events or infectious diseases could exceed the assumptions of our event response preparation and framework, and we may not always be able to respond to every situation. As a result, our officers and employees may become unable to perform their duties, and our facilities, systems, or communication networks may not function, adversely affecting our business continuity management. In particular, Japan, where Nomura has its group head office, is prone to natural disasters such as earthquakes and tsunamis; if a large-scale earthquake or other natural disasters were to occur in regions where our main offices are concentrated, it could have a serious impact on our ability to carry out business operations, our financial condition and our business performance. Geopolitical events include cases such as armed conflict or heightened military tensions, acts of terrorism, political instability, and trade fragmentation.

To prepare for these risks, we have developed a business continuity plan for addressing unexpected situations and conduct crisis management exercises including employee notification tests. This includes the establishment of an emergency command center if any unforeseen situation should arise, to ensure the safety of our officers, employees and others, prevent the expansion of damages, and maintain our business continuity readiness. We also continue to ensure that we can maintain operational resilience (which refers to the ability to continue to provide important business services at a minimum level that should be maintained in the event of a system failure, cyberattack or natural disaster).


20


Table of Contents

2. The financial services industry faces intense competition

Our businesses are intensely competitive, and are expected to remain so. We compete on the basis of a number of factors, including transaction execution capability, our products and services, innovation, reputation and price. We continue to experience intense price competition, particularly in brokerage, investment banking and other businesses.

(1) Competition with other financial firms and financial services by non-financial companies is increasing

We face intense competition in the financial services sector from a wide variety of competitors. We compete with other independent securities firms as well as securities firms affiliated with commercial banks and with firms that have broad footprints across regions. As a result, our market shares and commissions earned in the sales and trading, investment banking and Wealth Management businesses in particular have been affected. We face intense competition beyond the traditional financial sector based on the increasing digitalization of the industry, not only with the rise of online securities firms but also FinTech companies and the entry of non-financial companies into the financial services sector. Moreover, the competitive environment has begun to change due to shifts in service models driven by the use of AI technology. In order to address such changes in the competitive landscape, we continue to adopt and transform our business models through various measures. However, these measures may not be successful in growing or maintaining our market share in this increasingly fierce competitive environment, and we may lose business or transactions to our competitors, harming our business and results of operations.

(2) Increased consolidation and reorganization, business alliance and cooperation in the financial services industry mean increased competition for us

There has been substantial consolidation and convergence among companies in the financial services industry. In particular, a number of large commercial banks and other broad-based large financial services groups have established or acquired broker-dealers or have consolidated with other financial institutions. These large financial services groups have developed business linkage within their respective groups in order to provide comprehensive financial services to clients, offering a wide range of products, including loans, deposit-taking, insurance, brokerage, asset management and investment banking services within their group, which may enhance their competitive position compared with us. They also have the ability to supplement their investment banking and brokerage businesses with commercial banking and other financial services revenues in an effort to gain market share. In addition, the financial services industry has seen collaboration beyond the borders of businesses and industries, such as alliances between commercial banks and securities companies outside of the framework of existing corporate groups and recent alliances with non-financial companies including emerging companies. Our competitiveness may be adversely affected if our competitors are able to expand their businesses and improve their profitability through such business alliances.

(3) Strategic alliances and investments and the launching of new businesses may subject us to significant impact

We may seek to grow our business from time to time through strategic alliances, investments such as acquisitions or minority investments and launch new businesses. However, if the sourcing, evaluation, development and implementation of these business strategies do not proceed as expected because of regulatory issues or otherwise, we may not be able to grow our business, maintain or improve our competitive position, achieve the expected synergies and other benefits or recoup related investments, and we may experience competition from other institutions for a limited number of attractive investment and alliance opportunities. These new strategic alliances, investments and business initiatives may also subject us to increased risk as we engage in new activities, transact with a broader array of clients and counterparties and expose ourselves to new asset classes and new markets.

(4) Our global business continues to face intense competition and may require further revisions of our business model

We continue to believe there are significant opportunities in the international markets, but there is also significant competition associated with such opportunities. In order to take advantage of these opportunities, we will have to compete successfully with financial services firms based in important non-Japanese markets, including the U.S., Europe and Asia. We have been working to strengthen our global business platform, under which we aim to transform our business portfolio and pivot towards client businesses and growth areas, both organically and inorganically. The sale of stake of Capital Nomura Securities Public Company Limited in 2023 and the acquisition of all equity interests in Macquarie Management Holdings, Inc., Macquarie Investment Management Holdings (Luxembourg) S.à r.l., and Macquarie Investment Management Holdings (Austria) GmbH in 2025 (the “Macquarie Acquisition”) are recent examples of transforming our business platform. We will continue to review our entire business portfolio while looking at the competitive environment, and intend to implement our strategies in consideration of potential risks. However, the risk remains that we may be required to incur greater costs and expenses than we expect, or to commit greater financial, management and other resources to the strategies than we expect, which could adversely affect our business and results of operations. Moreover, the assumptions and expectations upon which these strategies are based may not be accurate, which could lead to us realizing fewer benefits or synergies than we expect or could even harm our business and results of operations. Furthermore, to the extent we reduce compensation or headcount as part of this strategy, our ability to attract and retain the employees needed to successfully run our businesses could be adversely affected. We may also be unsuccessful in designing a streamlined management structure, which could harm our ability to properly control or supervise our many businesses across the world.


21


Table of Contents

3. Event risk, including the ones caused by geopolitical events, may cause losses in our trading and investment assets as well as market and liquidity risk

Event risk refers to potential losses we may suffer through unpredictable events that cause large unexpected market price movements such as natural or man-made disasters, epidemics, acts of terrorism, military disputes or political instability, as well as adverse events specifically affecting our business activities or counterparties. These events include significant events such as the COVID-19 pandemic in 2020, the invasion of Ukraine by the Russian Federation in 2022, and the geopolitical tensions in the Middle East, as well as sudden, unforeseen changes in trade and security policies resulting from decisions by the U.S. administration or otherwise. More specifically, they include the following types of events that could cause losses in our trading and investment assets:


sudden and significant reductions in credit ratings with regard to financial instruments held by our trading and investment businesses by major rating agencies,


sudden changes in trading, tax, accounting, regulatory requirements, laws and other related rules which may make our trading strategy obsolete, less competitive or no longer viable, or


an unexpected failure in a corporate transaction in which we participate resulting in us not receiving the consideration we should have received, as well as bankruptcy, deliberate acts of fraud, and administrative penalties with respect to the issuers of our trading and investment assets.

4. Sustainability factors including climate change and broader associated policy changes in each jurisdiction could adversely affect our business

We consider climate change one of the most important global challenges facing society. The direct impact of climate change (physical risk), and the resulting changes in the business environment (transition risk) could cause us to incur losses.

In addition, as a global financial institution, we provide a wide range of solutions that address environmental and social issues. However, amid rapidly changing circumstances around sustainability, there may be cases where we are deemed to lack sufficient focus on sustainability matters such as the environment or human rights in our business activities, and we may not be able to provide adequate support to clients pursuing decarbonization or other sustainability-related initiatives. Furthermore, regulatory and market expectations in each country continue to evolve rapidly and generate conflicting views and approaches. As a result, there may be cases where our disclosure of sustainability-related information or our compliance with regulations is insufficient, or where it is perceived as such, or conversely, our efforts toward sustainability, including participation in voluntary initiatives, may be perceived negatively by some stakeholders, potentially resulting in litigation, regulatory action or administrative penalties. In such cases, there is a possibility that our reputation, results of operations and financial condition may be adversely affected.


22


Table of Contents

Risks Relating to Our Businesses

5. Our business may incur losses due to various factors in the conduct of its operations

(1) We may incur significant losses from our trading and investment activities

We maintain trading and investment positions in fixed income, equity and other markets, both for the purpose of facilitating our clients’ trades and for proprietary purposes. Our positions consist of various types of assets, such as interest rates, currency, credit, securitized products and equities, including securities, derivatives, repurchase agreements as well as loan transactions. Fluctuations in the markets where these assets are traded can adversely affect the value of our positions. Although we continue to mitigate these position risks with a variety of hedging techniques, we may incur losses if the value of these assets fluctuates significantly or if the financial system is overly stressed and the markets move in a way we have not anticipated. In addition, prices of crypto-assets may fluctuate significantly due to various factors such as developments in the industry or in regulation of crypto assets.

Our businesses have been, and may continue to be, affected by changes in market volatility levels. Certain of our trading businesses such as those engaged in trading and arbitrage opportunities depend on market volatility to generate revenues. Lower volatility may lead to a decrease in business opportunities which may affect the results of operations of these businesses. On the other hand, while higher volatility can increase trading volumes, it also increases risk as measured by Value-at-Risk (“VaR”). Higher volatility and wider bid offer spreads may expose us to higher risks in connection with our market-making and proprietary trading businesses and can also cause us to reduce the outstanding positions or size of these businesses where we consider necessary.

We also commit capital to take relatively large positions in connection with our underwriting or warehousing assets to facilitate certain capital market transactions. Furthermore, we structure and take positions in pilot funds for developing financial investment products and invest seed money to set up and support financial investment products. We may incur significant losses from these positions in the event of significant market fluctuations.

In addition, if we are the party providing collateral in a transaction, significant declines in the value of the collateral or a requirement to provide additional collateral due to a decline in our creditworthiness (by way of a lowered credit rating or otherwise) can increase our costs and reduce our profitability. On the other hand, if we are the party receiving collateral from our clients and counterparties, such declines may also affect our profitability due to a decrease in client transactions. See also “—Risks Relating to Our Financial Position—12. Liquidity risk could impair our ability to fund operations and jeopardize our financial condition—(3) Lowering of our credit ratings could impact our funding.”

(2) Holding large and concentrated positions of securities and other assets may expose us to significant losses

We regularly hold large and concentrated positions of certain securities in our businesses such as market-making, block trading, underwriting, asset securitization, prime brokerage, or providing business solutions to meet our clients’ needs. We have committed substantial amounts of capital to these businesses. This often requires us to take large positions in the securities of a particular issuer or issuers in a particular industry, country or region. Fluctuations in the prices of these positions can significantly affect the prices at which we are able to liquidate them when needed, resulting in us incurring significant trading losses. We generally have higher exposure to counterparties engaged in financial services businesses, including commercial banks, broker-dealers, clearing houses, exchanges and investment companies.

(3) Our hedging strategies may not prevent losses

We use a variety of financial instruments and strategies to hedge our exposure to financial risks arising from the financial instruments we enter into for our clients or for proprietary purposes. If our hedging strategies are not effective, we may incur losses. We do not necessarily hedge every risk and base many of our hedging strategies on historical trading patterns and correlations. For example, if we hold an asset, we may hedge this position by taking a position in another asset which has, historically, moved in a direction that would offset a change in value of the former asset. However, historical trading patterns and correlations may not continue, as seen in the case of past financial crises, and hedging strategies aimed at certain specific risks may not be fully effective in mitigating our risk exposure because we are exposed to all types of risk in a variety of market environments. Moreover, not all hedging strategies are effective, and certain strategies may, if the risk is not otherwise appropriately managed, increase our risk.


23


Table of Contents

(4) Our risk management policies and procedures may not be fully effective in managing risks

Our policies and procedures to identify, monitor and manage risks may not be fully effective. Although some of our methods of managing risk are based upon observed historical market data, future movements in the financial markets may not be the same as was observed in the past. As a result, we may suffer significant losses through unexpected future risk exposures. Other risk management methods that we use also rely on our evaluation of information regarding markets, clients or other matters, which is publicly available or otherwise accessible by us. This information may not be accurate, complete, up-to-date or properly evaluated, and we may be unable to properly assess our risks, and thereby suffer large losses. Furthermore, certain factors, such as market volatility, may render our risk evaluation model unsuitable for a new market environment. In such event, we may be unable to evaluate or otherwise manage our risks adequately. Moreover, regardless of how well policies and procedures are designed, they must be properly implemented and followed in order to be effective, which may not always occur despite our diligent efforts. Further, potential weaknesses in our organizational structures and governance frameworks may lead to misunderstanding roles and responsibilities.

(5) Market risk may increase other risks that we face

In addition to the potentially adverse effects on our businesses described above, market risk could exacerbate other risks that we face. For example, the risks inherent in financial instruments developed through financial engineering and innovation may be increased by market risk.

Also, if we incur significant trading losses caused by our exposure to market risk, our need for liquidity could rise sharply while our access to cash may be impaired as a result of market perception of our credit risk.

Furthermore, in a downturn in the market overall or for specific securities, our clients and counterparties could incur significant losses or experience other adverse events of their own, thereby weakening their financial condition and, as a result, increasing the credit risk they pose to us.

(6) Our brokerage and asset management revenues may decline

A market downturn could result in a decline in the revenues generated by our brokerage business because of a decline in the volume and value of securities that we broker for our clients. Also, in recent years, our asset management business has been growing in importance, both organically and through acquisitions such as the Macquarie Acquisition, and further growth of this platform is one of the priorities of our growth strategy. However, we may be unable to achieve the benefits of this strategy overall, or of the Macquarie Acquisition in particular. Moreover, the asset management business is subject to market downturns. Within our asset management business, in most cases, we charge fees for managing our clients’ portfolios that are based on the market value of their portfolios. A market downturn that reduces the market value of our clients’ portfolios would reduce the revenue we receive from these businesses and might increase the number of withdrawals or reduce the number of new investments in these portfolios. Also, any changes in our clients’ investment preference on their asset portfolios, including shifting investment assets to deposits which are stable assets and passive funds which generate lower fee revenue, may also result in a decline in our revenues.

(7) Our investment banking revenues may decline

Changes in financial or economic conditions would likely affect the number and size of transactions for which we provide securities underwriting, financial advisory and other investment banking services. Our investment banking revenues, which include fees from these services, are directly related to the number and size of the transactions in which we participate and would therefore decrease if there are financial and market changes unfavorable to our investment banking business and our clients.


24


Table of Contents

6. We may be exposed to losses when third parties do not perform their obligations to us

Our counterparties are from time to time indebted or otherwise owe certain obligations (such as with regard to the posting of collateral) to us as a result of transactions or contracts, including loans, commitments to lend, other contingent liabilities and derivative transactions. We may incur material losses when our counterparties default or fail to perform on their obligations to us due to their filing for bankruptcy, a deterioration in their creditworthiness, lack of liquidity, operational failure, an economic or political event, repudiation of the transaction or for other reasons. In the year ended March 31, 2024, the Company recorded a loss of approximately ¥14 billion due to a failure to settle transactions between a subsidiary of the Company and a broker in the U.K. Although we establish and maintain allowances for credit losses, such allowances reflect management judgments and assumptions based on information available to us. Such information may prove incorrect or incomplete, and these judgments and assumptions may prove to be incorrect, potentially significantly so.

We are also exposed to credit risk from holding securities issued by third parties as well as through the execution of securities, futures, currency or derivative transactions that fail to settle at the required time due to non-delivery by our counterparties such as financial institutions and hedge funds, or to system failures by clearing agents, exchanges, clearing houses, etc.

Issues related to third-party credit risk may include the following:

(1) Defaults by a large financial institution could adversely affect the financial markets generally and us specifically

The commercial soundness of many financial institutions is closely interrelated as a result of credit, trading, clearing or other relationships among the institutions. As a result, concern about the creditworthiness of or a default by, a certain financial institution could lead to significant liquidity problems or losses in, or defaults by, other financial institutions. This may adversely affect financial intermediaries, such as clearing agencies, clearing houses, banks, securities firms and exchanges, with which we interact on a daily basis. Actual defaults, increases in perceived default risk and other similar events could arise in the future and could have an adverse effect on the financial markets and on us.

(2) There can be no assurance as to the accuracy of the information about our credit risk, or the sufficiency of the collateral we use in managing it

We regularly review our credit exposure to specific clients or counterparties and to specific countries and regions that we believe may present credit concerns. Default risk, however, may arise from events or circumstances that we do not detect, such as account-rigging and fraud. We may also fail to receive full information with respect to the risks of a counterparty, or to accurately manage and assess such information internally. In addition, in cases where we have extended credit against collateral, sudden declines in market values of the collateral could result in such collateral being insufficient to cover our exposure.

(3) Our clients and counterparties may be unable to perform their obligations to us as a result of political or economic conditions

Country, regional and political risks are components of credit risk, as well as market risk. Political or economic pressures in a country or region, including those arising from local market disruptions or currency crises, may adversely affect the ability of clients or counterparties located in or subject to conditions in that country or region to obtain credit or foreign exchange, and therefore to perform their obligations owed to us.

7. We are exposed to model risk, i.e., risk of financial loss, incorrect decision making, or damage to our credibility arising from model errors or incorrect or inappropriate model application

We widely use models for various purposes including the valuation of illiquid derivative transactions or the estimation of the creditworthiness of certain counterparties. However, models are never perfect, and their use subjects us to model risk. Model errors or incorrect or inappropriate model applications could lead to incorrect decision making, financial losses or damage to our credibility. Nomura has a well-established Model Risk Management Framework, including robust model development, implementation, and use, and a sound model validation process and governance. While these initiatives effectively control and limit Model Risk within the firm, it is never perfectly mitigated.


25


Table of Contents

8. NHI is a holding company and depends on payments from its subsidiaries

NHI, the issuer of the common stock underlying the ADSs to which this annual report relates, is a holding company and is heavily dependent on dividends, distributions and other payments from its subsidiaries to be able to settle its financial obligations and liabilities. Regulatory and other legal restrictions, such as those under the Companies Act, may limit NHI’s ability to transfer funds freely, either to or from its subsidiaries. In particular, many of NHI’s subsidiaries, including its broker-dealer subsidiaries, are subject to laws and regulations, including regulatory capital requirements, that authorize regulatory bodies to block or reduce the flow of funds to the parent holding company, or that prohibit such transfers altogether in certain circumstances. For example, Nomura Securities Co., Ltd. (“NSC”), Nomura Securities International, Inc., Nomura International plc and Nomura International (Hong Kong) Limited, NHI’s main broker-dealer subsidiaries, are subject to regulatory capital requirements and changes in such regulatory capital requirements and the required level could limit the transfer of funds to NHI. While NHI monitors and manages the transfer of funds within the Nomura Group on the basis of relevant laws and regulations on a daily basis, these laws and regulations may hinder NHI’s ability to access funds needed to be able to settle its financial obligations and liabilities.

9. We may not be able to realize gains we expect, and may even suffer losses, on our investments in equity securities and non-trading debt securities

We hold substantial investments in equity securities including private equity investments and investments in affiliates for which the fair value option was elected, and non-trading debt securities. Under U.S. GAAP, depending on market conditions, we may recognize significant losses in connection with these investments, which could have an adverse impact on our financial condition and results of operations. Moreover, while we may decide to dispose of these equity securities and debt securities, depending on the market conditions, we may not be able to dispose of these equity securities and debt securities when we would like to do so, as quickly as we may wish or at the desired price.

10. We may face an outflow of clients’ assets due to losses incurred within cash reserve funds or debt securities we offer to clients

Cash reserve funds, such as money market funds and money reserve funds are typically categorized as low risk financial products. As a result of a sudden rise in interest rates, such cash reserve funds may fall below their par value due to losses resulting from price decreases, defaults or negative interest charges arising from debt securities held by the fund. If we determine that a stable return cannot be achieved from the investment performance of cash reserve funds, we may accelerate the redemption of, or impose a deposit limit on, such cash reserve funds.

In addition, issuers of debt securities that we sell may default or otherwise delay the payment of interest and/or principal.

Such events may result in the loss of client confidence and lead to an outflow of client assets from our custody or preclude us from increasing such client assets.

Risks Relating to Our Financial Position

11. We may have to recognize impairment losses with regard to the amount of goodwill, tangible assets and intangible assets recognized on our consolidated balance sheets

We have purchased all or a part of the equity interests in, or operations from, certain other companies in order to pursue our business expansion, and expect to continue to do so when and as we deem beneficial. We account for certain of those and similar purchases and acquisitions as a business combination under U.S. GAAP by allocating our acquisition costs to the assets acquired and liabilities assumed and recognizing the remaining amount as goodwill.

For example, in December 2025, we recognized additional goodwill of ¥150,976 million and additional intangible assets of ¥118,201 million on our consolidated balance sheet in connection with the Macquarie Acquisition.

We may have to recognize impairment losses, as well as other losses associated with subsequent transactions, with regard to the amount of goodwill, tangible assets and intangible assets recognized on our consolidated group balance sheet which may adversely affect our financial condition and results of operations.


26


Table of Contents

12. Liquidity risk could impair our ability to fund operations and jeopardize our financial condition

Liquidity, or having ready access to cash, is essential to our business. We define liquidity risk as the risk of loss arising from difficulty in securing the necessary funding, or from a significantly higher cost of funding than normal levels, due to a deterioration in our creditworthiness or a deterioration in market conditions. In addition to maintaining a readily available cash position, we seek to secure ample liquidity through repurchase agreements and securities lending transactions, long-term borrowings and the issuance of long-term debt securities as well as through diversification of our short-term funding sources such as commercial paper, and by holding a portfolio of highly liquid financial assets. Despite this, there is a risk that we may lose liquidity under certain circumstances, including the following:

(1) We may be unable to access unsecured or secured funding

We continuously access unsecured funding from issuance of securities in the short-term credit markets and debt capital markets as well as bank borrowings to finance our day-to-day operations, including refinancing. We also enter into repurchase agreements and securities lending transactions to raise secured funding for our trading businesses. An inability to access unsecured or secured funding or funding at significantly higher cost than normal levels could have a substantial negative effect on our liquidity. For example, lenders could refuse to extend the credit necessary for us to conduct our business based on their assessment of our long-term or short-term financial prospects if:


We incur large trading losses,


The level of our business activity decreases due to a market downturn,


Regulatory authorities take significant action against us, or


Our credit rating is downgraded.

In addition to the above, our ability to borrow in the debt capital markets could also be adversely impacted by factors that are not specific to us, such as increases in market interest rates, reductions in banks’ or other financial institutions’ lending ability, a severe disruption of the financial and credit markets, negative views about the general prospects for the investment banking, brokerage or financial services industries, or negative market perceptions of Japan’s financial soundness.

(2) We may be unable to sell assets

If we are unable to raise funds or if our liquidity declines significantly, we will need to liquidate assets or take other actions in order to meet our maturing liabilities. In volatile or uncertain market environments, overall market liquidity may decline. In a time of reduced market liquidity, we may be unable to sell some of our assets, or we may have to sell at depressed prices, which could adversely affect our results of operations and financial condition. Our ability to sell assets may also be adversely impacted by other market participants seeking to sell similar assets into the market at the same time.

(3) Lowering of our credit ratings could impact our funding

Our funding depends significantly on our credit ratings. Rating agencies may downgrade or withdraw their ratings or place us on “credit watch” with negative implications. Downgrades could increase our funding costs and limit our funding. This, in turn, could adversely affect our results of operations and our financial condition. In addition, other factors which are not specific to us may impact our funding, such as negative market perceptions of Japan’s financial soundness.

13. Equity investments in affiliates and other investees accounted for under the equity method in our consolidated financial statements may decline significantly over a period of time and result in us recognizing impairment losses

Under U.S. GAAP, we have affiliates and investees accounted for under the equity method in our consolidated financial statements and whose shares are publicly traded. If there is a decline in the market price of the shares, we hold in such affiliates below the carrying amount of our investments over a period of time, and we determine that the decline is other-than-temporary, then we recognize an impairment loss through earnings which may have an adverse effect on our financial condition and results of operations.


27


Table of Contents

Risks Relating to Legal, Compliance and Other Operational Issues

14. Operational risk could adversely affect our business

Operational risk is the risk of financial loss or non-financial impact arising from inadequate or failed internal processes and systems, from a lack of appropriate personnel, from human errors, or from external events, and includes fraud, compliance, legal, IT, cyber and information security, third-party, and other non-financial risks. We always face the potential of operational risk, and if it materializes, it could adversely affect our business. Issues related to operational risk may include the risks listed in items 16 to 22 below.

15. Reputational risk could adversely affect our business

Reputational risk is the risk of possible damage to Nomura’s reputation and associated risk to earnings, capital, or liquidity arising from any association, action, or inaction which could be perceived by stakeholders to be inappropriate, unethical, or inconsistent with Nomura Group’s values and corporate philosophy. We always face the potential of reputational risk, and if any of the events described in this Risk Factors occur and such risk materializes, it could adversely affect our business outlook, financial condition, or results of operations.

16. We may identify a material weakness in our internal control over financial reporting, indicating that our internal control over financial reporting may not be effective

As a New York Stock Exchange (“NYSE”)-listed company and SEC registrant, we assess the effectiveness of internal controls over financial reporting under the U.S. Sarbanes-Oxley Act of 2002. We also assess the effectiveness of internal controls over financial reporting pursuant to the Financial Instruments and Exchange Act and submit the Management’s Report on Internal Control over Financial Reporting including the results of this evaluation as a part of our Japanese language annual securities report. We have established a framework with the goal of ensuring the effectiveness and appropriateness of these controls. However, we may identify a material weakness in our internal control over financial reporting, indicating that our internal control over financial reporting may not be effective.

For example, we identified a material weakness during the quarter ended March 31, 2024 in relation to certain classification and presentation matters within the consolidated statement of cash flows as included within our consolidated financial statements, which resulted in the need to restate the consolidated statement of cash flows in certain of our annual and interim consolidated financial statements. We identified and implemented a number of remediation actions to address this material weakness and intended to mitigate the risk of similar errors occurring in the future within the consolidated statement of cash flows, and our management concluded that our internal control over financial reporting has been effective as of the end of each fiscal year, beginning with the year ended March 31, 2024.

If future material weaknesses are identified, we may be unable to provide financial information in our consolidated financial statements and elsewhere in an accurate, timely and reliable manner or require additional restatements of our consolidated financial statements or other aspects of our periodic reporting. Such issues may undermine confidence in our published financial information and other reported information by users of our consolidated financial statements, including the holders of our securities, potentially causing reductions in the price of our common stock and/or ADRs. Additionally, such issues could limit our access to capital markets, affect clients’ or counterparties’ appetite to enter into transactions with us and subject us to potential regulatory investigations and sanctions. Each of these factors may materially and adversely affect our business, results of operations and financial condition.

17. Misconduct, fraud or other criminal activity by an employee, director or officer, or any third-party, could occur, and our reputation in the market and our relationships with clients could be harmed

We always face the risk that our employees, directors or officers, or any third-party, could engage in misconduct that may adversely affect our business. Misconduct by an employee, director or officer includes conduct such as entering into transactions in excess of authorized limits, acceptance of risks that exceed our limits, concealment of unauthorized or unsuccessful activities or criminal or other unlawful actions against customers. The misconduct could also involve the improper use or disclosure of non-public information relating to us or our clients, such as insider trading, improper transmission of such information and the recommendation of trades based on such information, as well as other crimes, which could result in regulatory sanctions, legal liability and serious reputational or financial damage to us.

Third-parties may also engage in fraudulent activities, including devising a fraudulent scheme to induce our investment, loans, guarantee or any other form of financial commitment, both direct and indirect. Because of the broad range of businesses that we engage in and the large number of third-parties with whom we deal in our day-to-day business operations, such fraud or any other misconduct may be difficult to prevent or detect, and our future reputation and financial condition could be adversely affected, which could result in serious reputational or financial damage to us in the future.


28


Table of Contents

We have taken measures in line with the improvement plan to detect and prevent such fraudulent or misconduct by our employees, directors or officers, or any third party in the future, including the establishment and implementation of the “Nomura Group Code of Conduct” including ensuring its thorough dissemination throughout the group and ensuring thorough compliance with its terms, and through compliance training or any other programs, as well as an enhanced internal reporting system. However, the measures we have implemented or additional measures that may be implemented in the future may not be effective in preventing or managing the risk of misconduct or fraud in all cases, and we may not always be able to detect or deter misconduct or fraud by employees, directors, officers, or third-parties. If any administrative or judicial sanction is issued against us as a result of such fraud or misconduct, we may lose business opportunities, and our future revenue and results of operations may be materially and adversely affected, even after the sanction is lifted, if and to the extent that our clients, especially public institutions, decide not to engage us for their financial transactions.

The Company’s consolidated subsidiary, NSC, is addressing damages that occurred due to transactions, such as the purchase and sale of securities and other financial instruments, conducted by third-parties using customers’ assets through unauthorized access to securities accounts due to fraudulent activities, such as phishing. In regard to customer accounts that suffered damages since January 2025, NSC will handle each case based on the individual circumstances of each customer, including, at a maximum, restoring the accounts to the state prior to the unauthorized transactions. Currently, although strengthened cooperation with relevant parties, customer alerts, enhanced authentication measures and other initiatives have reduced the number of such incidents compared with earlier periods, phishing and related techniques continue to become more sophisticated and diverse, and similar incidents may occur again in the future. If we or our customers become involved in such incidents, or if our response—such as loss compensation or security enhancements—is viewed as insufficient, our future reputation, and financial condition may be adversely affected.

18. A failure to identify and appropriately address conflicts of interest could adversely affect our business

We are a global financial institution that provides a wide range of products and services to a diverse group of clients, including individuals, corporations, other financial institutions and governmental institutions. As such, we face potential conflicts of interest in the ordinary course of our business. Conflicts of interests can arise when our services to a particular client conflict or compete, or are perceived to conflict or compete, with our own interests. In addition, where non-public information is not appropriately restricted or shared within Nomura, conflicts of interest may also arise when a transaction within the Nomura Group or with another client conflicts or competes, or is perceived to conflict or compete, with a transaction with a particular client. While we have extensive internal procedures and controls designed to identify and address conflicts of interest on the basis of the “Nomura Group Conflicts of Interest Management Policy”, a failure, or a perceived failure, to identify, disclose and appropriately address such conflicts could adversely affect our reputation, the willingness of current or potential clients to do business with us, and give rise to potential regulatory actions or litigation against us, which could have a material adverse effect on our financial condition and results of operations.

19. Our business is subject to substantial legal and regulatory risks

Substantial legal liability or a significant regulatory action against us could have a material adverse effect on our business, financial condition or results of operations, or cause reputational harm to us. Also, material changes in regulations applicable to us or to the markets in which we operate could adversely affect our business. See Note 22 “Commitments, contingencies and guarantees” in our consolidated financial statements included in this annual report for further information regarding the significant investigations, lawsuits and other legal proceedings that we are currently facing.

We face significant legal risks in our businesses. These risks include liability under securities or other laws in connection with securities underwriting and offering transactions, liability arising from the purchase or sale of any securities or other financial products, disputes over the terms and conditions of complex trading arrangements or the validity of contracts for our transactions, disputes with our business alliance partners and legal claims concerning our other businesses. When we face the substantial legal liability, we seek advice from experts and third-parties, develop appropriate policies, and address the cases accordingly. However, depending on the disputes, our reputation, financial condition and results of operations could be adversely affected.

(1) Legal liability related to our business may occur and could adversely affect our business, financial condition and results of operations

During a prolonged market downturn or upon the occurrence of an event that adversely affects one of the markets in which we operate, we may be exposed to an increase in claims or significant litigations against us. The cost of defending such claims or litigations may be substantial and our involvement in litigation may damage our reputation. For example, during the year ended March 31, 2022, approximately ¥62.0 billion related to legacy transactions in the U.S. from before the global financial crisis (2007 – 2008) was recognized including legal expenses as well as certain transactions intended to mitigate future losses. In addition, even legal transactions might be subject to adverse public reaction according to the particular details of such transactions.


29


Table of Contents

These risks may be difficult to assess or quantify and their existence and magnitude may remain unknown for substantial periods of time.

(2) Extensive regulation of our businesses limits our activities and may subject us to significant penalties and losses

The financial services industry is subject to extensive regulation. We are subject to increasing regulation by governmental and self-regulatory organizations in Japan and in virtually all other jurisdictions in which we operate, and such governmental and regulatory scrutiny may increase as our operations expand or as laws change. In addition, while regulatory complexities increase, possibilities of extra-territorial application of a regulation in one jurisdiction to business activities outside of such jurisdiction may also increase. These regulations are broadly designed to ensure the stability of financial systems and the integrity of the financial markets and financial institutions, and to protect clients and other third-parties who deal with us. They may also limit our activities and/or affect our profitability, through net capital, client protection and market conduct requirements. In addition, on top of traditional finance-related legislation, the scope of laws and regulations applying to, and/or impacting on, our operations may become wider depending on the situation of the wider international political and economic environment or policy approaches taken by governmental authorities in respect of regulatory application or law enforcement. In particular, the number of investigations and proceedings against the financial services industry by governmental and self-regulatory organizations has increased substantially and the consequences of such investigations and proceedings have become more severe in recent years, and we are subject to the risk of such investigations and proceedings. Although we take measures such as timely monitoring and establishing internal governance procedures in order to comply with law and regulations, we may not always be able to prevent such violations, and we could be fined, prohibited from engaging in some of our business activities, ordered to improve our internal governance procedures or be subject to revocation of our license to conduct business. Our reputation could also suffer from the adverse publicity that any administrative or judicial sanction against us may create, which may negatively affect our business opportunities and ability to secure human resources. As a result of any such sanction, we may lose business opportunities for a period of time, even after the sanction is lifted, if and to the extent that our clients, especially public institutions, decide not to engage us for their financial transactions. In addition, certain market participants may refrain from investing in or entering into transactions with us if we engage in business activities in regions subject to international sanctions, even if our activities do not constitute violations of sanctions laws and regulations.

(3) Tightening of regulations applicable to the financial system and financial industry could adversely affect our business, financial condition and results of operations

If regulations that apply to our businesses are introduced, modified or removed, we could be adversely affected directly or through resulting changes in market conditions. The impact of such developments could make it economically unreasonable for us to continue to conduct all or certain of our businesses, or could cause us to incur significant costs to adjust to such changes.

New regulations or revisions to existing regulations relating to accounting standards, regulatory capital adequacy ratios, liquidity ratios and leverage ratios applicable to us could also have a material adverse effect on our business, financial condition and results of operations. Such new regulations or revisions to existing regulations include the so-called Basel III package formulated by the Basel Committee on Banking Supervision (“Basel Committee”) and the finalized Basel III reforms published in December 2017, and also finalized market risk capital framework published in January 2019. NHI is subject to the above revised regulatory capital adequacy ratios, liquidity ratios and leverage ratios since March 2025.

Furthermore, in December 2015, the FSA identified NHI as one of the domestic systemically important banks (“D-SIBs”) and imposed a surcharge of 0.5% on our required capital ratio after March 2016 with 3-year transitional arrangement. In addition, FSB published the final standard requiring global systemically important banks (“G-SIBs”) to maintain a certain level of total loss-absorbing capacity (“TLAC”) upon their failure in November 2015. Under the FSA’s policy implementing the TLAC framework in Japan as updated in April 2018, the TLAC requirements in Japan apply not only to Japanese G-SIBs but also to Japanese D-SIBs that are deemed (i) of particular need for a cross-border resolution arrangement and (ii) of particular systemic significance to Japanese financial system if they fail. Based on the revised policy, in March 2019, the FSA published the notices and guidelines of TLAC regulations in Japan. According to these notices and guidelines, NHI is subject to the TLAC requirements in Japan from March 31, 2021, although NHI is not identified as a G-SIB as of the date of this annual report. These changes in regulations may increase our funding costs or require us to liquidate financial instruments and other assets, raise additional capital or otherwise restrict our business activities in a manner that could adversely affect our operating or financing activities or the interests of our shareholders.


30


Table of Contents

(4) Deferred tax assets may be impacted due to a change in business condition or in laws and regulations, resulting in an adverse effect on our operating results and financial condition

Under U.S. GAAP, we recognize deferred tax assets in our consolidated balance sheets as a possible benefit of tax relief in the future if certain criteria are met. If we experience or forecast future operating losses, if tax laws or enacted tax rates in the relevant tax jurisdictions in which we operate change, or if there is a change in U.S. GAAP in the future, we may be required to reduce the deferred tax assets recognized in our consolidated balance sheets which may adversely affect our financial condition and results of operations. See Note 17 “Income taxes” in our consolidated financial statements included in this annual report for further information regarding the deferred tax assets that we currently recognize.

(5) Defects in our anti-money laundering and counter-terrorism financing measures could have serious consequences, such as administrative penalties or punitive fines

In recent years, financial crimes have become more complex, sophisticated, and diverse. As the world faces growing threats of military disputes, terrorism, and cyberattacks, it is highly important to counter the financing of crimes and terrorism. Financial institutions around the world are expected to take strong anti-money laundering (AML) and countering the financing of terrorism (CFT) measures. Despite our efforts to improve our anti-money laundering and counter-terrorism financing measures, which we have implemented consistently across the Nomura Group in accordance with the recommendations provided by the Financial Action Task Force (FATF) and the FSA’s “Guidelines on Anti-Money Laundering and Terrorist Financing”, there remains a risk that such measures will not be fully effective in preventing or detecting all violations in a timely manner. As a consequence, we could be subject to administrative penalties or punitive fines, which may adversely affect our financial condition and results of operations. See also “—Risks Relating to Legal, Compliance and Other Operational Issues—19. Our business is subject to substantial legal and regulatory risks—(2) Extensive regulation of our businesses limits our activities and may subject us to significant penalties and losses” for further information regarding regulatory actions and other legal proceedings as well as consequences thereof.

20. Unauthorized disclosure or misuse of personal information held by us may adversely affect our business

We keep and manage personal information obtained from clients in connection with our business. In recent years, there have been many reported cases of personal information and records in the possession of corporations and institutions being improperly accessed, disclosed or misused. There is also a risk of unauthorized acquisition of client information and misuse of customer information by former employees.

Although we exercise care to protect the confidentiality of personal information and have in place policies and procedures designed to safeguard such information and ensure that it is used in compliance with applicable laws, rules and regulations, were any unauthorized disclosure or misuse of personal information to occur, our business could be adversely affected. For example, we could be subject to government actions such as administrative actions or penalties in case there is any violation of applicable personal data protection laws, rules and regulations or be subject to complaints and lawsuits for damages from clients if they are adversely affected due to the unauthorized disclosure or misuse of their personal information (including leakage of such information by an external service provider). In addition, we could incur additional costs associated with changing our security systems, either voluntarily or in response to administrative guidance or other regulatory initiatives. Moreover, restrictions on our ability to use personal information collected from clients may adversely affect our existing businesses or our ability to develop new ones. Furthermore, any damage to our reputation caused by such unauthorized disclosure or misuse could lead to a decline in new clients and/or a loss of existing clients, as well as to increased costs and expenses incurred for public relations campaigns designed to prevent or mitigate damage to our corporate or brand image or reputation.

21. System failure, information leakage and cost of maintaining sufficient cybersecurity could adversely affect our business, financial condition and results of operations

Our businesses rely on secure processing, storage, transmission and reception of personal, confidential and proprietary information on our systems. We have been in the past and may again become the target of attempted unauthorized access, computer viruses or malware, and other cyberattacks designed to access and obtain information on our systems or to disrupt and cause other damage to our services. In recent years, many of our employees increasingly work remotely using networking or other technologies, and these technologies have become even more critical to our business. The implementation of remote work arrangements may also increase the possibility that we will be subject to cyberattacks and other information security breaches. In addition, Nomura is engaged in the cryptocurrency business, and if the cryptocurrency wallets used in that business become targets of cyberattacks or other information security breaches, there is a possibility of unauthorized outflow or loss of cryptocurrencies. We also face emerging risks from increased use of AI (including generative AI), which may introduce new data leakage, model manipulation, fraud/social engineering and third-party/vendor risks if not governed and controlled appropriately. Although these threats may originate from human error or technological failure, they may also originate from the malice or fraud of internal parties, such as employees, or third-parties, including foreign non-state actors and extremist parties. Additionally, we could also be adversely impacted if any of the third-party vendors, exchanges, clearing houses or other financial institutions to whom we are interconnected are subject to cyberattacks or other informational security breaches. Such events could cause interruptions to our systems, reputational damage, client dissatisfaction, legal liability, enforcement actions or additional costs, any and all of which could adversely affect our financial condition and operations.


31


Table of Contents

While we continue to devote significant resources to monitor and update our systems and implement information security measures to protect our systems, there can be no assurance that any controls and procedures we have in place will be sufficient to protect us from future security breaches. As cyber threats are continually evolving, our controls and procedures may become inadequate and we may be required to devote additional resources to modify or enhance our systems in the future.

22. Our business may be adversely affected if we are unable to hire, retain and develop qualified personnel

Under the philosophy that our people are our greatest assets, we view recruitment, talent development, performance appraisal, and mobility and advancement strategies as one human-resources management cycle and pursue various talent-management initiatives comprehensively. Under these initiatives, we employ a large workforce globally, and face various human-resources and workplace-related risks, such as discrimination, harassment, and inconsistencies with local laws and norms. Moreover, we face intense competition for personnel due to factors such as compensation, working environment, training opportunities, employee benefits, and our reputation as an employer, and any failure to hire, retain, and develop qualified personnel as anticipated may materially and adversely affect our business, financial condition and results of operations. Furthermore, spending to secure personnel may adversely affect our profitability. In addition, developing our human resources and fostering a uniform corporate culture requires sustained and thorough efforts, and may take longer than anticipated.


32


Table of Contents

4. Operating, Financial and Cash Flow Analyses by Management

(1) Operating Results.

Please refer to Item 1 “Information on the Company and Its Subsidiaries and Affiliates—1. Selected Financial Data” and Item 5 “Financial Information—Consolidates Balance Sheets, Consolidated Statements of Income, Consolidated Statements of Comprehensive Income, Consolidated Statements of Changes in Equity, Consolidated Statements of Cash Flows” for Operating Results below. The following information also contains certain forward-looking statements that involve risks, uncertainties and assumptions. Nomura’s actual financial results may differ materially from the forward-looking statements contained herein.

Executive Summary

1. Overall results of business

We recognized net revenue of ¥2,167.7 billion during the year ended March 31, 2026, an increase of 14.5% from the previous year. Non-interest expenses increased by 14.6% to ¥1,627.9 billion, income before income taxes was ¥539.8 billion, and net income attributable to the shareholders of NHI was ¥362.1 billion. Return on equity was 10.1%. Earnings per Share* for the year ended March 31, 2026 was ¥118.99, an increase from ¥111.03 for the year ended March 31, 2025. We have decided to pay a dividend of ¥24 per share to shareholders of record as of March 31, 2026. As a result, the total annual dividend will be ¥51 per share for the year ended March 31, 2026.

* Diluted net income attributable to NHI shareholders per share.

2. Management’s assessment of key initiatives and achievements during the fiscal year

During the year ended March 31, 2026, our initiatives to accelerate our recurring revenue-based business model, expand our stable earnings base, and deepen our global strategy made steady progress. These efforts have steadily translated into tangible results, further strengthening our profitability and business foundation. We also made solid progress toward realizing our management vision for 2030, “Reaching for Sustainable Growth,” and net income attributable to the shareholders of NHI for the year reached a record high.

Wealth Management Division had its best performance since the division was established in the year ended March 31, 2002. Recurring revenue was at an all-time high and recurring revenue assets saw continued net inflows as we made further progress in our full-service asset management business. The recurring revenue cost coverage ratio rose to 72 percent, reflecting higher revenues and disciplined cost controls.

In Investment Management Division, assets under management climbed to ¥136.9 trillion and business revenue increased significantly, thanks to market factors, continued net inflows, and contributions from the overseas businesses we recently acquired.

In Wholesale Division, income before income taxes reached an all-time high since the division was established in April 2010, underpinned by growth in Global Markets and Investment Banking revenues.

In the Banking Division, loans outstanding and investment trust balances grew, resulting in higher revenues than last year.

3. Capital policy and shareholder returns

We plan to maintain appropriate capital ratios and aim for sustainable growth through optimal capital allocation. As preparatory steps to achieve our management vision, while controlling cost levels, we are investing for growth to realize our management strategy of expanding the scope of our business from public into private markets, in order to balance investment and shareholder returns, and maximize shareholder value by improving productivity and expanding revenue sources.

We strive to pay dividends using a consolidated payout ratio of at least 40% of each semi-annual consolidated earnings as a key indicator. Additionally, we aim for a total payout ratio, which includes dividends and share buybacks, of at least 50%. The total amount of shareholder returns for each fiscal year is determined by comprehensively taking into account trends in the regulatory environment in Japan and overseas, including the strengthening of Basel regulations, as well as the consolidated results of our business divisions.

For further details of our dividend policy, refer to Item 4. “Company Information—3. Dividend Policy.


33


Table of Contents

4. Summary by Segment

In our Wealth Management Division, net revenue for the year ended March 31, 2026 increased by 12.5% from the previous year to ¥487.9 billion. Non-interest expenses increased by 6.2% to ¥283.9 billion. As a result, income before income taxes increased by 22.8% to ¥204.0 billion. We have worked to strengthen our wealth management services by enhancing our comprehensive service offerings in line with client needs to help our clients achieve the future they envision. Amid favorable market conditions and reflecting our keen understanding of client needs, there was an increase in flow revenue, mainly due to an increase in the sales of stocks and investment trusts, particularly through face-to-face channels. Additionally, there was also an increase in recurring revenue due to the expansion of Wealth Management client assets through our initiatives to provide consulting services on the entire asset bases of our clients, which we have been working on continuously.

In addition, we aim to build a sustainable client base and expand our business over the medium to long term by establishing contact points through workplace financial services, and we have been able to successfully increase the number of clients we provide services to, including the working generation. Going forward, we will provide a wide range of wealth management services, including face-to-face consulting, non-face-to-face services using digital tools, and workplace services that address asset building needs.

In our Investment Management Division, net revenue for the year ended March 31, 2026 increased by 34.3% from the previous year to ¥258.5 billion. Non-interest expenses increased by 65.5% to ¥170.2 billion. As a result, income before income taxes decreased by 1.4% to ¥88.3 billion. The Investment Management Division has aimed for business revenue growth by increasing assets under management and by providing higher value-added asset management services. Although the Japanese equity market experienced periods of adjustment at both the beginning and the end of the fiscal year, it generally remained above the level of the previous fiscal year overall. In addition, following the completion in December 2025 of the Macquarie Acquisition, assets under management as of the end of the period rose to a record high of ¥136.9 trillion. The average balance of assets under management during the fiscal year also increased from the previous fiscal year, contributing to the growth of business revenue. While fund outflows were recorded in the acquired business, net inflows for the fiscal year totaled ¥0.4 trillion, and positive net inflows were maintained on an overall basis. Supported by the expansion of assets under management, the asset management business delivered revenue growth, while the aircraft leasing business also contributed to higher earnings through the execution of high-quality deals, resulting in an increase in sales volume. As a result, business revenue, a stable source of revenue, reached a record high. In particular, alternative assets under management as of the end of the year ended March 31, 2026 increased from the end of the previous fiscal year to ¥3.6 trillion, supported by solid fund inflows and investment gains. In addition, the “Nomu Wrap Fund”, which enables investors to build well-balanced portfolios tailored to their investment styles, continued to attract stable inflows, with total net assets surpassing ¥1.5 trillion.

In our Wholesale Division, net revenue for the year ended March 31, 2026 increased by 9.9% from the previous year to ¥1,162.2 billion. Non-interest expenses increased by 7.9% to ¥961.7 billion. As a result, income before income taxes increased by 20.6% to ¥200.6 billion. In Global Markets, we continued to provide service and liquidity to our clients while maintaining tight risk control, as clients looked to rebalance and hedge their portfolios amid uncertain markets driven by macro-economic shifts, central banks’ policy actions and geopolitical developments. We delivered steady performance by monetizing client flows and market opportunities led by Equity Products, Securitized Products and International Wealth Management. In Investment Banking, though there were differences among regions, client activity was at a high level and we strived to meet our clients’ diversified needs through our services and solutions which led to an increase in the number of deals. Strong performances from Advisory and Equity Solutions in Japan, along with Advisory and Solutions including Equity Solutions and portions of lending in international regions resulted in an increase in revenue.

In our Banking Division, net revenue for the year ended March 31, 2026 increased by 14.3% from the previous year to ¥53.9 billion, but non-interest expenses increased by 29.5% to ¥39.9 billion. As a result, income before income taxes decreased by 14.3% to ¥14.0 billion. In addition to strengthened collaboration across divisions, the effects of business development and marketing activities have begun to materialize, and the KPIs we track, namely loans outstanding at The Nomura Trust and Banking Co., Ltd., investment trust balance at The Nomura Trust and Banking Co., Ltd., and assets under administration at Nomura Bank (Luxembourg) S.A., showed steady growth over the year. As a result, Banking Division revenues, which we position as a stable source of revenue, increased from the previous fiscal year. While expenses increased due to a core banking system renewal at The Nomura Trust and Banking Co., Ltd. and related initiatives, progress has been made in building the foundation necessary to enhance future product and service offerings.


34


Table of Contents

Progress on Key Performance Indicators (KPIs)

《Management Indicators》

Return on Equity / Income before income taxes

We have set quantitative management targets for the fiscal year 2030, aiming to achieve an ROE of 8-10%+ and an income before income taxes of over ¥500 billion, as our most important management performance indicators, and have made steady progress in our initiatives. In May 2026, we updated these quantitative management targets for the fiscal year 2030 and set a goal to achieve an ROE of 10–12%+ and an income before income taxes of over ¥750 billion.

After the introduction of the Corporate Governance Code in Japan, the importance of awareness of capital costs has increased among management of Japanese companies. In addition, under the framework of global financial regulations, more effective use of capital is required. As a result, we believe that the optimal allocation of financial resources will become even more important for our Company in the future. Accordingly, beginning in the year ended March 31, 2021, we adopted ROE as a key management indicator, which management uses to track the progress of our sustainable business transformation, along with the revision of “Fundamental Management Policy” based on the approval at the Board of Directors meeting held in May 2020.

ROE is defined and calculated as net income attributable to NHI shareholders divided by average of the total shareholders’ equity at the beginning and end of the period. We believe that disclosure of ROE is useful to investors in that it helps them to assess business conditions and our effective use of capital to enhance corporate value.

We have set ROE target of 10-12%+ for the year ending March 31, 2031, reflecting the cost of capital for our Company. However, ROE may be of limited use in that it does not necessarily reflect financial soundness. In order to avoid the excessive pursuit of capital efficiency with the aim of improving ROE at the expense of financial soundness, we attach importance to the creation of corporate value, giving due consideration to financial soundness, and thereby improving ROE. ROE for the year ended March 31, 2026 increased to 10.1% from 10.0% for the prior fiscal year.

In addition, in order to achieve sustainable growth, we have set a quantitative management target for the year ending March 31, 2031 to achieve an income before income taxes of over ¥750 billion, so that it helps them to assess business conditions more concretely and enhance corporate value. For the year ended March 31, 2026, the income before income taxes was ¥539.8 billion.

Common equity Tier1 capital ratio

There are multiple global financial regulations that we must comply with, including capital regulations established by Basel Committee on Banking Supervision as interpreted and implemented by the FSA which have a direct impact on the way we conduct business. For this reason, we have set a target of maintaining a common equity Tier 1 capital ratio of at least 11%, so that we will take into consideration the financial soundness including certain buffer against severe market stress. In addition, we seek to achieve an optimal allocation of capital by balancing growth investments and shareholder returns, and have set a target range of a common equity Tier 1 capital ratio of 11% to 14%.

Our common equity Tier 1 capital ratio decreased to 12.86% as of March 31, 2026, from 14.52% as of March 31, 2025. For further details, on the key capital requirements we must follow, see Item 2 “Operating and Financial Review—4. Operating, Financial and Cash Flow Analyses by Management—(5) Liquidity and Capital Resources—Consolidated Regulatory Capital Requirements.”


35


Table of Contents

《Indicators by Business Segment》

In addition to the Group KPIs, our management also uses certain divisional specific KPIs to monitor and assess performance of the divisions.

Wealth Management

We have adopted the following key indicators in the Wealth Management Division to quantify the outcomes of our efforts and monitor our business: Recurring revenue assets; Net inflows of recurring revenue assets; Flow business clients; and Workplace Services; so that our management will be able to monitor the progress of our businesses and target sustainable and further business growth. We believe that disclosure of those indicators is useful to investors in that it helps them to assess the progress of the division’s client-facing activities as well as digest and understand our growth potential.


     Trillions of yen  
     March 31, 2024      March 31, 2025      % Change from
previous year
    March 31, 2026      % Change from
previous year
 

Recurring revenue assets

   ¥ 23.0      ¥ 23.5        2.3   ¥ 27.9        18.8


     Billions of yen  
     Year ended March 31  
     2024      2025      % Change from
previous year
    2026      % Change from
previous year
 

Net inflows of recurring revenue assets

   ¥ 702.0      ¥ 1,374.0        95.7   ¥ 1,495.1        8.8


     Thousands  
     Year ended March 31  
     2024      2025      % Change from
previous year
    2026      % Change from
previous year
 

Flow business clients

     1,692        1,644        (2.9 )%      1,741        5.9

Workplace Services

     3,627        3,883        7.0     4,142        6.7


Recurring Revenue Assets

Recurring revenue assets are defined by adding related loans to the total amount of assets, such as investment trusts, discretionary investments, insurance, and level fee assets, for which management fees and other recurring fees are charged. The amount of related loans totaled approximately ¥1,114.7 billion as reported within Loans receivable in the consolidated balance sheets as of March 31, 2026. Total recurring revenue assets as of March 31, 2026, were ¥27.9 trillion, an increase of ¥4.4 trillion, or 18.8%, from ¥23.5 trillion as of March 31, 2025, due to initiatives to increase recurring revenue assets and market factors.

Net Inflows of Recurring Revenue Assets

Net inflows of recurring revenue assets are defined and calculated by subtracting the amount of sell-offs and outflows from the amount of purchase and inflows of recurring revenue assets, and is an index used to measure the expansion of recurring revenue assets excluding changes in market value. As a result of our success in establishing market presence in the Wealth Management business, the total net inflows of recurring revenue assets during the year ended March 31, 2026, were ¥1,495.1 billion, exceeding the ¥1,374.0 billion recorded for the year ended March 31, 2025, by 8.8%.

Flow Business Clients

The number of flow business clients is defined as the total number of clients to whom we provide flow business, businesses that generate flow revenues, within the fiscal year and is a measure of the growth in the client base that is critical to realizing the growth in flow revenue. The number of flow business clients as of March 31, 2026, was approximately 1,741 thousand, which is 5.9% higher than the number as of March 31, 2025, which was 1,644 thousand. This increase resulted from an acceleration in accumulation toward the end of the fiscal year against the background of an active market environment.

Workplace Services

Workplace Services are defined as the sum of the number of workplace financial services provided, such as the number of members of employee stock ownership plans, accounts derived from the employee stock ownership (excluding current members) and corporate defined contribution (DC) pension plan subscribers, and is an index used to measure the expansion of the client base through workplace financial businesses. As of March 31, 2026, the number of workplace services provided stood at 4,142 thousand. We achieved an expansion of 259 thousand, 6.7% increase from that of March 31, 2025, which was 3,883 thousand, mainly in terms of the increase in members of employee stock ownership plans, and have expanded our client base which will lead to sustainable growth.


36


Table of Contents

Investment Management

We have set the balance of assets under management and net inflows as key performance indicators for the Investment Management Division. The businesses in the Investment Management Division generally earn management or similar fees based on the amount of assets under management, meaning that revenue trends for these businesses tend to follow trends in the amount of assets under management, and our management considers this metric to be effective in monitoring the progress of these businesses. We also believe that it is an important indicator of how well investment products are received by investors. We believe that net inflows are an effective metric to monitor the progress of the division’s asset management businesses, excluding market factors from fluctuations in the balance of assets under management. It is an important indicator for ascertaining the effectiveness of the division’s measures to expand assets under management and thereby achieve its profit expansion target.


     Billions of yen  
     Year ended March 31  
     2024      2025      % Change from
previous year
    2026      % Change from
previous year
 

Net inflow

   ¥ 3,760      ¥ 2,648        (29.5 )%    ¥ 443        (83.3 )% 


     Trillions of yen  
     March 31, 2024      March 31, 2025      % Change from
previous year
    March 31, 2026      % Change from
previous year
 

The balance of assets under management

   ¥ 89.0      ¥ 89.3        0.4   ¥ 136.9        53.3


Net inflow

Net inflows are calculated by subtracting cash outflows from cash inflows. For these purposes, cash outflows do not include outflows from distributions. During the year ended March 31, 2026, Net inflows reached ¥0.4 trillion. In the investment trust business, there were inflows into Money Reserve Funds and other money market funds, alternative investments and balanced funds. In the investment advisory and international businesses, there were outflows mainly from active mutual funds in the U.S. and European public asset management business of Macquarie Group Limited, which was acquired in December 2025, reflecting industry trends in U.S.

The balance of assets under management

The balance of assets under management is calculated by deducting overlapping assets within the Investment Management division from the simple aggregate (gross) of assets under management of asset management companies within Investment Management division. Assets under management as of March 31, 2026, reached a record high of ¥136.9 trillion, reflecting both the Japanese equity market remaining above the level of the previous fiscal year and the addition of assets under management from the acquired business.

Wholesale

We have adopted a cost-to-income ratio and a revenue to modified RWA ratio as additional key performance indicators in our Wholesale Division. We believe that disclosure of these indicators would be useful for investors to assess progress in terms of cost and resource efficiency. Additionally, we use these indicators to evaluate our business based on progress on cost savings initiatives and return on resources.


     Year ended March 31  
       2024         2025       % Change from
previous year
      2026       % Change from
previous year
 

Cost-to-income ratio

     94     84     (10 )%      83     (1 )% 

Revenue/modified RWA

     6.8     7.6     0.8     7.4     (0.2 )% 


37


Table of Contents

Cost-to-income ratio

The cost-to-income ratio for the Wholesale Division is calculated by dividing non-interest expenses for the division for a given reporting period by net revenue generated by the division for the same period, calculated consistently, in each case, with our segment presentation for the division. It is monitored at a divisional level to track operating margins for the business. The ratio improved during the year ended March 31, 2026 compared to the previous year as Wholesale costs increased 8% while revenues grew 10%. Wholesale Revenues reached an all-time high since establishment of the division in April 2010, with record years in both Global Markets and Investment Banking (since relevant comparisons possible from the year ended March 31, 2017). Cost increase was primarily driven by increase in bonus provisions linked to performance and higher trading volume.

The ratio improved during the year ended March 31, 2025 compared to the previous year as Wholesale costs increased 10% while revenues grew 22%. Revenues increased on a year-over-year basis across Global Markets and Investment Banking. Global Markets uptick was driven by strong performance across Equity Products, Execution Services, Securitized Products, and International Wealth Management business, whereas Investment Banking witnessed significant growth in ECM, M&A and Solutions businesses. Cost increase was primarily driven by increased revenue-linked trading activity and higher performance related costs.

Revenue to modified Risk Weighted Asset (RWA) ratio

The revenue to modified RWA ratio for the Wholesale division is calculated by dividing net revenue generated by our Wholesale Division for a given reporting period (in the case of net revenue for the Wholesale Division for periods shorter than a full fiscal year, on an annualized basis) by the average balance of modified RWA used by the Wholesale Division for the same period. The revenue to modified RWA ratio is monitored to track our revenue earning capacity against risk resources deployed. Modified RWA is the total of (i) average daily risk-weighted assets as calculated and presented under Basel regulations as interpreted and implemented by the FSA and (ii) an adjustment equal to the regulatory adjustment to risk-based capital calculated and presented under Basel regulations as interpreted and implemented by the FSA divided by our internal capital ratio target of 12.5% (daily average for the accounting period), which we use to estimate the amount of deductions to RWA generated by the division. The revenue to modified RWA as we calculate and present it may differ from similarly titled measures presented by our competitors due to the approach and methodologies used for calculation. See Item 2 “Operating and Financial Review—4. Operating, Financial and Cash Flow Analyses by Management—(5) Liquidity and Capital Resources—Consolidated Regulatory Capital Requirements.” for further details on the applicable methodologies. The conversion of Wholesale RWA to modified RWA is based on adjustments reflecting our internal minimum capital ratio target. Moreover, the usefulness of this ratio may be limited in that the adjustment applied to RWA, which is intended to capture the appropriate amount of RWA to attribute to our businesses (as opposed to RWA as calculated for regulatory capital purposes), is an estimate incorporating our internal risk tolerance; however, this adjustment may not appropriately reflect the actual regulatory capital impact of the charged assets that are used by our business. Revenue to modified RWA decreased marginally for the year ended March 31, 2026 compared to the previous year, as the increase in RWA post Basel III finalization slightly exceeded the growth in Wholesale revenue. Both Global Markets and Investment Banking registered record-high revenues for the year ended March 31, 2026 (since relevant comparisons possible from FY2016/17). Revenue to modified RWA increased for the year ended March 31, 2025 compared to the previous year, as the growth in Wholesale revenue offset the impact of increase in RWA. Revenue increased across both Global Markets and Investment Banking, driven by strong performance in Equity Products, Execution Services, Securitized Products and International Wealth Management, as well as growth in ECM, M&A and Solutions businesses.


38


Table of Contents

Banking

The Banking Division has designated the following key performance indicators (KPIs): (i) Loan Outstanding (The Nomura Trust and Banking Co., Ltd.(“NTB”)), (ii) Investment Trust balance (NTB), and (iii) Assets under administration (Nomura Bank (Luxembourg) S.A. (“NBL”)). Given that this division comprises the banking business, which generates income from loans and securities investments funded primarily by deposits, and the trust and agency business, which earns fee income by administering clients’ assets, including investment trusts, management believes that these indicators are effective for monitoring the progress of the division’s business and also consider them useful for investors in assessing its progress.


     Trillions of yen  
     March 31, 2025      March 31, 2026      % Change from
previous year
 

Loan Outstanding (NTB)

   ¥ 1.04      ¥ 1.18        12.7


     Trillions of yen  
     March 31, 2025      March 31, 2026      % Change from
previous year
 

Investment Trust balance (NTB)

   ¥ 40.5      ¥ 42.9        5.8


     Billions of dollars  
     March 31, 2025      March 31, 2026      % Change from
previous year
 

Assets under administration (NBL)

   $ 56.6      $ 64.6        14.1


Loan Outstanding (NTB)

Loan Outstanding (NTB) represents the total outstanding balance of loans extended by NTB to individual and corporate customers. NTB’s primary loan products are securities-backed loans, with flagship offerings comprising PB (Private Banking) Loans—provided in person to high-net-worth clients—and Nomura Web Loan, which enables borrowers to complete lending and repayment entirely via an online banking service.

This figure corresponds to the figure for “Loans” disclosed on the asset side of NTB’s standalone balance sheet. Such figure is disclosed on the basis of regulatory standards based on accounting principles generally accepted in Japan and does not necessarily correspond to “Loans receivable” as disclosed by NHI on its consolidated balance sheet, which is prepared on the basis of U.S. GAAP.

Driven by new customer acquisition and marketing initiatives, Loan Outstanding (NTB) was ¥1,177 billion as of March 31, 2026, an increase of 12.7% from ¥1,044 billion as of March 31, 2025.

Investment Trust balance (NTB)

Investment Trust balance (NTB) represents the total portion of assets under custody represented by investment trusts for which NTB serves as trustee. Investment Trust balance (NTB) fluctuates based on net inflows/outflows (the difference between subscriptions and redemptions) as well as changes in asset prices.

This KPI is calculated as the total net asset value of each fund as of its respective most recent fiscal period end. Such fiscal period end may not align with the date shown, and, for funds with only annual or semi-annual accounting, such period-end may not have occurred, and the amount may not have been updated, during the relevant quarter.

The amount shown corresponds to the figure for “Investment Trusts” disclosed on the liability side of NTB’s standalone Statement of Trust Account. Such figure, which is disclosed on the basis of Japanese regulatory standards, is not included in NHI’s consolidated balance sheet.

As of March 31, 2026, the Investment Trust balance (NTB) was ¥42.9 trillion, driven by new inflows of funds and favorable market conditions, representing a 5.8% increase from ¥40.5 trillion as of March 31, 2025.


39


Table of Contents

Assets under administration (NBL)

Assets under administration (NBL) represents the aggregate balance of Cayman Islands- and Luxembourg-domiciled investment trusts and other funds for which NBL is responsible for calculating the net asset value, accounting treatment, order processing, nominee management, and preparing various reports. Assets under administration (NBL) fluctuates based on net inflows/outflows (the difference between subscriptions and redemptions) as well as changes in asset prices.

As of March 31, 2026, Assets under administration (NBL) was $64.6 billion, an increase of 14.1% from $56.6 billion as of March 31, 2025. Continued inflows into both public and private-placement funds investing in private assets have driven the increase in Assets under administration (NBL).


40


Table of Contents

Results of Operations

Overview

The following table provides selected consolidated statements of income information for the years ended March 31, 2024, 2025 and 2026.


     Millions of yen, except percentages  
     Year ended March 31  
     2024     2025     % Change from
previous year
    2026     % Change from
previous year
 

Non-interest revenues:


Commissions

   ¥ 364,095     ¥ 407,011       11.8   ¥ 455,289       11.9

Fees from investment banking

     173,265       212,234       22.5       200,548       (5.5

Asset management and portfolio service fees

     310,154       378,196       21.9       468,600       23.9  

Net gain on trading

     491,611       580,099       18.0       696,894       20.1  

Gain on private equity and debt investments

     11,877       7,634       (35.7     12,604       65.1  

Gain (loss) on investments in equity securities

     9,612       444       (95.4     13,066       —   

Other

     175,824       223,264       27.0       241,845       8.3  


Total Non-interest revenues

     1,536,438       1,808,882       17.7       2,088,846       15.5  

Net interest revenue

     25,562       83,603       227.1       78,867       (5.7


Net revenue

     1,562,000       1,892,485       21.2       2,167,713       14.5  

Non-interest expenses

     1,288,150       1,420,521       10.3       1,627,892       14.6  


Income before income taxes

     273,850       471,964       72.3       539,821       14.4  

Income tax expense

     96,630       124,709       29.1       165,439       32.7  


Net income

   ¥ 177,220     ¥ 347,255       95.9   ¥ 374,382       7.8

Less: Net income attributable to noncontrolling interests

     11,357       6,519       (42.6     12,253       88.0  


Net income attributable to NHI shareholders

   ¥ 165,863     ¥ 340,736       105.4   ¥ 362,129       6.3


Return on equity

     5.1     10.0       10.1  

Net revenue increased from the year ended March 31, 2025 to the year ended March 31, 2026. This increase was primarily driven by Asset management and portfolio service fees from our Wealth Management Division and Investment Management Division and Net gain on trading from our Wholesale Division. The increase in Commissions was primarily due to an increase in commissions received from brokerage for equity and equity-related products. Fees from investment banking decreased during the year ended March 31, 2026 primarily due to a decrease in revenue from underwriting and sales commission. Asset management and portfolio service fees increased as the average of assets under management increased during the year ended March 31, 2026. Net gain on trading increased during the year ended March 31, 2026, primarily due to an increase in revenue from the Fixed Income and Equities businesses. Net gain on trading also included total gains of ¥5.0 billion attributable to changes in Nomura’s own creditworthiness with respect to derivative liabilities primarily due to a widening of Nomura’s credit spread. Gain (loss) on investments in equity securities increased during the year ended March 31, 2026, primarily due to a result of market appreciation of the underlying investment during the year ended March 31, 2026. Gain (loss) on investments in equity securities includes both realized and unrealized gains and losses on investments in equity securities held for operating purposes which are our investments in unaffiliated companies, which we hold on a long-term basis in order to promote existing and potential business relationships. Other increased during the year ended March 31, 2026, primarily due to a gain on sale from the transfer of land and buildings located in Takanawa 2-chome, Minato-ku, Tokyo.

Net revenue increased from the year ended March 31, 2024 to the year ended March 31, 2025. This increase was primarily driven by Asset management and portfolio service fees from our Wealth Management Division and Investment Management Division and Net gain on trading from our Wholesale Division. The increase in Commissions was primarily due to an increase in commissions received from distribution of investment trusts. Fees from investment banking increased during the year ended March 31, 2025 primarily due to an increase in revenue from underwriting and sales commission and M&A advisory fee. Asset management and portfolio service fees increased as the average of assets under management increased during the year ended March 31, 2025. Net gain on trading increased during the year ended March 31, 2025, primarily due to an increase in revenue from the Fixed Income and Equities businesses. Net gain on trading also included total gains of ¥2.3 billion attributable to changes in Nomura’s own creditworthiness with respect to derivative liabilities primarily due to a widening of Nomura’s credit spread. Gain (loss) on investments in equity securities decreased during the year ended March 31, 2025, primarily due to a result of market correction of the underlying investment during the year ended March 31, 2025. Gain (loss) on investments in equity securities includes both realized and unrealized gains and losses on investments in equity securities held for operating purposes which are our investments in unaffiliated companies, which we hold on a long-term basis in order to promote existing and potential business relationships. Other increased during the year ended March 31, 2025, primarily due to foreign exchange gains.


41


Table of Contents

Net interest revenue fluctuates by the balance and structure of total assets and liabilities, which includes trading assets and financing and lending transactions, and term structure and volatility of interest rates. Net interest revenue is an integral component of trading activity. In assessing the profitability of our overall business and of our Global Markets business in particular, we view Net interest revenue and Non-interest revenues in aggregate. For the year ended March 31, 2026, interest and dividend revenue, including a dividend from our investment in American Century Investments decreased by 9%, and interest expense decreased by 9% from the year ended March 31, 2025. As a result, Net interest revenue for the year ended March 31, 2026 decreased from the year ended March 31, 2025. For the year ended March 31, 2025, interest and dividend revenue, including a dividend from our investment in American Century Investments increased by 12%, and interest expense increased by 10% from the year ended March 31, 2024. As a result, Net interest revenue for the year ended March 31, 2025 increased from the year ended March 31, 2024.

Non-interest expenses for the year ended March 31, 2026 increased from the year ended March 31, 2025, primarily due to increase in Compensation and benefits.

Non-interest expenses for the year ended March 31, 2025 increased from the year ended March 31, 2024, primarily due to increase in Compensation and benefits.

We are subject to various taxes in Japan and we have applied the Group Tax Sharing system. The Group Tax Sharing system is only available for a national tax. Our domestic effective statutory tax rate was approximately 31% for the year ended March 31, 2024, 2025 and 2026, respectively. Furthermore, as a result of revision to Japanese domestic tax laws on March 31, 2025, Nomura’s effective statutory tax rate will increase from 31% to 31.5% for fiscal years ending on or after April 1, 2026. Our foreign subsidiaries are subject to the income taxes of the jurisdictions in which they operate, which are generally lower than those in Japan. The Company’s effective statutory tax rate in any one year is therefore dependent on our geographic mix of profits and losses and also on the specific tax treatment applicable in each jurisdiction.

Income tax expense for the year ended March 31, 2026, represented an effective tax rate of 30.6%. Nomura adopted ASU 2023-09 “Income Taxes (Topic 740): Improvements to Income Tax Disclosures” prospectively for the year ended March 2026. By the adoption of this ASU, the tax rate reconciliation is presented using the Japanese national statutory tax rate as the starting point for reconciling to the effective tax rate. The significant factors causing the difference between the effective tax rate of 30.6% and the Japanese national statutory tax rate of 25.6% were due to effect of local tax in Japan by 5.4%, the changes in deferred tax valuation allowances in U.S. which decreased the effective tax rate by 8.1%, partially offset by the changes in the increment of non-deductible expenses related to stock-based compensation which increased the effective tax rate by 2.0%, and deferred tax valuation allowance in U.K. which increased the effective tax rate by 1.8% .

Income tax expense for the year ended March 31, 2025, represented an effective tax rate of 26.4%. The significant factors causing the difference between the effective tax rate of 26.4% and the effective statutory tax rate of 31% were the changes in deferred tax valuation allowances which decreased the effective tax rate by 5.3%.

Income tax expense for the year ended March 31, 2024, represented an effective tax rate of 35.3%. The significant factors causing the difference between the effective tax rate of 35.3% and the effective statutory tax rate of 31% were the increment of non-deductible expenses which increased the effective tax rate by 6.0%, partially offset by the non-taxable income which decreased the effective tax rate by 2.5%.


42


Table of Contents

Results by Business Segment

Nomura established a new Banking Division on April 1, 2025. Accordingly, our operating management and management reporting are prepared based on the Wealth Management, the Investment Management, the Wholesale and the Banking segments. We disclose business segment information in accordance with this structure from the year ended March 31, 2026. Amounts for prior periods have been reclassified to conform to the presentation for the year ended March 31, 2026.

Net gain (loss) related to economic hedging transactions, a part of realized gain (loss) on investments in equity securities held for operating purposes, our share of equity in the earnings of affiliates, corporate items and other financial adjustments are included as “Other” operating results outside of business segments in our segment information.

A part of unrealized gain (loss) on certain investments in equity securities held for operating purposes is classified as a reconciling item outside of our segment information. The following segment information should be read in conjunction with Note 23 “Segment and geographic information” in our consolidated financial statements included in this annual report. The reconciliation of our segment results of operations and consolidated financial statements is provided in Note 23 “Segment and geographic information” in our consolidated financial statements included in this annual report.

Wealth Management

Operating Results of Wealth Management


     Millions of yen  
     Year ended March 31  
         2024              2025          % Change from
previous year
        2026          % Change from
previous year
 

Non-interest revenue

   ¥ 380,563      ¥ 422,617        11.1   ¥ 473,282        12.0

Net interest revenue

     6,461        10,934        69.2       14,624        33.7  


Net revenue

     387,024        433,551        12.0       487,906        12.5  

Non-interest expenses

     268,035        267,369        (0.2     283,882        6.2  


Income before income taxes

   ¥ 118,989      ¥ 166,182        39.7   ¥ 204,024        22.8


Net revenue increased from the year ended March 31, 2025 to the year ended March 31, 2026 primarily due to an increase in commissions earned from brokerage commissions and the distribution of investment trusts.

Net revenue increased from the year ended March 31, 2024 to the year ended March 31, 2025 primarily due to an increase in asset management fees.

Non-interest expenses increased from the year ended March 31, 2025 to the year ended March 31, 2026, primarily due to an increase in personnel expenses driven by increases in bonuses.

Non-interest expenses were largely unchanged from the year ended March 31, 2024 to the year ended March 31, 2025.


43


Table of Contents

The following table shows the breakdown of Wealth Management non-interest revenues for the year ended March 31, 2025 and 2026.


                 Millions of yen  
                 Year ended March 31  
                 2025     2026     % Change from
 previous year 
 

Commissions


   ¥ 183,598     ¥ 217,533       18.5

Brokerage commissions


     72,249       95,993       32.9  

Commissions for distribution of investment trusts


     65,852       66,057       0.3  

Other commissions


     45,497       55,483       21.9  

Net gain on trading


     52,483       49,331       (6.0

Fees from investment banking


     27,323       25,550       (6.5

Asset management fees


     156,732       176,098       12.4  

Others


     2,481       4,770       92.3  


Non-interest revenues

       ¥ 422,617     ¥ 473,282       12.0


Commissions increased from the year ended March 31, 2025 to the year ended March 31, 2026, primarily due to an increase in brokerage commissions. Asset management fees increased from the year ended March 31, 2025 to the year ended March 31, 2026, due to an increase in recurring revenue.


Wealth Management Client Assets


The following table presents amounts and details regarding the composition of Wealth Management client assets as of March 31, 2025 and 2026. Wealth Management client assets consist of clients’ assets under management and assets relating to variable annuity insurance products.


    Trillions of yen  
    Year ended March 31, 2025  
    Balance at
 beginning of year 
     Gross inflows        Gross outflows      Market
appreciation /
 (depreciation) 
    Balance at
 end of year 
 

Equities

  ¥ 102.5     ¥ 41.1      ¥ (38.4   ¥ (13.0   ¥ 92.2  

Debt securities

    20.1       20.5        (23.7     3.8       20.7  

Equity investment trusts

    13.3       5.4        (5.0     (0.4     13.3  

Debt investment trusts

    7.3       0.7        (0.5     (0.8     6.7  

Overseas mutual funds

    1.8       0.7        (0.2     (0.3     2.0  

Others

    8.6       2.5        (1.1     (1.1     8.9  


Total

  ¥ 153.6     ¥ 70.9      ¥ (68.9   ¥ (11.8   ¥ 143.8  


    Trillions of yen  
    Year ended March 31, 2026  
    Balance at
beginning of year
    Gross inflows      Gross outflows     Market
appreciation /
(depreciation)
    Balance at
end of year
 

Equities

  ¥ 92.2     ¥ 31.0      ¥ (31.1   ¥ 25.5     ¥ 117.6  

Debt securities

    20.7       19.4        (16.7     (1.8     21.6  

Equity investment trusts

    13.3       4.1        (3.4     2.1       16.1  

Debt investment trusts

    6.7       0.5        (0.3     0.1       7.0  

Overseas mutual funds

    2.0       0.6        (0.1     0.2       2.7  

Others

    8.9       1.7        (0.8     1.0       10.8  


Total

  ¥ 143.8     ¥ 57.3      ¥ (52.4   ¥ 27.1     ¥ 175.8  


Wealth Management client assets increased from March 31, 2025 to March 31, 2026. The balances of our clients’ equity and equity-related products increased from March 31, 2025 to ¥117.6 trillion as of March 31, 2026, mainly due to market appreciation during the year. The balances of our clients’ investment trusts increased by ¥3.8 trillion from ¥22.0 trillion as of March 31, 2025 to ¥25.8 trillion as of March 31, 2026.

Wealth Management client assets decreased from March 31, 2024 to March 31, 2025. The balances of our clients’ equity and equity-related products decreased from March 31, 2024 to ¥92.2 trillion as of March 31, 2025, mainly due to market depreciation during the year. The balances of our clients’ investment trusts decreased by ¥0.4 trillion from ¥22.4 trillion as of March 31, 2024 to ¥22.0 trillion as of March 31, 2025.


44


Table of Contents

Investment Management

Operating Results of Investment Management


     Millions of yen  
     Year ended March 31  
        2024            2025         % Change from
 previous year 
       2026         % Change from
 previous year 
 

Non-interest revenue

   ¥   149,575      ¥ 181,010        21.0   ¥   248,388        37.2

Net interest revenue

     4,568        11,463        150.9       10,128        (11.6


Net revenue

     154,143        192,473        24.9       258,516        34.3  

Non-interest expenses

     93,945        102,882        9.5       170,219        65.5  


Income before income taxes

   ¥ 60,198      ¥ 89,591        48.8   ¥ 88,297        (1.4 )% 


Net revenue increased from the year ended March 31, 2025 to the year ended March 31, 2026, primarily due to an increase in gains recognized in respect of our investment in American Century Investments and an increase in management fee revenue in the asset management businesses.


Net revenue increased from the year ended March 31, 2024 to the year ended March 31, 2025, primarily due to an increase in gains recognized in respect of our investment in American Century Investments and an increase in management fee revenue in the asset management businesses.


Non-interest expenses increased from the year ended March 31, 2025 to the year ended March 31, 2026, primarily due to expenses related to acquired businesses and the recognition of impairment losses on equity interests in investees.


Non-interest expenses increased from the year ended March 31, 2024 to the year ended March 31, 2025, primarily due to an increase in personnel expenses driven by increases in bonuses.


The breakdown of net revenue for Investment Management is as follows.


     Millions of yen  
     Year ended March 31  
       2024          2025        % Change from
previous year
      2026        % Change from
previous year
 

Business revenue(1)

   ¥ 137,249      ¥   163,688        19.3   ¥ 223,699        36.7

Investment gain/ loss(2)

     16,894        28,785        70.4       34,817        21.0  


Net revenue

   ¥ 154,143      ¥ 192,473        24.9   ¥   258,516        34.3
 
(1)

Consists of divisional revenue, other than investment gain/loss, including revenue generated by our asset management business (excluding gains and losses related to our investment in American Century Investments), revenues generated by Nomura Babcock & Brown Co., Ltd.’s aircraft leasing-related businesses and management fee revenues generated from our private equity and other investment businesses

(2)

Consists of divisional revenue attributable to investments (including fair value fluctuations, funding cost and dividends), including gains and losses related to our investment in American Century Investments, our investments held in our private equity and other investment businesses.


45


Table of Contents

The following table presents assets under management of each principal Nomura entity within our Investment Management Division as of March 31, 2025 and 2026.


     Billions of yen  
     Year ended March 31, 2025  
     Balance at
beginning of year
    Adjustment in
beginning balance(1)
    Gross inflows     Gross outflows     Market
appreciation /
(depreciation)
and other
    Balance at
end of year
 

Nomura Asset Management Co., Ltd .

   ¥ 91,011     ¥ (2,837   ¥ 34,509     ¥ (33,369   ¥ (1,264   ¥ 88,050  

Nomura Corporate Research and Asset Management Inc. etc

     5,588       0       1,091       (1,382     249       5,546  


Combined total

     96,599       (2,837     35,600       (34,751     (1,015     93,596  

Shared across group companies

     (7,598     2,837       (952     1,552       (97     (4,258


Total

   ¥ 89,001     ¥ 0     ¥ 34,648     ¥ (33,199   ¥ (1,112   ¥ 89,338  


     Billions of yen  
     Year ended March 31, 2026  
     Balance at
beginning of year
    Adjustment(2)     Gross inflows     Gross outflows     Market
appreciation /
(depreciation)
and other
    Balance at
end of year
 

Nomura Asset Management Co., Ltd .

   ¥ 88,050     ¥ 412     ¥ 39,000     ¥ (38,735   ¥ 22,551     ¥ 111,278  

Nomura Asset Management

International, etc.

     5,546       28,648       2,249       (3,912     1,584       34,115  


Combined total

     93,596       29,060       41,249       (42,647     24,135       145,393  

Shared across group companies

     (4,258     (3,536     (1,163     1,555       (1,088     (8,490


Total

   ¥ 89,338     ¥ 25,524     ¥ 40,086     ¥ (41,092   ¥ 23,047     ¥ 136,903  


(1)

Combined total of Nomura Asset Management Co., Ltd. and Shared across group companies assets decreased similarly due to the reorganization in the Americas made on April 1, 2024.

(2)

Combined total of Nomura Asset Management International, etc and Shared across group companies increased similarly due to the transfer of Nomura Fiduciary Research & Consulting Co., Ltd. to the Investment Management Division effective April 1, 2025. Also, Combined total of Nomura Asset Management International, etc and Shared across group companies increased due to the assets under management of Macquarie Group’s Public Asset Management business acquired on December 1, 2025.

Assets under management increased primarily due to the Macquarie Acquisition during the year ended March 31, 2026.

Assets under management remained largely unchanged the year ended March 31, 2024 to the year ended March 31, 2025.

The following table presents Nomura Asset Management Co., Ltd.’s market share, in terms of net asset value, of the Japanese publicly offered investment trusts market as of March 31, 2024, 2025 and 2026.


     March 31  
     2024     2025     2026  

Total of publicly offered investment trusts

     26     25     25

Equity investment trusts

     25     24     23

Debt investment trusts

     44     44     43

(Source) Nomura’s own calculation based on data published by the Investment Trusts Association, Japan.

Investment trust assets included in assets under management by Nomura Asset Management Co., Ltd. were ¥78.0 trillion as of March 31, 2026, which represents a ¥15.9 trillion (26%) increase compared to March 31, 2025. This increase was due to net inflows of ¥0.6 trillion and market appreciation of ¥15.3 trillion. The balances of certain investment trusts, including TOPIX Exchange Traded Fund and NIKKEI 225 Exchange Traded Fund also increased.

Investment trust assets included in assets under management by Nomura Asset Management Co., Ltd. were ¥62.1 trillion as of March 31, 2025, which represents a ¥0.8 trillion (1%) decrease compared to March 31, 2024. This decrease was due to net inflows of ¥1.6 trillion and market depreciation of ¥2.4 trillion. Despite such market depreciation, the balances of certain investment trusts, including TOPIX Banks Exchange Traded Fund and Nomu Wrap Fund increased.


46


Table of Contents

Wholesale

Operating Results of Wholesale

The operating results of our Wholesale Division comprise the combined results of our Global Markets and Investment Banking businesses. Our Global Markets business comprises our Fixed Income and Equities businesses.


     Millions of yen  
     Year ended March 31  
     2024     2025      % Change from
previous year
    2026     % Change from
previous year
 

Non-interest revenue

   ¥ 875,664     ¥ 1,015,803        16.0   ¥ 1,168,966       15.1

Net interest revenue

     (9,517     42,135        —        (6,737     —   


Net revenue

     866,147       1,057,938        22.1       1,162,229       9.9  

Non-interest expenses

     812,236       891,656        9.8       961,662       7.9  


Income before income taxes

   ¥ 53,911     ¥ 166,282        208.4   ¥ 200,567       20.6


Net revenue increased from the year ended March 31, 2025 to the year ended March 31, 2026. Fixed Income revenues in Global Markets increased due to a strong performance in spread products. Equities revenues in Global Markets increased primarily due to increase in equity products and execution services. Investment Banking revenues increased primarily due to strong performance in Japan and overseas during the year ended March 31, 2026.


Net revenue increased from the year ended March 31, 2024 to the year ended March 31, 2025. Fixed Income revenues in Global Markets increased due to a strong performance in spread products. Equities revenues in Global Markets increased primarily due to increase in equity products and execution services. Investment Banking revenues increased primarily due to strong performance in Japan and overseas during the year ended March 31, 2025.


Non-interest expenses increased from the year ended March 31, 2025 to the year ended March 31, 2026, primarily due to the impact of a weaker yen on the translation of non-yen denominated overseas expenses, and increase in compensation expenses compared to previous year.


Non-interest expenses increased from the year ended March 31, 2024 to the year ended March 31, 2025, primarily due to the impact of a weaker yen on the translation of non-yen denominated overseas expenses, and increase in compensation expenses compared to previous year.


The following table presents a breakdown of net revenue for Wholesale for the year ended March 31, 2024, 2025 and 2026.


     Millions of yen  
     Year ended March 31  
     2024     2025      % Change from
previous year
    2026     % Change from
previous year
 

Wholesale net revenue:


Global Markets net revenue

   ¥ 707,113     ¥ 874,622        23.7   ¥ 968,122       10.7

Investment Banking net revenue

     159,034       183,316        15.3       194,107       5.9  


Net revenue

   ¥ 866,147     ¥ 1,057,938        22.1   ¥ 1,162,229       9.9


Global Markets

We have a proven track record in sales and trading of debt securities, equity securities, and foreign exchange, as well as derivative products referencing these financial instruments to domestic and overseas institutional investors. In response to the increasingly diverse and complex needs of our clients, we continue to enhance our trading and product origination capabilities to offer superior products not only to domestic and overseas institutional investors, but also to our Wealth Management and Investment Management Divisions. This cross-divisional approach also extends to Investment Banking, where close collaboration leads to high value-adding solutions for our clients. These ties enable us to identify the types of products of interest for investors and develop and deliver products that meet their needs. We continue to develop extensive ties with institutional investors in Japan and international markets, as well as wealthy investors, public-sector agencies, and regional financial institutions in Japan, and government agencies, financial institutions, and corporations around the world.


47


Table of Contents

Net revenue increased from the year ended March 31, 2025 to the year ended March 31, 2026. In our Fixed Income businesses, Net revenue increased from ¥499,203 million for the year ended March 31, 2025 to ¥508,958 million for the year ended March 31, 2026, primarily due to a strong performance in spread products compared to the previous year. In our Equities business, Net revenue increased from ¥375,419 million for the year ended March 31, 2025 to ¥459,165 million for the year ended March 31, 2026, primarily due to strong performance in equity products and execution services compared to the previous year.

Net revenue increased from the year ended March 31, 2024 to the year ended March 31, 2025. In our Fixed Income businesses, Net revenue increased from ¥420,268 million for the year ended March 31, 2024 to ¥499,203 million for the year ended March 31, 2025, primarily due to a strong performance in spread products compared to the previous year. In our Equities business, Net revenue increased from ¥286,845 million for the year ended March 31, 2024 to ¥375,419 million for the year ended March 31, 2025, primarily due to strong performance in equity products and execution services compared to the previous year.

Investment Banking

We provide a broad range of investment banking services, such as underwriting and advisory activities. We underwrite offerings of debt, equity and other financial instruments in major financial markets, such as Asia, Europe and the U.S. We have been enhancing our M&A and financial advisory expertise to secure more high-profile deals both across and within regions. We develop and forge solid relationships with clients on a long-term basis by providing extensive resources in a seamless fashion to facilitate bespoke solutions.

Net revenue increased from the year ended March 31, 2025 to the year ended March 31, 2026, primarily due to increases in financing and solutions-related transactions.

Net revenue increased from the year ended March 31, 2024 to the year ended March 31, 2025, primarily due to increases in underwriting and sales commission and M&A advisory fee during the year.


48


Table of Contents

Banking

The Banking Division comprises NTB and NBL. The division conducts (i) the banking business, under which funds procured primarily through deposits and other funding sources are deployed to loans and investments in securities to generate interest income, and (ii) the trust and agency business, under which fee and commission income is earned by providing asset administration and related services to clients, including investment trusts.


     Millions of yen  
     Year ended March 31  
     2024      2025      % Change from
previous year
    2026      % Change from
previous year
 

Non-interest revenue

   ¥ 35,244      ¥ 36,344        3.1   ¥ 42,081        15.8

Net interest revenue

     7,617        10,828        42.2       11,837        9.3  


Net revenue

     42,861        47,172        10.1       53,918        14.3  

Non-interest expenses

     27,755        30,815        11.0       39,902        29.5  


Income before income taxes

   ¥ 15,106      ¥ 16,357        8.3   ¥ 14,016        (14.3 )% 


Net revenue increased from the year ended March 31, 2025 to the year ended March 31, 2026 primarily due to increases in loan outstanding, investment trust balance and assets under administration.

Net revenue increased from the year ended March 31, 2024 to the year ended March 31, 2025 primarily due to increases in loan outstanding, investment trust balance and assets under administration.

Non-interest expenses increased from the year ended March 31, 2025 to the year ended March 31, 2026, primarily due to an increase in depreciation and amortization expenses associated with the renewal of the core banking system.

Non-interest expenses increased from the year ended March 31, 2024 to the year ended March 31, 2025, primarily due to an increase in personnel expenses driven by increases in bonuses.

The following table presents select figures from NTB’s non-consolidated balance sheet as of March 31, 2025 and 2026, which has been prepared in accordance with accounting principles generally accepted in Japan and with regulatory requirements applicable to NTB, and is not directly comparable to Nomura’s consolidated balance sheets, which are prepared in accordance with accounting principles generally accepted in the United States.


     Billions of yen  
     March 31,
2025
     March 31,
2026
 

Assets


Securities

   ¥ 310.7      ¥ 423.1  

Loans(1)

     1,044.4        1,177.2  


Total assets

     2,075.4        2,607.4  


Liabilities


Deposits

   ¥ 1,357.3      ¥ 1,334.5  


NTB’s total assets were ¥2.6 trillion as of March 31, 2026, an increase of 25.6% from ¥2.1 trillion as of March 31, 2025. During this period, Loans increased by 12.7%, primarily driven by the expansion of transactional customers and advertising and promotional activities, and Securities increased by 36.2%.


  (1)

Consists of the total balance of loans originated by NTB, such as private banking loans and the “Nomura Web Loan” securities-backed loan product. Such figure does not necessarily correspond to “Loans receivable” as disclosed by Nomura on its consolidated balance sheets.


49


Table of Contents

The following table presents NTB’s trust assets as of March 31, 2025 and 2026. These figures represent preliminary estimates as of the date of the filing of this annual report and are subject to revision.


     Billions of yen  
     March 31, 2025      March 31, 2026  

Designated money trusts

   ¥ 404.9      ¥ 374.3  

Specified money trusts

     4,417.8        4,609.2  

Pension trusts

     0.8        0.2  

Investment trusts

     40,541.4        42,899.2  

Pecuniary trusts other than money trusts

     1,064.7        1,275.6  

Securities trusts

     3,754.7        6,290.8  

Money claim trusts

     0.8        0.7  

Composite trusts

     1,111.7        1,403.1  


Total

   ¥ 51,296.8      ¥ 56,853.1  


Total trust assets were ¥56.9 trillion as of March 31, 2026, an increase of 10.8% from ¥51.3 trillion as of March 31, 2025. During this period, Investment trusts increased by 5.8%, and Securities trusts increased by 67.5%.

The following table presents a breakdown of NBL’s Assets under administration by source as of March 31, 2025 and 2026, distinguishing amounts entrusted by (i) the Nomura Group and (ii) clients other than the Nomura Group (“Other Clients”).


     Billions of U.S. Dollar  
     March 31, 2025      March 31, 2026  

Nomura Group

   $ 29.9      $ 35.3  

Other Clients

     26.7        29.2  


Total

   $    56.6      $    64.5  


NBL’s assets under administration was $64.6 billion as of March 31, 2026, an increase of 14.1% from $56.6 billion as of March 31, 2025. During this period, amounts entrusted by the Nomura Group increased by 18.3%, while amounts entrusted by Other Clients increased by 9.4%.


50


Table of Contents

Other Operating Results

Other operating results include net gain (loss) related to economic hedging transactions, a part of realized gain (loss) on investments in equity securities held for operating purposes, equity in earnings of affiliates, corporate items, and other financial adjustments. See Note 23 “Segment and geographic information” in our consolidated financial statements included within this annual report.

Income before income taxes in Other operating results were ¥35,987 million for the year ended March 31, 2024, ¥35,101 million for the year ended March 31, 2025 and ¥24,646 million for the year ended March 31, 2026, which decreased from the year ended March 31, 2025 to the year ended March 31, 2026.

Other operating results for the year ended March 31, 2026 include the positive impact of our own creditworthiness on derivative liabilities which resulted in gains of ¥1,627 million and losses from changes in counterparty credit spreads on derivative assets of ¥2,637 million.

Other operating results for the year ended March 31, 2025 include the positive impact of our own creditworthiness on derivative liabilities which resulted in gains of ¥1,443 million and gains from changes in counterparty credit spreads on derivative assets of ¥828 million.

Other operating results for the year ended March 31, 2024 include the negative impact of our own creditworthiness on derivative liabilities which resulted in losses of ¥12,068 million and gains from changes in counterparty credit spreads on derivative assets of ¥7,248 million.


51


Table of Contents

Summary of Regional Contribution

For a summary of our net revenue, income (loss) before income taxes and long-lived assets by geographic region, see Note 23 “Segment and geographic information” in our consolidated financial statements included in this annual report.

Cash flows

Please refer to Item 2 “4. Operating, Financial and Cash Flow Analyses by Management — (5) Liquidity and Capital Resources.”


52


Table of Contents

(2) Trading Activities

Assets and liabilities for trading purposes

For disclosures relating to the assets and liabilities for trading purposes, please refer to Item 5 “1. Consolidated Financial Statements and Other,” Note 2 “Fair value measurements” as well as Note 3 “Derivative instruments and hedging activities.

Risk management of trading activity

Nomura adopts Value at Risk (“VaR”) for measurement of market risk arising from trading activity.


1)

Assumption on VaR


Confidence level: 95%


Holding period: One day


Consideration of price movement among the products

Nomura uses a confidence level of 95% for VaR with a one-day holding period, which is used for our disclosure. Please find below the VaR data for the one-day holding period for the year ended March 31, 2026.


2)

Records of VaR


     Billions of yen  
     As of  
     March 31,
2025
    March 31,
2026
 

Equity

   ¥ 2.0     ¥ 4.5  

Interest rate

     2.1       2.9  

Foreign exchange

     1.5       1.1  


Subtotal

     5.6       8.5  

Less: Diversification Benefit

     (1.8     (2.7


VaR

   ¥ 3.8     ¥ 5.8  


     Billions of yen  
     Year ended March 31, 2026  
     Maximum      Minimum      Average  

VaR

   ¥ 7.7      ¥ 3.1      ¥ 5.1  


53


Table of Contents

(3) Critical accounting policies and estimates

Critical accounting policies are the accounting policies which have the most significant impact on the preparation of our consolidated financial statements included within this annual report and which require the most difficult, subjective and complex judgments by our management to develop estimates used in the application of these policies. Estimates, by their nature, are based on underlying assumptions which require management judgment and depend on the extent of information available at the time. Actual results in future reporting periods may differ from these estimates, which could have a material impact on our consolidated financial statements.

The following table summarizes the critical accounting policies which have had the most significant impact on our consolidated financial statements for the year ended March 31, 2026. The table also identifies the critical accounting estimates inherent within application of those policies, the underlying assumptions and judgments made by our management to derive those estimates and the potential financial impact had we applied different estimates or assumptions as of March 31, 2025 and 2026. See Note 1 “Summary of Accounting Policies” in our consolidated financial statements included in this annual report for more information on these critical accounting policies and the relevant footnote disclosures referred to in the table for more information around how those critical accounting policies and critical accounting estimates have been applied.


54


Table of Contents

Critical 

accounting 

policy 


Critical accounting 

estimates 


Key subjective assumptions or judgments by management 


Effect of changes in estimates 

and assumptions during the year 

ended March 31, 2026 

Fair value of financial instruments


Note 2 “Fair value

measurements”

  Estimating fair value for financial instruments  

A significant portion of our financial instruments are carried at fair value. The fair values of these financial instruments may not only be measured at quoted prices but also impacted by other factors, including selection of valuation techniques/ models and other assumptions that require judgment.


This may affect the amount and timing of unrealized gains or losses recognized in the consolidated statements of income or accumulated other comprehensive income for a particular financial instrument.


Selection of appropriate valuation techniques


For financial instruments measured at fair values where quoted prices are available in active markets, we typically use quoted prices as level 1 inputs for determining the fair values of these financial instruments.


For financial instruments where such quoted prices are not available, the fair values of these financial instruments are measured using level 2 or level 3 inputs. Significant judgment is involved in selection of appropriate valuation techniques and validation of assumptions applied in models because the estimated fair values measured could vary depending on which models and assumptions are used. When selecting valuation techniques, various factors such as the particular circumstances and markets where these financial instruments are traded, the availability of reliable inputs, maximizing the use of relevant observable inputs and minimizing the use of unobservable inputs are considered.


Significance of level 3 inputs


Fair values are more judgmental when we use level 3 inputs, which are based on significant non-market based unobservable inputs.


For these instruments, fair value is determined based on management’s judgment about the assumption that market participant would use in pricing the instruments, including perception of liquidity, economic environment and the risks affecting the specific financial instruments.


See Note 2 “Fair value measurements” for further information around our valuation methodologies and our policy for classification of financial instruments within the fair value hierarchy.


Level 3 financial assets (net of derivative liabilities) during the year decreased from ¥1,330 billion as of March 2025 to ¥1,290 billion as of March 2026. Total level 3 financial assets to total financial assets carried at fair value on a recurring basis ratio was 5 % as of March 31, 2026 (6 % as of March 31, 2025.)


See Note 2 “Fair Value measurements” for further quantitative and qualitative information regarding level 3 inputs, including the sensitivity of fair values of the underlying financial instruments to changes in level 3 inputs.


55


Table of Contents

Assets and Liabilities Associated with Investment and Financial Services Business

Exposure to Certain Financial Instruments and Counterparties

Market conditions continue to impact numerous products to which we have certain exposures. We also have exposures to Special Purpose Entities (“SPEs”) and others in the normal course of business.

Leveraged Finance

We provide loans to clients in connection with leveraged buy-outs and leveraged buy-ins. As this type of financing is usually initially provided through a commitment, we have both funded and unfunded exposures on these transactions.

The following table presents our exposure to leveraged finance transactions, separately showing funded and unfunded commitments by geographic location of the target company as of March 31, 2026.


     Millions of yen  
     March 31, 2026  
     Funded      Unfunded      Total  

Europe

   ¥ 26,844      ¥ 178,906      ¥ 205,750  

Americas

     35,888        375,156        411,044  

Asia and Oceania

     11,221        87,495        98,716  


Total

   ¥ 73,953      ¥ 641,557      ¥ 715,510  


Special Purpose Entities (“SPEs”)

Our involvement with these entities includes structuring, underwriting, distributing and selling debt instruments and beneficial interests issued by these entities, subject to prevailing market conditions. In connection with our securitization and equity derivative activities, we also act as a transferor of financial assets to these entities, as well as, underwriter, distributor and seller of asset-repackaged financial instruments issued by these entities. We retain, purchase and sell variable interests in SPEs in connection with our market-making, investing and structuring activities. Our other types of involvement with SPEs include guarantee agreements and derivative contracts.

For further discussion on Nomura’s involvement with variable interest entities, see Note 7 “Securitizations and Variable Interest Entities” in our consolidated financial statements included in this annual report.

Accounting Developments

See Note 1 “Basis of accounting and summary of accounting policies: New accounting pronouncements adopted during the current year” in our consolidated financial statements included in this annual report.


56


Table of Contents

(4) Deferred Tax Assets

Details of deferred tax assets and liabilities

The following table presents details of deferred tax assets and liabilities reported within Other assetsOther and Other liabilities, respectively, in the consolidated balance sheets as of March 31, 2026.


     Millions of yen  
     March 31, 2026  

Deferred tax assets


Depreciation, amortization and valuation of fixed assets

   ¥ 43,007  

Investments in subsidiaries and affiliates

     3,604  

Valuation of financial instruments

     128,286  

Accrued pension and severance costs

     5,224  

Other accrued expenses and provisions

     118,047  

Operating losses

     477,481  

Lease liabilities

     39,964  

Other

     20,477  


Gross deferred tax assets

     836,090  

Less - Valuation allowances

     (588,426


Total deferred tax assets

     247,664  


Deferred tax liabilities


Investments in subsidiaries and affiliates

     129,826  

Valuation of financial instruments

     98,372  

Undistributed earnings of foreign subsidiaries

     17,816  

Valuation of fixed assets and intangible assets

     58,329  

Right-of-use assets

     35,219  

Other

     13,030  


Total deferred tax liabilities

     352,592  


Net deferred tax assets (liabilities)

   ¥ (104,928


Calculation method of deferred tax assets

In accordance with U.S. GAAP, we recognize deferred tax assets to the extent we believe that it is more likely than not that a benefit will be realized. A valuation allowance is provided for tax benefits available to us, which are not deemed more likely than not to be realized.


57


Table of Contents

(5) Liquidity and Capital Resources

Funding and Liquidity Management

Overview

We define liquidity risk as the risk of loss arising from difficulty in securing the necessary funding or from a significantly higher cost of funding than normal levels due to deterioration of the Nomura Group’s creditworthiness or deterioration in market conditions. This risk could arise from Nomura-specific or market-wide events such as inability to access the secured or unsecured debt markets, a deterioration in our credit ratings, a failure to manage unplanned changes in funding requirements, a failure to liquidate assets quickly and with minimal loss in value, or changes in regulatory capital restrictions which may prevent the free flow of funds between different group entities. Our global liquidity risk management policy is based on liquidity risk appetite formulated by the Executive Management Board (“EMB”). Nomura’s liquidity risk management, under market-wide stress and in addition, under Nomura-specific stress, seeks to ensure enough continuous liquidity to meet all funding requirements and unsecured debt obligations across one year and 30-day periods, respectively, without raising funds through unsecured funding or through the liquidation of assets. We are required to meet regulatory notice on the Liquidity Coverage Ratio (“LCR”) and the Net Stable Funding Ratio (“NSFR”) issued by the Financial Services Agency (“FSA”).

We have in place a number of liquidity risk management frameworks that enable us to achieve our primary liquidity objective. These frameworks include (1) Centralized Control of Residual Cash and Maintenance of Liquidity Portfolio; (2) Utilization of Unencumbered Assets as Part of Our Liquidity Portfolio; (3) Appropriate Funding and Diversification of Funding Sources and Maturities Commensurate with the Composition of Assets; (4) Management of Credit Lines to Nomura Group Entities; (5) Implementation of Liquidity Stress Tests; and (6) Contingency Funding Plan.

Our EMB has the authority to make decisions concerning group liquidity management. The Chief Financial Officer (“CFO”) has the operational authority and responsibility over our liquidity management based on decisions made by the EMB.

1. Centralized Control of Residual Cash and Maintenance of Liquidity Portfolio.

We centrally control residual cash held at Nomura Group entities for effective liquidity utilization purposes. As for the usage of funds, the CFO decides the maximum amount of available funds, provided without posting any collateral, for allocation within Nomura and the EMB allocates the funds to each business division. Global Treasury monitors usage by businesses and reports to the EMB.

In order to enable us to transfer funds smoothly between group entities, we limit the issuance of securities by regulated broker-dealers or banking entities within the Nomura Group and seek to raise unsecured funding primarily through the Company or through unregulated subsidiaries. The primary benefits of this strategy include cost minimization, wider investor name recognition and greater flexibility in providing funding to various subsidiaries across the Nomura Group.

To meet any potential liquidity requirement, we maintain a liquidity portfolio, managed by Global Treasury apart from other assets, in the form of cash and highly liquid, unencumbered securities that may be sold or pledged to provide liquidity. As of March 31, 2026, our liquidity portfolio was ¥10,699.6 billion which sufficiently met liquidity requirements under the stress scenarios.

The following table presents a breakdown of our liquidity portfolio by type of financial assets as of March 31, 2025 and 2026 and averages maintained for the years ended March 31, 2025 and 2026. Yearly averages are calculated using month-end amounts.


     Billions of yen  
     Average for
year ended
March 31, 2025
     March 31, 2025      Average for
year ended
March 31, 2026
     March 31, 2026  

Cash, cash equivalents and time deposits(1)

   ¥ 4,395.5      ¥ 4,196.3      ¥ 4,719.2      ¥ 3,937.0  

Government debt securities

     4,765.2        5,475.4        5,134.2        5,958.5  

Others(2)

     501.3        485.0        632.3        804.1  


Total liquidity portfolio

   ¥ 9,662.0      ¥ 10,156.7      ¥ 10,485.7      ¥ 10,699.6  


(1)

Cash, cash equivalents, and time deposits include nostro balances and deposits with both central banks and market counterparties that are readily available to support the liquidity position of Nomura.

(2)

Others include other liquid financial assets such as money market funds and U.S. agency securities.


58


Table of Contents

The following table presents a breakdown of our liquidity portfolio by currency as of March 31, 2025 and 2026 and averages maintained for the years ended March 31, 2025 and 2026. Yearly averages are calculated using month-end amounts.


     Billions of yen  
     Average for
year ended
March 31, 2025
     March 31, 2025      Average for
year ended
March 31, 2026
     March 31, 2026  

Japanese Yen

   ¥ 2,522.7      ¥ 2,868.2      ¥ 2,997.6      ¥ 2,248.3  

U.S. Dollar

     4,912.4        4,840.2        5,089.2        5,841.7  

Euro

     1,101.3        1,234.6        1,267.6        1,412.5  

British Pound

     667.1        662.5        549.4        555.7  

Others(1)

     458.4        551.2        581.9        641.4  


Total liquidity portfolio

   ¥ 9,662.0      ¥ 10,156.7      ¥ 10,485.7      ¥ 10,699.6  


(1)

Includes other currencies such as the Australian Dollar, the Canadian Dollar and the Swiss Franc.

We assess our liquidity portfolio requirements globally as well as by each major operating entity in the Nomura Group. We primarily maintain our liquidity portfolio at Nomura Holdings, Inc. (“NHI”) and Nomura Securities Co. Ltd. (“NSC”), our other major broker-dealer subsidiaries, our bank subsidiaries, and other group entities. In determining the amounts and entities which hold this liquidity portfolio, we consider legal, regulatory and tax restrictions which may impact our ability to freely transfer liquidity across different entities in the Nomura Group. For more information regarding regulatory restrictions, see Note 20 “Regulatory requirements” in our consolidated financial statements included within this annual report.

The following table presents a breakdown of our liquidity portfolio by entity as of March 31, 2025 and 2026.


     Billions of yen  
     March 31, 2025      March 31, 2026  

NHI and NSC(1)

   ¥ 2,439.4      ¥ 1,777.9  

Major broker-dealer subsidiaries

     4,219.8        5,233.9  

Bank subsidiaries(2)

     1,784.4        1,712.0  

Other affiliates

     1,713.1        1,975.8  


Total liquidity portfolio

   ¥ 10,156.7      ¥ 10,699.6  


(1)

NSC, a broker-dealer located in Japan, holds an account with the Bank of Japan (“BOJ”) and has direct access to the BOJ Lombard facility through which same day funding is available for our securities pool. Any liquidity surplus at NHI is lent to NSC via short-term intercompany loans, which can be unwound immediately when needed.

(2)

Includes Nomura Bank International plc (“NBI”), Nomura Singapore Limited and Nomura Bank Luxembourg S.A.

2. Utilization of Unencumbered Assets as Part of Our Liquidity Portfolio.

In addition to our liquidity portfolio, we had ¥3,002.4 billion of other unencumbered assets comprising mainly of unpledged trading assets that can be used as an additional source of secured funding. Global Treasury monitors other unencumbered assets and can, under a liquidity stress event when the contingency funding plan has been invoked, monetize and utilize the cash generated as a result. The aggregate of our liquidity portfolio and other unencumbered assets as of March 31, 2026 was ¥13,702.0 billion, which represented 223.0% of our total unsecured debt maturing within one year.


     Billions of yen  
     March 31, 2025      March 31, 2026  

Net liquidity value of other unencumbered assets

   ¥ 2,432.2      ¥ 3,002.4  

Liquidity portfolio

     10,156.7        10,699.6  


Total

   ¥ 12,588.9      ¥ 13,702.0  


3. Appropriate Funding and Diversification of Funding Sources and Maturities Commensurate with the Composition of Assets

We seek to maintain a surplus of long-term debt and equity above the cash capital requirements of our assets. We also seek to achieve diversification of our funding by market, instrument type, investors, currency, and staggered maturities in order to reduce unsecured refinancing risk.


59


Table of Contents

We diversify funding by issuing various types of debt instruments - these include both structured loans and structured notes with returns linked to interest rates, currencies, equities, commodities, or related indices. We issue structured loans and structured notes in order to increase the diversity of our debt instruments. We typically hedge the returns we are obliged to pay with derivatives and/or the underlying assets to obtain funding equivalent to our unsecured long-term debt. The proportion of our non-Japanese Yen denominated long-term debt increased to 68.8% of total long-term debt outstanding as of March 31, 2026 from 62.4% as of March 31, 2025.

(1) Short-Term Unsecured Debt

Our short-term unsecured debt consists of short-term bank borrowings (including long-term bank borrowings maturing within one year), other loans, commercial paper, deposit at banking entities, certificates of deposit and debt securities maturing within one year. Deposits at banking entities and certificates of deposit comprise customer deposits and certificates of deposit of our banking subsidiaries. Short-term unsecured debt includes the current portion of long-term unsecured debt.

The following table presents an analysis of our short-term unsecured debt by type of financial liability as of March 31, 2025 and 2026.


     Billions of yen  
     March 31, 2025      March 31, 2026  

Short-term bank borrowings

   ¥ 369.2      ¥ 624.5  

Other loans

     304.4        330.0  

Commercial paper

     113.8        90.8  

Deposits at banking entities

     2,371.4        2,904.3  

Certificates of deposit

     262.8        351.2  

Debt securities maturing within one year

     1,380.7        1,842.3  


Total short-term unsecured debt

   ¥ 4,802.3      ¥ 6,143.1  


(2) Long-Term Unsecured Debt

We meet our long-term capital requirements and also achieve both cost-effective funding and an appropriate maturity profile by routinely funding through long-term debt and diversifying across various maturities and currencies.

Our long-term unsecured debt includes senior and subordinated debt issued through U.S. registered shelf offerings and our U.S. registered medium-term note programs, our Euro medium-term note programs, registered shelf offerings in Japan and various other debt programs.

As a globally competitive financial services group in Japan, we have access to multiple global markets and major funding centers. The Company, NSC, Nomura Europe Finance N.V., NBI, Nomura International Funding Pte. Ltd. and Nomura Global Finance Co., LTD. are the main group entities that borrow externally, issue debt instruments and engage in other funding activities. By raising funds to match the currencies and liquidities of our assets or by using foreign exchange swaps as necessary, we pursue optimization of our funding structures.

We use a wide range of products and currencies to ensure that our funding is efficient and well diversified across markets and investor types. Our unsecured senior debt is mostly issued without financial covenants, such as covenants related to adverse changes in our credit ratings, cash flows, results of operations or financial ratios, which could trigger an increase in our cost of financing or accelerate repayment of the debt.


60


Table of Contents

The following table presents an analysis of our long-term unsecured debt by type of financial liability as of March 31, 2025 and 2026.


     Billions of yen  
     March 31, 2025      March 31, 2026  

Long-term deposits at banking entities

   ¥ 471.4      ¥ 411.5  

Long-term bank borrowings

     3,272.8        3,428.0  

Other loans

     306.0        874.0  

Debt securities(1)

     6,757.2        7,938.9  


Total long-term unsecured debt

   ¥ 10,807.4      ¥ 12,652.4  


(1)

Excludes long-term debt securities issued by consolidated special purpose entities and similar entities that meet the definition of variable interest entities under Financial Accounting Standards Board (“FASB”) Accounting Standard Codification (“ASC”) 810 “Consolidation” and secured financing transactions recognized within Long-term borrowings as a result of transfers of financial assets that are accounted for as financings rather than sales in accordance with ASC 860 “Transfers and Servicing” (“ASC 860”).

(3) Maturity Profile

We also seek to maintain an average maturity for our plain vanilla debt securities and borrowings greater than or equal to three years. The average maturity for our plain vanilla debt securities and borrowings with maturities longer than one year was 4.2 years as of March 31, 2026. A significant amount of our structured loans and structured notes are linked to interest rates, currencies, equities, commodities, or related indices. These maturities are evaluated based on internal models and monitored by Global Treasury. Where there is a possibility that these may be called prior to their scheduled maturity date, maturities are based on our internal stress option adjusted model. The model values the embedded optionality under stress market conditions in order to determine when the debt securities or borrowing is likely to be called. The graph below shows the distribution of maturities of our outstanding long-term debt securities and borrowings by the model.

On this basis, the average maturity of our structured loans and structured notes with maturities longer than one year was 8.1 years as of March 31, 2026. The average maturity of our entire long-term debt with maturities longer than one year including plain vanilla debt securities and borrowings, was 6.3 years as of March 31, 2026.


LOGO

(4) Secured Funding

We typically fund our trading activities through secured borrowings, repurchase agreements and Japanese “Gensaki Repo” transactions. We believe such funding activities in the secured markets are more cost-efficient and less credit-rating sensitive than financing in the unsecured market. Our secured funding capabilities depend on the quality of the underlying collateral and market conditions. While we have shorter term secured financing for highly liquid assets, we seek longer terms for less liquid assets. We also seek to lower the refinancing risks of secured funding by transacting with a diverse group of global counterparties and delivering various types of securities collateral. In addition, we reserve an appropriate level of liquidity portfolio for the refinancing risks of secured funding maturing in the short term for less liquid assets. For more detail of secured borrowings and repurchase agreements, see Note 5 “Collateralized transactions” in our consolidated financial statements.


61


Table of Contents

4. Management of Credit Lines to Nomura Group Entities

We maintain and expand credit lines to Nomura Group entities from other financial institutions to secure stable funding. We ensure that the maturity dates of borrowing agreements are distributed evenly throughout the year in order to prevent excessive maturities in any given period.

5. Implementation of Liquidity Stress Tests

We maintain our liquidity portfolio and monitor the sufficiency of our liquidity based on an internal model which simulates changes in cash outflow under specified stress scenarios to comply with our above mentioned liquidity management policy.

We assess the liquidity requirements of the Nomura Group under various stress scenarios with differing levels of severity over multiple time horizons. We evaluate these requirements under Nomura-specific and broad market-wide events, including potential credit rating downgrades at the Company and subsidiary levels. We call this risk analysis our Maximum Cumulative Outflow (“MCO”) framework.

The MCO framework is designed to incorporate the primary liquidity risks for Nomura and models the relevant future cash flows in the following two primary scenarios:


Stressed scenario - To maintain adequate liquidity during a severe market-wide liquidity event without raising funds through unsecured financing or through the liquidation of assets for a year; and


Acute stress scenario - To maintain adequate liquidity during a severe market-wide liquidity event coupled with credit concerns regarding Nomura’s liquidity position, without raising funds through unsecured funding or through the liquidation of assets for 30 days.

We assume that Nomura will not be able to liquidate assets or adjust its business model during the time horizons used in each of these scenarios. The MCO framework therefore defines the amount of liquidity required to be held in order to meet our expected liquidity needs in a stress event to a level we believe appropriate based on our liquidity risk appetite.

As of March 31, 2026, our liquidity portfolio exceeded net cash outflows under the stress scenarios described above.

We constantly evaluate and modify our liquidity risk assumptions based on regulatory and market changes. The model we use in order to simulate the impact of stress scenarios includes the following assumptions:


No liquidation of assets;


No ability to issue additional unsecured funding;


Upcoming maturities of unsecured debt (maturities less than one year);


Potential buybacks of our outstanding debt;


Loss of secured funding lines particularly for less liquid assets;


Fluctuation of funding needs under normal business circumstances;


Cash deposits and free collateral roll-off in a stress event;


Widening haircuts on outstanding repo funding;


Additional collateralization requirements of clearing banks and depositories;


Drawdown on loan commitments;


Loss of liquidity from market losses;


Assuming a two-notch downgrade of our credit ratings, the aggregate fair value of assets that we would be required to post as additional collateral in connection with our derivative contracts; and


Legal and regulatory requirements that can restrict the flow of funds between entities in the Nomura Group.


62


Table of Contents

6. Contingency Funding Plan

We have developed a detailed contingency funding plan to integrate liquidity risk control into our comprehensive risk management strategy and to enhance the quantitative aspects of our liquidity risk control procedures. As a part of our Contingency Funding Plan (“CFP”), we have developed an approach for analyzing and quantifying the impact of any liquidity crisis. This allows us to estimate the likely impact of both Nomura-specific and market-wide events; and specifies the immediate action to be taken to mitigate any risk. The CFP lists details of key internal and external parties to be contacted and the processes by which information is to be disseminated. This has been developed at a legal entity level in order to capture specific cash requirements at the local level—it assumes that our parent company does not have access to cash that may be trapped at a subsidiary level due to regulatory, legal or tax constraints. We periodically test the effectiveness of our funding plans for different Nomura-specific and market-wide events. We also have access to central banks including, but not exclusively, the BOJ, which provide financing against various types of securities. These operations are accessed in the normal course of business and are an important tool in mitigating contingent risk from market disruptions.

Liquidity Regulatory Framework

In 2008, the Basel Committee published “Principles for Sound Liquidity Risk Management and Supervision.” To complement these principles, the Committee has further strengthened its liquidity framework by developing two minimum standards for funding liquidity. These standards have been developed to achieve two separate but complementary objectives.

The first objective is to promote short-term resilience of a financial institution’s liquidity risk profile by ensuring that it has sufficient high-quality liquid assets to survive a significant stress scenario lasting for 30 days. The Committee developed the LCR to achieve this objective.

The second objective is to promote resilience over a longer time horizon by creating additional incentives for financial institutions to fund their activities with more stable sources of funding on an ongoing basis. The NSFR has a time horizon of one year and has been developed to provide a sustainable maturity structure of assets and liabilities.

These two standards are comprised mainly of specific parameters which are internationally “harmonized” with prescribed values. Certain parameters, however, contain elements of national discretion to reflect jurisdiction-specific conditions.

In Japan, the regulatory notice on implementation of LCR, based on the international agreement issued by the Basel Committee with necessary national revisions, was published by the FSA. The notice was implemented at the end of March 2015 with phased-in minimum standards. Average of Nomura’s LCR for the three months ended March 31, 2026 was 214.0%, and Nomura was compliant with all LCR regulatory requirements. As for NSFR, the revision of the liquidity regulatory notice was published by the FSA on March 31, 2021 and was implemented from the end of September 2021. Nomura’s NSFR as of March 31, 2026 was compliant with all NSFR regulatory requirements.


63


Table of Contents

Cash Flows

Nomura’s cash flows are primarily generated from operating activities undertaken in connection with our client flows and trading and from financing activities which are closely related to such activities. As a financial institution, growth in operations tends to result in cash outflows from operating activities as well as investing activities. For the years ended March 31, 2025 and 2026, we recorded net cash outflows from operating activities and investing activities and net cash inflows from financing activities as discussed in the comparative analysis below.

The following table presents the key information on our consolidated cash flows for the years ended March 31, 2025 and 2026.


     Billions of yen  
     Year Ended March 31  
     2025     2026  

Net cash used in operating activities

   ¥ (678.6   ¥ (843.0

Net income

     347.3       374.4  

Trading assets and private equity and debt investments

     (3,026.3     (2,861.9

Trading liabilities

     574.2       1,111.3  

Securities purchased under agreements to resell, net of securities sold under agreements to

repurchase

     1,108.8       (441.0

Securities borrowed, net of securities loaned

     526.2       882.2  

Other net operating cash flow reconciling items

     (208.8     92.0  

Net cash used in investing activities

     (848.6     (1,498.9

Net cash outflows from time deposits

     (107.0     (1.4

Net cash outflows from loans

     (538.9     (805.4

Net cash outflows from other non-trading debt securities

     (47.8     (89.9

Acquisitions, net of cash acquired

     —        (275.0

Other net investing cash outflows

     (154.9     (327.2

Net cash provided by financing activities

     1,679.7       2,095.9  

Net cash inflows from long-term borrowings

     1,020.9       1,437.8  

Net cash inflows / (outflows) from short-term borrowings

     (26.7     110.7  

Net cash inflows from deposits received at banks

     785.4       387.4  

Other net financing cash inflows / (outflows)

     (99.9     160.0  

Effect of exchange rate changes on cash, cash equivalents, restricted cash and restricted cash equivalents

     (26.0     139.3  


Net increase (decrease) in cash, cash equivalents, restricted cash and restricted cash equivalents

     126.4       (106.7

Cash, cash equivalents, restricted cash and restricted cash equivalents at beginning of the year

     4,299.0       4,425.4  


Cash, cash equivalents, restricted cash and restricted cash equivalents at end of the year

   ¥ 4,425.4     ¥ 4,318.7  


See the consolidated statements of cash flows in our consolidated financial statements included within this annual report for more detailed information.

For the year ended March 31, 2026, our cash, cash equivalents, restricted cash and restricted cash equivalents decreased by ¥106.7 billion to ¥4,318.7 billion. Net cash of ¥2,095.9 billion was provided by financing activities due to net cash inflows of ¥1,437.8 billion from Net cash inflows from long-term borrowings. Net cash of ¥1,498.9 billion was used in investing activities due to net cash outflows of ¥805.4 billion from Net cash outflows from loans. As part of trading activities, while there were net cash outflows of ¥1,750.6 billion primarily due to an increase in Trading assets and private equity and debt investments, they were offset by net cash inflows of ¥441.2 billion from repo transactions and securities borrowed and loaned transactions such as Securities purchased under agreements to resell, net of securities sold under agreements to repurchase, and Securities borrowed, net of Securities loaned. As a result, net cash of ¥843.0 billion was used in operating activities.

For the year ended March 31, 2025, our cash, cash equivalents, restricted cash and restricted cash equivalents increased by ¥126.4 billion to ¥4,425.4 billion. Net cash of ¥1,679.7 billion was provided by financing activities due to net cash inflows of ¥1,020.9 billion from Net cash inflows from long-term borrowings. Net cash of ¥848.6 billion was used in investing activities due to net cash outflows of ¥538.9 billion from Net cash outflows from loans. As part of trading activities, while there were net cash outflows of ¥2,452.1 billion primarily due to an increase in Trading assets and private equity and debt investments, they were offset by net cash inflows of ¥1,635.0 billion from repo transactions and securities borrowed and loaned transactions such as Securities purchased under agreements to resell, net of securities sold under agreements to repurchase, and Securities borrowed, net of Securities loaned. As a result, net cash of ¥678.6 billion was used in operating activities.


64


Table of Contents

Balance Sheet and Financial Leverage

Total assets as of March 31, 2026, were ¥62,645.9 billion, an increase of ¥5,843.8 billion compared with ¥56,802.2 billion as of March 31, 2025, reflecting primarily an increase in Trading assets. Total liabilities as of March 31, 2026, were ¥58,791.0 billion, an increase of ¥5,569.8 billion compared with ¥53,221.2 billion as of March 31, 2025, reflecting primarily an increase in Long-term borrowings. NHI shareholders’ equity as of March 31, 2026 was ¥3,707.9 billion, an increase of ¥237.0 billion compared with ¥3,470.9 billion as of March 31, 2025, primarily due to an increase in Retained earnings.

We seek to maintain sufficient capital at all times to withstand losses due to extreme market movements. The EMB is responsible for implementing and enforcing capital policies. This includes the determination of our balance sheet size and required capital levels. We continuously review our equity capital base to ensure that it can support the economic risk inherent in our business. There are also regulatory requirements for minimum capital of entities that operate in regulated securities or banking businesses.

As leverage ratios are commonly used by other financial institutions similar to us, we voluntarily provide a leverage ratio and adjusted leverage ratio primarily for benchmarking purposes so that users of this annual report can compare our leverage against other financial institutions. Adjusted leverage ratio is a non-GAAP financial measure that Nomura considers to be a useful supplemental measure of leverage.

The following table presents NHI shareholders’ equity, total assets, adjusted assets and leverage ratios as of March 31, 2025 and 2026.


     Billions of yen, except ratios  
     March 31  
     2025      2026  

NHI shareholders’ equity

   ¥ 3,470.9      ¥ 3,707.9  

Total assets

     56,802.2        62,645.9  

Adjusted assets(1)

     38,138.6        45,096.0  

Leverage ratio(2)

     16.4 x        16.9 x  

Adjusted leverage ratio(3)

     11.0 x        12.2 x  
 
(1)

Represents total assets less Securities purchased under agreements to resell and Securities borrowed. Adjusted assets is a non-GAAP financial measure and is calculated as follows:

(2)

Equals total assets divided by NHI shareholders’ equity.

(3)

Equals adjusted assets divided by NHI shareholders’ equity.


     Billions of yen  
     March 31  
     2025      2026  

Total assets

   ¥  56,802.2      ¥  62,645.9  

Less:


Securities purchased under agreements to resell

     14,004.8        13,210.2  

Securities borrowed

     4,658.8        4,339.7  


Adjusted assets

   ¥ 38,138.6      ¥ 45,096.0  


Total assets increased by 10.3% reflecting primarily an increase in Trading assets. Total NHI shareholders’ equity increased by 6.8% reflecting primarily an increase in Retained earnings. As a result, our leverage ratios were 16.4 times as of March 31, 2025 and 16.9 times as of March 31, 2026.

Adjusted assets increased primarily due to an increase in Trading assets. As a result, our adjusted leverage ratios were 11.0 times as of March 31, 2025 and 12.2 times as of March 31, 2026.


65


Table of Contents

Consolidated Regulatory Capital Requirements

The FSA established the “Guideline for Financial Conglomerates Supervision” (“Financial Conglomerates Guideline”) in June 2005 and set out the rules on consolidated regulatory capital. We started monitoring our consolidated capital adequacy ratio in accordance with the Financial Conglomerates Guideline from April 2005.

The Company has been assigned by the FSA as a Final Designated Parent Company who must calculate a consolidated capital adequacy ratio according to the Capital Adequacy Notice on Final Designated Parent Company in April 2011. Since then, we have been calculating our consolidated capital adequacy ratio according to the Capital Adequacy Notice on Final Designated Parent Company. The Capital Adequacy Notice on Final Designated Parent Company has been revised to be in line with Basel 2.5 and Basel III since then. We have calculated a Basel III-based consolidated capital adequacy ratio from the end of March 2013. Basel 2.5 includes significant change in calculation method of market risk and Basel III includes redefinition of capital items for the purpose of requiring higher quality of capital and expansion of the scope of credit risk-weighted assets calculation.

In accordance with Article 2 of the Capital Adequacy Notice on Final Designated Parent Company, our consolidated capital adequacy ratio is currently calculated based on the amounts of common equity Tier 1 capital, Tier 1 capital (sum of common equity Tier 1 capital and additional Tier 1 capital), total capital (sum of Tier 1 capital and Tier 2 capital), credit risk-weighted assets, market risk and operational risk. As of March 31, 2026, our common equity Tier 1 capital ratio is 12.86%, Tier 1 capital ratio is 15.65% and consolidated capital adequacy ratio is 16.42% and we are in compliance with the requirement for each ratio set out in the Capital Adequacy Notice on Final Designated Parent Company, etc. (required level including applicable minimum consolidated capital buffers as of March 31, 2026 is 7.69% for the common equity Tier 1 capital ratio, 9.19% for the Tier 1 capital ratio and 11.19% for the consolidated capital adequacy ratio).

In accordance with Article 2 of the “Notice of the Establishment of Standards that Indicate Soundness pertaining to Loss-absorbing and Recapitalization Capacity, Established as Criteria by which the Highest Designated Parent Company is to Judge the Soundness in the Management of the Highest Designated Parent Company and its Subsidiary Corporations, etc., under Paragraph 1, Article 57 -17 of the Financial Instruments and Exchange Act” (“TLAC Notification”), we have started calculating our external TLAC ratio on a risk-weighted assets basis from March 2021. As of March 31, 2026, our external TLAC as a percentage of risk-weighted assets is 26.74% and we are in compliance with the requirement set out in the TLAC Notification.

The following table presents the Company’s consolidated capital adequacy ratios and External TLAC as a percentage of risk-weighted assets as of March 31, 2025 and March 31, 2026.


     Billions of yen, except ratios  
     March 31  
     2025     2026  

Common equity Tier 1 capital

   ¥ 3,122.5     ¥ 3,156.8  

Tier 1 capital

     3,499.5       3,842.9  

Total capital

     3,500.1       4,032.2  

Risk-Weighted Assets


Credit risk-weighted assets

     11,561.2       13,793.8  

Market risk equivalent assets

     6,239.2       6,535.7  

Operational risk equivalent assets

     3,696.2       4,214.3  


Total risk-weighted assets

   ¥ 21,496.6     ¥ 24,543.8  


Consolidated Capital Adequacy Ratios


Common equity Tier 1 capital ratio

     14.52     12.86

Tier 1 capital ratio

     16.27     15.65

Consolidated capital adequacy ratio

     16.28     16.42

Consolidated Leverage Ratio

     5.16     5.18

External TLAC Ratios


Risk-weighted assets basis

     28.16     26.74

Leverage ratio exposure measure basis

     9.93     9.91

Since the end of March 2011, we have been calculating credit risk-weighted assets by using the foundation Internal Ratings-Based Approach with the approval of the FSA. In according with Basel III, we have been calculating market risk equivalent assets by using both of the Internal Model Approach and the Standardized Approach, and operational risk equivalent assets by the Standardized Approach since March 2025.


66


Table of Contents

We provide consolidated capital adequacy ratios not only to demonstrate that we are in compliance with the requirements set out in the Capital Adequacy Notice on Final Designated Parent Company but also for benchmarking purposes so that users of this annual report can compare our capital position against those of other financial groups to which Basel III is applied. Our management receives and reviews these capital ratios on a regular basis.

Consolidated Leverage Ratio Requirements

In March 2019, the FSA set out requirements for the calculation and disclosure and minimum requirement of 3% of a consolidated leverage ratio, and the publication of “Notice of the Establishment of Standards for Determining Whether the Adequacy of Leverage, the Supplementary Measure to the Adequacy of Equity Capital of a Final Designated Parent Company and its Subsidiary Corporations, etc. is Appropriate Compared to the Assets Held by the Final Designated Parent Company and its Subsidiary Corporations, etc., under Paragraph 1, Article 57-17 of the Financial Instruments and Exchange Act” (2019 FSA Regulatory Notice No. 13; “Notice on Consolidated Leverage Ratio”), through amendments to revising “Specification of items which a final designated parent company should disclose on documents to show the status of its sound management” (2010 FSA Regulatory Notice No. 132; “Notice on Pillar 3 Disclosure”). We started calculating and disclosing a consolidated leverage ratio from March 31, 2015, in accordance with these Notices. We have also started calculating a consolidated leverage ratio from March 31, 2019, in accordance with the Notice on Pillar 3 Disclosure, Notice on Consolidated Leverage Ratio and other related Notices. In coordination with the monetary policy of the Bank of Japan in response to the impact of the COVID-19 pandemic, the FSA published amendments to the Notice on Consolidated Leverage Ratio on June 2020 and March 2021. Under these amendments, deposits with the Bank of Japan have been excluded from the total exposure measure used to calculate the leverage ratio during the period from June 30, 2020. In July 2022, the FSA published further amendments to the Notice on Consolidated Leverage Ratio to raise the required level of leverage ratio from 3.0% to 3.15% after April 2024, while excluding the outstanding deposits with the Bank of Japan from the exposure measure as set forth in the previous amendment. As of March 31, 2026, our consolidated leverage ratio is 5.18%.

In accordance with Article 2 of the TLAC Notification we have started calculating our external TLAC ratio on a total exposure basis from March 2021. As of March 31, 2026, our external TLAC as a percentage of leverage ratio exposure measure is 9.91% and we are in compliance with the requirement set out in the TLAC Notification.

It is likely that the FSA’s regulation and notice will be revised further to be in line with a series of rules and standards proposed by the Basel Committee, FSB or International Organization of Securities Commissions.

Credit Ratings

We rely on, or utilize, credit ratings on our long-term and short-term debt provided by these credit ratings agencies for unsecured funding and other financing purposes and also for our trading and other business activities. NHI and NSC obtain credit ratings on their long-term and short-term debt from S&P Global Ratings, Moody’s Investors Service, Fitch Ratings, Rating and Investment Information, Inc. and Japan Credit Rating Agency.

On February 17, 2026, S&P Global Ratings changed the Outlook of the Company and NSC from Stable to Positive.

On April 20, 2026, Rating and Investment Information, Inc. changed the Long Term Issuer Rating of the Company from A to A+, the Long Term Issuer Rating of NSC from A+ to AA-, and the Outlook of the Company and NSC from Positive to Stable.

As of April 30, 2026, the credit ratings of the Company and NSC were as follows.


Nomura Holdings, Inc.

   Short-term Debt      Long-term Debt  

S&P Global Ratings

     A-2        BBB+  

Moody’s Investors Service

     —         Baa1  

Fitch Ratings

     F1        A-  

Rating and Investment Information, Inc.

     a-1        A+  

Japan Credit Rating Agency, Ltd.

     —         AA-  

Nomura Securities Co., Ltd.

   Short-term Debt      Long-term Debt  

S&P Global Ratings

     A-2        A-  

Moody’s Investors Service

     P-2        A3  

Fitch Ratings

     F1        A-  

Rating and Investment Information, Inc.

     a-1+        AA-  

Japan Credit Rating Agency, Ltd.

     —         AA-  


67


Table of Contents

(6) Off-Balance Sheet Arrangements

Off-balance sheet entities

In the normal course of business, we engage in a variety of off-balance sheet arrangements with off-balance sheet entities which may have an impact on Nomura’s future financial position and performance.

Off-balance sheet arrangements with off-balance sheet entities include where Nomura has:


an obligation under a guarantee contract;


a retained or contingent interest in assets transferred to an off-balance sheet entity or similar arrangement that serves to provide credit, liquidity or market risk support to such entity;


any obligation, including a contingent obligation, under a contract that would be accounted for as a derivative instrument; or


any obligation, including a contingent obligation, arising out of a variable interest in an off-balance sheet entity that is held by, and material to, us, where such entity provides financing, liquidity, market risk or credit risk support to, or engages in leasing, hedging or research and development services with, us.

Off-balance sheet entities may take the form of a corporation, partnership, fund, trust or other legal vehicle which is designed to fulfill a limited, specific purpose by its sponsor. We both create or sponsor these entities and also enter into arrangements with entities created or sponsored by others.

Our involvement with these entities includes structuring, underwriting, distributing and selling debt instruments and beneficial interests issued by these entities, subject to prevailing market conditions. In connection with our securitization and equity derivative activities, we also act as a transferor of financial assets to these entities, as well as, underwriter, distributor and seller of asset-repackaged financial instruments issued by these entities. We retain, purchase and sell variable interests in SPEs in connection with our market-making, investing and structuring activities. Our other types of off-balance sheet arrangements include guarantee agreements and derivative contracts. Significant involvement is assessed based on all of our arrangements with these entities, even if the probability of loss, as assessed at the balance sheet date, is remote.

For further information about transactions with VIEs, see Note 7 “Securitizations and Variable Interest Entities” in our consolidated financial statements included in this annual report.


68


Table of Contents

(7) Tabular Disclosure of Contractual Obligations

In the ordinary course of our business, we enter into a variety of contractual obligations and contingent commitments, which may require future payments. These arrangements include:

Standby letters of credit and other guarantees:


In connection with our banking and financing activities, we enter into various guarantee arrangements with counterparties in the form of standby letters of credit and other guarantees, which generally have fixed expiration dates.

Long-term borrowings and contractual interest payments:


In connection with our operating activities, we issue Japanese Yen and non-Japanese Yen denominated long-term borrowings which incur variable and fixed interest payments in accordance with our funding policy.

Operating lease commitments:


We lease office space, residential facilities for employees, motor vehicles, equipment and technology assets in the ordinary course of business both in Japan and overseas as lessee. These arrangements predominantly consist of operating leases.


Separately we sublease certain real estate and equipment through operating lease arrangements.

Finance lease commitments:


We lease certain equipment and facilities in Japan and overseas which are classified as finance lease agreements.

Purchase obligations:


We have purchase obligations for goods and services which include payments for construction, advertising, and computer and telecommunications maintenance agreements.

Commitments to extend credit:


In connection with our banking and financing activities, we enter into contractual commitments to extend credit, which generally have fixed expiration dates.


In connection with our investment banking activities, we enter into agreements with clients under which we commit to underwrite securities that may be issued by clients.


As a member of certain central clearing counterparties, Nomura is committed to provide liquidity facilities through entering into reverse repurchase transactions backed by government and government agency debt securities with those counterparties in a situation where a default of another clearing member occurs.

Commitments to invest in partnerships:


We have commitments to invest in interests in various partnerships and other entities and commitments to provide financing for investments related to those partnerships.

Note 9 “Leases” in our consolidated financial statements contains further detail on our operating leases and finance leases. Note 13 “Borrowings” in our consolidated financial statements contains further detail on our short-term and long-term borrowing obligations and Note 22 “Commitments, contingencies and guarantees” in our consolidated financial statements included in this annual report contains further detail on our other commitments, contingencies and guarantees.

The contractual amounts of commitments to extend credit represent the maximum amounts at risk should the contracts be fully drawn upon, should the counterparties default, and assuming the value of any existing collateral becomes worthless. The total contractual amount of these commitments may not represent future cash requirements since the commitments may expire without being drawn upon. The credit risk associated with these commitments varies depending on our clients’ creditworthiness and the value of collateral held. We evaluate each client’s creditworthiness on a case-by-case basis. The amount of collateral obtained, if deemed necessary by us upon extension of credit, is based on management’s credit evaluation of the counterparty.


69


Table of Contents

The following table presents information regarding amounts and timing of our future contractual obligations and contingent commitments as of March 31, 2026.


     Millions of yen  
     Total
contractual
amount
     Years to maturity  
     Less than
1 year
     1 to 3
years
     3 to 5
years
     More than
5 years
 

Standby letters of credit and other guarantees

   ¥ 5,222,432      ¥ 5,189,429      ¥ 18,628      ¥ 11,126      ¥ 3,249  

Long-term borrowings(1)

     14,999,587        1,431,899        3,622,251        3,728,066        6,217,371  

Contractual interest payments(2)

     2,478,604        394,777        647,704        424,169        1,011,954  

Operating lease commitments(3)

     173,162        49,128        65,826        31,733        26,475  

Purchase obligations(4)

     110,732        78,647        17,817        6,623        7,645  

Commitments to extend credit(5)

     2,665,196        1,412,624        591,051        395,454        266,067  

Commitments to invest

     66,952        2,991        382        4,554        59,025  


Total

   ¥ 25,716,665      ¥ 8,559,495      ¥ 4,963,659      ¥ 4,601,725      ¥ 7,591,786  


(1)

The amounts disclosed within long-term borrowings exclude financial liabilities recognized within long-term borrowings as a result of transfers of financial assets that are accounted for as financings rather than sales in accordance with ASC 860 “Transfers and Servicing”. These are not borrowings issued for our own funding purposes and therefore do not represent actual contractual obligations by us to deliver cash.

(2)

The amounts represent estimated future interest payments related to long-term borrowings based on the period through to their maturity and applicable interest rates as of March 31, 2026.

(3)

The amounts of operating lease commitments are undiscounted future minimum lease payments. The amounts of finance lease contracts were immaterial.

(4)

The minimum contractual obligations under enforceable and legally binding contracts that specify all significant terms. Amounts exclude obligations that are already reflected on our consolidated balance sheets as liabilities or payables. Includes the commitment to purchase parts of the redeveloped real estate in Tokyo Nihonbashi district from the redevelopment association.

(5)

Contingent liquidity facilities to central clearing counterparties are included.

Excluded from the above table are obligations that are generally short-term in nature, including short-term borrowings, deposits received at banks and other payables, collateralized agreements and financing transactions (such as reverse repurchase and repurchase agreements), and trading liabilities.

In addition to amounts presented above, we have commitments under reverse repurchase and repurchase agreements including amounts in connection with collateralized agreements and collateralized financing. These commitments amount to ¥4,084 billion for reverse repurchase agreements and ¥2,322 billion for repurchase agreements as of March 31, 2026.

5. Significant Contracts.

Not applicable.


70


Table of Contents

Item 4. Company Information

1. Share Capital Information

(1) Total Number of Shares

A. Number of Authorized Share Capital


Type

   Authorized Share Capital
(shares)
 

Common Stock

     6,000,000,000  

Class 1 Preferred Stock

     200,000,000  

Class 2 Preferred Stock

     200,000,000  

Class 3 Preferred Stock

     200,000,000  

Class 4 Preferred Stock

     200,000,000  


Total

     6,000,000,000  


(Note)

The “Authorized Share Capital” is stated by class and the “Total” is the number of authorized share capital designated in the Articles of Incorporation.


B. Issued Shares


Type

   Number of
Issued Shares as of
March 31, 2025
     Number of
Issued Shares as of
June 23, 2025
    

Trading Markets


Description

Common Stock

     3,088,562,601        3,088,562,601      Tokyo Stock Exchange(2)    1 unit is 100 shares
         Nagoya Stock Exchange(3)   
         Singapore Exchange   
         New York Stock Exchange   


Total

     3,088,562,601        3,088,562,601      —     — 


(1)

Shares that may have increased from exercise of stock options between June 1, 2026 and June 22, 2026 are not included in the number of issued shares as of June 22, 2026.

(2)

Listed on the Prime Market.

(3)

Listed on the Premier Market.

(2) Stock Options

A. Stock Acquisition Right


Name of Stock Acquisition Rights

(“SARs”)

   Allotment
Date
   Number of
SARs
(March 31, 2026)
     Number of
SARs
in the Preceding
Month to Filing
of this Report
(May 31, 2026)
     Period for
the Exercise
of SARs
   Exercise
Price per
Share under
SARs
(yen)
     Capitalization
Price per
Share under
SARs

(yen)
 

SARs No.78

   June 9, 2017      288        —       From April 20, 2021

to April 19, 2026

     1        312  

SARs No.79

   June 9, 2017      680        565      From April 20, 2022

to April 19, 2027

     1        303  

SARs No.80

   June 9, 2017      127        127      From April 20, 2023

to April 19, 2028

     1        282  

SARs No.81

   June 9, 2017      150        150      From April 20, 2024

to April 19, 2029

     1        273  

B. Rights plan

None

C. Other plan

None


71


Table of Contents

(3) Exercises, etc., of moving strike convertible bonds, etc.

None

(4) Changes in Issued Shares, Common Stock, etc.


Date

   Increase/(Decrease)
of Issued Shares
    Total
Issued Shares
     Increase/(Decrease)
of Common Stock
(millions of yen)
     Common Stock
(millions of yen)
     Increase/(Decrease)
of Additional
paid-in capital
(millions of yen)
     Additional
paid-in capital
(millions of yen)
 

June 1, 2023(1)

     (70,000,000     3,163,562,601        —         594,493        —         559,676  

March 2, 2026(1)

     (75,000,000     3,088,562,601        —         594,493        —         559,676  
 
(1)

The decrease is due to the cancellation of treasury stock.

(5) Shareholders


     As of March 31, 2026  
     Unit Shareholders (100 shares per 1 unit)         
                                 Foreign Shareholders                       
     Governments
and
Municipal
Governments
     Financial
Institutions
     Securities
Companies
     Other
Corporations
     Other than
individuals
     Individuals      Individuals
and
Others
     Total      Shares
Representing
Less than
One Unit
(Shares)
 

Number of Shareholders

     1        136        79        2,638        1,010        710        295,735        300,309        —   

Number of Units Held

     30        7,482,441        1,512,977        892,890        12,070,276        13,674        8,897,944        30,870,232        1,539,401  

Percentage of Units Held (%)

     —         24.24        4.90        2.89        39.10        0.04        28.82        100.00        —   
 
(1)

Out of 186,846,208 shares of treasury stock, 1,868,462 units are included in Individuals and Others while 8 shares are in Shares Representing Less than One Unit (Shares).

(2)

Other Corporations includes 20 units held by Japan Securities Depository Center, Inc.


72


Table of Contents

(6) Major Shareholders


          As of March 31, 2026  

Name


Address

   Shares Held
(thousand
shares)
     Percentage of
Issued Shares
(%)
 

The Master Trust Bank of Japan, Ltd. (Trust Account)

   1-8-1, Akasaka, Minato-Ku, Tokyo, Japan      482,524        16.62  

Custody Bank of Japan, Ltd. (Trust Account)

   1-8-12, Harumi, Chuo-Ku, Tokyo, Japan      155,108        5.34  

State Street Bank And Trust Company 505001

   ONE CONGRESS STREET, SUITE 1, BOSTON, MASSACHUSETTS      88,304        3.04  

The Bank of New York Mellon as Depositary Bank for DR Holders

   240 Greenwich Street, 8TH FL West, New York, NY 10286, U.S.A.      79,924        2.75  

JPMorgan Securities Japan Co., Ltd.

   2-7-3, Marunouchi, Chiyoda-Ku, Tokyo, Japan      51,361        1.77  

JP Morgan Chase Bank 385781

   25 BANK STREET, CANARY WHARF, LONDON, E14 5JP, UNITED KINGDOM      43,207        1.48  

Goldman Sachs Japan Co. Ltd. BNYM

   2-6-1, Toranomon, Minato-Ku, Tokyo, Japan      34,407        1.18  

The Nomura Trust and Banking Co., Ltd. (Trust Account)

   2-2-2, Otemachi, Chiyoda-Ku, Tokyo, Japan      32,425        1.11  

State Street Bank And Trust Company 505103

   ONE CONGRESS STREET, SUITE 1, BOSTON, MASSACHUSETTS      27,835        0.95  

JP Morgan Chase Bank 385642

   25 BANK STREET, CANARY WHARF, LONDON, E14 5JP, UNITED KINGDOM      27,113        0.93  


Total

        1,022,208        35.17  


(1)

The Company has 186,846 thousand shares of treasury stock as of March 31, 2026 which is not included in the Major Shareholders list above.

(2)

For Shares Held in the above, amounts less than thousand shares are discarded.

(3)

According to a statement on Schedule 13G (Amendment No.11) filed by BlackRock, Inc. with the SEC on April 23, 2025, BlackRock, Inc. owned 227,858,398 shares, representing 7.20% of the issued shares of NHI shares. However, the Company has not confirmed the status of these shareholdings as of March 31, 2026 which is not included in the Major Shareholders list above.


          As of March 31, 2025  

Name


Address

   Shares Held
(thousand
shares)
     Percentage of
Issued Shares
(%)
 

BlackRock, Inc.

   50 Hudson Yards New York, NY 10001      227,858         7.20  


(4)

According to a statement on Schedule 13G (Amendment No.5) filed by Sumitomo Mitsui Trust Group, Inc. with the SEC on February 5, 2026, Sumitomo Mitsui Trust Group, Inc. owned 155,735,902 shares, representing 4.90% of the issued shares of NHI shares. However, the Company has not confirmed the status of these shareholdings as of March 31, 2026 which is not included in the Major Shareholders list above.


          As of March 31, 2026  

Name


Address

   Shares Held
(thousand
shares)
     Percentage of
Issued Shares
(%)
 

Sumitomo Mitsui Trust Group, Inc.

   1-4-1, Marunouchi, Chiyoda-Ku, Tokyo, Japan      155,735         4.90  


73


Table of Contents

(7) Voting Rights

A. Outstanding Shares


     As of March 31, 2026
   Number of Shares      Number of Votes      Description

Stock without voting right

       —         —       — 

Stock with limited voting right (Treasury stock, etc.)

       —         —       — 

Stock with limited voting right (Others)

       —         —       — 

Stock with full voting right (Treasury stock, etc.)


(Treasury stock)

Common stock


    186,846,200        —       — 
    

(Crossholding shares)

Common stock


    1,438,500        —       — 

Stock with full voting right (Others)

     Common stock       2,898,738,500        28,987,385      — 

Shares less than 1 unit

     Common stock       1,539,401        —       Shares less than 1 unit

(100 shares)


Total Shares Issued

       3,088,562,601        —       — 


Voting Rights of Total Shareholders

       —         28,987,385      — 


(1)

Stock with full voting right (Others) includes 2,000 shares held by Japan Securities Depository Center, Inc. Shares less than 1 unit includes 8 shares of treasury stock.

B. Treasury Stock


Name

   Address    As of March 31, 2026  
   Directly
held
shares
     Indirectly
held
shares
     Total      Percentage of
Issued Shares
(%)
 

(Treasury stock)
Nomura Holdings, Inc.

   1-13-1, Nihonbashi, Chuo-Ku,

Tokyo, Japan

     186,846,200        —         186,846,200        6.04  


Total

   —       186,846,200        —         186,846,200        6.04  


(1)

In addition to the above, 1,438,500 shares are directly held by a subsidiary of the Company for the purpose of securities related business.


74


Table of Contents

(8) Restricted Stock Units and Performance Share Units


Series of RSUs

   Grant date      Number of
RSUs
(March 31, 2026)
     Number of RSUs
in the Preceding Month
to Filing of this Report
(May 31, 2026)
     Period of payment  

RSU No.14

     2019.5.16        47,400        —         2026.4.20~2026.5.19  

RSU No.20

     2020.5.27        179,800        —         2026.4.20~2026.5.19  

RSU No.21

     2020.5.27        179,400        179,400        2027.4.20~2027.5.19  

RSU No.26

     2021.5.17        1,346,600        —         2026.4.20~2026.5.19  

RSU No.27

     2021.5.17        123,600        123,600        2027.4.20~2027.5.19  

RSU No.28

     2021.5.17        123,400        123,400        2028.4.20~2028.5.19  

RSU No.32

     2022.5.19        3,029,400        —         2026.4.20~2026.5.19  

RSU No.33

     2022.5.19        1,531,000        1,531,000        2027.4.20~2027.5.19  

RSU No.34

     2022.5.19        172,800        172,800        2028.4.20~2028.5.19  

RSU No.35

     2022.5.19        172,600        172,600        2029.4.20~2029.5.19  

RSU No.38

     2023.5.15        22,373,600        —         2026.4.20~2026.5.19  

RSU No.39

     2023.5.15        3,068,200        3,058,200        2027.4.20~2027.5.19  

RSU No.40

     2023.5.15        1,491,000        1,491,000        2028.4.20~2028.5.19  

RSU No.41

     2023.5.15        206,000        206,000        2029.4.20~2029.5.19  

RSU No.42

     2023.5.15        205,600        205,600        2030.4.20~2030.5.19  

RSU No.44

     2024.5.16        14,269,615        —         2026.4.20~2026.5.19  

RSU No.45

     2024.5.16        14,339,630        14,298,030        2027.4.20~2027.5.19  

RSU No.46

     2024.5.16        1,948,300        1,944,800        2028.4.20~2028.5.19  

RSU No.47

     2024.5.16        1,030,000        1,030,000        2029.4.20~2029.5.19  

RSU No.48

     2024.5.16        135,000        135,000        2030.4.20~2030.5.19  

RSU No.49

     2024.5.16        134,800        134,800        2031.4.20~2031.5.19  

RSU No.50

     2025.5.15        16,351,485        —         2026.4.20~2026.5.19  

RSU No.51

     2025.5.15        16,284,185        16,204,985        2027.4.20~2027.5.19  

RSU No.52

     2025.5.15        16,420,000        16,341,300        2028.4.20~2028.5.19  

RSU No.53

     2025.5.15        2,608,700        2,602,400        2029.4.20~2029.5.19  

RSU No.54

     2025.5.15        1,466,800        1,466,800        2030.4.20~2030.5.19  

RSU No.55

     2025.5.15        202,200        202,200        2031.4.20~2031.5.19  

RSU No.56

     2025.5.15        201,600        201,600        2032.4.20~2032.5.19  

RSU No.57

     2026.1.16        2,210,539        2,191,488        2027.4.20~2027.5.19  

RSU No.58

     2026.1.16        1,654,297        1,644,064        2028.4.20~2028.5.19  

RSU No.59

     2026.1.16        616,928        614,264        2029.4.20~2029.5.19  

RSU No.60

     2026.1.16        25,089        25,089        2030.4.20~2030.5.19  

RSU No.61

     2026.1.16        577,803        575,468        2027.1.20~2027.2.28  

RSU No.62

     2026.1.16        577,764        575,430        2028.1.20~2028.2.28  

RSU No.63

     2026.1.16        577,690        575,358        2029.1.20~2029.2.28  

RSU No.64

     2026.5.14        —         8,510,800        2027.4.20~2027.5.19  

RSU No.65

     2026.5.14        —         8,431,100        2028.4.20~2028.5.19  

RSU No.66

     2026.5.14        —         8,354,100        2029.4.20~2029.5.19  

RSU No.67

     2026.5.14        —         1,848,200        2030.4.20~2030.5.19  
 
(1)

Since the contents at the end of May are the same as those at the end of March, except for the number of RSUs, the description is

omitted.


75


Table of Contents

Series of PSUs

   Grant date      Number of
PSUs(2)
(March 31, 2026)
     Number of PSUs
in the Preceding Month
to Filing of this Report
(May 31, 2026)
     Period of payment  

PSU No.1

     2024.5.16        1,173,200        1,173,200        2027.4.20~2027.9.30  

PSU No.2

     2025.5.15        1,154,500        1,154,500        2028.4.20~2028.9.30  

PSU No.3

     2026.5.14        —         811,500        2029.4.20~2029.9.30  
 
(2)

The above number of shares represents the maximum number of shares to be allocated (150% of the base number of shares), calculated based on the base numbers of 782,100, 769,600 and 541,000 shares for the PSU No.1, No.2 and No.3, respectively. These numbers may decrease depending on the actual achievement of the performance targets.

See “4. Status of Corporate Governance and Other” for detail of the plan.


76


Table of Contents

2. Stock Repurchase


Type of Stock     Repurchase of the common stock in accordance with provisions of Articles 155-3 and 155-7 of the Companies Act.

(1) Stock Repurchase resolved by Shareholders’ Meeting

None

(2) Stock Repurchase resolved by Board of Directors


     Number of Shares      Total Amount
(Yen)
 

Resolution at the Board of Directors (April 25, 2025)

(Purchase period from May 15, 2025 to December 30, 2025)

     100,000,000        60,000,000,000  

Stock repurchased prior to April 1, 2025

     —         —   

Stock repurchased from April 1, 2025 to March 31, 2026

     66,790,900        59,999,913,930  

Total shares and amounts resolved

     33,209,100        86,070  

Percentage not repurchased at year end (%)

     33.2        0.0  

Stock repurchased during the period

     —         —   

Percentage not repurchased at the date of submission of this annual report (%)

     33.2        0.0  
     Number of Shares      Total Amount
(Yen)
 

Resolution at the Board of Directors (January 30, 2026)

(Purchase period from February 17, 2026 to September 30, 2026)

     100,000,000        60,000,000,000  

Stock repurchased prior to April 1, 2025

     —         —   

Stock repurchased from April 1, 2025 to March 31, 2026

     32,551,600        41,478,448,300  

Total shares and amounts resolved

     67,448,400        18,521,551,700  

Percentage not repurchased at year end (%)

     67.4        30.9  

Stock repurchased during the period

     14,309,600        18,521,431,000  

Percentage not repurchased at the date of submission of this annual report (%)

     53.1        0.0  

(3) Stock Repurchase not based on above (1) or (2)


     Number of Shares      Total Amount
(Yen)
 

Stock repurchased during the year ended March 31, 2026(1)

     18,649        20,712,371  

Stock repurchased during the period(2)

     1,599        2,060,512  
 
(1)

Acceptance of requests for purchasing less-than-a-full-unit-shares.

(2)

Repurchases from June 1, 2026 to the reporting date of this annual report are not included.

(4) Disposal and retention of repurchased stock


     Year ended March 31, 2026      Stock repurchased during the period(2)  
     Number of
shares
     Total amount of
disposal
(yen)
     Number of
shares
     Total amount of
disposal
(yen)
 

Treasury shares disposed subject to procedures for issuance of new shares

     —         —         —         —   

Treasury shares cancelled

     75,000,000        57,665,917,500        —         —   

Treasury shares transferred upon merger, share exchange, share delivery or demerger

     —         —         —         —   

Others(1)

     44,489,425        32,417,881,856        35,565,642        24,627,549,390  

Treasury stock

     186,846,208        —         165,591,765        —   
 
(1)

Others are for purchasing less-than-a-full-unit-shares and disposal for exercise of stock acquisition rights and allotment of RSU.

(2)

Repurchases or disposals and allotments from June 1, 2026 to the reporting date of this annual report are not included.


77


Table of Contents

3. Dividend Policy

We seek to enhance shareholder value and to capture growing business opportunities by maintaining sufficient levels of capital. We will continue to review our levels of capital as appropriate, taking into consideration the economic risks inherent to operating our businesses, the regulatory requirements, and maintaining our ratings necessary to operate businesses globally.

We believe that raising corporate value over the long term and paying dividends is essential to rewarding shareholders.

We will strive to pay dividends using a consolidated pay-out ratio of at least 40% of each semi-annual consolidated earnings as a key indicator. Dividend payments are determined taking into account a comprehensive range of factors such as, trends in domestic and international regulatory developments, including Basel regulations, as well as the Company’s consolidated financial performance.

Dividends will in principle be paid on a semi-annual basis with record dates of September 30 and March 31.

Additionally, we will aim for a total payout ratio, which includes dividends and share buybacks, of at least 50%.

With respect to retained earnings, in order to implement measures to adapt to regulatory changes and to increase shareholder value, we seek to efficiently invest in business areas where high profitability and growth may reasonably be expected, including the development and expansion of infrastructure such as IT systems and retail branches.

(Dividends for the year ended March 31, 2026)

Based on the dividend policy described above, we paid a dividend of ¥27 per share to shareholders of record as of September 30, 2025 and a dividend of ¥24 per share to shareholders of record as of March 31, 2026. As a result, the total annual dividend was ¥51 per share.

The details of dividends from retained earnings for the year ended March 31, 2026 are as follows.


Decision date

   Record date    Total dividend value
(millions of yen)
     Dividend per share
(yen)
 

Board of Directors October 28, 2025

   September 30, 2025      79,218        27.00  

Board of Directors April 24, 2026

   March 31, 2026      69,641        24.00  


78


Table of Contents

4. Status of Corporate Governance and Other

(1) Status of Corporate Governance

Underlying Concept of Corporate Governance

The Company recognizes that enhancement of corporate governance is one of the top priorities for the Company to achieve its management vision “to enhance corporate value by deepening society’s trust in the firm and increasing the satisfaction of stakeholders, including that of shareholders and clients.” On this basis, the Company is committed to strengthening and improving its governance framework which ensures the effectiveness of management oversight and transparency in the Company’s management and at the same time pursues sustainable growth and expedited decision-making processes within the Nomura Group.

The Company, recognizing the perspectives of various stakeholders including shareholders and clients, established the “Nomura Holdings Corporate Governance Guidelines” for the purpose of setting forth an effective corporate governance framework as a structure for transparent/fair and timely/decisive decision-making, and contributing to the realization of that.

The “Nomura Holdings Corporate Governance Guidelines” can be accessed from the Company’s website.

(https://www.nomuraholdings.com/en/company/cg/main/04/teaserItems1/03/linkList/00/link/cg_guideline.pdf)

In addition, the Company has established the “Nomura Group Code of Conduct” (“the Code of Conduct”) as a code of conduct to be observed by each director, officer and employee of the Nomura Group. This is a guideline for Nomura Group directors, officers and employees to translate the Nomura Group Corporate Philosophy into actions. All of our business activities are carried out based on the Code of Conduct, and through thorough compliance with the Code of Conduct, we endeavor to fulfill the various responsibilities in relation to, not only shareholders, but to various stakeholders.

The “Nomura Group Code of Conduct” can be accessed from the Company’s website.

(https://www.nomuraholdings.com/en/company/basic/main/04/teaserItems2/00/linkList/0/link/coc.pdf)

Summary of the Corporate Governance Structure and Reasons for Adopting such Structure

The Company is a Company with Three Board Committees. The Company has determined that the Company with Three Board Committees structure is the most suitable form of corporate governance at this point in time for the reasons below.

A Company with Three Board Committees establishes Nomination, Audit and Compensation Committees, which are each to be comprised of a majority of outside directors, and in addition to striving to enhance management oversight and improve transparency by separating management oversight and business execution functions, it is a structure that makes it possible to strive to expedite the decision-making process by broadly delegating authority for the execution of business functions from the Board of Directors to the executive officers. Further, the Company believes that a Company with Three Board Committees is the most compatible with the corporate governance standards which form a part of the NYSE (which the Company is listed on) Listed Company Manual.

The following is an outline of the Company’s corporate governance structure:

<The Board of Directors and Committees>

At the Company, which is a Company with Three Board Committees where management oversight and business execution functions are institutionally separated, in addition to the Board of Directors and the Nomination/Audit/Compensation committees, which are the three statutory committees, both the “Board Risk Committee”, which is a committee that has the purpose of deepening the oversight of risk management by the Board of Directors and the “Outside Directors Meeting” for having Outside Directors periodically engage in discussions regarding matters concerning the Company’s business and corporate governance, have been established.

The main role of the Company’s Board of Directors is management oversight and the purpose of the Board of Directors of the Company is to strive for the Company’s sustainable growth and maximization of corporate value over the mid to long-term. The Board of Directors, in addition to ensuring the fairness and transparency of the management, determines the “Fundamental Management Policy,” and appointments of executive officers that manage the Company such as the Group CEO and important business execution decisions are made based on such policy.

The Board of Directors of the Company, to enable active discussion from diversified perspectives, consists of members with diversity, such as in gender, international experience and work experience, and with expertise in areas such as accounting, corporate management, and law, etc., as a general rule. Further, for the appropriate exercise of the Board of Directors’ management oversight functions, there is a general rule that the majority of the Board of Directors must be Outside Directors.


79


Table of Contents

Eight out of the current twelve directors of the Company’s Board of Directors are outside directors, and out of the eight outside directors, there is a diverse composition of four non-Japanese directors and three female directors. Further, the current twelve directors of the Company’s Board of Directors are composed of members with expertise and experience, in areas such as management, global, financial industry, accounting/finance, legal systems/regulations, internal control including risk management, digital / IT / DX, and sustainability. In particular, because of the expansion of the U.S. business, directors with an extensive understanding of the U.S. financial industry, macro economy, and regulatory environment have been appointed. Moreover, in consideration of factors including the geographical distribution of directors, in addition to the appointment of a director well-versed in finance from Asia, in view of the importance of the global managerial knowledge, a director who is an executive of a Japanese company that is engaged in global business development has been appointed.

The Board of Directors of the Company is chaired by a director who is not concurrently serving as an executive officer, allowing the Board of Directors to concentrate on overseeing the business conducted by the executive officers. Further, with respect to each of the Nomination/Audit/Compensation/Board Risk committee, by having outside directors serve as chair, independence from the management has been made even clearer.


80


Table of Contents

The current composition of the Board of Directors and Committees of the Company

(As of the submission date of the Annual Securities Report pursuant to the Financial Instruments and Exchange Act for the fiscal year ended March 31, 2026)


Position and Name


Committees

Chairman of the Board of Directors Koji Nagai   
Director, Representative Executive Officer, President and Group CEO Kentaro Okuda   
Director, Representative Executive Officer and Deputy President Yutaka Nakajima   
Director Shoji Ogawa   

Member of the Audit Committee (Full-Time)

Member of the Board Risk Committee

Outside Director Victor Chu    Member of the Audit Committee
Outside Director J. Christopher Giancarlo    Member of the Board Risk Committee
Outside Director Patricia Mosser    Chairperson of the Board Risk Committee
Outside Director Takahisa Takahara   

Member of the Nomination Committee

Member of the Compensation Committee

Outside Director Miyuki Ishiguro   

Member of the Nomination Committee

Member of the Compensation Committee

Member of the Board Risk Committee

Outside Director Masahiro Ishizuka    Chairman of the Audit Committee
Outside Director Taku Oshima   

Chairman of the Nomination Committee

Chairman of the Compensation Committee

Outside Director Nellie Liang    Member of the Board Risk Committee

The Company has proposed an agenda item titled “Appointment of Eleven Directors” as part of the agenda (Matter to be Resolved) for the Annual General Meeting of Shareholders scheduled to be held on June 23, 2026. If this agenda item is approved, the members of the Board of Directors committees will be as follows.

The following items include the matters for the resolution of the Board of Directors to be resolved immediately after the Annual General Meeting of Shareholders.


Position and Name


Committees

Chairman of the Board of Directors Koji Nagai   
Director, Representative Executive Officer, President and Group CEO Kentaro Okuda   
Director, Representative Executive Officer and Deputy President Yutaka Nakajima   
Director Shoji Ogawa   

Member of the Audit Committee (Full-Time)

Member of the Board Risk Committee

Outside Director Victor Chu    Member of the Audit Committee
Outside Director Patricia Mosser    Chairperson of the Board Risk Committee
Outside Director Takahisa Takahara   

Member of the Nomination Committee

Member of the Compensation Committee

Outside Director Miyuki Ishiguro   

Member of the Nomination Committee

Member of the Compensation Committee

Member of the Board Risk Committee

Outside Director Masahiro Ishizuka    Chairman of the Audit Committee
Outside Director Taku Oshima   

Chairman of the Nomination Committee

Chairman of the Compensation Committee

Outside Director Nellie Liang

   Member of the Board Risk Committee


81


Table of Contents

The Board of Directors of the Company has been held not less frequently than quarterly. Eleven meetings in total were held during the fiscal year ended March 31, 2026.

Attendance record of each Director at meetings of the Board of Directors held during the fiscal year ended March 31, 2026

(As of March 31, 2026)


Position and Name


Attendance Record

(Year ended March 31, 2026)

Chairman of the Board of Directors Koji Nagai    11/11 meetings
Director, Representative Executive Officer, President and Group CEO Kentaro Okuda    11/11 meetings
Director, Representative Executive Officer and Deputy President Yutaka Nakajima    10/11 meetings
Director Shoji Ogawa    11/11 meetings
Outside Director Victor Chu    10/11 meetings
Outside Director J. Christopher Giancarlo    10/11 meetings
Outside Director Patricia Mosser    11/11 meetings
Outside Director Takahisa Takahara    11/11 meetings
Outside Director Miyuki Ishiguro    11/11 meetings
Outside Director Masahiro Ishizuka    11/11 meetings
Outside Director Taku Oshima    11/11 meetings

Outside Director Nellie Liang


9/9 meetings

(the number of meetings held after her appointment)

Specific deliberations of the Board of Directors of the Company for the fiscal year ended March 31, 2026

The Board of Directors received regular reports from the executive side on specific areas such as sustainability in addition to overall business execution. The Board of Directors discussed important issues such as management strategies, divisional strategies and information disclosure, etc. The summaries of discussions are as follows.


Key Deliberations
Future Strategies of Wealth Management Division    Current situation, initiatives to secure and develop human resources to achieve the management vision, business expansion with emerging-wealth clients through workplace channels, and behavior change of partners through the use of technology, etc.
Future Strategies of Investment Management Division    Current situation, provision of investment solutions to achieve the management vision, and expansion of private and real assets, etc.
Future Strategies of Wholesale Division    Current situation, platform management and operating model to achieve the management vision, expansion and strengthening of the customer base, and pursuit of growth opportunities in new areas, etc.
Business Strategies of Banking Division    Current situation, customer acquisition initiatives to achieve the management vision, development of products and services, progress on deposit sweep services, etc.
FY2026/27 Budget and Business Strategy    Approach to the budget planning and business strategies of each Division, etc.
Acquisition and Integration of Macquarie’s U.S. and European Public Asset Management Business    Strategic rationale for the acquisition, future branding strategy, management structure, direction for integration, reaction from investors and the market, and contribution to profitability, etc.
Action to implement management that is conscious of cost of capital and stock price    Nomura’s cost of equity, management vision for 2030, initiatives to improve corporate value (PBR), and disclosures in the Nomura Report 2025, etc.


82


Table of Contents
CET1 Ratio Target Range    Background to setting the target range, impact of the finalization of Basel III, and comparison with peers, etc.
Progress on Response of the Incidents    Progress on measures to prevent recurrence of penalty payment cases and response measures regarding former employee incident, etc.
Unauthorized Transactions due to Fraudulent Phishing and Related Acts    Response status, security measures to prevent fraudulent transactions, and policy on compensation for damages and future course of measures, etc.
Dialogues with Shareholders    Status of the dialogues with shareholders, results of exercising voting rights, initiatives to enhance engagement, including involvement by outside directors, and future course of action, etc.
Investor Day    Progress toward the management vision, and business growth strategy toward 2030, etc.
Business Environment in AEJ    Status of each business in AEJ, future developments and growth strategies, etc.
Sustainability Related Report    Identification and disclosure of materiality, relationship to our Purpose, etc.
Report of Investment Securities Committee    Status of holdings of Investment Securities, and future reduction target, etc.
2025 Nomura Group Employee Survey Results and Countermeasures    Employee survey results, regional differences, and future action plans to address identified issues, etc.
Report on the Board Effectiveness Evaluation    Initiatives for enhancing the Board effectiveness implemented in FY2025/26, etc. (*)
 
(*)

Concerning matters regarding the Board Effectiveness Evaluation, discussions were also held at Outside Directors Meetings in addition to the Board of Directors. The latest result of the Board Effectiveness Evaluation is disclosed at “Corporate Governance Report” of the Company.

(URL)https://www.nomuraholdings.com/en/company/cg/main/04/teaserItems1/03/linkList/01/link/cg_report.pdf


83


Table of Contents

The roles and the status of the activities of each Committee are as follows:

(1) Nomination Committee

This Committee is a statutory organ which determines the details of any proposals concerning the election and dismissal of Directors to be submitted to general meetings of shareholders. The three members of the Committee are elected by the Board of Directors. At the Nomination Committee, concerning the Group CEO Succession Plan, work is being done for the further development of governance by carrying out activities such as discussions concerning topics such as qualifications and potential candidates that should be sought on the basis of the management environment from now on.

The Committee has been held not less frequently than annually as necessary. Six meetings in total were held during the fiscal year ended March 31, 2026.

Attendance record of each Director at meetings of the Nomination Committee held during the fiscal year ended March 31, 2026

(As of March 31, 2026)


Positions and Name


Attendance Record

(Year ended March 31, 2026)

Member of the Nomination Committee (Chairman)    Outside Director Taku Oshima    6/6 meetings
Member of the Nomination Committee    Outside Director Takahisa Takahara    6/6 meetings
Member of the Nomination Committee    Outside Director Miyuki Ishiguro   

5/5 meetings

(the number of meetings held after her appointment)

Specific deliberations of the Nomination Committee of the Company for the fiscal year ended March 31, 2026


Key Deliberations    
Succession Plan for Group CEO   

Discussions on the succession plan for the Group CEO


Report to the Committee from the executive side and discussions on the Group CEO qualifications based on factors such as the management environment and the key process of the succession plan

 
Determination of Outside Director Nominees   

Discussions on the determination of outside director nominees


The following points were taken into consideration when determining the nominees


The composition of the Board of Directors shall have diversity from perspectives such as gender, international experience and work experience.


The majority of the Board of Directors shall be outside directors to perform its management oversight function appropriately


Nominees shall satisfy the independence criteria for outside directors as a general rule


Nominees shall include experts in accounting, corporate management and law, etc.


The criteria for the number of concurrent director/statutory auditor/executive officer positions of other publicly listed companies held by an outside director (no more than three companies for an outside director in addition to the Company as a general rule) should be satisfied.

 
Determination of Inside Director Nominees   

Discussions on the determination of inside director nominees


The following point was taken into consideration in determining the nominees


The Board of Directors shall appoint a director who does not concurrently serve as an executive officer and who is well-versed in the business of the Nomura Group as a full-time member of the Audit Committee or an audit mission director, in order to enhance the effectiveness of the Audit Committee’s audits.


84


Table of Contents

(2) Audit Committee

This Committee is a statutory organ which (i) audits the execution by the directors and executive officers of their duties and prepares audit reports and (ii) determines the details of proposals concerning the election, dismissal, and non-reappointment of the independent auditors to be submitted to general meetings of shareholders. The three members of the Committee are elected by the Board of Directors. All members satisfy requirements for independence as defined in the U.S. Sarbanes-Oxley Act of 2002, and Masahiro Ishizuka is Financial Expert under this Act and has a considerable degree of knowledge in the areas of finance and accounting.

Attendance record of each Director at meetings of the Committee held during the fiscal year ended March 31, 2026

(As of March 31, 2026)


Position and Name


Attendance Record

(Year ended March 31, 2026)

Member of the Audit Committee (Chairman)   Outside Director Masahiro Ishizuka    13/13 meetings
Member of the Audit Committee   Outside Director Victor Chu    12/13 meetings
Member of the Audit Committee (Full-time)   Director (Non-Executive) Shoji Ogawa    13/13 meetings

The status of the activities of the Committee is stated in the section entitled “Item 4. Company Information 4. Status of Corporate Governance and Other (3) Status of audit.”

(3) Compensation Committee

This Committee is a statutory organ which determines the Company’s policy with respect to the determination of the details of directors’ and executive officer’s compensation. The Committee also determines the details of each director and executive officer’s actual compensation. The three members of the Committee are elected by the Board of Directors.

The Committee has been held not less frequently than annually as necessary. Five meetings in total were held during the fiscal year ended March 31, 2026.

Attendance record of each Director at meetings of the Committee held during the fiscal year ended March 31, 2026

(As of March 31, 2026)


Position and Name


Attendance Record

(Year ended March 31, 2026)

Member of the Compensation Committee (Chairman)    Outside Director Taku Oshima    5/5 meetings
Member of the Compensation Committee    Outside Director Takahisa Takahara    5/5 meetings
Member of the Compensation Committee    Outside Director Miyuki Ishiguro   

4/4 meetings

(the number of meetings held after her appointment)

Specific deliberations of the Committee are stated in the section entitled “Item 4. Company Information 4. Status of Corporate Governance and Other (4) Compensation of Statutory Officers.”


85


Table of Contents

(4) Board Risk Committee

This Committee is a non-statutory organ of which purpose is to assist the Board of Directors in supervising Nomura Group’s risk management and to contribute to sophistication of the risk management. The five members of the Committee are elected by the Board of Directors.

The Committee has been held not less frequently than four times a year as necessary. Five meetings in total were held during the fiscal year ended March 31, 2026.

Attendance record of each Director at meetings of the Board Risk Committee held during the fiscal year ended March 31, 2026

(As of March 31, 2026)


Position and Name


Attendance Record

(Year ended March 31, 2026)

Member of the Board Risk Committee (Chairperson)    Outside Director Patricia Mosser    5/5 meetings
Member of the Board Risk Committee    Outside Director J. Christopher Giancarlo    4/5 meetings
Member of the Board Risk Committee    Outside Director Miyuki Ishiguro    5/5 meetings
Member of the Board Risk Committee    Outside Director Nellie Liang    5/5 meetings
Member of the Board Risk Committee    Director (Non-Executive) Shoji Ogawa    5/5 meetings

Specific deliberations of the Committee for the fiscal year ended March 31, 2026


Key Deliberations
Risk Appetite    Regular Review of Risk Appetite and Revision of the Risk Appetite Statement
Enhance and Strengthen Risk Management    Enhancement of Information Technology and Information Security Risk Management, Enhancement of Liquidity Risk Management, Further embedding of Three Lines of Defense Risk Management Framework
Top Risks / Emerging Risks    Risk outlook, strategies and stress analysis for the risks with a high potential to significantly impact the company’s management strategy and finance
Regulatory Compliance    Status update post Basel III implementation
 
(*)

For details of the Company’s risk management activities based on these deliberations are stated in the section entitled “Item 4. Company Information 4. Status of Corporate Governance and Other (1) Status of Corporate Governance Establishment of Risk Management Framework.”

<Business Execution Framework>

As a Company with Three Board Committees, the Board of Directors has, to the extent permitted by laws and regulations, delegated to the Executive Officers decision making authority for business execution functions to ensure that the Executive Officers can execute the Company’s business with speed and efficiency. Among the matters delegated to the Executive Officers by resolutions adopted by the Board of Directors, the most important matters of business must be decided upon deliberation by specific management bodies within the Company including the Executive Management Board, the Group Risk Management Committee, the Nomura Group Conduct Committee and the Sustainability Committee. The Board of Directors is to receive reports on the status of the deliberations at the Executive Management Board, etc. by each management body as appropriate.

The roles and composition of each management body are as follows:

(1) Executive Management Board

This Board is chaired by Kentaro Okuda, the Representative Executive Officer, President, and the Group CEO, and also consists of the Executive Officers and any persons designated by the Representative Executive Officer, President, and the Group CEO. It deliberates and determines management strategies, business plans, budgets, allocation of management resources, and other important matters related to the management of the Nomura Group.


86


Table of Contents

(2) Group Risk Management Committee

This Committee is chaired by Kentaro Okuda, the Representative Executive Officer, President, and the Group CEO, and also consists of one representative executive officer other than the Representative Executive Officer, President, and the Group CEO appointed by the Chairman, the Chief Compliance Officer (CCO), Chief Risk Officer (CRO), Chief Financial Officer (CFO), Division Heads (responsible for execution of business in each division) and any persons designated by the Chairman. The Executive Management Board has delegated authority to the Committee to deliberate and determine important matters concerning enterprise risk management of the Nomura Group.

(3) Nomura Group Conduct Committee

This Committee is chaired by Kentaro Okuda, the Representative Executive Officer, President, and the Group CEO, and also consists of any persons designated by the Representative Executive Officer, President, and the Group CEO. It deliberates necessary matters concerning compliance and conduct risk management within the Nomura Group and deliberates and determines necessary matters to embed the “Nomura Group Code of Conduct.”

(4) Sustainability Committee

This Committee is chaired by Kentaro Okuda, the Representative Executive Officer, President, and the Group CEO, and also consists of any persons designated by the Representative Executive Officer, President, and the Group CEO. It deliberates and determines matters such as the strategy in relation to promoting sustainability in the Nomura Group.

In order to further bolster the Company’s business execution framework for financial operations that are becoming increasingly sophisticated and specialized, the Company utilizes a system whereby the Executive Officers delegate a part of their authority for business execution decisions to Senior Managing Directors, who focus on individual business and operations.


87


Table of Contents

Corporate Governance System

(As of the submission date of the Annual Securities Report pursuant to the Financial Instruments and Exchange Act for the fiscal year ended March 31, 2026)


LOGO

(After the resolution of the Board of Directors following the conclusion of the Annual General Meeting of Shareholders scheduled to be held on June 23, 2026)


LOGO


88


Table of Contents

Status of the Internal Controls System and Status of the Internal Controls System of the Subsidiaries

The Company is committed to strengthening and improving its internal controls system in order to promote proper corporate behavior throughout the Nomura Group, from the viewpoints of ensuring management transparency and efficiency, complying with laws and regulations, controlling risks, ensuring the reliability of business and financial reports and fostering the timely and appropriate disclosure of information.

The internal controls system in the Company has been implemented based on a resolution adopted by the Board of Directors under the title “Structures for Ensuring Appropriate Operations at Nomura Holdings, Inc.,” which also includes matters regarding maintenance of internal control system as a group. Further, based on the content of the resolution of the Company, each Nomura Group company maintains internal control system that reflects the actual conditions of each company.

Structure of Nomura Holdings’ internal controls system


LOGO

Regulations regarding the Number of Directors

The Company’s Articles of Incorporation provide for not more than 20 directors.

Requirements for a Resolution to Appoint Directors

For the purpose of carrying out the smooth operation of the General Meeting of Shareholders, the Company’s Articles of Incorporation provide that a resolution for the appointment of directors shall be adopted at a general meeting of shareholders with a vote in favor by a simple majority of the voting rights held by the shareholders present at a meeting attended by shareholders entitled to exercise voting rights holding in aggregate 1/3 or more of the total voting rights. The Company’s Articles of Incorporation also provide that no cumulative voting shall be used for the appointment of directors.

Requirements for a “Special” Resolution at the General Meeting of Shareholders

The Company’s Articles of Incorporation provide that any resolution under Article 309, Paragraph 2 of the Companies Act must be adopted with a vote in favor by 2/3 of the voting rights held by the shareholders at a meeting attended by shareholders entitled to exercise voting rights holding in aggregate 1/3 or more of the total voting rights.


89


Table of Contents

Decision-Making Body for Dividends, Etc.

In order for the Company to return profit to the shareholders and execute capital policy by responding flexibly to changes in the business environment, the Company’s Articles of Incorporation provide that dividend distributions, etc., under Article 459, Paragraph 1 of the Companies Act must be approved by a resolution adopted by the Board of Directors, instead of a resolution adopted by the general meeting of shareholders, unless otherwise prescribed by law.

Release for Directors and Executive Officers

In order for the directors and executive officers to perform their expected roles in the execution of their duties, the Company’s Articles of Incorporation provide that directors (including former directors) and executive officers (including former executive officers) can be released from Companies Act Article 423, Paragraph 1 liability by a resolution adopted by the Board of Directors pursuant to Article 426, Paragraph 1 of the Companies Act, up to the amount specified in applicable laws and regulations.

Limitation of Liability Agreement

The Company has entered into agreements to limit Companies Act Article 423, Paragraph 1 liability for damages (limitation of liability agreements) with Director Shoji Ogawa and all of the outside directors. Liability under each such agreement is limited to either ¥20 million or the amount prescribed by laws and regulations, whichever is greater.

Directors and Officers Liability Insurance Contracts

The Company has entered into directors and officers liability insurance contracts set forth in Article 430-3, Paragraph 1 of the Companies Act with insurance companies, which have persons such as directors, executive officers, senior managing directors, auditors, and senior employees of the Company and its subsidiaries, etc. as insured persons. Under such insurance contracts, there will be an indemnification of losses, such as compensation for damages and litigation costs, incurred by an insured person due to a claim for loss or damage caused by an act (including an omission) carried out on the basis of the position, such as director or officer, held by the insured at the Company, and all insurance premiums of insureds have been entirely borne by the Company. However, there are certain exclusions applicable to such insurance contracts such as losses caused by a deliberately fraudulent or dishonest act of individuals such as directors/officers.

Preferred Stock

In order to secure as many financing options as possible and make it possible to promptly respond in the future to changes in the environment, including changes in the economic and business environments, the Company’s Articles of Incorporation essentially provides that the Company can issue preferred stock with no voting rights, in addition to common stock. The unit for preferred stock is 100 shares, which is the same as the unit for common stock. The shareholders of preferred stock may not exercise voting rights with regard to any proposals at a general meeting of shareholders, as long as such shareholders of the preferred stock receive preferred dividends that are paid in priority to the shareholders of the common stock. Further, as of the submission date of the Annual Securities Report pursuant to the Financial Instruments and Exchange Act for the fiscal year ended March 31, 2026, the only stock that has actually been issued is common stock.


90


Table of Contents

Overview of Risk Management

The business activities of Nomura Group are exposed to various risks, including market risk, credit risk, operational risk, and other risks arising from external factors. Below is an outline of our risk management framework.

Risk Characteristics

Nomura recognizes that unexpected losses from business operations may erode the capital of Nomura Group due to various risks, including market risk, credit risk, operational risk, and model risk. Additionally, liquidity risk may arise if a decline in the Group’s creditworthiness or adverse market conditions make it difficult to secure necessary funding. Furthermore, strategic risk could affect current and future earnings, capital, liquidity, enterprise value, and the reputation of Nomura Group due to poor management decisions, hasty or mistaken business advancements, or inaction in response to changes within the industry or external environment. Additional risks that may affect Nomura are described in Item 2. “3. Risk Factors.”

Risk Management Policy

Nomura’s fundamental principle is that all employees should regard themselves as principals of risk management and actively engage in the management of risks at all organizational levels. Nomura’s aim is to promote a proactive risk management culture throughout the organization and to limit risks within its defined risk appetite.

Risk Management Procedures


Nomura calculates, aggregates, reports, and monitors management information related to risk to support sound decision-making.


The Risk Management Division and Finance Division are responsible for regularly compiling the status of positions in line with risk appetite and ensuring appropriate data management.


Management information spans various risk categories and is produced using multiple risk management techniques.


The risk management framework consists of risk appetite, governance and oversight, management of financial resources, management of risk categories, and processes to measure and control risks.

Overview of Risk Management Structure

Nomura has established a framework designed to manage its risk aimed at maintaining financial soundness and enhancing enterprise value.

Three Lines of Defense Framework:


First Line of Defense: All executives and employees in the front office are primarily responsible for risk management.


Second Line of Defense: The risk management department supports and monitors first line activities and reports to senior management.


Third Line of Defense: The independent internal audit department examines and evaluates risk management activities and reports findings to the Audit Committee.

Setting Risk Appetite:

Based on its management strategy, Nomura determines the types and levels of risk it is willing to assume and reviews these regularly. Nomura’s Risk Appetite is jointly submitted by the Chief Risk Officer (“CRO”) and the Chief Financial Officer (“CFO”) to the Executive Management Board (“EMB”) for approval. It is then to be further reviewed at the Board Risk Committee (“BRC”) based on the BRC’s authority to consent to the relevant proposal raised by the executive side.

Limit Frameworks

The establishment of robust limit monitoring and management is central to the appropriate monitoring and management of risk. The limit management frameworks incorporate escalation policies to facilitate approval of limits at appropriate levels of seniority. The Risk Management Division and the Finance Division are responsible for day-to-day operations of these limit frameworks including approval, monitoring, and reporting as required. Business units are responsible for complying with the agreed limits. Limits apply across a range of quantitative measures of risk and across risk categories such as market risk, credit risk and model risk.


91


Table of Contents

Committee Governance

Nomura has the EMB as a body to deliberate on or determine management strategy, the allocation of the management resources and important management matters of Nomura. The Group Risk Management Committee (the “GRMC”) operates, upon delegation from the EMB, for the purpose of deliberating on or determining important matters concerning enterprise risk management of Nomura and thereby assuring the sound and effective management of Nomura’s businesses. The GRMC consists of the Group CEO, one representative executive officer other than the Group CEO appointed by the Committee Chairman, the Chief Compliance Officer, the CRO, the CFO, Division Heads and persons designated by the Committee Chairman as the members of the Committee. An organizational framework and committee structure is in place to facilitate effective business operations and management of the firm’s risks.

Please also see Item 4 “4. Status of Corporate Governance and Other — (1) Status of Corporate Governance <The Board of Directors and Committees>” in this annual report for a description of the respective roles of the Board of Directors and the Board Risk Committee in risk management.

Risk Categories and Definitions

Nomura categorizes risks as follows and has established departments to manage each type:


Financial Risk: Credit risk, market risk, model risk


Non-Financial Risk: Operational risk, reputational risk


Liquidity Risk: Liquidity risk


Other Risks: ESG (Environmental, Social, Governance), strategic risk and other risks

Financial and non-financial risks are described in more detail below. For further information on funding and liquidity risk management, see Item 2 “4. Operating, Financial and Cash Flow Analyses by Management — (5) Liquidity and Capital Resources.” in this annual report.


92


Table of Contents

Credit Risk

Risk Characteristics

Credit risk is defined as the risk of loss arising from an obligor’s default, insolvency, or legal proceedings that prevent the obligor from fulfilling its contractual obligations according to the agreed terms. This includes both on and off-balance sheet exposures. It is also the risk of loss arising through credit valuation adjustment associated with deterioration in the creditworthiness of a counterparty.

Risk Management Policy

Nomura has designed a risk management framework designed to allow it to take on appropriate credit risk in alignment with its risk appetite.


Credit Risk Management (“CRM”) expresses the creditworthiness of a counterparty or debtor by assigning internal ratings based on the results of individual credit analyses. These internal ratings are linked to the probability of default and are used to calculate the amount of credit risk-weighted assets (“RWA”).


Credit exposures arising from counterparties are managed through credit limits set based on internal ratings.

The scope of credit risk management includes transactions with counterparties, as well as loans, private equity investments, fund investments, investment securities, and various bonds and equities that are deemed to require credit risk management. Nomura’s credit risk primarily arises from derivative transactions and securities lending transactions.

Procedures

Credit risk management at Nomura is conducted through the following procedures:


Internal Rating Assignment and Updates:

CRM evaluates the creditworthiness of counterparties based on detailed due diligence and analysis concerning the counterparty’s business environment, competitiveness, and strengths and flexibility in management and finance. Credit analysts also consider the organizational structure of the target and any explicit or implicit credit enhancements. Credit analysts are responsible for assigning internal ratings and reviewing them at least once a year.


Setting Credit Limits:

CRM establishes credit limits for counterparties based on internal ratings.


Exposure and Limit Management:

Nomura’s credit risk management system calculates and aggregates credit exposures at both the counterparty and group levels. This allows CRM to monitor and manage the usage of credit limits and exposure concentration risk on a daily basis, ensuring that appropriate reporting mechanisms are in place in case of limit breaches.

Overview of the Management Structure

Nomura manages credit risk at both the global and legal entity levels, establishing the following structure:

Policies, etc.:


Under a risk management framework based on risk appetite, matters related to the basic policy on credit risk management, risk measurement methods, approval authority for credit limit setting, and monitoring are defined in global policies, standards, and procedures.


These policies are established through appropriate approval procedures by the GRMC, etc., and they define the basic policy of credit risk management as well as the approval authority for credit limit setting.

Credit Risk Management (CRM):


CRM is a global organization within the Risk Management Division responsible for managing credit risk and reports to the CRO.


93


Table of Contents
   

CRM is responsible for the implementation, maintenance and management of the policies.

Credit Risk Mitigation Measures

Risk Characteristics and Risk Management Policy


Please refer to “Credit Risk

Overview of Procedures and Structure

Nomura mitigates credit risk through means such as collateral, guarantees, and credit derivatives.

Collateral Agreements


To further reduce credit risk, Nomura utilizes collateral agreements.


These agreements help ensure that Nomura can receive collateral from counterparties at the commencement of transactions or in response to changes in exposure levels or other relevant circumstances.

Master Netting Agreements


Nomura enters into Master Netting Agreements with many counterparties, which consist of the standard agreements set forth by the International Swaps and Derivatives Association or similar contracts (collectively referred to as “Master Netting Agreements”).


By entering into Master Netting Agreements, Nomura is able to net receivables and payables, thereby reducing the potential loss amount arising from a counterparty’s default.

Credit Risk to Counterparties in Derivatives Transaction

The credit exposures arising from Nomura’s trading-related derivatives as of March 31, 2026 are summarized in the table below, showing the positive fair value of derivative assets by counterparty credit rating and by remaining contractual maturity. The credit ratings are internally determined by Nomura’s CRM.


    Billions of yen  
    Years to Maturity     Cross-
Maturity
Netting(1)
    Total
Fair Value
    Collateral
obtained
    Replacement
cost(3)
 

Credit Rating

  Less than
1 year
    1 to 3
years
    3 to 5
years
    5 to 7
years
    More than
7 years
 
                                        (a)     (b)     (a)-(b)  

AAA

  ¥ 6     ¥ 15     ¥ 11     ¥ 4     ¥ 45     ¥ (73   ¥ 8     ¥ 1     ¥ 7  

AA

    401       438       482       671       3,626       (4,887     731       134       597  

A

    457       344       270       219       1,127       (1,929     488       186       302  

BBB

    378       171       105       66       488       (504     704       257       447  

BB and lower

    104       189       73       35       41       (238     204       740       —   

Other(2)

    90       20       28       1       29       (170     (2     21       —   


Sub-total

  ¥ 1,436     ¥ 1,177     ¥ 969     ¥ 996     ¥ 5,356     ¥ (7,801   ¥ 2,133     ¥ 1,339     ¥ 1,353  

Listed

    924       138       213       42       0       (557     760       126       634  


Total

  ¥   2,360     ¥   1,315     ¥   1,182     ¥   1,038     ¥   5,356     ¥   (8,358   ¥   2,893     ¥   1,465     ¥   1,987  


(1)

Represents netting of derivative liabilities against derivatives assets entered into with the same counterparty across different maturity bands. Derivative assets and derivative liabilities with the same counterparty in the same maturity band are net within the relevant maturity band. Cash collateral netting against net derivative assets in accordance with ASC 210-20Balance SheetOffsetting” and ASC 815 “Derivatives and Hedging” is also included.


(2)

“Other” comprises unrated counterparties and certain portfolio level valuation adjustments not allocated to specific counterparties.


(3)

Zero balances represent instances where total collateral received is in excess of the total fair value; therefore, Nomura’s credit exposure is zero.


94


Table of Contents

Market Risk

Market risk is the risk of loss arising from fluctuations in market risk factors (such as interest rates, foreign exchange rates, and prices of securities) that result in changes in the value of financial assets and liabilities held (including off-balance-sheet items).

Overview of Market Risk Management Policy, Procedures, and Structure

Methods for Identifying, Evaluating, Managing, and Mitigating Risks, and Monitoring Hedge Effectiveness


Nomura employs various statistical tools to measure and monitor market risk, including Value at Risk (“VaR”). Sensitivity analysis and stress testing are also utilized as assessment tools. Sensitivities indicate the potential change in portfolio value due to standard shifts in market risk factors. These sensitivities are asset class-specific and are not typically aggregated across different risk factors. Stress testing allows for the analysis of portfolio risk and tail risk, incorporating non-linear effects and enabling aggregation across risk factors at any level of the organization, from group level to business divisions and trading desks.


Market risk is monitored through daily reports and other management information provided to business units and senior management, ensuring compliance with established limits. The market risk management function is carried out by a dedicated market risk department that operates independently of the front office, creating a robust framework for the effective identification, analysis, reporting, and management of market risk. The utilization of market risk limits is reported in accordance with the Market Risk Limit Procedure, covering all levels of business hierarchy and legal entities.


If the utilization of market risk limits exceeds pre-approved thresholds, the front office collaborates with the market risk department to develop an action plan, obtain approval, and execute it. Any limit breaches are reported to relevant stakeholders and committees in accordance with established policies.

Value at Risk (VaR)

VaR is a measure used to estimate the potential loss due to unfavorable movements in market factors such as equity prices, interest rates, credit spreads, foreign exchange rates, and commodity prices, along with their associated volatilities and correlations.


Methodology Assumptions

Nomura uses a globally consistent VaR model for measuring total trading VaR across the organization. The historical simulation method is employed, applying historical market movements over a two-year period to current exposures to generate one-day profit and loss distribution. This distribution is then utilized to estimate potential losses with required confidence levels. The VaR model maintains its reliability even when high-quality data is not available through a proxy logic system.


VaR Backtesting

The performance of Nomura’s VaR model is regularly monitored to ensure its fitness for purpose. The main method for validating VaR is through backtesting, which involves comparing actual losses over one day to the corresponding VaR estimate. The backtest results are reviewed monthly by the Risk Management Division.


Limitations and Advantages of VaR

The primary advantage of VaR is its ability to aggregate risks across different asset classes. However, it is a backward-looking measure that inherently assumes that recent distribution and correlations adequately represent potential future movements. VaR is suitable for liquid markets but has limitations regarding rapidly changing market variables. Consequently, VaR may not fully capture the impact of significant adverse events. Nomura acknowledges these limitations and uses VaR as one component of a broader market risk management strategy.


95


Table of Contents

VaR metrics: 95% Confidence Interval

One-day VaR data using the confidence level of 95% for the year ended March 31, 2026 is presented below.

The following graph shows the daily VaR over the last six quarters for substantially all of Nomura’s trading positions:


LOGO

The following tables show the VaR as of each of the dates indicated for substantially all of Nomura’s trading positions:


     Billions of yen  
     As of  
     March 31,
2025
    March, 31,
2026
 

Equity

   ¥ 2.0     ¥ 4.5  

Interest rate

     2.1       2.9  

Foreign exchange

     1.5       1.1  


Subtotal

     5.6       8.5  

Less: Diversification Benefit

     (1.8     (2.7


VaR

   ¥ 3.8     ¥ 5.8  


     Billions of yen  
     For the twelve months ended  
     March 31,
2025
    March 31,
2026
 

Maximum daily VaR(1)

   ¥ 6.9     ¥ 7.7  

Average daily VaR(1)

     5.2       5.1  

Minimum daily VaR(1)

     3.5       3.1  
 
(1)

Represents the maximum, average and minimum VaR based on all daily calculations for the year ended March 31, 2026.

Non-Trading Risk

A major market risk in Nomura’s non-trading portfolio relates to equity investments held for the purpose of maintaining business relationships and promoting business over the long term. These equity investments are primarily influenced by fluctuations in the Japanese stock market. One method that can estimate the market risk in this portfolio is to analyze market sensitivity based on changes in the TOPIX, which is a leading index of prices of stocks on the Tokyo Stock Exchange.

Nomura conducts regression analysis, over the past 90 days, on the relationship between movements in TOPIX and fluctuations in the market prices of equities held to maintain business relationships and promote business. Based on this analysis, for each 10% change in TOPIX, the fair value of these operating equity investments was expected to decrease by approximately ¥7.7 billion as of March 31, 2025, and by approximately ¥11.2 billion as of March 31, 2026. TOPIX closed at 2,658.73 points as of March 31, 2025, and at 3,497.86 points as of March 31, 2026. This simulation is based on regression analysis against TOPIX for Nomura’s entire portfolio of equity investments held for these purposes; therefore, actual results may differ from these estimates due to price fluctuations of individual equities.


96


Table of Contents

Operational Risk

Operational risk is defined as the risk of financial loss or non-financial impacts, such as violations of laws and regulations or deterioration of the reputation of Nomura, arising from inadequate or failed internal processes, people, systems, or from external events. This risk includes compliance, legal, IT, cyber and information security, fraud, third-party, and other non-financial risks. Although this definition excludes strategic risk (the risk of loss arising from poor strategic management decisions) and reputational risk, operational risks can still significantly affect the group’s reputation, creating a close relationship between operational and reputational risk.

Overview of Risk Management Policy and Procedures

Nomura has established a management framework for identifying, assessing, managing, monitoring, and reporting operational risk. This framework is supervised by the GRMC with delegated authority from the EMB. The operational risk management framework consists of the following components:

Foundation of the Risk Management Framework


Policy Framework: Clearly establishes the fundamental principles for managing operational risk and details how adherence to these standards will be monitored.


Training and Awareness: Initiatives aimed at improving understanding of operational risk management throughout the organization.

Key Risk Management Activities


Event Reporting: A process used to identify and report events that lead to, or could potentially lead to, losses or gains arising from inadequate or failed internal processes, people, systems, or external events.


Risk and Control Self-Assessment (RCSA): This process involves identifying the inherent operational risks the business faces, evaluating the key controls established to mitigate those risks, and formulating additional measures as necessary. The Operational Risk Management (ORM) team is responsible for developing the RCSA process and supporting its implementation within business units.


Key Risk Indicator (KRI): Metrics used to monitor exposure to operational risk and trigger appropriate responses if predefined thresholds are breached.


Scenario Analysis: A process used to assess and quantify potential high-impact, low-probability operational risk events and identify actions necessary to enhance the control environment.

Outputs from the Risk Management Activities


Analysis and Reporting: A critical aspect of the ORM team’s role is to analyze and report on operational risk information provided by business units, and work with them to develop action plans for risk mitigation.


Operational Risk Capital Calculation: Nomura calculates the required operational risk capital in alignment with Basel regulations and local regulatory requirements.

Model Risk

Model Risk is the risk of financial loss, incorrect decision making, or damage to the firm’s credibility arising from model errors or the incorrect or inappropriate application of models. To effectively manage Model Risk, Nomura has established a Model Risk Management Framework that governs the development, management, validation, approval, usage, ongoing monitoring, and periodic review of the firm’s models. Key aspects of the Framework are as follows:


Model Development and Validation: Prior to the introduction of new models and any material changes to approved models, independent validation is required from a team separate from the model development team. The thresholds for determining the materiality of model changes are defined in the procedures of Model Risk Management.


97


Table of Contents
   

Independent Validation: The model validation team evaluates the appropriateness of the models through various analyses, identifies model limitations, and quantifies the associated model risk. This process ensures the reliability and safety of the models.


Risk Mitigation: At the time of approval by the model validation team, conditions such as usage restrictions, model reserves, and capital adjustments are applied to mitigate risk. This ensures that the models are financially sound.


Periodic Evaluation and Monitoring: Approved models undergo regular validation procedures, with ongoing performance monitoring playing a crucial role in continuously assessing the appropriateness of the models.


Governance and Approval: The Model Risk Management Committee is responsible for Model Risk Management provide overall oversight, scrutiny, governance, and ultimate approval of validated models.

Through these measures, Nomura has established a robust management structure for Model Risk, enhancing its ability to identify and manage both financial and non-financial risks effectively.


98


Table of Contents

(3) Status of audits


1.

Status of Audits by the Audit Committee

Organization, personnel, and procedures of audits by the Audit Committee

As of the submission date of the annual securities report, the Audit Committee is composed of two outside directors and one full-time director who does not concurrently serve as an executive officer and does not execute business operations, for a total of three members. All members of the Audit Committee must be independent pursuant to the Sarbanes-Oxley Act of the United States, as well as related Securities and Exchange Commission rules and New York Stock Exchange rules, and in principle one or more members of the Audit Committee must be financial experts.


Position

  Name   Length of service as an Audit Committee member    Experience and Knowledge

Audit Committee Chairperson (outside)

  Masahiro Ishizuka   three years    With many years of experience as a Certified Public Accountant, is familiar with international accounting systems and has a high level of expertise, qualifying as a Financial Expert pursuant to the U.S. Sarbanes-Oxley Act
       

Audit Committee Member (outside)

  Victor Chu   four years    Has a wealth of experience in corporate management and the financial industry and a high level of expertise regarding laws, regulations, and corporate governance
       

Audit Committee Member

(full-time)

  Shoji Ogawa   five years    Has a wealth of experience and knowledge in the fields of Nomura Group’s governance, internal control and internal audits, primarily through being in charge of Group Internal Audit

In order to increase the effectiveness of audits by the Audit Committee, a full-time Audit Committee member is selected among Audit Committee members. Furthermore, the Company has established the “Office of Non-Executive Directors and Audit Committee” as a department dedicated to supporting the duties of the Audit Committee and directors. To ensure the independence of the Office of Non-Executive Directors and Audit Committee from business execution, its employees are evaluated by either the Audit Committee or an Audit Committee member designated by the Audit Committee, whose consent is required for the hiring, transfer, or discipline of such employees.

Characteristics of the Audit Committee


Regarding matters deemed to be important through audit activities, the Audit Committee offers comments and proposals in the form of “Observations of the Audit Committee” included in regular quarterly reports on execution of duties submitted to the Board of Directors, and exchanges views with directors who are not members of the Audit Committee. Through these efforts, the Audit Committee endeavors to ensure that the issues it has identified are reflected in management discussions.


The chairperson of the Audit Committee also serves as the chairperson of the Audit and Supervisory Committee of Nomura Securities, the Company’s main subsidiary. Furthermore, the Company’s full-time Audit Committee member, Nomura Securities’ Audit Mission Directors and others concurrently serve as Audit Committee members, Audit and Supervisory Committee members, corporate auditors and other similar positions of the major domestic and foreign subsidiaries. This has enabled the establishment and operation of an audit structure whereby the Company takes the lead in close collaboration among Group companies. This ensures a structure that facilitates the identification of common issues across the Group.


To strengthen collaboration on a global and Group-wide basis, the Audit Committee shares information and exchanges views regarding audit related issues and concerns with the Audit and Supervisory Committee members of Nomura Securities, Nomura Asset Management, and Nomura Trust and Banking, and the chairpersons of Audit Committees at holding companies overseeing the three overseas regions (Europe, Americas, and Asia). Through these efforts, the Audit Committee identifies not only issues specific to each region or company, but also risks and governance issues common to the Group, and reflects them in its audit focus areas.


The Internal Audit Division’s primary reporting line is to the Audit Committee. The Audit Committee approves the internal audit plan and related budget. In addition, the consent of the Audit Committee is required for the appointment or dismissal of the head of the Internal Audit Division, thereby ensuring the independence and objectivity of internal audits.

Activities of the Audit Committee


99


Table of Contents

During the fiscal year, the Audit Committee met 13 times, including a global meeting attended by the Overseas Regional Audit Committee Chairpersons. Each meeting lasted approximately 2 hours and 50 minutes on average. At the beginning of the fiscal year, the Audit Committee formulated the Annual Audit Plan and reviewed the progress of audit activities on a quarterly basis. During the fiscal year, it deliberated on significant internal control events, Group governance issues and other matters. At the end of the fiscal year, it conducted a self-evaluation and reflected the results in the Annual Audit Plan for the following fiscal year.


Masahiro Ishizuka

Audit Committee Chairperson (outside)


Victor Chu

Audit Committee Member (outside)


Shoji Ogawa

Audit Committee Member (full-time)

13/13 times    12/13 times    13/13 times

In the fiscal year, the main initiatives and observations of the Audit Committee were as follows.


Audit Committee’s Main Initiatives    Examples of Initiatives and the Audit Committee’s Views

1)  Enhancement of Group-wide Audit Committee activities


-   The Audit Committee shared information and exchanged views with the Audit and Supervisory Committee members of Nomura Asset Management and Nomura Trust and Banking at meetings of the Audit Committee. It also held discussions with the Overseas Regional Audit Committee Chairs and others at the Audit Committee’s global meetings and other forums. Through these activities, the Audit Committee identified Group-wide issues and shared awareness of issues.

-   The Audit Committee recognizes that maintaining a Group-wide perspective contributes to enhancing audit effectiveness.

2)  Monitoring and verification of internal control based on an appropriate understanding of risks and controls


-   The Audit Committee conducted Group-wide thematic audits on matters such as operational resilience and booking strategy, AI strategy and governance, Culture & Engagement, and the framework for promoting conduct. It also examined matters such as business expansion and internal controls, and responses to cyber risks and phishing.

-   The Audit Committee believes that it is important to identify risks and issues across the Group and link them to initiatives to strengthen internal controls.

3)  Initiatives to enhance corporate value


-   The Audit Committee reviewed the status of implementation of strategies and measures aimed at achieving medium- to long-term earnings targets. In addition, the chairperson of the Audit Committee participated in dialogue meetings with shareholders and other stakeholders.

-   The Audit Committee recognizes that improving profitability and communicating with shareholders and other stakeholders are essential to sustainably enhancing corporate value.

4)  Further pursuit of organizational audits and best practices in Audit Committee operations


-   The Audit Committee worked to strengthen cooperation and collaboration with the Internal Audit Division, including by enhancing its review of the Internal Audit Division’s responses to instructions from the Audit Committee. In addition, it strengthened human resource development initiatives, such as expanding participation by members of the Office of Non-Executive Directors and Audit Committee in activities of the Japan Audit & Supervisory Board Members Association, and also sought to improve operational efficiency through measures such as the use of generative AI. The Audit Committee recognizes that these initiatives should lead to the further enhancement of audit activities.

The Audit Committee conducted interviews with Executive Officers, including Representative Executive Officers; Senior Managing Directors; key employees and other personnel of internal control-related departments and other relevant departments; and the Accounting Auditor and others. It also received reports on audit activities from the full-time Audit Committee member and the three Audit Mission Directors of Nomura Securities. In addition, Audit Committee members themselves attended important meetings and conducted interviews with Executive Officers, Senior Managing Directors and others, as well as the Accounting Auditor and others, and reviewed the status of execution of duties by Directors, Executive Officers and others, as well as the status of development and operation of the internal control system.


100


Table of Contents
Main Agenda Items during Audit Committee Meetings  

Apr.


May


June


July


Aug.


Oct.


Nov.


Dec.


Jan.


Feb.


Mar.

Deliberations concerning the Annual Audit Plan  


Deliberations concerning Observations of the Audit Committee  


Deliberations concerning the Report of the Audit Committee  


Deliberations concerning evaluation of the accounting auditor      


Deliberations concerning the Audit Committee’s self-evaluation                                  


Reports from Executive Officers, Senior Managing Directors, etc.  


Approval of the implementation plan pertaining to internal audits and the related budget, and reports from the Internal Audit Division  


Reports from the accounting auditor      


Audit activity reports from the full-time Audit Committee member, etc.  


Exchanges of views and other activities with Audit and Supervisory Committee members of Group Companies, Overseas Regional Audit Committee Chairs and Others                  


101


Table of Contents

(No Audit Committee meetings were held in September.)

The main reports received by the Audit Committee during the fiscal year were as follows.


Main reports from Executive Officers, Senior Managing Directors, etc.   

-   Status of the Execution of Duties: The President and Group CEO; Representative Executive Officer and Deputy President; Executive Officer, Deputy President and Chief of Staff; Business Division Heads, etc.; CFO; CRO; Joint CCO, CIO etc.

-   Quarterly Financial Results Overview: CFO, Executive Officer in charge of Group Finance

-   Background and response to the legal violation in relation to JGB futures trading and the arrest and indictment of a former employee at Nomura Securities: Joint CCO

Main reports from the accounting auditor   

-   Financial audit plan and quarterly review plans (Japanese standards and U.S. standards)

-   Quarterly review results

-   Report on independence

-   CAM/KAM (critical/key audit matters)

-   Results of financial audits required by the Companies Act, status and results of the integrated audit concerning consolidated financial statements and internal controls pertaining to financial reporting

-   Results of the Japanese Institute of Certified Public Accountants quality control review, the Certified Public Accountants and Auditing Oversight Board inspection, etc.

-   Status of promotion of audits utilizing advanced digital technologies

-   Global regulatory updates, and AI and its utilization

The status of attendance at important meetings excluding the Audit Committee meetings by each member of the Audit Committee during the fiscal year was as follows.


Meeting   Masahiro Ishizuka
Audit Committee
Chairperson (outside)
  Victor Chu
Audit Committee
Member (outside)
  Shoji Ogawa
Audit Committee
Member  (full-time)

Board of Directors meetings

  11/11 times   10/11 times   11/11 times

Board Risk Committee meetings

      5/5 times

During the fiscal year, the full-time Audit Committee member, Nomura Securities’ Audit Mission Directors, and members of the Office of Non-Executive Directors and Audit Committee serving as the corporate auditors of domestic subsidiaries conducted interviews and other procedures with Executive Officers, Senior Managing Directors, key employees in Japan and overseas under their supervision, as well as the accounting auditor and others, and performed on-site audits of domestic branch offices and head office departments as well as overseas offices in Europe, the Americas and Asia.

Cooperation with the Internal Audit Division and the Accounting Auditor

As mentioned above, the Audit Committee receives reports from the Senior Managing Director in charge of Group Internal Audit and the accounting auditor, while the Senior Managing Director in charge of Group Internal Audit attends almost all committee meetings and the accounting auditor participates in interviews conducted by the Audit Committee. Through these efforts, the Audit Committee shares awareness of issues with the Group Internal Audit and the accounting auditor and continuously reviews significant internal control issues.

In addition, the Chairperson of the Audit Committee, the full-time Audit Committee member and Nomura Securities’ Audit Mission Directors hold monthly tripartite audit meetings with the accounting auditor and the Senior Managing Director of Group Internal Audit to share audit issues, key risks, issues concerning internal controls, and insights gained from their respective audit activities, as well as information on various topics, not limited to audits. In the fiscal year, monthly tripartite audit meetings were held 11 times.


102


Table of Contents

Furthermore, the full-time Audit Committee member and Nomura Securities’ Audit Mission Directors receive reports from the Senior Managing Director of Group Internal Audit every month, while the Audit Committee members communicate with the accounting auditor as needed.

Annual Audit Plan and Key Audit Items

The Audit Committee prepares an Annual Audit Plan for each business year.

Based on Nomura Group’s management strategy, the business environment surrounding Nomura Group, and the results of audit activities up to the previous fiscal year, the Annual Audit Plan for the fiscal year set the following key audit items, and audits were implemented accordingly: 1) establishing a sound corporate culture, 2) enhancing the effectiveness of governance frameworks, 3) upgrading the internal control system and dealing with risk, and 4) initiatives to achieve mid-to-long term management objectives.


Key Audit Items and Main Focal Points of Audits    Main contents of audit

1)  Embedding a sound corporate culture

(i) Ensure appropriate conduct and instill risk culture


-   Is senior management implementing measures to embed conduct compliance in the day-to-day activities of officers and employees?

-   Is senior management working to further instill risk culture and improve its quality so that each officer and employee can act by taking the initiative and cooperating with others to deal with risks appropriately?

2)  Enhancing the effectiveness of governance frameworks

(i) Upgrade integrated Group-wide business operations, develop a globally consistent control framework and strengthen the three lines of defense

(ii)  Strengthen dialogue with stakeholders

(iii)  Manage domestic and overseas subsidiaries


-   Is senior management working to implement radical measures to strengthen governance and internal control to a level befitting the Nomura Group?

-   Is senior management establishing a globally consistent control framework for business operations and strengthening the three lines of defense, including ensuring ownership of risk management within the first line?

-   Is senior management strengthening dialogue with stakeholders through timely and appropriate provision of information, and working to deepen mutual understanding?

-   Is senior management working to enhance the effectiveness of the framework for managing domestic and overseas subsidiaries?

3)  Upgrading the internal control system and dealing with risk

(i) Upgrade risk management for a range of risks

(ii)  Resilience

(iii)  Develop a system for appropriate information disclosure and enhance its operation

(iv) AI governance


-   Is each of the corporate functions enhancing its management of risks—including legal, compliance, conduct, IT/cybersecurity, business continuity, and human capital?

-   Is senior management working on initiatives to enhance the operational resilience of the entire Group on a mid-to-long-term basis?

-   Is senior management working to establish a framework for appropriate information disclosure and strengthen its operation, including internal control over financial reporting and measures to address the expected expansion of non-financial information disclosure?

-   Is senior management working to expand AI use cases aimed at enhancing financial services and to strengthen the AI governance framework?

4)  Initiatives to achieve mid-to-long-term management objectives

(i) Implement initiatives for the 2030 Management Vision

(ii)  Develop an improved personnel strategy that is comprehensive and focused on the next generation, and conduct appropriate performance appraisals


-   Is senior management working on key management priorities and business strategies to achieve the 2030 Management Vision?

-   Is senior management developing and implementing a comprehensive human resources strategy from a mid-to-long-term perspective?


103


Table of Contents

Audit Committee’s view

The Company marked a major milestone with its 100th anniversary during the fiscal year, and the results of the business model transformation it has been pursuing have steadily begun to emerge. In April 2026, a new management structure was launched, including changes in the heads of divisions and companies, and it is important for the Company to move on to a new stage of growth toward achieving its 2030 Management Vision, including further stabilizing earnings. In addition, the Company needs to focus on strengthening and enhancing its internal control system in order to prepare for changes in the external environment, including market volatility, and various risks, and to respond proactively to them.

In promoting these various initiatives for sustainable growth, it is essential to instill the Nomura Group Purpose in all officers and employees. Based on their understanding of and empathy with the Nomura Group Purpose, senior management needs to promote greater engagement among officers and employees, thereby earning the trust of stakeholders and enhancing corporate value.

PDCA (Plan, Do, Check, Act) Cycle for Audit Activities

The Audit Committee conducts audits in accordance with the Annual Audit Plan. On a quarterly basis, it reviews its audit activities, organizes matters confirmed or identified through those activities, as well as points requiring future confirmation, and provides findings and recommendations to the Board of Directors in the form of the Observations of the Audit Committee. At the end of the fiscal year, the Audit Committee conducts a self-evaluation, and reviews its activities as a whole. In this way, it reinforces the linkage between individual audit activities based on the Annual Audit Plan and reports such as the Observations of the Audit Committee, and ensures that issues identified through such activities are reflected in the Annual Audit Plan for the following fiscal year. In addition, the Audit Committee also works closely with the Internal Audit Division by, for instance, informing the Senior Managing Director in charge of Group Internal Audit of recognized issues and incorporating them into the internal audit implementation plan for the following fiscal year.

The full-time Audit Committee member and Nomura Securities’ Audit Mission Directors receive quarterly briefings from the executive side on the status of responses to the Observations of the Audit Committee and report the details to the Audit Committee. Through this process, they ensure two-way communication with the executive side and enhance the effectiveness of monitoring and verifying the executive side’s responses to those observations.


LOGO


104


Table of Contents

LOGO

Self-evaluation of the Audit Committee

The Audit Committee is promoting enhancement in areas such as group-wide Audit Committee activities, risk-based audits, the establishment of a PDCA cycle for auditing activities, and evaluation of the accounting auditor. By conducting self-evaluation of these activities, the Audit Committee clarifies issues and considers measures for further enhancement.

In the self-evaluation conducted in March 2026, Audit Committee members were required to complete a three-level evaluation on seven items and were asked for their opinions individually regarding reasons for low assessments. The seven items were: (i) the Audit Committee’s audit activities, (ii) collaboration with the Board of Directors, (iii) reports from the Internal Audit Division, (iv) collaboration with the accounting auditor, (v) collaboration with the Internal Control Division, (vi) communication with supervisory authorities, and (vii) effectiveness of the Audit Committee.

Based on the results of the self-evaluation, the Audit Committee believes there is room for improvement in areas such as receiving timely reports and holding discussions on issues deemed necessary from a risk-based perspective, as well as further strengthening collaboration with the Internal Audit Division and the Internal Control Division. The Audit Committee recognizes these as key priorities going forward and will work to enhance the effectiveness of group-wide audits.


105


Table of Contents
2.

Status of internal audit

The Internal Audit Division defines its purpose as “We help Nomura create a better world by providing valuable, independent, risk-based, and objective assurance, advice, insight, and foresight”, and our policy is to act as catalyst for change to improve the control environment and achieve business objectives.

Organization, Personnel and Procedures of Internal Audit

In order to ensure the effectiveness and adequacy of internal controls, the Company has established the Internal Audit Division that is independent from business execution and reports directly to the Audit Committee. In addition to the Group Internal Audit Department within the Company, it has also set up internal audit dedicated units (and personnel) in its major subsidiaries in Japan and overseas. This allows it to audit business and corporate functions across the Nomura Group.

The Internal Audit Division is staffed by approximately 220 employees in Japan and overseas and operates under a global matrix structure based on functions and regions. Highly skilled and experienced personnel in internal auditing and related areas have been appointed as Global Portfolio Directors for each business and corporate function to be audited, whereby enhancing the overall consistency and evaluating the internal controls of the entire group globally with coherency.

Especially, in order to promote the use of technology in internal audit activities throughout the Group, a dedicated data analytics team has been formed. In addition to the Global Portfolio Directors mentioned above, personnel skilled in data analytics and management have been assigned in each region to advance the use of data analytics in each internal audit activity. Efforts are also being made to implement continuous monitoring and other initiatives using data analytics.

[Group Internal Audit Operational Structure]


LOGO

The Internal Audit Division of the Nomura Group takes a risk-based approach in principle to effectively and efficiently utilize audit resources. It conducts risk assessment for each business and operation to be audited and works on formulating and implementing its annual internal audit plan to allocate audit resources according to the type and degree of inherent risks. As a foundation for internal audit activities that supports the aforementioned Group-wide internal auditing, in addition to adopting the globally unified internal audit methodologies, which adhere to the International Professional Practices Framework (“IPPF”) established by The Institute of Internal Auditors (IIA), the Internal Audit Division has also introduced a platform used by all regions that provides workflow functionalities for various internal audit activities and approval processes as well as storage functionalities for internal audit reports, work papers, and audit trails relating to internal audit activities. The platform provides an environment in which the status and results of internal audit activities of the entire Group can be easily reviewed and analyzed.

Mutual Coordination among Internal Audit, Audit Committee Audit and Accounting Audit and the Relationship between these Audits and Internal Controls Functions


106


Table of Contents

Coordination between Internal Audit and Audit Committee

The primary reporting line of the Internal Audit Division is the Audit Committee. In addition to reporting the result of each audit to the Audit Committee, the Internal Audit Division also periodically reports to the Audit Committee on the development/operation of internal audit organization and the progress of internal audits in order to promote the coordination with the Audit Committee. Notable matters on the status of the Internal Audit Division are reported in the regular reporting from the Audit Committee to the Board of Directors. Formulation of the annual internal audit plan and budget requires the approval of the Audit Committee and points to be considered for the formulation of the annual internal audit plan are separately communicated to the Internal Audit Division by the Audit Committee.

During the period under review, timely reporting was made throughout the year through a total of 11 reports from the Internal Audit Division to the Audit Committee. Main content of the reports includes key issues and trends relating to the overall internal control identified through internal audit activities, as well as matters to be referred to the Audit Committee for approval such as the annual internal audit plan and its changes. In addition to the reporting to the Audit Committee, key issues and trends relating to the overall internal control identified through internal audit activities are reported monthly to the full-time Audit Committee member and Audit Mission Directors of Nomura Securities.

Coordination among Internal Audit, Audit Committee and Accounting auditor

In regard to the Accounting auditor (Independent Auditor), the Audit Committee has the authority to approve their annual audit plan, receives reports and explanations from them on their financial audits at least once quarterly, exchanges information with them from time to time, reviews their audit method and the appropriateness of their audit results and examines financial statements and other relevant documents. The Senior Managing Director in charge of the Internal Audit Division attends the Audit Committee meetings and receives reports not only from the Audit Committee but also from the Accounting auditor. In addition, when the Internal Audit Division reports to the Audit Committee, the Accounting auditor is also present and receives reports from the Internal Audit Division.

Furthermore, the Internal Audit Division participates in the monthly meetings (regular three-way audit meetings) which the chairperson of the Audit Committee, the full-time Audit Committee member and the Accounting auditor attend, and shares information and exchanges opinions on matters such as recognition of issues identified in audits, the risk and control environment, and regulatory developments in Japan and overseas, with the aim of enhancing internal audit activities.

Coordination between Internal Audit and Accounting auditor

The Internal Audit Division coordinates and holds regular meetings with the Accounting auditor on a monthly basis, where their respective principal managers attend the meetings and share topics associated with their audit activities and recent risk assessments for the use in their respective audit activities. In order to improve the efficiency of the audit activities of both sides, the Internal Audit Division also coordinates with the Accounting auditor at the operational level by sharing the timing of fieldwork and the materials and data obtained from the auditees, etc. Internal audit reports are also shared with the Accounting auditor.

Coordination between Internal Audit and Internal Controls Functions

The Internal Audit Division conducts continuous monitoring in addition to the audit activities based on the annual internal audit plan approved by the Audit Committee. Through interviews with the internal controls functions and review of relevant documents, the Internal Audit Division assesses the risk landscape. Based on these assessments, the Internal Audit Division may propose changes to the annual internal audit plan to the Audit Committee as necessary.

Efforts to Ensure the Effectiveness of Internal Audits

As described above, the primary reporting line of the Internal Audit Division is the Audit Committee. The Senior Managing Director in charge of the Internal Audit Division reports directly to the Audit Committee on the development/operation of internal audit organization and the progress of internal audits while the Audit Committee requests the Internal Audit Division to formulate the annual internal audit plan covering points it deems necessary for future review, ensuring the effectiveness of internal audits through coordination between the Internal Audit Division and the Audit Committee. The Senior Managing Director in charge of the Internal Audit Division attends the Executive Management Board (EMB) meetings. This allows the Senior Managing Director in charge of the Internal Audit Division to receive information at the management level and to regularly report on matters related to internal controls identified through internal audits.

In addition, formulation of the annual internal audit plan and budget requires the approval of the Audit Committee, and the appointment or dismissal of the Internal Audit Division Head requires the consent of the Audit Committee thereby ensuring its independence and objectivity from the business execution.


107


Table of Contents

In addition, the Internal Audit Division undergoes a quality assessment of internal audits by external experts approximately every five years, in accordance with internal regulations and the IPPF Standards. Most recently, it has been evaluated as being generally conforming to the International Standards established by the IIA.

As the Internal Audit Division for the entire group, we have already undergone three rounds of external quality assessments. In addition to the evaluation of compliance with various standards, the Internal Audit Division has received insights into its performance and effectiveness compared to industry peers; industry best practices; and recommendations for improvement. These insights are being utilized in formulating the mid-term strategy for the Internal Audit Division, as part of its ongoing efforts to further enhance its internal auditing capabilities. Most recently, we have revised our internal audit charter to reflect the “Global Internal Audit Standards” established by the IIA, which came into effect in January 2025, and have explicitly documented matters related to coordination with the Audit Committee.


108


Table of Contents
3.

Status of accounting audit


  a.

Name of auditing firm

Ernst & Young ShinNihon LLC


  b.

Duration of the auditor’s assignment

Since 1973 (Including periods between 1978 and 2002 in joint audit with other auditing firms)


  c.

The certified accountants who executed the audit work


Names of the accountants


Names to which the accountants belong to

Designated and Operating Partner Toyohiro Fukata

   Ernst & Young ShinNihon LLC

Designated and Operating Partner Shinichi Hayashi

   Ernst & Young ShinNihon LLC

Designated and Operating Partner Mitsuhiro Nagao

   Ernst & Young ShinNihon LLC

Designated and Operating Partner Toshiro Kuwata

   Ernst & Young ShinNihon LLC
 

Note: Years of the accountants’ assignment is omitted due to less than seven years.


  d.

Composition of the assistants assigned to the audit work

Certified public accountants:      49   persons

Others:             129  persons


Note: Others include those who passed the Certified Public Accountant Examination and system auditors.


  e.

Accounting Auditor Selection Policy and Reasons, and Evaluation of Accounting Auditor by the Audit Committee

The Audit Committee conducted an annual evaluation based on the “Assessment Criteria for the Accounting Auditor” established by the Committee. Based on the results, as facts falling under the “Policy on Dismissal or Non-reappointment of the Accounting Auditor” established by the Audit Committee were not found, the Audit Committee deemed it appropriate to reappoint the current accounting auditor. At an Audit Committee meeting, the Audit Committee directly informed the accounting auditor of the results of the annual evaluation, while also expressing requests for further enhancement of audit activities, among other matters.

In the fiscal year ended March 2023, the Audit Committee implemented a process of evaluating multiple audit firms to select one candidate for appointment as accounting auditor; this process included the evaluation of proposals and presentations by the audit firms. The decision to nominate the current accounting auditor as the candidate for appointment was made in April 2023. In the annual evaluation for the fiscal year, the Audit Committee also considered the matters below in order to conduct an appropriate evaluation for enhancing audits and ensuring a Group-wide perspective.


  1.

Status of the following key matters included in the proposals received during the process of evaluating multiple audit firms in the fiscal year ended March 2023:


  -

Audit fees (extent to which efficiency improvements due to use of technology, etc. are reflected in fees)

  -

Efficient, sophisticated audits using technology

  -

Collaboration with the Internal Audit Division


  2.

Evaluation of the accounting auditor or the accounting auditor’s member firms in overseas regions by members of the Audit Committee, members of the Audit and Supervisory Committee of Nomura Securities, chairpersons of the Audit and Supervisory Committees of major domestic subsidiaries, and chairpersons of overseas regional Audit Committees

In addition, the Audit Committee considered the policy for conducting the selection process for candidates for Accounting Auditor, established the cycle for conducting the selection process, and decided that it would determine the timing of the process, taking into account factors such as the Company’s business environment and the status of the candidates for Accounting Auditor.


  f.

Policy on Dismissal or Non-reappointment of the Accounting Auditor


  1.

If any of the items stipulated under Article 340, Paragraph 1 of the Companies Act apply to the accounting auditor, the Audit Committee shall consider dismissal of the accounting auditor, and if dismissal is determined to be reasonable, the Audit Committee shall dismiss the accounting auditor by unanimous consent of all members of the Audit Committee. In such event, an Audit Committee member designated by the Audit Committee shall report the dismissal of the accounting auditor and reasons for dismissal at the first general meeting of shareholders convened after the dismissal.


  2.

In cases where the Audit Committee determines that the accounting auditor is unsuitable, or that the establishment of a more appropriate audit structure is needed, a proposal for the dismissal or non-reappointment of the accounting auditor shall be submitted to the general meeting of shareholders.


109


Table of Contents
4.

Audit fees, etc.


  a.

Details of fees to Ernst & Young ShinNihon LLC


     (Millions of yen)  
     Year ended March 31, 2025      Year ended March 31, 2026  
     Audit      Non-audit      Audit      Non-audit  

Company

   ¥ 835      ¥ 35      ¥ 586      ¥ 90  

Consolidated subsidiaries

     399        103        423        101  


Total

   ¥   1,234      ¥   138      ¥   1,009      ¥ 191  


Ernst & Young ShinNihon LLC provides certain non-audit services, such as, accounting advice and comfort letter, which are not included in the scope of services prescribed in Article 2, Paragraph 1 of Certified Public Accountants Act, with the Company.


  b.

Details of fees to Ernst & Young and its member firm companies other than Ernst & Young ShinNihon LLC (Except a.)


     (Millions of yen)  
     Year ended March 31, 2025      Year ended March 31, 2026  
     Audit      Non-audit      Audit      Non-audit  

Company

   ¥ —       ¥ 24      ¥ —       ¥ 2  

Consolidated subsidiaries

     3,423        552        3,777        549  


Total

   ¥   3,423      ¥   576      ¥   3,777      ¥ 551  


Ernst & Young ShinNihon LLC is a member firm of Ernst & Young. Ernst & Young and its member firm companies other than Ernst &Young ShinNihon LLC also provide various types of services, such as supporting tax filings and tax compliances with the Company and its consolidated subsidiaries.


  c.

Other details of significant fees based on audit attestation

Not applicable


  d.

Policy on determining audit fees

The Chief Financial Officer (“CFO”) considers whether the fee level for the accounting auditor, etc., is appropriate to ensure a high quality audit is conducted taking into account factors such as previous performance, audit scope, audit procedures, the audit structure, and annual plans. Audit fees are then decided after obtaining consent or pre-approval from the Audit Committee. With respect to the content and fees of non-audit services provided to Nomura by Ernst & Young ShinNihon LLC, its affiliated accounting firm Ernst & Young, and its associated companies within the same network, the Company has established a procedure whereby the Audit Committee conducts discussions and provides pre-approval and prior concurrence for these services upon receiving a request from the CFO.


  e.

Reasons for the Audit Committee’s Consent to the Accounting Auditor’s Fees, etc.

The Audit Committee has received necessary documents and reports from the CFO, relevant internal divisions, and the Accounting Auditor, and has confirmed the structure of the Accounting Auditor’s audit team, audit plan, status of the conduct of the audit, the status of development and operation of the audit firm’s quality control system, and the basis for the calculation of estimated audit fees, etc. Additionally, the Audit Committee conducts pre-approval procedures in accordance with Section 202 of the Sarbanes-Oxley Act of 2002, etc. and prior concurrence procedures in accordance with the IFAC Code of Ethics (Code of Ethics for Professional Accountants) and related regulations. Based on the results of such confirmations and procedures, the Audit Committee has verified the audit fees, etc. of the Accounting Auditor and determined that they are at a reasonable level to maintain and improve audit quality, and has given its consent pursuant to Article 399, Paragraph 1 of the Companies Act.


110


Table of Contents

(4) Compensation for Statutory Officers

Our compensation program for our Statutory Officers is outlined as follows. “Statutory Officers” refer to directors and executive officers of NHI.

1. Compensation Policy

Compensation for Statutory Officers is subject to two policies: the Nomura Group compensation policy that applies to our employees and Statutory Officers (“Basic Policy”), and the Compensation Policy for Directors and Executive Officers of NHI (“Policy for Statutory Officers”) that applies to Statutory Officers. We have developed these policies to enable us to achieve sustainable growth, deliver long-term growth in shareholder value, deliver excellence to our clients, enhance our competitive strength in the global markets and enhance our reputation. The Compensation Committee reviews and updates these policies. We also have established Compensation Recovery Policy separately.

We have established a compensation policy for our officers and employees, including senior managing directors of NHI and directors of our subsidiaries but excluding our Statutory Officers. This policy is referred to as our “Employee Policy.”

a. Basic Policy

Compensation Governance

As a Company with Three Board Committees, as defined under Japanese Companies Act, NHI has established an independent statutory Compensation Committee which comprises primarily Outside Directors as members. The Committee has established both our Basic Policy and our Compensation Policy for Statutory Officers, based on which compensation for Statutory Officers is determined.

With respect to the relevant policies and total compensation for our officers and employees other than Statutory Officers, decisions regarding employment and remuneration matters are delegated to our “Human Resources Committee” (“HRC”) by the Executive Management Board of NHI. The HRC is chaired by the Group CEO and an individual appointed by the chairman, taking into account financial and risk management perspectives. The HRC determines above matters with support from respective remuneration committees in each region.

The HRC establishes the Compensation Recovery Policy of NHI to comply with, among others, the U.S. Securities Exchange Act of 1934, as amended, and determines matters with respect to compensation of covered officers who are statutory officers of NHI under Japanese law, and is responsible for the management, operation, interpretation and administration of such.

Compensation Policies and Practices for Nomura Group’s Talent

We recognize that our employees are key in pursuing our Purpose, which is “We aspire to create a better world by harnessing the power of financial markets.”

Compensation for Nomura Group’s Talent is designed to support achieving sustainable corporate growth, increasing corporate value over the medium and long-term and maintaining sound and effective risk management, while contributing to the interest of our shareholders. In addition, to ensure that we attract, retain, motivate and develop talent, the level and structure of remuneration takes into account the roles and responsibilities of individuals as well as the market pay levels in Japan and overseas, and in line with any relevant laws and regulatory expectations.

(a) Sustainable corporate growth and increasing corporate value over the medium and long term

Our employee compensation policies aim to reinforce our corporate philosophy, to promote healthy corporate culture and behavior in line with our “Code of Conduct” and to align to our commitment to sustainability considerations.

Based on a pay-for-performance principle, our employee compensation programs are designed to be sound and competitive in the market and aligned to our strategic objectives and the goal of sustainable growth and increasing corporate value over the medium and long-term.


111


Table of Contents

(b) Sound and effective risk management

We seek to maintain sound and effective risk management with an appropriate risk appetite. We update performance measurement metrics and indicators used for determining compensation by considering both financial and non-financial risks underlying each business. Qualitative factors such as conduct, compliance, professional ethics and corporate philosophy are also considered in determining the final amount of remuneration provided to each officer and employee, which may include a reduction in compensation as a result of disciplinary actions.

In addition, when granting compensation, it shall be specified that in the event of a material revision of financial statements or a material violation of applicable laws and regulations or Nomura Group rules and policies, compensation may be subject to reduction, suspension, forfeiture of rights, cancellation, offset by other compensation, or repayment (so-called “clawback”).

(c) Alignment of interests with shareholders

Certain of our officers and employees’ remuneration package includes stock-based compensation awards linked to share price of NHI with an appropriate deferral period applied, in order to align with shareholders’ interests.

Approval and Revision of the Basic Policy

The approval, amendment or repeal of the Basic Policy is governed by our Compensation Committee of NHI.

b. Policy for Statutory Officers

Compensation of Statutory Officers is divided into fixed compensation and performance-linked compensation, with fixed compensation consisting of base salary and performance-linked compensation consisting of an annual bonus and long-term incentive plans. In order to provide incentives for the improvement of medium-to long-term corporate value and to align the interests of shareholders, a portion of the compensation is paid through stock-based compensation awards with specified deferral periods.

<Composition of Compensation for Statutory Officers>


Fixed Compensation


Performance-linked Compensation

Base salary   Annual Bonuses   Long-term Incentive Plan

Fixed Compensation


Base salary is paid in cash and determined based on factors such as professional background, career history, responsibilities and compensation standards of related business fields.

Performance-linked Compensation


With respect to the Group CEO, given the overall responsibility of business execution of the Nomura Group, the basic amount of the performance-linked compensation is calculated based on the level of achievement in actual value(s) against the target value(s) of key performance indicator(s) and performance metrics that form the basis for their calculation. In addition, qualitative evaluation competitor benchmarking is also reflected when determining final annual bonus amount.


With respect to Statutory Officers, the amount of annual bonus is determined with the annual bonus of Group CEO as standard baseline, taking into consideration roles and responsibilities, local remuneration regulations and compensation levels in each jurisdiction etc., in addition to a qualitative evaluation of individual performance.


Audit Committee members and outside directors are not bonus-eligible in order to maintain and ensure their independence from business execution.


  (a)

Annual Bonuses

In principle, certain portion of any annual bonus payment should be deferred.


  (b)

Long-term Incentive Plan

Payments under long-term incentive plans are made when a certain degree of achievements are accomplished.

Payments are made in stock-based compensation awards.


112


Table of Contents

When granting compensation, in the event of voluntary resignation, a material revision of financial statements or a material violation of applicable laws and regulations or Nomura Group rules and policies, compensation of Statutory Officers may be subject to reduction, suspension, forfeiture of rights, cancellation, offset by other compensation, or repayment (so-called “clawback”).

c. Employee Policy

Based on our “Basic Policy”, we have established our Employee Policy which applies to our officers and employees, including senior managing directors of NHI and directors of subsidiaries of NHI, but excluding our Statutory Officers.

Matters not provided for in our Employee Policy are governed by the provisions of our Basic Policy.

Compensation Governance

Supervised by the HRC, regional committees governing employee compensation are composed of representatives of Finance, Risk Management, Compliance, Human Resources, and other departments as appropriate. These regional committees implement our global compensation governance rules.

The proposed compensation of control function departments (such as Risk Management, Compliance, and Internal Audit) is not permitted to be determined by our front office business and performance evaluation of employees in these departments is not permitted to be determined solely by the financial performance of the business they support.

Compensation Policies and Practices

We recognize that our employees are key in pursuing our Purpose, which is “We aspire to create a better world by harnessing the power of financial markets.”

Compensation for our employees is designed to support achieving sustainable corporate growth, increasing corporate value over the medium and long-term and maintaining sound and effective risk management, while at the same time positively contributing to the interest of our shareholders. In addition, to ensure that we attract, retain, motivate and develop talent, the level and structure of remuneration takes into account the roles and responsibilities of individuals as well as market pay levels in Japan and overseas, in line with any relevant laws and regulatory expectations.

(a) Sustainable corporate growth and increasing corporate value over the medium and long term

The compensation policies for our employees aim to embody the Purpose which is “We aspire to create a better world by harnessing the power of financial markets” and our “Values of Entrepreneurial Leadership, Teamwork and Integrity”, to promote a healthy, diverse corporate culture and the right behavior in line with our “Code of Conduct” and to facilitate a greater alignment with sustainability considerations.

Based on a pay-for-performance principle, our compensation programs are designed to be sound and competitive in the market and aligned to our strategic objectives and the goal of sustainable growth and increasing corporate value over the medium and long-term.

Compensation at Nomura reflects and aligns with the performance of the Nomura Group as a whole, its divisions, as well as individual employees, taking into account both business strategy and market considerations.

(b) Sound and effective risk management

We seek to maintain sound and effective risk management with an appropriate risk appetite. We apply its performance measurement standards and indicators when determining compensation considering both financial and non-financial risks in each business, taking a holistic approach. Qualitative factors such as conduct, compliance, professional ethics and corporate philosophy are considered in determining the final amount of remuneration provided to each officer and employee, which may include a reduction in compensation.


113


Table of Contents

The compensation package offered to our employees comprises two key elements:


Fixed compensation – reflects the role, responsibilities and experience of the employee; and


Variable compensation – designed to incentivize performance, encourage the right behaviors and drive employee growth and development. For higher paid employees, a portion of variable compensation may be deferred, balancing short-term with our medium and long-term interests.

We seek to balance the components of compensation between fixed and variable according to the employee’s role and seniority. In principle, the proportion of compensation that is deferred increases with employee’s compensation. Guaranteed compensation is allowed only in limited circumstances such as for new hires or, where allowed, strategic business needs. Multi-year guarantees are typically prohibited.

In addition, when granting compensation, it shall be specified that in the event of a material revision of financial statements or a material violation of applicable laws and regulations or Nomura Group rules and policies, employees’ compensation may be subject to reduction, suspension, forfeiture of rights, cancellation, offset by other compensation, or repayment (so-called “clawback”).

(c) Alignment of interests with shareholders

Deferred variable compensation intends to align the interests of employees and NHI shareholders, and to encourage a long-term, sustainable approach to senior management and highly paid employees. For Nomura Group employees who receive a certain amount of remuneration, a portion of the remuneration is stock-based compensation awards linked to the price of NHI shares with an appropriate deferral period applicable, in order to align with shareholders’ interests.

Approval and Revision of the Employee Policy

The approval, amendment or repeal of the Employee Policy can be made by our HRC.

d. Compensation Recovery Policy

Article 1. (Purpose)

This Nomura Holdings, Inc. (“NHI”) Compensation Recovery Policy (this “Recovery Policy”), in addition to the Nomura Group compensation policy for all the employees and statutory officers (“Basic Policy”), Compensation Policy for Directors and Executive Officers of Nomura Holdings, Inc. (“Policy for Statutory Officers”) and the compensation policy for Nomura Group officers and employees, including senior managing directors of NHI and directors of subsidiaries of NHI but excluding Directors and Executive Officers of NHI (“Employee Policy”), establishes the policy to recover erroneously awarded Compensation received by current or former Officers. This Recovery Policy is designed to comply with Section 10D of the U.S. Securities Exchange Act of 1934, as amended (the “Exchange Act”), Rule 10D-1 thereunder, and Section 303A.14 of the New York Stock Exchange Listed Company Manual (“Section 303A.14”), and will be interpreted and applied accordingly. Capitalized terms used in this Recovery Policy are defined as provided herein.

Article 2. (Definitions)

1. “Compensation” means any compensation that is granted, earned, or vested based wholly or in part upon the attainment of a Financial Reporting Measure.

2. “Covered Event” means where NHI is required to prepare an accounting restatement due to the material noncompliance of NHI with any financial reporting requirement under the securities laws, including any accounting restatement to correct an error in previously issued financial statements that is material to the previously issued financial statements, or that would result in a material misstatement if the error were corrected in the current period or left uncorrected in the current period.

3. “Financial Reporting Measure” means (a) any measure that is determined and presented in accordance with the accounting principles used in preparing NHI’s financial statements, and any measures that are derived wholly or in part from such measures and (b) NHI’s stock price or the total shareholder return of NHI. A measure, however, need not be presented with the financial statements or included in a filing with the U.S. Securities and Exchange Commission (“SEC”) to constitute a Financial Reporting Measure.

4. “Officers” means any person who is or was an “executive officer” of NHI, as determined pursuant to Section 303A.14.

5. “Restatement Date” means the earlier to occur of: (i) the date NHI’s Board of Directors concludes, or reasonably should have concluded, that the Covered Event has occurred; or (ii) the date a court, regulator, or other legally authorized body directs NHI to prepare any accounting restatement as described in the definition of the Covered Event.


114


Table of Contents

Article 3. (Scope)


1.

This Recovery Policy shall apply to Compensation received by a current or former Officer (a “Covered Person”) on or after October 2, 2023:


  (1)

after beginning service as an Officer;


  (2)

who served as an Officer at any time during the performance period for the Compensation;


  (3)

while NHI has a class of securities listed on a national securities exchange or a national securities association registered with the SEC; and


  (4)

during the three completed fiscal years immediately preceding the Restatement Date (or such longer period as required under Section 303A.14 in the event NHI changes its fiscal year).


2.

Compensation is deemed received in NHI’s fiscal period during which the Financial Reporting Measure specified in the Compensation award is attained, even if the payment or grant of the Compensation occurs after the end of that period.

Article 4. (Recovery)


1.

Upon the occurrence of a Covered Event, NHI shall recover the following amount from a Covered Person: the amount of Compensation received that exceeds the amount of Compensation that otherwise would have been received had it been determined based on the restated Financial Reporting Measures, computed without regard to any taxes paid on such Compensation.


2.

If the amount of the Compensation received by a Covered Person was based on NHI’s stock price or total stockholder return and is not subject to mathematical recalculation directly from the information in the accounting restatement described in the Covered Event, the amount to be recovered shall be based on a reasonable estimate of the effect of the accounting restatement on the stock price or total stockholder return upon which the Compensation was received. NHI shall obtain and maintain all documentation of the determination of such reasonable estimate and provide such documentation to the NYSE when required.


3.

Recoupment of Compensation pursuant to this Recovery Policy shall be made on a “no fault” without regard to whether any misconduct occurred or whether any Covered Person has responsibility for the noncompliance that resulted in the Covered Event.


4.

NHI must recover the amount in accordance with Paragraph 1 above except to the extent the majority of the independent directors of NHI has made a determination that recovery would be impracticable for any of the following reasons:


  (1)

The direct expense paid to a third party to assist in enforcing this Recovery Policy would exceed the amount to be recovered, provided that before concluding that it would be impracticable to recover any Compensation based on the exception contemplated under this Article 4 Paragraph 4(1), NHI shall make a reasonable attempt to recover such Compensation, and shall document such reasonable attempt(s) to recover and provide that documentation to the NYSE when required.


  (2)

Recovery would violate an applicable home country law adopted prior to November 28, 2022, provided that before concluding that it would be impracticable to recover any amount of Compensation based on the exception contemplated under this Article 4 Paragraph 4(2), NHI shall engage legal counsel experienced and qualified to practice law in the applicable jurisdiction (if such counsel is acceptable to the NYSE) to render an opinion that recovery would result in a violation of law and shall provide such opinion to the NYSE; or


  (3)

Recovery would likely cause an otherwise tax-qualified, broad-based retirement plan of NHI to fail to meet the requirements of 26 U.S.C. 401(a)(13) or 26 U.S.C. 411(a) and regulations thereunder.


5.

Any right of recovery under this Recovery Policy is in addition to, and not in lieu of, any other remedies or rights of recovery that may be available to NHI pursuant to the terms of any award agreement and any other legal remedies available to NHI.

Article 5. (Method of Recovery)


1.

To recover the erroneously awarded compensation in accordance with Article 4, NHI may or may cause its subsidiaries to (a) cancel any unvested portion of the Compensation previously awarded; (b) forfeit any vested but unpaid portion of the Compensation previously awarded; (c) require the Covered Person to repay any amount equivalent to the Compensation subject to recoupment; (d) seek recovery of any gain realized on or since the vesting, exercise, settlement, sale, transfer, or other disposition of any share-based awards; (e) offset the recouped amount from any compensation otherwise owed by NHI to the Covered Person (including, without limitation, any severance otherwise payable by NHI to the Covered Person); use any other remedial and recovery method authorized by applicable law or contract.


2.

NHI will determine, in its sole discretion, the terms on which and the process by which erroneously awarded compensation must be recovered. Any sums owed to NHI under this Recovery Policy may be deducted from relevant individual’s salary or any outstanding payments due from NHI or its subsidiaries in accordance with applicable laws and as authorized by contract.


115


Table of Contents

Article 6. (No Indemnification)

Neither NHI nor any of its subsidiaries or affiliates shall indemnify any Covered Person against the loss of any Compensation recovered under this Recovery Policy. Further, neither NHI nor any of its subsidiaries or affiliates shall pay or reimburse any Covered Person for any insurance policy entered into by a Covered Person that provides for full or partial coverage of any recoupment obligation under this Recovery Policy.

Article 7. (Disclosure)


1.

NHI shall disclose this Recovery Policy and its amendments in accordance with applicable laws.


2.

If the Covered Event has occurred that require recovery of Compensation pursuant to this Recovery Policy, NHI shall disclose the matters as required in accordance with applicable laws.

Article 8. (Committee)

The Human Resources Committee of NHI shall be responsible for the management, operation, interpretation and administration of this Recovery Policy to the extent permitted by applicable laws. Furthermore, the Compensation Committee of NHI shall determine matters with respect to Compensation of Officers who are statutory officers of NHI under Japanese law. The Compensation Committee and the Human Resources Committee of NHI shall have the discretion to interpret the terms of this Recovery Policy and make determinations under it, and any action taken by each committee pursuant to this Recovery Policy shall be within the absolute discretion of such committee. Any interpretations or determinations made by each committee or its delegate shall be final and binding on all affected individuals.

Article 9. (Amendments)

Any amendments or termination of this Recovery Policy, which may only be made to the extent permitted under the rules of the NYSE, shall be made by resolution of the Compensation Committee of NHI.

2. Compensation for Statutory Officers

a. Scheme of Compensation for Statutory Officers

The following picture presents the scheme of compensation for Statutory Officers.


LOGO

b. Determination method of performance-linked compensation

Compensation of Statutory Officers is divided into fixed compensation and performance-linked compensation, with fixed compensation consisting of base salary and performance-linked compensation consisting of annual bonus and long-term incentive plans. With respect to the President and the Group CEO, the total compensation, which consists of fixed compensation and performance linked compensation, is determined by considering quantitative factors as well as qualitative factors including competitor benchmarking etc. With respect to Statutory Officers, their Annual Bonus and Total Compensation are determined based on the ones of the Group CEO, reflecting individual roles and responsibilities, respective jurisdiction’s regulations and compensation level etc. in addition to the qualitative elements. For the Long-Term Incentive Plan, see “(3) Matters related to Stock Compensation and Non-Monetary Compensation (iii) PSU as the Long-Term Incentive Plan.”


116


Table of Contents

(a) Quantitative elements

In order to ensure alignment with Nomura Group’s management vision and business strategy, we select key performance indicators and performance metrics that form the basis for its calculation. Additionally, we choose stock price-related indicators to promote alignment of interests with shareholders. In the current fiscal year, NHI achieved the target of 8-10%+ for ROE.


Type of elements


Item

   Actual for the year
ended March 31, 2026
 

Profit and loss

   Net revenue    ¥ 2,167.7 billion  
   Revenue cost coverage ratio(1)      75.1
   Income before income taxes    ¥ 539.8 billion  

Per share information

   Earnings per Share (“EPS”)    ¥ 118.99  

Capital efficiency

   ROE      10.1

Shareholder returns

   Total Shareholder Return (“TSR”)(2)      138.2
 

(Notes)


1.

Ratio calculated by dividing Total non-interest expenses by Net revenue

2.

The value obtained by dividing the total of fluctuations in the price of NHI shares and dividends in the current fiscal year by the NHI share price at the end of the previous business year.

(b) Qualitative elements

To promote enhancement of Nomura Group’s corporate value and the realization of a sustainable society, we have selected strategic management, as well as initiatives related to community, talent, and inclusion, as evaluation criteria.

c. Matters relating to Stock Based Compensation and Non-Monetary Compensation


  (a)

Outline of current Stock Based Compensation Awards

The outline of current Stock Based Compensation Awards is as follows.


Type of award


Key features

Restricted Stock Units (“RSUs”)   

Settled in the Company’s common stock.

Graded vesting period is set as three years in principle.

Notional Stock Units (“NSUs”)   

Linked to the price of the Company’s common stock and cash-settled in local currency.

Graded vesting period is set as three years in principle.

Performance Share Units (“PSUs”)   

The number of shares to be awarded will be determined based on the achievement of the performance targets during the three—fiscal—year performance evaluation period.


  (b)

Stock Based Compensation as Non-Monetary Compensation

In principle, half of the aggregate amount of the Annual Bonus of the Statutory Officers is paid in deferred compensation and we use RSUs that qualify as non-cash compensation. Furthermore, the Company has introduced PSUs as a long-term incentive plan.


  (c)

PSU as the Long-Term Incentive Plan

Under NHI’s PSU program, the base number of NHI shares to be granted is initially determined based on Nomura’s performance and other factors of the previous fiscal year. Following the performance period, the number of NHI shares to be awarded will vary from 0% to 150% of the base number of NHI shares depending on the degree of achievement of the performance targets for the three fiscal years. The settlement of the PSU will be primarily in NHI common shares held as treasury stock.

The performance indicators used in the evaluation are ROE and TSR. Please refer to the following for details.

Performance indicators selected as Basis of calculation

In order to enhance NHI’s corporate value over the medium-to long-term and to align NHI’s interests with those of its shareholders, a combination of ROE (average value over the performance evaluation period) and TSR (absolute value over the performance evaluation period) will be the basis to calculate the award amount.

Calculation Method for the base number of shares and the number of shares to be granted


Calculation method for the base number of shares:

The base number of NHI shares shall be calculated by dividing the amount determined with reference to the performance and qualitative evaluation of the target fiscal year, as well as competitor benchmarking with the NHI share price at the time of grant.


117


Table of Contents
   

Calculation method for the number of NHI shares to be granted:

After the end of the performance evaluation period, the number of NHI shares to be granted will be calculated in accordance with the following method.


Performance Evaluation Indicators and Grant Ratio


Performance Indicators

   Composition
ratio
    Change in the
grant ratio
    

Evaluation method

ROE

     50     0%~150%      Calculated based on the actual (average) values for the three-year performance evaluation period

TSR

     50     0%~150%      Calculated based on the actual value (absolute value) during the three-year performance evaluation period

The calculation methods for ROE and TSR, which form the basis for performance evaluation, are as follows:

<ROE>

If the actual average value for the performance evaluation period of three years reaches the management goal of 8% set by Nomura Group, a corresponding number of benchmark shares will be granted. If the actual value reaches 5%, 50% of the benchmark shares will be granted, and if it reaches 12% or more, 150% of the benchmark shares will be granted. However, if the actual value does not exceed either the lowest value of the past three business years, including the grant year, or 3%, no grant will occur.

<TSR>

If the actual value (absolute value) for the performance evaluation period of three years reaches 125%, a corresponding number of benchmark shares will be granted. However, if the actual value is 100% or below, no grant will occur. Furthermore, if the actual value reaches 150% or more, 150% of the benchmark shares will be granted. The calculation process of the actual value is as follows:

3-Year TSR = (Closing Stock Price (B) + Total Dividends during the performance evaluation period) / Initial Stock Price (A)

A: Initial Stock Price (Average closing price one month before the start of the performance evaluation period)

B: Final Stock Price (Average closing price one month before the end of the performance evaluation period)


118


Table of Contents
   

Calculation method for the number of NHI shares to be paid:

The number of NHI shares to be granted is calculated by multiplying the base number of NHI shares by the weighted average of the grant ratio based on ROE and the grant ratio based on TSR. The base number of NHI shares for the PSU for the year ended March 31, 2026 has been calculated as 541,000 NHI shares, and the number of NHI shares when applying a payout rate of 150% is 811,500 shares.


LOGO


Performance evaluation period and payment schedule:

The performance evaluation period shall be three years from the fiscal year in which the base number of PSUs is determined. After the performance evaluation period has concluded, the evaluation shall be finalized and the stock compensation based on PSUs shall be paid.

Delivery Method

The NHI shares awarded at the end of the performance period will be primarily issued from treasury stock.

(d) Effect of payment of stock-based compensation as deferred compensation

By providing equity-linked compensation as deferred compensation, the economic value of the compensation is linked to the stock price of NHI, and a certain vesting period is set.


Alignment of interests with shareholders.


Medium to long term incentives and retention by providing an opportunity for the economic value of Deferred Compensation at the time of grant to be increased by a rise in shares during a period of time from grant to vesting.


Promotion of cross-divisional collaboration and cooperation by providing a common goal of increasing corporate value over the medium to long term.

Due to these benefits, the active use of Deferred Compensation is also recommended by regulators in the key jurisdictions in which we operate.

With respect to Deferred Compensation in Nomura, a deferral period is generally three or more years from the following fiscal year or later. This is in line with the “Principles for Sound Compensation Practices” issued by the Financial Stability Board which recommends, among other things, a deferral period of three or more years.


119


Table of Contents

3. Compensation for Statutory Officers by Category, Status, and Type

Pursuant to the fundamental approach and framework of compensation as described above, and as a company which adopts a committee-based corporate governance system, the Compensation Committee of NHI determines the compensation of NHI’s Statutory Officers in accordance with our compensation policies.


a.

Aggregate Compensation for Statutory Officers

The following table presents a summary of aggregate compensation awarded to our Statutory Officers for the year ended March 31, 2026.


     Number(1)     Millions of yen  
    Year ended March 31, 2026  
    Fixed
compensation
    Performance-linked compensation     Total  
    Monetary
compensation
    Non-monetary
compensation
 
    Base salary     Cash Bonuses     NSUs(2)     RSUs(2)     PSUs(2)  

Directors

     11     ¥ 351     ¥ 355     ¥ 437     ¥ —      ¥ —      ¥ 1,143  

(Outside Directors included in above)

     (9     (194     (—      (—      (—      (—      (194

Executive Officers

     8       639       2,720       3,314       170       528       7,371  


Total

     19     ¥   990     ¥   3,075     ¥   3,751     ¥   170     ¥   528     ¥ 8,514  


1

Includes one director and one executive officer who retired in June 2025, and one director and one executive officer who were appointed in the same month. There were ten directors and seven executive officers as of March 31, 2026. Compensation to directors who were concurrently serving as executive officers is included within “Executive Officers.”

2

Represents deferred stock-based compensation awards granted in prior years recognized as expense in the Consolidated Financial Statement of Income for the year ended March 31, 2026. The expense of NSUs is remeasured to fair value at each balance sheet date, while the amounts of RSUs and PSUs are measured at fair value on the grant date. For more details, see Note.1 “Summary of accounting policies” in our consolidated financial statements.

3

Total compensation paid to outside directors for their services to subsidiaries of the Company was ¥72 million for the year ended March 31, 2026.


120


Table of Contents
b.

Compensation of Directors and Executive Officers receiving ¥100 million or above

The following table presents details of the compensation paid to our Statutory Officers for the year ended March 31, 2026, where such total amount given to the individual is ¥100 million or above. The total amount does not match above “a. Aggregate Compensation for Statutory Officers” which is recorded as an accounting expense, as it reflects the resolution amount in the compensation committee. In addition, the RSUs, NSUs and PSUs shown in the table below do not represent amounts received by each officer in cash or in shares during the fiscal year.

In order to ensure that Nomura Group attracts, retains, motivates and develops talent, the level and structure of remuneration takes into account the roles and responsibilities of individuals as well as the market pay levels in Japan and overseas, doing so in line with any relevant laws and regulatory expectations. Additionally, in order to provide incentives for the improvement of medium-to long-term corporate value and to align the interests of shareholders, a portion of the compensation is paid through stock-related incentives with a specified deferral period. Furthermore, with respect to such stock-related incentives, the economic value ultimately received by each officer may vary depending on vesting conditions, performance conditions, NHI share price fluctuations and other factors, and may be subject to reduction, forfeiture or clawback after grant in accordance with the Group’s rules and regulations. For more details, please refer to the above-mentioned “1. Compensation Policy a. Basic Policy” and “b. Policy for Statutory Officers.” In the current fiscal year, quantitative indicators were favorable, notably with Income before income taxes for the year amounting to ¥539.8 billion and ROE reaching 10.1%, thereby achieving the Company’s management target of 8-10%+ for ROE. Taking this into consideration, the amount of performance-linked compensation has been increased.


            Millions of yen  
            Fixed Compensation     Performance-linked Compensation     Total  

Name

  Company  

Role

  Cash     Cash Bonuses     RSUs or
NSUs(1)
    PSUs(2)  

Koji Nagai

  Nomura   Chairman of the Board of Directors   ¥ 91.2     ¥ 355.4     ¥ 355.4     ¥ 0.0     ¥ 802.0  

Kentaro Okuda

  Nomura   Director, Representative Executive Officer (Group CEO)   ¥   119.4     ¥   592.4     ¥   592.4     ¥   340.4     ¥ 1,644.6  

Yutaka Nakajima

  Nomura   Director, Representative Executive Officer   ¥ 90.0     ¥ 325.8     ¥ 325.8     ¥ 187.2     ¥ 928.8  

Toshiyasu Iiyama

  Nomura   Executive Officer   ¥ 86.4     ¥ 248.8     ¥ 248.8     ¥ 0.0     ¥ 584.0  

Takumi Kitamura

  Nomura   Executive Officer   ¥ 80.4     ¥ 104.8     ¥ 104.8     ¥ 0.0     ¥ 290.0  

Sotaro Kato

  Nomura   Executive Officer   ¥ 73.2     ¥ 103.4     ¥ 103.4     ¥ 0.0     ¥ 280.0  

Hiroyuki Moriuchi(3)

  Nomura   Executive Officer   ¥ 58.2     ¥ 120.9     ¥ 120.9     ¥ 0.0     ¥ 300.0  

Christopher Willcox(4)

  Nomura   Executive Officer   ¥ 113.0     ¥ 1,223.6     ¥ 1,223.6     ¥ 0.0     ¥   2,560.2  
  (Unit: thousands of U.S. dollars)   $ (750.0   $ (8,125.0   $ (8,125.0   $ 0.0     $ (17,000.0
 
1

As the payment is deferred over a period of three years following the grant, the amount stated herein differs from the compensation actually received by each individual during the year ended March 31, 2026.

2

Represents expenses recognized for the year ended March 31, 2026.

3

Appointed Executive Officer in place of Yosuke Inaida on June 24, 2025.

4

The equivalent U.S. dollar amounts, based on an exchange rate of US$1 = ¥150.6, are presented in parentheses in the row below.


121


Table of Contents
c.

Meetings of our Compensation Committee during the year

(a) Composition of Compensation Committee

Our Compensation Committee is composed of three members below.

Chairman: Taku Oshima (Outside Director)

Member: Takahisa Takahara (Outside Director)

Member: Miyuki Ishiguro (Outside Director) (1)

1 Miyuki Ishiguro was appointed committee member in place of Koji Nagai on June 24, 2025.

(b) Deliberation matters and attendance status in the Compensation Committee

The following table presents a summary of the meetings held by our Compensation Committee during the year ended March 31, 2026, a summary of key matters discussed, resolutions passed and attendance by members.


Date        Summary of the discussion and the resolution  

Attendance records

of the member

April 25, 2025

  Resolution:  

The annual bonus and Long Term Incentive Plan for the year ended March 31, 2025.

  All members attended

June 24, 2025

  Resolution:  

The appointment of the director with the right to convene the board of directors meetings.

The director who reports the executions of the committee’s duties to the board of the directors meetings.

Individual base salary of the statutory officers.

Granting RSUs and NSUs to the statutory officers.

Granting PSUs to the representative executive officers.

The amendment to the Basic Policy.

  All members attended
    Reporting:  

Schedule for current fiscal year.

The Policy for statutory officers and the Compensation Recovery Policy.


September 25, 2025

  Discussion:  

Eligible Recipients of Long Term Incentive Plan.

Base salary of the directors and executive officers.

  All members attended

December 4, 2025

  Resolution:  

Eligible Recipients of Long Term Incentive Plan.

Base salary of the directors and executive officers.

  All members attended

March 27, 2026

  Resolution:  

Individual base salary of the directors and executive officers effective from April.

  All members attended

Through discussions and resolutions of the above topics, our Compensation Committee confirmed that compensation for our Statutory Officers in respect of the year ended March 31, 2026 was appropriate and consistent with our relevant compensation policies. A summary of these meetings has been reported to the Board of Directors.


122


Table of Contents

(5) Status of Equity Investment

1. Standards and concepts for classification of equity investment

The pure investment purpose is to obtain profits mainly from capital gain or dividends income.

Equity investments held for the purpose of other than pure investment include investments such as strategic shareholdings, which are held to create business opportunities, and to maintain, strengthen, and expand business relationships with the company whose shares are held.

2. Equity investments held for the purpose of other than pure investment


a.

Method of verifying holding policies and the reasonableness of holding, and the content of assessment by the Board of Directors regarding the appropriateness of holding individual shares

The basic policy for strategic shareholdings and the methods to verify the reasonableness of the holding are as follows.


  *

The Company shall consider the risks and costs involved in holding such shares and perspectives of business strategy, such as opportunities to increase the revenues of the Company’s businesses through the expansion of transactions or business alliances with the company whose shares are held, and shall hold such shares only if such shareholdings will contribute to maintaining/enhancing the corporate value of the Nomura Group.


  *

The Board of Directors shall establish the Investment Securities Committee for the purpose of conducting continuous considerations with respect to the purpose of the holding of strategic shareholdings within the Nomura Group.


  *

After consideration of the holding status of strategic shareholdings along the lines of the policy by the Investment Securities Committee, concerning stocks whose sale has been determined to be reasonable, the Company shall proceed with the sale of such stocks while taking into consideration the impact on the market and other circumstances.


  *

The Board of Directors shall assess the content of what was considered at the Investment Securities Committee.

Nomura, in principle, plans to proceed with the sale of its strategic shareholdings taking into account the market impact and other circumstances that need to be considered. Nomura is examining the rationality of its holdings for which it will continue to hold, based on an internal verification process.

Specifically, Nomura regularly conducts quantitative analyses of all of its strategic holdings. Nomura verifies whether the return on required capital (revenues from transactions with issuer companies and dividends received) exceeds the standard level, and if the standard is met, Nomura allows the consideration of continuous holding and conducts continuous monitoring. If the standard is not met, Nomura will perform qualitative analyses. In the qualitative analyses, Nomura will determine whether to allow the consideration of continuous holding or to purse a sale, taking into account the expected future earnings including medium to long term earnings, the purpose and period of holding, the relationship with the issuer and the local economy, and other significant elements.


LOGO

Nomura generally holds the Investment Securities Committee twice a year. The Committee examines the quantitative and qualitative elements mentioned above, confirms the significance of holdings, and discusses policies for additional actions. At the Board of Directors meeting held on June 24, 2025 and January 30, 2026, the Board of Directors examined the appropriateness of holdings based on the contents discussed in the Investment Securities Committee, and confirmed the progress of the reduction and sale of shares as a result of the deliberations by the Committee.


123


Table of Contents

b. Number of the different securities and amount on balance sheet


     Securities        Millions of yen     
    
Number of the different
securities


Amount on

balance sheet


Non-listed securities

     109        12,625  

Listed securities

     58        97,173  

(Securities whose number of shares increased during the fiscal year ended March 31, 2026)

     Securities      Millions of yen       
     Number of the different
securities
     Acquisition cost for the
increase in number of shares
    

Reason for the increase in

number of shares

Non-listed securities

     2        53      Investment in the Sustainable Innovation Investment Scheme and investment in improving the efficiency of securities firms’ middle- and back-office operations

Listed securities

     1        100      Increased due to stock listing

(Securities whose number of shares decreased during the fiscal year ended March 31, 2026)

     Securities      Millions of yen       
    
Number of the different
securities
 
 
     Proceeds from sale of shares  

Non-listed securities

     10        70  

Listed securities

     4        4,442  


124


Table of Contents

c. Information on number of shares, amount on balance sheet, etc. by security


     Year ended March 31,
2026
     Year ended March 31,
2025
          
     in thousand
shares
     Millions of
yen
     in thousand
shares
     Millions of
yen
          

Name of security

   Number of
shares
     Amount on
balance
sheet
     Number of
shares
     Amount on
balance
sheet
     Purpose,overview
of business
alliances, and
quantitative effect of
holding
  Holder of the
Company’s
shares

Japan Exchange Group, Inc.

     8,858        16,002        8,858        13,531      D   No

TOYOTA MOTOR CORPORATION

     4,441        14,043        4,441        11,618      B   No

The Chiba Bank, Ltd.

     5,693        11,364        5,693        7,965      E   Yes

The Gunma Bank, Ltd.

     3,168        6,534        3,168        3,901      F   Yes

C.Uyemura & Co., Ltd.

     229        4,512        229        2,295      B   No

Shizuoka Financial Group, Inc.

     1,500        3,844        1,500        2,435      G   No

Nishi-Nippon Financial Holdings, Inc.

     922        3,417        922        1,927      A   No(5)

Otsuka Holdings Co., Ltd.

     300        3,303        300        2,326      B   No

Iyogin Holdings, Inc.

     934        2,644        934        1,642      A   No(5)

Hokuhoku Financial Group, Inc.

     413        2,412        413        1,061      A   No(5)

Juroku Financial Group, Inc.

     262        2,324        262        1,264      A   No(5)

NIPPON EXPRESS HOLDINGS, INC.

     618        2,190        618        1,681      B   No(5)

The Musashino Bank, Ltd.

     313        1,957        313        1,021      I   Yes

Mebuki Financial Group, Inc.

     1,519        1,812        1,519        1,102      H   No

Nippon Television Holdings, Inc.

     548        1,730        548        1,674      B   No(5)

Kyushu Financial Group, Inc.

     1,395        1,573        1,395        1,027      A   No(5)

North Pacific Bank, Ltd.

     1,670        1,561        1,670        863      A   No

HOKKO CHEMICAL INDUSTRY CO., LTD.

     836        1,427        836        1,074      C   Yes

Hachijuni Nagano Bank, Ltd.

     693        1,335        693        732      A   No

The Bank of Nagoya, Ltd.

     233        1,311        78        611      J(4)   Yes

The Awa Bank, Ltd.

     200        1,138        200        572      K   Yes

Dai-ichi Life Holdings, Inc.

     800        1,137        200        906      B(4)(6)   No

Aichi Financial Group, Inc.

     152        1,044        152        435      A   No

Heiwa Corporation

     400        747        400        938      B   No

AEON Financial Service Co., Ltd.

     474        738        474        625      B   No

Seven & i Holdings Co., Ltd.

     328        696        328        709      B   No

Procrea Holdings, Inc.

     207        643        207        352      A   No

The Bank of Iwate, Ltd.

     100        637        100        316      A   No

Daishi Hokuetsu Financial Group, Inc.

     326        608        109        342      A(4)   No(5)

TOMONY Holdings, Inc.

     723        588        723        389      A   No(5)

Senshu Ikeda Holdings, Inc.

     626        537        626        272      A   No

Fukuoka Financial Group, Inc.

     88        517        88        345      L   No(5)

NIPPON SHOKUBAI CO., LTD.

     160        363        160        279      B   No

Chugin Financial Group, Inc.

     119        329        119        198      A   No

The Toho Bank, Ltd.

     312        202        312        111      M   Yes

ALPHA SYSTEMS INC.

     59        200        59        193      B   No

SHINNIHON CORPORATION

     94        183        94        148      A   No

FUNDINNO, Inc.

     200        178        N/A        N/A      Q(7)   No

Yamaguchi Financial Group, Inc.

     69        167        69        122      A   No

HIRAKAWA HEWTECH CORP.

     42        164        40        56      B(4)   Yes

THE TOTTORI BANK, LTD.

     85        138        85        108      A   No

THE TOCHIGI BANK, LTD.

     139        120        139        44      A   No

THE BANK OF SAGA LTD.

     25        117        25        58      A   Yes

HEIWA REAL ESTATE CO., LTD.

     40        97        20        94      B(4)   Yes

The Ehime Bank, Ltd.

     61        94        61        66      A   No

The Shimizu Bank, Ltd.

     38        92        38        56      A   Yes

The Hyakujushi Bank, Ltd.

     10        84        10        35      N   No

The Miyazaki Taiyo Bank, Ltd.

     37        82        37        47      A   Yes

THE TAIKO BANK, LTD.

     20        46        20        29      A   No

The Kita-Nippon Bank, Ltd.

     10        45        10        32      A   Yes

MINAMI NIPPON BANK, LTD.

     27        38        27        23      A   Yes

Bank of The Ryukyus, Limited

     13        29        13        15      A   No

THE BANK OF KOCHI, LTD.

     22        23        22        18      A   No

FIDEA Holdings Co. Ltd.

     10        18        10        15      A   No

CHIKUHO BANK Ltd.

     9        16        9        12      A   No

Artiza Networks, Inc.

     20        13        20        12      B   No

Poplar Co., Ltd.

     53        9        53        11      A   No

SONOCOM CO., LTD.

     2        2        N/A        N/A      B   Yes

Hirogin Holdings, Inc.

     —         —         1,500        1,817      P   No(5)

Suruga Bank Ltd.

     —         —         1,136        1,527      P   No

HIROSE ELECTRIC CO., LTD.

     —         —         55        953      O   No

The Ogaki Kyoritsu Bank, Ltd.

     —         —         62        146      P   Yes


125


Table of Contents

(Note)

1.

It is difficult to describe the effects of quantitative retention because of the diversified reasons. See (5) 2a for the verification

method.

2.

N/A means that the amount of securities on the balance sheet is not more than 1% of shareholders’ equity of the Company and not in top 60.

3.

Purpose, overview of business alliances, and quantitative effect of holding

  A:

To create business opportunities, and to maintain, strengthen, and expand business relationships and relationships with local economies, mainly in the Wealth Management Division.

  B:

To create business opportunities, and to maintain, strengthen, and expand business relationships, mainly in the Wholesale Division.

  C:

To create business opportunities, and to maintain, strengthen, and expand business relationships and relationships with local economies, mainly in the Corporate Division.

  D:

Nomura Securities Co., Ltd., a subsidiary of the Company, is a trading participant of the Tokyo Stock Exchange. Shares are held in order to contribute to the JPX Group providing an optimal trading platform with fairness, safety, and reliability. In addition, by maintaining and enhancing business relationships between Nomura Group and the JPX Group, the Company aims to create and expand business opportunities, particularly in the Wholesale Division, and maintain and expand business alliances related to BOOSTRY’s operations and business aimed at promoting digital asset-related business initiatives.

  E:

Wealth Square Co., Ltd., a subsidiary of the Company, has been offering the discretionary investment management service “TSUBASA Fund Wrap” since March 18, 2021, with The Chiba Bank, Ltd., as a registered financial institution that intermediates the execution of discretionary investment contracts, and Chibagin Securities Co., Ltd., a subsidiary of The Chiba Bank, Ltd., as a financial instruments business operator to which the company entrusts agency services for the execution of discretionary investment contracts. Including such partnerships, shares are held in order to create business opportunites, and to maintain, strengthen, and expand business relationships, and relationships with local economies, mainly in the Wealth Management Division.

  F:

Wealth Square Co., Ltd., a subsidiary of the Company, has been offering the discretionary investment management service “Gungin Fund Wrap” since February 22, 2024, with The Gunma Bank, Ltd., as a registered financial institution that intermediates the execution of discretionary investment contracts, and Gungin Securities Co., Ltd., a subsidiary of The Gunma Bank, Ltd., as a financial instruments business operator to which the company entrusts agency services for the execution of discretionary investment contracts. Including such partnerships, shares are held in order to create business opportunites, and to maintain, strengthen, and expand business relationships, and relationships with local economies, mainly in the Wealth Management Division.

  G:

Wealth Square Co., Ltd., a subsidiary of the Company, has been offering the discretionary investment management service “Shizugin Wrap (Wealth Square)” since October 26, 2020, with Shizugin TM Securities Co., Ltd., a subsidiary of Shizuoka Financial Group, Inc., as a financial institution to which the company entrusts agency services for the execution of discretionary investment contracts. Including such partnerships, shares are held in order to create business opportunites, and to maintain, strengthen, and expand business relationships, and relationships with local economies, mainly in the Wealth Management Division.


126


Table of Contents
  H:

Wealth Square Co., Ltd., a subsidiary of the Company, has been offering the discretionary investment management service “Mebuki Fund Wrap” with The Joyo Bank, Ltd. (from October 1, 2021) and The Ashikaga Bank, Ltd. (from October 8, 2021) as a registered financial institutions that intermediate the execution of discretionary investment contracts, and Mebuki Securities Co., Ltd., a subsidiary of Mebuki Financial Group, Inc., (from October 1, 2021) as a financial instruments business operator to which the company entrusts agency services for the execution of discretionary investment contracts. Including such partnerships, shares are held in order to create business opportunites, and to maintain, strengthen, and expand business relationships, and relationships with local economies, mainly in the Wealth Management Division.

  I:

Wealth Square Co., Ltd., a subsidiary of the Company, has been offering the discretionary investment management service “TSUBASA Fund Wrap” since July 1, 2021, with The Musashino Bank, Ltd., as a registered financial institution that intermediates the execution of discretionary investment contracts, and Chibagin Securities Co., Ltd., a subsidiary of The Chiba Bank, Ltd., as a financial instruments business operator to which the company entrusts agency services for the execution of discretionary investment contracts. Including such partnerships, shares are held in order to create business opportunites, and to maintain, strengthen, and expand business relationships, and relationships with local economies, mainly in the Wealth Management Division.

  J:

Wealth Square Co., Ltd., a subsidiary of the Company, has been offering the discretionary investment management service “Meigin Wrap (Wealth Square)” since December 1, 2023 with The Bank of Nagoya, Ltd., as a registered financial institution that intermediates the execution of discretionary investment contracts, and Shizugin TM Securities Co., Ltd., a subsidiary of Shizuoka Financial Group, Inc., as a financial instruments business operator to which the company entrusts agency services for the execution of discretionary investment contracts. Including such partnerships, shares are held in order to create business opportunites, and to maintain, strengthen, and expand business relationships, and relationships with local economies, mainly in the Wealth Management Division.

  K:

Nomura Securities Co., Ltd., a subsidiary of the Company, and The Awa Bank, Ltd., finalized a comprehensive business alliance agreement aimed at providing financial intermediary services on June 26, 2020. Including such partnerships, shares are held in order to create business opportunites, and to maintain, strengthen, and expand business relationships, and relationships with local economies, mainly in the Wealth Management Division.

  L:

Wealth Square Co., Ltd., a subsidiary of the Company, has been offering the discretionary investment management service aimed towards institutional clients, “FFG Corporate Fund Wrap,” with FFG Securities Co., Ltd., a subsidiary of Fukuoka Financial Group, Inc., (from May 7, 2019) as a financial institution entrusted with agency services for the execution of discretionary investment contracts. Including such partnerships, shares are held in order to create business opportunites, and to maintain, strengthen, and expand business relationships, and relationships with local economies, mainly in the Wealth Management Division.

  M:

Nomura Securities Co., Ltd., a subsidiary of the Company, and The Toho Bank, Ltd., finalized a comprehensive business alliance agreement aimed at providing financial intermediary services on July 26, 2024. Including such partnerships, shares are held in order to create business opportunites, and to maintain, strengthen, and expand business relationships, and relationships with local economies, mainly in the Wealth Management Division.

  N:

Wealth Square Co., Ltd., a subsidiary of the Company, has been offering the discretionary investment management service “Fund Wrap” since April 1, 2022, with Nomura Securities Co., Ltd., a subsidiary of the Company as a financial instruments business operator to which the company entrusts agency services for the execution of discretionary investment contracts and The Hyakujushi Bank, Ltd., as a registered financial institution that intermediates the execution of discretionary investment contracts. Furthermore, Nomura Securities Co., Ltd., a subsidiary of the Company, and The Hyakujushi Bank, Ltd., signed a final agreement on the comprehensive business alliance aimed at providing financial instruments intermediary services on December 9, 2025. Including such partnerships, shares are held in order to create business opportunites, and to maintain, strengthen, and expand business relationships, and relationships with local economies, mainly in the Wealth Management Division.

  O:

Shares were held to create business opportunities, and to maintain, strengthen, and expand business relationships, mainly in the Wholesale Division. However, all shares have been sold during the fiscal year ending March 2026.

  P:

Shares were held to create business opportunities, and to maintain, strengthen, and expand business relationships and relationships with local economies, mainly in the Wealth Management Division. However, all shares have been sold during the fiscal year ending March 2026.

  Q:

To create business opportunities, and to maintain, strengthen, and expand business relationships, mainly in the Wholesale Division and Wealth Management Division.

4.

Due to stock split or gratis allotment of shares, the number of shares is increased.

5.

The issuers whose shares we own do not hold any of our shares, but their subsidiary holds our shares, including those held in trust.

6.

Dai-ichi Life Holdings, Inc. changed its trade name to Daiichi Life Group, Inc. on April 1, 2026.

7.

Due to stock listing, the number of shares is increased.


127


Table of Contents

3. Equity investments for pure investment purpose


     Year ended March 31, 2026      Year ended March 31, 2025  
     Securities      Millions of yen      Securities     Millions of yen  
     Number of the different
securities
     Amount on
balance sheet
     Number of the different
securities
    Amount on
balance sheet
 

Non-listed securities

     15        709        15       762  

Listed securities

     —         —         1       144  
     Year ended March 31, 2026        
     Millions of yen  
     Dividends received      Gains on sale      Gains on valuation  
        
Non-listed securities      —         —         (74

Listed securities

     —         1         

4. Equity investments reclassified from held for the purpose of pure investment to held for the purpose of other than pure investment during the fiscal year ended March 31, 2026

None

5. Equity investments reclassified from held for the purpose of other than pure investment to held for the purpose of pure investment during the fiscal year ended March 31, 2026 and previous four fiscal years

None


128


Table of Contents

5. Employees

(1) Basic Policy on Human Resources Strategy

Please refer to Item 2. “Operating and Financial Review, 2 View on Sustainability and Efforts, (5) Human Capital Initiatives.”

(2) Employees

① Consolidated company


    Year ended March 31, 2026
   

Number of our employees

Total

  28,677 (4,105)
 
1

Business segments of the Nomura Group consist of four divisions: Wealth Management Division, Investment Management Division, Wholesale Division and Banking Division, along with Other. As of March 31, 2026, we had 6,943 employees in our Wealth Management Division, 2,645 in our Investment Management Division, 5,343 in our Wholesale Division, 938 in our Banking Division, and 12,808 in Other.

2

Number of employees refers to the number of persons engaged, and the number of temporary employees is stated separately in brackets as the annual average number.

② Status of the Company and the Company with the Largest Number of Employees


                             Year ended March 31, 2026

Company

   Number of our
employees
    

Average age


Average service years

   Average
annual salary
  Year-on-Year
Change in
Average Annual
Salary
Nomura Holdings, Inc      204        (—)      45 years and 1 month    4 years and 4 month    ¥ 14,208,790   3.3%
Nomura Securities Co., Ltd      11,076        (2,274)      42 years and 2 month    15 years and 10 month    ¥ 13,253,240   6.3%

Nomura Asset

Management Co., Ltd

     965        (64)      42 years and 10 month    12 years and 5 month    ¥ 13,906,054   16.2%
 
1

Number of employees refers to the number of persons engaged, and the number of temporary employees is stated separately in brackets as the annual average number.

2

Average annual salary includes bonus and non-standard salary.

3

We had employees of the Company, most of which were in Other in business segments.

4

In addition to the employees above, we had 690 employees, who belong to both the Company and Nomura Securities Co., Ltd.

③ Nomura employees’ union

None


129


Table of Contents

④ The ratio of female managers and so on


Subsidiaries

   Ratio of female
managers (%) (1) (2)
     Ratio of male
employees taking
childcare leave (%) (1)  (3)
     Gender pay gap (female pay gap) (%) (1) (2) (4)  
   All      Permanent      Fixed Term  

Nomura Securities Co., Ltd.

     21.2        94.8        57.0        57.5        68.1  

Nomura Asset Management Co., Ltd.

     21.4        91.7        66.6        66.7        77.6  

The Nomura Trust and Banking Co., Ltd.

     28.4        85.7        69.1        73.9        51.7  

Nomura Business Services Co., Ltd.

     31.6        100.0        69.8        69.4        43.9  

SUGIMURA WAREHOUSE Co., Ltd.

     11.5        100.0        65.9        73.9        74.6  

SUGIMURA TRANSPORTATION Co., Ltd.

     1.4        133.3        40.9        70.6        50.3  
 
1

The ratio of female in manager roles is as of March 31, 2026, the ratio of male employees taking childcare leave and the gender pay gaps are calculated from April 1, 2025 to March 31, 2026.

2

The ratio of female in manager roles and the gender pay gaps are calculated according to the Act on the Promotion of Women’s Active Engagement in Professional Life (Act No. 64 of 2015, Japan).

3

The ratio of male employees taking childcare leave is calculated as the ratio of childcare leave taken according to the Act on Childcare Leave, Caregiver Leave, and Other Measures for the Welfare of Workers Caring for Children or Other Family Members (Act No. 76 of 1991) and Article 71-6 items (ii) of Ordinance for Enforcement of the Act on Childcare Leave, Caregiver Leave, and Other Measures for the Welfare of Workers Caring for Children or Other Family Members (Ordinance of the Ministry of Labor No. 25 of 1991). In companies where the number of male employees who took childcare leave in the current fiscal year exceeded the number of male employees whose spouses gave birth in the current fiscal year, the acquisition rate exceeds 100%.

4

At our major subsidiaries such as Nomura Securities Co., Ltd., Nomura Asset Management Co., Ltd., The Nomura Trust and Banking Co., Ltd., and Nomura Business Services Co., Ltd., a gender pay gap exists among all employees or permanent employees mainly due to the low percentage of female employees in higher corporate titles or positions which are relatively high in salary. As the percentage of female employees in higher corporate titles or positions increases, it is believed that this wage differential will shrink. Each company sets targets for the ratio of female managerial positions in their action plans to promote the active participation of women. As a common initiative in the group, we incorporate Inclusion into personnel evaluations. Specifically, for managers, efforts related to the development of female employees’ abilities, the establishment of a workplace environment that accepts diversity, and the promotion of male employees taking childcare leave and the necessary environmental adjustments are identified as essential tasks. We are continuously implementing initiatives to promote the active participation of women throughout the entire group.

(Reference) Gender pay gap between male and female by corporate title at our major subsidiaries.

At Nomura Securities Co., Ltd., by management/non-management status, the ratios are 76.9% for management, 79.2% for non-management; by corporate title, the ratios are 82.2% for Managing Directors, 87.5% for Executive Directors, 89.6% for Vice Presidents, 77.4% for Senior Associates, 78.0% for Associates, and 93.5% for Analysts.

At Nomura Asset Management Co., Ltd., by management/non-management status, the ratios are 82.7% for management and 94.2% for non-management; by corporate title, the ratios are 88.5% for Managing Directors, 85.2% for Executive Directors, 90.8% for Vice Presidents, 87.7% for Senior Associates, 85.9% for Associates, and 92.0% for Analysts.

At The Nomura Trust and Banking Co., Ltd., by management/non-management status, the ratios are 93.5% for management, 93.8% for non-management; by corporate title, the ratios are 100.9% for Managing Directors, 98.4% for Executive Directors, 96.5% for Vice Presidents, 89.8% for Senior Associates, 82.2% for Associates, and 92.5% for Analysts.

At Nomura Business Services Co., Ltd., by management/non-management status, the ratios are 92.4% for management, 84.8% for non-management; by corporate title, the ratios are 87.8% for Managing Directors, 88.6% for Executive Directors, 100.7% for Vice Presidents, 96.2% for Senior Associates, 97.7% for Associates, and 95.1% for Analysts.


130


Table of Contents

Item 5. Financial Information

1. Preparation Method of Consolidated Financial Statements and Unconsolidated Financial Statements


  (1)

Pursuant to Article 316 of “Ordinance on Terminology, Forms and Preparation Methods of Consolidated Financial Statements”(Ministry of Finance Ordinance No. 28, 1976), the consolidated financial statements were prepared in accordance with the accounting principles which are required in order to issue American Depositary Shares (“ADS”), i.e., the accounting principles generally accepted in the United States of America (“U.S. GAAP”).


  (2)

The consolidated financial statements were prepared by making necessary adjustments to the financial statements of each consolidated company which were prepared in accordance with the accounting principles generally accepted in each country. Such adjustment has been made to comply with above-mentioned principles in (1).


  (3)

The unconsolidated financial statements of the Company were prepared based on the “Ordinance on Terminology, Forms and Preparation Methods of Financial Statements” (Ministry of Finance Ordinance No. 59, 1963) (the “Ordinance”). Also, the financial statements of the Company are prepared in accordance with Article 127 of the Ordinance.

2. Audit Certificate

Under Article No.193-2-1 of the Financial Instruments and Exchange Act, Ernst & Young ShinNihon LLC performed audits of the consolidated and unconsolidated financial statements for the year ended March 31, 2026.

3. Specific efforts to ensure the appropriateness of the consolidated financial statements

The Company makes specific efforts to ensure the appropriateness of its consolidated financial statements. Certain internal structures are in place for ensuring the Company’s correct understanding of the accounting standards and the ability to accurately deal with any changes in the standards as well as for maintaining the completeness and appropriateness in disclosure in relation to any significant information which is subject to disclosure requirements.


131


Table of Contents

NOMURA HOLDINGS, INC.

CONSOLIDATED BALANCE SHEETS


            Millions of yen  
            March 31  
     Note      2025     2026  
ASSETS        

Cash and cash deposits:


Cash and cash equivalents

      ¥ 4,424,462     ¥ 4,298,693  

Time deposits

        642,388       709,639  

Deposits with stock exchanges and other segregated cash

        447,846       640,642  


Total cash and cash deposits

        5,514,696       5,648,974  


Loans and receivables:


Loans receivable (includes ¥2,178,376 and ¥2,783,696 at fair value option)

     *2,8        6,025,008       7,745,214  

Receivables from customers (includes ¥50,258 and ¥44,338 at fair value option)

     *2,4        410,722       470,341  

Receivables from other than customers

        1,030,023       1,345,631  

Allowance for credit losses

     *8        (16,920     (18,381


Total loans and receivables

        7,448,833       9,542,805  


Collateralized agreements:


Securities purchased under agreements to resell (includes ¥358,711 and ¥470,736 at fair value option)

     *2        14,004,757       13,210,236  

Securities borrowed

        4,658,828       4,339,659  


Total collateralized agreements

        18,663,585       17,549,895  


Trading assets and private equity and debt investments:


Trading assets (includes assets pledged of ¥8,666,326 and ¥10,899,960; includes ¥745,801 and ¥1,043,919 at fair value option)

     *2,3        22,372,339       26,128,073  

Private equity and debt investments (includes ¥28,212 and ¥34,863 at fair value option)

     *2        151,710       214,014  


Total trading assets and private equity and debt investments

        22,524,049       26,342,087  


Other assets:


Office buildings, land, equipment and facilities (net of accumulated depreciation and amortization of ¥546,117 and ¥600,417)

        436,454       543,847  

Non-trading debt securities (includes ¥226,772 and ¥365,223 at fair value option)

     *2,6        485,290       761,267  

Investments in equity securities (includes assets pledged of ¥272 and ¥537)

     *2        98,401       123,191  

Investments in and advances to affiliated companies (includes assets pledged of ¥7,460 and ¥5,919; includes ¥11,478 and ¥15,554 at fair value option)

     *8,21        506,389       535,402  

Other (includes ¥215,854 and ¥276,258 at fair value option)

     *2,11        1,124,473       1,598,457  


Total other assets

        2,651,007       3,562,164  


Total assets

      ¥ 56,802,170     ¥ 62,645,925  


The accompanying notes are an integral part of these consolidated financial statements.


132


Table of Contents

NOMURA HOLDINGS, INC.

CONSOLIDATED BALANCE SHEETS—(Continued)


            Millions of yen  
            March 31  
     Note      2025     2026  

LIABILITIES AND EQUITY


Short-term borrowings (includes ¥630,604 and ¥915,584 at fair value option)

     *2,13      ¥ 1,117,292     ¥ 1,752,669  

Payables and deposits:


Payables to customers

        1,377,222       1,598,758  

Payables to other than customers

     *4        2,766,112       3,432,040  

Deposits received at banks (includes ¥325,570 and ¥316,020 at fair value option)

     *2,12        3,105,581       3,667,090  


Total payables and deposits

        7,248,915       8,697,888  


Collateralized financing:


Securities sold under agreements to repurchase (includes ¥673,648 and ¥571,554 at fair value option)

     *2        16,287,758       15,233,838  

Securities loaned (includes ¥30,216 and ¥122,323 at fair value option)

     *2        1,964,682       2,448,284  

Other secured borrowings

        393,420       384,156  


Total collateralized financing

        18,645,860       18,066,278  


Trading liabilities (includes ¥ nil and ¥436 at fair value option)

     *2,3        11,378,828       12,915,584  

Other liabilities (includes ¥54,588 and ¥92,076 at fair value option)

     *2,11        1,456,598       1,813,635  

Long-term borrowings (includes ¥6,915,178 and ¥8,487,521 at fair value option)

     *2,13        13,373,678       15,544,956  


Total liabilities

        53,221,171       58,791,010  


Commitments and contingencies (Note 22)

     *22       

Equity:

     *19       

Nomura Holdings, Inc. (“NHI”) shareholders’ equity:


Common stock


No par value shares;
Authorized—6,000,000,000 shares
Issued—3,163,562,601 and 3,088,562,601 shares
Outstanding—2,956,210,965 and 2,901,337,224 shares

        594,493       594,493  

Additional paid-in capital

        704,877       706,261  

Retained earnings

        1,867,379       2,013,986  

Accumulated other comprehensive income

     *18        447,808       548,221  


Total NHI shareholders’ equity before treasury stock

        3,614,557       3,862,961  

Common stock held in treasury, at cost—207,351,636 and 187,225,377 shares

        (143,678     (155,093


Total NHI shareholders’ equity

        3,470,879       3,707,868  


Noncontrolling interests

        110,120       147,047  

Total equity

        3,580,999       3,854,915  


Total liabilities and equity

      ¥ 56,802,170     ¥ 62,645,925  


The accompanying notes are an integral part of these consolidated financial statements.


133


Table of Contents

The following table presents the classification of consolidated variable interest entities’ (“VIEs”) assets and liabilities included in the consolidated balance sheets above. The assets of a consolidated VIE may only be used to settle obligations of that VIE. Creditors do not typically have any recourse to Nomura beyond the assets held in the VIEs. See Note 7 “Securitizations and Variable Interest Entities” for further information.


     Billions of yen  
     March 31  
     2025     2026  

Cash and cash deposits

   ¥ 14     ¥ 41  

Trading assets and private equity and debt investments

     1,318       1,393  

Other assets

     239       238  


Total assets

   ¥    1,571      ¥    1,672   


Trading liabilities

   ¥ 0     ¥ 1  

Other liabilities

     156       119  

Borrowings

     1,047       908  


Total liabilities

   ¥ 1,203     ¥ 1,028  


The accompanying notes are an integral part of these consolidated financial statements.


134


Table of Contents

NOMURA HOLDINGS, INC.

CONSOLIDATED STATEMENTS OF INCOME


          Millions of yen  
          Year ended March 31  
     Note    2025     2026  

Revenue:


Commissions

   *4    ¥ 407,011     ¥ 455,289  

Fees from investment banking

   *4      212,234       200,548  

Asset management and portfolio service fees

   *4      378,196       468,600  

Net gain on trading

   *2,3      580,099       696,894  

Gain on private equity and debt investments

        7,634          12,604   

Interest and dividends

        2,927,861       2,669,640  

Gain on investments in equity securities

        444       13,066  

Other

   *4,11,21,23      223,264       241,845  


Total revenue

        4,736,743       4,758,486  

Interest expense

        2,844,258       2,590,773  


Net revenue

        1,892,485       2,167,713  


Non-interest expenses:


Compensation and benefits

        732,390       829,502  

Commissions and floor brokerage

        177,452       221,857  

Information processing and communications

        227,018       248,439  

Occupancy and related depreciation

          70,166        71,523  

Business development expenses

        27,055       33,679  

Other

   *11      186,440       222,892  


Total non-interest expenses

        1,420,521       1,627,892  


Income before income taxes

        471,964       539,821  


Income tax expense

   *17      124,709       165,439  


Net income

      ¥ 347,255     ¥ 374,382  


Less: Net income attributable to noncontrolling interests

        6,519       12,253  


Net income attributable to NHI shareholders

      ¥ 340,736     ¥ 362,129  


          Yen  

Per share of common stock:

   *14     

Basic—


Net income attributable to NHI shareholders per share

      ¥ 115.30     ¥ 123.08  


Diluted—


Net income attributable to NHI shareholders per share

      ¥ 111.03     ¥ 118.99  


The accompanying notes are an integral part of these consolidated financial statements.


135


Table of Contents

NOMURA HOLDINGS, INC.

CONSOLIDATED STATEMENTS OF COMPREHENSIVE INCOME


     Millions of yen  
     Year ended March 31  
     2025     2026  

Net income

   ¥ 347,255     ¥ 374,382  

Other comprehensive income (loss):


Change in cumulative translation adjustments:


Change in cumulative translation adjustments

     (35,768        149,812  

Deferred income taxes

     (1,569     (2,074


Total

     (37,337     147,738  


Defined benefit pension plans:


Pension liability adjustment

     17,734       11,653  

Deferred income taxes

     (5,327     (4,670


Total

     12,407       6,983  


Non-trading debt securities:


Net unrealized gain (loss) on non-trading debt securities

     (1,675     (3,233

Deferred income taxes

     528       1,018  


Total

     (1,147     (2,215


Own credit adjustments:


Own credit adjustments

     20,636       (57,597

Deferred income taxes

     (7,978     10,718  


Total

     12,658       (46,879


Total other comprehensive income (loss)

     (13,419     105,627  


Comprehensive income

        333,836       480,009  

Less: Comprehensive income attributable to noncontrolling interests

     5,276       17,467  


Comprehensive income attributable to NHI shareholders

   ¥ 328,560     ¥ 462,542  


The accompanying notes are an integral part of these consolidated financial statements.


136


Table of Contents

NOMURA HOLDINGS, INC.

CONSOLIDATED STATEMENTS OF CHANGES IN EQUITY


     Millions of yen  
     Year ended March 31  
     2025     2026  

Common stock


Balance at beginning of year

   ¥ 594,493     ¥ 594,493  


Balance at end of year

        594,493          594,493  


Additional paid-in capital


Balance at beginning of year

     708,785       704,877  

Stock-based compensation awards

     (3,929     1,400  

Changes in ownership interests in subsidiaries

     36       —   

Changes in an affiliated company’s interests

     (15     (16


Balance at end of year

     704,877       706,261  


Retained earnings


Balance at beginning of year

     1,705,725       1,867,379  

Net income attributable to NHI shareholders

     340,736       362,129  

Cash dividends

     (168,477     (148,840

Loss on disposal of treasury stock

     (10,605     (9,016

Cancellation of treasury stock

     —        (57,666


Balance at end of year

     1,867,379       2,013,986  


Accumulated other comprehensive income (loss)


Cumulative translation adjustments


Balance at beginning of year

     444,071       407,977  

Net change during the year

     (36,094     142,524  


Balance at end of year

     407,977       550,501  


Defined benefit pension plans


Balance at beginning of year

     (19,512     (7,105

Pension liability adjustment

     12,407       6,983  


Balance at end of year

     (7,105     (122


Non-trading debt securities


Balance at beginning of year

     —        (1,147

Net unrealized loss on non-trading debt securities

     (1,147     (2,215


Balance at end of year

     (1,147     (3,362


Own credit adjustments


Balance at beginning of year

     35,425       48,083  

Own credit adjustments

     12,658       (46,879


Balance at end of year

     48,083       1,204  


Balance at end of year

     447,808       548,221  


137


Table of Contents

NOMURA HOLDINGS, INC.

CONSOLIDATED STATEMENTS OF CHANGES IN EQUITY—(Continued)


     Millions of yen  
   Year ended March 31  
   2025     2026  

Common stock held in treasury


Balance at beginning of year

     (118,798     (143,678

Repurchases of common stock

     (58,835     (101,499

Sales of common stock

     0       0  

Common stock issued to employees

     33,955       32,418  

Cancellation of treasury stock

     —        57,666  


Balance at end of year

     (143,678     (155,093


Total NHI shareholders’ equity


Balance at end of year

     3,470,879       3,707,868  


Noncontrolling interests


Balance at beginning of year

     98,324       110,120  

Cash dividends

     (10,680     (21,056

Net income attributable to noncontrolling interests

     6,519       12,253  

Accumulated other comprehensive income (loss) attributable to noncontrolling interests


Cumulative translation adjustments

     (1,243     5,214  

Transaction between NHI group and noncontrolling interest holders, net

     (5,370     44,694  

Other net change in noncontrolling interests

     22,570       (4,178


Balance at end of year

     110,120       147,047  


Total equity


Balance at end of year

   ¥  3,580,999     ¥  3,854,915  


The accompanying notes are an integral part of these consolidated financial statements.


138


Table of Contents

NOMURA HOLDINGS, INC.

CONSOLIDATED STATEMENTS OF CASH FLOWS


     Millions of yen  
     Year ended March 31  
     2025     2026  
Cash flows from operating activities:   

Net income

   ¥ 347,255     ¥ 374,382  

Adjustments to reconcile net income to net cash provided by (used in) operating activities:


Depreciation and amortization

     61,653       68,269  

Provision for credit losses

     (1,060     248  

Stock-based compensation

     38,578       40,836  

Gain on investments in equity securities

     (444     (13,066

(Gain) loss on investments in subsidiaries and affiliates

     (205     11,995  

Equity in earnings of affiliates, net of dividends received

     (34,605     (18,662

(Gain) loss on disposal of office buildings, land, equipment and facilities

     2,344       (58,744

Deferred income taxes

     11,559       8,349  

Changes in operating assets and liabilities:


Deposits with stock exchanges and other segregated cash

     (144,542     (133,311

Trading assets and private equity and debt investments

     (3,026,277     (2,861,869

Trading liabilities

     574,231       1,111,331  

Securities purchased under agreements to resell, net of securities sold under agreements to repurchase

     1,108,828       (441,013

Securities borrowed, net of securities loaned

     526,233       882,237  

Margin loans and receivables

     (179,668     (653,334

Payables

     (16,725     703,622  

Bonus accrual

     26,496       63,422  

Accrued income taxes, net

     19,235       25,684  

Other, net

     8,503       46,664  


Net cash used in operating activities

     (678,611     (842,960


Cash flows from investing activities:


Payments for placements of time deposits

     (679,945     (747,618

Proceeds from redemption or maturity of time deposits

     572,947       746,174  

Payments for purchases of office buildings, land, equipment and facilities

     (189,971     (353,818

Proceeds from sales of office buildings, land, equipment and facilities

     131,078       234,693  

Payments for purchases of equity investments

     (10,712     (33,900

Proceeds from sales of equity investments

     8,112       23,491  

Net cash outflows from loans receivable at banks

     (129,829     (131,647

Payments for purchases or origination of other non-trading loans

     (5,939,225     (7,625,952

Proceeds from sales or repayments of other non-trading loans

     5,530,064       6,952,187  

Payments for purchases of available-for-sale debt securities

     (113,702     (167,408

Proceeds from sales of available-for-sale debt securities

     4,982       —   

Payments for purchases of other non-trading debt securities

     (179,032     (316,858

Proceeds from sales or maturity of other non-trading debt securities

     131,200       226,985  

Acquisitions, net of cash acquired

     —        (275,014

Divestures, net of cash disposed of

     8,141       12  

Payments for purchases of investments in affiliated companies

     (19,007     (11,919

Proceeds from sales of investments in affiliated companies

     10,098       1,684  

Other, net

     16,154       (20,015


Net cash used in investing activities

     (848,647     (1,498,923


Cash flows from financing activities:


Proceeds from issuances of long-term borrowings

     4,334,376       4,611,984  

Payments for repurchases or maturity of long-term borrowings

     (3,313,452     (3,174,186

Proceeds from issuances of short-term borrowings

     1,850,155       2,468,863  

Payments for repurchases or maturity of short-term borrowings

     (1,876,894     (2,358,223

Net cash inflows from interbank money market borrowings

     130,455       443,081  

Net cash outflows from other secured borrowings

     (23,560     (7,649

Net cash inflows from deposits received at banks

     785,385       387,377  

Payments for withholding taxes on stock-based compensation

     (20,583     (18,214

Proceeds from sales of common stock

     1,412       422  

Payments for repurchases of common stock

     (59,006     (101,499

Payments for cash dividends

     (112,541     (179,742

Contributions from noncontrolling interests

     64,549       122,335  

Distributions to noncontrolling interests

     (80,599     (98,698


Net cash provided by financing activities

     1,679,697       2,095,851  


Effect of exchange rate changes on cash, cash equivalents, restricted cash and restricted cash equivalents

     (26,020     139,313  


Net increase (decrease) in cash, cash equivalents, restricted cash and restricted cash equivalents

     126,419       (106,719

Cash, cash equivalents, restricted cash and restricted cash equivalents at beginning of year

     4,299,022        4,425,441  


Cash, cash equivalents, restricted cash and restricted cash equivalents at end of year    ¥ 4,425,441     ¥ 4,318,722  


Supplemental information:     

Cash paid during the year for —


Interest

   ¥  2,879,779     ¥ 2,570,408  


Income tax payments, net

   ¥ 93,915     ¥ 118,852  


139


Table of Contents

The following table presents a reconciliation of cash and cash equivalents, and restricted cash and restricted cash equivalents reported in Deposits with stock exchanges and other segregated cash within the consolidated balance sheets to the total of the same such amounts shown in the statements of cash flows above. Restricted cash and restricted cash equivalents are amounts where access, withdrawal or usage by Nomura is substantively prohibited by a third party entity outside of the Nomura group.


     Millions of yen  
     Year ended March 31  
     2025      2026  

Cash and cash equivalents reported in Cash and cash equivalents

   ¥ 4,424,462      ¥ 4,298,693  

Restricted cash and restricted cash equivalents reported in Deposits with stock exchanges and other segregated cash

     979        20,029  


Total cash, cash equivalent, restricted cash and restricted cash equivalents

   ¥  4,425,441      ¥  4,318,722  


Non-cash

Total amount of right-of-use assets recognized for the years ended March 31, 2025 and 2026 were ¥29,148 million and ¥27,167 million, respectively.

The accompanying notes are an integral part of these consolidated financial statements.


140


Table of Contents

NOMURA HOLDINGS, INC.

NOTES TO THE CONSOLIDATED FINANCIAL STATEMENTS

1. Summary of accounting policies:

Description of business—

Nomura Holdings, Inc. (“Company”) and its broker-dealer, banking and other financial services subsidiaries provide investment, financing and related services to individual, institutional and government clients on a global basis. The Company and other entities in which it has a controlling financial interest are collectively referred to as “Nomura” within these consolidated financial statements.

Nomura operates its business through various divisions based on the nature of specific products and services, its main client base and management structure. Nomura reports operating results through four business segments: Wealth Management, Investment Management, Wholesale, and Banking. The Banking Division was newly established on April 1, 2025. See Note 23 “Segment and geographic information” for further details regarding Nomura’s business segments.

Basis of presentation—

The accounting and financial reporting policies of Nomura are based on accounting principles generally accepted in the United States (“U.S. GAAP”).

These consolidated financial statements include the financial statements of the Company and other entities in which it has a controlling financial interest. Nomura initially determines whether it has a controlling financial interest in an entity by evaluating whether the entity is a variable interest entity (“VIE”) under Financial Accounting Standards Board (“FASB”) Accounting Standard Codification (“ASC”) 810 “Consolidation.” VIEs are entities in which equity investors do not have the characteristics of a controlling financial interest or which do not have sufficient equity at risk for the entities to finance their activities without additional subordinated financial support. Nomura consolidates VIEs where Nomura is the primary beneficiary, which is where (1) Nomura has power to direct the activities of the VIE that is most significantly impact the VIE’s economic performance; and (2) through Nomura’s interest in the VIE, the right to receive benefits or the obligation to absorb losses that could potentially be significant to the VIE, provided that Nomura is not acting as a fiduciary for other interest holders.

For entities other than VIEs, Nomura is generally determined to have a controlling financial interest in an entity when it owns a majority of the voting interests.

Equity investments in entities in which Nomura has significant influence over operating and financial decisions (generally defined as a holding of 20 to 50 percent of the voting stock of a corporate entity, or at least 3 percent of a limited partnership) are accounted for under the equity method of accounting (“equity method investments”) and reported within Other assetsInvestments in and advances to affiliated companies or at FV-NI by electing the fair value option (“FVO”) permitted by ASC 825 “Financial Instruments” (“ASC 825”) and reported in the consolidated balance sheets within Trading assets, Private equity and debt investments or Other assetsOther depending on the nature and purpose of the investments. These investments are tested in their entirety for other-than-temporary impairment when there is an indication of impairment. The underlying assets associated with the equity method investments, including goodwill, are not tested separately for impairment. Where an other-than-temporary impairment is deemed to exist, the equity method investment is written down to its fair value, which establishes a new carrying value to be used prospectively.

Certain consolidated entities are investment companies under ASC 946 “Financial ServicesInvestment Companies” (“ASC 946”). Nomura carries all of their investments at FV-NI.

The Company’s principal subsidiaries include Nomura Securities Co., Ltd. (“NSC”), Nomura Securities International, Inc. (“NSI”), Nomura International plc (“NIP”) and Nomura Financial Products & Services, Inc. (“NFPS”).

All material intercompany transactions and balances have been eliminated on consolidation.


141


Table of Contents

NOMURA HOLDINGS, INC.

NOTES TO THE CONSOLIDATED FINANCIAL STATEMENTS—(Continued)


Use of estimates—

Nomura uses accounting estimates to prepare these consolidated financial statements and they require difficult, subjective and complex judgments by management. Such estimates determined by management to have a significant/material impact during the periods covered by these consolidated financial statements primarily relate to estimates regarding the fair value of financial instruments. Estimates, by their nature, are based on underlying assumptions which require management judgment and depend on the extent of available information. Actual results in future periods may differ from current estimates, which could have a material impact on these consolidated financial statements.

Various references are made throughout the notes to these consolidated financial statements where critical accounting estimates based on management judgment have been made, the nature of the estimates, the underlying assumptions made by management used to derive those estimates and how these estimates affect the amounts reported in these consolidated financial statements.

Fair value of financial instruments—

A significant amount of Nomura’s financial assets and financial liabilities are carried at FV-NI or at fair value with changes in fair value recognized through the consolidated statements of comprehensive income (i.e. FV-OCI). Use of a fair value measurement is either specifically required under U.S. GAAP or Nomura makes an election to use a fair value measurement for certain eligible items under the FVO permitted by ASC 825.

Other financial assets and financial liabilities are carried at fair value on a nonrecurring basis, where the primary measurement basis is not fair value. Fair value is only used in specific circumstances after initial recognition, such as to measure impairment.

In both cases, fair value is generally determined in accordance with ASC 820 “Fair Value Measurements and Disclosures” (“ASC 820”) which defines fair value as the amount that would be exchanged to sell a financial asset or transfer a financial liability in an orderly transaction between market participants at the measurement date. It assumes that the transaction occurs in Nomura’s principal market, or in the absence of a principal market, the most advantageous market for the relevant financial asset or financial liability. See Note 2 “Fair value measurements” for further information regarding how Nomura estimates fair value for specific types of financial instruments used in the ordinary course of business.

The fair values of financial assets and financial liabilities of consolidated VIEs which meet the definition of collateralized financing entities are both measured using the more observable fair value of the financial assets and financial liabilities.


142


Table of Contents

NOMURA HOLDINGS, INC.

NOTES TO THE CONSOLIDATED FINANCIAL STATEMENTS—(Continued)


Allowance for current expected credit losses—

Management recognizes allowance for current expected credit losses on financial assets not carried at fair value and certain off-balance sheet financial instruments including unfunded loan commitments in accordance with ASC 326, “Financial Instruments – Credit Losses” (“ASC 326”).

Current expected credit losses are calculated over the expected life of the financial instruments in scope of the requirements on an individual or a portfolio basis, considering all relevant, reasonable and supportable information available about the collectability of cash flows, including information about past events, current conditions and future forecasts. Accrued interest receivables are excluded from the amortized cost basis of financing receivables when calculating current expected credit losses.

The methodology used by Nomura to determine allowances for current expected credit losses in accordance with the current expected credit losses impairment model (“CECL impairment model”) primarily depends on the nature of the financial instrument and whether certain practical expedients permitted by ASC 326 are applied by Nomura.

Allowances for current expected credit losses against recognized financial instruments are reported in the consolidated balance sheets within Allowance for credit losses while allowances for current expected credit losses against off-balance sheet financial instruments are reported in the consolidated balance sheets within Other liabilities. All movements in the allowances are reported in the consolidated statements of income within Other expenses.

See Note 8 “Financing receivables” for further information including how allowances for current expected credit losses are calculated.

Transfers of financial assets—

Nomura accounts for the transfer of a financial asset as a sale when Nomura relinquishes control over the asset by meeting the following conditions: (a) the asset has been isolated from the transferor (even in bankruptcy or other receivership), (b) the transferee has the right to pledge or exchange the asset received, or if the transferee is an entity whose sole purpose is to engage in securitization or asset-backed financing activities, the holders of its beneficial interests have the right to pledge or exchange the beneficial interests held, and (c) the transferor has not maintained effective control over the transferred asset.

In connection with its securitization activities, Nomura utilizes special purpose entities (“SPEs”) to securitize commercial and residential mortgage loans, government and corporate securities or other types of financial assets. Nomura’s involvement with SPEs includes structuring and underwriting, distributing and selling debt instruments and beneficial interests issued by SPEs to investors. Nomura derecognizes financial assets transferred in securitizations provided that Nomura has relinquished control over such assets and does not consolidate the SPE. Nomura may obtain or retain an interest in the financial assets, including residual interests in the SPEs dependent upon prevailing market conditions. Any such interests are carried at fair value and reported within Trading assets in the consolidated balance sheets with the change in fair value reported within RevenueNet gain on trading in the consolidated statements of income.

Foreign currency translation—

The financial statements of the Company’s subsidiaries and operations are measured using their functional currency which is the currency of the primary economic environment in which the entity operates. All assets and liabilities of subsidiaries and operations which have a functional currency other than Japanese Yen are translated into Japanese Yen at exchange rates at the balance sheet date, and all revenue and expenses are translated at the average exchange rates for the respective years and the resulting translation adjustments are reported in the consolidated statements of comprehensive income, net of applicable income taxes within Other comprehensive income (loss) and Accumulated other comprehensive income (loss) in NHI shareholders’ equity.

Foreign currency assets and liabilities are translated at exchange rates at the balance sheet date and the resulting translation gains or losses are credited or charged to the consolidated statements of income.


143


Table of Contents

NOMURA HOLDINGS, INC.

NOTES TO THE CONSOLIDATED FINANCIAL STATEMENTS—(Continued)


Revenue from services provided to customers—

Nomura earns revenue through fees and commissions from providing financial services to customers primarily across all business divisions. These services primarily include trade execution and clearing, distribution of fund units, financial advisory, underwriting and distribution and asset management services.

Revenue is recognized when or as the customer obtains control of the service provided by Nomura which depends on when each of the key distinct substantive promises made by Nomura within the contract with the customer (“performance obligations”) are satisfied. Such performance obligations are generally satisfied at a particularly point in time or, if certain criteria are met, over a period of time.

Revenue from the distribution of fund units and clearing is reported in the consolidated statements of income within RevenueCommissions, revenue from asset management services is reported within RevenueAsset management and portfolio service fees and revenue from financial advisory , underwriting and distribution is reported within RevenueFees from investment banking.

Costs to obtain or fulfill the underlying contract to provide such financial services to customers are deferred as assets if certain criteria are met. These deferred costs, which are reported in the consolidated balance sheets within Other assets, are released to the consolidated statements of income when the related revenue from providing the service is also recognized or earlier, if there is evidence that the costs are not recoverable and therefore impaired.

Trading assets and trading liabilities—

Trading assets primarily comprise debt securities, equity securities and derivative assets which are recognized on the consolidated balance sheets on a trade date basis and loans which are recognized on the consolidated balance sheets on a settlement date basis. Financial assets are classified as being held for trading when any of the following criteria are met:


The financial assets are originated or acquired with the intention to generate profit through sale in the short-term;


The financial assets are part of a portfolio of identified financial instruments that are managed together for the purposes of short-term profit or arbitrage profit-taking; or


The financial assets are derivative assets, other than those formally designated as accounting hedges or certain other non-trading derivative assets entered for specific economic and risk management hedging purposes.

Trading liabilities primarily comprise short sales of securities and derivative liabilities other than those formally designated as accounting hedges or certain other non-trading derivative liabilities entered into for specific economic and risk management hedging purposes, which are recognized on the consolidated balance sheets on a trade date basis. Trading assets and liabilities are carried at fair value and changes in fair value are generally reported within RevenueNet gain on trading in the consolidated statements of income.

Certain short sales of securities of trading liabilities are held to economically hedge the price risk of specific investments in equity securities held for operating purposes. Changes in fair value of these trading liabilities are reported in the consolidated statements of income within Revenue—Gain (loss) on investments in equity securities.

Collateralized agreements and collateralized financing—

Collateralized agreements consist of reverse repurchase agreements reported as Securities purchased under agreements to resell and securities borrowing transactions reported as Securities borrowed. Collateralized financing consists of repurchase agreements reported as Securities sold under agreements to repurchase, securities lending transactions reported as Securities loaned and certain other secured borrowings.


144


Table of Contents

NOMURA HOLDINGS, INC.

NOTES TO THE CONSOLIDATED FINANCIAL STATEMENTS—(Continued)


Reverse repurchase and repurchase agreements principally involve the buying or selling of securities under agreements with clients to resell or repurchase these securities to or from those clients, respectively. These transactions are generally accounted for as collateralized agreements or collateralized financing transactions and are recognized in the consolidated balance sheets at the amount for which the securities were originally acquired or sold. Certain reverse repurchase and repurchase agreements are carried at FV-NI through election of the FVO.

Nomura also enters into Japanese repo transactions (“Gensaki Repo”) which are the standard type of repurchase agreement used in Japanese financial markets. These transactions contain margin requirements, substitution rights, and certain restrictions on the client’s right to sell or repledge the transferred securities and are accounted for as collateralized agreements or collateralized financing transactions and are recognized on the consolidated balance sheets at the amount that the securities were originally acquired or sold.

Securities borrowing and lending transactions are generally accounted for as collateralized agreements and collateralized financing transactions, respectively. These transactions are generally cash collateralized and are recognized on the consolidated balance sheets at the amount of cash collateral advanced or received, unless they are carried at FV-NI through election of the FVO. Allowances for current expected credit losses recognized against securities borrowing transactions are not significant due to the ongoing monitoring of collateral and the short expected life of these transactions. Where Nomura receives securities rather than cash in a securities lending transaction and such securities can be sold or pledged as collateral, Nomura recognizes the securities received at fair value which are reported in the consolidated balance sheets within Other assetsOther and the obligation to return those securities as a liability within Other liabilities.

See Note 8 “Financing receivables” for further information including how allowances for current expected credit losses under ASC 326 are determined.

Offsetting of collateralized agreements and collateralized financings

Reverse repurchase agreements and repurchase agreements accounted for as collateralized agreements and collateralized financing transactions respectively, entered into with the same counterparty and documented under a master netting agreement are offset in the consolidated balance sheets where the specific criteria defined by ASC 210-20Balance SheetOffsetting” (“ASC 210-20”) are met. These criteria primarily relate to the maturity of the transactions, the underlying systems on which the collateral is settled, associated banking arrangements and the legal enforceability of close-out and offsetting rights under the master netting agreement. Similarly, securities borrowing and lending transactions accounted for as collateralized agreements and collateralized financing transactions respectively, entered into with the same counterparty and documented under a master netting agreement are also offset in the consolidated balance sheets where the specific criteria defined by ASC 210-20 are met.

Other secured borrowings primarily consist of secured borrowings from financial institutions and central banks in the inter-bank money market, and are carried at contractual amounts due.

Trading balances of secured borrowings consist of liabilities related to transfers of financial assets that are accounted for as secured financing transactions rather than sales under ASC 860 “Transfers and Servicing” (“ASC 860”) and are reported in the consolidated balance sheets within Long-term borrowings. The fair value option is generally elected for these transactions, which are carried at FV-NI. See Note 7 “Securitizations and Variable Interest Entities” and Note 13 “Borrowings” for further information regarding these transactions.

All Nomura-owned assets pledged to counterparties where the counterparty has the right to sell or repledge the securities, including collateral transferred under Gensaki Repo transactions, are reported parenthetically in the consolidated balance sheets as assets pledged within Trading assets.

See Note 5 “Collateralized transactions” for further information.


145


Table of Contents

NOMURA HOLDINGS, INC.

NOTES TO THE CONSOLIDATED FINANCIAL STATEMENTS—(Continued)


Derivatives—

Nomura uses a variety of derivatives, including futures, forwards, swaps and options, for both trading and non-trading purposes. Freestanding financial instruments which meet the accounting definition of derivatives are carried at fair value in the consolidated balance sheets Certain derivatives embedded in hybrid financial instruments such as structured notes and certificates of deposit are bifurcated from the host contract and are also carried at fair value in the consolidated balance sheets and reported within Short-term borrowings or Long-term borrowings depending on the maturity of the underlying host contract. These derivatives are subsequently measured at FV-NI or FV-OCI depending on the purpose for which the derivatives are used.

Derivatives used for trading purposes.

Derivatives used for trading purposes, including bifurcated embedded derivatives, are carried at FV-NI. These derivatives are reported in the consolidated balance sheets within Trading assets or Trading liabilities depending on whether fair value at the balance sheet date is positive or negative, respectively with all changes in fair value reported in the consolidated statements of income within RevenueNet gain on trading.

Derivatives held for non-trading purposes

In addition to its trading activities, Nomura uses derivatives for non-trading purposes such as to manage certain risk exposures arising from recognized assets and liabilities, forecasted transactions and firm commitments. Derivatives held for non-trading purposes include derivatives formally designated as fair value or net investment hedges under ASC 815 “Derivatives and Hedging” (“ASC 815”) as well as certain other derivatives designated as economic and risk management hedges as follows:


Fair value hedges—Nomura designates certain derivative as fair value hedges of interest rate risk and foreign exchange risk arising from specific financial liabilities and foreign currency denominated non-trading debt securities, respectively. These derivatives are highly effective in reducing the risk associated with the exposure being hedged and are highly correlated with changes in the fair value of the underlying hedged items, both at inception and throughout the life of the hedging relationship. Changes in fair value of the hedging derivatives are reported together with those of the hedged financial assets and liabilities through the consolidated statements of income within Interest expense and RevenueOther, respectively.


Net investment hedges—Nomura designates certain derivatives as hedges of the net investment in foreign operations related to specific subsidiaries or branches with functional currencies other than the Japanese Yen. When determining the effectiveness of net investment hedges, the effective portion of the change in fair value of the hedging derivative is determined by changes in spot exchange rates. Changes in fair value of the hedging derivatives attributable to changes in the difference between the forward rate and spot rate are excluded from the measurement of hedge effectiveness and are reported in the consolidated statements of income within RevenueNet gain on trading. All other movements in fair value of highly effective net investment hedging derivatives are reported through Shareholders’ equity within Accumulated other comprehensive income (loss).


Economic and risk management hedges—Nomura designates certain derivatives as economic and risk management hedges to manage equity price risk, interest rate risk or foreign currency risk of certain specific financial assets and liabilities as well as certain expenses arising from forecasted transactions or firm commitments. Changes in fair value of these derivatives are reported in the same line item in the consolidated statements of income where gains, losses or expenses arising from the hedged transactions are reported.

Although these are non-trading derivatives, such recognized derivative assets and liabilities are currently reported in the consolidated balance sheets within Trading assets and Trading liabilities respectively, as such amounts are not significant.

Offsetting of derivatives

Trading and non-trading derivative assets and liabilities entered into with the same counterparty documented under a legally enforceable master netting agreement and the related cash collateral receivables and payables are presented on a net basis in the consolidated balance sheets where the specific criteria defined by ASC 210-20 and ASC 815 are met.


146


Table of Contents

NOMURA HOLDINGS, INC.

NOTES TO THE CONSOLIDATED FINANCIAL STATEMENTS—(Continued)


Settlement-to-market derivatives

Exchange traded and centrally cleared OTC derivatives typically involve daily variation margin payments and receipts which reflect changes in the fair value of the related derivatives. Such variation margin amounts are accounted for as either a partial settlement of the derivative or as a separate cash collateral receivable or payable depending on the legal arrangement with the relevant central clearing counterparty.

See Note 3 “Derivatives instruments and hedging activities” for further information.

Loans receivable—

Loans receivable are loans held for non-trading purposes, namely those which management intends to hold for the foreseeable future. Loans receivable are either carried at FV-NI through election of the FVO or at amortized cost.

Loans receivable carried at fair value

Certain loans which are risk managed on a fair value basis are carried at FV-NI through election of the FVO. Nomura makes this election to mitigate volatility in the consolidated statements of income caused by the difference in measurement basis that would otherwise exist between the loans and the derivatives used to risk manage those loans. Changes in the fair value of loans receivable carried at FV-NI are reported in the consolidated statements of income within RevenueNet gain on trading. Interest earned on loans receivable carried at FV-NI is recognized in the consolidated statements of income within RevenueInterest and dividends.

Loans receivable carried at amortized cost

Loans receivable which are not carried at FV-NI through election of the FVO are carried at amortized cost. Amortized cost represents cost adjusted for deferred fees and direct costs, unamortized premiums or discounts on purchased loans and after deducting applicable allowances for current expected credit losses under ASC 326. Interest income, including net loan origination fees, is recognized using the interest method and reported in the consolidated statements of income within RevenueInterest and dividends.

Modifications of loans from debtors experiencing financial difficulty

See Note 8 “Financing receivables” for further information including how allowances for current expected credit losses under ASC 326 are determined and how modifications of loans are accounted for.

Other receivables—

Receivables from customers include amounts receivable on client securities transactions, amounts receivable from clients for failed to deliver securities and receivables for commissions receivable. Receivables from other than customers include amounts receivable from brokers and dealers for failed to deliver securities, margin deposits, cash collateral receivables for derivative transactions, and net receivables arising from unsettled securities transactions.

These amounts are carried at contractual amounts due less any applicable allowance for current expected credit losses recognized under ASC 326.

See Note 8 “Financing receivables” for further information including how allowances for current expected credit losses under ASC 326 are determined.


147


Table of Contents

NOMURA HOLDINGS, INC.

NOTES TO THE CONSOLIDATED FINANCIAL STATEMENTS—(Continued)


Loan commitments—

Unfunded loan commitments written by Nomura are accounted for as either off-balance sheet instruments, or are carried at FV-NI either as trading instruments or through election of the FVO.

These loan commitments are generally accounted for in a manner consistent with the accounting for the loan receivable upon funding. Where the loan receivable is carried at FV-NI through classification as a trading asset or through election for the FVO, the loan commitment is also generally carried at FV-NI, with changes in fair value reported in the consolidated statements of income within RevenueNet gain on trading. Loan commitment fees integral to the loan commitment are recognized as part of the fair value of the commitment.

For loan commitments where the loan will be held for the foreseeable future and will not be elected for the fair value option, Nomura recognizes allowances for current expected credit losses in accordance with ASC 326. Loan commitment fees are generally deferred and recognized over the term of the loan when funded as an adjustment to yield. If drawdown of the loan commitment is considered remote, loan commitment fees are recognized over the commitment period as service revenue.

See Note 8 “Financing receivables” for further information including how allowances for current expected credit losses under ASC 326 are determined.

Non-trading investments

Prior to April 1, 2024, all debt securities and equity investments which were not held for trading purposes were recognized on the consolidated balance sheets on a trade date basis and were generally carried at FV-NI with all changes in fair value reported in the consolidated statements of income within RevenueGain (loss) on investments in equity securities or RevenueOther through consolidated application of ASC 940 “Financial Services — Brokers and Dealers” (“ASC 940”).

The Company and its consolidated subsidiaries that are not registered as a broker-dealer (“non-BD entities”) are permitted to classify non-trading debt securities purchased on or after April 1, 2024 as available for sale (“AFS”) debt securities or held to maturity (“HTM”) debt securities in accordance with ASC 320 “Investments—Debt Securities” (“ASC 320”).

AFS debt securities

AFS debt securities are non-trading debt securities held by non-BD entities which have not been designated as HTM debt securities nor which have been elected to be carried at FV-NI through election of the FVO.

AFS debt securities and accrued interest arising from these securities are reported in the consolidated balance sheets within Non-trading debt securities and Receivables from other than customers, respectively. AFS debt securities are carried at FV-OCI, with any changes in fair value reported net of applicable income taxes within Other comprehensive income (loss). Interest income, including amortization of premiums and accretion of discounts, is recognized using the interest method over the life of the AFS debt security and reported in the consolidated statements of income within Interest and dividends.

Nomura evaluates each AFS debt security for impairment at each interim and annual balance sheet date when its fair value declines below its amortized cost and therefore the AFS debt security is in an unrealized loss position. If Nomura has the intention to sell the AFS security in an unrealized loss position, or if it is more likely than not that Nomura will be required to sell the security before recovery of its amortized cost, the AFS debt security is written down to its fair value through Non-interest expensesOther in the consolidated statements of income.


148


Table of Contents

NOMURA HOLDINGS, INC.

NOTES TO THE CONSOLIDATED FINANCIAL STATEMENTS—(Continued)


AFS debt securities which are in an unrealized loss position that Nomura neither has the intention to sell nor a more likely than not requirement to sell are evaluated to determine whether the decline in fair value below its amortized cost has resulted from a credit loss or is due to other factors. Nomura considers various qualitative factors in such determination, including the financial condition of the issuer and any adverse conditions related to industry or geographic area of the issuer, failure of interest and principal payments by the issuer, current status and any changes in rating and credit enhancement. If the AFS debt security fails any of these qualitative criteria, Nomura calculates an allowance for current expected credit losses using a discounted cash flow analysis to determine if all or portion of the unrealized loss is a result of such expected credit losses which is recognized in the consolidated statements of income within Non-interest expensesOther. Any residual amount of the unrealized loss which is not due to expected credit losses continues to be recognized within Other comprehensive income (loss).

Nomura does not recognize any allowances for current expected credit losses against accrued interest receivable amounts arising from AFS debt securities since Nomura policy is to write off the receivable by reversing accrued interest when it is determined that the accrued interest receivable is uncollectible.

Any realized gains or losses arising on the sale of or transfer of an AFS debt security recognized in Accumulated other comprehensive income (loss) are reclassified to in the consolidated statements of income within Revenue – Other at the point of sale. Nomura uses the moving average method when determining the cost of the AFS debt security for this purpose.

HTM debt securities.

HTM debt securities are non-trading debt securities held by non-BD entities which are specifically designated as HTM debt securities on the basis that the non-BD entity has both the ability and the intent to hold the securities until maturity..

HTM debt securities and accrued interest arising from these securities are reported in Non-trading debt securities and Receivables from other than customers in the consolidated balance sheets, respectively..

HTM debt securities are carried at amortized cost less an appropriate allowance for current expected credit losses typically determined and calculated in the same way as for loans also carried at amortized cost. Interest on HTM debt securities, including amortization of premiums and accretion of discounts, is recognized using the interest method and reported in the consolidated statements of income within Interest and dividends. Realized gains and losses from permitted sales or other dispositions of HTM debt securities are determined using the specific identification method and reported within RevenueOther in the consolidated statements of income.

Other non-trading debt securities.

Other non-trading debt securities consist of all debt securities held by BD entities for non-trading purposes which are mandatorily carried at FV-NI through application of ASC 940 and debt securities held by non-BD entities for non-trading purposes which are also carried at FV-NI through election of the FVO. Other non-trading debt securities and accrued interest arising from these securities are reported in the consolidated balance sheets within Non-trading debt securities and Receivables from other than customers, respectively. Interest on other non-trading debt securities is recognized on an accrual basis and reported in the consolidated statements of income within Revenue Interest and dividends.

Equity investments held for non-trading purposes.

Equity investments held for non-trading purposes are equity securities and similar instruments in which Nomura has neither control nor significant influence held by both BD and non-BD entities which are not held for trading purposes. The investments include private equity investments, investments in exchanges and settlement systems and equity investments held for operating purposes, namely minority equity investments in unaffiliated Japanese financial institutions and corporations in order to promote existing and potential business relationships. These companies often have similar investments in Nomura. Such cross-holdings are a customary business practice in Japan and provide a way for companies to manage shareholder relationships. Equity investments held for non-trading purposes and accrued dividends receivable arising from these equity investments are reported in the consolidated balance sheets within Trading assets and private equity and debt investmentsPrivate equity and debt investments, Other assetsInvestments in equity securities, Other assetsOther depending on the nature of the underlying equity investment..


149


Table of Contents

NOMURA HOLDINGS, INC.

NOTES TO THE CONSOLIDATED FINANCIAL STATEMENTS—(Continued)


Equity investments held for non-trading purposes by BD and non-BD entities are mandatorily carried at FV-NI through application of ASC 940 and ASC 321 “Investments – Equity Securities” (“ASC 321”), respectively. Unrealized and realized gains and losses are reported in the consolidated statements of income within RevenueGain on private equity and debt investments, RevenueGain (loss) on investments in equity securities or RevenueOther depending on the nature of the underlying equity investment. Dividend income is recognized when Nomura’s right to receive the dividend is established and is reported in the consolidated statements of income within RevenueInterest and dividends..

As described above, since April 1, 2024, certain equity investments held for non-trading purposes by non-BD entities which do not have readily determinable fair values have been elected for the fair value measurement alternative permitted by ASC 321.

Payables and deposits—

Payables to customers include amounts payable on client securities transactions and are generally carried at contractual amounts due.

Payables to other than customers include payables to brokers and dealers for failed-to-receive securities, cash collateral payable for derivative transactions, certain collateralized agreements and financing transactions and net payables arising from unsettled securities transactions. Amounts are carried at contractual amounts due unless the FVO is elected.

Deposits received at banks represent amounts held on deposit within banking subsidiaries and are carried at contractual amounts due or carried at FV-NI through election of the FVO.


150


Table of Contents

NOMURA HOLDINGS, INC.

NOTES TO THE CONSOLIDATED FINANCIAL STATEMENTS—(Continued)


Office buildings, land, equipment and facilities—

Office buildings, land, equipment and facilities, owned and held for use by Nomura are carried at cost, net of accumulated depreciation and amortization, except for land, which is carried at cost. Significant renewals and additions are capitalized at cost. Maintenance, repairs and minor renewals are expensed as incurred in the consolidated statements of income.

Leases and subleases entered into by Nomura as either lessor or lessee are classified as either operating or finance leases on inception date in accordance with ASC 842 “Leases.” On lease commencement date, Nomura as lessee recognizes right-of-use (“ROU”) assets and lease liabilities which are reported in the consolidated balance sheets within Other assetsOffice buildings, land, equipment and facilities and Other liabilities, respectively.

Lease liabilities are initially carried at the present value of the future minimum lease payments over the expected lease term. The future minimum lease payments are discounted using a relevant Nomura incremental borrowing rate as derived from information available at lease commencement date. The expected lease term is generally determined based on the contractual maturity of the lease, and adjusted for periods covered by options to extend or terminate the lease when Nomura is reasonably certain to exercise those options. ROU assets are initially carried at the amount of lease liabilities, and adjusted for any prepaid lease payments, initial direct costs incurred and any lease incentives received.

After lease commencement date, for operating leases Nomura as lessee recognizes lease expense over the lease term generally on a straight-line basis in the consolidated statements of income within Occupancy and related depreciation or Information processing and communications. For finance leases, Nomura recognizes amortization charges of ROU assets over the lease term in the consolidated statements of income within Occupancy and related depreciation and interest expense arising on finance lease liabilities in the consolidated statements of income within Interest expense.

Depreciation and amortization expenses of owned assets are generally computed using the straight-line method and recognized over the estimated useful lives of each asset. The estimated useful life of an asset considers technological change, normal deterioration and actual physical usage by Nomura. Leasehold improvements are depreciated over the shorter of their useful life or the term of corresponding lease.

The estimated useful lives for significant asset classes are as follows:


Office buildings

     3 to 50 years  

Equipment and facilities

     3 to 20 years  

Software

     3 to 5 years  

Long-lived assets, including ROU assets and software assets but excluding goodwill and indefinite-lived intangible assets, are reviewed for impairment whenever events or changes in circumstances indicate that the carrying amount may not be recoverable. If the estimated future undiscounted cash flows generated by the asset is less than the carrying amount of the asset, a loss is recognized to the extent that the carrying value exceeds its fair value.

See Note 9 “Leases” for further information.


151


Table of Contents

NOMURA HOLDINGS, INC.

NOTES TO THE CONSOLIDATED FINANCIAL STATEMENTS—(Continued)


Short-term and long-term borrowings—

Short-term borrowings are defined as borrowings which are due on demand, which have a contractual maturity of one year or less at issuance date, or which have a longer contractual maturity but which contain substantive features outside of Nomura’s control that allows the investor to demand redemption within one year from original issuance date. Short-term and long-term borrowings primarily consist of commercial paper, bank borrowings, and certain structured notes issued by Nomura and SPEs consolidated by Nomura, and financial liabilities recognized in transfers of financial assets which are accounted for as financings rather than sales under ASC 860 (“secured financing transactions”). Of these financial liabilities, all structured notes and certain secured financing transactions are carried at FV-NI through election of the FVO. Other short and long-term borrowings are carried at amortized cost or at FV-NI through election of the FVO.

Structured notes are debt securities which contain embedded features (often meeting the accounting definition of a derivative) that alter the return to the investor from simply receiving a fixed or floating rate of interest to a return that depends upon some other variable(s) such as an equity or equity index, commodity price, foreign exchange rate, credit rating of a third party or more complex interest rate calculation. Structured borrowings are borrowings that have similar characteristics as structured notes.

All structured notes and certain structured borrowings issued by Nomura are carried at FV-NI through election of the FVO. This blanket election for structured notes and certain structured borrowings are made primarily to mitigate the volatility in the consolidated statements of income caused by differences in the measurement basis for structured notes and the derivatives used to risk manage those positions and to generally simplify the accounting Nomura applies to these financial instruments.

Changes in the fair value of structured notes elected for the FVO are reported in the consolidated statements of income within RevenueNet gain on trading, except for those changes attributable to Nomura’s own creditworthiness which are reported in the consolidated statements of comprehensive income, net of applicable income taxes within Other comprehensive income (loss).

See Note 13 “Borrowings” for further information.

Income taxes—

Deferred tax assets and liabilities are recognized in the consolidated balance sheets to reflect the expected future tax consequences of operating loss carryforwards, tax credit carryforwards and temporary differences between the carrying amounts for financial reporting purposes and the tax bases of assets and liabilities based upon enacted tax laws and tax rates. Nomura recognizes deferred tax assets to the extent it believes that it is more likely than not that a benefit will be realized. A valuation allowance is established against deferred tax assets for tax benefits available to Nomura that are not deemed more likely than not to be realized.

Deferred tax assets and deferred tax liabilities that relate to the same tax-paying component within a particular tax jurisdiction are offset in the consolidated balance sheets. Net deferred tax assets and net deferred tax liabilities are reported in the consolidated balance sheets within Other assetsOther and Other liabilities respectively.

Nomura recognizes and measures unrecognized tax benefits based on Nomura’s estimate of the likelihood, technical merits that tax positions will be sustained upon examination based on the facts and circumstances and information available at the end of each reporting period. Nomura adjusts the level of unrecognized tax benefits when there is more information available, or when an event occurs requiring a change. The reassessment of unrecognized tax benefits could have a material impact on Nomura’s effective tax rate in the period in which it occurs.

Nomura reports income tax-related interest and penalties in the consolidated statements of income within Income tax expense.

See Note 17 “Income taxes” for further information.


152


Table of Contents

NOMURA HOLDINGS, INC.

NOTES TO THE CONSOLIDATED FINANCIAL STATEMENTS—(Continued)


Stock-based and other compensation awards—

Stock-based awards issued by Nomura to senior management and other employees are classified as either equity or liability awards depending on the terms of the award.

Stock-based awards such as Stock Acquisition Rights (“SARs”) and Restricted Stock Units (“RSUs”) which are expected to be settled by the delivery of the NHI Shares are classified as equity awards. For these awards, total compensation cost is generally fixed at the grant date and measured using the grant-date fair value of the award, net of any amount the employee is obligated to pay and estimated forfeitures.

Stock-based awards such as Notional Stock Units (“NSUs”) and Collared Notional Stock Units (“CSUs”) which are expected to be settled in cash are classified as liability awards. Liability awards are remeasured to fair value at each balance sheet date, net of estimated forfeitures with the final measurement of cumulative compensation cost equal to the settlement amount.

For both equity and liability awards, fair value is determined either by using option pricing models, the market price of NHI Shares or the price of the third party index, as appropriate.

Other compensation awards include Notional Fund Units (“NFUs”) which are linked to performance of specific Nomura managed funds and are settled in cash. NFUs are remeasured to fair value with reference to the underlying funds’ performance at each balance sheet date, net of estimated forfeitures with the final measurement of cumulative compensation cost equal to the settlement amount. Nomura also issues Deferred Cash Awards (“DCAs”) which are multi-year awards settled in cash if specific service conditions are met.

Compensation cost is recognized in the consolidated statements of income over the requisite service period, which generally is equal to the contractual vesting period. Where an award has graded vesting, compensation expense is recognized using the accelerated recognition method.

Certain compensation awards include “Full Career Retirement” (“FCR”) provisions which permit recipients of the awards to continue to vest in the awards upon voluntary termination or by claiming FCR during a pre-defined election window if certain criteria based on corporate title and length of service within Nomura are met. The requisite service period for these awards ends on the earlier of the contractual vesting date and the date that the recipients become eligible for or claim FCR.

Compensation cost recognized for stock-based and other compensation awards is reported in the consolidated statements of income within Compensation and benefits.

See Note 16 “Deferred compensation awards” for further information.

Earnings per share—

The computation of basic earnings per share is based on the weighted average number of shares outstanding during the year. Diluted earnings per share reflects the assumed conversion of all dilutive securities based on the most advantageous conversion rate or exercise price available to the investors, and assuming conversion of convertible debt under the if-converted method.

See Note 14 “Earnings per share” for further information.

Cash and cash equivalents—

Nomura defines cash and cash equivalents as cash on hand and demand deposits with banks.


153


Table of Contents

NOMURA HOLDINGS, INC.

NOTES TO THE CONSOLIDATED FINANCIAL STATEMENTS—(Continued)


Goodwill and intangible assets—

Goodwill is recognized upon completion of a business combination as the difference between the purchase price and the fair value of the net assets acquired. Subsequent to initial recognition, goodwill is not amortized but is tested for impairment at a reporting unit level during the fourth quarter of each fiscal year, or more frequently during earlier interim periods if events or circumstances indicate there may be impairment. Nomura’s reporting units are at the same level as or one level below its business segments.

Nomura tests goodwill of each separate reporting unit by initially qualitatively assessing whether events and circumstances indicate that it is more likely than not (i.e., greater than 50% likelihood) that a reporting unit’s fair value is less than its carrying amount. If such assessment indicates fair value is not less than the carrying value, the reporting unit is deemed not to be impaired and no further analysis is required. If it is more likely than not that fair value of the reporting unit is below its carrying value, a quantitative test is then performed. A goodwill impairment loss is recognized through the consolidated statements of income as the excess of the carrying amount of a reporting unit, including goodwill, over its fair value but limited to the total amount of goodwill allocated to the reporting unit. Intangible assets not subject to amortization (“indefinite-lived intangible assets”) are generally tested for impairment on an individual asset basis during the fourth quarter of each fiscal year, or more frequently during earlier interim periods if events or circumstances indicate there may be impairment. Similar to goodwill, Nomura tests an indefinite-lived intangible asset by initially qualitatively assessing whether events or circumstances indicate that it is more likely than not that the fair value of the intangible asset is less than its carrying amount. If such assessment indicates fair value is not less than the carrying value, the intangible asset is deemed not to be impaired and no further analysis is required. If it is more likely than not that the fair value of the intangible asset is below its carrying value, the current estimated fair value of the intangible asset is compared with its carrying value. An impairment loss is recognized if the carrying value of the intangible asset exceeds its estimated fair value.

Intangible assets with finite lives (“finite-lived intangible assets”) are amortized over their estimated useful lives and tested for impairment either individually or with other assets (“asset group”) when events and circumstances indicate that the carrying value of the intangible asset (or asset group) may not be recoverable.

A finite-lived intangible asset is impaired when its carrying amount or the carrying amount of the asset group exceeds its fair value. An impairment loss is recognized only if the carrying amount of the intangible asset (or asset group) is not recoverable and exceeds its fair value.

For both goodwill and intangible assets, to the extent an impairment loss is recognized, the loss establishes a new cost basis for the asset which cannot be subsequently reversed.

See Note 11 “Other assetsOffice buildings, land, equipment and facilities and Other / Other liabilities” for further information.


154


Table of Contents

NOMURA HOLDINGS, INC.

NOTES TO THE CONSOLIDATED FINANCIAL STATEMENTS—(Continued)


Employee benefit plans—

Nomura provides certain eligible employees with various benefit plans, including pensions and other post-retirement benefits. These benefit plans are classified as either defined benefit plans or defined contribution plans.

Defined benefit plans

Plan assets and benefit obligations, as well as the net periodic benefit cost of a defined benefit pension or post-retirement benefit plan, are recognized based on various actuarial assumptions such as discount rates, expected return on plan assets and future compensation levels at the balance sheet date. Actuarial gains and losses in excess of 10% of the greater of the projected benefit obligation or the fair value of plan assets and unrecognized prior service costs or credits are amortized to net periodic benefit cost on a straight-line basis over the average remaining service life of active employees expected to receive benefits. The overfunded or underfunded status of a plan is reported within Other assetsOther or Other liabilities in the consolidated balance sheets, and changes in funded status are reflected in net periodic benefit cost in the consolidated statements of income within Compensation and benefits or Other and in the consolidated statements of comprehensive income, net of applicable income taxes within Other comprehensive income (loss).

Defined contribution plans

The net periodic pension and other benefit cost of defined contribution plans is recognized in the consolidated statements of income within Compensation and benefits when the employee renders service to Nomura, which generally coincides with when contributions to the plan are made.

See Note 15 “Employee benefit plans” for further information.


155


Table of Contents

NOMURA HOLDINGS, INC.

NOTES TO THE CONSOLIDATED FINANCIAL STATEMENTS—(Continued)


New accounting pronouncements adopted during the current year—

The following table presents a summary of new accounting pronouncements relevant to Nomura which have been adopted on or after April 1, 2025, the date of adoption by Nomura and whether the new accounting pronouncement has had a material financial impact on these consolidated financial statements on adoption or prospectively since adoption:


Pronouncement


Summary of new guidance


Adoption date and
method of adoption


Effect on these
consolidated financial
statements

ASU 2023-08
“Intangibles—Goodwill and Other—Crypto Assets (Subtopic 350-60): Accounting for and Disclosure of Crypto Assets”


•   Requires all in-scope crypto assets be subsequently measured at FV-NI.


•   In-scope crypto assets to be presented separately on the face of the financial statements from other intangible assets.


•   Introduces new disclosure requirements for in-scope crypto assets applicable to all entities.

   Nomura has adopted the amendments based on a modified retrospective approach from April 1, 2025.    No material financial impact on initial adoption or since adoption.

ASU 2023-09

“Income Taxes (Topic 740): Improvements to Income Tax Disclosures”


•   Introduces incremental annual disclosures for disaggregated information about an entity’s effective tax rate reconciliation and information on income taxes paid.


•   Removes certain existing disclosure requirements in relation to unrecognized tax benefits and temporary differences for which a deferred tax liability is not recognized.

   Nomura has adopted the amendments prospectively for the year ended March 31, 2026.   

As this ASU only introduces additional disclosure requirements around Nomura’s effective tax rate and other tax-related matters and does not change the accounting for income taxes, no material financial impact in the year of adoption.


See Note 17“Income taxes” where the enhanced disclosures have been made.


156


Table of Contents

NOMURA HOLDINGS, INC.

NOTES TO THE CONSOLIDATED FINANCIAL STATEMENTS—(Continued)


Future accounting developments—

The following table presents a summary of new authoritative accounting pronouncements relevant to Nomura which will be adopted on or after April 1, 2026, the expected date of adoption by Nomura and whether the new accounting pronouncement is expected to have a material financial impact on these consolidated financial statements on initial adoption or prospectively after adoption:


Pronouncement


Summary of new guidance


Expected adoption
date and method of
adoption


Effect on these
consolidated financial
statements

ASU 2024-03

“Income Statement—Reporting Comprehensive Income—Expense Disaggregation Disclosures (Subtopic 220-40): Disaggregation of Income Statement Expenses”, as amended by ASU 2025-01 “Income Statement—Reporting Comprehensive Income—Expense Disaggregation Disclosures (Subtopic 220-40): Clarifying the Effective Date”


•   Requires additional annual and interim disclosures about specific types of expenses presented in the consolidated statements of income.

   Nomura currently plans to initially adopt the amendments to the annual and interim disclosures prospectively in the consolidated financial statements for the year ending March 31, 2028 and March 31, 2029 respectively.    As this ASU only introduces new disclosures and does not affect the accounting for expense items in the consolidated statements of income, no material financial impact is expected.
        

ASU 2025-08
Financial Instruments—Credit Losses (Topic 326): Purchased Loans


•   Expands the scope of acquired financial assets subject to the gross-up approach in ASC 326 to purchased seasoned held-for-investment loans, excluding credit cards. Under the current guidance, the gross-up approach only applies to purchased financial assets with credit deterioration (“PCD”).


•   Clarifies all non-PCD loans that were acquired in a business combination are deemed seasoned. Other non-PCD loans are seasoned if they were purchased at least 90 days after origination and the acquirer was not involved in the origination of the loans.

   Nomura currently plans to initially adopt the amendments prospectively for the year ending March 31, 2028.    Nomura is evaluating the potential impact of this ASU but does not expect a material financial impact at this stage.


157


Table of Contents

NOMURA HOLDINGS, INC.

NOTES TO THE CONSOLIDATED FINANCIAL STATEMENTS—(Continued)


2. Fair value measurements:

The fair value of financial instruments

A significant amount of Nomura’s financial instruments are carried at fair value. Financial assets carried at fair value on a recurring basis, namely at FV-NI or FV-OCI, are reported in the consolidated balance sheets within Trading assets and private equity and debt investments, Loans and receivables, Collateralized agreements and Other assets. Financial liabilities carried at fair value on a recurring basis are reported within Trading liabilities, Short-term borrowings, Payables and deposits, Collateralized financing, Long-term borrowings and Other liabilities.

Other financial assets and financial liabilities are carried at fair value on a nonrecurring basis, where the primary measurement basis is not fair value but where fair value is used in specific circumstances after initial recognition, such as to measure impairment.

In all cases, fair value is determined in accordance with ASC 820 which defines fair value as the amount that would be exchanged to sell a financial asset or transfer a financial liability in an orderly transaction between market participants at the measurement date. It assumes that the transaction occurs in the principal market for the relevant financial assets or financial liabilities, or in the absence of a principal market, the most advantageous market.

Fair value is usually determined on an individual financial instrument basis consistent with the unit of account of the financial instrument. However, certain financial instruments managed on a portfolio basis are valued as a portfolio, namely based on the price that would be received to sell a net long position (i.e., a net financial asset) or transfer a net short position (i.e., a net financial liability) consistent with how market participants would price the net risk exposure at the measurement date.

Financial assets carried at fair value also include investments in certain funds where, as a practical expedient, fair value is determined on the basis of net asset value per share (“NAV per share”) if the NAV per share is calculated in accordance with certain industry standard principles.

Increases and decreases in the fair value of assets and liabilities may significantly impact Nomura’s position, performance, liquidity and capital resources. As explained below, valuation techniques applied contain inherent uncertainties and Nomura is unable to predict the accurate impact of future developments in the market. The valuation of financial instruments is more difficult during periods of market stress as a result of greater volatility and reduced price transparency and may therefore require the greater use of judgement in the determination of fair value. Where appropriate, Nomura uses economic hedging strategies to mitigate risk, although these hedges are also subject to unpredictable movements in the market.

Valuation methodology for financial instruments carried at fair value on a recurring basis

The fair value of financial instruments is based on quoted market prices including market indices, broker or dealer quotations or an estimation by management of the expected exit price under current market conditions. Various financial instruments, including cash instruments and OTC contracts, have bid and offer prices that are observable in the market. These are measured at the point within the bid-offer range which best represents Nomura’s estimate of fair value. Where quoted market prices or broker or dealer quotations are not available, prices for similar instruments or valuation pricing models are considered in the determination of fair value.

Where quoted prices are available in active markets, no valuation adjustments are taken to modify the fair value of assets or liabilities marked using such prices. Other instruments may be measured using valuation techniques, such as valuation pricing models incorporating observable valuation inputs, unobservable parameters or a combination of both. Valuation pricing models use valuation inputs which would be considered by market participants in valuing similar financial instruments.

Valuation pricing models and their underlying assumptions impact the amount and timing of unrealized and realized gains and losses recognized, and the use of different valuation pricing models or underlying assumptions could produce different financial results. Valuation uncertainty results from a variety of factors, including the valuation technique or model selected, the quantitative assumptions used within the valuation model, the inputs into the model, as well as other factors. Valuation adjustments are used to reflect the assessment of this uncertainty. Common valuation adjustments include model reserves, credit adjustments, close-out adjustments, and other appropriate instrument-specific adjustments, such as those to reflect transfer or sale restrictions. Changes in these valuation adjustments may have a significant impact on our consolidated financial statements.


158


Table of Contents

NOMURA HOLDINGS, INC.

NOTES TO THE CONSOLIDATED FINANCIAL STATEMENTS—(Continued)


The level of adjustments is largely judgmental and is based on an assessment of the factors that management believe other market participants would use in determining the fair value of similar financial instruments. The type of adjustments taken, the methodology for the calculation of these adjustments, and the valuation inputs for these calculations are reassessed periodically to reflect current market practice and the availability of new information.

For example, the fair value of certain financial instruments includes adjustments for credit risk, both with regard to counterparty credit risk on positions held and Nomura’s own creditworthiness on positions issued. Credit risk on financial assets is significantly mitigated by credit enhancements such as collateral and netting arrangements. Any net credit exposure is measured using available and applicable valuation inputs for the relevant counterparty. The same approach is used to measure the credit exposure on Nomura’s financial liabilities as is used to measure counterparty credit risk on Nomura’s financial assets.

Such valuation pricing models are calibrated to the market on a regular basis and inputs used are adjusted for current market conditions and risks. The Valuation Model Validation Group within Nomura’s Risk Management Department reviews pricing models and assesses model appropriateness and consistency independently of the front office. The model reviews consider a number of factors about a model’s suitability for valuation and sensitivity of a particular product. Valuation models are calibrated to the market on a periodic basis by comparison to observable market pricing, comparison with alternative models and analysis of risk profiles.

As explained above, any changes in fixed income, equity, foreign exchange and commodity markets can impact Nomura’s estimates of fair value in the future, potentially affecting trading gains and losses. Where financial contracts have longer maturity dates, Nomura’s estimates of fair value may involve greater subjectivity due to the lack of transparent market data.

Fair value hierarchy

Certain financial instruments carried at fair value, including those carried at fair value using the FVO, have been categorized into a three-level hierarchy (“fair value hierarchy”) based on the transparency of valuation inputs used by Nomura to estimate fair value. A financial instrument is classified in the fair value hierarchy based on the lowest level of input that is significant to the fair value measurement of the financial instrument. The three levels of the fair value hierarchy are defined as follows, with Level 1 representing the most transparent inputs and Level 3 representing the least transparent inputs:

Level 1:

Observable valuation inputs that reflect quoted prices (unadjusted) for identical financial instruments traded in active markets at the measurement date.

Level 2:

Valuation inputs other than quoted prices included within Level 1 that are either directly or indirectly observable for the financial instrument.

Level 3:

Unobservable valuation inputs which reflect Nomura assumptions and specific data.

The availability of valuation inputs observable in the market varies by type of financial instrument and can be affected by a variety of factors. Significant factors include, but are not restricted to, the prevalence of similar financial instruments in the market, especially for those which are customized, how established the financial instrument is in the market, for example, whether it is a new financial instrument or is relatively mature, and the reliability of information provided in the market which would depend, for example, on the frequency and volume of current market data. A period of significant change in the market may reduce the availability of observable data. Under such circumstances, financial instruments may be reclassified into a lower level in the fair value hierarchy.

Significant judgments used in determining the classification of financial instruments include the nature of the market in which the financial instrument would be traded, the underlying risks, the type and liquidity of market data inputs and the nature of observed transactions for similar financial instruments.


159


Table of Contents

NOMURA HOLDINGS, INC.

NOTES TO THE CONSOLIDATED FINANCIAL STATEMENTS—(Continued)


Where valuation models include the use of valuation inputs which are less observable or unobservable in the market, significant management judgment is used in determining fair value. The valuations for Level 3 financial instruments, therefore, involve a greater degree of judgment than those valuations for Level 1 or Level 2 financial instruments.

Certain criteria used to determine whether a market is active or inactive include the number of transactions, the frequency that pricing is updated by other market participants, the variability of price quotes among market participants, and the amount of publicly available information.


160


Table of Contents

NOMURA HOLDINGS, INC.

NOTES TO THE CONSOLIDATED FINANCIAL STATEMENTS—(Continued)


The following tables present the amounts of Nomura’s financial instruments carried at fair value on a recurring basis as of March 31, 2025 and 2026 within the fair value hierarchy.


     Billions of yen  
     March 31, 2025  
     Level 1      Level 2      Level 3      Counterparty
and
Cash Collateral
Netting(1)
    Balance as of
March 31, 2025
 

Assets:


Trading assets and private equity and debt investments(2)


Equities(3)

   ¥ 2,807      ¥ 1,661      ¥ 21      ¥ —      ¥ 4,489  

Private equity and debt investments(5)

     0        2        103        —        105  

Japanese government securities

     2,674        —         —         —        2,674  

Japanese agency and municipal securities

     —         222        0        —        222  

Foreign government, agency and municipal securities

     4,402        2,346        6        —        6,754  

Bank and corporate debt securities and loans for trading purposes

     —         1,762        181        —        1,943  

Commercial mortgage-backed securities (“CMBS”)

     —         2        10        —        12  

Residential mortgage-backed securities (“RMBS”)

     —         3,335        48        —        3,383  

Issued/Guaranteed by government sponsored entity

     —         3,204        —         —        3,204  

Other

     —         131        48        —        179  

Real estate-backed securities

     —         137        207        —        344  

Collateralized debt obligations (“CDOs”) and other(6)

     —         35        42        —        77  

Investment trust funds and other

     470        7        3        —        480  


Total trading assets and private equity and debt investments

     10,353        9,509        621        —        20,483  


Derivative assets(7)


Equity contracts

     14        2,541        17        —        2,572  

Interest rate contracts

     22        12,306        100        —        12,428  

Credit contracts

     1        240        63        —        304  

Foreign exchange contracts

     0        4,330        33        —        4,363  

Other contracts

     3        5        3        —        11  

Netting

     —         —         —         (17,711     (17,711


Total derivative assets

     40        19,422        216        (17,711     1,967  


Subtotal

   ¥ 10,393      ¥ 28,931      ¥ 837      ¥ (17,711   ¥ 22,450  


Loans and receivables(8)

     —         1,795        448        —        2,243  

Collateralized agreements(9)

     —         344        15        —        359  

Other assets(2)


Non-trading debt securities(10)

     116        352        17        —        485  

Other(3)(4)(11)

     211        259        275        —        745  


Total

   ¥ 10,720      ¥ 31,681      ¥ 1,592      ¥ (17,711   ¥ 26,282  


Liabilities:


Trading liabilities


Equities

   ¥ 2,757      ¥ 18      ¥ 1      ¥ —      ¥ 2,776  

Japanese government securities

     2,569        —         —         —        2,569  

Japanese agency and municipal securities

     —         2        —         —        2  

Foreign government, agency and municipal securities

     2,828        754        —         —        3,582  

Bank and corporate debt securities

     —         217        0        —        217  

Residential mortgage-backed securities (“RMBS”)

     —         0        —         —        0  

Collateralized Debt Obligation (CDO) and Other Securitized Product(6)

     —         —         —         —        —   

Investment trust funds and other

     249        2        0        —        251  


Total trading liabilities

     8,403        993        1        —        9,397  


Derivative liabilities(7)


Equity contracts

     5        3,048        16        —        3,069  

Interest rate contracts

     31        11,523        94        —        11,648  

Credit contracts

     1        282        99        —        382  

Foreign exchange contracts

     —         4,148        46        —        4,194  

Other contracts

     1        42        7        —        50  

Netting

     —         —         —         (17,361     (17,361


Total derivative liabilities

     38        19,043        262        (17,361     1,982  


Subtotal

   ¥ 8,441      ¥ 20,036      ¥ 263      ¥ (17,361   ¥ 11,379  


Short-term borrowings(12)

   ¥ —       ¥ 595      ¥ 36      ¥ —      ¥ 631  

Payables and deposits(13)(14)

     —         311        14        —        325  

Collateralized financing(9)

     —         704        —         —        704  

Long-term borrowings(12)(15)(16)

     10        6,428        477        —        6,915  

Other liabilities(17)

     132        265        65        —        462  


Total

   ¥ 8,583      ¥ 28,339      ¥ 855      ¥ (17,361   ¥ 20,416  


161


Table of Contents

NOMURA HOLDINGS, INC.

NOTES TO THE CONSOLIDATED FINANCIAL STATEMENTS—(Continued)


     Billions of yen  
     March 31, 2026  
     Level 1      Level 2      Level 3      Counterparty
and
Cash Collateral
Netting(1)
    Balance as of
March 31, 2026
 

Assets:


Trading assets and private equity and debt investments(2)


Equities(3)

   ¥ 3,992      ¥ 1,576      ¥ 14      ¥ —      ¥ 5,582  

Private equity and debt investments(5)

     —         2        146        —        148  

Japanese government securities

     3,983        —         —         —        3,983  

Japanese agency and municipal securities

     —         142        —         —        142  

Foreign government, agency and municipal securities

     4,591        2,549        4        —        7,144  

Bank and corporate debt securities and loans for trading purposes

     —         2,028        104        —        2,132  

Commercial mortgage-backed securities (“CMBS”)

     —         9        0        —        9  

Residential mortgage-backed securities (“RMBS”)

     —         3,172        10        —        3,182  

Issued/Guaranteed by government sponsored entity

     —         3,021        —         —        3,021  

Other

     —         151        10        —        161  

Real estate-backed securities

     —         445        82        —        527  

Collateralized debt obligations (“CDOs”) and other(6)

     —         25        34        —        59  

Investment trust funds and other

     372        56        9        —        437  


Total trading assets and private equity and debt investments

     12,938        10,004        403        —        23,345  


Derivative assets(7)


Equity contracts

     0        3,016        37        —        3,053  

Interest rate contracts

     1        15,686        119        —        15,806  

Credit contracts

     0        296        98        —        394  

Foreign exchange contracts

     0        5,709        35        —        5,744  

Other contracts

     0        3        6        —        9  

Netting

     —         —         —         (22,113     (22,113


Total derivative assets

     1        24,710        295        (22,113     2,893  


Subtotal

   ¥ 12,939      ¥ 34,714      ¥ 698      ¥ (22,113   ¥ 26,238  


Loans and receivables(8)

     6        2,244        584        —        2,834  

Collateralized agreements(9)

     —         455        16        —        471  

Other assets(2)


Non-trading debt securities(10)

     347        366        48        —        761  

Other(3)(4)(11)

     368        264        308        —        940  


Total

   ¥ 13,660      ¥ 38,043      ¥ 1,654      ¥ (22,113   ¥ 31,244  


Liabilities:


Trading liabilities


Equities

   ¥ 3,438      ¥ 34      ¥ 0      ¥ —      ¥ 3,472  

Japanese government securities

     2,719        —         —         —        2,719  

Japanese agency and municipal securities

     —         2        —         —        2  

Foreign government, agency and municipal securities

     2,694        1,255        —         —        3,949  

Bank and corporate debt securities

     —         220        0        —        220  

Residential mortgage-backed securities (“RMBS”)

     —         0        —         —        0  

Collateralized Debt Obligation (CDO) and Other Securitized Product(6)

     —         0        1        —        1  

Investment trust funds and other

     120        13        —         —        133  


Total trading liabilities

     8,971        1,524        1        —        10,496  


Derivative liabilities(7)


Equity contracts

     0        3,561        10        —        3,571  

Interest rate contracts

     24        14,476        135        —        14,635  

Credit contracts

     3        402        154        —        559  

Foreign exchange contracts

     —         5,292        57        —        5,349  

Other contracts

     2        27        8        —        37  

Netting

     —         —         —         (21,731     (21,731


Total derivative liabilities

     29        23,758        364        (21,731     2,420  


Subtotal

   ¥ 9,000      ¥ 25,282      ¥ 365      ¥ (21,731   ¥ 12,916  


Short-term borrowings(12)

   ¥ —       ¥ 873      ¥ 43      ¥ —      ¥ 916  

Payables and deposits(13)(14)

     —         303        12        —        315  

Collateralized financing(9)

     —         694        —         —        694  

Long-term borrowings(12)(15)(16)

     11        8,024        452        —        8,487  

Other liabilities(17)

     255        284        67        —        606  


Total

   ¥ 9,266      ¥ 35,460      ¥ 939      ¥ (21,731   ¥ 23,934  


162


Table of Contents

NOMURA HOLDINGS, INC.

NOTES TO THE CONSOLIDATED FINANCIAL STATEMENTS—(Continued)


(1)

Represents the amount offset under counterparty netting of derivative assets and liabilities as well as cash collateral netting against net derivatives assets or liabilities.

(2)

Investments that are carried at fair value using NAV per share as a practical expedient have not been classified in the fair value hierarchy. As of March 31, 2025 and March 31, 2026, the fair values of these investments which are included in Trading assets and private equity and debt investments were ¥73 billion and ¥104 billion, respectively. As of March 31, 2025 and March 31, 2026, the fair values of these investments which are included in Other assets were ¥3 billion and ¥15 billion, respectively.

(3)

Includes equity investments that would have been accounted for under the equity method had Nomura not chosen to elect the FVO.

(4)

Includes equity investments which comprise listed and unlisted equity securities held for operating purposes in the amounts of ¥72,184 million and ¥26,217 million, respectively, as of March 31, 2025 and ¥97,173 million and ¥26,018 million, respectively, as of March 31, 2026.

(5)

Private equity and debt investments include minority private equity and venture capital equity investments and other junior debt investments such as mezzanine debt held for non-trading purposes, and post-IPO investments. These investments also include equity investments that would have been accounted for under the equity method had Nomura not chosen to elect the FVO.

(6)

Includes collateralized loan obligations (“CLOs”) and asset-backed securities (“ABS”) such as those secured on credit card loans, auto loans and student loans.

(7)

Derivatives which contain multiple types of risk are classified based on the primary risk type of the instrument.

(8)

Includes loans and receivables for which the fair value option has been elected.

(9)

Includes collateralized agreements or collateralized financing for which the FVO has been elected.

(10)

Includes non-trading debt securities for which the FVO has been elected and AFS debt securities.

(11)

Includes non-financial assets carried at fair value on a recurring basis using similar valuation methodologies to those used for financial instruments.

(12)

Includes structured notes for which the FVO has been elected.

(13)

Includes deposits received at banks for which the FVO has been elected.

(14)

Includes embedded derivatives bifurcated from deposits received at banks. Deposits are adjusted for fair value changes in corresponding embedded derivatives for presentation in the consolidated balance sheets.

(15)

Includes embedded derivatives bifurcated from issued structured notes. Structured notes are adjusted for fair value changes in corresponding embedded derivatives for presentation in the consolidated balance sheets

(16)

Includes liabilities recognized from secured financing transactions that are accounted for as financings rather than sales. Nomura elected the fair value option for these liabilities.

(17)

Includes loan commitments for which the FVO has been elected.


163


Table of Contents

NOMURA HOLDINGS, INC.

NOTES TO THE CONSOLIDATED FINANCIAL STATEMENTS—(Continued)


Valuation techniques by major class of financial instrument

The valuation techniques used by Nomura to estimate fair value for major classes of financial instruments, together with the significant inputs which determine classification in the fair value hierarchy, are as follows.

Equities and equity securities reported within Other assets—Equities and equity securities reported within Other assets include direct holdings of both listed and unlisted equity securities, and fund investments. The fair value of listed equity securities is determined using quoted prices for identical securities from active markets where available. These valuations should be in line with market practice and therefore can be based on bid prices or mid-market prices. Nomura determines whether the market is active depending on the sufficiency and frequency of trading activity. Where these securities are classified in Level 1 of the fair value hierarchy, no valuation adjustments are made to fair value. Listed equity securities traded in inactive markets are also generally valued using the exchange price and are classified in Level 2. While rare in practice, Nomura may apply a discount or liquidity adjustment to the exchange price of a listed equity security traded in an inactive market if the exchange price is not considered to be an appropriate representation of fair value. These adjustments are determined by individual security and are not determined or influenced by the size of holding. The amount of such adjustments made to listed equity securities traded in inactive markets was ¥nil as of March 31, 2025 and 2026, respectively. The fair value of unlisted equity securities is determined using the same valuation technique as private equity and debt investments described below and are usually classified in Level 3 because significant valuation inputs such as liquidity discounts and credit spreads are unobservable.

Private equity and debt investments—The determination of fair value of unlisted equity and debt investments requires significant management judgment because the investments, by their nature, have little or no price transparency. Private equity and debt investments are initially carried at cost as an approximation of fair value. Adjustments to carrying value are made if there is third party evidence of a change in value. Adjustments are also made, in the absence of third party transactions, if it is determined that the expected exit price of the investment is different from carrying value. In reaching that determination, Nomura primarily uses either a discounted cash flow (“DCF”) or market multiple valuation technique. A DCF valuation technique incorporates estimated future cash flows to be generated from the investee, as adjusted for an appropriate growth rate discounted at a weighted average cost of capital (“WACC”). Market multiple valuation techniques include comparables such as Enterprise Value/Earnings before interest, taxes, depreciation and amortization (“EV/EBITDA”) ratios, Price/Earnings (“PE”) ratios, Price/Book ratios, Price/Embedded Value ratios and other multiples based on relationships between numbers reported in the financial statements of the investee and the price of comparable companies. A liquidity discount may also be applied to either a DCF or market multiple valuation to reflect the specific characteristics of the investee. The liquidity discount includes considerations for various uncertainties in the model and inputs to valuation. Where possible these valuations are compared with the operating cash flows and financial performance of the investee or properties relative to budgets or projections, PE data for similar quoted companies, trends within sectors and/or regions and any specific rights or terms associated with the investment, such as conversion features and liquidation preferences. Private equity and debt investments are generally classified in Level 3 since the valuation inputs such as those mentioned above are usually unobservable.


164


Table of Contents

NOMURA HOLDINGS, INC.

NOTES TO THE CONSOLIDATED FINANCIAL STATEMENTS—(Continued)


Government, agency and municipal securities—The fair value of Japanese and other G7 government securities is primarily determined using quoted market prices, executable broker or dealer quotations, or alternative pricing sources. These securities are traded in active markets and therefore are classified within Level 1 of the fair value hierarchy. Non-G7 government securities, agency securities and municipal securities are valued using similar pricing sources but are generally classified in Level 2 as they are traded in inactive markets. Certain non-G7 securities may be classified in Level 1 because they are traded in active markets. Certain securities may be classified in Level 3 because they are traded infrequently and there is not sufficient information from comparable securities to classify them in Level 2. These are valued using DCF valuation techniques which include significant unobservable valuation inputs such as credit spreads of the issuer.

Bank and corporate debt securities—The fair value of bank and corporate debt securities is primarily determined using broker or dealer quotations and recent market transactions of identical or similar debt securities if available, but also using DCF valuation techniques. Consideration is given to the nature of the broker and dealer quotations, namely whether these are indicative or executable, the number of available quotations and how these quotations compare to any available recent market activity or alternative pricing sources. The significant valuation inputs used for DCF valuations are yield curves, asset swap spreads, recovery rates and credit spreads of the issuer. Bank and corporate debt securities are generally classified in Level 2 because these valuation inputs are usually observable or market-corroborated. Certain bank and corporate debt securities will be classified in Level 3 because they are traded infrequently and there is insufficient information from comparable securities to classify them in Level 2, or credit spreads or recovery rates of the issuer used in DCF valuations are unobservable.

Commercial mortgage-backed securities (“CMBS”) and Residential mortgage-backed securities (“RMBS”)—The fair value of CMBS and RMBS are primarily determined using DCF valuation techniques but also using broker or dealer quotations and recent market transactions of identical or similar securities, if available. Consideration is given to the nature of the broker and dealer quotations, namely whether these are indicative or executable, the number of available quotations and how these quotations compare to any available recent market activity or alternative pricing sources. The significant valuation inputs include yields, prepayment rates, default probabilities and loss severities. CMBS and RMBS securities are generally classified in Level 2 because these valuation inputs are observable or market-corroborated. Certain CMBS and RMBS positions will be classified in Level 3 because they are traded infrequently and there is insufficient information from comparable securities to classify them in Level 2, or one or more of the significant valuation inputs used in DCF valuations are unobservable.

Real estate-backed securities—The fair value of real estate-backed securities is determined using broker or dealer quotations, recent market transactions or by reference to a comparable market index. Consideration is given to the nature of the broker and dealer quotations, namely whether these are indicative or executable, the number of available quotations and how these quotations compare to any available recent market activity or alternative pricing sources. Where all significant inputs are observable, the securities will be classified in Level 2. For certain securities, no direct pricing sources or comparable securities or indices may be available. These securities are valued using DCF or valuation techniques and are classified in Level 3 as the valuation includes significant unobservable valuation inputs such as yields or loss severities.

Collateralized debt obligations (“CDOs”) and other—The fair value of CDOs is primarily determined using DCF valuation techniques but also using broker or dealer quotations and recent market transactions of identical or similar securities, if available. Consideration is given to the nature of the broker and dealer quotations, namely whether these are indicative or executable, the number of available quotations and how these quotations compare to any available recent market activity or alternative pricing sources. The significant valuation inputs used include market spread data for each credit rating, yields, prepayment rates, default probabilities and loss severities. CDOs are generally classified in Level 2 because these valuation inputs are observable or market-corroborated. CDOs will be classified in Level 3 where one or more of the significant valuation inputs used in the DCF valuations are unobservable.


165


Table of Contents

NOMURA HOLDINGS, INC.

NOTES TO THE CONSOLIDATED FINANCIAL STATEMENTS—(Continued)


Investment trust funds and other—Publicly traded funds which are valued based on quoted prices in active markets are classified in Level 1 of the fair value hierarchy. Investments in funds that are not publicly traded but Nomura has the ability to redeem its investment at NAV per share on the balance sheet date are valued at NAV and classified in Level 2. Investments in funds which are valued using significant unobservable valuation inputs such as credit spreads of issuer and correlation are classified in Level 3. Investment in funds that are carried at fair value using NAV per share as a practical expedient are not classified in the fair value hierarchy.

DerivativesEquity contracts—Nomura enters into both exchange-traded and OTC equity derivative transactions such as index and equity options, equity basket options and index and equity swaps. Where these derivatives are traded in active markets and the exchange price is representative of fair value, the fair value of exchange-traded equity derivatives is determined using an unadjusted exchange price and classified in Level 1 of the fair value hierarchy. The fair value of exchange-traded equity derivatives which are traded in inactive markets or where the exchange price is not representative of fair value is determined using a model price and are classified in Level 2. The fair value of OTC equity derivatives is determined through option models such as Black-Scholes and Monte Carlo simulation. The significant valuation inputs used include equity prices, dividend yields, volatilities and correlations. Valuation adjustments are also made to model valuations in order to reflect counterparty credit risk on derivative assets and Nomura’s own creditworthiness on derivative liabilities. OTC equity derivatives are generally classified in Level 2 because all significant valuation inputs and adjustments are observable or market-corroborated. Certain less liquid vanilla or more complex equity derivatives are classified in Level 3 where dividend yield, volatility or correlation valuation inputs are significant and unobservable.

DerivativesInterest rate contracts—Nomura enters into both exchange-traded and OTC interest rate derivative transactions such as interest rate swaps, currency swaps, interest rate options, forward rate agreements, swaptions, caps and floors. Where these derivatives are traded in active markets and the exchange price is representative of fair value, the fair value of exchange-traded interest rate derivatives is determined using an unadjusted exchange price and classified in Level 1 of the fair value hierarchy. The fair value of exchange-traded interest rate derivatives which are traded in inactive markets or where the exchange price is not representative of fair value is determined using a model price and are classified in Level 2. The fair value of OTC interest rate derivatives is determined through DCF valuation techniques as well as option models such as Black-Scholes or Monte Carlo simulation. The significant valuation inputs used include interest rates, forward foreign exchange (“FX”) rates, volatilities and correlations. Valuation adjustments are also made to model valuations in order to reflect counterparty credit risk on derivative assets and Nomura’s own creditworthiness on derivative liabilities. OTC interest rate derivatives are generally classified in Level 2 because all significant valuation inputs and adjustments are observable or market-corroborated. Certain less liquid vanilla or more complex OTC interest rate derivatives are classified in Level 3 where interest rate, volatility or correlation valuation inputs are significant and unobservable.

DerivativesCredit contracts—Nomura enters into OTC credit derivative transactions such as credit default swaps and credit options on single names, indices or baskets of assets. The fair value of OTC credit derivatives is determined through DCF valuation techniques as well as option models such as Black-Scholes or Monte Carlo simulation. The significant valuation inputs used include interest rates, credit spreads, recovery rates, default probabilities, volatilities and correlations. Valuation adjustments are also made to model valuations in order to reflect counterparty credit risk on derivative assets and Nomura’s own creditworthiness on derivative liabilities. OTC credit derivatives are generally classified in Level 2 of the fair value hierarchy because all significant valuation inputs and adjustments are observable or market-corroborated. Certain less liquid vanilla or more complex OTC credit derivatives are classified in Level 3 where credit spread, recovery rate, volatility or correlation valuation inputs are significant and unobservable.


166


Table of Contents

NOMURA HOLDINGS, INC.

NOTES TO THE CONSOLIDATED FINANCIAL STATEMENTS—(Continued)


DerivativesForeign exchange contracts—Nomura enters into both exchange-traded and OTC foreign exchange derivative transactions such as foreign exchange forwards and currency options. The fair value of exchange-traded foreign exchange derivatives which are traded in inactive markets or where the exchange price is not representative of fair value is determined using a model price and are classified in Level 2. The fair value of OTC foreign exchange derivatives is determined through DCF valuation techniques as well as option models such as Black-Scholes or Monte Carlo simulation. The significant valuation inputs used include interest rates, forward FX rates, spot FX rates and volatilities. Valuation adjustments are also made to model valuations in order to reflect counterparty credit risk on derivative assets and Nomura’s own creditworthiness on derivative liabilities. OTC foreign exchange derivatives are generally classified in Level 2 because all significant valuation inputs and adjustments are observable or market-corroborated. Certain foreign exchange derivatives are classified in Level 3 where interest rates, volatility or correlation valuation inputs are significant and unobservable.

Nomura includes valuation adjustments in its estimation of fair value of certain OTC derivatives relating to funding costs associated with these transactions to be consistent with how market participants in the principal market for these derivatives would determine fair value.

Loans and receivables—The fair value of loans and receivables carried at fair value either as trading assets or through election of the fair value option is primarily determined using DCF valuation techniques as quoted prices are typically not available. The significant valuation inputs used are similar to those used in the valuation of corporate debt securities described above. Loans and receivables are generally classified in Level 2 of the fair value hierarchy because all significant valuation inputs are observable. Certain loans and receivables, however, are classified in Level 3 because they are traded infrequently and there is not sufficient information from comparable securities to classify them in Level 2 or credit spreads of the issuer or recovery rates used in DCF valuations are significant and unobservable.

Collateralized agreements and Collateralized financing—The primary types of collateralized agreement and financing transactions carried at fair value are reverse repurchase and repurchase agreements elected for the fair value option. The fair value of these financial instruments is primarily determined using DCF valuation techniques. The significant valuation inputs used include interest rates and collateral funding spreads such as general collateral or special rates. Reverse repurchase and repurchase agreements are generally classified in Level 2 of the fair value hierarchy because these valuation inputs are usually observable.

Non-trading debt securities—These are debt securities held by certain non-trading subsidiaries in the group and are valued and classified in the fair value hierarchy using the same valuation techniques used for other debt securities classified as Government, agency and municipal securities and Bank and corporate debt securities described above.

Short-term and long-term borrowings (“Structured notes”)—Structured notes are debt securities issued by Nomura or by consolidated VIEs which contain embedded features that alter the return to the investor from simply receiving a fixed or floating rate of interest to a return that depends upon some other variables, such as an equity or equity index, commodity price, foreign exchange rate, credit rating of a third party or a more complex interest rate (i.e., an embedded derivative).


167


Table of Contents

NOMURA HOLDINGS, INC.

NOTES TO THE CONSOLIDATED FINANCIAL STATEMENTS—(Continued)


The fair value of structured notes is determined using quoted prices in active markets for the identical instrument if available, and where not available, using a mixture of valuation techniques that use the quoted price of the identical liability when traded as an asset, quoted prices for similar liabilities, similar liabilities when traded as assets, or an internal model which combines DCF valuation techniques and option pricing models, depending on the nature of the embedded features within the structured note. Where an internal model is used, Nomura estimates the fair value of both the underlying debt instrument and the embedded derivative components. The significant valuation inputs used to estimate the fair value of the debt instrument component include yield curves, prepayment rates, default probabilities and loss severities. The significant valuation inputs used to estimate the fair value of the embedded derivative component are the same as those used for the relevant type of freestanding OTC derivative discussed above. A valuation adjustment is also made to the entire structured note in order to reflect Nomura’s own creditworthiness. This adjustment is determined based on recent observable secondary market transactions and executable broker quotes involving Nomura debt instruments and is therefore typically treated as a Level 2 valuation input. Structured notes are generally classified in Level 2 of the fair value hierarchy as all significant valuation inputs and adjustments are observable. Where any unobservable valuation inputs are significant, such as yields, prepayment rates, default probabilities, loss severities, volatilities and correlations used to estimate the fair value of the embedded derivative component, structured notes are classified in Level 3.

Long-term borrowings (“Secured financing transactions”)—Secured financing transactions are liabilities recognized when a transfer of a financial asset does not meet the criteria for sales accounting under ASC 860 and therefore the transaction is accounted for as a secured borrowing. These liabilities are valued using the same valuation techniques that are applied to the transferred financial assets which remain on the consolidated balance sheets and are therefore classified in the same level in the fair value hierarchy as the transferred financial assets. These liabilities do not provide general recourse to Nomura and therefore, no adjustment is made to reflect Nomura’s own creditworthiness.


168


Table of Contents

NOMURA HOLDINGS, INC.

NOTES TO THE CONSOLIDATED FINANCIAL STATEMENTS—(Continued)


Level 3 financial instruments

The valuation of Level 3 financial instruments is dependent on certain significant valuation inputs which are unobservable. Common characteristics of an inactive market include a low number of transactions of the financial instrument, stale or non-current price quotes, price quotes that vary substantially either over time or among market makers, non-executable broker quotes or little publicly released information.

If corroborative evidence is not available to value Level 3 financial instruments, fair value may be measured using other equivalent products in the market. The level of correlation between the specific Level 3 financial instrument and the available benchmark instrument is considered as an unobservable valuation input. Other techniques for determining an appropriate value for unobservable valuation input may consider information such as consensus pricing data among certain market participants, historical trends, extrapolation from observable market data and other information Nomura would expect market participants to use in valuing similar instruments.

Use of reasonably possible alternative valuation input assumptions to value Level 3 financial instruments will significantly influence fair value determination. Ultimately, the uncertainties described above about input assumptions imply that the fair value of Level 3 financial instruments is a judgmental estimate. The specific valuation for each instrument is based on management’s judgment of prevailing market conditions, in accordance with Nomura’s established valuation policies and procedures.


169


Table of Contents

NOMURA HOLDINGS, INC.

NOTES TO THE CONSOLIDATED FINANCIAL STATEMENTS—(Continued)


Quantitative and qualitative information regarding significant unobservable valuation inputs

The following tables present quantitative and qualitative information about the significant unobservable valuation inputs used by Nomura to measure the fair value of financial instruments classified in Level 3 as of March 31, 2025 and 2026. These financial instruments will also typically include observable valuation inputs (i.e., Level 1 or Level 2 valuation inputs) which are not included in the table and are also often hedged using financial instruments which are classified in Level 1 or Level 2 of the fair value hierarchy. Changes in each of these significant unobservable valuation inputs used by Nomura will impact upon the fair value measurement of the financial instrument. The following tables also illustrate qualitatively how an increase in those significant unobservable valuation inputs might result in a higher or lower fair value measurement at the reporting date and the interrelationship between significant unobservable valuation inputs where more than one is used to determine fair value measurement of the financial instruments.


    March 31, 2025

Financial Instrument

  Fair
value in
billions of
yen
   

Valuation

technique


Significant

unobservable
valuation input

  Range of
valuation
inputs(1)
    Weighted
Average(2)(3)
   

Impact of
increases in
significant
unobservable
valuation

inputs(4)(5)


Interrelationships
between valuation

inputs(6)

Assets:                                                                         

Trading assets and private equity

and debt investments


Equities

    ¥21     DCF/ Option models   Credit spreads     2.5%       2.5%     Lower fair value   Not applicable


Private equity and debt investments

    103     DCF  

WACC

Growth rates

Credit spreads

Liquidity discounts


5.8 – 17.3%
0.0 – 2.0%
7.9 – 11.0%
5.0 – 30.0%


11.6%
1.2%
9.4%
16.0%


  Lower fair value Higher fair value Lower fair value Lower fair value   No predictable interrelationship


    Market multiples  

EV/EBITDA ratios PE Ratios

Liquidity discounts


7.8 – 16.2 x
10.6 – 28.4 x
5.0 – 20.0%


10.0 x
15.2 x
9.6%


  Higher fair value Higher fair value Lower fair value   No predictable interrelationship


Foreign government, agency and municipal securities

    6     DCF   Credit spreads Recovery rates    
0.0 – 2.4%
3.4 – 18.0%


1.1%
14.4%
 
 
  Lower fair value Higher fair value   No predictable interrelationship


Bank and corporate debt securities and loans for trading purposes

    181     DCF   Credit spreads Recovery rates    
0.0 – 227.0%
0.0 – 100.0%


14.3%
79.8%
 
 
  Lower fair value Higher fair value   No predictable interrelationship


Commercial mortgage-

backed securities (“CMBS”)

    10     DCF   Yields Loss severities    

21.1%

65.0%


21.1%
65.0%
 
 
  Lower fair value Lower fair value   No predictable interrelationship


Residential mortgage-backed securities (“RMBS”)

    48     DCF  

Yields

Prepayment rates Loss severities


21.5 – 62.2%
12.0 – 15.0%
0.0 – 100.0%


41.6%
13.5%
50.4%


  Lower fair value Lower fair value Lower fair value   No predictable interrelationship


Real estate-backed

securities

    207     DCF   Loss severities     0.0 – 16.9%       2.3%     Lower fair value   Not applicable


Collateralized debt obligations (“CDOs”) and other

    42     DCF   Yields Prepayment rates Default probabilities Loss severities Credit spreads    


4.0 – 50.0%
20.0%

2.0%
62.9 – 100.0%
0.1 – 16.9%


13.6%
20.0%
2.0%
87.7%
4.7%


  Lower fair value Lower fair value Lower fair value Lower fair value Lower fair value   Change in default probabilities typically accompanied by directionally similar change in loss severities and opposite change in prepayment rates


Investment trust funds and other

    3     DCF   Liquidity discounts     1.5 – 2.9%       2.1%     Lower fair value   Not applicable


170


Table of Contents

NOMURA HOLDINGS, INC.

NOTES TO THE CONSOLIDATED FINANCIAL STATEMENTS—(Continued)


    March 31, 2025

Financial Instrument

  Fair
value in
billions of
yen
   

Valuation

technique


Significant

unobservable
valuation input

  Range of
valuation
inputs(1)
    Weighted
Average(2)(3)
   

Impact of
increases in
significant
unobservable
valuation

inputs(4)(5)


Interrelationships
between valuation

inputs(6)

Derivatives, net:                                                                       

Equity contracts

    ¥1     Option models   Dividend yield Volatilities Correlations    

0.0 – 16.6%
3.5 – 99.4%
(0.85) – 0.99


— 

— 

— 


  Higher fair value Higher fair value Higher fair value   No predictable interrelationship


Interest rate contracts

    6     DCF/ Option models   Interest rates Volatilities Volatilities Correlations    


0.9 – 4.5%
9.8 – 13.3%
41.0 – 261.7 bp
(1.00) – 0.99


— 

— 

— 

— 


  Higher fair value Higher fair value Higher fair value Higher fair value   No predictable interrelationship


Credit contracts

    (36)     DCF/ Option models   Credit spreads Recovery rates Volatilities Correlations    


0.0 – 132.2%
1.0 – 90.0%
45.9 – 51.9%
0.00 – 0.85


— 

— 

— 

— 


  Higher fair value Higher fair value Higher fair value Higher fair value   No predictable interrelationship


Foreign exchange contracts

    (13)     Option models   Volatilities Correlations    
1.6 – 18.8%
0.29 – 0.70


— 

— 


  Higher fair value Higher fair value   No predictable interrelationship


Loans and receivables     448     DCF   Credit spreads Recovery rates    
0.0 – 193.2%
66.7 – 100.0%


9.9%
95.1%
 
 
  Lower fair value Higher fair value   No predictable interrelationship


Collateralized agreements     15     DCF   Repo rate     6.4%       6.4%     Lower fair value   Not applicable


Other assets              

Non-trading debt securities

    17     DCF   Credit spreads     5.2 – 14.4%       7.3%     Lower fair value   Not applicable


Other(7)(8)

    275     DCF  

WACC

Growth rates


10.6%

3.0%


10.6%
3.0%
 
 
  Lower fair value Higher fair value   No predictable interrelationship


    Market multiples   Liquidity discounts     25.0%       25.0%     Lower fair value   Not applicable


Liabilities:              
Short-term borrowings     36     DCF/ Option models   Volatilities Correlations    
5.0 – 51.5%
(0.72) – 0.96


— 

— 


  Higher fair value Higher fair value   No predictable interrelationship


Payable and deposits     14     DCF/ Option models   Volatilities Correlations    
9.8 – 10.6%
0.40 – 0.98


— 

— 


  Higher fair value Higher fair value   No predictable interrelationship


Long-term borrowings     477     DCF   Loss severities     12.7 – 99.5%       79.8%     Lower fair value   Not applicable


    DCF/ Option models   Volatilities Volatilities Correlations    

5.0 – 51.5%
44.1 – 67.9 bp
(1.00) – 0.99


— 

— 

— 


  Higher fair value Higher fair value Higher fair value   No predictable interrelationship


Other liabilities     65     DCF   Credit spreads Recovery rates    
0.8 – 7.1%
91.0 – 99.5%


1.0%
93.8%
 
 
  Lower fair value Higher fair value   No predictable interrelationship


171


Table of Contents

NOMURA HOLDINGS, INC.

NOTES TO THE CONSOLIDATED FINANCIAL STATEMENTS—(Continued)


    March 31, 2026

Financial Instrument

  Fair
value in
billions of
yen
   

Valuation

technique


Significant

unobservable
valuation input

  Range of
valuation
inputs(1)
    Weighted
Average(2)(3)
   

Impact of
increases in
significant
unobservable
valuation

inputs(4)(5)


Interrelationships
between valuation

inputs(6)

Assets:


Trading assets and private equity

and debt investments


Equities

    ¥14     DCF/ Option models   Credit spreads     2.9%       2.9%     Lower fair value   Not applicable


Private equity and debt investments

    146     DCF  

WACC

Growth rates

Credit spreads

Liquidity discounts


7.5 – 16.2%
0.0 – 2.0%
0.0 – 49.9%
0.0 – 30.0%


12.2%
1.7%
8.5%
11.0%


  Lower fair value Higher fair value Lower fair value Lower fair value   No predictable interrelationship


    Market multiples  

EV/EBITDA ratios

PE Ratios

Liquidity discounts


5.9 – 11.4 x
12.1 – 20.8 x
10.0 – 20.0%


8.9 x
15.2 x
12.6%


  Higher fair value Higher fair value Lower fair value   No predictable interrelationship


Foreign government, agency and municipal securities

    4     DCF   Credit spreads Recovery rates    
0.0 – 2.3%
12.5 – 18.0%


1.1%
17.2%
 
 
  Lower fair value Higher fair value   No predictable interrelationship


Bank and corporate debt securities and loans for trading purposes

    104     DCF   Credit spreads Recovery rates    
0.5 – 12.6%
0.0 – 99.5%


4.8%
38.2%
 
 
  Lower fair value Higher fair value   No predictable interrelationship


Residential mortgage-backed securities (“RMBS”)

    10     DCF  

Yields

Prepayment rates

Loss severities


140.2%

12.0%

0.0 – 100.0%


140.2%
12.0%
9.4%


  Lower fair value Lower fair value Lower fair value   No predictable interrelationship


Real estate-backed

securities

    82     DCF   Loss severities     0.0 – 17.5%       0.5%     Lower fair value   Not applicable


Collateralized debt obligations (“CDOs”) and other

    34     DCF  

Yields

Prepayment rates

Default probabilities

Loss severities

Credit spreads


8.5 – 40.7%
20.0%

2.0%
69.3 – 100.0%

0.2%


17.9%
20.0%
2.0%
93.6%
0.2%


  Lower fair value Lower fair value Lower fair value Lower fair value Lower fair value   Change in default probabilities typically accompanied by directionally similar change in loss severities and opposite change in prepayment rates


Investment trust funds and other

    9     DCF   Liquidity discounts     2.4 – 15.2%       5.5%     Lower fair value   Not applicable


172


Table of Contents

NOMURA HOLDINGS, INC.

NOTES TO THE CONSOLIDATED FINANCIAL STATEMENTS—(Continued)


    March 31, 2026

Financial Instrument

  Fair
value in
billions of
yen
   

Valuation

technique


Significant

unobservable
valuation input

  Range of
valuation
inputs(1)
    Weighted
Average(2)(3)
   

Impact of
increases in
significant
unobservable
valuation

inputs(4)(5)


Interrelationships
between valuation

inputs(6)

Derivatives, net:                                                                       

Equity contracts

    ¥27     Option models   Dividend yield Volatilities Correlations    

0.0 – 12.6%
3.7 – 100.9%
(0.85) – 0.98


— 

— 

— 


  Higher fair value Higher fair value Higher fair value   No predictable interrelationship


Interest rate contracts

    (16)     DCF/ Option models   Interest rates Volatilities Volatilities Correlations    


2.6 – 5.0%
9.7 – 13.0%
42.4 – 109.9 bp
(1.00) – 1.00


— 

— 

— 

— 


  Higher fair value Higher fair value Higher fair value Higher fair value   No predictable interrelationship


Credit contracts

    (56)     DCF/ Option models   Credit spreads Recovery rates Volatilities Correlations    


0.0 – 156.3%
1.0 – 90.0%
25.0 – 81.6%
0.30 – 0.85


— 

— 

— 

— 


  Higher fair value Higher fair value Higher fair value Higher fair value   No predictable interrelationship


Foreign exchange contracts

    (22)     Option models   Interest rates Volatilities Correlations    

3.1 – 3.1%
1.4 – 16.1%
0.24 – 0.70


— 

— 

— 


  Higher fair value Higher fair value Higher fair value   No predictable interrelationship


Loans and receivables     584     DCF   Credit spreads Recovery rates    
0.0 – 20.0%
64.5 – 100.0%


5.9%
97.4%
 
 
  Lower fair value Higher fair value   No predictable interrelationship


Collateralized agreements     16     DCF   Repo rate     5.2 – 5.6%       5.4%     Lower fair value   Not applicable


Other assets              

Non-trading debt securities

    48     DCF   Credit spreads     4.1 – 18.5%       8.5%     Lower fair value   Not applicable


Other(7)(8)

    308     DCF  

WACC

Growth rates

Credit spreads


10.5%

3.0%

0.3 – 22.0%


10.5%
3.0%
3.2%


  Lower fair value Higher fair value Lower fair value   No predictable interrelationship


    Market multiples   Liquidity discounts     25.0%       25.0%     Lower fair value   Not applicable


Liabilities:              
Short-term borrowings     43     DCF/ Option models   Volatilities Correlations    
16.7 – 60.2%
(0.72) – 0.95


— 

— 


  Higher fair value Higher fair value   No predictable interrelationship


Payable and deposits     12     DCF/ Option models   Volatilities Correlations    
9.7 – 10.8%
0.40 – 0.97


— 

— 


  Higher fair value Higher fair value   No predictable interrelationship


Long-term borrowings     452     DCF   Loss severities     9.5 – 99.3%       54.4%     Lower fair value   Not applicable


    DCF/ Option models   Volatilities Volatilities Correlations    

9.7 – 60.2%
65.5 – 85.8 bp
(1.00) – 0.97


— 

— 

— 


  Higher fair value Higher fair value Higher fair value   No predictable interrelationship


Other liabilities     67     DCF   Credit spreads Recovery rates    
0.8 – 4.0%
91.0 – 99.8%


0.8%
93.9%
 
 
  Lower fair value Higher fair value   No predictable interrelationship


(1)

Range information is provided in percentages, coefficients and multiples and represents the highest and lowest level significant unobservable valuation input used to value that type of financial instrument. A wide dispersion in the range does not necessarily reflect increased uncertainty or subjectivity in the valuation input and is typically just a consequence of the different characteristics of the financial instruments themselves.

(2)

Weighted average information for non-derivatives is calculated by weighting each valuation input by the fair value of the financial instrument.

(3)

Nomura has not provided weighted average information for derivatives as unlike cash products the risk on such products is distinct from the balance sheet value and is subject to netting. Discussion of the ranges of significant unobservable valuation inputs for derivatives and short-term and long-term borrowings which contain embedded derivatives classified in Level 3 is provided below as a substitute for weighted average information.


173


Table of Contents

NOMURA HOLDINGS, INC.

NOTES TO THE CONSOLIDATED FINANCIAL STATEMENTS—(Continued)


(4)

The above table only considers the impact of an increase in each significant unobservable valuation input on the fair value measurement of the financial instrument. However, a decrease in the significant unobservable valuation input would have the opposite effect on the fair value measurement of the financial instrument. For example, if an increase in a significant unobservable valuation input would result in a lower fair value measurement, a decrease in the significant unobservable valuation input would result in a higher fair value measurement.

(5)

The impact of an increase in the significant unobservable valuation input on the fair value measurement for a derivative assumes Nomura is long risk to the input (such as being long volatility). Where Nomura is short such risk, the impact of an increase would have a converse effect on the fair value measurement of the derivative.

(6)

Consideration of the interrelationships between significant unobservable valuation inputs is only relevant where more than one unobservable valuation input is used to determine the fair value measurement of the financial instrument.

(7)

Valuation techniques and unobservable valuation inputs in respect of equity securities reported within Other assets in the consolidated balance sheets.

(8)

Includes non-financial assets carried at fair value on a recurring basis

Discussion of the ranges of significant unobservable valuation inputs

The following comments complement the above information regarding the significant unobservable valuation inputs used by Nomura for derivatives and short-term and long-term borrowings which contain embedded derivatives classified in Level 3.

DerivativesEquity contracts—The significant unobservable valuation inputs are dividend yield, volatilities and correlations. The range of dividend yields varies as some companies do not pay any dividends, for example due to a lack of profits or as a policy during a growth period, and hence have a zero dividend yield while others may pay high dividends, for example to return money to investors. The range of volatilities is wide as the volatilities of shorter-dated equity derivatives or those based on single equity securities can be higher than those of longer-dated instruments or those based on indices. Correlations represent the relationships between one input and another (“pairs”) and can either be positive or negative amounts. The range of correlations moves from positive to negative because the movement of some pairs is very closely related and in the same direction causing highly positive correlations while others generally move in opposite directions causing highly negative correlations with pairs that have differing relationships throughout the range.

DerivativesInterest rate contracts—The significant unobservable valuation inputs are interest rates, volatilities and correlations. The range of interest rates is due to interest rates in different countries/currencies being at different levels. The range of volatilities is wide as volatilities of shorter-dated interest rate derivatives are typically higher than those of longer-dated instruments. The range of correlations moves from positive to negative because the movement of some pairs is very closely related and in the same direction causing highly positive correlations while others generally move in opposite directions causing highly negative correlations with pairs that have differing relationships through the range. All significant unobservable valuation inputs are spread across the ranges.

DerivativesCredit contracts—The significant unobservable valuation inputs are credit spreads, recovery rates, volatilities and correlations. The range of credit spreads reflects the different risk of default present within the portfolio. At the low end of the range, underlying reference names have a very limited risk of default whereas at the high end of the range, underlying reference names have a much greater risk of default. The range of recovery rates varies primarily due to the seniority of the underlying exposure with senior exposures having a higher recovery than subordinated exposures. The range of volatilities is wide as the volatilities of shorter-dated credit contracts are typically higher than those of longer-dated instruments. The correlation range is positive since credit spread moves are generally in the same direction. Highly positive correlations are those for which the movement is very closely related and in the same direction, with correlation falling as the relationship becomes less strong.

DerivativesForeign exchange contracts—The significant unobservable valuation inputs are interest rates, volatilities and correlations. The range of interest rates is due to interest rates in different countries/currencies being at different levels with some countries having extremely low levels and others being at levels that while still relatively low are less so. The range of volatilities is mainly due to the lower end of the range arising from currencies that trade in narrow ranges (e.g., versus the U.S. Dollar) while the higher end comes from currencies with a greater range of movement such as emerging market currencies. The range of correlations moves from positive to negative because the movement of some pairs is very closely related and in the same direction causing highly positive correlations while others generally move in opposite directions causing highly negative correlations with pairs that have differing relationships through the range.

Short-term borrowings and Long-term borrowings—The significant unobservable valuation inputs are yields, prepayment rates, default probabilities, loss severities, volatilities and correlations. The range of volatilities is wide as the volatilities of shorter-dated instruments are typically higher than those in longer-dated instruments. The range of correlations moves from positive to negative because the movement of some pairs is very closely related and in the same direction causing highly positive correlations while others generally move in opposite directions causing highly negative correlations with pairs that have differing relationships through the range.


174


Table of Contents

NOMURA HOLDINGS, INC.

NOTES TO THE CONSOLIDATED FINANCIAL STATEMENTS—(Continued)


Movements in Level 3 financial instruments

The following tables present gains and losses as well as increases and decreases of financial instruments carried at fair value on a recurring basis which Nomura classified in Level 3 of the fair value hierarchy for the years ended March 31, 2025 and 2026. Financial instruments classified in Level 3 are often hedged with instruments within Level 1 or Level 2 of the fair value hierarchy. The gains or losses presented below do not reflect the offsetting gains or losses for these hedging instruments. Level 3 financial instruments are also measured using both observable and unobservable valuation inputs. Fair value changes presented below, therefore, reflect realized and unrealized gains and losses resulting from movements in both observable and unobservable valuation inputs.

For the years ended March 31, 2025 and 2026, gains and losses related to Level 3 assets and liabilities did not have a material impact on Nomura’s liquidity and capital resources management.


          Billions of yen  
          Year ended March 31, 2025  
    Balance
as of
April 1,
2024
    Total gains
(losses)
recognized
in net  income(1)
    Total gains
(losses)
recognized in
other
comprehensive
income
    Purchases
/ issues(2)
    Sales /
redemptions(2)
    Settlements     Foreign
exchange
movements
    Transfers
into
Level 3(4)(5)
    Transfers
out of
Level 3(5)(6)
    Balance
as of
March 31,
2025
 

Assets:


Trading assets and private equity and debt investments


Equities

  ¥ 8     ¥ 0     ¥ —      ¥ 17     ¥ (13   ¥ —      ¥ 1     ¥ 15     ¥ (7   ¥ 21  

Private equity and debt investments

    80       3       —        37       (9     —        0       —        (8     103  

Japanese agency and municipal securities

    0       —        —        —        0       —        —        —        —        0  

Foreign government, agency and municipal securities

    3       0       —        5       (5     —        0       7       (4     6  

Bank and corporate debt securities and loans for trading purposes

    173       (5     —        205       (240     —        (5     69       (16     181  

Commercial mortgage-backed securities (“CMBS”)

    0       2       —        7       (6     —        —        7       —        10  

Residential mortgage-backed securities (“RMBS”)

    35       2       —        56       (46     —        (1     2       0       48  

Real estate-backed securities

    122       11       —        370       (294     —        (2     —        —        207  

Collateralized debt obligations (“CDOs”) and other

    46       (25     —        107       (86     —        0       —        0       42  

Investment trust funds and other

    3       0       —        68       (68     —        0       0       —        3  


Total trading assets and private equity and debt investments

    470       (12     —        872       (767     —        (7     100       (35     621  


Derivatives, net(3)


Equity contracts

    5       0       —        —        —        (5     0       0       1       1  

Interest rate contracts

    32       (20     —        —        —        12       (4     (19     5       6  

Credit contracts

    (46     (30     —        —        —        37       1       (1     3       (36

Foreign exchange contracts

    3       (9     —        —        —        (5     0       0       (2     (13

Other contracts

    —        2       —        —        —        1       (2     (5     —        (4


Total derivatives, net

    (6     (57     —        —        —        40       (5     (25     7       (46


Subtotal

  ¥ 464     ¥ (69   ¥ —      ¥ 872     ¥ (767   ¥ 40     ¥ (12   ¥ 75     ¥ (28   ¥ 575  


Loans and receivables

  ¥ 291     ¥ 24     ¥ —      ¥ 199     ¥ (234   ¥ —      ¥ (14   ¥ 244     ¥ (62   ¥ 448  

Collateralized agreements

    12       0       —        2       —        1       0       —        —        15  

Other assets


Non-trading debt securities

    21       0       —        3       (7     —        0       —        —        17  

Other(7)

    253       20       —        45       (11     —        (4     0       (28     275  


Total

  ¥ 1,041     ¥ (25   ¥ —      ¥ 1,121     ¥ (1,019   ¥ 41     ¥ (30   ¥ 319     ¥ (118   ¥ 1,330  


Liabilities:


Trading liabilities


Equities

  ¥ 0     ¥ 0     ¥ —      ¥ 3     ¥ (2   ¥ —      ¥ 0     ¥ 0     ¥ 0     ¥ 1  

Bank and corporate debt securities

    1       0       —        2       (3     —        0       0       0       0  

Collateralized debt obligations (“CDOs”) and other

    —        —        —        0       0       —        0       —        0       0  

Investment trust funds and other

    0       0       —        0       0       —        0       —        —        0  


Total trading liabilities

  ¥ 1     ¥ 0     ¥ —      ¥ 5     ¥ (5   ¥ —      ¥ 0     ¥ 0     ¥ 0     ¥ 1  


Short-term borrowings

    23       (1     0       70       (41     —        0       1       (18     36  

Payables and deposits

    15       1       0       1       —        —        —        1       (2     14  

Long-term borrowings

    474       0       9       218       (172     —        0       11       (45     477  

Other liabilities

    44       0       —        47       (25     —        (1     0       0       65  


Total

  ¥ 557     ¥ 0     ¥ 9     ¥ 341     ¥ (243   ¥ —      ¥ (1   ¥ 13     ¥ (65   ¥ 593  


175


Table of Contents

NOMURA HOLDINGS, INC.

NOTES TO THE CONSOLIDATED FINANCIAL STATEMENTS—(Continued)


          Billions of yen  
          Year ended March 31, 2026  
    Balance
as of
April 1,
2025
    Total gains
(losses)
recognized
in net income(1)
    Total gains
(losses)
recognized in
other
comprehensive
income
    Purchases
/ issues(2)
    Sales /
redemptions(2)
    Settlements     Foreign
exchange
movements
    Transfers
into
Level 3(4)(5)
    Transfers
out of
Level 3(5)(6)
    Balance
as of
March 31,
2026
 

Assets:


Trading assets and private equity and debt investments


Equities

  ¥ 21     ¥ 0     ¥ —      ¥ 16     ¥ (36   ¥ —      ¥ 2     ¥ 14     ¥ (3   ¥ 14  

Private equity and debt investments

    103       5       —        101       (44     —        1       1       (21     146  

Japanese agency and municipal securities

    0       0       —        2       (2     —        —        —        —        —   

Foreign government, agency and municipal securities

    6       1       —        5       (6     —        0       4       (6     4  

Bank and corporate debt securities and loans for trading purposes

    181       8       —        103       (182     —        13       39       (58     104  

Commercial mortgage-backed securities (“CMBS”)

    10       0       —        0       (10     —        —        —        0       0  

Residential mortgage-backed securities (“RMBS”)

    48       (3     —        3       (20     —        2       1       (21     10  

Real estate-backed securities

    207       0       —        362       (287     —        8       18       (226     82  

Collateralized debt obligations (“CDOs”) and other

    42       (9     —        39       (36     —        1       0       (3     34  

Investment trust funds and other

    3       0       —        88       (79     —        0       5       (8     9  


Total trading assets and private equity and debt investments

    621       2       —        719       (702     —        27       82       (346     403  


Derivatives, net(3)


Equity contracts

    1       2       —        —        —        32       (1     (15     8       27  

Interest rate contracts

    6       16       —        —        —        (29     2       8       (19     (16

Credit contracts

    (36     2       —        —        —        (25     (2     12       (7     (56

Foreign exchange contracts

    (13     (12     —        —        —        4       1       (1     (1     (22

Other contracts

    (4     (2     —        —        —        2       0       2       —        (2


Total derivatives, net

    (46     6       —        —        —        (16     0       6       (19     (69


Subtotal

  ¥ 575     ¥ 8     ¥ —      ¥ 719     ¥ (702   ¥ (16   ¥ 27     ¥ 88     ¥ (365   ¥ 334  


Loans and receivables

  ¥ 448     ¥ 32     ¥ —      ¥ 237     ¥ (285   ¥ —      ¥ 40     ¥ 178     ¥ (66   ¥ 584  

Collateralized agreements

    15       0       —        —        —        —        1       —        —        16  

Other assets


Non-trading debt securities

    17       2       —        10       (8     —        1       26       —        48  

Other(7)

    275       32       —        80       (99     —        21       1       (2     308  


Total

  ¥ 1,330     ¥ 74     ¥ —      ¥ 1,046     ¥ (1,094   ¥ (16   ¥ 90     ¥ 293     ¥ (433   ¥ 1,290  


Liabilities:


Trading liabilities


Equities

  ¥ 1     ¥ 0     ¥ —      ¥ 0     ¥ 0     ¥ —      ¥ 0     ¥ 0     ¥ (1   ¥ 0  

Bank and corporate debt securities

    0       0       —        0       0       —        0       0       0       0  

Collateralized debt obligations (“CDOs”) and other

    0       (1     —        1       (1     —        0       —        —        1  

Investment trust funds and other

    0       0       —        0       0       —        0       —        —        —   


Total trading liabilities

  ¥ 1     ¥ (1   ¥ —      ¥ 1     ¥ (1   ¥ —      ¥ 0     ¥ 0     ¥ (1   ¥ 1  


Short-term borrowings

    36       (2     0       96       (79     —        2       1       (15     43  

Payables and deposits

    14       1       0       —        (1     —        —        —        —        12  

Long-term borrowings

    477       (16     (3     194       (178     —        1       21       (82     452  

Other liabilities

    65       (1     —        100       (104     —        5       2       (2     67  


Total

  ¥ 593     ¥ (19   ¥ (3   ¥ 391     ¥ (363     —      ¥ 8     ¥ 24     ¥ (100   ¥ 575  


(1)

Includes gains and losses reported primarily within Net gain on trading, Gain on private equity and debt investments, and also within Gain (loss) on investments in equity securities, RevenueOther and Non-interest expensesOther, Interest and dividends and Interest expense in the consolidated statements of income.

(2)

Amounts reported in Purchases / issues include increases in trading liabilities while Sales / redemptions include decreases in trading liabilities.

(3)

Derivatives which contain multiple types of risk are classified based on the primary risk type of the instrument.

(4)

Amounts of gains and losses on these transfers which were recognized in the period when the Transfers into Level 3 occurred were not significant for the years ended March 31, 2025 and March 31, 2026.

(5)

Transfers into Level 3 indicate certain valuation inputs of a financial instrument become unobservable or significant. Transfers out of Level 3 indicate certain valuation inputs of a financial instrument become observable or insignificant. See “Quantitative and qualitative information regarding significant unobservable valuation inputs” above for the valuation inputs of each financial instruments.

(6)

Transfers out of Level 3 include financial instruments that moved out of level 3 by application of measurement alternative. See Note 6 “Non-trading investments” for further information of financial instruments under the measurement alternative.

(7)

Includes non-financial assets carried at fair value on a recurring basis.


176


Table of Contents

NOMURA HOLDINGS, INC.

NOTES TO THE CONSOLIDATED FINANCIAL STATEMENTS—(Continued)


Unrealized gains and losses recognized for Level 3 financial instruments

The following table presents the amounts of unrealized gains (losses) for the years ended March 31, 2025 and 2026, relating to those financial instruments which Nomura classified in Level 3 within the fair value hierarchy and that were still held by Nomura at the relevant consolidated balance sheet date.


     Billions of yen  


   March 31  


      2025       2026   
              
     Unrealized
gains / (losses)(1)
 

Assets:


Trading assets and private equity and debt investments


Equities

   ¥ 0     ¥ (1

Private equity and debt investments

     (1     1  

Foreign government, agency and municipal securities

     0       1  

Bank and corporate debt securities and loans for trading purposes

     (6     5  

Commercial mortgage-backed securities (“CMBS”)

     7       0  

Residential mortgage-backed securities (“RMBS”)

     2       (2

Real estate-backed securities

     5       (3

Collateralized debt obligations (“CDOs”) and other

     (24     (5

Investment trust funds and other

     0       0  


Total trading assets and private equity and debt investments

     (17     (4


Derivatives, net(2)


Equity contracts

     (3     19  

Interest rate contracts

     (23     (2

Credit contracts

     (26     (16

Foreign exchange contracts

     (7     (11

Other contracts

     2       (2


Total derivatives, net

     (57     (12


Subtotal

   ¥ (74   ¥ (16


Loans and receivables

       14         22  

Collateralized agreements

     0       0  

Other assets


Non-Trading debt Securities

     0       1  

Other(3)

     20       49  


Total

   ¥ (40   ¥ 56  


Liabilities:


Trading liabilities


Equities

   ¥ 0     ¥ 0  

Bank and corporate debt securities

     0       0  

Collateralized debt obligation (“CDOs”) and other

     1       0  


Total trading liabilities

   ¥ 1     ¥ 0  


Short-term borrowings(4)

     (7     1  

Payables and deposits(4)

     1       1  

Long-term borrowings(4)

     24       5  

Other liabilities

     (1     (1


Total

   ¥ 18     ¥ 6  


(1)

Includes gains and losses reported within Net gain on trading, Gain on private equity and debt investments, and also within Gain(loss) on investments in equity securities, RevenueOther and Non-interest expensesOther, Interest and dividends and Interest expense in the consolidated statements of income.

(2)

Derivatives which contain multiple types of risk are classified based on the primary risk type of the instrument.

(3)

Includes non-financial assets carried at fair value on a recurring basis.

(4)

Includes unrealized gains and losses of ¥10 billion and ¥(1) billion for the years ended March 31, 2025 and 2026 recognized in Other comprehensive income (loss) for recurring Level 3 fair value measurements held at the end of the reporting period.


177


Table of Contents

NOMURA HOLDINGS, INC.

NOTES TO THE CONSOLIDATED FINANCIAL STATEMENTS—(Continued)


Investments in investment funds that calculate NAV per share

In the normal course of business, Nomura invests in non-consolidated funds which meet the definition of investment companies or are similar in nature and which do not have readily determinable fair values. For certain of these investments, Nomura uses NAV per share as the basis for valuation as a practical expedient. Some of these investments are redeemable at different amounts from NAV per share.

The following tables present information on these investments where NAV per share is calculated or disclosed as of March 31, 2025 and 2026. Investments are presented by major category relevant to the nature of Nomura’s business and risks.


     Billions of yen  
     March 31, 2025  
     Fair value      Unfunded
commitments(1)
     Redemption frequency
(if currently eligible)(2)
     Redemption notice(3)  

Hedge funds

   ¥ 11      ¥ 4        Daily-Monthly        Same day-30 days  

Venture capital funds

     19        3        —         —   

Private equity funds and private credit funds

     43        10        —         —   

Real estate funds

     4        0        —         —   


Total

   ¥ 77      ¥ 17        


     Billions of yen  
     March 31, 2026  
     Fair value      Unfunded
commitments(1)
     Redemption frequency
(if currently eligible)(2)
     Redemption notice(3)  

Hedge funds

   ¥ 33      ¥ 2        Daily-Monthly        Same day-30 days  

Venture capital funds

     20        3        —         —   

Private equity funds and private credit funds

     63        8        —         —   

Real estate funds

     3        0        —         —   


Total

   ¥ 119      ¥ 13        


(1)

The contractual amount of any unfunded commitments Nomura is required to make to the entities in which the investment is held.

(2)

The frequency with which Nomura is permitted to redeem investments.

(3)

The range in prior notice period for redemption.

Hedge funds:

These investments include funds of funds that invest in multiple asset classes. The fair values of these investments are determined using NAV per share. Although majority of these funds are redeemable monthly, certain funds cannot be redeemed within one month due to contractual, liquidity or gating issues. The redemption period is unknown for certain suspended or liquidating funds. Some of these investments contain restrictions against transfers of the investments to third parties.

Venture capital funds:

These investments include primarily start-up funds. The fair values of these investments are determined using NAV per share. Most of these funds cannot be redeemed within six months. The redemption period is unknown for certain suspended or liquidating funds. Some of these investments contain restrictions against transfers of the investments to third parties.

Private equity, private credit and other funds:

These investments are made mainly in various sectors in Europe, U.S. and Japan. The fair values of these investments are determined using NAV per share. Redemption is restricted for most of these investments. The redemption period is unknown for certain suspended or liquidating funds. Some of these investments contain restrictions against transfers of the investments to third parties.

Real estate funds:

These are investments in commercial and other types of real estate. The fair values of these investments are determined using NAV per share. Redemption is restricted for most of these investments. The redemption period is unknown for certain suspended or liquidating funds. Some of these investments contain restrictions against transfers of the investments to third parties.


178


Table of Contents

NOMURA HOLDINGS, INC.

NOTES TO THE CONSOLIDATED FINANCIAL STATEMENTS—(Continued)


Fair value option (“FVO”) for financial assets and financial liabilities

Nomura carries certain eligible financial assets and liabilities at FV-NI through the election of the FVO permitted by ASC 815 and ASC 825. Election of the FVO is generally irrevocable unless an event occurs that gives rise to a new basis of accounting for that instrument.

The financial assets and financial liabilities primarily elected for the FVO by Nomura, and the reasons for the election, are as follows:


Equity method investments reported within Trading assets and private equity and debt investments and Other assets held for capital appreciation or current income purposes which Nomura generally has an intention to exit rather than hold indefinitely. Nomura elects the FVO to more appropriately represent the purpose of these investments in these consolidated financial statements.


Certain loans receivables and receivables from customers reported within Loans and Receivables which are risk managed on a fair value basis and undrawn loan commitments related to such loans receivables expected to be funded. Nomura elects the FVO to mitigate volatility through earnings caused by the difference in measurement basis that otherwise would arise between loans and the derivatives used to risk manage those instruments.


Reverse repurchase and repurchase agreements reported within Collateralized agreements and Collateralized financing which are risk managed on a fair value basis. Nomura elects the FVO to mitigate volatility through earnings caused by the difference in measurement basis that otherwise would arise between the reverse repurchase and repurchase agreements and the derivatives used to risk manage those instruments.


All structured notes issued on or after April 1, 2008 reported within Short-term borrowings or Long-term borrowings. Nomura elects the FVO for those structured notes primarily to mitigate the volatility through earnings caused by differences in the measurement basis for structured notes and the derivatives Nomura uses to risk manage those positions. Nomura also elects the FVO for certain notes issued by consolidated VIEs for the same purpose and for certain structured notes issued prior to April 1, 2008. Certain subsidiaries elect the FVO for structured loans and vanilla debt securities issued by those subsidiaries.


Certain structured deposit issuances reported within Deposits received at banks. Nomura elects the FVO for those structured deposits primarily to mitigate the volatility through earnings caused by differences in the measurement basis for structured deposits and the derivatives Nomura uses to risk manage those positions.


Financial liabilities reported within Long-term borrowings recognized in transactions which are accounted for as secured financing transactions under ASC 860. Nomura elects the FVO for these financial liabilities to mitigate volatility through earnings that otherwise would arise had this election not been made. Even though Nomura usually has little or no continuing economic exposure to the transferred financial assets, they remain on the consolidated balance sheets and continue to be carried at fair value, with changes in fair value recognized through earnings.


Financial reinsurance contracts reported within Other assets. Nomura elects the FVO to mitigate income volatility caused by the difference in measurement basis that would otherwise exist. Changes in the fair value of the reinsurance contracts carried at fair value are reported in the consolidated statements of income.


Loans for trading purposes and non-trading debt securities held by subsidiaries that are not registered as a broker-dealer (“non-BD entities”) before March 31, 2024. Moreover, originations or purchases of loans held for trading purposes by non-BD entities and non-trading debt securities that are not classified as HTM or AFS held by non-BD entities from April 1, 2024. Nomura elects the FVO to these loans and non-trading debt securities for its holding purpose or to mitigate volatility through earnings that otherwise would arise had this election not been made.

Interest and dividends arising from financial instruments for which the FVO has been elected are recognized within Interest and dividends, Interest expense or RevenueNet gain on trading.


179


Table of Contents

NOMURA HOLDINGS, INC.

NOTES TO THE CONSOLIDATED FINANCIAL STATEMENTS—(Continued)


The following table presents gains (losses) due to changes in fair value for financial instruments carried at FV-NI using the FVO for the years ended March 31, 2025 and 2026.


     Billions of yen  


   Year ended March 31  


     2025     2026  
     Gains/(Losses)(1)  

Assets:


Trading assets and private equity and debt investments(2)


Trading assets

   ¥ 4     ¥ 16  

Private equity and debt investments

     2       1  

Loans and receivables

     45       52  

Collateralized agreements(3)

     20       12  

Other assets(2)(4)

     15       37  


Total

   ¥ 86     ¥ 118  


Liabilities:


Short-term borrowings(5)

   ¥ 153     ¥ 83  

Payables and deposits

     6       38  

Collateralized financing(3)

     (23     (17

Long-term borrowings(5)(6)

     (48     12  

Other liabilities(7)

     (1     (11


Total

   ¥ 87     ¥ 105  


(1)

Includes gains and losses reported primarily within Revenue—Net gain on trading and RevenueOther in the consolidated statements of income.

(2)

Includes equity investments that would have been accounted for under the equity method had Nomura not chosen to elect the FVO.

(3)

Includes reverse repurchase and repurchase agreements.

(4)

Includes non-trading debt securities.

(5)

Includes structured notes and other financial liabilities.

(6)

Includes secured financing transactions arising from transfers of financial assets which did not meet the criteria for sales accounting.

(7)

Includes unfunded written loan commitments.

As of March 31, 2025 and 2026, Nomura held an economic interest of 39.74% and 40.42% in American Century Companies, Inc., respectively. The investment is carried at FV-NI through election of the FVO and is reported within Other assets—Other in the consolidated balance sheets.

For the year ended March 31, 2025 and 2026, there was no significant impact on financial assets for which the FVO was elected attributable to instrument-specific credit risks.

Nomura calculates the impact of changes in its own creditworthiness on certain financial liabilities for which the FVO is elected by revaluation techniques using a rate which incorporates observable changes in its credit spread.


180


Table of Contents

NOMURA HOLDINGS, INC.

NOTES TO THE CONSOLIDATED FINANCIAL STATEMENTS—(Continued)


The following table presents changes in the valuation adjustment for Nomura’s own creditworthiness recognized in the consolidated statements of comprehensive income during the years ended March 31, 2025 and 2026 in respect of financial liabilities elected for the FVO recognized in other comprehensive income during such years. The following table also presents amounts reclassified to the consolidated statements of income from accumulated other comprehensive income on early settlement of such financial liabilities during the years ended March 31, 2025 and 2026 and the cumulative amounts recognized in accumulated other comprehensive income as of March 31, 2025 and 2026.


     Billions of yen  
     Year ended March 31  
     2025      2026  

Changes recognized as a credit (debit) to other comprehensive income.

   ¥ 26      ¥ (55

Credit (debit) amounts reclassified to earnings

     0        (1

Cumulative credit balance recognized in accumulated other comprehensive income

     78        22  

As of March 31, 2025, the fair value of the aggregate unpaid principal balance (which is contractually principally protected) of Loans and receivables for which the FVO was elected was ¥105 billion less than the principal balance of such Loans and receivables. There were no Loans and receivables for which the FVO was elected that were 90 days or more past due. The fair value of the aggregate unpaid principal balance (which is contractually principally protected) of Short-term borrowings and Long-term borrowings for which the FVO was elected was ¥473 billion less than the principal balance of such Short-term borrowings and Long-term borrowings.

As of March 31, 2026, the fair value of the aggregate unpaid principal balance (which is contractually principally protected) of Loans and receivables for which the FVO was elected was ¥108 billion less than the principal balance of such Loans and receivables. There were no Loans and receivables for which the FVO was elected that were 90 days or more past due. The fair value of the aggregate unpaid principal balance (which is contractually principally protected) of Short-term borrowings and Long-term borrowings for which the FVO was elected was ¥461 billion less than the principal balance of such Short-term borrowings and Long-term borrowings.

Investment by Investment companies

Nomura carries all of investments by investment companies under ASC 946 at FV-NI.


181


Table of Contents

NOMURA HOLDINGS, INC.

NOTES TO THE CONSOLIDATED FINANCIAL STATEMENTS—(Continued)


Concentrations of credit risk

Concentrations of credit risk may arise from trading, securities financing transactions and underwriting activities, and may be impacted by changes in political or economic factors. Nomura has credit risk concentrations on debt securities issued by the Japanese Government, U.S. Government, British Government (“U.K.”), Governments within the European Union (“EU”), their states and municipalities, and their agencies. These concentrations generally arise from taking trading positions and are reported within Trading assets in the consolidated balance sheets. Government, agency and municipal securities, including Securities pledged as collateral, represented 17% of total assets as of March 31, 2025 and 18% as of March 31, 2026.

The following tables present geographic allocations of Nomura’s trading assets related to government, agency and municipal securities as of March 31, 2025 and 2026. See Note 3 “Derivative instruments and hedging activities” for further information regarding the concentration of credit risk for derivatives.


     Billions of yen  


   March 31, 2025  
     Japan      U.S.      EU & U.K.      Other      Total(1)  

Government, agency and municipal securities

   ¥   2,896      ¥   2,629      ¥   2,655      ¥   1,470      ¥ 9,650  
     Billions of yen  


   March 31, 2026  
     Japan      U.S.      EU & U.K.      Other      Total(1)  

Government, agency and municipal securities

   ¥ 4,125      ¥ 3,141      ¥ 2,587      ¥ 1,416      ¥   11,269  
 
(1)

Other than above, there were ¥313 billion and ¥653 billion of government, agency and municipal securities reported within Other assetsNon-trading debt securities in the consolidated balance sheets as of March 31, 2025 and 2026, respectively. These securities are primarily Japanese government, agency and municipal securities.

Estimated fair value of financial instruments not carried at fair value

Certain financial instruments are not carried at fair value on a recurring basis in the consolidated balance sheets since they are neither held for trading purposes nor are elected for the FVO. These are typically carried at contractual amounts due or amortized cost.

The carrying value of the majority of the financial instruments detailed below approximates their fair value since they are short-term in nature and contain minimal credit risk. These financial instruments include financial assets reported within Cash and cash equivalents, Time deposits, Deposits with stock exchanges and other segregated cash, Receivables from customers, Receivables from other than customers, Securities purchased under agreements to resell and Securities borrowed and financial liabilities reported within Short-term borrowings, Payables to customers, Payables to other than customers, Deposits received at banks, Securities sold under agreements to repurchase, Securities loaned and Other secured borrowings in the consolidated balance sheets.

The fair values of other financial instruments which are longer-term in nature or may contain more than minimal credit risk may be different to their carrying value. Financial assets of this type include certain loans which are reported within Loans receivable while financial liabilities include long-term borrowings which are reported within Long-term borrowings.


182


Table of Contents

NOMURA HOLDINGS, INC.

NOTES TO THE CONSOLIDATED FINANCIAL STATEMENTS—(Continued)


The following tables present carrying values, fair values and classification within the fair value hierarchy for certain classes of financial instrument as of March 31, 2025 and 2026.


     Billions of yen  


   March 31, 2025(1)  


                   Fair value by level  
     Carrying
value
     Fair
value
     Level 1      Level 2      Level 3  

Assets:


Cash and cash equivalents

   ¥ 4,424      ¥ 4,424      ¥ 4,424      ¥ —       ¥ —   

Time deposits

     642        642        —         642        —   

Deposits with stock exchanges and other segregated cash

     448        448        —         448        —   

Loans receivable(2)

     6,022        6,020        —         3,436        2,584  

Securities purchased under agreements to resell

     14,005        14,005        —         13,991        14  

Securities borrowed

     4,659        4,659        —         4,659        —   


Total

   ¥ 30,200      ¥ 30,198      ¥ 4,424      ¥ 23,176      ¥ 2,598  


Liabilities:


Short-term borrowings

   ¥ 1,117      ¥ 1,117      ¥ —       ¥ 1,081      ¥ 36  

Deposits received at banks

     3,106        3,106        —         3,092        14  

Securities sold under agreements to repurchase

     16,288        16,288        —         16,288        —   

Securities loaned

     1,965        1,965        —         1,965        —   

Other secured borrowings

     393        393        —         393        —   

Long-term borrowings

     13,374        13,385        10        12,879        496  


Total

   ¥ 36,243      ¥ 36,254      ¥ 10      ¥ 35,698      ¥ 546  


     Billions of yen  


   March 31, 2026(1)  


                   Fair value by level  
     Carrying
value
     Fair
value
     Level 1      Level 2      Level 3  

Assets:


Cash and cash equivalents

   ¥ 4,299      ¥ 4,299      ¥ 4,299      ¥ —       ¥ —   

Time deposits

     710        710        —         710        —   

Deposits with stock exchanges and other segregated cash

     641        641        —         641        —   

Loans receivable(2)

     7,742        7,740        —         4,449        3,291  

Securities purchased under agreements to resell

     13,210        13,210        —         13,195        15  

Securities borrowed

     4,340        4,340        —         4,340        —   


Total

   ¥ 30,942      ¥ 30,940      ¥ 4,299      ¥ 23,335      ¥ 3,306  


Liabilities:


Short-term borrowings

   ¥ 1,753      ¥ 1,753      ¥ —       ¥ 1,710      ¥ 43  

Deposits received at banks

     3,667        3,667        —         3,655        12  

Securities sold under agreements to repurchase

     15,234        15,234        —         15,234        —   

Securities loaned

     2,448        2,448        —         2,448        —   

Other secured borrowings

     384        384        —         384        —   

Long-term borrowings

     15,545        15,562        11        15,085        466  


Total

   ¥ 39,031      ¥ 39,048      ¥ 11      ¥ 38,516      ¥ 521  


(1)

Includes financial instruments which are carried at fair value on a recurring basis.

(2)

Carrying values are shown after deducting relevant allowances for current expected credit losses.


183


Table of Contents

NOMURA HOLDINGS, INC.

NOTES TO THE CONSOLIDATED FINANCIAL STATEMENTS—(Continued)


Assets and liabilities measured at fair value on a nonrecurring basis

In addition to financial instruments carried at fair value on a recurring basis, Nomura also measures other financial and non-financial assets and liabilities at fair value on a nonrecurring basis, where the primary measurement basis is not fair value. Fair value is only used in specific circumstances after initial recognition such as to measure impairment.

As of March 31, 2025, there were no significant amount of assets or liabilities which were carried at fair value on a nonrecurring basis.

As of March 31, 2026, certain investment in affiliated company under equity method accounting was measured at fair value on a nonrecurring basis. The relevant investment, which is reported within Other assets—Other in the consolidated balance sheets, was impaired by ¥12 billion. Nomura recognized this other-than-temporary impairment losses in Non-interest expenses—Other in the consolidated statements of income The carrying amount of the investment after fair value measurement is ¥14 billion. The fair value was determined using a DCF valuation technique and consequently, this nonrecurring fair value measurement was determined using valuation inputs which would be classified in Level 3 of the fair value hierarchy.

Equity securities subject to contractual sale restrictions

The following table presents a summary of equity securities primarily reported within Other assets—Other in consolidated balance sheet which are subject to contractual sale restrictions as of March 31, 2025 and 2026.


     Millions of yen  
     March 31, 2025  
            Remaining duration  
     Fair value      Less than
1 year
     1 to 5
years
     More than
5 years
 

Restriction on transfer

   ¥ 200,658      ¥ 9      ¥ 200,621      ¥ 28  

Consent from third parties

     7,806        18        —         7,788  

Others

     2,148        —         —         2,148  


Total

   ¥ 210,612      ¥ 27      ¥ 200,621      ¥ 9,964  


     Millions of yen  
     March 31, 2026  
            Remaining duration  
     Fair value      Less than
1 year
     1 to 5
years
     More than
5 years
 

Restriction on transfer

   ¥ 250,291      ¥ 250,291      ¥ —       ¥ —   

Consent from third parties

     8,054        —         —         8,054  

Others

     3,745        —         —         3,745  


Total

   ¥ 262,090      ¥ 250,291      ¥ —       ¥ 11,799  


(1)

No specific conditions could cause a lapse in the sale restrictions as disclosed above.


184


Table of Contents

NOMURA HOLDINGS, INC.

NOTES TO THE CONSOLIDATED FINANCIAL STATEMENTS—(Continued)


3. Derivative instruments and hedging activities:

Nomura uses a variety of derivatives, including futures, forwards, options and swaps, for both trading and non-trading purposes.

Derivatives used for trading purposes

In the normal course of business, Nomura enters into transactions involving derivatives to meet client needs, for trading purposes, and to reduce its own exposure to loss due to adverse fluctuations in interest rates, currency exchange rates and market prices of securities. These financial instruments include contractual agreements such as commitments to swap interest payment streams, exchange currencies or purchase or sell securities and other financial instruments on specific terms at specific future dates.

Nomura maintains active trading positions in a variety of derivatives. Most of Nomura’s trading activities are client oriented. Nomura utilizes a variety of derivatives to meet clients’ specific financial needs and investors’ demands in the securities markets. Nomura also offers a variety of derivatives to its clients in adjusting their risk profiles in interest rate, foreign exchange and other market and credit risk exposures. In performing certain of these activities, Nomura carries an inventory of capital markets instruments and maintains its access to market liquidity by quoting bid and offer prices to and trading with other market makers. These activities are essential to provide clients with securities and other capital market products at competitive prices.

Futures and forward contracts are commitments to either purchase or sell securities, foreign exchange contracts or other capital market instruments at a specific future date for a specified price and may be settled in cash or through delivery. Foreign exchange contracts include spot and forward contracts and involve the exchange of two currencies at a rate agreed by the contracting parties. Risks arise from the possible inability of counterparties to meet the terms of their contracts and from movements in market prices. Futures contracts are executed through exchanges which clear and guarantee performance of counterparties. Accordingly, credit risk associated with futures contracts is considered minimal. In contrast, forward contracts are generally negotiated between two counterparties and, therefore, are subject to counterparty risks.

Options are contracts that grant the purchaser, for a premium payment, the right to either purchase or sell a financial instrument at a specified price within a specified period of time or on a specified date from or to the writer of the option. The writer of options receives premiums and bears the risk of unfavorable changes in the market price of the financial instruments underlying the options.

Swaps are contractual agreements in which two counterparties agree to exchange certain cash flows, at specified future dates, based on an agreed contract. Certain agreements may contain combined interest rate and foreign exchange exposures. Entering into swap agreements may involve the risk of credit losses in the event of counterparty default.

To the extent these derivatives are economically hedging underlying financial instruments held by Nomura, the overall risk of loss may be fully or partly mitigated by the hedged position.

Nomura seeks to minimize its exposure to market risk arising from its use of these derivatives through various control policies and procedures, including position limits, monitoring procedures and hedging strategies whereby Nomura enters into offsetting or other positions in a variety of financial instruments.


185


Table of Contents

NOMURA HOLDINGS, INC.

NOTES TO THE CONSOLIDATED FINANCIAL STATEMENTS—(Continued)


Derivatives used for non-trading purposes

Nomura’s principal objectives in using derivatives for non-trading purposes are to manage interest rate risk, to modify the interest rate risk profile of certain financial liabilities, to manage foreign exchange risk of certain foreign currency denominated debt securities, and to manage net investment exposure to fluctuations in foreign exchange rates arising from certain foreign operations. Credit risk associated with derivatives utilized for non-trading purposes is controlled and managed in the same way as that associated with derivatives used for trading purposes.

Fair value hedges

Nomura designates certain derivatives as fair value hedges of interest rate risk arising from specific financial liabilities and foreign currency risk arising from specific foreign currency denominated debt securities. These derivatives are effective in reducing the risk associated with the exposure being hedged and are highly correlated with changes in the fair value and foreign currency rates of the underlying hedged items, both at inception and throughout the life of the hedging relationship. Changes in fair value of the hedging derivatives are reported together with those of the hedged liabilities and assets through the consolidated statements of income within Interest expense and RevenueOther, respectively.

Net investment hedges

Nomura designates certain derivatives designated as hedges of its net investment in foreign operations relating to specific subsidiaries which have non-Japanese Yen functional currencies. When determining the effectiveness of net investment hedges, the effective portion of the change in fair value of the hedging derivative is determined by changes in spot exchange rates. Changes in fair value of the hedging derivatives attributable to changes in the difference between the forward rate and spot rate are excluded from the measurement of hedge effectiveness and are reported in the consolidated statements of income within RevenueNet gain on trading. All other movements in the fair value of highly effective net investment hedging derivatives are reported through NHI shareholders’ equity within Accumulated other comprehensive income (loss).

Concentrations of credit risk for derivatives

Although Nomura’s exposures to financial instruments are broadly diversified across different types of financial instrument, counterparty and geographical location generally, a significant portion of derivatives are entered into with other financial institutions. The following tables present Nomura’s significant concentration of credit risk in OTC derivatives with financial institutions including transactions cleared through central counterparties as of March 31, 2025 and 2026. The gross fair value of derivative assets represents the maximum amount of loss that Nomura would incur if the counterparties of Nomura failed to perform in accordance with the terms of the financial instruments and any collateral or other security Nomura held to offset or partially offset such credit risk exposures was of no value.


     Billions of yen  
     March 31, 2025  
     Gross fair value of
derivative assets
     Impact of
master netting
agreements
    Impact of
collateral
    Net exposure to
credit risk
 

Financial institutions

   ¥ 14,974      ¥      (12,745)     ¥       (1,759)     ¥          470  
     Billions of yen  
     March 31, 2026  
     Gross fair value of
derivative assets
     Impact of
master netting
agreements
    Impact of
collateral
    Net exposure to
credit risk
 

Financial institutions

   ¥ 19,414      ¥ (16,606   ¥ (2,104   ¥ 704  


186


Table of Contents

NOMURA HOLDINGS, INC.

NOTES TO THE CONSOLIDATED FINANCIAL STATEMENTS—(Continued)


Derivative activities

The following tables present the notional value and fair value of derivatives as of March 31, 2025 and 2026. All amounts are disclosed on a gross basis, prior to counterparty offsetting of derivative assets and liabilities and cash collateral offsetting against net derivatives. Derivatives which contain multiple types of risk are classified in the table based on the primary risk type of the financial instrument. Changes in the fair value of derivatives are recognized either through the consolidated statements of income or the consolidated statements of comprehensive income, depending on the purpose for which the derivatives are used.


            Billions of yen  
            March 31, 2025  
     Total
notional(1)
     Derivative
assets
     Derivative
liabilities
 
     Fair value      Fair value(1)  

Derivatives used for trading and non-trading purposes(2):


Equity contracts

   ¥ 110,348      ¥ 2,572      ¥ 3,069  

Interest rate contracts

     3,814,576        12,424        11,509  

Credit contracts

     59,408        304        382  

Foreign exchange contracts

     484,797        4,363        4,186  

Other contracts

     904        11        50  


Total

   ¥ 4,470,033      ¥    19,674      ¥    19,196  


Derivatives designated as formal fair value or net investment accounting hedges:


Interest rate contracts

   ¥ 3,182      ¥ 4      ¥ 138  

Foreign exchange contracts

     183        —         8  


Total

   ¥ 3,365      ¥ 4      ¥ 146  


Total derivatives

   ¥ 4,473,398      ¥ 19,678      ¥ 19,342  


            Billions of yen  
            March 31, 2026  
     Total
notional(1)
     Derivative
assets
     Derivative
liabilities
 
     Fair value      Fair value(1)  

Derivatives used for trading and non-trading purposes(2):


Equity contracts

   ¥ 127,843      ¥ 3,053      ¥ 3,571  

Interest rate contracts

     4,646,591        15,803        14,515  

Credit contracts

     90,918        394        559  

Foreign exchange contracts

     595,071        5,741        5,349  

Other contracts

     820        9        37  


Total

   ¥ 5,461,243      ¥    25,000      ¥    24,031  


Derivatives designated as formal fair value or net investment accounting hedges:


Interest rate contracts

   ¥ 3,874      ¥ 3      ¥ 119  

Foreign exchange contracts

     220        3        —   


Total

   ¥ 4,094      ¥ 6      ¥ 119  


Total derivatives

   ¥ 5,465,337      ¥ 25,006      ¥ 24,150  


(1)

Includes the amount of embedded derivatives bifurcated in accordance with ASC 815.

(2)

The amounts reported include derivatives used for non-trading purposes other than those designated as formal fair value or net investment accounting hedges. These amounts have not been separately presented since such amounts were not significant as of March 31, 2025 and March 31, 2026.


187


Table of Contents

NOMURA HOLDINGS, INC.

NOTES TO THE CONSOLIDATED FINANCIAL STATEMENTS—(Continued)


Offsetting of derivatives

Counterparty credit risk associated with derivatives is controlled by Nomura through credit approvals, limits and monitoring procedures. To reduce the risk of loss, Nomura requires collateral, principally cash collateral and government securities, for certain derivative transactions. In certain cases, Nomura may agree for such collateral to be posted to a third-party custodian under a control agreement that enables Nomura to take control of such collateral in the event of counterparty default. From an economic standpoint, Nomura evaluates default risk exposure net of related collateral. Furthermore, OTC derivative transactions are typically documented under industry standard master netting agreements which mitigate Nomura’s credit exposure to counterparties. A master netting agreement is a single agreement with a counterparty that permits multiple transactions governed by that agreement to be terminated or accelerated and settled through a single payment in a single currency in the event of a default of the counterparty (“close-out and offsetting rights”).

For certain OTC centrally-cleared and exchange-traded derivatives, the clearing or membership agreements entered into by Nomura provide similar rights to Nomura in the event of default of the relevant central clearing party or exchange. Nomura generally seeks to obtain an external legal opinion in order to ascertain the enforceability of such close-out and offsetting rights within these agreements.

For certain counterparties and/ or in certain jurisdictions, Nomura may enter into derivative transactions which are not documented under a master netting agreement. Even when derivatives are documented under such agreements, Nomura may not have obtained, or may not be able to obtain evidence to determine with sufficient certainty that close-out and offsetting rights within such agreements are legally enforceable. This may be the case where the relevant local laws explicitly prohibit the enforceability of such close-out and offsetting rights, or where the local laws are complex, ambiguous or silent on the enforceability of such rights. This may include derivative transactions executed with certain foreign governments, agencies, municipalities, central clearing counterparties, exchanges and pension funds.

Nomura considers the enforceability of a master netting agreement in determining how credit risk arising from transactions with a specific counterparty is hedged, how counterparty credit exposures are calculated and applied to credit limits and the extent and nature of collateral requirements from the counterparty.

Trading and non-trading derivative assets and liabilities with the same counterparty and the related cash collateral receivables and payables documented under an enforceable master netting agreement are presented on a net basis on the consolidated balance sheets where the specific criteria defined by ASC 210-20 and ASC 815 are met.


188


Table of Contents

NOMURA HOLDINGS, INC.

NOTES TO THE CONSOLIDATED FINANCIAL STATEMENTS—(Continued)


The following table presents information about offsetting of derivatives and related cash collateral amounts on the consolidated balance sheets as of March 31, 2025 and 2026 by type of derivative contract, and additional amounts permitted to be offset legally by Nomura under enforceable master netting agreements, central clearing counterparties or exchange rules in the event of counterparty default but not offset on the consolidated balance sheets due to one or more of the criteria defined by ASC 210-20 and ASC 815 are not met. Derivative transactions which are not documented under a master netting agreement or are documented under a master netting agreement for which Nomura does not have sufficient evidence of enforceability of close-out and offsetting rights are not offset in the following table.


     Billions of yen     Billions of yen  
     March 31, 2025     March 31, 2026  
     Derivative
assets
    Derivative
liabilities(1)
    Derivative
assets
    Derivative
liabilities(1)
 

Equity contracts


OTC settled bilaterally

   ¥ 1,094     ¥ 1,185     ¥ 1,736     ¥ 2,041  

Exchange-traded

     1,478       1,884       1,317       1,530  

Interest rate contracts


OTC settled bilaterally

     10,243       9,476       11,509       10,347  

OTC centrally-cleared

     2,163       2,140       4,296       4,263  

Exchange-traded

     22       31       1       25  

Credit contracts


OTC settled bilaterally

     265       345       373       533  

OTC centrally-cleared

     38       36       21       23  

Exchange-traded

     1       1       0       3  

Foreign exchange contracts


OTC settled bilaterally

     4,363       4,194       5,744       5,349  

Other contracts


OTC settled bilaterally

     8       49       9       35  

Exchange-traded

     3       1       0       2  


Total gross derivative balances(2)

   ¥ 19,678     ¥ 19,342     ¥ 25,006     ¥ 24,151  


Less: Amounts offset in the consolidated balance sheets(3)

     (17,711     (17,361     (22,113     (21,731


Total net amounts reported on the face of the consolidated balance sheets(4)

   ¥ 1,967     ¥ 1,981     ¥ 2,893     ¥ 2,420  


Less: Additional amounts not offset in the consolidated balance sheets(5)


Financial instruments and non-cash collateral

   ¥ (713   ¥ (554   ¥ (872   ¥ (449


Net amount

   ¥ 1,254     ¥ 1,427     ¥ 2,021     ¥ 1,971  


189


Table of Contents

NOMURA HOLDINGS, INC.

NOTES TO THE CONSOLIDATED FINANCIAL STATEMENTS—(Continued)


(1)

Includes the amount of embedded derivatives bifurcated in accordance with ASC 815.

(2)

Includes all gross derivative asset and liability balances irrespective of whether they are transacted under a master netting agreement or whether Nomura has obtained sufficient evidence of enforceability of the master netting agreement. As of March 31, 2025, the gross balance of derivative assets and derivative liabilities which are not documented under master netting agreements or are documented under master netting agreements for which Nomura has not yet obtained sufficient evidence of enforceability was ¥609 billion and ¥832 billion, respectively. As of March 31, 2026, the gross balance of such derivative assets and derivative liabilities was ¥1,027 billion and ¥1,206 billion, respectively.

(3)

Represents amounts offset through counterparty offsetting of derivative assets and liabilities as well as cash collateral offsetting against net derivatives under master netting and similar agreements for which Nomura has obtained sufficient evidence of enforceability in accordance with ASC 210-20 and ASC 815. As of March 31, 2025, Nomura offset a total of ¥1,740 billion of cash collateral receivables against net derivative liabilities and ¥2,090 billion of cash collateral payables against net derivative assets. As of March 31, 2026, Nomura offset a total of ¥2,035 billion of cash collateral receivables against net derivative liabilities and ¥2,416 billion of cash collateral payables against net derivative assets.

(4)

Net derivative assets and net derivative liabilities are generally reported within Trading assets and private equity and debt investmentsTrading assets and Trading liabilities, respectively in the consolidated balance sheet. Bifurcated embedded derivatives are reported within Short-term borrowings or Long-term borrowings depending on the maturity of the underlying host contract.

(5)

Represents amounts which are not permitted to be offset on the consolidated balance sheets in accordance with ASC 210-20 and ASC 815 but which provide Nomura with a legally enforceable right of offset in the event of counterparty default. Amounts relating to derivative and collateral agreements where Nomura has not yet obtained sufficient evidence of enforceability of such offsetting rights are excluded. As of March 31, 2025, a total of ¥343 billion of cash collateral receivables and ¥1,043 billion of cash collateral payables, including amounts reported in the table, have not been offset against net derivatives. As of March 31, 2026, a total of ¥399 billion of cash collateral receivables and ¥1,300 billion of cash collateral payables, including amounts reported in the table, have not been offset against net derivatives.

For information on offsetting of collateralized transactions, see Note 5 “Collateralized transactions.


190


Table of Contents

NOMURA HOLDINGS, INC.

NOTES TO THE CONSOLIDATED FINANCIAL STATEMENTS—(Continued)


Derivatives used for trading purposes

Derivative financial instruments used for trading purposes, including bifurcated embedded derivatives, are carried at fair value with changes in fair value recognized through the consolidated statements of income within Revenue—Net gain on trading.

The following table presents amounts included in the consolidated statements of income for the years ended March 31, 2025 and 2026 related to derivatives used for trading and non-trading purposes by types of underlying derivative contract. Derivatives which contain multiple types of risk are classified in the table based on the primary risk type of instrument.


     Billions of yen  
     Year ended March 31  
      2025       2026   

Derivatives used for trading and non-trading purposes(1):


Equity contracts

   ¥ (2   ¥ (272

Interest rate contracts

     (189     106  

Credit contracts

     27       46  

Foreign exchange contracts

     140       (175

Other contracts

     11       46  


Total

   ¥ (13   ¥ (249


(1)

Includes net gains (losses) on derivatives used for non-trading purposes which are not designated as fair value or net investment hedges. For the year ended March 31, 2025 and 2026, net gains (losses) for these non-trading derivatives were not significant.

Fair value hedges

Nomura issues Japanese Yen and foreign currency denominated debt with both fixed and floating interest rates. Nomura generally enters into swap agreements to convert fixed rate interest payments on its debt obligations to a floating rate and applies fair value hedge accounting to these instruments.

The following table presents the carrying value of the hedged items that are currently designated in a hedging relationship by line items in the consolidated balance sheets where the hedged item is reported, the cumulative amount of fair value hedging adjustment included in the carrying amount of the hedged items and the cumulative amount of fair value hedging adjustment remaining for the liabilities which hedge accounting has been discontinued as of March 31, 2025 and 2026.


     Billions of yen  

Balance sheet line item in which the hedged
item is included:

   Carrying amount of the hedged
liabilities
     Cumulative gains of fair value
hedging adjustment included in the
carrying amount of the hedged
liabilities
     Cumulative amount of fair value
hedging adjustment remaining
for the liabilities which hedge
accounting has been
discontinued
 
      March 31, 2025        March 31, 2026        March 31, 2025        March 31, 2026        March 31, 2025        March 31, 2026   
Long-term borrowings    ¥ 3,057      ¥ 3,493      ¥ 122      ¥ 113      ¥ 3      ¥ 3  


Total

   ¥ 3,057      ¥ 3,493      ¥ 122      ¥ 113      ¥ 3      ¥ 3  


Hedging derivatives designated as fair value hedges are carried at fair value attributable to the hedged risk, which is recognized in the consolidated statements of income within Interest expense and Revenue-Other, respectively together with the change in fair value of the hedged items. Similar to interest payables arising from hedged long-term borrowings, cash flows from interest rate contracts designated as fair value hedges are reported as cash flows from operating activities in the consolidated statements of cash flows.


191


Table of Contents

NOMURA HOLDINGS, INC.

NOTES TO THE CONSOLIDATED FINANCIAL STATEMENTS—(Continued)


The following tables present gains (losses) included in the consolidated statements of income for the years ended March 31, 2025 and 2026 related to derivatives designated as fair value hedges by type of underlying derivative contract and the nature of the hedged item.


     Billions of yen  
     Year ended March 31  
      2025       2026   

Derivatives designated as hedging instruments:


Interest rate contracts

   ¥ 85     ¥ 17  


Total

   ¥ 85     ¥ 17  


     Billions of yen  
     Year ended March 31  
     2025     2026  

Hedged items :


Long-term borrowings

   ¥ (85   ¥ (17


Total

   ¥ (85   ¥ (17


Net investment hedges

Nomura designates certain foreign currency derivatives, as hedges of net investments in certain foreign operations with significant foreign exchange risks and applies hedge accounting to these instruments. Accordingly, foreign exchange gains and losses arising from the derivatives and non-derivative financial instruments designated as hedges, except for the portion excluded from effectiveness assessment, are recognized through the consolidated statements of comprehensive income within Other comprehensive income (loss)-Change in cumulative translation adjustments. This is offset by the foreign exchange adjustments arising from consolidation of the relevant foreign subsidiaries.

The following table presents gains (losses) from derivatives designated as net investment hedges included in the consolidated statements of comprehensive income for the years ended March 31, 2025 and 2026.


     Billions of yen  
     Year ended March 31  
      2025       2026   

Hedging instruments:


Foreign exchange contracts

   ¥ (2   ¥ (10


Total

   ¥    (2   ¥    (10


The portion of gains (losses) representing the amount excluded from the assessment of hedge effectiveness are recognized within

RevenueNet gain on trading in the consolidated statements of income. The amounts of gains (losses) were not significant during the years ended March 31, 2025 and 2026.

Derivatives containing credit risk related contingent features

Nomura enters into certain OTC derivatives and other agreements containing credit-risk-related contingent features. These features would require Nomura to post additional collateral or settle the instrument upon occurrence of a credit event, the most common of which would be a downgrade in the Company’s long-term credit rating.

The aggregate fair value of all derivatives with credit-risk-related contingent features that are in a liability position as of March 31, 2025 was ¥770 billion with related collateral pledged of ¥628 billion. In the event of a one-notch downgrade to Nomura’s long-term credit rating in effect as of March 31, 2025, the aggregate fair value of assets that would have been required to be posted as additional collateral or that would have been needed to settle the instruments immediately was ¥8 billion.


192


Table of Contents

NOMURA HOLDINGS, INC.

NOTES TO THE CONSOLIDATED FINANCIAL STATEMENTS—(Continued)


The aggregate fair value of all derivatives with credit-risk-related contingent features that are in a liability position as of March 31, 2026 was ¥859 billion with related collateral pledged of ¥653 billion. In the event of a one-notch downgrade to Nomura’s long-term credit rating in effect as of March 31, 2026, the aggregate fair value of assets that would have been required to be posted as additional collateral or that would have been needed to settle the instruments immediately was ¥9 billion.

Credit derivatives

Credit derivatives are derivatives in which one or more of their underlying reference assets of the instrument are related to the credit risk of a specified entity (or group of entities) or an index based on the credit risk of a group of entities that expose the seller of credit protection to potential loss from credit events specified in the contract.

Written credit derivatives are instruments or embedded features where Nomura assumes third party credit risk, either as guarantor in a guarantee-type contract, or as the party that provides credit protection in an option-type contract, credit default swap, or any other credit derivative contract.

Nomura enters into credit derivatives as part of its normal trading activities as both purchaser and/ or seller of protection for credit risk mitigation, proprietary trading positions and for client transactions.

The most common type of credit derivatives used by Nomura are single-name credit default swaps where settlement of the derivative is based on the credit risk of a single reference entity or obligation. Nomura also writes credit derivatives linked to the performance of credit default indices and issues other credit risk related portfolio products.

Nomura would have to perform under a credit derivative contract if a credit event as defined in the respective contract occurs. Typical credit events include bankruptcy, failure to pay and restructuring of obligations of the underlying reference asset.

Credit derivatives written by Nomura are either cash or physically settled. In cash-settled instruments, once payment is made upon an event of default, the contract usually terminates with no further payments due. Nomura generally has no right to assume the reference assets of the counterparty in exchange for payment, nor does Nomura usually have any direct recourse to the actual issuers of the reference assets to recover the amount paid. In physically settled contracts, upon a default event, Nomura takes delivery of the reference asset in return for payment of the full notional amount of the contract.

Nomura actively monitors and manages its credit derivative exposures. Where protection is sold, risks may be mitigated by purchasing credit protection from third parties either on identical underlying reference assets or on underlying reference assets with the same issuer which would be expected to behave in a correlated fashion. The most common form of recourse provision to enable Nomura to recover from third parties any amounts paid under a written credit derivative is therefore not through the derivative itself but rather through the purchase of separate credit derivative protection with identical or correlated underlying reference assets.

The extent of these purchased credit protection contracts is quantified in the following tables under the column titled “Purchased Credit Protection.” These amounts represent purchased credit protection with identical underlying reference assets to the written credit derivatives which act as a hedge against Nomura’s exposures. To the extent Nomura is required to pay out under the written credit derivative, a similar amount would generally become due to Nomura under the purchased credit protection.


193


Table of Contents

NOMURA HOLDINGS, INC.

NOTES TO THE CONSOLIDATED FINANCIAL STATEMENTS—(Continued)


Written credit derivatives have a stated notional amount which represents the maximum payment Nomura may be required to make under the written credit derivative. However, this is generally not a true representation of the amount Nomura will actually pay under these contracts as there are other factors that affect the likelihood and amount of any payment obligations under the contracts, including:

Probability of default: Nomura values credit derivatives by taking into account of the probability that the underlying reference asset will default and that Nomura will be required to make payments under the contract. Based on historical experience and Nomura’s assessment of the market, Nomura believes that the probability that all reference assets on which Nomura provides protection will default in a single period is remote. The notional amounts are therefore, significantly higher than Nomura’s actual exposures to these contracts as a whole.

Recovery value on the underlying asset: In the case of the occurrence of an event of default, Nomura’s liability on a written credit derivative is limited to the difference between the notional amount and the recovery value of the underlying reference asset under default. While the recovery value on a defaulted asset may be minimal in certain cases, this does reduce amounts paid on these contracts.

The following tables present information about Nomura’s written credit derivatives and purchased credit protection with identical underlying reference assets as of March 31, 2025 and 2026.


     Billions of yen  
     March 31, 2025  
     Carrying value(1)
(Asset) /
Liability
    Maximum potential payout/Notional      Notional  
    Total      Years to maturity      Purchased
credit
protection
 
     Less than
1 year
     1 to 3
years
     3 to 5
years
     More than
5 years
 

Single-name credit default swaps

   ¥ (156   ¥ 11,480      ¥ 1,730      ¥ 3,124      ¥ 4,963      ¥ 1,663      ¥ (6,711

Credit default swap indices

     (221     15,488        1,465        3,168        7,877        2,978        (8,097

Other credit risk related portfolio products

     28       1,236        124        464        571        77        (785

Credit-risk related options and swaptions

     0       171        —         11        79        81        (42


Total

   ¥ (349   ¥ 28,375      ¥ 3,319      ¥ 6,767      ¥ 13,490      ¥ 4,799      ¥ (15,635


194


Table of Contents

NOMURA HOLDINGS, INC.

NOTES TO THE CONSOLIDATED FINANCIAL STATEMENTS—(Continued)


     Billions of yen  
     March 31, 2026  
     Carrying value(1)
(Asset) /
Liability
    Maximum potential payout/Notional      Notional  
    Total      Years to maturity      Purchased
credit
protection
 
     Less than
1 year
     1 to 3
years
     3 to 5
years
     More than
5 years
 

Single-name credit default swaps

   ¥ (277   ¥ 23,468      ¥ 2,229      ¥ 6,782      ¥ 11,699      ¥ 2,758      ¥ (17,962

Credit default swap indices

     (617     42,499        2,859        9,014        25,640        4,986        (33,274

Other credit risk related portfolio products

     (49     1,824        177        881        568        198        (1,029

Credit-risk related options and swaptions

     (1     419        6        2        374        37        (219


Total

   ¥ (944   ¥ 68,210      ¥ 5,271      ¥ 16,679      ¥ 38,281      ¥ 7,979      ¥ (52,484


(1)

Carrying value amounts are shown on a gross basis prior to cash collateral or counterparty offsetting. Asset balances represent positive fair value amounts caused by tightening of credit spreads of the underlyings since inception of the credit derivatives.

The following tables present information about Nomura’s written credit derivatives by external credit rating of the underlying asset. Credit ratings are based on S&P Global Ratings (“S&P”), or if not rated by S&P, based on Moody’s Investors Service. If credit ratings from either of these agencies are not available, the credit ratings are based on Fitch Ratings Ltd. or Japan Credit Rating Agency, Ltd. For credit default indices, the credit rating is determined by taking the weighted average of the external credit ratings given for each of the underlying reference entities comprising the portfolio or index.


     Billions of yen  
     March 31, 2025  
     Maximum potential payout/Notional  
     AAA      AA      A      BBB      BB      Other(1)      Total  

Single-name credit default swaps

   ¥ 571      ¥ 1,855      ¥ 3,488      ¥ 4,213      ¥ 655      ¥ 698      ¥ 11,480  

Credit default swap indices

     32        38        3,958        10,256        277        927        15,488  

Other credit risk-related portfolio products

     —         —         24        748        20        444        1,236  

Credit risk-related options and swaptions

     —         —         —         127        —         44        171  


Total

   ¥ 603      ¥ 1,893      ¥ 7,470      ¥ 15,344      ¥ 952      ¥ 2,113      ¥ 28,375  


     Billions of yen  
     March 31, 2026  
     Maximum potential payout/Notional  
     AAA      AA      A      BBB      BB      Other(1)      Total  

Single-name credit default swaps

   ¥ 133      ¥ 2,999      ¥ 7,182      ¥ 9,459      ¥ 2,406      ¥ 1,289      ¥ 23,468  

Credit default swap indices

     46        2,702        6,605        19,626        720        12,800        42,499  

Other credit risk-related portfolio products

     —         13        3        959        27        822        1,824  

Credit risk-related options and swaptions

     —         14        130        —         2        273        419  


Total

   ¥ 179      ¥ 5,728      ¥ 13,920      ¥ 30,044      ¥ 3,155      ¥ 15,184      ¥ 68,210  


(1)

Other includes credit derivatives where the credit rating of the underlying reference asset is below investment grade or where a credit rating is unavailable.


195


Table of Contents

NOMURA HOLDINGS, INC.

NOTES TO THE CONSOLIDATED FINANCIAL STATEMENTS—(Continued)


Derivatives entered into in contemplation of sales of financial assets

Nomura enters into transactions which involve both the transfer of financial assets to a counterparty and a separate agreement entered contemporaneously with the same counterparty through which Nomura retains substantially all of the exposure to the economic return on the transferred financial assets throughout the term of the transaction. These transactions primarily include sales of securities with bilateral OTC total return swaps or other derivative agreements which are in-substance total return swaps.

These transactions are accounted for as sales of the securities with the derivative accounted for separately if the criteria for derecognition of the securities under ASC 860 are met. Where the derecognition criteria are not met, the transfer and separate derivative are accounted for as a single collateralized financing transaction which is reported within Long-term borrowings in the consolidated balance sheets.

Nomura entered into certain contemporaneous transactions involving the transfer of securities that are accounted for as sales, where substantially all of the economic exposures to the transferred securities are retained through total return swaps but does not retain control over the assets transferred. The following table provides information about relevant transactions outstanding as of March 31, 2025 and March 31, 2026.


     Millions of yen  
     March 31  
     2025      2026  

Gross cash proceeds received at transfer dates

   ¥  60,715      ¥  31,321  

Fair value of transferred securities at transfer dates

   ¥ 60,591      ¥ 31,278  

Fair value of transferred securities at reporting dates

   ¥ 41,101      ¥ 16,997  

Gross derivative liabilities arising from the transactions at reporting dates(1)

   ¥ 19,401      ¥ 14,221  
 
(1)

Amounts are presented on a gross basis, before the application of counterparty offsetting and are reported within Trading liabilities in the consolidated balance sheets as of March 31, 2025 and March 31, 2026. Of these gross derivative liability amounts, ¥19,401 million and ¥14,221 million are included in interest rate contracts used for trading purposes as of March 31, 2025 and March 31, 2026 respectively as disclosed in Note 3 “Derivative instruments and hedging activities.


196


Table of Contents

NOMURA HOLDINGS, INC.

NOTES TO THE CONSOLIDATED FINANCIAL STATEMENTS—(Continued)


4. Revenue from services provided to customers

Revenue by types of service

The following table presents revenue earned by Nomura from providing services to customers by relevant line item in the consolidated statements of income for the years ended March 31, 2025 and 2026.


     Millions of yen  
     Year ended March 31  
     2025      2026  

Commissions

   ¥ 407,011      ¥ 455,289  

Fees from investment banking

     212,234        200,548  

Asset management and portfolio service fees

     378,196        468,600  

Other revenue

     71,221        79,735  


Total

   ¥ 1,068,662      ¥ 1,204,172  


Commissions represent revenue principally from trade execution, clearing services and distribution of fund units primarily provided by the Wealth Management Division, and to a lesser extent, the Wholesale Division. In addition, part of this revenue is included in the newly established Banking Division as of April 1, 2025. The following table shows a breakdown of Commissions for the years ended March 31, 2025 and 2026.


     Millions of yen  
     Year ended March 31  
     2025      2026  

Brokerage commissions

   ¥ 264,512      ¥ 295,192  

Commissions for distribution of investment trust

     66,108        66,345  

Other commissions

     76,391        93,752  


Total

   ¥ 407,011      ¥ 455,289  


Fees from investment banking represent revenue from financial advisory, underwriting and distribution primarily from the Wholesale Division, and to a lesser extent, the Wealth Management Division. The following table shows the breakdown of Fees from investment banking for the years ended March 31, 2025 and 2026.


     Millions of yen  
     Year ended March 31  
     2025      2026  

Equity underwriting and distribution fees

   ¥ 52,930      ¥ 40,997  

Debt underwriting and distribution fees

     48,383        47,014  

Financial advisory fees

     78,674        83,031  

Other fees

     32,247        29,506  


Total

   ¥ 212,234      ¥ 200,548  


Asset management and portfolio service fees represent revenue from asset management services primarily from the Investment Management Division, and to a lesser extent, the Wealth Management Division. In addition, part of this revenue is included in the newly established Banking Division as of April 1, 2025. The following table shows the breakdown of Asset management and portfolio service fees for the years ended March 31, 2025 and 2026.


     Millions of yen  
     Year ended March 31  
     2025      2026  

Asset management fees

   ¥ 235,893      ¥ 311,710  

Administration fees

     109,092        120,570  

Custodial fees

     33,211        36,320  


Total

   ¥ 378,196      ¥ 468,600  


197


Table of Contents

NOMURA HOLDINGS, INC.

NOTES TO THE CONSOLIDATED FINANCIAL STATEMENTS—(Continued)


The following table presents summary information regarding the key methodologies, assumptions and judgments used in recognizing revenue for each of the primary types of service provided to customers, including the nature of underlying performance obligations within each type of service and whether those performance obligations are satisfied at a point in time or over a period of time. For performance obligations recognized over time, information is also provided to explain the nature of the input or output method used to recognize revenue over time.


Type of service provided to customers


Overview of key services provided


Key revenue recognition policies, assumptions and

judgments

Trade execution, clearing services and distribution of fund units


•    Buying and selling of securities on behalf of customers

•    Distribution of fund units

•    Clearing of securities and derivatives on behalf of customers


•    Trade execution and clearing commissions recognized at a point in time, namely trade date.

•    Distribution fees are recognized at a point in time when the fund units have been sold to third party investors.

•    Commissions recognized net of soft dollar credits provided to customers where Nomura is acting as agent in providing investment research and similar services to the customer.

Financial advisory services


•    Provision of financial advice to customers in connection with a specific forecasted transaction or transactions such as mergers and acquisitions

•    Provision of financial advice not in connection with a specific forecasted transaction or transactions such as general corporate intelligence and similar research

•    Issuance of fairness opinions

•    Structuring complex financial instruments for customers


•    Fees contingent on the success of an underlying transaction are variable consideration recognized when the underlying transaction has been completed since only at such point is it probable that a significant reversal of revenue will not occur.

•    Retainer and milestone fees are recognized either over the period to which they relate or are deferred until consummation of the underlying transaction depending on whether the underlying performance obligation is satisfied at a point in time or over time.

•    Judgment is required to make this determination with factors influencing this determination including, but not limited to, whether the fee is in connection with an engagement designed to achieve a specific transaction or outcome for the customer (such as the purchase or sale of a business), the nature and extent of benefit to be provided to the customer prior to, and in addition to such specific transaction or outcome and the fee structure for the engagement.

•    Retainer and milestone fees recognized over time are normally recognized on a straight-line basis over the term of the contract based on time elapsed.

Underwriting and syndication services


•    Underwriting of debt, equity and other financial instruments on behalf of customers

•    Distributing securities on behalf of issuers

•    Arranging loan financing for customers

•    Syndicating loan financing on behalf of customer


•    Underwriting and syndication fees are recognized at a point in time when the underlying transaction is complete.

•    Commitment fees where draw down of the facility is deemed remote are recognized on a straight-line basis over the life of the facility based on time elapsed.

•    Underwriting and syndication costs are recognized either as a reduction of revenue or on a gross basis depending on whether Nomura is acting as principal or agent for such amounts.


198


Table of Contents

NOMURA HOLDINGS, INC.

NOTES TO THE CONSOLIDATED FINANCIAL STATEMENTS—(Continued)


Type of service provided to customers


Overview of key services provided


Key revenue recognition policies, assumptions and

judgments

Asset management services


•    Management of funds, investment trusts and other investment vehicles

•    Provision of investment advisory services

•    Provision of custodial and administrative services to customers


•    Management fees earned by Nomura in connection with managing a fund, investment trust or other vehicle generally are recognized on a straight-line basis over the term of the contract based on time elapsed.

•    Performance-based fees are variable consideration recognized when the performance metric has been determined since only at such point is it probable that a significant reversal of revenue will not occur.

•    Custodial and administrative fees are recognized on a straight-line basis over time based on time elapsed.

Where revenue is recognized at a point in time, payments of fees are typically received at the same time as when the performance obligation is satisfied, or within several days or months after satisfying a performance obligation. In relation to revenue recognized over time, payments of fees are typically settled monthly, quarterly or semi-annually.

The underlying contracts entered into by Nomura in connection with the services described above typically do not have significant financing components. If such components exist in a contract, Nomura has made an accounting policy permitted by ASC 606 “Revenue from Contracts with Customers” (“ASC 606”) not to adjust for the effects of a significant financing component where the financing is effectively for a period of one year or less. Such contracts also typically do not contain any rights of return or similar features for the customer.


199


Table of Contents

NOMURA HOLDINGS, INC.

NOTES TO THE CONSOLIDATED FINANCIAL STATEMENTS—(Continued)


Customer contract balances

When Nomura or the customer performs in accordance with the terms of a customer contract, a contract asset, customer contract receivable or contract liability is recognized in Nomura’s consolidated balance sheet.

A contract asset represents accrued revenue recognized by Nomura for completion or partially completion of a performance obligation, namely a right of Nomura to receive consideration for providing the service to the customer, which is conditional on factors or events other than the passage of time. A customer contract receivable is an unconditional right of Nomura to receive consideration in exchange for services provided. Both contract assets and customer contract receivables are reported in Receivables from Customers within Nomura’s consolidated balance sheet. A contract liability is any liability recognized in connection with a customer contract, including obligations to refund or obligations to provide a service in the future for which consideration has already been received or is due to be received. Contract liabilities are reported in Payables to Customers within Nomura’s consolidated balance sheet.

The following table presents the balances of customer contract receivables and contract liabilities in scope of ASC 606 as of March 31, 2025 and 2026. The balances of contract assets as of March 31, 2025 and 2026 were not significant.


     Millions of yen  
     March 31  
     2025      2026  

Customer contract receivables

   ¥  114,158      ¥  143,413  

Contract liabilities(1)

     5,276        6,004  
 
(1)

Contract liabilities primarily rise from investment advisory services and are recognized over the term of the contract based on time elapsed.

The balance of contract liabilities as of March 31, 2024 and 2025 were recognized as revenue for the year ended March 31, 2025 and 2026, respectively. Nomura recognized ¥2,737 million of revenue from performance obligations satisfied in previous periods for the year ended March 31, 2025. Nomura recognized ¥1,808 million of revenue from performance obligations satisfied in previous periods for the year ended March 31, 2026.

Transaction price allocated to the remaining performance obligations

In the ordinary course of business, Nomura may enter into customer contracts where the performance obligations are wholly or partially unsatisfied as of fiscal year ends. The total transaction prices allocated to the remaining unsatisfied performance obligations within these customer contracts were ¥550 million as of March 31, 2025 and ¥293 million as of March 31, 2026. As permitted by ASC 606, Nomura has elected not to disclose information about remaining performance obligations that have an individual estimated contract period of one year or less. In addition, consideration arising from contracts with customers does not comprise any significant amount that is not included in transaction price.

Customer contract costs

As permitted by ASC 340 “Other Assets and Deferred Costs,” Nomura has elected to expense all costs to obtain customer contracts where such amounts would be otherwise expensed within one year or less. As a result, the amounts of deferred costs to obtain or fulfill customer contracts as of March 31, 2025 and 2026 were not significant.


200


Table of Contents

NOMURA HOLDINGS, INC.

NOTES TO THE CONSOLIDATED FINANCIAL STATEMENTS—(Continued)


5. Collateralized transactions:

Nomura enters into collateralized transactions, including reverse repurchase agreements, repurchase agreements, securities borrowing transactions, securities lending transactions, other secured borrowings and similar transactions mainly to meet clients’ financing needs, finance trading inventory positions and obtain securities for settlement.

Reverse repurchase agreements, repurchase agreements, securities borrowing transactions and securities lending transactions are typically documented under industry standard master netting agreements which mitigate Nomura’s credit exposure to counterparties. For certain centrally-cleared reverse repurchase and repurchase agreements, the clearing or membership agreements entered into by Nomura provide similar rights to Nomura in the event of default of the relevant central clearing counterparty. Nomura generally seeks to obtain an external legal opinion in order to ascertain the enforceability of such close-out and offsetting rights within these agreements.

Nomura may enter into reverse repurchase agreements, repurchase agreements, securities borrowing and securities lending transactions with certain types of counterparties and in certain jurisdictions which are not documented under a master netting agreement. Even when these transactions are documented under such master netting agreements, Nomura may not have obtained, or may not be able to obtain, evidence to determine with sufficient certainty that the close-out and offsetting rights in the agreements are legally enforceable. This may be the case where relevant local laws explicitly prohibit such close-out and offsetting rights, or where local laws are complex, ambiguous or silent on the enforceability of such rights. This may include reverse repurchase agreements, repurchase agreements, securities borrowing and securities lending transactions executed with certain foreign governments, agencies, municipalities, central clearing counterparties, agent banks and pension funds.

Nomura considers the enforceability of a master netting agreement in determining how credit risk arising from transactions with a specific counterparty is hedged, how counterparty credit exposures are calculated and applied to credit limits and the extent and nature of collateral requirements from the counterparty.

In all of these transactions, Nomura either receives or provides collateral, including Japanese and non-Japanese government, agency, mortgage-backed, bank and corporate debt securities and equities. In most cases, the party receiving the collateral is free to sell or repledge the securities received through repurchase agreements, securities lending transactions or to cover short positions. In repurchase and reverse repurchase agreements, the value of collateral typically exceeds the amount of cash transferred, where collateral is generally in the form of securities. Securities borrowing transactions generally require Nomura to provide the counterparty with collateral in the form of cash or other securities. For securities lending transactions, Nomura generally receives collateral in the form of cash or other securities. Nomura monitors the market value of the securities either received from or provided to the counterparty. Additional cash or securities are exchanged as necessary, to ensure that such transactions are adequately collateralized throughout the life of the transactions.


201


Table of Contents

NOMURA HOLDINGS, INC.

NOTES TO THE CONSOLIDATED FINANCIAL STATEMENTS—(Continued)


Offsetting of certain collateralized transactions

Reverse repurchase agreements and repurchase agreements, securities borrowing and lending transactions with the same counterparty documented under a master netting agreement are offset in the consolidated balance sheets where specific criteria as defined by ASC 210-20 are met. These criteria include requirements around maturity of transactions, underlying systems on which collateral is settled, associated banking arrangements and legal enforceability of close-out and offsetting rights under relevant master netting agreements.

The following tables present information about offsetting of these transactions in the consolidated balance sheets as of March 31, 2025 and 2026, together with the extent to which master netting agreements entered into with counterparties and central clearing parties permit additional offsetting in the event of counterparty default. Transactions which are not documented under a master netting agreement or are documented under a master netting agreement for which Nomura does not have sufficient evidence of enforceability are not offset in the following tables.


     Billions of yen  
     March 31, 2025  
     Assets     Liabilities  
     Reverse
repurchase
agreements
    Securities
borrowing
transactions
    Repurchase
agreements
    Securities
lending
transactions
 

Total gross balance(1)

   ¥ 43,464     ¥ 4,656     ¥ 45,747     ¥ 2,347  

Less: Amounts offset in the consolidated balance sheets(2)

     (29,459     —        (29,459     —   


Total net amounts as reported on the face of the consolidated balance sheets(3)

   ¥ 14,005     ¥ 4,656     ¥ 16,288     ¥ 2,347  


Less: Additional amounts not offset in the consolidated balance sheets(4)


Financial instruments and non-cash collateral

     (13,422     (2,941     (13,800     (2,162

Cash collateral

     (3     —        (4     —   


Net amount

   ¥ 580     ¥ 1,715     ¥ 2,484     ¥ 185  


202


Table of Contents

NOMURA HOLDINGS, INC.

NOTES TO THE CONSOLIDATED FINANCIAL STATEMENTS—(Continued)


     Billions of yen  
     March 31, 2026  
     Assets     Liabilities  
     Reverse
repurchase
agreements
    Securities
borrowing
transactions
    Repurchase
agreements
    Securities
lending
transactions
 

Total gross balance(1)

   ¥ 49,251     ¥ 4,336     ¥ 51,275     ¥ 2,953  

Less: Amounts offset in the consolidated balance sheets(2)

     (36,041     —        (36,041     —   


Total net amounts as reported on the face of the consolidated balance sheets(3)

   ¥ 13,210     ¥ 4,336     ¥ 15,234     ¥ 2,953  


Less: Additional amounts not offset in the consolidated balance sheets(4)


Financial instruments and non-cash collateral

     (12,493     (2,635     (13,670     (2,645

Cash collateral

     (5     —        (27     —   


Net amount

   ¥ 712     ¥ 1,701     ¥ 1,537     ¥ 308  


(1)

Include all recognized balances irrespective of whether they are transacted under a master netting agreement or whether Nomura has obtained sufficient evidence of enforceability of the master netting agreement. Amounts include transactions carried at fair value through election of the fair value option. As of March 31, 2025, the gross balance of reverse repurchase agreements and repurchase agreements which were not transacted under master netting agreements or are documented under master netting agreements for which Nomura has not yet obtained sufficient evidence of enforceability amounted to ¥441 billion and ¥1,973 billion, respectively. As of March 31, 2025, the gross balance of securities borrowing transactions and securities lending transactions which were not transacted under master netting agreements or are documented under master netting agreements for which Nomura has not yet obtained sufficient evidence of enforceability amounted to ¥1,528 billion and ¥111 billion, respectively. As of March 31, 2026, the gross balance of reverse repurchase agreements and repurchase agreements which were not transacted under master netting agreements or are documented under master netting agreements for which Nomura has not yet obtained sufficient evidence of enforceability amounted to ¥458 billion and ¥895 billion, respectively. As of March 31, 2026, the gross balance of securities borrowing transactions and securities lending transactions which were not transacted under master netting agreements or are documented under master netting agreements for which Nomura has not yet obtained sufficient evidence of enforceability amounted to ¥1,532 billion and ¥151 billion, respectively.

(2)

Represent amounts offset through counterparty netting under master netting or similar agreements for which Nomura has obtained sufficient evidence of enforceability in accordance with ASC 210-20. Amounts offset include transactions carried at fair value through election of the fair value option.

(3)

Reverse repurchase agreements and securities borrowing transactions are reported within Collateralized agreements—Securities purchased under agreements to resell and Collateralized agreementsSecurities borrowed in the consolidated balance sheets, respectively. Repurchase agreements and securities lending transactions are reported within Collateralized financingSecurities sold under agreements to repurchase and Collateralized financingSecurities loaned in the consolidated balance sheets, respectively. Amounts reported under securities lending transactions also include transactions where Nomura lends securities and receives securities that can be sold or pledged as collateral. Nomura recognizes the securities received at fair value and a liability for the same amount, representing the obligation to return those securities. The securities received and the liability are reported within Other assets-Other and Other liabilities in the consolidated balance sheets, respectively.

(4)

Represent amounts which are not permitted to be offset on the face of the consolidated balance sheets in accordance with ASC 210-20 but which provide Nomura with the right of offset in the event of counterparty default. Amounts relating to agreements where Nomura has not yet obtained sufficient evidence of enforceability of such offsetting rights are excluded.

For information on offsetting of derivatives, see Note 3 “Derivative instruments and hedging activities.”


203


Table of Contents

NOMURA HOLDINGS, INC.

NOTES TO THE CONSOLIDATED FINANCIAL STATEMENTS—(Continued)


Maturity analysis of repurchase agreements and securities lending transactions

The following tables present an analysis of the total carrying value of liabilities recognized in the consolidated balance sheets for repurchase agreements and securities lending transactions by remaining contractual maturity of the agreement as of March 31, 2025 and 2026. Amounts reported are shown prior to counterparty netting in accordance with ASC 210-20.


     Billions of yen  
     March 31, 2025  
     Overnight
and open(1)
     Up to
30 days
     30 - 90
days
     90 days -1
year
     Greater than
1 year
     Total  

Repurchase agreements

   ¥ 19,523      ¥ 20,673      ¥ 2,466      ¥ 1,848      ¥ 1,237      ¥ 45,747  

Securities lending transactions

     1,384        144        14        255        550        2,347  


Total gross recognized liabilities(2)

   ¥ 20,907      ¥ 20,817      ¥ 2,480      ¥ 2,103      ¥ 1,787      ¥ 48,094  


     Billions of yen  
     March 31, 2026  
     Overnight
and open(1)
     Up to
30 days
     30 - 90
days
     90 days -1
year
     Greater than
1 year
     Total  

Repurchase agreements

   ¥ 22,834      ¥ 23,656      ¥ 1,783      ¥ 1,411      ¥ 1,591      ¥ 51,275  

Securities lending transactions

     1,660        146        46        482        619        2,953  


Total gross recognized liabilities(2)

   ¥ 24,494      ¥ 23,802      ¥ 1,829      ¥ 1,893      ¥ 2,210      ¥ 54,228  


(1)

Open transactions do not have an explicit contractual maturity date and are terminable on demand by Nomura or the counterparty.

(2)

Repurchase agreements and securities lending transactions are reported within Collateralized financingSecurities sold under agreements to repurchase and Collateralized financingSecurities loaned in the consolidated balance sheets, respectively. Amounts reported for securities lending transactions also include transactions where Nomura lends securities and receives securities that can be sold or pledged as collateral. Nomura recognizes the securities received at fair value and a liability for the same amount, representing the obligation to return those securities. The securities received and the liability are reported within Other assets-Other and Other liabilities in the consolidated balance sheets, respectively. The total gross recognized liabilities reported for repurchase agreements and securities lending transactions are consistent with the total gross balances reported in the offsetting disclosures above.


204


Table of Contents

NOMURA HOLDINGS, INC.

NOTES TO THE CONSOLIDATED FINANCIAL STATEMENTS—(Continued)


Securities transferred in repurchase agreements and securities lending transactions

The following tables present an analysis of the total carrying value of liabilities recognized in the consolidated balance sheets for repurchase agreements and securities lending transactions by class of securities and other financial assets transferred by Nomura to counterparties as of March 31, 2025 and 2026. Amounts reported are shown prior to counterparty netting in accordance with ASC 210-20.


     Billions of yen  
   March 31, 2025  
   Repurchase
agreements
     Securities
lending
transactions
     Total  

Equities and convertible securities

   ¥ 401      ¥ 1,734      ¥ 2,135  

Japanese government, agency and municipal securities

     2,202        1        2,203  

Foreign government, agency and municipal securities

     34,569        81        34,650  

Bank and corporate debt securities

     3,881        369        4,250  

Commercial mortgage-backed securities (“CMBS”)

     29        —         29  

Residential mortgage-backed securities (“RMBS”)(1)

     4,466        —         4,466  

Collateralized debt obligations (“CDOs”) and other

     177        —         177  

Investment trust funds and other

     22        162        184  


Total gross recognized liabilities(2)

   ¥ 45,747      ¥ 2,347      ¥ 48,094  


     Billions of yen  
   March 31, 2026  
   Repurchase
agreements
     Securities
lending
transactions
     Total  

Equities and convertible securities

   ¥ 442      ¥ 2,272      ¥ 2,714  

Japanese government, agency and municipal securities

     3,061        163        3,224  

Foreign government, agency and municipal securities

     38,182        182        38,364  

Bank and corporate debt securities

     5,598        267        5,865  

Commercial mortgage-backed securities (“CMBS”)

     —         —         —   

Residential mortgage-backed securities (“RMBS”)(1)

     3,635        —         3,635  

Collateralized debt obligations (“CDOs”) and other

     346        —         346  

Investment trust funds and other

     11        69        80  


Total gross recognized liabilities(2)

   ¥ 51,275      ¥ 2,953      ¥ 54,228  


(1)

Includes ¥3,586 billion of U.S. government sponsored agency mortgage pass through securities and collateralized mortgage obligations as of March 31, 2025. Includes ¥2,877 billion of U.S. government sponsored agency mortgage pass through securities and collateralized mortgage obligations as of March 31, 2026.

(2)

Repurchase agreements and securities lending transactions are reported within Collateralized financing—Securities sold under agreements to repurchase and Collateralized financingSecurities loaned in the consolidated balance sheets, respectively. Amounts reported for securities lending transactions also include transactions where Nomura lends securities and receives securities that can be sold or pledged as collateral. Nomura recognizes the securities received at fair value and a liability for the same amount, representing the obligation to return those securities. The securities received and the liability are reported within Other assets-Other and Other liabilities in the consolidated balance sheets, respectively. The total gross recognized liabilities reported for repurchase agreements and securities lending transactions are consistent with the total gross balances reported in the offsetting disclosures above.


205


Table of Contents

NOMURA HOLDINGS, INC.

NOTES TO THE CONSOLIDATED FINANCIAL STATEMENTS—(Continued)


Collateral received by Nomura

The following table presents the fair value of securities received as collateral, securities borrowed with or without collateral, which Nomura is permitted to sell or repledge, and the portion that has been sold or repledged as of March 31, 2025 and 2026.


     Billions of yen  
     March 31  
     2025      2026  

The fair value of collateral received

   ¥ 64,853      ¥ 69,667  

The portion of the above received that has been sold (as reported as short sales within Trading liabilities in the consolidated balance sheets) or repledged

       48,717          56,304  

Collateral is generally sourced from securities purchased under agreement to resell, securities borrowing transactions, secured loans and from derivative transactions. Collateral is used together with owned securities and other financial assets to cover short sales, collateralize repurchase transactions, other secured financings and derivative transactions.

Assets pledged by Nomura

Nomura pledges owned securities and other financial assets to collateralize repurchase transactions, other secured financings and derivative transactions. Pledged securities that can be sold or repledged by the transferee, including Gensaki Repo transactions, are reported in parentheses as Assets pledged within Trading assets, Investments in equity securities and Investments in and advances to affiliated companies in the consolidated balance sheets.

The following table presents the carrying amounts of financial assets recognized in the consolidated balance sheets which have been pledged as collateral, primarily to stock exchanges and clearing organizations, where the secured party does not have the right to sell or repledge them by type of asset as of March 31, 2025 and 2026.


     Millions of yen  
     March 31  
     2025      2026  

Trading assets:


Equities and convertible securities

   ¥ 326,398      ¥ 417,915  

Government and government agency securities

     1,134,816        1,396,517  

Bank and corporate debt securities

     86,034        123,674  

Commercial mortgage-backed securities (“CMBS”)

     —         5,189  

Residential mortgage-backed securities (“RMBS”)

     2,626,708        2,120,771  

Collateralized debt obligations (“CDOs”) and other(1)

     12,391        7,864  

Investment trust funds and other

     21,042        10,715  


   ¥ 4,207,389      ¥ 4,082,645  


Non-trading debt securities(2)

     15,896        21,566  

Investments in and advances to affiliated companies(3)

   ¥ 16,124      ¥ 16,086  
 
(1)

Includes collateralized loan obligations (“CLOs”) and asset-backed securities (“ABSs”) such as those secured on credit card loans, auto loans and student loans.

(2)

Non-trading debt securities are primarily Japanese municipal securities issued by prefectures or ordinance-designated city.

(3)

Investments in and advances to affiliated companies comprise shares in Nomura Research Institute, Ltd.


206


Table of Contents

NOMURA HOLDINGS, INC.

NOTES TO THE CONSOLIDATED FINANCIAL STATEMENTS—(Continued)


The following table presents the carrying amount of financial and non-financial assets recognized in the consolidated balance sheets, other than those disclosed above, which are subject to lien as of March 31, 2025 and 2026.


     Millions of yen  
     March 31  
     2025      2026  

Loans and receivables

   ¥ 627,090      ¥ 934,055  

Trading assets and private equity and debt investments

     1,766,083        1,713,792  

Office buildings, land, equipment and facilities

     2,933        13,617  

Non-trading debt securities

     117,655        212,469  

Investments in and advances to affiliated companies

     2        3  

Other

     1,333        1,522  


   ¥ 2,515,096      ¥ 2,875,458  


Assets in the above table were primarily pledged for secured borrowings, including other secured borrowings, collateralized borrowings of consolidated VIEs and derivative transactions. The above table also includes financial assets which continue to be recognized on the consolidated balance sheets as they fail the criteria for derecognition under ASC 860. The associated liabilities with these transactions are reported as trading balances of secured borrowings reported in Long-term borrowings. See Note 13 “Borrowings” for further information regarding trading balances of secured borrowings.


207


Table of Contents

NOMURA HOLDINGS, INC.

NOTES TO THE CONSOLIDATED FINANCIAL STATEMENTS—(Continued)


6. Non-trading investments:

Available-for-sale (“AFS”) debt securities

Amortized cost and fair value amounts of AFS debt securities

The following table presents the amortized cost and fair value of major types of AFS debt securities as well as cumulative unrealized gains and unrealized losses recognized through Accumulated other comprehensive income (loss) since acquisition as of March 31, 2025 and 2026.


     Millions of yen  
     March 31, 2025  
     Amortized cost (1)      Unrealized gains      Unrealized losses     Fair value  

Japanese government securities

   ¥ 25,001      ¥ —       ¥ (187   ¥ 24,814  

Japanese agency and municipal securities

     81,913        19        (1,495     80,437  

Bank and corporate debt securities

     1,790        —         (11     1,779  


Total

   ¥ 108,704      ¥ 19      ¥ (1,693   ¥ 107,030  


     Millions of yen  
     March 31, 2026  
     Amortized cost (1)      Unrealized gains      Unrealized losses     Fair value  

Japanese government securities

   ¥ 99,977      ¥ —       ¥ (493   ¥ 99,484  

Japanese agency and municipal securities

     160,639        —         (4,129     156,510  

Bank and corporate debt securities

     15,636        —         (286     15,350  


Total

   ¥ 276,252      ¥ —       ¥ (4,908   ¥ 271,344  


(1)

No allowances for credit losses have been recognized as of March 31, 2025 and 2026.

The following table presents the amortized cost and fair value of major types of AFS debt securities, categorized by contractual maturity as of March 31, 2025 and 2026.


     Millions of yen  
     March 31, 2025      March 31, 2026  
     Amortized cost (1)      Fair value      Amortized cost (1)      Fair value  

Japanese government securities


less than 1 year

   ¥ —       ¥ —       ¥ 19,997      ¥ 19,961  

1 year to 5 years

     25,001        24,814        79,980        79,523  


Subtotal

   ¥ 25,001      ¥ 24,814      ¥ 99,977      ¥ 99,484  


Japanese agency and municipal securities


less than 1 year

   ¥ —       ¥ —       ¥ 1,395      ¥ 1,387  

1 year to 5 years

     81,913        80,437        159,244        155,123  


Subtotal

   ¥ 81,913      ¥ 80,437      ¥ 160,639      ¥ 156,510  


Bank and corporate debt securities


1 year to 5 years

   ¥ 1,790      ¥ 1,779      ¥ 15,636      ¥ 15,350  


Subtotal

   ¥ 1,790      ¥ 1,779      ¥ 15,636      ¥ 15,350  


Total

   ¥ 108,704      ¥ 107,030      ¥ 276,252      ¥ 271,344  


(1)

No allowances for credit losses have been recognized as of March 31, 2025 and 2026.


208


Table of Contents

NOMURA HOLDINGS, INC.

NOTES TO THE CONSOLIDATED FINANCIAL STATEMENTS—(Continued)


AFS debt securities in an unrealized loss position

The following table presents the fair value of major types of AFS debt securities that are in an unrealized loss position as of March 31, 2025 and 2026, and the duration of the unrealized loss status. An unrealized loss exists where the fair value of an individual AFS debt securities is less than its amortized cost basis.


     Millions of yen  
     March 31, 2025      March 31, 2026  
     Fair value      Unrealized
losses
    Number of debt
securities
     Fair value      Unrealized
losses
    Number of debt
securities
 

Japanese government securities


Less than 12 months

   ¥ 24,814      ¥ (187     4      ¥ 74,665      ¥ (311     8  

12 months or longer

     —         —        —         24,819        (182     4  


Subtotal

   ¥ 24,814      ¥ (187     4      ¥ 99,484      ¥ (493     12  


Japanese agency and municipal securities


Less than 12 months

   ¥ 68,063      ¥ (1,495     72      ¥ 89,242      ¥ (1,828     80  

12 months or longer

     —         —        —         67,268        (2,301     72  


Subtotal

   ¥ 68,063      ¥ (1,495     72      ¥ 156,510      ¥ (4,129     152  


Bank and corporate debt securities


Less than 12 months

   ¥ 1,779      ¥ (11     3      ¥ 13,485      ¥ (260     28  

12 months or longer

     —         —        —         1,865        (26     3  


Subtotal

   ¥ 1,779      ¥ (11     3      ¥ 15,350      ¥ (286     31  


Total

   ¥ 94,656      ¥ (1,693     79      ¥ 271,344      ¥ (4,908     195  


Nomura does not intend to sell, nor is it likely to be required to sell, any AFS debt securities which were in an unrealized loss position as of March 31, 2025 and 2026, prior to when the fair value of each of these AFS debt securities is expected to recover above each individual amortized cost basis. No allowances for credit losses have been recognized against AFS debt securities as of March 31, 2025 and 2026.

The amount of accrued interest receivable from AFS debt securities was not significant as of March 31, 2025 and 2026. There was no write-off of accrued interest receivable during the years ended March 31, 2025 and 2026, respectively.

Sales and transfers of AFS debt securities

The amount of sales of AFS debt securities was not significant during the years ended March 31, 2025 and 2026. There were no transfers or reclassification of AFS debt securities into trading assets during the years ended March 31, 2025 and 2026.

Held-to-maturity (“HTM”) debt securities

As of March 31, 2025 and 2026, there were no debt securities classified as HTM debt securities.

Non-trading equity investments

Unrealized gains and losses of non-trading equity investments

The unrealized gain and losses on equity investments owned by non-BD entities that are not investment companies during the years ended March 31, 2025 and 2026 were ¥2,630 million loss and ¥12,452 million gain, respectively. These equity securities do not include equity investments that would have been accounted for under the equity method had Nomura not chosen to elect the FVO. Please see Note 2 “Fair Value Measurements” for the unrealized gains and losses on equity securities for which the FVO has been elected.

Non-trading equity investments elected for the fair value measurement alternative

The carrying value of non-trading equity investments without readily determinable fair values held by non-BD entities carried at fair value where fair value is determined using the fair value measurement alternative as of March 31, 2025 and 2026, were ¥95,529 million and ¥102,546 million, respectively. The amounts of cumulative impairment losses, and upward and downward fair value adjustments as a result of observable price changes from orderly transactions in identical or sufficiently similar equity investments were not significant as of March 31, 2025 and 2026.


209


Table of Contents

NOMURA HOLDINGS, INC.

NOTES TO THE CONSOLIDATED FINANCIAL STATEMENTS—(Continued)


During the years ended March 31, 2025 and 2026 the amounts of impairment losses, and upward and downward fair value adjustments recognized for these non-trading equity investments were not significant.


210


Table of Contents

NOMURA HOLDINGS, INC.

NOTES TO THE CONSOLIDATED FINANCIAL STATEMENTS—(Continued)


7. Securitizations and Variable Interest Entities:

Securitizations

Nomura utilizes special purpose entities (“SPEs”) to securitize commercial and residential mortgage loans, government agency and corporate securities and other types of financial assets. Those SPEs are incorporated as stock companies, silent partnerships (“Tokumei kumiai”), Cayman special purpose companies (“SPCs”) or trust accounts. Nomura’s involvements with these SPEs includes structuring the SPEs, underwriting, distributing and selling debt instruments and beneficial interests issued by SPEs to investors. Nomura accounts for the transfer of financial assets in accordance with ASC 860. This statement requires that Nomura accounts for the transfer of financial assets as a sale when Nomura relinquishes control over the financial assets. ASC 860 deems control to be relinquished when the following conditions are met: (a) the financial assets have been isolated from the transferor (even in bankruptcy or other receivership), (b) the transferee has the right to pledge or exchange the financial assets received, or if the transferee is an entity whose sole purpose is to engage in securitization or asset-backed financing activities, the holders of its beneficial interests have the right to pledge or exchange the beneficial interests, and (c) the transferor has not maintained effective control over the transferred assets. Where Nomura retains an interest in the financial assets, including residual interests in the SPEs, any such interests are measured at fair value and reported within Trading assets in the consolidated balance sheets, with the change in fair value reported within Revenue-Net gain on trading. Fair value for retained interests in securitized financial assets is determined by using observable prices; or in cases where observable prices are not available for certain retained interests, Nomura estimates fair value generally based on the present value of expected future cash flows using its best estimates of the key assumptions, including forecasted credit losses, prepayment rates, forward yield curves and discount rates commensurate with the risks involved. Nomura may also enter into derivative transactions in relation to the assets transferred to an SPE.

As noted above, Nomura may have continuing involvement with SPEs to which Nomura transferred assets. For the years ended March 31, 2025 and 2026, Nomura received cash proceeds from SPEs in new securitizations of ¥635 billion and ¥512 billion, respectively, and the associated loss on sale of ¥0 billion and gain on sale of ¥2 billion, respectively. For the years ended March 31, 2025 and 2026, Nomura received debt securities issued by these SPEs with an initial fair value of ¥708 billion and ¥824 billion, respectively, and cash inflows from third parties primarily on the sale of those debt securities of ¥743 billion and ¥1,106 billion, respectively. The cumulative balance of financial assets transferred to SPEs with which Nomura has continuing involvement was ¥7,123 billion and ¥7,919 billion as of March 31, 2025 and 2026, respectively. Those transferred financial assets are primarily government, agency and municipal securities. Nomura’s retained interests were ¥250 billion and ¥208 billion as of March 31, 2025 and 2026, respectively. For the years ended March 31, 2025 and 2026, Nomura received cash flows of ¥28 billion and ¥43 billion, respectively, from the SPEs on such retained interests held in the SPEs.

Nomura does not provide any financial support to SPEs beyond its contractual obligations as of March 31, 2025 and 2026.

The following tables present the fair value of retained interests which Nomura has continuing involvement in SPEs and their classification in the fair value hierarchy, categorized by the type of transferred assets as of March 31, 2025 and 2026.


     Billions of yen  
     March 31, 2025  
     Level 1      Level 2      Level 3      Total      Investment
grade
     Other  

Government, agency and municipal securities

   ¥ —       ¥ 241      ¥ —       ¥ 241      ¥ 241      ¥ —   

Bank and corporate debt securities

     —         —         —         —         —         —   

CMBS and RMBS

     —         —         9        9        2        7  


Total

   ¥ —       ¥ 241      ¥ 9      ¥ 250      ¥ 243      ¥ 7  


     Billions of yen  
     March 31, 2026  
     Level 1      Level 2      Level 3      Total      Investment
grade
     Other  

Government, agency and municipal securities

   ¥ —       ¥ 192      ¥ —       ¥ 192      ¥ 192      ¥ —   

Bank and corporate debt securities

     —         —         —         —         —         —   

CMBS and RMBS

     —         —         16        16        —         16  


Total

   ¥ —       ¥ 192      ¥ 16      ¥ 208      ¥ 192      ¥ 16  


As of March 31, 2025 and 2026, predominantly all of the retained interests held by Nomura were valued using significant observable inputs. The initial fair value of these retained interests are primarily classified as level 2 financial instruments in the fair value hierarchy.


211


Table of Contents

NOMURA HOLDINGS, INC.

NOTES TO THE CONSOLIDATED FINANCIAL STATEMENTS—(Continued)


The following table presents the type and carrying value of financial assets included within Trading assets and Loans receivable which have been transferred to SPEs but which do not meet the criteria for derecognition under ASC 860 as of March 31, 2025 and 2026. These transfers are accounted for as secured financing transactions and generally reported within Borrowings. The assets are pledged as collateral and cannot be removed unilaterally by Nomura and the liabilities are non-recourse to Nomura.


     Billions of yen  
   March 31  
   2025      2026  

Assets


Trading assets


Japanese government securities

   ¥ 1      ¥ 2  

Loans for trading purposes

     66        197  

Loans receivable

     481        432  


Total

   ¥ 548      ¥ 631  


Liabilities


Borrowings

   ¥    548      ¥    631  


Variable Interest Entities (“VIEs”)

In the normal course of business, Nomura acts as a transferor of financial assets to VIEs, and underwriter, distributor, and seller of repackaged financial instruments issued by VIEs in connection with its securitization and equity derivative activities. Nomura retains, purchases and sells variable interests in VIEs in connection with its market-making, investing and structuring activities.

If Nomura has power to direct the activities of a VIE that most significantly impact the VIE’s economic performance, and through Nomura’s interest in the VIE, Nomura has the right to receive benefits or the obligation to absorb losses that could be potentially significant to the VIE, Nomura is the primary beneficiary of the VIE and consolidates the entity, provided that Nomura does not act as a fiduciary for other interest holders. Nomura’s consolidated VIEs include those that were created to market structured securities to investors by repackaging corporate convertible securities, mortgages and mortgage-backed securities. Certain VIEs used in connection with Nomura’s aircraft leasing business as well as other purposes are consolidated. Nomura also consolidates certain investment funds for which Nomura is the primary beneficiary.

The power to direct the most significant activities may take a number of different forms in different types of VIEs. For transactions such as securitizations, investment funds, and CDOs, Nomura generally considers collateral management and servicing to represent the power to make the most significant decisions, unless such roles are deemed to be a fiduciary relationship. Accordingly, Nomura does not consolidate such types of VIEs for which it does not act as collateral manager or servicer unless Nomura has the unilateral right to replace the collateral manager or servicer or to require liquidation of the entity.

For many transactions, such as where VIEs are used for re-securitizations of residential mortgage-backed securities, there are no significant economic decisions made on an ongoing basis and no single investor has the unilateral ability to liquidate the VIE. In those cases, Nomura focuses its analysis on the party who has the sole discretion in the initial design of the VIE, and considers factors such as the nature of the underlying assets held by the VIE, the extent of third party investors’ involvement in the design of the VIE, the size of initial third party investment and the amount and level of any subordination of beneficial interests issued by the VIE which will be held by Nomura and any third party investors. Nomura has sponsored numerous re-securitization transactions and in many cases has determined that it is not the primary beneficiary on the basis that power to direct the most significant activities relating to these entities are shared with third party investors. Nomura has consolidated certain VIEs where it was determined that third party investors were not involved in the design of the VIEs, including where the size of third party investment was insignificant at inception of the transaction.


212


Table of Contents

NOMURA HOLDINGS, INC.

NOTES TO THE CONSOLIDATED FINANCIAL STATEMENTS—(Continued)


The following table presents the classification of consolidated VIEs’ assets and liabilities in these consolidated financial statements as of March 31, 2025 and 2026. Most of these assets and liabilities are related to consolidated VIEs which securitize corporate convertible securities, mortgages and mortgage-backed securities. The assets of a consolidated VIE may only be used to settle obligations of that VIE. Creditors do not typically have any recourse to Nomura.


     Billions of yen  
     March 31  
     2025      2026  

Consolidated VIE assets


Cash and cash equivalents

   ¥ 14      ¥ 41  

Trading assets


Equities

     527        531  

Debt securities

     643        647  

CMBS and RMBS

     64        54  

Derivatives

     1        1  

Private equity and debt investments

     83        160  

Office buildings, land, equipment and facilities

     3        61  

Other

     236        177  


Total

   ¥ 1,571      ¥ 1,672  


Consolidated VIE liabilities


Trading liabilities


Derivatives

     0        1  

Borrowings


Short-term borrowings

     112        69  

Long-term borrowings

     935        839  

Other

     156        119  


Total

   ¥ 1,203      ¥ 1,028  


On a quarterly basis, Nomura reassesses its involvement with VIEs and evaluates the impact of any changes in governing documents and/or variable interests held by Nomura and other parties.

Nomura also holds variable interests in VIEs where Nomura is not the primary beneficiary. Nomura’s variable interests in such VIEs include senior and subordinated debt, residual interests, and equity interests associated with commercial and residential mortgage-backed and other asset-backed securitizations and structured financings, equity interests in VIEs which were formed primarily to acquire high yield leveraged loans and other lower investment grade debt obligations, residual interests in operating leases for aircraft held by VIEs, and loans and investments in VIEs that acquire operating businesses.


213


Table of Contents

NOMURA HOLDINGS, INC.

NOTES TO THE CONSOLIDATED FINANCIAL STATEMENTS—(Continued)


The following tables present the carrying amount of variable interests in unconsolidated VIEs and the maximum exposure to loss associated with these variable interests as of March 31, 2025 and 2026. Maximum exposure to loss does not reflect Nomura’s estimate of the actual losses that could result from adverse changes, nor does it reflect the economic hedges Nomura enters into to reduce its exposure. The risks associated with VIEs in which Nomura is involved are limited to the amount recognized in the consolidated balance sheets and the amount of any undrawn commitments and financial guarantees issued.


     Billions of yen  
   March 31, 2025  
   Carrying amount of variable interests      Maximum exposure
to loss to
unconsolidated VIEs
 
   Assets      Liabilities  

Trading assets and liabilities


Equities

   ¥ 23      ¥ —       ¥ 23  

Debt securities

     80        —         80  

CMBS and RMBS

     3,288        —         3,288  

Investment trust funds and other

     129        —         129  

Private equity and debt investments

     23        —         23  

Loans

     1,712        —         1,712  

Other

     23        —         23  

Commitments to extend credit and other guarantees

     —         —         167  


Total

   ¥ 5,278      ¥ —       ¥ 5,445  


     Billions of yen  
   March 31, 2026  
   Carrying amount of variable interests      Maximum exposure
to loss to
unconsolidated VIEs
 
   Assets      Liabilities  

Trading assets and liabilities


Equities

   ¥ 23      ¥ —       ¥ 23  

Debt securities

     63        —         63  

CMBS and RMBS

     2,807        —         2,807  

Investment trust funds and other

     187        —         187  

Private equity and debt investments

     20        —         20  

Loans

     2,205        —         2,205  

Other

     32        —         32  

Commitments to extend credit and other guarantees

     —         —         188  


Total

   ¥      5,337      ¥      —       ¥     5,525  


The above does not include certain repurchase agreement financings provided to third parties or Nomura sponsored VIEs.


214


Table of Contents

NOMURA HOLDINGS, INC.

NOTES TO THE CONSOLIDATED FINANCIAL STATEMENTS—(Continued)


8. Financing receivables:

In the normal course of business, Nomura extends financing to clients primarily in the form of loan receivables, loan commitments and collateralized agreements such as reverse repurchase agreements and securities borrowing transactions. These financing receivables are recognized as assets on Nomura’s consolidated balance sheets at fair value or on amortized cost basis and provide a contractual right to receive money either on demand or on future fixed or determinable dates.

The carrying value of financing receivables measured on an amortized cost basis is adjusted for allowances for current expected credit losses defined by ASC 326 “Financial InstrumentsCredit Losses” (“ASC 326”) where appropriate. Allowances for current expected credit losses against recognized financial instruments are reported in the consolidated balance sheets within Allowance for credit losses.

Collateralized agreements

Collateralized agreements consist of reverse repurchase agreements reported as Securities purchased under agreements to resell and securities borrowing transactions reported as Securities borrowed in the consolidated balance sheets, including those executed under Japanese Gensaki Repo agreements. Reverse repurchase agreements and securities borrowing transactions principally involve the buying of government and government agency securities from customers under agreements that also require Nomura to resell these securities to those customers, or borrowing these securities with cash and non-cash collateral. Nomura monitors the value of the underlying securities on a daily basis to the related receivables, including accrued interest, and requests or returns additional collateral when appropriate. Except for those transactions carried at fair value through election of the fair value option, reverse repurchase agreements are generally recognized in the consolidated balance sheets at the purchase price of the securities with applicable accrued interest. Securities borrowing transactions are generally recognized in the consolidated balance sheets at the amount of cash collateral advanced. Allowances for current expected credit losses against collateralized agreements are not typically significant either because of application of practical expedients permitted by ASC 326 based on the collateralization requirements and ongoing monitoring of the collateral levels or the short expected life of the financial instruments.

See Note 5 “Collateralized transactions” for more information about these types of financial instruments.

Loans receivable

The key types of loans receivable recognized by Nomura are loans at banks, short-term secured margin loans and corporate loans.

Loans at banks include both retail and commercial secured loans and traditional unsecured loans mainly extended by The Nomura Trust & Banking Co., Ltd. Where retail and commercial loans are secured by real estate or securities, Nomura is exposed to the risk of a decline in the value of the underlying collateral. Loans at banks also include unsecured commercial loans provided to investment banking clients for relationship purposes. For unsecured commercial loans, Nomura is exposed to risk of default of the counterparty, although these counterparties usually have high or good credit ratings. Where loans are secured by guarantees, Nomura is also exposed to the risk of default by the guarantor.

Short-term secured margin loans include margin loans provided to clients in connection with securities brokerage activities provided by Nomura’s Wealth Management Division. These loans provide funding for clients in order to purchase securities. Nomura requests initial margin in the form of acceptable securities or deposits against these loans and holds the purchased securities as collateral through the life of the loans. If the value of the securities declines by more than specified amounts, Nomura can make additional frequent margin calls in order to maintain a specified loan-to-value (“LTV”) ratio. These clients are required and reasonably expected to continue to replenish the amount of collateral as required by Nomura. Allowances for current expected credit losses against short-term secured margin loans are usually not significant.


215


Table of Contents

NOMURA HOLDINGS, INC.

NOTES TO THE CONSOLIDATED FINANCIAL STATEMENTS—(Continued)


Corporate loans are primarily commercial loans provided to corporate clients excluding loans at banks. Corporate loans include loans secured by real estate or securities and, unsecured commercial loans provided to investment banking clients for relationship purposes. The risk to Nomura of making these loans is similar to those risks arising from commercial loans reported in loans at banks. Advances to affiliated companies include loans to affiliated companies.

The following tables present a summary of loans receivable reported within Loans and receivables or Investments in and advances to affiliated companies in the consolidated balance sheets as of March 31, 2025 and 2026 by portfolio segment.


     Millions of yen  
     March 31, 2025  
     Carried at
amortized cost
     Carried at
fair value(1)
     Total  

Loans receivables


Loans at banks

   ¥ 1,045,787      ¥ —       ¥ 1,045,787  

Short-term secured margin loans

     796,936        —         796,936  

Corporate loans

     2,003,909        2,178,376        4,182,285  


Total loans receivables

   ¥ 3,846,632      ¥ 2,178,376      ¥ 6,025,008  


Advances to affiliated companies

     4,008        4,946        8,954  


Total

   ¥ 3,850,640      ¥ 2,183,322      ¥ 6,033,962  


     Millions of yen  
     March 31, 2026  
     Carried at
amortized cost
     Carried at
fair value(1)
     Total  

Loans receivables


Loans at banks

   ¥ 1,177,435      ¥ —       ¥ 1,177,435  

Short-term secured margin loans

     1,134,393        —         1,134,393  

Corporate loans

     2,649,690        2,783,696        5,433,386  


Total loans receivables

   ¥ 4,961,518      ¥ 2,783,696      ¥ 7,745,214  


Advances to affiliated companies

     4,000        15,554        19,554  


Total

   ¥ 4,965,518      ¥ 2,799,250      ¥ 7,764,768  


(1)

Includes loans receivable and loan commitments carried at fair value through election of the fair value option.

There were no significant purchases or sales of loans receivable during the years ended March 31, 2025 and 2026, respectively.

There were no significant reclassifications of loans receivable to or from trading assets during the year ended March 31, 2025.

There were no reclassifications of loans receivable to or from trading assets during the year ended March 31, 2026.

Net unamortized deferred fees and costs, unamortized premiums and discounts related to loans receivable carried at amortized cost were not significant as of March 31, 2025 and 2026.


216


Table of Contents

NOMURA HOLDINGS, INC.

NOTES TO THE CONSOLIDATED FINANCIAL STATEMENTS—(Continued)


Allowances for current expected credit losses

Management has established allowances for current expected credit losses using the current expected credit losses impairment model (“CECL impairment model”) against the following types of financial instruments, including financing receivables, which are not measured at fair value on a recurring basis, to reflect the net amount Nomura expects to collect:


Loans receivable and HTM debt securities;


Written unfunded loan commitments and other off-balance sheet financial instruments;


Cash deposits;


Collateralized agreements such as reverse repos and securities borrowing transactions;


Customer contract assets and receivables; and


Other receivables including margin receivables, security deposits, default fund contributions to central clearing counterparties, reinsurance benefits, and net investments in finance leases.

Current expected credit losses for an individual or portfolio of financial instrument are measured at each Nomura reporting date based on expected credit losses over the remaining expected life of the financial instruments that consider forecast of future economic conditions in addition to information about past events and current conditions. Key macroeconomic inputs to our weighted average forecasts of three years include GDP and credit spreads.

The risk of loss is considered, even when that risk of loss is remote. While management has based its estimate of the allowances for current expected credit losses on the best information available, future adjustments to the allowances may be necessary as a result of changes in the economic environment or variances between actual results and original assumptions.

Nomura writes off uncollectible accrued interest receivable on a timely basis, and has elected to exclude accrued interest receivable from the amortized cost basis of financial instruments used to measure expected credit losses. The amount of accrued interest receivable as of March 31, 2025 was ¥11,448 million. The amount of accrued interest receivable as of March 31, 2026 was ¥14,409 million.

The methodology used by Nomura to determine allowances for current expected credit losses in accordance with the CECL impairment model primarily depends on the nature of the financial instrument and whether certain practical expedients permitted by ASC 326 are applied.

Financial instruments subject to the CECL impairment model are written off when Nomura has deemed the loan or receivable as uncollectible, namely management believes there is no reasonable expectation of collecting future contractual cash flows and all commercially reasonable means of recovering outstanding principal and interest balances have been exhausted.


217


Table of Contents

NOMURA HOLDINGS, INC.

NOTES TO THE CONSOLIDATED FINANCIAL STATEMENTS—(Continued)


The following table summarizes the methodology used for each significant type of financial instrument subject to the CECL impairment model and the key assumptions used which have impacted the measurement of current expected credit losses during the year ended March 31, 2026.


Financial instrument


Methodology to determine current expected credit losses

Loans, written loan commitments, HTM debt securities, other off-balance sheet financial instruments and certain deposits


Full loss rate model developed by Nomura’s Risk department


Measures expected credit losses based on probability of default (“PD”), Loss Given Default (“LGD”) and Exposure at Default (“EAD”) inputs.


PD inputs incorporate forward-looking scenarios used by Nomura for internal risk management and capital purposes.


Immediate reversion method used for periods beyond which reasonable and supportable forecast is not available.


For financial instruments which have defaulted or are probable of defaulting, expected credit losses measured using discounted cash flow analyses or, where the financial instrument is collateral dependent, based on any shortfall of fair value of the underlying collateral.

Collateralized agreements, short-term secured margin loans and cash prime brokerage loans


For reverse repos and short-term secured margin loans and cash prime brokerage loans where frequent margining is required and the counterparty has ability to replenish margin, as permitted by a practical expedient provided by ASC 326 expected credit losses are limited to difference between carrying value of the reverse repo or margin loan and fair value of underlying collateral.


Securities borrowing transactions typically have very short expected lives and are collateralized and therefore expected credit losses are generally determined qualitatively to be insignificant based on historical experience and consistent monitoring of collateral.

Customer contract assets and receivables


Expected credit losses typically based on aging analysis where loss rates are applied to the carrying value based on historical experience, the current economic climate and specific information about the ability of the client to pay.

See Note 6 “Non-trading investments” for further information with respect to impairment assessment with respect to AFS debt securities.


218


Table of Contents

NOMURA HOLDINGS, INC.

NOTES TO THE CONSOLIDATED FINANCIAL STATEMENTS—(Continued)


The following table presents changes in the allowances for current expected credit losses for the years ended March 31, 2025 and 2026 as determined using the CECL impairment model defined by ASC 326.


     Millions of yen  
     Year ended March 31, 2025  
     Allowances for current expected credit losses against loans     Allowances
against

receivables
other than
loans (1)
    Total
allowances for
current
expected
credit losses
 
     Loans
at banks
    Short-term
secured
margin
loans
     Corporate
loans
    Subtotal  

Opening balance

   ¥ 785     ¥ —       ¥ 1,631     ¥ 2,416     ¥ 15,631     ¥ 18,047  

Provision for credit losses

     100       —         64       164       (876     (712

Write-offs

     —        —         —        —        —        —   

Other(2)

     —        —         (36     (36     (379     (415


Ending balance

   ¥ 885     ¥ —       ¥ 1,659     ¥ 2,544     ¥ 14,376     ¥ 16,920  


     Millions of yen  
     Year ended March 31, 2026  
     Allowances for current expected credit losses against loans     Allowances
against

receivables
other than
loans (1)
    Total
allowances for
current
expected
credit losses
 
     Loans
at banks
    Short-term
secured
margin
loans
     Corporate
loans
    Subtotal  

Opening balance

   ¥ 885     ¥ —       ¥ 1,659     ¥ 2,544     ¥ 14,376     ¥ 16,920  

Provision for credit losses

     (549     —         653       104       192       296  

Write-offs

     —        —         —        —        —        —   

Other(2)

     —        —         139       139       1,026       1,165  


Ending balance

   ¥ 336     ¥ —       ¥ 2,451     ¥ 2,787     ¥ 15,594     ¥ 18,381  


(1)

Includes amounts recognized against collateralized agreements, customer contract assets and receivables and other receivables.

(2)

Primarily includes recoveries and foreign exchange movements. The amounts of recoveries for the years ended March 31, 2025 and 2026 were not significant.


219


Table of Contents

NOMURA HOLDINGS, INC.

NOTES TO THE CONSOLIDATED FINANCIAL STATEMENTS—(Continued)


Modifications of loans from borrowers experiencing financial difficulty

In the ordinary course of business, Nomura may modify loans classified as held for investment either because of financial difficulties of the borrower, or simply as a result of market conditions or for relationship reasons. These modifications occur when Nomura (as lender) for economic or legal reasons related to the borrower’s financial difficulties grants a concession to the borrower including, but not limited to, interest rate reductions, term extensions, other-than-insignificant payment delays and principal forgiveness that would not otherwise have been required under the terms of the original agreement.

Expected credit losses for these types of modification which only involve modification of the loan’s terms (rather than receipt of assets in full or partial satisfaction) are now typically determined using a discounted cash flow analysis. Assets received in full or partial satisfaction of loans from borrowers experiencing financial difficulty are recognized at fair value.

There were no amounts of modifications of loans from borrowers experiencing financial difficulty which occurred during the years ended March 31, 2025 and 2026, respectively.

Nonaccrual and past due loans

Loans are placed on a nonaccrual status if interest is deemed uncollectible. Nomura policy is to define interest as being uncollectible if the borrower is determined to be in financial difficulty or an interest or principal payment on the underlying loan is 90 days or more past due.

Where a loan is placed on a nonaccrual status, any accrued but unpaid interest receivable reversed against revenue and no further accrual of interest is permitted. Interest income is subsequently recognized when a cash payment is received from the borrower using the cash basis method.

Generally loans are only returned to an accrual status if the loan is brought contractually current, i.e., all overdue principal and interest amounts are paid. In limited circumstances, a loan which has not been brought contractually current will also be returned to an accrual status if all principal and interest amounts contractually due are reasonably assured of repayment within a reasonable period of time or there has been a sustained period of repayment performance by the borrower.

As of March 31, 2025 and 2026, the amount of loans which were placed on a nonaccrual status were not significant. The amount of loans which were 90 days past due but were not on a nonaccrual status was not significant.

Credit quality indicators

Nomura is exposed to credit risks due to a decline in the value of loans or a default caused by deterioration of creditworthiness or bankruptcy of the borrower. Nomura’s risk management framework for such credit risks is based on a risk assessment through an internal rating process, in depth pre-financing credit analysis of each individual loan and continuous post-financing monitoring of the borrower’s creditworthiness.


220


Table of Contents

NOMURA HOLDINGS, INC.

NOTES TO THE CONSOLIDATED FINANCIAL STATEMENTS—(Continued)


The following tables present an analysis of each portfolio segment not carried at fair value using Nomura’s internal ratings or equivalent credit quality indicators applied by subsidiaries by years of origination as of March 31, 2025 and 2026.(2)(4)


     Millions of yen  
     As of March 31, 2025  
     Year of origination(3)  
     2025      2024      2023      2022      2021      2020 or
earlier
     Revolving      Total  

Secured loans at banks:


AAA-BBB

   ¥ 119,134      ¥ 231,869      ¥ 2,837      ¥ 7,517      ¥ 5,000      ¥ 23,453      ¥ —       ¥ 389,810  

BB-CCC

     125,213        219,055        15,000        8,439        —         1,151        —         368,858  

CC-D

     —         —         —         —         —         —         —         —   

Others(1)

     —         243,034        —         —         —         —         —         243,034  


Total secured loans at banks

   ¥ 244,347      ¥ 693,958      ¥ 17,837      ¥ 15,956      ¥ 5,000      ¥ 24,604      ¥ —       ¥ 1,001,702  


Unsecured loans at banks:


AAA-BBB

   ¥ 4,500      ¥ 1,377      ¥ 300      ¥ 1,735      ¥ 7,700      ¥ 23,875      ¥ —       ¥ 39,487  

BB-CCC

     703        1,000        756        —         —         2,139        —         4,598  

CC-D

     —         —         —         —         —         —         —         —   

Others

     —         —         —         —         —         —         —         —   


Total unsecured loans at banks

   ¥ 5,203      ¥ 2,377      ¥ 1,056      ¥ 1,735      ¥ 7,700      ¥ 26,014      ¥ —       ¥ 44,085  


Short-term secured margin loans:


AAA-BBB

   ¥ —       ¥ —       ¥ —       ¥ —       ¥ —       ¥ —       ¥ —       ¥ —   

BB-CCC

     —         —         —         —         —         —         —         —   

CC-D

     —         —         —         —         —         —         —         —   

Others(1)

     —         —         —         —         —         474,019        322,917        796,936  


Total short-term secured margin loans

   ¥ —       ¥ —       ¥ —       ¥ —       ¥ —       ¥ 474,019      ¥ 322,917      ¥ 796,936  


Secured corporate loans:


AAA-BBB

   ¥ 58,325      ¥ 289,986      ¥ 266,380      ¥ 89,955      ¥ 90,419      ¥ 159,346      ¥ 385,419      ¥ 1,339,830  

BB-CCC

     1        32,529        50,893        25,157        4,424        41,270        199,701        353,975  

CC-D

     —         —         —         —         —         —         —         —   

Others(1)

     131,132        34,567        —         1,640        —         115        84        167,538  


Total secured corporate loans

   ¥ 189,458      ¥ 357,082      ¥ 317,273      ¥ 116,752      ¥ 94,843      ¥ 200,731      ¥ 585,204      ¥ 1,861,343  


221


Table of Contents

NOMURA HOLDINGS, INC.

NOTES TO THE CONSOLIDATED FINANCIAL STATEMENTS—(Continued)


     Millions of yen  
     As of March 31, 2025  
     Year of origination(3)  
     2025      2024      2023      2022      2021      2020 or
earlier
     Revolving      Total  

Unsecured corporate loans:


AAA-BBB

   ¥ —       ¥ —       ¥ —       ¥ —       ¥ —       ¥ —       ¥ —       ¥ —   

BB-CCC

     —         —         —         —         —         —         —         —   

CC-D

     —         —         —         —         —         —         —         —   

Others

     147        21        119        —         529        141,750        —         142,566  


Total unsecured corporate loans

   ¥ 147      ¥ 21      ¥ 119      ¥ —       ¥ 529      ¥ 141,750      ¥ —       ¥ 142,566  


Advances to affiliated companies


AAA-BBB

   ¥ —       ¥ —       ¥ 8      ¥ 3,000      ¥ 1,000      ¥ —       ¥ —       ¥ 4,008  

BB-CCC

     —         —         —         —         —         —         —         —   

CC-D

     —         —         —         —         —         —         —         —   

Others

     —         —         —         —         —         —         —         —   


Total advances to affiliated companies

   ¥ —       ¥ —       ¥ 8      ¥ 3,000      ¥ 1,000      ¥ —       ¥ —       ¥ 4,008  


Total

   ¥ 439,155      ¥ 1,053,438      ¥ 336,293      ¥ 137,443      ¥ 109,072      ¥ 867,118      ¥ 908,121      ¥ 3,850,640  


(1)

Relates to collateralized exposures where a specified ratio of LTV is maintained.

(2)

The amounts of write offs for the year ended March 31, 2025 were not significant.

(3)

Amounts are presented by calendar year of origination.

(4)

The amounts are aggregated by reference to the year in which the contract became effective, rather than the date of loan drawdown.


222


Table of Contents

NOMURA HOLDINGS, INC.

NOTES TO THE CONSOLIDATED FINANCIAL STATEMENTS—(Continued)


     Millions of yen  
     As of March 31, 2026  
     Year of origination(3)  
     2026      2025      2024      2023      2022      2021 or
earlier
     Revolving      Total  

Secured loans at banks:


AAA-BBB

   ¥ 461,911      ¥ 2,166      ¥ 1,248      ¥ 199      ¥ 10,700      ¥ 13,309      ¥ —       ¥ 489,533  

BB-CCC

     314,914        1,006        —         21,086        —         778        —         337,784  

CC-D

     —         —         —         —         —         —         —         —   

Others(1)

     304,342        —         —         —         —         —         —         304,342  


Total secured loans at banks

   ¥ 1,081,167      ¥ 3,172      ¥ 1,248      ¥ 21,285      ¥ 10,700      ¥ 14,087      ¥ —       ¥ 1,131,659  


Unsecured loans at banks:


AAA-BBB

   ¥ 10,564      ¥ 1,500      ¥ 300      ¥ 835      ¥ 3,988      ¥ 24,529      ¥ —       ¥ 41,716  

BB-CCC

     101        803        1,656        —         —         1,500        —         4,060  

CC-D

     —         —         —         —         —         —         —         —   

Others

     —         —         —         —         —         —         —         —   


Total unsecured loans at banks

   ¥ 10,665      ¥ 2,303      ¥ 1,956      ¥ 835      ¥ 3,988      ¥ 26,029      ¥ —       ¥ 45,776  


Short-term secured margin loans:


AAA-BBB

   ¥ —       ¥ —       ¥ —       ¥ —       ¥ —       ¥ —       ¥ —       ¥ —   

BB-CCC

     —         —         —         —         —         —         —         —   

CC-D

     —         —         —         —         —         —         —         —   

Others(1)

     747,640        —         —         —         —         —         386,753        1,134,393  


Total short-term secured margin loans

   ¥ 747,640      ¥ —       ¥ —       ¥ —       ¥ —       ¥ —       ¥ 386,753      ¥ 1,134,393  


Secured corporate loans:


AAA-BBB

   ¥ 728,870      ¥ 228,451      ¥ 114,889      ¥ 103,943      ¥ 215,395      ¥ 146,352      ¥ 433,637      ¥ 1,971,537  

BB-CCC

     47,531        41,777        57,374        34,605        3,698        9,646        280,651        475,282  

CC-D

     —         —         —         1,944        —         —         —         1,944  

Others(1)

     48,128        —         —         —         —         —         101        48,229  


Total secured corporate loans

   ¥ 824,529      ¥ 270,228      ¥ 172,263      ¥ 140,492      ¥ 219,093      ¥ 155,998      ¥ 714,389      ¥ 2,496,992  


223


Table of Contents

NOMURA HOLDINGS, INC.

NOTES TO THE CONSOLIDATED FINANCIAL STATEMENTS—(Continued)


     Millions of yen  
     As of March 31, 2026  
     Year of origination(3)  
     2026      2025      2024      2023      2022      2021 or
earlier
     Revolving      Total  

Unsecured corporate loans:


AAA-BBB

   ¥ —       ¥ —       ¥ —       ¥ —       ¥ —       ¥ —       ¥ —       ¥ —   

BB-CCC

     —         —         —         —         —         —         —         —   

CC-D

     —         —         —         —         —         —         —         —   

Others

     188        22        —         128        567        151,793        —         152,698  


Total unsecured corporate loans

   ¥ 188     

¥

22


   ¥ —       ¥ 128      ¥ 567      ¥ 151,793      ¥ —       ¥ 152,698  


Advances to affiliated companies


AAA-BBB

   ¥ 1,000      ¥ —       ¥ —       ¥ 3,000      ¥ —       ¥ —       ¥ —       ¥ 4,000  

BB-CCC

     —         —         —         —         —         —         —         —   

CC-D

     —         —         —         —         —         —         —         —   

Others

     —         —         —         —         —         —         —         —   


Total advances to affiliated companies

   ¥ 1,000      ¥ —       ¥ —       ¥ 3,000      ¥ —       ¥ —       ¥ —       ¥ 4,000  


Total

   ¥ 2,665,189      ¥ 275,725      ¥ 175,467      ¥ 165,740      ¥ 234,348      ¥ 347,907      ¥ 1,101,142      ¥ 4,965,518  


(1)

Relates to collateralized exposures where a specified ratio of LTV is maintained.

(2)

The amounts of write offs for the year ended March 31, 2026 were not significant.

(3)

Amounts are presented by fiscal year of origination.

(4)

The amounts are aggregated by reference to the year in which the contract became effective, rather than the date of loan drawdown.


224


Table of Contents

NOMURA HOLDINGS, INC.

NOTES TO THE CONSOLIDATED FINANCIAL STATEMENTS—(Continued)


The following table presents a definition of each of the internal ratings used in the Nomura.


Rating Range   

Definition

AAA    Highest credit quality category. An obligor or facility has extremely strong capacity to meet its financial commitments. ‘AAA range’ is the highest credit rating assigned by Nomura. Extremely low probability of default.
AA    Very high credit quality category. An obligor or facility has very strong capacity to meet its financial commitments. Very low probability of default but higher than that of ‘AAA range.’
A    High credit quality category. An obligor or facility has strong capacity to meet its financial commitments but is somewhat more susceptible to the adverse effects of changes in circumstances and economic conditions than those in higher-rated categories. Low probability of default but higher than that of ‘AA range.’
BBB    Good credit quality category. An obligor or facility has adequate capacity to meet its financial commitments. However, adverse economic conditions or changes in circumstances are more likely to lead to a weakened capacity to meet its financial commitments. Medium probability of default but higher than that of ‘A range.’
BB    Speculative credit quality category. An obligor or facility is less vulnerable in the near term than other lower-ratings. However, it faces major ongoing uncertainties and exposure to adverse business, financial, or economic conditions which could lead to the inadequate capacity to meet its financial commitments. Medium to high probability of default but higher than that of ‘BBB range.’
B    Highly speculative credit quality category. An obligor or facility is more vulnerable than those rated ‘BB range’, but the obligor currently has the capacity to meet its financial commitments. Adverse business, financial, or economic conditions will likely impair the issuer’s or obligor’s capacity or willingness to meet its financial commitments. High probability of default—higher than that of ‘BB range.’
CCC    Substantial credit risk. An obligor or facility is currently vulnerable, and is dependent upon favorable business, financial, and economic conditions to meet its financial commitments. Strong probability of default – higher than that of ‘B range.’
CC    An obligor or facility is currently highly vulnerable to insolvency or is under distressed debt restructuring. Due to insolvency concern or payment failure, a termination notice and close out is initiated. It also includes a solvent obligor past due on financial obligations by more than 3 months. The obligor continues to be a going-concern.
C    An obligor or facility is imminent to file for bankruptcy (i.e. Chapter 11 or equivalent) in the near-term. The going-concern status is about to cease; unless for an extraordinary turnaround event.
D    An Obligor or facility has filed for bankruptcy, administration, receivership, liquidation or other winding up or cessation of business of an obligor or other similar situations. D range includes sale of assets (i.e. loans) at a material loss of more than 30%, or the obligor is externally rated ‘D’ by any Designated External Rating Agencies.

Nomura reviews internal ratings at least once a year by using available credit information of obligors including financial statements and other information. Internal ratings are also reviewed more frequently for high-risk obligors or problematic exposures and any significant credit event of obligors will trigger an immediate credit review process.


225


Table of Contents

NOMURA HOLDINGS, INC.

NOTES TO THE CONSOLIDATED FINANCIAL STATEMENTS—(Continued)


9. Leases:

Nomura as lessor

Nomura leases real estate and aircrafts in Japan and overseas either as head lessor or through subleases. These leases and subleases are primarily classified as operating leases. The related assets are stated at cost, net of accumulated depreciation, except for land, which is stated at cost in the consolidated balance sheets and reported within Other assets-Office buildings, land, equipment and facilities.

The following table presents the types of assets which Nomura leases under operating leases:


     Millions of yen  
     March 31  
     2025      2026  
       Cost        Accumulated
depreciation
    Net carrying
amount
       Cost        Accumulated
depreciation
    Net carrying
amount
 

Real estate(1)

   ¥ 21      ¥ —      ¥ 21      ¥ 10,690      ¥ (6   ¥ 10,684  

Aircraft

     2,757        (127     2,630        50,756        (545     50,211  


Total

   ¥ 2,778      ¥ (127   ¥ 2,651      ¥ 61,446      ¥ (551   ¥ 60,895  


(1)

Cost, accumulated depreciation and net carrying amounts include amounts relating to real estate used by Nomura.

Nomura recognized lease income of ¥1,879 million and ¥1,698 million for the years ended March 31, 2025 and 2026, respectively. These are reported in the consolidated statements of income within RevenueOther.

The following table presents an analysis of future undiscounted lease payments receivable in connection with operating leases entered into by Nomura as lessor over the remaining lease term as of March 31, 2026. Amounts in connection with finance leases were not significant.


     Millions of yen  
   March 31, 2026  
     Minimum lease payments
to be received
 

Years of receipt


Less than 1 year

   ¥ 4,076  

1 to 2 years

     4,142  

2 to 3 years

     3,931  

3 to 4 years

     3,715  

4 to 5 years

     3,715  

More than 5 years

     15,000  


Total

   ¥ 34,579  


Nomura as lessee

Nomura enters into leases of office space, residential facilities for employees, equipment and technology assets in the ordinary course of business in both Japan and overseas as lessee. These arrangements predominantly consist of operating leases. Separately Nomura subleases certain real estate and equipment through operating lease arrangements. The total carrying values of ROU assets recognized in connection with operating leases as of March 31, 2025 and 2026 were ¥156,791 million and ¥138,708 million, respectively. The total carrying values of ROU assets recognized in connection with finance leases as of March 31, 2025 and 2026 were not significant. These lease assets are reported within Other assets-Office buildings, land, equipment and facilities in the consolidated balance sheets.


226


Table of Contents

NOMURA HOLDINGS, INC.

NOTES TO THE CONSOLIDATED FINANCIAL STATEMENTS—(Continued)


The following table presents income and expense amounts recognized through the consolidated statements of income for leases where Nomura is acting as lessee for the years ended March 31, 2025 and 2026. Amounts recognized in the consolidated statements of income in respect of finance lease cost, short-term lease cost, variable lease cost and net gains (losses) on qualifying sale and leaseback transactions were not significant during the years ended March 31, 2025 and 2026.


     Millions of yen  
     Year ended March 31  
     2025      2026  

Lease expense:


Operating lease costs

   ¥ 48,586      ¥ 49,831  

Other income and expenses:


Gross sublease income

   ¥ 1,923      ¥ 1,986  
 

Lease cash flow information

Lease payments made in cash in connection with operating leases are classified as operating activity in the consolidated statements of cash flows. The initial recognition of ROU assets and lease liabilities on lease commencement date represents noncash transactions.

The following table presents cash payments made by Nomura as lessee which meet the definition of lease payments and therefore have been included in the measurement of operating lease liabilities recorded under operating cash flows and the total amount of ROU assets and lease liabilities recognized during the years ended March 31, 2025 and 2026.


     Millions of yen  
     Year ended March 31  
     2025      2026  

Cash flows for operating leases

   ¥ 50,114      ¥ 49,935  

ROU assets recognized in connection with new operating leases

   ¥ 29,148      ¥ 27,167  


227


Table of Contents

NOMURA HOLDINGS, INC.

NOTES TO THE CONSOLIDATED FINANCIAL STATEMENTS—(Continued)


Maturity analysis of lease liabilities

The following table presents an analysis of future undiscounted lease payments under operating leases entered into by Nomura as lessee over the remaining lease term as of March 31, 2026 and also represents a reconciliation between total of such lease payments and the discounted carrying value of operating lease liabilities recognized in the consolidated balance sheets as of March 31, 2026. Finance lease liabilities were not significant as of March 31, 2026. These lease liabilities are reported within Other liabilities in the consolidated balance sheets.


     Millions of yen  
     March 31, 2026  
     Operating leases  

Years of payment


Less than 1 year

   ¥ 49,128  

1 to 2 years

     38,999  

2 to 3 years

     26,827  

3 to 4 years

     17,255  

4 to 5 years

     14,478  

More than 5 years

     26,475  


Total undiscounted lease payments

   ¥ 173,162  

Less: Impact of discounting

     (16,883


Lease liabilities as reported in the consolidated balance sheets

   ¥ 156,279  


The following table presents the weighted-average discount rate used to measure lease liabilities and the weighted-average remaining lease term of operating leases as of March 31, 2025 and 2026.


     Year ended March 31  
     2025     2026  
     Operating leases     Operating leases  

Weighted-average discount rate used to measure lease liabilities

     2.1     3.4

Weighted-average remaining lease term

     5.3 years       4.8 years  


228


Table of Contents

NOMURA HOLDINGS, INC.

NOTES TO THE CONSOLIDATED FINANCIAL STATEMENTS—(Continued)


10. Business combinations:

Macquarie Acquisition

On December 1, 2025, Nomura completed the acquisition of 100% equity interests in Macquarie Management Holdings, Inc., Macquarie Investment Management Holdings (Luxembourg) S.à r.l., and Macquarie Investment Management Holdings (Austria) GmbH for a purchase price of ¥288.8 billion. The acquirees were rebranded as Nomura Management Holdings, Inc., Nomura Investment Management Holdings (Luxembourg) S.à r.l., and Nomura Investment Management Holdings (Austria) GmbH, respectively. The Macquarie Acquisition represents a significant step towards Nomura’s 2030 management vision, resulting in an increase of assets under management as of March 31, 2026, in retail and institutional client assets across equities, fixed income and multi-asset strategies, under Nomura’s global Nomura Asset Management brand.

The following table summarizes the consideration paid for Macquarie and the fair values of key assets acquired and liabilities assumed recognized at acquisition date. The goodwill recognized in connection with the acquisition includes future benefits for Nomura as a result of scale and anticipated synergies from a combined global asset management franchise. Recognized goodwill is not expected to be deductible for tax purpose.


     Millions of yen  
     December 1, 2025  
     Fair values of assets acquired and liabilities assumed  

Finite-lived intangible assets


Client relationships

   ¥ 113,510  

Software

     4,691  

Goodwill

     150,976  

Investments in equity securities for other than operating purposes

     31,334  

Other assets

     17,579  

Deferred tax assets

     11,389  

Other liabilities

     (9,694

Employee Liabilities

     (16,799

Deferred tax liabilities

     (26,001


Total consideration, net of cash acquired

   ¥ 276,985  


     Millions of yen  
     December 1, 2025  
     Summary of consideration, net of cash acquired  

Cash paid

   ¥ 285,021  

Cash acquired

     (11,864

Replacement of share-based payment awards

     3,828  


Total cash (net of cash acquired) and other consideration

   ¥ 276,985  


See Note 11 “Other assetsOffice buildings, land, equipment and facilities and Other / Other liabilities;” for further information about goodwill and identifiable intangible assets related to the Macquarie Acquisition.

Acquisition-related transaction costs of ¥7,034 million incurred in connection with the acquisition have been reported in Non-interest expenses—Other in the consolidated statements of income, ¥1,914 million and ¥5,120 million for the year ended March 31, 2025 and 2026, respectively.


229


Table of Contents

NOMURA HOLDINGS, INC.

NOTES TO THE CONSOLIDATED FINANCIAL STATEMENTS—(Continued)


Subsequent to the closing of the Macquarie Acquisition on December 1, 2025, the acquirees contributed ¥39,891 million of revenue and ¥6,409 million of net income to Nomura’s consolidated group results.

The following unaudited pro forma information presents combined results of operations of the Company as if the Macquarie Acquisition had occurred on April 1, 2024. Such pro forma information is not indicative of the actual results of operations that would have been achieved, nor are they indicative of future results of operations of the combined Company. Similarly, the pro forma combined provision for income taxes may not represent the amount that would have resulted had Nomura and Macquarie filed consolidated tax returns during the years presented.


     Millions of yen  
     2025      2026  

Total revenue

   ¥ 136,649      ¥ 121,359  

Net income attributable to Nomura

   ¥ 16,317      ¥ 21,327  

The following unaudited adjustments and related tax effects have been made to the above pro forma information assuming the acquisition occurred on April 1, 2024:


Employment related expenses of ¥10,739 million and acquisition-related transaction costs of ¥7,099 million have been adjusted to be recognized on April 1, 2024, rather than on or around closing date; and


Amortization of expenses related to amortization of intangible assets recognized as part of the transaction has been adjusted to begin on April 1, 2024, rather than from closing date. Amortization of expenses related to amortization of intangible assets included in the pro forma were ¥10,153 million and ¥10,025 million for the year ended March 31, 2025 and 2026, respectively.


230


Table of Contents

NOMURA HOLDINGS, INC.

NOTES TO THE CONSOLIDATED FINANCIAL STATEMENTS—(Continued)


11. Other assets—Office buildings, land, equipment and facilities and Other / Other liabilities:

Office buildings, land, equipment and facilities

The following table presents a breakdown of owned and leased office buildings, land, equipment and facilities as of March 31, 2025 and 2026.


     Millions of yen  
     March 31  
     2025      2026  

Land

   ¥ 42,934      ¥ 64,327  

Office buildings

     46,173        52,876  

Equipment and facilities

     26,793        80,000  

Software

     143,002        170,292  

Construction in progress

     20,761        37,644  

Operating lease ROU assets

     156,791        138,708  


Total

   ¥ 436,454      ¥ 543,847  


Depreciation and amortization charges are reported within Non-interest expenses—Information processing and communications in the amount of ¥47,714 million, and ¥51,527 million, and in Non-interest expenses—Occupancy and related depreciation in the amount of ¥13,939 million, and ¥13,703 million for the years ended March 31, 2025 and 2026, respectively.

Other assets—Other / Other liabilities

The following table presents components of Other assetsOther and Other liabilities in the consolidated balance sheets as of March 31, 2025 and 2026.


     Millions of yen  
     March 31  
     2025      2026  

Other assets—Other:


Securities received as collateral

   ¥ 382,780      ¥ 504,843  

Goodwill and other intangible assets

     73,345        315,379  

Net deferred tax assets(1)

     25,224        41,778  

Investments in equity securities for other than operating purposes(2)

     302,973        386,473  

Deposit receivables(3)

     214,587        206,563  

Prepaid expenses

     28,003        34,097  

Other

     97,561        109,324  


Total

   ¥ 1,124,473      ¥ 1,598,457  


Other liabilities:


Obligation to return securities received as collateral

   ¥ 382,780      ¥ 504,843  

Accrued income taxes

     88,424        105,154  

Net deferred tax liabilities(1)

     113,820        146,706  

Other accrued expenses and provisions (4)

     551,064        700,592  

Operating lease liabilities

     174,132        156,279  

Other

     146,378        200,061  


Total

   ¥ 1,456,598      ¥ 1,813,635  


(1)

Net deferred tax assets are deferred tax assets offset by deferred tax liabilities which relate to the same tax-paying component within a particular tax jurisdiction. Net deferred tax liabilities are deferred tax liabilities offset by deferred tax assets which relate to the same tax-paying component within a particular tax jurisdiction. See Note 17 “Income taxes” for further information.

(2)

Includes equity securities held for other than trading or operating purposes. These investments comprise listed equity securities and unlisted equity securities of ¥5,889 million and ¥297,085 million, respectively, as of March 31, 2025, and ¥15,776 million and ¥370,642 million, respectively, as of March 31, 2026. These securities are generally carried at fair value, with changes in fair value recognized and reported within RevenueOther in the consolidated statements of income. Also includes equity securities without a readily determinable fair value. See Note 6 “Non-trading investments” for further information.

(3)

Includes Japan Securities Clearing Corporation’s clearing fund.

(4)

Includes a liability of ¥14,240 million and ¥13,077 million as of March 31, 2025 and 2026, respectively, in respect of all outstanding and unsettled investigations, lawsuits and other legal proceedings where loss is considered probable and the amount of such loss can be reasonably estimated. See Note 22 “Commitments, contingencies and guarantees” for further information.


231


Table of Contents

NOMURA HOLDINGS, INC.

NOTES TO THE CONSOLIDATED FINANCIAL STATEMENTS—(Continued)


Goodwill

Goodwill is recognized upon completion of a business combination as the difference between the purchase price and the fair value of the net assets acquired. Subsequent to initial recognition, goodwill is not amortized but is tested for impairment during the fourth quarter of each fiscal year, or more often if events or circumstances, such as adverse changes in the business climate, indicate there may be impairment.

Impairment testing of goodwill is inherently subjective and often requires management judgment to determine when to perform an impairment test, whether qualitatively the fair value of a reporting unit exceeds its carrying value and also to estimate the fair value of a reporting unit when a quantitative impairment test is required.

An annual goodwill impairment test was performed in the quarter ended March 31, 2025 and 2026.

The following tables present changes in goodwill, which are reported in the consolidated balance sheets within Other assetsOther for the years ended March 31, 2025 and 2026.


     Millions of yen  
     Year ended March 31, 2025  
     Beginning of year      Changes during year     End of year  
     Gross
carrying
amount
     Accumulated
Impairment
    Net carrying
amount
     Acquisition      Impairment     Other(1)     Gross
carrying
amount
     Accumulated
Impairment
    Net carrying
amount
 

Investment Management(2)

   ¥ —       ¥ —      ¥ —       ¥ —       ¥ —      ¥ —      ¥ —       ¥ —      ¥ —   

Wholesale

     112,379        (93,537     18,842        —         —        (2,061     110,318        (93,537     16,781  

Other

     418        —        418        —         —        —        418        —        418  


Total

   ¥ 112,797      ¥ (93,537   ¥ 19,260      ¥ —       ¥ —      ¥ (2,061   ¥ 110,736      ¥ (93,537   ¥ 17,199  


     Millions of yen  
     Year ended March 31, 2026  
     Beginning of year      Changes during year     End of year  
     Gross
carrying
amount
     Accumulated
Impairment
    Net carrying
amount
     Acquisition      Impairment(3)     Other(1)     Gross
carrying
amount
     Accumulated
Impairment
    Net carrying
amount
 

Investment Management(2)

   ¥ —       ¥ —      ¥ —       ¥ 150,976      ¥ —      ¥ 3,128     ¥ 154,104      ¥ —      ¥ 154,104  

Wholesale

     110,318        (93,537     16,781        —         —        1,189       111,507        (93,537     17,970  

Other

     418        —        418        35        (35     —        453        (35     418  


Total

   ¥ 110,736      ¥ (93,537   ¥ 17,199      ¥ 151,011      ¥ (35   ¥ 4,317     ¥ 266,064      ¥ (93,572   ¥ 172,492  


(1)

Includes currency translation adjustments.

(2)

Nomura recognized goodwill in December 2025 as a result of the Macquarie Acquisition. See Note 10 “Business Combinations” for further information.

(3)

The impairment recognized during the current period was not a significant amount.


232


Table of Contents

NOMURA HOLDINGS, INC.

NOTES TO THE CONSOLIDATED FINANCIAL STATEMENTS—(Continued)


Finite-lived and indefinite-lived intangible assets

As discussed in Note 10 “Business Combinations” to the Consolidated Financial Statements, the Company completed the Macquarie Acquisition on December 1, 2025, which resulted in the recognition of certain identifiable intangible assets.

The following table presents finite-lived intangible assets by type as of March 31, 2025 and 2026.


     Millions of yen  
     March 31, 2025      March 31, 2026  
     Gross
carrying
amount
     Accumulated
amortization
    Net
carrying

amount
     Gross
carrying
amount
     Accumulated
amortization
    Net
carrying

amount
 

Client relationships(1)

   ¥ 77,736      ¥ (75,382   ¥ 2,354      ¥ 197,727      ¥ (84,144   ¥ 113,583  

Other

     3,218        (2,549     669        3,513        (2,965     548  


Total

   ¥ 80,954      ¥ (77,931   ¥ 3,023      ¥ 201,240      ¥ (87,109   ¥ 114,131  


(1)

Client relationships as of March 31, 2026 include intangible assets with a net carrying value of ¥112,659 million as of March 31, 2026 related to the Macquarie Acquisition described in Note 10 “Business Combinations” to the consolidated financial statements, weighted average amortization period for the corresponding intangible assets is 12 years.

Amortization expenses for the years ended March 31, 2025 and 2026 were ¥2,552 million and ¥4,854 million, respectively. Estimated amortization expenses for the next five years are shown below.


     Millions of yen  

Year ending March 31

   Estimated
amortization expense
 

2027

   ¥ 10,300  

2028

     9,752  

2029

     9,752  

2030

     9,752  

2031

     9,752  

The amounts of indefinite-lived intangibles, which primarily includes crypto assets and trademarks, were ¥53,123 million and ¥28,756 million as of March 31, 2025 and 2026, respectively.

An annual impairment test was performed during the years ended March 31, 2025 and 2026 against these intangibles. The estimated fair value of each intangible exceeded carrying value and therefore no impairment loss was recognized.

Asset retirement obligations

Nomura recognizes a liability in the consolidated balances within Other liabilities – Other in respect of legal obligations incurred in connection with the restoration of leased property to its original condition at the end of the lease term. These asset retirement obligations (“AROs”) are recognized in the period when the legal obligation is incurred and are measured at the present value of the expected cost of the obligation.

The following table presents changes in AROs during the years ended March 31, 2025 and 2026.


     Millions of yen  
     March 31  
     2025     2026  

Balance at beginning of year

   ¥ 15,512     ¥ 16,193  

Provision for the year

     161       757  

Settled during the year

     (413     (233

Revisions in estimated cash flows

     933       5,219  


Balance at end of year

   ¥ 16,193     ¥ 21,936  


233


Table of Contents

NOMURA HOLDINGS, INC.

NOTES TO THE CONSOLIDATED FINANCIAL STATEMENTS—(Continued)


12. Deposits received at banks

Noninterest-bearing deposits and interest-bearing deposits

The following table presents deposit liabilities both domestically in Japan and overseas as of March 31, 2025 and 2026 analyzed between those which are interest and non-interesting bearing in nature.


     Millions of yen  
     March 31  
     2025      2026  

Domestic


Noninterest-bearing deposits

   ¥ 28,627      ¥ 26,266  

Interest-bearing deposits

     1,477,496        1,529,663  


Subtotal

   ¥ 1,506,123      ¥ 1,555,929  


Foreign


Noninterest-bearing deposits

   ¥ —       ¥ 28,431  

Interest-bearing deposits

     1,599,458        2,082,730  


Subtotal

   ¥ 1,599,458      ¥ 2,111,161  


Total

   ¥ 3,105,581      ¥ 3,667,090  


Remaining maturities of time deposits and certificates of deposits

The following table presents the total balance of time deposits and certificates of deposit issued both domestically in Japan and overseas as of March 31, 2026 by remaining maturity.


     Millions of yen  
     Time
deposits
     Certificates of
deposit
     Total  

Domestic


Due in one year or less

   ¥ 663,061      ¥ 351,219      ¥ 1,014,280  

Due after one year through two years

     40,861        —         40,861  

Due after two years through three years

     12,830        —         12,830  

Due after three years through four years

     2,825        —         2,825  

Due after four years through five years

     1,516        —         1,516  

Due after five years

     197,301        —         197,301  


Subtotal

   ¥ 918,394      ¥ 351,219      ¥ 1,269,613  


Foreign


Due in one year or less

   ¥ 1,339,326      ¥ —       ¥ 1,339,326  

Due after one year through two years

     15,610        —         15,610  


Subtotal

   ¥ 1,354,936      ¥ —       ¥ 1,354,936  


Total

   ¥ 2,273,330      ¥ 351,219      ¥ 2,624,549  


Uninsured time deposits and certificate of deposits

The total amounts of uninsured time deposit liabilities as of March 31, 2025 and 2026 were ¥1,918 billion and ¥2,530 billion, respectively. This amount is determined as the total portion of the outstanding time deposit balance which is not protected by a statutory deposit insurance regime in the jurisdiction in which the deposit is held. Such insurance regimes typically only protect certain types of deposit and also only up to a specific amount invested by each client.


234


Table of Contents

NOMURA HOLDINGS, INC.

NOTES TO THE CONSOLIDATED FINANCIAL STATEMENTS—(Continued)


13. Borrowings:

The following table presents short-term and long-term borrowings of Nomura as of March 31, 2025 and 2026.


     Millions of yen  
     March 31  
     2025      2026  

Short-term borrowings(1):


Commercial paper

   ¥ 113,765      ¥ 90,795  

Bank borrowings

     341,561        700,802  

Other

     661,966        961,072  


Total

   ¥ 1,117,292      ¥ 1,752,669  


Long-term borrowings:


Long-term borrowings from banks and other financial institutions(2)

   ¥ 4,213,264      ¥ 5,165,056  

Bonds and notes issued(3):


Fixed-rate obligations:


Japanese Yen denominated

     1,170,404        1,116,741  

Non-Japanese Yen denominated

     4,778,830        5,724,325  

Floating-rate obligations:


Japanese Yen denominated

     603,794        522,891  

Non-Japanese Yen denominated

     708,559        841,213  

Index / Equity-linked obligations:


Japanese Yen denominated

     926,572        941,444  

Non-Japanese Yen denominated

     510,126        687,917  


     8,698,285        9,834,531  


Subtotal

     12,911,549        14,999,587  


Trading balances of secured borrowings

     462,129        545,369  


Total

   ¥ 13,373,678      ¥ 15,544,956  


(1)

Includes secured borrowings of ¥119,682 million and ¥113,315 million as of March 31, 2025 and March 31, 2026 respectively.

(2)

Includes secured borrowings of ¥472,328 million and ¥670,182 million as of March 31, 2025 and March 31, 2026 respectively.

(3)

Includes secured borrowings of ¥811,118 million and ¥720,958 million as of March 31, 2025 and March 31, 2026 respectively.

Trading balances of secured borrowings

These are liabilities recognized when a transfer of a financial asset does not meet the criteria for sales accounting under ASC 860 and therefore the transaction is accounted for as a secured borrowing. These borrowings are part of Nomura’s trading activities intended to generate profits from the distribution of financial products secured by those financial assets.

Long-term borrowings consisted of the following:


     Millions of yen  
     March 31  
     2025      2026  

Debt issued by the Company

   ¥ 3,465,010      ¥ 3,872,736  

Debt issued by subsidiaries—guaranteed by the Company(1)

     6,568,898        7,923,892  

Debt issued by subsidiaries—not guaranteed by the Company(1)

     3,339,770        3,748,328  


Total

   ¥ 13,373,678      ¥ 15,544,956  


(1)

Includes trading balances of secured borrowings.

As of March 31, 2025, fixed-rate long-term borrowings mature between 2025 and 2067 with interest rates (including contractual interest rates) ranging from 0.00% to 44.00%. Floating-rate obligations, excluding perpetual subordinated debts, which are generally based on TIBOR, Tokyo Overnight Average rate and Secured Overnight Financing Rate, mature between 2025 and 2069 with interest rates (including contractual interest rates) ranging from 0.00% to 17.00%. Index / Equity-linked obligations mature between 2025 and 2055 with interest rates (including contractual interest rates) ranging from 0.00% to 36.80%.

As of March 31, 2026, fixed-rate long-term borrowings mature between 2026 and 2067 with interest rates (including contractual interest rates) ranging from 0.00% to 37.10%. Floating-rate obligations, excluding perpetual subordinated debts, which are generally based on TIBOR, Tokyo Overnight Average rate and Secured Overnight Financing Rate, mature between 2026 and 2070 with interest rates (including contractual interest rates) ranging from 0.00% to 12.89%. Index / Equity-linked obligations mature between 2026 and 2056 with interest rates (including contractual interest rates) ranging from 0.00% to 45.00%.


235


Table of Contents

NOMURA HOLDINGS, INC.

NOTES TO THE CONSOLIDATED FINANCIAL STATEMENTS—(Continued)


Certain borrowing agreements contain provisions whereby the borrowings are redeemable at the option of the borrower at specified dates prior to maturity and include various equity-linked or other index-linked instruments.

Nomura enters into swap agreements to manage its exposure to interest rates and foreign exchange rates. Debt securities and notes issued are typically converted to Tokyo Overnight Average rate and Secured Overnight Financing Rate-based floating rate obligations through such swap agreements. The carrying value of the long-term borrowings includes adjustments to reflect fair value hedges.

The following table presents the effective weighted-average interest rates of borrowings, including the effect of fair value hedges, as of March 31, 2025 and 2026.


     March 31  
     2025     2026  

Short-term borrowings

     2.77     2.75

Long-term borrowings

     3.19     3.01

Fixed-rate obligations

     3.77     3.28

Floating-rate obligations

     2.74     2.78

Index / Equity-linked obligations

     1.99     2.52

Maturities of long-term borrowings

The following table presents the aggregate annual maturities of long-term borrowings, including adjustments related to fair value hedges and liabilities measured at fair value, as of March 31, 2026:


Year ending March 31

   Millions of yen  

2027

   ¥ 1,431,899  

2028

     1,759,717  

2029

     1,862,534  

2030

     1,754,773  

2031

     1,973,293  

2032 and thereafter

     6,217,371  


Subtotal

     14,999,587  


Trading balances of secured borrowings

     545,369  


Total

   ¥ 15,544,956  


Borrowing facilities

As of March 31, 2025 and 2026, Nomura had unutilized borrowing facilities of ¥nil and ¥nil, respectively.

Subordinated borrowings

As of March 31, 2025 and 2026, subordinated borrowings were ¥414,500 million and ¥874,309 million, respectively.


236


Table of Contents

NOMURA HOLDINGS, INC.

NOTES TO THE CONSOLIDATED FINANCIAL STATEMENTS—(Continued)


14. Earnings per share:

Basic and diluted earnings per share (“EPS”) are presented on the face of the consolidated statements of income. Basic EPS is calculated by dividing net income attributable to NHI shareholders by the weighted average number of NHI shares outstanding during the year. The calculation of diluted EPS is similar to basic EPS, except that the weighted average number of NHI shares is adjusted to reflect all dilutive instruments where NHI shares is potentially deliverable during the year. In addition, net income attributable to NHI shareholders is adjusted for any change in income or loss that would result from the assumed conversion of dilutive instruments issued by subsidiaries and affiliates.

The following table presents a reconciliation of net income amounts and the numbers of NHI shares used in the calculation of net income attributable to NHI shareholders per share in order to calculate basic and diluted earnings per share amounts for the years ended March 31, 2025 and 2026.


     Millions of yen
except per share data presented in yen
 
     Year ended March 31  
     2025      2026  

Basic—


Net income attributable to NHI shareholders

   ¥ 340,736      ¥ 362,129  


Weighted average number of NHI shares outstanding

     2,955,204,882        2,942,280,410  


Net income attributable to NHI shareholders per share

   ¥ 115.30      ¥ 123.08  


Diluted—


Net income attributable to NHI shareholders

   ¥ 340,463      ¥ 361,871  


Weighted average number of NHI shares outstanding

     3,066,458,811        3,041,190,068  


Net income attributable to NHI shareholders per share

   ¥ 111.03      ¥ 118.99  


Net income attributable to NHI shareholders was adjusted to reflect the decline in Nomura’s equity share of earnings of subsidiaries and affiliates for the years ended March 31, 2025 and 2026 arising from options to purchase common stock issued by subsidiaries and affiliates.

For the years ended March 31, 2025 and 2026, the weighted average number of shares used in the calculation of diluted EPS reflects the potential issuance of shares under the stock-based compensation plans, which grant Stock Acquisition Rights, Restricted Stock Units (“RSUs”), and Performance Share units (“PSUs”); however, the impact on EPS is minimal.

There were no such shares outstanding for the years ended March 31, 2025 and 2026.

Subsequent Events

On May 14, 2026, the Company adopted a resolution to grant RSUs and PSUs. See Note 16 “Deferred compensation awards” for further information.


237


Table of Contents

NOMURA HOLDINGS, INC.

NOTES TO THE CONSOLIDATED FINANCIAL STATEMENTS—(Continued)


15. Employee benefit plans:

Nomura provides various pension plans and other post-retirement benefits which cover certain eligible employees worldwide. In addition, Nomura provides health care benefits to certain active and retired employees through its Nomura Securities Health Insurance Society (“NSHIS”).

Defined benefit pension plans—

The Company and certain subsidiaries in Japan (“Japanese entities”) have contributory funded benefit pension plans for eligible employees. The benefits are paid as annuity payments subsequent to retirement or as lump-sum payments at the time of retirement based on a combination of years of service, age at retirement and employee’s choice. The benefits under the plans are calculated based upon position, years of service and reason for retirement. In addition to the plans described above, certain Japanese entities also have unfunded lump-sum payment plans. Under these plans, employees with at least two years of service are generally entitled to lump-sum payments upon termination of employment. The benefits under the plans are calculated based upon position, years of service and the reason for retirement. In December 2008, certain contributory funded benefit pension plans and unfunded lump-sum payment plans were amended and “Cash balance pension plans” were introduced. Participants receive an annual benefit in their cash balance pension plan accounts, which is computed based on compensation of the participants, adjusted for the changes in market interest rate.

In April 2020, certain Japanese entities amended their pension plans. Certain defined benefit pension plans and unfunded lump-sum payment plans were either closed for additional funding or abolished. Defined contribution pension plans and cash balance pension plans have replaced them for future contributions.

Certain overseas subsidiaries have various local defined benefit plans covering certain employees. Nomura recognized an asset for surplus pension benefits for these plans amounting to ¥5,798 million and ¥726 million as of March 31, 2025 and 2026, respectively.

Net periodic benefit cost

The following table presents the components of net periodic benefit cost for defined benefit plans of Japanese entities for the years ended March 31, 2025 and 2026. Nomura’s measurement date is March 31 for defined benefit plans of Japanese entities.


     Millions of yen  
     Year ended March 31  
     2025     2026  

Service cost

   ¥ 5,748     ¥ 5,404  

Interest cost

     4,039       5,056  

Expected return on plan assets

     (5,664     (5,369

Amortization of net actuarial losses

     1,844       798  

Amortization of prior service cost

     (441     (541


Net periodic benefit cost

   ¥ 5,526     ¥ 5,348  


Prior service cost is amortized on a straight-line basis over the average remaining service period of active participants. Gains and losses in excess of 10% of the greater of the projected benefit obligation or the fair value of plan assets are amortized over the average remaining service period of active participants, which is 12 years.


238


Table of Contents

NOMURA HOLDINGS, INC.

NOTES TO THE CONSOLIDATED FINANCIAL STATEMENTS—(Continued)


Benefit obligations and funded status

The following table presents a reconciliation of changes in projected benefit obligation (“PBO”) and the fair value of plan assets, as well as a summary of the funded status of Japanese entities’ plans as of, and for the years ended March 31, 2025 and 2026.


     Millions of yen  
     As of or for the year ended March 31  
     2025     2026  

Change in projected benefit obligation:


Projected benefit obligation at beginning of year

   ¥ 245,439     ¥ 218,187  

Service cost

     5,748       5,404  

Interest cost

     4,039       5,056  

Actuarial gain

     (19,012     (13,512

Benefits paid

     (17,137     (16,842

Amendments of pension benefit plans

     (883     —   

Acquisition, divestitures and other

     (7     1  


Projected benefit obligation at end of year

   ¥ 218,187     ¥ 198,294  


Change in plan assets:


Fair value of plan assets at beginning of year

   ¥ 219,869     ¥ 208,523  

Actual return on plan assets

     (364     6,023  

Employer contributions

     748       —   

Benefits paid

     (11,730     (12,178


Fair value of plan assets at end of year

   ¥ 208,523     ¥ 202,368  


Funded status at end of year

     (9,664     4,074  


Amounts recognized in the consolidated balance sheets

   ¥ (9,664   ¥ 4,074  


The accumulated benefit obligation (“ABO”) was ¥218,187 million and ¥198,294 million as of March 31, 2025 and 2026, respectively.

In April 2020, defined contribution pension plans and cash balance pension plans were adopted for future contributions following the amendments of pension benefit plans. Certain contributory defined benefit pension plans were closed for additional funding and will be managed within the accumulated funds. Unfunded lump-sum payment plans were abolished and transferred to cash balance plans with the calculated amount of lump-sum retirement payment as of the amendment date.

The following table presents the PBO, ABO and fair value of plan assets for Japanese entities’ plans with ABO and PBO in excess of plan assets as of March 31, 2025 and 2026.


     Millions of yen  
     March 31  
        2025            2026     

Plans with ABO in excess of plan assets:


PBO

   ¥ 45,064      ¥ 45,356  

ABO

     45,064        45,356  

Fair value of plan assets

     —         —   

Plans with PBO in excess of plan assets:


PBO

   ¥ 45,064      ¥ 45,356  

ABO

     45,064        45,356  

Fair value of plan assets

     —         —   


239


Table of Contents

NOMURA HOLDINGS, INC.

NOTES TO THE CONSOLIDATED FINANCIAL STATEMENTS—(Continued)


The following table presents pre-tax amounts of Japanese entities’ plans deferred in Accumulated other comprehensive income (loss) that have not yet been recognized as components of net periodic benefit cost during the year ended March 31, 2026.


       Millions of yen    
     For the year ended
March 31, 2026
 

Net actuarial loss

   ¥ 13,560  

Net prior service cost

     (4,693


Total

   ¥ 8,867  


Pre-tax amounts of Japanese entities’ plans in Accumulated other comprehensive income which are expected to be recognized as components of net periodic benefit cost over the next fiscal year are as follows.


       Millions of yen    
     For the year ending
March 31, 2027
 

Net actuarial loss

   ¥ (217

Net prior service cost

     (541


Total

   ¥ (758


Assumptions

The following table presents the weighted-average assumptions used to determine projected benefit obligations of Japanese entities’ plans as of March 31, 2025 and 2026.


         March 31      
     2025     2026  

Discount rate

     2.3     3.2

Rate of increase in compensation levels

     0.5     0.4

Interest crediting rate

     2.9     2.9

The following table presents the weighted-average assumptions used to determine the net periodic benefit cost of Japanese entities’ plans for the year ended March 31, 2025 and 2026.


      Year ended March 31   
     2025     2026  

Discount rate

     1.6     2.3

Rate of increase in compensation levels

     0.5     0.5

Expected long-term rate of return on plan assets

     2.6     2.6

Interest crediting rate

     2.8     2.9

Nomura generally determines the discount rates for its defined benefit plans by referencing indices for long-term, high-quality debt securities and ensuring that the discount rate does not exceed the yield reported for those indices after adjustment for the duration of the plans’ liabilities.

Nomura uses the expected long-term rate of return on plan assets to compute the expected return on assets. Nomura’s approach in determining the long-term rate of return on plan assets is primarily based on historical financial market relationships that have existed over time with the presumption that this trend will generally remain constant in the future.


240


Table of Contents

NOMURA HOLDINGS, INC.

NOTES TO THE CONSOLIDATED FINANCIAL STATEMENTS—(Continued)


Plan assets

Plan assets are managed with an objective to generate sufficient long-term value in order to enable future pension payouts. While targeting a long-term rate of return on plan assets, Nomura aims to minimize short-term volatility by managing the portfolio through diversifying risk. Based on this portfolio policy, the plan assets are invested diversely.

The plan assets of domestic plans target to invest 8% in equities (including private equity investments), 50% in debt securities, 28% in life insurance company general accounts, and 14% in other investments. Investment allocations are generally reviewed and revised at the time of the actual revaluation that takes place every five years or when there is a significant change in portfolio assumptions.

For details of the levels of inputs used to measure the fair value of plan assets, see Note 2 “Fair value measurements.

The following tables present information about the fair value of plan assets of Japanese entities’ plans as of March 31, 2025 and 2026 within the fair value hierarchy.


     Millions of yen  
     March 31, 2025  
     Level 1      Level 2      Level 3      Balance as of
March 31, 2025
 

Pension plan assets:


Private equity and pooled investments(1)

   ¥ —       ¥ 1,545      ¥ 9,418      ¥ 10,963  

Japanese government securities

     24,713        —         —         24,713  

Investment trust funds and other(2)(3)

     —         10,535        20,296        30,831  

Life insurance company general accounts

     —         75,067        —         75,067  

Other assets

     —         31,420        —         31,420  


Total

   ¥ 24,713      ¥ 118,567      ¥ 29,714      ¥ 172,994  


     Millions of yen  
     March 31, 2026  
     Level 1      Level 2      Level 3      Balance as of
March 31, 2026
 

Pension plan assets:


Private equity and pooled investments(1)

   ¥ —       ¥ 584      ¥ 9,139      ¥ 9,723  

Japanese government securities

     19,954        —         —         19,954  

Investment trust funds and other(2)(3)

     —         10,026        20,739        30,765  

Life insurance company general accounts

     —         74,968        —         74,968  

Other assets

     —         28,866        —         28,866  


Total

   ¥ 19,954      ¥ 114,444      ¥ 29,878      ¥ 164,276  


(1)

Includes corporate type equity investments.

(2)

Includes primarily debt investment funds. Hedge funds and real estate funds are also included.

(3)

Certain plan assets that are carried at fair value using net asset value per share as a practical expedient have not been classified in the fair value hierarchy. As of March 31, 2025 and 2026, the fair value of these assets was ¥35,529 million and ¥38,092 million, respectively.


241


Table of Contents

NOMURA HOLDINGS, INC.

NOTES TO THE CONSOLIDATED FINANCIAL STATEMENTS—(Continued)


Within the fair value measurement of plan assets of non-Japanese entities’ plans as of March 31, 2025, ¥133 million, ¥3,102 million and ¥24,121 million were classified in Level 1, Level 2 and Level 3 of the fair value hierarchy, respectively. Within the fair value measurement of plan assets of non-Japanese entities’ plans as of March 31, 2026, ¥242 million, ¥3,098 million and ¥24,148 million were classified in Level 1, Level 2 and Level 3 of the fair value hierarchy, respectively.

See Note 2 “Fair value measurements” for further information regarding how Nomura estimates fair value for specific types of financial instruments.

The following tables present information about plan assets of Japanese entities’ plans for which Nomura has utilized significant Level 3 valuation inputs to estimate fair value.


     Millions of yen  
     Year ended March 31, 2025  
     Balance
as of
April 1, 2024
     Unrealized
and realized
gains / (loss)
    Purchases /
sales and
other
settlement
    Balance
as of
March 31,
2025
 

Private equity and pooled investments

   ¥ 16,321      ¥ (3,608   ¥ (3,295   ¥ 9,418  

Investment trust funds and other

     27,022        (1,245     (5,481     20,296  


Total

   ¥ 43,343      ¥ (4,853   ¥ (8,776   ¥ 29,714  


     Millions of yen  
     Year ended March 31, 2026  
     Balance
as of
April 1, 2025
     Unrealized
and realized
gains / (loss)
     Purchases /
sales and
other
settlement
    Balance
as of
March 31,
2026
 

Private equity and pooled investments

   ¥ 9,418      ¥ 415      ¥ (694   ¥ 9,139  

Investment trust funds and other

     20,296        1,215        (772     20,739  


Total

   ¥ 29,714      ¥ 1,630      ¥ (1,466   ¥ 29,878  


The fair value measurement of plan assets of non-Japanese entities’ plans classified as Level 3 mainly consists of annuities which amounted to ¥24,121 million and ¥24,148 million as of March 31, 2025 and 2026, respectively. The amount of unrealized gain (loss) of Level 3 assets amounted to ¥(4,836) million and ¥(796) million for the years ended March 31, 2025 and 2026, respectively. The amounts of gains and losses other than above, purchases and sales, and transfers between Level 1 or Level 2 and Level 3 relating to these assets during the years ended March 31, 2025 and 2026 were not significant.

Cash Flows

Following the amendments of pension benefit plans in Japanese entities, certain contributory funded benefit pension plans were closed for additional funding and will be managed within the accumulated funds.

The following table presents the expected benefit payments of Japanese entities’ plans during the next five fiscal years and in aggregate for the five fiscal years thereafter.


Year ending March 31

   Millions of yen  

2027

   ¥ 16,926  

2028

     16,288  

2029

     14,758  

2030

     13,291  

2031

     12,450  

2032-2036

     57,471  


242


Table of Contents

NOMURA HOLDINGS, INC.

NOTES TO THE CONSOLIDATED FINANCIAL STATEMENTS—(Continued)


Defined contribution pension plans—

In addition to defined benefit pension plans, the Company, NSC and other Japanese and non-Japanese subsidiaries have defined contribution pension plans.

Nomura contributed ¥6,681 million and ¥7,049 million to defined contribution pension plans for Japanese entities’ plans for the years ended March 31, 2025 and 2026, respectively.

The contributions to overseas defined contribution pension plans were ¥15,179 million and ¥21,674 million for the years ended March 31, 2025 and 2026, respectively.

Health care benefits—

The Company and certain subsidiaries provide certain health care benefits to both active and retired employees through NSHIS. The Company and certain subsidiaries also sponsor certain health care benefits to retired employees (“Special Plan”) and who participate in the Special Plan on a pay-all basis, i.e., by requiring a retiree contribution based on the estimated per capita cost of coverage. The Special Plan is a multi-employer post-retirement plan because it is jointly administered by NSHIS and the Japanese government, and the funded status of it is not computed separately. Therefore, although the Company and certain subsidiaries contribute some portion of the cost of retiree health care benefits not covered through retiree contributions, the Company and certain subsidiaries do not reserve for future costs. The health care benefit costs, which are equivalent to the required contribution, were ¥10,066 million and ¥10,146 million for the years ended March 31, 2025 and 2026, respectively.


243


Table of Contents

NOMURA HOLDINGS, INC.

NOTES TO THE CONSOLIDATED FINANCIAL STATEMENTS—(Continued)


16. Deferred compensation awards:

Nomura issues deferred compensation awards to senior management and employees, which are linked to the price of the Company’s common stock, in order to retain and motivate key staff. These stock-based compensation awards comprise Restricted Stock Units (“RSUs”), Performance Share Units (“PSUs”), Stock Acquisition Rights (“SARs”) Plan B, Notional Stock Units (“NSUs”), and Collared Notional Stock Units (“CSUs”). They are all analogous to awards of restricted common stock. As of March 31, 2026, the numbers of outstanding shares and the total unrecognized compensation cost of PSUs were not significant.

Nomura also issues other deferred compensation awards that are not linked to the Company’s common stock, namely Notional Fund Units, which are based on the performance of funds managed by the Company, and Deferred Cash Awards (“DCAs”), which vest annually in equal increments over a period of three to four years.

Certain deferred compensation awards include Full Career Retirement (“FCR”) provisions which permit recipients of the awards to continue to vest in the awards upon voluntary termination of employment if certain criteria based on corporate title and length of service within Nomura are met. The requisite service period for these awards ends on the earlier of the contractual vesting date and the date that the recipients become eligible for or claim FCR.

Unless indicated below, deferred compensation awards are generally reduced, forfeited or clawed back in the event of termination of employment, material restatements of financial statements, material conduct issues, material damage to Nomura’s business or reputation, material downturns in the performance of the Nomura group and/or a material failure of risk management.

RSUs

For each of the RSUs, one NHI share is delivered. The awards generally have a graded vesting period from one to three years with an extended vesting period of up to seven years for certain senior management and employees in order to meet local regulatory requirements based on the role they perform within Nomura.

The grant date fair value per award is determined using the price of NHI shares.

The following table presents activity relating to RSUs for the year ended March 31, 2026.


     Outstanding
(number of Nomura
shares)
    Weighted-average
grant date fair
value per share
     Weighted-average
remaining life
until expiry
(years)
 

Outstanding as of March 31, 2025

     136,203,210     ¥ 598        0.9  

Granted

     62,190,310       811     

Forfeited

     (6,206,885     680     

Delivered

     (66,303,810     598     


Outstanding as of March 31, 2026

     125,882,825     ¥ 699        1.0  


The weighted-average grant date fair value per award for the year ended March 31, 025 and 2026 was ¥857 and ¥811, respectively.

The total fair value of RSUs vested during the years ended March 31, 2025 and 2026 was ¥62,719 million and ¥56,751 million, respectively. The total value of units delivered during the year ended March 31, 2025 was ¥63,041 million. A total of 43,567,027 shares were delivered during the year ended March 31, 2026 with a total value of ¥56,928 million. The aggregate value of RSUs outstanding as of March 31, 2026 was ¥151,563 million.

As of March 31, 2026, total unrecognized compensation cost relating to nonvested RSUs was ¥16,425 million which is expected to be recognized over a weighted average period of 1.8 years.

Nomura withholds vested RSUs to meet employer statutory tax withholding requirements of employees arising on either vesting of the awards or delivery of the Company’s common stock. The total cash paid to tax authorities to settle these requirements was ¥20,583 million and ¥18,214 million during the years ended March 31, 2025 and 2026. These cash flows are classified as outflows from financing activities in the consolidated statements of cash flows.


244


Table of Contents

NOMURA HOLDINGS, INC.

NOTES TO THE CONSOLIDATED FINANCIAL STATEMENTS—(Continued)


SARs Plan B

In prior years, the Company issued SARs Plan B linked to the price of the Company’s common stock pursuant to several stock unit plans. These awards vest and are exercisable into the Company’s common stock, have an exercise price of ¥1 per share and graded vesting generally over three years with certain longer vesting or holding periods where required under local regulations.

The grant date fair value of SARs Plan B is determined using the price of NHI shares.

No new SARs Plan B have been granted since April 1, 2018.

The numbers of outstanding shares of SARs Plan B as of March 31, 2025 and 2026 were not significant.

The total unrecognized compensation cost relating to SARs Plan B during the years ended March 31, 2025 and 2026 were not significant.

Total compensation expense recognized within Non-interest expensesCompensation and benefits in the consolidated statements of income relating to RSUs and SARs for the years ended March 31, 2025 and 2026 were ¥38,381 million and ¥40,639 million, respectively.

Total related tax benefits recognized in the consolidated statements of income relating to RSUs for the years ended March 31, 2025 and 2026 were not significant. The dilutive effect of outstanding deferred compensation plans is included in the weighted average number of shares outstanding used in diluted EPS computations. See Note 14 “Earnings per share” for further information.

There were no significant modifications of RSUs or SARs Plan B during the years ended March 31, 2025 and 2026.


245


Table of Contents

NOMURA HOLDINGS, INC.

NOTES TO THE CONSOLIDATED FINANCIAL STATEMENTS—(Continued)


NSUs and CSUs

NSUs and CSUs are cash-settled awards linked to the price of the Company’s common stock. NSUs replicate the key features of SARs Plan B described above but are settled in cash rather than exercisable into NHI shares. CSUs are similar to NSUs but exposure to movements in the price of the Company’s common stock is subject to a cap and floor. Both types of award have graded vesting periods generally over three years with certain longer vesting periods where required by local regulations.

The fair value of NSUs and CSUs are determined using the price of NHI shares.

The following table presents activity related to NSUs and CSUs for the year ended March 31, 2026.


     NSUs     CSUs  
     Outstanding
(number of units)
    Stock
price
    Outstanding
(number of units)
    Stock
price
 

Outstanding as of March 31, 2025

     17,525,289     ¥ 854       3,152,678     ¥ 478  

Granted

     17,728,234       929 (1)      —        —   

Vested

     (13,722,254     1,062 (2)      (2,970,567     541 (2) 

Forfeited

     (121,282       (163,856  


Outstanding as of March 31, 2026

     21,409,987     ¥ 1,046 (3)      18,255     ¥ 1,113 (3) 


(1)

Weighted-average price of NHI shares used to determine number of awards granted.

(2)

Weighted-average price of NHI shares used to determine the final cash settlement amount of the awards.

(3)

The price of NHI shares used to remeasure the fair value of the remaining outstanding unvested awards as of March 31, 2026.

Total compensation expense recognized within Non-interest expensesCompensation and benefits in the consolidated statements of income relating to NSUs and CSUs for the years ended March 31, 2025 and 2026 were ¥7,995 million and ¥15,583 million, respectively.

Total unrecognized compensation cost relating to nonvested NSUs, based on the fair value of these awards as of March 31, 2026, was ¥2,455 million, which is expected to be recognized through the consolidated statements of income over a remaining weighted-average period of 0.8 years. The total fair value of NSUs which vested during the years ended March 31, 2025 and 2026 was ¥13,249 million and ¥14,570 million, respectively.

Total unrecognized compensation cost relating to nonvested CSUs, based on the fair value of these awards as of March 31, 2026, was ¥0 million. The total fair value of CSUs which vested during the years ended March 31, 2025 and 2026 was ¥3,190 million and ¥1,607 million, respectively.

Total tax benefits recognized in the consolidated statements of income for compensation expense relating to NSUs and CSUs for the years ended March 31, 2025 and 2026 were ¥174 million and ¥1,054 million, respectively.

There were no significant modifications of NSUs or CSUs during the years ended March 31, 2025 and 2026.

Subsequent events

On May 14, 2026, the Company adopted a resolution to grant RSUs to certain senior management and employees. A total of 29,736,800 RSUs have been granted which generally have a graded vesting period from one to three years or with an extended vesting period of up to four years for certain senior management and employees in order to meet local regulatory requirements based on the role they perform within Nomura. Approximately half of the amount previously granted as RSUs is provided as DCAs. Until last year, the Company granted RSUs to employees subject to compensation regulations, with an allotment date of about seven years from the date of the decision to dispose of treasury shares. However, following amendments to the regulations, this year the Company granted RSUs with an allotment date of about four years after the date of the disposal decision.

On May 14, 2026, the Company adopted a resolution to grant PSUs to executive officers of the Company. The base number of shares has been calculated as 541,000 shares, and the number of shares when applying a payout rate of 150% is 811,500 shares. PSUs are to deliver NHI shares to grantees depending on the degree of achievement of the performance targets for the three fiscal years. The settlement of the PSUs will be primarily in treasury stock.


246


Table of Contents

NOMURA HOLDINGS, INC.

NOTES TO THE CONSOLIDATED FINANCIAL STATEMENTS—(Continued)


On May 25, 2026, Nomura also granted NSUs to senior management and employees in countries where RSUs are less favorably treated for tax or other reasons. These NSUs have a total grant date fair value of ¥6 billion and vesting periods of up to four years.


247


Table of Contents

NOMURA HOLDINGS, INC.

NOTES TO THE CONSOLIDATED FINANCIAL STATEMENTS—(Continued)


17. Income taxes:

The following table presents a disaggregation of Income tax expense as reported in the consolidated statements of income for the years ended March 31, 2025 between current and deferred tax expenses and between domestic income tax benefits or expenses recognized by the Company and other subsidiaries in Japan and income tax benefits or expenses recognized by overseas foreign subsidiaries.


     Millions of yen  
     Year ended March 31  
     2025  

Current:


Domestic

   ¥ 89,845  

Foreign

     23,305  


Subtotal

     113,150  


Deferred:


Domestic

     9,784  

Foreign

     1,775  


Subtotal

     11,559  


Total

   ¥ 124,709  


Nomura adopted ASU 2023-09Income Taxes (Topic 740): Improvements to Income Tax Disclosures” prospectively for the year ended March 31, 2026. The ASU has introduced new disclosures, including a breakdown of income before income taxes between domestic and foreign operations and has also made certain changes to the disclosure of the reconciliation of the domestic Japanese national statutory tax rate to the effective tax rate and tax paid.

The following table presents a disaggregation of Income before income taxes as reported in the consolidated statement of income for the year ended March 31, 2026 between domestic and foreign operations. See Note 23 “Segment and geographic information” for details of Income before income taxes by geographical locations.


     Millions of yen  
     Year ended March 31  
     2026  

Income before income taxes:


Domestic

   ¥ 448,291  

Foreign

     91,530  


Total

   ¥ 539,821  


248


Table of Contents

NOMURA HOLDINGS, INC.

NOTES TO THE CONSOLIDATED FINANCIAL STATEMENTS—(Continued)


The following table presents a disaggregation of Income tax expense as reported in the consolidated statement of income for the year ended March 31, 2026, by the nature of the tax expense and specifically whether such tax expense is incurred in connection with domestic Japanese national, domestic Japanese local taxes or foreign taxes. Foreign tax expense amounts represent income tax expenses imposed by jurisdictions outside Japan.


     Millions of yen  
     Year ended March 31  
Current:    2026  

Domestic national tax

   ¥ 108,070  

Domestic local tax

     23,725  

Foreign taxes

     25,295  


Subtotal

     157,090  


Deferred:


Domestic national tax

     19,936  

Domestic local tax

     6,163  

Foreign taxes

     (17,750


Subtotal

     8,349  


Total Income Tax expense (benefit)


Domestic national tax

     128,006  

Domestic local tax

     29,888  

Foreign taxes

     7,545  


Total

   ¥ 165,439  


The income tax benefit recognized from operating losses for the years ended March 31, 2025 and 2026 was ¥6,086 million and ¥5,298 million, respectively, which is included within deferred income tax expense above.

The Company and its wholly-owned domestic subsidiaries have applied the Group Tax Sharing system in Japan. The Group Tax Sharing system is only available for a national tax.

Effective statutory tax rate reconciliation

Foreign subsidiaries are subject to income taxes of the countries in which they operate. The relationship between income tax expense and accounting income (loss) before income taxes is affected by a number of items, including various tax credits, non-taxable income, non-deductible expenses, changes in deferred tax valuation allowance and different tax rates applicable to foreign subsidiaries.


249


Table of Contents

NOMURA HOLDINGS, INC.

NOTES TO THE CONSOLIDATED FINANCIAL STATEMENTS—(Continued)


The following table presents a reconciliation of Nomura’s effective statutory tax rate to the effective tax rate for the years ended March 31, 2025, and is based on applicable U.S. GAAP requirements prior to the adoption of ASU 2023-09. Nomura’s effective statutory tax rate represents the blended rate that combines the Japanese national tax rate and other Japanese local taxes. The effective tax rate represents total Income tax expense as a percentage of Income (loss) before income taxes as reported in the consolidated statement of income for the years presented.


     Year ended March 31  
     2025  

Nomura’s effective statutory tax rate

     31.0

Impact of:


Changes in deferred tax valuation allowances

     (5.3

Additional taxable income

     1.3  

Non-deductible expenses

     3.2  

Non-taxable income

     (1.6

Dividends from foreign subsidiaries

     0.0  

Tax effect of undistributed earnings of foreign subsidiaries

     0.0  

Different tax rate applicable to income (loss) of foreign subsidiaries

     (2.5

Effect of changes in foreign tax laws

     0.0  

Effect of changes in domestic tax laws

     0.4  

Tax benefit recognized on the outside basis differences for investment in subsidiaries and affiliates

     (0.0

Other

     (0.1


Effective tax rate

     26.4


250


Table of Contents

NOMURA HOLDINGS, INC.

NOTES TO THE CONSOLIDATED FINANCIAL STATEMENTS—(Continued)


The following table presents a reconciliation of the expected Japanese national income tax expense, calculated by applying the Japanese national statutory tax rate, to Nomura’s actual income tax expense, and the effective tax rate for the year ended March 31, 2026. The effective tax rate represents total Income tax expense as a percentage of Income (loss) before income taxes as reported in the consolidated statement of income for the year ended March 31, 2026.


     Millions of yen  
     Year ended March 31  
     2026  
     Amount     Percent  

Japan national statutory tax rate

   ¥ 138,194       25.6

Japan local tax, net of national tax effect(1)

     29,213       5.4  

Increase/(decrease) in taxes resulting from:


Foreign tax effects


U.S.


Changes in deferred tax valuation allowances(2)

     (43,725     (8.1

Other

     2,159       0.4  

U.K.


Changes in deferred tax valuation allowances

     9,717       1.8  

Other

     (1,619     (0.3

India


Undistributed earnings of foreign subsidiaries

     7,557       1.4  

Other

     540       0.1  

Other jurisdictions

     6,478       1.2  

Non-deductible expenses


Stock-based compensation awards

     10,610       2.0  

Other

     3,426       0.6  

Changes in deferred tax valuation allowances

     4,319       0.8  

Non-taxable income

     (2,699     (0.5

Tax credits

     (2,699     (0.5

Effect of cross-border tax laws

     3,239       0.6  

Unrecognized tax benefit

     5,039       0.9  

Other

     (4,310     (0.8


Effective tax rate

   ¥ 165,439       30.6


(1)

The tax effects in this category primarily relate to local Japanese taxes arising in Tokyo

(2)

Primarily due to improved profitability and increase in taxable temporary differences resulted in release of certain valuation allowance.


251


Table of Contents

NOMURA HOLDINGS, INC.

NOTES TO THE CONSOLIDATED FINANCIAL STATEMENTS—(Continued)


The following table presents a disaggregation of total income tax paid to taxing authorities (net of refunds received) for the year ended March 31, 2026 between domestic Japanese national taxes, domestic Japanese local taxes and foreign taxes.


     Millions of yen  
     Year ended March 31  
     2026  

Domestic National Tax

   ¥ 74,617  


Domestic Local Tax


Tokyo

     13,182  

Other

     7,979  

Subtotal

     21,161  


Foreign Tax

     23,074  


Total

   ¥ 118,852  


The following table presents the significant components of deferred tax assets and liabilities as of March 31, 2025 and 2026, before offsetting of amounts which relate to the same tax-paying component within a particular tax jurisdiction.


     Millions of yen  
     March 31  
     2025     2026  

Deferred tax assets


Depreciation, amortization and valuation of fixed assets

   ¥ 38,105     ¥ 43,007  

Investments in subsidiaries and affiliates

     310       3,604  

Valuation of financial instruments

     123,754       128,286  

Accrued pension and severance costs

     6,571       5,224  

Other accrued expenses and provisions

     86,813       118,047  

Operating losses

     462,392       477,481  

Lease liabilities

     45,937       39,964  

Other

     19,994       20,477  


Gross deferred tax assets

     783,876       836,090  

Less—Valuation allowances

     (571,017     (588,426


Total deferred tax assets

     212,859       247,664  


Deferred tax liabilities


Investments in subsidiaries and affiliates

     120,341       129,826  

Valuation of financial instruments

     107,997       98,372  

Undistributed earnings of foreign subsidiaries

     3,014       17,816  

Valuation of fixed assets and intangible assets

     22,930       58,329  

Right-of-use assets

     41,413       35,219  

Other

     5,760       13,030  


Total deferred tax liabilities

     301,455       352,592  


Net deferred tax assets (liabilities)

   ¥ (88,596   ¥ (104,928


After offsetting deferred tax assets and liabilities which relate to the same tax-paying component within a particular tax jurisdiction, net deferred tax assets reported within Other assetsOther in the consolidated balance sheets were ¥25,224 million and ¥41,778 million as of March 31, 2025 and 2026, respectively and net deferred tax liabilities reported within Other liabilities in the consolidated balance sheets were ¥113,820 million and ¥146,706 million as of March 31, 2025 and 2026, respectively.

As of March 31, 2026, no deferred tax liabilities have been recognized for undistributed earnings of foreign subsidiaries which are not expected to be remitted in the foreseeable future. It is not practicable to determine the amount of income taxes payable in the event all such foreign earnings are repatriated.


252


Table of Contents

NOMURA HOLDINGS, INC.

NOTES TO THE CONSOLIDATED FINANCIAL STATEMENTS—(Continued)


Deferred taxes

The following table presents changes in total valuation allowances recognized against deferred tax assets for the years ended March 31, 2025 and 2026.


     Millions of yen  
     Year ended March 31  
     2025     2026  

Balance at beginning of year

   ¥ 595,668     ¥ 571,017  

Net change during the year

     (24,651 )(1)      17,409 (2) 


Balance at end of year

   ¥ 571,017     ¥ 588,426  


(1)

Primarily includes a decrease of ¥21,610 million of valuation allowances on deferred tax assets of certain foreign subsidiaries primarily due to a decrease in operating loss carryforwards, and a reduction of ¥3,041 million of valuation allowances on deferred tax assets related to Japanese subsidiaries and the Company primarily due to a utilization of loss carryforwards. In total, ¥24,651 million of allowances decreased.

(2)

Primarily includes an increase of ¥12,691 million of valuation allowances on deferred tax assets primarily related to valuation of financial instruments of certain foreign subsidiaries. While valuation allowances on deferred tax assets of foreign subsidiaries related to operating loss carryforwards had increases due to foreign exchange, valuation allowances of certain foreign subsidiaries had decreases in operating loss carryforwards due to utilization by improved profitability, resulting in an immaterial net change during the year. In addition, there was an increase of ¥4,718 million of valuation allowances on deferred tax assets related to Japanese subsidiaries and the Company primarily due to an increase of valuation allowances of Investments in subsidiaries and affiliates. In total, ¥17,409 million of allowances increased.

As of March 31, 2026, total operating loss carryforwards were ¥2,308,076 million, which included ¥307,780 million relating to the Company and domestic subsidiaries, ¥852,730 million relating to foreign subsidiaries in U.K., ¥665,526 million relating to foreign subsidiaries in U.S., ¥380,924 million relating to foreign subsidiaries in Hong Kong, and ¥101,116 million relating to foreign subsidiaries in other tax jurisdictions. Of this total amount, ¥1,539,348 million can be carried forward indefinitely, ¥729,875 million expires by March 31, 2036 and ¥38,853 million expires in later fiscal years.

In determining the amount of valuation allowances to be recognized as of March 31, 2026, Nomura considered all available positive and negative evidence around the likelihood that sufficient future taxable income will be generated to realize the deferred tax assets in the relevant tax jurisdiction of the Company, its domestic subsidiaries and foreign subsidiaries. In Japan and other tax jurisdictions where certain domestic and foreign subsidiaries have experienced cumulative operating losses in recent years, these losses provide the most verifiable negative evidence available and outweigh positive evidence. On the other hand, for certain foreign subsidiaries of the Company upon review and weighing in available positive evidences, we determined that it is more likely than not that a portion of the deferred tax assets related to operating loss carryforwards should be realized. Accordingly, we released a portion of the valuation allowances against those deferred tax assets.

While Nomura has considered certain future tax planning strategies as a potential source of future taxable income, such strategies are not relied upon as significant positive evidence resulting in a reduction of valuation allowances in any major tax jurisdiction in which Nomura operates as of March 31, 2025 and 2026. In addition, valuation allowances have not been significantly reduced in any of these periods as a result of changing the weighting applied to positive or negative evidence in any of the major tax jurisdictions in which Nomura operates by certain tax planning strategies.

The determination of whether deferred tax assets will be realized, and therefore whether a valuation allowance is required, is inherently subjective and often requires management judgment around the future profitability of Nomura entities, an interpretation of tax rules by courts and regulatory authorities and tax examinations by taxing authorities, and the appropriate weighting of positive and negative evidence around the likelihood that sufficient future taxable income will be generated to realize deferred tax assets in the relevant tax jurisdiction.


253


Table of Contents

NOMURA HOLDINGS, INC.

NOTES TO THE CONSOLIDATED FINANCIAL STATEMENTS—(Continued)


As a result of the Macquarie Acquisition, deferred tax assets and deferred tax liabilities of ¥10,479 million and ¥11,820 million, respectively, were assumed and additional deferred tax assets and deferred tax liabilities of ¥929 million and ¥14,476 million, respectively recognized as of March 31, 2026. These arose from recognition of additional employee liabilities and intangible assets as part of the acquisition. The expected reversal of the assumed and established net deferred tax liabilities led to a valuation allowance release of ¥12,769 million.


254


Table of Contents

NOMURA HOLDINGS, INC.

NOTES TO THE CONSOLIDATED FINANCIAL STATEMENTS—(Continued)


Unrecognized tax benefits

The following table presents changes in Nomura’s unrecognized tax benefits for the years ended March 31, 2025 and 2026.


     Millions of yen  
     Year ended March 31  
     2025     2026  

Balance at beginning of year

   ¥ 41,437     ¥ 48,462  

Increases based on tax positions related to the current period

     6,791       8,551  

Increases based on tax positions related to the prior periods

     866       17  

Decreases related to lapse of the applicable statute of limitations

     —        (1,957

Exchange rate fluctuations

     (632     3,433  


Balance at end of year

   ¥ 48,462     ¥ 58,506  


The amounts of unrecognized tax benefits which would reduce Nomura’s effective tax rate in future periods if recognized for the years ended March 31, 2025, and 2026, were ¥17,561 million, and ¥25,658 million, respectively. The remaining balance would not impact the effective tax rate as it is expected to increase operating loss carryforwards and corresponding valuation allowance.

There were also no significant movements of the amount of interest and penalties recognized due to unrecognized tax benefits during the years ended March 31, 2025. During the year ended March 31, 2026, the total amount of unrecognized tax benefits includes ¥1,493 million of interest, and there was no movement in the amount of penalties.

Examinations by taxing authorities

Nomura operates in multiple tax jurisdictions and faces audits from various taxing authorities regarding many issues including, but not limited to, transfer pricing, the deductibility of certain expenses, foreign tax credits and other matters.

The table below presents information regarding the earliest year in which Nomura remains subject to examination in the major tax jurisdictions in which Nomura operates as of March 31, 2026.


Jurisdiction

   Year ended March 31,  

Japan

     2021 (1) 

United Kingdom

     2016 (2) 

United States

     2023  

India

     2020 (3) 

Singapore

     2021  
 
(1)

The earliest year in which Nomura remains subject to examination for transfer pricing issues is the year ended March 31, 2019.

(2)

The earliest year in which Nomura remains subject to examination for transfer pricing issues is the year ended March 31, 2016.

(3)

The earliest year in which Nomura remains subject to examination for transfer pricing issues is the year ended March 31, 2008.


255


Table of Contents

NOMURA HOLDINGS, INC.

NOTES TO THE CONSOLIDATED FINANCIAL STATEMENTS—(Continued)


18. Other comprehensive income (loss):

The following tables present changes in Accumulated other comprehensive income (loss) for the years ended March 31, 2025 and 2026.


     Millions of yen  
     For the year ended March 31, 2025  
     Balance at
beginning
of year
    Other
comprehensive
income (loss)
before
reclassifications
    Reclassifications out of
accumulated other
comprehensive
income (loss)
    Net change
during the year
    Balance at
end of year
 

Cumulative translation adjustments

   ¥ 444,071     ¥ (38,121   ¥ 2,027     ¥ (36,094   ¥ 407,977  

Pension liability adjustment (1)

     (19,512     11,317       1,090       12,407       (7,105

Net unrealized gain (loss) on non-trading debt securities (2)

     —        (1,147     —        (1,147     (1,147

Own credit adjustments (3)

     35,425       12,870       (212     12,658       48,083  


Total

   ¥ 459,984     ¥ (15,081   ¥ 2,905     ¥ (12,176   ¥ 447,808  


     Millions of yen  
     For the year ended March 31, 2026  
     Balance at
beginning
of year
    Other
comprehensive
income (loss)
before
reclassifications
    Reclassifications out of
accumulated other
comprehensive
income (loss)
    Net change
during the year
    Balance at
end of year
 

Cumulative translation adjustments

   ¥ 407,977     ¥ 142,536     ¥ (12   ¥ 142,524     ¥ 550,501  

Pension liability adjustment (1)

     (7,105     6,062       921       6,983       (122

Net unrealized gain (loss) on non-trading debt securities (2)

     (1,147     (2,215     —        (2,215     (3,362

Own credit adjustments (3)

     48,083       (45,886     (993     (46,879     1,204  


Total

   ¥ 447,808     ¥ 100,497     ¥ (84   ¥ 100,413     ¥ 548,221  


(1)

See Note 15 “Employee benefit plans” for further information.

(2)

See Note 6 “Non-trading investments” for further information.

(3)

See Note 2 “Fair value measurements” for further information.


256


Table of Contents

NOMURA HOLDINGS, INC.

NOTES TO THE CONSOLIDATED FINANCIAL STATEMENTS—(Continued)


The following tables present significant reclassifications out of Accumulated other comprehensive income (loss) for the years ended March 31, 2025 and 2026.


     Millions of yen  
     For the year ended March 31  
     2025     2026     Affected line items in consolidated
statements of income
 
     Reclassifications out of
accumulated other
comprehensive income
(loss)
    Reclassifications out of
accumulated other
comprehensive income
(loss)
 

Cumulative translation adjustments:

      
   ¥ (2,027   ¥ 12      
Revenue—Other /Non-interest
expenses—Other
 
 
     —        —        Income tax expense  


     (2,027     12       Net income (loss)  


     —        —       
Net income attributable to
noncontrolling interests


   ¥ (2,027   ¥ 12      
Net income (loss) attributable to
NHI shareholders


     Millions of yen  
     For the year ended March 31  
     2025     2026     Affected line items in consolidated
statements of income
 
     Reclassifications out of
accumulated other
comprehensive income
(loss)
    Reclassifications out of
accumulated other
comprehensive income
(loss)
 

Pension liability adjustment:

      
   ¥ (1,464   ¥ (882    


Non-interest
expenses—Compensation and
benefits /

Revenue—Other


     374       (39     Income tax expense  


     (1,090     (921 ))      Net income (loss)  


     —        —       
Net income attributable to
noncontrolling interests


   ¥ (1,090   ¥ (921    
Net income (loss) attributable to
NHI shareholders


     Millions of yen  
     For the year ended March 31  
     2025     2026     Affected line items in consolidated
statements of income
 
     Reclassifications out of
accumulated other
comprehensive income
(loss)
    Reclassifications out of
accumulated other
comprehensive income
(loss)
 

Own credit adjustments:

      
   ¥ 315     ¥ 1,403       Revenue—Net gain on trading  
     (103     (410     Income tax expense  


     212       993       Net income (loss)  


     —        —       
Net income attributable to
noncontrolling interests


   ¥ 212     ¥ 993      
Net income (loss) attributable to
NHI shareholders


257


Table of Contents

NOMURA HOLDINGS, INC.

NOTES TO THE CONSOLIDATED FINANCIAL STATEMENTS—(Continued)


19. Shareholders’ equity:

The following table presents changes in shares of NHI shares outstanding for the years ended March 31, 2025 and 2026.


     Number of Shares  
     Year ended March 31  
     2025     2026  

Common stock outstanding at beginning of year

     2,970,755,160       2,956,210,965  

Decrease of common stock by cancellation of treasury stock

     —        (75,000,000

Common stock held in treasury:


Repurchases of common stock

     (63,523,657     (99,361,149

Sales of common stock

     115       298  

Common stock issued to employees

     48,981,222       44,489,127  

Cancellation of treasury stock

     —        75,000,000  

Other net change in treasury stock

     (1,875     (2,017


Common stock outstanding at end of year

     2,956,210,965       2,901,337,224  


The amount available for dividends and acquisition of treasury stock is subject to restrictions imposed by the Companies Act. Additional paid-in capital and retained earnings include amounts which the Companies Act prohibits for the use of dividends and acquisition of treasury stock. As of March 31, 2025 and 2026, the amounts available for distributions were ¥1,405,134 million and ¥1,282,317 million, respectively. These amounts are based on the amounts recorded in the Company’s unconsolidated financial statements maintained in accordance with accounting principles and practices prevailing in Japan. U.S. GAAP adjustments and undistributed earnings of equity-method investees and affiliates included in these consolidated financial statements, but not recorded in the Company’s unconsolidated financial statements, have no effect on the determination of the amounts available for distributions under the Companies Act.

Dividends on NHI shares per share for the years ended March 31, 2025 and 2026 were ¥57.0 and ¥51.0, respectively. Dividend for the year ended March 31, 2025 includes a commemorative dividend of ¥10.0 per share in celebration of the company’s 100th anniversary on December 25, 2025.

On January 31, 2024, the board of directors approved a repurchase program of Nomura Holdings common stock in accordance with Article 459-1 of the Companies Act of Japan as follows: (a) total number of shares authorized for repurchase is up to 125,000,000 shares, (b) total value of shares authorized for repurchase is up to ¥100,000 million and (c) the share buyback ran from February 16, 2024 to September 30, 2024. Under this repurchase program, the Company repurchased 109,726,600 shares of common stock at a cost of ¥100,000 million.

On April 25, 2025, the board of directors approved a repurchase program of Nomura Holdings common stock in accordance with Article 459-1 of the Companies Act of Japan as follows: (a) total number of shares authorized for repurchase is up to 100,000,000 shares, (b) total value of shares authorized for repurchase is up to ¥60,000 million and (c) the share buyback ran from May 15, 2025 to December 30, 2025. Under this repurchase program, the Company repurchased 66,790,900 shares of common stock at a cost of ¥60,000 million.

During the year ended March 31, 2026, due to the cancellation of treasury stock on March 2, 2026, total number of issued shares and treasury stock decreased by 75,000,000 shares, respectively.

On January 30, 2026, the board of directors approved a repurchase program of Nomura Holdings common stock in accordance with Article 459-1 of the Companies Act of Japan as follows: (a) total number of shares authorized for repurchase is up to 100,000,000 shares, (b) total value of shares authorized for repurchase is up to ¥60,000 million and (c) the share buyback ran from February 17, 2026 to September 30, 2026. Under this repurchase program, from February 17, 2026 to April 15, 2026, the Company repurchased 46,861,200 shares of common stock at a cost of ¥60,000 million. This completes the share repurchase program.

In addition to the above, the change in common stock held in treasury includes the change in common stock issued to employees under stock-based compensation plans, common stock held by affiliated companies, common stock sold to enable shareholders to hold round lots of the 100 share minimum tradable quantity (adding-to-holdings requests) or common stock acquired to create round lots or eliminate odd lots.


258


Table of Contents

NOMURA HOLDINGS, INC.

NOTES TO THE CONSOLIDATED FINANCIAL STATEMENTS—(Continued)


20. Regulatory requirements:

In April 2011, the Company has been assigned as Final Designated Parent Company who must calculate a consolidated capital adequacy ratio and since then, our consolidated capital adequacy ratio has been calculated based on Capital Adequacy Notice on Final Designated Parent Company. The Capital Adequacy Notice on Final Designated Parent Company has been revised in line with Basel 2.5 and Basel III and Nomura has calculated a Basel III-based consolidated capital adequacy ratio since March 2013.

In accordance with Article 2 of the Capital Adequacy Notice on Final Designated Parent Company, Nomura’s consolidated capital adequacy ratio is calculated based on the amounts of common equity Tier 1 capital, Tier 1 capital, total capital, credit risk-weighted assets, market risk and operational risk. As of March 31, 2025 and 2026, the Company was in compliance with common equity Tier 1 capital ratio, Tier 1 capital ratio and consolidated capital adequacy ratio requirements set out in the Capital Adequacy Notice on Final Designated Parent Company, etc. The required level (including applicable minimum consolidated capital buffer) as of March 31, 2026 was 7.69% for the common equity Tier 1 capital ratio, 9.19% for the Tier 1 capital ratio and 11.19% for the consolidated capital adequacy ratio.

Under the Financial Instruments and Exchange Act (“FIEA”), NSC and NFPS are subject to the capital adequacy rules of the FSA. These rules require the maintenance of a capital adequacy ratio, which is defined as the ratio of adjusted capital to a quantified total of business risk, of not less than 120%. Adjusted capital is defined as net worth (which includes shareholders’ equity, net unrealized gains and losses on securities held, reserves and subordinated debt) less illiquid assets. Business risks are divided into three categories: (1) market risks, (2) counterparty risks, and (3) basic risks. Under these rules, there are no restrictions on the operations of the companies provided that the resulting net capital adequacy ratio exceeds 120%. As of March 31, 2025 and 2026, the capital adequacy ratio of NSC exceeded 120%. Also, as of March 31, 2025 and 2026, the capital adequacy ratio of NFPS also exceeded 120%.

In connection with providing brokerage, clearing, asset management and wealth management services to clients, Nomura maintains segregated accounts to hold financial assets such as cash and securities on behalf of its clients. These accounts are typically governed by stringent statutory or regulatory rules in the relevant jurisdiction where the accounts are maintained in order to protect the clients from loss.

As of March 31, 2025 and 2026, the total amount of segregated client cash recognized as an asset in Deposits with stock exchanges and other segregated cash in the consolidated balance sheets was ¥110,223 million and ¥166,651 million, respectively. As of March 31, 2025 and 2026, the total amount of segregated securities recognized as assets in Trading assets and Collateralized agreements in the consolidated balance sheets was ¥1,034,783 million and ¥960,952 million, respectively.

In the U.S., Nomura Securities International, Inc. (“NSI”) is registered as a broker-dealer under the Securities Exchange Act of 1934 and is a futures commission merchant with the Commodity Futures Trading Commission (“CFTC”). NSI is also regulated by self-regulatory organizations, such as the Financial Industry Regulatory Authority (“FINRA”) and the Chicago Mercantile Exchange Group. NSI is subject to the SEC’s Uniform Net Capital Rule (“Rule 15c3-1”) and other related rules, which require net capital, as defined under the alternative method, of not less than the greater of $1,000,000 or 2% of aggregate debit items arising from client transactions. NSI is also subject to CFTC Regulation 1.17 which requires the maintenance of net capital of 8% of the total risk margin requirement, as defined, for all positions carried in client accounts and nonclient accounts or $1,000,000, whichever is greater. NSI is required to maintain net capital in accordance with the SEC, CFTC, or other various exchange requirements, whichever is greater. Another U.S. subsidiary, Nomura Global Financial Products Inc. (“NGFP”) is registered as an OTC Derivatives Dealer under the Securities Exchange Act of 1934. NGFP is registered with CFTC as a Swap Dealer on October 6, 2021 and registered with the Securities and Exchange Commission (“SEC”) as a Security Based Swap Dealer on November 1, 2021. NGFP calculates capital under SEC rule 18a-1 and CFTC rule 23.101 and requires the greater of $20,000,000, 2% of the SEC risk margin amount or 2% of the CFTC risk margin amount. Another U.S. subsidiary, Instinet, LLC (“ILLC”) is a broker-dealer registered with the SEC and is a member of FINRA. Further, ILLC is an introducing broker registered with the CFTC and a member of the National Futures Association and various other exchanges. ILLC is subject to Rule 15c3-1 which requires the maintenance of minimum net capital, as defined under the alternative method, equal to the greater of $1,000,000, 2% of aggregate debit items arising from client transactions, or the CFTC minimum requirement. Under CFTC rules, ILLC is subject to the greater of the following when determining its minimum net capital requirement: $45,000 minimum net capital required as a CFTC introducing broker; the amount of adjusted net capital required by a futures association of which it is a member; and the amount of net capital required by Rule 15c3-1(a). As of March 31, 2025 and 2026, NSI, NGFP and ILLC were in compliance with relevant regulatory capital related requirements.


259


Table of Contents

NOMURA HOLDINGS, INC.

NOTES TO THE CONSOLIDATED FINANCIAL STATEMENTS—(Continued)


In Europe, Nomura Europe Holdings plc (“NEHS”) is subject to consolidated regulatory supervision by the Prudential Regulation Authority (“U.K. PRA”) as a U.K. Parent Financial Holding Company. The regulatory consolidation is produced in accordance with the requirements established under the Financial Services and Markets Act 2000, U.K. Capital Requirements Regulations and the PRA Rulebook. Nomura International plc (“NIP”), the most significant of NEHS’ subsidiaries, acts as a securities brokerage and dealing business. NIP is also regulated by the U.K. PRA and has minimum capital adequacy requirements imposed on it on a standalone basis. NIP is also registered with the CFTC as a non-U.S. Swap Dealer (SD) and with the SEC as a conditionally registered Security-based Swap Dealer (SBSD). NIP is a member of National Futures Association (NFA). Both the SEC and CFTC have granted substituted compliance in some cases to recognize the comparability of U.K. regulations as being equivalent to satisfy the relevant requirements under the U.S. Dodd Frank regime. NIP has elected to rely on certain aspects of the substituted compliance regime in areas including, but not limited to, capital and margin, reporting and record keeping. In addition, Nomura Bank International plc (“NBI”), another subsidiary of NEHS, is also regulated by the U.K. PRA on a standalone basis. NEHS also has a number of European domiciled subsidiaries including Nomura Financial Products Europe GmbH (“NFPE”), Banque Nomura France (“BNF”) and Nomura Bank Luxembourg S.A. (“NBL”) which are subject to the EU Capital Requirements Regulation and local regulations as applied by the regulators in the country of domicile of the subsidiary. NFPE is domiciled in Germany and is regulated by the German regulator (“BaFin”), BNF is domiciled in France and is regulated by the French regulator (“ACPR”) and NBL is domiciled in Luxembourg and is regulated by the Luxembourg regulator (“CSSF”). As of March 31, 2025 and 2026, NEHS, NIP, NBI, NFPE, BNF and NBL were all in compliance with relevant regulatory capital related requirements.

In Asia, Nomura International (Hong Kong) Limited (“NIHK”) and Nomura Singapore Ltd (“NSL”) are regulated by their local respective regulatory authorities. NIHK is licensed by the Securities and Futures Commission in Hong Kong to carry out regulated activities including dealing in securities and futures contracts, advising on securities, futures contracts and corporate finance. Activities of NIHK, including its branch in Taiwan, are subject to the Securities and Futures (Financial Resources) Rules which require it, at all times, to maintain liquid capital at a level not less than its required liquid capital. Liquid capital is the amount by which liquid assets exceed ranking liabilities. Required liquid capital is calculated in accordance with provisions laid down in the Securities and Futures (Financial Resources) Rules. NSL holds a Merchant Bank license from the Monetary Authority of Singapore (“MAS”) and is authorized to conduct merchant banking activities including accepting deposits (subject to regulatory restrictions) and providing loans and advances. NSL also operates under exemptions as an Exempt Capital Markets Services Entity, Exempt Financial Adviser, and Exempt Trust Company, authorized to conduct regulated activities including fund management, dealing in capital markets products, product financing, providing custodial services, advising on corporate finance and investment products, and issuing or promulgating analyses/reports on investment products. NSL is regulated and has minimum capital adequacy requirements imposed on it, including its branch in the Dubai International Financial Centre, by the MAS in Singapore. NIHK and NSL have been compliant with relevant regulatory capital related requirements.


260


Table of Contents

NOMURA HOLDINGS, INC.

NOTES TO THE CONSOLIDATED FINANCIAL STATEMENTS—(Continued)


21. Affiliated companies and other equity-method investees:

Nomura’s significant affiliated companies and other equity-method investees include Nomura Research Institute, Ltd. (“NRI”) and Nomura Real Estate Holdings, Inc. (“NREH”). Nomura also invests in American Century Companies, Inc., that is carried at fair value on a recurring basis through election of the FVO. See Note 2 “Fair value measurements” for further information.

NRI

NRI develops and manages computer systems and provides research services and management consulting services. One of the major clients of NRI is Nomura.

As of March 31, 2025 and 2026, Nomura’s ownership of NRI was 23.0% and 23.1% respectively.

NREH

NREH is the holding company of the Nomura Real Estate Group which is primarily involved in the residential property development, leasing, investment management as well as other real estate-related activities.

As of March 31, 2025 and 2026, Nomura’s ownership of NREH was 37.2% and 37.6% respectively.

As of March 31, 2025 and 2026, the aggregated carrying value of the investments in equity method investees exceeded Nomura’s equity in the underlying net assets of these equity method investees by ¥31,576 million and ¥21,810 million, respectively. Such excess primarily represented equity method goodwill for each significant equity method investee, except for certain equity method investees including NREH for which Nomura’s carrying value was below Nomura’s equity in the underlying net assets of the investees.

Summary financial information

The following tables present summarized financial information for significant affiliated companies of Nomura (including those elected for the FVO) as of March 31, 2025 and 2026, and for the years ended March 31, 2025 and 2026.


     Millions of yen  
     March 31  
     2025      2026  

Total assets

   ¥ 3,849,351      ¥ 4,070,274  

Total liabilities

     2,597,957        2,761,101  
     Millions of yen  
     Year ended March 31  
     2025      2026  

Net revenues

   ¥ 1,254,864      ¥ 1,503,892  

Non-interest expenses

     965,914        1,242,921  

Net income attributable to affiliated companies

     209,174        171,418  


261


Table of Contents

NOMURA HOLDINGS, INC.

NOTES TO THE CONSOLIDATED FINANCIAL STATEMENTS—(Continued)


The following tables present a summary of balances and transactions with affiliated companies and other equity-method investees as of March 31, 2025 and 2026, and during the years ended March 31, 2025 and 2026. Investments in American Century Companies, Inc., for which FVO was elected, are not included in Investments in affiliated companies in the following table and are reported within Other assets—Other in the consolidated balance sheets.


     Millions of yen  
     March 31  
     2025      2026  

Investments in affiliated companies

   ¥   497,435      ¥   515,848  

Advances to affiliated companies

     8,954        19,554  

Other receivables from affiliated companies(1)

     38,351        42,134  

Other payables to affiliated companies (2)

     26,643        25,475  
 
(1)

Includes ROU assets of ¥20,664 million and ¥19,547 million as of March 31, 2025 and 2026, respectively.

(2)

Includes operating lease liabilities of ¥20,664 million and ¥19,547 million as of March 31, 2025 and 2026, respectively.


     Millions of yen  
     Year ended March 31  
     2025      2026  

Revenues(1)(2)

   ¥     3,887      ¥     3,664  

Non-interest expenses

     52,721        53,699  

Purchase of software, securities and tangible assets

     44,954        61,122  
 
(1)

The revenue amount does not include revenue of ¥56,144 million from the sale in April 2025 by Nomura of its own land and buildings located in Takanawa 2-chome, Minato-ku, Tokyo. The transaction counterparties included Nomura Real Estate Development Co., Ltd., a subsidiary of Nomura Real Estate Holdings, Inc., an affiliated company, and a third-party financing company. Nomura considers the entire transaction to be with a related party. The revenue is included in RevenueOther in the consolidated statements of income for the year ended March 31, 2026.

(2)

The revenue amount does not include the dividends from and the movement in fair values of the affiliate investee for which FVO was elected. The revenue is included in RevenueInterest and dividends and RevenueOther, respectively in the consolidated statements of income.

The following table presents the aggregate carrying amount and fair value of investments in affiliated companies and other equity-method investees for which a quoted market price is available as of March 31, 2025 and 2026.


     Millions of yen  
     March 31  
     2025      2026  

Carrying amount

   ¥   429,968      ¥   457,152  

Fair value

     919,677        898,413  

The following table presents equity in earnings of from equity-method investees and dividends from equity-method investees and affiliate for which FVO was elected, for the years ended March 31, 2025 and 2026.


     Millions of yen  
     Year ended March 31  
     2025      2026  

Equity in earnings of equity-method investees(1)

   ¥   52,454      ¥   45,158  

Dividends from equity-method investees and affiliates for which FVO was elected(2)

     37,067        26,496  
 
(1)

Equity in earnings of equity-method investees is reported within Revenue—Other in the consolidated statements of income.

(2)

Dividends from affiliate for which FVO was elected are reported within Interest and Dividends.


262


Table of Contents

NOMURA HOLDINGS, INC.

NOTES TO THE CONSOLIDATED FINANCIAL STATEMENTS—(Continued)


22. Commitments, contingencies and guarantees:

Commitments—

Credit and investment commitments

In connection with its banking and financing activities, Nomura provides commitments to extend credit which generally have fixed expiration dates. In connection with its investment banking activities, Nomura enters into agreements with clients under which Nomura commits to underwrite securities that may be issued by the clients. As a member of certain central clearing counterparties, Nomura is committed to provide liquidity facilities through entering into reverse repo transactions backed by government and government agency debt securities with those counterparties in a situation where a default of another clearing member occurs. The outstanding commitments under these agreements are included below as commitments to extend credit.

Nomura has commitments to invest in various partnerships and other entities and also has commitments to provide financing for investments related to these partnerships. The outstanding commitments under these agreements are included below as commitments to invest.

The following table presents a summary of the key types of outstanding commitments provided by Nomura as of March 31, 2025 and 2026.


     Millions of yen  
     March 31  
     2025      2026  

Commitments to extend credit


Liquidity facilities to central clearing counterparties

   ¥ 2,038,836      ¥ 1,034,593  

Other commitments to extend credit

     1,199,287        1,630,603  


Total

   ¥  3,238,123      ¥  2,665,196  


Commitments to invest

   ¥ 25,677      ¥ 66,952  

Maturity profile of these commitments as of March 31, 2026:


     Millions of yen  
     Total
contractual
amount
     Years to maturity  
     Less than
1 year
     1 to 3
years
     3 to 5
years
     More than
5 years
 

Commitments to extend credit


Liquidity facilities to central clearing

counterparties

   ¥ 1,034,593      ¥ 1,034,593      ¥ —       ¥ —       ¥ —   

Other commitments to extend credit

     1,630,603        378,031        591,051        395,454        266,067  


Total

   ¥ 2,665,196      ¥ 1,412,624      ¥ 591,051      ¥ 395,454      ¥ 266,067  


Commitments to invest

   ¥ 66,952      ¥ 2,991      ¥ 382      ¥ 4,554      ¥ 59,025  

The contractual amounts of these commitments to extend credit represent the maximum amounts at risk assuming the contracts are fully drawn upon, should all the counterparties default, and the value of all collateral or credit mitigations becomes worthless. The total contractual amount of these commitments may not represent actual future cash outflows since the commitments may expire without being drawn upon. The credit risk associated with these commitments varies depending on the clients’ creditworthiness and the value and quality of collateral held. Nomura evaluates each client’s creditworthiness on a case-by-case basis. The amount of collateral obtained, if deemed necessary by Nomura upon extension of credit, is based on credit evaluation of the counterparty.


263


Table of Contents

NOMURA HOLDINGS, INC.

NOTES TO THE CONSOLIDATED FINANCIAL STATEMENTS—(Continued)


Other commitments

Purchase obligations for goods or services that include payments for construction-related, advertising, and computer and telecommunications maintenance agreements were ¥91,877 million as of March 31, 2025 and ¥110,732 million as of March 31, 2026.

As of March 31, 2026, these purchase obligations had the following maturities:


     Millions of yen  
     Total      Years of payment  
     Less than
1 year
     1 to 2
years
     2 to 3
years
     3 to 4
years
     4 to 5
years
     More than
5 years
 

Purchase obligations

   ¥ 110,732      ¥ 78,647      ¥ 10,327      ¥ 7,490      ¥ 4,344      ¥ 2,279      ¥ 7,645  

Above table includes the commitment to purchase parts of the redeveloped real estate in Tokyo Nihonbashi district from the redevelopment association.

Nomura has commitments under resale and repurchase agreements including amounts in connection with collateralized agreements and collateralized financing. These commitments amounted to ¥1,880 billion for resale agreements and ¥1,305 billion for repurchase agreements as of March 31, 2025 and ¥4,084 billion for resale agreements and ¥2,322 billion for repurchase agreements as of March 31, 2026.

Nomura has commitments to purchase notes held by our clients. These commitments amounted to ¥33 billion as of March 31, 2025 and ¥58 billion as of March 31, 2026.

As a member of various securities clearing houses and exchanges, Nomura may be required to assume a certain share of the financial obligations of another member who may default on its obligations to the clearing house or the exchange. These guarantees are generally required under the membership agreements. To mitigate these risks, exchanges and clearing houses often require members to post collateral. The potential for Nomura to make payments under such guarantees is deemed remote.


264


Table of Contents

NOMURA HOLDINGS, INC.

NOTES TO THE CONSOLIDATED FINANCIAL STATEMENTS—(Continued)


Contingencies—

Investigations, lawsuits and other legal proceedings

In the normal course of business as a global financial services entity, Nomura is involved in investigations, lawsuits and other legal proceedings and, as a result, may suffer loss from any fines, penalties or damages awarded against Nomura, any settlements Nomura chooses to make to resolve a matter, and legal and other advisory costs incurred to support and formulate a defense.

The ability to predict the outcome of these actions and proceedings is inherently difficult, particularly where claimants are seeking substantial or indeterminate damages, where investigations and legal proceedings are at an early stage, where the matters present novel legal theories or involve a large number of parties, or which take place in foreign jurisdictions with complex or unclear laws.

The Company regularly evaluates each legal proceeding and claim on a case-by-case basis in consultation with external legal counsel to assess whether an estimate of possible loss or range of loss can be made, if recognition of a liability is not appropriate. In accordance with ASC 450 “Contingencies” (“ASC 450”), the Company recognizes a liability for this risk of loss arising on each individual matter when a loss is probable and the amount of such loss or range of loss can be reasonably estimated. The amount recognized as a liability is reviewed at least quarterly and is revised when further information becomes available. If these criteria are not met for an individual matter, such as if an estimated loss is only reasonably possible rather than probable, no liability is recognized. However, where a material loss is reasonably possible, the Company will disclose details of the legal proceeding or claim below. Under ASC 450 an event is defined as reasonably possible if the chance of the loss to the Company is more than remote but less than probable. As of March 31, 2025 and 2026, a total liability of ¥14,240 million and ¥13,077 million has been recognized, respectively, and reported within the consolidated balance sheets within Other liabilities in respect of outstanding and unsettled investigations, lawsuits and other legal proceedings where loss is considered probable and the amount of such loss can be reasonably estimated.

The most significant actions and proceedings against Nomura are summarized below. The Company believes that, based on current information available as of the date of these consolidated financial statements, the ultimate resolution of these actions and proceedings will not be material to the Company’s financial condition. However, an adverse outcome in certain of these matters could have a material adverse effect on the consolidated statements of income or cash flows in a particular quarter or annual period.

For certain of the significant actions and proceedings, the Company is currently able to estimate the amount of reasonably possible loss, or range of reasonably possible losses, in excess of amounts recognized as a liability (if any) against such cases. These estimates are based on current information available as of the date of these consolidated financial statements and include, but are not limited to, the specific amount of damages or claims against Nomura in each case. As of June 22, 2026, for those cases where an estimate of the range of reasonably possible losses can be made, the Company estimates that the total aggregate reasonably possible maximum loss in excess of amounts recognized as a liability (if any) against these cases is approximately ¥62 billion.

For certain other significant actions and proceedings, the Company is unable to provide an estimate of the reasonably possible loss or range of reasonably possible losses because, among other reasons, (i) the proceedings are at such an early stage there is not enough information available to assess whether the stated grounds for the claim are viable; (ii) damages have not been identified by the claimant; (iii) damages are unsupported and/or exaggerated; (iv) there is uncertainty as to the outcome of pending appeals or motions; (v) there are significant legal issues to be resolved that may be dispositive, such as the applicability of statutes of limitations; (vi) there are novel or unsettled legal theories underlying the claims and/or (vii) a judgment has been made against Nomura but detailed reasons for the basis for the judgment and how the amount of the judgment has been determined have not yet been received.

Nomura will continue to cooperate with regulatory investigations and to vigorously defend its position in the ongoing actions and proceedings set out below, as appropriate.

In October 2010 and June 2012, two actions were brought against Nomura International plc (“NIP”), seeking recovery of payments allegedly made to NIP by Fairfield Sentry Ltd. and Fairfield Sigma Ltd. (collectively, “Fairfield Funds”), which are now in liquidation and were feeder funds to Bernard L. Madoff Investment Securities LLC (in liquidation pursuant to the Securities Investor Protection Act in the U.S. since December 2008) (“BLMIS”). The first suit was brought by the liquidators of the Fairfield Funds. It was filed on October 5, 2010 in the Supreme Court of the State of New York, but was subsequently removed to the United States Bankruptcy Court for the Southern District of New York. The second suit was brought by the trustee for the liquidation of BLMIS (“Madoff Trustee”). NIP was added as a defendant in June 2012 when the Madoff Trustee filed an amended complaint in the United States Bankruptcy Court for the Southern District of New York. Both actions seek to recover approximately $34 million plus interest.


265


Table of Contents

NOMURA HOLDINGS, INC.

NOTES TO THE CONSOLIDATED FINANCIAL STATEMENTS—(Continued)


In November 2011, NIP was served with a claim filed by the Madoff Trustee in the United States Bankruptcy Court for the Southern District of New York. This is a clawback action similar to claims filed by the Madoff Trustee against numerous other institutions. The Madoff Trustee alleges that NIP received redemptions from the BLMIS feeder fund, Harley International (Cayman) Limited in the six years prior to December 11, 2008 (the date proceedings were commenced against BLMIS) and that these are avoidable and recoverable under the U.S. Bankruptcy Code and New York law. The amount that the Madoff Trustee is currently seeking to recover from NIP is approximately $24.4 million plus interest.

Certain of the Company’s subsidiaries in the U.S. securitized residential mortgage loans as residential mortgage-backed securities (“RMBS”) by purchasing loans from third-party originators rather than originating them. These subsidiaries received and provided loan level representations and warranties that detailed borrower characteristics and property conditions, including credit status and compliance with guidelines and laws. Regarding RMBS issued between 2005 and 2007, although the subsidiaries received repurchase claims totaling $3,203 million, claims made after the expiration of the statute of limitations applicable to the breach of representation claims were rejected. Certain investors initiated breach of contract actions through the trustee from 2011 to 2014. Actions filed within the six-year statute of limitations were dismissed due to settlements.

NIP is involved in two Italian civil claims and has been involved in an Italian administrative matter, each described further below relating to certain structured financial transactions that Banca Monte dei Paschi di Siena SpA (“MPS”) entered into with NIP in 2009 (“Transactions”). The Transactions have also been subject to criminal proceedings, in relation to which NIP and two former employees of NIP were acquitted on appeal as well as other civil litigation which has been resolved.

In January 2018, a claim before the Italian Courts brought by two claimants, Alken Fund Sicav (on behalf of two Luxembourg investment funds Alken Fund European Opportunities and Alken Fund Absolute Return Europe) and Virmont S.A. (formerly, Alken Luxembourg S.A, the funds’ management company) (collectively referred to as “Alken”) was served on NIP. The claim was made against NIP, MPS, four MPS former directors and a member of MPS’s internal audit board, and sought monetary damages of approximately EUR 434 million plus interest, as well as non-monetary damages in an amount left to be quantified by the Judge. In July 2021, the court rejected all of Alken’s claims. In February 2022, Alken appealed the decision to the Milan Court of Appeal and, in November 2023, the court dismissed Alken’s appeal. In January 2024, Alken appealed the Court of Appeal’s decision to the Italian Supreme Court.

In May 2019, a claim before the Italian Courts brought by York Global Finance Offshore BDH (Luxembourg) Sàrl and a number of seemingly related funds was served on NIP. The claim is made against NIP, MPS, two MPS former directors and a member of MPS’s internal audit board, and seeks monetary damages of approximately EUR 186.7 million plus interest, as well as non-monetary damages in an amount left to be quantified by the Judge. In May 2024, the court rejected all of York’s claims. In June 2024, York appealed the decision to the Milan Court of Appeal.

On May 20, 2021, NIP and the Company were named as addressees in a decision issued by the European Commission in which NIP, the Company and various other third party banks were found to have infringed EU competition law in connection with their activity in the primary and secondary markets for European Government Bonds (“EGB”). The European Commission found that the infringement consisted of anticompetitive agreements and/or concerted practices in the EGB sector in breach of EU competition law and fined NIP and the Company approximately EUR 129.6 million. The fine was provisionally paid as required. In August 2021, NIP and the Company appealed the decision to the European Union’s General Court. In March 2025 the General Court upheld the European Commission’s decision but reduced the amount of NIP’s and the Company’s fine to approximately EUR 125.6 million. In June 2025, NIP and the Company appealed the decision to the Court of Justice of the European Union.

Nomura has responded to requests for information from the U.S. Commodity Futures Trading Commission (“CFTC”) in relation to swap trading related to bond issuances. On February 1, 2021, the CFTC filed a civil enforcement action against a Nomura employee and charged him with violating the anti-fraud, price manipulation and false statements provisions of the Commodity Exchange Act in relation to a 2015 interest rate swap transaction. On April 30, 2026, following notice from the parties that they had reached an agreement in principle on a settlement that would resolve all claims asserted in the action, the CFTC’s action against the Nomura employee was dismissed without prejudice to the right to reopen the action by June 29, 2026 if the settlement is not consummated.


266


Table of Contents

NOMURA HOLDINGS, INC.

NOTES TO THE CONSOLIDATED FINANCIAL STATEMENTS—(Continued)


In September 2017 and November 2017, Nomura International (Hong Kong) Limited (“NIHK”) and Nomura Special Investments Singapore Pte Limited (“NSIS”) were respectively served with a complaint filed in the Taipei District Court against NIHK, NSIS, China Firstextile (Holdings) Limited (“FT”) and certain individuals by First Commercial Bank, Ltd., Land Bank of Taiwan Co., Ltd., Chang Hwa Commercial Bank Ltd., Taishin International Bank, E.Sun Commercial Bank, Ltd., CTBC Bank Co., Ltd., Hwatai Bank, Ltd. and Bank of Taiwan (collectively, “FT Syndicate Banks”). The FT Syndicate Banks’ complaint relates to a $100 million syndicated term loan facility to borrower FT that was arranged by NIHK, and made by the FT Syndicate Banks together with NSIS. The FT Syndicate Banks’ allegations in the complaint include tort claims under Taiwan law against the defendants. The FT Syndicate Banks sought to recover approximately $68 million in damages, plus interest. By judgment dated October 13, 2023, the Taipei District Court dismissed the FT Syndicate Banks’ claims in entirety. In November 2023, Statements of Appeal were filed by 7 of the 8 FT Syndicate Banks (First Commercial Bank, Ltd., Land Bank of Taiwan Co., Ltd., Chang Hwa Commercial Bank Ltd., Taishin International Bank, E.Sun Commercial Bank, Ltd., CTBC Bank Co., Ltd. and Bank of Taiwan, together the “Appellants”), indicating the Appellants’ intention to appeal the Taipei District Court decision to the Taiwan High Court. The case is transferred to the Taiwan High Court in February 2024 for appeal. The claim amount for the appeal is approximately $63 million in damages, plus interest.

In August 2017, the Cologne public prosecutor in Germany notified NIP that it is investigating possible tax fraud by individuals who worked for the Nomura Group in relation to the historic planning and execution of trading strategies around dividend record dates in certain German equities (known as “cum/ex” trading) and in relation to filings of tax reclaims in 2007 to 2013. During the year ended March 31, 2020, Nomura Group became aware that certain of those individuals would be the subject of investigative proceedings in Germany. NIP and another entity in the Nomura Group are cooperating with the investigation, including by disclosing to the public prosecutor certain documents and trading data, and Nomura Group premises in Frankfurt were raided by the public prosecutor in April 2023 for the purpose of obtaining additional data and documents. It appears that the investigation has expanded including to also now encompass cum/cum trading strategies in certain German equities. If the investigation involving Nomura Group entities and former individuals proceeds to trial, the individuals could face criminal sanctions and Nomura Group entities could face administrative sanctions such as administrative fines or profit confiscation orders.

In and after August 2022, Nomura Financial Advisory and Securities (India) Private Limited (“NFASI”) was served with seven commercial suits filed with the Bombay High Court, and one commercial suit filed with the City Civil Court of Mumbai, against NFASI and other parties. The lawsuits relate to the same equity disposal where the plaintiffs were eight of the sellers and NFASI acted as financial advisor to the sellers, and include allegations that NFASI failed to comply with its duties as financial advisor. The total claim amounts in the suits are approximately INR 5.2 billion in damages, plus interest.

In October 2024, NIP received a statement of claim from a Prosecutor of the Court of Auditors in Italy in relation to an advisory relationship NIP entered into with an Italian Regional counterparty in 2005. The claim alleges that NIP caused harm to the Italian Regional counterparty and as such civil damages of approximately EUR 122.8 million are payable.

The Company’s consolidated subsidiary, Nomura Securities Co., Ltd. (“NSC”), is addressing damages that occurred due to transactions such as the purchase and sale of securities and other financial instruments, conducted by third parties using customers’ assets through unauthorized access to securities accounts due to fraudulent activities, such as phishing. In regard to customer accounts that suffered damages since January 2025, NSC will handle each case based on the individual circumstances of each customer, including, at a maximum, restoring the accounts to the state prior to the unauthorized transactions.

In November 2025, a counterparty issued a claim in the English courts against NIP and Nomura Singapore Limited (“NSL”) alleging that they were charged excess sums and suffered damages for breach of contract in relation to certain derivative transactions entered into by the counterparty and either NIP or NSL between 2017 and 2023. The counterparty is seeking approximately $50 million, together with interest.

In addition to the matters described above, Nomura is also involved in other matters which can include ongoing lawsuits by counterparties or other third parties or former and current employees or formal and informal reviews, requests for information, audits, assessments and investigations by regulators, taxing authorities and other governmental agencies regarding certain business activities, which may include trading, financing, prime brokerage, market-making, advisory services, investment management services, financial reporting matters, and labor management, certain of which may result in adverse judgments, settlements, fines, penalties, injunctions or limitations on the ability to conduct certain business. These are not separately disclosed above on the basis that these are not currently considered significant.


267


Table of Contents

NOMURA HOLDINGS, INC.

NOTES TO THE CONSOLIDATED FINANCIAL STATEMENTS—(Continued)


Guarantees—

In the normal course of business, Nomura enters into various guarantee arrangements with counterparties in the form of standby letters of credit and other guarantees, which generally have a fixed expiration date.

In addition, Nomura enters into certain derivative contracts that meet the accounting definition of a guarantee, namely derivative contracts that contingently require a guarantor to make payment to a guaranteed party based on changes in an underlying that relate to an asset, liability or equity security held by a guaranteed party. Since Nomura does not track whether its clients enter into these derivative contracts for speculative or hedging purposes, Nomura includes relevant information about these derivative contracts that could meet the accounting definition of guarantees in the disclosure below.

For information about the maximum potential amount of future payments that Nomura could be required to make under these derivative contracts, the notional amount of contracts has been disclosed, except for certain derivative contracts, such as written interest rate caps and written currency options, the maximum potential payout amount cannot be estimated, as increases in interest or foreign exchange rates in the future could be theoretically unlimited.

The notional amounts do not represent anticipated losses from these derivatives contracts. As Nomura measures all derivative contracts at fair value, carrying value is considered the best indication of probability of payment and performance risks for these derivative contracts. Nomura may also reduce net exposures to certain of these contracts by entering into offsetting transactions or by entering into contracts that hedge the market risks related to these derivative contracts.

The following table presents information on Nomura’s derivative contracts that could meet the accounting definition of a guarantee and standby letters of credit and other guarantees.


     Millions of yen  
     March 31  
     2025      2026  
     Carrying
value
     Maximum
potential
payout /
Notional
total
     Carrying
value
     Maximum
potential
payout /
Notional
total
 

Derivative contracts(1)(2)

   ¥ 9,399,725      ¥ 609,318,612      ¥ 9,868,845      ¥ 649,090,164  

Standby letters of credit and other guarantees(3)

     —         4,939,056        6        5,222,432  
 
(1)

Credit derivatives are disclosed in Note 3 “Derivative instruments and hedging activities” and are excluded from above.

(2)

Derivative contracts primarily consist of equity, interest rate and foreign exchange contracts.

(3)

Primarily related to a certain sponsored repo program where Nomura guarantees to a third party clearing house in relation to its clients’ payment obligations. Our credit exposures under this guarantee is minimized by obtaining collateral from clients at amount approximately the maximum potential payout under the guarantee.

The following table presents maturity information on Nomura’s derivative contracts that could meet the accounting definition of a guarantee and standby letters of credit and other guarantees as of March 31, 2026.


     Millions of yen  
     Carrying
value
     Maximum potential payout/Notional  
     Total      Years to Maturity  
     Less than
1 year
     1 to 3
years
     3 to 5
years
     More than
5 years
 

Derivative contracts

   ¥ 9,868,845      ¥ 649,090,164      ¥ 172,240,897      ¥ 215,694,397      ¥ 61,022,285      ¥ 200,132,585  

Standby letters of credit and other guarantees

     6        5,222,432        5,189,429        18,628        11,126        3,249  


268


Table of Contents

NOMURA HOLDINGS, INC.

NOTES TO THE CONSOLIDATED FINANCIAL STATEMENTS—(Continued)


23. Segment and geographic information:

Operating segments—

Nomura’s operating management and management reporting are prepared based on the Wealth Management, the Investment Management, the Wholesale, and the Banking segments. Nomura structures its business segments based upon the nature of its main products and services, its client base and its management structure. Please refer to Note 4 “Revenue from services provided to customers” for types of products and services offered by each reportable segment and corresponding revenue. Nomura established a new Banking Division on April 1, 2025.

In its Wealth Management, Nomura provides investment consultation services mainly to individual clients in Japan. In its Investment Management segment, Nomura mainly provides various investment management services and investment solutions such as establishing and managing investment trusts, discretionary investment services for Japanese and overseas investors, investment and management for investment vehicles and for funds for institutional investors, and management of silent partnerships (“Tokumei kumiai”). In its Wholesale segment, Nomura engages in the sales and trading of debt and equity securities, foreign exchange contracts and derivatives globally, and provides investment banking services such as the underwriting and distribution of debt and equity securities as well as mergers and acquisitions and financial advisory. In its Banking segment, Nomura leverages the strengths of The Nomura Trust and Banking Co., Ltd. and Nomura Bank (Luxembourg) S.A. in private markets and bespoke products and meets the diverse needs of clients in areas such as asset building and estate planning. Nomura completed the Macquarie Acquisition on December 1, 2025. Results of the acquired business are reported under the Investment Management segment from December 1, 2025 onwards.

Nomura’s Chief Operating Decision Maker (“CODM”) is the Executive Management Board (“EMB”) which is the management function primarily responsible for assessing performance of and allocating resources to the business segments.

Revenues and expenses directly associated with each business segment are included in the operating results of each respective segment. Revenues and expenses that are not directly attributable to a particular segment are allocated to each respective business segment or included in “Other,” based upon Nomura’s allocation methodologies as used by management to assess each segment’s performance.

Business segments’ results are shown in the following tables. The EMB reviews business segment results including Net revenue, Non-interest expenses, and Income before income taxes on a regular basis. The EMB uses these measures along with certain segment-specific KPIs and budgets to evaluate segment performance and to make key operating decisions, including resource and capital allocations. Business segments’ information on total assets is not disclosed as EMB does not consider such information for its operating decisions and therefore, it is not reported.

Amounts for prior periods have been reclassified to conform to the presentation for the year ended March 31, 2026, in accordance with the realignment in April 2025.


269


Table of Contents

NOMURA HOLDINGS, INC.

NOTES TO THE CONSOLIDATED FINANCIAL STATEMENTS—(Continued)


     Millions of yen  
     Wealth
Management
     Investment
Management
     Wholesale     Banking      Other
(Incl. elimination)
     Total  

Year ended March 31, 2025


Non-interest revenue

   ¥ 422,617      ¥ 181,010      ¥ 1,015,803     ¥ 36,344      ¥ 154,657      ¥ 1,810,431  

Net interest revenue

     10,934        11,463        42,135       10,828        8,243        83,603  


Net revenue

     433,551        192,473        1,057,938       47,172        162,900        1,894,034  

Non-interest expenses(1)

     267,369        102,882        891,656       30,815        127,799        1,420,521  


Income before income taxes

   ¥ 166,182      ¥ 89,591      ¥ 166,282     ¥ 16,357      ¥ 35,101      ¥ 473,513  


Year ended March 31, 2026


Non-interest revenue

   ¥ 473,282      ¥ 248,388      ¥ 1,168,966     ¥ 42,081      ¥ 147,858      ¥ 2,080,575  

Net interest revenue

     14,624        10,128        (6,737     11,837        49,015        78,867  


Net revenue

     487,906        258,516        1,162,229       53,918        196,873        2,159,442  

Non-interest expenses(1)

     283,882        170,219        961,662       39,902        172,227        1,627,892  


Income before income taxes

   ¥ 204,024      ¥ 88,297      ¥ 200,567     ¥ 14,016      ¥ 24,646      ¥ 531,550  


(1)

Includes primarily personnel expenses, occupancy, technology, and professional fees.

Transactions between operating segments are recorded within segment results based on commercial terms and conditions and are eliminated in “Other.”

The following table presents the major components of Income before income taxes in “Other” for the years ended March 31, 2025 and 2026.


     Millions of yen  
     Year ended March 31  
     2025     2026  

Net gain (loss) related to economic hedging transactions

   ¥ (5,809   ¥ (2,940

Realized gain on investments in equity securities held for operating purposes

     1,475       3,349  

Equity in earnings of affiliates

     51,221       36,452  

Corporate items

     (5,884     (41,982

Other(1)(2)

     (5,902     29,767  


Total

   ¥      35,101     ¥      24,646  


(1)

Includes the impact of Nomura’s own creditworthiness.

(2)

On April 10, 2025, Nomura sold certain owned land and buildings located in Takanawa 2-chome, Minato-ku, Tokyo, for the effective utilization of its assets. The transaction counterparties included Nomura Real Estate Development Co., Ltd., a subsidiary of Nomura Real Estate Holdings, Inc., an affiliated company, and a third party financing company. Nomura considers the entire transaction to be with a related party. As a result of the sale, a gain of ¥56,144 million is included in RevenueOther in the consolidated statements of income for the year ended March 31, 2026.


270


Table of Contents

NOMURA HOLDINGS, INC.

NOTES TO THE CONSOLIDATED FINANCIAL STATEMENTS—(Continued)


The table below presents reconciliations of the combined business segments’ results included in the preceding table to Nomura’s reported Net revenue, Non-interest expenses and Income before income taxes in the consolidated statements of income for the years ended March 31, 2025 and 2026.


     Millions of yen  
     Year ended March 31  
     2025     2026  

Net revenue

   ¥ 1,894,034     ¥ 2,159,442  

Unrealized gain (loss) on investments in equity securities held for operating purposes(1)

     (1,549     8,271  


Consolidated net revenue

   ¥ 1,892,485     ¥ 2,167,713  


Non-interest expenses

   ¥ 1,420,521     ¥ 1,627,892  

Unrealized gain (loss) on investments in equity securities held for operating purposes

     —        —   


Consolidated non-interest expenses

   ¥   1,420,521     ¥   1,627,892  


Income before income taxes

   ¥ 473,513     ¥ 531,550  

Unrealized gain (loss) on investments in equity securities held for operating purposes(1)

     (1,549     8,271  


Consolidated income before income taxes

   ¥ 471,964     ¥ 539,821  


(1)

Includes a reversal of unrealized gain (loss) on investments in equity securities held for operating purposes that were sold in the years ended March 31, 2025 and 2026.

Geographic information—

Nomura’s identifiable assets, revenues and expenses are generally allocated based on the country of domicile of the legal entity providing the service. However, because of the integration of the global capital markets and the corresponding global nature of Nomura’s activities and services, it is not always possible to make a precise separation by location. As a result, various assumptions, which are consistent among years, have been made in presenting the following geographic data.

The tables below present a geographic allocation of Net revenue and Income (loss) before income taxes from operations by geographic areas for the years ended March 31, 2025 and 2026 and Long-lived assets associated with Nomura’s operations as of March 31, 2025 and 2026. Net revenue in Americas and Europe in the table substantially represents Nomura’s operations in the U.S. and the U.K., respectively. Net revenue and Long-lived assets have been allocated based on transactions with external customers while Income (loss) before income taxes has been allocated based on the inclusion of intersegment transactions.


     Millions of yen  
     Year ended March 31  
     2025      2026  

Net revenue(1):


Americas

   ¥ 589,122      ¥ 669,998  

Europe

     375,648        261,522  

Asia and Oceania

     61,730        148,415  


Subtotal

     1,026,500        1,079,935  

Japan

     865,985        1,087,778  


Consolidated

   ¥   1,892,485      ¥   2,167,713  


Income (loss) before income taxes:


Americas

   ¥ 65,753      ¥ 61,868  

Europe

     20,348        (31,128

Asia and Oceania

     50,878        60,790  


Subtotal

     136,979        91,530  

Japan

     334,985        448,291  


Consolidated

   ¥ 471,964      ¥ 539,821  


(1)

There is no revenue derived from transactions with a single major external customer.


271


Table of Contents

NOMURA HOLDINGS, INC.

NOTES TO THE CONSOLIDATED FINANCIAL STATEMENTS—(Continued)


     Millions of yen  
     Year ended March 31  
     2025      2026  

Long-lived assets:


Americas

   ¥ 111,312      ¥ 385,825  

Europe

     55,515        58,555  

Asia and Oceania

     31,656        41,112  


Subtotal

     198,483        485,492  

Japan

     270,693        363,151  


Consolidated

   ¥   469,176      ¥   848,643  


24. Related party transactions

Apart from transactions disclosed elsewhere in these consolidated financial statements, Nomura also makes loans to certain of its directors and other related parties. Outstanding loans to its directors and other related parties were not considered significant.

2. Unconsolidated Financial Statements

(1) Unconsolidated Financial Statements

1. Balance Sheets


            Millions of yen  
            March 31  
     Notes      2025     2026  

(ASSETS)


Current Assets


Cash and time deposits

      ¥ 149,655     ¥ 181,167  

Short-term loans receivable

        5,073,550       5,243,279  

Accounts receivable

        3,339       878  

Others

        275,187       252,904  


Total Current Assets

        5,501,732       5,678,228  


Fixed Assets


Tangible fixed assets

        35,808       55,634  

Buildings

        6,005       7,556  

Furniture and fixtures

        9,208       11,493  

Land

        0       0  

Construction in progress

        20,595       36,586  

Intangible assets

        76,170       89,098  

Software

        76,169       89,098  

Others

        0       0  

Investments and others

        5,468,736       6,169,214  

Investment securities

     *1        103,586       128,197  

Investments in subsidiaries and affiliates (at cost)

     *1        2,493,762       2,591,754  

Other securities of subsidiaries and affiliates

        50,819       25,182  

Long-term loans receivable from subsidiaries and affiliates

        2,714,583       3,317,813  

Long-term guarantee deposits

        21,223       20,387  

Deferred tax assets

        67,034       54,768  

Others

        17,752       31,136  

Allowance for doubtful accounts

        (23     (23


Total Fixed Assets

        5,580,713       6,313,946  


TOTAL ASSETS

      ¥ 11,082,445     ¥ 11,992,174  


272


Table of Contents
            Millions of yen  
            March 31  
     Notes      2025     2025  

(LIABILITIES)


Current Liabilities


Short-term borrowings

      ¥ 2,919,110     ¥ 3,419,997  

Bond due within one year

        550,231       549,013  

Collaterals received

        87,275       73,049  

Accrued income taxes

        6,723       3,571  

Accrued bonuses

        77,246       86,188  

Others

        106,542       102,394  


Total Current Liabilities

        3,747,126       4,234,213  

Long-term liabilities


Bonds payable

        2,684,987       3,112,292  

Long-term borrowings

        1,935,078       2,037,612  

Allowance for loss on business of subsidiaries and affiliates

        —        10,167  

Others

        139,243       115,567  


Total Long-term liabilities

        4,759,308       5,275,639  


TOTAL LIABILITIES

        8,506,434       9,509,851  


(NET ASSETS)


Shareholder’s equity


Common stock

        594,493       594,493  

Capital reserves


Additional paid-in capital

        559,676       559,676  


Total capital reserves

        559,676       559,676  

Earned surplus


Earned surplus reserve

        81,858       81,858  

Other Earned surplus


Earned surplus carried forward

        1,548,616       1,437,215  


Total earned surplus

        1,630,474       1,519,073  

Treasury stock

        (143,482     (154,897


Total shareholders’ equity

        2,641,161       2,518,344  

Valuation and translation adjustments


Net unrealized gain on investments

        29,008       37,582  

Deferred gains or loss on hedges

        (94,461     (73,674


Total valuation and translation adjustments

        (65,452     (36,091

Subscription rights to shares

        303       70  


TOTAL NET ASSETS

        2,576,011       2,482,323  


TOTAL LIABILITIES AND NET ASSETS

      ¥ 11,082,445     ¥   11,992,174  


273


Table of Contents

2. Statements of Income


            Millions of yen  
            Year ended March 31  
     Notes      2025     2026  

Operating revenue


Property and equipment fee revenue

      ¥ 110,475     ¥     123,896  

Rent revenue

        27,627       26,728  

Royalty on trademark

        53,505       60,952  

Dividend from subsidiaries and affiliates

          175,396       199,644  

Interest from affiliates

        274,818       270,803  

Others

        23,823       22,469  


Total operating revenue

        665,643       704,491  

Operating expenses


Compensation and benefits

        66,935       71,096  

Rental and maintenance

        39,387       38,242  

Data processing and office supplies

        85,192       87,331  

Depreciation and amortization

        29,310       30,348  

Taxes

        3,006       3,399  

Others

        8,776       9,440  

Interest expenses

        305,994       305,089  


Total operating expenses

        538,600       544,945  


Operating income

        127,043       159,546  


Non-operating revenue

        18,346       12,636  

Non-operating expenses

        4,711       10,803  


Ordinary income

        140,679       161,379  


Extraordinary profits


Gain on sales of investment securities

        1,511       2,574  

Compensation income

        —        523  

Gain on sales of subsidiaries and affiliates

        —        411  

Gain on reversal of subscription rights to shares

        93       58  

Gain on sales of fixed assets

        69       —   


Total extraordinary profits

        1,673       3,565  


Extraordinary losses


Loss on sales of investment securities

        35       26  

Loss on devaluation of investment securities

        190       340  

Loss on liquidation of subsidiaries and affiliates

        3,032       61  

Loss on devaluation of stocks of subsidiaries and affiliates

        1,132       14,193  

Provision for loss on business of subsidiaries and affiliates

        —        10,167  

Loss on sales and retirement of fixed assets

        590       649  


Total extraordinary losses

        4,980       25,436  


Income before income taxes

        137,372       139,509  


Income taxes—current

        9,124       6,803  

Income taxes—deferred

        (4,428     (259


Total income taxes

        4,696       6,544  


Net income

      ¥  132,675     ¥  132,964  


274


Table of Contents

3. Statements of Changes in Net Assets

(Year ended March 31, 2025)


     Millions of yen        
     Shareholders’ equity        
           Capital reserve      Earned surplus        
                              Other Earned
surplus
             
     Common
stock
    Additional
paid-in
capital
    Total
capital
reserve
     Earned
surplus
reserve
    Earned
surplus
carried
forward
    Total
Earned
surplus
       

Balance at April 1, 2024

   ¥ 594,493     ¥ 559,676     ¥ 559,676      ¥ 81,858     ¥ 1,537,390     ¥ 1,619,248    

Change in the term


Cash dividends

              (112,541     (112,541  

Net Income

              132,675       132,675    

Repurchases of treasury stock


Sale of treasury stock

              (8,908     (8,908  

Other-net


Total change in the year

     —        —        —         —        11,226       11,226    


Balance at March 31, 2025

   ¥ 594,493     ¥ 559,676     ¥ 559,676      ¥ 81,858     ¥ 1,548,616     ¥ 1,630,474    


Millions of yen

 
     Shareholders’ equity     Valuation and translation adjustments              
     Treasury
stock
    Total
Shareholders’
equity
    Net
unrealized
gain on
investments
     Deferred
gains or
loss on
hedges
    Total
Valuation and
translation
adjustments
    Subscription
rights to
shares
    Total
net assets
 

Balance at April 1, 2024

   ¥ (118,431   ¥ 2,654,986     ¥ 28,803      ¥ (143,162   ¥ (114,359   ¥ 270     ¥ 2,540,897  

Change in the term


Cash dividends

       (112,541              (112,541

Net Income

       132,675                132,675  

Repurchases of treasury stock

     (59,006     (59,006              (59,006

Sale of treasury stock

     33,955       25,047                25,047  

Other-net

         205        48,701       48,907       33       48,939  


Total change in the year

     (25,051     (13,825     205        48,701       48,907       33       35,114  


Balance at March 31, 2025

   ¥ (143,482   ¥ 2,641,161     ¥ 29,008      ¥ (94,461   ¥ (65,452   ¥ 303     ¥ 2,576,011  


275


Table of Contents

(Year ended March 31, 2026)


     Millions of yen        
     Shareholders’ equity        
           Capital reserve      Earned surplus        
                              Other Earned
surplus
             
     Common
stock
    Additional
paid-in
capital
    Total
capital
reserve
     Earned
surplus
reserve
    Earned
surplus
carried
forward
    Total
Earned
surplus
       

Balance at April 1, 2025

   ¥ 594,493     ¥ 559,676     ¥ 559,676      ¥ 81,858     ¥ 1,548,616     ¥ 1,630,474    

Change in the term


Cash dividends

              (179,742     (179,742  

Net Income

              132,964       132,964    

Repurchases of treasury stock


Sale of treasury stock

              (6,958     (6,958  

Cancellation of treasury stock

              (57,666     (57,666  

Other-net


Total change in the year

     —        —        —         —        (111,401     (111,401  


Balance at March 31, 2026

   ¥ 594,493     ¥ 559,676     ¥ 559,676      ¥ 81,858     ¥ 1,437,215     ¥ 1,519,073    


Millions of yen

 
     Shareholders’ equity     Valuation and translation adjustments              
     Treasury
stock
    Total
Shareholders’
equity
    Net
unrealized
gain on
investments
     Deferred
gains or
loss on
hedges
    Total
Valuation
and
translation
adjustments
    Subscription
rights to
shares
    Total
net assets
 

Balance at April 1, 2025

   ¥ (143,482   ¥ 2,641,161     ¥ 29,008      ¥ (94,461   ¥ (65,452   ¥ 303     ¥ 2,576,011  

Change in the term


Cash dividends

       (179,742              (179,742

Net Income

       132,964                132,964  

Repurchases of treasury stock

     (101,499     (101,499              (101,499

Sale of treasury stock

     32,418       25,460                25,460  

Cancellation of treasury stock

     57,666       —                 —   

Other-net

         8,574        20,787       29,361       (232     29,128  


Total change in the year

     (11,415     (122,817     8,574        20,787       29,361       (232     (93,688


Balance at March 31, 2026

   ¥ (154,897   ¥ 2,518,344     ¥ 37,582      ¥ (73,674   ¥ (36,091   ¥ 70     ¥ 2,482,323  


276


Table of Contents

[Notes to the Financial Statements]

(Significant Accounting Policies)

1. Basis and methods of valuation for financial instruments

(1) Other securities

a. Securities other than shares without market value

Recorded at market value

The difference between the cost using the moving average method or amortized cost and market value less deferred taxes is recorded as Net unrealized gain on investments in Net assets on the balance sheet.

b. Shares without market value

Recorded at cost using the moving average method or amortized cost

With respect to investments in investment enterprise partnerships and similar ones which are regarded as equivalent to securities in accordance with Paragraph 2, Article 2 of the Financial Instruments and Exchange Act, the pro rata shares of such partnerships are recorded at net asset values based on the available current financial statements on the reporting date set forth in the partnership agreements.

(2) Stocks of subsidiaries and affiliates

Recorded at cost using the moving average method

2. Basis and method of valuation for derivative transaction

Accounted for at fair value based on the mark-to-market method

3. Depreciation and amortization

(1) Depreciation of tangible fixed assets

Tangible fixed assets are depreciated primarily on the declining balance method, except for buildings (excluding equipment of the buildings) acquired on or after April 1, 1998 and equipment of the buildings and structures acquired on or after April 1, 2016 which are depreciated on the straight-line method.

(2) Amortization of intangible assets, investments and others

Intangible assets, investments and others are amortized over their estimated useful lives primarily on the straight-line method. The useful lives of software are based on those determined internally.

4. Deferred Assets

Bond issuance costs

Bond issuance costs are expensed upon incurred.

5. Translation of assets and liabilities denominated in foreign currencies

Financial assets and liabilities denominated in foreign currencies are translated into Japanese yen using exchange rates as of the balance sheet date. Gains and losses resulting from translation are reflected in the statement of income.

6. Provisions

(1) Allowance for doubtful accounts

To provide for bad loans, the Company recorded an allowance for doubtful accounts based on an estimate of the uncollectible amounts calculated using historical loss ratios or a reasonable estimate based on the financial condition of individual borrowers.

(2) Accrued bonuses

To prepare for bonus payments to employees, the estimated amount was recorded in accordance with the prescribed calculation method.

(3) Allowance for loss on business of subsidiaries and affiliates

Allowance for loss on business of subsidiaries and affiliates is made at an estimated amount of loss.


277


Table of Contents

7. Recognition criteria for revenue and expenses

The primary types of service provided to customers are as follows;

For royalty fees for the use of the “Nomura” trademark, performance obligations are satisfied over service providing period of time. The performance obligations are normally judged to be satisfied over the term of the contracts and are recognized as “Royalty on trademarks” based on revenue of the service recipient.

For revenue from providing outsourcing services, performance obligations are satisfied over service providing period of time. The performance obligations are normally judged to be satisfied over the term of the contracts and are recognized as “Other operating revenue” on a straight-line basis.

8. Hedging activities

(1) Hedge accounting

Mark-to-market profits and losses on hedging instruments are deferred as assets or liabilities until the profits or losses on the underlying hedged items are realized for interest rate risk hedge and foreign currency risk hedge. Fair value hedge is applied and all the profits and losses are recognized for share price risk hedge.

(2) Hedging instrument and hedged item

The Company utilizes interest rate swap contracts to hedge the interest rate risk on bonds and borrowings that the Company issued. The Company utilizes currency forward contracts and long-term foreign currency liabilities including long-term bonds issued to hedge foreign currency risk on investments in subsidiaries. Additionally, the Company utilizes total return swap contracts to hedge share price risk on a part of investment securities.

(3) Hedging policy

As a general rule, the interest rate risk on bonds and borrowings is fully hedged until maturity. Foreign currency investment in subsidiaries is hedged by currency forward contracts and long-term foreign currency liabilities including long-term bonds issued. A part of investment securities is hedged by total return swap contracts.

(4) Valuating the validity of hedging instruments

Regarding to the hedge of the interest risk and foreign currency risk, the Company regularly verifies the result of risk offsetting by each hedging instrument and hedged item, and verifies the validity of the hedge. For the hedge of share price risk, the Company verifies the hedge effectiveness by comparing the change in fair value of each investment security and total return swap contract.

9. Consumption taxes and local consumption taxes are accounted for based on the tax exclusion method.

(Significant Accounting Estimates)

1. Realization of deferred tax assets

(1) The following information present deferred tax assets for the year ended March 31, 2025 and March 31, 2026.

March 31,2025 67,034 million yen

March 31,2026 54,768 million yen

(2) Content information which were identified as considerable accounting estimates

The Company recognized deferred tax assets to extent it believes that it is more likely than not that a benefit will be realized against future taxable income in a future deductible amount and unused tax loss carried forward. Future taxable income is computed based on taxable income more likely to be realized in the future, which timing and amount is reasonably estimated. Deferred tax assets are reviewed at the fiscal year end and in case deferred tax assets is determined to have no possible benefit of tax relief in the future, the Company may reduce the deferred tax assets recognized in balance sheets. See “Tax Effect Accounting” in financial statement included in this annual report for further information regarding the deferred tax assets that the Company currently recognize.


278


Table of Contents

(Balance Sheets)

*1. Securities deposited

(March 31, 2025)

The Company loaned investment securities (mainly investments in subsidiaries and affiliates) with a book value of ¥11,203 million based on securities lending agreements contracts which provide borrowers with the rights to resell or repledge the securities.

(March 31, 2026)

The Company loaned investment securities (mainly investments in subsidiaries and affiliates) with a book value of ¥13,122 million based on securities lending agreements contracts which provide borrowers with the rights to resell or repledge the securities.

2. Financial guarantee(1)


(March 31, 2025)  
Millions of yen  

Nomura Global Finance Co., Ltd.


Borrowings/Medium term notes/

Repurchase transactions

     2,695,770  

Nomura International Funding Pte. Ltd.


Borrowings/Medium term notes/

Repurchase transactions

     1,986,675 (2) 

Nomura Europe Finance N.V.


Borrowings/Medium term notes/

Repurchase transactions

     821,199 (3) 

Nomura International plc


Borrowings/Medium term notes/

Repurchase transactions

     808,271  

Nomura International plc

   Derivative transactions      511,264 (3) 

Nomura Global Financial Products Inc.

   Derivative transactions      498,813 (3) 

Nomura Bank International plc


Borrowings/Medium term notes/

Repurchase transactions

     408,259  

Nomura Corporate Funding Americans, LLC


Borrowings/Medium term notes/

Repurchase transactions

     212,617  

Nomura America Finance, LLC


Borrowings/Medium term notes/

Repurchase transactions

     179,734  

Other

        280,572 (3) 
(March 31, 2026)  
Millions of yen  

Nomura Global Finance Co.,Ltd.


Borrowings/Medium term notes/

Repurchase transactions

     2,886,321  

Nomura International Funding Pte. Ltd.


Borrowings/Medium term notes/

Repurchase transactions

     2,671,311 (2) 

Nomura International plc


Borrowings/Medium term notes/

Repurchase transactions

     1,120,427  

Nomura Europe Finance N.V.


Borrowings/Medium term notes/

Repurchase transactions

     879,724 (3) 

Nomura International plc

   Derivative transactions      743,119 (3) 

Nomura Corporate Funding Americans, LLC


Borrowings/Medium term notes/

Repurchase transactions

     567,421  

Nomura Bank International plc


Borrowings/Medium term notes/

Repurchase transactions

     421,515  

Nomura Global Financial Products Inc.

   Derivative transactions      362,242 (3) 

Nomura America Finance, LLC


Borrowings/Medium term notes/

Repurchase transactions

     342,059  

Other

        320,558  
 
(1)

In accordance with Japan Institute of Certified Public Accountants Audit and Assurance Practice Committee Practical Guideline No. 61, items recognized as effectively bearing the obligation of guarantee of liabilities are included in notes items equivalent to guaranteed obligations.


279


Table of Contents
(2)

Includes joint guarantee with Nomura International (Hong Kong) Limited.

(3)

Includes joint guarantee with Nomura Securities Co., Ltd.

3. Balance with Subsidiaries and Affiliates

Balances with subsidiaries and affiliates are as follows:


     Millions of yen  
   March 31  
   2025      2026  

Short-term receivables

   ¥  5,339,981      ¥  5,610,325  

Short-term payables

     2,993,943        3,467,446  

Long-term receivables

     2,745,295        3,230,761  

Long-term payables

     1,798,271        1,898,826  

4. Commitments

The Company has provided commitments to extend subordinated credits to its subsidiaries.


     Millions of yen  
     March 31  
     2025      2026  

Total commitment available

   ¥  1,100,000      ¥  1,100,000  

Less amount utilized

     815,803        856,802  


Balance available

   ¥ 284,197      ¥ 243,198  


280


Table of Contents

(Statements of Income)

1. Transactions with subsidiaries and affiliates


     Millions of yen  
   Year ended March 31  
   2025      2026  

Operating revenue

   ¥   648,893      ¥   690,054  

Operating expenses

     262,561        267,636  

Non-operating transactions

     6,237        21,588  


281


Table of Contents

(Securities)

Stocks of subsidiaries and affiliates with market value


     Millions of yen  
     March 31, 2025  
     Book Value      Market Value         Difference     

Subsidiaries

   ¥ 31      ¥ 551      ¥ 519  

Affiliates

       83,723          841,648          757,925  


     Millions of yen  
     March 31, 2026  
     Book Value      Market Value         Difference     

Subsidiaries

   ¥ 31      ¥ 728      ¥ 697  

Affiliates

       83,723          828,516          744,793  

Stocks of subsidiaries and affiliates without market value which are not included in above.


     Millions of yen  
     March 31, 2025      March 31, 2026  
     Book Value      Book Value  

Subsidiaries

   ¥ 2,406,315      ¥ 2,504,499  

Affiliates

     3,693        3,500  


Total

   ¥ 2,410,007      ¥ 2,508,000  


282


Table of Contents

(Tax Effect Accounting)

1. Breakdown of deferred tax assets and liabilities


     Millions of yen  
     March 31  
     2025     2026  

Deferred tax assets


Loss on devaluation of securities

   ¥ 134,369     ¥ 137,507  

Deferred loss on hedges

     43,852       34,294  

Derivatives

     7,283       7,666  

Loss carry-forward on local tax

     5,945       5,019  

Allowance for loss on business of subsidiaries and affiliates

     —        3,203  

Loss on devaluation of fixed assets

     2,411       2,421  

Others

     2,869       3,052  


Subtotal of deferred tax assets

     196,730       193,162  

Valuation allowance for tax loss carryforwards

     (4,306     (3,632

Valuation allowance for deferred temporary differences

     (114,306     (120,477


Valuation allowance

     (118,612     (124,108


Total of deferred tax assets

     78,118       69,054  

Deferred tax liabilities


Net unrealized gain on investments

     (9,169     (13,096

Deferred gain on hedges

     (1,594     (634

Others

     (321     (556


Total of deferred tax liabilities

     (11,084     (14,286


Net deferred tax assets

   ¥ 67,034     ¥ 54,768  


2. Major differences between the statutory effective tax rate and the corporate tax rate after tax effect accounting application


     Percentage tax rate  
     March 31  
     2025     2026  

Statutory effective tax rate

           31.0          31.0

Permanent differences excluded from revenues

     (40.0     (43.8

Permanent differences excluded from expenses

     11.4       12.7  

Valuation allowance

     (1.7     3.5  

Accumulated earning tax of overseas subsidiaries

     4.3       1.7  

Income taxes—prior year adjustments

     (0.4     (0.6

Foreign Tax Credit

     (1.0     (0.5

Applicable tax rate differences

     0.2       0.1  

Others

     (0.4     0.6  


Corporate tax rate after tax effect accounting

     3.4       4.7  


3. Accounting treatment for corporate tax, local corporate tax, and the related tax effect

The Company applies the Group Tax Sharing System. In addition, the Company follows the “Practical Solution on the Accounting and Disclosure Under the Group Tax Sharing System” (Practical Solution No.42, August 12, 2021) for accounting and disclosures of the corporate tax, local corporate tax, and the related tax effect.


283


Table of Contents

(Significant Subsequent Events)

Grant of Restricted Stock Units

On May 14, 2026, the Company passed a resolution to grant Restricted Stock Units (“RSUs”) to directors, executive officers and/or employees of the Company and/or its subsidiaries, etc. The number of RSUs is 29,736,800 units (29,736,800 shares equivalent). RSUs are to deliver shares of common stock of the Company to grantees from one year to the maximum of four years after the RSUs are granted. Until last year, the Company granted RSUs to employees subject to compensation regulations, with an allotment date of about seven years from the date of the decision to dispose of treasury shares. However, following amendments to the regulations, this year the Company granted RSUs with an allotment date of about four years after the date of the disposal decision.

Performance Share Units

On May 14, 2026, the Company passed a resolution to grant Performance Share Units (“PSUs”) to executive officers of the Company. The base number of shares has been calculated as 541,000 shares, and the number of shares when applying a payout rate of 150% is 811,500 shares. PSUs are to deliver shares of common stock of the Company to grantees depending on the degree of achievement of the performance targets for the three fiscal years. The settlement of the PSUs will be primarily in treasury stock.


284


Table of Contents

[Translation]

Independent Auditor’s Report

June 22, 2026

The Board of Directors

Nomura Holdings, Inc.


Ernst & Young ShinNihon LLC

Tokyo, Japan

Toyohiro Fukata
Designated Engagement Partner
Certified Public Accountant
Shinichi Hayashi
Designated Engagement Partner
Certified Public Accountant
Mitsuhiro Nagao
Designated Engagement Partner
Certified Public Accountant
Toshiro Kuwata
Designated Engagement Partner
Certified Public Accountant

The Audit of the Consolidated Financial Statements

Opinion

Pursuant to the audit requirement of the rule specified in the Article 193-2, Section 1 of the Financial Instruments and Exchange Act, we have audited the consolidated financial statements, which comprise the consolidated balance sheet, the consolidated statements of income, comprehensive income, changes in equity, and cash flows, notes to the consolidated financial statements and the consolidated supplementary schedules of Nomura Holdings, Inc. (the “Company”) applicable to the fiscal year from April 1, 2025 to March 31, 2026, included in the “Financial Information” section.

In our opinion, the consolidated financial statements referred to above present fairly, in all material respects, the financial position of the Company and its consolidated subsidiaries (the “Group”) as of March 31, 2026 and the consolidated results of their operations and cash flows for the fiscal year then ended, in accordance with accounting principles generally accepted in the United States of America pursuant to Article 316 of “Regulations Concerning the Terminology, Forms and Preparation Methods of Consolidated Financial Statements”.

Basis for Opinion

We conducted our audit in accordance with auditing standards generally accepted in Japan. Our responsibilities under those standards are further described in the “Auditor’s Responsibilities for the Audit of the Consolidated Financial Statements” section of our report. We are independent of the Group in accordance with the ethical requirements that are relevant to our audit of the financial statements in Japan, including those applicable to audits of financial statements of public interest entities, and we have fulfilled our other ethical responsibilities in accordance with these requirements. We believe that the audit evidence we have obtained is sufficient and appropriate to provide a basis for our opinion.


285


Table of Contents

Key Audit Matter

Key audit matter is that matter that, in our professional judgment, was of most significance in our audit of the consolidated financial statements of the current period. This matter was addressed in the context of the audit of the consolidated financial statements as a whole, and in forming the auditor’s opinion thereon, and we do not provide a separate opinion on this matter.


Fair value of certain level 3 financial instruments
   
Description of Key Audit Matter    Auditor’s Response

The Company holds financial instruments for trading, customer facilitation and investment purposes. As disclosed in Note 2 to the consolidated financial statements as of March 31, 2026, the Company had ¥ 1,654 billion and ¥ 939 billion of primarily financial instrument assets and liabilities recorded at fair value on a recurring basis, respectively, categorized within Level 3 of the fair value hierarchy. In determining the fair value of these financial instruments, the Company used valuation models and unobservable inputs which reflect its assumptions and specific data. These inputs are significant to the fair value of the financial instruments and are supported by little or no market activity as of March 31, 2026. The valuation techniques applied by management to determine the fair value of such instruments are described in Note 2 to the consolidated financial statements.


Auditing the fair value of certain Level 3 financial instruments was complex and highly judgmental due to the subjectivity of the judgments used and estimations made by management in determining the fair value for these financial instruments. In particular, to value certain financial instruments, management used a variety of valuation techniques which involved certain underlying valuation assumptions and significant unobservable inputs, including weighted average cost of capital, growth rates, volatilities, correlations, credit spreads, recovery rates, loss severities, prepayment rates, default probabilities and yields.


We obtained an understanding, evaluated the design and tested the operating effectiveness of controls relating to the valuation models and significant unobservable inputs used in fair value measurement. This included the testing of model validation controls by various departments within the Company.


Our audit procedures to evaluate the valuation techniques used by the Company included, among others, testing valuation models and significant unobservable inputs.


For certain of these financial instruments, we independently developed fair value estimates for which we involved our valuation specialists to assist with the application of these procedures and compared them to the Company’s results, on a sample basis.


We also agreed significant unobservable inputs and underlying data used in the Company’s valuation models to information available from third party sources and market data, where available.


We evaluated subsequent transactions, where available, for certain Level 3 financial instruments and considered whether they corroborate or contradict the Company’s year-end valuations.

Other Information

The other information included in the Annual Securities Report comprises information other than the consolidated financial statements, the financial statements, and our auditor’s reports thereon. Management is responsible for preparation and disclosure of the other information. The Audit Committee is responsible for overseeing the Group’s reporting process of the other information.

Our opinion on the consolidated financial statements does not cover the other information and we do not express any form of assurance conclusion thereon.

In connection with our audit of the consolidated financial statements, our responsibility is to read the other information and, in doing so, consider whether the other information is materially inconsistent with the consolidated financial statements or our knowledge obtained in the audit or otherwise appears to be materially misstated.

If, based on the work we have performed, we conclude that there is a material misstatement of this other information, we are required to report that fact.

We have nothing to report in this regard.


286


Table of Contents

Responsibilities of Management and the Audit Committee for the Consolidated Financial Statements

Management is responsible for the preparation and fair presentation of these consolidated financial statements in accordance with accounting principles generally accepted in the United States of America, and for such internal control as management determines is necessary to enable the preparation of consolidated financial statements that are free from material misstatement, whether due to fraud or error.

In preparing the consolidated financial statements, management is responsible for assessing the Group’s ability to continue as a going concern and disclosing, as required by accounting principles generally accepted in the United States of America, matters related to going concern.

The Audit Committee is responsible for overseeing the Group’s financial reporting process.

Auditor’s Responsibilities for the Audit of the Consolidated Financial Statements

Our objectives are to obtain reasonable assurance about whether the consolidated financial statements as a whole are free from material misstatement, whether due to fraud or error, and to issue an auditor’s report that includes our opinion. Misstatements can arise from fraud or error and are considered material if, individually or in the aggregate, they could reasonably be expected to influence the economic decisions of users taken on the basis of these consolidated financial statements.

As part of an audit in accordance with auditing standards generally accepted in Japan, we exercise professional judgment and maintain professional skepticism throughout the audit. We also:


Identify and assess the risks of material misstatement of the consolidated financial statements, whether due to fraud or error, design and perform audit procedures responsive to those risks, and obtain audit evidence that is sufficient and appropriate to provide a basis for our opinion.


Consider internal control relevant to the audit in order to design audit procedures that are appropriate in the circumstances for our risk assessments, while the purpose of the audit of the consolidated financial statements is not expressing an opinion on the effectiveness of the Group’s internal control.


Evaluate the appropriateness of accounting policies used and the reasonableness of accounting estimates and related disclosures made by management.


Conclude on the appropriateness of management’s use of the going concern basis of accounting and, based on the audit evidence obtained, whether a material uncertainty exists related to events or conditions that may cast significant doubt on the Group’s ability to continue as a going concern. If we conclude that a material uncertainty exists, we are required to draw attention in our auditor’s report to the related disclosures in the consolidated financial statements or, if such disclosures are inadequate, to modify our opinion. Our conclusions are based on the audit evidence obtained up to the date of our auditor’s report. However, future events or conditions may cause the Group to cease to continue as a going concern.


Evaluate the overall presentation, structure and content of the consolidated financial statements, including the disclosures, and whether the consolidated financial statements represent the underlying transactions and events in a manner that achieves fair presentation in accordance with accounting principles generally accepted in the United States of America.


Plan and perform the group audit to obtain sufficient appropriate audit evidence regarding the financial information of the entities or business units within the Group as a basis for forming an opinion on the consolidated financial statements. We are responsible for the direction, supervision and review of the group audit. We remain solely responsible for our audit opinion.

We communicate with the Audit Committee regarding, among other matters, the planned scope and timing of the audit and significant audit findings, including any significant deficiencies in internal control that we identify during our audit.

We also provide the Audit Committee with a statement that we have complied with the ethical requirements regarding independence that are relevant to our audit of the consolidated financial statements in Japan, and to communicate with them all relationships and other matters that may reasonably be thought to bear on our independence, and where applicable, actions taken to eliminate threats or safeguards applied to reduce threats to an acceptable level.

From the matters communicated with the Audit Committee, we determine those matters that were of most significance in the audit of the consolidated financial statements of the current period and are therefore the key audit matters. We describe these matters in our auditor’s report unless law or regulation precludes public disclosure about the matter or when, in extremely rare circumstances, we determine that a matter should not be communicated in our report because the adverse consequences of doing so would reasonably be expected to outweigh the public interest benefits of such communication.

Audit of the internal control over financial reporting

Opinion on Internal Control over Financial Reporting

We have audited the Group’s internal control over financial reporting as of March 31, 2026, based on criteria established in Internal Control—Integrated Framework issued by the Committee of Sponsoring Organizations of the Treadway Commission (2013 framework) (the “COSO criteria”).


287


Table of Contents

In our opinion, the Group maintained, in all material respects, effective internal control over financial reporting as of March 31, 2026, based on the COSO criteria.

Basis for Opinion

The Group’s management is responsible for maintaining effective internal control over financial reporting and for its assessment of the effectiveness of internal control over financial reporting included in the accompanying Management’s Report on Internal Control over Financial Reporting. Our responsibility is to express an opinion on the Group’s internal control over financial reporting based on our audit. We are a public accounting firm registered with the Public Company Accounting Oversight Board (the “PCAOB”) and are required to be independent with respect to the Group in accordance with the U.S. federal securities laws and the applicable rules and regulations of the Securities and Exchange Commission and the PCAOB.

We conducted our audit in accordance with the standards of the PCAOB. Those standards require that we plan and perform the audit to obtain reasonable assurance about whether effective internal control over financial reporting was maintained in all material respects. Our audit included obtaining an understanding of internal control over financial reporting, assessing the risk that a material weakness exists, testing and evaluating the design and operating effectiveness of internal control based on the assessed risk, and performing such other procedures as we considered necessary in the circumstances. We believe that our audit provides a reasonable basis for our opinion.

Emphasis of Matter

As indicated in the accompanying Management’s Report on Internal Control over Financial Reporting, management’s assessment of the effectiveness of internal control over financial reporting as of March 31, 2026 did not include the internal controls over financial reporting of Macquarie Management Holdings, Inc., Macquarie Investment Management Holdings (Luxembourg) S.à r.l., and Macquarie Investment Management Holdings (Austria) GmbH acquired on December 1, 2025 (collectively, the “Acquired Companies”), which is constituted 0.2% of consolidated total assets as of March 31, 2026 and 1.7% of consolidated total net revenues for the year then ended.

Our audit of internal control over financial reporting of the Group also did not include an evaluation of the internal control over financial reporting of the Acquired Companies.

Key Differences from Audit of Internal Control in Japan

We conducted the audit of the Group’s internal control over financial reporting in accordance with the PCAOB Standards. The key differences from an audit under auditing standards for internal control over financial reporting generally accepted in Japan (the Japanese Standards) are as follows:


  1.

An opinion is expressed on Management’s Report on Internal Control Over Financial Reporting under the Japanese Standards while an opinion is expressed on the company’s internal control over financial reporting under the PCAOB Standards.


  2.

The audit scope includes the financial statements and the disclosures that could have a material effect on the reliability of the financial statements under the Japanese Standards while the audit scope only includes internal control over preparation of the financial statements contained in the “Financial Information” section under the PCAOB Standards, as defined above.


  3.

The audit covers internal control performed at affiliated companies that are accounted for by the equity method under the Japanese Standards while such internal control is not covered under the PCAOB Standards.

Definition and Limitations of Internal Control Over Financial Reporting

A company’s internal control over financial reporting is a process designed to provide reasonable assurance regarding the reliability of financial reporting and the preparation of financial statements for external purposes in accordance with generally accepted accounting principles. A company’s internal control over financial reporting includes those policies and procedures that (1) pertain to the maintenance of records that, in reasonable detail, accurately and fairly reflect the transactions and dispositions of the assets of the company; (2) provide reasonable assurance that transactions are recorded as necessary to permit preparation of financial statements in accordance with generally accepted accounting principles, and that receipts and expenditures of the company are being made only in accordance with authorizations of management and directors of the company; and (3) provide reasonable assurance regarding prevention or timely detection of unauthorized acquisition, use, or disposition of the company’s assets that could have a material effect on the financial statements.

Because of its inherent limitations, internal control over financial reporting may not prevent or detect misstatements. Also, projections of any evaluation of effectiveness to future periods are subject to the risk that controls may become inadequate because of changes in conditions, or that the degree of compliance with the policies or procedures may deteriorate.


288


Table of Contents

Fee-related Information

The fees for the audits of the financial statements of the Group and other services provided by us and other EY member firms for the year ended March 31, 2026 are presented in paragraph (3) titled “Status of audit” in Section 4 “Status of Corporate Governance and Other” included in Item 4 “Company Information” in Part 1 of the Annual Securities Report.

Interest Required to Be Disclosed by the Certified Public Accountants Act of Japan

Our firm and its designated engagement partners do not have any interest in the Group which is required to be disclosed pursuant to the provisions of the Certified Public Accountants Act of Japan.

(Note)

This is an English translation of the Japanese language Independent Auditor’s Report issued by Ernst & Young ShinNihon LLC in connection with the audit of the consolidated financial statements of the Group, prepared in Japanese, for the year ended March 31, 2026 and the Group’s internal control over financial reporting as of March 31, 2026. Ernst & Young ShinNihon LLC have not audited the English language version of the consolidated financial statements for the above-mentioned year, which are included in this report of foreign private issuer on Form 6-K.


289


Table of Contents

[Translation]

Independent Auditor’s Report

June 22, 2026

The Board of Directors

Nomura Holdings, Inc.


Ernst & Young ShinNihon LLC

Tokyo, Japan

Toyohiro Fukata
Designated Engagement Partner
Certified Public Accountant
Shinichi Hayashi
Designated Engagement Partner
Certified Public Accountant
Mitsuhiro Nagao
Designated Engagement Partner
Certified Public Accountant
Toshiro Kuwata
Designated Engagement Partner
Certified Public Accountant

The Audit of the Financial Statements

Opinion

Pursuant to the audit requirement of the rule specified in the Article 193-2, Section 1 of the Financial Instruments and Exchange Act, we have audited the financial statements, which comprise the balance sheet, the statements of income, and changes in net assets, significant accounting policies, other explanatory information and the supplementary schedules of Nomura Holdings, Inc. (the “Company”) applicable to the 122nd fiscal year from April 1, 2025 to March 31, 2026, included in the “Financial Information” section.

In our opinion, the accompanying financial statements referred to above present fairly, in all material respects, the financial position of the Company as of March 31, 2026 and the results of operations of the Company for the fiscal year then ended, in accordance with accounting principles generally accepted in Japan.

Basis for Opinion

We conducted our audit in accordance with auditing standards generally accepted in Japan. Our responsibilities under those standards are further described in the Auditor’s Responsibilities for the Audit of the Financial Statements section of our report. We are independent of the Company in accordance with the ethical requirements that are relevant to our audit of the financial statements in Japan, including those applicable to audits of financial statements of public interest entities, and we have fulfilled our other ethical responsibilities in accordance with these requirements. We believe that the audit evidence we have obtained is sufficient and appropriate to provide a basis for our opinion.

Key Audit Matters

Key audit matters are those matters that, in our professional judgment, were of most significance in our audit of the financial statements of the current period. These matters were addressed in the context of the audit of the financial statements as a whole, and in forming the auditor’s opinion thereon, and we do not provide a separate opinion on these matters.

We determined that there are no key audit matters to communicate in our report.

Other Information

The other information included in the Annual Securities Report comprises information other than the consolidated financial statements, the financial statements and our auditor’s reports thereon. Management is responsible for preparation and disclosure of the other information. The Audit Committee is responsible for overseeing the Company’s reporting process of the other information.


290


Table of Contents

Our opinion on the financial statements does not cover the other information and we do not express any form of assurance conclusion thereon.

In connection with our audit of the financial statements, our responsibility is to read the other information and, in doing so, consider whether the other information is materially inconsistent with the financial statements or our knowledge obtained in the audit or otherwise appears to be materially misstated.

If, based on the work we have performed, we conclude that there is a material misstatement of this other information, we are required to report that fact.

We have nothing to report in this regard.

Responsibilities of Management and the Audit Committee for the Financial Statements

Management is responsible for the preparation and fair presentation of these financial statements in accordance with accounting principles generally accepted in Japan, and for such internal control as management determines is necessary to enable the preparation of financial statements that are free from material misstatement, whether due to fraud or error.

In preparing the financial statements, management is responsible for assessing the Company’s ability to continue as a going concern and disclosing, as required by accounting principles generally accepted in Japan, matters related to going concern.

The Audit Committee is responsible for overseeing the Company’s financial reporting process.

Auditor’s Responsibilities for the Audit of the Financial Statements

Our objectives are to obtain reasonable assurance about whether the financial statements as a whole are free from material misstatement, whether due to fraud or error, and to issue an auditor’s report that includes our opinion. Misstatements can arise from fraud or error and are considered material if, individually or in the aggregate, they could reasonably be expected to influence the economic decisions of users taken on the basis of these financial statements.

As part of an audit in accordance with auditing standards generally accepted in Japan, we exercise professional judgment and maintain professional skepticism throughout the audit. We also:


Identify and assess the risks of material misstatement of the financial statements, whether due to fraud or error, design and perform audit procedures responsive to those risks, and obtain audit evidence that is sufficient and appropriate to provide a basis for our opinion.


Consider internal control relevant to the audit in order to design audit procedures that are appropriate in the circumstances for our risk assessments, while the purpose of the audit of the financial statements is not expressing an opinion on the effectiveness of the Company’s internal control.


Evaluate the appropriateness of accounting policies used and the reasonableness of accounting estimates and related disclosures made by management.


Conclude on the appropriateness of management’s use of the going concern basis of accounting and, based on the audit evidence obtained, whether a material uncertainty exists related to events or conditions that may cast significant doubt on the Company’s ability to continue as a going concern. If we conclude that a material uncertainty exists, we are required to draw attention in our auditor’s report to the related disclosures in the financial statements or, if such disclosures are inadequate, to modify our opinion. Our conclusions are based on the audit evidence obtained up to the date of our auditor’s report. However, future events or conditions may cause the Company to cease to continue as a going concern.


Evaluate the overall presentation, structure and content of the financial statements, including the disclosures, and whether the financial statements represent the underlying transactions and events in a manner that achieves fair presentation in accordance with accounting principles generally accepted in Japan.


Plan and perform the audit to obtain sufficient and appropriate audit evidence regarding the financial information of the components within the Company as a basis for forming an opinion on the financial statements. We are responsible for the direction, supervision and review of the audit of the financial information of the components. We remain solely responsible for our audit opinion.

We communicate with the Audit Committee regarding, among other matters, the planned scope and timing of the audit and significant audit findings, including any significant deficiencies in internal control that we identify during our audit.

We also provide the Audit Committee with a statement that we have complied with the ethical requirements regarding independence that are relevant to our audit of the financial statements in Japan, and to communicate with them all relationships and other matters that may reasonably be thought to bear on our independence, and where applicable, actions taken to eliminate threats or safeguards applied to reduce threats to an acceptable level.


291


Table of Contents

From the matters communicated with the Audit Committee, we determine those matters that were of most significance in the audit of the financial statements of the current period and are therefore the key audit matters. We describe these matters in our auditor’s report unless law or regulation precludes public disclosure about the matter or when, in extremely rare circumstances, we determine that a matter should not be communicated in our report because the adverse consequences of doing so would reasonably be expected to outweigh the public interest benefits of such communication.

Fee-related Information

Fee-related information is included in the Independent Auditor’s Report in connection with the audit of the consolidated financial statements.

Interest Required to Be Disclosed by the Certified Public Accountants Act of Japan

Our firm and its designated engagement partners do not have any interest in the Company which is required to be disclosed pursuant to the provisions of the Certified Public Accountants Act of Japan.

(Note)

This is an English translation of the Japanese language Independent Auditor’s Report issued by Ernst & Young ShinNihon LLC in connection with the audit of the financial statements of the Company, prepared in Japanese, for the year ended March 31, 2026. Ernst & Young ShinNihon LLC have not audited the English language version of the financial statements for the above-mentioned year, which are included in this report of foreign private issuer on Form 6-K.


292


Table of Contents

EXHIBIT 2

Management’s Report on Internal Control over Financial Reporting

1 [Framework of Internal Control over Financial Reporting]

Kentaro Okuda, Group Chief Executive Officer, and Hiroyuki Moriuchi, Chief Financial Officer, are responsible for establishing and maintaining adequate internal control over financial reporting for the Company.

The establishment and maintenance of an adequate internal control over financial reporting are based on the criteria set forth in Internal Control—Integrated Framework issued by the Committee of Sponsoring Organizations of the Treadway Commission (2013 framework) (the “COSO framework”).

There is a possibility that the internal control over financial reporting may not fully prevent or detect misstatements in financial reporting.

2 [Scope, Reference Date, and Method of Evaluation]

The Company evaluated the effectiveness of its internal control over financial reporting (as defined in Rules 13a-15(f) and 15d-15(f) under the Securities Exchange Act of 1934) using the criteria set forth in the COSO framework. The reference date of evaluation was as of March 31, 2026.

The Company conducts an evaluation of internal controls that have a material impact on overall financial reporting on a consolidated basis (company-wide internal controls), identifies significant consolidated subsidiaries and significant accounts in the consolidated financial statements, and, based on the results of the evaluation, identifies the business processes to be evaluated.

The evaluation scope of internal controls over financial reporting is determined from the perspective of the significance of their impact on the reliability of financial reporting at the Company and significant consolidated subsidiaries in our group. Our group has established the following quantitative criteria for determining significant consolidated subsidiaries to be included in the scope of evaluation:


Included in the top 80% of revenues or total assets in the consolidated financial statements, or


Revenues or total assets included in the financial statements above individually account for more than 5% of the total.

We have also established the following qualitative criteria to determine the final evaluation scope:

— Consolidated subsidiaries that are exposed to the risk of material misstatement in their financial statements and have business processes that cannot be covered by other consolidated subsidiaries, in consideration of the characteristics of the business

— Significant shared service centers (business centers that consolidate some of the Nomura Group’s corporate functions)

— Consolidated subsidiaries whose likelihood of fraud in the financial reporting is considered to be high.

Based on the above criteria, our company and its 21 consolidated subsidiaries have been designated as important consolidated subsidiaries and have been included in the scope of internal control over financial reporting.

In addition, with regards to the accounts that are significantly related to business objectives in the scope of these assessments, the Company has selected trading assets and liabilities, securities purchased under agreements to resell and securities sold under agreements to repurchase, commissions, net gain on trading, interest and dividends, and interest expense, taking into account such factors as the characteristics of the accounts, the complexity of accounting procedures, and the risk of misstatement that may have a significant impact on financial reporting in addition to the importance of the amounts in the consolidated financial statements.

The Company excluded from the scope of its evaluation of the effectiveness of our internal control over financial reporting as of the assessment date the internal control over financial reporting of Macquarie Management Holdings, Inc., Macquarie Investment Management Holdings (Luxembourg) S.à r.l. and Macquarie Investment Management Holdings (Austria) GmbH, which were acquired on December 1, 2025. These companies were excluded based on guidance issued by the U.S. Securities and Exchange Commission, which permits exclusion from the scope of the evaluation only in the first year of acquisition. As of March 31, 2026, the Company’s consolidated financial statements comprised approximately 0.2% of total assets and approximately 1.7% of net revenue for the year ended March 31, 2026.


1


Table of Contents

3 [Report of Result of Evaluation]

Based on the evaluation, management concluded that our internal control over financial reporting was effective as of March 31, 2026.

4 [Comments]

The key differences between the standards generally accepted in the United States which the Company adopts for the evaluation of internal control over financial reporting (“U.S. standards”) and the standards generally accepted in Japan (“Japanese standards”) are as follows:

— Under the U.S. standards, the financial reporting which is subject to the internal control requirements only includes the consolidated financial statements. Under the Japanese standards, the financial reporting which is subject to the internal control requirements includes financial statements, including consolidated financial statements, and other disclosures that have material effects on the reliability of the financial statements.

— Under the U.S. standards, the scope of internal control over financial reporting includes the parent company and its consolidated entities. Under the Japanese standards, the scope of internal control over financial reporting includes the parent company, its consolidated entities, and the affiliated companies that are accounted for by using the equity method.

5 [Special Comments]

There is no special comment to be stated.


2


Table of Contents

Confirmation Letter

1 [Appropriateness of Annual Securities Report]

Kentaro Okuda, Group Chief Executive Officer, and Hiroyuki Moriuchi, Chief Financial Officer, have confirmed that the Annual Securities Report of Nomura Holdings, Inc. for the year ended March 31, 2026 is fairly presented pursuant to the Financial Instruments and Exchange Act.

2 [Special Comments]

There is no special comment to be stated.


3