| NABORS INDUSTRIES October 29, 2025 3Q 2025 Earnings Presentation |
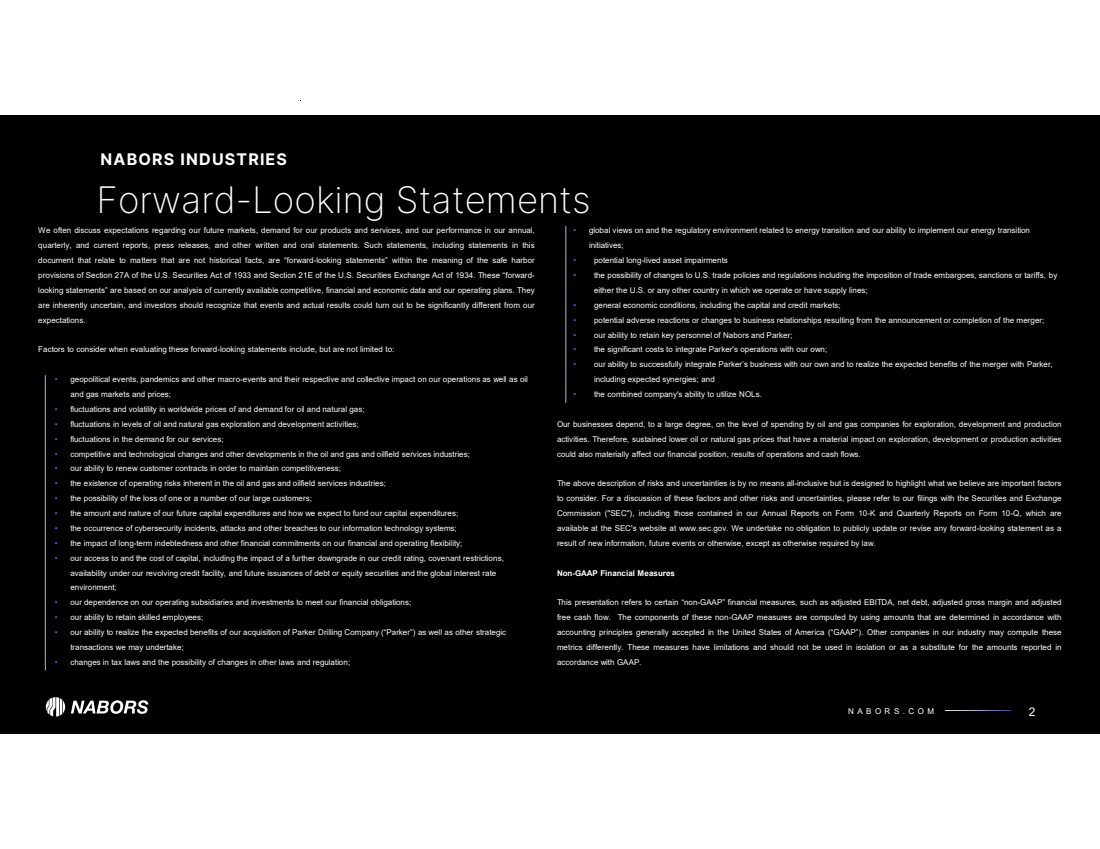
| N A B O R S . C O M We often discuss expectations regarding our future markets, demand for our products and services, and our performance in our annual, quarterly, and current reports, press releases, and other written and oral statements. Such statements, including statements in this document that relate to matters that are not historical facts, are “forward-looking statements” within the meaning of the safe harbor provisions of Section 27A of the U.S. Securities Act of 1933 and Section 21E of the U.S. Securities Exchange Act of 1934. These “forward-looking statements” are based on our analysis of currently available competitive, financial and economic data and our operating plans. They are inherently uncertain, and investors should recognize that events and actual results could turn out to be significantly different from our expectations. Factors to consider when evaluating these forward-looking statements include, but are not limited to: • geopolitical events, pandemics and other macro-events and their respective and collective impact on our operations as well as oil and gas markets and prices; • fluctuations and volatility in worldwide prices of and demand for oil and natural gas; • fluctuations in levels of oil and natural gas exploration and development activities; • fluctuations in the demand for our services; • competitive and technological changes and other developments in the oil and gas and oilfield services industries; • our ability to renew customer contracts in order to maintain competitiveness; • the existence of operating risks inherent in the oil and gas and oilfield services industries; • the possibility of the loss of one or a number of our large customers; • the amount and nature of our future capital expenditures and how we expect to fund our capital expenditures; • the occurrence of cybersecurity incidents, attacks and other breaches to our information technology systems; • the impact of long-term indebtedness and other financial commitments on our financial and operating flexibility; • our access to and the cost of capital, including the impact of a further downgrade in our credit rating, covenant restrictions, availability under our revolving credit facility, and future issuances of debt or equity securities and the global interest rate environment; • our dependence on our operating subsidiaries and investments to meet our financial obligations; • our ability to retain skilled employees; • our ability to realize the expected benefits of our acquisition of Parker Drilling Company (“Parker”) as well as other strategic transactions we may undertake; • changes in tax laws and the possibility of changes in other laws and regulation; Forward-Looking Statements NABORS INDUSTRIES 2 • global views on and the regulatory environment related to energy transition and our ability to implement our energy transition initiatives; • potential long-lived asset impairments • the possibility of changes to U.S. trade policies and regulations including the imposition of trade embargoes, sanctions or tariffs, by either the U.S. or any other country in which we operate or have supply lines; • general economic conditions, including the capital and credit markets; • potential adverse reactions or changes to business relationships resulting from the announcement or completion of the merger; • our ability to retain key personnel of Nabors and Parker; • the significant costs to integrate Parker's operations with our own; • our ability to successfully integrate Parker’s business with our own and to realize the expected benefits of the merger with Parker, including expected synergies; and • the combined company's ability to utilize NOLs. Our businesses depend, to a large degree, on the level of spending by oil and gas companies for exploration, development and production activities. Therefore, sustained lower oil or natural gas prices that have a material impact on exploration, development or production activities could also materially affect our financial position, results of operations and cash flows. The above description of risks and uncertainties is by no means all-inclusive but is designed to highlight what we believe are important factors to consider. For a discussion of these factors and other risks and uncertainties, please refer to our filings with the Securities and Exchange Commission ("SEC"), including those contained in our Annual Reports on Form 10-K and Quarterly Reports on Form 10-Q, which are available at the SEC's website at www.sec.gov. We undertake no obligation to publicly update or revise any forward-looking statement as a result of new information, future events or otherwise, except as otherwise required by law. Non-GAAP Financial Measures This presentation refers to certain “non-GAAP” financial measures, such as adjusted EBITDA, net debt, adjusted gross margin and adjusted free cash flow. The components of these non-GAAP measures are computed by using amounts that are determined in accordance with accounting principles generally accepted in the United States of America (“GAAP”). Other companies in our industry may compute these metrics differently. These measures have limitations and should not be used in isolation or as a substitute for the amounts reported in accordance with GAAP. |
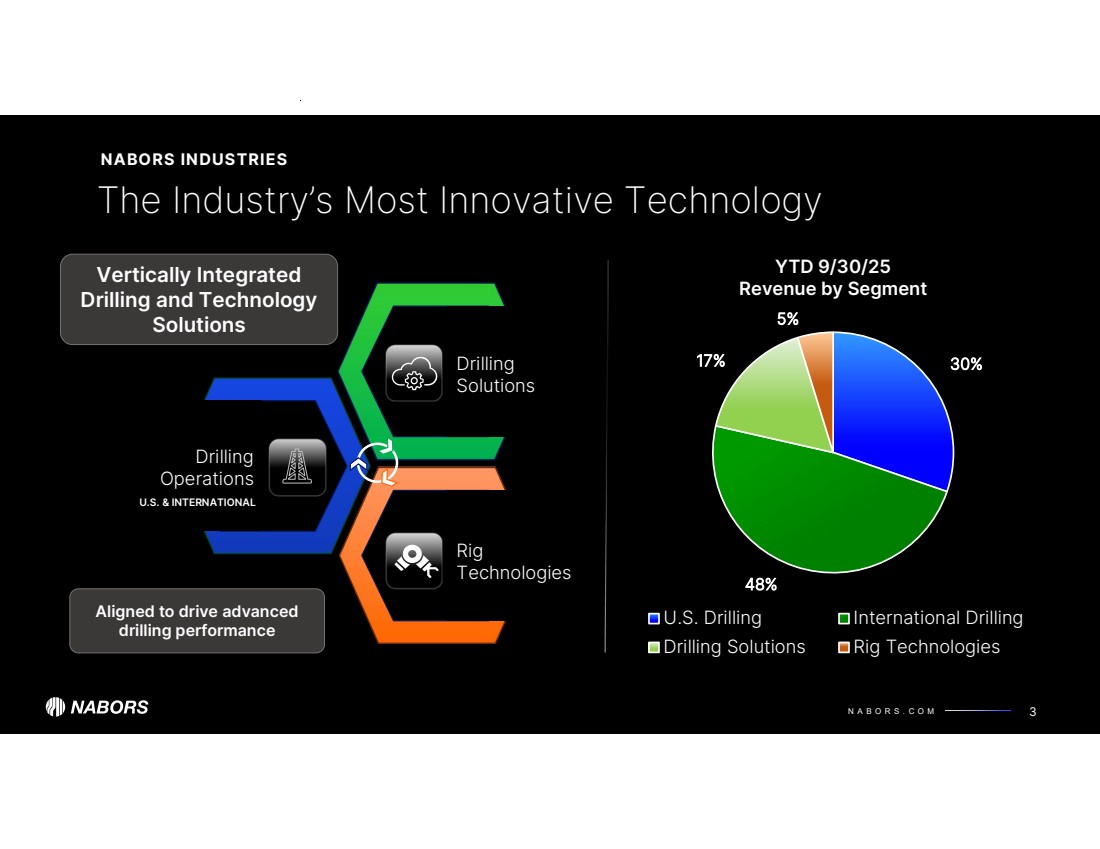
| N A B O R S . C O M 30% 48% 17% 5% YTD 9/30/25 Revenue by Segment U.S. Drilling International Drilling Drilling Solutions Rig Technologies 3 The Industry’s Most Innovative Technology NABORS INDUSTRIES Vertically Integrated Drilling and Technology Solutions Drilling Operations Rig Technologies Drilling Solutions Aligned to drive advanced drilling performance U.S. & INTERNATIONAL |
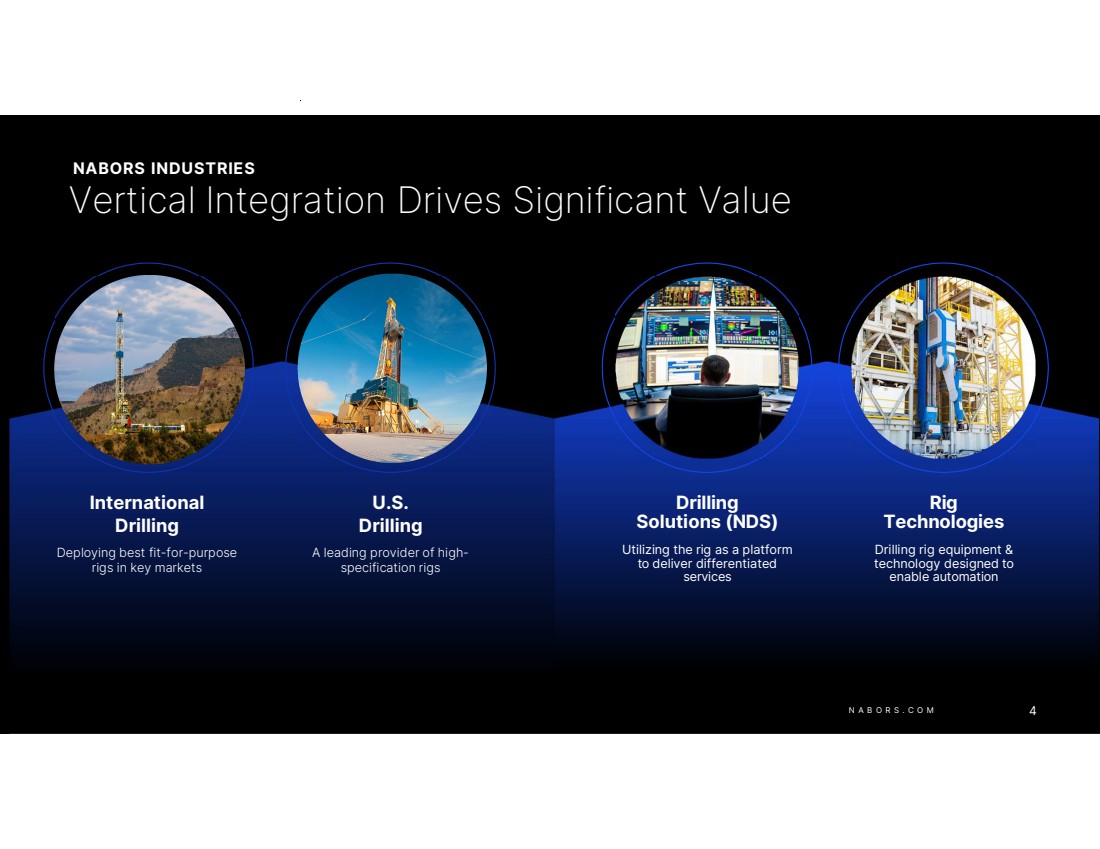
| Vertical Integration Drives Significant Value Rig Technologies Drilling rig equipment & technology designed to enable automation Drilling Solutions (NDS) Utilizing the rig as a platform to deliver differentiated services U.S. Drilling A leading provider of high-specification rigs NABORS INDUSTRIES N A B O R S . C O M 4 International Drilling Deploying best fit-for-purpose rigs in key markets |
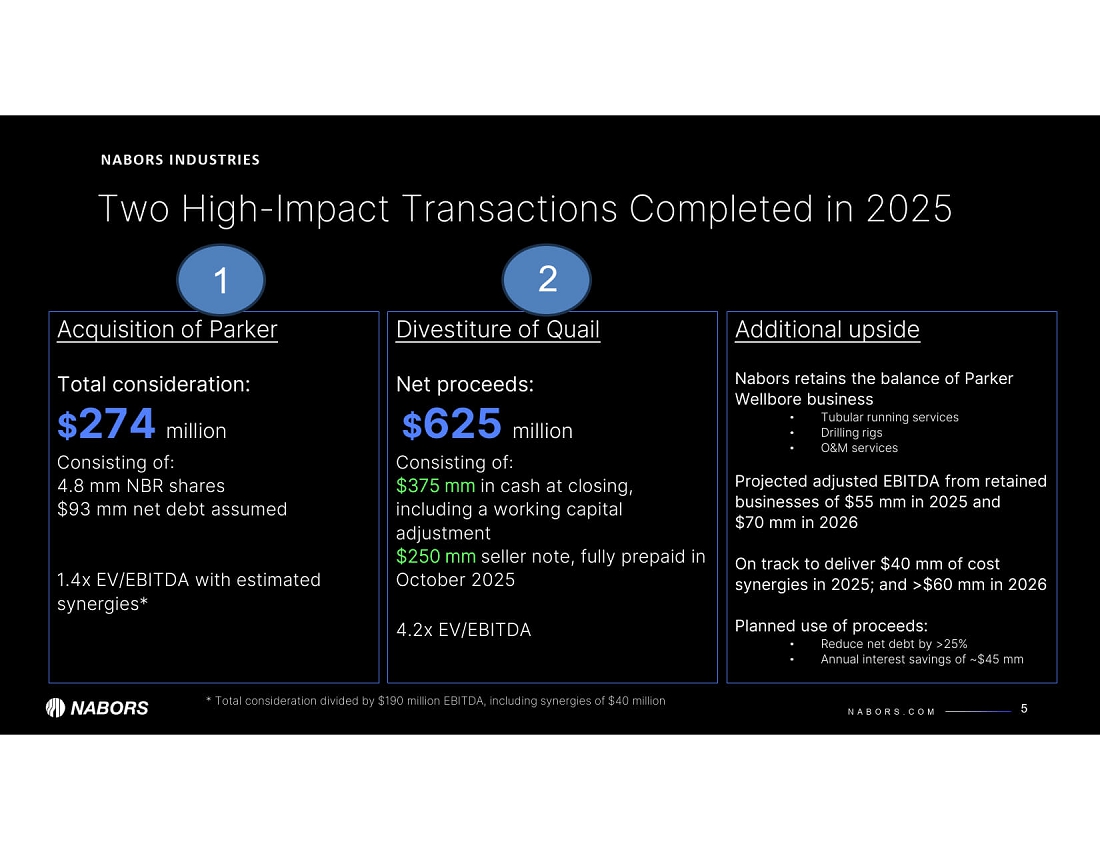
| N A B O R S . C O M Two High-Impact Transactions Completed in 2025 NABORS INDUSTRIES 5 Acquisition of Parker Total consideration: $274 million Consisting of: 4.8 mm NBR shares $93 mm net debt assumed 1.4x EV/EBITDA with estimated synergies* Divestiture of Quail Net proceeds: $625 million Consisting of: $375 mm in cash at closing, including a working capital adjustment $250 mm seller note, fully prepaid in October 2025 4.2x EV/EBITDA Additional upside Nabors retains the balance of Parker Wellbore business • Tubular running services • Drilling rigs • O&M services Projected annualized 4Q adjusted EBITDA of >$70 mm from retained businesses On track to deliver $40 mm of cost synergies in 2025; and >$60 mm in 2026 Planned use of proceeds: • Reduce net debt by >25% • Annual interest savings of ~$45 mm 1 2 * Total consideration divided by $190 million EBITDA, including synergies of $40 million |
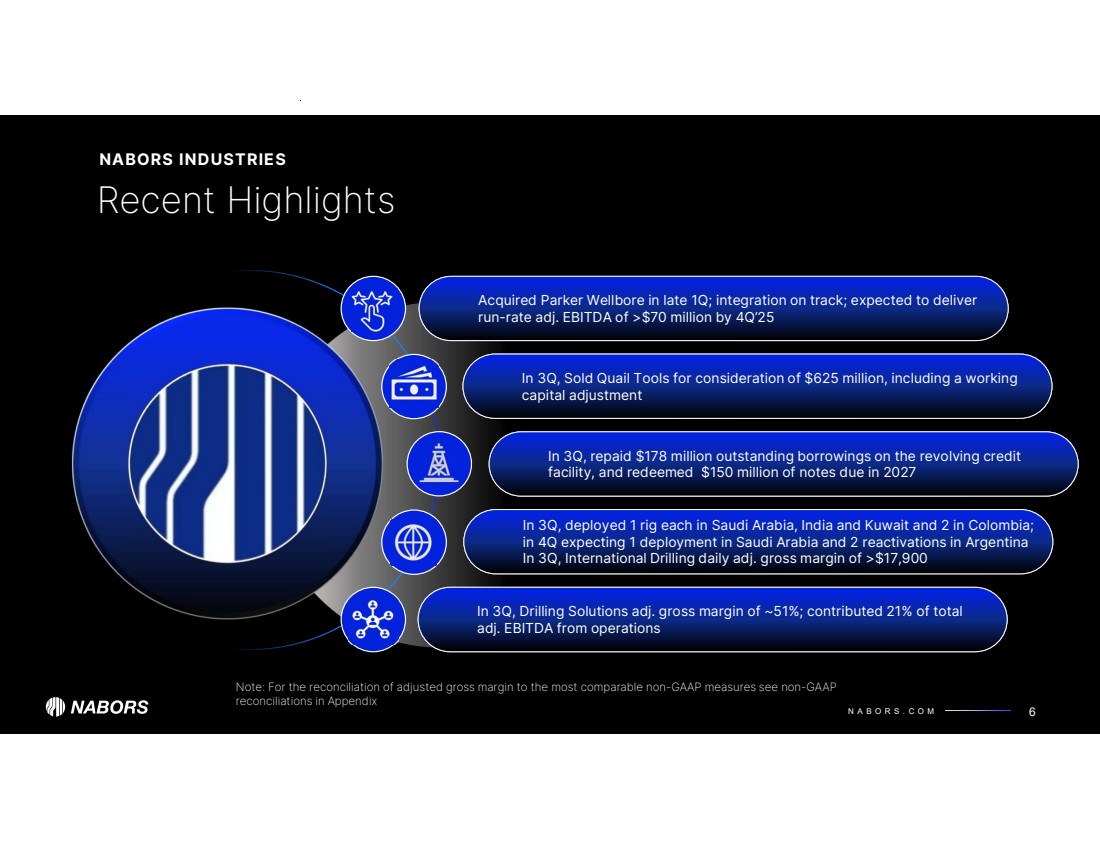
| N A B O R S . C O M Recent Highlights NABORS INDUSTRIES 6 In 3Q, deployed 1 rig each in Saudi Arabia, India and Kuwait and 2 in Colombia; in 4Q expecting 1 deployment in Saudi Arabia and 2 reactivations in Argentina In 3Q, International Drilling daily adj. gross margin of >$17,900 Acquired Parker Wellbore in late 1Q; integration on track; expected to deliver run-rate adj. EBITDA of >$70 million by 4Q’25 In 3Q, repaid $178 million outstanding borrowings on the revolving credit Nabors facility, and redeemed $150 million of notes due in 2027 In 3Q, Drilling Solutions adj. gross margin of ~51%; contributed 21% of total adj. EBITDA from operations Note: For the reconciliation of adjusted gross margin to the most comparable non-GAAP measures see non-GAAP reconciliations in Appendix In 3Q, Sold Quail Tools for consideration of $625 million, including a working capital adjustment |
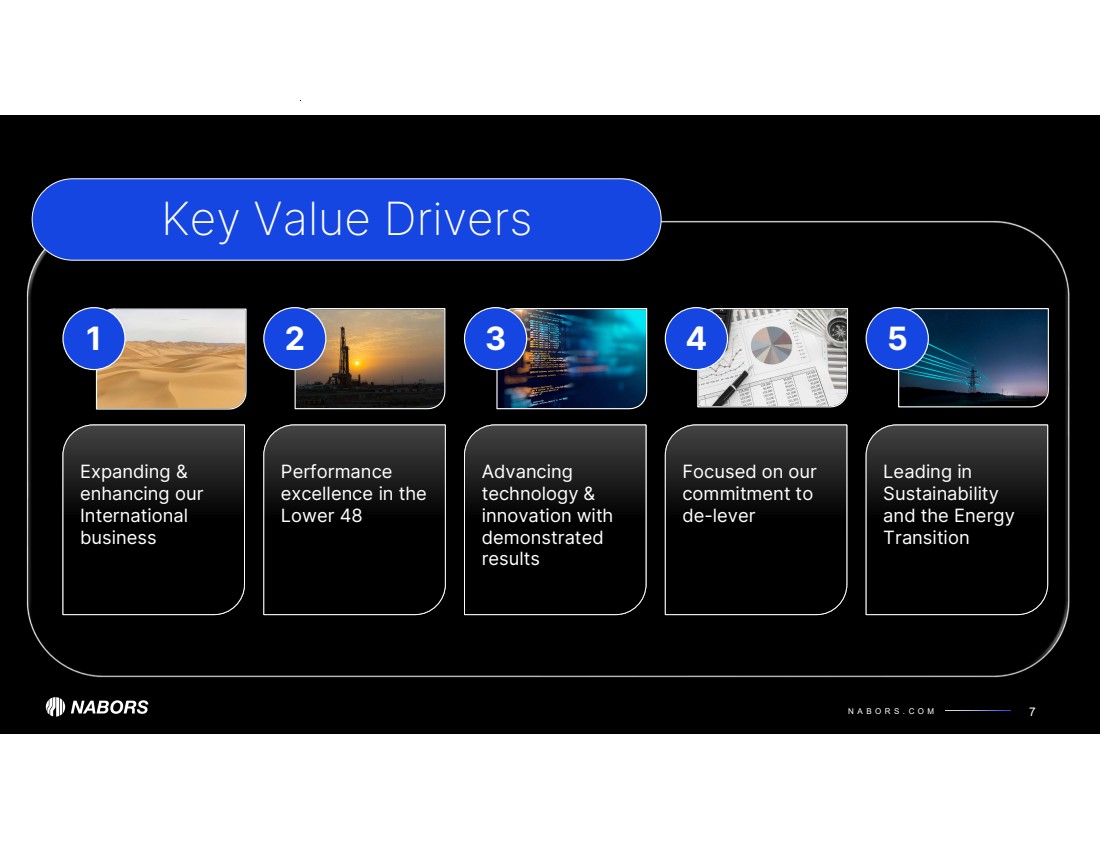
| N A B O R S . C O M Performance excellence in the Lower 48 7 Expanding & enhancing our International business Key Value Drivers 1 Advancing technology & innovation with demonstrated results Focused on our commitment to de-lever 2 3 Leading in Sustainability and the Energy Transition 4 5 |
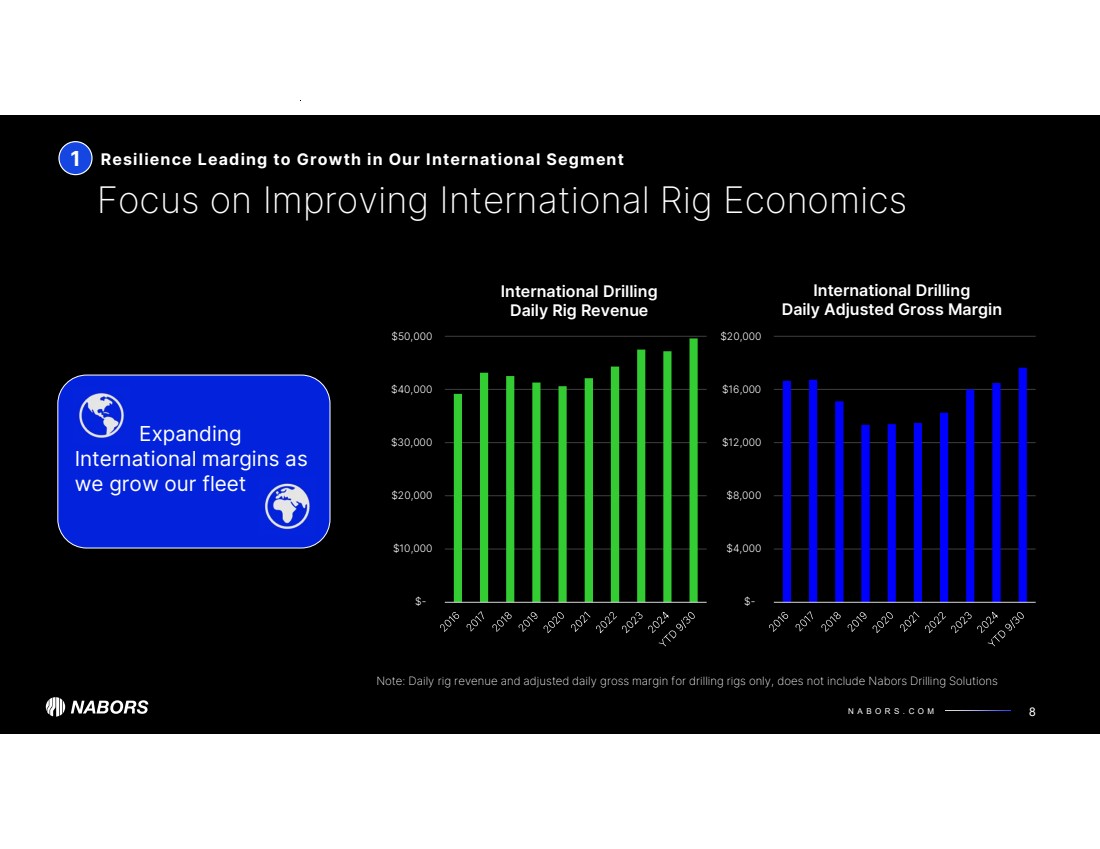
| N A B O R S . C O M $- $4,000 $8,000 $12,000 $16,000 $20,000 International Drilling Daily Adjusted Gross Margin $- $10,000 $20,000 $30,000 $40,000 $50,000 International Drilling Daily Rig Revenue 1 Expanding International margins as we grow our fleet Focus on Improving International Rig Economics Resilience Leading to Growth in Our International Segment 8 Note: Daily rig revenue and adjusted daily gross margin for drilling rigs only, does not include Nabors Drilling Solutions |
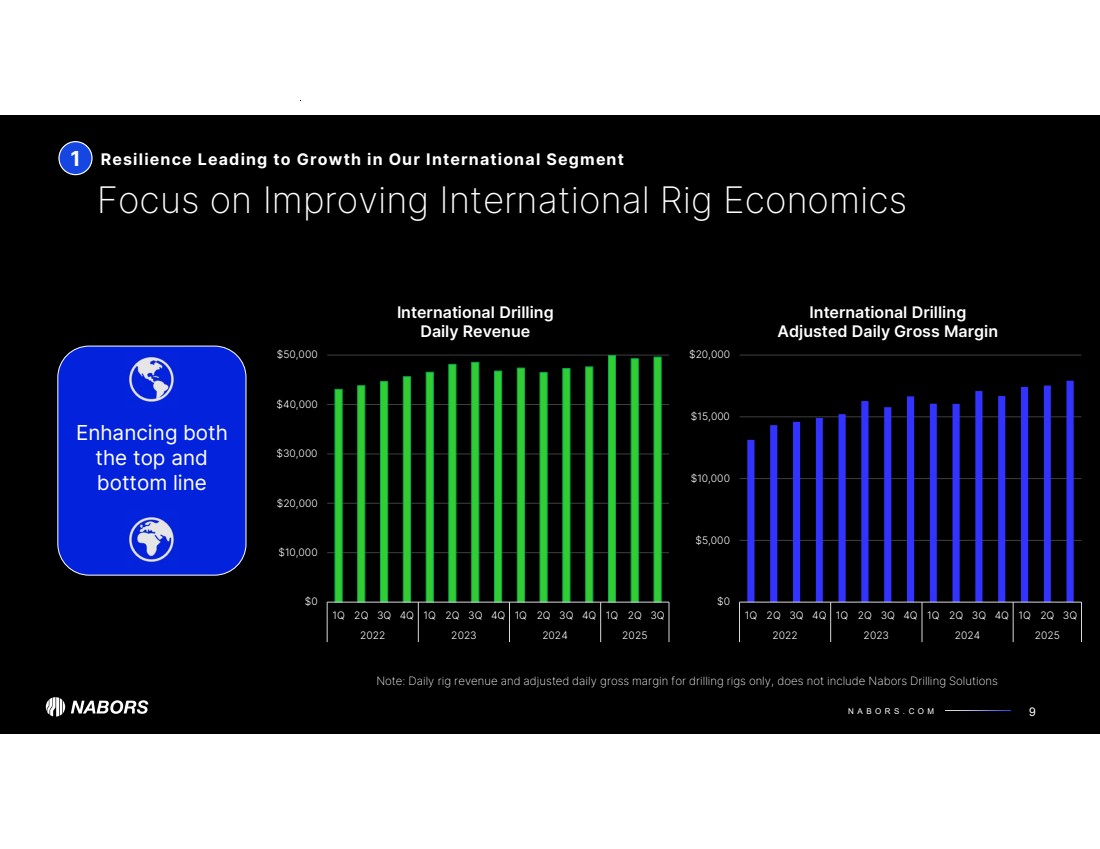
| N A B O R S . C O M $0 $5,000 $10,000 $15,000 $20,000 1Q 2Q 3Q 4Q 1Q 2Q 3Q 4Q 1Q 2Q 3Q 4Q 1Q 2Q 3Q 2022 2023 2024 2025 International Drilling Adjusted Daily Gross Margin $0 $10,000 $20,000 $30,000 $40,000 $50,000 1Q 2Q 3Q 4Q 1Q 2Q 3Q 4Q 1Q 2Q 3Q 4Q 1Q 2Q 3Q 2022 2023 2024 2025 International Drilling Daily Revenue 1 Enhancing both the top and bottom line Focus on Improving International Rig Economics Resilience Leading to Growth in Our International Segment 9 Note: Daily rig revenue and adjusted daily gross margin for drilling rigs only, does not include Nabors Drilling Solutions |
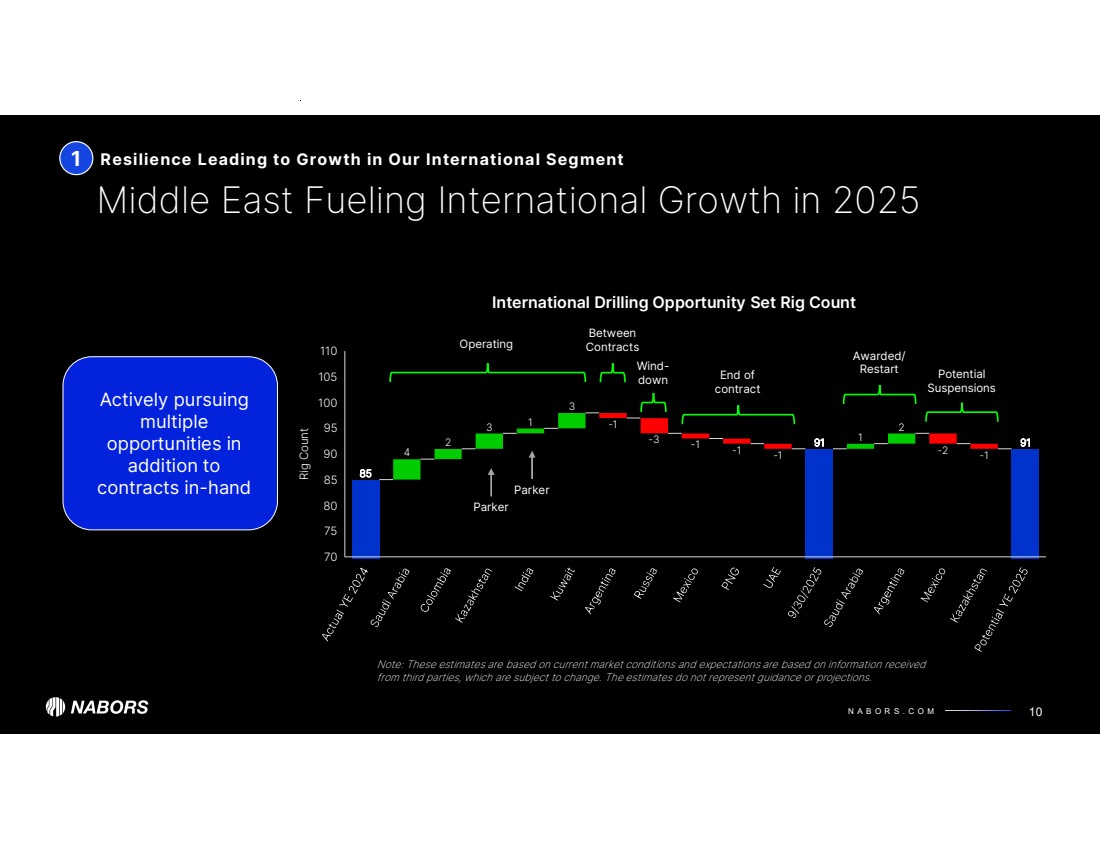
| N A B O R S . C O M 4 2 3 1 3 -1 -3 -1 -1 -1 1 2 -2 -1 85 91 91 Rig Count 70 75 80 85 90 95 100 105 110 1 Middle East Fueling International Growth in 2025 10 Actively pursuing multiple opportunities in addition to contracts in-hand Note: These estimates are based on current market conditions and expectations are based on information received from third parties, which are subject to change. The estimates do not represent guidance or projections. Resilience Leading to Growth in Our International Segment Awarded/ Restart International Drilling Opportunity Set Rig Count Operating End of contract Between Contracts Parker Parker Wind-down Potential Suspensions |
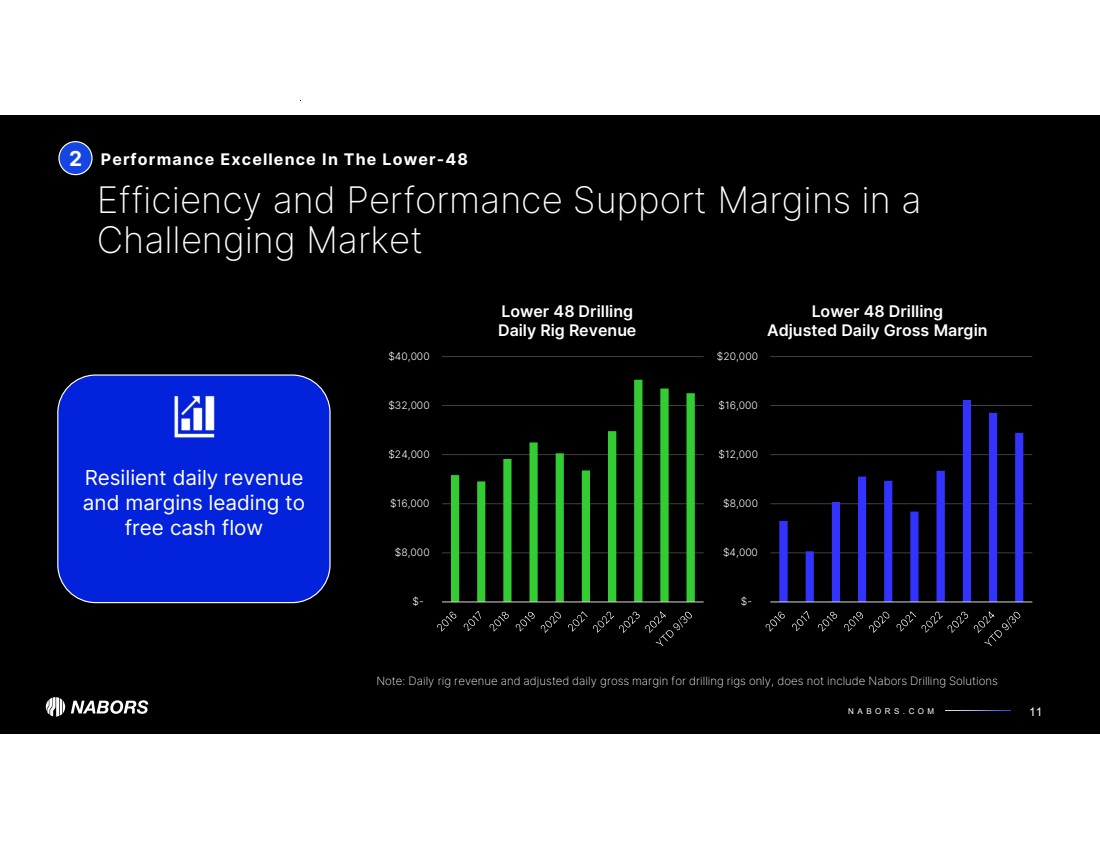
| N A B O R S . C O M $- $4,000 $8,000 $12,000 $16,000 $20,000 Lower 48 Drilling Adjusted Daily Gross Margin $- $8,000 $16,000 $24,000 $32,000 $40,000 Lower 48 Drilling Daily Rig Revenue 2 Efficiency and Performance Support Margins in a Challenging Market Performance Excellence In The Lower-48 11 Resilient daily revenue and margins leading to free cash flow Note: Daily rig revenue and adjusted daily gross margin for drilling rigs only, does not include Nabors Drilling Solutions |
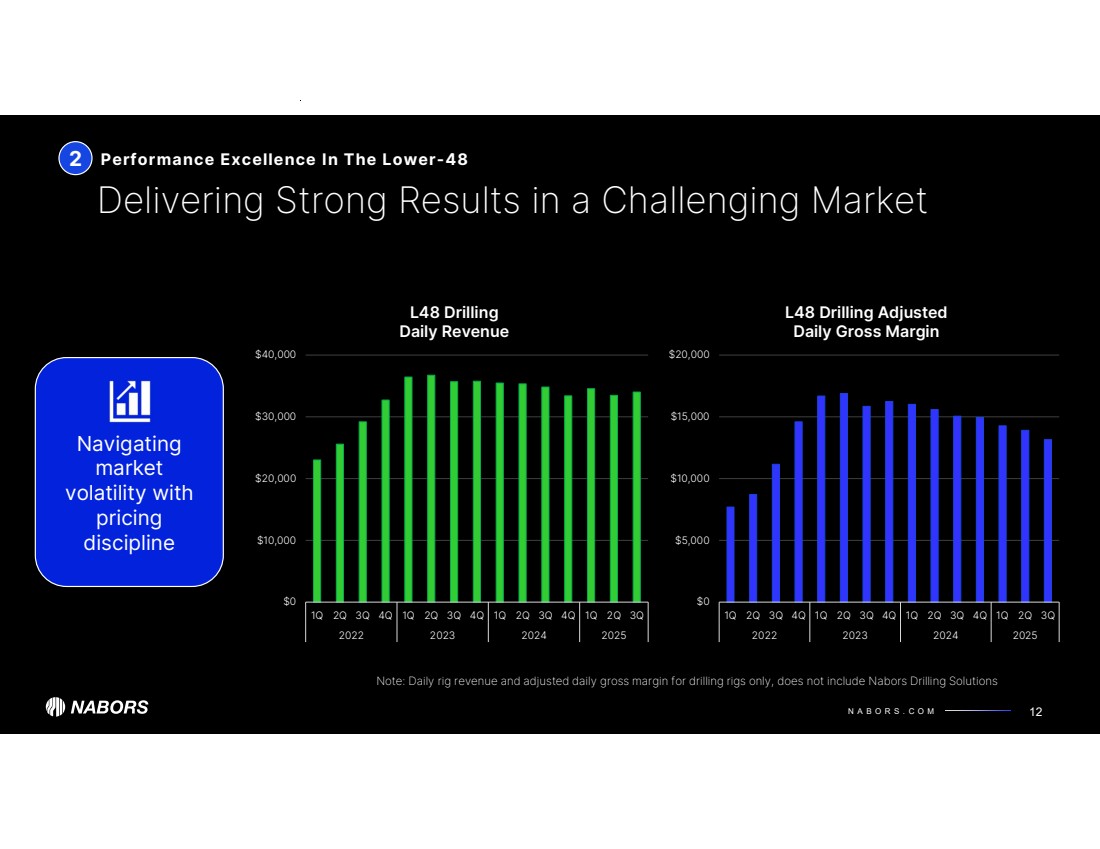
| N A B O R S . C O M $0 $5,000 $10,000 $15,000 $20,000 1Q 2Q 3Q 4Q 1Q 2Q 3Q 4Q 1Q 2Q 3Q 4Q 1Q 2Q 3Q 2022 2023 2024 2025 L48 Drilling Adjusted Daily Gross Margin $0 $10,000 $20,000 $30,000 $40,000 1Q 2Q 3Q 4Q 1Q 2Q 3Q 4Q 1Q 2Q 3Q 4Q 1Q 2Q 3Q 2022 2023 2024 2025 L48 Drilling Daily Revenue 2 Delivering Strong Results in a Challenging Market Performance Excellence In The Lower-48 12 Navigating market volatility with pricing discipline Note: Daily rig revenue and adjusted daily gross margin for drilling rigs only, does not include Nabors Drilling Solutions |
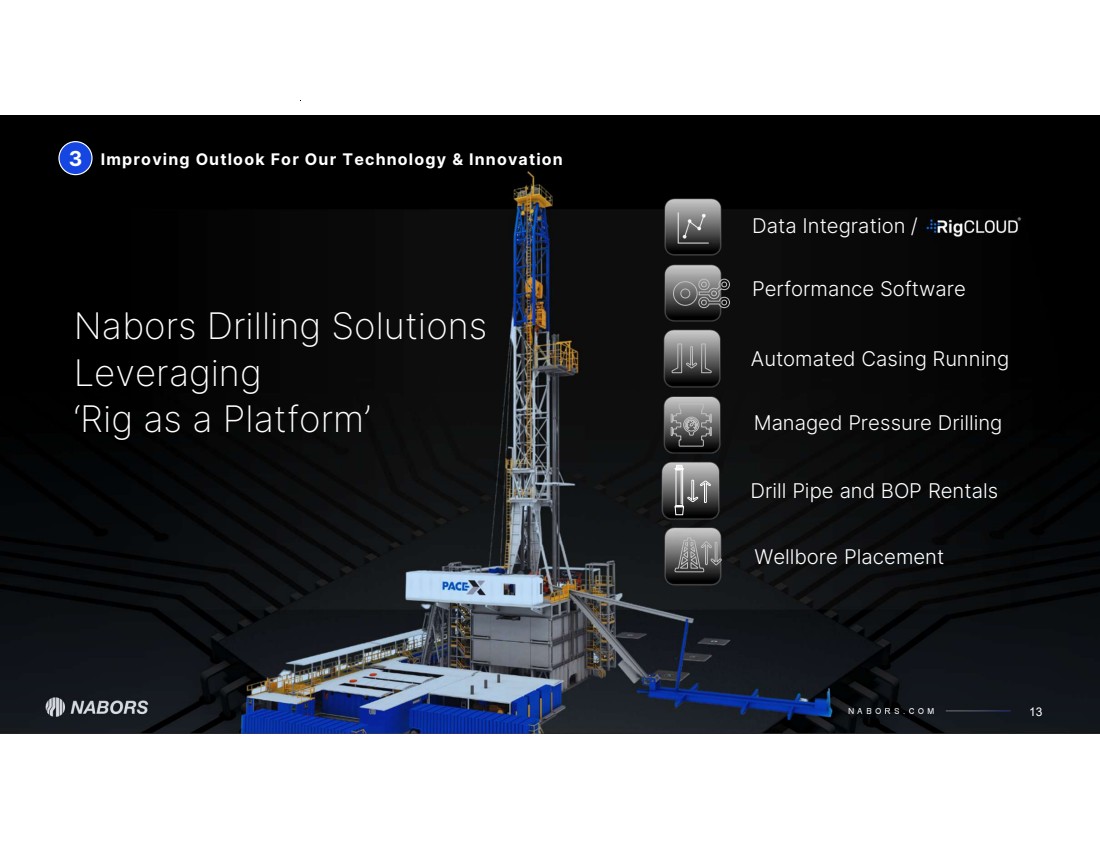
| N A B O R S . C O M 13 Nabors Drilling Solutions Leveraging ‘Rig as a Platform’ Managed Pressure Drilling Performance Software Wellbore Placement Automated Casing Running Data Integration / 3 Improving Outlook For Our Technology & Innovation Drill Pipe and BOP Rentals |
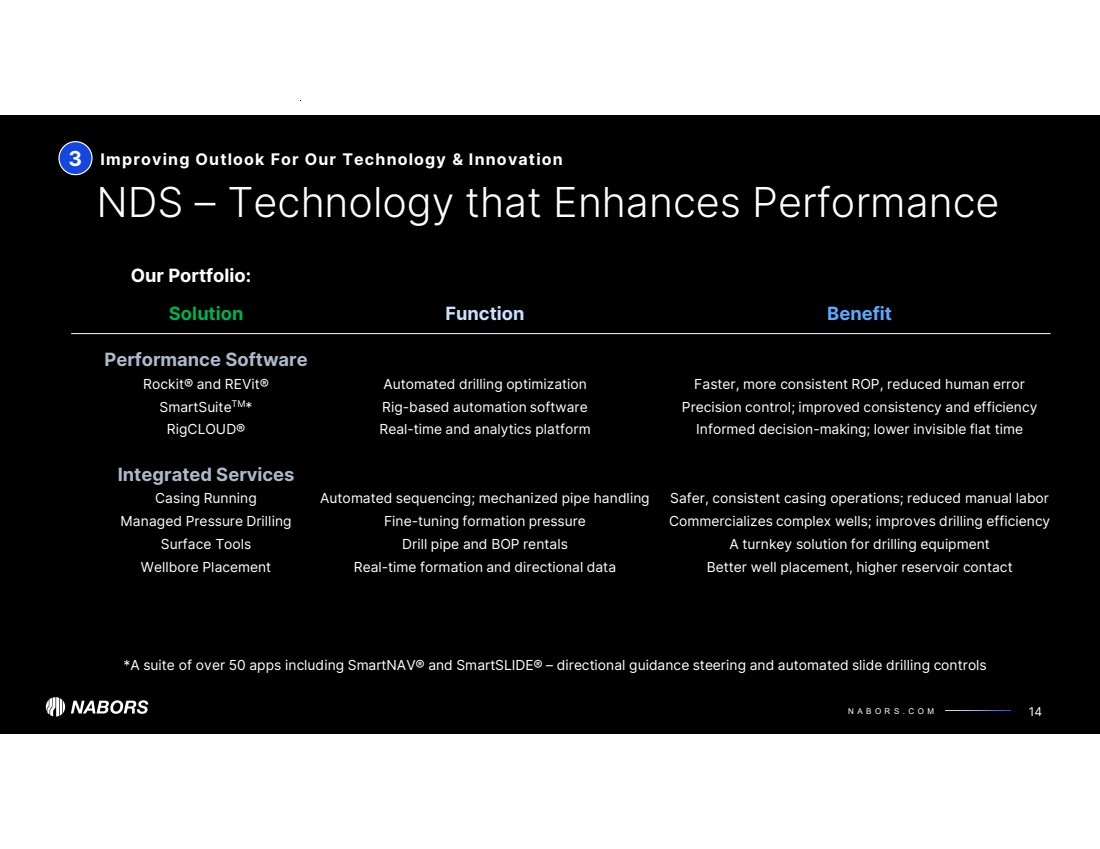
| N A B O R S . C O M 14 NDS – Technology that Enhances Performance Our Portfolio: Solution Performance Software Rockit® and REVit® SmartSuiteTM* RigCLOUD® Integrated Services Casing Running Managed Pressure Drilling Surface Tools Wellbore Placement Function Performance Software Automated drilling optimization Rig-based automation software Real-time and analytics platform Integrated Services Automated sequencing; mechanized pipe handling Fine-tuning formation pressure Drill pipe and BOP rentals Real-time formation and directional data Benefit Performance Software Faster, more consistent ROP, reduced human error Precision control; improved consistency and efficiency Informed decision-making; lower invisible flat time Integrated Services Safer, consistent casing operations; reduced manual labor Commercializes complex wells; improves drilling efficiency A turnkey solution for drilling equipment Better well placement, higher reservoir contact *A suite of over 50 apps including SmartNAV® and SmartSLIDE® – directional guidance steering and automated slide drilling controls 3 Improving Outlook For Our Technology & Innovation |
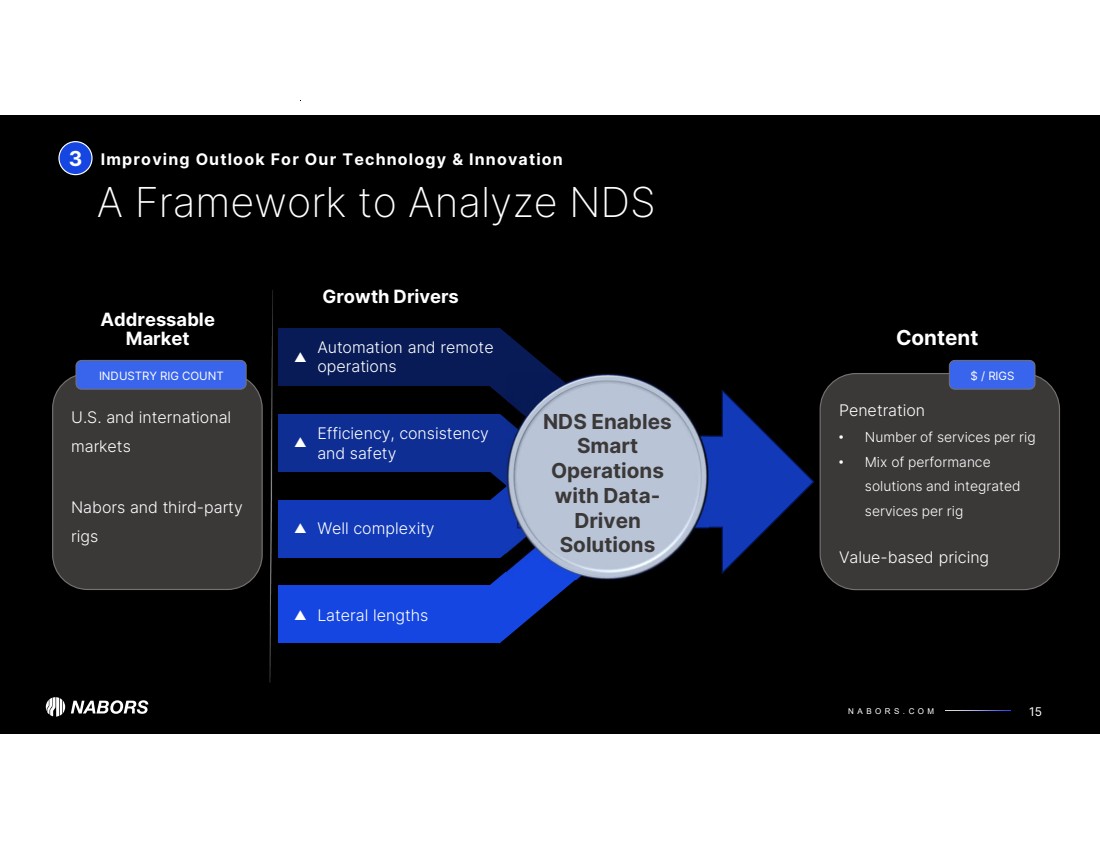
| N A B O R S . C O M 15 A Framework to Analyze NDS NDS Enables Smart Operations with Data-Driven Solutions 3 Improving Outlook For Our Technology & Innovation Efficiency, consistency and safety Automation and remote operations Well complexity Lateral lengths Addressable Market Growth Drivers Content Penetration • Number of services per rig • Mix of performance solutions and integrated services per rig Value-based pricing $ / RIGS U.S. and international markets Nabors and third-party rigs INDUSTRY RIG COUNT ▲ ▲ ▲ ▲ |
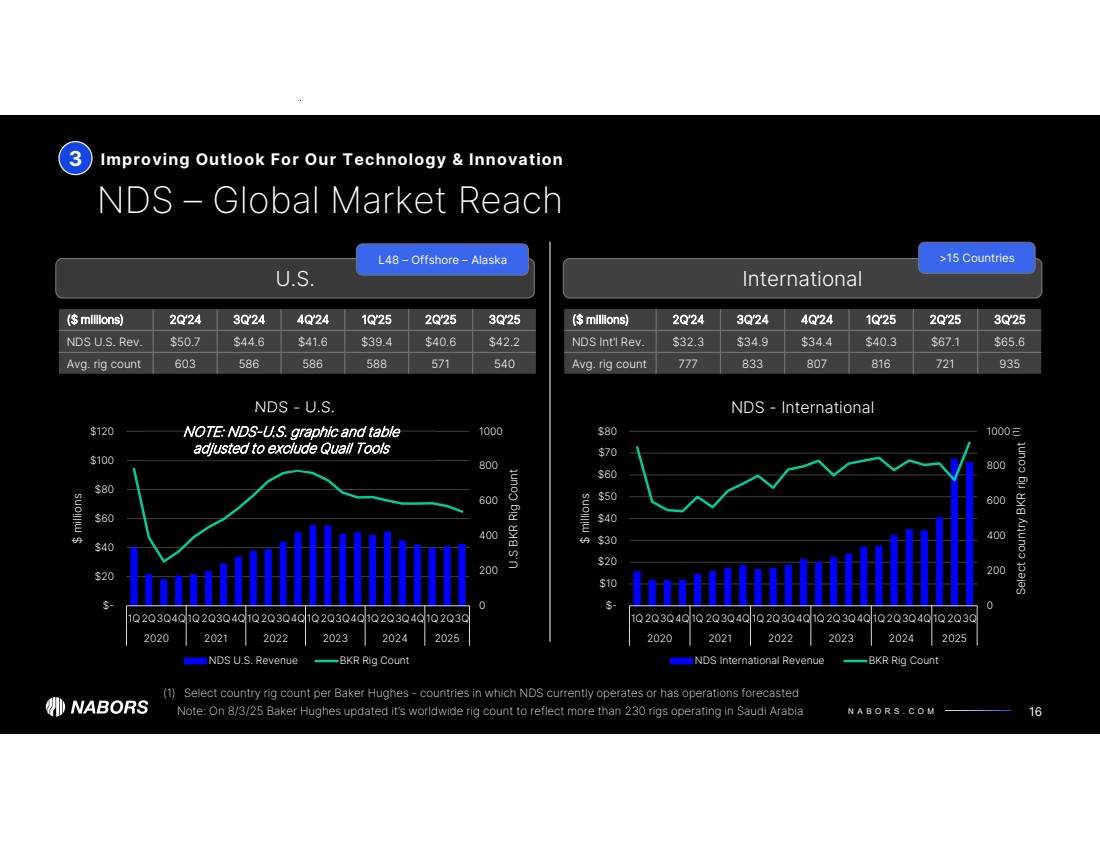
| N A B O R S . C O M 0 200 400 600 800 1000 $- $20 $40 $60 $80 $100 $120 1Q 2Q3Q4Q 1Q 2Q3Q4Q 1Q 2Q3Q4Q 1Q 2Q3Q4Q 1Q 2Q3Q4Q 1Q 2Q3Q 2020 2021 2022 2023 2024 2025 U.S BKR Rig Count $ millions NDS - U.S. NDS U.S. Revenue BKR Rig Count 0 200 400 600 800 1000 $- $10 $20 $30 $40 $50 $60 $70 $80 1Q 2Q3Q4Q 1Q 2Q3Q4Q 1Q 2Q3Q4Q 1Q 2Q3Q4Q 1Q 2Q3Q4Q 1Q 2Q3Q 2020 2021 2022 2023 2024 2025 Select country BKR rig count $ millions NDS - International NDS International Revenue BKR Rig Count U.S. 16 NDS – Global Market Reach International L48 – Offshore – Alaska (1) Select country rig count per Baker Hughes - countries in which NDS currently operates or has operations forecasted (1) >15 Countries ($ millions) 2Q’24 3Q’24 4Q’24 1Q’25 2Q’25 3Q’25 NDS U.S. Rev. $50.7 $44.6 $41.6 $39.4 $40.6 $42.2 Avg. rig count 603 586 586 588 571 540 ($ millions) 2Q’24 3Q’24 4Q’24 1Q’25 2Q’25 3Q’25 NDS Int’l Rev. $32.3 $34.9 $34.4 $40.3 $67.1 $65.6 Avg. rig count 777 833 807 816 721 935 3 Improving Outlook For Our Technology & Innovation NOTE: NDS-U.S. graphic and table adjusted to exclude Quail Tools Note: On 8/3/25 Baker Hughes updated it’s worldwide rig count to reflect more than 230 rigs operating in Saudi Arabia |
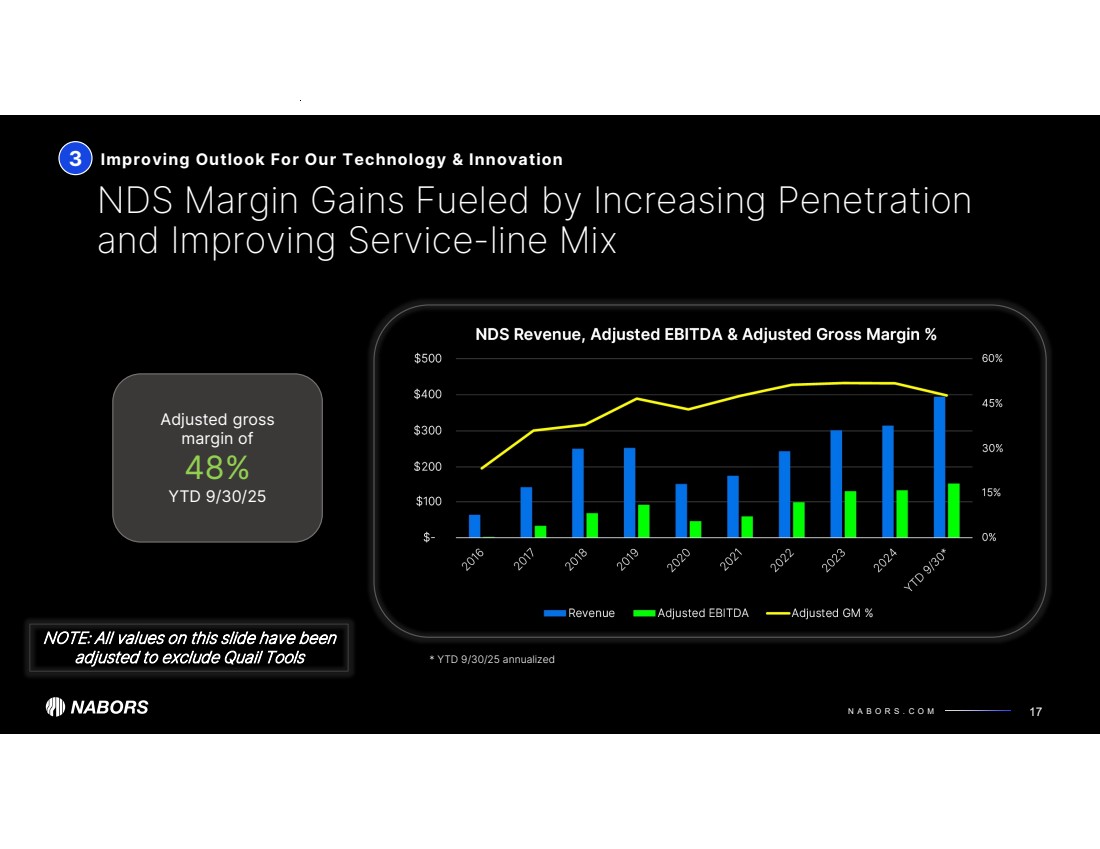
| N A B O R S . C O M 0% 15% 30% 45% 60% $- $100 $200 $300 $400 $500 NDS Revenue, Adjusted EBITDA & Adjusted Gross Margin % Revenue Adjusted EBITDA Adjusted GM % NDS Margin Gains Fueled by Increasing Penetration and Improving Service-line Mix Improving Outlook For Our Technology & Innovation 17 3 * YTD 9/30/25 annualized Adjusted gross margin of 48% YTD 9/30/25 NOTE: All values on this slide have been adjusted to exclude Quail Tools |
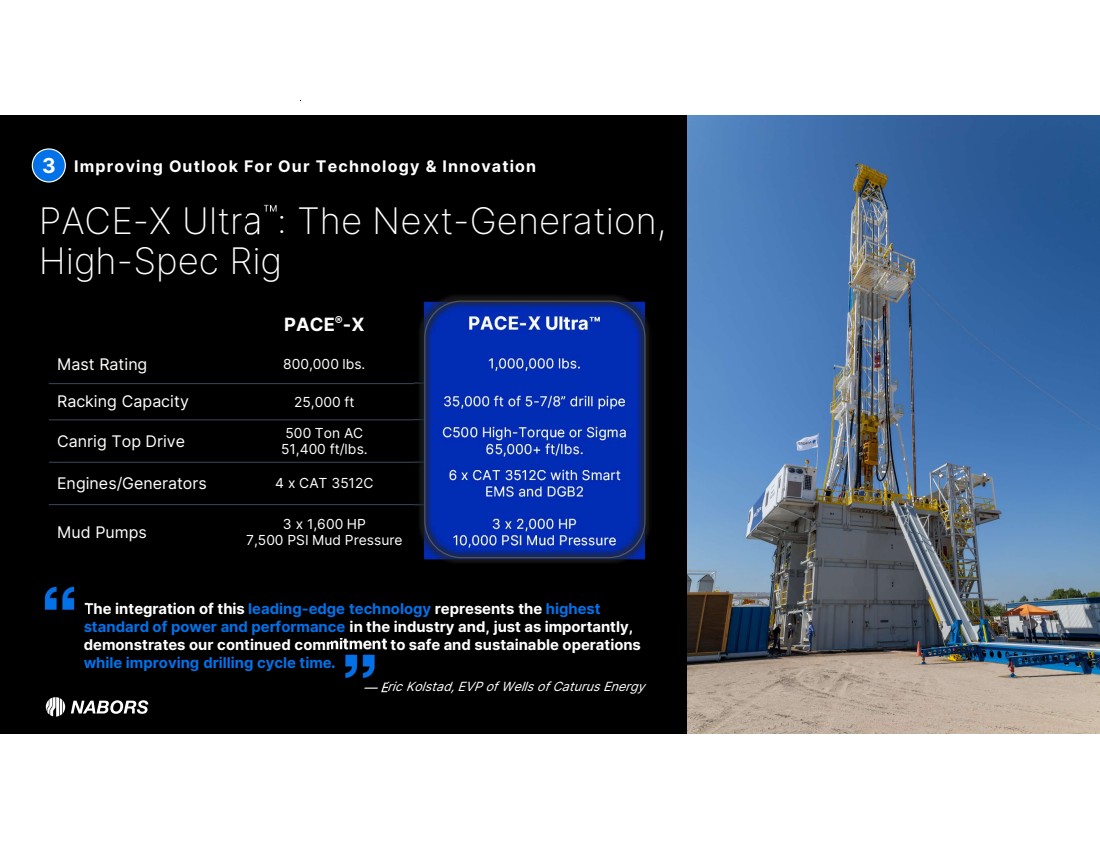
| N A B O R S . C O M 18 3 Improving Outlook For Our Technology & Innovation — Eric Kolstad, EVP of Wells of Caturus Energy The integration of this leading-edge technology represents the highest standard of power and performance in the industry and, just as importantly, demonstrates our continued commitment to safe and sustainable operations while improving drilling cycle time. PACE-X Ultra : The Next-Generation, High-Spec Rig PACE PACE-X Ultra ®-X Mast Rating 800,000 lbs. 1,000,000 lbs. Racking Capacity 25,000 ft 35,000 ft of 5-7/8” drill pipe C500 High-Torque or Sigma 65,000+ ft/lbs. 500 Ton AC 51,400 ft/lbs. Canrig Top Drive 6 x CAT 3512C with Smart EMS and DGB2 Engines/Generators 4 x CAT 3512C 3 x 2,000 HP 10,000 PSI Mud Pressure 3 x 1,600 HP 7,500 PSI Mud Pressure Mud Pumps |
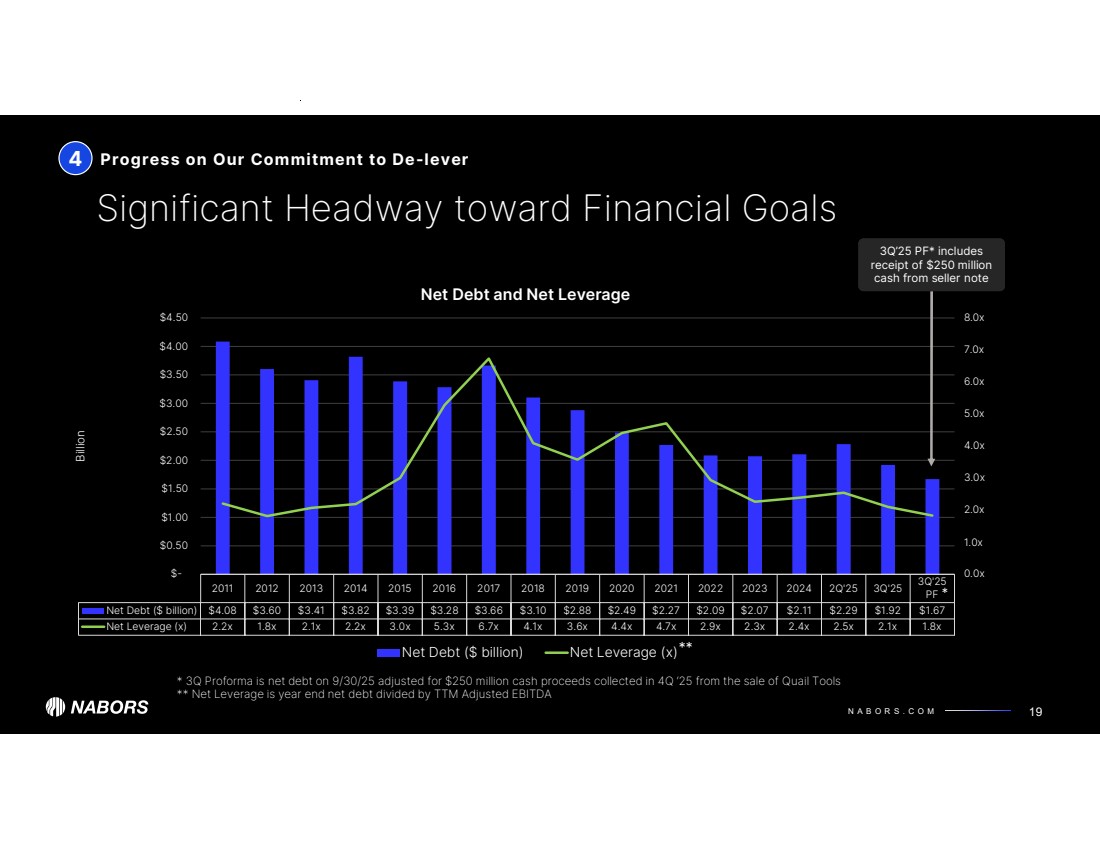
| N A B O R S . C O M 2011 2012 2013 2014 2015 2016 2017 2018 2019 2020 2021 2022 2023 2024 2Q'25 3Q'25 3Q'25 PF Net Debt ($ billion) $4.08 $3.60 $3.41 $3.82 $3.39 $3.28 $3.66 $3.10 $2.88 $2.49 $2.27 $2.09 $2.07 $2.11 $2.29 $1.92 $1.67 Net Leverage (x) 2.2x 1.8x 2.1x 2.2x 3.0x 5.3x 6.7x 4.1x 3.6x 4.4x 4.7x 2.9x 2.3x 2.4x 2.5x 2.1x 1.8x 0.0x 1.0x 2.0x 3.0x 4.0x 5.0x 6.0x 7.0x 8.0x $- $0.50 $1.00 $1.50 $2.00 $2.50 $3.00 $3.50 $4.00 $4.50 Billion Net Debt and Net Leverage Net Debt ($ billion) Net Leverage (x) Significant Headway toward Financial Goals Progress on Our Commitment to De-lever 19 4 3Q’25 PF* includes receipt of $250 million cash from seller note * 3Q Proforma is net debt on 9/30/25 adjusted for $250 million cash proceeds collected in 4Q ‘25 from the sale of Quail Tools ** Net Leverage is year end net debt divided by TTM Adjusted EBITDA ** * |
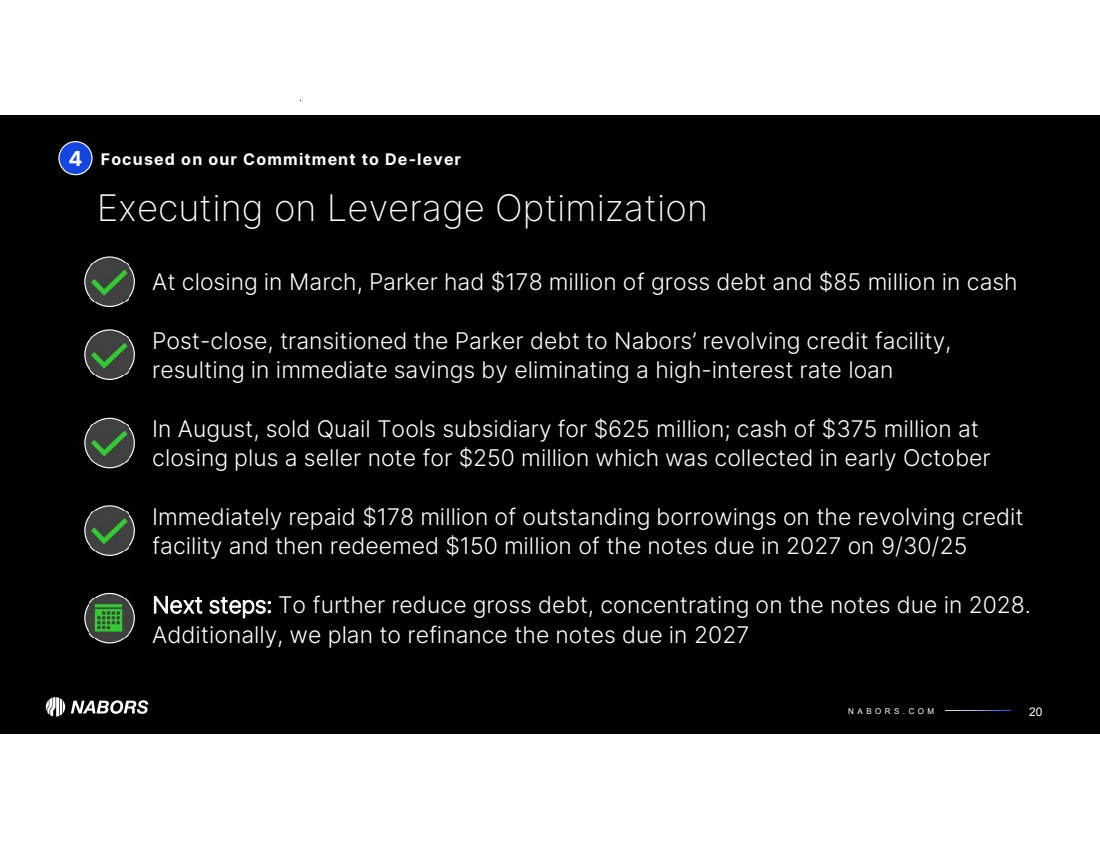
| N A B O R S . C O M At closing in March, Parker had $178 million of gross debt and $85 million in cash Post-close, transitioned the Parker debt to Nabors’ revolving credit facility, resulting in immediate savings by eliminating a high-interest rate loan In August, sold Quail Tools subsidiary for $625 million; cash of $375 million at closing plus a seller note for $250 million which was collected in early October Immediately repaid $178 million of outstanding borrowings on the revolving credit facility and then redeemed $150 million of the notes due in 2027 on 9/30/25 Next steps: To further reduce gross debt, concentrating on the notes due in 2028. Additionally, we plan to refinance the notes due in 2027 Executing on Leverage Optimization Focused on our Commitment to De-lever 20 4 |
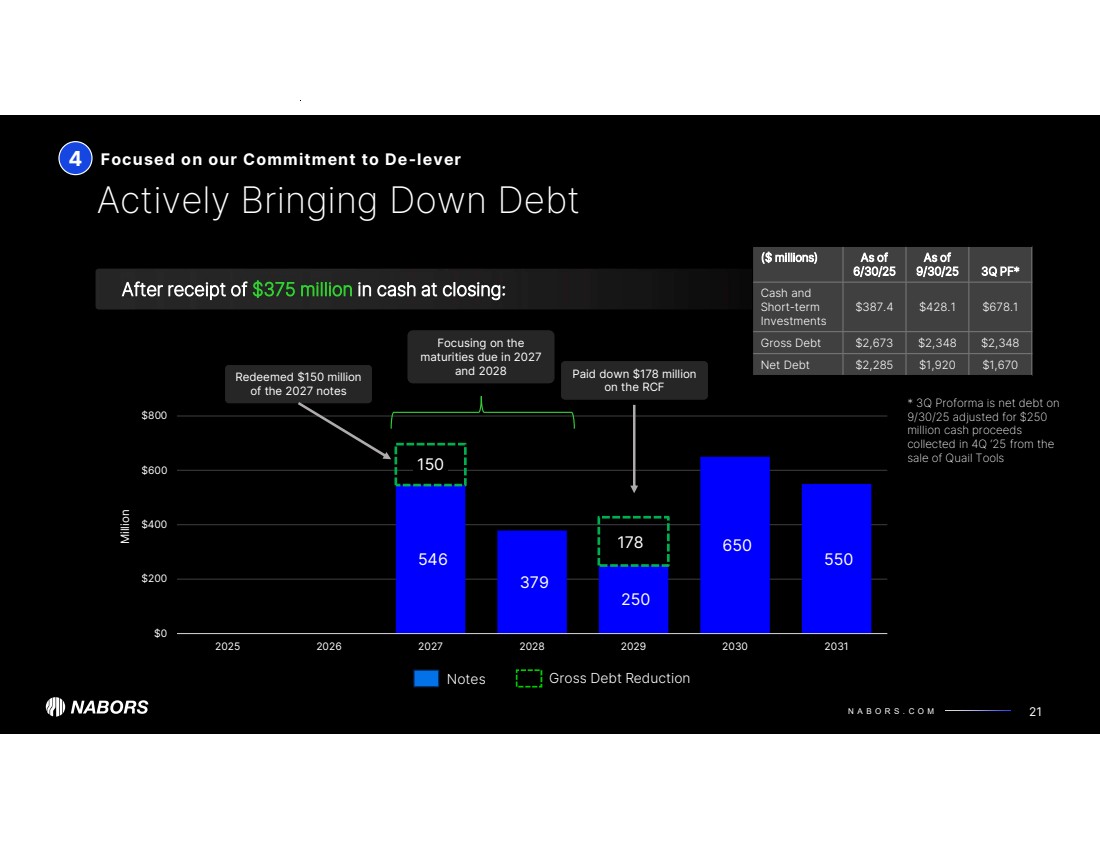
| N A B O R S . C O M 546 379 250 650 550 150 178 $0 $200 $400 $600 $800 2025 2026 2027 2028 2029 2030 2031 Million 21 Actively Bringing Down Debt Notes Gross Debt Reduction Focusing on the maturities due in 2027 and 2028 Paid down $178 million on the RCF After receipt of $375 million in cash at closing: 4 Focused on our Commitment to De-lever Redeemed $150 million of the 2027 notes 3Q PF* As of 9/30/25 As of 6/30/25 ($ millions) $387.4 $428.1 $678.1 Cash and Short-term Investments Gross Debt $2,673 $2,348 $2,348 Net Debt $2,285 $1,920 $1,670 * 3Q Proforma is net debt on 9/30/25 adjusted for $250 million cash proceeds collected in 4Q ‘25 from the sale of Quail Tools |
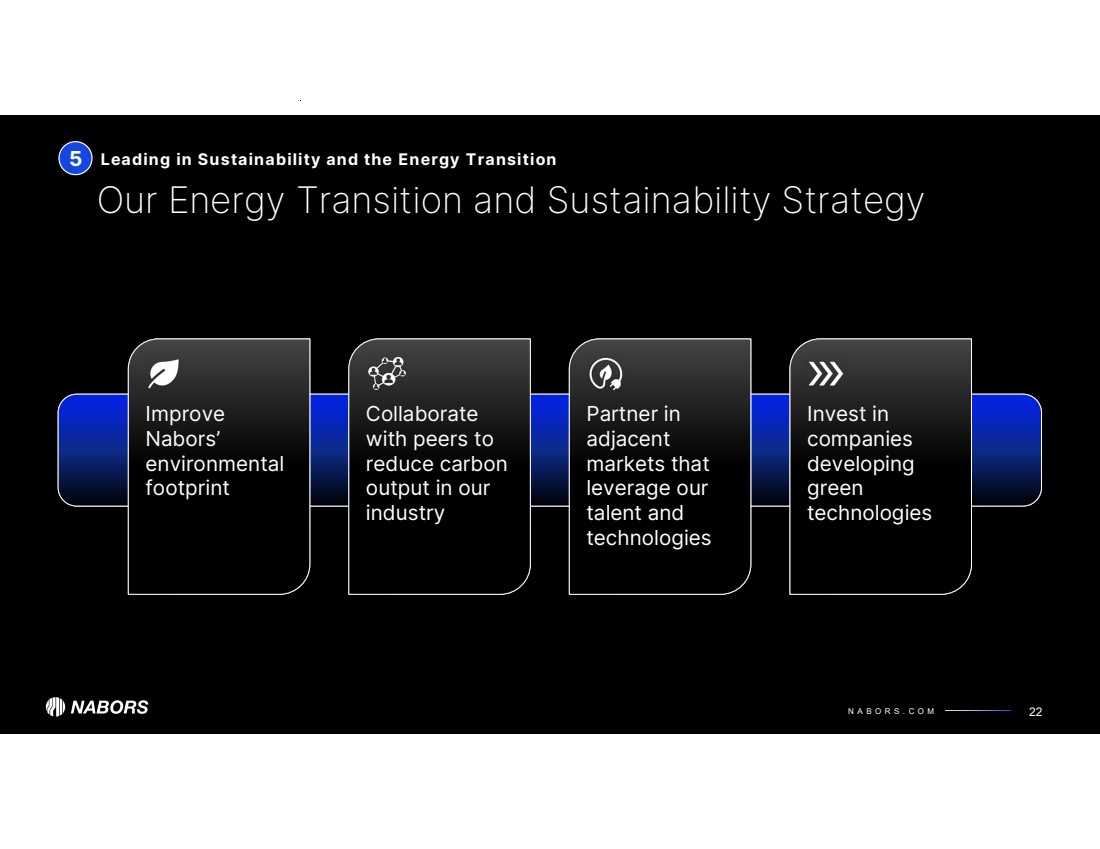
| N A B O R S . C O M Our Energy Transition and Sustainability Strategy Leading in Sustainability and the Energy Transition 22 Improve Nabors’ environmental footprint Collaborate with peers to reduce carbon output in our industry Partner in adjacent markets that leverage our talent and technologies Invest in companies developing green technologies 5 |
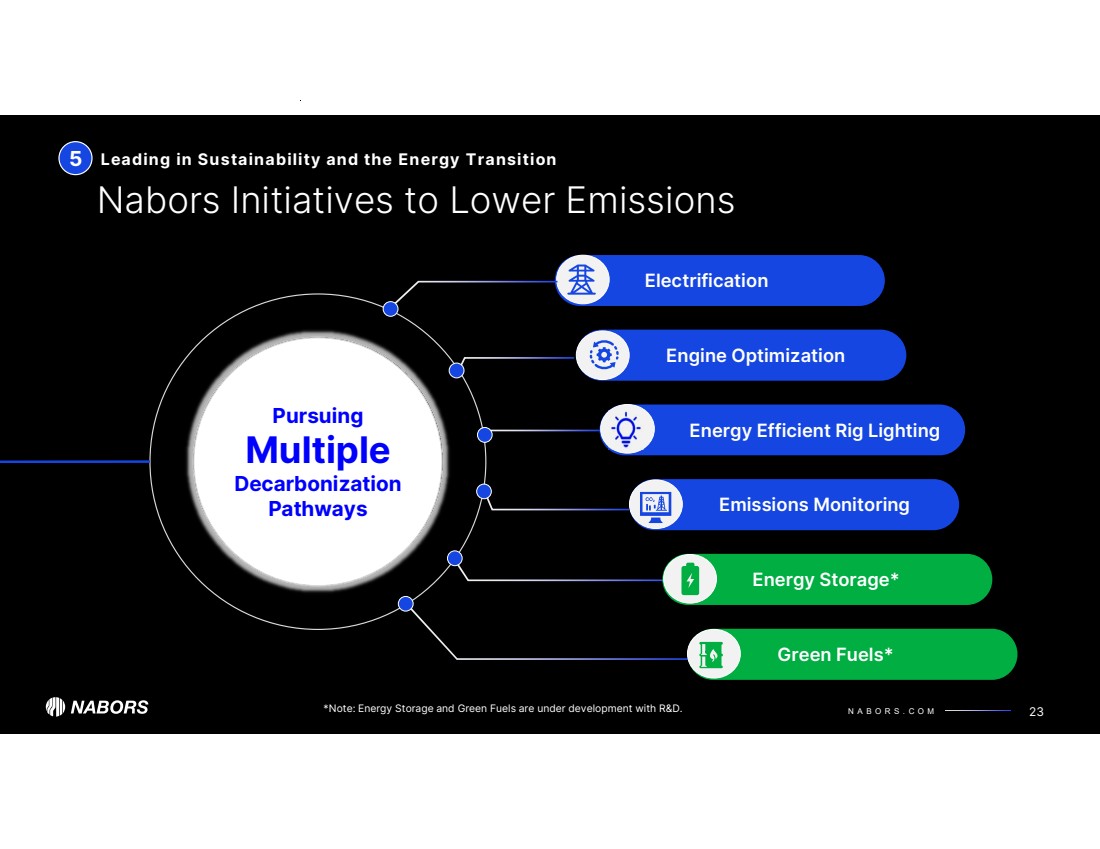
| N A B O R S . C O M Electrification Pursuing Multiple Decarbonization Pathways Green Fuels* Energy Storage* Leading in Sustainability and the Energy Transition Nabors Initiatives to Lower Emissions 23 Emissions Monitoring Engine Optimization 5 Energy Efficient Rig Lighting *Note: Energy Storage and Green Fuels are under development with R&D. |
| Appendix 24 |
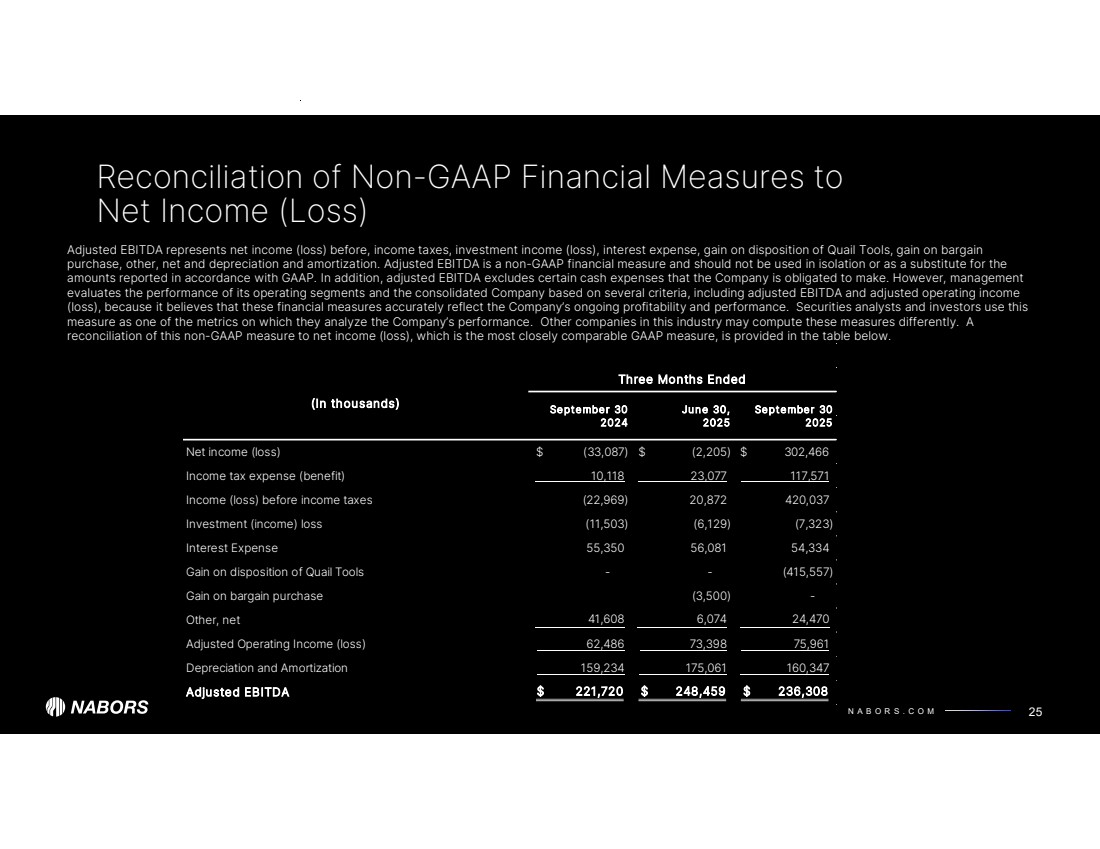
| N A B O R S . C O M Reconciliation of Non-GAAP Financial Measures to Net Income (Loss) 25 Adjusted EBITDA represents net income (loss) before, income taxes, investment income (loss), interest expense, gain on disposition of Quail Tools, gain on bargain purchase, other, net and depreciation and amortization. Adjusted EBITDA is a non-GAAP financial measure and should not be used in isolation or as a substitute for the amounts reported in accordance with GAAP. In addition, adjusted EBITDA excludes certain cash expenses that the Company is obligated to make. However, management evaluates the performance of its operating segments and the consolidated Company based on several criteria, including adjusted EBITDA and adjusted operating income (loss), because it believes that these financial measures accurately reflect the Company’s ongoing profitability and performance. Securities analysts and investors use this measure as one of the metrics on which they analyze the Company’s performance. Other companies in this industry may compute these measures differently. A reconciliation of this non-GAAP measure to net income (loss), which is the most closely comparable GAAP measure, is provided in the table below. (In thousands) September 30 June 30, September 30 2024 2025 2025 Net income (loss) (33,087) $ (2,205) $ 302,466 $ Income tax expense (benefit) 10,118 23,077 117,571 Income (loss) before income taxes (22,969) 20,872 420,037 Investment (income) loss (11,503) (6,129) (7,323) Interest Expense 55,350 56,081 54,334 Gain on disposition of Quail Tools - - (415,557) Gain on bargain purchase (3,500) - Other, net 41,608 6,074 24,470 Adjusted Operating Income (loss) 62,486 73,398 75,961 Depreciation and Amortization 159,234 175,061 160,347 Adjusted EBITDA $ 221,720 248,459 $ 236,308 $ Three Months Ended |
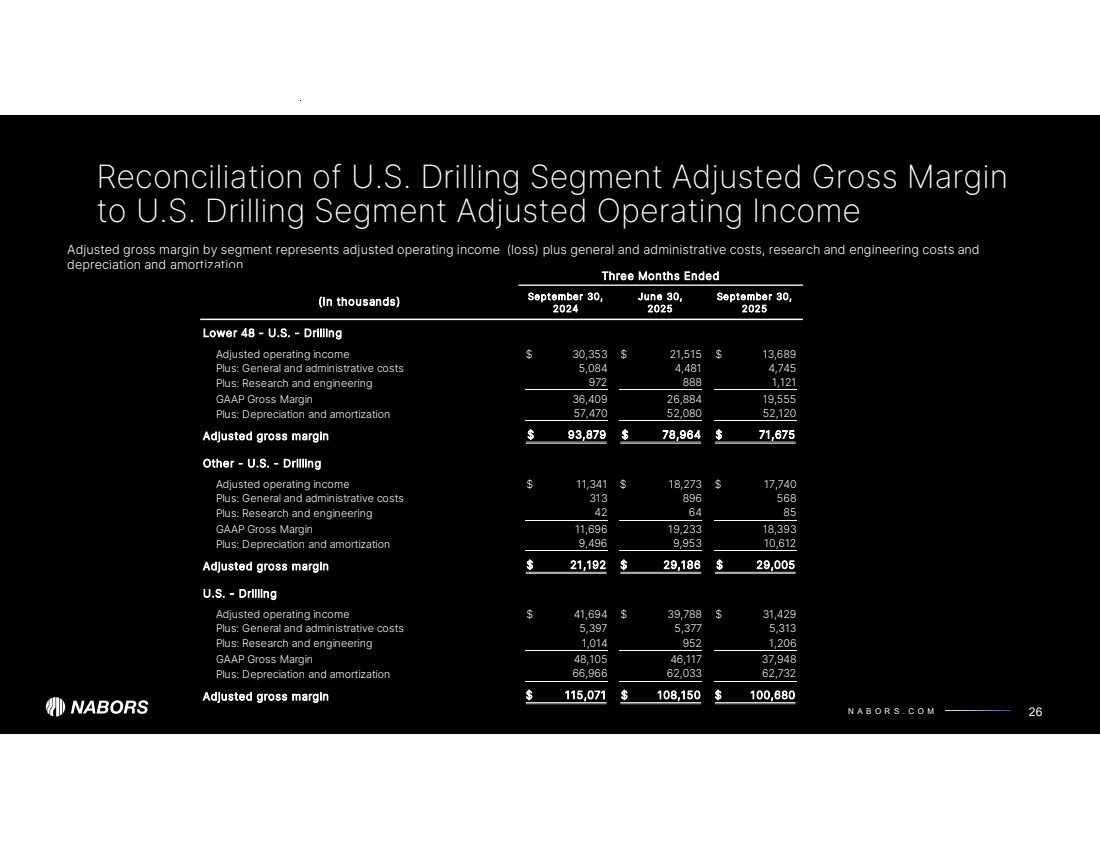
| N A B O R S . C O M Reconciliation of U.S. Drilling Segment Adjusted Gross Margin to U.S. Drilling Segment Adjusted Operating Income 26 Adjusted gross margin by segment represents adjusted operating income (loss) plus general and administrative costs, research and engineering costs and depreciation and amortization. September 30, June 30, September 30, 2024 2025 2025 Lower 48 - U.S. - Drilling Adjusted operating income 30,353 $ 21,515 $ 13,689 $ Plus: General and administrative costs 5,084 4,481 4,745 Plus: Research and engineering 972 888 1,121 GAAP Gross Margin 36,409 26,884 19,555 Plus: Depreciation and amortization 57,470 52,080 52,120 Adjusted gross margin $ 78,964 93,879 $ 71,675 $ Other - U.S. - Drilling Adjusted operating income 11,341 $ 18,273 $ 17,740 $ Plus: General and administrative costs 313 896 568 Plus: Research and engineering 42 64 85 GAAP Gross Margin 11,696 19,233 18,393 Plus: Depreciation and amortization 9,953 9,496 10,612 Adjusted gross margin $ 29,186 21,192 $ 29,005 $ U.S. - Drilling Adjusted operating income 41,694 $ 39,788 $ 31,429 $ Plus: General and administrative costs 5,397 5,377 5,313 Plus: Research and engineering 952 1,014 1,206 GAAP Gross Margin 48,105 46,117 37,948 Plus: Depreciation and amortization 62,033 66,966 62,732 Adjusted gross margin $ 115,071 108,150 $ 100,680 $ (In thousands) Three Months Ended |
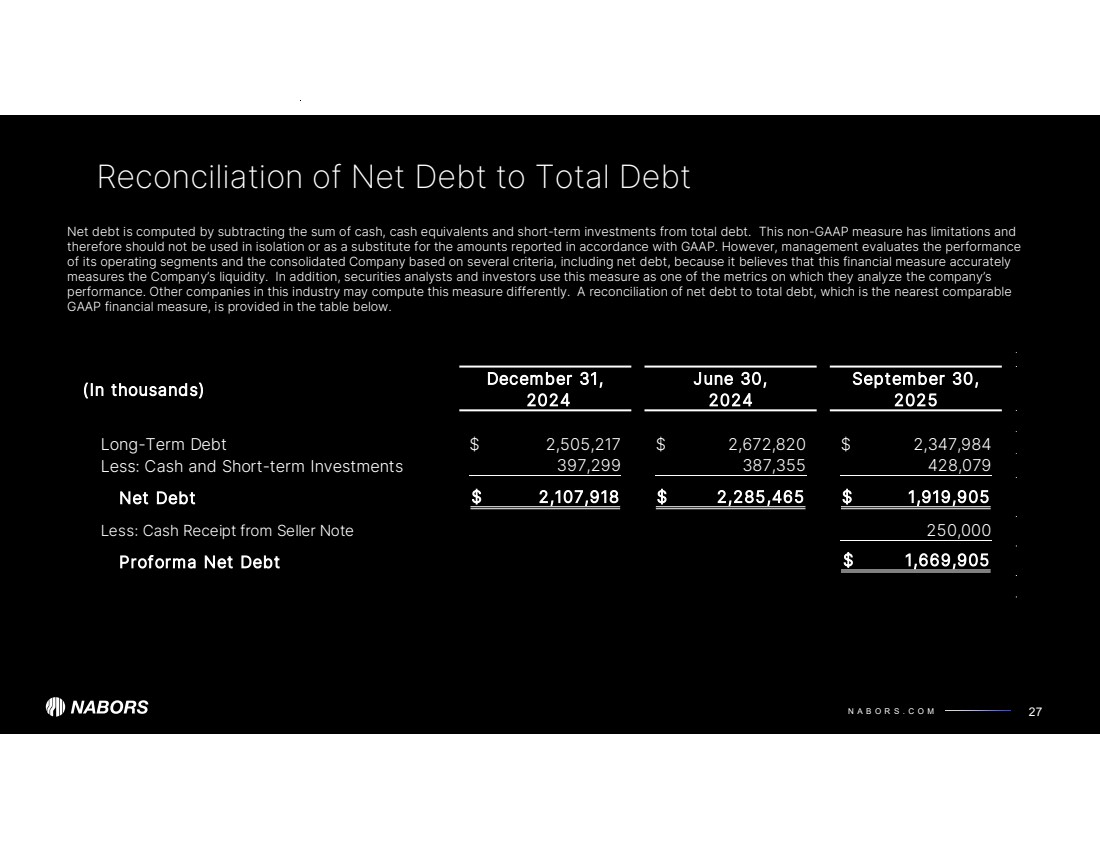
| N A B O R S . C O M Reconciliation of Net Debt to Total Debt 27 Net debt is computed by subtracting the sum of cash, cash equivalents and short-term investments from total debt. This non-GAAP measure has limitations and therefore should not be used in isolation or as a substitute for the amounts reported in accordance with GAAP. However, management evaluates the performance of its operating segments and the consolidated Company based on several criteria, including net debt, because it believes that this financial measure accurately measures the Company’s liquidity. In addition, securities analysts and investors use this measure as one of the metrics on which they analyze the company’s performance. Other companies in this industry may compute this measure differently. A reconciliation of net debt to total debt, which is the nearest comparable GAAP financial measure, is provided in the table below. (In thousands) December 31, 2024 June 30, 2024 September 30, 2025 Long-Term Debt 2,505,217 $ 2,672,820 $ 2,347,984 $ Less: Cash and Short-term Investments 397,299 387,355 428,079 Net Debt $ 2,285,465 2,107,918 $ 1,919,905 $ Less: Cash Receipt from Seller Note 250,000 Proforma Net Debt $ 1,669,905 |
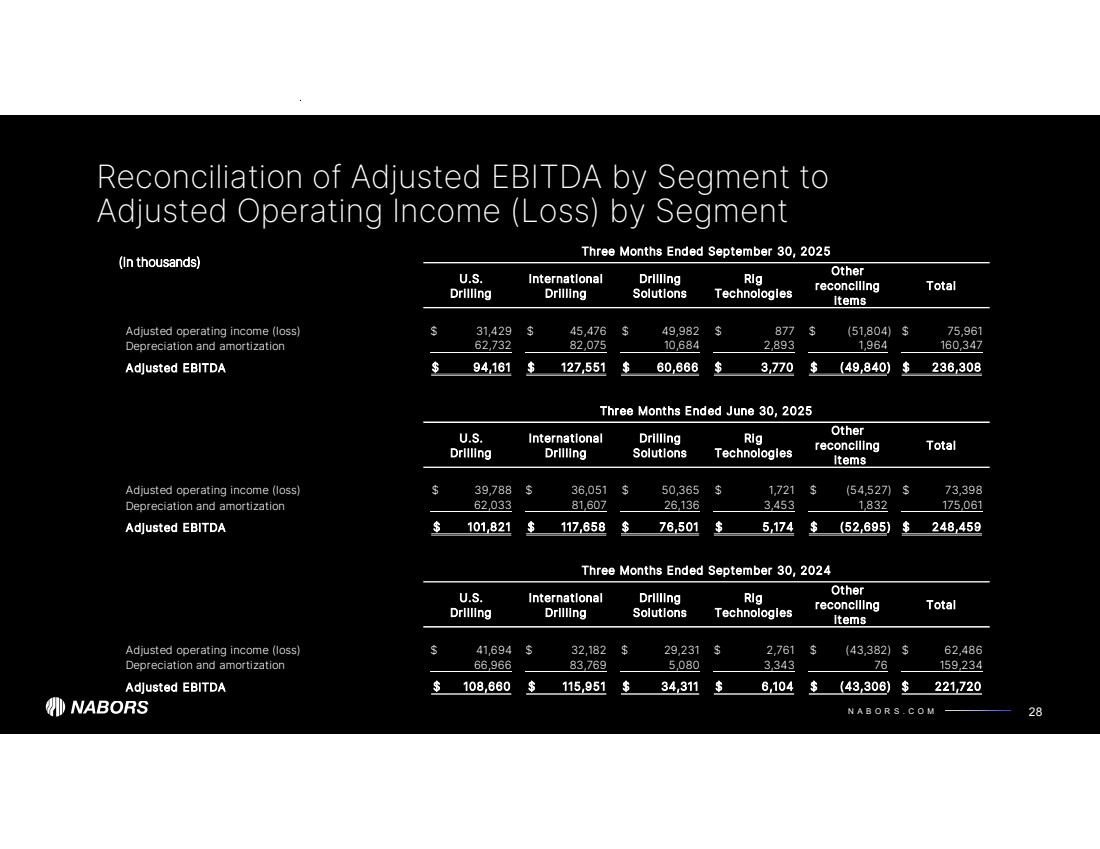
| N A B O R S . C O M Reconciliation of Adjusted EBITDA by Segment to Adjusted Operating Income (Loss) by Segment 28 Adjusted EBITDA by segment represents adjusted income (loss) plus depreciation and amortization. Three Months Ended September 30, 2025 U.S. Drilling International Drilling Drilling Solutions Rig Technologies Other reconciling items Total Adjusted operating income (loss) 31,429 $ 45,476 $ 49,982 $ 877 $ (51,804) $ 75,961 $ Depreciation and amortization 82,075 62,732 10,684 2,893 1,964 160,347 Adjusted EBITDA $ 94,161 127,551 $ 60,666 $ 3,770 $ (49,840) $ 236,308 $ Three Months Ended June 30, 2025 U.S. Drilling International Drilling Drilling Solutions Rig Technologies Other reconciling items Total Adjusted operating income (loss) 39,788 $ 36,051 $ 50,365 $ 1,721 $ (54,527) $ 73,398 $ Depreciation and amortization 81,607 62,033 26,136 3,453 1,832 175,061 Adjusted EBITDA $ 117,658 101,821 $ 76,501 $ 5,174 $ (52,695) $ 248,459 $ Three Months Ended September 30, 2024 U.S. Drilling International Drilling Drilling Solutions Rig Technologies Other reconciling items Total Adjusted operating income (loss) 41,694 $ 32,182 $ 29,231 $ 2,761 $ (43,382) $ 62,486 $ Depreciation and amortization 83,769 66,966 5,080 3,343 76 159,234 Adjusted EBITDA $ 115,951 108,660 $ 34,311 $ 6,104 $ (43,306) $ 221,720 $ (In thousands) |
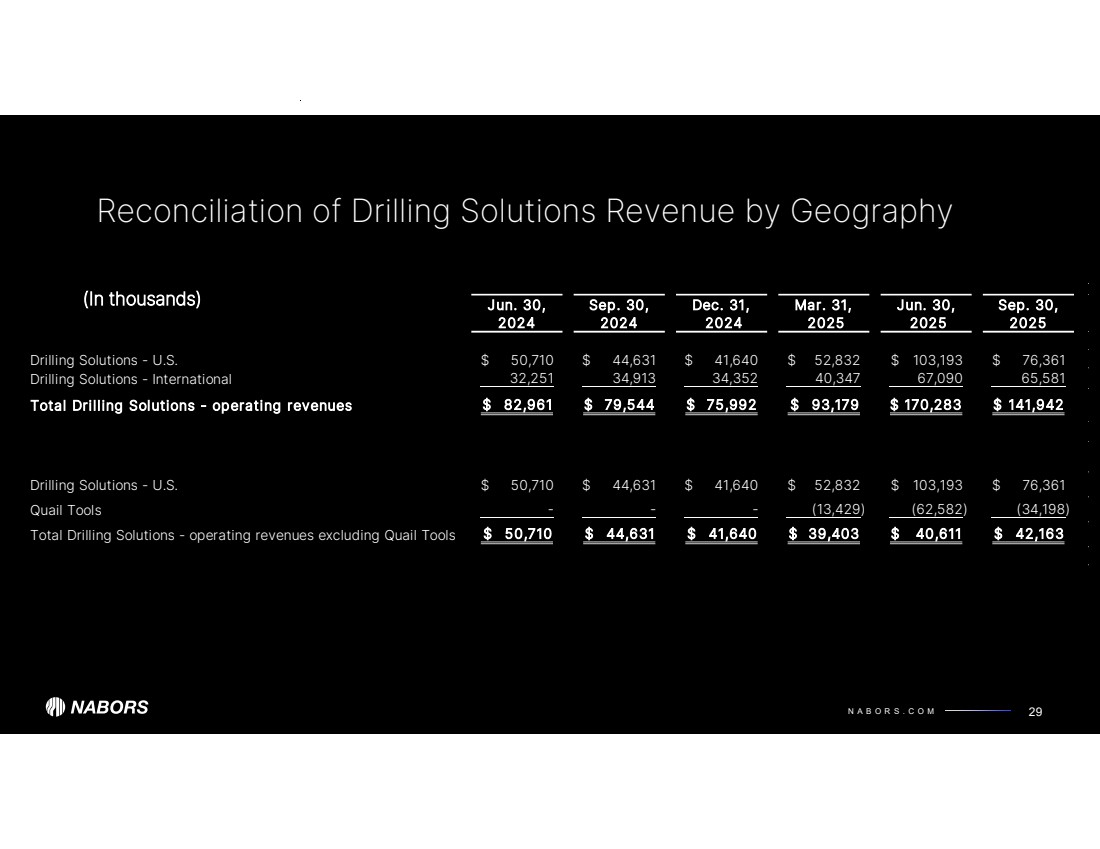
| N A B O R S . C O M Reconciliation of Drilling Solutions Revenue by Geography 29 Adjusted EBITDA by segment represents adjusted income (loss) plus depreciation and amortization. Jun. 30, 2024 Sep. 30, 2024 Dec. 31, 2024 Mar. 31, 2025 Jun. 30, 2025 Sep. 30, 2025 Drilling Solutions - U.S. 50,710 $ 44,631 $ 41,640 $ 52,832 $ 103,193 $ 76,361 $ Drilling Solutions - International 32,251 34,913 34,352 40,347 67,090 65,581 Total Drilling Solutions - operating revenues $ 79,544 82,961 $ 75,992 $ 93,179 $ 170,283 $ 141,942 $ Drilling Solutions - U.S. 50,710 $ 44,631 $ 41,640 $ 52,832 $ 103,193 $ 76,361 $ Quail Tools - - - (13,429) (62,582) (34,198) Total Drilling Solutions - operating revenues excluding Quail Tools $ 44,631 50,710 $ 41,640 $ 39,403 $ 40,611 $ 42,163 $ (In thousands) |
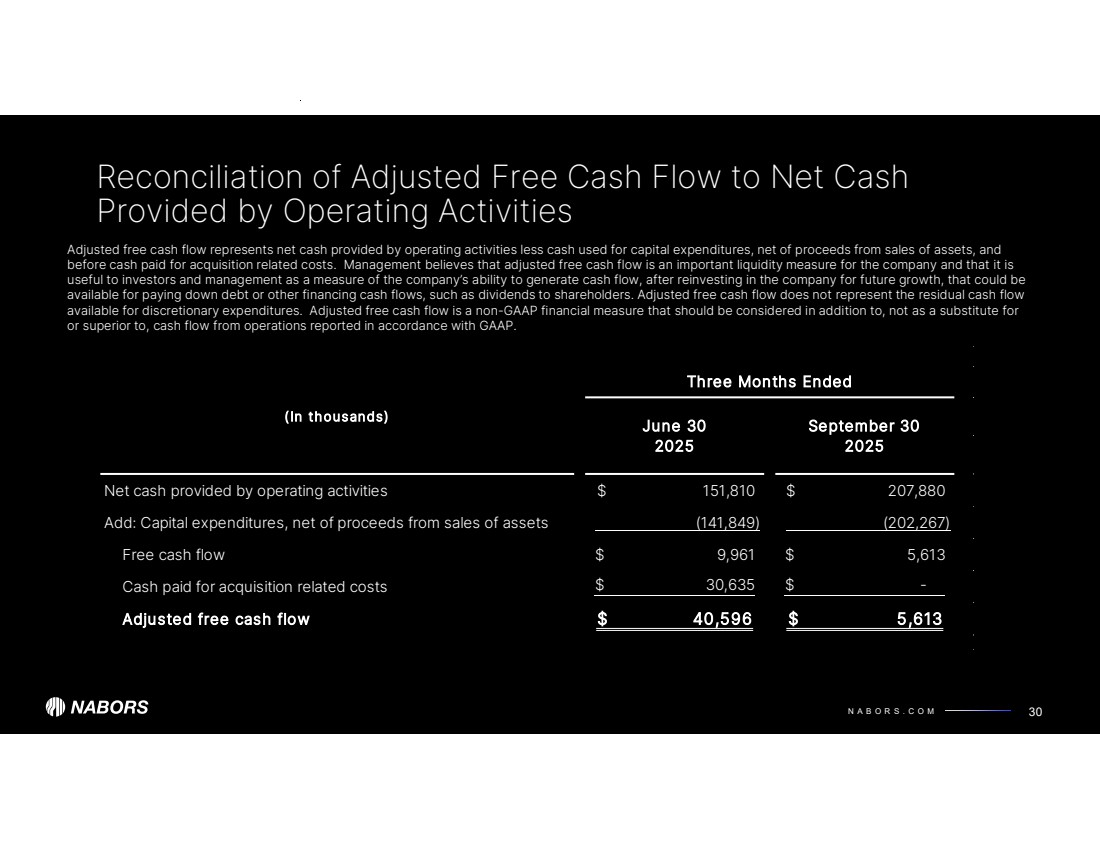
| N A B O R S . C O M Reconciliation of Adjusted Free Cash Flow to Net Cash Provided by Operating Activities 30 Adjusted free cash flow represents net cash provided by operating activities less cash used for capital expenditures, net of proceeds from sales of assets, and before cash paid for acquisition related costs. Management believes that adjusted free cash flow is an important liquidity measure for the company and that it is useful to investors and management as a measure of the company’s ability to generate cash flow, after reinvesting in the company for future growth, that could be available for paying down debt or other financing cash flows, such as dividends to shareholders. Adjusted free cash flow does not represent the residual cash flow available for discretionary expenditures. Adjusted free cash flow is a non-GAAP financial measure that should be considered in addition to, not as a substitute for or superior to, cash flow from operations reported in accordance with GAAP. Three Months Ended (In thousands) June 30 September 30 2025 2025 Net cash provided by operating activities 151,810 $ 207,880 $ Add: Capital expenditures, net of proceeds from sales of assets (141,849) (202,267) Free cash flow 9,961 $ 5,613 $ Cash paid for acquisition related costs $ - 30,635 $ Adjusted free cash flow $ 40,596 5,613 $ |
| NABORS INDUSTRIES LTD. NABORS.COM NABORS CORPORATE SERVICES 515 W. Greens Road Suite 1200 Houston, TX 77067-4525 @ n a b o r s g l o b a l Contact Us: William C. Conroy, CFA VP - Corporate Development and Investor Relations William.Conroy@nabors.com Kara K. Peak Director - Corporate Development and Investor Relations Kara.Peak@nabors.com |