Please wait
Table of Contents
UNITED STATES
SECURITIES AND EXCHANGE COMMISSION
WASHINGTON, D.C. 20549
FORM 10-K/A
(Amendment No. 1)
x ANNUAL REPORT PURSUANT TO SECTION 13 OR 15(d) OF THE SECURITIES EXCHANGE ACT OF 1934
For the fiscal year ended December 31, 2014
OR
o TRANSITION REPORT PURSUANT TO SECTION 13 OR 15(d) OF THE SECURITIES EXCHANGE ACT OF 1934
For the transition period from to
Commission file number 001-31468
MONTPELIER RE HOLDINGS LTD.
(Exact name of registrant as specified in its charter)
|
Bermuda |
|
98-0428969 |
|
(State or other jurisdiction of |
|
(I.R.S. Employer |
|
incorporation or organization) |
|
Identification No.) |
Montpelier House, 94 Pitts Bay Road
Pembroke, Bermuda HM 08
(Address of principal executive offices)
Registrant’s telephone number, including area code: (441) 296-5550
Securities registered pursuant to Section 12(b) of the Act:
|
Title of each class |
|
Name of each exchange on which registered |
|
Common Shares, par value 1/6 cent per share (“Common Shares”) |
|
New York Stock Exchange and Bermuda Stock Exchange |
|
Preferred Shares, Series A, par value 1/6 cent per share (“Preferred Shares”) |
|
New York Stock Exchange and Bermuda Stock Exchange |
Securities registered pursuant to Section 12(g) of the Act
None
Indicate by check mark if the registrant is a well-known seasoned issuer, as defined in Rule 405 of the Securities Act. Yes x No o
Indicate by check mark if the registrant is not required to file reports pursuant to Section 13 or Section 15(d) of the Act. Yes o No x
Indicate by check mark whether the registrant (1) has filed all reports required to be filed by Section 13 or 15(d) of the Securities Exchange Act of 1934 during the preceding 12 months (or for such shorter period that the registrant was required to file such reports), and (2) has been subject to such filing requirements for the past 90 days. Yes x No o
Indicate by check mark whether the registrant has submitted electronically and posted on its corporate Web site, if any, every Interactive Data File required to be submitted and posted pursuant to Rule 405 of Regulation S-T during the preceding 12 months (or for such shorter period that the registrant was required to submit and post such files). Yes x No o
Indicate by check mark if disclosure of delinquent filers pursuant to Item 405 of Regulation S-K is not contained herein, and will not be contained, to the best of the registrant’s knowledge, in definitive proxy or information statements incorporated by reference in Part III of this Form 10-K or any amendment to this Form 10-K. x
Indicate by check mark whether the registrant is a large accelerated filer, an accelerated filer, a non-accelerated filer, or a smaller reporting company. See definition of “large accelerated filer,” “accelerated filer” and “smaller reporting company” in Rule 12b-2 of the Exchange Act.
|
Large accelerated filer x |
|
Accelerated filer o |
|
Non-accelerated filer o |
|
Smaller reporting company o |
Indicate by check mark whether the registrant is a shell company (as defined in Rule 12b-2 of the Act). Yes o No x
The aggregate market value of the outstanding Common Shares held by non-affiliates of the registrant as of the last business day of the registrant’s most recently completed second fiscal quarter (based on the New York Stock Exchange closing price as of June 30, 2014 for Common Shares) was $1,235,712,737.
As of March 30, 2015, 43,799,253 Common Shares were outstanding.
DOCUMENTS INCORPORATED BY REFERENCE
None
Table of Contents
EXPLANATORY NOTE
This Amendment No. 1 on Form 10-K/A (the “Amendment”) amends the Annual Report on Form 10-K of Montpelier Re Holdings Ltd. (the “Company” or the “Registrant”) for the year ended December 31, 2014 that was originally filed with the Securities and Exchange Commission (“SEC”) on February 25, 2015 (the “Original Filing”). The Amendment is being filed solely for the purpose of including the information required by Items 10 through 14 of Part III of Form 10-K.
This information was previously omitted from the Original Filing in reliance on SEC general instructions to Form 10-K, which permits the information in the above referenced items to be incorporated in a Form 10-K by reference from a definitive proxy statement if such statement is filed no later than 120 days after a company’s fiscal year end. We are filing the Amendment to include Part III information in our Form 10-K because our definitive proxy statement containing this information will not be filed before that date. As such, the Amendment hereby amends and restates in their entirety Items 10 through 14 of Part III of the Original Filing as well as the Form 10-K cover page (solely to update the number of Common Shares outstanding to March 30, 2015 and to remove the statement that information is being incorporated by reference from our definitive proxy statement).
We are also filing the Amendment to correct certain errors in the table appearing under “Market Information” contained in Item 5 herein.
In addition, in accordance with the rules and regulations promulgated by the SEC, Item 15 of Part IV has been supplemented to include currently dated certifications pursuant to Sections 302 and 906 of the Sarbanes Oxley Act of 2002.
We have made no substantive changes to the Original Filing other than those noted above. For the convenience of the reader, we have included a complete version of the Amendment, which includes all unchanged portions of the Original Filing, within this report.
This Form 10-K/A does not change any previously reported financial results, nor does it reflect events occurring after the date of the Original Filing. The Amendment should be read in conjunction with the Company’s other filings with the SEC.
Table of Contents
PART I
FORWARD LOOKING STATEMENTS
This Report on Form 10-K/A contains forward-looking statements within the meaning of the United States (“U.S.”) federal securities laws, pursuant to the safe harbor provisions of the Private Securities Litigation Reform Act of 1995, that are not historical facts, including statements about our beliefs and expectations. These statements are based upon current plans, estimates and projections. Forward-looking statements rely on a number of assumptions concerning future events and are subject to a number of uncertainties and various risk factors, many of which are outside our control. See “Risk Factors” contained in Item 1A herein for specific important factors that could cause actual results to differ materially from those contained in forward looking statements. In particular, statements using words such as “may,” “should,” “estimate,” “expect,” “anticipate,” “intend,” “believe,” “predict,” “potential,” or words of similar meaning generally involve forward-looking statements.
Important events and uncertainties that could cause our results or future dividends on, or repurchases of, Common Shares or Preferred Shares to change include, but are not limited to: market conditions affecting the prices of our Common Shares or Preferred Shares; the possibility of severe or unanticipated losses from natural or man-made catastrophes, including those that may result from changes in climate conditions, including, but not limited to, global temperatures and expected sea levels; the effectiveness of our loss limitation methods; our dependence on principal employees; our ability to effectively execute the business plans of the Company, its subsidiaries and any new ventures that it may enter into; the cyclical nature of the insurance and reinsurance business; the levels of new and renewal business achieved; opportunities to increase writings in our core property and specialty insurance and reinsurance lines of business and in specific areas of the casualty reinsurance market and our ability to capitalize on those opportunities; the sensitivity of our business to financial strength ratings established by independent rating agencies; the inherent uncertainty of our risk management processes, which are subject to, among other things, industry loss estimates and estimates generated by modeling techniques; the accuracy of written premium estimates reported by cedants and brokers on pro-rata contracts and certain excess-of-loss contracts where a deposit or minimum premium is not specified in the contract; the inherent uncertainties of establishing reserves for loss and loss adjustment expenses, including our dependency on the loss information we receive from cedants and brokers; unanticipated adjustments to premium estimates; changes in the availability, cost or quality of reinsurance or retrocessional coverage; changes in general economic and financial market conditions; changes in and the impact of governmental legislation or regulation, including changes in tax laws in the jurisdictions where we conduct business; the amount and timing of reinsurance recoverables and reimbursements we actually receive from our reinsurers; the overall level of competition, and the related demand and supply dynamics in our markets relating to growing capital levels in our industry; declining demand due to increased retentions by cedants and other factors; the impact of terrorist activities on the Company and the economy; rating agency policies and practices; unexpected developments concerning the small number of insurance and reinsurance brokers upon whom we rely for a large portion of revenues; our dependence as a holding company upon dividends or distributions from our operating subsidiaries; and the impact of foreign currency and interest rate fluctuations.
We undertake no obligation to publicly update or revise any forward-looking statements, whether as a result of new information, future events or otherwise. Readers are cautioned not to place undue reliance on these forward-looking statements, which speak only as of the dates on which they are made.
Item 1. Business
OVERVIEW
The Company
Montpelier Re Holdings Ltd. (the “Company” or the “Registrant”) was incorporated as a Bermuda exempted limited liability company under the laws of Bermuda in November 2001. Through our subsidiaries and affiliates in Bermuda, the United Kingdom (the “U.K.”) and the U.S. (collectively “Montpelier”), we provide customized and innovative insurance and reinsurance solutions to the global market. Through our affiliates in Bermuda, we also provide institutional and retail investors with direct access to the global property catastrophe reinsurance market.
At December 31, 2014 and 2013, the Company had $3,629.1 million and $3,758.5 million of consolidated total assets, respectively, and total shareholders’ equity available to the Company of $1,648.2 million and $1,642.1 million, respectively. The Company’s headquarters and principal executive offices are located at Montpelier House, 94 Pitts Bay Road, Pembroke, Bermuda HM 08.
2
Table of Contents
Our Reportable Segments
We operate through three reportable segments: Montpelier Bermuda, Montpelier at Lloyd’s and Collateralized Reinsurance. Each of our segments represents a separate and distinct underwriting platform through which we conduct insurance and reinsurance business. Our segment disclosures present the operations of Montpelier Bermuda, Montpelier at Lloyd’s and Collateralized Reinsurance prior to the effects of any inter-segment quota share reinsurance agreements among them. This presentation allows the reader, as well as the Company’s chief operating decision makers, to objectively analyze the business originated through each of our underwriting platforms, regardless of where such business ultimately resides within Montpelier’s group of companies.
Detailed financial information about our reportable segments for each of the years in the three-year period ended December 31, 2014 is presented in Note 12 of the Notes to Consolidated Financial Statements. The activities of the Company, certain intermediate holding and service companies, intercompany eliminations relating to inter-segment reinsurance agreements and support services and the business retained upon the Company’s 2011 sale (the “MUSIC Sale”) of Montpelier U.S. Insurance Company (“MUSIC”) to Selective Insurance Group, Inc. (“Selective”), collectively referred to as “Corporate and Other”, are also presented in Note 12.
The nature and composition of each of our reportable segments and our Corporate and Other activities is as follows:
Montpelier Bermuda
Our Montpelier Bermuda segment consists of the assets and operations of Montpelier Reinsurance Ltd. (“Montpelier Re”).
Montpelier Re, our wholly-owned operating subsidiary based in Pembroke, Bermuda, is registered as a Bermuda Class 4 insurer. Montpelier Re seeks to identify and underwrite insurance and reinsurance opportunities by combining underwriting experience with proprietary risk pricing and capital allocation models and catastrophe modeling tools. Montpelier Re focuses on writing short-tail U.S. and international catastrophe treaty reinsurance on both an excess-of-loss and proportional basis. Montpelier Re also writes specialty treaty reinsurance, including casualty, accident & health, aviation, space, crop, financial risk, political risk, terrorism and workers’ compensation catastrophe classes of business, as well as insurance and facultative reinsurance business.
Montpelier at Lloyd’s
Our Montpelier at Lloyd’s segment consists of the collective assets and operations of Montpelier Syndicate 5151 (“Syndicate 5151”), Montpelier Capital Limited (“MCL”), Montpelier at Lloyd’s Limited (“MAL”), Montpelier Underwriting Services Limited (“MUSL”) and Montpelier Underwriting Inc. (“MUI”).
Syndicate 5151, our wholly-owned Lloyd’s of London (“Lloyd’s”) syndicate based in London, was established in July 2007. Syndicate 5151 underwrites property insurance and reinsurance, engineering, marine hull and liability, cargo and specie, political & financial risks and specialty casualty classes sourced mainly from the London, U.S. and European markets through MUI and other authorized Lloyd’s coverholders (“Lloyd’s Coverholders”).
MCL, our wholly-owned U.K. subsidiary based in London, serves as Syndicate 5151’s corporate underwriting member at Lloyd’s.
MAL, our wholly-owned Lloyd’s Managing Agent based in London, manages Syndicate 5151.
MUSL, our wholly-owned U.K. subsidiary based in London, provides support services to Syndicate 5151, MAL and MCL.
MUI, our wholly-owned subsidiary based in Woburn, Massachusetts serves as a Lloyd’s Coverholder on behalf of Syndicate 5151. MUI underwrites facultative reinsurance business through managing general agents and intermediaries.
Since its inception, approximately 70% of Montpelier at Lloyd’s business has been ceded to Montpelier Re through inter-segment quota share reinsurance agreements consisting of a quota share agreement between Syndicate 5151 and Montpelier Re and a quota share agreement between MCL and Montpelier Re. As previously stated, our segment disclosures provided herein present the operations of Montpelier at Lloyd’s prior to the effects of these inter-segment quota share reinsurance agreements.
3
Table of Contents
Collateralized Reinsurance
Our Collateralized Reinsurance segment, which we market under the name Blue Capital® (Blue Capital is a registered trademark of the Company), was launched in 2012 as an asset management platform offering a range of property catastrophe reinsurance-linked investment products to institutional and retail investors. Blue Capital® differentiates itself by providing institutional and retail investors with the opportunity to directly invest in global property catastrophe reinsurance risks.
Our Collateralized Reinsurance segment consists of the assets and operations of Blue Water Re Ltd. (“Blue Water Re”), Blue Water Master Fund Ltd. (the “Master Fund”), Blue Capital Management Ltd. (“BCML”) and the operating subsidiaries of Blue Capital Reinsurance Holdings Ltd. (“BCRH”). On December 15, 2014, Blue Capital Insurance Managers Ltd., our former wholly-owned subsidiary, was merged into BCML.
Blue Water Re, our wholly-owned Bermuda-based special purpose insurance vehicle, provides collateralized property catastrophe reinsurance coverage and related products. Blue Water Re was established in November 2011 and commenced operations in June 2012.
The Master Fund is an exempted mutual fund segregated accounts company which was incorporated in Bermuda in December 2011. The Master Fund has various segregated accounts, including the BCAP Mid Vol Fund cell (the “Mid Vol Cell”), the Blue Capital Low Volatility Strategy cell (the “Low Vol Cell”) and the Blue Capital Global Reinsurance SA-I cell (the “BCGR Cell”), (collectively, the “Cells”).
The Cells may invest in: (i) fully-collateralized property catastrophe reinsurance contracts by subscribing for non-voting redeemable preference shares issued by Blue Water Re, with each series of such preference shares linked to a specific reinsurance contract with a third-party ceding company; and (ii) various insurance-linked securities issued by entities other than Blue Water Re.
Montpelier Re has been the sole investor in the Mid Vol Cell and the Low Vol Cell since their inception.
BCML, our wholly-owned Bermuda-based subsidiary, provides investment and insurance management services to: (i) Blue Water Re; (ii) the Cells; and (iii) BCRH and its subsidiaries. BCML is a registered investment advisor with the U.S. Securities and Exchange Commission (the “SEC”).
BCRH is a Bermuda-based exempted limited liability holding company which provides fully-collateralized property catastrophe reinsurance and invests in various insurance-linked securities through its wholly-owned Bermuda-based subsidiaries Blue Capital Re Ltd. (“Blue Capital Re”) and Blue Capital Re ILS Ltd. (“Blue Capital Re ILS”). The underwriting decisions and operations of BCRH and its subsidiaries are managed by BCML, and each uses Montpelier’s reinsurance underwriting expertise and infrastructure to conduct its business. BCRH commenced its operations in November 2013 pursuant to its initial public offering (the “BCRH IPO”) and its common shares are listed on the New York Stock Exchange, under the symbol BCRH, and the Bermuda Stock Exchange, under the symbol BCRH BH. As of December 31, 2014 and 2013, Montpelier owned 33.3% and 28.6% of BCRH’s outstanding common shares, respectively. Montpelier increased its ownership in BCRH during 2014 through a series of open-market purchases of BCRH common shares.
BCRH is considered a “variable interest entity” under accounting principles generally accepted in the U.S. (“GAAP”) and we have determined that we are BCRH’s primary beneficiary. As a result, we fully consolidate the assets, liabilities and operations of BCRH and its subsidiaries within our consolidated financial statements and our Collateralized Reinsurance segment disclosures. The interests in BCRH and its subsidiaries that we fully consolidate which are attributable to third-party investors are reported within our consolidated financial statements as non-controlling interests.
Blue Capital Global Reinsurance Fund Limited (the “BCGR Listed Fund”) is a closed-ended mutual fund incorporated in Bermuda that serves as the feeder fund for the BCGR Cell. The BCGR Listed Fund commenced its operations in October 2012 and its ordinary shares are listed on the Specialist Fund Market of the London Stock Exchange, under the symbol BCGR, and on the Bermuda Stock Exchange, under the symbol BCGR BH. As of December 31, 2014 and 2013, Montpelier Re owned 25.1% and 29.0% of the BCGR Listed Fund’s ordinary shares, respectively. Montpelier’s ownership in the BCGR Listed Fund decreased during 2014 as a result of investments made by non-controlling interests.
4
Table of Contents
The BCGR Listed Fund is considered a “voting interest entity” under GAAP and, because we own less than 50% of its outstanding ordinary shares, we do not consolidate its assets, liabilities or operations within our consolidated financial statements or our Collateralized Reinsurance segment disclosures. However, the BCGR Cell and Blue Water Re are considered variable interest entities under GAAP and we have determined that we are the primary beneficiary for these entities. Therefore, as funds held in the BCGR Listed Fund are deployed into the BCGR Cell, and ultimately into Blue Water Re, they are included in our consolidated financial statements and our Collateralized Reinsurance segment disclosures. Conversely, as funds previously deployed by the BCGR Listed Fund and the BCGR Cell into Blue Water Re are returned to the BCGR Listed Fund, they are no longer included in our consolidated financial statements or our Collateralized Reinsurance segment disclosures.
The interests in the BCGR Cell and Blue Water Re that we fully consolidate which are attributable to third-party investors are reported within our consolidated financial statements as non-controlling interests.
Montpelier is entitled to receive management and performance fees from BCRH and the BCGR Listed Fund for the services that it performs for these entities.
Corporate and Other
Our Corporate and Other activities consist of the assets and operations of: (i) the Company and certain of its intermediate holding and service and support companies, including Montpelier Technical Resources Ltd. (“MTR”) and Cladium, Inc. (“Cladium”); (ii) intercompany eliminations relating to inter-segment reinsurance agreements; and (iii) the business we retained upon the MUSIC Sale (“MUSIC Run-Off”).
MTR, our wholly-owned U.S. subsidiary with its main offices in Woburn, Massachusetts and Hanover, New Hampshire, provides accounting, finance, legal, risk management, information technology, internal audit, human resources and advisory services to many of our subsidiaries.
Cladium, Inc. (“Cladium”), our wholly-owned U.S. subsidiary with its main offices in Sunrise, Florida, is a managing general agency for a third-party insurer.
On December 31, 2011, we completed the sale of MUSIC, our former U.S.-based excess and surplus lines insurance company that we acquired in 2007, to Selective. During the period in which we owned MUSIC, it was a domestic surplus lines insurer and was authorized as an excess and surplus lines insurer in all 50 U.S. states and the District of Columbia. MUSIC underwrote smaller commercial property and casualty risks that did not conform to standard insurance lines.
Prior to the MUSIC Sale, MUSIC ceded 75% of its business to Montpelier Re through an inter-segment quota share agreement (the “MUSIC Quota Share”).
Prior to 2014, we presented our MUSIC Run-Off operations as a separate reportable segment. Beginning in 2014,we revised our reportable segments to present our former MUSIC Run-Off operations within Corporate and Other. All periods presented in this report have been restated to conform with the current presentation.
Our Strategy and Operating Principles
We manage our business by the following tenets:
Maintaining a Strong Balance Sheet. We focus on maintaining a strong balance sheet in support of our underwriting activities and we actively manage our capital with a view towards maximizing our fully converted book value per Common Share based on prudent risk tolerances. Our total capital was $2,047.5 million at December 31, 2014, which consisted of $399.3 million of long-term debt, $150.0 million of preferred shareholders’ equity and $1,498.2 million of common shareholders’ equity available to the Company. As part of our capital management strategy, we intend to actively increase or decrease our total capital, as needed, in order to support our current and future underwriting opportunities, including those relating to the third-party capital we manage.
Enhancing Our Lead Position With Cedants and Brokers. We believe that by leading reinsurance programs our underwriters can attract, and can selectively write, exposures from a broad range of business in the marketplace. Our financial strength and the experience and reputation of our underwriters permit us to play an active role in this process, which provides us with greater access to preferred risks and greater influence in negotiation of policy terms, attachment points and premium rates than many other reinsurers.
5
Table of Contents
Combining Subjective Underwriting Methods With Objective Modeling Tools. Through the use of proprietary underwriting tools our underwriters seek to identify those exposures that meet our objectives in terms of return on capital and underwriting criteria. Our underwriters use risk modeling tools, both proprietary and third-party, together with their market knowledge, experience and judgment, and seek to achieve the highest available price per unit of risk assumed. We also seek to exploit pricing inefficiencies that may exist in the market from time to time.
Developing and Maintaining a Balanced Portfolio of Insurance and Reinsurance Risks. We aim to maintain a balanced portfolio of risks, diversified by product, geography and marketing source within each chosen class of business. We employ risk management techniques to monitor correlation risk and we seek to enhance underwriting returns through careful risk selection using advanced capital allocation methodologies. We also actively seek to write more business in classes experiencing attractive conditions and to avoid those classes suffering from intense price competition or poor fundamentals. We believe a balanced portfolio of risks reduces the volatility of returns and optimizes our fully converted book value per Common Share. From time to time, however, we may choose to be overweight in certain classes, products or geographies based on market conditions.
Delivering Customized, Innovative and Timely Insurance and Reinsurance Solutions for Our Clients. We aim to be a premier provider of global property and casualty insurance and reinsurance products and we aim to provide superior customer service. Our objective is to establish and solidify long-term relationships with brokers and clients while developing an industry reputation for innovative and timely quotes for difficult technical risks.
Investing For Total Return. We invest with a view towards optimizing our risk-adjusted return on our investments over time. Under this approach, we equally value net investment income (interest and dividends) and investment gains and losses (both realized and unrealized), each of which is reflected in our net income and earnings per common share. We also believe that investing in prudent levels of equity securities and other investments, in addition to fixed maturities, will enhance our investment returns over time without significantly increasing the overall risk profile of our investment portfolio.
Property and Casualty Insurance and Reinsurance in General
Property and casualty insurers write insurance policies in exchange for premiums paid by the policyholder. An insurance policy is a contract between the insurance company and the policyholder whereby the insurance company agrees to pay for losses suffered by the policyholder that are covered under the contract. Property insurance typically covers the financial consequences of accidental losses to the policyholder’s property. Casualty insurance typically covers the financial consequences of losses to a third-party that are the result of unforeseen acts and accidents.
Property and casualty reinsurers assume, from insurance and reinsurance companies (referred to as “ceding companies,” or “cedants”), all or a portion of the insurance risks that the ceding company has underwritten under one or more insurance policies. In return, the reinsurer receives a premium for the risks that it assumes from the ceding company. Reinsurance can benefit a ceding company in a number of ways, including reducing exposure on individual risks and providing catastrophe protections from larger or multiple losses. Reinsurance can also provide a ceding company with additional underwriting capacity permitting it to accept larger risks and/or write more business than would be possible without an accompanying increase in its capital or surplus. Reinsurers may also purchase reinsurance, known as retrocessional reinsurance, to cover their own risks assumed from ceding companies. Reinsurance companies often enter into retrocessional agreements for many of the same reasons that ceding companies enter into reinsurance agreements.
Insurance and reinsurance companies derive substantially all of their revenues from net earned premiums, net investment income and net gains and losses from investment securities. Premiums represent amounts received from policyholders and ceding companies, and net earned premiums represent the portion of net premiums (gross premiums less ceded reinsurance) which are recognized as revenue over the period of time that coverage is provided (i.e., ratably over the life of the policy). In insurance and reinsurance operations, “float” arises when premiums are received before losses and other expenses are paid, an interval that may extend over many years. During that time, the insurer may choose to invest the money, thereby earning investment income and generating investment gains and losses.
Insurance and reinsurance companies incur a significant amount of their total expenses from policyholder and assumed reinsurance losses, commonly referred to as “claims.” In settling claims, various loss adjustment expenses (“LAE”) are incurred, such as claim adjusters’ fees and litigation expenses. In addition, insurance and reinsurance companies incur policy acquisition costs, such as commissions, profit commissions, brokerage costs, premium taxes and excise taxes, when applicable.
6
Table of Contents
A widely-used measure of relative underwriting performance for an insurance or reinsurance company is the combined ratio. Our combined ratio is calculated by adding: (i) the ratio of incurred losses and LAE to earned premiums (known as the “loss and LAE ratio”); (ii) the ratio of acquisition costs to earned premiums (known as the “acquisition cost ratio”); and (iii) the ratio of general and administrative expenses to earned premiums (known as the “general and administrative expense ratio”), with each component determined in accordance with GAAP (the “GAAP combined ratio”). A GAAP combined ratio under 100% indicates that an insurance or reinsurance company is generating an underwriting profit. A GAAP combined ratio over 100% indicates that an insurance or reinsurance company is generating an underwriting loss.
Insurance and reinsurance companies operating at a GAAP combined ratio of greater than 100% can be profitable when investment income and net investment gains are taken into account. The length of time between receiving premiums and paying out claims, commonly referred to as the “tail,” can significantly affect how profitable float can be. Long-tail losses, such as medical malpractice, pay out over longer periods of time providing the insurance or reinsurance company the opportunity to generate significant investment earnings from float. Short-tail losses, such as fire or physical damage, pay out over shorter periods of time providing the insurance or reinsurance company with a reduced opportunity to generate significant investment earnings from float.
Underwriting and Risk Strategy
Our reinsurance contracts can be written on either an excess-of-loss or a proportional basis. In the case of reinsurance written on an excess-of-loss basis, we receive a specified premium for the risk assumed and indemnify the cedant against all or a specified portion of losses and expenses in excess of a specified dollar or percentage amount. With proportional reinsurance, we share the premiums as well as the losses and expenses in an agreed proportion with the cedant. In both types of contracts, we may provide a ceding commission to the cedant which compensates them for certain underwriting expenses they incur.
Our primary business focus is on short-tail property and other specialty treaty reinsurance written on both an excess-of-loss and proportional basis. We also underwrite certain direct insurance risks.
Our reinsurance contracts can be written on either a traditional or a fully-collateralized basis. In the case of traditional reinsurance, ceding companies often require their reinsurers to have, and to maintain, strong financial strength ratings as assurance that their claims will be paid. In the case of collateralized reinsurance, the reinsurer provides collateral to the cedant for the full amount of any potential claim under the contract in question. In most instances, the collateral posted under each collateralized contract is equal to the total contract value less the net premium charged for the reinsurance protection.
Montpelier Re and Syndicate 5151 (in common with all Lloyd’s syndicates) each have financial strength ratings from one or more independent rating agencies, including A.M. Best, Standard & Poor’s and Fitch Ratings Ltd. Blue Water Re and Blue Capital Re fully-collateralize their reinsurance obligations and do not have financial strength ratings.
Blue Water Re and Blue Capital Re also offer participation in fronting arrangements with Montpelier Re or with other well capitalized third-party rated reinsurers. Under a typical fronting arrangement, a rated insurer issues an insurance policy on behalf of an unrated, fully-collateralized, reinsurer without the intention of retaining any of the risk. The economic risk remains with the unrated reinsurer via an indemnity/reinsurance agreement but the contractual and credit risk is assumed by the fronting insurer, which is required to honor obligations under the policy if the unrated reinsurer fails to indemnify the fronting insurer. Through fronting arrangements, Blue Water Re and Blue Capital Re are able to participate in reinsurance opportunities that would not otherwise be available to a fully-collateralized reinsurer, although they are still required to provide collateral to the fronting reinsurer.
Across all our locations and classes of business, our operating strategy is to write only those risks that we expect will generate an attractive return on allocated capital while seeking to limit our exposure to the potential loss that may arise from a single or a series of loss events to within acceptable levels.
Our insurance and reinsurance underwriting teams work with proprietary and third-party risk analytic and exposure databases that have been designed to provide consistent pricing, prudent risk selection and real-time portfolio management. Our underwriters adhere to guidelines that are developed by senior management, are approved by the boards of directors of each of our operating subsidiaries and are reviewed by the Underwriting Committee of the Company’s Board of Directors (the “Board”).
7
Table of Contents
Reinsurance Modeling and Pricing
As part of our pricing and underwriting process we assess a variety of available factors, including, but not limited to: (i) the reputation and management of the ceding company and the likelihood of establishing a long-term relationship; (ii) the geographical location of the ceding company’s original risks; (iii) the historical loss data of the ceding company; (iv) the historical loss data of the industry as a whole in the relevant regions (in order to compare the ceding company’s historical loss experience to industry averages); and (v) the perceived financial strength of the ceding company.
Historically in the reinsurance market, one lead reinsurer would act as the principal underwriter in terms of negotiating key policy terms and pricing of reinsurance contracts with a broker. In the current environment, brokers typically obtain prices and terms submitted by several quoting reinsurers, all of which are taken into account during the binding process. Our financial strength and the experience and reputation of our underwriters permit us to play an active role in this process. We believe this provides us with greater access to preferred risks and greater influence in negotiation of policy terms, attachment points and premium rates than many other reinsurers.
We have developed a sophisticated proprietary risk management system, called CATM® (CATM is a registered trademark of the Company), to analyze and manage the reinsurance exposures we assume from cedants. This computer-based underwriting system, the technical components of which incorporate the fundamentals of modern portfolio theory, is designed to measure the amount of capital required to support individual contracts based on the degree of correlation between contracts that we underwrite as well as other factors. CATM® consists of a set of risk assessment tools which estimate the amount of potential loss and volatility associated with the contracts we assume. CATM® is designed to use output from models developed by our actuarial team as well as from those of commercial vendors. In addition, CATM® serves as an important component of our corporate enterprise-wide risk model which we use as a guide in managing our risk exposures.
Our Treaty Reinsurance Book of Business
The majority of the reinsurance products we currently write are in the form of treaty reinsurance contracts, which are contractual arrangements that provide for the automatic reinsurance of a type or category of risk underwritten by our clients. When writing a treaty reinsurance contract, we do not typically evaluate separately each of the individual risks assumed under the contract. Accordingly, we are largely dependent on the individual underwriting decisions made by the cedant and, as a result, we carefully consider the cedant’s risk management, underwriting practices, exposure data, loss history and other factors in deciding whether to provide such treaty reinsurance and in appropriately pricing the contract. The majority of our current treaty reinsurance book of business represents short-tail property reinsurance, which includes a limited amount of retrocessional business. Our gross short-tail treaty reinsurance writings totaled $473.7 million, $462.0 million and $503.0 million during the years ended December 31, 2014, 2013 and 2012, respectively. We also write a modest amount of long-tail treaty reinsurance business, mainly casualty risks, which totaled $88.4 million, $79.4 million and $71.9 million during the years ended December 31, 2014, 2013 and 2012, respectively.
The terms of reinsurance contracts we underwrite vary by contract and by type, whether they are excess-of-loss or proportional. We typically provide coverage under excess-of-loss contracts on either an occurrence basis or on an aggregate basis. Some contracts provide coverage on a per risk basis versus a per event basis. Most of our excess-of-loss contracts provide for a reinstatement of coverage following a covered loss event in return for an additional premium.
We manage certain key risks using a combination of CATM®, various third-party models and underwriting judgment. Our three-tiered approach focuses on tracking exposed contract limits, estimating the potential impact of single and multiple natural catastrophe events, and simulating our yearly net operating result to reflect aggregate underwriting and investment risk. We seek to refine and improve each of these approaches based on operational feedback. Underwriting judgment involves important assumptions about matters that are inherently unpredictable and beyond our control and for which historical experience and probability analysis may not provide accurate guidance.
Treaty reinsurance premiums, which are typically due in installments, are a function of the number and type of contracts we write, as well as prevailing market prices. The timing of premiums written vary by line of business. The majority of our property catastrophe business is written in the January 1, April 1, June 1 and July 1 renewal periods, while our property specialty and other specialty business is typically written throughout the year. In the case of pro-rata contracts and excess-of-loss contracts where no deposit or minimum premium is specified in the contract, written premium is recognized evenly through the term of the reinsurance contract based on estimates of ultimate premiums provided by the ceding companies. Subsequent adjustments, based on reports of actual premium or revisions to estimates by ceding companies, are recorded in the period in which they are determined.
8
Table of Contents
Excess-of-loss contracts are typically written on a losses occurring basis, which means that they cover losses that occur during the contract term, regardless of when the underlying policies incept. Premiums from excess-of-loss contracts are earned ratably over the contract term, which is ordinarily twelve months. In contrast, most pro-rata contracts are written on a risks attaching basis, which means that we assume a stated percentage of each original policy that the ceding company writes during the contract term. As a result, the risk period for pro-rata contracts, which extends from the inception date of the first policy bound during the contract term to the termination date of the last policy bound, exceeds the contract term. Premiums from pro-rata contracts are earned over the associated risk periods.
Our Individual Risk Book of Business
We write direct insurance and facultative reinsurance contracts where we insure and reinsure individual risks. Our individual risk business is currently underwritten by Montpelier Re and Syndicate 5151 and our excess and surplus lines insurance was formerly underwritten by MUSIC.
Our gross short-tail direct insurance and facultative reinsurance writings totaled $172.3 million, $162.6 million and $157.9 million during the years ended December 31, 2014, 2013 and 2012, respectively. We also wrote a small amount of long-tail direct insurance and facultative reinsurance business which totaled $5.9 million, $2.0 million and $2.5 million during the years ended December 31, 2014, 2013 and 2012, respectively.
Our Operating Platforms
Montpelier Re
Montpelier Re, our largest operating platform, focuses on writing short-tail U.S. and international catastrophe treaty reinsurance on both an excess-of-loss and proportional basis. Montpelier Re also writes specialty treaty reinsurance, including casualty, accident & health, aviation, space, crop, financial risk, political risk, terrorism and workers’ compensation catastrophe classes of business, as well as insurance and facultative reinsurance business.
Montpelier Re focuses on providing reinsurance protection to small and mid-sized regional U.S. insurance companies. This has allowed Montpelier Re to form long-term relationships with its cedants, thereby increasing client persistency as well as its understanding of the risks it assumes.
Montpelier at Lloyd’s
MAL’s London team underwrites property insurance and reinsurance, engineering, marine hull and liability, cargo and specie, political & financial risks and specialty casualty classes sourced mainly from the London, U.S. and European markets with a view to underwriting business that would not normally be accessible to our Bermuda underwriters.
MUI, our U.S. Lloyd’s Coverholder, underwrites facultative reinsurance business through managing general agents and intermediaries on behalf of Syndicate 5151. MUI’s business is produced through two underwriting divisions as follows: (i) the Brokered Property Facultative division, which writes North American property exposures, covering both fire and catastrophe perils, attaching in a proportional or excess-of-loss position; and (ii) the Direct Property Facultative division, which writes predominantly non-catastrophe U.S. business that is produced without broker involvement. The policies typically incorporate low-frequency, high-severity risks written on an excess-of-loss basis.
Blue Water Re
Blue Water Re is our market-facing collateralized reinsurer which provides property catastrophe reinsurance protection and related products to Montpelier Re and other third-party insurance and reinsurance companies. A portion of Blue Water Re’s business is retroceded to Blue Capital Re through a fully-collateralized retrocessional contract (the “BW Retrocessional Agreement”) and the remaining portion of its business is retained in support of the financial interests of the Cells.
Blue Capital Re
Blue Capital Re provides collateralized property catastrophe reinsurance protection and related products to Blue Water Re and other third-party insurance and reinsurance companies. In addition to providing fully-collateralized reinsurance protection to third parties, through the BW Retrocessional Agreement, Blue Capital Re may also participate in up to 100% of Blue Water Re’s participation in: (i) quota share agreements among Blue Water Re and Montpelier Re or other third-party reinsurers; and (ii) fronting agreements among Blue Water Re and Montpelier Re or other well capitalized third-party rated reinsurers.
9
Table of Contents
The Montpelier Risk Institute (“MRI”)
In 2013 we created MRI, a virtual risk institute that leverages the complementary capabilities of scientists and insurance specialists to target new methods for quantifying risk. Partnering with us in this endeavor are the University of Western Ontario, the affiliated Institute for Catastrophic Research in Ontario, Canada, and several private research institutions in Europe.
MRI was formed to promote global research, knowledge exchange and advanced model development on natural catastrophe and man-made risks. MRI’s goal is to collaborate to better understand, calculate, mitigate and hedge risk in a changing environment. MRI is overseen by a steering committee led by Montpelier Re’s Chief Risk Officer, Dr. Gero Michel, and is composed of representatives from academia and government.
Ceded Reinsurance Protection
We purchase reinsurance from third parties in the normal course of our business in order to manage our exposures. The amount and type of reinsurance that we purchase varies from year to year and is dependent on a variety of factors, including the cost of a particular reinsurance contract and the nature of our gross exposures assumed. All of our reinsurance purchases to date have represented prospective cover, meaning that the coverage has been purchased to protect us against the risk of future losses as opposed to covering losses that have already occurred but have not yet been paid. Our ceded reinsurance consists of excess-of-loss contracts covering one or more lines of business and pro-rata reinsurance with respect to specific lines of business. We also purchase industry loss warranty policies that provide us with coverage for certain losses we incur, provided they are triggered by events exceeding a specified industry loss size. In addition, for certain pro-rata contracts that we purchase, the associated direct insurance contracts carry underlying reinsurance protection from third-party reinsurers, known as inuring reinsurance, which we net against our gross premiums written and our gross loss and LAE reserves.
We remain liable for losses we incur to the extent that any third-party reinsurer is unable or unwilling to make timely payments to us under our reinsurance agreements. Under our reinsurance security policy, our reinsurers are generally required to be rated “A-” (Excellent) or better by A.M. Best (or an equivalent rating with another recognized rating agency) at the time the policy is written. We also consider reinsurers that are not rated or do not fall within the above threshold on a case-by-case basis if adequately collateralized. We monitor the financial condition and ratings of our reinsurers on an ongoing basis.
Montpelier Re also purchases collateralized reinsurance protection from Blue Water Re pursuant to inter-segment reinsurance agreements, and Blue Water Re purchases collateralized reinsurance protection from Blue Capital Re pursuant to the BW Retrocessional Agreement.
Claims Management
Our personnel oversee and administer claims arising from our insurance and reinsurance contracts, including validating and monitoring claims, posting case reserves and approving payments. Authority for establishing reserves and paying claims is based upon the level and experience of our claims personnel.
Our reinsurance claim specialists work closely with our brokers to obtain specific claims information from ceding companies. In addition, when necessary, we or an established third-party provider instructed on our behalf perform on-site claims reviews of the claims handling abilities and reserving techniques of ceding companies. The results of such claims reviews are shared with our underwriters and actuaries to assist them in pricing products and establishing loss reserves.
As a reinsurer, we recognize that a fair interpretation of our reinsurance agreements and timely payment of covered claims is a valuable service to our clients which also enhances our reputation.
Loss and LAE Reserves
Our loss and LAE reserves are estimates of the future amounts needed to pay claims and related expenses for insured events that have occurred. Our reserving methodology does not lend itself well to a statistical calculation of a range of estimates surrounding the best point estimate of our loss and LAE reserves. Due to the low frequency and high-severity nature of much of our business, our reserving methodology principally involves arriving at a specific point estimate for the ultimate expected loss on a contract by contract basis, and our aggregate loss reserves are the sum of the individual loss reserves established.
10
Table of Contents
Our internal actuaries review our reserving assumptions and our methodologies on a quarterly basis. Our third quarter and year-end loss estimates are subject to a corroborative review by both an independent loss reserve specialist and an independent registered public accounting firm using generally accepted actuarial principles. The Audit Committee of the Board (the “Audit Committee”) reviews our quarterly and annual reserve analyses.
Our loss and LAE reserves are comprised of case reserves (which are based on claims that have been reported to us) and IBNR reserves (which are based on losses that we believe have occurred but for which claims have not yet been reported to us and which may include a provision for expected future development on our case reserves). The process of establishing our loss reserves can be complex and is subject to considerable variability. It requires the use of informed estimates and judgments based on circumstances known at the date of accrual, and is highly dependent on the loss information we receive from our cedants and brokers. Estimating loss reserves requires us to make assumptions regarding future reporting and development patterns, frequency and severity trends, claims settlement practices, potential changes in the legal environment and other factors such as foreign currency fluctuations and inflation. Another assumption we must make relates to “loss amplification,” which refers to inflationary and heightened loss adjustment pressure within a local economy that has the potential to occur after a catastrophe loss and which can escalate overall losses.
We believe that our loss and LAE reserves fairly estimate the losses that fall within our assumed coverages. There can be no assurance, however, that actual losses will not be less than or exceed our total established reserves. Our loss and LAE reserve estimates and our methodology of estimating such reserves are regularly reviewed and updated as new information becomes known. Any resulting adjustments are reflected in our consolidated financial results in the period in which they become known.
Lines of Business
We categorize our lines of business as follows: (i) Property Catastrophe - Treaty; (ii) Property Specialty - Treaty; (iii) Other Specialty - Treaty; and (iv) Property and Specialty Individual Risk. Montpelier Re and Syndicate 5151 write each of these lines of business, Blue Water Re and Blue Capital Re write only Property Catastrophe - Treaty business and MUSIC wrote only Property and Specialty Individual Risk business.
Property Catastrophe - Treaty
Our Property Catastrophe reinsurance contracts are typically “all risk” in nature, providing protection to the ceding company against losses from earthquakes and hurricanes, as well as other natural and man-made catastrophes such as floods, tornados, storms and fires. The predominant exposures covered by these contracts are losses stemming from property damage and business interruption resulting from a covered peril.
Our Property Catastrophe reinsurance contracts are typically written on an excess-of-loss basis, which provides coverage to the ceding company when aggregate losses from a single occurrence for a covered peril exceed an amount specified in a particular contract. Under these contracts, we provide protection to an insurer for a portion of the total losses in excess of a specified loss amount, up to a maximum amount per loss specified in the contract.
In the event of a loss, property catastrophe excess-of-loss contracts typically include a second (or reinstated) contractual limit of coverage following a covered loss event in return for an additional premium. When Blue Water Re or Blue Capital Re write an excess-of-loss reinsurance contract which includes a second (or reinstated) limit, as collateralized reinsurers, each are required to fully collateralize both the original limit and the reinstated limit.
The coverage provided under excess-of-loss reinsurance contracts may be on a worldwide basis or limited in scope to specific regions or geographical areas. Coverage can also vary from “all natural” perils, which is the most expansive form, to more limited types such as windstorm-only coverage.
Property Specialty - Treaty
We write Property Specialty reinsurance contracts on either an excess-of-loss or pro-rata basis, which protects the ceding company on its primary insurance risks and facultative reinsurance transactions on a “single risk” basis. A “risk” in this context might mean the insurance coverage on one building or a group of buildings or the insurance coverage under a single policy which the reinsured treats as a single loss. Coverage on an excess-of-loss basis is usually triggered by a large loss sustained by an individual risk rather than by smaller losses that fall below the specified retention of the reinsurance contract. Coverage on a pro-rata basis may be triggered by individual losses of any size, as reinsurance protection is typically provided on the same basis and attachment as the original insurance policy.
11
Table of Contents
Other Specialty - Treaty
We write Other Specialty reinsurance covering classes such as aviation (including liability), engineering, space, marine, workers’ compensation, medical malpractice and other casualty risks, political & financial risks, accident & health, crop and other specialty reinsurance business.
Our aviation and space business is written either as pro-rata or excess-of-loss with a focus on the major airlines and associated liabilities for aviation business and launch plus in-orbit risks for space business.
Our coverage for workers’ compensation and personal accident contracts tends to attach at the upper layers of such reinsurance programs. We therefore regard our workers’ compensation and personal accident classes as being catastrophe exposed and relatively short-tail in nature.
Our medical malpractice book includes excess treaty reinsurance for insurers that write medical malpractice insurance for physicians, typically single state insurers. Certain of our medical malpractice contracts are written on a swing-rated basis, meaning that the ultimate premium will vary based on the level of ultimate losses incurred.
We also write a limited amount of professional liability business on both an excess-of-loss and pro-rata basis, and pro-rata treaties covering general liability for municipalities in the U.S.
We have written a number of reinsurance contracts providing coverage for losses arising from acts of terrorism in the U.S. and in a number of other countries.
In the U.S., the Terrorism Risk Insurance Act of 2002 (“TRIA”) established a system for sharing losses from terrorist attacks between the private insurance industry and the U.S. government and regulates the terms of insurance relating to terrorism coverage. Extensions of TRIA were authorized in 2005 and 2007, with the latter extending the program through December 31, 2014. On January 12, 2015, TRIA was reauthorized through December 31, 2020. The most notable changes made to TRIA pursuant to its 2015 reauthorization were to increase: (i) the threshold for industry losses before qualifying for U.S. government financial support to $200 million from $100 million (through annual increases of $20 million beginning in 2016); and (ii) the industry co-participation to 20% from 15% (through annual increases of one percent per year beginning in 2016).
In a number of countries outside of the U.S., we have written reinsurance contracts through government-backed programs or “pools”, which provide coverage for stipulated acts of terrorism.
Most of the reinsurance contracts that we write that provide coverage for losses arising from acts of terrorism exclude coverage protecting against nuclear, biological or chemical attacks.
Property and Specialty Individual Risk
We underwrite direct insurance and facultative reinsurance coverage on industrial, commercial, and residential property, liability, marine and space risks where we assume all or part of a risk under a single insurance contract. We also underwrite stand-alone political and financial risks, pandemic and event contingency business, as well as U.S. and international terrorism coverage on either a stand-alone basis or embedded within an existing property policy. Facultative reinsurance is normally purchased by clients where individual risks are not covered by their reinsurance treaties, for amounts in excess of the dollar limits of their reinsurance treaties or for unusual risks.
Through MUSIC, we also underwrote certain insurance risks, referred to as excess and surplus lines, coverage which is not available from state licensed insurers (called admitted insurers) and must be purchased from a non-admitted carrier. These risks, primarily smaller commercial property and casualty risks, were written through select general agents. These risks involved specialized treatment with respect to coverage, forms, price and other policy terms.
12
Table of Contents
GROSS PREMIUMS WRITTEN
By Line of Business and Segment
The following tables present our gross premiums written, by line of business and reportable segment, during the years ended December 31, 2014, 2013 and 2012:
|
(Millions)
Year Ended December 31, 2014 |
|
Montpelier
Bermuda |
|
Montpelier at
Lloyd’s |
|
Collateralized
Reinsurance |
|
Corporate
and
Other (1) |
|
Total |
|
|
|
|
|
|
|
|
|
|
|
|
|
|
|
Property Catastrophe - Treaty |
|
$ |
256.1 |
|
$ |
3.4 |
|
$ |
83.4 |
|
$ |
(31.9 |
) |
$ |
311.0 |
|
|
Property Specialty - Treaty |
|
54.0 |
|
3.8 |
|
— |
|
— |
|
57.8 |
|
|
Other Specialty - Treaty |
|
76.4 |
|
93.2 |
|
— |
|
(0.5 |
) |
169.1 |
|
|
Property and Specialty Individual Risk |
|
29.9 |
|
172.6 |
|
— |
|
(0.1 |
) |
202.4 |
|
|
Total gross premiums written |
|
$ |
416.4 |
|
$ |
273.0 |
|
$ |
83.4 |
|
$ |
(32.5 |
) |
$ |
740.3 |
|
|
Year Ended December 31, 2013 |
|
Montpelier
Bermuda |
|
Montpelier at
Lloyd’s |
|
Collateralized
Reinsurance |
|
Corporate
and
Other (1) |
|
Total |
|
|
|
|
|
|
|
|
|
|
|
|
|
|
|
Property Catastrophe - Treaty |
|
$ |
279.0 |
|
$ |
4.7 |
|
$ |
39.8 |
|
$ |
1.0 |
|
$ |
324.5 |
|
|
Property Specialty - Treaty |
|
50.3 |
|
4.3 |
|
— |
|
0.1 |
|
54.7 |
|
|
Other Specialty - Treaty |
|
68.7 |
|
78.3 |
|
— |
|
(0.1 |
) |
146.9 |
|
|
Property and Specialty Individual Risk |
|
31.4 |
|
147.9 |
|
— |
|
0.6 |
|
179.9 |
|
|
Total gross premiums written |
|
$ |
429.4 |
|
$ |
235.2 |
|
$ |
39.8 |
|
$ |
1.6 |
|
$ |
706.0 |
|
|
Year Ended December 31, 2012 |
|
Montpelier
Bermuda |
|
Montpelier at
Lloyd’s |
|
Collateralized
Reinsurance |
|
Corporate
and
Other (1) |
|
Total |
|
|
|
|
|
|
|
|
|
|
|
|
|
|
|
Property Catastrophe - Treaty |
|
$ |
332.8 |
|
$ |
10.9 |
|
$ |
2.4 |
|
$ |
3.9 |
|
$ |
350.0 |
|
|
Property Specialty - Treaty |
|
47.5 |
|
6.1 |
|
— |
|
— |
|
53.6 |
|
|
Other Specialty - Treaty |
|
70.4 |
|
82.1 |
|
— |
|
— |
|
152.5 |
|
|
Property and Specialty Individual Risk |
|
29.8 |
|
146.9 |
|
— |
|
2.5 |
|
179.2 |
|
|
Total gross premiums written |
|
$ |
480.5 |
|
$ |
246.0 |
|
$ |
2.4 |
|
$ |
6.4 |
|
$ |
735.3 |
|
(1) Represents: (i) the elimination of inter-segment reinsurance arrangements between Montpelier Bermuda and Montpelier at Lloyd’s; and (ii) premiums earned within the Company’s former MUSIC Run-Off segment.
By Broker
The majority of our insurance and reinsurance business is originated through independent brokers. Brokers are intermediaries that assist the ceding company in structuring a particular reinsurance program and in negotiating and placing risks with third-party reinsurers. In this capacity, the broker is selected and retained by the ceding company on a treaty-by-treaty basis, rather than by us. Once the ceding company has approved the terms of a particular reinsurance program, as quoted by the lead underwriter or a group of reinsurers acting as such, the broker will offer participation to qualified reinsurers until the program is fully subscribed. The broker is not a party to the reinsurance contract.
We seek to build long-term relationships with brokers by providing: (i) prompt and responsive service on underwriting submissions; (ii) innovative and customized insurance and reinsurance solutions to their clients; and (iii) timely payment of claims. Brokers receive compensation, typically in the form of a commission, based on negotiated percentages of the premium they produce and the performance of other necessary services. Brokerage costs constitute a significant portion of our insurance and reinsurance acquisition costs.
We monitor our broker concentrations on a company-wide basis rather than by reportable segment.
13
Table of Contents
The following table sets forth a breakdown of our gross premiums written by broker:
|
|
|
Year Ended December 31, |
|
|
($ in millions) |
|
2014 |
|
2013 |
|
2012 |
|
|
|
|
|
|
|
|
|
|
|
|
|
|
|
|
|
Aon Corporation |
|
$ |
175.4 |
|
24 |
% |
$ |
164.7 |
|
23 |
% |
$ |
192.1 |
|
26 |
% |
|
Marsh & McLennan Companies, Inc. |
|
142.4 |
|
19 |
|
147.2 |
|
21 |
|
158.3 |
|
22 |
|
|
Willis Group Holdings Limited |
|
111.9 |
|
15 |
|
121.3 |
|
17 |
|
109.9 |
|
15 |
|
|
JLT Group |
|
48.7 |
|
7 |
|
36.0 |
|
5 |
|
27.3 |
|
4 |
|
|
All other brokers |
|
241.9 |
|
35 |
|
220.2 |
|
32 |
|
226.3 |
|
30 |
|
|
|
|
|
|
|
|
|
|
|
|
|
|
|
|
|
Gross premiums written through brokers |
|
720.3 |
|
97 |
|
689.4 |
|
98 |
|
713.9 |
|
97 |
|
|
|
|
|
|
|
|
|
|
|
|
|
|
|
|
|
Gross premiums not written through brokers |
|
20.0 |
|
3 |
|
16.6 |
|
2 |
|
21.4 |
|
3 |
|
|
|
|
|
|
|
|
|
|
|
|
|
|
|
|
|
Total gross premiums written |
|
$ |
740.3 |
|
100 |
% |
$ |
706.0 |
|
100 |
% |
$ |
735.3 |
|
100 |
% |
As illustrated above, the majority of our gross premiums written are sourced through a limited number of brokers, with Aon Corporation, Marsh & McLennan Companies, Inc., Willis Group Holdings Limited and JLT Group providing a total of 65% of our gross premiums written for the year ended December 31, 2014. We are therefore highly dependent on these brokers and a loss of all or a substantial portion of the business provided by one or more of these brokers could have a material adverse effect on our financial condition and results of operations. See “Risk Factors” contained in Item 1A herein.
By Geographic Area of Risks Insured
We seek to diversify our exposure across geographic zones around the world in order to obtain a prudent spread of risk. The spread of these exposures is also a function of market conditions and opportunities. We monitor our geographic exposures on a company-wide basis rather than by segment.
The following table sets forth a breakdown of our gross premiums written by geographic area of risks insured:
|
|
|
Year Ended December 31, |
|
|
($ in millions) |
|
2014 |
|
2013 |
|
2012 |
|
|
|
|
|
|
|
|
|
|
|
|
|
|
|
|
|
U.S. and Canada |
|
$ |
344.6 |
|
47 |
% |
$ |
346.2 |
|
49 |
% |
$ |
351.7 |
|
48 |
% |
|
Worldwide (1) |
|
239.3 |
|
32 |
|
210.4 |
|
30 |
|
231.5 |
|
31 |
|
|
Western Europe, excluding U.K. and Ireland |
|
34.6 |
|
5 |
|
31.9 |
|
4 |
|
30.7 |
|
4 |
|
|
Worldwide, excluding U.S. and Canada (2) |
|
26.9 |
|
4 |
|
33.8 |
|
5 |
|
23.1 |
|
3 |
|
|
Australia and Oceania |
|
26.8 |
|
4 |
|
20.4 |
|
3 |
|
23.4 |
|
3 |
|
|
U.K. and Ireland |
|
18.5 |
|
2 |
|
20.1 |
|
3 |
|
24.1 |
|
3 |
|
|
Japan |
|
16.8 |
|
2 |
|
22.1 |
|
3 |
|
27.5 |
|
4 |
|
|
Other |
|
32.8 |
|
4 |
|
21.1 |
|
3 |
|
23.3 |
|
4 |
|
|
|
|
|
|
|
|
|
|
|
|
|
|
|
|
|
Total gross premiums written |
|
$ |
740.3 |
|
100 |
% |
$ |
706.0 |
|
100 |
% |
$ |
735.3 |
|
100 |
% |
(1) “Worldwide” comprises insurance and reinsurance contracts that cover risks in more than one geographic area and do not specifically exclude the U.S. and Canada.
(2) “Worldwide, excluding U.S. and Canada” comprises insurance and reinsurance contracts that cover risks in more than one geographic area but specifically exclude the U.S. and Canada.
LOSS AND LAE RESERVE DEVELOPMENT
Loss and LAE reserves consist of estimates of future amounts needed to pay claims and related expenses for insured events that have occurred. The process of estimating these reserves involves a considerable degree of judgment and, as of any given date, is inherently uncertain. See “Summary of Critical Accounting Policies and Estimates” contained in Item 7 herein for a full discussion regarding our loss and LAE reserving process. We do not discount any of our loss and LAE reserves for time value.
The following information presents: (i) our loss and LAE reserve development over the preceding ten years (the “Loss Table”); and (ii) a reconciliation of reserves determined in accordance with accounting principles and practices prescribed or permitted by insurance authorities, which we refer to as “statutory basis”, to such reserves determined in accordance with GAAP, each as prescribed by Securities Act Industry Guide No. 6.
14
Table of Contents
The Loss Table represents the development of our loss and LAE reserves from 2004 through 2014. The top line of the table shows the gross loss and LAE reserves at the balance sheet date for each of the indicated years. This represents the estimated amounts of loss and LAE reserves, both case and IBNR, arising in the current year and all prior years that are unpaid at the balance sheet date. The table also shows the re-estimated amount of the previously recorded reserves based on experience as of the end of each succeeding year. The estimate changes as more information becomes known about the frequency and severity of claims for individual years. The “cumulative net redundancy” represents the aggregate change to date from the indicated estimate of the gross reserve for claims and claim expenses, net of losses recoverable on the third line of the table. The table also shows the cumulative net paid amounts as of successive years with respect to the net reserve liability.
The Loss Table does not reflect any loss development relating to MUSIC for periods prior to November 2007, the date we acquired that company. See “MUSIC Sale Considerations” contained in Item 1 herein.
|
|
|
Consolidated Loss and LAE Reserves |
|
|
|
|
Years ended December 31, |
|
|
(Millions) |
|
2004 |
|
2005 |
|
2006 |
|
2007 |
|
2008 |
|
2009 |
|
2010 |
|
2011 |
|
2012 |
|
2013 |
|
2014 |
|
|
|
|
|
|
|
|
|
|
|
|
|
|
|
|
|
|
|
|
|
ENDING UNPAID LOSS AND LAE RESERVES: |
|
|
|
|
|
|
|
|
|
|
|
|
|
|
|
|
|
|
|
|
|
|
|
|
|
|
|
|
|
|
|
|
|
|
|
|
|
Gross balance |
|
$ |
549.5 |
|
$ |
1,781.9 |
|
$ |
1,089.2 |
|
$ |
860.7 |
|
$ |
808.9 |
|
$ |
680.8 |
|
$ |
784.6 |
|
$ |
1,077.1 |
|
$ |
1,112.4 |
|
$ |
881.6 |
|
$ |
775.7 |
|
|
Less: reinsurance recoverables on unpaid losses |
|
(94.7 |
) |
(305.7 |
) |
(197.3 |
) |
(152.5 |
) |
(122.9 |
) |
(69.6 |
) |
(62.4 |
) |
(77.7 |
) |
(102.7 |
) |
(63.6 |
) |
(48.7 |
) |
|
|
|
|
|
|
|
|
|
|
|
|
|
|
|
|
|
|
|
|
|
|
|
|
|
|
Net liability |
|
$ |
454.8 |
|
$ |
1,476.2 |
|
$ |
891.9 |
|
$ |
708.2 |
|
$ |
686.0 |
|
$ |
611.2 |
|
$ |
722.2 |
|
$ |
999.4 |
|
$ |
1,009.7 |
|
$ |
818.0 |
|
$ |
727.0 |
|
|
|
|
|
|
|
|
|
|
|
|
|
|
|
|
|
|
|
|
|
|
|
|
|
|
|
CUMULATIVE NET LIABILITY PAID: |
|
|
|
|
|
|
|
|
|
|
|
|
|
|
|
|
|
|
|
|
|
|
|
|
|
|
|
|
|
|
|
|
|
|
|
|
|
|
|
|
|
|
|
|
|
|
|
1 year later |
|
$ |
214.2 |
|
$ |
716.1 |
|
$ |
335.2 |
|
$ |
192.5 |
|
$ |
182.8 |
|
$ |
115.8 |
|
$ |
175.5 |
|
$ |
239.2 |
|
$ |
272.2 |
|
$ |
178.5 |
|
|
|
|
2 years later |
|
309.7 |
|
1,026.5 |
|
480.3 |
|
304.4 |
|
262.0 |
|
191.8 |
|
261.4 |
|
430.8 |
|
393.9 |
|
|
|
|
|
|
3 years later |
|
325.2 |
|
1,150.4 |
|
570.9 |
|
330.6 |
|
318.7 |
|
240.1 |
|
343.9 |
|
518.9 |
|
|
|
|
|
|
|
|
4 years later |
|
334.1 |
|
1,229.7 |
|
588.3 |
|
354.9 |
|
357.9 |
|
290.5 |
|
375.7 |
|
|
|
|
|
|
|
|
|
|
5 years later |
|
353.2 |
|
1,243.6 |
|
608.2 |
|
372.3 |
|
400.7 |
|
304.9 |
|
|
|
|
|
|
|
|
|
|
|
|
6 years later |
|
356.5 |
|
1,259.9 |
|
622.9 |
|
409.2 |
|
410.5 |
|
|
|
|
|
|
|
|
|
|
|
|
|
|
7 years later |
|
359.5 |
|
1,271.2 |
|
648.5 |
|
414.1 |
|
|
|
|
|
|
|
|
|
|
|
|
|
|
|
|
8 years later |
|
360.4 |
|
1,295.5 |
|
651.5 |
|
|
|
|
|
|
|
|
|
|
|
|
|
|
|
|
|
|
9 years later |
|
363.2 |
|
1,297.1 |
|
|
|
|
|
|
|
|
|
|
|
|
|
|
|
|
|
|
|
|
10 years later |
|
363.7 |
|
|
|
|
|
|
|
|
|
|
|
|
|
|
|
|
|
|
|
|
|
|
|
|
|
|
|
|
|
|
|
|
|
|
|
|
|
|
|
|
|
|
|
|
|
|
|
NET LIABILITY RE-ESTIMATED: |
|
|
|
|
|
|
|
|
|
|
|
|
|
|
|
|
|
|
|
|
|
|
|
|
|
|
|
|
|
|
|
|
|
|
|
|
|
|
|
|
|
|
|
|
|
|
|
|
|
1 year later |
|
$ |
437.7 |
|
$ |
1,452.4 |
|
$ |
855.5 |
|
$ |
604.1 |
|
$ |
610.3 |
|
$ |
501.9 |
|
$ |
632.9 |
|
$ |
912.0 |
|
$ |
865.3 |
|
$ |
666.2 |
|
|
|
|
2 years later |
|
407.8 |
|
1,447.7 |
|
783.1 |
|
555.7 |
|
552.5 |
|
450.8 |
|
607.1 |
|
835.3 |
|
747.9 |
|
|
|
|
|
|
3 years later |
|
400.3 |
|
1,398.4 |
|
764.4 |
|
518.6 |
|
521.8 |
|
440.0 |
|
565.8 |
|
750.2 |
|
|
|
|
|
|
|
|
4 years later |
|
390.6 |
|
1,383.4 |
|
737.9 |
|
495.7 |
|
514.3 |
|
413.6 |
|
514.4 |
|
|
|
|
|
|
|
|
|
|
5 years later |
|
385.4 |
|
1,364.7 |
|
715.6 |
|
491.6 |
|
494.0 |
|
383.0 |
|
|
|
|
|
|
|
|
|
|
|
|
6 years later |
|
384.1 |
|
1,349.5 |
|
707.5 |
|
474.3 |
|
465.9 |
|
|
|
|
|
|
|
|
|
|
|
|
|
|
7 years later |
|
378.7 |
|
1,343.8 |
|
694.7 |
|
455.3 |
|
|
|
|
|
|
|
|
|
|
|
|
|
|
|
|
8 years later |
|
376.0 |
|
1,333.5 |
|
681.8 |
|
|
|
|
|
|
|
|
|
|
|
|
|
|
|
|
|
|
9 years later |
|
373.1 |
|
1,322.1 |
|
|
|
|
|
|
|
|
|
|
|
|
|
|
|
|
|
|
|
|
10 years later |
|
371.1 |
|
|
|
|
|
|
|
|
|
|
|
|
|
|
|
|
|
|
|
|
|
|
CUMULATIVE NET REDUNDANCY |
|
$ |
83.7 |
|
$ |
154.1 |
|
$ |
210.1 |
|
$ |
252.9 |
|
$ |
220.1 |
|
$ |
228.2 |
|
$ |
207.8 |
|
$ |
249.2 |
|
$ |
261.8 |
|
$ |
151.8 |
|
|
|
|
|
|
|
|
|
|
|
|
|
|
|
|
|
|
|
|
|
|
|
|
|
|
|
|
|
RECONCILIATION OF NET LIABILITY RE-ESTIMATED AS OF THE END OF THE LATEST RE-ESTIMATION PERIOD: |
|
|
|
|
|
|
|
|
|
|
|
|
|
Gross re-estimated liability |
|
$ |
496.8 |
|
$ |
1,622.0 |
|
$ |
843.7 |
|
$ |
562.5 |
|
$ |
535.5 |
|
$ |
439.4 |
|
$ |
550.5 |
|
$ |
796.7 |
|
$ |
840.0 |
|
$ |
720.3 |
|
|
|
|
|
|
|
|
|
|
|
|
|
|
|
|
|
|
|
|
|
|
|
|
|
|
|
|
|
|
|
|
|
|
|
|
|
|
|
Less: re-estimated reinsurance recoverable |
|
(125.7 |
) |
(299.9 |
) |
(161.9 |
) |
(107.2 |
) |
(69.6 |
) |
(56.4 |
) |
(36.1 |
) |
(46.5 |
) |
(92.1 |
) |
(54.1 |
) |
|
|
|
|
|
|
|
|
|
|
|
|
|
|
|
|
|
|
|
|
|
|
|
|
|
|
|
|
Net re-estimated liability |
|
$ |
371.1 |
|
$ |
1,322.1 |
|
$ |
681.8 |
|
$ |
455.3 |
|
$ |
465.9 |
|
$ |
383.0 |
|
$ |
514.4 |
|
$ |
750.2 |
|
$ |
747.9 |
|
$ |
666.2 |
|
|
|
|
CUMULATIVE GROSS REDUNDANCY |
|
$ |
52.7 |
|
$ |
159.9 |
|
$ |
245.5 |
|
$ |
298.2 |
|
$ |
273.4 |
|
$ |
241.4 |
|
$ |
234.1 |
|
$ |
280.4 |
|
$ |
272.4 |
|
$ |
161.3 |
|
|
|
See “Management’s Discussion and Analysis of Financial Condition and Results of Operations” and “Summary of Critical Accounting Policies and Estimates,” each contained in Item 7 herein, for an analysis of our aggregate loss and LAE reserves for each of the latest three years, including a discussion of our loss reserve development experienced during those periods.
15
Table of Contents
INVESTMENTS, CASH AND INVESTMENT-RELATED DERIVATIVES
Investments
Our investment portfolio is structured to support our need for: (i) optimizing our risk-adjusted total return; (ii) adequate liquidity; (iii) financial strength and stability; and (iv) regulatory and legal compliance. While we oversee all of our investment activities, the portfolio is actively managed by a number of registered investment advisors. Our investment advisors adhere to an investment policy and guidelines developed by senior management, as approved by the Finance Committee of the Board (the “Finance Committee”), which specify minimum criteria regarding the credit quality and liquidity characteristics of the portfolio as well as the use of certain derivative instruments. These guidelines also set limitations on the size of certain holdings, as well as the types of securities and industries in which the portfolio can be invested.
The Finance Committee also oversees our investment activities and reviews compliance with our investment objectives and guidelines. These objectives and guidelines stress diversification of risk, capital preservation, market liquidity and stability of portfolio income. Our investment advisors have the discretion to invest our assets as they see fit, provided that they comply with our objectives and guidelines.
The components of our investment assets as of December 31, 2014 are as follows:
Fixed Maturity Investments. As a provider of insurance and reinsurance for natural and man-made catastrophes, we could be required to pay significant losses on short notice. As a result, our asset allocation is predominantly oriented toward high-quality fixed maturity securities with a short average duration. Our asset allocation is designed to reduce our sensitivity to interest rate fluctuations and provide adequate liquidity for the settlement of our expected liabilities. As of December 31, 2014, our fixed maturities, which totaled $1,901.0 million, comprised 70% of our total investments at such date.
Equity Securities. Over longer time horizons, we believe that investments in equity securities can enhance our investment returns. Our equity investment strategy is expected to maximize our risk-adjusted total return through investments in a variety of equity and equity-related instruments with a focus on value investing. As of December 31, 2014, our equity securities, which totaled $173.1 million, comprised 6% of our total investments at such date.
Other Investments. Our other investments consist primarily of investments in investment funds, limited partnership interests, the BCGR Listed Fund, event-linked securities whose principal and interest are forgiven if specific events occur and certain derivative instruments. The investment funds that we hold contain primarily fixed maturity investments. As of December 31, 2014, our other investments, which totaled $642.0 million, comprised 24% of our total investments at such date.
In addition to the investment assets described above, we also held investment liabilities of $76.2 million as of December 31, 2014, consisting of $70.5 million of open short fixed maturity positions and $5.7 million of open short equity and investment option and future positions. Our investment liabilities are collateralized largely with restricted cash and investment securities.
As of December 31, 2014, the average duration of our investment portfolio, including cash, was 0.9 years (inclusive of relevant derivative and short positions).
Cash and Cash Equivalents
Our cash and cash equivalents consist of unrestricted cash and fixed income securities with maturities of less than three months from the date of purchase. These balances are comprised of: (i) collateral supporting our Collateralized Reinsurance operations; (ii) undeployed cash and cash equivalents held by our investment advisors; (iii) amounts held to pay our operating expenses, including a provision for losses that may become due for payment on short notice; and (iv) amounts held for other obligations and contingencies. As of December 31, 2014, we held $447.7 million of cash and cash equivalents.
Restricted Cash
Our restricted cash consists of cash held in support of: (i) investments sold short; (ii) open derivative positions; and (iii) foreign deposit accounts held at Lloyd’s. As of December 31, 2014, we held $26.6 million of restricted cash.
16
Table of Contents
Investment-Related Derivatives
At times we use various derivative instruments to enhance our investment performance, replicate certain investment positions or manage market exposures and duration risk. Our investment-related derivative activities are governed by our investment policy and guidelines and are overseen by the Finance Committee.
See “Management’s Discussion and Analysis of Financial Condition and Results of Operations” contained in Item 7 herein for further information concerning our investment portfolio, our investment results, our liquidity and capital resources and our use of investment-related derivatives.
CONFLICTS OF INTEREST
The following discussion should be read in conjunction with the “Risk Factors” contained in Item 1A herein, in particular the specific risk factor entitled “There may be conflicts of interest that result from our relationships with the BCGR Listed Fund and BCRH and its subsidiaries.”
BCML, our wholly-owned investment and insurance management service company, provides services to the BCGR Cell (which serves as a segregated account of the Master Fund for the benefit of the BCGR Listed Fund) and to BCRH and its subsidiaries. In addition, Blue Water Re, our wholly-owned special purpose insurance vehicle, is the sole source of collateralized reinsurance business for the BCGR Cell and is a significant source of business for BCRH and its subsidiaries through the BW Retrocessional Agreement. As of December 31, 2014, Montpelier Re owned 25.1% of the BCGR Listed Fund’s ordinary shares and 33.3% of BCRH’s outstanding common shares, with third-party investors (which we refer to as “non-controlling interests”) owning the remainder.
We provide reinsurance opportunities to, and make investments on behalf of, these affiliates that we determine are appropriate for them, provided that such business is in accordance with their respective underwriting guidelines. We intend to primarily allocate those reinsurance opportunities that are made available to these affiliates on a proportional basis in accordance with our allocation policies.
In addition, William Pollett, the Company’s Chief Corporate Development and Strategy Officer and Treasurer, serves as a director and the Chief Executive Officer of BCRH, Michael Paquette, the Company’s Chief Financial Officer, serves as BCRH’s Chief Financial Officer, and Christopher Harris, the Company’s Chief Executive Officer, serves as Chairman of BCRH.
As a result, our officers, BCML and Blue Water Re may have conflicts of interest between their duties to Montpelier and their duties to the BCGR Listed Fund and BCRH and its subsidiaries.
MUSIC SALE CONSIDERATIONS
On December 31, 2011, we completed the MUSIC Sale, received total proceeds of $54.9 million therefrom and recorded a gain on the sale of $11.1 million, which is net of $1.0 million in expenses related to the transaction.
In connection with this transaction, we have either retained, reinsured or otherwise indemnified Selective for all business written by MUSIC with an effective date on or prior to December 31, 2011. These protections were effected through the following arrangements, each of which became effective as of the closing date:
(i) we amended and increased the MUSIC Quota Share from 75% to 100%, which had the effect of ceding the majority of MUSIC’s unearned premiums at December 31, 2011 to Montpelier Re;
(ii) we entered into a Loss Development Cover (the “Loss Development Cover”) with MUSIC, which had the effect of ensuring that MUSIC’s net loss and LAE reserves relating to retained business written on or prior to December 31, 2011 (that business not otherwise covered by the MUSIC Quota Share) remain adequate. Under the Loss Development Cover, any future adverse development associated with such retained reserves will be protected by Montpelier Re and any future favorable development associated with such retained reserves will benefit Montpelier Re; and
(iii) we provided Selective with an indemnification which had the effect of guaranteeing each of the contractual arrangements (those with MUSIC and/or Selective) of Montpelier Re U.S. Holdings Ltd., as MUSIC’s seller, and Montpelier Re, as MUSIC’s primary reinsurer.
17
Table of Contents
During the years ended December 31, 2014, 2013 and 2012, we assumed $(0.1) million, $0.5 million and $2.5 million of MUSIC’s premium writings, respectively, which primarily represented audit premiums and other premium adjustments relating to policies written on or prior to December 31, 2011. We may be required to assume additional MUSIC premium writings in future periods, but we do not expect such additional writings to be significant.
As of December 31, 2014 and 2013, Montpelier Re had remaining loss and LAE reserves of $19.3 million and $31.2 million, respectively, under the MUSIC Quota Share.
We acquired MUSIC, formerly known as General Agents Insurance Company of America, Inc. (“General Agents”), from GAINSCO, Inc. (“GAINSCO”) in November 2007 (the “MUSIC Acquisition”). Prior to the MUSIC Acquisition, General Agents wrote general liability, commercial auto liability, specialty and umbrella lines of business. From 2003 to 2007 General Agents did not write any new business and entered into run-off.
As of December 31, 2014, MUSIC’s remaining gross loss and LAE reserves relating to business underwritten by General Agents prior to the MUSIC Acquisition (the “Acquired Reserves”) were not significant and, as protection against these liabilities, MUSIC continues to hold a GAINSCO-maintained trust deposit and reinsurance recoverables from third-party reinsurers rated “A-” or better by A.M. Best, which collectively support the Acquired Reserves. In addition, the Company has the benefit of a full indemnity from GAINSCO (the “GAINSCO Indemnity”) covering any adverse development from its past business.
If the remaining Acquired Reserves were to develop unfavorably in the future and the trust deposits and reinsurance recoverables held by MUSIC ultimately prove to be insufficient, these liabilities would become MUSIC’s liability and MUSIC would be entitled to reinsurance protection from us under the Loss Development Cover. If this adverse development were to occur and we were unable to recover such losses under the GAINSCO Indemnity, these liabilities, which are not significant, would become our responsibility.
RATINGS
Financial Strength Ratings
Reinsurance contracts do not discharge ceding companies from their obligations to policyholders. Therefore, ceding companies often require reinsurers to have, and to maintain, strong financial strength ratings as assurance that their claims will be paid. Montpelier Re and Syndicate 5151 (in common with all Lloyd’s syndicates) each has financial strength ratings from one or more independent rating agencies, as outlined below.
The financial strength ratings of Montpelier Re and Syndicate 5151 are not evaluations directed to the investment community with regard to Common Shares, Preferred Shares or debt securities or a recommendation to buy, sell or hold such securities. Montpelier Re and Syndicate 5151’s financial strength ratings may be revised or revoked at the sole discretion of the independent rating agencies.
Montpelier Re
Montpelier Re is currently rated “A” by A.M. Best (Excellent, with a stable outlook), “A-” by Standard & Poor’s (Strong, with a stable outlook) and “A” by Fitch Ratings Ltd. (Strong, with a negative outlook). “A” is the third highest of fifteen A.M. Best financial strength ratings, “A-” is the seventh highest of twenty-one Standard & Poor’s financial strength ratings and “A” is the sixth highest of twenty-four Fitch Ratings Ltd. financial strength ratings.
Montpelier Re’s ability to underwrite business is dependent upon its financial strength rating as evaluated by these independent rating agencies. In the event that Montpelier Re is downgraded below “A-” by A.M. Best or Standard & Poor’s, we believe our ability to write business through Montpelier Re would be adversely affected. In the normal course of business, we evaluate Montpelier Re’s capital needs to support the amount of business it writes in order to maintain its financial strength ratings.
A downgrade of Montpelier Re’s A.M. Best or Standard & Poor’s rating could also trigger provisions allowing some ceding companies to opt to cancel their reinsurance contracts with Montpelier Re. For the majority of contracts that incorporate rating provisions, a downgrade of below “A-” by A.M. Best, or below “A-” by Standard and Poor’s constitutes grounds for cancellation. In the event of such a downgrade, we cannot predict whether or how many of our clients would actually exercise such cancellation rights or the extent to which any such cancellations would impact Montpelier Re and the Company. See “Risk Factors” contained in Item 1A herein.
18
Table of Contents
A downgrade of Montpelier Re’s A.M. Best financial strength rating below “B++,” would constitute an event of default under our secured letter of credit facilities.
At our request, in 2009 Moody’s Investors Services (“Moody’s”) withdrew its financial strength rating of Montpelier Re. Immediately prior to this withdrawal, Moody’s had reaffirmed Montpelier Re’s “Baa1” rating (Adequate, with a positive outlook).
Syndicate 5151
Syndicate 5151, as is the case with all Lloyd’s syndicates, benefits from Lloyd’s central resources, including the Lloyd’s brand, its network of global licenses and the Lloyd’s New Central Fund. Pursuant to the byelaws of the Society of Lloyd’s, the Lloyd’s New Central Fund is obligated to meet any valid claim that cannot be met by the resources of the liable member. As all Lloyd’s policies are ultimately backed by this common security, the Lloyd’s single market rating is applied to all syndicates, including Syndicate 5151, equally. Lloyd’s is currently rated “A” by A.M. Best (Excellent, with a stable outlook), “A+” by Standard & Poor’s (Strong, with a stable outlook) and “AA-” by Fitch Ratings Ltd. (Very Strong, with a stable outlook). “A” is the third highest of fifteen A.M. Best financial strength ratings, “A+” is the fifth highest of twenty-one Standard & Poor’s financial strength ratings and “AA-” is the fourth highest of twenty-four Fitch Ratings Ltd. financial strength ratings.
A downgrade of Lloyd’s A.M. Best or Standard & Poor’s rating could also trigger provisions allowing some ceding companies to opt to cancel their reinsurance contracts with Syndicate 5151. For the majority of contracts that incorporate rating provisions, a downgrade of below “A-” by A.M. Best, or “A-” by Standard and Poor’s constitutes grounds for cancellation. In the event of such a downgrade, we cannot predict whether or how many of our clients would actually exercise such cancellation rights or the extent to which any such cancellations would impact Syndicate 5151 and the Company. See “Risk Factors” contained in Item 1A herein.
At our request, in 2011 Standard & Poor’s withdrew its interactive Lloyd’s Syndicate Assessment rating of Syndicate 5151. Immediately prior to this withdrawal, Standard & Poor’s had reaffirmed Syndicate 5151’s “3-” rating (Average Dependency, with a positive outlook).
Blue Water Re and Blue Capital Re
Blue Water Re and Blue Capital Re do not operate with a financial strength rating and, alternatively, each fully-collateralizes its reinsurance obligations.
Enterprise Risk Management (“ERM”) Rating
Our ERM infrastructure consists of the methods and processes we utilize in order to prudently manage risk in the achievement of our objectives. We consider ERM to be a key process within our organization as it helps us to identify potential events that may affect us, to quantify, evaluate and manage the risks to which we are exposed and to provide reasonable assurance regarding the achievement of our objectives. ERM is managed by our senior management under the oversight of the Board and is implemented by personnel across our organization.
Our current ERM rating, as issued by Standard & Poor’s, is “Strong”, which is the second highest of six Standard & Poor’s ERM ratings.
COMPETITION
We compete with other Bermuda and international insurers and reinsurers and certain underwriting syndicates and insurers, many of which have greater financial, marketing and management resources than we do. We consider our primary competitors to include: Aspen Insurance Holdings Ltd., Endurance Specialty Holdings Ltd., Everest Re Group, Ltd., PartnerRe Ltd., Platinum Underwriters Holdings Ltd., RenaissanceRe Holdings Ltd. and Validus Holdings, Ltd. Competition varies depending on the type of business being insured or reinsured and whether we are in a leading position or acting on a following basis.
In addition, affiliates of some of the brokers we transact with have co-sponsored the formation of reinsurance companies that directly compete with us, and these brokers may favor those reinsurers over us.
Competition in the types of business that we underwrite is based on many factors, including: (i) premiums charged and other terms and conditions offered; (ii) quality of services provided; (iii) financial strength ratings assigned by independent rating agencies; (iv) speed of claims payment; (v) reputation; (vi) perceived financial strength; and (vii) the experience of the underwriter in the line of insurance or reinsurance to be written.
19
Table of Contents
Competition in the insurance and reinsurance industry has increased over the past several years and may increase further, either as a result of capital provided by new entrants or of the commitment of additional capital by existing insurers or reinsurers. In addition, alternative products, such as the collateralized reinsurance contracts that we and others write and the insurance-linked securities that we and others may invest in, may also provide increased capacity. Continued increases in the supply of property reinsurance may have adverse consequences for us and for the property catastrophe industry generally, including fewer contracts written, lower premium rates, increased expenses for customer acquisition and retention and less favorable policy terms and conditions.
Increased competition could result in fewer submissions, lower premium rates and less favorable policy terms, which could adversely impact our growth and profitability.
REGULATION AND CAPITAL REQUIREMENTS
Insurance and reinsurance entities are highly regulated in most countries, although the degree and type of regulation varies significantly from one jurisdiction to another with reinsurers generally subject to less regulation than primary insurers. The Company, Montpelier Re, Blue Water Re, Blue Capital Re and Blue Capital Re ILS are regulated by the Bermuda Monetary Authority (the “BMA”). BCML is licensed and supervised by the BMA and is a registered investment advisor with the SEC. MAL is subject to regulation by the Prudential Regulation Authority (the “PRA”) and the Financial Conduct Authority (the “FCA”), each of which is a successor to the former U.K. Financial Services Authority. MAL and MCL are regulated by Lloyd’s. MUI is subject to approval by Lloyd’s as a Coverholder for Syndicate 5151.
Bermuda Regulation
The Insurance Act 1978 of Bermuda and related regulations, as amended (the “Insurance Act”), provides that no person may carry on an insurance business in or from within Bermuda unless registered as an insurer under the Insurance Act by the BMA. In deciding whether to grant registration, the BMA has broad discretion to act as it thinks fit in the public interest. The BMA is required by the Insurance Act to determine whether the applicant is a fit and proper body to be engaged in the insurance business and, in particular, whether it has, or has available to it, adequate knowledge and expertise. The registration of an applicant as an insurer is subject to the insurer complying with the terms of its registration and such other conditions as the BMA may impose at any time. The Insurance Act also grants to the BMA powers to supervise, investigate and intervene in the affairs of insurance companies.
The Insurance Act is currently proposed to be amended by the Insurance Amendment Act 2014 (the “Insurance Amendment Act”). Once in force, the Insurance Amendment Act will make the following material amendments to the Insurance Act: (i) the BMA may take certain intervention actions where it appears that the business of an insurer is being conducted in such a manner that the insurer will be unable to meet its obligations to policyholders; (ii) includes an additional material change that would require an insurer to notify the BMA in writing, where an insurer effects the sale of an insurer; (iii) increases the time period from 14 days to 30 days following a notification of a material change by an insurer within which the BMA must either notify the insurer that it has no objection to the proposed material change or that the period has lapsed without the BMA having issued a notice of objection to such material change; (iv) extends the restriction that applies to a Class 3B and a Class 4 insurer to not in any financial year pay dividends which would exceed 25% of its total statutory capital and surplus without the consent of the BMA to include Class 3A insurers; and (v) provides that an insurer will be required to file a declaration of compliance signed by two directors together with its statutory financial statements declaring whether or not the insurer has: (A) complied with all requirements of the minimum criteria available to it; (B) complied with the minimum margin of solvency as of its financial year-end; (C) complied with applicable enhanced capital requirements as of its financial year end; and (D) where a license is issued by the BMA subject to limitations, restrictions or conditions it has observed such limitations, restrictions or conditions. Where the insurer has failed to comply with these requirements it shall, at the time it delivers the declaration of compliance, give the BMA details of such failure in writing.
The BMA utilizes a risk-based approach when it comes to licensing and supervising insurance and reinsurance companies. As part of the BMA’s risk-based system, an assessment of the inherent risks within each particular class of insurer or reinsurer is used to determine the limitations and specific requirements that may be imposed. Thereafter the BMA keeps its analysis of relative risk within individual institutions under review on an ongoing basis, including through the scrutiny of audited financial statements, and, as appropriate, meeting with senior management during onsite visits.
20
Table of Contents
Regulatory Framework
The Insurance Act imposes on Bermuda insurance companies solvency and liquidity standards, as well as auditing and reporting requirements. Certain significant aspects of the Bermuda insurance regulatory framework are set forth below.
Classification of Insurers
The Insurance Act distinguishes between insurers and reinsurers carrying on long-term business, general business (everything except life, annuity and certain types of accident and health insurance) and special purpose business. There are six general business classifications for insurers ranging from Class 1 (pure captives) to Class 4 (very large commercial underwriters).
Montpelier Re is registered with the BMA as a Class 4 insurer, meaning that it is licensed to write a broad array of insurance and reinsurance contracts. Class 4 insurers are subject to greater regulatory stringency than other classes of Bermuda insurers and have substantial capital and surplus requirements.
Blue Capital Re is registered with the BMA as a Class 3A insurer. As a result of the approvals received from the BMA and the terms of its business plan, Blue Capital Re’s insurance and reinsurance contracts must be fully-collateralized. Class 3A insurers benefit from an expedited application process, less regulatory stringency and minimal capital and surplus requirements. The total annual net premiums from unrelated business written by Blue Capital Re may, in the future, exceed $50.0 million, the maximum amount of total annual net premiums currently permitted by a Class 3A insurer, however, Blue Capital Re has obtained a waiver from the BMA so that it may remain a Class 3A insurer at all times, even if it writes more than $50.0 million in total annual net premiums from unrelated business.
Blue Water Re is registered with the BMA as a Special Purpose Insurer, meaning that its insurance and reinsurance contracts must be fully-collateralized and the parties to the transactions must be sophisticated. Blue Water Re is also required to notify the BMA of each reinsurance contract it writes. Special Purpose Insurers benefit from an expedited application process, less regulatory stringency and minimal capital and surplus requirements.
Principal Representative and Principal Office
Every registered insurer or reinsurer is required to maintain a principal office in Bermuda and to appoint and maintain a principal representative in Bermuda.
Montpelier Re’s principal office is located at Montpelier House, 94 Pitts Bay Road, Pembroke, HM 08, Bermuda. Christopher Schaper, Montpelier Re’s President, has been appointed by Montpelier Re’s Board of Directors as its principal representative and has been approved by the BMA.
Mr. Schaper has also been appointed as the group representative for the Company, including Montpelier Re as the Company’s Designated Insurer. See “Group Supervision.”
Blue Water Re and Blue Capital Re each maintains its principal office at Montpelier House, 94 Pitts Bay Road, Pembroke, HM 08, Bermuda. The Board of Directors of each company has appointed BCML as its principal representative and the BMA has approved the respective appointments.
Loss Reserve Specialist
The Company is required to submit annually an opinion of its loss reserve specialist with respect to its consolidated loss and loss expense provisions. The loss reserve specialist, who will normally be a qualified property and casualty actuary, must be approved by the BMA.
Montpelier Re is also required to submit annually an opinion of its approved loss reserve specialist with its annual statutory financial return in respect of its stand-alone loss and LAE provisions.
Blue Water Re and Blue Capital Re are not currently required to obtain an opinion from a loss reserve specialist in respect of their stand-alone loss and LAE provisions.
21
Table of Contents
Cancellation of Insurer’s Registration
The BMA may revoke or suspend an insurer’s license in certain circumstances, including circumstances in which: (i) false, misleading or inaccurate information has been supplied to the BMA by the insurer or on its behalf; (ii) the insurer has ceased to carry on business; (iii) the insurer has persistently failed to pay fees due under the Insurance Act; (iv) the insurer has failed to comply with a condition attached to its registration or with an applicable requirement of the Insurance Act; (v) the insurer is convicted of an offense against a provision of the Insurance Act; (vi) in the opinion of the BMA, the insurer has not been carrying on business in accordance with sound insurance principles; or (vii) any of the minimum criteria for registration under the Insurance Act is not or will not have been fulfilled.
Annual Statutory Financial Statements and Return; Independent Approved Auditor
The Insurance Act generally requires all insurers to: (i) prepare annual statutory financial statements and returns; and (ii) appoint an independent auditor who will annually audit and report on such financial statements and returns. The independent auditor of the insurer must be approved by the BMA and may be the same person or firm that audits the insurer’s financial statements and reports for presentation to its shareholders. If the insurer fails to appoint an approved auditor or at any time fails to fill a vacancy for such auditor, the BMA may appoint an approved auditor for the insurer and shall fix the remuneration to be paid to the approved auditor.
Montpelier Re submits audited statutory financial statements and a statutory financial return with the BMA annually.
Each of Blue Water Re and Blue Capital Re has filed an application under the Insurance Act to have the requirement to file audited statutory financial statements and statutory financial returns annually with the BMA waived, and each has obtained such a waiver from the BMA. However, Blue Capital Re and Blue Water Re are each required to file annual audited GAAP financial statements with the BMA.
The independent auditor of Montpelier Re, Blue Water Re and Blue Capital Re has been approved by the BMA.
Minimum Liquidity Ratio
The Insurance Act provides a minimum liquidity ratio and requires general business insurers and reinsurers to maintain the value of their relevant assets at not less than 75% of the amount of their relevant liabilities. Relevant assets include, but are not limited to, cash and cash equivalents, investments, investment income due and accrued, accounts and premiums receivable, reinsurance balances receivable and funds held by ceding companies. Relevant liabilities include, but are not limited to, loss and LAE reserves, other liabilities, letters of credit and guarantees.
Montpelier Re and Blue Capital Re, as Class 4 and 3A insurers, respectively, are subject to the foregoing minimum liquidity ratio requirements. Blue Water Re, as a Special Purpose Insurer, is not subject to the foregoing minimum liquidity ratio requirements.
Minimum Solvency Margin
The Insurance Act provides that the value of the assets of an insurer must exceed the value of its liabilities by an amount greater than its prescribed minimum solvency margin.
The minimum solvency margin that must be maintained by Montpelier Re, as a Class 4 insurer is the greatest of: (i) $100.0 million; (ii) 50% of net premiums written; (iii) 15% of net undiscounted aggregate loss and loss expense provisions and other insurance reserves; and (iii) 15% of net undiscounted aggregate loss and loss expense provisions and other insurance reserves.
There is no minimum solvency margin that must be maintained by Blue Water Re, as a Special Purpose Insurer, provided that the value of its assets exceeds the value of its liabilities.
The minimum solvency margin that must be maintained by a Class 3A insurer is the greatest of: (i) $1.0 million; (ii) 20% of net premiums written where such net premiums do not exceed $6.0 million and $1.2 million plus 15% of net premiums written where such net premiums exceed $6.0 million; (iii) 15% of net undiscounted aggregate loss and loss expense provisions and other insurance reserves; and (iv) 25% of the insurer’s enhanced capital requirement. However, an insurer may file an application under the Insurance Act to waive the aforementioned requirements. Blue Capital Re has obtained such a waiver from the BMA so that its minimum solvency margin shall remain at $1.0 million at all times, so long as: (i) Blue Capital Re only enters into contracts of reinsurance that are fully-collateralized; and (ii) each transaction represents no material deviation from the original business plan filed with BMA at the time of Blue Capital Re’s registration.
22
Table of Contents
Enhanced Capital Requirement (“ECR”)
The BMA has promulgated the Insurance (Prudential Standards) (Class 4 and Class 3B Solvency Requirement) Amendment Rules 2008, as amended (the “Rules”), which mandate that a Class 4 insurer calculate its enhanced capital requirements (“ECR”) at the end of its relevant year by reference to either: (i) the BMA’s model set out in Schedule 1 to the Rules, a standard mathematical model that correlates the risk underwritten by Bermuda insurers and reinsurers to the capital dedicated to their business (termed the Bermuda Solvency Capital Requirement or “BSCR”); or (ii) where an insurer or reinsurer believes that its own internal model for measuring risk and determining appropriate levels of capital better reflects the inherent risk of its business, an internal capital model approved by the BMA.
The risk-based solvency capital framework referred to above represents a modification of the minimum solvency margin test set out in the Insurance Returns and Solvency Amendment Regulations 1980 (as amended). While it must calculate its ECR annually by reference to either the BSCR or an approved internal model, a Class 4 insurer such as Montpelier Re must also ensure at all times that its ECR is at least equal to its minimum solvency margin.
The BMA has also introduced a three-tiered capital system for Class 4 insurers designed to assess the quality of capital resources that an insurer has available to meet its capital requirements. The system classifies all capital instruments into one of three tiers based on their “loss absorbency” characteristics, with the highest quality capital classified as Tier 1 Capital and lesser quality capital classified as either Tier 2 or Tier 3 Capital. Only Tier 1 and Tier 2 Capital may be used to support an insurer’s minimum solvency margin. Certain percentages of each of Tier 1, 2 and 3 Capital may be used to satisfy an insurer’s ECR. Any combination of Tier 1, 2 or 3 Capital may be used to meet an insurer’s capital requirements.
The Rules introduced a regime that requires Class 4 insurers to perform an assessment of their own risk and solvency requirements, referred to as a Commercial Insurer’s Solvency Self Assessment (“CISSA”). The CISSA will allow the BMA to obtain an insurer’s view of the capital resources required to achieve its business objectives and to assess the company’s governance, risk management and controls surrounding this process. The Rules also introduced a Catastrophe Risk Return, which must be filed annually with the BMA, which assesses an insurer’s reliance on vendor models in assessing its catastrophe exposure.
As a Class 4 insurer, Montpelier Re is subject to the foregoing ECR requirements.
Class 3A insurers are required to maintain available capital and surplus at a level equal to or in excess of the applicable ECR, which is established by reference to either the BSCR - Small and Medium-Sized Entities model or an approved internal capital model. Furthermore, to enable the BMA to better assess the quality of the insurer’s capital resources, a Class 3A insurer is required to disclose the makeup of its capital in accordance with the BMA’s 3-tiered capital system.
An insurer may file an application under the Insurance Act to have the aforementioned ECR requirements waived. In this instance, Blue Capital Re has obtained such a waiver from the BMA.
Blue Water Re, as a Special Purpose Insurer, is not subject to the foregoing ECR requirements.
Restrictions on Dividends and Distributions
In addition to the requirements under the Companies Act 1981, as amended (the “Companies Act”), which are discussed below, the Insurance Act limits the maximum amount of annual dividends and distributions that may be paid by Montpelier Re and Blue Capital Re.
Montpelier Re is prohibited from declaring or paying a dividend if it fails to meet its minimum solvency margin, ECR or minimum liquidity ratio, or if the declaration or payment of such dividend would cause such a breach. The declaration of dividends in any financial year that would exceed 25% of Montpelier re’s prior year-end statutory capital and surplus also requires the approval of the BMA. Additionally, annual distributions by either Montpelier Re or Blue Capital Re that would result in a reduction of the distributing company’s prior year-end balance of statutory capital (defined as its statutory capital and surplus less its statutory earnings retained) by more than 15% also require the approval of the BMA.
If any of Montpelier Re, Blue Capital Re or Blue Water Re were to fail to meet its minimum solvency margin or minimum liquidity ratio on the last day of any financial year, it would be prohibited from declaring or paying any dividends during the next financial year without the approval of the BMA.
23
Table of Contents
The Companies Act further limits the Company’s, BCRH’s, Montpelier Re’s, Blue Water Re’s, Blue Capital Re’s and Blue Capital Re ILS’ ability to pay dividends and make distributions to their shareholders. None of these entities is permitted to declare or pay a dividend, or make a distribution out of contributed surplus, if it is, or would after the payment be, unable to pay its liabilities as they become due or if the realizable value of its assets would be less than its liabilities.
Reduction of Capital
Neither Montpelier Re nor Blue Capital Re may reduce its total statutory capital by 15% or more, as set out in its previous year’s financial statements, unless it has received BMA approval. Total statutory capital consists of the insurer’s paid-in share capital, its contributed surplus (sometimes called additional paid-in capital) and any other fixed capital designated by the BMA as statutory capital.
Supervision, Investigation and Intervention
The BMA may appoint an inspector to investigate the affairs of an insurer or a designated insurer (as detailed in “Group Supervision” below) if the BMA believes that an investigation is required in the interest of the insurer’s or insurance group’s policyholders or potential policyholders. In order to verify or supplement information otherwise provided to it, the BMA may direct an insurer or designated insurer to produce documents or information relating to matters connected with the insurer’s or insurance group’s business. Further, the BMA has the power to appoint a professional person to prepare a report on any aspect of any matter about which the BMA has required or could require information.
If it appears to the BMA that: (i) there is a risk of the insurer or designated insurer becoming insolvent; (ii) the insurer or designated insurer is in breach of the Insurance Act; (iii) any conditions imposed upon its registration, or the minimum criteria stipulated in the Insurance Act are not or have not been fulfilled in respect of a registered insurer; (iv) a person has become a Controller (which for this purpose means a managing director, chief executive or other person in accordance with whose directions or instructions the directors of an insurer are accustomed to act, including any person who holds 10% or more of the shares carrying rights to vote at any general meeting, or is entitled to exercise 10% or more of the voting shares or voting power or is otherwise able to exercise a significant influence over the management of an insurer) without providing the BMA with the appropriate notice or in contravention of a notice of objection; (v) the registered insurer is in breach of its enhanced capital requirement; or (vi) a designated insurer is in breach of any provision of the Insurance Act or the regulations or rules applicable to it, the BMA may issue such directions as appear desirable for safeguarding the interests of policyholders or potential policyholders of the insurer or the insurance group. The BMA may also direct the insurer or designated insurer: (i) not to effect further contracts of insurance business; (ii) not to vary any insurance contract when the direction is given if the effect would be to increase the insurer’s liabilities; (iii) not to make any investments of a specified class; (iv) to realize any existing investments of a specified class; (v) to maintain in, or transfer to the custody of, a specified bank assets of the insurer that are specified in the direction; (vi) not to declare or pay any dividends or make other distributions or to restrict the making of such payments; (vii) to limit its premium income; (viii) to remove a Controller or officer; or (ix) to file a petition for the winding-up of the insurer.
The BMA may also make rules prescribing prudential standards with which the insurer must comply. An insurer may make an application to be exempted from such rules.
Winding-up
The BMA may present a petition for the winding-up of an insurer on the grounds that: (i) the insurer is unable to pay its debts within the meaning of sections 161 and 162 of the Companies Act; (ii) the insurer has failed to satisfy an obligation to which it is or was subject by virtue of the Insurance Act; or (iii) the insurer has failed to satisfy the obligation imposed upon it by section 15 of the Insurance Act as to the preparation of accounts or to produce or file financial statements in accordance with section 17 of the Insurance Act, and that the BMA is unable to ascertain the insurer’s financial position. In addition, if it appears to the BMA that it is expedient in the public interest that an insurer should be wound up, it may present a petition for it to be so wound up if a court thinks it just and equitable for it to be so wound up.
24
Table of Contents
Disclosure of Information
In addition to powers under the Insurance Act to investigate the affairs of an insurer, the BMA may require certain information from an insurer (or certain other persons) to be produced to it. The BMA has also been given powers to assist foreign regulatory authorities with their investigations involving insurance and reinsurance companies in Bermuda, subject to certain restrictions. For example, the BMA must be satisfied that the assistance being requested is in connection with the discharge of regulatory responsibilities of the foreign regulatory authority. Further, the BMA must consider whether cooperation with the foreign regulatory authorities is in the public interest. The grounds for disclosure by the BMA to a foreign regulatory authority without consent of the insurer are limited and the Insurance Act provides sanctions for breach of the statutory duty of confidentiality.
Bermuda Insurance Code
The BMA implemented the Insurance Code of Conduct (the “Bermuda Insurance Code”) on July 1, 2010, which was revised in December 2014. The deadline for compliance with the revised Bermuda Insurance Code is July 1, 2015. The Bermuda Insurance Code contains the duties, requirements and compliance standards to be adhered to by all insurers. The Bermuda Insurance Code stipulates that insurers are to develop and apply policies and procedures capable of assessment by the BMA. The board of directors of an insurer has the responsibility to ensure that the insurer is compliant with the Bermuda Insurance Code.
Group Supervision
The BMA serves as Montpelier’s group supervisor. In this instance, an “insurance group” is defined as a group of companies that conducts insurance business.
Where the BMA determines that it should act as the group supervisor, it shall designate a specified insurer that is a member of the insurance group to be the designated insurer in respect of that insurance group for purposes of the Insurance Act (the “Designated Insurer”) and it shall give to the Designated Insurer and other competent authorities written notice of its intention to act as group supervisor. Once the BMA has been designated as group supervisor, the Designated Insurer must ensure that an approved group actuary is appointed to provide an opinion as to the adequacy of the insurance group’s insurance reserves as reported in its group statutory financial statements. Montpelier Re has been designated by the BMA to act as Montpelier’s Designated Insurer.
As group supervisor, the BMA performs a number of supervisory functions including: (i) coordinating the gathering and dissemination of information which is of importance for the supervisory task of other competent authorities; (ii) carrying out a supervisory review and assessment of the insurance group; (iii) carrying out an assessment of the insurance group’s compliance with the rules on solvency, risk concentration, intra-group transactions and good governance procedures as may be prescribed by or under the Insurance Act; (iv) planning and coordinating through regular meetings held at least annually or by other appropriate means with other competent authorities, supervisory activities in respect of the insurance group, both as a going concern and in emergency situations; (v) coordinating any enforcement action that may need to be taken against the insurance group or any of its members; and (vi) planning and coordinating meetings of colleges of supervisors (consisting of insurance regulators) in order to facilitate the carrying out of the functions described above.
In carrying out its group supervisor functions, the BMA may make rules for: (i) assessing the financial situation and the solvency position of the insurance group and its members; and (ii) regulating intra-group transactions, risk concentration, governance procedures, risk management and regulatory reporting and disclosure.
Other international supervisory authorities are not, at the current time, under any obligation to accept or otherwise rely on the BMA’s determination that it is acting as group supervisor, rather the BMA’s decision defines the scope and extent of the BMA’s interest in Montpelier’s operations group-wide.
25
Table of Contents
Notifications to the BMA
Notification of Material Changes
All registered insurers are required to give notice to the BMA of their intention to effect a material change within the meaning of the Insurance Act. For the purposes of the Insurance Act, the following changes are material: (i) the transfer or acquisition of insurance business that is part of a scheme falling under section 25 of the Insurance Act or section 99 of the Companies Act; (ii) the amalgamation with or acquisition of another firm; (iii) engaging in unrelated business that is retail business; (iv) the acquisition of a controlling interest in an undertaking that is engaged in non-insurance business which offers services and products to persons who are not affiliates of the insurer; (v) outsourcing all or substantially all of the insurer’s actuarial, risk management and internal audit functions; (vi) outsourcing all or a material part of an insurer’s underwriting activity; or (vii) the transfer, other than by way of reinsurance, of all or substantially all of a line of business; (viii) the expansion into a material new line of business.
No registered insurer shall take any steps to give effect to a material change unless it has first served notice on the BMA that it intends to effect such material change and, before the end of 14 days, either the BMA has notified such company in writing that it has no objection to such change or the period has lapsed without the BMA having issued a notice of objection.
Before issuing a notice of objection, the BMA is required to serve upon the person concerned a preliminary written notice stating the BMA’s intention to issue a formal notice of objection. Upon receipt of the preliminary written notice, the person served may, within 28 days, file written representations with the BMA which shall be taken into account by the BMA in making its final determination.
Change of Shareholder Controller
In the event that the share capital of an insurer (or its parent) is traded on any stock exchange recognized by the BMA, then any shareholder must notify the BMA within 45 days of becoming a 10%, 20%, 33% or 50% shareholder of such insurer. An insurer or reinsurer must also provide written notice to the BMA that a person has become, or ceased to be, a Controller of that insurer or reinsurer.
An insurer is also required to notify the BMA in writing in the event any person has become or has ceased to be a Controller or an officer of it, an officer being a director, chief executive or senior executive performing duties of underwriting, actuarial, risk management, compliance, internal audit, finance or investment matters. Failure to give any required notice is an offense under the Insurance Act.
Certain Other Bermuda Law Considerations
Although the Company, BCRH, Montpelier Re, Blue Water Re, Blue Capital Re and Blue Capital Re ILS are incorporated in Bermuda, each is classified as non-resident for exchange control purposes by the BMA. Pursuant to their non-resident status, each of these entities may engage in transactions in currencies other than Bermuda dollars, and there are no restrictions on their ability to transfer funds (other than funds denominated in Bermuda dollars) in and out of Bermuda.
BCML is licensed and supervised by the BMA as an investment manager and an insurance agent/manager. BCML is not subject to any material minimum solvency requirements.
Each of the Company, BCRH, BCML, Montpelier Re, Blue Water Re, Blue Capital Re and Blue Capital Re ILS is incorporated in Bermuda as an “exempted company.” Under Bermuda law, exempted companies are companies formed for the purpose of conducting business outside Bermuda from a principal place of business in Bermuda. As a result, the Company, BCRH, BCML, Montpelier Re, Blue Water Re, Blue Capital Re and Blue Capital Re ILS are each exempt from Bermuda laws restricting the percentage of share capital that may be held by non-Bermudians, but they may not participate in certain business transactions, including: (i) the acquisition or holding of land in Bermuda (except that required for their businesses and held by way of lease or tenancy for a term of not more than 50 years, or, with the consent of the Minister of Economic Development, that which is used to provide accommodations or recreational facilities for their officers and employees and is held by way of lease or tenancy for a term of not more than 21 years) without the express authorization of the Bermuda legislature; (ii) the taking of mortgages on land in Bermuda to secure an amount in excess of $50,000 without the consent of the relevant Ministers; (iii) the acquisition of any bonds or debentures secured by any land in Bermuda, other than certain types of Bermuda government securities; or (iv) the carrying on of business of any kind in Bermuda, except in furtherance of their business carried on outside Bermuda or under license granted by the Minister of Economic Development.
26
Table of Contents
Each of Montpelier Re, Blue Water Re and Blue Capital Re is a licensed insurer in Bermuda, and so each may carry on activities from Bermuda that are related to and in support of its insurance business.
The Company has the consent of the Minister of Finance to carry on restricted business under the Companies Act, which means it may: (i) operate a financial institution within the meaning of the Bermuda Monetary Authority Act 1969 and other institutions that are investment funds or persons registered as insurers or insurance managers under the Insurance Act; (ii) provide by way of business to the general public various professional services; or (iii) acquire land or hold land other than land required for its business.
Exempted companies, such as the Company, BCRH, Montpelier Re, Blue Water Re, Blue Capital Re and Blue Capital Re ILS must comply with Bermuda resident representation provisions under the Companies Act. Securities may be offered or sold in Bermuda only in compliance with the provisions of the Investment Business Act 2003 and the Exchange Control Act 1972 and related regulations of Bermuda which regulate the sale of securities in Bermuda. In addition, specific permission is required from the BMA, pursuant to the provisions of the Exchange Control Act 1972 and related regulations, for all issuances and transfers of securities of Bermuda companies, other than in cases where the BMA has granted a general permission. The BMA’s policy dated June 1, 2005 provides that whenever any equity securities of a Bermuda company, which would include Common Shares, are listed on an appointed stock exchange, general permission is given for the issue and subsequent transfer of any securities of such company from and to a non-resident, for as long as any equity securities of such company remain so listed. This general permission also currently applies to the Company’s Preferred Shares, which are not considered to be equity securities pursuant to the BMA’s policy.
Notwithstanding the above general permission, the Company has applied for and received permission from the BMA to, subject to the Company’s Common Shares being listed on an appointed stock exchange, issue, grant, create, sell and transfer freely its Common Shares, its Preferred Shares and certain of its investment securities to and among persons who are either resident or non-resident of Bermuda for exchange control purposes.
U.K. Regulation
We participate in the Lloyd’s market through Syndicate 5151, which is managed by MAL. Under the legislation governing U.K. financial services regulation, including the Financial Services and Markets Act 2000 and the Financial Services Act 2012, MAL is subject to regulation by the PRA and the FCA. The PRA and FCA oversee compliance with their rules and the threshold conditions that must be met by financial services firms carrying on business in the U.K.
The PRA, which is a subsidiary of the Bank of England, is responsible for promoting the stable and prudent operation of the U.K. financial system through regulation of all deposit-taking institutions, insurers, Lloyd’s managing agents and investment banks. Specifically, the PRA has responsibility for promoting the safety and soundness of Lloyd’s and its members taken together, including the Lloyd’s New Central Fund, and the prudential regulation of managing agents.
The FCA is responsible for regulation of conduct in financial markets and the infrastructure that supports those markets. The FCA also has responsibility for the prudential regulation of firms that do not fall under the PRA’s scope. The FCA regulates the conduct of Lloyd’s and its managing agents and, on a prudential and conduct basis, its members’ agents, advisors and brokers. Particular conduct issues include the management of the auction system (whereby members can buy and sell syndicate capacity) and the handling of policyholders’ complaints.
The PRA and the FCA have established a supervisory college for oversight of Lloyd’s and maintain arrangements with Lloyd’s in support of its vestigial regulatory activities. They also have powers of direction over Lloyd’s and are expected to consult with each other in the exercise of such powers. Accordingly, the PRA, the FCA and the Council of Lloyd’s have entered into cooperation arrangements which deal with instances where regulators might need to cooperate over the supervision of firms that are subject the jurisdiction of all three bodies. These arrangements seek to minimize duplication of supervision and provide clarity to regulated firms over which regulator will lead in specific circumstances.
The Council of Lloyd’s is responsible under the Lloyd’s Act 1982 for the management and supervision of Lloyd’s, including its members, syndicates and managing agents, and has rule-making and enforcement powers. The Council of Lloyd’s may discharge some of its functions directly by making decisions and issuing resolutions, requirements, rules and byelaws. Other decisions are delegated to the Lloyd’s Franchise Board and associated committees. The PRA and FCA, when relevant, coordinate with each other and Lloyd’s over its use of enforcement powers.
MCL, Syndicate 5151’s corporate underwriting member at Lloyd’s, provides 100% of the stamp capacity of Syndicate 5151. Stamp capacity is a measure of the amount of premium a syndicate is authorized to write by Lloyd’s. Syndicate 5151’s stamp capacity for 2014, 2013 and 2012 was £180 million.
27
Table of Contents
As the corporate underwriting member of Lloyd’s, MCL is bound by the rules of Lloyd’s, which are prescribed by Byelaws and Requirements made by the Council of Lloyd’s under powers conferred by the Lloyd’s Act 1982. These rules, among other matters, prescribe MCL’s membership subscription, the level of its contribution to the Lloyd’s New Central Fund and the assets it must deposit with Lloyd’s in support of its underwriting. The Council of Lloyd’s has broad powers to sanction breaches of its rules, including the power to restrict or prohibit a member’s participation in Lloyd’s syndicates.
Under the U.K. regulatory regime, managing agents have been required, among other matters, to adopt internal systems and controls appropriate to the risks of their business, obtain regulatory approval for those members of staff responsible for performing certain controlled functions and calculate the level of capital required to support the underwriting of the syndicates that they manage. They are also subject to minimum solvency tests established by Lloyd’s and are required to conduct their business according to eleven core regulatory principles, to which all firms regulated by the PRA and FCA have been subject.
The Council of Lloyd’s supervises Coverholders such MUI as part of its statutory role in managing and supervising the Lloyd’s market. This supervision is carried out through the approval process and through Lloyd’s ongoing supervision of approved Coverholders. Local regulators may require Lloyd’s to demonstrate that it has control over, and responsibility for, the business carried out by Coverholders under the terms of Lloyd’s authorization in that jurisdiction. Nonetheless, the primary responsibility for the oversight of Coverholders and binding authorities on a day-to-day basis rests with Lloyd’s managing agents, which in our case is currently MAL.
Each corporate or individual member of Lloyd’s is required to deposit cash, securities or letters of credit (or a combination of these assets) with Lloyd’s to support its participation on Lloyd’s syndicates. These assets are known as a member’s “Funds at Lloyd’s.” Funds at Lloyd’s requirements are calculated according to a minimum capital resources requirement, which is assessed at the syndicate level by Lloyd’s and at the level of the Lloyd’s market as a whole by the PRA. This requirement is similar in effect to a required solvency margin.
At the syndicate level, managing agents are required to calculate the capital resources requirement of the members of each syndicate they manage. In the case of Syndicate 5151, MAL carries out an annual syndicate Individual Capital Assessment (“ICA”) according to detailed rules prescribed by the PRA under the Individual Capital Adequacy Standards regime in force. Lloyd’s has also anticipated the arrival of the Solvency II regime across Europe by mandating that each syndicate calculates a Solvency II Solvency Capital Requirement (“SCR”), utilizing MAL’s own internal model equivalent to the forthcoming Solvency II principles. Both the ICA and SCR evaluate the risks faced by the syndicate, including insurance risk, operational risk, market risk, credit risk, liquidity risk and group risk, and assess the amount of capital that syndicate members should hold against those risks.
Lloyd’s reviews each syndicate’s SCR annually and may challenge it. In order to ensure that Lloyd’s aggregate capital is maintained at a high enough level to support its overall security rating, Lloyd’s adds an uplift to each member’s overall capital resources requirement produced by the ICA or SCR. The aggregate amount is known as a syndicate’s Economic Capital Assessment, which is used by Lloyd’s to determine the syndicate’s required Funds at Lloyd’s.
At market level, Lloyd’s is required to demonstrate to the PRA that each member’s capital resources requirement is met by that member’s capital resources made available to Lloyd’s, which for this purpose comprises its Funds at Lloyd’s and its share of member capital held at syndicate level. Any deficits must be covered by the Lloyd’s New Central Fund, which is itself subject to review by the PRA for the purposes of the capital adequacy of the market as a whole. The Council of Lloyd’s has wide discretionary powers to regulate members’ underwriting at Lloyd’s. It may, for instance, vary the amount of a member’s Funds at Lloyd’s requirement (or alter the ways in which those funds may be invested). The exercise of any of these powers may reduce the amount of premium which a member is allowed to accept for its account in an underwriting year and/or increase a member’s costs of doing business at Lloyd’s. As a consequence, the member’s ability to achieve an anticipated return on capital during that year may be compromised.
Each syndicate is required to submit a business plan to Lloyd’s on an annual basis, which is subject to the review and approval of the Lloyd’s Franchise Board. The Franchise Board is the managing agents’ principal interface with the Council of Lloyd’s. The main goal of the Franchise Board is to seek to create and maintain a commercial environment at Lloyd’s in which underwriting risk is prudently managed while providing maximum long-term returns to capital providers.
28
Table of Contents
Lloyd’s syndicates are treated as “annual ventures” and members’ participation on syndicates may change from underwriting year to underwriting year. Ordinarily, a syndicate will accept business over the course of one calendar year (an underwriting year of account), which will remain open for a further two calendar years before being closed by means of “reinsurance to close.” An underwriting year may be reinsured to close by the next underwriting year of the same syndicate or by an underwriting year of a different syndicate. Prior to 2005, the London market operated according to a three-year accounting cycle so that members were not able to distribute profits made in an underwriting year until it had been reinsured to close, usually at the end of three years. Since then, provided that certain solvency requirements are met, underwriting profits may be distributed in part before the year has been reinsured to close. Once an underwriting year has been reinsured to close, Lloyd’s will release the Funds at Lloyd’s provided that they are not required to support open underwriting years or to meet a loss made on the closed underwriting year. If reinsurance to close cannot be obtained at the end of an underwriting year’s third open year (either at all, or on terms that the managing agent considers to be acceptable on behalf of the members participating on that underwriting year), then the managing agent must determine that the underwriting year will remain open. If the managing agent determines to keep the underwriting year open, then the underwriting year of account will be considered to be in run-off, and the Funds at Lloyd’s of the participating members will continue to be held by Lloyd’s to support their continuing liabilities unless the members can demonstrate that their Funds at Lloyd’s are in excess of the amount required to be held in relation to that year.
The reinsurance to close of an underwriting year does not discharge participating members from the insurance liabilities they incurred during that year. Rather, it provides them with a full indemnity from the members participating in the reinsuring underwriting year in respect of those liabilities. Therefore, even after all the underwriting years in which a member has participated have been reinsured to close, the member is required to stay in existence and to remain a non-underwriting member of Lloyd’s. Accordingly, although Lloyd’s will release members’ Funds at Lloyd’s, there nevertheless continues to be an administrative and financial burden for corporate members between the time of the reinsurance to close of the underwriting years on which they participated and the time that their insurance obligations are entirely extinguished. This includes the completion of financial accounts in accordance with the Companies Act and the submission of an annual compliance declaration to Lloyd’s.
Underwriting losses incurred by a syndicate during an underwriting year must be paid according to the links in the Lloyd’s chain of security. Claims must be funded first from the member’s premiums trust fund (which is held under the control of the syndicate’s managing agent), second from a cash call made to the corporate name and third from member’s Funds at Lloyd’s. In the event that any member is unable to pay its debts owed to policyholders from these assets, such debts may be paid by the Lloyd’s New Central Fund.
Syndicate 5151’s contribution to the Lloyd’s New Central Fund, which is available to satisfy claims if a member of Lloyd’s is unable to meet its obligation to policyholders and is funded annually by members, was determined by Lloyd’s to be 0.5% of Syndicate 5151’s written premiums with respect to 2014, 2013 and 2012. In addition, the Council of Lloyd’s has power to call on members to make an additional contribution to the New Central Fund of up to 3.0% of their underwriting capacity each year should it decide that such additional contributions are necessary.
Lloyd’s also imposes other charges to its members and the syndicates on which they participate, including an annual subscription charge of 0.5% of written premiums and an overseas business charge, levied as a percentage of gross international premiums (defined as business outside the U.K. and the Channel Islands), with the percentage depending on the type of business written. Lloyd’s also has power to impose additional charges under Lloyd’s Powers of Charging Byelaw.
U.S. Regulation
BCML
BCML is subject to registration and supervision by the SEC as a registered investment advisor but is not subject to any minimum solvency requirements.
Collateral Requirements For Non-Admitted Reinsurers
U.S. ceding companies typically receive full credit for outwards reinsurance protections in their statutory financial statements with respect to liabilities ceded to admitted U.S. domestic reinsurers. However, most states in the U.S. do not confer full credit for outwards reinsurance protections for liabilities ceded to non-admitted or unlicensed reinsurers, such as Montpelier Re, unless the reinsurer specifically collateralizes its obligations to the ceding company or is an authorized or trusteed reinsurer in the ceding company’s state of domicile through the establishment of a multi-beneficiary trust.
29
Table of Contents
Under applicable statutory provisions, permissible collateral arrangements include letters of credit, reinsurance trusts maintained by third-party trustees and funds withheld arrangements.
In 2010 Montpelier Re established a Multi-Beneficiary U.S. Reinsurance Trust (the “Reinsurance Trust”) as a means of providing statutory credit to Montpelier Re’s cedants. Montpelier Re has been granted authorized or trusteed reinsurer status in all U.S. states and the District of Columbia.
A number of states in the U.S. have considered reducing their collateral requirements for risks ceded to financially sound non-U.S. reinsurers. Montpelier Re is currently authorized to post reduced collateral with respect to certain risks ceded from insurers domiciled in Florida and New York. Montpelier Re also intends to take advantage of reduced collateral statutes as and when they may be adopted in other states.
In 2011 Montpelier Re entered into a Reinsurance Trust (the “MUSIC Trust”) in connection with the MUSIC Sale. The MUSIC Trust was established as a means of providing statutory credit to MUSIC in support of the MUSIC Quota Share and the Loss Development Cover.
Legislative and Regulatory Proposals
Government intervention in the insurance and reinsurance markets, both in the U.S. and worldwide, continues to evolve. For example, Florida has enacted insurance reforms that have caused declines in our property catastrophe gross premiums in past years. See “Risk Factors” contained in Item 1A herein. Federal and state legislators have also considered numerous government initiatives. While we cannot predict the exact nature, timing, or scope of other such proposals, if adopted they could adversely affect our business by: (i) providing government supported insurance and reinsurance capacity in markets and to consumers that we target; (ii) regulating the terms of insurance and reinsurance policies; (iii) impacting producer compensation; or (iv) disproportionately benefitting the companies of one country over those of another.
We are unable to predict whether any proposed legislation or any other proposed laws and regulations will be adopted, the form in which any such laws and regulations would be adopted, or the effect, if any, these developments would have on our operations and financial condition.
Solvency II
Solvency II is a fundamental review of the capital adequacy regime for the European Union (“EU”) insurance industry. It establishes a revised set of EU-wide capital requirements and risk management standards that will replace the solvency requirements currently in effect in member states. Solvency II’s implementation date is January 1, 2016.
Montpelier Re and Syndicate 5151 are both affected by Solvency II. Montpelier Re is affected by the BMA’s Solvency II equivalence program for Bermuda Class 4 insurance companies and by the application of Solvency II to European entities ceding business to Montpelier Re. Syndicate 5151 is affected as a result of its authorization by the former Financial Services Authority and its successor bodies (the PRA and the FCA) within the EU.
In accordance with Solvency II, insurers and reinsurers are expected to seek approval from the relevant supervisory authority to use an internal model for the purpose of setting required capital. Absent an approved internal model, the capital requirements of insurers and reinsurers will be established using a standard formula which, for Montpelier, would be more punitive. In the case of Montpelier Re, the supervisory authority is the BMA under its equivalence regime. Syndicate 5151 is affected as a result of its participation in the Lloyd’s market, where Lloyd’s is considered an “undertaking” for the purposes of directive compliance.
In order to obtain approval for use of an internal model, the governance, risk quantification and risk management frameworks for Montpelier Re and Syndicate 5151 must support the respective supervisory authority’s approach to Solvency II and meet mandated disclosure requirements. For MAL, its internal model is subject to review in the first instance by Lloyd’s and, ultimately, by the PRA as the competent supervisory authority.
Montpelier Re and MAL have each developed (and continue to refine) their internal models for the purpose of setting their respective capital levels in accordance with Solvency II. Montpelier Re may apply to the BMA for approval to use its internal capital model in substitution for the BSCR model, but has not yet done so. MAL’s internal model is currently being used in support of the assessment of Syndicate 5151’s capital requirements.
30
Table of Contents
EMPLOYEES
As of December 31, 2014, we had 185 full-time employees worldwide. None of our employees is subject to a collective bargaining agreement and we know of no current efforts to implement such agreements.
AVAILABLE INFORMATION
We are subject to the informational reporting requirements of the Securities Exchange Act of 1934 (the “Exchange Act”). In accordance therewith, we file reports, proxy statements and other information with the SEC. These documents are electronically available at www.montpelierre.bm and www.sec.gov at the same time they are filed with or furnished to the SEC. They are also available to copy or view at the SEC’s Public Reference Room at 100 F Street NE, Washington, DC 20549. For further information call 1-800-SEC-0330. In addition, our Code of Conduct and Ethics as well as the various charters governing the actions of certain of our Committees of the Board, including our Audit Committee and our Compensation and Nominating Committee (the “Compensation Committee”) charters, are available at www.montpelierre.bm. Updates to, as well as waivers of, our Code of Conduct and Ethics will also be made available on our website. Our website is not part of this report and nothing from our website shall be deemed to be incorporated into this report.
We will provide to any shareholder, upon request and without charge, copies of these documents (excluding any applicable exhibits unless specifically requested). Requests should be directed to Investor Relations, Montpelier Re Holdings Ltd., P.O. Box HM 2079, Hamilton, Bermuda HM HX, telephone (441) 299-7570 or info@montpelierre.bm. All such documents are also physically available at our principal office at 94 Pitts Bay Road, Pembroke, Bermuda HM 08.
Item 1A. Risk Factors
Our business, financial condition and results of operations can be impacted by a number of risk factors, any one of which could cause our actual results to vary materially from recent results or from our anticipated future results. Additional risks not presently known to us or that we currently deem immaterial may also impair our business or results of operations. Any of the risks described below could result in a significant or material adverse effect on our results of operations or financial condition.
Risks Related to Our Company
Unpredictable disasters and other catastrophic events could have a material adverse affect on our financial condition and results of operations.
We have substantial exposure to losses resulting from natural and man-made disasters and other catastrophic events. Many of our insurance and reinsurance policies cover unpredictable natural and other disasters, such as hurricanes, windstorms, earthquakes, floods, fires, explosions and terrorism. In recent years, the frequency of major weather-related catastrophes is believed to have increased and changes in climate conditions, primarily global temperatures and expected sea levels, may serve to further increase the severity, and possibly the frequency, of natural disasters and catastrophes.
The extent of losses from catastrophes is a function of the frequency of such loss events, the total amount of insured exposure in the area affected by each event and the severity of the events. Increases in the value of insured property, the effects of inflation and changes in cyclical weather patterns may increase the severity of claims from catastrophic events in the future. Claims from catastrophic events could reduce or eliminate our earnings and cause substantial volatility in our results of operations for any period and adversely affect our financial condition. Our ability to write new insurance and reinsurance policies could also be impacted as a result of corresponding reductions in our capital.
We manage certain key quantifiable risks using a combination of CATM®, various third-party models and underwriting judgment. We focus on tracking exposed contract limits, estimating the potential impact of a single natural catastrophe event and simulating our yearly net operating results to reflect aggregate underwriting and investment risk. Accordingly, if our assumptions are materially incorrect, the losses we might incur from an actual catastrophe could be significantly higher than our expectation of losses generated from modeled catastrophe scenarios and, as a result, such losses could have a material adverse affect on our financial condition and results of operations.
31
Table of Contents
The property reinsurance business has historically been cyclical, and we expect to experience periods with excess underwriting capacity and unfavorable pricing, which could have a material adverse affect on our business.
Historically, the property reinsurance industry has been cyclical, and reinsurers have experienced significant fluctuations in operating results due to competition, frequency of occurrence or severity of catastrophic events, levels of underwriting capacity, underwriting results of primary insurers, general economic conditions and other factors. The supply of property reinsurance is dependent upon prevailing prices, the level of insured losses and the level of industry capacity which, in turn, may fluctuate, including in response to changes in rates of return on investments being earned in the reinsurance industry.
The property catastrophe industry has historically been characterized by periods of strong price competition, also known as a “soft market,” due to excessive underwriting capacity, as well as periods of more favorable pricing, also known as a “hard market,” due to limited underwriting capacity. Increased capacity, frequently as a result of favorable pricing, is often provided by new entrants or by the commitment of additional capital by existing reinsurers. The industry’s capacity to write business diminishes as losses are incurred and the industry’s capital is depleted. As the industry’s capacity decreases, a hard market begins, which ultimately attracts additional capacity.
The supply of available property reinsurance capital has increased over the past several years and may increase further, either as a result of capital provided by new entrants or of the commitment of additional capital by existing insurers or reinsurers. In addition, alternative products, such as the collateralized reinsurance contracts that we and others write and the insurance-linked securities that we and others may invest in, may also provide increased capacity. Continued increases in the supply of property reinsurance may have negative consequences for us and for the property catastrophe industry generally, including fewer contracts written, lower premium rates, increased expenses for customer acquisition and retention and less favorable policy terms and conditions.
The cyclical trends in the industry and the industry’s profitability can also be affected significantly by volatile and unpredictable developments, such as fluctuations in interest rates, changes in the investment environment that affect market prices of investments, realized investment losses and inflationary pressures that may affect the size of losses experienced by insureds and primary insurance companies. We expect to experience the effects of cyclicality, which could have a material adverse affect on our business.
Montpelier Re and Syndicate 5151 may not maintain their favorable financial strength ratings, which could have a material and adverse affect on our financial condition and results of operations and our ability to conduct business.
Third-party rating agencies assess and rate the financial strength, including claims-paying ability, of rated insurers and reinsurers such as Montpelier Re and Syndicate 5151. These ratings are based upon criteria established by the rating agencies and are subject to revision at any time at the sole discretion of the rating agencies. Some of the criteria relate to general economic conditions and other circumstances that are outside of our control. Financial strength ratings are used by policyholders, agents and brokers as an important means of assessing the suitability of rated insurers and reinsurers as business counterparties and are an important factor in establishing the competitive position of rated insurance and reinsurance companies. These financial strength ratings do not refer to our ability to meet non-insurance obligations and are not a recommendation to purchase or discontinue any policy or contract issued by us or to buy, hold or sell our Common Shares, Preferred Shares or debt securities.
Rating agencies periodically evaluate us to determine whether we continue to meet the criteria of the ratings previously assigned to us. A downgrade or withdrawal of Montpelier Re’s or Lloyd’s financial strength ratings could limit or prevent Montpelier Re or Syndicate 5151 from writing new insurance or reinsurance contracts or renewing existing contracts, which could have a material adverse effect on our financial condition and results of operations.
In addition, a ratings downgrade by A.M. Best or Standard & Poor’s could trigger provisions allowing some cedants to opt to cancel their reinsurance contracts with Montpelier Re or Syndicate 5151. In the event of such a downgrade, we cannot predict whether or how many of our clients would actually exercise such cancellation rights or the extent to which any such terminations would have a material adverse effect on our financial condition, results of operations, cash flows or future prospects or the market price for our securities. A downgrade could also result in both a substantial loss of business for us as ceding companies and brokers that place such business may move to other insurers and reinsurers with higher ratings and the loss of key employees.
32
Table of Contents
In addition, a downgrade of Montpelier Re’s A.M. Best financial strength rating to below “B++” would constitute an event of default under our letter of credit facilities.
We are highly dependent on a small number of insurance and reinsurance brokers for a large portion of our revenues. Additionally, we are subject to credit risk with respect to brokers.
We market our reinsurance worldwide primarily through insurance and reinsurance brokers. The majority of our gross premiums written are sourced through a limited number of brokers with Aon Corporation, Marsh & McLennan Companies, Inc., Willis Group Holdings Limited and JLT Group providing a total of 65% of our gross premiums written for the year ended December 31, 2014.
The nature of our dependency on these brokers relates to the high volume of business they consistently refer to us. Our relationship with these brokers is based on the quality of the underwriting and claims services we provide to our cedants and on our financial strength ratings. Any deterioration in these factors could result in these brokers advising cedants to place their risks with other reinsurers rather than with us. In addition, affiliates of some of these brokers have co-sponsored the formation of reinsurance companies that directly compete with us, and these brokers may favor those reinsurers over us. A loss of all or a substantial portion of the business provided by one or more of these brokers could have a material adverse effect on our financial condition and results of operations.
We are frequently required to pay amounts owed on claims under our policies to brokers, and these brokers, in turn, pay these amounts to the ceding companies that have reinsured a portion of their liabilities with us. In some jurisdictions, if a broker fails to make such a payment, we might remain liable to the ceding company for the deficiency. In addition, in certain jurisdictions, when the ceding company pays premiums for these policies to brokers, these premiums are considered to have been paid and the ceding insurer is no longer liable to us for those amounts, whether or not we have actually received the premiums.
There may be conflicts of interest that result from our relationships with the BCGR Listed Fund and BCRH and its subsidiaries.
BCML provides services to the BCGR Cell (which serves as a segregated account of the Master Fund for the benefit of the BCGR Listed Fund) and to BCRH and its subsidiaries. In addition, Blue Water Re is the sole source of collateralized reinsurance business for the BCGR Cell and is a significant source of business for BCRH and its subsidiaries. As of December 31, 2014, Montpelier owned 25.1% of the BCGR Listed Fund’s ordinary shares and 33.3% of BCRH’s outstanding common shares, with third-party “non-controlling” investors owning the remainder.
We provide reinsurance opportunities and make investments on behalf of these affiliates that we determine are appropriate for them, provided that such business is in accordance with their respective underwriting guidelines. We intend to primarily allocate those reinsurance opportunities that are made available to these affiliates on a proportional basis in accordance with our allocation policies.
In addition, William Pollett, the Company’s Chief Corporate Development and Strategy Officer and Treasurer, serves as a director and the Chief Executive Officer of BCRH, Michael Paquette, the Company’s Chief Financial Officer, serves as BCRH’s Chief Financial Officer and Christopher Harris, the Company’s Chief Executive Officer, serves as Chairman of BCRH.
As a result, certain of our officers, BCML and Blue Water Re may have conflicts of interest between their duties to Montpelier and their duties to the BCGR Listed Fund and BCRH and its subsidiaries.
The Audit Committee considers each of our related party arrangements and transactions and is made aware of actual or potential conflicts of interest that result from our relationship with the BCGR Listed Fund and BCRH and its subsidiaries.
We may be unable to collect all amounts due from our reinsurers under our existing reinsurance arrangements.
In the normal course of business, we purchase reinsurance from third parties in order to manage our exposures. However, we are not relieved of our obligations to policyholders or ceding companies by purchasing reinsurance and we are subject to credit risk with respect to our reinsurance protections in the event that a reinsurer is unable to pay amounts owed to us.
If one or more of our reinsurers is unable or unwilling to honor their obligations to us, our inability to collect amounts due to us could have a material adverse effect on our financial condition and results of operations.
33
Table of Contents
We are subject to loss settlements made by ceding companies, which could materially adversely affect our performance.
When we enter into reinsurance contracts, all loss settlements made by a ceding company, provided they are within the terms of the underlying policies and within the terms of the relevant contract, will be unconditionally binding upon us. While we believe that the ceding companies will settle such claims in good faith, we are bound to accept the claims settlements agreed to by the ceding companies. Under the underlying policies, each ceding company bears the burden of proving that a contractual exclusion applies to a loss, and there may be circumstances where the facts of a loss are insufficient to support the application of an exclusion. In such circumstances, we assume such losses under the reinsured policies, which could materially adversely affect our performance.
Emerging claims and coverage issues could adversely affect our business.
As industry practices and legal, judicial, social and other environmental conditions change, unexpected and unintended issues related to claims and coverages may emerge. These issues may adversely affect our business by either extending coverages beyond our underwriting intent or by increasing the number or size of claims. In some instances, these changes may not become apparent until some time after we have issued reinsurance contracts that are affected by the changes. In addition, we are unable to predict the extent to which the courts may expand the theory of liability under a casualty insurance contract, such as the range of occupational hazards causing losses under employers’ liability insurance, thereby increasing our reinsurance exposure.
In addition, coverage disputes are common within the insurance and reinsurance industry. For example, a reinsurance contract might limit the amount that can be recovered as a result of flooding. However, if the flood damage was caused by an event that also caused extensive wind damage, the determination and quantification of the two types of damage is often a matter of judgment. Similarly, one geographic zone could be affected by more than one catastrophic event. In this case, the amount recoverable from a reinsurer may, in part, be determined by the judgmental allocation of damage among the events. Given the magnitude of the amounts at stake involved with a catastrophic event, these types of judgment occasionally necessitate third-party resolution. As a result, the full extent of liability under our reinsurance contracts may not be known for many years after a contract is issued.
Our loss and LAE reserves may be insufficient to cover our ultimate liability for losses and LAE, which could have a material adverse effect on our financial condition and results of operations.
We maintain loss and LAE reserves to cover our estimated ultimate liabilities. Our loss and LAE reserves are estimates based on what we believe the settlement and administration of claims will cost based on facts and circumstances then known to us, including but not limited to potential changes in the legal environment and other factors such as inflation and loss amplification. Because of the uncertainties that surround estimating loss and LAE reserves, we cannot be certain that our reserves are adequate. If we determine in the future that our reserves are insufficient to cover our actual loss and LAE, we would have to increase our reserves, which could have a material adverse effect on our financial condition and results of operations.
Our stated catastrophe and enterprise-wide risk management exposures are based on estimates and judgments which are subject to significant uncertainties. These measures do not predict our actual exposure to, nor guarantee our successful management of, future losses that could have a material adverse effect on our financial condition and results of operations.
Our approach to risk management, and our estimates of the net impact from single event losses such as those provided in Item 7 herein, rely on subjective variables that entail significant uncertainties. For example, in our treaty reinsurance business, the effectiveness of our reinsurance contract zonal limits in managing risk depends largely on the degree to which an actual event is confined to the zone in question and our ability to determine the actual location of the risks insured. Moreover, in the treaties we write, the definition of a single occurrence may differ from policy to policy, and the legal interpretation of a policy’s various terms and conditions following a catastrophic event may be different from that which we envisioned at its inception. For these and other reasons, there can be no assurance that our actual net aggregate reinsurance treaty limits by zone, or our net impact from single event loss by return period, will not exceed the Natural Catastrophe Risk Management disclosures provided in Item 7 herein.
34
Table of Contents
In addition, our Natural Catastrophe Risk Management disclosures provided in Item 7 herein involve a substantial number of subjective variables, factors and uncertainties. Small changes in assumptions, which depend heavily on our judgment, can have a significant impact on the modeled outputs. Further, these disclosures do not take into account numerous real, but non-quantifiable, inputs and risks such as the implications of a loss of our financial strength ratings on our business. Although we believe that these probabilistic measures provide a meaningful indicator of the relative riskiness of certain events and changes to our business over time, these measures do not predict our actual exposure to, nor guarantee our successful management of, future losses that could have a material adverse effect on our financial condition and results of operations.
Worldwide capital markets and general economic conditions, which may change suddenly and dramatically, could adversely affect the value of our investment portfolio.
Our investment portfolio consists of fixed maturity investments, equity securities and other investments. We also invest in various investment-related derivatives and short investment positions. Our primary investment focus is to maximize risk-adjusted total returns while maintaining adequate liquidity. Since investing entails substantial risks, we cannot assure you that we will achieve our investment objectives and our investment performance may vary substantially year-to-year.
The value of our investments and our investment-related derivatives can be significantly affected by the performance of our investment managers and can be further impacted by fluctuations in interest rates, foreign currencies, issuer and counterparty credit concerns and volatility in financial markets. Our investments and investment-related derivatives are sensitive to many factors, including governmental monetary policies, domestic and international economic and political conditions, the financial position of issuers and financial guarantors of investment securities and other factors beyond our control.
For example, during 2008, difficult conditions worldwide in the capital markets, and in worldwide economies generally, adversely affected our business and results of operations. These unfavorable and uncertain conditions originated, in large part, from difficulties encountered in the mortgage and broader credit markets in the U.S. and elsewhere and resulted in a sudden decrease in the availability of credit, a corresponding increase in borrowing costs and an increase in residential mortgage delinquencies and foreclosures. As a result, many issuers of such securities and the financial guarantors of such securities experienced a sudden deterioration in credit quality which caused both a decline in liquidity and prices for these types of securities. These factors resulted in broad and significant declines in the fair value of fixed income and equity securities worldwide, including investment securities held in our investment portfolio and our investment-related derivatives.
Although worldwide capital markets have largely improved since the events of 2008, they remain volatile due to uncertainty over the availability and cost of credit, inflation, deflation, real estate and mortgage markets, risks associated with global sovereign entities (including emerging markets), the effects of changes in the monetary policies of global sovereign entities, crude oil prices, the stability of banks and other financial institutions, solvency risks of state and local municipalities and stresses evident in European markets. In addition, continued political friction in the U.S. over debt and spending thresholds and revenue policy could result in a further downgrade of its credit rating, which could adversely impact worldwide capital markets.
To the extent that worldwide capital markets and general economic conditions deteriorate from current levels, the value of our investment portfolio could be adversely impacted.
As a Bermuda company, we may be unable to attract and retain staff.
Many of our employees, including the majority of our executive officers, are employed in Bermuda. Although to-date we have been successful in recruiting employees in Bermuda, this location may be an impediment to attracting and retaining experienced personnel, particularly if we are unable to secure Bermuda work permits. In addition, Bermuda is currently a highly-competitive location for qualified staff making it harder to retain employees.
As our success depends on our ability to hire and retain personnel, any future difficulties in hiring or retaining personnel in Bermuda or elsewhere could adversely affect our results of operations and financial condition.
Operational risks, including the risk of fraud and employee errors and omissions, are inherent in our business.
Operational risks that are inherent to our business can result in financial losses, including those resulting from fraud or employee errors and omissions.
35
Table of Contents
We believe we have established appropriate controls and mitigation procedures to prevent significant fraud, errors and omissions and any other potential irregularities from occurring, but such procedures provide only reasonable, not absolute, assurance as to the absence and mitigation of such risks. It is possible that insurance policies that we have in place with third-parties would not entirely protect us in the event that we experienced a significant loss from these risks.
If actual renewals of our insurance and reinsurance contracts do not meet expectations, our premiums written in future years and our future results of operations could be materially adversely affected.
Many of our contracts are written for a one-year term. In our financial forecasting process, we make assumptions about the level of renewals of our prior year’s contracts based on indicative terms and conditions. If the level of actual renewals does not meet expectations or if we choose not to underwrite some or all of our existing contracts on a renewal basis because of pricing, changes in terms and conditions or other risk-selective criteria, our premiums written in future years and our future operations could be materially adversely affected.
We rely on information provided by cedants and brokers in determining whether amounts are due following the occurrence of a covered event, and we may rely on incomplete or unverified information when making underwriting decisions.
The determination of whether amounts are due following the occurrence of a covered event is typically based on reports and may be based upon information provided by cedants, brokers or an independent source, such as an index. If any of this information or data is incomplete, not genuine or inaccurate, our performance may be adversely affected.
Technology breaches or failures, including, but not limited to, those resulting from a malicious cyber attack on us, our business partners or our service providers, could disrupt or otherwise negatively impact our business.
We rely on information technology systems to process, transmit, store and protect the electronic information, financial data and proprietary models that are critical to our business. Furthermore, a significant portion of the communications between our employees and our business, banking and investment partners depends on information technology and electronic information exchange. Like all companies, our information technology systems are vulnerable to data breaches, interruptions or failures due to events that may be beyond our control, including, but not limited to, natural and man-made disasters, theft, terrorist attacks, computer viruses, hackers and general technology failures.
We believe that we have established and implemented appropriate security measures, controls and procedures to safeguard our information technology systems and to prevent unauthorized access to such systems and any data processed and/or stored in such systems, and we periodically employ third parties to evaluate, test and enhance the adequacy of such systems, controls and procedures. In addition, we have established a comprehensive business continuity plan which is designed to ensure that we are able to maintain all aspects of our key business processes functioning in the midst of certain disruptive events, including any disruptions to or breaches of our information technology systems. Our business continuity plan is routinely tested and evaluated for adequacy. Despite these safeguards, disruptions to and breaches of our information technology systems are possible and may negatively impact our business, including our reputation in the insurance and reinsurance marketplace.
It is possible that insurance policies we have in place would not entirely protect us in the event that we experienced a breach, interruption or widespread failure of our information technology systems. Furthermore, we have not secured insurance coverage designed to specifically protect us from an economic loss resulting from such events.
Although we have never experienced any known or threatened cases involving unauthorized access to our information technology systems or unauthorized appropriation of the data contained within such systems, we have no assurance that such technology breaches will not occur in the future.
The Company is dependent upon dividends or distributions from its operating subsidiaries and affiliates.
The Company (as a holding company) has no substantial operations of its own and relies primarily on cash dividends and/or distributions from its operating subsidiaries and affiliates to pay its operating expenses, interest on its debt and dividends to its holders of Common Shares and Preferred Shares. Furthermore, our insurance and reinsurance subsidiaries are highly regulated by authoritative bodies in Bermuda and the U.K. and the various laws and regulations to which they are subject in these jurisdictions limit the declaration and payment of dividends and/or distributions to their parent.
36
Table of Contents
The Companies Act limits the Company’s, BCRH’s, Montpelier Re’s, Blue Water Re’s, Blue Capital Re’s and Blue Capital Re ILS’ ability to pay dividends and/or distributions to their respective shareholders in that none of the Company, BCRH, Montpelier Re, Blue Water Re, Blue Capital Re or Blue Capital Re ILS is permitted to declare or pay a dividend or make a distribution out of its contributed surplus, if it is, or would after the payment be, unable to pay its liabilities as they become due or if the realizable value of its assets would be less than its liabilities.
The inability of our insurance and reinsurance operating subsidiaries to pay dividends and/or distributions in an amount sufficient to enable the Company to meet its cash obligations could have a material adverse effect on us.
We cannot assure you that we will declare or pay future dividends on Common Shares and Preferred Shares.
Although the Company has a long history of declaring and paying dividends to holders of Common Shares and Preferred Shares, we cannot provide assurance that the Company will declare or pay such dividends in the future. Any determination to declare and pay future dividends to holders of Common Shares and Preferred Shares will be at the discretion of the Board and will be dependent upon: (i) our financial position, results of operations, cash flows and capital requirements; (ii) general business conditions; (iii) legal, tax and regulatory developments and limitations; (iv) any contractual restrictions; and (v) any other factors the Board deems relevant.
In addition, so long as any Preferred Shares remain outstanding, no cash dividend shall be paid or declared on our Common Shares, unless the full dividend (which accrues at an annual rate of 8.875%) for the latest completed dividend period on all outstanding Preferred Shares has been declared and paid or otherwise provided for. As a result, if we decline or are unable to pay the full dividend on our Preferred Shares, we will be prohibited from paying or declaring a dividend on our Common Shares.
We may require additional capital in the future, which may not be available or may be available only on unfavorable terms.
We may need to raise additional capital in the future, through the issuance of debt, additional common or preferred equity or hybrid securities, in order to, among other things: (i) write new business; (ii) pay significant losses; (iii) respond to, or comply with, any changes in the capital requirements that regulators or rating agencies use to evaluate us; (iv) acquire new businesses; (v) invest in existing businesses; or (vi) refinance our existing obligations.
The issuance of any new debt, equity or hybrid financial instruments might contain terms and conditions that are more unfavorable to us, our existing shareholders and our debtholders than those contained within our current capital structure. More specifically, any new issuances of equity or hybrid securities could include the issuance of securities with rights, preferences and privileges that are senior or otherwise superior to those of Common Shares and could be dilutive to current holders of our Common Shares. The issuance of additional preferred stock on a parity with or senior to our Preferred Shares would dilute the interests of the holders of our Preferred Shares, and any issuance of preferred stock senior to our Preferred Shares or of additional indebtedness could affect our ability to pay dividends on, redeem or pay the liquidation preference on our Preferred Shares in the event of a liquidation, dissolution or winding-up of the Company. Further, if we cannot obtain adequate capital on favorable terms or otherwise, our business, financial condition and operating results could be adversely affected.
Our operating results may be adversely affected by foreign currency fluctuations.
The U.S. dollar is the Company’s reporting currency. The British pound is the functional currency for the operations of Syndicate 5151, MAL, MCL and MUSL. In addition, we write a portion of our business, receive premiums and pay losses in foreign currencies and may maintain a portion of our investment portfolio in investments denominated in currencies other than U.S. dollars. We may experience net foreign currency losses to the extent our foreign currency exposure is not successfully managed or otherwise hedged, which in turn could adversely affect our financial condition and results of operations.
37
Table of Contents
Competition for business in our industry is intense, and this competition could adversely affect our profitability.
The reinsurance industry is highly competitive. We face intense competition, based upon, among other things, global capacity, market terms and conditions, product breadth, reputation and experience with respect to particular lines of business, relationships with reinsurance intermediaries, quality of service and perceived financial strength. We compete with a variety of operators, including: (i) major global reinsurance companies, many of which have extensive experience in reinsurance and have greater financial resources available to them than we do; (ii) other Bermuda-based reinsurers that write reinsurance and that target the same markets and utilize similar business strategies, many of which currently have more capital than we do; and (iii) capital markets participants that access business in securitized form, including through the issuance of insurance-linked securities or through special purpose vehicles, derivative transactions or other instruments. This competition or any increase in competition could result in fewer submissions (i.e., requests for quotes) and lower rates, which could have an adverse effect on our growth and profitability.
In addition, ceding companies may retain larger shares of risk, thereby reducing overall demand for reinsurance. As a result of this competition and the possible decrease in demand, there may be fewer attractively priced underwriting opportunities, which could have an adverse impact on our expected profitability and our objective to invest substantially all of our available capital.
Regulation and changes in laws and regulations may restrict or otherwise impact our ability to operate.
Our insurance and reinsurance operations are subject to regulation under the laws of Bermuda, the U.S. and the U.K. Governmental agencies have broad administrative power to regulate many aspects of our business, which may include premium rates, marketing practices, advertising, policy forms and capital adequacy. These governmental agencies are concerned primarily with the protection of policyholders rather than shareholders and insurance laws and regulations can impose restrictions on the amount and type of investments, prescribe solvency standards that must be met and maintained and require the maintenance of reserves.
Changes in laws and regulations may restrict our ability to operate or have an adverse effect upon the profitability of our business within a given jurisdiction. For example:
· in past years there have been a number of government initiatives in Florida designed to decrease insurance rates in the state. Of most significance to reinsurers is the capacity of the Florida Hurricane Catastrophe Fund (“FHCF”), a state-run reinsurer. We believe any future increases in the capacity of private reinsurers and the FHCF will cause downward pressure on windstorm catastrophe rates for the foreseeable future, particularly for Florida residential exposures. In addition, state and Federal legislation has been proposed to establish catastrophe funds and to discourage development in coastal areas which could adversely impact our business;
· on January 12, 2015, TRIA was reauthorized through December 31, 2020. TRIA was enacted in 2002 to: (i) establish a system of sharing of losses from terrorist attacks between the private insurance industry and the U.S. government; and (ii) to regulate the terms of insurance relating to terrorism coverage. See “Other Specialty - Treaty” contained in Item 1 herein; and
· Solvency II, a fundamental review of the capital adequacy regime for the EU insurance industry, aims to establish a revised set of EU-wide capital requirements and risk management standards that will replace the solvency requirements currently in effect in member states. Whereas we do not currently believe that we will experience a material change in the overall capital requirements of Montpelier Re or Syndicate 5151 as a result of the implementation of Solvency II, our general and administrative expenses have been, and will continue to be, adversely affected by the additional reporting and administrative burdens of this initiative. See “Solvency II” contained in Item 1 herein.
New ventures that we may sponsor or otherwise enter into could expose us to operational, execution and reputational challenges and risks and could create conflicts of interest.
Any new ventures that we have sponsored or otherwise entered into, or may in the future enter into, could expose us to operational and executional challenges and risks, including: (i) creating, integrating or modifying financial and operational reporting systems; (ii) establishing satisfactory financial, operational, reporting and internal controls; (iii) funding increased capital needs and overhead expenses; (iv) obtaining additional personnel; and (v) compliance with regulatory matters.
38
Table of Contents
Any new ventures could also create reputational risks to us to the extent such ventures ultimately prove to be unsuccessful or their projected results are not ultimately achieved.
Any new ventures could further create potential conflicts of interests in a manner similar to those that may arise out of our existing relationship with the BCGR Listed Fund and BCRH and its subsidiaries. See “Conflicts of Interest” contained in Item 1 herein.
Our failure to successfully manage these risks and potential conflicts may adversely impact our results of operations.
Risks Related to our Common Shares and/or Preferred Shares
The market price and trading volume of our Common Shares and Preferred Shares may be subject to significant volatility.
The market price and trading volume of our Common Shares and Preferred Shares may be subject to significant volatility in response to a variety of events and factors, including but not limited to:
· catastrophes that may specifically impact us or are perceived by investors as impacting the insurance and reinsurance market in general;
· exposure to capital market risks related to changes in interest rates, realized investment losses, credit spreads, equity prices and foreign currency rates;
· our creditworthiness, financial condition, performance and prospects;
· changes in financial estimates and recommendations by securities analysts concerning us or the insurance and reinsurance industries in general;
· whether dividends on Common Shares or Preferred Shares have been declared and are likely to be declared from time to time;
· whether our financial strength ratings or the issuer credit ratings on our Preferred Shares provided by any rating agency have changed;
· the market for similar securities; and
· economic, financial, geopolitical, regulatory or judicial events that affect us and/or the insurance or financial markets generally.
Holders of our Common Shares or Preferred Shares may have difficulty effecting service of process on us or enforcing judgments against us in the U.S.
We are incorporated pursuant to the laws of Bermuda and are headquartered in Bermuda. In addition, certain of our directors and officers reside outside the U.S. and a substantial portion of our assets, and the assets of such persons, are located in jurisdictions outside the U.S. As such, we have been advised that there is doubt as to whether:
· a holder of Common Shares or Preferred Shares would be able to enforce, in the courts of Bermuda, judgments of U.S. courts based upon the civil liability provisions of the U.S. federal securities laws; and
· a holder of Common Shares or Preferred Shares would be able to bring an original action in the Bermuda courts to enforce liabilities against us or our directors and officers, as well as the experts named in this Form 10-K, who reside outside the U.S. based solely upon U.S. federal securities laws.
Further, there is no treaty in effect between the U.S. and Bermuda providing for the enforcement of judgments of U.S. courts, and there are grounds upon which Bermuda courts may not enforce judgments of U.S. courts. Because judgments of U.S. courts are not automatically enforceable in Bermuda, it may be difficult for a holder of Common Shares or Preferred Shares to recover against us based upon such judgments.
39
Table of Contents
Dividends on our Preferred Shares are non-cumulative.
Dividends on Preferred Shares are non-cumulative and payable only out of lawfully available funds of the Company under Bermuda law. Consequently, if the Board, or a duly authorized committee of the Board, does not authorize and declare a dividend for any dividend period, holders of the Preferred Shares would not be entitled to receive any dividend for such period, and no dividend for such period will accrue or ever become payable. If dividends on Preferred Shares are authorized and declared with respect to any subsequent dividend period, the Company will be free to pay dividends on any other series of preferred shares and/or Common Shares.
Our Preferred Shares are equity and are subordinate to our existing and future indebtedness.
Our Preferred Shares are equity interests and do not constitute indebtedness. As a result, holders of our Preferred Shares may be required to bear the financial risks of an investment in an equity interest for an indefinite period of time. In addition, Preferred Shares will rank junior to all of our indebtedness and other non-equity claims with respect to assets available to satisfy our claims, including in our liquidation. As of December 31, 2014, the face value of our long-term debt was $400.0 million, and we may incur additional debt in the future. Our existing and future indebtedness may restrict payments of dividends on Preferred Shares. Additionally, unlike debt, where principal and interest would customarily be payable on specified due dates, in the case of Preferred Shares: (i) dividends are payable only if declared by the Board (or a duly authorized committee of the Board); and (ii) we are subject to certain regulatory and other constraints affecting our ability to pay dividends and make other payments.
The voting rights of holders of our Common Shares and Preferred Shares are limited.
Our bye-laws provide that, if any person beneficially owns or is deemed to beneficially own directly, indirectly or constructively (within the meaning of Section 958 of the U.S. Internal Revenue Code), more than 9.5% of Common Shares, the voting rights attached to such Common Shares will be reduced so that such person may not exercise and is not attributed more than 9.5% of the total voting rights. In addition, our bye-laws provide that if any U.S. person acquires actual knowledge that such person owns, directly or indirectly, 9.0% or more of our Common Shares or the common shares of our affiliates, such person must deliver notice to us within 10 days of acquiring such knowledge.
Holders of Preferred Shares have no voting rights with respect to matters that typically require the approval of voting shareholders. The limited voting rights of holders of Preferred Shares include the right to vote as a class on certain fundamental matters that affect the preference or special rights of Preferred Shares as set forth in the certificate of designation relating to the Preferred Shares. In addition, if dividends on Preferred Shares have not been declared or paid for the equivalent of six dividend payments, whether or not for consecutive dividend periods, holders of outstanding Preferred Shares will be entitled to vote for the election of two additional directors to the Board subject to the terms and to the limited extent as set forth in the certificate of designation relating to the Preferred Shares.
Bermuda law differs from the laws in effect in the U.S. and may afford less protection to holders of our Common and Preferred Shares
We are organized under the laws of Bermuda. As a result, it may not be possible for our shareholders to enforce court judgments obtained in the U.S. against us based on the civil liability provisions of the Federal or state securities laws of the U.S., either in Bermuda or in countries other than the U.S. where we have assets. In addition, there is some doubt as to whether the courts of Bermuda and other countries would recognize or enforce judgments of U.S. courts obtained against us or our directors or officers based on the civil liabilities provisions of the Federal or state securities laws of the U.S. or would hear actions against us or those persons based on those laws.
Our corporate affairs are governed by the Companies Act, which differs in some material respects from laws typically applicable to U.S. corporations and shareholders, including the provisions relating to interested directors, amalgamations, mergers and acquisitions, takeovers, shareholder lawsuits and indemnification of directors. Generally, the duties of directors and officers of a Bermuda company are owed to the company only. Shareholders of Bermuda companies typically do not have rights to take action against directors or officers of the company and may only do so in limited circumstances. Class actions and derivative actions are typically not available to shareholders under Bermuda law. The Bermuda courts, however, would ordinarily be expected to permit a shareholder to commence an action in the name of a company to remedy a wrong to the company where the act complained of is alleged to be beyond the corporate power of the company or illegal, or would result in the violation of the company’s memorandum of association or bye-laws.
40
Table of Contents
Furthermore, consideration would be given by a Bermuda court to acts that are alleged to constitute a fraud against the minority shareholders or, for instance, where an act requires the approval of a greater percentage of the company’s shareholders than that which actually approved it.
When the affairs of a company are being conducted in a manner that is oppressive or prejudicial to the interests of some shareholders, one or more shareholders may apply to the Supreme Court of Bermuda, which may make such order as it sees fit, including an order regulating the conduct of the company’s affairs in the future or ordering the purchase of the shares of any shareholders by other shareholders or by the company. Additionally, under our bye-laws and as permitted by Bermuda law, each shareholder has waived any claim or right of action against our directors or officers for any action taken by directors or officers in the performance of their duties, except for actions involving fraud or dishonesty. In addition, the rights of holders of our Common and Preferred Shares and the fiduciary responsibilities of our directors under Bermuda law are not as clearly established as under statutes or judicial precedent in existence in jurisdictions in the U.S., particularly the State of Delaware. Therefore, holders of our Common Shares and Preferred Shares may have more difficulty protecting their interests than would shareholders of a corporation incorporated in a jurisdiction within the U.S.
We may require our shareholders to sell us their Common Shares or Preferred Shares.
Under our bye-laws and subject to Bermuda law, we have the option, but not the obligation, to require a shareholder to sell some or all of their Common Shares or Preferred Shares to us at fair market value (which would be based upon the average closing price of Common Shares or Preferred Shares as defined under our bye-laws) if the Board reasonably determines, in good faith based on an opinion of counsel, that share ownership, directly, indirectly or constructively by any shareholder is likely to result in adverse tax, regulatory or legal consequences to us, certain of our other shareholders or our subsidiaries.
In addition, under the terms of our Preferred Shares, on and after May 10, 2016, we have the option, but not the obligation, to require a shareholder to sell some or all of their Preferred Shares to us at a price equal to $25.00 per share, plus declared and unpaid dividends. We may also require a shareholder to sell some or all of their Preferred Shares to us before May 10, 2016, in specified circumstances relating to certain tax or corporate events.
Risks Related to Taxation
Our Bermuda operating companies may be subject to U.S. tax.
The Company, BCRH, Montpelier Re, Blue Water Re, Blue Capital Re and Blue Capital Re ILS currently intend to conduct substantially all of their operations in Bermuda in a manner such that they will not be engaged in a trade or business in the U.S. However, because there is no definitive authority regarding activities that constitute being engaged in a trade or business in the U.S. for U.S. federal income tax purposes, there can be no assurance that the U.S. Internal Revenue Service (the “IRS”) will not contend, perhaps successfully, that the Company, BCRH, Montpelier Re, Blue Water Re, Blue Capital Re and/or Blue Capital Re ILS is subject to taxation in the U.S. A foreign corporation deemed to be so engaged would be subject to U.S. federal income tax, as well as the branch profits tax, on its income that is treated as effectively connected with the conduct of that trade or business unless the corporation is entitled to relief under a tax treaty.
In addition, the U.S. Congress has discussed legislation from time-to-time intended to eliminate certain perceived tax advantages of Bermuda reinsurers and U.S. companies with Bermuda affiliates, and has recently considered proposals which, if adopted, would adversely impact such operations. While these legislative proposals would not have a material impact on our current results, such proposals and/or additional legislative proposals (if adopted) could have a future material adverse impact on us or our shareholders.
Changes in U.S. tax legislation may adversely affect U.S. holders of Common Shares or Preferred Shares.
U.S. federal income tax laws and interpretations, including those regarding whether a company is a passive foreign investment company (“PFIC”), are subject to change, possibly on a retroactive basis. Under current tax law, U.S. holders of Common Shares or Preferred Shares generally qualify for an exception to the PFIC rules because we are considered to be an active insurance company. Recent proposals seek to change this exception which, if adopted, could cause us to be treated as a PFIC in some or all taxable years. In such case, U.S. holders of Common or Preferred Shares would be subject to unfavorable U.S. federal income tax treatment, including that any dividends we pay with respect to our Common Shares or Preferred Shares would be no longer be “qualified dividends” eligible to be taxed at reduced U.S. federal income tax rates.
41
Table of Contents
Provided our Common Shares and Preferred Shares remain listed on the New York Stock Exchange and we are not a PFIC, then under current U.S. law, dividends paid on our Common Shares and Preferred Shares to U.S. individual shareholders should continue to qualify as “qualified dividend income” and be eligible for reduced U.S. federal income tax rates. The U.S. Congress has, in the past, considered legislation that would exclude shareholders of foreign corporations from this preferential U.S. federal income tax treatment unless either: (i) the corporation is organized or created under the laws of a country that has entered into a “comprehensive income tax treaty” with the U.S.; or (ii) the stock of such corporation is readily tradable on an established securities market in the U.S. and the corporation is organized or created under the laws of a country that has a “comprehensive income tax system” that the U.S. Secretary of the Treasury determines is satisfactory for this purpose. We would likely not satisfy either of these tests and, accordingly, if this or similar legislation were to become law, individual U.S. shareholders would no longer qualify for reduced U.S. federal income tax rates on dividends paid by us.
We may be subject to tax withholding under FATCA, which may reduce investment returns and distributions to shareholders.
Sections 1471 through 1474 of the U.S. Internal Revenue Code, commonly referred to as the Foreign Account Tax Compliance Act (“FATCA”), recently imposed a reporting regime and a 30% withholding tax (“FATCA Withholding”) with respect to certain payments occurring after June 30, 2014, to a non-U.S. entity that is not otherwise excepted from FATCA Withholding and does not comply with FATCA disclosure requirements.
In December 2013, Bermuda entered into a Model 2 intergovernmental agreement with the U.S. (the “Bermuda IGA”) to implement FATCA with respect to Bermudian institutions. The Bermuda IGA generally requires financial institutions in Bermuda to register with the IRS and to identify and annually report key information about U.S. persons directly to the IRS.
While the Company is excepted from FATCA Withholding as a non-financial foreign entity that is publicly traded, certain of its wholly-owned subsidiaries are classified as Foreign Financial Institutions (“FFIs”) under the regime. Some of the Company’s subsidiary FFIs are required to register, and have registered, with the IRS to obtain Global Intermediary Identification Numbers (“GIINs”). As a result of these registrations and the completion of ongoing reporting requirements for FFIs that hold GIINs, the Company believes that it is currently in compliance with the Bermuda IGA and FATCA.
If we are found not to be in compliance with FATCA, we may be subject to FATCA Withholding on all, or a portion of all, payments received by us, directly or indirectly, from U.S. sources or in respect of U.S. assets, including premiums owed to us in respect of U.S. sourced risks, and, beginning in 2017, the gross proceeds on the sale or disposition of certain U.S. assets. Any such withholding imposed on us would reduce the amounts available to us to make payments to our shareholders.
In addition, shareholders may be required to provide certain information to us, which we may have to report to the IRS, to avoid FATCA Withholding on certain amounts paid by us to our shareholders. If an amount in respect of FATCA Withholding is deducted or withheld on a payment made by us to shareholders, we will not pay additional amounts as a result of this deduction or withholding. As a result, shareholders may receive a smaller payment from us than expected.
FATCA and the impact of the Bermuda IGA are particularly complex and you should consult your own tax advisors to obtain a more detailed explanation of FATCA and the Bermuda IGA and to learn how they might affect you in your particular circumstances.
We may become subject to income and other taxes in Bermuda after March 31, 2035, which may have a material adverse effect on our financial condition.
The Minister of Finance of Bermuda, under the Exempted Undertaking Tax Protection Act 1966, as amended, has exempted the Company and its Bermuda-domiciled subsidiaries from all local income, withholding and capital gains taxes until March 31, 2035. At the present time, no such taxes are levied in Bermuda. We cannot assure you that we will not be subject to any Bermuda tax after March 31, 2035.
Item 1B. Unresolved Staff Comments
As of the date of this report, we had no unresolved comments from the SEC regarding our periodic or current reports under the Exchange Act.
42
Table of Contents
Item 2. Properties
We lease office space in Pembroke, Bermuda, where the Company’s Bermuda operations and BCRH and its subsidiaries are located. We lease office space in London, U.K. where the Company’s U.K. operations are located. We lease office space in Woburn, Massachusetts, Chicago, Illinois and Hanover, New Hampshire where the Company’s U.S. operations are located.
We believe our facilities are adequate for our current needs.
Item 3. Legal Proceedings
We are subject to litigation and arbitration proceedings in the normal course of our business. Such proceedings often involve insurance or reinsurance contract disputes, which are typical for the insurance and reinsurance industry. Expected or actual reductions in our reinsurance recoveries due to insurance or reinsurance contract disputes (as opposed to a reinsurer’s inability to pay) are not recorded as an uncollectible reinsurance recoverable. Rather, they are factored into the determination of, and are reflected in, our net loss and LAE reserves.
During 2011 Montpelier Re was named in a series of lawsuits filed by a group of plaintiffs in their capacity as trustees for senior debt issued by the Tribune Company (“Tribune”) on behalf of various senior debt holders. Montpelier Re, along with thousands of other named defendants, formerly owned Tribune common shares and tendered such common shares pursuant to a 2007 leveraged buyout led by Tribune management (the “Tribune LBO”). Tribune subsequently filed for bankruptcy protection at the end of 2008 and emerged from bankruptcy on December 31, 2012.
The plaintiffs are suing all tendering shareholders, including Montpelier Re, on the grounds of fraudulent conveyance and seek recovery of the proceeds received pursuant to the Tribune LBO on the basis that the transaction was undertaken without fair consideration and left Tribune insolvent. The various lawsuits are still pending and, in December 2011, were consolidated in the Federal District Court for the Southern District of New York by the U.S. Judicial Panel on Multidistrict Litigation.
Montpelier Re was also named in a similar suit filed by the Official Committee of Unsecured Creditors in the Tribune bankruptcy case. This suit was filed in the U.S. Bankruptcy Court for the District of Delaware and also asserts a fraudulent conveyance claim involving the Tribune LBO.
In the event that the plaintiffs in these suits were to fully prevail, Montpelier Re would have to return the $4.4 million in cash proceeds it received in connection with the Tribune common shares tendered pursuant to the Tribune LBO.
Other than the Tribune litigation referred to above, we had no other unresolved legal proceedings, other than those in the normal course of our business, at December 31, 2014.
Item 4. Mine Safety Disclosures
Not applicable.
PART II
Item 5. Market for Registrant’s Common Equity, Related Shareholder Matters and Issuer Purchases of Equity Securities
Market Information
Our Common Shares are listed on the New York Stock Exchange under the symbol MRH and the Bermuda Stock Exchange under the symbol MRH BH. The quarterly range of the high and low New York Stock Exchange closing prices for our Common Shares during 2014 and 2013 is presented below:
|
|
|
2014 |
|
2013 |
|
|
|
|
High |
|
Low |
|
High |
|
Low |
|
|
Quarter ended: |
|
|
|
|
|
|
|
|
|
|
December 31 |
|
$ |
37.63 |
|
$ |
30.91 |
|
$ |
29.50 |
|
$ |
25.65 |
|
|
September 30 |
|
32.63 |
|
29.16 |
|
27.38 |
|
24.38 |
|
|
June 30 |
|
32.27 |
|
29.17 |
|
27.50 |
|
23.91 |
|
|
March 31 |
|
29.95 |
|
26.53 |
|
26.46 |
|
23.14 |
|
|
|
|
|
|
|
|
|
|
|
|
|
|
|
43
Table of Contents
Registered Holders of Common Shares
As of February 20, 2015, we had 85 registered holders of Common Shares.
Dividends Declared on Common Shares
During 2014 and 2013, we declared quarterly cash dividends totaling $0.65 and $0.47 per Common Share, respectively.
The Company has no operations of its own and relies on dividends and/or distributions from its subsidiaries to pay dividends to its holders of Common Shares and to fund any Common Share repurchase activities. There are restrictions on the payment of dividends to the Company from its regulated operating companies as described under “Regulation and Capital Requirements” herein. Any future determination to pay dividends to holders of Common Shares will, however, be at the discretion of the Board and will be dependent upon many factors, including our results of operations, cash flows, financial position, capital requirements, general business opportunities, and legal, tax, regulatory and contractual restrictions.
Securities Authorized for Issuance Under Equity Compensation Plans
See “Securities Authorized for Issuance Under Equity Compensation Plans” contained in Item 12 herein.
Performance Graph
The following graph shows the five-year cumulative total return for a shareholder who invested $100 in Common Shares as of January 1, 2010, assuming reinvestment of dividends and distributions. Cumulative returns for the five-year period ended December 31, 2014 are also shown for the Standard & Poor’s 500 Index (“S&P 500”) and the Standard & Poor’s 500 Property & Casualty Insurance Index (“S&P 500 P&C”) for comparison.
The returns presented below are based on historical results and are not intended to suggest future performance.
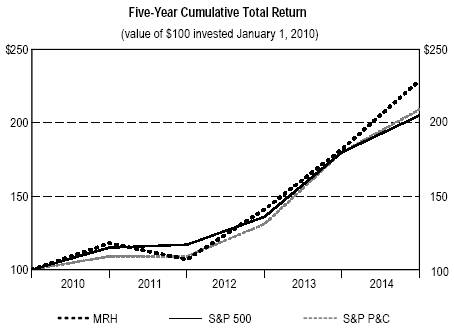
|
|
|
Year Ended December 31, |
|
|
Company/Index |
|
2009 |
|
2010 |
|
2011 |
|
2012 |
|
2013 |
|
2014 |
|
|
Montpelier Re Holdings Ltd. Common Shares |
|
$ |
100 |
|
$ |
118 |
|
$ |
107 |
|
$ |
141 |
|
$ |
182 |
|
$ |
229 |
|
|
S&P 500 |
|
100 |
|
115 |
|
117 |
|
136 |
|
180 |
|
205 |
|
|
S&P 500 P&C |
|
100 |
|
109 |
|
109 |
|
131 |
|
180 |
|
209 |
|
|
|
|
|
|
|
|
|
|
|
|
|
|
|
|
|
|
|
|
|
44
Table of Contents
Issuer Purchases of Common Shares
The following table provides information with respect to the Company’s repurchases of Common Shares during the three months ended December 31, 2014:
|
Period |
|
Total Number
of Shares
Purchased |
|
Average
Price Paid
per Share |
|
Total Number
of Shares
Purchased
as Part of Publicly
Announced
Plans or Programs |
|
Approximate
Dollar Value of
Shares That
May Yet Be
Purchased Under
the Plans or
Programs (1) |
|
|
October 1 - October 31, 2014 |
|
965,634 |
|
$ |
31.72 |
|
965,634 |
|
|
|
|
November 1 - November 30, 2014 |
|
39,459 |
|
32.44 |
|
39,459 |
|
|
|
|
December 1 - December 31, 2014 |
|
— |
|
— |
|
— |
|
|
|
|
Total |
|
1,005,093 |
|
$ |
31.75 |
|
1,005,093 |
|
$ |
281,737,898 |
|
|
|
|
|
|
|
|
|
|
|
|
|
(1) On November 14, 2014, the Board increased the Company’s existing share repurchase authorization by $200.0 million to a total of $281.7 million. There is no stated expiration date associated with the Company’s Common Share repurchase authorization.
45
Table of Contents
Item 6. Selected Financial Data
Selected consolidated statement of operations data, ending consolidated balance sheet data and share data for each of the five years ended December 31, 2014, follows:
|
|
|
Year Ended December 31, |
|
|
(Millions, except per share amounts) |
|
2014 |
|
2013 |
|
2012 |
|
2011 |
|
2010 |
|
|
Statement of Operations Data: |
|
|
|
|
|
|
|
|
|
|
|
|
Revenues (a) |
|
$ |
691.1 |
|
$ |
573.6 |
|
$ |
757.2 |
|
$ |
720.9 |
|
$ |
748.4 |
|
|
Expenses (b) |
|
(445.8 |
) |
(363.1 |
) |
(529.3 |
) |
(836.7 |
) |
(537.7 |
) |
|
Income (loss) before income taxes |
|
245.3 |
|
210.5 |
|
227.9 |
|
(115.8 |
) |
210.7 |
|
|
Income tax benefit (provision) |
|
2.7 |
|
0.1 |
|
(0.3 |
) |
0.6 |
|
1.3 |
|
|
Net income (loss) |
|
248.0 |
|
210.6 |
|
227.6 |
|
(115.2 |
) |
212.0 |
|
|
Net income attributable to non-controlling interests (c) |
|
(24.1 |
) |
(6.1 |
) |
— |
|
— |
|
— |
|
|
Net income (loss) available to the Company |
|
223.9 |
|
204.5 |
|
227.6 |
|
(115.2 |
) |
212.0 |
|
|
Dividends declared on Preferred Shares (d) |
|
(13.3 |
) |
(13.3 |
) |
(13.3 |
) |
(9.1 |
) |
— |
|
|
Net income (loss) available to the Company’s common shareholders |
|
$ |
210.6 |
|
$ |
191.2 |
|
$ |
214.3 |
|
$ |
(124.3 |
) |
$ |
212.0 |
|
|
Balance Sheet Data: |
|
|
|
|
|
|
|
|
|
|
|
|
Total assets |
|
$ |
3,629.1 |
|
$ |
3,758.5 |
|
$ |
3,810.1 |
|
$ |
3,499.5 |
|
$ |
3,219.4 |
|
|
Loss and LAE reserves |
|
775.7 |
|
881.6 |
|
1,112.4 |
|
1,077.1 |
|
784.6 |
|
|
Debt (e) |
|
407.3 |
|
399.2 |
|
399.1 |
|
327.8 |
|
327.7 |
|
|
Preferred shareholders’ equity (d) |
|
150.0 |
|
150.0 |
|
150.0 |
|
150.0 |
|
— |
|
|
Common shareholders’ equity available to the Company (f) |
|
1,498.2 |
|
1,492.1 |
|
1,479.4 |
|
1,399.3 |
|
1,628.8 |
|
|
Non-controlling interests (c) |
|
266.3 |
|
244.9 |
|
— |
|
— |
|
— |
|
|
Amounts per Common Share: |
|
|
|
|
|
|
|
|
|
|
|
|
Fully converted book value (g) |
|
$ |
33.19 |
|
$ |
29.42 |
|
$ |
26.14 |
|
$ |
22.71 |
|
$ |
24.61 |
|
|
Basic and diluted earnings (loss) |
|
4.48 |
|
3.61 |
|
3.67 |
|
(2.01 |
) |
2.97 |
|
|
Dividends declared |
|
0.650 |
|
0.470 |
|
0.430 |
|
0.405 |
|
0.370 |
|
(a) During 2013 we experienced $49.2 million in net realized and unrealized investment losses. The net investment losses we experienced in 2013, versus the net gains we experienced in all other years presented, muted our total revenues in that year.
(b) During 2012 we incurred a $102.8 million net catastrophe loss (not including the benefit of reinstatement premiums, which we record as revenues) from windstorm Sandy. During 2011 we incurred $409.0 million in net losses (not including the benefit of reinstatement premiums) associated with several catastrophic events, including earthquakes in New Zealand and Japan, and Thailand floods. During 2010 we incurred $135.9 million in net losses (not including the benefit of reinstatement premiums) associated with earthquakes in Chile and New Zealand. The magnitude of these catastrophic events significantly impacted our loss and loss adjustment expenses in those years.
(c) Represents the interests in the entities included within our Collateralized Reinsurance segment that are attributable to third-party investors.
(d) In May 2011 we issued the Preferred Shares in the amount of $150.0 million.
(e) In October 2012 we issued $300.0 million of senior unsecured debt due in 2022 (the “2022 Senior Notes”) and used the majority of the proceeds to fully redeem $228.0 million of outstanding senior unsecured debt due in 2013 (the “2013 Senior Notes”).
(f) During 2014 we repurchased 6,210,415 Common Shares for $185.9 million. During 2013 we repurchased 6,590,546 Common Shares for $168.0 million. During 2012 we repurchased 5,981,589 Common Shares for $120.9 million. During 2011 we repurchased 4,349,302 Common Shares for $82.7 million. During 2010 we repurchased 16,123,261 Common Shares for $293.8 million.
(g) See “Management’s Discussion and Analysis of Financial Condition and Results of Operations” contained in Item 7 herein for a description and computation of our fully converted book value per Common Share.
46
Table of Contents
Item 7. Management’s Discussion and Analysis of Financial Condition and Results of Operations
General
The following is a discussion and analysis of our results of operations for the years ended December 31, 2014, 2013 and 2012 and our financial condition as of December 31, 2014 and 2013. This discussion and analysis should be read in conjunction with the audited consolidated financial statements and related notes thereto included elsewhere in this report.
This discussion contains forward-looking statements that are not historical facts, including statements about our beliefs and expectations. These statements are based upon current plans, estimates and projections. Our actual results may differ materially from those projected in these forward-looking statements as a result of various factors. See “Forward Looking Statements” appearing at the beginning of this report and “Risk Factors” contained in Item 1A herein.
Overview
Summary Financial Results
Year Ended December 31, 2014
We ended 2014 with a fully converted book value per Common Share (“FCBVPCS”) of $33.19, an increase of 15.0% for the year after taking into account dividends declared on Common Shares during the period. The increase in our FCBVPCS during 2014 was primarily the result of strong underwriting results. Our comprehensive income available to the Company for 2014 was $221.5 million and our GAAP combined ratio was 65.6%.
Our underwriting results for 2014 benefitted from a low level of net catastrophe losses as well as $151.8 million of prior year favorable loss reserve development. Our investment results for 2014 included $5.4 million of net realized and unrealized investment gains, which were comprised of $14.0 million in net gains from fixed maturities, $1.9 million in net gains from equity securities and $10.5 million in net losses from other investments.
Year Ended December 31, 2013
We ended 2013 with a FCBVPCS of $29.42, an increase of 14.3% for the year after taking into account dividends declared on Common Shares during the period. The increase in our FCBVPCS during 2013 was primarily the result of strong underwriting results. Our comprehensive income available to the Company for 2013 was $205.4 million and our GAAP combined ratio was 56.1%.
Our underwriting results for 2013 benefitted from a low level of net catastrophe losses as well as $144.4 million of prior year favorable loss reserve development. Our investment results for 2013 included $49.2 million of net realized and unrealized investment losses, which were comprised of $60.6 million in net losses from fixed maturities, $7.2 million in net gains from equity securities and $4.2 million in net gains from other investments.
During 2013 we also incurred a $7.5 million non-recurring expense associated with the underwriting discount and structuring fees paid by us in connection with the BCRH IPO.
Year Ended December 31, 2012
We ended 2012 with a FCBVPCS of $26.14, an increase of 17.0% for the year after taking into account dividends declared on Common Shares during the period. The increase in our FCBVPCS during 2012 was primarily the result of strong underwriting and investment results. Our comprehensive income for 2012 was $228.4 million and our GAAP combined ratio was 81.0%.
Our underwriting results for 2012 included a $102.8 million net catastrophe loss (not including the benefit of reinstatement premiums) from windstorm Sandy. This net loss was partially offset by $87.4 million of prior year favorable loss reserve development. Our investment results for 2012 included $82.4 million of net realized and unrealized investment gains, which were comprised of $64.4 million in net gains from fixed maturities, $8.8 million in net gains from equity securities and $9.2 million in net gains from other investments.
During 2012 we also incurred a $9.7 million non-recurring loss upon the early extinguishment of our 2013 Senior Notes.
47
Table of Contents
Book Value Per Common Share
The following table presents our computations of book value per Common Share (“BVPCS”) and FCBVPCS as of December 31, 2014, 2013 and 2012:
|
|
|
December 31, |
|
|
|
|
2014 |
|
2013 |
|
2012 |
|
|
Book value numerator (in millions): |
|
|
|
|
|
|
|
|
|
|
|
|
|
|
|
|
|
Shareholders’ Equity available to the Company |
|
$ |
1,648.2 |
|
$ |
1,642.1 |
|
$ |
1,629.4 |
|
|
Less: Preferred Shareholders’ Equity |
|
(150.0 |
) |
(150.0 |
) |
(150.0 |
) |
|
[A] Common Shareholders’ Equity available to the Company |
|
$ |
1,498.2 |
|
$ |
1,492.1 |
|
$ |
1,479.4 |
|
|
|
|
|
|
|
|
|
|
|
Book value denominators (in thousands): |
|
|
|
|
|
|
|
|
|
|
|
|
|
|
|
|
|
[B] Common Shares outstanding |
|
43,619 |
|
49,274 |
|
55,270 |
|
|
|
|
|
|
|
|
|
|
|
Restricted Share Units (“RSUs”) outstanding |
|
1,521 |
|
1,449 |
|
1,327 |
|
|
[C] Common Shares and RSUs outstanding |
|
45,140 |
|
50,723 |
|
56,597 |
|
|
|
|
|
|
|
|
|
|
|
BVPCS [A] / [B] |
|
$ |
34.35 |
|
$ |
30.28 |
|
$ |
26.77 |
|
|
FCBVPCS [A] / [C] |
|
33.19 |
|
29.42 |
|
26.14 |
|
|
|
|
|
|
|
|
|
|
|
Increase (decrease) in FCBVPCS: (1) |
|
|
|
|
|
|
|
|
|
|
|
|
|
|
|
|
|
From December 31, 2013 |
|
15.0 |
% |
|
|
|
|
|
From December 31, 2012 |
|
31.3 |
% |
14.3 |
% |
|
|
|
From December 31, 2011 |
|
53.0 |
% |
33.5 |
% |
17.0 |
% |
(1) Computed as the change in FCBVPCS after taking into account dividends declared on Common Shares of $0.65, $0.47 and $0.43 during 2014, 2013 and 2012, respectively.
Our computations of FCBVPCS and the increase in FCBVPCS are non-GAAP measures which we believe are important to our investors, analysts and other interested parties who benefit from having an objective and consistent basis for comparison with other companies within our industry.
The Company’s increase in FCBVPCS serves as the performance measure for both the portion of our annual employee cash bonuses that are based on Company performance and for our Variable RSU awards in the Initial RSU Period (each as defined on page F-30 of this report). We believe that this performance measure: (i) directly aligns our interests and motivations with those of our stakeholders; and (ii) provides our employees with the ability to easily understand, and identify with, their incentive hurdle, and allows our stakeholders to easily track the Company’s performance with respect to this goal, since we present our calculations of FCBVPCS and the increase in our FCBVPCS in our quarterly earnings releases and our annual and quarterly filings with the SEC.
Executive Overview
We provide customized and innovative insurance and reinsurance solutions to the global market through our underwriting platforms in Bermuda, the U.K. and the U.S. Through our affiliates in Bermuda, we also provide institutional and retail investors with the opportunity to directly invest in global property catastrophe reinsurance risks.
During 2014 each of our operating segments, Montpelier Bermuda, Montpelier at Lloyd’s and Collateralized Reinsurance, experienced strong profitability. Overall, we achieved a 15.0% increase in our FCBVPCS for the year while returning $215.8 million to holders of our Common Shares through share repurchases and dividends.
In addition, the launch of BCRH on the New York Stock Exchange in November 2013 and the subsequent growth experienced by the BCGR Listed Fund further expanded our presence in the collateralized reinsurance market. These initiatives, as well as the various underwriting partnerships that we continue to successfully develop, served to significantly increase the amount of third-party assets that we manage, enabling us to provide a broader product mix and increased line sizes for select clients. As of January 1, 2015, Blue Capital® had approximately $790 million of capital under management, of which $625 million represented capital from third-parties.
48
Table of Contents
Looking ahead to 2015, we experienced continued competition during the key January 1, 2015 renewal season, particularly within our Property Catastrophe-Treaty class, due to relatively light industry catastrophe losses experienced since 2012. As a result, we experienced an overall rate decrease of approximately 6% on the risks we wrote at January 1, 2015.
Despite the competitive market conditions we currently face, through our efforts thus far in 2015, we believe that we have: (i) achieved preferred signings; (ii) maintained strong relationships with our key business partners; and (iii) expanded our product mix. Further, through the recent reductions to our largest projected exposures from single event losses versus those of a year ago, we have retained the ability to quickly adapt and respond to new market opportunities while continuing our strategic focus on property, marine and other short-tail lines. Given our strong balance sheet, disciplined underwriting and specialist approach, we believe we are positioned to perform well into 2015 and beyond.
Third-Party Fees and Expense Reimbursements
We have entered into specialized quota share reinsurance contracts with third-parties and certain of our affiliates, namely BCRH and the BCGR Listed Fund, with respect to a portion of Montpelier Re’s Property Catastrophe - Treaty book of business, under which we are eligible to receive override and profit commissions.
We record the override and profit commissions associated with specialized quota share reinsurance contracts with third-parties (when earned) as a reduction to our acquisition costs which, in turn, reduces our acquisition cost and overall combined ratios. These benefits totaled $8.4 million, $12.2 million and $10.4 million during the years ended December 31, 2014, 2013 and 2012, respectively.
We record the override and profit commissions associated with specialized quota share reinsurance contracts with BCRH and the BCGR Listed Fund (when earned), as well as the fronting fees, management and performance fees and expense reimbursements we receive as the manager for these entities, as decreases to the net income attributable to non-controlling interests, thereby increasing the net income and comprehensive income available to the Company. These benefits totaled $7.6 million, $3.3 million and zero during the years ended December 31, 2014, 2013 and 2012, respectively.
Natural Catastrophe Risk Management
We insure and reinsure exposures throughout the world against various natural catastrophe perils. We manage our exposure to these perils using a combination of methods, including underwriting judgment, CATM® (our proprietary risk management system), third-party models and third-party protection such as ceded reinsurance and derivative instrument protections.
Our multi-tiered risk management approach focuses on tracking exposed contract limits, estimating the potential impact of a single natural catastrophe event and simulating our yearly net operating result to reflect an aggregation of modeled underwriting, investment and other risks. Management routinely seeks to refine and improve our risk management system and the Board regularly reviews the outputs from this process.
The following discussion should be read in conjunction with the “Risk Factors” contained in Item 1A herein, in particular the specific risk factor entitled “Our stated catastrophe and enterprise-wide risk management exposures are based on estimates and judgments which are subject to significant uncertainties.”
Exposure Management
We monitor our net reinsurance treaty contract limits that we believe are exposed to a single natural catastrophe occurrence within certain broadly defined major catastrophe zones. We provide these limits as a measure of our relative potential loss exposure across major zones in the event a natural catastrophe occurs.
Our January 1, 2015 net reinsurance treaty limits by zone were as follows:
49
|
|
|
Treaty Limits |
|
Percentage of December 31, 2014 |
|
|
|
|
(Millions) |
|
Shareholders’ Equity Available to the Company |
|
|
U.S. Hurricane: |
|
|
|
|
|
|
|
|
|
|
|
|
|
Mid-Atlantic hurricane |
|
$ |
498 |
|
30 |
% |
|
Northeast hurricane |
|
413 |
|
25 |
% |
|
Florida hurricane |
|
385 |
|
23 |
% |
|
Gulf hurricane |
|
363 |
|
22 |
% |
|
Hawaii hurricane |
|
163 |
|
10 |
% |
|
|
|
|
|
|
|
|
U.S. Earthquake: |
|
|
|
|
|
|
|
|
|
|
|
|
|
New Madrid earthquake |
|
$ |
510 |
|
31 |
% |
|
California earthquake |
|
361 |
|
22 |
% |
|
Northwest earthquake |
|
324 |
|
20 |
% |
|
|
|
|
|
|
|
|
European Windstorm: |
|
|
|
|
|
|
|
|
|
|
|
|
|
Western European windstorm |
|
$ |
409 |
|
25 |
% |
|
U.K. & Ireland windstorm |
|
364 |
|
22 |
% |
|
Scandinavia windstorm |
|
170 |
|
10 |
% |
|
|
|
|
|
|
|
|
Other Countries: |
|
|
|
|
|
|
|
|
|
|
|
|
|
Japan earthquake |
|
$ |
242 |
|
15 |
% |
|
Canada earthquake |
|
218 |
|
13 |
% |
|
Australia earthquake |
|
218 |
|
13 |
% |
|
Australia cyclone |
|
207 |
|
13 |
% |
|
New Zealand earthquake |
|
158 |
|
10 |
% |
|
Turkey earthquake |
|
149 |
|
9 |
% |
|
Chile earthquake |
|
139 |
|
8 |
% |
|
Japan windstorm |
|
118 |
|
7 |
% |
(1) For purposes of this presentation, “Mid-Atlantic” includes Georgia, South Carolina, North Carolina, Virginia, West Virginia, Maryland, Delaware, Pennsylvania, New Jersey and the District of Columbia; “Northeast” includes New York, Connecticut, Rhode Island, Massachusetts, New Hampshire, Vermont and Maine; “Gulf” includes Texas, Louisiana, Mississippi and Alabama; “New Madrid” includes Missouri, Tennessee, Arkansas, Illinois, Kentucky, Indiana, Ohio and Michigan; “Northwest” includes Washington and Oregon; “Western European” includes France, Belgium, Netherlands, Luxembourg, Germany, Switzerland and Austria; and “Scandinavia” includes Denmark, Norway and Sweden.
The treaty limits presented are shown net of any ceded reinsurance or other third-party protection we purchase but have not been reduced by any reinstatement premiums. The treaty limits include all business coded as property catastrophe reinsurance (including retrocessional business), property pro-rata reinsurance, workers compensation catastrophe reinsurance and event-linked derivative securities. The treaty limits also include those exposures we have assumed through our investments in BCRH and the BCGR Listed Fund, but exclude those exposures attributable to non-controlling interests. The treaty limits do not include individual risk business and other reinsurance classes.
For U.S. earthquake, the regional limits shown are for earthquake ground motion damage only, i.e., they exclude limits for contracts that do not specifically cover earthquake damage but may provide coverage for fire following an earthquake event. Contracts that provide coverage for multiple regions are included in the totals for each potentially exposed zone; therefore, the limits for a single multi-zone policy may be included within several different zone limits.
These treaty limits are a snapshot of our exposure as of January 1, 2015. As of that date, New Madrid earthquake represented our largest concentration of net reinsurance treaty limits among the selected zones. The relative comparison between zones and the absolute level of exposure may change materially at any time due to changes in the composition of our portfolio and changes in our ceded reinsurance program.
Single Event Losses
For certain defined natural catastrophe region and peril combinations, we assess the probability and likely magnitude of losses using a combination of industry third-party models, CATM® and underwriting judgment. We attempt to model the projected net impact from a single event, taking into account contributions from property catastrophe reinsurance (including retrocessional business), property pro-rata reinsurance, workers compensation catastrophe reinsurance, event-linked derivative securities and individual risk business, offset by the net benefit of any reinsurance or derivative protections we purchase and the benefit of reinstatement premiums.
50
Table of Contents
The projected single event net impact figures also include those single event exposures we have assumed through our investments in BCRH and the BCGR Listed Fund, but exclude those exposures attributable to non-controlling interests.
There is no single standard methodology or set of assumptions utilized industry-wide in estimating property catastrophe losses. As a result, it may be difficult to accurately compare estimates of risk exposure among different insurance and reinsurance companies, due to, among other things, underwriting judgment, differences in modeling, modeling assumptions, portfolio composition and concentrations, and selected event scenarios.
The table below details the projected net impact from single event losses as of January 1, 2015 for selected zones at selected return period levels using AIR Worldwide Corporation’s Touchstone 2.0 and CATRADER 16.0, both of which are industry-recognized third-party vendor models. It is important to note that each catastrophe model contains its own assumptions as to the frequency and severity of loss events, and results may vary significantly from model to model.
Since we utilize a combination of third-party models, CATM® and underwriting judgment to project the net impact from single event losses, our internal projections may be higher or lower than those presented in the table below.
Net Impact From Single Event Losses by Return Period (in years) (1)
|
|
|
Net Impact |
|
Percentage of December 31, 2014 |
|
|
|
|
(Millions) |
|
Shareholders’ Equity Available to the Company |
|
|
|
|
100-year |
|
250-year |
|
100-year |
|
250-year |
|
|
U.S. Hurricane |
|
$ |
263 |
|
$ |
313 |
|
16 |
% |
19 |
% |
|
European windstorm |
|
219 |
|
273 |
|
13 |
% |
17 |
% |
|
U.S. Earthquake |
|
158 |
|
259 |
|
10 |
% |
16 |
% |
|
|
|
|
|
|
|
|
|
|
|
|
(1) A “100-year” return period can also be referred to as the 1.0% occurrence exceedance probability (“OEP”), meaning there is a 1.0% chance in any given year that this level will be exceeded. A “250-year” return period can also be referred to as the 0.4% OEP, meaning there is a 0.4% chance in any given year that this level will be exceeded.
As of January 1, 2015, our three largest modeled exposures to a single event loss at a 250-year return period were U.S. Hurricane, European Windstorm and U.S. Earthquake.
Our projections of the net impact from single event losses may vary considerably within a particular territory depending on the specific characteristics of the event. This is particularly true for the direct insurance and facultative reinsurance portfolio we underwrite. For example, our projected net impact from a large European windstorm may differ materially depending on whether the majority of loss comes from the U.K. & Ireland or from Continental Europe.
Given the limited availability of reliable historical data, there is a great deal of uncertainty with regard to the accuracy of any catastrophe model, especially when contemplating longer return periods.
Our single event loss estimates represent snapshots as of January 1, 2015. The composition of our in-force portfolio may change materially at any time due to the acceptance of new policies, the expiration of existing policies, losses incurred and changes in our ceded reinsurance and derivative protections.
Annual Operating Result
In addition to monitoring treaty contract limits and single event accumulation potential, we attempt to simulate our annual operating result to reflect an aggregation of modeled underwriting, investment and other risks. This approach estimates a net operating result over simulated twelve month periods, including contributions from certain variables such as aggregate premiums, losses, expenses and investment results.
We view this approach as a supplement to our single event stress test as it allows for multiple losses from both natural catastrophe and other circumstances and attempts to take into account certain risks that are unrelated to our underwriting activities. Through our modeling, we endeavor to take into account many risks that we face as an enterprise. However, by the very nature of the insurance and reinsurance business, and due to limitations associated with the use of models in general, our simulated result does not cover every potential risk.
51
Table of Contents
Results of Operations
Our consolidated financial results for the years ended December 31, 2014, 2013 and 2012 follow:
|
|
|
Year Ended December 31, |
|
|
($ in millions) |
|
2014 |
|
2013 |
|
2012 |
|
|
|
|
|
|
|
|
|
|
|
Gross insurance and reinsurance premiums written |
|
$ |
740.3 |
|
$ |
706.0 |
|
$ |
735.3 |
|
|
Ceded reinsurance premiums |
|
(89.4 |
) |
(102.9 |
) |
(119.6 |
) |
|
Net insurance and reinsurance premiums written |
|
650.9 |
|
603.1 |
|
615.7 |
|
|
Change in net unearned insurance and reinsurance premiums |
|
(5.7 |
) |
(3.5 |
) |
0.8 |
|
|
Net insurance and reinsurance premiums earned |
|
645.2 |
|
599.6 |
|
616.5 |
|
|
|
|
|
|
|
|
|
|
|
Net investment income |
|
46.8 |
|
64.0 |
|
67.1 |
|
|
Net realized and unrealized investment gains (losses) |
|
5.4 |
|
(49.2 |
) |
82.4 |
|
|
Net foreign currency gains (losses) |
|
9.4 |
|
(15.9 |
) |
(12.8 |
) |
|
Net income (loss) from derivative instruments |
|
(18.6 |
) |
(25.3 |
) |
3.2 |
|
|
Other revenues |
|
2.9 |
|
0.4 |
|
0.8 |
|
|
Total revenues |
|
691.1 |
|
573.6 |
|
757.2 |
|
|
|
|
|
|
|
|
|
|
|
Underwriting expenses: |
|
|
|
|
|
|
|
|
Loss and LAE — current year losses |
|
(341.4 |
) |
(270.9 |
) |
(373.8 |
) |
|
Loss and LAE — prior year losses |
|
151.8 |
|
144.4 |
|
87.4 |
|
|
Insurance and reinsurance acquisition costs |
|
(110.2 |
) |
(90.5 |
) |
(96.6 |
) |
|
General and administrative expenses |
|
(123.7 |
) |
(119.2 |
) |
(116.2 |
) |
|
|
|
|
|
|
|
|
|
|
Non-underwriting expenses: |
|
|
|
|
|
|
|
|
Interest and other financing expenses |
|
(18.9 |
) |
(18.8 |
) |
(20.4 |
) |
|
Underwriting discount and structuring fees associated with the BCRH IPO |
|
— |
|
(7.5 |
) |
— |
|
|
Loss on early extinguishment of 2013 Senior Notes |
|
— |
|
— |
|
(9.7 |
) |
|
Other expenses |
|
(3.4 |
) |
(0.6 |
) |
— |
|
|
Total expenses |
|
(445.8 |
) |
(363.1 |
) |
(529.3 |
) |
|
|
|
|
|
|
|
|
|
|
Income before income taxes |
|
245.3 |
|
210.5 |
|
227.9 |
|
|
Income tax benefit (provision) |
|
2.7 |
|
0.1 |
|
(0.3 |
) |
|
|
|
|
|
|
|
|
|
|
Net income |
|
248.0 |
|
210.6 |
|
227.6 |
|
|
Net income attributable to non-controlling interests |
|
(24.1 |
) |
(6.1 |
) |
— |
|
|
|
|
|
|
|
|
|
|
|
Net income available to the Company |
|
223.9 |
|
204.5 |
|
227.6 |
|
|
Dividends declared on Preferred Shares |
|
(13.3 |
) |
(13.3 |
) |
(13.3 |
) |
|
|
|
|
|
|
|
|
|
|
Net income available to the Company’s common shareholders |
|
$ |
210.6 |
|
$ |
191.2 |
|
$ |
214.3 |
|
|
|
|
|
|
|
|
|
|
|
Net income |
|
$ |
248.0 |
|
$ |
210.6 |
|
$ |
227.6 |
|
|
Change in accumulated net foreign currency translation losses |
|
(2.4 |
) |
0.9 |
|
0.8 |
|
|
|
|
|
|
|
|
|
|
|
Comprehensive income |
|
245.6 |
|
211.5 |
|
228.4 |
|
|
Net income attributable to non-controlling interests |
|
(24.1 |
) |
(6.1 |
) |
— |
|
|
|
|
|
|
|
|
|
|
|
Comprehensive income available to the Company |
|
$ |
221.5 |
|
$ |
205.4 |
|
$ |
228.4 |
|
|
|
|
|
|
|
|
|
|
|
Loss and LAE ratio |
|
29.4 |
% |
21.1 |
% |
46.4 |
% |
|
Acquisition cost ratio |
|
17.1 |
% |
15.1 |
% |
15.7 |
% |
|
General and administrative expense ratio |
|
19.1 |
% |
19.9 |
% |
18.9 |
% |
|
|
|
|
|
|
|
|
|
|
GAAP combined ratio |
|
65.6 |
% |
56.1 |
% |
81.0 |
% |
52
Table of Contents
I. Review of Underwriting Results - by Segment
We currently operate through three reportable segments: Montpelier Bermuda, Montpelier at Lloyd’s and Collateralized Reinsurance. Each of our segments represents a separate underwriting platform through which we write insurance and reinsurance business. Our segment disclosures provided herein present the operations of each segment prior to the effects of intercompany quota share reinsurance agreements among them.
The activities of the Company, certain of its intermediate holding and service companies, the Company’s former MUSIC Run-Off segment and eliminations relating to intercompany reinsurance and support services, collectively referred to as “Corporate and Other”, are also presented herein.
MONTPELIER BERMUDA
Underwriting results for Montpelier Bermuda for the years ended December 31, 2014, 2013 and 2012 were as follows:
|
|
|
Year Ended December 31, |
|
|
($ in millions) |
|
2014 |
|
2013 |
|
2012 |
|
|
|
|
|
|
|
|
|
|
|
Gross premiums written |
|
$ |
416.4 |
|
$ |
429.4 |
|
$ |
480.5 |
|
|
Ceded reinsurance premiums |
|
(102.1 |
) |
(75.8 |
) |
(99.8 |
) |
|
Net premiums written |
|
314.3 |
|
353.6 |
|
380.7 |
|
|
Change in net unearned premiums |
|
1.6 |
|
5.6 |
|
(11.2 |
) |
|
Net premiums earned |
|
315.9 |
|
359.2 |
|
369.5 |
|
|
|
|
|
|
|
|
|
|
|
Loss and LAE - current year losses |
|
(148.2 |
) |
(123.7 |
) |
(205.4 |
) |
|
Loss and LAE - prior year losses |
|
125.2 |
|
106.7 |
|
45.9 |
|
|
Acquisition costs |
|
(37.1 |
) |
(34.4 |
) |
(40.5 |
) |
|
General and administrative expenses |
|
(38.7 |
) |
(39.3 |
) |
(44.2 |
) |
|
Underwriting income |
|
$ |
217.1 |
|
$ |
268.5 |
|
$ |
125.3 |
|
|
|
|
|
|
|
|
|
|
|
Loss and LAE ratio |
|
7.3 |
% |
4.7 |
% |
43.2 |
% |
|
Acquisition cost ratio |
|
11.7 |
% |
9.6 |
% |
11.0 |
% |
|
General and administrative expense ratio |
|
12.2 |
% |
11.0 |
% |
12.0 |
% |
|
GAAP combined ratio |
|
31.2 |
% |
25.3 |
% |
66.2 |
% |
Gross and Net Premiums Written
The following table summarizes Montpelier Bermuda’s premium writings, by line of business, for the years ended December 31, 2014, 2013 and 2012:
|
|
|
Year Ended December 31, |
|
|
($ in millions) |
|
2014 |
|
2013 |
|
2012 |
|
|
|
|
|
|
|
|
|
|
|
|
|
|
|
|
|
Property Catastrophe - Treaty |
|
$ |
256.1 |
|
62 |
% |
$ |
279.0 |
|
65 |
% |
$ |
332.8 |
|
69 |
% |
|
Property Specialty - Treaty |
|
54.0 |
|
13 |
|
50.3 |
|
12 |
|
47.5 |
|
10 |
|
|
Other Specialty - Treaty |
|
76.4 |
|
18 |
|
68.7 |
|
16 |
|
70.4 |
|
15 |
|
|
Property and Specialty Individual Risk |
|
29.9 |
|
7 |
|
31.4 |
|
7 |
|
29.8 |
|
6 |
|
|
|
|
|
|
|
|
|
|
|
|
|
|
|
|
|
Gross premiums written |
|
416.4 |
|
100 |
% |
429.4 |
|
100 |
% |
480.5 |
|
100 |
% |
|
Ceded reinsurance premiums |
|
(102.1 |
) |
|
|
(75.8 |
) |
|
|
(99.8 |
) |
|
|
|
Net premiums written |
|
$ |
314.3 |
|
|
|
$ |
353.6 |
|
|
|
$ |
380.7 |
|
|
|
Note - Montpelier Bermuda’s gross and net premiums written during the years presented include amounts assumed from Montpelier at Lloyd’s. Montpelier Bermuda’s reinsurance premiums ceded during 2014 includes amounts ceded to Collateralized Reinsurance. These inter-segment reinsurance agreements are eliminated in consolidation. See “Corporate and Other” under this Item 7.
Gross premiums written by Montpelier Bermuda during 2014 totaled $416.4 million, a decrease of $13.0 million, or 3%, as compared to 2013. This decrease was largely the result of pricing reductions in the Property Catastrophe - Treaty line of business, which led to decreased premiums on certain renewed contracts. Partially offsetting the 2014 decrease in gross premiums written by Montpelier Bermuda was a $7.7 million increase in Other Specialty - Treaty writings, which related primarily to financial risk and aviation classes of business.
53
Table of Contents
Gross premiums written by Montpelier Bermuda during 2013 totaled $429.4 million, a decrease of $51.1 million, or 11%, as compared to 2012. This decrease was largely the result of pricing reductions in the Property Catastrophe - Treaty line of business, which led to decreased premiums on certain renewed contracts. Also contributing to the decrease in Property Catastrophe - Treaty gross premiums written was a reduction in reinstatement premiums written in 2013 versus those written in 2012, due to the low level of catastrophe losses experienced in 2013.
Net premiums written and earned by Montpelier Bermuda in 2014, 2013 and 2012 included increases due to reinstatements of $6.3 million, $4.6 million and $10.5 million, respectively. The level of reinstatement premiums that Montpelier Bermuda recognizes in any given period is a function of the nature and extent of losses recognized in that period.
Reinsurance premiums ceded by Montpelier Bermuda in 2014, 2013 and 2012 were $102.1 million, $75.8 million and $99.8 million, respectively. Over the past few years, Montpelier Bermuda has established several underwriting partnerships (in the form of property catastrophe quota share reinsurance treaties) with various third parties and affiliates. These underwriting partnerships allow Montpelier Bermuda to: (i) write larger property catastrophe lines with preferred clients; (ii) recover a portion of its losses from events of all sizes, not just from those events that exceed a specified loss amount; and (iii) reduce its net acquisition costs. The increases in Montpelier Bermuda’s reinsurance premiums ceded from 2012 to 2014 was primarily the result of more Property Catastrophe - Treaty business being ceded on a pro-rata basis, both to third-parties and the Company’s Collateralized Reinsurance segment.
Montpelier Bermuda purchases reinsurance in the normal course of its business in order to manage its exposures. The amount and type of reinsurance that Montpelier Bermuda purchases is dependent on a variety of factors, including the cost of a particular reinsurance cover and the nature of its gross premiums written during a particular period. Other factors affect Montpelier Bermuda’s appetite and capacity to write and retain risk. These factors include the impact of changes in frequency and severity assumptions used in our models and the corresponding pricing required to meet our return targets, evolving industry-wide capital requirements, increased competition, market conditions and other considerations.
All of Montpelier Bermuda’s reinsurance purchases to date have represented prospective cover; that is, reinsurance has been purchased to protect Montpelier Bermuda against the risk of future losses as opposed to covering losses that have already occurred but have not been paid. Montpelier Bermuda purchases: (i) excess-of-loss reinsurance covering one or more lines of its business; (ii) quota share reinsurance with respect to specific lines of its business; and (iii) industry loss warranty policies which provide coverage for certain losses provided they are triggered by events exceeding a specified industry loss size.
Net Premiums Earned
Net premiums earned by Montpelier Bermuda in 2014, 2013 and 2012 were $315.9 million, $359.2 million and $369.5 million, respectively. Net premiums earned are primarily a function of the amount and timing of net premiums previously written.
Loss and LAE Reserve Movements
The following tables summarize Montpelier Bermuda’s loss and LAE reserve movements for the years ended December 31, 2014, 2013 and 2012, and the composition of its gross loss and LAE reserves at December 31, 2014 and 2013:
54
Table of Contents
|
|
|
Year Ended December 31, |
|
|
(Millions) |
|
2014 |
|
2013 |
|
2012 |
|
|
|
|
|
|
|
|
|
|
|
Gross unpaid loss and LAE reserves - beginning |
|
$ |
520.9 |
|
$ |
728.2 |
|
$ |
716.9 |
|
|
Reinsurance recoverable on unpaid losses - beginning |
|
(48.7 |
) |
(87.7 |
) |
(61.0 |
) |
|
Net unpaid loss and LAE reserves - beginning |
|
472.2 |
|
640.5 |
|
655.9 |
|
|
|
|
|
|
|
|
|
|
|
Losses and LAE incurred: |
|
|
|
|
|
|
|
|
Current year losses |
|
148.2 |
|
123.7 |
|
205.4 |
|
|
Prior year losses |
|
(125.2 |
) |
(106.7 |
) |
(45.9 |
) |
|
Total losses and LAE incurred |
|
23.0 |
|
17.0 |
|
159.5 |
|
|
|
|
|
|
|
|
|
|
|
Losses and LAE paid and approved for payment |
|
(131.7 |
) |
(185.3 |
) |
(174.9 |
) |
|
|
|
|
|
|
|
|
|
|
Net unpaid loss and LAE reserves - ending |
|
363.5 |
|
472.2 |
|
640.5 |
|
|
Reinsurance recoverable on unpaid losses - ending |
|
45.3 |
|
48.7 |
|
87.7 |
|
|
Gross unpaid loss and LAE reserves - ending (1) |
|
$ |
408.8 |
|
$ |
520.9 |
|
$ |
728.2 |
|
(1) Montpelier Bermuda’s ending gross unpaid loss and LAE reserves at December 31, 2014, 2013 and 2012 include losses assumed from Montpelier at Lloyd’s in the amount of $8.6 million, $8.4 million and $13.3 million, respectively, and amounts recoverable from Collateralized Reinsurance in the amount of $6.1 million, zero and zero, respectively. The effects of these inter-segment reinsurance contracts are eliminated in consolidation.
|
|
|
December 31, |
|
|
(Millions) |
|
2014 |
|
2013 |
|
|
|
|
|
|
|
|
|
Gross IBNR |
|
$ |
265.6 |
|
$ |
332.5 |
|
|
Gross Case Reserves |
|
143.2 |
|
188.4 |
|
|
Gross unpaid loss and LAE reserves |
|
$ |
408.8 |
|
$ |
520.9 |
|
Our best estimates of Montpelier Bermuda’s ending gross loss and LAE reserves at December 31, 2014 and 2013 were $408.8 million and $520.9 million, respectively. Montpelier Bermuda’s gross IBNR reserves, as a percentage of its total gross reserves, amounted to 65% and 64% as of December 31, 2014 and 2013, respectively.
We estimated Montpelier Bermuda’s gross and net loss and LAE reserves using the methodology outlined in our “Summary of Critical Accounting Policies and Estimates” contained in Item 7 herein. We did not make any significant changes in the assumptions or methodology used in Montpelier Bermuda’s reserving process during each of the years ended December 31, 2014 and 2013.
The following table presents Montpelier Bermuda’s net loss and LAE ratios for the years ended December 31, 2014, 2013 and 2012:
|
|
|
Year Ended December 31, |
|
|
|
|
2014 |
|
2013 |
|
2012 |
|
|
|
|
|
|
|
|
|
|
|
Loss and LAE ratio - current year |
|
46.9 |
% |
34.4 |
% |
55.6 |
% |
|
Loss and LAE ratio - prior year |
|
(39.6 |
)% |
(29.7 |
)% |
(12.4 |
)% |
|
Loss and LAE ratio |
|
7.3 |
% |
4.7 |
% |
43.2 |
% |
Current Year Loss and LAE
During 2014 Montpelier Bermuda incurred $148.2 million in current year net losses and LAE. There were no individually significant known loss events impacting Montpelier Bermuda during 2014, other than $29.7 million of net catastrophe losses recognized in connection with U.S. and European wind and hail storms that occurred in June 2014.
During 2013 Montpelier Bermuda incurred $123.7 million in current year net losses and LAE. There were no individually significant known loss events impacting Montpelier Bermuda during 2013, other than $17.5 million of net catastrophe losses incurred from flooding in Europe and Canada, and U.S. tornadoes.
55
Table of Contents
During 2012 Montpelier Bermuda incurred $205.4 million in current year net losses and LAE. There were no individually significant known loss events impacting Montpelier Bermuda during 2012, other than an $85.0 million net catastrophe loss associated with windstorm Sandy.
Prior Year Loss and LAE Development
During 2014 Montpelier Bermuda experienced $125.2 million in net favorable development on prior year loss and LAE reserves, which included loss reserve movements associated with:
· 2012 and prior IBNR reductions associated with medical malpractice business ($14.3 million decrease),
· 2011 and 2010 New Zealand earthquakes ($12.1 million decrease),
· 2005 hurricanes ($6.6 million decrease),
· 2012 windstorm Sandy ($5.9 million decrease),
· 2011 Japanese earthquake ($4.9 million decrease),
· 2010 flooding in Portugal ($4.8 million decrease),
· 2011 Thai floods ($2.9 million decrease),
· 2013 U.S. crop losses ($2.9 million decrease),
· 2010 Chilean earthquake ($2.0 million decrease),
· 2008 Hurricane Gustav ($2.2 million decrease), and
· 2012 Italian earthquake ($1.4 million decrease).
In addition, claims reported to Montpelier Bermuda during 2014 indicated that IBNR for natural catastrophe losses initially recorded during 2013 (excluding the U.S. crop losses noted above) exceeded the extent of losses that actually occurred, and consequently Montpelier decreased its loss and LAE reserves by $21.6 million.
During 2013 Montpelier Bermuda experienced $106.7 million in net favorable development on prior year loss and LAE reserves, which included loss reserve movements associated with:
· 2011 Japan earthquake ($10.1 million decrease),
· 2012 windstorm Sandy ($9.1 million decrease)
· Casualty IBNR (excluding medical malpractice) recorded over several prior years ($8.4 million decrease),
· IBNR reductions associated with medical malpractice business ($7.3 million decrease),
· the settlement of several claims which occurred in 2007, 2010 and 2011 within the Property and Specialty Individual Risk line of business ($7.2 million decrease),
· 2011 catastrophes, excluding the Japan earthquake ($6.6 million decrease),
· 2004 and 2005 Hurricanes ($6.2 million decrease), and
· a settlement associated with the 2010 Deepwater Horizon oil rig explosion and fire ($5.6 million decrease).
In addition, claims reported to Montpelier Bermuda during 2013 indicated that IBNR for natural catastrophe and individual risk losses initially recorded during 2012 (other than those included in the foregoing) exceeded the extent of losses that actually occurred. Consequently Montpelier Bermuda decreased its loss and LAE reserves by a further $28.4 million and $4.1 million, respectively, for these classes of business.
During 2012 Montpelier Bermuda experienced $45.9 million in net favorable development on prior year loss and LAE reserves, which included loss reserve movements associated with:
· 2011 catastrophe losses relating to the Japanese earthquake, Thai floods, Hurricane Irene and other events ($34.1 million decrease), and
· 2011 and prior medical malpractice contracts ($4.2 million decrease).
The remaining net favorable development on prior year loss reserves recognized during 2014, 2013 and 2012 related to several smaller adjustments made across multiple classes of business.
The prior year loss and LAE development recorded by Montpelier Bermuda in each of the periods presented associated with natural catastrophes such as earthquakes, hurricanes, wildfires, floods and windstorms was the result of new information received from multiple cedants and information regarding the impact of such losses on the entire reinsurance market.
56
Table of Contents
Impact of Foreign Currency Transaction Gains and Losses on Prior Year Loss and LAE Reserves
Montpelier Bermuda’s prior year losses and LAE incurred also includes foreign currency transaction gains (losses) relating to its prior year loss and LAE reserves of $1.3 million, $3.8 million and $(1.3) million during 2014, 2013 and 2012, respectively. Since these foreign currency transaction gains (losses) are reported as decreases (increases) in Montpelier Bermuda’s losses and LAE incurred, they have a direct impact on its underwriting results and its underwriting ratios.
Underwriting Expenses
The following table summarizes Montpelier Bermuda’s underwriting expenses during the years ended December 31, 2014, 2013 and 2012:
|
|
|
Year Ended December 31, |
|
|
($ in millions) |
|
2014 |
|
2013 |
|
2012 |
|
|
|
|
|
|
|
|
|
|
|
Acquisition costs |
|
$ |
37.1 |
|
$ |
34.4 |
|
$ |
40.5 |
|
|
Acquisition cost ratio |
|
11.7 |
% |
9.6 |
% |
11.0 |
% |
|
General and administrative expenses |
|
$ |
38.7 |
|
$ |
39.3 |
|
$ |
44.2 |
|
|
General and administrative expense ratio |
|
12.2 |
% |
11.0 |
% |
12.0 |
% |
Acquisition costs include commissions, profit commissions, brokerage costs and excise taxes, when applicable. Profit commissions and brokerage costs can vary based on the nature of business produced.
Profit commissions, which are accrued based on the estimated results of the subject contract, change as Montpelier Bermuda’s estimates of loss and LAE fluctuate. Montpelier Bermuda pays profit commissions on certain assumed reinsurance contracts, and receives profit commissions on certain ceded reinsurance contracts. Only a few of Montpelier Bermuda’s assumed and ceded reinsurance contracts contain profit commission clauses, and the terms of these profit commissions are specific to the individual contracts and vary as a percentage of the contract results.
During 2014, 2013 and 2012, the profit commissions earned by Montpelier Bermuda in connection with its ceded reinsurance contracts exceeded the profit commissions it incurred in connection with its assumed reinsurance contracts by $3.4 million, $9.0 million and $4.0 million, respectively. The decrease in net profit commissions earned by Montpelier Bermuda from 2013 to 2014, as well as the resulting increase in its acquisition cost ratio for 2014, is primarily the result of an increase in current year Property Catastrophe - Treaty losses ceded to Montpelier Bermuda’s various underwriting partners, including the Collateralized Reinsurance segment, which resulted from the aforementioned U.S. and European wind and hail storms that occurred in June 2014.
All other acquisition costs are generally driven by contract terms and are normally a set percentage of gross premiums written. Such acquisition costs consist of commission expenses incurred on assumed business less commission revenue earned on purchased reinsurance covers. Commission revenue on purchased reinsurance covers is earned over the same period that the corresponding premiums are expensed.
The following table summarizes Montpelier Bermuda’s general and administrative expenses during the years ended December 31, 2014, 2013 and 2012:
|
|
|
Year Ended December 31, |
|
|
(Millions) |
|
2014 |
|
2013 |
|
2012 |
|
|
|
|
|
|
|
|
|
|
|
Operating expenses |
|
$ |
25.6 |
|
$ |
27.9 |
|
$ |
30.9 |
|
|
Incentive compensation expenses |
|
13.1 |
|
11.4 |
|
13.3 |
|
|
General and administrative expenses |
|
$ |
38.7 |
|
$ |
39.3 |
|
$ |
44.2 |
|
Montpelier Bermuda’s operating expenses have decreased during the periods presented primarily as a result of reductions in information technology costs and a re-allocation of certain risk management expenses from Montpelier Bermuda to Corporate and Other. This re-allocation was made in response to an increase in the Company’s group-wide risk management activities, including Solvency II and related initiatives.
57
Table of Contents
Incentive compensation expenses recorded at Montpelier Bermuda consist of two independent components. The first component represents amounts that are not, or are no longer, dependent on Company performance, and consist of: (i) Fixed RSUs and Variable RSUs granted in prior years that have been effectively converted to Fixed RSUs; and (ii) the portion of annual employee cash bonuses that is based on individual employee performance goals. The second component represents amounts that are entirely dependent on Company performance and consist of: (i) Variable RSUs in the Initial RSU Period; and (ii) the portion of annual employee cash bonuses that is based on Company performance.
Montpelier Bermuda’s incentive compensation expenses incurred during 2014 increased versus those of 2013 primarily as a result of: (i) its 2014 accruals reflecting a higher projected payout level than that of the prior year; and (ii) a greater number of Fixed RSUs outstanding during 2014. The decrease in Montpelier Bermuda’s incentive compensation expenses during 2013, versus those of 2012, was primarily the result of its 2013 accruals reflecting a lower projected payout level than those of the prior year. See Note 9 of the Notes to Consolidated Financial Statements.
MONTPELIER AT LLOYD’S
Underwriting results for Montpelier at Lloyd’s for the years ended December 31, 2014, 2013 and 2012 were as follows:
|
|
|
Year Ended December 31, |
|
|
($ in millions) |
|
2014 |
|
2013 |
|
2012 |
|
|
|
|
|
|
|
|
|
|
|
Gross premiums written |
|
$ |
273.0 |
|
$ |
235.2 |
|
$ |
246.0 |
|
|
Ceded reinsurance premiums |
|
(19.7 |
) |
(23.0 |
) |
(15.9 |
) |
|
Net premiums written |
|
253.3 |
|
212.2 |
|
230.1 |
|
|
Change in net unearned premiums |
|
(8.5 |
) |
1.5 |
|
(12.8 |
) |
|
Net premiums earned |
|
244.8 |
|
213.7 |
|
217.3 |
|
|
|
|
|
|
|
|
|
|
|
Loss and LAE - current year losses |
|
(169.8 |
) |
(145.0 |
) |
(148.6 |
) |
|
Loss and LAE - prior year losses |
|
27.5 |
|
39.1 |
|
41.0 |
|
|
Acquisition costs |
|
(59.9 |
) |
(52.6 |
) |
(46.6 |
) |
|
General and administrative expenses |
|
(39.8 |
) |
(36.5 |
) |
(38.2 |
) |
|
Underwriting income |
|
$ |
2.8 |
|
$ |
18.7 |
|
$ |
24.9 |
|
|
|
|
|
|
|
|
|
|
|
Loss and LAE ratio |
|
58.1 |
% |
49.6 |
% |
49.5 |
% |
|
Acquisition cost ratio |
|
24.5 |
% |
24.6 |
% |
21.4 |
% |
|
General and administrative expense ratio |
|
16.2 |
% |
17.1 |
% |
17.6 |
% |
|
GAAP combined ratio |
|
98.8 |
% |
91.3 |
% |
88.5 |
% |
Gross and Net Premiums Written
The following table summarizes Montpelier at Lloyd’s premium writings, by line of business, for the years ended December 31, 2014, 2013 and 2012:
|
|
|
Year Ended December 31, |
|
|
($ in millions) |
|
2014 |
|
2013 |
|
2012 |
|
|
|
|
|
|
|
|
|
|
|
|
|
|
|
|
|
Property Catastrophe - Treaty |
|
$ |
3.4 |
|
1 |
% |
$ |
4.7 |
|
2 |
% |
$ |
10.9 |
|
4 |
% |
|
Property Specialty - Treaty |
|
3.8 |
|
2 |
|
4.3 |
|
2 |
|
6.1 |
|
3 |
|
|
Other Specialty - Treaty |
|
93.2 |
|
34 |
|
78.3 |
|
33 |
|
82.1 |
|
33 |
|
|
Property and Specialty Individual Risk |
|
172.6 |
|
63 |
|
147.9 |
|
63 |
|
146.9 |
|
60 |
|
|
|
|
|
|
|
|
|
|
|
|
|
|
|
|
|
Gross premiums written |
|
273.0 |
|
100 |
% |
235.2 |
|
100 |
% |
246.0 |
|
100 |
% |
|
Ceded reinsurance premiums |
|
(19.7 |
) |
|
|
(23.0 |
) |
|
|
(15.9 |
) |
|
|
|
Net premiums written |
|
$ |
253.3 |
|
|
|
$ |
212.2 |
|
|
|
$ |
230.1 |
|
|
|
Note - Montpelier at Lloyd’s reinsurance premiums ceded during the years presented include amounts ceded to Montpelier Bermuda’s pursuant to inter-segment reinsurance agreements are eliminated in consolidation. See “Corporate and Other” under this Item 7.
Gross premiums written by Montpelier at Lloyd’s during 2014 totaled $273.0 million, an increase of $37.8 million, or 16%, as compared to 2013. The increase, which was mainly within the Other Specialty - Treaty and Property and Specialty Individual Risk lines of business, was primarily the result of an expansion of Montpelier at Lloyd’s direct property and casualty quota-share classes of business.
58
Table of Contents
Gross premiums written by Montpelier at Lloyd’s during 2013 totaled $235.2 million, a decrease of $10.8 million, or 4%, as compared to 2012. The largest decrease was within the Property Catastrophe - Treaty line of business, resulting from rate decreases and planned reductions in net catastrophe exposures.
Net premiums written and earned by Montpelier at Lloyd’s in 2014, 2013 and 2012 include net increases (reductions) due to reinstatements of $2.0 million, $(3.4) million and $2.6 million, respectively. The negative reinstatement premiums recognized during 2013 resulted from an increase in reinsurance recoveries associated with the 2012 Costa Concordia accident (which resulted in ceded reinstatement premiums). The level of reinstatement premiums that Montpelier at Lloyd’s may realize in future periods will be dependent upon the occurrence of future losses.
Montpelier at Lloyd’s purchases reinsurance in the normal course of its business in order to manage its exposures. The amount and type of reinsurance that Montpelier at Lloyd’s purchases is dependent on a variety of factors, including the cost of a particular reinsurance cover and the nature of its gross premiums written during a particular period. Other factors affect Montpelier at Lloyd’s appetite and capacity to write and retain risk. These include the impact of changes in frequency and severity assumptions used in our models and the corresponding pricing required to meet our return targets, evolving industry-wide capital requirements, increased competition, market conditions and other considerations.
All of Montpelier at Lloyd’s reinsurance purchases to date have represented prospective cover; that is, reinsurance has been purchased to protect Montpelier at Lloyd’s against the risk of future losses as opposed to covering losses that have already occurred but have not been paid. Montpelier at Lloyd’s purchases: (i) excess-of-loss reinsurance covering one or more lines of its business; and (ii) quota share reinsurance with respect to specific lines of its business.
Net Premiums Earned
Net premiums earned by Montpelier at Lloyd’s in 2014, 2013 and 2012 were $244.8 million, $213.7 million and $217.3 million, respectively. Net premiums earned are primarily a function of the amount and timing of net premiums previously written.
Loss and LAE Reserve Movements
The following tables summarize Montpelier at Lloyd’s loss and LAE reserve movements for the years ended December 31, 2014, 2013 and 2012, and the composition of its gross loss and LAE reserves at December 31, 2014 and 2013:
|
|
|
Year Ended December 31, |
|
|
(Millions) |
|
2014 |
|
2013 |
|
2012 |
|
|
|
|
|
|
|
|
|
|
|
Gross unpaid loss and LAE reserves - beginning |
|
$ |
337.3 |
|
$ |
354.0 |
|
$ |
341.6 |
|
|
Reinsurance recoverable on unpaid losses - beginning |
|
(23.3 |
) |
(28.3 |
) |
(36.4 |
) |
|
Net unpaid loss and LAE reserves - beginning |
|
314.0 |
|
325.7 |
|
305.2 |
|
|
|
|
|
|
|
|
|
|
|
Losses and LAE incurred: |
|
|
|
|
|
|
|
|
Current year losses |
|
169.8 |
|
145.0 |
|
148.6 |
|
|
Prior year losses |
|
(27.5 |
) |
(39.1 |
) |
(41.0 |
) |
|
Total losses and LAE incurred |
|
142.3 |
|
105.9 |
|
107.6 |
|
|
|
|
|
|
|
|
|
|
|
Net foreign currency translation movements on loss and LAE |
|
(22.2 |
) |
6.1 |
|
12.0 |
|
|
|
|
|
|
|
|
|
|
|
Losses and LAE paid and approved for payment |
|
(102.4 |
) |
(123.7 |
) |
(99.1 |
) |
|
|
|
|
|
|
|
|
|
|
Net unpaid loss and LAE reserves - ending |
|
331.7 |
|
314.0 |
|
325.7 |
|
|
Reinsurance recoverable on unpaid losses - ending |
|
18.1 |
|
23.3 |
|
28.3 |
|
|
Gross unpaid loss and LAE reserves - ending (1) |
|
$ |
349.8 |
|
$ |
337.3 |
|
$ |
354.0 |
|
(1) Montpelier at Lloyd’s ending gross unpaid loss and LAE reserves at December 31, 2014, 2013 and 2012 includes recoverables from Montpelier Bermuda of $8.6 million, $8.4 million and $13.3 million, respectively. The effects of these inter-segment reinsurance contracts are eliminated in consolidation.
59
Table of Contents
|
|
|
December 31, |
|
|
(Millions) |
|
2014 |
|
2013 |
|
|
|
|
|
|
|
|
|
Gross IBNR |
|
$ |
197.5 |
|
$ |
198.4 |
|
|
Gross Case Reserves |
|
152.3 |
|
138.9 |
|
|
Gross unpaid loss and LAE reserves |
|
$ |
349.8 |
|
$ |
337.3 |
|
Our best estimates of Montpelier at Lloyd’s ending gross loss and LAE reserves at December 31, 2014 and 2013 were $349.8 and $337.3 million, respectively. Montpelier at Lloyd’s gross IBNR reserves, as a percentage of its total gross reserves, amounted to 56% and 59% as of December 31, 2014 and 2013, respectively.
We estimated Montpelier at Lloyd’s loss and LAE reserves using the methodology outlined in our “Summary of Critical Accounting Policies and Estimates” contained in Item 7 herein. We did not make any significant changes in the assumptions or methodology used in Montpelier at Lloyd’s reserving process during each of the years ended December 31, 2014 and 2013.
The following table presents Montpelier at Lloyd’s net loss and LAE ratios for the years ended December 31, 2014, 2013 and 2012:
|
|
|
Year Ended December 31, |
|
|
|
|
2014 |
|
2013 |
|
2012 |
|
|
|
|
|
|
|
|
|
|
|
Loss and LAE ratio - current year |
|
69.3 |
% |
67.9 |
% |
68.4 |
% |
|
Loss and LAE ratio - prior year |
|
(11.2 |
)% |
(18.3 |
)% |
(18.9 |
)% |
|
Loss and LAE ratio |
|
58.1 |
% |
49.6 |
% |
49.5 |
% |
Current Year Loss and LAE
During 2014 and 2013 Montpelier at Lloyd’s incurred $169.8 million and $145.0 million, respectively, of current year net losses and LAE. There were no individually significant known catastrophe loss events affecting Montpelier at Lloyd’s during those years as most of the current year loss and LAE incurred related to claims and events that had been incurred during those years but had not yet been reported to us.
During 2012 Montpelier at Lloyd’s incurred $148.6 million of current year net losses and LAE. There were no individually significant known loss events impacting Montpelier at Lloyd’s during 2012, other than a $17.8 million net catastrophe loss associated with windstorm Sandy. Most of the remaining current year loss and LAE incurred during 2012 related to claims and events that had been incurred during that year but had not yet been reported to us.
Prior Year Loss and LAE Development
During 2014 Montpelier at Lloyd’s experienced $27.5 million in net favorable development on prior year loss and LAE reserves, which included loss reserve movements associated with:
· 2011 Thai floods ($7.9 million decrease),
· 2012 windstorm Sandy ($1.4 million decrease), and
· 2011 Japanese earthquake ($1.2 million decrease).
In addition, claims reported to Montpelier at Lloyd’s during 2014 indicated that IBNR for natural catastrophe losses it initially recorded during 2013 exceeded the extent of losses that actually occurred, and, consequently, Montpelier at Lloyd’s decreased its loss and LAE reserves by $6.6 million.
During 2013 Montpelier at Lloyd’s experienced $39.1 million in net favorable development on prior year loss and LAE reserves, which included loss reserve movements associated with:
· 2012 non-catastrophe individual risk losses ($12.4 million decrease),
· 2011 non-catastrophe individual risk losses ($11.0 million decrease), and
· 2012 natural catastrophes ($4.1 million decrease, which is net of a $3.0 million increase in connection with windstorm Sandy).
Table of Contents
During 2012 Montpelier at Lloyd’s experienced $41.0 million in net favorable development on prior year loss and LAE reserves, which included loss reserve movements associated with:
· 2011 catastrophe losses relating to Thai floods and other events ($16.9 million decrease), and
· three individual risk losses incurred at Montpelier at Lloyd’s during 2008 and 2011 ($5.3 million decrease).
In addition to the loss reserve movements referred to above, Montpelier at Lloyd’s prior year loss development also related to movements associated with reserves established in prior years in order to provide for claims and events that had been incurred in that year but had not yet been reported to us. These reserves were originally recorded by Montpelier at Lloyd’s largely on the basis of historical loss rates, industry data and actuarial judgment and experience as opposed to information received from cedants, brokers and other customers. As prior underwriting years have matured, Montpelier at Lloyd’s has increased its reliance on the loss data it has received and, as a result, has adjusted its estimates of ultimate losses accordingly.
Impact of Foreign Currency Transaction Gains and Losses on Prior Year Loss and LAE Reserves
Montpelier at Lloyd’s prior year losses and LAE incurred also includes foreign currency transaction gains (losses) relating to its prior year loss and LAE reserves of $(5.3) million, $(1.4) million and $5.3 million during 2014, 2013 and 2012, respectively. Since these foreign currency transaction gains (losses) are reported as decreases (increases) in Montpelier at Lloyd’s losses and LAE incurred, they have a direct impact on its underwriting results and its underwriting ratios.
For the year ended December 31, 2014, Montpelier at Lloyd’s loss and LAE ratio of 58.1% (as well as its combined ratio of 98.8%) included a 2.2 percentage point detriment relating to net foreign currency transaction losses on its prior year loss and LAE reserves. For the year ended December 31, 2013, Montpelier at Lloyd’s loss and LAE ratio of 49.6% (as well as its combined ratio of 91.3%) included a 0.7 percentage point detriment relating to net foreign currency transaction losses on its prior year loss and LAE reserves. For the year ended December 31, 2012, Montpelier at Lloyd’s loss and LAE ratio of 49.5% (as well as its combined ratio of 88.5%) included a 2.4 percentage point benefit relating to net foreign currency transaction gains on its prior year loss and LAE reserves.
Since a significant portion of Montpelier at Lloyd’s loss and LAE reserves are denominated in U.S. dollars, changes in the value of the British pound (Montpelier at Lloyd’s functional currency) relative to the U.S. dollar generate foreign currency transaction gains or losses within its losses and LAE incurred upon the conversion of these U.S. dollar-denominated liabilities to British pounds. However, the subsequent translation of these liabilities back into U.S. dollars in consolidation generates substantially offsetting foreign currency translation gains and losses, which are recorded as part of comprehensive income. Therefore, in periods in which there are meaningful movements in the relative value of the British pound versus the U.S. dollar, which was the case in 2014 and 2012, the resulting impact to Montpelier at Lloyd’s losses and LAE incurred (as well as its loss and LAE and combined ratios) can significantly impact its reported underwriting performance without necessarily impacting the Company’s comprehensive income or shareholders’ equity.
Impact of Foreign Currency Translation Gains and Losses on Loss and LAE Reserves
Montpelier at Lloyd’s loss and LAE reserves include foreign currency translation gains (losses) of $22.2 million, $(6.1) million and $(12.0) million during 2014, 2013 and 2012, respectively. Since these foreign currency translation gains (losses) are reported as decreases (increases) in Montpelier at Lloyd’s net change in foreign currency translation, which is a component of its comprehensive income or loss, they have no impact on its underwriting results or its underwriting ratios.
Underwriting Expenses
The following table summarizes Montpelier at Lloyd’s underwriting expenses for the years ended December 31, 2014, 2013 and 2012:
|
|
|
Year Ended December 31, |
|
|
($ in millions) |
|
2014 |
|
2013 |
|
2012 |
|
|
|
|
|
|
|
|
|
|
|
Acquisition costs |
|
$ |
59.9 |
|
$ |
52.6 |
|
$ |
46.6 |
|
|
Acquisition cost ratio |
|
24.5 |
% |
24.6 |
% |
21.4 |
% |
|
General and administrative expenses |
|
$ |
39.8 |
|
$ |
36.5 |
|
$ |
38.2 |
|
|
General and administrative expense ratio |
|
16.2 |
% |
17.1 |
% |
17.6 |
% |
Table of Contents
Acquisition costs include commissions, profit commissions, brokerage costs and excise taxes, when applicable. Profit commissions and brokerage costs can vary based on the nature of business produced. Commissions earned by Montpelier at Lloyd’s from business that it cedes to reinsurers are recorded as reductions in its acquisition costs.
Profit commissions, which are paid by assuming companies to ceding companies in the event of a favorable loss experience, change as Montpelier at Lloyd’s estimates of loss and LAE fluctuate and are accrued based on the estimated results of the subject contract. Profit commissions incurred were less than $0.1 million, $3.4 million and $1.1 million during 2014, 2013 and 2012, respectively.
All other acquisition costs incurred by Montpelier at Lloyd’s are generally driven by contract terms and are normally a set percentage of gross premiums written. Such acquisition costs consist of commission expenses incurred on assumed business and commission revenue earned on purchased reinsurance covers, all of which is earned over the same period that the corresponding premiums are expensed.
Excluding the effects of profit commissions, Montpelier at Lloyd’s acquisition costs and acquisition cost ratios have increased from 2012 to 2014, primarily as a result of changes in the mix of the business it writes. Montpelier at Lloyd’s marine, pro-rata engineering and casualty writings, which have increased during such periods, are typically written at a higher acquisition cost ratio than most other classes of business written by Montpelier at Lloyd’s.
The following table summarizes Montpelier at Lloyd’s general and administrative expenses during the years ended December 31, 2014, 2013 and 2012:
|
|
|
Year Ended December 31, |
|
|
(Millions) |
|
2014 |
|
2013 |
|
2012 |
|
|
|
|
|
|
|
|
|
|
|
Operating expenses |
|
$ |
27.2 |
|
$ |
26.7 |
|
$ |
28.5 |
|
|
Incentive compensation expenses |
|
12.6 |
|
9.8 |
|
9.7 |
|
|
General and administrative expenses |
|
$ |
39.8 |
|
$ |
36.5 |
|
$ |
38.2 |
|
Montpelier at Lloyd’s operating expenses incurred during 2014 were largely consistent with those of 2013. Montpelier at Lloyd’s operating expenses incurred during 2013 decreased, versus those incurred during 2012, due primarily to a non-recurring third-party management fee recorded in 2012.
Incentive compensation expenses recorded at Montpelier at Lloyd’s consist of two independent components. The first component represents amounts that are not, or are no longer, dependent on Company performance, and consist of: (i) Fixed RSUs and Variable RSUs granted in prior years that have been effectively converted to Fixed RSUs; and (ii) the portion of annual employee cash bonuses that is based on individual employee performance goals. The second component represents amounts that are entirely dependent on Company performance and consist of: (i) Variable RSUs in the Initial RSU Period; and (ii) the portion of annual employee cash bonuses that is based on Company performance.
Montpelier at Lloyd’s incentive compensation expenses incurred during 2014 increased versus those of 2013 as a result of an increase in personnel who are eligible to receive RSU awards, as well as its 2014 accruals being recorded at a higher projected payout level than that of the prior year. The increase in Montpelier at Lloyd’s incentive compensation expenses during 2013, versus those of 2012, was primarily the result of additional incentive compensation costs associated with new personnel, which more than offset the benefit of its 2013 accruals being provided at a lower projected payout level than that of the prior year. See Note 9 of the Notes to Consolidated Financial Statements.
62
Table of Contents
COLLATERALIZED REINSURANCE
Underwriting results for the Collateralized Reinsurance segment, which we launched in 2012, were as follows for the years ended December 31, 2014, 2013 and 2012:
|
|
|
Year Ended December 31, |
|
|
($ in millions) |
|
2014 |
|
2013 |
|
2012 |
|
|
|
|
|
|
|
|
|
|
|
Gross premiums written |
|
$ |
83.4 |
|
$ |
39.8 |
|
$ |
2.4 |
|
|
Ceded reinsurance premiums |
|
— |
|
(3.0 |
) |
— |
|
|
Net premiums written |
|
83.4 |
|
36.8 |
|
2.4 |
|
|
Change in net unearned premiums |
|
1.2 |
|
(10.6 |
) |
— |
|
|
Net premiums earned |
|
84.6 |
|
26.2 |
|
2.4 |
|
|
|
|
|
|
|
|
|
|
|
Loss and LAE - current year losses |
|
(23.4 |
) |
(2.2 |
) |
— |
|
|
Loss and LAE - prior year losses |
|
0.2 |
|
— |
|
— |
|
|
Acquisition costs |
|
(13.2 |
) |
(3.2 |
) |
(0.1 |
) |
|
General and administrative expenses |
|
(7.3 |
) |
(3.5 |
) |
(1.7 |
) |
|
Underwriting income |
|
$ |
40.9 |
|
$ |
17.3 |
|
$ |
0.6 |
|
|
|
|
|
|
|
|
|
|
|
Loss and LAE ratio |
|
27.4 |
% |
8.4 |
% |
— |
% |
|
Acquisition cost ratio |
|
15.6 |
% |
12.2 |
% |
4.2 |
% |
|
General and administrative expense ratio |
|
8.7 |
% |
13.4 |
% |
70.9 |
% |
|
GAAP combined ratio |
|
51.7 |
% |
34.0 |
% |
75.1 |
% |
Since the commencement of its operations in June 2012, the Collateralized Reinsurance segment has assumed natural catastrophe exposures from third-parties and Montpelier Re (pursuant to inter-segment reinsurance arrangements), all of which is reflected within the Property Catastrophe - Treaty line of business.
Gross and Net Premiums Written
Gross premiums written by the Collateralized Reinsurance segment totaled $83.4 million, $39.8 million and $2.4 million during the years ended December 31, 2014, 2013 and 2012, respectively. The significant increases in gross premiums written within Collateralized Reinsurance during the periods presented reflect: (i) additional capital being deployed into Blue Water Re by the BCGR Listed Fund; and (ii) the operations of Blue Capital Re, which commenced operations in November 2013, but did not write any reinsurance premiums during that year.
Net reinstatement premiums earned within the Collateralized Reinsurance segment were not significant in any of the periods presented. The level of reinstatement premiums that the Collateralized Reinsurance segment may realize in future periods will be dependent upon the occurrence of future losses; however, any such reinstatement premiums are not expected to be material.
During 2014, 2013 and 2012 the Collateralized Reinsurance segment ceded zero, $3.0 million and zero of its premiums to third-party reinsurers, respectively. The Collateralized Reinsurance segment purchases reinsurance in the normal course of its business in order to manage its exposures. The amount and type of reinsurance that the Collateralized Reinsurance segment purchases is dependent on a variety of factors, including the cost of a particular reinsurance cover and the nature of its gross premiums written during a particular period. Other factors affect the Collateralized Reinsurance segment’s appetite and capacity to write and retain risk. These include the impact of changes in frequency and severity assumptions used in our models and the corresponding pricing required to meet our return targets, evolving industry-wide capital requirements, increased competition, market conditions and other considerations.
Net Premiums Earned
Net premiums earned at the Collateralized Reinsurance segment during the years ended December 31, 2014, 2013 and 2012 were $84.6 million, $26.2 million and $2.4 million, respectively. Premiums earned are primarily a function of the amount and timing of net premiums previously written.
Loss and LAE Reserve Movements
The following tables summarize the Collateralized Reinsurance segment’s loss and LAE reserve movements for the years ended December 31, 2014, 2013 and 2012, and the composition of its gross loss and LAE reserves at December 31, 2014 and 2013:
63
Table of Contents
|
|
|
Year Ended December 31, |
|
|
(Millions) |
|
2014 |
|
2013 |
|
2012 |
|
|
|
|
|
|
|
|
|
|
|
Gross and net unpaid loss and LAE reserves - beginning |
|
$ |
0.6 |
|
$ |
— |
|
$ |
— |
|
|
|
|
|
|
|
|
|
|
|
Losses and LAE incurred: |
|
|
|
|
|
|
|
|
Current year losses |
|
23.4 |
|
2.2 |
|
— |
|
|
Prior year losses |
|
(0.2 |
) |
— |
|
— |
|
|
Total losses and LAE incurred |
|
23.2 |
|
2.2 |
|
— |
|
|
|
|
|
|
|
|
|
|
|
Losses and LAE paid and approved for payment |
|
(11.3 |
) |
(1.6 |
) |
— |
|
|
|
|
|
|
|
|
|
|
|
Gross and net unpaid loss and LAE reserves - ending |
|
$ |
12.5 |
|
$ |
0.6 |
|
$ |
— |
|
|
|
|
December 31, |
|
|
(Millions) |
|
2014 |
|
2013 |
|
|
|
|
|
|
|
|
|
|
|
Gross IBNR |
|
$ |
7.5 |
|
$ |
0.2 |
|
|
Gross Case Reserves |
|
5.0 |
|
0.4 |
|
|
Gross unpaid loss and LAE reserves |
|
$ |
12.5 |
|
$ |
0.6 |
|
Underwriting Expenses
The following table summarizes the Collateralized Reinsurance segment’s underwriting expenses for the years ended December 31, 2014, 2013 and 2012:
|
|
|
Year Ended December 31, |
|
|
($ in millions) |
|
2014 |
|
2013 |
|
2012 |
|
|
|
|
|
|
|
|
|
|
|
Acquisition costs |
|
$ |
13.2 |
|
$ |
3.2 |
|
$ |
0.1 |
|
|
Acquisition cost ratio |
|
15.6 |
% |
12.2 |
% |
4.2 |
% |
|
|
|
|
|
|
|
|
|
|
General and administrative expenses |
|
$ |
7.3 |
|
$ |
3.5 |
|
$ |
1.7 |
|
|
General and administrative expense ratio |
|
8.7 |
% |
13.4 |
% |
70.9 |
% |
n/m - not meaningful.
Acquisition costs include commissions, profit commissions, brokerage costs and excise taxes, when applicable. Profit commissions and brokerage costs can vary based on the nature of business produced.
Profit commissions, which are paid by assuming companies to ceding companies in the event of favorable loss experience, change as the Collateralized Reinsurance segment’s estimates of loss and LAE fluctuate. Profit commissions incurred during the years ended December 31, 2014, 2013 and 2012 totaled $1.7 million, zero and zero, respectively.
Excluding the effects of profit commissions, the Collateralized Reinsurance segment’s acquisition cost ratios have remained largely consistent during each of the periods presented.
The Collateralized Reinsurance segment incurred $7.3 million, $3.5 million and $1.7 million of general and administrative expenses during 2014, 2013 and 2012, respectively. The Collateralized Reinsurance segment’s general and administrative expenses consist primarily of third-party legal and consulting costs, as well as personnel costs.
CORPORATE AND OTHER
Corporate and Other, which collectively represents the Company, certain intermediate holding and service companies, the Company’s former MUSIC Run-Off segment and eliminations relating to intercompany reinsurance and service charges, is not considered to be an operating segment. The underwriting losses generated by Corporate and Other principally reflect general and administrative expenses incurred in support of the Company’s various operating companies.
64
Table of Contents
The Corporate and Other results for the years ended December 31, 2014, 2013 and 2012 were as follows:
|
|
|
Year Ended December 31, |
|
|
($ in millions) |
|
2014 |
|
2013 |
|
2012 |
|
|
Gross premiums written |
|
$ |
(32.5 |
) |
$ |
1.6 |
|
$ |
6.4 |
|
|
Ceded reinsurance premiums |
|
32.4 |
|
(1.1 |
) |
(3.9 |
) |
|
Net premiums written |
|
(0.1 |
) |
0.5 |
|
2.5 |
|
|
Change in net unearned premiums |
|
— |
|
— |
|
24.8 |
|
|
Net premiums earned |
|
(0.1 |
) |
0.5 |
|
27.3 |
|
|
|
|
|
|
|
|
|
|
|
Loss and LAE - current year losses |
|
— |
|
— |
|
(19.8 |
) |
|
Loss and LAE - prior year losses |
|
(1.1 |
) |
(1.4 |
) |
0.5 |
|
|
Acquisition costs |
|
— |
|
(0.3 |
) |
(9.4 |
) |
|
General and administrative expenses |
|
(37.9 |
) |
(39.9 |
) |
(32.1 |
) |
|
Underwriting loss |
|
$ |
(39.1 |
) |
$ |
(41.1 |
) |
$ |
(33.5 |
) |
The premium activity reflected within Corporate and Other represent: (i) the elimination of inter-segment reinsurance arrangements between Montpelier Bermuda and Montpelier at Lloyd’s and between Montpelier Bermuda and Collateralized Reinsurance, and (ii) premium adjustments relating to policies written by MUSIC on or prior to December 31, 2011, which were not significant during any of the periods presented.
The losses incurred within Corporate and Other represent losses associated with business retained in connection with the MUSIC Sale. The favorable and unfavorable net prior year loss reserve development associated with the reserves we retained from the MUSIC Sale during each of the periods presented was not significant.
The gross and net premium eliminations associated with inter-segment reinsurance arrangements follow:
|
|
|
Year Ended December 31, 2014 |
|
Year Ended December 31, 2013 |
|
|
(Millions) |
|
Gross
premiums
written |
|
Ceded
reins.
premiums |
|
Net
premiums
written |
|
Gross
premiums
written |
|
Ceded
reins.
premiums |
|
Net
premiums
written |
|
|
|
|
|
|
|
|
|
|
|
|
|
|
|
|
|
Montpelier Bermuda |
|
$ |
0.4 |
|
$ |
(32.0 |
) |
$ |
(31.6 |
) |
$ |
(1.1 |
) |
$ |
— |
|
$ |
(1.1 |
) |
|
Montpelier at Lloyd’s |
|
— |
|
(0.4 |
) |
(0.4 |
) |
— |
|
1.1 |
|
1.1 |
|
|
Collateralized Reinsurance |
|
32.0 |
|
— |
|
32.0 |
|
— |
|
— |
|
— |
|
|
Total inter-segment premiums |
|
$ |
32.4 |
|
$ |
(32.4 |
) |
$ |
— |
|
$ |
(1.1 |
) |
$ |
1.1 |
|
$ |
— |
|
|
|
|
Year Ended December 31, 2012 |
|
|
(Millions) |
|
Gross
premiums
written |
|
Ceded
reins.
premiums |
|
Net
premiums
written |
|
|
|
|
|
|
|
|
|
|
|
Montpelier Bermuda |
|
$ |
(3.9 |
) |
$ |
— |
|
$ |
(3.9 |
) |
|
Montpelier at Lloyd’s |
|
— |
|
3.9 |
|
3.9 |
|
|
Total inter-segment premiums |
|
$ |
(3.9 |
) |
$ |
3.9 |
|
$ |
— |
|
The following table summarizes the general and administrative expenses of Corporate and Other during the years ended December 31, 2014, 2013 and 2012:
|
|
|
Year Ended December 31, |
|
|
(Millions) |
|
2014 |
|
2013 |
|
2012 |
|
|
|
|
|
|
|
|
|
|
|
Operating expenses |
|
$ |
23.9 |
|
$ |
22.5 |
|
$ |
18.4 |
|
|
Incentive compensation expenses |
|
14.0 |
|
17.4 |
|
13.7 |
|
|
General and administrative expenses |
|
$ |
37.9 |
|
$ |
39.9 |
|
$ |
32.1 |
|
Operating expenses recorded within Corporate and Other include salaries and benefits, information technology costs, director fees, legal and consulting expenses, corporate insurance premiums, audit fees and fees associated with MRH and BCRH being publicly traded companies.
Operating expenses during 2014 increased as compared to those of 2013 primarily as a result of BCRH becoming a publicly traded company in November 2013.
65
Table of Contents
Operating expenses during 2013 increased over those of 2012 primarily as a result of the re-allocation of certain risk management expenses from Montpelier Bermuda to Corporate and Other. This re-allocation was made in response to an increase in the Company’s group-wide risk management activities, including Solvency II and related initiatives.
Incentive compensation expenses recorded within Corporate and Other consist of two independent components. The first component represents amounts that are not, or are no longer, dependent on Company performance, and consist of: (i) Fixed RSUs and Variable RSUs granted in prior years that have been effectively converted to Fixed RSUs; and (ii) the portion of annual employee cash bonuses that is based on individual employee performance goals. The second component represents amounts that are entirely dependent on Company performance and consist of: (i) Variable RSUs in the Initial RSU Period; and (ii) the portion of annual employee cash bonuses that is based on Company performance.
Incentive compensation expenses incurred during 2014 were less than those of the prior year, primarily as a result of incentive compensation expenses during 2013 being adversely affected by the acceleration of Mr. Busher’s outstanding RSU award in connection with his retirement on December 31, 2013. See Note 14 of the Notes to Consolidated Financial Statements. The increase in Corporate and Other’s incentive compensation expenses during 2013, versus those of 2012, was due to: (i) a greater number of outstanding RSUs attributable to Corporate and Other activities; and (ii) the acceleration of the vesting of Mr. Busher’s outstanding RSUs awards in connection with his retirement. These items more than offset the impact of the 2013 incentives being provided at a lower projected payout level than that of the prior year. See Note 9 of the Notes to Consolidated Financial Statements.
II. Review of Non-Underwriting Results - Consolidated
Net Investment Income and Total Return on Cash and Investments
The following table summarizes our consolidated net investment income and total return on cash and investments for the years ended December 31, 2014, 2013 and 2012:
|
|
|
Year Ended December 31, |
|
|
($ in millions) |
|
2014 |
|
2013 |
|
2012 |
|
|
|
|
|
|
|
|
|
|
|
Investment income |
|
$ |
54.8 |
|
$ |
72.6 |
|
$ |
73.4 |
|
|
Investment expenses |
|
(8.0 |
) |
(8.6 |
) |
(6.3 |
) |
|
Net investment income |
|
46.8 |
|
64.0 |
|
67.1 |
|
|
Net realized investment gains (losses) |
|
15.0 |
|
(1.7 |
) |
56.7 |
|
|
Net unrealized investment gains (losses) |
|
(9.6 |
) |
(47.5 |
) |
25.7 |
|
|
Net income (loss) from investment-related derivative instruments: |
|
|
|
|
|
|
|
|
Foreign Exchange Contracts - investment activities |
|
2.0 |
|
2.0 |
|
(3.9 |
) |
|
Credit Derivatives |
|
(5.0 |
) |
(16.9 |
) |
(0.4 |
) |
|
Interest Rate Contracts |
|
(3.7 |
) |
5.0 |
|
2.7 |
|
|
Investment Options and Futures |
|
(8.9 |
) |
(3.7 |
) |
(0.3 |
) |
|
Net foreign currency transaction gains (losses) - investing activities |
|
(3.3 |
) |
(4.3 |
) |
2.3 |
|
|
Total return on cash and investments ($) |
|
$ |
33.3 |
|
$ |
(3.1 |
) |
$ |
149.9 |
|
|
|
|
|
|
|
|
|
|
|
Weighted average investment portfolio including cash |
|
$ |
3,156 |
|
$ |
3,088 |
|
$ |
3,013 |
|
|
Investment return on cash and investments (%) |
|
1.1 |
% |
(0.1 |
)% |
5.2 |
% |
|
|
|
|
|
|
|
|
|
|
Weighted average investment portfolio including cash, as adjusted (1) |
|
$ |
2,719 |
|
$ |
2,899 |
|
$ |
2,987 |
|
|
Investment return on cash and investments, as adjusted (%) (1) |
|
1.2 |
% |
(0.1 |
)% |
5.2 |
% |
(1) Our weighted average investment portfolio and investment return calculations, as adjusted, exclude the cash, cash equivalents and short-term investments that relate to our Collateralized Reinsurance segment, which totaled $468.9 million, $394.9 million and $72.5 million at December 31, 2014, 2013 and 2012, respectively. These assets are earmarked for the benefit of our Collateralized Reinsurance segment’s cedants and counterparties and are not intended to provide Montpelier or its cedants and counterparties with any investment return.
66
Table of Contents
Our total return on cash and investments for 2014 was higher than that of 2013, due primarily to lower net investment and derivative losses experienced in 2014 versus the amount of such losses we experienced in 2013. Our total return on cash and investments for 2013 was significantly lower than that of 2012, due primarily to net investment and investment-related derivative losses experienced in 2013 versus net gains experienced in 2012.
Our investment income has steadily decreased since 2012 due mainly to: (i) declines in the weighted average investment portfolio (when excluding the cash, cash equivalents and short-term investments that relate to our Collateralized Reinsurance segment); and (ii) declines in market interest rates. Our investment expenses for 2014 were largely consistent with those incurred during 2013, but our investment expenses for 2013 were higher than those incurred during 2012 due to changes in the allocation of invested balances among our investment managers.
During 2014 we recognized $14.0 million in net realized and unrealized gains from our fixed maturity portfolio, $1.9 million in net realized and unrealized gains from our equity portfolio and $10.5 million in net realized and unrealized losses from our other investments. The fixed maturity net gains we experienced during 2014 were largely the result of a decline in market interest rates. The equity portfolio net gains we experienced during 2014 followed a trend consistent with global equity markets. The other investment net losses we experienced during 2014 related primarily to a widening of credit spreads between the yield on the fixed maturity investments we held within our other investment portfolio versus that of U.S. Treasuries.
During 2013 we recognized $60.6 million in net realized and unrealized losses from our fixed maturity portfolio, $7.2 million in net realized and unrealized gains from our equity portfolio and $4.2 million in net realized and unrealized gains from our other investments. The fixed maturity net losses we experienced during 2013 were largely the result of an abrupt increase in market interest rates at mid-year. The equity portfolio net gains we experienced during 2013 followed a trend consistent with that of the U.S. equity market, as measured by the S&P 500, when considering that the majority of our equity securities were purchased mid-year. The other investment net gains we experienced during 2013 related primarily to the overall performance of the various limited partnership investments we own.
During 2012 we recognized $64.4 million in net realized and unrealized gains from our fixed maturity portfolio, $8.8 million in net realized and unrealized gains from our equity portfolio and $9.2 million in net realized and unrealized gains from our other investments. The fixed maturity net gains we experienced during 2012 were largely the result of declines in U.S. Treasury yields as well as tightening credit spreads between the yield on the fixed maturity investments we held versus that of U.S. Treasuries. The equity portfolio net gains we experienced during 2012 were consistent with trends experienced by the U.S. equity market as a whole, as measured by the S&P 500 Index. The other investment net gains we experienced during 2012 related primarily to the performance of certain private investment funds.
Certain of our investment managers have entered into derivative contracts for investment purposes. Our total net losses from investment-related derivative instruments during 2014, 2013 and 2012 were $15.6 million, $13.6 million and $1.9 million, respectively. Each of our derivative instruments, as well as the income and loss derived therefrom, is described in Note 7 of the Notes to Consolidated Financial Statements.
During 2014, 2013 and 2012, we experienced net foreign currency transaction gains (losses) on cash and investments (those in connection with our investing activities) of $(3.3) million, $(4.3) million and $2.3 million, respectively. These foreign currency transaction gains and losses represent foreign currency fluctuations in the value of our non-U.S. dollar managed cash and investments.
Our investments classified as Level 3 securities (as defined in GAAP) as of December 31, 2014 and 2013 consisted primarily of the following: (i) with respect to certain fixed maturity investments, bank loans and certain asset-backed securities, many of which are not actively traded; and (ii) with respect to other investments, certain investments in investment funds and limited partnerships. Our Level 3 securities measured at fair value represented 3.9% ($83.8 million) and 1.1% ($28.6 million) of our total invested assets measured at fair value as of December 31, 2014 and 2013, respectively. The increase in our level 3 securities from 2013 to 2014 primarily reflects the 2014 purchase of an interest in an investment fund that cannot be readily redeemed due to lock-up restrictions.
67
Table of Contents
Net Foreign Currency Losses
The following table summarizes the components of our consolidated net foreign currency gains (losses) for the years ended December 31, 2014, 2013 and 2012:
|
|
|
Year Ended December 31, |
|
|
(Millions) |
|
2014 |
|
2013 |
|
2012 |
|
|
|
|
|
|
|
|
|
|
|
Net foreign currency transaction gains (losses) - investing activities |
|
$ |
(3.3 |
) |
$ |
(4.3 |
) |
$ |
2.3 |
|
|
Net foreign currency transaction gains (losses) - other activities |
|
12.7 |
|
(11.6 |
) |
(15.1 |
) |
|
Net foreign currency gains (losses) |
|
$ |
9.4 |
|
$ |
(15.9 |
) |
$ |
(12.8 |
) |
See “Net Investment Income and Total Return on Cash and Investments” above for details of our net foreign currency transaction gains (losses) we experienced in connection with our investing activities during the years presented.
The net foreign currency transaction gains (losses) we experienced in connection with our other activities represent net foreign currency gains and losses resulting from: (i) Montpelier Bermuda’s premiums receivable that are denominated in currencies other than the U.S. dollar (its functional currency); and (ii) Montpelier at Lloyd’s assets and liabilities that are denominated in currencies other than the British pound (its functional currency), including those denominated in U.S. dollars. These net transaction gains and losses do not include: (i) fluctuations associated with Montpelier Bermuda’s and Montpelier at Lloyd’s losses and LAE, which we record as favorable or unfavorable loss reserve development; (ii) the income or loss associated with those Foreign Exchange Contracts we enter into in order to mitigate the financial effects of certain foreign currency exchange rate fluctuations, see “Net Income (Loss) From Derivative Instruments”; and (iii) any offsetting foreign currency translation gains and losses we recognize through our comprehensive income or loss associated with Montpelier at Lloyd’s assets and liabilities that are denominated in U.S. dollars.
The net foreign currency transaction gains (losses) we experienced during the periods presented associated with our other activities were primarily due to a strengthening (weakening) of the U.S. dollar against the British pound. The closing rates of the U.S. dollar versus the British pound as of December 31, 2014, 2013 and 2012, follow:
|
Currency |
|
Closing Rate
December 31, 2014 |
|
Closing Rate
December 31, 2013 |
|
Closing Rate
December 31, 2012 |
|
|
British pound (GBP) |
|
1.5559 |
|
1.6559 |
|
1.6234 |
|
Net Income (Loss) from Derivative Instruments
The following table presents our consolidated net income (loss) from derivative instruments during the years ended December 31, 2014, 2013 and 2012:
|
|
|
Year Ended December 31, |
|
|
(Millions) |
|
2014 |
|
2013 |
|
2012 |
|
|
|
|
|
|
|
|
|
|
|
Foreign Exchange Contracts - underwriting activities |
|
$ |
(0.1 |
) |
$ |
(4.5 |
) |
$ |
7.5 |
|
|
Foreign Exchange Contracts - investing activities |
|
2.0 |
|
2.0 |
|
(3.9 |
) |
|
Credit Derivatives |
|
(5.0 |
) |
(16.9 |
) |
(0.4 |
) |
|
Interest Rate Contracts |
|
(3.7 |
) |
5.0 |
|
2.7 |
|
|
Investment Options and Futures |
|
(8.9 |
) |
(3.7 |
) |
(0.3 |
) |
|
UST Contract |
|
— |
|
— |
|
0.6 |
|
|
LIBOR Swap |
|
(0.7 |
) |
0.4 |
|
(2.2 |
) |
|
Outward ILW Swaps |
|
(4.3 |
) |
(7.6 |
) |
(0.8 |
) |
|
Inward ILW Swaps |
|
2.1 |
|
— |
|
— |
|
|
|
|
|
|
|
|
|
|
|
Net income (loss) from derivative instruments |
|
$ |
(18.6 |
) |
$ |
(25.3 |
) |
$ |
3.2 |
|
See Note 7 of the Notes to Consolidated Financial Statements for a description of each of our derivative instruments.
Other Revenues
The following table summarizes our consolidated other revenues for the years ended December 31, 2014, 2013 and 2012:
68
Table of Contents
|
|
|
Year Ended December 31, |
|
|
(Millions) |
|
2014 |
|
2013 |
|
2012 |
|
|
|
|
|
|
|
|
|
|
|
Services provided to third parties |
|
$ |
2.5 |
|
$ |
— |
|
$ |
1.0 |
|
|
Equity in earnings of unconsolidated affiliate |
|
0.3 |
|
— |
|
— |
|
|
Interest on funds advanced |
|
0.1 |
|
— |
|
0.1 |
|
|
Gain (loss) on sale of PUAL |
|
— |
|
0.4 |
|
(0.5 |
) |
|
Revenue from the Loss Development Cover |
|
— |
|
— |
|
0.2 |
|
|
Other revenues |
|
$ |
2.9 |
|
$ |
0.4 |
|
$ |
0.8 |
|
Our consolidated other revenues are comprised of: (i) managing general agency fees earned by Cladium, commissions earned by our former wholly-owned subsidiary Paladin Underwriting Agency Limited (“PUAL”) and transitional services provided to Selective in connection with the MUSIC Sale; (ii) equity in the earnings of a specialty managing general agency in which we hold a minority investment; (iii) interest on funds advanced to ceding companies to cover losses in accordance with contract terms; (iv) amounts recorded in connection with the sale of PUAL; and (v) the proceeds from the Loss Development Cover.
In September 2012, we sold PUAL to a founding member of its management. In connection with the sale of PUAL, we received a note from the buyer under which the repayment of principal and interest was contingent on the future performance of that company. Due to the contingencies surrounding the note at the time of sale in 2012, we assigned no value to it and recognized a loss on the sale of PUAL of $0.5 million. Based on the subsequent performance of the note, we recognized its full value during 2013 and recorded a $0.4 million gain on the sale of PUAL. PUAL’s assets and operations were not material to the Company.
Interest and Other Financing Expenses
The following table summarizes our consolidated interest and other financing expenses for the years ended December 31, 2014, 2013 and 2012:
|
|
|
Year Ended December 31, |
|
|
(Millions) |
|
2014 |
|
2013 |
|
2012 |
|
|
|
|
|
|
|
|
|
|
|
Interest expense and amortization of discount and issuance costs - 2022 Senior Notes |
|
$ |
14.4 |
|
$ |
14.4 |
|
$ |
3.4 |
|
|
Interest expense and amortization of issuance costs - 2013 Senior Notes |
|
— |
|
— |
|
11.7 |
|
|
Interest expense - Trust Preferred Securities |
|
4.1 |
|
4.1 |
|
4.3 |
|
|
Other interest and financing expenses |
|
0.4 |
|
0.3 |
|
1.0 |
|
|
Interest and other financing expenses |
|
$ |
18.9 |
|
$ |
18.8 |
|
$ |
20.4 |
|
Our consolidated interest and financing expenses remained largely consistent from 2013 to 2014 because the annual interest expense in respect of the 2022 Senior Notes, which we issued in 2012, is highly consistent with that in respect of the 2013 Senior Notes, which were retired in 2012.
In 2012 we incurred $1.2 million of incremental interest expense during the one-month period in which both debt issuances were outstanding (which constituted the redemption notice period we were required to provide to holders of the 2013 Senior Notes).
Our other interest and financing expenses consist of interest expense and commitment fees associated with BCRH’s 364-day unsecured credit agreement (the “BCRH Credit Agreement”), letter of credit fees and trust fees.
Underwriting Discount and Structuring Fees Associated With The BCRH IPO
In connection with the BCRH IPO, in 2013 we: (i) reimbursed BCRH for the underwriting discount it incurred, which was equal to 5% of the gross proceeds it received from third parties ($6.2 million); and (ii) paid a structuring fee to a third-party equal to 1% of the gross proceeds BCRH received from third parties ($1.3 million).
Loss on Early Extinguishment of 2013 Senior Notes
In November 2012 we fully redeemed the 2013 Senior Notes at a “make-whole” redemption price of $237.6 million (104.2% of the principal thereof), plus accrued and unpaid interest to the redemption date. In connection with the redemption of the 2013 Senior Notes, we recorded a loss of $9.7 million.
69
Table of Contents
Other Expenses
The following table summarizes our consolidated other expenses for the years ended December 31, 2014, 2013 and 2012:
|
|
|
Year Ended December 31, |
|
|
(Millions) |
|
2014 |
|
2013 |
|
2012 |
|
|
|
|
|
|
|
|
|
|
|
Cladium operating expenses |
|
$ |
2.4 |
|
$ |
— |
|
$ |
— |
|
|
Expenses from the Loss Development Cover |
|
0.8 |
|
0.6 |
|
— |
|
|
Other non-underwriting expenses |
|
0.2 |
|
— |
|
— |
|
|
Other expenses |
|
$ |
3.4 |
|
$ |
0.6 |
|
$ |
— |
|
Our consolidated other expenses are comprised of: (i) operating expenses associated with Cladium; (ii) provisions for our ongoing obligation to Selective in connection with the MUSIC Sale pursuant to the Loss Development Cover; and (iii) professional fees associated with the development of our Collateralized Reinsurance initiatives.
Income Tax Benefit (Provision)
We are domiciled in Bermuda and have subsidiaries that are domiciled in the U.K. and the U.S. At the present time, no income taxes are levied in Bermuda and the Company and its Bermuda-domiciled subsidiaries have received an assurance from the Bermuda Minister of Finance exempting them from all Bermuda-imposed income, withholding and capital gains taxes until March 31, 2035.
During 2014 we recorded a net tax benefit of $2.7 million, consisting of a current tax provision of $2.0 million and a deferred tax benefit of $4.7 million. During 2013 we recorded a net tax benefit of $0.1 million, consisting of a current tax benefit of $0.3 million and a deferred tax provision of $0.2 million. During 2012 we recorded a net tax provision of $0.3 million, consisting of a current tax provision of $0.8 million and a deferred tax benefit of $0.5 million.
The movements in our income tax provisions during the years presented herein were associated primarily with our U.K. operations. The pretax income associated with each of our U.K. entities is generally taxable unless: (i) that entity has prior year net operating losses that may be utilized to fully or partially offset its current income tax liability; or (ii) another entity within our U.K. group of companies experiences a current year pretax loss which is eligible to be used to fully or partially offset any other entity’s current income tax liability (“Group Relief”).
During 2014 and 2012, each of the entities within our U.K. group of companies generated taxable income so we were unable to utilize Group Relief to offset our U.K. net current income tax liabilities in those years. During 2013 we were able to utilize a combination of net operating losses and Group Relief to partially offset our U.K. net current income liabilities for that year.
During 2014 we released our remaining U.K. deferred tax asset valuation allowance in light of: (i) the expected future taxable earnings of our U.K. entities; and (ii) the fact that our U.K. net operating loss carryforwards do not expire. The release of these U.K. deferred tax valuation allowances resulted in the recognition of a $2.9 million income tax benefit during 2014.
During 2014, 2013 and 2012, our Bermuda operations generated income before income taxes of $246.7 million, $205.3 million and $232.2 million, respectively.
During 2014, 2013 and 2012, our U.K. operations generated income (losses) before income taxes of $(2.8) million, $4.6 million and $(4.4) million, respectively, and certain of these operations are currently in a net operating loss position.
During 2014, 2013 and 2012, our U.S. operations generated income before income taxes of $1.4 million, $0.6 million and $0.1 million, respectively, and are currently in a cumulative net operating loss position. Due to the uncertainty at this time as to whether such operations will generate sufficient taxable income in future periods to utilize its existing deferred tax assets, we have established offsetting valuation allowances against each of our existing U.S. gross deferred tax assets.
70
Table of Contents
Net Income Attributable to Non-Controlling Interests
The following table summarizes the net income attributable to non-controlling interests during the years ended December 31, 2014, 2013 and 2012:
|
|
|
Year Ended December 31, |
|
|
(Millions) |
|
2014 |
|
2013 |
|
2012 |
|
|
|
|
|
|
|
|
|
|
|
Income attributable to third-party investments in the BCGR Cell |
|
$ |
13.7 |
|
$ |
6.6 |
|
$ |
— |
|
|
Income (loss) attributable to third-party investments in BCRH |
|
10.4 |
|
(0.5 |
) |
— |
|
|
Net income attributable to non-controlling interests |
|
$ |
24.1 |
|
$ |
6.1 |
|
$ |
— |
|
Dividends Declared on Preferred Shares
During 2014, 2013 and 2012 we declared $13.3 million in cash dividends on our Preferred Shares.
III. Liquidity and Capital Resources
Liquidity
The Company has no operations of its own and relies on dividends and distributions from its subsidiaries to pay its operating expenses, interest on debt, dividends to holders of Preferred Shares and Common Shares and to fund any Common Share repurchase activities. There are restrictions on the payment of dividends to the Company from its regulated operating and holding companies. See Note 13 of the Notes to Consolidated Financial Statements. Our Preferred Shares have a stated dividend rate of 8.875% per year and, beginning in September 2014, we raised our quarterly Common Share dividend to $0.20 per share. Any future determination to pay dividends to holders of Common Shares and Preferred Shares will, however, be at the discretion of the Board and will be dependent upon many factors, including our results of operations, cash flows, financial position, capital requirements, general business opportunities, and legal, tax, regulatory and contractual restrictions.
The primary sources of cash for our regulated operating subsidiaries are premium collections, investment income, sales and maturities of investments and reinsurance recoveries. The primary uses of cash for our operating subsidiaries are payments of losses and LAE, acquisition costs, operating expenses, ceded reinsurance, investment purchases and dividends and distributions paid to the Company.
As a provider of short-tail insurance and reinsurance, mainly from natural and man-made catastrophes, we could be required to pay significant losses on short notice. As a result, we have structured our investment portfolio with high-quality fixed maturity securities with a short average duration in order to reduce our sensitivity to interest rate fluctuations and to provide adequate liquidity for the settlement of our liabilities. As of December 31, 2014, the average duration of our investment portfolio, including cash, was 0.9 years (inclusive of relevant derivative and short positions). If our calculations with respect to the timing of the payment of our liabilities are incorrect, or if we improperly structure our investment portfolios, we could be forced to liquidate our investments at inopportune times, potentially at a significant loss.
As of December 31, 2014, our sources of immediate and unencumbered liquidity consisted of: (i) $141.3 million of cash and cash equivalents; (ii) $48.0 million of highly liquid fixed maturity investments which currently trade at a very narrow bid-ask spread and whose proceeds are available within two business days; (iii) $159.4 million of publicly-traded equity securities whose proceeds are available within four business days; and (iv) $5.0 million of liquid fixed maturity investments which currently trade at a narrow bid-ask spread and whose proceeds are available within four business days. Further, we believe that we have significant sources of additional liquidity within our fixed maturity investment and other investment portfolios, although the bid-ask spreads associated with such investment securities could be broader, perhaps significantly, than those with respect to the securities referred to above, particularly if a large individual investment were required to be liquidated in an expeditious manner.
The Company does not have a revolving credit facility for its own purposes because its current cash and cash equivalent balances and projected future cash flows from its operations are expected to be sufficient to cover its cash obligations under most loss scenarios through the foreseeable future.
In May 2014 BCRH entered into the BCRH Credit Agreement which permits it to borrow up to $20.0 million on a revolving basis for working capital and general corporate purposes. Borrowings under the BCRH Credit Agreement bear interest, set at the time of the borrowing, at a rate equal to the 3-month LIBOR rate plus 100 basis points.
71
Table of Contents
The Company serves as a guarantor of BCRH’s obligations under the BCRH Credit Agreement and receives an annual guarantee fee from BCRH equal to 0.125% of the facility’s total capacity.
As of December 31, 2014, BCRH had $8.0 million of outstanding borrowings under the BCRH Credit Agreement. Of these borrowings, $4.0 million was repaid on January 26, 2015, and (while outstanding) was subject to an annual interest rate of 1.33%, and $4.0 million must be repaid no later than April 10, 2015, and is subject to an annual interest rate of 1.32%.
The BCRH Credit Agreement contains covenants that limit BCRH’s and, to a lesser extent, the Company’s ability to, among other things, grant liens on its assets, sell assets, merge or consolidate, incur debt and enter into certain transactions with affiliates. The BCRH Credit Agreement also contains covenants that require: (i) BCRH to maintain a debt to total capitalization ratio less than or equal to 22.5%; (ii) the Company to maintain a financial strength rating from Fitch Ratings Ltd. of at least “BBB+”; and (iii) each of BCRH and the Company to maintain at least 70% of its net worth as of the date of the BCRH Credit Agreement. If BCRH or the Company were to fail to comply with any of these covenants, the lender could revoke the facility and exercise remedies against BCRH or the Company. As of December 31, 2014, BCRH and the Company (as a guarantor) were in compliance with each of the covenants associated with the BCRH Credit Agreement.
In May 2014 the BCGR Listed Fund entered into a 364-day unsecured credit agreement (the “BCGR Credit Agreement”) which permits it to borrow up to $20.0 million on a revolving basis for working capital and general corporate purposes. Borrowings under the BCGR Credit Agreement bear interest, set at the time of the borrowing, at a rate equal to the 3-month LIBOR rate plus 100 basis points.
The Company serves as a guarantor of the BCGR Listed Fund’s obligations under the BCGR Credit Agreement and receives an annual guarantee fee from the BCGR Listed Fund equal to 0.125% of the facility’s total capacity.
As of December 31, 2014, the BCGR Listed Fund had a $4.0 million outstanding borrowing under the BCGR Credit Agreement. This borrowing was repaid by the BCGR Listed Fund on February 3, 2015, and (while outstanding) was subject to an annual interest rate of 1.27%.
The BCGR Credit Agreement contains covenants that limit the BCGR Listed Fund’s and, to a lesser extent, the Company’s ability, among other things, to grant liens on its assets, sell assets, merge or consolidate, incur debt and enter into certain transactions with affiliates. The BCGR Credit Agreement also contains a financial covenant that requires the Company to maintain a leverage ratio at or below 30%. If the Company were to fail to comply with any of these covenants, the lender could revoke the facility and exercise remedies against the Company. As of December 31, 2014, the BCGR Listed Fund and the Company (as a guarantor) were in compliance with each of the covenants associated with the BCGR Credit Agreement.
Capital Resources
The following table summarizes our capital structure as of December 31, 2014 and 2013:
|
|
|
December 31, |
|
|
(Millions) |
|
2014 |
|
2013 |
|
|
|
|
|
|
|
|
|
|
|
2022 Senior Notes, at face value |
|
$ |
300.0 |
|
$ |
300.0 |
|
|
Trust Preferred Securities |
|
100.0 |
|
100.0 |
|
|
Total Debt |
|
$ |
400.0 |
|
$ |
400.0 |
|
|
|
|
|
|
|
|
|
Preferred Shareholders’ Equity available to the Company |
|
150.0 |
|
150.0 |
|
|
Common Shareholders’ Equity available to the Company |
|
1,498.2 |
|
1,492.1 |
|
|
|
|
|
|
|
|
|
Total Capital available to the Company |
|
$ |
2,048.2 |
|
$ |
2,042.1 |
|
Our total capital increased by $6.1 million during 2014 as a result of our recording comprehensive income available to the Company of $221.5 million, recognizing $13.4 million of additional paid-in capital through the amortization and issuance of share-based compensation, recognizing $0.3 million of additional paid-in capital from purchases of non-controlling interests, declaring $43.2 million in dividends to holders of Common Shares and Preferred Shares and repurchasing $185.9 million of Common Shares.
The 2022 Senior Notes bear interest at a fixed rate of 4.70% per annum, payable semi-annually in arrears on April 15 and October 15 of each year. We may redeem the 2022 Senior Notes at any time, in whole or in part, at a “make-whole” redemption price, plus accrued and unpaid interest.
72
Table of Contents
The Trust Preferred Securities mature on March 30, 2036, but are redeemable at our option at par. The Trust Preferred Securities bear interest at a floating rate of 3-month LIBOR plus 380 basis points, reset quarterly. We currently have no intention of redeeming the Trust Preferred Securities.
The LIBOR Swap, which we entered into in 2012, will result in the future net cash flows in connection with the Trust Preferred Securities, for the five-year period beginning March 30, 2012, being the same as if these securities bore interest at a fixed rate of 4.905%, provided we hold the LIBOR Swap to its maturity.
The Preferred Shares have no stated maturity, are not subject to any sinking fund or mandatory redemption and are not convertible into any other securities. Except in certain limited circumstances, the Preferred Shares are not redeemable prior to May 10, 2016. After that date, we may redeem the Preferred Shares at our option, in whole or in part, at a price of $25.00 per share plus any declared and unpaid dividends.
None of the 2022 Senior Notes, the Trust Preferred Securities or the Preferred Shares contain any covenants regarding financial ratios or specified levels of net worth or liquidity to which we must adhere.
We do not consider the BCRH’s short-term borrowings outstanding under the BCRH Credit Agreement that we guarantee to be a component of our capital structure.
We may need to raise additional capital in the future, through the issuance of debt, equity or hybrid securities, in order to, among other things, write new business, incur and/or pay significant losses, respond to, or comply with, changes in the capital requirements that rating agencies or various regulatory bodies use to evaluate us, acquire new businesses, invest in existing businesses or refinance our existing obligations.
The issuance of any new debt, equity or hybrid financial instruments might contain terms and conditions that are more unfavorable to us, our existing shareholders and our debtholders than those contained within our current capital structure. More specifically, any new issuances of equity or hybrid securities could include the issuance of securities with rights, preferences and privileges that are senior or otherwise superior to those of our Common and Preferred Shares and could be dilutive to our existing holders of these equity securities. Further, if we cannot obtain adequate capital on favorable terms or otherwise, our business, financial condition and operating results could be adversely affected.
Letter of Credit Facilities and Trusts
In the normal course of our business, we maintain letter of credit facilities and trust arrangements as a means of providing collateral and/or statutory credit to certain of our constituents. These facilities and arrangements are secured by collateral accounts and trusts containing cash, cash equivalents and investment securities.
The agreements governing our letter of credit facilities contain covenants that limit our ability, among other things, to grant liens on our assets, sell our assets, merge or consolidate, incur debt and enter into certain agreements. In addition, our four year committed letter of credit facility requires us to maintain a debt to capital ratio of no greater than 30% and for Montpelier Re to maintain an A.M. Best financial strength rating of no less than “B++.” If we were to fail to comply with these covenants or fail to meet these financial ratios, the lenders could revoke these facilities and exercise remedies against us. As of December 31, 2014 and 2013, we were in compliance with each of the covenants contained in our letter of credit facilities.
We established the Reinsurance Trust and the Florida Multi-Beneficiary Reinsurance Trust as a means of providing statutory credit to Montpelier Re’s cedants and we established the Lloyd’s Deposit Trust Deed as a means of satisfying Lloyd’s capital requirements. As a result of these and other trust arrangements we currently utilize, our ongoing reliance on letter of credit facilities has been significantly reduced. See Note 6 of the Notes to Consolidated Financial Statements.
73
Table of Contents
Contractual Obligations and Commitments
Below is a schedule of our material contractual obligations and commitments as of December 31, 2014:
|
|
|
Due in |
|
Due in One |
|
Due in Three |
|
Due After |
|
|
|
|
|
|
One Year |
|
to Three |
|
to Five |
|
Five |
|
|
|
|
Millions |
|
or Less |
|
Years |
|
Years |
|
Years |
|
Total |
|
|
|
|
|
|
|
|
|
|
|
|
|
|
|
|
|
|
|
|
Loss and LAE reserves |
|
$ |
298.8 |
|
$ |
292.6 |
|
$ |
107.4 |
|
$ |
76.9 |
|
$ |
775.7 |
|
|
Debt |
|
8.0 |
|
— |
|
— |
|
400.0 |
|
408.0 |
|
|
Interest and other financing expenses |
|
19.1 |
|
38.1 |
|
38.1 |
|
120.3 |
|
215.6 |
|
|
Letter of credit fees |
|
0.2 |
|
0.1 |
|
— |
|
— |
|
0.3 |
|
|
Non-cancellable operating leases |
|
4.8 |
|
4.7 |
|
3.0 |
|
6.2 |
|
18.7 |
|
|
Unfunded investment commitments |
|
23.4 |
|
— |
|
— |
|
— |
|
23.4 |
|
|
Total contractual obligations and commitments |
|
$ |
354.3 |
|
$ |
335.5 |
|
$ |
148.5 |
|
$ |
603.4 |
|
$ |
1,441.7 |
|
Our loss and LAE reserves do not have contractual maturity dates. Our expected loss and LAE reserve obligations are based on historical loss and LAE reserve payment patterns.
Our debt and interest and other financing obligations assume that the Trust Preferred Securities are redeemed upon their maturity in March 2036, and that the interest rate thereon remains at 4.905% per year, the rate that we have achieved through the LIBOR Swap.
Our bilateral letter of credit facility is cancellable upon one-years’ notice and it is assumed, solely for purposes of this exercise, that such notice of cancellation was given on December 31, 2014. Our four year committed letter of credit facility expires in October 2016 and it is assumed that this facility will not be renewed at that time.
Our non-cancellable operating lease obligations presented represent the actual terms of those arrangements.
Our unfunded commitments to invest: (i) $7.9 million into a private investment fund; and (ii) up to $15.5 million into a private placement fixed maturity investment, are each assumed to be fully funded during 2015.
Regulation and Capital Requirements
Our holding company and insurance and reinsurance operations are subject to regulation and capital requirements established by supervisors in multiple jurisdictions. See Note 13 of the Notes to Consolidated Financial Statements for detailed information concerning our regulatory and capital requirements.
Off-Balance Sheet Arrangements
The Foreign Exchange Contracts, Credit Derivatives, Interest Rate Contracts, Investment Options and Futures, certain of our ongoing obligations to Selective in connection with the MUSIC Sale and the Company’s guarantee of the BCGR Listed Fund’s obligations under the BCGR Credit Agreement each constitute off-balance sheet arrangements. Excluding these specific transactions, as of December 31, 2014, we were not subject to any off-balance sheet arrangements that we believe are material to our investors.
Cash Flows
We experienced a net increase (decrease) in our cash and cash equivalents of $(20.7) million, $185.0 million and $(22.1) million during 2014, 2013 and 2012, respectively.
We generated $200.9 million, $120.2 million and $200.8 million of net cash from our operations during 2014, 2013 and 2012, respectively, which resulted primarily from our premiums received, net of acquisition costs, exceeding our net losses and operating expenses paid. Our net loss and LAE payments during 2014, 2013 and 2012 were $258.4 million, $324.3 million and $288.1 million, respectively.
Our investment activities provided (used) net cash and cash equivalents of $14.2 million, $36.6 million and $(141.5) million during 2014, 2013 and 2012, respectively. The cash and cash equivalents provided from our investing activities during 2014 primarily resulted from a decrease in restricted cash and settlements of reverse repurchase agreements offsetting net investment purchases. The cash and cash equivalents provided from our investment activities during 2013 resulted primarily from net sales of investment securities, whose proceeds were used to pay loss and LAE reserves and to fund repurchases of Common Shares. The cash and cash equivalents used for our investment activities during 2012 resulted primarily from net purchases of investment securities, representing the initial deployment of the net proceeds raised from the issuance of the 2022 Senior Notes and a lower level of Common Share repurchases.
74
Table of Contents
Our financing activities provided (used) net cash and cash equivalents of $(238.4) million, $29.9 million and $(86.8) million during 2014, 2013 and 2012, respectively. Our financing cash flows are largely influenced by our Common Share repurchase activities from year-to-year. In addition, our financing cash flows in 2013 and 2012 benefitted from receipts of third-party investments in non-controlling interests and the net proceeds raised from the issuance of the 2022 Senior Notes, respectively.
Detailed information regarding our cash flows for the years ended December 31, 2014, 2013 and 2012, follows:
For the Year Ended December 31, 2014
Our cash flows provided from operations totaled $200.9 million.
Our cash flows provided from investing activities totaled $14.2 million, resulting from the following:
· we received $497.5 million from net sales and maturities of fixed maturity investments,
· we paid $655.3 million for net purchases of equity securities and other investments,
· we paid $10.0 million in settlements of investment-related derivative instruments,
· we received $85.2 million pursuant to net settlements of reverse repurchase agreements,
· we had a $106.3 million decrease in our restricted cash,
· we paid $4.1 million in investment performance fees, and
· we paid $5.4 million to acquire capitalized assets.
Our cash flows used for financing activities totaled $238.4 million, resulting from the following:
· we paid $185.9 million to repurchase Common Shares,
· we received $5.2 million from third party investors in the BCGR Listed Fund,
· we paid $7.9 million for purchases of BCRH Common Shares made by the Company,
· we paid $11.8 million pursuant to net settlements of repurchase agreements,
· BCRH borrowed $8.0 million under the BCRH Credit Agreement,
· we paid $5.5 million in dividends to non-controlling holders of BCRH Common Shares, and
· we paid $40.5 million in dividends to holders of Common Shares and Preferred Shares.
We also experienced a $2.6 million increase in the U.S. dollar value of our cash and cash equivalents due to foreign currency exchange rate fluctuations.
For the Year Ended December 31, 2013
Our cash flows provided from operations totaled $120.2 million.
Our cash flows provided from investing activities totaled $36.6 million, resulting from the following:
· we received $137.2 million from net sales and maturities of fixed maturity investments,
· we received $21.9 million from net sales of equity securities and other investments,
· we paid $18.1 million in settlements of investment-related derivative instruments,
· we paid $33.4 million pursuant to net settlements of reverse repurchase agreements,
· we had a $63.4 million increase in our restricted cash,
· we paid $6.4 million in investment performance fees, and
· we paid $1.2 million to acquire capitalized assets.
Table of Contents
Our cash flows provided from financing activities totaled $29.9 million, resulting from the following:
· we paid $171.4 million to repurchase Common Shares,
· we received $238.8 million in net third-party investments in non-controlling interests, and
· we paid $37.5 million in dividends to holders of Common Shares and Preferred Shares.
We also experienced a $1.7 million decrease in the U.S. dollar value of our cash and cash equivalents due to foreign currency exchange rate fluctuations.
For the Year Ended December 31, 2012
Our cash flows provided from operations totaled $200.8 million.
Our cash flows used for investing activities totaled $141.5 million, resulting from the following:
· we paid $224.7 million for net purchases of fixed maturity investments,
· we received $38.4 million from net sales of equity securities and other investments,
· we paid $1.0 million in expenses related to the MUSIC Sale,
· we received $0.7 million in settlements of investment-related derivative instruments,
· we paid $12.6 million pursuant to net settlements of reverse repurchase agreements,
· we had a $58.1 million decrease in our restricted cash, and
· we paid $0.4 million to acquire capitalized assets.
Our cash flows used for financing activities totaled $86.8 million, resulting from the following:
· we paid $228.0 million to extinguish the 2013 Senior Notes,
· we received $299.1 million from the issuance of the 2022 Senior Notes,
· we paid $2.7 million in expenses related to the issuance of the 2022 Senior Notes,
· we paid $117.5 million to repurchase Common Shares, and
· we paid $37.7 million in dividends to holders of Common Shares and Preferred Shares.
We also experienced a $5.4 million increase in the U.S. dollar value of our cash and cash equivalents due to foreign currency exchange rate fluctuations.
Cash and Cash Equivalents Held by Our U.K. and U.S. Subsidiaries
As of December 31, 2014, we held total cash and cash equivalents of $447.7 million. Of this amount, $415.2 million was held by our Bermuda companies, $24.3 million was held by our U.K. companies and $8.2 million was held by our U.S. companies.
We have no current intention, or need, to repatriate any cash or cash equivalents from our U.K. or U.S. operations to Bermuda in order to satisfy our parent company obligations. Additionally, our current structure is such that any distributions of earnings, in the form of cash or otherwise, from our subsidiaries outside of Bermuda would not currently subject us to a material amount of incremental taxation.
IV. Summary of Critical Accounting Policies and Estimates
Our Consolidated Financial Statements have been prepared in accordance with GAAP. The preparation of these financial statements requires us to make estimates and assumptions that affect the reported and disclosed amounts of our assets and liabilities as of the balance sheet dates and the reported amounts of our revenues and expenses during the reporting periods. We believe the items that require the most subjective and complex estimates are: (i) our loss and LAE reserves; (ii) our written and earned insurance and reinsurance premiums; (iii) our ceded reinsurance; and (iv) our share-based compensation accruals. Our accounting policies for these items are of critical importance to our consolidated financial statements.
The following discussion provides detailed information regarding our use of estimates and assumptions as it relates to such items.
76
Table of Contents
Loss and LAE Reserves
Our loss and LAE reserves represent estimates of future amounts needed to pay our claims and related expenses (such as claim adjusters’ fees and litigation expenses) for insured losses that have occurred. The process of estimating these reserves involves a considerable degree of judgment and our estimates as of any given date are inherently uncertain.
Estimating loss and LAE reserves requires us to make assumptions regarding reporting and development patterns, frequency and severity trends, claims settlement practices, potential changes in legal environments, inflation, loss amplification, foreign exchange movements and other factors. These estimates and judgments are based on numerous considerations and are often revised as: (i) we receive changes in loss amounts reported by ceding companies and brokers; (ii) we obtain additional information, experience or other data; (iii) new or improved methodologies are developed; or (iv) laws change.
Our loss and LAE reserves relating to short-tail property risks are typically reported to us and settled more promptly than those relating to our long-tail risks. However, the timeliness of loss reporting can be affected by such factors as the nature of the event causing the loss, the location of the loss, whether the loss is from policies in force with primary insurers or with reinsurers and where our exposure falls within the cedant’s overall reinsurance program. In the case of our reinsurance business, our reserving process is highly dependent on the loss information we receive from ceding companies and brokers.
Our loss and LAE reserves are comprised of case reserves (which are based on claims that have been reported to us) and IBNR reserves (which are based on losses that we believe to have occurred but for which claims have not yet been reported to us and which may include a provision for expected future development on our case reserves).
Our case reserve estimates are initially determined on the basis of loss reports received from third parties. Our IBNR reserve estimates are determined using various actuarial methods as well as a combination of our own historical loss experience, historical insurance industry loss experience, estimates of pricing adequacy trends and our professional judgment. The process we use to estimate our IBNR reserves involves projecting our estimated ultimate loss and LAE reserves and then subtracting paid claims and case reserves as notified by the ceding company, to arrive at our IBNR reserve.
Our primary focus is on short-tail property treaty reinsurance, written on both an excess-of-loss and proportional basis. We also underwrite direct insurance and facultative reinsurance, as well as specialty casualty risks. The nature and extent of our judgment in the reserving process depends upon the type of business.
Most of our property treaty reinsurance contracts comprise business which has both a low frequency of claims occurrence and a high potential severity of loss, such as claims arising from natural catastrophes, terrorism, large individual property risks, and space and aviation risks. Given the high-severity, low-frequency nature of these events, the losses typically generated therefrom do not lend themselves to traditional actuarial reserving methods, such as statistical calculations of a range of estimates surrounding the best point estimate of our loss and LAE reserves. Therefore, our reserving approach for these types of coverages is to estimate the ultimate cost associated with a single loss event rather than analyzing the historical development patterns of past losses as a means of estimating ultimate losses for an entire accident year. We estimate our reserves for these large events on a contract-by-contract basis by means of a review of policies with known or potential exposure to a particular loss event.
The two primary bases for estimating the ultimate loss associated with a large event are: (i) actual and precautionary claims advices received from the cedant; and (ii) the nature and extent of the impact the event is estimated to have on the industry as a whole. Immediately after a loss event, the estimated industry market loss is the primary driver of our ultimate loss from such event. In order to estimate the nature and extent of the event, we rely on output provided by commercially available catastrophe models, as well as proprietary models (including CATM®) that have been developed in-house. The exposure of each cedant potentially affected by the event is analyzed on the basis of this output. As the amount of information received from cedants or brokers increases during the period following an event, so does our reliance on this correspondence. The quality of the cedant’s historical evaluation of losses and loss information received from other cedants and brokers in relation to the same event are considered as we migrate from industry loss-based estimates to specific cedant information.
77
Table of Contents
While the approach we use in reserving for large events is applied with consistency, at any point in time the specific reserving assumptions may vary among contracts. The assumptions for a specific contract may depend upon the class of business, historical reporting patterns of the cedant, whether or not the cedant provides an IBNR estimate, how much of the loss has been paid, the number of underlying claims still open, the number of claims potentially subject to litigation and other factors. For example, the expected loss development for a contract with 1% of its claims still open would likely be less than for a contract with 50% of its claims still open.
For non-catastrophe losses, including those affecting our primary insurance business, we often apply trend-based actuarial methodologies in setting reserves, including paid and incurred loss development, Bornheutter-Ferguson and frequency and severity techniques. We also utilize industry loss ratio and development pattern information in conjunction with our own experience. The weight given to a particular method will depend on many factors, including the homogeneity within the class of business, the volume of losses, the maturity of the accident year and the length of the expected development tail. For example, development methods rely on reported losses, while expected loss ratio methods are typically based on expectations established prior to a notification of loss. Therefore, as an accident year matures, we may migrate from an expected loss ratio method to an incurred development method.
To the extent we rely on industry data to aid us in our reserve estimates, there is a risk that the data may not match our risk profile or that the industry’s overall reserving practices differ from our own and those of our cedants. In addition, reserving can prove to be especially difficult should a significant loss take place near the end of a financial reporting period, particularly if the loss involves a catastrophic event. These factors further contribute to the degree of uncertainty in our reserving process.
As a predominantly broker-market reinsurer for both excess-of-loss and proportional contracts, we must rely on loss information reported to brokers by primary insurers who, in turn, must estimate their own losses at the policy level, often based on incomplete and changing information. The information we receive varies by cedant and may include paid losses, estimated case reserves and an estimated provision for IBNR reserves. Reserving practices and the quality of data reporting varies among ceding companies, which adds further uncertainty to the estimation of our ultimate losses. The nature and extent of information received from ceding companies and brokers also varies widely depending on the type of coverage, the contractual reporting terms (which are affected by market conditions and practices) and other factors. Due to the lack of standardization of the terms and conditions of reinsurance contracts, the wide variability of coverage provided to individual clients and the tendency of those coverages to change rapidly in response to market conditions, the ongoing economic impact of such uncertainties and inconsistencies cannot always be reliably measured. Additional risks to us involved in the reporting of retrocessional contracts include varying reserving methodologies used by the original cedants and an additional reporting lag due to the time required for the retrocedant to aggregate its assumed losses before reporting them to us. Additionally, the number of contractual intermediaries is normally greater for retrocessional business than for insurance and reinsurance business, thereby further increasing the time lag and imprecision associated with loss reporting.
Time lags are inherent in loss reporting, especially in the case of excess-of-loss reinsurance contracts. Also, the combined characteristics of low claim frequency and high claim severity make the available data more volatile and less useful for predicting ultimate losses. In the case of proportional contracts, we rely on an analysis of a contract’s historical experience, industry information and the professional judgment of underwriters in estimating reserves for these contracts. In addition, we utilize ultimate loss ratio forecasts when reported by cedants and brokers, which are normally subject to a quarterly or six month lag for proportional business. Due to the degree of reliance that we place on ceding companies for claims reporting, our reserve estimates are highly dependent on ceding companies’ management judgment. Furthermore, during the loss settlement period, which may last several years, additional facts regarding individual claims and trends often will become known, and case law may change, all of which can affect ultimate expected losses.
The nature and extent of loss information provided under many facultative and per occurrence excess-of-loss contracts, where our personnel work closely with the ceding company in settling individual claims, may not differ significantly from the information received under a primary insurance contract. Loss information from aggregate excess-of-loss contracts, including catastrophe losses and proportional treaties, will often be less detailed. Occasionally, such information is reported in summary format rather than on an individual claim basis.
Since we rely on ceding company estimates of case and IBNR reserves in the process of establishing our own loss and LAE reserves, we maintain certain procedures designed to mitigate the risk that such information is incomplete or inaccurate. These procedures may include: (i) comparisons of expected premiums to reported premiums, which helps us to identify delinquent client periodic reports; (ii) ceding company audits to facilitate loss reporting and identify inaccurate or incomplete reporting of claims; and (iii) underwriting reviews to ascertain that the losses ceded are covered
78
Table of Contents
as provided under the contract terms. We also use catastrophe model outputs and industry market share information to evaluate the reasonableness of reported losses, which are also compared to loss reports received from other cedants and brokers. In addition, each subsequent year of loss experience with a given cedant provides additional insight into the accuracy and timeliness of previously reported information. These procedures are incorporated in our internal controls process on an ongoing basis and are regularly evaluated and amended as market conditions, risk factors, and unanticipated areas of exposure develop. Our claims handling follow-up actions do not permit us to capture data which records the extent to which ceding company claims are subsequently adjusted as a result of these activities, nor do they permit us to determine the extent to which our actions influence the accuracy of subsequent cedant reporting. Nonetheless, we: (i) reserve the right to perform ceding company audits in order to facilitate loss reporting and identify inaccurate or incomplete claims reporting; and (ii) consider unreliable reporting to be a factor which influences an underwriters’ willingness to offer terms to potential cedants. We believe that our diligence in these matters promotes better reporting by cedants and brokers over the long term. In our history, disputes with ceding companies have been rare and those which have not been resolved in negotiation have been resolved through arbitration in accordance with contractual provisions.
The development of our prior-year losses is monitored during the course of subsequent calendar years by comparing the actual reported losses against expected losses. The analysis of this loss development is an important factor in our ongoing refinement of the assumptions underlying our reserving process. Our internal analysis of changes in prior year reserve estimates is focused on changes in the estimated ultimate loss and therefore management believes that it is not meaningful to split the movement of prior year loss reserve estimates between case reserves and IBNR. With regards to our short-tail property book of business, we do not feel that we can predict the breakdown of losses in the first year with a high level of accuracy. The percentage split between paid losses, case reserves and IBNR would vary greatly depending on the number, nature and timing of losses throughout the year. However, we would expect that by the end of the year subsequent to the year in which the loss occurred, the majority of these short-tail property losses would be reported to us, and by the end of the following year the majority would be paid.
Estimating loss reserves for our book of longer-tail casualty reinsurance business, which can be written on an excess-of-loss or proportional basis, involves further uncertainties. In addition to the uncertainties inherent in the reserving process referred to above, casualty business can be subject to longer reporting lags than property business and claims often take several years to settle. During this period additional factors and trends will be revealed and, as they become apparent, we may adjust our reserves. There is also the potential for the emergence of new types of losses within our casualty book. Therefore, any factors that extend the time until claims are settled add uncertainty to the reserving process. Furthermore, determining the appropriate level of casualty reserves is largely dependent upon our view of premium rates at any given time. Therefore, overestimating the extent to which premium rates have increased (or decreased) can lead to an understatement (or overstatement) of loss reserves. This uncertainty is particularly relevant in relation to Montpelier at Lloyd’s business that is underwritten by its managing agents and coverholders. At December 31, 2014 and 2013, we recorded gross loss and LAE reserves related to our casualty business of $242.4 million and $223.2 million, respectively.
Our internal actuaries, our Chief Executive Officer (“CEO”) and our Chief Financial Officer (“CFO”) each review our reserving assumptions and our methodologies on a quarterly basis. Our third quarter and year-end loss estimates are subject to a corroborative review by both an independent loss reserve specialist and an independent registered public accounting firm, each using generally accepted actuarial principles. The Audit Committee also reviews our quarterly and annual reserve analyses.
We do not typically experience significant claims processing backlogs, although such backlogs may occur following a major catastrophic event. At December 31, 2014 and 2013, we did not have a significant backlog in either our insurance or reinsurance claims processing.
The uncertainties inherent in the reserving process, together with the potential for unforeseen developments, including changes in laws and the prevailing interpretation of policy terms, may result in our loss and LAE reserves being materially greater or less than the loss and LAE reserves we initially established. Any adjustments to our loss and LAE reserves are reflected in our financial results during the period in which they are determined. Changes to our prior year loss reserves will impact our current underwriting results by improving our results if the prior year reserves prove to be redundant or impairing our results if the prior year reserves prove to be insufficient.
79
Table of Contents
GAAP does not permit us to record or carry contingency reserves for catastrophe losses that are expected to occur in the future. Therefore, during periods in which significant catastrophe loss events occur, our underwriting results are likely to be adverse and, during periods in which significant catastrophe loss events do not occur, our underwriting results are likely to be favorable.
We believe that our reserves for loss and LAE are sufficient to cover losses that fall within the terms of our policies and agreements with our insured and reinsured customers on the basis of the methodologies used to estimate those reserves. There can be no assurance, however, that actual losses will not be less than or exceed our total established reserves.
The following tables provide the details of our gross case reserves and IBNR, by line of business, at December 31, 2014 and 2013:
|
(Millions) |
|
Gross
IBNR
at Dec. 31,
2014 |
|
Gross Case
Reserves
at Dec. 31,
2014 |
|
Gross Loss
and LAE
Reserves
at Dec. 31,
2014 |
|
|
|
|
|
|
|
|
|
|
|
|
|
|
Property Catastrophe - Treaty |
|
$ |
89.5 |
|
$ |
73.6 |
|
$ |
163.1 |
|
|
Property Specialty - Treaty |
|
42.4 |
|
28.3 |
|
70.7 |
|
|
Other Specialty - Treaty |
|
217.9 |
|
94.5 |
|
312.4 |
|
|
Property and Specialty Individual Risk |
|
127.1 |
|
102.4 |
|
229.5 |
|
|
Total |
|
$ |
476.9 |
|
$ |
298.8 |
|
$ |
775.7 |
|
|
(Millions) |
|
Gross
IBNR
at Dec. 31,
2013 |
|
Gross Case
Reserves
at Dec. 31,
2013 |
|
Gross Loss
and LAE
Reserves
at Dec. 31,
2013 |
|
|
|
|
|
|
|
|
|
|
|
Property Catastrophe - Treaty |
|
$ |
123.9 |
|
$ |
100.9 |
|
$ |
224.8 |
|
|
Property Specialty - Treaty |
|
59.4 |
|
41.0 |
|
100.4 |
|
|
Other Specialty - Treaty |
|
227.5 |
|
72.8 |
|
300.3 |
|
|
Property and Specialty Individual Risk |
|
138.9 |
|
117.2 |
|
256.1 |
|
|
Total |
|
$ |
549.7 |
|
$ |
331.9 |
|
$ |
881.6 |
|
The portion of our gross loss and LAE reserves at any given time represented by IBNR tends to be lower in periods during which we experience large loss events (such as catastrophes) than those during which we experience loss events of a lower severity. This is because losses from larger events tend to move from IBNR to reported losses much faster than those of a lower severity. With respect to 2014 and 2013, years in which we experienced no large loss events, our ending gross IBNR reserves remained consistent at 61% and 62% of our total ending gross loss and LAE reserves, respectively.
We have determined that our best estimates for our gross loss and LAE reserves at December 31, 2014 and 2013 were $775.7 million and $881.6 million, respectively. Of these estimates, at December 31, 2014 and 2013, $167.6 million and $174.6 million related to our direct insurance business, respectively, and $608.1 million and $707.0 million related to our reinsurance business, respectively.
Favorable development of prior period net losses experienced as a percentage of our opening net loss reserves across all underwriting years was 18.6%, 14.3% and 8.7% for the years ended December 31, 2014, 2013 and 2012, respectively. As of December 31, 2014, we estimate that a 15% change in our net unpaid loss and LAE reserves would result in an increase or decrease in our net income or loss and shareholders’ equity of approximately $109.1 million. The net income or loss and shareholders’ equity impact of the change in net reserves might be partially offset by adjustments to items such as reinstatement premiums, profit commission expense, incentive compensation and income taxes.
80
Table of Contents
Written and Earned Insurance and Reinsurance Premiums
Reinsurance contracts can be written on a risks-attaching or losses-occurring basis. Under risks-attaching reinsurance contracts, all claims from cedants’ underlying policies incepting during the contract period are covered, even if they occur after the expiration date of the reinsurance contract. In contrast, losses-occurring reinsurance contracts cover all claims occurring during the period of the contract, regardless of the inception dates of the underlying policies. Any losses occurring after the expiration of the losses-occurring contract are not covered.
Premiums written are recognized as revenues, net of any applicable underlying ceded reinsurance, and are earned over the term of the related policy or contract. For direct insurance, and facultative and losses-occurring contracts, the earnings period is the same as the term of the reinsurance contract, which is ordinarily twelve months. For risks-attaching contracts, the earnings period is based on the terms of the underlying insurance policies, which extends from the inception date of the first policy bound during the contract term to the termination date of the last policy bound, and thereby exceeds the term of the reinsurance contract.
Insurance and facultative reinsurance contracts are written based on agreed upon terms and conditions which include a stated premium for coverages provided. The stated premium is then recorded as written premium at the effective date of the policy. In general, if the terms and conditions change during the policy period, either through policyholder request or underwriting audit, the policy would be endorsed to reflect the change in coverage. This endorsement usually generates a change to the policy premium which is then recorded as an adjustment to our written premiums in the period the endorsement becomes effective.
Our assumed treaty reinsurance premiums are written on an excess-of-loss or on a pro-rata basis. Reinsurance contracts are typically written prior to the time the underlying direct policies are written by cedants and accordingly they must estimate such premiums when purchasing reinsurance coverage. For the majority of excess-of-loss contracts, including insurance contracts, a deposit or minimum premium is defined in the contract wording. The deposit or minimum premium is based on the ceding company’s estimated premiums and this estimate is recorded as written premium in the period the underlying risks incept. In the majority of cases, this premium is adjustable at the end of the contract period to reflect the changes in underlying risks in force during the contract period. Subsequent adjustments, based on reports by the ceding companies of actual premium, are recorded in the period they are determined, which is normally within six months to one year subsequent to the expiration of the policy. To date these adjustments have not been material.
For pro-rata contracts and certain excess-of-loss contracts in which a deposit or minimum premium is not specified in the contract, written premium is recognized evenly over the term of the reinsurance contract based on estimates of ultimate premiums provided by the ceding companies and brokers. When the actual premium is reported by the ceding company, typically on a quarterly or six month lag, it may be significantly higher or lower than the estimate.
We regularly evaluate the appropriateness of these premium estimates based on the latest information available, which includes actual reported premiums to date, the latest premium estimates as provided by cedants and brokers, historical experience, management’s professional judgment, information obtained during the underwriting renewal process and a continuing assessment of relevant economic conditions. Any adjustments to premium estimates are recorded in the period in which they become known. Adjustments to original premium estimates could be material and may significantly impact earnings in the period they are determined.
Excess-of-loss contracts often include contract terms that require an automatic reinstatement of coverage in the event of a loss. The associated reinstatement premium is normally calculated on the basis of: (i) a fixed percentage (normally 100%) of the deposit or minimum premium; and (ii) the proportion of the original limit exhausted. In a year of relatively large loss events (such as 2012), reinstatement premiums will be higher than in a year in which there are no such events (such as 2014 and 2013). Reinstatement premiums are fully earned or expensed as applicable when a triggering loss event occurs and losses are recorded. We record reinstatement premiums on a basis consistent with our estimates of loss and LAE. During 2014, 2013 and 2012, we recorded net written and earned reinstatement premiums totaling $8.7 million, $1.5 million and $13.1 million, respectively.
We routinely review the creditworthiness of our cedants on the basis of our market knowledge, the cedant’s current financial strength ratings, the timeliness of cedants’ past payments and the status of current balances owing. Based on our reviews, we established allowances of $3.7 million and $3.6 million for uncollectible insurance and reinsurance premiums receivable as of December 31, 2014 and 2013, respectively, each of which represented less than one percent of our consolidated net insurance and reinsurance premiums earned in those years.
81
Table of Contents
Ceded Reinsurance
In the normal course of business, we purchase reinsurance from third parties in order to manage our exposures. The amount of ceded reinsurance that we buy varies from year to year depending on our risk appetite, as well as the availability and cost of the reinsurance coverage. Ceded reinsurance premiums are earned on a basis consistent with those used in accounting for the underlying premiums assumed, and are reported as a reduction of net premiums written.
Certain of our assumed pro-rata contracts incorporate reinsurance protection provided by third-party reinsurers that inures to our benefit. These reinsurance premiums are reported as a reduction in our gross premiums written and earned.
The cost of reinsurance purchased varies based on a number of factors. The initial premium associated with excess-of-loss reinsurance is normally based on the underlying premiums we assume. As these reinsurance contracts are typically purchased prior to the time the assumed risks are written, ceded reinsurance premiums recorded in the period of inception reflect an estimate of the amount that we will ultimately pay. In the majority of cases, the premiums initially recorded are subsequently adjusted to reflect premiums actually assumed by us during the contract period. These adjustments are recorded in the period that they are determined, and to date they have not been significant. In addition, losses which pierce excess-of-loss reinsurance cover may generate reinstatement premiums ceded, depending on the terms of the contract. Reinstatement premiums ceded are recognized as written and earned when the loss occurs and the reinsurance recovery is estimated and recorded.
The cost of pro-rata reinsurance is initially based on our estimated gross premiums written related to the specific lines of business covered by the reinsurance contract. As gross premiums are written during the period of coverage, reinsurance premiums ceded are adjusted in accordance with the terms of the reinsurance agreement.
Reinsurance recoverable on paid losses represents amounts currently due from reinsurers. Reinsurance recoverable on unpaid losses represents amounts that will be collectible from reinsurers once the losses are paid. The recognition of reinsurance recoverable requires two key judgments. In determining our ceded IBNR, the first judgment involves the estimation of the amount of gross IBNR to be ceded to reinsurers. Ceded IBNR is developed as part of our loss reserving process and consequently, the estimate is subject to risks and uncertainties similar to the estimation of gross IBNR. The second judgment relates to the amount of the reinsurance recoverable balance that ultimately will not be collected from reinsurers due to insolvency, contractual dispute or other reasons.
As of December 31, 2014 and 2013, we recorded $7.1 million and $3.6 million in reinsurance recoverable on paid losses, respectively, and $48.7 million and $63.6 million in reinsurance recoverable on unpaid losses, respectively. We record provisions for uncollectible reinsurance recoverable when collection becomes unlikely due to the reinsurer’s inability to pay. Based on a review of the financial condition of the reinsurers and other factors, we have determined that a reserve for uncollectible reinsurance recoverable on paid and unpaid loss and LAE was not considered necessary as of December 31, 2014 and 2013.
We are subject to litigation and arbitration proceedings in the normal course of our business. Such proceedings often involve insurance or reinsurance contract disputes, which are typical for the insurance and reinsurance industry. Expected or actual reductions in our reinsurance recoveries due to insurance or reinsurance contract disputes (as opposed to a reinsurer’s inability to pay) are not recorded as an uncollectible reinsurance recoverable. Rather, they are factored into the determination of, and are reflected in, our net loss and LAE reserves.
As of December 31, 2014 and 2013, we had no ongoing material reinsurance contract disputes.
Share-Based Compensation
At the discretion of the Compensation Committee, incentive awards, the value of which are based on Common Shares, may be made to our eligible employees, consultants and non-employee directors. Share-based incentive awards currently outstanding consist solely of RSUs, all of which were awarded under either the Company’s 2012 Long Term Incentive Plan (the “2012 LTIP”) or the Company’s former 2007 Long Term Incentive Plan (the “2007 LTIP”), collectively the “LTIPs”.
RSUs are phantom (as opposed to actual) Common Shares which, depending on the individual award, vest in equal tranches over a one to five-year period, subject to the recipient maintaining a continuous relationship with Montpelier through the applicable vesting date. RSUs are payable in Common Shares upon vesting (the amount of which may be reduced by applicable statutory income tax withholdings at the recipient’s option). RSUs do not require the payment of an exercise price and are not entitled to voting rights, but they are entitled to receive payments equivalent to any dividends and distributions declared on the Common Shares underlying the RSUs.
82
Table of Contents
We currently use Variable RSUs as the principal component of our ongoing long-term incentive compensation for our employees. Variable RSUs are awarded based on our performance during the Initial RSU Period and are earned ratably each year based on continued employment over a four-year vesting period. Since the number of RSUs to be awarded is dependent upon our performance during the Initial RSU Period, the number of RSUs estimated to be awarded for that cycle may fluctuate throughout the Initial RSU Period.
For each of the years presented, the number of Variable RSUs expected to be formally awarded to employees was based on our increase in FCBVPCS for such year. FCBVPCS is computed by dividing the common shareholders’ equity available to the Company by the sum of its ending Common Shares and unvested RSUs outstanding. Our calculation of the increase in our FCBVPCS represents the growth in our FCBVPCS during the Initial RSU Period, after taking into account dividends on Common Shares declared during such period.
We also use Fixed RSUs as a supplemental component of our ongoing long-term incentive compensation for certain of our employees and non-employee directors. Unlike Variable RSUs, the number of Fixed RSUs is fixed on the grant date. Fixed RSUs are typically granted for the following purposes: (i) to induce individuals to join Montpelier; (ii) to retain certain key employees; (iii) to reward employees for exhibiting outstanding individual performance; and (iv) as remuneration to non-management members of the boards of directors of both the Company and MAL. Additionally, when the actual number of Variable RSUs to be awarded in any given year has been formally determined, they are effectively converted into Fixed RSUs.
For the 2014-2017 Variable RSU award cycle, the targeted performance metric was based on a 2014 increase in FCBVPCS of 10.0%, which would have generated a grant of approximately 495,000 Variable RSUs to participants. The payout range for that year was from a threshold of 3.0% (generating no RSUs) to a maximum of 17.0% (generating approximately 990,000 Variable RSUs). Throughout the Initial RSU Period for this cycle, our quarterly Variable RSU accrual for this cycle varied in response to actual year-to-date results achieved and ranged from as many as 850,262 RSUs (as recorded at December 31, 2014) to as few as 494,340 RSUs (as recorded at March 31, 2014). Because we determined our achieved increase in FCBVPCS for 2014 to be 15.0%, the preliminary number of Variable RSUs expected to be granted for the 2014-2017 Variable RSU award cycle was determined to be 850,262 at December 31, 2014. The final number of Variable RSUs granted for the 2014-2017 Variable RSU award cycle will be formally determined by the Compensation Committee on February 26, 2015 and any adjustments required to be made will be recorded in our consolidated financial statements in the first quarter of 2015.
For the 2013-2016 Variable RSU award cycle, the targeted performance metric was based on a 2013 increase in FCBVPCS of 9.76%, which would have generated a grant of approximately 500,000 Variable RSUs to participants. The payout range for that year was from a threshold of 2.76% (generating no RSUs) to a maximum of 16.76% (generating approximately 1,000,000 Variable RSUs). Throughout the Initial RSU Period for this cycle, our quarterly Variable RSU accrual for this cycle varied in response to actual year-to-date results achieved and ranged from as many as 900,800 RSUs (as recorded at December 31, 2013) to as few as 498,954 RSUs (as recorded at March 31, 2013). Because we determined our achieved increase in FCBVPCS for 2013 to be 14.3%, the preliminary number of Variable RSUs expected to be granted for the 2013-2016 Variable RSU award cycle was determined to be 900,800 at December 31, 2013. The final number of Variable RSUs granted for the 2013-2016 Variable RSU award cycle was formally determined to be 883,537 RSUs (or 166% of the in force target RSUs for that cycle at that time) by the Compensation Committee in February 2014.
For the 2012-2015 Variable RSU award cycle, the targeted performance metric was based on a 2012 increase in FCBVPCS of 9.88%, which would have generated a grant of approximately 560,000 Variable RSUs to participants. The payout range for that year was from a threshold of 2.88% (generating no RSUs) to a maximum of 16.88% (generating approximately 1,120,000 Variable RSUs). Throughout the Initial RSU Period for this cycle, our quarterly Variable RSU accrual for this cycle varied in response to actual year-to-date results achieved and ranged from as many as 1,068,556 RSUs (as recorded at September 30, 2012) to as few as 669,105 RSUs (as recorded at March 31, 2012). Because we determined our achieved increase in FCBVPCS for 2012 to be 17.0%, the preliminary number of Variable RSUs expected to be granted for the 2012-2015 Variable RSU award cycle was determined to be 1,058,304 at December 31, 2012. The final number of Variable RSUs granted for the 2012-2015 Variable RSU award cycle was formally determined to be 1,058,304 RSUs (or 200% of the in force target RSUs for that cycle at that time) by the Compensation Committee in February 2013.
83
Table of Contents
For the years covered by this Report on Form 10-K/A, we assumed a zero to 8.8% forfeiture rate depending on the nature and term of individual awards and past and recent experience. Our forfeiture assumptions serve to reduce the unamortized grant date fair value of outstanding RSUs as well as the associated RSU expense. As RSUs are actually forfeited, the number of RSUs outstanding is reduced and the remaining unamortized grant date fair value is compared to assumed forfeiture levels. True-up adjustments are made as deemed necessary.
During 2014, 2013 and 2012, we also granted 49,000, 35,000 and 50,700 Fixed RSUs, respectively, to certain of our employees and non-management directors.
During 2014, 2013 and 2012, we recognized $19.8 million, $18.0 million and $12.1 million of RSU expense, respectively.
As of December 31, 2014, the unamortized grant date fair value of the 1,520,764 RSUs outstanding was $17.0 million. As of December 31, 2013, the unamortized grant date fair value of the 1,448,374 RSUs outstanding was $12.2 million.
Item 7A. Quantitative and Qualitative Disclosures About Market Risk
We believe that our consolidated balance sheet is principally exposed to four types of market risk consisting of: (i) interest rate risk; (ii) foreign currency risk; (iii) equity price risk; and (iv) credit risk. In addition, we believe that our consolidated balance sheet is also exposed to natural catastrophe risk and the effects of inflation.
Market Risk
Fixed Maturity Investments and Other Investments. As a provider of short-tail insurance and reinsurance for losses resulting mainly from natural and man-made catastrophes, we could be required to pay significant losses on short notice. Since changes in market interest rates result in fluctuations in the fair value of our fixed maturity investments and certain of our other investments, we have structured our investment portfolio with high-quality fixed maturity securities with a short average duration in order to reduce our sensitivity to interest rate fluctuations and to provide adequate liquidity for the settlement of our expected liabilities. Nonetheless, if our calculations with respect to the timing of the payment of our liabilities are incorrect, or if we improperly structure our investment portfolios, we could be forced to liquidate our investments at inopportune times, potentially at a significant loss.
We manage the interest rate risk associated with our fixed maturity investments and certain of our other investments by monitoring the average duration of the portfolio, which allows us to achieve an acceptable yield without subjecting the portfolio to an unreasonable level of interest rate risk.
The table below summarizes the estimated pre-tax effects of increases and decreases in market interest rates on our fixed maturity investments and certain of our other investments as of December 31, 2014 and 2013:
|
Fixed Maturity Investments
($ in millions) |
|
Fair Value (1) |
|
Hypothetical
Change
in Market
Interest Rates |
|
Resulting
Estimated
Fair Value |
|
Resulting
Increase
(Decrease)
in Fair Value |
|
|
As of December 31, 2014 |
|
$ |
2,462.0 |
|
100 bp decrease |
|
$ |
2,481.9 |
|
$ |
19.9 |
|
|
|
|
|
|
100 bp increase |
|
2,422.8 |
|
(39.2 |
) |
|
|
|
|
|
|
|
|
|
|
|
|
As of December 31, 2013 |
|
$ |
2,360.2 |
|
100 bp decrease |
|
$ |
2,435.2 |
|
$ |
75.0 |
|
|
|
|
|
|
100 bp increase |
|
2,292.6 |
|
(67.6 |
) |
(1) The net amount shown for 2014 represents the aggregate value of our long fixed maturity investments ($1,901.0 million) plus our fixed maturity investments held within our other investments ($631.5 million) less our liability for fixed maturities sold short ($70.5 million), each presented at December 31, 2014. The net amount shown for 2013 represents the aggregate value of our long fixed maturity investments ($2,430.8 million) plus our fixed maturity investments held within our other investments ($59.4 million) less our liability for fixed maturities sold short ($130.0 million), each presented at December 31, 2013.
84
Table of Contents
Debt. Our outstanding debt at December 31, 2014 and 2013 consisted of the 2022 Senior Notes, the Trust Preferred Securities and BCRH’s borrowings under the BCRH Credit Agreement. The 2022 Senior Notes bear interest at a fixed rate of 4.70% per annum and are scheduled to mature on October 15, 2022, the Trust Preferred Securities bear interest at a floating rate equal to the 3-month LIBOR plus 380 basis points, reset quarterly, and are scheduled to mature on March 30, 2036 and our borrowings under the BCRH Credit Agreement are short-term obligations which bear interest at a floating rate equal to the 3-month LIBOR plus 100 basis points.
At December 31, 2014, the fair value of the 2022 Senior Notes was $306.3 million, which compared to a carrying value of $299.3 million. At December 31, 2013, the fair value of the 2022 Senior Notes was $303.2 million, which compared to a carrying value of $299.2 million.
At December 31, 2014, the fair value of the Trust Preferred Securities was $92.0 million, which compared to a carrying value of $100.0 million. At December 31, 2013, the fair value of the Trust Preferred Securities was $89.5 million, which compared to a carrying value of $100.0 million.
At December 31, 2014, the fair value of BCRH’s outstanding borrowings under the BCRH Credit Agreement, which must be repaid in early 2015, approximated their carrying value of $8.0 million.
In February 2012 we entered into the LIBOR Swap, which will result in the future net cash flows in connection with the Trust Preferred Securities, for the five-year period beginning March 30, 2012, being the same as if these securities bore interest at a fixed rate of 4.905%, provided we hold the LIBOR Swap to its maturity. At December 31, 2014 and 2013, the fair value of the LIBOR Swap (which is recorded as an other investment on our consolidated balance sheets) was negative $0.3 million and negative $0.5 million, respectively.
Derivative Instruments. As of December 31, 2014 and 2013, we had the following derivative instruments, expressed either as a net asset, (liability) or (contra-asset), with direct or indirect exposure to fluctuations in market interest rates: (i) Credit Derivatives with a fair value of $1.8 million and $(0.2) million, respectively, (ii) Interest Rate Contracts with a fair value of less than $0.1 million and $1.5 million, respectively; and (iii) Investment Options and Futures (long and short) with a fair value of less than $0.1 million and $2.5 million, respectively.
The table below summarizes the estimated hypothetical pre-tax effects of increases and decreases in market interest rates on our derivative instruments as of December 31, 2014 and 2013:
|
Derivative Instruments
($ in millions) |
|
Fair Value |
|
Hypothetical
Change
in Market
Interest Rates |
|
Resulting
Estimated
Fair Value |
|
Resulting
Increase
(Decrease)
in Fair Value |
|
|
As of December 31, 2014 |
|
$ |
1.8 |
|
100 bp decrease |
|
$ |
2.1 |
|
$ |
0.3 |
|
|
|
|
|
|
100 bp increase |
|
1.5 |
|
(0.3 |
) |
|
|
|
|
|
|
|
|
|
|
|
|
As of December 31, 2013 |
|
$ |
3.8 |
|
100 bp decrease |
|
$ |
(7.3 |
) |
$ |
(11.1 |
) |
|
|
|
|
|
100 bp increase |
|
12.7 |
|
8.9 |
|
The table above excludes the effects of any hypothetical increases and decreases in market interest rates on the LIBOR Swap because the LIBOR Swap serves to fix the amount of future net cash flows in connection with the Trust Preferred Securities, for the five-year period beginning March 30, 2012, at a fixed rate of 4.905%.
Foreign Currency Risk
We often collect premiums and pay losses in foreign currencies. We also maintain a portion of our investment portfolio in foreign currencies. Accordingly, we are exposed to fluctuations in the exchange rates of these currencies.
Our reporting currency is the U.S. dollar. The British pound is the functional currency for the operations of Syndicate 5151, MUAL, MCL and MUSL. The U.S. dollar is the functional currency for all our other operations. The assets and liabilities of our foreign operations are converted to U.S. dollars at exchange rates in effect at the balance sheet date, and the related revenues and expenses are converted using average exchange rates for the period. Net foreign currency gains and losses arising from translating our foreign operations to U.S. dollars are reported as a separate component of our shareholders’ equity as translation gains and losses, with changes therein reported as a component of our other comprehensive income.
85
Table of Contents
Our U.K. operations had net liabilities denominated in British pounds with a U.S. dollar equivalent value of $15.2 million at December 31, 2014. Assuming a hypothetical 10% increase (or decrease) in the rate of exchange from British pounds to U.S. dollars as of December 31, 2014, we would expect the carrying value of these net liabilities to increase (or decrease) by approximately $1.5 million.
During 2014, 2013 and 2012, we recorded pretax net foreign currency transaction gains (losses), separately presented in our consolidated statements of operations and comprehensive income, of $9.4 million, $(15.9) million and $(12.8) million, respectively. In addition, during 2014, 2013 and 2012, we recorded pretax net foreign currency transaction gains (losses) associated with our loss and LAE, which we record as favorable or (unfavorable) loss and LAE reserve development, of $(8.6) million, $7.5 million and $6.7 million, respectively. During 2014, 2013 and 2012, we also recorded net foreign currency translation gains (losses) in our consolidated statements of operations and comprehensive income of $(2.4) million, $0.9 million and $0.8 million, respectively.
From time to time we enter into, either directly or indirectly through our investment managers, Foreign Exchange Contracts that constitute obligations to buy or sell specified currencies at future dates at prices set at the inception of each contract. We enter into these contracts in connection with both our underwriting and investing activities.
Foreign Exchange Contracts designed to protect our insurance and reinsurance balances against movements in foreign currency rates do not eliminate fluctuations in the actual value of our assets and liabilities denominated in foreign currencies; rather, they provide an offsetting benefit or detriment against such exchange rate movements. Foreign Exchange Contracts related to our investing activities are designed to either protect our cash and invested assets from movements in foreign currency rates or to enhance our investment performance.
We recorded net income (losses) associated with our Foreign Exchange Contracts of $1.9 million, $(2.5) million and $3.6 million during 2014, 2013 and 2012, respectively.
Whereas the exposure associated with our Foreign Exchange Contracts is typically unlimited, the vast majority of the Foreign Exchange Contracts we have historically entered into have served to eliminate, or otherwise reduce, our exposure to foreign currency movements with respect to our existing assets and liabilities.
Equity Price Risk
The fair value of our equity securities and certain of our other investments and derivative instruments are based on quoted market prices or our estimates of fair value (which are based, in part, on quoted market prices) as of the balance sheet date. Market prices of equity securities, in general, are subject to fluctuations which could cause the amount to be realized upon sale or conversion to differ significantly from the carrying value as of the balance sheet date. These fluctuations may result from perceived changes in the underlying economic characteristics of the investee, the relative price of alternative investments, general market conditions and supply and demand imbalances for a particular security or instrument.
We estimate that a 10% price increase or decrease affecting the value of our equity securities and certain of our other investments and derivative instruments (those with exposure to equity price risk) as of December 31, 2014 and 2013, would have had an net impact to our total shareholders’ equity of less than 1% as of those dates.
Credit Risk
Our financial instruments, which potentially subject us to concentrations of credit risk, consist principally of our investment securities (primarily our fixed maturity investments and certain of our other investments), credit derivatives, insurance and reinsurance premiums receivable and our reinsurance recoverables.
Fixed Maturity Investments. We believe that we have a high-quality fixed maturity investment portfolio, meaning that we would expect that our exposure to the loss of principal resulting from issuer credit difficulties to be less than that of an entity with a lower quality fixed maturity portfolio. We measure the quality of our fixed maturity investment portfolio based on its average overall rating, which was “A+” (Strong) by Standard & Poor’s at December 31, 2014, and by the overall strength and consistency of its fair value over time.
We also believe that we have no significant concentrations of credit risk from a single issue or issuer within our investment portfolio other than concentrations in U.S. government and U.S. government-sponsored enterprises. Our investment guidelines prohibit us from owning an undue concentration of a single issue or issuer, other than U.S.-backed securities, and we did not own an aggregate fixed maturity investment in a single entity, other than U.S.-backed securities, in excess of 10% of our total shareholders’ equity at December 31, 2014 and 2013.
86
Table of Contents
As of December 31, 2014, 67% of our fixed maturity investments were either rated “A” (Strong) or better by Standard & Poor’s (or an equivalent rating with another recognized rating agency), 11% were rated “BBB” (Good) by Standard & Poor’s (or an equivalent rating with another recognized rating agency) and 22% were either unrated or rated below “BBB” by Standard & Poor’s (or an equivalent rating with another recognized rating agency). As of December 31, 2013, 68% of our fixed maturity investments were either rated “A” (Strong) or better by Standard & Poor’s (or an equivalent rating with another recognized rating agency), 11% were rated “BBB” (Good) by Standard & Poor’s (or an equivalent rating with another recognized rating agency) and 21% were either unrated or rated below “BBB” by Standard & Poor’s (or an equivalent rating with another recognized rating agency).
In accordance with our investment controls and guidelines, we routinely monitor the credit quality of our fixed maturity investments, including those involving investments in: (i) the Eurozone; (ii) commercial mortgage backed securities; (iii) non-agency collateralized residential mortgage obligations; (iv) U.S. state and local municipalities; (v) subprime and Alternative A exposed mortgage-backed securities; and (vi) those securities that benefit from credit enhancements provided by third-party financial guarantors. As of December 31, 2014 and 2013, the total market value of the fixed maturity investments that we held in each of these classes approximated the associated amortized cost. A summary of the details associated with these investments follows:
We currently hold long and short fixed maturity investments with exposure to the Eurozone. As of December 31, 2014, we held $141.5 million of net sovereign, corporate and asset-backed fixed maturity investments with exposure to the Eurozone with an amortized cost of $142.4 million. Of our total Eurozone holdings at December 31, 2014, $40.1 million represented net debt obligations of financial corporations with an amortized cost of $40.2 million. As of December 31, 2013, we held $155.2 million of net sovereign, corporate and asset-backed fixed maturity investments with exposure to the Eurozone with an amortized cost of $152.0 million. Of our total Eurozone holdings at December 31, 2013, $52.9 million represented net debt obligations of financial corporations with an amortized cost of $51.7 million.
We currently hold commercial mortgage backed securities (“CMBS Securities”) within our fixed maturity portfolio. As of December 31, 2014, we held $101.4 million of CMBS Securities with an amortized cost of $100.6 million, 91% of which were rated “BBB” (Good) or better by Standard & Poor’s (or an equivalent rating with another recognized rating agency). As of December 31, 2013, we held $138.9 million of CMBS Securities with an amortized cost of $137.7 million, 97% of which were rated “BBB” (Good) or better by Standard & Poor’s (or an equivalent rating with another recognized rating agency).
We currently hold non-agency collateralized residential mortgage obligations (“Non-Agency CMOs”) within our fixed maturity portfolio. Non-Agency CMOs are not backed by a U.S. government-sponsored enterprise. As of December 31, 2014, we held $86.6 million of Non-Agency CMOs with an amortized cost of $85.7 million, 85% of which were rated “BBB” (Good) or better by Standard & Poor’s (or an equivalent rating with another recognized rating agency). As of December 31, 2013, we held $119.2 million of Non-Agency CMOs with an amortized cost of $118.1 million, 23% of which were rated “BBB” (Good) or better by Standard & Poor’s (or an equivalent rating with another recognized rating agency).
We currently hold U.S. state and local municipal bonds within our fixed maturity portfolio. As of December 31, 2014, we held $19.4 million of municipal bonds with an amortized cost of $19.4 million, 80% of which were rated “BBB” (Good) or better by Standard & Poor’s (or an equivalent rating with another recognized rating agency). As of December 31, 2013, we held $47.1 million of municipal bonds with an amortized cost of $47.2 million, 79% of which were rated “BBB” (Good) or better by Standard & Poor’s (or an equivalent rating with another recognized rating agency).
We currently hold fixed maturity investments that have exposure to subprime and Alternative A mortgage markets. As of December 31, 2014, we held $5.9 million of subprime and Alternative A investments with an amortized cost of $5.5 million, 12% of which were rated “BBB” (Good) or better by Standard & Poor’s (or an equivalent rating with another recognized rating agency). As of December 31, 2013, we held $76.3 million of subprime and Alternative A investments with an amortized cost of $76.5 million, 13% of which were rated “BBB” (Good) or better by Standard & Poor’s (or an equivalent rating with another recognized rating agency).
We currently hold fixed maturity investments that are subject to credit enhancements provided by third-party financial guarantors. As of December 31, 2014, we held $1.6 million of credit enhanced investments with an amortized cost of $1.6 million. As of December 31, 2013, we held $4.5 million of credit enhanced investments with an amortized cost of $4.4 million. We estimate that these investments held at December 31, 2014 and 2013 would be rated “BBB-” (Good) or better by Standard & Poor’s excluding the effects of financial guarantee enhancements, if they were rated on that basis.
87
Table of Contents
Other Investments. We hold fixed maturity investments in various investment funds and limited partnership interests within our other investment portfolio. As of December 31, 2014 and 2013, we held $631.5 million and $59.4 million, respectively, of other investments with exposure to fixed and floating rate fixed maturity investments (net of short positions).
The overall investment objective of the various fixed maturity investments contained within our other investment portfolio is to achieve an adequate risk-adjusted total return, primarily though investments in fixed and floating rate securities denominated in various currencies which are issued by governments, government agencies, supranational, financial institutions and corporate issuers worldwide. These fixed maturity investments often incorporate long and short credit exposures and often employ the use of investment-related derivatives in order to achieve their targeted investment return goals. We estimate that the fixed maturity investments held within our other investment portfolio at December 31, 2014 and 2013 had an average credit rating of “AA” (Very Strong) and “BBB” (Good), respectively, by Standard & Poor’s (or an equivalent rating with another recognized rating agency).
Insurance and Reinsurance Premiums Receivable. We underwrite the majority of our business through independent insurance and reinsurance brokers. Credit risk exists to the extent that one or more of these brokers are unable to fulfill their contractual obligations to us. For example, we are frequently required to pay amounts owed on claims under policies to brokers, and these brokers, in turn, pay these amounts to the ceding companies that have reinsured a portion of their liabilities with us. In some jurisdictions, if a broker fails to make such a payment, we might remain liable to the ceding company for the deficiency. In addition, in certain jurisdictions, when the ceding company pays premiums for these policies to brokers, these premiums are considered to have been paid and the ceding insurer is no longer liable to us for those amounts, whether or not we have actually received them.
Our premiums receivable are recorded at amounts due less an allowance for doubtful accounts. As of December 31, 2014 and 2013, our allowance for doubtful accounts was $3.7 million and $3.6 million, respectively.
Reinsurance Recoverable. We remain liable for losses we incur to the extent that any third-party reinsurer is unable or unwilling to make timely payments to us under our reinsurance agreements. We also remain liable in the event that any of our ceding companies were unable to collect amounts due from their underlying third-party reinsurers where such reinsurance would otherwise enure to our benefit.
Under our reinsurance security policy, our reinsurers are typically required to be rated “A-” (Excellent) or better by A.M. Best (or an equivalent rating with another recognized rating agency) at the time the policy is written. We also consider reinsurers that are not rated or do not fall within this threshold on a case-by-case basis if adequately collateralized. We monitor the financial condition and ratings of our reinsurers on an ongoing basis.
As of December 31, 2014 and 2013, we did not have any reinsurance recoverables from reinsurers rated less than “A-” by A.M. Best, except in those instances where the reinsurer has either: (i) fully-collateralized their reinsurance obligation to us; (ii) a Standard & Poor’s financial strength rating equivalent to an A.M. Best rating of “A-” (Excellent) or better; or (iii) subsequently entered run-off but is considered by management to be financially sound.
As of December 31, 2014 and 2013, we determined that an allowance for uncollectible reinsurance recoverable on paid and unpaid loss and LAE was not considered necessary.
Natural Catastrophe Risk
We have exposure to natural catastrophes around the world. We manage our exposure to catastrophes using a combination of CATM®, third-party models, underwriting judgment and ceded reinsurance. See “Natural Catastrophe Risk Management” contained in Item 7 herein.
Effects of Inflation
The pricing for our insurance and reinsurance products, our loss and LAE reserve estimates and our investment returns could be significantly impacted by changing rates of inflation and other economic conditions. We also take loss amplification into account in our catastrophe loss models and in establishing our loss and LAE reserves.
Item 8. Financial Statements and Supplementary Data
The financial statements and supplementary data have been filed as a part of this Report on Form 10-K/A as indicated in the Index to Consolidated Financial Statements and Financial Statement Schedules appearing on page 129 of this report.
88
Table of Contents
Item 9. Changes in and Disagreements With Accountants on Accounting and Financial Disclosure
None.
Item 9A. Controls and Procedures
Our Principal Executive Officer (“PEO”) and Principal Financial Officer (“PFO”) have evaluated the effectiveness of our disclosure controls and procedures (as defined in Rule 13a-15(e) of the Exchange Act) as of December 31, 2014. Based on that evaluation, our PEO and PFO have concluded that our disclosure controls and procedures are effective.
Our PEO and PFO have also evaluated the effectiveness of our internal control over financial reporting as of December 31, 2014. Based on that evaluation, our PEO and PFO have concluded that our internal controls over financial reporting are effective. Management’s annual report on internal control over financial reporting is included on page F-48 of this report. The audit report of PricewaterhouseCoopers Ltd., an independent registered public accounting firm, is included on page F-49 of this report.
There have been no changes in our internal controls over financial reporting during the fourth quarter of 2014 that have materially affected, or are reasonably likely to materially affect our internal control over financial reporting.
Item 9B. Other Information
None.
PART III
Item 10. Directors, Executive Officers and Corporate Governance
Directors
(as of March 30, 2015)
The current members of the Board and terms of each class are set forth below:
|
Name |
|
Age |
|
Position |
|
Director
Since |
|
|
|
|
|
|
|
|
|
Class A - term expiring 2015 |
|
|
|
|
|
|
|
|
|
|
|
|
|
|
|
John G. Bruton |
|
67 |
|
Director Nominee |
|
2010 |
|
Candace L. Straight |
|
67 |
|
Director Nominee |
|
2006 |
|
Anthony Taylor |
|
69 |
|
Chairman Nominee |
|
2001 |
|
|
|
|
|
|
|
|
|
Class B - term expiring 2016 |
|
|
|
|
|
|
|
|
|
|
|
|
|
|
|
Morgan W. Davis |
|
64 |
|
Director |
|
2006 |
|
Henry R. Keizer |
|
58 |
|
Director |
|
2013 |
|
John F. Shettle, Jr. |
|
60 |
|
Director |
|
2004 |
|
Susan J. Sutherland |
|
57 |
|
Director |
|
2013 |
|
|
|
|
|
|
|
|
|
Class C - term expiring 2017 |
|
|
|
|
|
|
|
|
|
|
|
|
|
|
|
Michael R. Eisenson |
|
59 |
|
Director |
|
2011 |
|
Christopher L. Harris |
|
45 |
|
Director, President and CEO |
|
2008 |
|
Nicholas C. Marsh |
|
59 |
|
Director |
|
2014 |
|
Ian M. Winchester |
|
68 |
|
Director |
|
2007 |
Mr. John D. Collins, an independent Class A director, resigned from the Board on June 30, 2014.
The following information presents the principal occupation, business experience, and recent business activities involving the Company and other affiliations of our directors:
89
Table of Contents
Class A Directors, term expiring in 2015:
John G. Bruton. Mr. Bruton has served as Prime Minister (Taoiseach) of Ireland from 1994 to 1997 and previously as Minister for Finance, Minister for Industry and Energy and Minister for Industry and Trade. He was also President of the Council of the European Union in 1996, member of the Presidency (Preasidium) of the Convention on the Future of Europe from 2001 to 2004 and Ambassador of the European Union to the U.S. from 2004 to 2009. He is currently a member of the Board of Directors of the Ingersoll Rand Corporation, Co-operation Ireland, Connect-Ireland Diaspora Loan Fund plc and the Centre for European Policy Studies. He is also a Distinguished Fellow at the Centre for Transatlantic Studies at Johns Hopkins University. He serves as President of IFSC Ireland and as Chairman of the Public Oversight Committee of Deloitte (Ireland). Mr. Bruton has an extensive understanding of institutional structures and policies, especially within the European Union and in terms of its relations with other regions, economies and markets.
Candace L. Straight. Ms. Straight is currently a self-employed investment banking consultant specializing in the insurance industry. From 1998 to 2003, she was an Advisory Director of Securitas Capital, LLC (“Securitas”), a global private equity investment firm specializing in insurance and financial services related industries. She is currently a director of Neuberger Berman Mutual Funds and is a current or former member or trustee of numerous non-profit boards and commissions. Throughout her career she has worked for numerous corporations, including Merck & Co. Inc. and Bankers Trust Company. From 1987 to 1996, Ms. Straight was a principal of Head & Company LLC, a merchant banking firm specializing in the insurance industry. Head & Company LLC acquired numerous companies, including Integon Corporation, Sphere Drake and Marketing One. Ms. Straight was president of Integon Corporation from 1990 to 1992 and served as a director until 1995. She also served as a director of Integon Life, Marketing One and Drake Holdings. Ms. Straight has extensive experience in the areas of capital and investment management, capital markets and strategic planning.
Anthony Taylor. Mr. Taylor currently serves as our Non-Executive Chairman, a post he has held since January 1, 2010. He previously served as the Company’s President, CEO and Executive Chairman. From 1983 to 1998, Mr. Taylor served as the Active Underwriter for Lloyd’s Syndicate Number 51 “A Taylor & Others,” a non-marine syndicate, which was managed initially by Willis Faber Agencies and later by Wellington Underwriting Agencies Limited (“Wellington Agencies”). From 1999 to 2001, Mr. Taylor was Chairman of Wellington Underwriting Inc., as well as Underwriting Director of Wellington Agencies. During 2001, Mr. Taylor was Chairman of Wellington Agencies and Deputy Chairman of Wellington Underwriting plc. Mr. Taylor is a Fellow of the Chartered Insurance Institute and has held various committee and board positions for the Lloyd’s market. From 2010 to 2012, Mr. Taylor served on the Board of Hardy Underwriting Bermuda Limited and during that same period he also served on the Board of CATCo Reinsurance Opportunities Fund Ltd. as Non-Executive Chairman. Mr. Taylor has more than forty-five years of experience in the global insurance and reinsurance industries and is an experienced public company executive and director.
Class B Directors, term expiring in 2016:
Morgan W. Davis. Mr. Davis currently serves as a director of White Mountains Insurance Group, Ltd. (“White Mountains”). He also serves as a director of OneBeacon Insurance Group, Ltd. (“OneBeacon”), a specialty insurer and an affiliate of White Mountains, and was formerly a Managing Director at OneBeacon from 2001 to 2005. From 1994 to 2001, Mr. Davis served in various executive capacities at White Mountains. Mr. Davis also previously served as a director of Answer Financial Inc. and Esurance Holdings, Inc., which were both wholly-owned subsidiaries of White Mountains at that time. Prior to that, he was with Fireman’s Fund Insurance Company for seven years and INA/Cigna Corporation (“CIGNA”) for ten years. In addition, Mr. Davis’ public service includes his role as a director on the board of directors of The African Development Foundation, an independent U.S. Federal agency established to support African-designed and African-driven solutions that address grassroots economic and social problems for marginalized populations. Mr. Davis has extensive insurance industry experience, specifically in the areas of underwriting and claims management, and is an experienced public company executive and director.
90
Table of Contents
Henry R. Keizer. Mr. Keizer formerly served as Deputy Chairman and Chief Operating Officer of KPMG, the U.S.-based and largest individual member firm of KPMG International (“KPMGI”), a role from which he retired in December 2012. KPMGI is a professional services organization which provides audit, tax and advisory services in 152 countries. Prior to serving as Deputy Chairman and Chief Operating Officer of KPMG, Mr. Keizer held a number of key leadership positions throughout his 35 years at KPMGI providing him with perspective on the issues facing major companies and the evolving business environment. Mr. Keizer served, among other positions, as Global Head of Audit, KPMGI from 2006 to 2010 and U.S. Vice Chairman of Audit, KPMG from 2005 to 2010 and he continues to serve as a director of Park Indemnity Limited, a Bermuda captive insurer of KPMGI. Mr. Keizer is also a director and Chairman of the Audit Committee of MUFG Americas Holdings Corporation and MUFG Union Bank, N.A. Mr. Keizer has extensive knowledge and understanding of financial accounting, reporting and auditing standards. He also has over three decades of diverse industry perspective gained through advising clients engaged in manufacturing, banking, insurance, consumer products, retail, technology and energy. With his strong financial and accounting background, Mr. Keizer also meets the SEC definition of an audit committee financial expert.
John F. Shettle, Jr. Mr. Shettle is currently an Operating Partner of Stone Point Capital (“Stone Point”), a private equity firm focused on the global financial services industry. Prior to joining Stone Point, Mr. Shettle was a Senior Advisor and Operating Partner at Lightyear Capital, a private equity firm providing buyout and growth capital to companies in the financial services industry. From August 2005 to November 2007, he was the President and CEO of the Victor O. Schinnerer Company, where he was responsible for running two of the largest underwriting management insurance organizations in North America, Victor O. Schinnerer & Company, Inc. and ENCON Group Inc. Mr. Shettle has served as a Senior Managing Director of Securitas and was the CEO of AVEMCO Corporation and Tred Avon Capital Advisors, Inc. Mr. Shettle is a director of Sagicor Financial Corporation and AAM Insurance Investment Management. Mr. Shettle has more than thirty years of experience in the global insurance industry and has extensive experience in underwriting, finance and strategic and operational management.
Susan J. Sutherland. Ms. Sutherland is a private investor who previously served as a senior partner in the Financial Institutions Group of Skadden, Arps, Slate, Meagher & Flom LLP until her retirement in March 2013 after a thirty-year career with the firm. For the last twenty years of her career she primarily represented U.S. and international insurance and reinsurance companies, investment banks and private equity firms in insurance-related corporate transactions. She also advised on a broad range of corporate transactions in industries including healthcare, transportation, and industrial and consumer goods. Ms. Sutherland has been appointed as a director of Hagerty Holding Corp., which through its subsidiaries is the leading provider of automobile and marine insurance for collectors, and as a trustee of the Eaton Vance Mutual Funds complex. Each of these board appointments is effective as of May 2015. Ms. Sutherland also presently serves on the Board of Directors of Literacy, Inc. and the New York Theatre Ballet, and is a Governance Fellow of the National Association of Corporate Directors. Ms. Sutherland has extensive legal experience and a broad knowledge of the U.S. and international insurance and reinsurance industries, having represented numerous industry participants in all lines of business. She also has experience in corporate finance, including initial public offerings, mergers and acquisitions, corporate restructurings, strategic planning, risk analysis, capital markets and investments.
Class C Directors, term expiring in 2017:
Michael R. Eisenson. Mr. Eisenson is currently a Managing Director, the Chief Executive Officer and co-founder of Charlesbank Capital Partners, LLC (“Charlesbank”), a private equity investment firm based in Boston and New York. Prior to co-founding Charlesbank in 1998, Mr. Eisenson was the President of Harvard Private Capital Group, Inc. (“Harvard”), Charlesbank’s predecessor. Before joining Harvard, Mr. Eisenson was with the Boston Consulting Group, a corporate-strategy consulting firm. Mr. Eisenson also serves on the Board of Directors of Blueknight Energy Partners and Penske Auto Group, Inc., as well as several privately held Charlesbank portfolio companies. Mr. Eisenson was formerly a director of CIFC Corp., Catlin Group Limited, Playtex Products, Inc. and Caliper Life Sciences. Mr. Eisenson has extensive experience in the areas of finance and investments and is an experienced public company director.
Christopher L. Harris. Mr. Harris has served as President and CEO of the Company since 2008. He originally joined the Company in 2002 as Chief Actuary and Senior Vice President (“SVP”) and was later named Chief Risk Officer in 2005 and Chief Underwriting and Risk Officer in 2006. Prior to joining the Company, from 2001 to 2002, Mr. Harris was employed by Allianz Risk Transfer, where he was Chief Actuary, North America. Prior to his employment with Allianz, Mr. Harris ran the actuarial and risk management consulting practice for KPMG Bermuda from 1998 to 2001. Mr. Harris is a Fellow of the Casualty Actuarial Society, a Chartered Property and Casualty Underwriter (“CPCU”) and a Chartered Financial Analyst (“CFA”) and has extensive experience in the global insurance and reinsurance industries, particularly in the areas of underwriting, actuarial and strategic and operational management.
91
Table of Contents
Nicholas C. Marsh. Mr. Marsh was employed as Director of Corporate Underwriting and Director of Underwriting Review at Atrium Underwriting Group Limited from 2007 until his retirement in December 2013. During his forty-year career with Atrium, Mr. Marsh also served as the Active Underwriter of Syndicate 570 at Lloyd’s from 1989 to 2005, and prior to that as an Underwriter of Syndicate 570 from 1973 to 1989, as Chairman of Atrium Underwriters Limited from 2005 to 2007 and Chief Executive Officer of Atrium Underwriting Plc from 2000 to 2005. He has served as a trustee of the Lloyd’s Benevolent Fund since 2007 and, from 2008 to 2013, he served as a member of the Council of Lloyd’s. Mr. Marsh has also served as non-executive Chairman of HCC International Insurance Company PLC and HCC at Lloyd’s since April 2014. Mr. Marsh has extensive underwriting and executive and governance experience, particularly within the London market.
Ian M. Winchester. Mr. Winchester is currently a Managing Partner and Chairman of the Investment Committee of BHC Winton Funds, L.P. investment funds, which focus on providing capital to Lloyd’s syndicates, and the Managing Director - Insurance for Brooks, Houghton & Co., a privately owned specialist investment banking and fund management firm founded in 1989. From 1985 to 2006, he was with T&H Holdings, Inc., parent of Toplis and Harding, Inc., one of the oldest independent insurance outsourced services companies in North America specializing in claims adjusting work, where he served as Chairman, President and CEO. From 1970 to 1985, he was with Winchester Bowring, Ltd., a specialist reinsurance broker at Lloyd’s and a subsidiary of Marsh & McLennan, Inc., where he served as Managing Director from 1976 to 1985, and from 1964 to 1970 he was with Alexander Howden, Ltd., now a part of Aon Corporation, where he served as an Assistant Director from 1968 to 1970. Mr. Winchester has also been an Underwriting Member of Lloyd’s since 1978. Mr. Winchester has over fifty years of experience in the insurance and reinsurance industry, particularly in the areas of reinsurance brokerage, insurance loss adjusting and strategic and operational management.
Executive Officers
(as of March 30, 2015)
|
Name |
|
Age |
|
Principal Position |
|
Executive
Officer
Since |
|
|
|
|
|
|
|
|
|
Christopher L. Harris (1) (2) |
|
45 |
|
President and CEO |
|
2006 |
|
Michael S. Paquette (3) |
|
51 |
|
CFO and Executive Vice President |
|
2007 |
|
Christopher T. Schaper (4) |
|
50 |
|
President, Montpelier Reinsurance Ltd. |
|
2011 |
|
Richard M.M. Chattock (5) |
|
51 |
|
CEO, Montpelier at Lloyd’s Limited |
|
2014 |
|
William Pollett (6) |
|
47 |
|
Chief Corporate Development and Strategy Officer and SVP |
|
2007 |
|
Timothy P. Aman (7) |
|
48 |
|
Chief Risk Officer and SVP |
|
2011 |
|
Jonathan B. Kim (8) |
|
49 |
|
General Counsel, Secretary and SVP |
|
2004 |
|
George A. (Chip) Carbonar (9) |
|
53 |
|
Controller and Vice President |
|
2011 |
(1) See the biography of Mr. Harris under this Item 10.
(2) Mr. Harris also serves as Chairman and CEO of Montpelier Re, Chairman of BCRH, Montpelier Re U.S. Holdings Ltd. (“MRUSHL”) and Cladium, and as a director of Blue Capital Re, Blue Capital Re ILS, Blue Water Re, BCML, MUI, MAL, MTR and Montpelier Holdings Limited (“MHL”).
(3) Mr. Paquette also serves as CFO of BCRH, President of MRUSHL and MTR, Chairman of MTR, and as a director of MRUSHL, MHL and MUI.
(4) Mr. Schaper also serves as a director of Montpelier Re, Blue Capital Re, Blue Capital Re ILS and Blue Water Re, and as Vice Chairman of Cladium.
(5) Mr. Chattock also serves as Chairman of MHL, MUSL, MCL, and MUI.
(6) Mr. Pollett also serves as Treasurer of the Company, Chief Corporate Development and Strategy Officer, SVP and Treasurer of Montpelier Re, President, CEO and a director of Blue Capital Re, Blue Capital Re ILS, Blue Water Re and BCML He also serves as President, CEO and a director of BCRH.
(7) Mr. Aman also serves as Chief Risk Officer of MTR.
(8) Mr. Kim also serves as a director and Secretary of MRUSHL, MUI and MTR, Secretary of Blue Water Re and BCML, Assistant Secretary of BCRH, Blue Capital Re and Blue Capital Re ILS and a director of Montpelier Re.
(9) Mr. Carbonar also serves as Controller and Vice President of MTR.
92
Table of Contents
Michael S. Paquette. Mr. Paquette serves as our CFO and is an Executive Vice President of the Company. He has held these positions since 2008. Mr. Paquette also serves as CFO of BCRH, a position he has held since August 2013. Prior to joining the Company in 2007 as Controller and SVP, he spent eighteen years with White Mountains in various capacities, including Controller and SVP, and four years with KPMG as an auditor. Mr. Paquette assisted White Mountains in establishing the Company in 2001 and is a Certified Public Accountant (“CPA”), a Certified Management Accountant, a Certified Financial Manager and a Chartered Global Management Accountant.
Christopher T. Schaper. Mr. Schaper serves as the President of Montpelier Re where he is responsible for the underwriting strategy, profitability and growth of Montpelier Re’s Bermuda-based businesses, including reinsurance and insurance accountability. Mr. Schaper joined Montpelier in 2011. Mr. Schaper has over twenty-five years of experience within the insurance and reinsurance industry, most recently with Endurance Specialty Holdings Ltd. where he served from 2002-2011, first, for Endurance Bermuda as Head of Casualty Treaty until 2006 and then as Head of Reinsurance and Chief Underwriting Officer from 2006-2011. Mr. Schaper is a CPCU.
Richard M.M. Chattock. Mr. Chattock joined Montpelier Re in March 2002. He founded Syndicate 5151 as Active Underwriter in 2007, becoming its Chief Underwriting Officer in 2011 and subsequently Chief Executive Officer in 2012. He has nearly 30 years of underwriting experience encompassing engineering risks, direct & facultative and catastrophe & risk excess property reinsurance, as well as specialty classes. His career has also included appointments with CIGNA and AXA Re in London and AIG in Brussels, and as Underwriting Manager of the Property and Casualty Division for the Cox Syndicate at Lloyd’s.
William Pollett. Mr. Pollett serves as Chief Corporate Development and Strategy Officer, Treasurer and is an SVP of the Company. He also serves as President and CEO of BCRH, Blue Water Re and BCML. Prior to joining the Company in 2006, he spent five years with ACE Group, initially as CFO of ACE Tempest Re and then as Senior Financial Analyst and Senior Vice President at ACE Limited. Prior to the ACE Group, Mr. Pollett was employed by the OIL Group of Companies for seven years in various capacities, including Treasurer and Vice President of its investment companies. Mr. Pollett is a CFA and a Chartered Accountant.
Timothy P. Aman. Mr. Aman serves as our Chief Risk Officer and is an SVP of the Company. As Chief Risk Officer, he is responsible for our risk management activities, including ceded reinsurance, catastrophe modelling, enterprise risk management and financial modelling. He joined the Company in 2007 as an SVP and Risk Management Officer, with nineteen years of insurance and reinsurance experience, including eleven years with Guy Carpenter & Company, LLC (“Guy Carpenter”). During his tenure as managing director at Guy Carpenter, Mr. Aman served as a senior reinsurance and retrocessional treaty broker and risk management advisor. From 1989 to 1996, he served in the International & Marine department at St. Paul Re and the actuarial department at CIGNA. He is a fellow of the Casualty Actuarial Society and is a member of the American Academy of Actuaries.
Jonathan B. Kim. Mr. Kim serves as General Counsel, Secretary and an SVP of the Company as well as Chairman of the Montpelier Re Foundation, the Company’s charitable arm. Prior to joining the Company from 1991 to 1998, he worked for Winthrop, Stimson, Putnam & Roberts (currently Pillsbury Winthrop Shaw Pittman LLP) in New York. Subsequently, he served as in-house counsel to a number of start-up ventures and worked in London as an Account Director for Modem Media, Inc. (now part of the Publicis Groupe S.A.). From 2002 to 2004, Mr. Kim was with AXA Advisors, LLC, a subsidiary of the AXA Group, in New York.
George A. (Chip) Carbonar. Mr. Carbonar serves as our Group Controller and is a Vice President of the Company. He has held the Group Controller position since 2011. Prior to joining the Company as Vice President and Assistant Group Controller in 2007, Mr. Carbonar served as Assistant Controller of OneBeacon Insurance Company for the previous nine years. Mr. Carbonar brings with him more than twenty-five years of operating experience in the Insurance industry covering many critical areas within the accounting and finance function and is a CPA.
Section 16(a) Beneficial Ownership Reporting Compliance
Section 16(a) of the Exchange Act requires the Company’s executive officers and directors and persons who own more than 10% of a registered class of the Company’s equity securities to file initial reports of ownership and reports of changes in ownership with the SEC. Such persons are required by SEC regulation to furnish the Company with copies of all Section 16(a) forms they file.
Based solely on our review of the copies of such forms received by us or written representations from certain reporting persons, during the year ended December 31, 2014, all Section 16(a) filing requirements applicable to the directors, executive officers and greater than 10% Shareholders were complied with by such persons on a timely basis.
93
Table of Contents
Code of Conduct and Ethics
The Company has adopted a Code of Conduct and Ethics for all its directors, officers and employees, including the Company’s CEO and CFO. This document is available on our website at (www.montpelierre.bm > Corporate Governance > Governance Documents > Code of Conduct and Ethics) and may also be obtained at no charge upon written request to the attention of the Company Secretary at Montpelier House, 94 Pitts Bay Road, Pembroke HM 08, Bermuda. Any waiver of any part of the Code of Conduct and Ethics for executive officers or directors may be made only by the Board (or the Audit Committee) and will be promptly disclosed to Shareholders as required by SEC and New York Stock Exchange (“NYSE”) rules.
Our Code of Conduct and Ethics has also been provided within this report as Exhibit 14. See “Exhibits and Financial Statement Schedules - (b) Exhibits” contained in Item 15 herein.
Corporate Governance
Director Nomination Process
There have been no changes to the procedures by which shareholders may recommend nominees to the Board within the past twelve months.
Audit Committee
The Audit Committee presently consists of Messrs. Keizer (Chairman), Marsh, Shettle, Winchester and Ms. Straight. The Audit Committee is primarily responsible for the integrity of the Company’s consolidated financial statements, the Company’s compliance with legal and regulatory requirements, the independence and qualifications of the Company’s independent registered public accounting firm and the performance of the Company’s internal audit function and independent registered public accounting firm.
The Board has determined that all members of the Audit Committee are “independent,” as defined by the NYSE, the SEC and the Company’s Independence Standards. The Board has further determined that, of the persons on the Audit Committee, at a minimum, Mr. Keizer meets the requirements of being an “Audit Committee Financial Expert” under Item 407(d) of Regulation S-K of the Exchange Act.
Item 11. Executive Compensation
Compensation Discussion and Analysis
In this section we detail the material components of the compensation awarded to and earned by the following executive officers (our “Named Executive Officers”).
|
Christopher L. Harris |
|
President and CEO (Principal Executive Officer) |
|
Michael S. Paquette |
|
CFO and EVP (Principal Financial Officer) |
|
Christopher T. Schaper |
|
President, Montpelier Reinsurance Ltd. |
|
Richard M.M Chattock |
|
CEO, Montpelier at Lloyd’s Limited |
|
William Pollett |
|
Chief Corporate Development and Strategy Officer and SVP |
We also describe our executive compensation philosophy and objectives, and we explain how and why the Compensation Committee adopted the Company’s current compensation policies and practices and approved the amounts set forth in the Summary Compensation Table.
Executive Summary
Corporate Governance
We seek to maintain the highest corporate governance standards. Our fully independent Compensation Committee reviews all compensation-related decisions with respect to our Named Executive Officers as well as our officers generally. Such decisions are reviewed, ratified and approved by our Board upon the Compensation Committee’s recommendation.
We also seek to align the interests of our executives and our Shareholders through the early adoption of corporate governance “best practices.” For example, in addition to our adoption of share ownership guidelines for senior executives, we adopted an incentive compensation recoupment, or “clawback”, policy prior to the issuance of final rules mandating such policies under the Dodd-Frank Wall Street Reform and Consumer Protection Act (“Dodd-Frank”). Both our clawback policy and ownership guidelines are applicable to our Named Executive Officers.
94
Table of Contents
Feedback from Shareholders on our corporate governance and compensation programs has been consistently positive. Since the introduction of the Advisory Vote to Approve Executive Compensation required under Section 14A of the Exchange Act — also known as “Say-on-Pay” - Shareholders have voted overwhelmingly in favor of our compensation arrangements (99% of the votes cast in 2014, 99% of the votes cast in 2013, and 94% of the votes cast in 2012, in each case excluding abstentions and non-votes). After reviewing the highly supportive results of the Company’s most recent Say-on-Pay vote, the Compensation Committee determined not to materially alter such arrangements for 2014. For more information on these components of our corporate governance program, see “Clawback Policy and Share Ownership Requirements.”
Corporate Performance
In 2014, we again achieved a highly favorable underwriting result as evidenced by a “combined ratio”, a widely-used measure of relative underwriting performance for insurance and reinsurance companies, of 66%. See “Property and Casualty Insurance and Reinsurance in General” contained in Item 1 of our 2014 Form 10-K. This performance, along with that of our investment portfolio, enabled us to achieve a 15.0% increase in our fully-converted book value per Common Share, inclusive of Common Share dividends declared (“FCBVPCS”). On a cumulative basis, our FCBVPCS through December 31, 2014, inclusive of Common Share dividends declared, has grown 10.5% annually since 2001 compared to an annual growth in the S&P 500 Index of 6.5% over the same period. We regard FCBVPCS as a meaningful and consistent measure of financial performance in our industry, and achieving FCBVPCS growth remains among the Company’s principal performance goals.
Following reviews in 2014, we again received favorable recognition from each of our rating agencies. Both A.M. Best and Fitch affirmed their “A” financial strength ratings for Montpelier Re and Standard & Poor’s affirmed Montpelier Re’s “A-” financial strength rating as well as its “strong” Enterprise Risk Management (“ERM”) rating.
Under the direction of our CEO, Mr. Harris, we reaffirmed our commitment to the growth of long-term shareholder value in 2014. Beyond the impressive underwriting performance of our Montpelier Bermuda, Montpelier at Lloyd’s and Collateralized Reinsurance platforms, we continued to expand our collateralized reinsurance asset management arm, which we market under the name “Blue Capital®.” Launched in 2012, Blue Capital® offers a range of innovative catastrophe reinsurance-linked investment products to institutional and retail investors. During 2014 Blue Capital® continued to see steady growth in its third-party capital under management, which stood at $625 million at January 1, 2015.
We also increased our Common Share dividend by 60% in the third quarter of 2014, representing our sixth consecutive dividend increase in six years.
Performance-Based Compensation
Our compensation philosophy is founded on a long-standing principle of aligning our executives’ incentives with the economic result experienced by our Shareholders. Accordingly, the performance measures employed by our incentive compensation program (“ICP”) are linked to our overall corporate results. Revenue-based metrics are not considered in measuring or allocating incentive compensation, since rewarding top-line growth, rather than value creation, could introduce the potential for unnecessary or excessive risk-taking by our executives.
Our ICP consists of cash bonuses under our annual bonus plan and share-based grants under the LTIPs. Share-based grants consist of variable and fixed restricted share units (“Variable RSUs” and “Fixed RSUs”, respectively). Variable RSUs are awarded based on Company performance during the initial year of a four-year award period, after which the number of RSUs is fixed and determined with vesting occurring ratably over the award period. For Fixed RSUs, the number of RSUs is fixed and determinable on the award grant date and vesting occurs over a one to five-year period. Vesting of both Variable RSUs and Fixed RSUs is subject to continued employment or qualified retirement by the award recipient over the award period.
Annual cash bonuses and Variable RSU awards are expressed with reference to a “target” level of performance set by the Compensation Committee. The achievement of a level of performance that falls between threshold and target levels or target and maximum levels is calculated using linear interpolation. A year-over-year change in the Company’s FCBVPCS above the target level is an indication that the Company has outperformed its goals and brings award recipients closer to their maximum payout levels. A year-over-year change in FCBVPCS below the target level is an indication that the Company has underperformed the target and brings award recipients closer to their threshold payout levels (or in a year of significant under-performance at or below the threshold level to a point where no incentive compensation is earned).
95
Table of Contents
The ICP allows us to design and achieve an appropriate balance and blend of annual cash and short- and long-term share-based incentive awards. The Compensation Committee has affirmed our allocation of such awards as appropriate, given our objective of aligning the interests of our Named Executive Officers with those of Shareholders.
The following chart illustrates the approximate allocation of compensation in 2014 for our Named Executive Officers, in each case excluding perquisites. Allocations reflect the split between:
· short- and long-term incentive awards (i.e., grants under our annual cash bonus plan vs. grants under the LTIPs);
and
· fixed compensation and variable components (i.e., base salaries vs. ICP awards).
The allocations are based on ICP payouts at target performance levels (see “Components of Compensation”) and exclude one-off discretionary awards. Base salaries represented a relatively small portion of the overall compensation for our senior executives, and in the case of our CEO, Mr. Harris, a proportionately smaller portion vs. years prior to 2013 as a result of his 2013 service agreement with the Company. See tables below and “Base Salary and Benefits.”
|
|
|
Christopher L.
Harris |
|
Michael S.
Paquette |
|
Christopher T.
Schaper |
|
Richard M.M.
Chattock |
|
William
Pollett |
|
Short-Term / Long-Term Incentive Awards * |
|
28% / 72% |
|
33% / 67% |
|
33% / 67% |
|
33% / 67% |
|
33% / 67% |
|
Fixed / Variable Component * |
|
22% / 78% |
|
25% / 75% |
|
25% / 75% |
|
25% / 75% |
|
25% / 75% |
* excluding perquisites.
As demonstrated above, at target-level performance, 67% to 72% of incentive compensation for our Named Executive Officers is both long-term and in the form of share-based compensation while 75% to 78% of their total compensation is variable and contingent on performance.
Variability of Performance-Based Compensation
Our business focuses on the assumption of catastrophic risks and the management of such risks. By its nature, this business is subject to cyclical market conditions, often prompted by severe but infrequent natural and man-made catastrophic events. Because a significant portion of our executive compensation is linked to the year-over-year change in our FCBVPCS - which can vary significantly depending on the frequency and severity of insured catastrophic risks and their relative impact to the insured risks we underwrite - the overall compensation awarded and paid to our Named Executive Officers in a given year can also vary significantly.
In 2014, a relatively low level of insured catastrophic events affected our business. As a result, 2014, like 2013 and 2012, was a highly successful year for the Company as measured by our growth in FCBVPCS. By contrast, 2011 was a record high catastrophe year, when no incentive compensation payouts were made to our Named Executive Officers and no incentive compensation based on Company performance was earned or paid to our employees generally. This reflects our philosophy that our employees, including most notably our Named Executive Officers, should not be rewarded in years in which our results are unsatisfactory.
The variability of our incentive payouts, which for our Named Executive Officers are directly linked to changes in our FCBVPCS, reflects a key belief on our part. Namely, that our employees throughout the Company are highly incentivized to deliver favorable results for Shareholders and to remain with the organization through periods of favorable and unfavorable market conditions, since the majority of our ICP is share-based and vests over multi-year periods.
Reflecting our pay-for-performance philosophy, and in accordance with our historical approach to executive compensation, we have avoided pay practices that might be considered problematic. For example, we do not provide any tax gross-ups or guaranteed bonuses to our Named Executive Officers, except in limited circumstances such as sign-on bonuses. In addition, all change in control benefits payable under the LTIPs, associated award agreements and the Company’s Severance Plan (the “Severance Plan”) have “double-trigger” vesting conditions. This double trigger condition means that such benefits would generally vest in connection with a change in control (trigger 1) only if the officer also experienced a qualifying termination (trigger 2). See “Potential Payments Upon Termination of Employment or Change in Control” and “Service Agreements.”
96
Table of Contents
The following table is a variation on the Summary Compensation Table appearing in this Report on Form 10-K/A . The Summary Compensation Table on page 106 discloses compensation for our Named Executive Officers according to the format required by the SEC and illustrates the value of all share-based incentive compensation based on the probable level of satisfaction of the applicable performance conditions as of the grant date, assuming target-level performance. By contrast, the supplemental table that appears below provides year-over-year comparisons of actual share-based compensation awarded and paid to our Named Executive Officers over the 2012-14 period. See “Grants of Plan-Based Awards”, “Outstanding Equity Awards at Fiscal Year-End” and “Option Exercises and Shares Vested” for additional information regarding our 2014 ICP awards.
Supplemental Table of Named Executive Officer Compensation
|
Named Executive Officer |
|
Base Salary |
|
Contingent
Annual Cash
Bonus |
|
Fair Value of
Variable RSU
Awards (3) |
|
Non-Contingent
Cash Bonuses
and One-Off
Grants of Fixed
RSUs (4) |
|
All Other
Compensation (5) |
|
Total
Compensation |
|
|
Christopher L. Harris |
|
|
|
|
|
|
|
|
|
|
|
|
|
|
2014 |
|
$ |
750,000 |
|
$ |
1,290,000 |
|
$ |
4,004,160 |
|
$ |
143,350 |
|
$ |
363,190 |
|
$ |
6,550,700 |
|
|
2013 (1) |
|
787,500 |
|
1,245,000 |
|
3,680,917 |
|
124,000 |
|
266,368 |
|
6,103,785 |
|
|
2012 |
|
900,000 |
|
1,800,000 |
|
2,662,500 |
|
— |
|
248,243 |
|
5,610,743 |
|
|
|
|
|
|
|
|
|
|
|
|
|
|
|
|
|
Michael S. Paquette |
|
|
|
|
|
|
|
|
|
|
|
|
|
|
2014 |
|
$ |
418,750 |
|
$ |
731,000 |
|
$ |
1,462,013 |
|
$ |
— |
|
$ |
117,576 |
|
$ |
2,729,339 |
|
|
2013 |
|
393,750 |
|
664,000 |
|
1,046,828 |
|
— |
|
90,200 |
|
2,194,778 |
|
|
2012 |
|
370,000 |
|
750,000 |
|
1,109,375 |
|
— |
|
82,599 |
|
2,311,974 |
|
|
|
|
|
|
|
|
|
|
|
|
|
|
|
|
|
Christopher T. Schaper |
|
|
|
|
|
|
|
|
|
|
|
|
|
|
2014 |
|
$ |
557,500 |
|
$ |
963,200 |
|
$ |
1,926,391 |
|
$ |
— |
|
$ |
341,551 |
|
$ |
3,788,642 |
|
|
2013 |
|
550,000 |
|
913,000 |
|
1,439,380 |
|
— |
|
282,831 |
|
3,185,211 |
|
|
2012 |
|
550,000 |
|
1,100,000 |
|
1,627,072 |
|
— |
|
264,833 |
|
3,541,905 |
|
|
|
|
|
|
|
|
|
|
|
|
|
|
|
|
|
Richard M.M. Chattock (2) |
|
|
|
|
|
|
|
|
|
|
|
|
|
|
2014 |
|
$ |
582,768 |
|
$ |
951,681 |
|
$ |
2,022,101 |
|
$ |
— |
|
$ |
159,477 |
|
$ |
3,716,027 |
|
|
2013 |
|
547,505 |
|
962,949 |
|
1,486,974 |
|
— |
|
124,235 |
|
3,121,663 |
|
|
2012 |
|
554,785 |
|
1,138,130 |
|
1,616,990 |
|
— |
|
116,870 |
|
3,426,775 |
|
|
|
|
|
|
|
|
|
|
|
|
|
|
|
|
|
William Pollett |
|
|
|
|
|
|
|
|
|
|
|
|
|
|
2014 |
|
$ |
322,500 |
|
$ |
567,600 |
|
$ |
1,135,191 |
|
$ |
— |
|
$ |
264,900 |
|
$ |
2,290,191 |
|
|
2013 |
|
294,653 |
|
498,000 |
|
588,828 |
|
— |
|
211,040 |
|
1,592,521 |
|
|
2012 |
|
276,913 |
|
400,000 |
|
618,162 |
|
— |
|
206,283 |
|
1,501,358 |
|
(1) Effective May 20, 2013, in conjunction with his service agreement, Mr. Harris’ base salary decreased from $900,000 to $750,000. This decrease was accompanied by an increase in his annual share-based compensation as a relative portion of his overall compensation, the majority of which consisted of contingent Variable RSUs linked to the Company’s performance. See “Compensation Discussion and Analysis - CEO Service Agreement.”
(2) For each of the years presented in the table above, Mr. Chattock’s salary and all other compensation have been converted to U.S. dollars based on the applicable average rate of exchange of U.S. dollars per British pound and his non-equity incentive plan compensation has been converted to U.S. dollars based on the applicable ending rate of exchange of U.S. dollars per British pound. Mr. Chattock’s share-based compensation is denominated in U.S. dollars.
(3) The amounts disclosed in this column reflect the value of Variable RSUs awarded to each of the Named Executive Officers during 2014, 2013 and 2012. The values in the table above are based on the fair value of the Variable RSUs as of their respective grant dates and also reflect the number of Variable RSUs actually earned based on Company performance, rather than an assumption that Variable RSUs would be earned at the target level, as required by the Summary Compensation Table. Awards granted in 2014, 2013 and 2012, which are contingent upon the Company’s performance during that year, resulted in 172%, 166% and 200% of the target RSUs actually being earned, respectively.
(4) For Mr. Harris, this column represents the value of his 2014 and 2013 annual Fixed RSU awards pursuant to his service agreement. See “Compensation Discussion and Analysis - CEO Service Agreement.” Vesting with respect to such Fixed RSUs is contingent solely on continued employment. The values in the table above are based on the fair value of the RSUs as of their respective grant dates.
(5) The amounts disclosed in this column reflect the value of perquisites and benefits, including dividend equivalents earned on outstanding RSUs, applicable Bermuda housing and travel allowances and applicable supplemental defined contribution pension benefits. In the case of Messrs. Harris and Schaper, such supplemental pension benefits are in the form of cash payments made in lieu of Company-provided contributions to a non-qualified deferred compensation plan, and in the case of Mr. Paquette, such supplemental pension benefits are in the form of a Company-provided contribution to a non-qualified deferred compensation plan for employees based in the U.S. See “Components of Compensation-Base Salary and Benefits-Retirement Benefits.”
97
Table of Contents
Compensation Philosophy and Practices
The primary goal of our compensation program has always been to attract, reward and retain key executives while promoting the long-term interests of the Company and Shareholders. We believe that executive compensation should correspond to long-term Shareholder value as measured by changes in our FCBVPCS. In support of this goal, we believe a significant portion of executive compensation should be at-risk and dependent upon our Company’s performance and that a significant portion of such compensation should be denominated in the same equity currency as the interests held by Shareholders (i.e., Common Shares). We adhere to this approach by utilizing a combination of contingent and highly-variable annual cash and long-term, share-based incentive awards.
Our Compensation Committee develops and oversees the Company’s executive compensation practices and retains discretion over such practices at all times.
Market and Peer Company Research
To determine competitive compensation levels for executives in Bermuda, the location of our principal executive office, we subscribe to or participate in the following independent local market surveys and services: PricewaterhouseCoopers Bermuda International Business Compensation Survey, Towers Watson Survey on Executive Compensation, the Bermuda Employers’ Council Employment Conditions and Benefits Survey and Equilar’s Compensation Benchmarking Service. In 2014, neither the Company nor the Compensation Committee engaged the services of an outside compensation consultant.
We also review compensation information obtained from publicly available sources, such as securities law filings. Based on factors deemed relevant by the Compensation Committee, such as market capitalization, annual premiums written and the markets in which we write business, we regard Aspen Insurance Holdings Ltd., Endurance Specialty Holdings Ltd., Everest Re Group, Ltd., PartnerRe Ltd., RenaissanceRe Holdings Ltd. and Validus Holdings, Ltd. as our primary peers. These companies have been selected as a basis for comparison since they compete with us in underwriting various lines of business and since we believe the operational and industry challenges faced by their executive officers are similar to those that confront our Named Executive Officers. We do not use this information or the results of independent market surveys to target compensation relative to our peers formulaically. Rather, the information provides us with a general overview of our market competitiveness.
We assess our executive compensation policy by closely monitoring our ability to attract and hire for key positions, as well as our employee satisfaction and turnover. A repeated inability to recruit or higher than anticipated turnover would signal that our policy is out of step with our industry or our peers. We believe our compensation policy has been effective in recent years, enabling us to attract and retain key employees and resulting in a zero voluntary turnover rate for executive officers since 2009, excluding retirements in the normal course.
We believe our compensation packages provide a meaningful array of incentives that correspond reasonably with packages for comparable positions in our industry. The Compensation Committee has chosen not to target strict, narrowly-applied market percentiles for any component of compensation in favor of a more flexible and dynamic approach. This approach provides the ability to address specific business conditions relevant to the Company, including the continued diversification of our underwriting lines and expansion of our business platforms. The approach also allows us to encourage and reward entrepreneurial efforts by executives that promote the Company’s growth.
Risk Assessment of Compensation Program
Our ERM activities include the assessment and management of risks associated with our compensation program, at all times subject to the oversight of our Compensation Committee. We have reviewed and considered all of the Company’s compensation policies and practices and have concluded that they do not create risks that are reasonably likely to have a material adverse effect on the Company.
In conducting our 2014 risk assessment, we engaged in our annual enterprise-wide review of our compensation program. We identified and categorized the risks associated with the program, and we documented them and assigned ownership of the risks and their associated controls to our Board, its standing committees and management as appropriate. We have incorporated these risks and controls into our ERM framework via the Company’s Risk Register, a risk management tool that enables us to identify and analyze the risks we face as an enterprise and to document the controls in place for managing such risks. The Risk Register creates a consistent view of risk across the Company allowing management to focus resources on key risks and the development of risk management controls.
98
Table of Contents
Controls that enable us to effectively manage risks related to our underwriting and investment activities - and in turn our compensation program - include: (i) the Company’s Corporate Risk Policy, (ii) our ERM Committee (a broad range of managers charged with implementing our ERM program) and (iii) our Investment and Underwriting guidelines, which are overseen by our Board’s Finance and Underwriting Committees, respectively. Furthermore, our Audit Committee reviews and discusses our risk assessment and risk management processes at least annually with both management and our internal auditors. As discussed above under “Market and Peer Company Research”, we also compare our compensation practices with those of peer companies through reviews of market surveys and publicly-available information, and we implement and maintain compensation-related controls such as our Clawback Policy and Share Ownership Guidelines.
When assessing the effectiveness of our controls, we focus on elements of our compensation program that could create undue or unintentional risks or encourage excessive or unnecessary risk-taking by our employees. Our assessment analyzes a broad range of considerations, including but not limited to the identification of risks; the sufficiency of risk controls; the balance of potential risks to potential rewards within specific elements of the program; and the effectiveness of our ICP in discouraging risk-taking by our employees beyond our ability to effectively manage and mitigate such risks.
While our risk assessment is comprehensive in nature, we pay particular attention to elements of the program that provide for variable payouts and the controls on participants with the ability to affect such payouts, either directly or indirectly. We focus our attention on these elements, since some groups within the Company may have portions of their overall compensation tailored to their specific business or operational platforms and goals.
Based on the foregoing, we believe our compensation program and its associated policies, practices and controls do not create inappropriate or unintended material risk to the Company. We also believe our ICP provides incentives that discourage undue risk-taking by our employees, since a significant portion of pay under the ICP consists of equity awards that vest over multi-year periods.
Our Incentive Compensation Program
Our annual cash bonus opportunities and Variable RSU awards under our ICP are earned based on achievement of a “change in FCBVPCS” performance measure. We believe this approach: (i) directly aligns our interests and motivations with those of Shareholders; (ii) provides our employees with the ability to easily understand and identify with, their incentive targets, since we present our calculations of FCBVPCS in our quarterly earnings releases and SEC filings; and (iii) allows Shareholders to precisely monitor the performance results of the key performance metric used to determine the incentive compensation of our Named Executive Officers.
We also believe our “change in FCBVPCS” metric provides an objective measure of our performance and our executives’ ability to:
· identify and select underwriting and investment opportunities intelligently;
· develop methods and tools for assessing and monitoring insurance risk;
· improve operational efficiencies; and
· avoid or reduce other business risks such as strategic, legal/regulatory, reputational, credit, liquidity and foreign exchange.
Our ICP is designed to foster a robust and efficient ERM framework. Consistent with this framework, our executives are rewarded primarily via performance-based equity awards with payouts to all participating executives based solely on changes in our FCBVPCS. From an ERM perspective, this payout structure serves as a control over excessive risk-taking by any one individual or area of the Company. The awards, which vest in full over multiple years, are designed to promote decisions and behavior that match our long-term appetite for underwriting and investment risk.
We calculate FCBVPCS by dividing our common Shareholders’ equity available to the Company by the sum of our outstanding Common Shares and unvested RSUs outstanding. The change in FCBVPCS represents the change in this metric during any particular period, after taking into account any dividends on Common Shares declared during such period.
99
Table of Contents
Threshold, target and maximum performance measures for 2014 were established as increases in FCBVPCS of 3.0%, 10.0% and 17.0%, respectively. No payout would result from an increase of 3.0% or less; an increase of 10.0% would result in a target payout; and an increase of 17.0% or more would result in the maximum payout. Payouts based on achievement of performance goals between threshold and target levels or target and maximum levels are calculated using linear interpolation. The selected 2014 performance levels represent returns of 115, 815 and 1,515 basis points over the ten-year U.S. Treasury rate at the beginning of the 2014 calendar year for threshold, target and maximum awards, respectively. These performance levels compare to 2013’s FCBVPCS increases of 2.76%, 9.76% and 16.76% (representing 100, 800 and 1,500 basis points over the ten-year U.S. Treasury rate at the beginning of the 2013 calendar year) for threshold, target and maximum awards, respectively. We believe these selected performance metrics served as adequate risk-adjusted return targets for Shareholders given our risk profile at the relevant times.
Components of Compensation
The compensation of our Named Executive Officers is governed by their service agreements, our ICP, our Severance Plan (as applicable) and any other compensation arrangements we offer staff generally. Service agreements are a common feature among our peer companies, particularly for executives who relocate from their home countries. For more information, see “Service Agreements.”
A. Base Salary and Benefits
Salaries and benefits for our employees are set by reference to the nature and demands of the position, the knowledge, skills and experience of the individual and the markets in the locations in which we operate.
Base Salaries. In accordance with our compensation philosophy and objectives, we offer our Named Executive Officers competitive base salaries that are proportionate to their day-to-day responsibilities. Ending base salaries range from 19% of overall target compensation for Mr. Harris to 25% of overall target compensation for all other Named Executive Officers, in each case excluding perquisites.
Effective May 20, 2013, in conjunction with his service agreement, Mr. Harris’ base salary decreased from $900,000 to $750,000. This decrease was accompanied by an increase in his equity compensation as a relative portion of his overall compensation, with the majority of the share-based component consisting of Variable RSUs linked to the Company’s performance. Mr. Harris and the Compensation Committee mutually determined that it was desirable to reduce his base salary in exchange for an increase in share-based compensation in order to place a greater percentage of his compensation at risk, which further aligns his long-term interests with those of Shareholders. See “Compensation Discussion and Analysis - CEO Service Agreement.” For each of 2014 and 2013, Mr. Paquette’s base salary was increased by $25,000, reflecting a combination of merit and market adjustments. For 2014, Mr. Pollett’s base salary was increased by $30,000, reflecting his promotion to CEO of BCML. We also provided nominal adjustments for Messrs. Schaper and Chattock in 2014 of approximately 2% of their base salaries. Increases and adjustments for Messrs. Paquette, Pollett, Schaper and Chattock were each effective April 1 of the applicable year(s). See “Compensation Discussion and Analysis -Supplemental Table of Named Executive Officer Compensation” for further details on compensation and benefits for our Named Executive Officers.
Benefits. The principal employee benefits we offer our executives are retirement and health benefits. Certain of our Bermuda-based executives also receive personal travel and housing allowances. We do not pay tax gross-ups to any of our Named Executive Officers relating to any benefit programs or perquisites. As a result of our annual review of benefit programs, we believe our benefits and perquisites are consistent with the practices of Bermuda-based peer companies. See “Personal Travel and Housing Allowances.”
Retirement Benefits. The Company provides its employees with customary retirement benefits through Company-funded or Company-matched defined contribution retirement programs. For U.S. citizens and residents, the programs consist primarily of two qualified 401(k) plans: one for participants residing in the U.S. and one for U.S. citizens residing in Bermuda. Substantially equivalent programs for employees who are not U.S. citizens or residents have been established in accordance with Bermuda law and the laws of the other jurisdictions where we maintain offices. Our Named Executive Officers participate in these retirement plans on the same terms and conditions as our other full-time employees.
100
Table of Contents
Due to limitations associated with U.S. qualified retirement plans, Messrs. Harris, Paquette and Schaper also received non-qualified supplemental defined contribution pension benefits to equalize their total 2014 pension benefits with those of Messrs. Chattock and Pollett at 10% of their base salaries. Messrs. Harris and Schaper, who are U.S. citizens and reside in Bermuda, received their 2014 supplemental pension benefits in cash to prevent the benefits from constituting deferred compensation within the meaning of Section 457A of the Code. Mr. Paquette, who is a U.S. citizen and principally resides in the U.S., received his 2014 supplemental pension benefit in the form of a Company-provided contribution to a non-qualified deferred compensation plan for certain employees based in the U.S. See “All Other Compensation- 2014” and “Non-Qualified Deferred Compensation-2014.”
Health and Welfare Plans. The Company provides all qualifying employees with comprehensive health and welfare benefits, including medical, dental, life and disability insurance. Our U.S.-based employees, including Mr. Paquette, bear a portion of the cost of these benefits.
Personal Travel and Housing Allowances. We provide personal travel allowances to our Bermuda-based executive officers for a certain number of return trips to their home countries. Certain of our Bermuda-based executives also receive housing allowances to help defray the high cost of housing in the local market, however among our Named Executive Officers, only Messrs. Schaper and Pollett receive such an allowance. Mr. Paquette, who is based in the U.S., receives neither personal travel nor housing allowances. The Company does not maintain or use corporate jet aircraft for business or personal travel by our executives. See “Perquisites and Other Personal Benefits-2014.”
Bermuda Permanent Residency Certificates. During 2014, the Company paid one-time fees of $25,000 on behalf of each of Messrs. Harris, Schaper and Pollett to secure a Bermuda Permanent Residency Certificate (“PRC”) for each executive. A PRC permits a qualifying Bermuda resident the right to permanently reside and work in Bermuda (without a requisite work permit) and to acquire Bermuda property. Messrs. Harris, Schaper and Pollett have each agreed to fully reimburse the Company for the cost of this benefit should they choose to voluntarily terminate their employment with the Company prior to October 2017.
B. Annual Cash Bonuses
General Framework. Pursuant to our ICP, we provide annual cash bonus opportunities to our Named Executive Officers that are entirely tied to the Company’s increase in FCBVPCS. Each year, the Compensation Committee establishes threshold, target and maximum bonus opportunities for the Company’s cash bonus plan, each expressed as a percentage of base salary, as well as appropriate performance criteria. This process enables the Compensation Committee to adjust the plan in light of developments affecting the industry as a whole and the Company in particular. The expression of incentive compensation measures as percentages of salary is a standard industry approach and one we believe enables our employees and Shareholders to better understand how bonuses are calculated.
Within our annual cash bonus plan, we utilize varying individual performance weightings depending on a particular employee’s position with the Company. Those with greater levels of overall responsibility, such as our Named Executive Officers, have weightings that are entirely weighted toward Company performance. By contrast, those with comparatively less overall responsibility have weightings substantially weighted toward individual performance. This relative weighting of performance metrics permits those employees with limited opportunities to influence our overall results to remain eligible for an annual cash bonus even in years where the Company’s performance falls at or below threshold bonus levels.
2014 Performance Measurement. Our 2014 annual bonus plan was also based on a “change in FCBVPCS” performance measure. This measure, first recommended by the Compensation Committee and approved by the Board at the beginning of the 2013 performance cycle, was carried over to 2014. See “Our Incentive Compensation Program”, above.
The threshold, target and maximum 2014 bonus amounts for each of our Named Executive Officers were 0%, 100% and 200% of base salary, respectively. Threshold, target and maximum FCBVPCS performance levels were set at 3.0%, 10.0% and 17.0%, respectively, for all bonus plan participants with no payout resulting from an increase of 3.0% or less; an increase of 10.0% resulting in a target payout; and an increase of 17.0% or more resulting in the maximum payout. Payouts based on achievement of performance goals between threshold and target levels or target and maximum levels are calculated using linear interpolation.
101
Table of Contents
For 2014, our actual increase in FCBVPCS, inclusive of Common Share dividends declared, was 15.0%. As a result, the payouts received by each of our Named Executive Officers were equal to 1.72 times their ending base salaries (172% of their target bonus). See “Management’s Discussion and Analysis of Financial Condition and Results of Operations” contained in Item 7 of our 2014 Form 10-K for a description and calculation of our FCBVPCS as of December 31, 2014, and our increase in FCBVPCS for the year ended December 31, 2014.
Although the Compensation Committee retains absolute discretion in determining the final value of annual cash bonuses for our Named Executive Officers based on extenuating circumstances or otherwise, the Compensation Committee did not exercise such discretion for 2014. As in past years, the Company did not provide any guaranteed bonuses to its Named Executive Officers for 2014.
C. Long-Term Incentive Awards
General Framework. The LTIPs allow for a broad range of incentive award grants, including Fixed and Variable RSUs, restricted Common Shares, incentive share options (on a limited basis), non-qualified share options, share appreciation rights, deferred share units, performance compensation awards, performance units, cash incentive awards and other equity-based and equity-related awards. As of December 31, 2014, the only incentive awards outstanding under the LTIPs were RSUs.
RSUs vest in equal tranches over a one- to five-year period, depending on the individual award, subject to the recipient maintaining an active employment relationship with the Company in good standing through the vesting date. Holders of RSUs are not entitled to voting rights but are entitled to receive dividend equivalents in amounts equal to any dividends paid with respect to the Common Shares that underlie such RSUs. Upon satisfaction of all vesting conditions, RSUs are payable in Common Shares (the amount of which may be reduced by applicable statutory income tax withholdings at the recipient’s option).
In 2014, we continued to use annual Variable RSU awards as the principal component of our long-term incentive compensation, including incentive compensation granted to our Named Executive Officers. Pursuant to our Variable RSU awards, the number of RSUs to be awarded is dependent upon a pre-defined performance metric set by the Compensation Committee (currently the Company’s change in FCBVPCS) prior to the initial year of the four-year award period and ranges from zero to 200% of a target number. After completion of the initial year of the award period and application of the performance metric to that year, the number of Variable RSUs actually granted relative to the target is determined (or no longer varies) and becomes fixed. The award then vests ratably over the four-year award period, subject to the employee’s continued employment. Because the number of Variable RSUs expected to be awarded may fluctuate throughout the first year of an award period, dividend equivalent payments for the initial year are made in arrears.
The target number of annual Variable RSUs for the 2014-2017 award cycle was calculated as two (2) times base salary for Messrs. Paquette, Schaper, Chattock and Pollett, in each case divided by the New York Stock Exchange price per Common Share at the beginning of the year ($29.10 with respect to 2014). Mr. Harris’ target number of annual Variable RSUs for the 2014-2017 award cycle was equal to approximately 300% of his base salary as per his service agreement. See “Compensation Discussion and Analysis - CEO Service Agreement.”
2014 Performance Measurement and Results. The target performance metric for the 2014-2017 Variable RSU award cycle was based on an increase in FCBVPCS with a threshold of 3.0%, a target of 10.0% and a maximum of 17.0%. For 2014, our actual increase in FCBVPCS, inclusive of Common Share dividends declared, was 15.0%. As a result, each of our Named Executive Officers received Variable RSUs for the 2014-2017 award cycle equivalent to 172% of target, of which 25% were considered earned at December 31, 2014.
Fixed RSU Awards. We also continued our policy of providing for discretionary awards of Fixed RSUs as an inducement to new hires, as a retention measure or to reward exceptional performance. None of our Named Executive Officers received awards of Fixed RSUs in 2014, with the exception of 5,000 Fixed RSUs granted to Mr. Harris pursuant to his service agreement and which he earned and received on December 15, 2014. See “Compensation Discussion and Analysis - CEO Service Agreement.”
102
Table of Contents
2014 RSU Payouts and Vesting. During 2014, each of our Named Executive Officers earned and received Variable RSU payouts for the third installment of the 2012-2015 award cycle and the second installment of the 2013-2016 award cycle. RSU payouts during 2014 for the 2012-2015 award cycle and 2013-2016 award cycle were based on prior years’ performance and vested solely on continued employment. Each of our Named Executive Officers also earned and received partial installments of any Fixed RSU awards granted to them in prior years. For additional information regarding outstanding grants and grants that vested during 2014, see “Outstanding Equity Awards at Fiscal Year-End”, “Option Exercises and Shares Vested” and “Awards Made Under Equity Compensation Plans.”
Future Awards. While the Compensation Committee regularly reviews the form and design of our long-term incentive awards, we anticipate that any future capacity under the 2012 LTIP will be heavily allocated towards grants of Variable RSUs. In most instances, such awards will be based on the achievement of pre-established performance objectives and will contain time-based vesting and payout requirements designed to promote retention. We believe this approach promotes long-term share ownership by employees in the form of a tangible, equity-linked award, which aligns the interests of our employees and Shareholders. The approach also mitigates the adverse effects of volatility and cyclicality upon the results of the reinsurance sector and our Company.
Clawback Policy and Share Ownership Requirements
In 2012, we adopted a recoupment, or “clawback”, policy (the “Clawback Policy”). The Clawback Policy provides for the recovery of excess incentive compensation payouts in the event the Company is required to prepare an accounting restatement due to its material non-compliance with any financial reporting requirement under securities laws. Any clawback would apply to covered current or former executive officers and would involve the recoupment of excess incentive compensation payouts to such officers made during the three-year period immediately preceding the date on which the Company is required to prepare the accounting restatement. Recovery of excess incentive compensation will be reduced by any taxes paid or payable on such compensation by the executive officer.
All of our officers subject to the requirements of Section 16 of the Exchange Act, including all of our Named Executive Officers, are covered by the Clawback Policy. The requirements of our Clawback Policy are more stringent than those required by the Sarbanes-Oxley Act of 2002. Implementation rules for the mandatory clawback requirements of Dodd-Frank have yet to be finalized as of the date of this Proxy Statement. However, to the extent necessary, we will amend our Clawback Policy to conform with the final Dodd-Frank rules once issued. The Company has never been required to restate its financial results.
Our Named Executive Officers and selected senior executives are also subject to formal share ownership requirements. Each covered executive must amass Common Shares and/or Preferred Shares (including unvested RSUs underlying Common Shares) within five (5) years of his/her appointment, and the required minimum shareholdings must be maintained and held during the executive’s continuous service with the Company. In certain rare circumstances, and in his or her discretion, the Chairman of the Compensation Committee may temporarily waive or modify the recommended ownership levels in response to undue hardship on an executive or other considerations. No such waivers or modifications have been requested by (or granted to) any Named Executive Officers during the periods presented.
Minimum shareholdings for our Named Executive Officers and certain selected senior executives are equivalent to an aggregate market value in Common and/or Preferred Shares of: (i) five (5) times base salary in the case of our CEO, Mr. Harris, (ii) three and a half (3.5) times base salary in the case of Messrs. Paquette, Chattock and Schaper, and (iii) two (2) times base salary in the case of certain other senior executives, including Mr. Pollett, in each case subject to adjustment by our Board. As of December 31, 2014, each of our Named Executive Officers owned Common Shares and/or Preferred Shares and unvested RSUs underlying Common Shares with an aggregate market value of at least ten (10) times his annual base salary.
Change in Control and Severance
Our Named Executive Officers may be entitled to payments following a termination of their employment and/or upon a change in control in the Company. These payments are governed by their individual service agreements, our Severance Plan and our LTIPs and associated RSU award agreements. Such payments are due in conjunction with a termination of employment in the following situations: (i) voluntary termination of employment by the executive with or without “constructive termination” (as such term is defined in the LTIPs); (ii) termination of employment by the Company without “cause” (as such term is defined in the LTIPs); (iii) termination of employment by the Company following disability; (iv) non-renewal of the executive’s current service agreement; and (v) a change in control of the Company followed by a termination of employment. In the event of a termination of employment for “cause”, none of the Named Executive Officers are entitled to any termination-related payments.
103
Table of Contents
Severance Plan. Each of our Named Executive Officers is eligible for severance benefits under our Severance plan. The key feature of the Plan is that a simple change in control of the Company does not automatically trigger a vesting of benefits. A second trigger must also occur. Upon a change in control of the Company, our Named Executive Officers may be entitled to receive additional payments if, within twenty-four (24) months following the change in control, their employment is terminated by the Company (or a successor company) without cause or by the executive as the result of a constructive termination. These “double-trigger” severance payments would be made in lieu of any salary continuation or cash severance payments under the terms of their service agreements. In addition, all RSUs granted under our LTIPs would generally vest under comparable circumstances. The purpose of these arrangements is to mitigate the disincentives that may exist (economic and otherwise) in a transaction that would be negotiated by senior executives for the benefit of Shareholders and that may result in the elimination of the senior executives’ positions. None of our Named Executive Officers or other employees are entitled to a gross-up for any taxes or penalties associated with Section 280G of the Code. In fact, Messrs. Harris and Paquette’s service agreements provide for reductions in certain amounts payable to them to the extent that such payments would, if so made, trigger incremental taxes or penalties associated with Section 280G.
For additional information regarding the circumstances under which severance or change in control benefits are payable and the amounts thereof, see “Executive Officer Compensation - Potential Payments upon Termination of Employment or Change in Control” and “Executive Officer Compensation - Service Agreements.”
CEO Service Agreement
On May 17, 2013, on recommendation of the Compensation Committee, our Board approved a new service agreement with Mr. Harris, which became effective on May 20, 2013 (the “Effective Date”). The term of Mr. Harris’ service agreement is from the Effective Date through December 31, 2017, subject to automatic renewal for successive one-year periods beginning on January 1, 2018 unless, at least 90 days prior to the scheduled expiration date, either party provides the other party with notice of non-renewal or of a desire to renegotiate the service agreement’s material terms. If the Company delivers notice of non-renewal to Mr. Harris either before or after a change in control, the term will expire on the later of the scheduled expiration date and the second anniversary of such change in control.
Salary and Annual Bonus. During the term of Mr. Harris’s service agreement, the Company will pay Mr. Harris an annual base salary of $750,000, which represents a reduction from his former base salary of $900,000; his target bonus opportunity will continue to be equal to 100% of his base salary; and neither Mr. Harris’ base salary nor his target bonus may be decreased during the term of the service agreement.
Long-Term Incentive Awards. In accordance with the terms of his service agreement, Mr. Harris received the following grants in 2014: (i) 5,000 Fixed RSUs which vested in full on December 15, 2014, and (ii) 80,000 Variable RSUs (at target) for the 2014-2017 award cycle, which will be earned and vest in a four equal tranches (March 15, 2015 and December 15, 2015, 2016 and 2017). For each subsequent year during the term of his service agreement, Mr. Harris will be entitled to an annual grant of long-term incentive awards with a target value of not less than $2,448,000, with annual awards valued at no less than $120,000 vesting no more than one year after grant and annual awards with a target value of not less than $2,328,000 vesting no more than four years after grant.
Severance Provisions. Notwithstanding the provisions of the Severance Plan, his service agreement provides that if Mr. Harris terminates his employment without good reason, he will be entitled to receive continuation of base salary, medical benefits and vesting of share-based incentive awards for twelve months following termination of employment, subject to continued compliance with the non-competition and non-solicitation provisions of his service agreement at the discretion of the Company. The Company has provided Mr. Harris with these severance benefits in order to promote compliance with the non-compete and non-solicit provisions in his service agreement. The Company may cease continuation of base salary, medical benefits and RSU vesting at any time in exchange for releasing Mr. Harris from his obligations under such provisions. For additional information regarding the potential severance and benefits are payable to Mr. Harris, see “Executive Officer Compensation - Potential Payments upon Termination of Employment or Change in Control.”
104
Table of Contents
Compliance with Section 162(m) of the Code
Section 162(m) of the Code generally disallows a tax deduction for compensation in excess of $1 million paid to any of a company’s named executive officers (under current rules, other than the CFO). As a Bermuda limited liability company, historically we have been exempt from U.S. income taxes and ineligible to take a U.S. income tax deduction for the compensation paid to any of our Named Executive Officers. With the establishment of our U.S. operations in 2007, we are now subject to taxes on our U.S. income and are therefore potentially subject to Section 162(m) limitations on deductions. We believe that the value of any lost deductions is currently insignificant; however the 2012 LTIP provides for the ability to grant future awards that may qualify as performance-based compensation under Section 162(m).
Role of Executive Officers in Executive and CEO Compensation
The components and levels of compensation for each of our Named Executive Officers are set by the Compensation Committee in consultation with our CEO (except with respect to his own compensation) and are ratified and approved by our Board. The Compensation Committee also reviews all of the Company’s compensation policies and elements of remuneration for our Named Executive Officers at least annually.
As CEO, Mr. Harris makes recommendations to the Compensation Committee on all aspects of compensation for our Named Executive Officers, including general plan structures, performance measures and any amendments thereto. Mr. Harris is not present during any Compensation Committee or Board discussions regarding his own remuneration.
The Company’s General Counsel and Secretary, Jonathan Kim, acts as Secretary for the Compensation Committee and supports the Company’s Global Head of Human Resources, Kevin Long, in the preparation of meeting and research materials. Mr. Long develops recommendations to the Compensation Committee and the Chairman regarding the CEO’s compensation. He is also responsible for providing the Board with sufficient information, including reports on the market practices of peer companies, to enable them to review and recommend structures, levels and targets for the CEO’s compensation.
Compensation Committee Interlocks and Insider Participation
No member of the Compensation Committee has served as an officer or employee of the Company during 2014 and the Board notes no relationship that would impair the independence of any director who served as a member of the Compensation Committee during 2014.
Compensation Committee Report
The Compensation Committee has reviewed and discussed the Compensation Discussion and Analysis disclosure required by Item 402(b) of Regulation S-K of the Exchange Act with management. Based on such review and discussions, the Compensation Committee recommended to the Company’s Board of Directors that the Compensation Discussion and Analysis be included in this Proxy Statement.
|
Morgan W. Davis (Chair) |
March 25, 2015 |
|
John G. Bruton |
|
|
Michael R. Eisenson |
|
|
Susan J. Sutherland |
|
|
Anthony Taylor |
|
105
Table of Contents
Executive Officer Compensation
Summary Compensation Table
The following table sets forth information relating to compensation awarded to, earned by or paid for services rendered in all capacities during 2014, 2013 and 2012 by our Named Executive Officers.
|
Name and
Principal Position (1) |
|
Year |
|
Salary
($) |
|
Bonus
($) |
|
Share
Awards (2)
($) |
|
Option
Awards
($) |
|
Non-Equity
Incentive Plan
Compensation (3)
($) |
|
All Other
Compensation (4)
($) |
|
Total
($) |
|
|
|
|
|
|
|
|
|
|
|
|
|
|
|
|
|
|
|
|
|
Christopher L. Harris (5) |
|
2014 |
|
750,000 |
|
— |
|
2,471,350 |
|
— |
|
1,290,000 |
|
363,190 |
|
4,874,540 |
|
|
President and CEO |
|
2013 |
|
787,500 |
|
— |
|
2,341,420 |
|
— |
|
1,245,000 |
|
266,368 |
|
4,640,288 |
|
|
(Principal Executive Officer) |
|
2012 |
|
900,000 |
|
— |
|
1,331,250 |
|
— |
|
1,800,000 |
|
248,243 |
|
4,279,493 |
|
|
|
|
|
|
|
|
|
|
|
|
|
|
|
|
|
|
|
|
|
Michael S. Paquette |
|
2014 |
|
418,750 |
|
— |
|
850,011 |
|
— |
|
731,000 |
|
117,576 |
|
2,117,337 |
|
|
CFO and EVP |
|
2013 |
|
393,750 |
|
— |
|
630,616 |
|
— |
|
664,000 |
|
90,200 |
|
1,778,566 |
|
|
(Principal Financial Officer) |
|
2012 |
|
370,000 |
|
— |
|
554,688 |
|
— |
|
750,000 |
|
82,599 |
|
1,757,287 |
|
|
|
|
|
|
|
|
|
|
|
|
|
|
|
|
|
|
|
|
|
Christopher T. Schaper |
|
2014 |
|
557,500 |
|
— |
|
1,120,001 |
|
— |
|
963,200 |
|
341,551 |
|
2,982,252 |
|
|
President, |
|
2013 |
|
550,000 |
|
— |
|
867,103 |
|
— |
|
913,000 |
|
282,831 |
|
2,612,934 |
|
|
Montpelier Reinsurance Ltd. |
|
2012 |
|
550,000 |
|
— |
|
813,536 |
|
— |
|
1,100,000 |
|
264,833 |
|
2,728,369 |
|
|
|
|
|
|
|
|
|
|
|
|
|
|
|
|
|
|
|
|
|
Richard M.M. Chattock (6) |
|
2014 |
|
582,768 |
|
— |
|
1,175,640 |
|
— |
|
951,681 |
|
159,477 |
|
2,869,566 |
|
|
CEO, |
|
2013 |
|
547,505 |
|
— |
|
895,769 |
|
— |
|
962,949 |
|
124,235 |
|
2,530,458 |
|
|
Montpelier at Lloyd’s Limited |
|
2012 |
|
554,785 |
|
— |
|
808,495 |
|
— |
|
1,138,130 |
|
116,870 |
|
2,618,280 |
|
|
|
|
|
|
|
|
|
|
|
|
|
|
|
|
|
|
|
|
|
William Pollett |
|
2014 |
|
322,500 |
|
— |
|
659,988 |
|
— |
|
567,600 |
|
264,900 |
|
1,814,988 |
|
|
Chief Corporate Development |
|
2013 |
|
294,653 |
|
— |
|
354,719 |
|
— |
|
498,000 |
|
211,040 |
|
1,358,412 |
|
|
and Strategy Officer and SVP |
|
2012 |
|
276,913 |
|
— |
|
309,081 |
|
— |
|
400,000 |
|
206,283 |
|
1,192,277 |
|
(1) All amounts presented in the table above and in the supporting tables that follow are expressed in U.S. dollars. Certain amounts presented were paid in Bermuda dollars and British pounds. The Bermuda dollar is fixed to the U.S. dollar at a one-to-one ratio. The ending and average rates of exchange of U.S. dollars per British pound used were: (i) for 2014 - 1.559 and 1.647, respectively; (ii) for 2013 - 1.657 and 1.564, respectively; and (iii) for 2012 - 1.626 and 1.585, respectively.
(2) For Variable RSUs, represents the grant date fair value assuming target-level performance (the most probable outcome as of the date of grant) in accordance with Financial Accounting Standards Board (“FASB”) Accounting Standards Codification Topic 718 (“ASC Topic 718”) without regard to estimated forfeitures. At the maximum payout, the value of the Variable RSUs granted to Mr. Harris would be: 2014 - $4,656,000; 2013 - $4,434,840; 2012 - $2,662,500; for Mr. Paquette: 2014 - $1,700,022; 2013 - $1,261,232; 2012 - $1,109,375; for Mr. Schaper: 2014 - $2,240,002; 2013 - $1,734,205; 2012 - $1,627,072; for Mr. Chattock 2014 - $2,351,280; 2013 - $1,791,538; 2012 - $1,616,990; and Mr. Pollett 2014 - $1,319,976; 2013 - $709,438; 2012 - $618,162. For Fixed RSUs, represents the grant date fair value in accordance with FASB ASC Topic 718 without regard to estimated forfeitures. See Note 9 of the Notes to Consolidated Financial Statements for a description of the assumptions used to determine the initial grant date fair value of RSUs.
(3) Compensation shown as “Non-Equity Incentive Plan Compensation” within the above table represents the amount to which the Named Executive Officer was entitled under the Company’s annual bonus plan. See “Compensation Discussion and Analysis - Components of Compensation - Annual Cash Bonuses.”
(4) The individual components of “All Other Compensation” for 2014 are presented in the tables that follow.
(5) Effective May 20, 2013, in conjunction with his service agreement, Mr. Harris’ base salary decreased from $900,000 to $750,000. This decrease was accompanied by an increase in his share-based compensation as a relative portion of his overall compensation, the majority of which consisted of contingent Variable RSUs linked to the Company’s performance. See “Compensation Discussion and Analysis - CEO Service Agreement.”
(6) Mr. Chattock’s cash compensation is denominated and paid in British pounds. His salary and all other compensation presented above have been converted to U.S. dollars based on the applicable average rate of exchange of U.S. dollars per British pound and his non-equity incentive plan compensation presented above has been converted to U.S. dollars based on the applicable ending rate of exchange of U.S. dollars per British pound. Mr. Chattock’s share-based compensation is denominated in U.S. dollars.
106
Table of Contents
All Other Compensation - 2014
|
|
|
|
|
|
|
Tax- |
|
|
|
|
|
|
|
|
|
|
|
|
Perquisites |
|
|
|
Qualified |
|
Supplemental |
|
|
|
|
|
|
|
|
|
|
and Other |
|
|
|
Defined |
|
Defined |
|
|
|
|
|
|
|
|
|
|
Personal |
|
Housing |
|
Contribution |
|
Contribution |
|
Dividends |
|
Life |
|
|
|
|
|
|
Benefits (1) |
|
Allowance |
|
Pension |
|
Pension (2) |
|
on RSUs (3) |
|
Insurance (4) |
|
Total |
|
|
Name |
|
($) |
|
($) |
|
($) |
|
($) |
|
($) |
|
($) |
|
($) |
|
|
Christopher L. Harris |
|
78,044 |
|
— |
|
52,000 |
|
23,000 |
|
203,386 |
|
6,760 |
|
363,190 |
|
|
Michael S. Paquette |
|
1,500 |
|
— |
|
17,500 |
|
24,375 |
|
72,479 |
|
1,722 |
|
117,576 |
|
|
Christopher T. Schaper |
|
35,400 |
|
144,000 |
|
52,000 |
|
3,750 |
|
100,284 |
|
6,117 |
|
341,551 |
|
|
Richard M.M. Chattock |
|
1,186 |
|
— |
|
58,277 |
|
— |
|
98,676 |
|
1,338 |
|
159,477 |
|
|
William Pollett |
|
62,896 |
|
120,000 |
|
32,250 |
|
— |
|
46,202 |
|
3,552 |
|
264,900 |
|
(1) See table below for the individual components of Perquisites and Other Personal Benefits.
(2) Represents supplemental defined contribution pension benefits provided to Messrs. Harris, Paquette and Schaper in order to bring their total 2014 pension benefits up to 10% of their base salaries. Messrs. Harris and Schaper, who are U.S. citizens and reside in Bermuda, received their 2014 supplemental pension benefits in cash and Mr. Paquette, who is a U.S. citizen and resides in the U.S., received his 2014 supplemental benefit in the form of a Company-provided contribution to a non-qualified deferred compensation plan. See “Non-Qualified Deferred Compensation.”
(3) Represents dividend equivalents earned on outstanding RSU awards.
(4) Represents the cost of employer-provided life insurance.
Perquisites and Other Personal Benefits - 2014
|
|
|
One-Time |
|
|
|
|
|
|
|
|
|
|
|
|
|
|
Bermuda |
|
|
|
|
|
Tax and |
|
|
|
|
|
|
|
|
Residency |
|
Personal |
|
Health Club |
|
Financial |
|
Transportation/ |
|
|
|
|
|
|
Fee (1) |
|
Travel (2) |
|
Membership |
|
Planning |
|
Parking (3) |
|
Total |
|
|
Name |
|
($) |
|
($) |
|
($) |
|
($) |
|
($) |
|
($) |
|
|
|
|
|
|
|
|
|
|
|
|
|
|
|
|
|
Christopher L. Harris |
|
25,000 |
|
42,440 |
|
1,380 |
|
3,300 |
|
5,924 |
|
78,044 |
|
|
Michael S. Paquette |
|
— |
|
— |
|
— |
|
— |
|
1,500 |
|
1,500 |
|
|
Christopher T. Schaper |
|
25,000 |
|
10,400 |
|
— |
|
— |
|
— |
|
35,400 |
|
|
Richard M.M. Chattock |
|
— |
|
— |
|
1,186 |
|
— |
|
— |
|
1,186 |
|
|
William Pollett |
|
25,000 |
|
35,000 |
|
1,380 |
|
1,516 |
|
— |
|
62,896 |
|
(1) Represents a one-time fee paid by the Company to secure a Bermuda Permanent Residency Certificate (“PRC”) on behalf of Messrs. Harris, Schaper and Pollett. A PRC permits a qualifying Bermuda resident the right to permanently reside and work in Bermuda (without a requisite work permit) and to acquire Bermuda property. Messrs. Harris, Schaper and Pollett have each agreed to fully reimburse the Company for the cost of this benefit should they choose to voluntarily terminate their employment with the Company prior to October 2017.
(2) Represents the incremental cost to the Company of reimbursing personal travel for our Bermuda-based Named Executive Officers.
(3) Reflects the annual cost of an automobile in Bermuda for Mr. Harris and office parking in the U.S. for Mr. Paquette. Mr. Harris is provided this personal benefit because his service agreement precludes him from traveling in Bermuda by any means other than by automobile and, as a Bermuda resident, he and his family are otherwise limited to owning one automobile per household in accordance with local law.
107
Table of Contents
Grants of Plan-Based Awards - 2014
|
|
|
|
|
|
|
|
|
|
|
All Other |
|
|
|
|
|
|
|
|
|
|
|
|
|
|
Share |
|
|
|
|
|
|
|
|
|
|
Estimated Possible Payouts |
|
Estimated Possible Payouts |
|
Awards: |
|
Grant Date |
|
|
|
|
|
|
|
|
Under Non-Equity Incentive Plan |
|
Under Equity Incentive Plan |
|
Number of |
|
Fair Value of |
|
|
|
|
|
|
|
|
Awards |
|
Awards |
|
Shares or |
|
Share |
|
|
|
|
Grant |
|
Approval |
|
Threshold |
|
Target |
|
Maximum |
|
Threshold |
|
Target |
|
Maximum |
|
Units |
|
Awards (4) |
|
|
Name |
|
Date |
|
Date |
|
($) |
|
($) |
|
($) |
|
(#) |
|
(#) |
|
(#) |
|
(#) |
|
($) |
|
|
|
|
|
|
|
|
|
|
|
|
|
|
|
|
|
|
|
|
|
|
|
|
|
Christopher L. Harris |
|
|
|
|
|
|
|
|
|
|
|
|
|
|
|
|
|
|
|
|
|
|
Non-Equity Awards (1) |
|
— |
|
— |
|
0 |
|
750,000 |
|
1,500,000 |
|
— |
|
— |
|
— |
|
— |
|
— |
|
|
Variable RSUs (2) |
|
1/01/14 |
|
2/25/14 |
|
— |
|
— |
|
— |
|
0 |
|
80,000 |
|
160,000 |
|
— |
|
2,328,000 |
|
|
Fixed RSUs (3) |
|
1/01/14 |
|
2/25/14 |
|
— |
|
— |
|
— |
|
|
|
|
|
|
|
5,000 |
|
143,350 |
|
|
|
|
|
|
|
|
|
|
|
|
|
|
|
|
|
|
|
|
|
|
|
|
|
Michael S. Paquette |
|
|
|
|
|
|
|
|
|
|
|
|
|
|
|
|
|
|
|
|
|
|
Non-Equity Awards (1) |
|
— |
|
— |
|
0 |
|
425,000 |
|
850,000 |
|
— |
|
— |
|
— |
|
— |
|
— |
|
|
Variable RSUs (2) |
|
1/01/14 |
|
2/25/14 |
|
— |
|
— |
|
— |
|
0 |
|
29,210 |
|
58,420 |
|
— |
|
850,011 |
|
|
|
|
|
|
|
|
|
|
|
|
|
|
|
|
|
|
|
|
|
|
|
|
|
Christopher T. Schaper |
|
|
|
|
|
|
|
|
|
|
|
|
|
|
|
|
|
|
|
|
|
|
Non-Equity Awards (1) |
|
— |
|
— |
|
0 |
|
560,000 |
|
1,120,000 |
|
— |
|
— |
|
— |
|
— |
|
— |
|
|
Variable RSUs (2) |
|
1/01/14 |
|
2/25/14 |
|
— |
|
— |
|
— |
|
0 |
|
38,488 |
|
76,976 |
|
— |
|
1,120,001 |
|
|
|
|
|
|
|
|
|
|
|
|
|
|
|
|
|
|
|
|
|
|
|
|
|
Richard M.M. Chattock |
|
|
|
|
|
|
|
|
|
|
|
|
|
|
|
|
|
|
|
|
|
|
Non-Equity Awards (1) |
|
— |
|
— |
|
0 |
|
553,303 |
|
1,106,606 |
|
— |
|
— |
|
— |
|
— |
|
— |
|
|
Variable RSUs (2) |
|
1/01/14 |
|
2/25/14 |
|
— |
|
— |
|
— |
|
0 |
|
40,400 |
|
80,800 |
|
— |
|
1,175,640 |
|
|
|
|
|
|
|
|
|
|
|
|
|
|
|
|
|
|
|
|
|
|
|
|
|
William Pollett |
|
|
|
|
|
|
|
|
|
|
|
|
|
|
|
|
|
|
|
|
|
|
Non-Equity Awards (1) |
|
— |
|
— |
|
0 |
|
330,000 |
|
660,000 |
|
— |
|
— |
|
— |
|
— |
|
— |
|
|
Variable RSUs (2) |
|
1/01/14 |
|
2/25/14 |
|
— |
|
— |
|
— |
|
0 |
|
22,680 |
|
45,360 |
|
— |
|
659,988 |
|
(1) Represents the Named Executive Officer’s annual bonus potential for 2014 pursuant to the Company’s 2014 Annual Bonus Plan. Based on our actual increase in FCBVPCS for 2014 of 15.0%, the Compensation Committee and the Board awarded cash bonuses to Messrs. Harris, Paquette, Schaper, Chattock and Pollett, in an amount equal to 172% of their target bonus. Mr. Chattock’s non-equity award presented above, which is denominated and paid in British pounds, has been converted to U.S. dollars based on the December 31, 2014 ending rate of exchange of 1.559 U.S. dollars per British pound. See “Compensation Discussion and Analysis - Components of Compensation - Annual Cash Bonuses.”
(2) Represents Variable RSUs awarded pursuant to the 2012 LTIP for the 2014-2017 award cycle. Variable RSUs are contingent awards in which the actual number of RSUs awarded is not known on the grant date and is dependent on Company performance during the initial year of the four year award cycle (the “Initial RSU Period”). The actual number of Variable RSUs awarded is not known until: (i) the completion of the Initial RSU Period; and (ii) the formal approval by the Compensation Committee and the Board of the number of RSUs awarded based on actual performance achieved. The number of Variable RSUs shown above at target is based on an increase in FCBVPCS of 10.0%. The number of Variable RSUs shown at maximum is based on an achieved increase in FCBVPCS of 17.0% or greater. At an achieved increase in FCBVPCS of 3.0% or less, no Variable RSUs would be awarded. Variable RSUs vest in equal annual installments over a four-year period subject to continuous employment.
(3) Represents an annual Fixed RSU award to Mr. Harris in connection with his service agreement. Mr. Harris’ Fixed RSU award was made pursuant to the 2012 LTIP, was not contingent on Company performance and the actual number of RSUs awarded to him was known on the grant date. Mr. Harris’ Fixed RSU award fully vested on December 31, 2014. See “Compensation Discussion and Analysis - CEO Service Agreement.”
(4) Represents the grant date fair value at target (the most probable outcome as of the date of grant) in accordance with FASB ASC Topic 718 without regard to estimated forfeitures. At the maximum payout, the value of the Variable RSUs granted to Messrs. Harris, Paquette, Schaper, Chattock and Pollett would be $4,656,000, $1,700,022, $2,240,002, $2,351,280 and $1,319,976, respectively. See Note 9 of the Notes to Consolidated Financial Statements for a description of the assumptions used to determine the initial grant date fair value of RSUs. Based on our actual increase in FCBVPCS for 2014 of 15.0%, the Compensation Committee and the Board awarded Variable RSUs for the 2014-2017 award cycle to Messrs. Harris, Paquette, Schaper, Chattock and Pollett, in an amount equal to 172% of their target Variable RSUs. See “Compensation Discussion and Analysis - Components of Compensation - Long-Term Incentive Awards.”
108
Table of Contents
Narrative to the Summary Compensation Table and Grants Of Plan-Based Awards
Service Agreements
Each of our Named Executive Officers is subject to a Service Agreement with the Company (each a “Service Agreement”). Each Service Agreement entitles the relevant Named Executive Officer to a base salary, the right to participate in the Company’s annual bonus and long-term incentive plans and certain benefits and other perquisites. For further information regarding the components of the Named Executive Officers’ compensation, see “Compensation Discussion and Analysis-Components of Compensation.”
Messrs. Harris and Paquette’s Service Agreements provide that, in the event it is determined that any payment under those agreements would be considered an “excess parachute payment” under Section 280G, their payments will be reduced (with cash payments being reduced before share-based payments) in such a manner that no portion of the payments will be considered “excess parachute payments” under Section 280G. However, if such a reduction would result in Mr. Harris or Mr. Paquette receiving less after-tax compensation than they would have otherwise received without such reduction, then such payments will not be reduced. In either case, Messrs. Harris and Paquette are fully responsible for their own personal income taxes and the Company has no obligation or intent to reimburse or otherwise provide a tax gross-up to them in connection with any such payments.
Mr. Harris’ Service Agreement is for a term expiring December 31, 2017, subject to automatic renewal for successive one-year periods beginning January 1, 2018 unless either party gives prior notice of non-renewal. See “Compensation Discussion and Analysis - CEO Service Agreement.” Mr. Paquette’s Service Agreement is continual and is terminable upon twelve-months’ written notice by the Company and upon six-months’ written notice by him. Mr. Schaper’s Service Agreement is continual and is terminable upon twelve-months’ written notice by either the Company or by him. Mr. Chattock’s Service Agreement is continual and is terminable upon twelve-months’ written notice by the Company and upon six-months’ written notice by him. Mr. Pollett’s Service Agreement is continual and is terminable upon six months’ written notice by either the Company or the executive.
The Named Executive Officers are entitled under their Service Agreements to certain benefits upon various circumstances resulting in termination of their employment. For information regarding the principal terms and conditions of these provisions see “Executive Officer Compensation-Potential Payments Upon Termination of Employment or Change in Control.”
The Service Agreements also contain restrictive covenants that prevent the Named Executive Officers from engaging in certain competitive activities and soliciting our customers and employees. These covenants are effective during each Named Executive Officer’s employment and, with respect to each Named Executive Officer other than Messrs. Chattock and Pollett for twelve months thereafter. With respect to Messrs. Chattock and Pollett, the non-competition covenant remains effective for the six-month period following the termination of the executive’s employment, and the non-solicitation covenant remains effective for the twelve-month period following the termination of the executive’s employment. Pursuant to their Service Agreements, each Named Executive Officer is also subject to a confidentiality covenant of an indefinite duration.
Annual Cash Bonuses
Each Named Executive Officer participates in the Company’s annual cash bonus plan. The Company does not generally pay guaranteed minimum or discretionary bonuses (although in light of the Company’s business and the potential for unforeseen catastrophic events to disrupt the Company’s performance, the Compensation Committee retains the discretion to implement guaranteed or discretionary bonuses).
Pursuant to their Service Agreements, Messrs. Harris and Paquette are specifically entitled to a target bonus opportunity equal to 100% of their respective base salaries. Messrs. Schaper, Chattock and Pollett are not entitled to a specified target bonus opportunity pursuant to their Service Agreements.
For further information regarding the terms of the Company’s annual cash bonus plan, see “Compensation Discussion and Analysis-Components of Compensation-Annual Cash Bonuses.”
109
Table of Contents
Long-Term Incentive Plan Awards
The Company has a practice of making annual grants to senior management, including the Named Executive Officers, of Variable RSUs that vest in equal annual installments over a four-year period subject to continuous active employment. The actual number of RSUs awarded depends upon the Company’s performance during the Initial RSU Period in which the grants are made. For further information regarding the terms of the Company’s RSU awards, see “Compensation Discussion and Analysis-Components of Compensation-Long-Term Incentive Awards.”
Outstanding Equity Awards at Fiscal Year-End
|
|
|
Option Awards |
|
Share Awards |
|
|
|
|
|
|
|
|
|
|
|
|
|
|
|
|
|
|
Equity |
|
|
|
|
|
|
|
|
|
|
|
|
|
|
|
|
|
|
|
|
Incentive |
|
|
|
|
|
|
|
|
|
|
|
|
|
|
|
|
|
|
|
|
Plan |
|
Equity |
|
|
|
|
|
|
|
|
Equity |
|
|
|
|
|
|
|
|
|
Awards: |
|
Incentive |
|
|
|
|
|
|
|
|
Incentive |
|
|
|
|
|
|
|
|
|
Number of |
|
Plan Awards: |
|
|
|
|
|
|
|
|
Plan |
|
|
|
|
|
|
|
|
|
Unearned |
|
Market or |
|
|
|
|
|
|
|
|
Awards: |
|
|
|
|
|
|
|
|
|
Shares, |
|
Payout Value |
|
|
|
|
Number of |
|
Number of |
|
Number of |
|
|
|
|
|
|
|
Market |
|
Units |
|
of Unearned |
|
|
|
|
Securities |
|
Securities |
|
Securities |
|
|
|
|
|
Number of |
|
Value of |
|
or Other |
|
Shares, Units |
|
|
|
|
Underlying |
|
Underlying |
|
Underlying |
|
|
|
|
|
Shares or |
|
Shares or |
|
Rights |
|
or Other |
|
|
|
|
Unexercised |
|
Unexercised |
|
Unexercised |
|
Option |
|
|
|
Units That |
|
Units That |
|
That |
|
Rights That |
|
|
|
|
Options |
|
Options |
|
Unearned |
|
Exercise |
|
Option |
|
Have Not |
|
Have Not |
|
Have Not |
|
Have Not |
|
|
|
|
(#) |
|
(#) |
|
Options |
|
Price |
|
Expiration |
|
Vested (1) |
|
Vested (2) |
|
Vested |
|
Vested |
|
|
Name |
|
Exercisable |
|
Unexercisable |
|
(#) |
|
($) |
|
Date |
|
(#) |
|
($) |
|
(#) |
|
($) |
|
|
|
|
|
|
|
|
|
|
|
|
|
|
|
|
|
|
|
|
|
|
|
Christopher L. Harris |
|
— |
|
— |
|
— |
|
— |
|
— |
|
221,210 |
|
7,923,742 |
|
— |
|
— |
|
|
Michael S. Paquette |
|
— |
|
— |
|
— |
|
— |
|
— |
|
80,203 |
|
2,872,871 |
|
— |
|
— |
|
|
Christopher T. Schaper |
|
— |
|
— |
|
— |
|
— |
|
— |
|
104,047 |
|
3,726,964 |
|
— |
|
— |
|
|
Richard M.M. Chattock |
|
— |
|
— |
|
— |
|
— |
|
— |
|
107,412 |
|
3,847,498 |
|
— |
|
— |
|
|
William Pollett |
|
— |
|
— |
|
— |
|
— |
|
— |
|
50,840 |
|
1,821,089 |
|
— |
|
— |
|
(1) Represents unvested RSU awards outstanding pursuant to the LTIPs as of December 31, 2014. Mr. Harris’ unvested RSUs consist of: 37,500 Variable RSUs for the 2012-2015 award cycle; 80,510 RSUs for the 2013-2016 award cycle; and 103,200 RSUs for the 2014-2017 award cycle. Mr. Paquette’s unvested RSUs consist of: 4,000 Fixed RSUs for the 2011-2016 award cycle; 15,625 Variable RSUs for the 2012-2015 award cycle; 22,897 Variable RSUs for the 2013-2016 award cycle; and 37,681 Variable RSUs for the 2014-2017 award cycle. Mr. Schaper’s unvested RSUs consist of: 22,915 Variable RSUs for the 2012-2015 award cycle; 31,483 Variable RSUs for the 2013-2016 award cycle; and 49,649 Variable RSUs for the 2014-2017 award cycle. Mr. Chattock’s unvested RSUs consist of: 22,773 Variable RSUs for the 2012-2015 award cycle; 32,523 Variable RSUs for the 2013-2016 award cycle; and 52,116 Variable RSUs for the 2014-2017 award cycle. Mr. Pollett’s unvested RSUs consist of: 8,705 Variable RSUs for the 2012-2015 award cycle; 12,878 Variable RSUs for the 2013-2016 award cycle; and 29,257 Variable RSUs for the 2014-2017 award cycle. The Fixed RSUs granted to Mr. Harris in 2014 pursuant to his Service Agreement fully vested on December 31, 2014.
(2) Each outstanding RSU vests in equal annual installments over the applicable award cycle on December 15 of each year, except for the 4,000 outstanding Fixed RSUs awarded to Mr. Paquette in 2011 that are scheduled to vest in five equal annual installments beginning on March 15, 2012. The market value of all RSUs that have not vested was calculated using the $35.82 closing market price of Common Shares on December 31, 2014, as quoted on the NYSE.
Option Exercises and Shares Vested - 2014
|
|
|
Option Awards |
|
Share Awards (1) |
|
|
|
|
Number of Shares |
|
|
|
Number of Shares |
|
|
|
|
|
|
Acquired on |
|
Value Realized |
|
Acquired on |
|
Value Realized |
|
|
|
|
Vesting |
|
on Exercise |
|
Vesting |
|
on Vesting |
|
|
Name |
|
(#) |
|
($) |
|
(#) |
|
($) |
|
|
Christopher L. Harris |
|
— |
|
— |
|
117,155 |
|
4,196,492 |
|
|
Michael S. Paquette |
|
— |
|
— |
|
41,633 |
|
1,477,210 |
|
|
Christopher T. Schaper |
|
— |
|
— |
|
65,208 |
|
2,335,751 |
|
|
Richard M.M. Chattock |
|
— |
|
— |
|
56,409 |
|
2,020,570 |
|
|
William Pollett |
|
— |
|
— |
|
24,900 |
|
891,918 |
|
(1) Represents RSU awards and the value thereof that vested during 2014.
110
Table of Contents
Non-Qualified Deferred Compensation - 2014
|
|
|
Executive |
|
Company |
|
Aggregate |
|
|
|
Aggregate |
|
|
|
|
Contributions |
|
Contributions |
|
Earnings |
|
Aggregate |
|
Balance at |
|
|
|
|
in Last Fiscal |
|
in Last Fiscal |
|
In Last |
|
Withdrawals/ |
|
Last Fiscal |
|
|
|
|
Year |
|
Year |
|
Fiscal |
|
Distributions |
|
Year-End |
|
|
Name |
|
($) |
|
($) |
|
Year (1) |
|
($) |
|
($) |
|
|
|
|
|
|
|
|
|
|
|
|
|
|
|
Christopher L. Harris |
|
— |
|
— |
|
3,077 |
|
— |
|
50,219 |
|
|
Michael S. Paquette |
|
— |
|
24,375 |
|
4,096 |
|
— |
|
108,385 |
|
|
Richard M.M. Chattock |
|
— |
|
— |
|
— |
|
— |
|
— |
|
|
Christopher T. Schaper |
|
— |
|
— |
|
— |
|
— |
|
— |
|
|
William Pollett |
|
— |
|
— |
|
— |
|
— |
|
— |
|
The Company’s non-qualified deferred compensation plans allow participants to voluntarily defer, or for the Company to provide, qualifying remuneration payable (consisting of all or a portion of their salary, annual bonus and Company-provided contributions) which can be invested in various investment options available to the general public. Participants may change their investment elections on a daily basis.
A payment date is designated with each deferral election made. Participants may elect to receive payments in a lump sum or in annual installments. Payment dates cannot be accelerated and commence upon the earliest of the designated payment date, death and separation from service. The Company’s nonqualified deferred compensation plans will terminate and all amounts deferred thereunder will be paid out in connection with a change of control of the Company.
On or about December 15, 2014, 2013 and 2012, the Company provided Mr. Paquette with supplemental defined contribution pension benefits of $24,375, $21,875 and $20,000, respectively, in order to equalize his total annual pension benefit at 10% of his base salary. These supplemental defined contribution pension benefits have been included in the Summary Compensation table as “All Other Compensation.”
Mr. Harris did not make or receive any non-qualified deferred compensation contributions from 2012 to 2014.
All current and prior year earnings and losses have been excluded from the Summary Compensation Table as none of the investment options offered under the deferred compensation plan provide an above-market rate of interest.
Potential Payments Upon Termination of Employment or Change in Control
The following tables outline the potential payments and benefits that our Named Executive Officers would be entitled to receive under certain situations involving a termination of their employment, including a termination resulting from a change in control of the Company. Our Named Executive Officers are not employed at-will and the terms and conditions of their employment are governed by their individual Service Agreements. Each Service Agreement is negotiated independently and the specific provisions of each may vary, in some cases significantly, from person to person. See “Executive Officer Compensation - Service Agreements.” Termination of employment and satisfaction of all conditions to payment are deemed to occur at December 31, 2014 for purposes of this presentation. The closing market price of Common Shares on December 31, 2014, as quoted on the NYSE, was $35.82.
The amounts shown in the tables that follow do not include payments and benefits provided on a non-discriminatory basis to salaried employees upon their termination of employment. These payments and benefits include: (i) earned but unpaid salary, unused vacation pay and continuation of standard insurance benefits (consisting of medical, dental and disability coverages) through the effective date of termination; (ii) reimbursement of all documented business-related expenses; and (iii) accumulated balances under any of the Company’s qualified defined contribution retirement plans. In addition, the amounts shown in the tables do not include any distributions of non-qualified deferred compensation. The amount of such non-qualified deferred compensation is set forth in “Executive Officer Compensation - Nonqualified Deferred Compensation.”
Our Named Executive Officers may not compete against the Company or solicit its clients or employees for a period of six months to one year following termination, for any reason, without the Company’s prior consent. The Company may require the executive not to attend work and/or not to undertake any or all of their duties during such period.
111
Table of Contents
Amounts Payable Upon Termination of Employment by the Company For Cause
In the event of their termination of employment by the Company for “cause,” none of the Named Executive officers are entitled to any termination payments, other than previously accrued obligations.
For purposes of Messrs. Harris’ and Paquette’s Service Agreements, “cause,” means: (i) the conviction of an offense (other than a road traffic offense or other non-material offense not subject to a custodial sentence); or (ii) willful gross negligence or willful gross misconduct by the executive in connection with the executive’s employment with the Company that causes or is likely to cause material loss or damage to the Company. For purposes of Messrs. Schaper’s and Pollett’s Service Agreements, “cause,” means: the executive: (a) is guilty of conduct tending to bring himself or the Company into disrepute or likely to affect prejudicially the Company’s interests; (b) filed for bankruptcy; (c) failed or neglected to diligently discharge his duties under his Service Agreement after receiving six months’ written notice of such misconduct; or (d) committed a serious breach of his obligations under his Service Agreement. For purposes of Mr. Chattock’s Service Agreement, “cause” generally has the same meaning as described above for the other four named executive officers and also means: (w) failure to comply with a lawful instruction given by the Company; (x) resignation as a director of one of the Company’s subsidiaries other than at the request of such entity; (y) inability as a result of sickness or injury to perform duties for a period exceeding an aggregate of 180 days per year; or (z) is guilty of breach of applicable regulatory rules or suspension or revocation of the executive’s registration or status as an approved person under applicable regulatory rules.
Amounts Payable Upon Voluntary Termination of Employment by the Executive
|
|
|
|
|
Continuation |
|
|
|
|
|
|
|
|
|
|
|
|
of Vesting of |
|
|
|
|
|
Total |
|
|
|
|
|
|
Equity |
|
|
|
|
|
Payments In |
|
|
|
|
Cash |
|
Incentive |
|
Continuation |
|
Repatriation/ |
|
Connection |
|
|
|
|
Severance |
|
Plan |
|
of Medical |
|
Relocation |
|
with |
|
|
|
|
Payment |
|
Awards |
|
Benefits |
|
Expenses |
|
Termination |
|
|
Name |
|
($) |
|
($) |
|
($) |
|
($) |
|
($) |
|
|
Christopher L. Harris |
|
750,000 |
|
4,017,392 |
|
23,102 |
|
— |
|
4,790,494 |
|
|
Michael S. Paquette |
|
212,500 |
|
— |
|
— |
|
— |
|
212,500 |
|
|
Christopher T. Schaper |
|
560,000 |
|
— |
|
— |
|
— |
|
560,000 |
|
|
Richard M.M. Chattock |
|
276,652 |
|
— |
|
— |
|
— |
|
276,652 |
|
|
William Pollett |
|
165,000 |
|
— |
|
— |
|
— |
|
165,000 |
|
In the event of voluntary termination of employment by the executive, Mr. Harris is entitled to a continuation of his base salary, vesting of outstanding RSUs and medical benefits during the twelve-month period following the date of termination. The amount attributable to continuation of medical benefits: (i) have been calculated based upon the Company’s current actual costs of providing the benefits; and (ii) have not been discounted for the time value of money. The Company may avoid or discontinue paying Mr. Harris his cash severance payments and providing continuation of medical benefits and may halt the vesting of his outstanding RSUs in exchange for releasing him from the restrictive covenants related to non-competition and non-solicitation set forth in the Service Agreement.
Messrs. Paquette, Chattock and Pollett are required to provide the Company with no less than six-months’ written notice and each are entitled to a continuation of their base salary during that period. Mr. Schaper is required to provide the Company with no less than twelve-months’ written notice and is entitled to a continuation of his base salary during that period.
Amounts Payable Upon Termination of Employment by the Company Following Disability
|
|
|
|
|
Continuation |
|
|
|
|
|
|
|
|
|
|
|
|
of Vesting of |
|
|
|
|
|
Total |
|
|
|
|
|
|
Equity |
|
|
|
|
|
Payments In |
|
|
|
|
Cash |
|
Incentive |
|
Continuation |
|
Repatriation/ |
|
Connection |
|
|
|
|
Severance |
|
Plan |
|
of Medical |
|
Relocation |
|
with |
|
|
|
|
Payment |
|
Awards |
|
Benefits |
|
Expenses |
|
Termination |
|
|
Name |
|
($) |
|
($) |
|
($) |
|
($) |
|
($) |
|
|
Christopher L. Harris |
|
— |
|
7,923,742 |
|
— |
|
375,000 |
|
8,298,742 |
|
|
Michael S. Paquette |
|
— |
|
— |
|
— |
|
— |
|
— |
|
|
Christopher T. Schaper |
|
560,000 |
|
— |
|
— |
|
— |
|
560,000 |
|
|
Richard M.M. Chattock |
|
— |
|
— |
|
— |
|
— |
|
— |
|
|
William Pollett |
|
330,000 |
|
— |
|
— |
|
— |
|
330,000 |
|
112
Table of Contents
In the event of termination of employment by the Company following disability, Mr. Harris is entitled to: (i) an acceleration of the vesting of all of his outstanding RSUs; and (ii) a one-time payment of repatriation/relocation benefits equal to six-months’ base salary. In the event of termination of employment by the Company following disability, Messrs. Schaper and Pollett are entitled to a continuation of base salary for twelve months. Messrs. Paquette and Chattock are not entitled to any incremental compensation in the event of termination of employment by the Company following disability.
In this instance, “disability” means a condition that results in the executive being unable to perform the duties and responsibilities required of him due to a physical and/or mental disability for a stated period of time.
Amounts Payable Upon Termination of Employment by the Company Following a Change in Control
|
|
|
|
|
Accelerated |
|
|
|
|
|
|
|
|
|
|
|
|
Vesting of |
|
|
|
|
|
|
|
|
|
|
|
|
Equity |
|
|
|
|
|
Total |
|
|
|
|
Cash |
|
Incentive |
|
Continuation |
|
Repatriation/ |
|
Payments |
|
|
|
|
Severance |
|
Plan |
|
of Medical |
|
Relocation |
|
Upon |
|
|
|
|
Payment |
|
Awards |
|
Benefits |
|
Expenses |
|
Termination |
|
|
Name |
|
($) |
|
($) |
|
($) |
|
($) |
|
($) |
|
|
Christopher L. Harris |
|
7,650,000 |
|
7,923,742 |
|
69,306 |
|
— |
|
15,643,048 |
|
|
Michael S. Paquette |
|
2,350,000 |
|
2,872,871 |
|
— |
|
— |
|
5,222,871 |
|
|
Christopher T. Schaper |
|
3,320,000 |
|
3,726,964 |
|
— |
|
— |
|
7,046,964 |
|
|
Richard M.M. Chattock |
|
3,379,334 |
|
3,847,498 |
|
— |
|
— |
|
7,226,832 |
|
|
William Pollett |
|
1,795,200 |
|
1,821,089 |
|
— |
|
— |
|
3,616,289 |
|
The Severance Plan provides for the payment of specified benefits if a participant’s employment is terminated by the Company without cause or by the participant pursuant to a constructive termination within twenty-four months following the occurrence of a change in control, as defined in the LTIPs. Benefits payable under the Severance Plan are triggered if termination is initiated by: (i) the Company for a reason other than death, disability or cause; or (ii) the executive in the case of constructive termination. The Severance Plan is administered by the Compensation Committee, which is authorized to interpret the plan and to establish, amend and rescind any rules and regulations relating to the plan. For purposes of the Severance Plan, (i) “cause” has the meaning set forth in the individual Service Agreements for Messrs. Harris and Paquette and, for Messrs. Schaper, Chattock and Pollett, means: (a) willful and continued failure to substantially perform the material duties set for in the executive’s Service Agreement (other than any failure resulting from the executive’s disability) after the Company has delivered a written demand for substantial performance identifying the deficient performance; (b) conviction of, guilty plea or plea of no contest to, a felony; (c) commission of an act involving moral turpitude, which could be reasonably expected to have an adverse effect on the Company; (d) fraud, misappropriation, embezzlement, or intentional breach of fiduciary duty; (e) wilful malfeasance in connection with the executive’s employment that the Company determines adversely affected it; or (f) material violation of any Company policy or a material breach of any agreement between the executive and the Company that could be reasonably expected to have an adverse effect on the Company; and (ii) “constructive termination” means, for Messrs. Schaper, Chattock and Pollett, a termination of the executive’s employment with the Company or a subsidiary at the initiative of the executive that the executive declares by prior written notice delivered to the Secretary of the Company to be a constructive termination by the Company or subsidiary and that follows: (a) a material decrease in the executive’s salary or bonus opportunity; or (b) an involuntary relocation of the executive’s principal place of a employment by more than 50 miles from the executive’s then-current location or, in the case of an executive located in Bermuda, a relocation from Bermuda. For Messrs. Harris and Paquette, “constructive termination” has the same meaning as “good reason” pursuant to their Service Agreements, which is described below under the heading “Amounts Payable Upon Termination of Employment - Other Events Not Following A Change in Control” (as applicable).
Under the provisions of the Severance Plan, Mr. Harris is eligible for Group A severance benefits and Messrs. Paquette, Schaper, Chattock and Pollett are each eligible for Group B benefits. Group A benefits consist of three times the sum of: (i) the executive’s annual base salary at the greater of (a) the annual rate in effect on the executive’s severance date and (b) the annual rate in effect on the date of the change in control; and (ii) the executive’s highest annual bonus paid in the three-year period preceding the year in which the severance occurs. Group B benefits consist of two times the sum of: (i) the executive’s annual base salary at the greater of (a) the annual rate in effect on the executive’s severance date and (b) the annual rate in effect on the date of the change in control; and (ii) the executive’s highest annual bonus paid in the three-year period preceding the year in which the severance occurs. In order for an executive to receive any payments under the Severance Plan, the executive must execute a general release of all claims against the Company within sixty days after termination of employment. Amounts payable under the Severance Plan
113
Table of Contents
to each of Messrs. Harris, Paquette, Schaper, Chattock and Pollett are paid in a lump sum and would offset any other severance or notice payments (other than, in the case of Mr. Harris, any continued medical benefits) to which they would be entitled under their Service Agreements. Under the terms of Mr. Harris’ Service Agreement, in the event of a termination of employment without cause by the Company or for good reason by Mr. Harris, Mr. Harris is entitled to continuation of medical benefits for three years following such termination. The amounts attributable to continuation of medical benefits: (i) have been calculated based upon the Company’s current actual costs of providing the benefits; and (ii) have not been discounted for the time value of money.
Under the provisions of the LTIPs, if, within twenty-four months following the occurrence of a change in control, a participant’s employment is terminated by the Company for a reason other than death, disability or cause, or by the participant following a constructive termination or retirement at age 60, all outstanding RSUs immediately vest. In the case of Variable RSUs in their Initial RSU Period, the number of Variable RSUs that will be accelerated will reflect the greater of: (i) target performance; and (ii) actual performance during the completed quarterly periods in the applicable performance period preceding the change in control. The table above reflects the acceleration of all outstanding Fixed RSUs, including those Variable RSUs that have been effectively converted to Fixed RSUs following the end of the first year of the applicable award period, which, for the Variable RSUs granted in 2014, reflects 172% of the target Variable RSUs as discussed in “Components of Compensation - Long-Term Equity Awards - 2014 Performance Measurement and Results.”
Amounts Payable Upon Termination of Employment - Other Events Not Following A Change in Control (as applicable)
|
|
|
|
|
Accelerated |
|
|
|
|
|
|
|
|
|
|
|
|
Vesting of |
|
|
|
|
|
Total |
|
|
|
|
Cash |
|
Equity |
|
Continuation |
|
Repatriation/ |
|
Payments |
|
|
|
|
Severance |
|
Incentive |
|
of Medical |
|
Relocation |
|
Upon |
|
|
|
|
Payment |
|
Plan Awards |
|
Benefits |
|
Expenses |
|
Termination |
|
|
Name |
|
($) |
|
($) |
|
($) |
|
($) |
|
($) |
|
|
Termination Without Cause by the Company or for Good |
|
|
|
|
|
|
|
|
|
|
|
|
Reason by the Executive |
|
|
|
|
|
|
|
|
|
|
|
|
Christopher L. Harris |
|
3,000,000 |
|
7,923,742 |
|
69,306 |
|
— |
|
10,993,048 |
|
|
Michael S. Paquette |
|
425,000 |
|
1,491,294 |
|
24,110 |
|
— |
|
1,940,404 |
|
|
Termination Without Cause by the Company |
|
|
|
|
|
|
|
|
|
|
|
|
Christopher T. Schaper |
|
560,000 |
|
1,977,551 |
|
— |
|
— |
|
2,537,551 |
|
|
Richard M.M. Chattock |
|
553,303 |
|
2,020,499 |
|
— |
|
— |
|
2,573,802 |
|
|
William Pollett |
|
165,000 |
|
— |
|
— |
|
— |
|
165,000 |
|
In the event of termination of employment without cause by the Company or for good reason by the executive, subject to the executive’s executive of a general release of all claims against the Company within sixty days after termination of employment:
· Mr. Harris is entitled to: (i) the sum of his annual base salary plus annual target bonus multiplied by 2.0, payable in a lump sum; (ii) an acceleration of the vesting of all of his outstanding RSUs (with any Variable RSUs in their Initial RSU Period vesting at target); and (iii) a three-year continuation of his current medical benefits at the Company’s expense; and
· Mr. Paquette is entitled to a continuation for one year of: (i) his base salary; (ii) the vesting of his outstanding RSUs; and (iii) his current medical benefits at the Company’s expense.
Good reason, in this instance, means the occurrence of the following, without the executive’s consent: (i) a decrease in the executive’s base salary or any decrease (which, in the case of Mr. Paquette, must be material) in annual bonus opportunity or, solely in the case of Mr. Harris, annual target opportunity under the 2012 LTIP; (ii) a material diminution in the executive’s authority, duties or responsibilities such that he cannot continue to carry out his job in substantially the same manner as it was intended to be carried out immediately before such diminution; (iii) a relocation of the executive’s principal place of employment by more than 50 miles from the location at which he is then principally employed; or (iv) a material breach by the Company of the terms of the executive’s Service Agreement or of any outstanding award to the executive under the LTIPs that the Company has failed to cure. For purposes of Mr. Harris’ Service Agreement, clause (ii) of the preceding sentence also includes Mr. Harris’ removal as President or Chief Executive Officer of the Company, failure to continue Mr. Harris’ service as a director or failure to have him report directly and solely to the Board and clause (iii) is triggered only upon a relocation of the Company’s executive offices from Bermuda while Mr. Harris is CEO.
114
Table of Contents
In the event of termination of employment without cause by the Company, Messrs. Schaper and Chattock are entitled to a continuation for one year of: (i) their base salary; and (ii) the vesting of their outstanding RSUs, and Mr. Pollett is entitled to a six-month continuation of his base salary. In each case, the Company may, in its sole discretion, terminate the employment of Messrs. Schaper, Chattock or Pollett without notice by paying the respective executive a lump-sum payment equal to the termination benefit that would have been paid during the notice period had notice been given.
In the event of non-renewal of Mr. Harris’ current Service Agreement and Mr. Harris’ employment terminates, followed by Mr. Harris being removed from or not re-elected to the Board (other than for cause), he is entitled to: (i) one (1) times the sum of his annual base salary plus his highest annual bonus paid in the three years preceding the year in which the non-renewal occurs; and (ii) an acceleration of the vesting of all of his outstanding RSUs (with any Variable RSUs in their Initial RSU Period vesting at target).
In the event that Mr. Harris retires or the Service Agreement is not renewed and Mr. Harris’ employment terminates but he remains an active member of the Board, he is entitled to continuation of his current medical benefits at the Company’s expense (representing a current annual value of $23,102), and his ongoing service on the Board will be considered continued employment for purposes of vesting of his outstanding RSUs. The table above does not include any payments related to the new-renewal of Mr. Harris’ Service Agreement since it does not expire until December 31, 2017.
Amounts Payable Upon Retirement
None of our Named Executive Officers are entitled to any retirement benefits beyond those generally provided to our salaried employees on a non-discriminatory basis upon retirement or upon non-renewal of their Service Agreements, with the exception of Mr. Harris, as outlined under the heading “Amounts Payable Upon Termination of Employment — Other Events Not Following A Change in Control” (as applicable).
Director Compensation
Director Compensation Earned in 2014
Each non-management director receives the following cash compensation annually: (i) a retainer of $75,000; (ii) for the Chairman (Mr. Taylor), an additional retainer of $100,000; (iii) for the Chairmen of the Compensation and Finance Committees (Messrs. Davis and Eisenson, respectively), an additional retainer of $25,000; (iv) for the Chairmen of the Audit and Underwriting Committees (Messrs. Keizer and Winchester, respectively), an additional retainer of $50,000; (v) for all other members of the Audit and Underwriting Committees, an additional retainer of $15,000; and (vi) Board and Committee attendance fees of $3,000 per meeting. Mr. Harris, our President and CEO, does not receive any additional compensation for his services as a member of the Board or any committee of the Board.
In addition, each non-management director was entitled to receive a one-time grant of 4,000 RSUs upon his or her election or appointment to the Board. These RSUs vest in equal annual installments over a two-year period based on continuous service as a director. Beginning in the second year of his or her service, each non-management director is entitled to receive an annual grant of 2,500 RSUs, which vest over a one-year period based on continuous service as a director. Holders of RSUs are not entitled to voting rights but are entitled to receive payments equivalent to dividends declared on Common Shares.
Subject to his continued service on the Board, Mr. Taylor continues to receive medical benefits at the Company’s expense.
Mr. Winchester serves as a director and Chairman of the Audit Committee of MAL and, for 2014, received an additional retainer of £32,000 (or $52,717 at an average rate of exchange of 1.6474 U.S. dollars per British pound) for such services.
Mr. Eisenson serves as the representative of Charlesbank and the affiliated investment funds of Charlesbank (the “Charlesbank Funds”) on the Board. In accordance with the internal policies of Charlesbank and the terms of the limited partnership agreements for the Charlesbank Funds, all of the cash compensation to which Mr. Eisenson is entitled as a director has been paid directly to Charlesbank and all of the share-based compensation to which Mr. Eisenson is entitled as a director has been assigned to the Charlesbank Funds.
Director Compensation For 2015
There are currently no proposed changes to our 2015 director compensation.
115
Table of Contents
The following table summarizes the total compensation earned by the Company’s non-management directors during the year ended December 31, 2014:
|
|
|
|
|
|
|
|
|
|
|
Change in |
|
|
|
|
|
|
|
|
|
|
|
|
|
|
|
|
Pension Value |
|
|
|
|
|
|
|
|
|
|
|
|
|
|
|
|
and Nonqualified |
|
|
|
|
|
|
|
|
Fees Earned |
|
|
|
|
|
Non-Equity |
|
Deferred |
|
|
|
|
|
|
|
|
or Paid |
|
Share |
|
Option |
|
Incentive Plan |
|
Compensation |
|
All Other |
|
|
|
|
|
|
in Cash |
|
Awards (2) |
|
Awards |
|
Compensation |
|
Earnings |
|
Compensation (3) |
|
Total |
|
|
Director (1) |
|
($) |
|
($) |
|
($) |
|
($) |
|
($) |
|
($) |
|
($) |
|
|
Class A Directors |
|
|
|
|
|
|
|
|
|
|
|
|
|
|
|
|
John G. Bruton |
|
108,000 |
|
79,375 |
|
— |
|
— |
|
— |
|
1,719 |
|
189,094 |
|
|
John D. Collins (4) |
|
82,077 |
|
79,375 |
|
— |
|
— |
|
— |
|
500 |
|
161,952 |
|
|
Candace L. Straight |
|
138,000 |
|
79,375 |
|
— |
|
— |
|
— |
|
1,563 |
|
218,938 |
|
|
Anthony Taylor |
|
223,000 |
|
79,375 |
|
— |
|
— |
|
— |
|
19,317 |
|
321,692 |
|
|
Class B Directors |
|
|
|
|
|
|
|
|
|
|
|
|
|
|
|
|
Morgan W. Davis |
|
148,000 |
|
79,375 |
|
— |
|
— |
|
— |
|
1,563 |
|
228,938 |
|
|
Henry R. Keizer |
|
159,923 |
|
79,375 |
|
— |
|
— |
|
— |
|
4,813 |
|
244,111 |
|
|
John F. Shettle Jr. |
|
153,000 |
|
79,375 |
|
— |
|
— |
|
— |
|
1,563 |
|
233,938 |
|
|
Susan J. Sutherland |
|
108,000 |
|
79,375 |
|
— |
|
— |
|
— |
|
4,163 |
|
191,538 |
|
|
Class C Directors |
|
|
|
|
|
|
|
|
|
|
|
|
|
|
|
|
Michael R. Eisenson (5) |
|
130,000 |
|
79,375 |
|
— |
|
— |
|
— |
|
3,113 |
|
212,488 |
|
|
Nicholas C. Marsh |
|
92,769 |
|
127,000 |
|
— |
|
— |
|
— |
|
2,100 |
|
221,869 |
|
|
Ian M. Winchester |
|
188,000 |
|
79,375 |
|
— |
|
— |
|
— |
|
54,280 |
|
321,655 |
|
(1) All amounts presented in the table above are expressed in U.S. dollars. Certain amounts presented were paid in Bermuda dollars (at a fixed rate of exchange of one U.S. dollar per Bermuda dollar) and British pounds (at an average rate of exchange of 1.6474 U.S. dollars per British pound).
(2) Represents the grant date fair value of RSU awards made during 2014 computed in accordance with FASB ASC Topic 718. Mr. Marsh received a one-time grant of 4,000 RSUs upon his election to the Board and all other non-management directors each received an annual grant of 2,500 RSUs on June 15, 2014. See Note 9 of the Notes to Consolidated Financial Statements for a description of the assumptions used to determine the initial grant date fair value of RSUs. As of December 31, 2014, Ms. Straight and Messrs. Bruton Taylor, Davis, Shettle, and Winchester each had 2,500 unvested RSUs outstanding, Mr. Eisenson had 4,500 RSUs outstanding, Mr. Marsh had 4,000 RSUs outstanding, Ms. Sutherland and Mr. Keizer each had 6,500 unvested RSUs outstanding and Mr. Collins had no unvested RSUs outstanding.
(3) Represents dividend equivalents earned on all outstanding RSUs held by the directors. In addition, for Mr. Taylor, such amount also includes $17,754 in medical benefits and, for Mr. Winchester, such amount also includes $52,717 in fees for his services as a director and Chairman of the Audit Committee of MAL
(4) Mr. Collins resigned from the Board effective June 30, 2014. Effective upon his resignation, the annual award of 2,500 RSUs that he received on June 15, 2014 was cancelled without payment.
(5) Mr. Eisenson serves as the representative of the Charlesbank Funds on the Board. In accordance with the internal policies of Charlesbank and the terms of the limited partnership agreements for the Charlesbank Funds, all of the cash compensation to which Mr. Eisenson is entitled as a director (including dividend equivalents earned on all outstanding RSUs) has been assigned and paid directly to Charlesbank and all of the share-based compensation to which Mr. Eisenson is entitled as a director has been assigned and issued to the Charlesbank Funds.
116
Table of Contents
Item 12. Security Ownership of Certain Beneficial Owners and Management and Related Shareholder Matters
Securities Authorized for Issuance Under Equity Compensation Plans
The following table provides information, as of December 31, 2014, with respect to our equity compensation plans:
|
|
|
|
|
|
|
Number of Securities |
|
|
|
|
Number of Securities |
|
|
|
Remaining Available for |
|
|
|
|
to be Issued Upon |
|
Weighted-Average |
|
Future Issuance Under |
|
|
|
|
Exercise of |
|
Exercise Price of |
|
Equity Compensation |
|
|
|
|
Outstanding |
|
Outstanding |
|
Plans (Excluding |
|
|
|
|
Options, Warrants |
|
Options, Warrants |
|
Securities Reflected in |
|
|
|
|
and Rights |
|
and Rights (3) |
|
Column (a)) |
|
|
Plan Category |
|
(a) |
|
(b) |
|
(c) |
|
|
Equity compensation plans approved by shareholders - 2012 LTIP (1) |
|
1,506,764 |
|
— |
|
2,142,928 |
|
|
Equity compensation plans approved by shareholders - 2007 LTIP (2) |
|
14,000 |
|
— |
|
— |
|
|
Total |
|
1,520,764 |
|
— |
|
2,142,928 |
|
(1) The 2012 LTIP, which was approved by the Company’s shareholders in May 2012, permits the issuance of up to 4,700,000 Common Shares to selected Montpelier employees, non-employee directors and consultants. If any award granted under the 2012 LTIP: (i) is subsequently forfeited, expires, terminates or is canceled without delivery of the Common Shares underlying such award; (ii) is settled in cash; or (iii) is partially surrendered in payment of any taxes or social security (or similar) liabilities required to be withheld in respect of an award granted under the 2012 LTIP, then the number of Common Shares subject to such award will not be treated as issued and will not reduce the aggregate number of Common Shares that may be delivered pursuant to awards granted under the 2012 LTIP.
Incentive awards that may be granted under the 2012 LTIP consist of RSUs, restricted Common Shares, incentive share options (on a limited basis), non-qualified share options, share appreciation rights, deferred share units, performance compensation awards, performance units, cash incentive awards and other equity-based and equity-related awards.
As of December 31, 2014, the only incentive awards outstanding under the 2012 LTIP were RSUs.
(2) Represents outstanding RSU awards issued under the 2007 LTIP, which was approved by the Company’s shareholders on May 23, 2007 and expired on May 23, 2011.
As of December 31, 2014, the only incentive awards outstanding under the 2007 LTIP were RSUs.
(3) RSUs are phantom (as opposed to actual) Common Shares which, depending on the individual award, vest in equal tranches over one- to five-year periods, subject to the recipient maintaining a continuous relationship with Montpelier through the applicable vesting date. Holders of RSUs are not entitled to voting rights but are entitled to receive cash dividends and distributions. RSUs do not require the payment of an exercise price, accordingly, there is no weighted average exercise price for RSU awards.
117
Table of Contents
Security Ownership of Certain Beneficial Owners
The following table sets forth information, as of March 30, 2015 unless otherwise noted, with respect to the ownership of Common Shares by each person known by us to beneficially own 5% or more of our outstanding Common Shares. As of March 30, 2015, we were not aware of any persons who beneficially owned 5% or more of our Preferred Shares.
|
|
|
Number of |
|
Percentage of |
|
|
|
|
Common |
|
Common Shares |
|
|
Name and Address of Beneficial Owner |
|
Shares Owned |
|
Outstanding (1) |
|
|
|
|
|
|
|
|
|
Charlesbank Equity Fund VII, Limited Partnership (2) |
|
5,758,000 |
|
13.1 |
% |
|
200 Clarendon Street, 54th Floor |
|
|
|
|
|
|
Boston, MA 02116 |
|
|
|
|
|
|
|
|
|
|
|
|
|
Dimensional Fund Advisors L.P. (3) |
|
4,107,831 |
|
9.4 |
% |
|
Building One, 6300 Bee Cave Road |
|
|
|
|
|
|
Austin, TX 78746 |
|
|
|
|
|
|
|
|
|
|
|
|
|
The Vanguard Group, Inc. (4) |
|
3,422,670 |
|
7.8 |
% |
|
100 Vanguard Boulevard |
|
|
|
|
|
|
Malvern, PA 19355 |
|
|
|
|
|
|
|
|
|
|
|
|
|
BlackRock Inc. (5) |
|
3,265,571 |
|
7.5 |
% |
|
55 East 52nd Street |
|
|
|
|
|
|
New York, NY 10022 |
|
|
|
|
|
|
|
|
|
|
|
|
|
The London Company (6) |
|
2,856,187 |
|
6.5 |
% |
|
1801 Bayberry Court, Suite 301 |
|
|
|
|
|
|
Richmond, VA 23226 |
|
|
|
|
|
|
|
|
|
|
|
|
|
LSV Asset Management (7) |
|
2,472,959 |
|
5.6 |
% |
|
155 N. Wacker Drive, Suite 4600 |
|
|
|
|
|
|
Chicago, IL 60606 |
|
|
|
|
|
|
|
|
|
|
|
|
|
Allianz Global Investors U.S. Holdings LLC (8) |
|
2,279,957 |
|
5.2 |
% |
|
680 Newport Center Drive, Suite 250 |
|
|
|
|
|
|
Newport Beach, CA 92660 |
|
|
|
|
|
|
|
|
|
|
|
|
|
Donald Smith & Co., Inc. (9) |
|
2,266,581 |
|
5.2 |
% |
|
152 West 57th Street |
|
|
|
|
|
|
New York, NY 10019 |
|
|
|
|
|
(1) Based on 43,799,253 Common Shares outstanding as of March 30, 2015.
(2) Information based on a Form 4 filed with the SEC by Charlesbank Equity Fund VII, Limited Partnership on June 17, 2014. Mr. Eisenson is the CEO and a Managing Director of Charlesbank, the investment advisor to the Charlesbank Funds. See “Security Ownership of Management.”
(3) Information based on a Schedule 13G/A, as of December 31, 2014, filed with the SEC by Dimensional Fund Advisors L.P. on February 5, 2015.
(4) Information based on a Schedule 13G/A, as of December 31, 2014, filed with the SEC by The Vanguard Group, Inc. on February 11, 2015.
(5) Information based on a Schedule 13G, as of December 31, 2014, filed with the SEC by BlackRock Inc. on February 2, 2015.
(6) Information based on a Schedule 13G/A, as of December 31, 2014, filed with the SEC by The London Company on February 13, 2015.
(7) Information based on a Schedule 13G, as of December 31, 2014, filed with the SEC by LSV Asset Management on February 12, 2015.
(8) Information based on a Schedule 13G, as of December 31, 2014, filed with the SEC by Allianz Global Investors U.S. Holdings LLC on February 13, 2015.
(9) Information based on a Schedule 13G, as of December 31, 2014, filed with the SEC by Donald Smith & Co., Inc. on February 3, 2015.
118
Table of Contents
Security Ownership of Management
The following table sets forth information, as of March 30, 2015, with respect to the beneficial ownership of Common Shares and Preferred Shares by each of our directors and our Principal Executive Officer, our Principal Financial Officer and our three other most highly compensated executive officers and by all of our directors and executive officers as a group. None of the Common Shares or Preferred Shares shown as beneficially owned by our directors and executive officers are known to have been pledged as collateral.
|
|
|
Number of |
|
Percentage of |
|
Number of |
|
Percentage of |
|
|
|
|
Common |
|
Common Shares |
|
Preferred |
|
Preferred Shares |
|
|
Name of Beneficial Owner (1) |
|
Shares Owned |
|
Outstanding (2) |
|
Shares Owned |
|
Outstanding (2) |
|
|
|
|
|
|
|
|
|
|
|
|
|
John G. Bruton |
|
11,000 |
|
* |
|
— |
|
* |
|
|
Richard M.M. Chattock |
|
72,103 |
|
* |
|
— |
|
* |
|
|
Morgan W. Davis |
|
33,840 |
|
* |
|
— |
|
* |
|
|
Michael R. Eisenson (3) |
|
5,758,000 |
|
13.1 |
% |
— |
|
* |
|
|
Christopher L. Harris |
|
508,321 |
|
1.2 |
% |
5,000 |
|
* |
|
|
Henry R. Keizer |
|
3,300 |
|
* |
|
3,700 |
|
* |
|
|
Nicholas C. Marsh |
|
2,600 |
|
* |
|
— |
|
* |
|
|
Michael S. Paquette |
|
121,520 |
|
* |
|
— |
|
* |
|
|
William Pollett |
|
81,648 |
|
* |
|
— |
|
* |
|
|
Christopher T. Schaper |
|
96,672 |
|
* |
|
— |
|
* |
|
|
John F. Shettle, Jr. |
|
16,465 |
|
* |
|
— |
|
* |
|
|
Candace L. Straight |
|
13,716 |
|
* |
|
— |
|
* |
|
|
Susan J. Sutherland |
|
5,000 |
|
* |
|
2,700 |
|
* |
|
|
Anthony Taylor |
|
661,550 |
|
1.5 |
% |
42,000 |
|
* |
|
|
Ian M. Winchester |
|
46,300 |
|
* |
|
9,500 |
|
* |
|
|
All directors, director nominees and executive officers as a group (18 persons) |
|
7,597,364 |
|
17.3 |
% |
62,900 |
|
1.0 |
% |
* Represents less than 1.0% of our outstanding Common Shares and Preferred Shares. Beneficial ownership is determined in accordance with Rule 13d-3(d)(1) of the Exchange Act, meaning that RSU vesting within sixty days of such date are deemed to be Common Shares outstanding for computing the percentage held by each person or entity listed, but are not deemed outstanding for computing the percentage held by any other person or entity.
(1) The address of each of the beneficial owners identified is Montpelier House, 94 Pitts Bay Road, Pembroke HM08, Bermuda.
(2) Based on 43,799,253 Common Shares and 6,000,000 Preferred Shares outstanding as of March 30, 2015.
(3) Mr. Eisenson is the CEO and a Managing Director of Charlesbank, the investment advisor to the Charlesbank Funds (the registered owners of these Common Shares). Mr. Eisenson serves as the representative of the Charlesbank Funds on the Board and disclaims beneficial ownership of these Common Shares, except to the extent of his pecuniary interest therein.
Item 13. Certain Relationships and Related Transactions and Director Independence
Certain Relationships and Related Transactions
All relationships and transactions between the Company and any of our directors, executive officers or their immediate family members are reviewed to determine whether such persons have a direct or indirect material interest therein. Responsibility for the development and implementation of processes and controls to obtain information from our directors and executive officers with respect to related person transactions and for the determination, based on facts and circumstances, as to whether the Company or a related person has a direct or indirect material interest lies primarily with our legal department. The Company has a written related person transaction policy. This document is available on the Company’s web site at (www.montpelierre.bm > Corporate Governance > Governance Documents > Related Person Transaction Policy).
As required under SEC rules, transactions that are determined to be directly or indirectly material to the Company or a related person are disclosed in the Company’s Proxy Statement. In addition, our Audit Committee reviews and approves or ratifies any related person transaction that must be disclosed. In the course of its review, the relevant committee considers:
119
Table of Contents
· the nature of the related person’s interest in the transaction;
· the material terms of the transaction, including, without limitation, the amount and type of the transaction;
· whether the transaction would impair the judgment of a director or executive officer in acting in the best interests of the Company;
· the importance of the transaction to the related person; and
· any other matters it deems appropriate.
Any member of the relevant committee or sub-committee who is a related person with respect to a transaction under review may not participate in the deliberations or any vote respecting approval or ratification of the transaction; provided, however, that such director may be counted in determining the presence of a quorum at a meeting of the committee or sub-committee that considers the transaction.
We have entered into transactions with parties that are related to the Company. We believe that each of these transactions, as described below, was made on terms no less favorable to us than we could have obtained from unrelated parties.
BCRH
BCRH provides fully-collateralized property catastrophe reinsurance and invests in various insurance-linked securities through its subsidiaries Blue Capital Re and Blue Capital Re ILS. The underwriting decisions and operations of BCRH and its subsidiaries are managed by BCML. BCML uses Montpelier’s reinsurance underwriting expertise and infrastructure to conduct its business. In addition, Blue Water Re, our wholly-owned special purpose insurance vehicle, is a significant source of reinsurance business for BCRH.
As of December 31, 2014 and 2013, Montpelier owned 33.3% and 28.6% of BCRH’s outstanding common shares, respectively.
In connection with the IPO, Montpelier: (i) reimbursed BCRH for the underwriting discount it incurred, which was equal to 5% of the gross proceeds it received from third parties ($6.2 million); (ii) paid a structuring fee to a third-party equal to 1% of the gross proceeds BCRH received from third parties ($1.3 million); and (iii) paid $0.9 million of BCRH’s offering expenses (representing BCRH’s offering expenses in excess of $1.0 million).
In addition to their roles and responsibilities with the Company, Mr. Pollett serves as CEO and a director of BCRH, Mr. Paquette serves as CFO of BCRH and Mr. Harris serves as Chairman of the Board of Directors of BCRH.
All of the compensation to which Messrs. Pollett and Harris are entitled as directors of BCRH has been assigned and paid directly to Montpelier.
Montpelier provides services to BCRH and its subsidiaries through the following arrangements:
BW Retrocessional Agreement. Through the BW Retrocessional Agreement December 31, 2013, between Blue Capital Re and Blue Water Re, Blue Water Re has the option to cede to Blue Capital Re up to 100% of its participation in the ceded reinsurance business it writes, provided that such business is in accordance with BCRH’s underwriting guidelines. Pursuant to the BW Retrocessional Agreement, Blue Capital Re may participate in: (i) retrocessional, quota share or other agreements between Blue Water Re and Montpelier Re or other third-party reinsurers, which provides it with the opportunity to participate in a diversified portfolio of risks on a proportional basis; and (ii) fronting agreements between Blue Water Re and Montpelier Re or other well capitalized third-party rated reinsurers, which allows Blue Capital Re to transact business with counterparties who prefer to enter into contracts with rated reinsurers.
Investment Management Agreement. BCRH has entered into an Investment Management Agreement with BCML (the “Investment Management Agreement”). Pursuant to the terms of the Investment Management Agreement, BCML has full discretionary authority, including the delegation of the provision of its services, to manage BCRH’s assets, subject to BCRH’s underwriting guidelines, the terms of the Investment Management Agreement and the oversight of BCRH’s board of directors.
120
Table of Contents
Pursuant to the Investment Management Agreement, BCML is entitled to a management fee (the “Management Fee”) of 1.5% of BCRH’s average total shareholders’ equity per annum, calculated and payable in arrears in cash each quarter that the Investment Management Agreement is in effect. For purposes of calculating the Management Fee, BCRH’s total shareholders’ equity means: (1) the net proceeds from all issuances of BCRH’s equity securities since its inception (allocated on a pro rata daily basis for such issuances during the quarter of any such issuance), plus (2) BCRH’s retained earnings as of the end of its most recently completed quarter (without taking into account any non-cash compensation expense it incurred in current or prior periods), minus (3) any amount that BCRH may have paid to repurchase its common shares on a cumulative basis since its inception. It also excludes (x) any unrealized gains and losses and other non-cash items that have impacted BCRH’s shareholders’ equity as reported in its financial statements prepared in accordance with GAAP, other than unrealized gains and losses and other non-cash items relating to insurance-linked securities, and (y) one-time events pursuant to changes in GAAP after discussions between BCML and BCRH’s independent directors and approval by both a majority of BCRH’s independent directors and BCML for all such adjustments.
Underwriting and Insurance Management Agreement. BCRH, Blue Capital Re and BCML have entered into an Underwriting and Insurance Management Agreement (the “Underwriting and Insurance Management Agreement”). Pursuant to the Underwriting and Insurance Management Agreement, BCML provides underwriting, risk management, claims management, ceded retrocession agreements management, and actuarial and reinsurance accounting services to Blue Capital Re. BCML has full discretionary authority to manage the underwriting decisions of Blue Capital Re, subject to BCRH’s underwriting guidelines, the terms of the Underwriting and Insurance Management Agreement and the oversight of BCRH’s and Blue Capital Re’s boards of directors.
Pursuant to the Underwriting and Insurance Management Agreement, BCML is entitled to a performance fee (the “Performance Fee”) calculated and payable in arrears in cash each quarter that the Underwriting and Insurance Management Agreement is in effect in an amount, not less than zero, equal to the product of (1) 20% and (2) the difference between (A) BCRH’s pre-tax, pre-Performance Fee Distributable Income for the then current quarter and (B) a hurdle amount calculated as the product of (i) the weighted average of the issue price per BCRH common share issued pursuant to each of its public or private offerings of common shares since its inception multiplied by the weighted average number of all common shares outstanding (including any common share equivalents), as further reduced by the amount, if any, by which BCRH’s inception-to-date dividends to its shareholders exceeds its inception-to-date GAAP net income, and (ii) 2% (equivalent to an 8% annualized hurdle rate); provided, however, that the foregoing Performance Fee is subject to a rolling three-year high water mark (except that for periods prior to the completion of the three-year period following the IPO, the high water mark calculation will be done over the inception-to-date period).
“Distributable Income,” a non-GAAP measure, means BCRH’s GAAP net income excluding any non-cash compensation expense, unrealized gains and losses and other non-cash items recorded in its net income for the period.
Administrative Services Agreement. BCRH has entered into an Administrative Services Agreement with BCML, as amended on November 13, 2014 (the “Administrative Services Agreement”). Pursuant to the terms of the Administrative Services Agreement, BCML provides BCRH with support services, including the services of Messrs. Pollett and Paquette, as well as finance and accounting, internal audit, claims management and policy wording, modeling software licenses, office space, information technology, human resources and administrative support.
BCRH and its subsidiaries may not terminate the Investment Management Agreement, the Underwriting and Insurance Management Agreement or the Administrative Services Agreement until the fifth anniversary of the completion of the IPO, whether or not BCML’s performance is satisfactory. Upon any termination or non-renewal of either of the Investment Management Agreement or the Underwriting and Insurance Management Agreement (other than for a material breach by, or the insolvency of BCML), BCRH and/or its subsidiaries must pay a one-time termination fee to BCML equal to 5% of its GAAP shareholders’ equity, calculated as of the most recently completed quarter prior to the date of termination (approximately $9.0 million as of December 31, 2014).
During 2014, Montpelier earned a total of $2.6 million and $0.6 million pursuant to services we provided to BCRH and its subsidiaries under the Investment Management Agreement and the Administrative Services Agreement, respectively. Montpelier earned less than $0.1 million during 2014 pursuant to the Underwriting and Insurance Management Agreement.
During 2013, Montpelier earned a total of $0.4 million and $0.1 million pursuant to services we provided to BCRH and its subsidiaries under the Investment Management Agreement and the Administrative Services Agreement, respectively. Montpelier did not earn any amounts in 2013 pursuant to the Underwriting and Insurance Management Agreement.
121
Table of Contents
As of December 31, 2014 and 2013, BCRH and its subsidiaries owed us $0.5 million for the services we performed pursuant to the aforementioned agreements.
BCRH Credit Agreement. In May 2014 BCRH entered into the BCRH Credit Agreement which permits it to borrow up to $20.0 million on a revolving basis for working capital and general corporate purposes. Montpelier serves as a guarantor of BCRH’s obligations under the BCRH Credit Agreement and receives an annual guarantee fee from BCRH equal to 0.125% of the facility’s total capacity.
Director Independence
Members of the Audit Committee and the Compensation Committee must meet all applicable independence tests as defined by the NYSE, the SEC and the Company’s Categorical Standards for Director Independence as adopted by the Board.
The Board and the Compensation Committee have reviewed the responses of directors and director nominees to a questionnaire asking about their direct and indirect relationships with the Company (including those of their immediate family members) and other potential conflicts of interest, as well as pertinent materials provided by management related to transactions, relationships or arrangements between the Company and the directors or director nominees or parties related thereto.
The Board has concluded that each of the Company’s directors and director nominees, other than Mr. Harris, are independent in accordance with the director independence standards of the NYSE and the Company’s Independence Standards and that none of the Company’s directors and director nominees, other than Mr. Harris, has a material relationship with the Company that would impair his or her independence from management or otherwise compromise his or her ability to act as an independent director. Only Mr. Harris, by virtue of his current management position with the Company, is not considered to be an independent director. Accordingly, the majority of the Board is comprised of independent directors.
Item 14. Principal Accountant Fees and Services
Audit Fees, Audit-Related Fees, Tax Fees and All Other Fees
The following table presents fees billed for professional services rendered by PricewaterhouseCoopers Ltd. during 2014 and 2013:
|
|
|
Year Ended December 31, |
|
|
|
|
2014 |
|
2013 |
|
|
Audit Fees (1) |
|
$ |
2,246,446 |
|
$ |
2,216,700 |
|
|
Audit-Related Fees (2) |
|
— |
|
10,200 |
|
|
Tax Fees (3) |
|
30,000 |
|
79,500 |
|
|
All Other Fees (4) |
|
10,500 |
|
17,000 |
|
|
Total Fees (5) |
|
$ |
2,286,946 |
|
$ |
2,323,400 |
|
(1) Represents services in connection with: (i) the audit of the Company’s annual consolidated financial statements, including internal controls over its financial reporting, as set forth in its Annual Reports on Form 10-K; (ii) reviews of the Company’s quarterly consolidated financial statements, as set forth in its Quarterly Reports on Form 10-Q; (iii) with respect to 2013, audit services in connection with the IPO; (iv) audits of the Company’s subsidiaries that are required by statute or regulation; and (v) services that only the Company’s independent registered public accounting firm reasonably can provide.
(2) Audit-related fees for 2013 represent services associated with Lloyd’s required procedures involving a U.K. Liability Register (the “U.K. Register”).
(3) Represents tax compliance, tax advisory and tax planning services.
(4) All other fees for 2014 and 2013 represent subscriptions to the PricewaterhouseCoopers Ltd. annual Bermuda compensation survey and an online accounting research tool.
(5) Audit fees for 2014 and 2013 exclude $77,250 and $81,682, respectively, of audit and consent fees related to the BCGR Listed Fund. Audit-related fees for 2014 exclude $132,000 of fees associated with secondary offerings involving the ordinary shares of the BCGR Listed Fund. Tax fees for 2014 exclude $3,600 of fees relating to the BCGR Listed Fund. The Board of Directors of the BCGR Listed Fund consists solely of independent directors and we do not consolidate the net assets or operations of the BCGR Listed Fund within our consolidated financial statements.
122
Table of Contents
The Audit Committee has considered whether the provision of non-audit services by PricewaterhouseCoopers Ltd. is compatible with maintaining its independence with respect to the Company and has determined that the provision of the specified non-audit services is consistent and compatible with PricewaterhouseCoopers Ltd. maintaining its independence.
Pre-Approval Policies and Procedures
The policy of the Audit Committee is to pre-approve all audit and permissible non-audit services to be performed by the independent registered public accounting firm during the year and, pursuant to this policy, the Audit Committee pre-approved all (100%) of such services for the year ended December 31, 2014. The Audit Committee pre-approves services by authorizing specific projects within the categories outlined below, subject to the budget for each category. The Audit Committee Charter permits the Audit Committee to delegate authority to one or more members, including the Chair, when appropriate, with respect to granting pre-approvals of audit and permitted non-audit services, provided that decisions of such members to grant pre-approvals must be presented to, and ratified by, the full Audit Committee at its next scheduled meeting.
PART IV
Item 15. Exhibits and Financial Statement Schedules
(a) Documents Filed as Part of the Report
The financial statements, financial statement schedules and report of independent registered public accounting firm have been filed as part of this Annual Report on Form 10-K as indicated in the Index to Consolidated Financial Statements and Financial Statement Schedules appearing on page 129 of this report. A listing of all exhibits filed as part of the report appear on pages 123 through 127 of this report.
(b) Exhibits
The exhibits followed by an asterisk (*) indicate exhibits physically filed with this Annual Report on Form 10-K. All other exhibit numbers indicate exhibits filed by incorporation by reference.
|
Exhibit |
|
|
|
Number |
|
Description of Document |
|
|
|
|
|
3.1 |
|
Memorandum of Association (incorporated herein by reference to Exhibit 3.1 to the Company’s Registration Statement on Form S-1, Registration No. 333-89408). |
|
|
|
|
|
3.2 |
|
Amended and Restated Bye-Laws (incorporated herein by reference to Exhibit 3.2 to the Company’s Current Report on Form 8-K filed May 19, 2014). |
|
|
|
|
|
4.1 |
|
Specimen Ordinary Share Certificate (incorporated herein by reference to Exhibit 4.1 to the Company’s Report on Form 10-K filed on February 26, 2010). |
|
|
|
|
|
4.2 |
|
Senior Indenture, dated as of July 15, 2003, between the Company, as Issuer, and The Bank of New York, as Trustee (incorporated herein by reference to Exhibit 4.1 to the Company’s Registration Statement on Form S-1, Registration No. 333-106919). |
|
|
|
|
|
4.3 |
|
First Supplemental Indenture to Senior Indenture, dated as of July 30, 2003, between the Company, as Issuer, and The Bank of New York, as Trustee (incorporated herein by reference to Exhibit 4.2 to the Company’s Registration Statement on Form S-1, Registration No. 333-106919). |
|
|
|
|
|
4.4 |
|
Certificate of Designation of the 8.875% Non-Cumulative Preferred Shares, Series A (incorporated herein by reference to Exhibit 3.3 to the Company’s Report on Form 8-A filed May 10, 2011). |
|
|
|
|
|
4.5 |
|
Second Supplemental Indenture, dated as of October 5, 2012, between Montpelier Re Holdings Ltd. and The Bank of New York Mellon, as trustee (incorporated herein by reference to Exhibit 4.1 to the Company’s Current Report on Form 8-K filed October 5, 2012). |
|
|
|
|
|
10.1 |
|
Shareholders Agreement, dated as of December 12, 2001, among the Company and each of the persons listed on schedule 1 thereto, as amended by Amendment No. 1, dated December 24, 2001 (incorporated herein by reference to Exhibit 10.1 to the Company’s Registration Statement on Form S-1, Registration No. 333-89408). |
|
|
|
|
|
10.2 |
|
Service Agreement, dated as of November 20, 2007, between Anthony Taylor and the Company (incorporated herein by reference to Exhibit 10.1 to the Company’s Current Report on Form 8-K filed November 21, 2007). |
|
|
|
|
|
10.3 |
|
Service Agreement among Thomas G.S. Busher and the Company dated April 3, 2008 (incorporated herein by reference to Exhibit 10.1 to the Company’s Form 8-K filed April 3, 2008). |
123
Table of Contents
|
Exhibit |
|
|
|
Number |
|
Description of Document |
|
|
|
|
|
10.4 |
|
Service Agreement, dated as of January 24, 2002, between Thomas G.S. Busher and MUSL (which was assigned to MUSL by MMSL in January 2009) (incorporated herein by reference to Exhibit 10.6 to the Company’s Registration Statement on Form S-1, Registration No. 333-89408). |
|
|
|
|
|
10.5 |
|
Amendment to Service Agreement among the Company and Thomas G.S. Busher dated July 1, 2010 (incorporated herein by reference to Exhibit 10.2 to the Company’s Current Report on Form 8-K filed July 1, 2010). |
|
|
|
|
|
10.6 |
|
Amendment to Service Agreement between Thomas G.S. Busher and MUSL dated August 4, 2011 (incorporated herein by reference to Exhibit 10.3 to the Company’s Quarterly Report on Form 10-Q filed August 5, 2011). |
|
|
|
|
|
10.7 |
|
Transition Letter dated February 21, 2013, among the Company and Thomas G.S. Busher (incorporated herein by reference to Exhibit 10.1 to the Company’s Current Report on Form 8-K filed February 25, 2013). |
|
|
|
|
|
10.8 |
|
Service Agreement among Christopher L. Harris and the Company dated March 13, 2008 (incorporated herein by reference to Exhibit 10.1 to the Company’s Form 8-K filed March 13, 2008). |
|
|
|
|
|
10.9 |
|
Amendment to Service Agreement among the Company and Christopher L. Harris dated July 1, 2010 (incorporated herein by reference to Exhibit 10.1 to the Company’s Current Report on Form 8-K filed July 1, 2010). |
|
|
|
|
|
10.10 |
|
Service agreement between Christopher L. Harris and the Company dated May 20, 2013 (incorporated herein by reference to Exhibit 10.1 to the Company’s Current Report on Form 8-K filed on May 20, 2013). |
|
|
|
|
|
10.11 |
|
Service Agreement among Michael S. Paquette and the Company dated March 11, 2008 (incorporated herein by reference to Exhibit 10.1 to the Company’s Form 8-K filed March 11, 2008). |
|
|
|
|
|
10.12 |
|
Amendment to Service Agreement among Michael S. Paquette and the Company dated February 27, 2009 (incorporated herein by reference to Exhibit 10.7 to the Company’s Annual Report on Form 10-K filed February 27, 2009). |
|
|
|
|
|
10.13 |
|
Amendment to Service Agreement among Michael S. Paquette and the Company dated August 4, 2011 (incorporated herein by reference to Exhibit 10.2 to the Company’s Quarterly Report on Form 10-Q filed August 5, 2011). |
|
|
|
|
|
10.14 |
|
Service Agreement, dated as of January 24, 2006, between William Pollett and Montpelier Re (incorporated herein by reference to Exhibit 10.6 to the Company’s Quarterly Report on Form10-Q filed May 6, 2009). |
|
|
|
|
|
10.15 |
|
Service Agreement, dated as of November 30, 2004, between Jonathan B. Kim and Montpelier Re. (incorporated herein by reference to Exhibit 10.13 to the Company’s Annual Report on Form10-K filed February 25, 2011). |
|
|
|
|
|
10.16 |
|
Deed, dated as of November 24, 2008, between Jonathan B. Kim and Montpelier Re and the Company. (incorporated herein by reference to Exhibit 10.14 to the Company’s Annual Report on Form10-K filed February 25, 2011). |
|
|
|
|
|
10.17 |
|
Service Agreement, dated March 26, 2010, between Timothy Aman and MTR (incorporated herein by reference to Exhibit 10.4 to the Company’s Quarterly Report on Form 10-Q filed August 5, 2011). |
|
|
|
|
|
10.18 |
|
Service Agreement, dated September 6, 2011, between Christopher T. Schaper and Montpelier Re (incorporated herein by reference to Exhibit 10.18 to the Company’s Annual Report on Form 10-K filed February 24, 2012). |
|
|
|
|
|
10.19 |
|
Letter Agreement dated June 18, 2007 between George A. Carbonar and MTR. (incorporated herein by reference to Exhibit 10.19 to the Company’s Annual Report on Form 10-K filed February 24, 2012). |
|
|
|
|
|
10.20 |
|
Service Agreement between Richard M.M. Chattock, MUSL and Spectrum Syndicate Management Limited (“Spectrum”) dated August 1, 2007. (incorporated herein by reference to Exhibit 10.20 to the Company’s Annual Report filed on Form 10-K filed February 26, 2014). |
|
|
|
|
|
10.21 |
|
Deed between Richard M.M. Chattock, MUSL and Spectrum dated November 5, 2008. (incorporated herein by reference to Exhibit 10.21 to the Company’s Annual Report filed on Form 10-K filed February 26, 2014). |
|
|
|
|
|
10.22 |
|
Severance Plan, dated as of August 27, 2004, among certain Executives and the Company (incorporated herein by reference to Exhibit 10.4 to the Company’s Current Report on Form 8-K filed September 1, 2004). |
|
|
|
|
|
10.23 |
|
Amendment to the Severance Plan, dated as of August 27, 2004, among certain Executives and the Company (incorporated herein by reference to Exhibit 10.2 to the Company’s Quarterly Report on Form 10-Q filed August 6, 2010). |
|
|
|
|
|
10.24 |
|
Second Amendment dated May 18, 2012 to Montpelier Re Holdings Ltd. Severance Plan (incorporated herein by reference to Exhibit 10.4 to the Company’s Quarterly Report filed on Form 10-Q filed August 3, 2012). |
124
Table of Contents
|
Exhibit |
|
|
|
Number |
|
Description of Document |
|
|
|
|
|
10.25 |
|
Montpelier Re Amended and Restated Deferred Compensation Plan (incorporated herein by reference to Exhibit 10.3 to the Company’s Quarterly Report on Form 10-Q filed August 6, 2010). |
|
|
|
|
|
10.26 |
|
The Company’s 2007 Long-Term Incentive Plan as amended May 23, 2007 (incorporated herein by reference to Exhibit 10.14 to the Company’s Annual Report on Form 10-K filed February 28, 2008). |
|
|
|
|
|
10.27 |
|
The Company’s 2007 Long-Term Incentive Plan, Amendment No. 1 (incorporated herein by reference to Exhibit 10.4 to the Company’s Quarterly Report on Form 10-Q filed August 6, 2010). |
|
|
|
|
|
10.28 |
|
The Company’s 2012 Long-Term Incentive Plan (incorporated herein by reference to Exhibit 10.1 to the Company’s Current Report on Form 8-K filed May 18, 2012). |
|
|
|
|
|
10.29 |
|
Form of the Company’s Long-Term Incentive Plan Annual Bonus and Restricted Share Unit Award Agreement (incorporated herein by reference to Exhibit 10.17 to the Company’s Annual Report on Form 10-K filed February 28, 2008). |
|
|
|
|
|
10.30 |
|
Form of Annual Restricted Share Unit Award Agreement under the Company’s Long-Term Incentive Plan (incorporated herein by reference to Exhibit 10.24 to the Company’s Annual Report on Form 10-K filed February 27, 2009). |
|
|
|
|
|
10.31 |
|
Form of Restricted Share Unit Award Agreement under the Company’s Long-Term Incentive Plan (incorporated herein by reference to Exhibit 10.25 to the Company’s Annual Report on Form 10-K filed February 27, 2009). |
|
|
|
|
|
10.32 |
|
Form of the Company’s Long-Term Incentive Plan Restricted Share Unit Award Agreement (incorporated herein by reference to Exhibit 10.18 to the Company’s Annual Report on Form 10-K filed February 28, 2008). |
|
|
|
|
|
10.33 |
|
Form of Restricted Share Unit Award Agreement under the Company’s Long-Term Incentive Plan (incorporated herein by reference to Exhibit 10.5 to the Company’s Quarterly Report on Form 10-Q filed May 6, 2010). |
|
|
|
|
|
10.34 |
|
Form of Restricted Share Unit Award Agreement under the Company’s Long-Term Incentive Plan (incorporated herein by reference to Exhibit 10.1 to the Company’s Quarterly Report on Form 10-Q filed May 5, 2011). |
|
|
|
|
|
10.35 |
|
Form of Restricted Share Unit Award Agreement (incorporated herein by reference to Exhibit 10.5 to the Company’s Quarterly Report filed on Form 10-Q filed August 5, 2011). |
|
|
|
|
|
10.36 |
|
Form of Montpelier Re Holdings Ltd. 2012 Restricted Share Unit Award Agreement under the Company’s 2007 Long-Term Incentive Plan (incorporated herein by reference to Exhibit 10.2 to the Company’s Current Report on Form 8-K filed March 2, 2012). |
|
|
|
|
|
10.37 |
|
Form of 2012 Restricted Share Unit Award Agreement under the Company’s 2012 Long-Term Incentive Plan (incorporated herein by reference to Exhibit 10.2 to the Company’s Quarterly Report filed on Form 10-Q filed August 3, 2012). |
|
|
|
|
|
10.38 |
|
Form of 2012 Director Restricted Share Unit Award Agreement under the Company’s 2012 Long-Term Incentive Plan (incorporated herein by reference to Exhibit 10.3 to the Company’s Quarterly Report filed on Form 10-Q filed August 3, 2012). |
|
|
|
|
|
10.39 |
|
Form of 2013 Annual Restricted Share Unit Award Agreement under the Company’s 2012 Long-Term Incentive Plan (incorporated herein by reference to Exhibit 10.36 to the Company’s Annual Report filed on Form 10-K filed February 25, 2013). |
|
|
|
|
|
10.40 |
|
Form of 2014 Annual Restricted Share Unit Award Agreement under the Company’s 2012 Long-Term Incentive Plan. (incorporated herein by reference to Exhibit 10.40 to the Company’s Annual Report filed on Form 10-K filed February 26, 2014). |
|
|
|
|
|
10.41 |
|
Form of 2014 Director Restricted Share Unit Award Agreement under the Company’s 2012 Long-Term Incentive Plan (incorporated herein by reference to Exhibit 10.2 to the Company’s Current Report filed on Form 8-K filed May 19, 2014). |
|
|
|
|
|
10.42 |
|
The Company’s 2011 Annual Bonus Plan (incorporated herein by reference to Exhibit 10.3 to the Company’s Quarterly Report on Form 10-Q filed May 5, 2011). |
|
|
|
|
|
10.43 |
|
The Company’s 2012 Annual Bonus Plan (incorporated herein by reference to Exhibit 10.1 to the Company’s Current Report on Form 8-K filed March 2, 2012). |
|
|
|
|
|
10.44 |
|
The Company’s 2013 Annual Bonus Plan (incorporated herein by reference to Exhibit 10.40 to the Company’s Annual Report filed on Form 10-K filed February 25, 2013). |
125
Table of Contents
|
Exhibit |
|
|
|
Number |
|
Description of Document |
|
|
|
|
|
10.45 |
|
The Company’s 2014 Annual Bonus Plan. (incorporated herein by reference to Exhibit 10.44 to the Company’s Annual Report filed on Form 10-K filed February 26, 2014). |
|
|
|
|
|
10.46 |
|
Standing Agreement for Letters of Credit between Montpelier Re and the Bank of New York (incorporated herein by reference to Exhibit 10.2 to the Company’s Current Report on Form 8-K filed November 18, 2005). |
|
|
|
|
|
10.47 |
|
Stock Purchase Agreement between GAINSCO, Inc., MGA Insurance Company, Inc. and Montpelier Re U.S. Holdings Ltd. (incorporated herein by reference to Exhibit 10.1 to the Company’s Form 8-K filed August 13, 2007). |
|
|
|
|
|
10.48 |
|
Stock Purchase Agreement between Montpelier Re U.S. Holdings Ltd. and Selective Insurance Group, Inc. (incorporated herein by reference to Exhibit 10.1 to the Company’s Form 8-K filed September 20, 2011). |
|
|
|
|
|
10.49 |
|
Lloyd’s Deposit Trust Deed dated March 30, 2010 among Montpelier Capital Limited as “the Member,” Montpelier Re as “the Depositor” and the Society incorporated by Lloyd’s Act 1871. (incorporated herein by reference to Exhibit 10.1 to the Company’s Current Report on Form 8-K filed March 31, 2010). |
|
|
|
|
|
10.50 |
|
Deed of Determination Release and Substitution dated March 30, 2010 between the Society incorporated by Lloyd’s Act 1871, Montpelier Capital Limited and Montpelier Re (incorporated herein by reference to Exhibit 10.2 to the Company’s Current Report on Form 8-K filed March 31, 2010). |
|
|
|
|
|
10.51 |
|
Investment Management Agreement dated March 30, 2010 between Montpelier Capital Limited, Montpelier Re, the Society incorporated by Lloyd’s Act 1871 and GR-NEAM Limited. (incorporated herein by reference to Exhibit 10.3 to the Company’s Current Report on Form 8-K filed March 31, 2010). |
|
|
|
|
|
10.52 |
|
Lloyd’s Deposit Trust Deed dated May 6, 2010 among Montpelier Capital Limited as “the Member,” Montpelier Re as “the Depositor” and the Society incorporated by Lloyd’s Act 1871 (incorporated herein by reference to Exhibit 10.7 to the Company’s Quarterly Report on Form 10-Q filed May 6, 2010). |
|
|
|
|
|
10.53 |
|
Deed of Transition dated May 6, 2010 between the Society incorporated by Lloyd’s Act 1871, Montpelier Capital Limited as “the Member” and Montpelier Re as “the Depositor” (incorporated herein by reference to Exhibit 10.8 to the Company’s Quarterly Report on Form 10-Q filed May 6, 2010). |
|
|
|
|
|
10.54 |
|
Letter of Credit Reimbursement and Pledge Agreement, dated October 31, 2012, between Montpelier Re and Barclays Bank PLC (incorporated herein by reference to Exhibit 10.1 to the Company’s Current Report on Form 8-K filed October 31, 2012). |
|
|
|
|
|
10.55 |
|
Retrocession Agreement dated December 31, 2013, between Blue Capital Re Ltd. and Blue Water Re Ltd. (incorporated herein by reference to Exhibit 10.1 to the Company’s Current Report on Form 8-K filed on January 6, 2014). |
|
|
|
|
|
10.56 |
|
Investment Management Agreement dated November 12, 2013, between BCRH and BCML (incorporated herein by reference to Exhibit 10.2 to the Company’s Current Report on Form 8-K filed on November 12, 2013). |
|
|
|
|
|
10.57 |
|
Underwriting and Insurance Management Agreement dated November 12, 2013, among BCRH, Blue Capital Re and BCML (incorporated herein by reference to Exhibit 10.1 to the Company’s Current Report on Form 8-K filed on November 12, 2013). |
|
|
|
|
|
10.58 |
|
Amended and Restated Administrative Services Agreement dated November 13, 2014 between BCRH and BCML (*) |
|
|
|
|
|
10.59 |
|
Trademark License Agreement dated November 12, 2013, between BCRH and the Company (incorporated herein by reference to Exhibit 10.4 to the Company’s Current Report on Form 8-K filed on November 12, 2013). |
|
|
|
|
|
10.60 |
|
Assignment of Christopher L. Harris’ Director Remuneration paid by BCRH to the Company dated February 25, 2014. (incorporated herein by reference to Exhibit 10.59 to the Company’s Annual Report filed on Form 10-K filed February 26, 2014). |
|
|
|
|
|
10.61 |
|
Assignment of William Pollett’s Director Remuneration paid by BCRH to the Company dated February 25, 2014. (incorporated herein by reference to Exhibit 10.60 to the Company’s Annual Report filed on Form 10-K filed February 26, 2014). |
|
|
|
|
|
10.62 |
|
Credit Agreement dated as of May 2, 2014, among BCRH (as Borrower), the Guarantors party thereto (as Guarantors), Royal Bank of Canada (as Administrative Agent), RBC Capital Markets (as Arranger) and the Lenders party thereto (incorporated herein by reference to Exhibit 10.1 to the Company’s Current Report on Form 8-K filed on May 5, 2014). |
126
Table of Contents
|
Exhibit |
|
|
|
Number |
|
Description of Document |
|
|
|
|
|
10.63 |
|
Guarantee Agreement dated as of May 2, 2014, among the Company, and the other Guarantors party thereto and Royal Bank of Canada (as Administrative Agent) (incorporated herein by reference to Exhibit 10.2 to the Company’s Current Report on Form 8-K filed on May 5, 2014). |
|
|
|
|
|
10.64 |
|
Credit Agreement dated as of May 15, 2014, among BCGR, the Company (as the Guarantor) and Barclays Bank plc (as the Lender) (incorporated herein by reference to Exhibit 10.1 to the Company’s Current Report on Form 8-K filed on May 19, 2014). |
|
|
|
|
|
11 |
|
Computation of Per Share Earnings (included as Note 2 of the Notes to Consolidated Financial Statements) (*) |
|
|
|
|
|
12 |
|
Computation of Ratios of Earnings to Fixed Charges and Preferred Dividends (*) 14 Code of Ethics (*) |
|
|
|
|
|
21 |
|
Subsidiaries of the Registrant (*) |
|
|
|
|
|
23 |
|
Consent of PricewaterhouseCoopers Ltd. (*) |
|
|
|
|
|
24 |
|
Power of Attorney (included as part of Signatures page) (*) |
|
|
|
|
|
31.1 |
|
Certification of Christopher L. Harris, Chief Executive Officer of the Company, pursuant to Rules 13a-14(a) and 15d-14(a) of the Securities Exchange Act of 1934, as amended (*) |
|
|
|
|
|
31.2 |
|
Certification of Michael S. Paquette, Chief Financial Officer of the Company, pursuant to Rules 13a-14(a) and 15d-14(a) of the Securities Exchange Act of 1934, as amended (*) |
|
|
|
|
|
32 |
|
Certifications of Christopher L. Harris and Michael S. Paquette, Chief Executive Officer and Chief Financial Officer, respectively, of the Company, pursuant to 18 U.S.C. Section 1350 (*) |
|
|
|
|
|
101 |
|
The following materials from the Company’s Report on Form 10-K/A for the fiscal year ended December 31, 2014, formatted in XBRL (eXtensible Business Reporting Language): (i) the Consolidated Balance Sheets at December 31, 2014 and 2013; (ii) the Consolidated Statements of Operations and Comprehensive Income for each of the years ended December 31, 2014, 2013 and 2012; (iii) the Consolidated Statements of Shareholders’ Equity for each of the years ended December 31, 2014, 2013 and 2012; (iv) the Consolidated Statements of Cash Flows for each of the years ended December 31, 2014, 2013 and 2012; and (iv) the Notes to the Consolidated Financial Statements (*) |
Pursuant to Item 602(b)(4)(iii) of Regulation S-K, copies of certain instruments defining the rights of holders of our debt are not filed and, in lieu thereof, we agree to furnish copies to the SEC upon request.
(c) Financial Statement Schedules
The financial statement schedules and report of independent registered public accounting firm have been filed as part of this Annual Report on Form 10-K/A as indicated in the Index to Consolidated Financial Statements and Financial Statement Schedules appearing on page 129 of this report.
127
Table of Contents
SIGNATURES
Pursuant to the requirements of Section 13 or 15(d) of the Securities Exchange Act of 1934, the Company has duly caused this report to be signed on its behalf by the undersigned, thereunto duly authorized.
|
|
MONTPELIER RE HOLDINGS LTD. |
|
|
|
|
Date: March 31, 2015 |
By: |
/s/ MICHAEL S. PAQUETTE |
|
|
|
Michael S. Paquette |
|
|
|
Executive Vice President and |
|
|
|
Chief Financial Officer |
Power of Attorney
KNOW ALL MEN by these presents, that the undersigned does hereby make, constitute and appoint Christopher L. Harris, Michael S. Paquette, Jonathan B. Kim and Allison D. Kiene and each of them, as true and lawful attorney-in-fact and agent of the undersigned, with full power of substitution, resubstitution and revocation, for and in the name, place and stead of the undersigned, to execute and deliver the Annual Report on Form 10-K for the fiscal year ended December 31, 2014, and any and all amendments thereto; such Form 10-K and each such amendment to be in such form and to contain such terms and provisions as said attorney or substitute shall deem necessary or desirable; giving and granting unto said attorney, or to such person or persons as in any case may be appointed pursuant to the power of substitution herein given, full power and authority to do and perform any and every act and thing whatsoever requisite, necessary or, in the opinion of said attorney or substitute, able to be done in and about the premises as fully and to all intents and purposes as the undersigned might or could do if personally present, hereby ratifying and confirming all that said attorney or such substitute shall lawfully do or cause to be done by virtue hereof.
Pursuant to the requirements of the Securities Act of 1934, this Report on Form 10-K/A has been signed by the following persons in the capacities indicated on the 31st day of March, 2015.
|
Signature |
|
Title |
|
|
|
|
|
/s/ CHRISTOPHER L. HARRIS |
|
President, Chief Executive Officer and Director |
|
Christopher L. Harris |
|
(Principal Executive Officer) |
|
|
|
|
|
/s/ MICHAEL S. PAQUETTE |
|
Executive Vice President and Chief Financial Officer |
|
Michael S. Paquette |
|
(Principal Financial Officer and Principal Accounting Officer) |
|
|
|
|
|
/s/ ANTHONY TAYLOR |
|
Chairman |
|
Anthony Taylor |
|
|
|
|
|
|
|
/s/ JOHN G. BRUTON |
|
Director |
|
John G. Bruton |
|
|
|
|
|
|
|
/s/ MORGAN W. DAVIS |
|
Director |
|
Morgan W. Davis |
|
|
|
|
|
|
|
/s/ MICHAEL R. EISENSON |
|
Director |
|
Michael R. Eisenson |
|
|
|
|
|
|
|
/s/ HENRY R. KEIZER |
|
Director |
|
Henry R. Keizer |
|
|
|
|
|
|
|
/s/ NICHOLAS C. MARSH |
|
Director |
|
Nicholas C. Marsh |
|
|
|
|
|
|
|
/s/ JOHN F. SHETTLE, JR. |
|
Director |
|
John F. Shettle, Jr. |
|
|
|
|
|
|
|
/s/ CANDACE L. STRAIGHT |
|
Director |
|
Candace L. Straight |
|
|
|
|
|
|
|
/s/ SUSAN J. SUTHERLAND |
|
Director |
|
Susan J. Sutherland |
|
|
|
|
|
|
|
/s/ IAN M. WINCHESTER |
|
Director |
|
Ian M. Winchester |
|
|
128
Table of Contents
Index to Consolidated Financial Statements and Financial Statement Schedules
|
|
Form |
|
|
10-K/A |
|
|
page(s) |
|
Consolidated Financial Statements: |
|
|
|
|
|
Consolidated Balance Sheets as of December 31, 2014 and 2013 |
F-1 |
|
|
|
|
Consolidated Statements of Operations and Comprehensive Income for each of the years ended December 31, 2014, 2013 and 2012 |
F-2 |
|
|
|
|
Consolidated Statements of Shareholders’ Equity for each of the years ended December 31, 2014, 2013 and 2012 |
F-3 |
|
|
|
|
Consolidated Statements of Cash Flows for each of the years ended December 31, 2014, 2013 and 2012 |
F-4 |
|
|
|
|
Notes to Consolidated Financial Statements |
F-5 |
|
|
|
|
Other Financial Information: |
|
|
|
|
|
Management’s Responsibility For Financial Statements |
F-48 |
|
|
|
|
Management’s Annual Report on Internal Control Over Financial Reporting |
F-48 |
|
|
|
|
Report of Independent Registered Public Accounting Firm |
F-49 |
|
|
|
|
Selected Quarterly Financial Data (unaudited) |
F-50 |
|
|
|
|
Financial Statement Schedules: |
|
|
|
|
|
I. Summary of Investments - Other than Investments in Related Parties |
FS-1 |
|
|
|
|
II. Condensed Financial Information of the Registrant |
FS-2 |
|
|
|
|
III. Supplementary Insurance Information |
FS-4 |
|
|
|
|
IV. Reinsurance |
FS-5 |
|
|
|
|
V. Valuation and Qualifying Accounts |
* |
|
|
|
|
VI. Supplemental Information Concerning Property and Casualty Insurance Operations |
FS-6 |
* Not required to be filed in accordance with Rule 7-05 of Regulation S-X.
129
Table of Contents
MONTPELIER RE HOLDINGS LTD.
CONSOLIDATED BALANCE SHEETS
|
|
|
December 31, |
|
|
(In millions of U.S. dollars, except share and per share amounts) |
|
2014 |
|
2013 |
|
|
Assets |
|
|
|
|
|
|
Fixed maturity investments, at fair value (amortized cost: $1,902.9 and $2,421.9) |
|
$ |
1,901.0 |
|
$ |
2,430.8 |
|
|
Equity securities, at fair value (cost: $163.8 and $106.6) |
|
173.1 |
|
117.3 |
|
|
Other investments (cost: $642.4 and $77.7) |
|
642.0 |
|
78.8 |
|
|
Total investments |
|
2,716.1 |
|
2,626.9 |
|
|
Cash and cash equivalents |
|
447.7 |
|
468.4 |
|
|
Restricted cash |
|
26.6 |
|
133.7 |
|
|
Reinsurance recoverable on unpaid losses |
|
48.7 |
|
63.6 |
|
|
Reinsurance recoverable on paid losses |
|
7.1 |
|
3.6 |
|
|
Insurance and reinsurance premiums receivable |
|
206.5 |
|
203.4 |
|
|
Unearned reinsurance premiums ceded |
|
24.0 |
|
22.6 |
|
|
Deferred insurance and reinsurance acquisition costs |
|
53.3 |
|
51.5 |
|
|
Accrued investment income |
|
11.5 |
|
15.0 |
|
|
Amounts receivable under reverse repurchase agreements |
|
— |
|
80.8 |
|
|
Unsettled sales of investments |
|
51.1 |
|
58.8 |
|
|
Other assets |
|
36.5 |
|
30.2 |
|
|
|
|
|
|
|
|
|
Total Assets |
|
$ |
3,629.1 |
|
$ |
3,758.5 |
|
|
Liabilities |
|
|
|
|
|
|
Loss and loss adjustment expense reserves |
|
$ |
775.7 |
|
$ |
881.6 |
|
|
Debt |
|
407.3 |
|
399.2 |
|
|
Unearned insurance and reinsurance premiums |
|
275.4 |
|
276.7 |
|
|
Insurance and reinsurance balances payable |
|
48.0 |
|
43.3 |
|
|
Liability for investment securities sold short |
|
76.2 |
|
155.6 |
|
|
Unsettled purchases of investments |
|
68.8 |
|
58.8 |
|
|
Accounts payable, accrued expenses and other liabilities |
|
63.2 |
|
56.3 |
|
|
|
|
|
|
|
|
|
Total Liabilities |
|
1,714.6 |
|
1,871.5 |
|
|
|
|
|
|
|
|
|
Commitments and Contingent Liabilities (See Note 15) |
|
— |
|
— |
|
|
|
|
|
|
|
|
|
Shareholders’ Equity |
|
|
|
|
|
|
Non-cumulative Preferred Shares, Series A, at 1/6 cent par value per share - 6,000,000 shares authorized and issued |
|
150.0 |
|
150.0 |
|
|
Common Shares, at 1/6 cent par value per share - 1,200,000,000 shares authorized; 45,113,841 and 50,462,839 shares issued |
|
0.1 |
|
0.1 |
|
|
Additional paid-in capital |
|
744.4 |
|
900.5 |
|
|
Common Shares held in treasury at cost; 1,494,717 and 1,188,674 shares |
|
(31.0 |
) |
(18.9 |
) |
|
Retained earnings |
|
789.5 |
|
612.8 |
|
|
Accumulated net foreign currency translation losses |
|
(4.8 |
) |
(2.4 |
) |
|
|
|
|
|
|
|
|
Total Shareholders’ Equity available to the Company |
|
1,648.2 |
|
1,642.1 |
|
|
|
|
|
|
|
|
|
Non-controlling interests |
|
266.3 |
|
244.9 |
|
|
|
|
|
|
|
|
|
Total Shareholders’ Equity |
|
1,914.5 |
|
1,887.0 |
|
|
|
|
|
|
|
|
|
Total Liabilities and Shareholders’ Equity |
|
$ |
3,629.1 |
|
$ |
3,758.5 |
|
See Notes to Consolidated Financial Statements
F-1
Table of Contents
MONTPELIER RE HOLDINGS LTD.
CONSOLIDATED STATEMENTS OF OPERATIONS AND COMPREHENSIVE INCOME
|
|
|
Year Ended December 31, |
|
|
(In millions of U.S. dollars, except per share amounts) |
|
2014 |
|
2013 |
|
2012 |
|
|
Revenues |
|
|
|
|
|
|
|
|
Gross insurance and reinsurance premiums written |
|
$ |
740.3 |
|
$ |
706.0 |
|
$ |
735.3 |
|
|
Ceded reinsurance premiums |
|
(89.4 |
) |
(102.9 |
) |
(119.6 |
) |
|
|
|
|
|
|
|
|
|
|
Net insurance and reinsurance premiums written |
|
650.9 |
|
603.1 |
|
615.7 |
|
|
Change in net unearned insurance and reinsurance premiums |
|
(5.7 |
) |
(3.5 |
) |
0.8 |
|
|
|
|
|
|
|
|
|
|
|
Net insurance and reinsurance premiums earned |
|
645.2 |
|
599.6 |
|
616.5 |
|
|
Net investment income |
|
46.8 |
|
64.0 |
|
67.1 |
|
|
Net realized and unrealized investment gains (losses) |
|
5.4 |
|
(49.2 |
) |
82.4 |
|
|
Net foreign currency gains (losses) |
|
9.4 |
|
(15.9 |
) |
(12.8 |
) |
|
Net income (loss) from derivative instruments |
|
(18.6 |
) |
(25.3 |
) |
3.2 |
|
|
Other revenues |
|
2.9 |
|
0.4 |
|
0.8 |
|
|
|
|
|
|
|
|
|
|
|
Total revenues |
|
691.1 |
|
573.6 |
|
757.2 |
|
|
Expenses |
|
|
|
|
|
|
|
|
Underwriting expenses: |
|
|
|
|
|
|
|
|
Loss and loss adjustment expenses |
|
189.6 |
|
126.5 |
|
286.4 |
|
|
Insurance and reinsurance acquisition costs |
|
110.2 |
|
90.5 |
|
96.6 |
|
|
General and administrative expenses |
|
123.7 |
|
119.2 |
|
116.2 |
|
|
Non-underwriting expenses: |
|
|
|
|
|
|
|
|
Interest and other financing expenses |
|
18.9 |
|
18.8 |
|
20.4 |
|
|
Underwriting discount and structuring fees associated with the BCRH IPO |
|
— |
|
7.5 |
|
— |
|
|
Loss on early extinguishment of 2013 Senior Notes |
|
— |
|
— |
|
9.7 |
|
|
Other expenses |
|
3.4 |
|
0.6 |
|
— |
|
|
|
|
|
|
|
|
|
|
|
Total expenses |
|
445.8 |
|
363.1 |
|
529.3 |
|
|
|
|
|
|
|
|
|
|
|
Income before income taxes |
|
245.3 |
|
210.5 |
|
227.9 |
|
|
Income tax benefit (provision) |
|
2.7 |
|
0.1 |
|
(0.3 |
) |
|
|
|
|
|
|
|
|
|
|
Net income |
|
248.0 |
|
210.6 |
|
227.6 |
|
|
|
|
|
|
|
|
|
|
|
Net income attributable to non-controlling interests |
|
(24.1 |
) |
(6.1 |
) |
— |
|
|
|
|
|
|
|
|
|
|
|
Net income available to the Company |
|
223.9 |
|
204.5 |
|
227.6 |
|
|
|
|
|
|
|
|
|
|
|
Dividends declared on Preferred Shares |
|
(13.3 |
) |
(13.3 |
) |
(13.3 |
) |
|
|
|
|
|
|
|
|
|
|
Net income available to the Company’s common shareholders |
|
$ |
210.6 |
|
$ |
191.2 |
|
$ |
214.3 |
|
|
|
|
|
|
|
|
|
|
|
Net income |
|
$ |
248.0 |
|
$ |
210.6 |
|
$ |
227.6 |
|
|
Change in accumulated net foreign currency translation losses |
|
(2.4 |
) |
0.9 |
|
0.8 |
|
|
|
|
|
|
|
|
|
|
|
Comprehensive income |
|
245.6 |
|
211.5 |
|
228.4 |
|
|
Net income attributable to non-controlling interests |
|
(24.1 |
) |
(6.1 |
) |
— |
|
|
|
|
|
|
|
|
|
|
|
Comprehensive income available to the Company |
|
$ |
221.5 |
|
$ |
205.4 |
|
$ |
228.4 |
|
|
|
|
|
|
|
|
|
|
|
Basic and diluted earnings per Common Share |
|
$ |
4.48 |
|
$ |
3.61 |
|
$ |
3.67 |
|
|
Dividends declared per Common Share and RSU |
|
$ |
0.65 |
|
$ |
0.47 |
|
$ |
0.43 |
|
See Notes to Consolidated Financial Statements
F-2
Table of Contents
MONTPELIER RE HOLDINGS LTD.
CONSOLIDATED STATEMENTS OF SHAREHOLDERS’ EQUITY
|
|
|
|
|
|
|
|
|
|
|
|
|
|
|
Accum. foreign |
|
|
|
|
|
|
Total |
|
|
|
Common |
|
Additional |
|
Common |
|
|
|
currency |
|
Non- |
|
|
|
|
shareholders’ |
|
Preferred |
|
Shares, at |
|
paid-in |
|
Shares held |
|
Retained |
|
translation |
|
controlling |
|
|
(In millions of U.S. dollars) |
|
equity |
|
Shares |
|
par value |
|
capital |
|
in treasury |
|
earnings |
|
losses |
|
interests |
|
|
|
|
|
|
|
|
|
|
|
|
|
|
|
|
|
|
|
|
|
Balances at January 1, 2012 |
|
$ |
1,549.3 |
|
$ |
150.0 |
|
$ |
0.1 |
|
$ |
1,165.6 |
|
$ |
(22.0 |
) |
$ |
259.7 |
|
$ |
(4.1 |
) |
$ |
— |
|
|
|
|
|
|
|
|
|
|
|
|
|
|
|
|
|
|
|
|
|
Net income |
|
227.6 |
|
— |
|
— |
|
— |
|
— |
|
227.6 |
|
— |
|
— |
|
|
Net change in foreign currency translation |
|
0.8 |
|
— |
|
— |
|
— |
|
— |
|
— |
|
0.8 |
|
— |
|
|
Issuances of Common Shares from treasury |
|
— |
|
— |
|
— |
|
(7.8 |
) |
7.8 |
|
— |
|
— |
|
— |
|
|
Repurchases of Common Shares |
|
(120.9 |
) |
— |
|
— |
|
(112.0 |
) |
(8.9 |
) |
— |
|
— |
|
— |
|
|
Expense recognized for RSUs |
|
12.1 |
|
— |
|
— |
|
12.1 |
|
— |
|
— |
|
— |
|
— |
|
|
RSUs withheld for income taxes |
|
(1.9 |
) |
— |
|
— |
|
(1.9 |
) |
— |
|
— |
|
— |
|
— |
|
|
Dividends declared - Preferred Shares |
|
(13.3 |
) |
— |
|
— |
|
— |
|
— |
|
(13.3 |
) |
— |
|
— |
|
|
Dividends declared - Common Shares |
|
(24.3 |
) |
— |
|
— |
|
— |
|
— |
|
(24.3 |
) |
— |
|
— |
|
|
|
|
|
|
|
|
|
|
|
|
|
|
|
|
|
|
|
|
|
Balances at December 31, 2012 |
|
$ |
1,629.4 |
|
$ |
150.0 |
|
$ |
0.1 |
|
$ |
1,056.0 |
|
$ |
(23.1 |
) |
$ |
449.7 |
|
$ |
(3.3 |
) |
$ |
— |
|
|
|
|
|
|
|
|
|
|
|
|
|
|
|
|
|
|
|
|
|
Net income |
|
210.6 |
|
— |
|
— |
|
— |
|
— |
|
204.5 |
|
— |
|
6.1 |
|
|
Net change in foreign currency translation |
|
0.9 |
|
— |
|
— |
|
— |
|
— |
|
— |
|
0.9 |
|
— |
|
|
Issuances of Common Shares from treasury |
|
— |
|
— |
|
— |
|
(9.3 |
) |
13.4 |
|
(4.1 |
) |
— |
|
— |
|
|
Repurchases of Common Shares |
|
(168.0 |
) |
— |
|
— |
|
(158.8 |
) |
(9.2 |
) |
— |
|
— |
|
— |
|
|
Expense recognized for RSUs |
|
18.0 |
|
— |
|
— |
|
18.0 |
|
— |
|
— |
|
— |
|
— |
|
|
RSUs withheld for income taxes |
|
(5.4 |
) |
— |
|
— |
|
(5.4 |
) |
— |
|
— |
|
— |
|
— |
|
|
Net contributions from non-controlling interests |
|
238.8 |
|
— |
|
— |
|
— |
|
— |
|
— |
|
— |
|
238.8 |
|
|
Dividends declared - Preferred Shares |
|
(13.3 |
) |
— |
|
— |
|
— |
|
— |
|
(13.3 |
) |
— |
|
— |
|
|
Dividends declared - Common Shares |
|
(24.0 |
) |
— |
|
— |
|
— |
|
— |
|
(24.0 |
) |
— |
|
— |
|
|
|
|
|
|
|
|
|
|
|
|
|
|
|
|
|
|
|
|
|
Balances at December 31, 2013 |
|
$ |
1,887.0 |
|
$ |
150.0 |
|
$ |
0.1 |
|
$ |
900.5 |
|
$ |
(18.9 |
) |
$ |
612.8 |
|
$ |
(2.4 |
) |
$ |
244.9 |
|
|
|
|
|
|
|
|
|
|
|
|
|
|
|
|
|
|
|
|
|
Net income |
|
248.0 |
|
— |
|
— |
|
— |
|
— |
|
223.9 |
|
— |
|
24.1 |
|
|
Net change in foreign currency translation |
|
(2.4 |
) |
— |
|
— |
|
— |
|
— |
|
— |
|
(2.4 |
) |
— |
|
|
Issuances of Common Shares from treasury |
|
— |
|
— |
|
— |
|
(9.6 |
) |
13.6 |
|
(4.0 |
) |
— |
|
— |
|
|
Repurchases of Common Shares |
|
(185.9 |
) |
— |
|
— |
|
(160.2 |
) |
(25.7 |
) |
— |
|
— |
|
— |
|
|
Expense recognized for RSUs |
|
19.8 |
|
— |
|
— |
|
19.8 |
|
— |
|
— |
|
— |
|
— |
|
|
RSUs withheld for income taxes |
|
(6.4 |
) |
— |
|
— |
|
(6.4 |
) |
— |
|
— |
|
— |
|
— |
|
|
Purchases of non-controlling interest |
|
(7.9 |
) |
— |
|
— |
|
0.3 |
|
— |
|
— |
|
— |
|
(8.2 |
) |
|
Net contributions from non-controlling interests |
|
11.0 |
|
— |
|
— |
|
— |
|
— |
|
— |
|
— |
|
11.0 |
|
|
Dividends declared - non-controlling interests |
|
(5.5 |
) |
— |
|
— |
|
— |
|
— |
|
— |
|
— |
|
(5.5 |
) |
|
Dividends declared - Preferred Shares |
|
(13.3 |
) |
— |
|
— |
|
— |
|
— |
|
(13.3 |
) |
— |
|
— |
|
|
Dividends declared - Common Shares and RSUs |
|
(29.9 |
) |
— |
|
— |
|
— |
|
— |
|
(29.9 |
) |
— |
|
— |
|
|
|
|
|
|
|
|
|
|
|
|
|
|
|
|
|
|
|
|
|
Balances at December 31, 2014 |
|
$ |
1,914.5 |
|
$ |
150.0 |
|
$ |
0.1 |
|
$ |
744.4 |
|
$ |
(31.0 |
) |
$ |
789.5 |
|
$ |
(4.8 |
) |
$ |
266.3 |
|
See Notes to Consolidated Financial Statements
F-3
Table of Contents
MONTPELIER RE HOLDINGS LTD.
CONSOLIDATED STATEMENTS OF CASH FLOWS
|
|
|
Year Ended December 31, |
|
|
(In millions of U.S. dollars) |
|
2014 |
|
2013 |
|
2012 |
|
|
|
|
|
|
|
|
|
|
|
Cash flows from operations: |
|
|
|
|
|
|
|
|
Net income |
|
$ |
248.0 |
|
$ |
210.6 |
|
$ |
227.6 |
|
|
Charges (credits) to reconcile net income to net cash from operations: |
|
|
|
|
|
|
|
|
Net realized and unrealized investment losses (gains) |
|
(5.4 |
) |
49.2 |
|
(82.4 |
) |
|
Net realized and unrealized losses (gains) on investment-related derivative instruments |
|
11.7 |
|
11.3 |
|
(0.7 |
) |
|
Net amortization and depreciation of assets and liabilities |
|
12.2 |
|
8.1 |
|
14.7 |
|
|
Expense recognized for RSUs |
|
19.8 |
|
18.0 |
|
12.1 |
|
|
Net change in: |
|
|
|
|
|
|
|
|
Loss and loss adjustment expense reserves |
|
(82.4 |
) |
(239.5 |
) |
21.7 |
|
|
Reinsurance recoverable on paid and unpaid losses |
|
(7.5 |
) |
47.5 |
|
(14.2 |
) |
|
Unearned insurance and reinsurance premiums |
|
7.6 |
|
3.2 |
|
(1.3 |
) |
|
Insurance and reinsurance balances payable |
|
9.9 |
|
(13.3 |
) |
8.5 |
|
|
Unearned reinsurance premiums ceded |
|
(1.8 |
) |
(0.3 |
) |
0.1 |
|
|
Deferred insurance and reinsurance acquisition costs |
|
(4.0 |
) |
(2.3 |
) |
3.9 |
|
|
Insurance and reinsurance premiums receivable |
|
(9.7 |
) |
18.6 |
|
(5.4 |
) |
|
Other assets |
|
3.5 |
|
(7.5 |
) |
(1.9 |
) |
|
Accounts payable, accrued expenses and other liabilities |
|
4.3 |
|
(0.7 |
) |
9.7 |
|
|
Other |
|
(5.3 |
) |
17.3 |
|
8.4 |
|
|
Net cash and cash equivalents provided from operations |
|
200.9 |
|
120.2 |
|
200.8 |
|
|
|
|
|
|
|
|
|
|
|
Cash flows from investing activities: |
|
|
|
|
|
|
|
|
Purchases of fixed maturity investments |
|
(9,353.1 |
) |
(6,434.2 |
) |
(4,513.3 |
) |
|
Purchases of equity securities |
|
(525.3 |
) |
(324.3 |
) |
(155.3 |
) |
|
Purchases of other investments |
|
(1,043.8 |
) |
(2.0 |
) |
(82.0 |
) |
|
Sales, maturities, calls and pay downs of fixed maturity investments |
|
9,850.6 |
|
6,571.4 |
|
4,288.6 |
|
|
Sales and redemptions of equity securities |
|
448.4 |
|
277.5 |
|
224.1 |
|
|
Sales and redemptions of other investments |
|
465.4 |
|
70.7 |
|
51.6 |
|
|
Expenses paid in connection with MUSIC Sale |
|
— |
|
— |
|
(1.0 |
) |
|
Net settlements of investment-related derivative instruments |
|
(10.0 |
) |
(18.1 |
) |
0.7 |
|
|
Net settlements of reverse repurchase agreements |
|
85.2 |
|
(33.4 |
) |
(12.6 |
) |
|
Net change in restricted cash |
|
106.3 |
|
(63.4 |
) |
58.1 |
|
|
Payment of accrued investment performance fees |
|
(4.1 |
) |
(6.4 |
) |
— |
|
|
Acquisitions of capitalized assets |
|
(5.4 |
) |
(1.2 |
) |
(0.4 |
) |
|
Net cash and cash equivalents provided from (used for) investing activities |
|
14.2 |
|
36.6 |
|
(141.5 |
) |
|
|
|
|
|
|
|
|
|
|
Cash flows from financing activities: |
|
|
|
|
|
|
|
|
Repurchases of Common Shares |
|
(185.9 |
) |
(171.4 |
) |
(117.5 |
) |
|
Net contributions from non-controlling interests |
|
5.2 |
|
238.8 |
|
— |
|
|
Purchases of non-controlling interest |
|
(7.9 |
) |
— |
|
— |
|
|
Net settlements of repurchase agreements |
|
(11.8 |
) |
— |
|
— |
|
|
Borrowings under the BCRH Credit Agreement |
|
8.0 |
|
— |
|
— |
|
|
Dividends paid - non-controlling interests |
|
(5.5 |
) |
— |
|
— |
|
|
Dividends paid - Common Shares and RSUs |
|
(27.2 |
) |
(24.2 |
) |
(24.4 |
) |
|
Dividends paid - Preferred Shares |
|
(13.3 |
) |
(13.3 |
) |
(13.3 |
) |
|
Redemptions of 2013 Senior Notes |
|
— |
|
— |
|
(228.0 |
) |
|
Proceeds from 2022 Senior Note issuance |
|
— |
|
— |
|
299.1 |
|
|
Debt issuance costs of 2022 Senior Notes |
|
— |
|
— |
|
(2.7 |
) |
|
Net cash and cash equivalents (used for) provided from financing activities |
|
(238.4 |
) |
29.9 |
|
(86.8 |
) |
|
|
|
|
|
|
|
|
|
|
Effect of foreign currency exchange rate fluctuations on cash and cash equivalents |
|
2.6 |
|
(1.7 |
) |
5.4 |
|
|
|
|
|
|
|
|
|
|
|
Net (decrease) increase in cash and cash equivalents during the year |
|
(20.7 |
) |
185.0 |
|
(22.1 |
) |
|
Cash and cash equivalents - beginning of year |
|
468.4 |
|
283.4 |
|
305.5 |
|
|
Cash and cash equivalents - end of year |
|
$ |
447.7 |
|
$ |
468.4 |
|
$ |
283.4 |
|
See Notes to Consolidated Financial Statements
F-4
Table of Contents
NOTES TO CONSOLIDATED FINANCIAL STATEMENTS
(Expressed in millions of United States Dollars,
except per share amounts or as otherwise described)
NOTE 1. Summary of Significant Accounting Policies
Basis of Presentation
Montpelier Re Holdings Ltd. (the “Company” or the “Registrant”) was incorporated as an exempted Bermuda limited liability company under the laws of Bermuda on November 14, 2001. The Company, through its subsidiaries and affiliates in Bermuda, the United Kingdom (the “U.K.”) and the United States (the “U.S.”), collectively “Montpelier,” provides customized and innovative insurance and reinsurance solutions to the global market. Through its affiliates in Bermuda, the Company provides institutional and retail investors with direct access to the global property catastrophe reinsurance market. The Company’s headquarters and principal executive offices are located at Montpelier House, 94 Pitts Bay Road, Pembroke, Bermuda HM 08.
The Company’s consolidated financial statements have been prepared in accordance with accounting principles generally accepted in the U.S. (“GAAP”). All significant intercompany accounts and transactions have been eliminated in consolidation. The preparation of financial statements in conformity with GAAP requires management to make estimates and assumptions that affect the reported and disclosed amounts of assets and liabilities, and disclosure of contingent assets and liabilities as of the date of the financial statements and the amounts of revenues and expenses reported during the period. Actual results could differ materially from those estimates. The significant estimates reflected in the Company’s consolidated financial statements include, but are not limited to, loss and loss adjustment expense (“LAE”) reserves, written and earned insurance and reinsurance premiums, ceded reinsurance and share-based compensation.
Reportable Segments
The Company operates through three reportable segments: Montpelier Bermuda, Montpelier at Lloyd’s and Collateralized Reinsurance. Each of the Company’s segments represents a separate and distinct underwriting platform through which Montpelier conducts insurance and reinsurance business. The Company’s segment disclosures present the operations of Montpelier Bermuda, Montpelier at Lloyd’s and Collateralized Reinsurance prior to the effects of any inter-segment quota share reinsurance agreements among them. This presentation allows the reader, as well as the Company’s chief operating decision makers, to objectively analyze the business originated through each of the Company’s underwriting platforms, regardless of where such business ultimately resides within Montpelier.
Detailed financial information about the Company’s reportable segments for each of the years in the three-year period ended December 31, 2014 is presented in Note 12. The activities of the Company, certain intermediate holding and service companies, intercompany eliminations relating to inter-segment reinsurance agreements and support services and the business retained upon the Company’s December 31, 2011 sale (the “MUSIC Sale”) of Montpelier U.S. Insurance Company (“MUSIC”) to Selective Insurance Group, Inc. (“Selective”), collectively referred to as “Corporate and Other,” are also presented in Note 12.
Prior to 2014, the Company presented the business it retained upon the MUSIC Sale (“MUSIC Run-Off”) as a separate reportable segment. Beginning in 2014, the Company revised its reportable segments to present its former MUSIC Run-Off operations within Corporate and Other. All periods presented in this report have been restated to conform with the current presentation.
The nature and composition of each of the Company’s reportable segments and its Corporate and Other activities is as follows:
Montpelier Bermuda
The Montpelier Bermuda segment consists of the assets and operations of Montpelier Reinsurance Ltd. (“Montpelier Re”).
F-5
Table of Contents
Montpelier Re, the Company’s wholly-owned operating subsidiary based in Pembroke, Bermuda, is registered as a Bermuda Class 4 insurer. Montpelier Re seeks to identify and underwrite insurance and reinsurance opportunities by combining underwriting experience with proprietary risk pricing and capital allocation models and catastrophe modeling tools. Montpelier Re focuses on writing short-tail U.S. and international catastrophe treaty reinsurance on both an excess-of-loss and proportional basis. Montpelier Re also writes specialty treaty reinsurance, including casualty, accident & health, aviation, space, crop, financial risk, political risk, terrorism and workers’ compensation catastrophe classes of business, as well as insurance and facultative reinsurance business.
Montpelier at Lloyd’s
The Montpelier at Lloyd’s segment consists of the collective assets and operations of Montpelier Syndicate 5151 (“Syndicate 5151”), Montpelier Capital Limited (“MCL”), Montpelier at Lloyd’s Limited (“MAL”), Montpelier Underwriting Services Limited (“MUSL”) and Montpelier Underwriting Inc. (“MUI”).
Syndicate 5151, the Company’s wholly-owned Lloyd’s of London (“Lloyd’s”) syndicate based in London, was established in July 2007. Syndicate 5151 underwrites property insurance and reinsurance, engineering, marine hull and liability, cargo and specie, political & financial risks and specialty casualty classes sourced mainly from the London, U.S. and European markets.
MCL, the Company’s wholly-owned U.K. subsidiary based in London, serves as Syndicate 5151’s corporate underwriting member at Lloyd’s.
MAL, the Company’s wholly-owned Lloyd’s Managing Agent based in London, manages Syndicate 5151.
MUSL, the Company’s wholly-owned U.K. subsidiary based in London, provides support services to Syndicate 5151, MAL and MCL.
MUI, the Company’s wholly-owned subsidiary based in Woburn, Massachusetts, serves as a Lloyd’s Coverholder, meaning that it is authorized to enter into insurance and reinsurance contracts and/or issue documentation on behalf of Syndicate 5151. MUI underwrites facultative reinsurance business through managing general agents and intermediaries.
Collateralized Reinsurance
The Collateralized Reinsurance segment, which Montpelier markets under the name Blue Capital® (Blue Capital is a registered trademark of the Company), was launched in 2012 as an asset management platform offering a range of property catastrophe reinsurance-linked investment products to institutional and retail investors. Blue Capital® differentiates itself by providing institutional and retail investors with the opportunity to directly invest in global property catastrophe reinsurance risks.
The Collateralized Reinsurance segment consists of the assets and operations of Blue Water Re Ltd. (“Blue Water Re”), Blue Water Master Fund Ltd. (the “Master Fund”), Blue Capital Management Ltd. (“BCML”) and the operating subsidiaries of Blue Capital Reinsurance Holdings Ltd. (“BCRH”). On December 15, 2014, Blue Capital Insurance Managers Ltd., a former wholly-owned subsidiary of Montpelier, was merged into BCML.
Blue Water Re is a wholly-owned Bermuda-based special purpose insurance vehicle that provides collateralized property catastrophe reinsurance coverage and related products. Blue Water Re was established in November 2011 and commenced its operations in June 2012.
The Master Fund is an exempted mutual fund segregated accounts company which was incorporated in Bermuda in December 2011. The Master Fund has various segregated accounts, including the BCAP Mid Vol Fund cell (the “Mid Vol Cell”), the Blue Capital Low Volatility Strategy cell (the “Low Vol Cell”) and the Blue Capital Global Reinsurance SA-I cell (the “BCGR Cell”) (collectively, the “Cells”).
The Cells may invest in: (i) fully-collateralized property catastrophe reinsurance contracts by subscribing for non-voting redeemable preference shares issued by Blue Water Re, with each series of such preference shares linked to a specific reinsurance contract with a third-party ceding company; and (ii) various insurance-linked securities issued by entities other than Blue Water Re.
Montpelier Re has been the sole investor in the Mid Vol Cell and the Low Vol Cell since their inception.
BCML is a wholly-owned Bermuda-based subsidiary that provides investment and insurance management services to: (i) Blue Water Re; (ii) the Cells; and (iii) BCRH and its subsidiaries. BCML is a registered investment advisor with the U.S. Securities and Exchange Commission (the “SEC”).
F-6
Table of Contents
BCRH is a Bermuda-based exempted limited liability holding company which provides fully-collateralized property catastrophe reinsurance and invests in various insurance-linked securities through its wholly-owned Bermuda-based subsidiaries Blue Capital Re Ltd. (“Blue Capital Re”) and Blue Capital Re ILS Ltd. (“Blue Capital Re ILS”). The underwriting decisions and operations of BCRH and its subsidiaries are managed by BCML, and each uses Montpelier’s reinsurance underwriting expertise and infrastructure to conduct its business. BCRH commenced its operations in November 2013 pursuant to an initial public offering (the “BCRH IPO”) and its common shares are listed on the New York Stock Exchange, under the symbol BCRH, and the Bermuda Stock Exchange, under the symbol BCRH BH. As of December 31, 2014 and 2013, Montpelier owned 33.3% and 28.6% of BCRH’s outstanding common shares, respectively. Montpelier increased its ownership in BCRH during 2014 through a series of open-market purchases of BCRH common shares.
BCRH is considered a “variable interest entity” under GAAP and the Company has determined that it is BCRH’s primary beneficiary. As a result, the Company fully consolidates the assets, liabilities and operations of BCRH and its subsidiaries within its consolidated financial statements and Collateralized Reinsurance segment disclosures. The interests in BCRH and its subsidiaries that the Company fully consolidates which are attributable to third-party investors are reported within the Company’s consolidated financial statements as non-controlling interests.
Blue Capital Global Reinsurance Fund Limited (the “BCGR Listed Fund”) is a closed-ended mutual fund incorporated in Bermuda that serves as the feeder fund for the BCGR Cell. The BCGR Listed Fund commenced its operations in October 2012 and its ordinary shares are listed on the Specialist Fund Market of the London Stock Exchange, under the symbol BCGR, and on the Bermuda Stock Exchange, under the symbol BCGR BH. As of December 31, 2014 and 2013, Montpelier Re owned 25.1% and 29.0% of the BCGR Listed Fund’s ordinary shares, respectively. Montpelier’s ownership in the BCGR Listed Fund decreased during 2014 as a result of investments made by non-controlling interests.
The BCGR Listed Fund is considered a “voting interest entity” under GAAP and, because Montpelier owns less than 50% of its outstanding ordinary shares, the Company does not consolidate the BCGR Listed Fund’s assets, liabilities or operations within its consolidated financial statements or Collateralized Reinsurance segment disclosures. However, the BCGR Cell and Blue Water Re are considered variable interest entities under GAAP and the Company has determined that it is the primary beneficiary of these entities. Therefore, as funds held in the BCGR Listed Fund are deployed into the BCGR Cell, and ultimately into Blue Water Re, they are included in the Company’s consolidated financial statements and Collateralized Reinsurance segment disclosures. Conversely, as funds previously deployed by the BCGR Listed Fund and the BCGR Cell into Blue Water Re are returned to the BCGR Listed Fund, they are no longer included in the Company’s consolidated financial statements or Collateralized Reinsurance segment disclosures.
The interests in the BCGR Cell and Blue Water Re that the Company fully consolidates which are attributable to third-party investors are reported within the Company’s consolidated financial statements as non-controlling interests. See “Non-Controlling Interests” in this Note 1.
Montpelier is entitled to receive management and performance fees from BCRH and the BCGR Listed Fund for the services that it performs for these entities.
Corporate and Other
The Company’s Corporate and Other activities consist of the assets and operations of: (i) the Company and certain of its intermediate holding and service and support companies, including Montpelier Technical Resources Ltd. (“MTR”); (ii) Cladium, Inc. (“Cladium”), a wholly-owned Florida-based managing general agency that was acquired by Montpelier on May 19, 2014; (iii) intercompany eliminations relating to inter-segment reinsurance agreements; and (iv) the MUSIC Run-Off business.
In connection with the MUSIC Sale, Montpelier Re has either retained, reinsured or otherwise indemnified Selective for all business written by MUSIC with an effective date on or prior to December 31, 2011, and for this reason the MUSIC Sale did not constitute a “discontinued operation” in accordance with GAAP.
Insurance and Reinsurance Premiums and Related Costs
Reinsurance contracts can be written on a risks-attaching or losses-occurring basis. Under risks-attaching reinsurance contracts, all claims from cedants’ underlying policies incepting during the contract period are covered, even if they occur after the expiration date of the reinsurance contract. In contrast, losses-occurring reinsurance contracts cover all claims occurring during the period of the contract, regardless of the inception dates of the underlying policies. Any claims occurring after the expiration of the losses-occurring contract are not covered.
F-7
Table of Contents
Premiums written are recognized as revenues, net of any applicable underlying reinsurance coverage, and are earned over the term of the related policy or contract. For direct insurance and facultative and losses-occurring contracts, the earnings period is the same as the reinsurance contract. For risks-attaching contracts, the earnings period is based on the terms of the underlying insurance policies.
For contracts that have a risk period of three years or less, the premiums are earned ratably over the term. For the few contracts with risk periods greater than three years, premiums are earned in accordance with schedules that reflect the level of risk associated with each period in the contract term. These schedules are reviewed periodically and are adjusted as deemed necessary.
For the majority of Montpelier’s excess-of-loss contracts, written premium is based on the deposit or minimum premium as defined in the contract. Subsequent adjustments, based on reports of actual premium or revisions in estimates by ceding companies, are recorded in the period in which they are determined. For pro-rata contracts and excess-of-loss contracts where no deposit or minimum premium is specified in the contract, written premium is recognized based on estimates of ultimate premiums provided by ceding companies and Montpelier’s underwriters.
Initial estimates of written premium are recognized in the period in which the underlying risks incept. Subsequent adjustments, based on reports of actual premium by the ceding companies, or revisions in estimates, are recorded in the period in which they are determined. Such adjustments are generally determined after the associated risk periods have expired, in which case the premium adjustments are fully earned when written. Unearned premiums represent the portion of premiums written that are applicable to future insurance or reinsurance coverage provided by policies or contracts in force.
Premiums receivable are recorded at amounts due less any provision for doubtful accounts. As of December 31, 2014 and 2013, Montpelier’s allowance for doubtful accounts was $3.7 million and $3.6 million, respectfully.
When a reinsurance contract provides for a reinstatement of coverage following a covered loss, the associated reinstatement premium is recorded as both written and earned when Montpelier determines that such a loss event has occurred.
Deferred acquisition costs are comprised of commissions, brokerage costs, premium taxes and excise taxes, each of which relates directly to the writing of insurance and reinsurance contracts. These deferred acquisition costs are typically amortized over the underlying risk period of the related contracts. However, if the sum of a contract’s expected losses and LAE and deferred acquisition costs exceeds related unearned premiums and projected investment income, a premium deficiency is determined to exist. In this event, deferred acquisition costs are immediately expensed to the extent necessary to eliminate the premium deficiency. If the premium deficiency exceeds deferred acquisition costs then a liability is accrued for the excess deficiency. There were no significant premium deficiency adjustments recognized during the periods presented herein.
Profit commissions earned and incurred are included in insurance and reinsurance acquisition costs within the Company’s Consolidated Statements of Operations and Comprehensive Income.
Insurance and Reinsurance Balances Payable
Insurance and reinsurance balances payable consist primarily of reinsurance premiums and reinstatement premiums payable, losses and LAE that have been approved for payment and profit commissions payable.
Loss and LAE Reserves
Loss and LAE reserves are comprised of case reserves (which are based on claims that have been reported) and IBNR reserves (which are based on losses that are believed to have occurred but for which claims have not yet been reported and may include a provision for expected future development on existing case reserves). Case reserve estimates are initially set on the basis of loss reports received from third parties. IBNR reserves are estimated by management using various actuarial methods as well as a combination of Montpelier’s own loss experience, historical insurance industry loss experience and management’s professional judgment. Montpelier’s internal actuaries review the reserving assumptions and methodologies on a quarterly basis and its loss estimates are subject to an annual corroborative review by independent actuaries using generally accepted actuarial principles.
F-8
Table of Contents
The uncertainties inherent in the reserving process, potential delays by cedants and brokers in the reporting of loss information, together with the potential for unforeseen adverse developments, may result in loss and LAE reserves ultimately being significantly greater or less than the reserve provided at the end of any given reporting period. The degree of uncertainty is further increased when a significant loss event takes place near the end of a reporting period. Loss and LAE reserve estimates are regularly reviewed and updated as new information becomes known. Any resulting adjustments are reflected in operations in the period in which they become known.
A significant portion of Montpelier’s business is in the Property Catastrophe - Treaty class of business and other classes with high attachment points of coverage. As a result, reserving for losses relating to such programs can be imprecise. Montpelier’s exposures are also highly leveraged, meaning that the proportional impact of any change in the estimate of total loss incurred by the cedant is magnified in the layers at which Montpelier’s coverage attaches. Additionally, the high-severity, low-frequency nature of the exposures limits the volume of claims experience available from which to reliably predict ultimate losses following a loss event, and renders certain traditional loss estimation techniques inapplicable.
Ceded Reinsurance
In the normal course of business, Montpelier purchases reinsurance from third parties in order to manage its exposures. The amount of reinsurance that Montpelier buys varies from year to year depending on its risk appetite, as well as the availability and cost of the reinsurance coverage. Ceded reinsurance premiums are accounted for on bases consistent with those used in accounting for the underlying premiums assumed, and are reported as reductions of net premiums written and earned. Certain of Montpelier’s assumed pro-rata contracts incorporate reinsurance protection provided by third-party reinsurers that inures to Montpelier’s benefit. These inuring reinsurance premiums are reported as reductions in gross premiums written and net premiums earned.
The cost of reinsurance purchased varies based on a number of factors. The initial premium associated with excess-of-loss reinsurance is normally based on the underlying premiums assumed by Montpelier. As these reinsurance contracts are typically purchased prior to the time the assumed risks are written, ceded premium recorded in the period of inception reflects an estimate of the amount that Montpelier will ultimately pay. In the majority of cases, the premium initially recorded is subsequently adjusted to reflect premium actually assumed by Montpelier during the contract period. These adjustments are recorded in the period that they are determined, and to date they have not been significant. In addition, losses which pierce excess-of-loss reinsurance cover may generate reinstatement premium ceded, depending on the terms of the contract. This reinstatement premium ceded is recognized as written and expensed at the time the reinsurance recovery is estimated and recorded.
The cost of quota share reinsurance is initially based on Montpelier’s estimated gross premium written related to the specific lines of business covered by the reinsurance contract. As gross premiums are written during the period of coverage, reinsurance premiums ceded are adjusted in accordance with the terms of the quota share agreement.
Reinsurance recoverable on paid losses represents amounts currently due from reinsurers. Reinsurance recoverable on unpaid losses represents amounts that will be collectible from reinsurers once the losses are paid. The recognition of reinsurance recoverable requires two key judgments. In determining Montpelier’s ceded IBNR, the first judgment involves the estimation of the amount of gross IBNR to be ceded to reinsurers. Ceded IBNR is developed as part of Montpelier’s loss reserving process and consequently, its estimation is subject to risks and uncertainties similar to the estimation of gross IBNR. The second judgment relates to the amount of the reinsurance recoverable balance that ultimately will not be collected from reinsurers due to insolvency, contractual dispute, or other reasons.
Cash and Cash Equivalents
Cash and cash equivalents (consisting of unrestricted cash and fixed income investments with maturities of less than three months, as measured from the date of purchase) of $447.7 million at December 31, 2014 were comprised of: (i) $298.0 million supporting the Company’s Collateralized Reinsurance operations; (ii) $113.7 million held by Montpelier’s investment advisors; (iii) $25.9 million held for operating expenses, including a provision for losses that may become due for payment on short notice; and (iv) $10.1 million held for other obligations. Cash and cash equivalents of $468.4 million at December 31, 2013, were comprised of: (i) $314.6 million supporting the Company’s Collateralized Reinsurance operations; (ii) $120.9 million held by Montpelier’s investment advisors; (iii) $28.0 million held for operating expenses, including a provision for losses that may become due for payment on short notice; and (iv) $4.9 million held for other obligations and contingencies.
F-9
Table of Contents
Restricted Cash
Restricted cash of $26.6 million at December 31, 2014 consisted of $6.9 million of collateral supporting investment securities sold short and open derivative positions and $19.7 million of foreign deposit accounts held at Lloyd’s. Restricted cash of $133.7 million at December 31, 2013 consisted of $121.1 million of collateral supporting investment securities sold short and open derivative positions and $12.6 million of foreign deposit accounts held at Lloyd’s.
Investments
Montpelier’s fixed maturity investments, equity securities and investment securities sold short are carried at fair value, with the net unrealized appreciation or depreciation on such securities reported within net realized and unrealized investment gains (losses) on the Company’s Consolidated Statements of Operations and Comprehensive Income.
Montpelier’s other investments consist of investments in investment funds, limited partnership interests, the BCGR Listed Fund, event-linked securities whose principal and interest are forgiven if specific events occur (“CAT Bonds”) and certain derivative instruments. See Notes 5 and 7.
Investments, including investment securities sold short, are recorded on a trade date basis. For those marketable securities not listed and regularly traded on an established exchange, fair values are determined based on bid prices, as opposed to ask prices. Fair values are not adjusted for transaction costs. Gains and losses on sales of investments are determined on a first-in, first-out basis and are included in operations when realized. Realized investment gains and losses typically result from the actual sale of securities. Unrealized investment gains and losses represent the gain or loss that would result from a hypothetical sale of securities on the balance sheet date. In instances where the Company becomes aware of a significant unrealized loss with little or no likelihood of recovery, it writes down the cost basis of the investment and recognizes the loss as being realized.
Some of Montpelier’s investment managers are entitled to performance fees determined as a percentage of their portfolio’s net total return achieved over specified periods. Montpelier’s net realized and unrealized investment gains or losses and net income or loss from derivative instruments are presented net of any associated performance fees. During 2014, 2013 and 2012 Montpelier incurred (reversed) performance fees related to investments of $(0.1) million, $6.4 million and $7.1 million, respectively. During 2014, 2013 and 2012 Montpelier incurred (reversed) performance fees related to investment-related derivative instruments of zero, $(2.1) million and $(0.7) million, respectively.
Net investment income is stated net of investment management, custody and other investment-related expenses. Investment income is recognized when earned and includes interest and dividend income together with the amortization of premiums and the accretion of discounts associated with those fixed maturity investments that were purchased at amounts other than their par value.
Repurchase and Reverse Repurchase Agreements
In connection with Montpelier’s investing activities, certain of its investment managers may enter into repurchase and reverse repurchase agreements from time to time in order to enhance Montpelier’s investment performance.
A repurchase agreement, which is essentially a form of short-term borrowing, involves the sale of an investment security to a third-party buyer with the agreement that the seller (Montpelier in this instance) will repurchase the same security from the same party for an agreed-upon price on a specified future date. As of December 31, 2014 and 2013, Montpelier did not have any open repurchase agreements.
A reverse repurchase agreement, which is essentially a form of secured short-term lending, involves the purchase of an investment security from a third-party seller with the agreement that the buyer (Montpelier in this instance) will sell the same security to the same party for an agreed-upon price on a specified future date. As of December 31, 2014 and 2013, Montpelier had amounts receivable under reverse repurchase agreements of zero and $80.8 million, respectively. In accordance with GAAP, investment securities purchased under reverse repurchase agreements are not reflected within Montpelier’s Consolidated Balance Sheets.
F-10
Table of Contents
Common Shares Held in Treasury
The Company’s common shares (“Common Shares”) held in treasury are carried at cost and any resulting gain or loss on subsequent issuances is determined on a last-in, first-out basis. As of December 31, 2014, the Company’s $8.1 million inception to-date loss from issuances of its treasury shares has been recorded as a reduction to retained earnings on the Company’s Consolidated Balance Sheet. As of December 31, 2013, the Company’s $4.1 million inception to-date loss from issuances of its treasury shares has been recorded as a reduction to retained earnings on the Company’s Consolidated Balance Sheet. See Note 8.
Funds Withheld
Funds withheld by reinsured companies represent insurance balances retained by ceding companies in accordance with contractual terms. Montpelier typically earns investment income on these balances during the period the funds are held. At December 31, 2014 and 2013, funds withheld balances of $7.6 million and $8.2 million, respectively, were recorded within other assets on the Company’s Consolidated Balance Sheets.
Non-Controlling Interests
The following table summarizes the movements in the non-controlling interests balance during the years ended December 31, 2014 and 2013:
|
|
|
Year Ended
December 31, |
|
|
|
|
2014 |
|
2013 |
|
|
Non-controlling interests - beginning of year |
|
$ |
244.9 |
|
$ |
— |
|
|
|
|
|
|
|
|
|
Income attributable to third-party investments in the BCGR Cell |
|
13.7 |
|
6.6 |
|
|
Income (loss) attributable to third-party investments in BCRH |
|
10.4 |
|
(0.5 |
) |
|
Net income attributable to non-controlling interests |
|
24.1 |
|
6.1 |
|
|
|
|
|
|
|
|
|
Net third-party investments in the BCGR Cell |
|
11.0 |
|
114.5 |
|
|
Net third-party investments in BCRH |
|
— |
|
124.3 |
|
|
Purchases of BCRH common shares by the Company |
|
(8.2 |
) |
— |
|
|
Net change in third-party investments in non-controlling interests |
|
2.8 |
|
238.8 |
|
|
|
|
|
|
|
|
|
Dividends declared by BCRH attributable to non-controlling interests |
|
(5.5 |
) |
— |
|
|
|
|
|
|
|
|
|
Non-controlling interests - ending |
|
$ |
266.3 |
|
$ |
244.9 |
|
Foreign Currency Exchange
The U.S. dollar is the Company’s reporting currency and the British pound is the functional currency for the Company’s U.K.- based operations. The U.S. dollar is the functional currency for all other operations. The assets and liabilities of the Company’s U.K. operations are converted to U.S. dollars at exchange rates in effect at the balance sheet date, and the related revenues and expenses are converted using average exchange rates for the period. Net foreign currency gains and losses arising from translating these foreign operations to U.S. dollars are reported as a separate component of shareholders’ equity as translation gains and losses, with changes therein reported as a component of other comprehensive income or loss.
The following rates of exchange to the U.S. dollar were used to translate the results of Montpelier’s U.K. operations:
|
Currency |
|
Closing Rate
December 31, 2014 |
|
Closing Rate
December 31, 2013 |
|
Closing Rate
December 31, 2012 |
|
|
British pound (GBP) |
|
1.5559 |
|
1.6559 |
|
1.6234 |
|
Other transactions involving certain monetary assets and liabilities denominated in foreign currencies have been converted into the appropriate functional currencies at exchange rates in effect at the balance sheet date, and the related revenues and expenses are converted using either specific or average exchange rates for the period, as appropriate. Net foreign currency transaction gains and losses arising from these activities are reported as a component of operations in the period in which they arise.
F-11
Table of Contents
Recent Accounting Pronouncements
There have been no recent accounting pronouncements that are expected to have a material impact on the presentation of the Company’s Consolidated Balance Sheets or its Consolidated Statements of Operations and Comprehensive Income.
NOTE 2. Basic and Diluted Earnings Per Common Share
The Company applies the two-class method of calculating its earnings per Common Share. In applying the two-class method, the Company’s outstanding Restricted Share Units (“RSUs”) are considered to be participating securities. See Note 9. For all periods presented, the two-class method was used to determine basic and diluted earnings per Common Share since this method yielded a more dilutive result than the treasury stock method.
For purposes of determining basic and diluted earnings per Common Share, a portion of net income is allocated to outstanding RSUs which serves to reduce the Company’s earnings per Common Share numerators. Net losses are not allocated to outstanding RSUs and, therefore, do not impact the Company’s loss per Common Share numerators.
The following table outlines the Company’s computation of its basic and diluted earnings per Common Share for the years ended December 31, 2014, 2013 and 2012:
|
|
|
Year Ended December 31, |
|
|
|
|
2014 |
|
2013 |
|
2012 |
|
|
|
|
|
|
|
|
|
|
|
Net income available to the Company’s common shareholders |
|
$ |
210.6 |
|
$ |
191.2 |
|
$ |
214.3 |
|
|
Less: net earnings allocated to participating securities |
|
(6.3 |
) |
(4.8 |
) |
(4.9 |
) |
|
Earnings per Common share numerator |
|
$ |
204.3 |
|
$ |
186.4 |
|
$ |
209.4 |
|
|
Average Common Shares outstanding (in millions) |
|
45.6 |
|
51.6 |
|
57.1 |
|
|
Basic and diluted earnings per Common Share |
|
$ |
4.48 |
|
$ |
3.61 |
|
$ |
3.67 |
|
NOTE 3. Loss and LAE Reserve Movements
The following table summarizes Montpelier’s loss and LAE reserve activities for the years ended December 31, 2014, 2013 and 2012:
|
|
|
Year Ended December 31, |
|
|
|
|
2014 |
|
2013 |
|
2012 |
|
|
Gross unpaid loss and LAE reserves - beginning |
|
$ |
881.6 |
|
$ |
1,112.4 |
|
$ |
1,077.1 |
|
|
Reinsurance recoverable on unpaid losses - beginning |
|
(63.6 |
) |
(102.7 |
) |
(77.7 |
) |
|
Net unpaid loss and LAE reserves - beginning |
|
818.0 |
|
1,009.7 |
|
999.4 |
|
|
|
|
|
|
|
|
|
|
|
Losses and LAE incurred: |
|
|
|
|
|
|
|
|
Current year losses |
|
341.4 |
|
270.9 |
|
373.8 |
|
|
Prior year losses |
|
(151.8 |
) |
(144.4 |
) |
(87.4 |
) |
|
Total incurred losses and LAE |
|
189.6 |
|
126.5 |
|
286.4 |
|
|
|
|
|
|
|
|
|
|
|
Net foreign currency translation movements on loss and LAE |
|
(22.2 |
) |
6.1 |
|
12.0 |
|
|
|
|
|
|
|
|
|
|
|
Losses and LAE paid and approved for payment: |
|
|
|
|
|
|
|
|
Current year losses |
|
(79.9 |
) |
(52.1 |
) |
(48.9 |
) |
|
Prior year losses |
|
(178.5 |
) |
(272.2 |
) |
(239.2 |
) |
|
Total losses and LAE paid and approved for payment |
|
(258.4 |
) |
(324.3 |
) |
(288.1 |
) |
|
|
|
|
|
|
|
|
|
|
Net unpaid loss and LAE reserves - ending |
|
727.0 |
|
818.0 |
|
1,009.7 |
|
|
Reinsurance recoverable on unpaid losses - ending |
|
48.7 |
|
63.6 |
|
102.7 |
|
|
Gross unpaid loss and LAE reserves - ending |
|
$ |
775.7 |
|
$ |
881.6 |
|
$ |
1,112.4 |
|
Montpelier’s reserving process is highly dependent on loss information received from its cedants. With respect to prior year loss and LAE development, information and experience obtained since the last reporting date included changes in loss amounts reported by ceding companies, IBNR recorded as a result of these loss advices and other information and events. In particular, loss and LAE reserves for non-catastrophe losses initially include significant IBNR as a result of timing lags inherent in the reporting process.
F-12
Table of Contents
Prior Year Loss and LAE Development — 2014
During the year ended December 31, 2014, Montpelier experienced $151.8 million in net favorable development on prior year loss and LAE reserves relating to the following events and factors:
· 2012 and prior IBNR reductions associated with medical malpractice business ($14.3 million decrease),
· 2011 Thai floods ($10.8 million decrease),
· 2011 and 2010 New Zealand earthquakes ($10.8 million decrease),
· 2012 windstorm Sandy ($7.3 million decrease),
· 2005 hurricanes ($6.6 million decrease),
· 2011 Japanese earthquake ($6.1 million decrease),
· 2010 flooding in Portugal ($4.8 million decrease),
· 2013 U.S. crop losses ($2.9 million decrease),
· 2010 Chilean earthquake ($2.4 million decrease),
· 2008 Hurricane Gustav ($2.2 million decrease), and
· 2012 Italian earthquake ($1.4 million decrease).
In addition, claims reported to Montpelier during 2014 indicated that IBNR for natural catastrophe losses initially recorded during 2013 (excluding the U.S. crop losses noted above) exceeded the extent of losses that actually occurred, and consequently Montpelier decreased its loss and LAE reserves by $28.4 million.
The remaining net favorable development on prior year loss and LAE reserves recognized during 2014 related to several smaller adjustments made across multiple classes of business.
Prior Year Loss and LAE Development — 2013
During the year ended December 31, 2013, Montpelier experienced $144.4 million in net favorable development on prior year loss and LAE reserves relating to the following events and factors:
· 2011 Japan earthquake ($10.7 million decrease),
· Casualty IBNR (excluding medical malpractice) recorded over several prior years ($8.6 million decrease),
· 2011 catastrophes, excluding the Japan earthquake ($7.9 million decrease),
· IBNR reductions associated with medical malpractice business ($7.3 million decrease),
· the settlement of several individual claims which occurred in 2007, 2010 and 2011 within the Property and Specialty Individual Risk line of business ($7.2 million decrease),
· 2004 and 2005 Hurricanes ($6.2 million decrease),
· 2012 windstorm Sandy ($6.1 million decrease), and
· a settlement associated with the 2010 Deepwater Horizon oil rig explosion and fire ($5.6 million decrease).
Additionally, claims reported to Montpelier during 2013 indicated that IBNR for natural catastrophe and individual risk losses initially recorded during 2012 and 2011 (other than those included in the foregoing) exceeded the extent of losses that actually occurred. Consequently Montpelier decreased its loss and LAE reserves by a further $35.5 million and $16.5 million, respectively, for these classes of business.
The remaining net favorable development on prior year loss and LAE reserves recognized in 2013 related to several smaller adjustments made across multiple classes of business.
Prior Year Loss and LAE Development — 2012
During the year ended December 31, 2012, Montpelier experienced $87.4 million in net favorable development on prior year loss and LAE reserves relating to the following events and factors:
· 2011 catastrophe losses relating to the Japan earthquake, Thai floods, Hurricane Irene and other events ($51.0 million decrease),
· three individual risk losses incurred at Montpelier at Lloyd’s during 2008 and 2011 ($5.3 million decrease),
· 2011 and prior medical malpractice contracts ($4.2 million decrease), and
· net foreign currency transaction gains ($4.0 million decrease).
The remaining net favorable development on prior year loss and LAE reserves recognized in 2012 related to several smaller adjustments made across multiple classes of business.
F-13
Table of Contents
Impact of Foreign Currency Transaction Gains and Losses on Prior Year Loss and LAE Reserves
Montpelier’s prior year losses and LAE incurred also includes foreign currency transaction gains (losses) relating to its prior year loss and LAE reserves of $(4.0) million, $2.4 million and $4.0 million during 2014, 2013 and 2012, respectively. Since these foreign currency transaction gains (losses) are reported as decreases (increases) in Montpelier’s losses and LAE incurred, they have a direct impact on its underwriting results and its underwriting ratios.
Impact of Foreign Currency Translation Gains and Losses on Loss and LAE Reserves
Montpelier’s loss and LAE reserves include foreign currency translation gains (losses) of $22.2 million, $(6.1) million and $(12.0) million during 2014, 2013 and 2012, respectively. Since these foreign currency translation gains (losses) are reported as decreases (increases) in Montpelier’s net change in foreign currency translation, which is a component of its comprehensive income or loss, they have no impact on its underwriting results or its underwriting ratios.
The following table outlines the composition of Montpelier’s gross and net ending loss and LAE reserves as of December 31, 2014 and 2013:
|
|
|
December 31, |
|
|
|
|
2014 |
|
2013 |
|
|
|
|
|
|
|
|
|
Components of ending gross loss and LAE reserves: |
|
|
|
|
|
|
IBNR reserves |
|
$ |
476.9 |
|
$ |
549.7 |
|
|
Case reserves |
|
298.8 |
|
331.9 |
|
|
Gross loss and LAE reserves |
|
$ |
775.7 |
|
$ |
881.6 |
|
|
|
|
|
|
|
|
|
Components of ending net loss and LAE reserves: |
|
|
|
|
|
|
IBNR reserves |
|
$ |
454.3 |
|
$ |
516.7 |
|
|
Case reserves |
|
272.7 |
|
301.3 |
|
|
Net loss and LAE reserves |
|
$ |
727.0 |
|
$ |
818.0 |
|
NOTE 4. Reinsurance
All of Montpelier’s reinsurance purchases to date have represented prospective cover, meaning that the coverage has been purchased to protect Montpelier against the risk of future losses as opposed to covering losses that have already occurred but have not yet been paid. Montpelier’s reinsurance contracts consist of excess-of-loss contracts covering one or more lines of business and pro-rata reinsurance with respect to specific lines of its business. Montpelier also purchases industry loss warranty (“ILW”) policies which provide coverage for certain losses incurred, provided they are triggered by events exceeding a specified industry loss size as well as Montpelier’s own incurred loss. For non-ILW excess-of-loss reinsurance contracts, the attachment point and exhaustion of these contracts are based solely on the amount of Montpelier’s actual losses incurred from an event or events.
The effects of reinsurance on Montpelier’s written and earned premiums and on losses and LAE were as follows:
|
|
|
Year Ended December 31, |
|
|
|
|
2014 |
|
2013 |
|
2012 |
|
|
Premiums written: |
|
|
|
|
|
|
|
|
Direct |
|
$ |
175.5 |
|
$ |
142.9 |
|
$ |
136.9 |
|
|
Assumed |
|
564.8 |
|
563.1 |
|
598.4 |
|
|
Ceded |
|
(89.4 |
) |
(102.9 |
) |
(119.6 |
) |
|
Net premiums written |
|
$ |
650.9 |
|
$ |
603.1 |
|
$ |
615.7 |
|
|
Premiums earned: |
|
|
|
|
|
|
|
|
Direct |
|
$ |
163.4 |
|
$ |
135.1 |
|
$ |
125.4 |
|
|
Assumed |
|
569.2 |
|
567.3 |
|
610.9 |
|
|
Ceded |
|
(87.4 |
) |
(102.8 |
) |
(119.8 |
) |
|
Net premiums earned |
|
$ |
645.2 |
|
$ |
599.6 |
|
$ |
616.5 |
|
|
Loss and LAE: |
|
|
|
|
|
|
|
|
Direct |
|
$ |
103.1 |
|
$ |
78.3 |
|
$ |
92.6 |
|
|
Assumed |
|
100.3 |
|
52.0 |
|
232.6 |
|
|
Ceded |
|
(13.8 |
) |
(3.8 |
) |
(38.8 |
) |
|
Net loss and LAE |
|
$ |
189.6 |
|
$ |
126.5 |
|
$ |
286.4 |
|
F-14
Table of Contents
Montpelier remains liable for losses it incurs to the extent that any third-party reinsurer is unable or unwilling to make timely payments under reinsurance agreements. Montpelier would also be liable in the event that its ceding companies were unable to collect amounts due from underlying third-party reinsurers.
Montpelier records provisions for uncollectible reinsurance recoverable when collection becomes unlikely due to the reinsurer’s inability to pay. Montpelier does not believe that there are any amounts uncollectible from its reinsurers as of the balance sheet dates presented.
Reinsurance Recoverable on Paid and Unpaid Losses
Under Montpelier’s reinsurance security policy, its reinsurers are typically required to be rated “A-” (Excellent) or better by A.M. Best (or an equivalent rating with another recognized rating agency) at the time the policy is written. Montpelier also considers reinsurers that are not rated or do not fall within this threshold on a case-by-case basis if adequately collateralized. Montpelier monitors the financial condition and ratings of its reinsurers on an ongoing basis.
The A.M. Best ratings of Montpelier’s reinsurers related to reinsurance recoverable on paid and unpaid losses at December 31, 2014 and 2013, are as follows:
|
|
|
December 31, 2014 |
|
December 31, 2013 |
|
|
|
|
Amount |
|
% of Total |
|
Amount |
|
% of Total |
|
|
Rating |
|
|
|
|
|
|
|
|
|
|
A++ |
|
$ |
0.1 |
|
1 |
% |
$ |
— |
|
— |
% |
|
A+ |
|
2.8 |
|
40 |
|
0.7 |
|
19 |
|
|
A |
|
3.2 |
|
45 |
|
1.4 |
|
39 |
|
|
A- |
|
— |
|
— |
|
— |
|
— |
|
|
Unrated by A.M. Best |
|
1.0 |
|
14 |
|
1.5 |
|
42 |
|
|
Total reinsurance recoverable on paid losses |
|
$ |
7.1 |
|
100 |
% |
$ |
3.6 |
|
100 |
% |
|
|
|
December 31, 2014 |
|
December 31, 2013 |
|
|
|
|
Amount |
|
% of Total |
|
Amount |
|
% of Total |
|
|
Rating |
|
|
|
|
|
|
|
|
|
|
A++ |
|
$ |
0.3 |
|
1 |
% |
$ |
— |
|
— |
% |
|
A+ |
|
21.8 |
|
44 |
|
28.6 |
|
45 |
|
|
A |
|
18.8 |
|
39 |
|
20.2 |
|
32 |
|
|
A- |
|
2.2 |
|
5 |
|
4.2 |
|
6 |
|
|
Unrated by A.M. Best |
|
5.6 |
|
11 |
|
10.6 |
|
17 |
|
|
Total reinsurance recoverable on unpaid losses |
|
$ |
48.7 |
|
100 |
% |
$ |
63.6 |
|
100 |
% |
Montpelier’s unrated reinsurance recoverables as of December 31, 2014 and 2013, relate to reinsurers that have either: (i) fully-collateralized the reinsurance obligation; (ii) a Standard & Poor’s financial strength rating equivalent to an A.M. Best rating of “A-” (Excellent) or better; or (iii) subsequently entered run-off but are considered by management to be financially sound.
Reinsurance Disputes
Montpelier is subject to litigation and arbitration proceedings in the normal course of its business. These proceedings often involve reinsurance contract disputes which are typical for the reinsurance industry. Expected or actual reductions in reinsurance recoveries due to contract disputes (as opposed to a reinsurer’s inability to pay) are not recorded as an uncollectible reinsurance recoverable. Rather, they are factored into the determination of, and are reflected in, Montpelier’s net loss and LAE reserves.
As of December 31, 2014, Montpelier had no ongoing material insurance or reinsurance contract disputes.
F-15
Table of Contents
NOTE 5. Investments
Fixed Maturity Investments and Equity Securities
The table below shows the aggregate cost (or amortized cost) and fair value of Montpelier’s fixed maturity investments and equity securities, by investment type, as of the dates indicated:
|
|
|
December 31, 2014 |
|
December 31, 2013 |
|
|
|
|
Cost or
Amortized
Cost |
|
Fair
Value |
|
Cost or
Amortized
Cost |
|
Fair
Value |
|
|
Fixed maturity investments: |
|
|
|
|
|
|
|
|
|
|
Corporate debt securities |
|
$ |
853.6 |
|
$ |
848.2 |
|
$ |
886.7 |
|
$ |
906.8 |
|
|
Debt securities issued/sponsored by the U.S. Treasury and its agencies |
|
408.3 |
|
408.7 |
|
533.0 |
|
524.5 |
|
|
Residential mortgage-backed securities |
|
194.8 |
|
196.8 |
|
430.3 |
|
423.5 |
|
|
Commercial mortgage-backed securities |
|
100.7 |
|
101.4 |
|
137.7 |
|
138.8 |
|
|
Debt securities issued by non-U.S. governments and their agencies |
|
99.0 |
|
98.7 |
|
109.6 |
|
108.2 |
|
|
Debt securities issued by U.S. states and political subdivisions |
|
19.4 |
|
19.4 |
|
47.2 |
|
47.1 |
|
|
Other asset-backed obligations |
|
227.1 |
|
227.8 |
|
277.4 |
|
281.9 |
|
|
Total fixed maturity investments |
|
$ |
1,902.9 |
|
$ |
1,901.0 |
|
$ |
2,421.9 |
|
$ |
2,430.8 |
|
|
Equity securities: |
|
|
|
|
|
|
|
|
|
|
Exchange-listed funds |
|
$ |
150.3 |
|
$ |
159.4 |
|
$ |
84.5 |
|
$ |
95.2 |
|
|
Other |
|
13.5 |
|
13.7 |
|
22.1 |
|
22.1 |
|
|
Total equity securities |
|
$ |
163.8 |
|
$ |
173.1 |
|
$ |
106.6 |
|
$ |
117.3 |
|
As a provider of insurance and reinsurance for natural and man-made catastrophes, Montpelier could be required to pay significant losses on short notice. As a result, its asset allocation is predominantly oriented toward cash and high-quality fixed maturity securities, cash equivalents and other investments with a short average duration. This asset allocation is designed to reduce Montpelier’s sensitivity to interest rate fluctuations and provide a secure level of liquidity for the settlement of its liabilities as they arise. As of December 31, 2014, the average duration of Montpelier’s investment portfolio, including cash and cash equivalents, was 0.9 years (inclusive of relevant derivative and short positions).
As of December 31, 2014, 67% of Montpelier’s fixed maturity investments were either rated “A” (Strong) or better by Standard & Poor’s (or an equivalent rating with another recognized rating agency) or represented U.S. government or U.S. government-sponsored enterprise securities, 11% were rated “BBB” (Good) by Standard & Poor’s (or an equivalent rating with another recognized rating agency) and 22% were either unrated or rated below “BBB” (or an equivalent rating with another recognized rating agency).
In addition to the investment securities presented above, Montpelier had open short fixed maturity positions of $70.5 million and $130.0 million as of December 31, 2014 and 2013, respectively. Montpelier also had open short equity positions of $5.7 million and $25.6 million at December 31, 2014 and 2013, respectively. Net unrealized gains (losses) associated with Montpelier’s open short positions totaled $0.3 million and $(2.4) million as of December 31, 2014 and 2013, respectively.
The contractual maturity of Montpelier’s fixed maturity investments at December 31, 2014 and 2013 is presented below:
|
|
|
December 31, 2014 |
|
December 31, 2013 |
|
|
|
|
Amortized
Cost |
|
Fair
Value |
|
Amortized
Cost |
|
Fair
Value |
|
|
Fixed maturity investments: |
|
|
|
|
|
|
|
|
|
|
Due in one year or less |
|
$ |
252.8 |
|
$ |
252.2 |
|
$ |
359.3 |
|
$ |
360.1 |
|
|
Due after one year through five years |
|
855.4 |
|
853.9 |
|
811.2 |
|
818.8 |
|
|
Due after five years through ten years |
|
194.2 |
|
189.8 |
|
203.9 |
|
203.9 |
|
|
Due after ten years |
|
77.9 |
|
79.1 |
|
202.0 |
|
203.8 |
|
|
Mortgage-backed and asset-backed securities |
|
522.6 |
|
526.0 |
|
845.5 |
|
844.2 |
|
|
Total fixed maturity investments |
|
$ |
1,902.9 |
|
1,901.0 |
|
$ |
2,421.9 |
|
2,430.8 |
|
|
|
|
|
|
|
|
|
|
|
|
|
|
|
F-16
Table of Contents
Other Investments
The table below shows the aggregate cost and carrying value of Montpelier’s other investments, by investment type, as of the dates indicated:
|
|
|
December 31, 2014 |
|
December 31, 2013 |
|
|
|
|
Cost |
|
Carrying
Value |
|
Cost |
|
Carrying
Value |
|
|
Other investments carried at net asset value: |
|
|
|
|
|
|
|
|
|
|
|
|
|
|
|
|
|
|
|
|
|
Investment funds and limited partnership interests |
|
$ |
586.2 |
|
$ |
586.2 |
|
$ |
70.1 |
|
$ |
70.1 |
|
|
Investment in the BCGR Listed Fund |
|
4.3 |
|
4.3 |
|
2.4 |
|
2.4 |
|
|
Total other investments at net asset value |
|
$ |
590.5 |
|
$ |
590.5 |
|
$ |
72.5 |
|
$ |
72.5 |
|
|
|
|
|
|
|
|
|
|
|
|
|
Other investments carried at fair value: |
|
|
|
|
|
|
|
|
|
|
|
|
|
|
|
|
|
|
|
|
|
Derivative instruments |
|
$ |
— |
|
2.1 |
|
3.1 |
|
4.2 |
|
|
CAT Bonds |
|
1.9 |
|
2.0 |
|
2.0 |
|
2.0 |
|
|
Investment funds and limited partnership interests |
|
50.0 |
|
47.4 |
|
0.1 |
|
0.1 |
|
|
Total other investments carried at fair value |
|
$ |
51.9 |
|
$ |
51.5 |
|
$ |
5.2 |
|
$ |
6.3 |
|
|
|
|
|
|
|
|
|
|
|
|
|
Other investments |
|
$ |
642.4 |
|
$ |
642.0 |
|
$ |
77.7 |
|
$ |
78.8 |
|
Montpelier’s investments in investment funds and limited partnership interests are carried at either their fair values or their underlying net asset values, depending on Montpelier’s ownership share. For those investment funds and limited partnership interests carried at fair values, the underlying net asset value is used as a best estimate of fair value.
Net appreciation or depreciation in the value of Montpelier’s investments in investment funds, limited partnerships, the BCGR Listed Fund and CAT Bonds is reported as net realized and unrealized investment gains (losses) on the Company’s Consolidated Statements of Operations and Comprehensive Income. Net appreciation or depreciation on Montpelier’s derivative instruments is reported as net income (loss) from derivative instruments.
Montpelier’s interests in investment funds and limited partnerships that are carried at net asset value relate to vehicles that invest in the following:
· Highly-rated bond markets, using fixed maturities and derivatives to take long and short positions,
· Structured credit instruments backed by residential mortgages and other loans and receivables,
· High-yield fixed maturities and loans,
· Public and private equity securities, derivative instruments and currency exposures, and
· Small growth-oriented businesses.
The majority of Montpelier’s interests in investment funds and limited partnerships can be redeemed or sold without penalty upon 30 days’ notice. Redemptions of the remaining interests are subject to early termination fees and liquidity constraints. Montpelier does not expect to redeem a significant portion of any of these investments during 2015.
Montpelier’s investment in the BCGR Listed Fund at December 31, 2014 and 2013 represents the amount of its investment in the BCGR Listed Fund that had not been deployed into the BCGR Cell as of those dates.
Montpelier’s derivative instruments carried as other investments consisted of the Foreign Exchange Contracts, Credit Derivatives, Interest Rate Contracts, Investment Options and Futures and the LIBOR Swap as of December 31, 2014 and 2013. See Note 7.
Fair Value Hierarchy
GAAP establishes a hierarchy that prioritizes the inputs to valuation techniques used to measure fair value into the three broad levels described below. The level in the hierarchy within which a given fair value measurement falls is determined based on the lowest level input that is significant to the measurement. Level 1 inputs are quoted prices (unadjusted) in active markets for identical assets or liabilities that the reporting entity has the ability to access at the measurement date, Level 2 inputs are inputs other than quoted prices that are observable for the asset or liability, either directly or indirectly and Level 3 inputs are unobservable inputs for the asset or liability.
F-17
Table of Contents
Montpelier uses an independent service provider for assistance with its investment accounting function. This service provider, as well as Montpelier’s investment managers, use several pricing services and brokers to assist with the determination of the fair value of Montpelier’s marketable securities. Montpelier performs several reviews of these values as it is ultimately management’s responsibility to ensure that the fair values reflected in the Company’s consolidated financial statements are appropriate. The ultimate pricing source varies depending on the security and pricing service, but investments valued on the basis of observable (Levels 1 and 2) inputs are generally assigned values on the basis of actual transactions. Securities valued on the basis of pricing models with significant unobservable inputs or non-binding broker quotes are classified as Level 3.
In accordance with GAAP, the valuation techniques used by Montpelier and its pricing services maximize the use of observable inputs. Unobservable inputs are used to measure fair value only to the extent that observable inputs are unavailable. Montpelier uses both the market and income approaches in valuing its investments. There have been no significant changes in the Company’s use of valuation techniques or related inputs during the periods presented.
The following tables present Montpelier’s investments carried at fair value, categorized by the level within the hierarchy in which the fair value measurements fall, at December 31, 2014 and 2013:
|
|
|
December 31, 2014 |
|
|
|
|
Level 1 |
|
Level 2 |
|
Level 3 |
|
Total |
|
|
Fixed maturity investments: |
|
|
|
|
|
|
|
|
|
|
Corporate debt securities |
|
$ |
— |
|
$ |
838.1 |
|
$ |
10.1 |
|
$ |
848.2 |
|
|
Debt securities issued/sponsored by the U.S. Treasury and its agencies |
|
333.4 |
|
75.3 |
|
— |
|
408.7 |
|
|
Residential mortgage-backed securities |
|
— |
|
196.8 |
|
— |
|
196.8 |
|
|
Commercial mortgage-backed securities |
|
— |
|
101.4 |
|
— |
|
101.4 |
|
|
Debt securities issued by non-U.S. governments and their agencies |
|
— |
|
98.7 |
|
— |
|
98.7 |
|
|
Debt securities issued by U.S. states and political subdivisions |
|
— |
|
19.4 |
|
— |
|
19.4 |
|
|
Other asset-backed obligations |
|
— |
|
201.5 |
|
26.3 |
|
227.8 |
|
|
Total fixed maturity investments |
|
$ |
333.4 |
|
$ |
1,531.2 |
|
$ |
36.4 |
|
$ |
1,901.0 |
|
|
Equity securities: |
|
|
|
|
|
|
|
|
|
|
Exchange-listed funds |
|
$ |
159.4 |
|
$ |
— |
|
$ |
— |
|
$ |
159.4 |
|
|
Other |
|
13.7 |
|
— |
|
— |
|
13.7 |
|
|
Total equity securities |
|
$ |
173.1 |
|
$ |
— |
|
$ |
— |
|
$ |
173.1 |
|
|
Other investments carried at fair value |
|
$ |
— |
|
$ |
4.1 |
|
$ |
47.4 |
|
$ |
51.5 |
|
|
Total investments carried at fair value |
|
$ |
506.5 |
|
$ |
1,535.3 |
|
$ |
83.8 |
|
$ |
2,125.6 |
|
|
Other investments carried at net asset value |
|
$ |
— |
|
$ |
492.2 |
|
$ |
98.3 |
|
$ |
590.5 |
|
|
|
|
|
|
|
|
|
|
|
|
|
Total investments |
|
$ |
506.5 |
|
$ |
2,027.5 |
|
$ |
182.1 |
|
$ |
2,716.1 |
|
|
|
|
December 31, 2013 |
|
|
|
|
Level 1 |
|
Level 2 |
|
Level 3 |
|
Total |
|
|
Fixed maturity investments: |
|
|
|
|
|
|
|
|
|
|
Corporate debt securities |
|
$ |
— |
|
$ |
896.8 |
|
$ |
10.0 |
|
$ |
906.8 |
|
|
Debt securities issued/sponsored by the U.S. Treasury and its agencies |
|
430.7 |
|
93.8 |
|
— |
|
524.5 |
|
|
Residential mortgage-backed securities |
|
— |
|
423.5 |
|
— |
|
423.5 |
|
|
Debt securities issued by non-U.S. governments and their agencies |
|
— |
|
108.2 |
|
— |
|
108.2 |
|
|
Commercial mortgage-backed securities |
|
— |
|
138.8 |
|
— |
|
138.8 |
|
|
Debt securities issued by U.S. states and political subdivisions |
|
— |
|
47.1 |
|
— |
|
47.1 |
|
|
Other asset-backed obligations |
|
— |
|
263.6 |
|
18.3 |
|
281.9 |
|
|
Total fixed maturity investments |
|
$ |
430.7 |
|
$ |
1,971.8 |
|
$ |
28.3 |
|
$ |
2,430.8 |
|
|
Equity securities: |
|
|
|
|
|
|
|
|
|
|
Exchange-listed funds |
|
$ |
95.2 |
|
$ |
— |
|
$ |
— |
|
$ |
95.2 |
|
|
Other |
|
21.9 |
|
— |
|
0.2 |
|
22.1 |
|
|
Total equity securities |
|
$ |
117.1 |
|
$ |
— |
|
$ |
0.2 |
|
$ |
117.3 |
|
|
Other investments carried at fair value |
|
$ |
— |
|
$ |
6.2 |
|
$ |
0.1 |
|
$ |
6.3 |
|
|
Total investments carried at fair value |
|
$ |
547.8 |
|
$ |
1,978.0 |
|
$ |
28.6 |
|
$ |
2,554.4 |
|
|
Other investments carried at net asset value |
|
$ |
— |
|
$ |
61.5 |
|
$ |
11.0 |
|
$ |
72.5 |
|
|
|
|
|
|
|
|
|
|
|
|
|
Total investments |
|
$ |
547.8 |
|
$ |
2,039.5 |
|
$ |
39.6 |
|
$ |
2,626.9 |
|
F-18
Table of Contents
Level 1 Securities
Montpelier’s investments classified as Level 1 as of December 31, 2014 and 2013 consisted of U.S. Treasuries and long equity positions that are publicly listed and/or actively traded in an established market. In addition, as of December 31, 2014 and 2013, approximately 26% and 33%, respectively, of Montpelier’s open short fixed maturity positions, and substantially all of Montpelier’s short equity positions, were valued on the basis of Level 1 inputs.
Level 2 Securities
For Montpelier’s investments classified as Level 2 as of December 31, 2014 and 2013, Montpelier’s pricing vendors generally utilize third-party market data and other observable inputs in matrix pricing models to determine prices. Although prices for these securities obtained from broker quotations are generally considered non-binding, they are based on observable inputs and secondary trading patterns of similar securities obtained from active, non-distressed markets. In addition, as of December 31, 2014 and 2013, approximately 74% and 63%, respectively, of Montpelier’s open short fixed maturity positions were valued on the basis of Level 2 inputs.
Further details for selected investment types classified as Level 2 follow:
Corporate debt securities. Montpelier’s Level 2 corporate debt securities are priced using market sources and other considerations such as the issuer of the security, credit data, the specific terms and conditions of the securities, including any specific features which may influence risk, as well as other observations from relevant market and sector news reports. Evaluations are updated by obtaining broker quotes and other market information including actual trade volumes, when available. Each security is individually evaluated using a spread model which is added to the U.S. Treasury curve.
Residential mortgage-backed securities and debt securities issued/sponsored by the U.S. Treasury and its agencies. Montpelier’s Level 2 residential mortgage-backed securities and debt securities issued by U.S. agencies are priced using a mortgage-pool-specific model which utilizes daily inputs from the to-be-announced, or “TBA” market (the most liquid secondary market for mortgage loans), as well as the U.S. Treasury market. This pricing model also utilizes additional information such as the weighted average maturity, weighted average coupon and other available pool level data which is provided by the agency. Valuations are also corroborated by daily active market quotes.
Montpelier’s Level 2 U.S. government-sponsored enterprise securities are priced using information from market sources, as well as other observations from relevant market and sector news. Evaluations are updated by obtaining broker quotes and other market information including actual trade volumes, when available. Each security is individually evaluated using analytical models which incorporate option-adjusted spreads and other relevant interest rate data.
Commercial mortgage-backed securities. Montpelier’s Level 2 commercial mortgage-backed securities are priced using dealer quotes and other available trade information such as bids and offers, prepayment speeds (which may be adjusted for the underlying collateral or current price data), the U.S. Treasury curve, swap curve and TBA values, as well as cash settlement. This pricing methodology utilizes a single cash flow stream, computes both a yield-to-call and weighted average yield-to-maturity and generates a derived price for the security by applying the most likely scenario.
Other investments. Montpelier’s Level 2 other investments carried at fair value consist of publicly traded derivative instruments and CAT bonds. Montpelier’s Level 2 other investments carried at net asset value consist of certain investments in funds and limited partnership interests whose carrying values are based on net asset values provided by the relevant investment managers.
There were no transfers between Levels 1 and 2 during any of the periods presented.
Level 3 Securities
Montpelier’s investments classified as Level 3 as of December 31, 2014 and 2013 consisted primarily of the following: (i) with respect to certain fixed maturity investments, bank loans and certain asset-backed securities, many of which are not actively traded; and (ii) with respect to other investments, certain investments in investment funds and limited partnerships. In addition, as of December 31, 2014 and 2013, approximately zero and 4%, respectively, of Montpelier’s open short fixed maturity positions were valued on the basis of Level 3 inputs.
Further details for selected investment types follow:
Corporate debt securities. Montpelier’s Level 3 corporate debt securities represent: (i) bank loans that are priced using non-binding broker quotes that cannot be corroborated with other externally obtained information; and (ii) debt instruments issued by private entities that are priced using third-party market analyses and cash-flow models maintained by Montpelier.
F-19
Table of Contents
Other asset-backed obligations. Montpelier’s Level 3 other asset-backed obligations represent tranches of collateralized loan obligations that are priced using non-binding broker quotes which may not be corroborated with other externally obtained information.
Other investments. Montpelier’s Level 3 other investments include certain investments in investment funds and limited partnerships which cannot be readily redeemed, and whose values are based on net asset values obtained from the investment manager or general partner of the respective entity. As of December 31, 2014, nearly all of Montpelier’s Level 3 other investments were subject to lock-up restrictions and therefore cannot be redeemed until such restrictions expire in 2015 and 2016.
As of December 31, 2014 and 2013, the Company’s Level 3 securities measured at fair value represented 3.9% and 1.1% of its total investments measured at fair value, respectively. As of December 31, 2014 and 2013, the Company’s total Level 3 securities represented 6.7% and 1.5% of its total investments, respectively. The primary reason for the increase in the proportionate share of investments represented by Level 3 securities is the purchase of investment funds during 2014 that are subject to the lock-up restrictions previously noted.
The following tables reconcile the beginning and ending balances for all investments measured at fair value on a recurring basis using Level 3 inputs during 2014 and 2013:
|
|
|
Year Ended December 31, 2014 |
|
|
|
|
Beginning
Level 3
balance |
|
Purchases |
|
Sales and
maturities |
|
Net
realized
gains |
|
Net
unrealized
gains
(losses) |
|
Net
transfers |
|
Ending
Level 3
balance |
|
|
Fixed maturity investments: |
|
|
|
|
|
|
|
|
|
|
|
|
|
|
|
|
Corporate debt securities |
|
$ |
10.0 |
|
$ |
16.6 |
|
$ |
(11.8 |
) |
$ |
0.1 |
|
$ |
(0.1 |
) |
$ |
(4.7 |
) |
$ |
10.1 |
|
|
Other asset-backed obligations |
|
18.3 |
|
28.0 |
|
(9.9 |
) |
0.2 |
|
0.7 |
|
(11.0 |
) |
26.3 |
|
|
Total fixed maturity investments |
|
$ |
28.3 |
|
$ |
44.6 |
|
$ |
(21.7 |
) |
$ |
0.3 |
|
$ |
0.6 |
|
$ |
(15.7 |
) |
$ |
36.4 |
|
|
|
|
|
|
|
|
|
|
|
|
|
|
|
|
|
|
|
Equity investments |
|
$ |
0.2 |
|
$ |
— |
|
$ |
(0.6 |
) |
$ |
0.4 |
|
$ |
— |
|
$ |
— |
|
$ |
— |
|
|
|
|
|
|
|
|
|
|
|
|
|
|
|
|
|
|
|
Other investments |
|
$ |
0.1 |
|
$ |
50.0 |
|
$ |
(0.1 |
) |
$ |
— |
|
$ |
(2.6 |
) |
$ |
— |
|
$ |
47.4 |
|
|
|
|
|
|
|
|
|
|
|
|
|
|
|
|
|
|
|
Total Level 3 securities |
|
$ |
28.6 |
|
$ |
94.6 |
|
$ |
(22.4 |
) |
$ |
0.7 |
|
$ |
(2.0 |
) |
$ |
(15.7 |
) |
$ |
83.8 |
|
|
|
|
Year Ended December 31, 2013 |
|
|
|
|
Beginning
Level 3
balance |
|
Purchases |
|
Sales and
maturities |
|
Net
realized
gains
(losses) |
|
Net
unrealized
gains
(losses) |
|
Net
transfers |
|
Ending
Level 3
balance |
|
|
Fixed maturity investments: |
|
|
|
|
|
|
|
|
|
|
|
|
|
|
|
|
Corporate debt securities |
|
$ |
95.4 |
|
$ |
17.5 |
|
$ |
(28.8 |
) |
$ |
(4.1 |
) |
$ |
10.9 |
|
$ |
(80.9 |
) |
$ |
10.0 |
|
|
Other asset-backed obligations |
|
16.2 |
|
33.2 |
|
(19.7 |
) |
0.2 |
|
1.2 |
|
(12.8 |
) |
18.3 |
|
|
Total fixed maturity investments |
|
$ |
111.6 |
|
$ |
50.7 |
|
$ |
(48.5 |
) |
$ |
(3.9 |
) |
$ |
12.1 |
|
$ |
(93.7 |
) |
$ |
28.3 |
|
|
|
|
|
|
|
|
|
|
|
|
|
|
|
|
|
|
|
Equity investments |
|
$ |
— |
|
$ |
— |
|
$ |
— |
|
$ |
— |
|
$ |
— |
|
$ |
0.2 |
|
$ |
0.2 |
|
|
|
|
|
|
|
|
|
|
|
|
|
|
|
|
|
|
|
Other investments |
|
$ |
12.7 |
|
$ |
— |
|
$ |
(12.5 |
) |
$ |
1.5 |
|
$ |
(1.6 |
) |
$ |
— |
|
$ |
0.1 |
|
|
|
|
|
|
|
|
|
|
|
|
|
|
|
|
|
|
|
Total Level 3 securities |
|
$ |
124.3 |
|
$ |
50.7 |
|
$ |
(61.0 |
) |
$ |
(2.4 |
) |
$ |
10.5 |
|
$ |
(93.5 |
) |
$ |
28.6 |
|
The transfers from Level 3 to Level 2 during 2014 and 2013 reflect an increase in the overall quality and transparency of the pricing information that the Company receives from its pricing vendors. Additionally, during 2013 Montpelier’s portfolio of bank loans shifted toward holdings that are more broadly syndicated than had previously been the case.
F-20
Table of Contents
Changes in Carrying Value
Changes in the carrying value of Montpelier’s investment portfolio and its short investment positions for the years ended December 31, 2014, 2013 and 2012, consisted of the following:
|
|
|
Gross Realized
Gains on
Investments |
|
Gross Realized
Losses on
Investments |
|
Net
Unrealized
Gains
(Losses) on
Investments |
|
Net Foreign
Exchange and
Gains (Losses)
From Certain
Derivatives (1) |
|
Total Changes
in Carrying
Value
Reflected in
Revenues |
|
|
Year Ended December 31, 2014: |
|
|
|
|
|
|
|
|
|
|
|
|
Fixed maturity investments |
|
$ |
69.3 |
|
$ |
(46.8 |
) |
$ |
(8.5 |
) |
$ |
(2.3 |
) |
$ |
11.7 |
|
|
Equity securities |
|
10.6 |
|
(10.2 |
) |
1.5 |
|
(4.0 |
) |
(2.1 |
) |
|
Other investments |
|
11.4 |
|
(19.3 |
) |
(2.6 |
) |
(12.8 |
) |
(23.3 |
) |
|
Year Ended December 31, 2013: |
|
|
|
|
|
|
|
|
|
|
|
|
Fixed maturity investments |
|
$ |
62.8 |
|
$ |
(59.1 |
) |
$ |
(64.3 |
) |
$ |
0.1 |
|
$ |
(60.5 |
) |
|
Equity securities |
|
9.7 |
|
(7.7 |
) |
5.2 |
|
(5.0 |
) |
2.2 |
|
|
Other investments |
|
— |
|
(7.4 |
) |
11.6 |
|
(13.7 |
) |
(9.5 |
) |
|
Year Ended December 31, 2012: |
|
|
|
|
|
|
|
|
|
|
|
|
Fixed maturity investments |
|
$ |
49.0 |
|
$ |
(18.6 |
) |
$ |
34.0 |
|
$ |
4.3 |
|
$ |
68.7 |
|
|
Equity securities |
|
30.0 |
|
(6.4 |
) |
(14.8 |
) |
(1.9 |
) |
6.9 |
|
|
Other investments |
|
5.5 |
|
(2.8 |
) |
6.5 |
|
3.6 |
|
12.8 |
|
|
(1) |
Represents net realized and unrealized foreign currency gains and losses from investments and income and losses from the following derivative instruments: (i) Foreign Exchange Contracts; (ii) Credit Derivatives; (iii) Interest Rate Contracts; (iv) Investment Options and Futures - long; (v) the UST Contract; and (vi) the LIBOR Swap (see Notes 6 and 7). These derivatives are carried at fair value within other investments on the Company’s Consolidated Balance Sheets. |
Net Investment Income
Montpelier’s net investment income for the years ended December 31, 2014, 2013 and 2012 consisted of the following:
|
|
|
Year Ended December 31, |
|
|
|
|
2014 |
|
2013 |
|
2012 |
|
|
Fixed maturity investments |
|
$ |
51.8 |
|
$ |
71.2 |
|
$ |
70.6 |
|
|
Cash and cash equivalents |
|
0.5 |
|
0.5 |
|
0.6 |
|
|
Equity securities |
|
2.1 |
|
0.7 |
|
0.2 |
|
|
Other investments |
|
0.4 |
|
0.2 |
|
2.0 |
|
|
Total investment income |
|
54.8 |
|
72.6 |
|
73.4 |
|
|
Investment expenses |
|
(8.0 |
) |
(8.6 |
) |
(6.3 |
) |
|
Net investment income |
|
$ |
46.8 |
|
$ |
64.0 |
|
$ |
67.1 |
|
Investment Assets Held in Trust
Blue Water Re, which commenced its operations in June 2012, does not operate with a financial strength rating and, instead, fully collateralizes its reinsurance obligations through cash and cash equivalents held in trust funds established by Blue Water Re (the “Blue Water Trusts”) for the benefit of ceding companies. As of December 31, 2014 and 2013, the fair value of all assets held in the Blue Water Trusts was $410.9 million and $164.7 million, respectively, which met the minimum values required on those dates.
As of December 31, 2014, Blue Capital Re had pledged $184.0 million of its cash and cash equivalents to trust accounts established for the benefit of Blue Water Re pursuant to the BW Retrocessional Agreement (see Note 14). These funds are included in the value of the Blue Water Trusts balance presented above.
F-21
Table of Contents
Blue Capital Re ILS, which commenced its operations in November 2013, fully collateralizes its insurance-linked security obligations through cash and cash equivalents held in trust funds established by Blue Capital Re ILS (the “Blue Capital Re ILS Trusts”) for the benefit of third parties. As of December 31, 2014, the fair value of all assets held in the Blue Capital Re ILS Trusts was $10.0 million, which met the minimum value required on that date. As of December 31, 2013, Blue Capital Re ILS was not required to hold any of its cash and cash equivalents in trust for the benefit of third parties.
In 2011 Montpelier Re entered into a Reinsurance Trust (the “MUSIC Trust”). The MUSIC Trust was established as a means of providing statutory credit to MUSIC in support of the business Montpelier retained in connection with the MUSIC Sale. As of December 31, 2014 and 2013, the fair value of all assets held in the MUSIC Trust was $25.3 million and $32.0 million, respectively, which met the minimum value required on those dates.
In 2010 Montpelier Re entered into a Multi-Beneficiary U.S. Reinsurance Trust (the “Reinsurance Trust”) for the benefit of certain of its U.S. cedants. The Reinsurance Trust was established as a means of providing statutory credit to Montpelier Re’s cedants. Montpelier Re has been granted authorized or trusteed reinsurer status in all U.S. states and the District of Columbia. As of December 31, 2014 and 2013, the fair value of all assets held in the Reinsurance Trust was $342.2 million and $337.7 million, respectively, which met the minimum value required on those dates.
In 2011 Montpelier Re established a second Multi-Beneficiary Reinsurance Trust (the “FL Trust”) in connection with a reduction in Florida’s collateral requirements. As of December 31, 2014 and 2013, the fair value of all assets held in the FL Trust was $26.2 million and $26.1 million, respectively, which met the minimum value required on those dates.
In 2010 Montpelier entered into a Lloyd’s Deposit Trust Deed (the “Lloyd’s Capital Trust”) in order to meet MCL’s ongoing funds at Lloyd’s (“FAL”) requirements. The minimum value of cash and investments held by the Lloyd’s Capital Trust is determined on the basis of MCL’s Individual Capital Assessment, which is used to determine the required amount of FAL. As of December 31, 2014 and 2013, the fair value of all assets held in the Lloyd’s Capital Trust was $212.8 million and $160.2 million, respectively, which met the minimum value required on those dates.
Premiums received by Syndicate 5151 are required to be received into the Lloyd’s Premiums Trust Funds (the “Premiums Trust Funds”). Under the Premiums Trust Funds’ deeds, assets may only be used for the payment of claims and valid expenses for a stated period of time. See Note 13. As of December 31, 2014 and 2013, the fair value of all assets held in the Premiums Trust Funds was $284.5 million and $326.4 million, respectively.
Montpelier’s investment assets held in trust appear on the Company’s Consolidated Balance Sheets as cash and cash equivalents, investments and accrued investment income, as appropriate.
Sales and Maturities of Investments
Sales of investments totaled $10,438.0 million, $6,545.7 million and $3,970.6 million for the years ended December 31, 2014, 2013 and 2012, respectively. Maturities, calls and paydowns of investments totaled $326.4 million, $373.9 million and $593.7 million for the years ended December 31, 2014, 2013 and 2012, respectively. There were no non-cash exchanges or involuntary sales of investment securities during 2014, 2013 and 2012.
Pending Securities Litigation
During 2011 Montpelier Re was named in a series of lawsuits filed by a group of plaintiffs in their capacity as trustees for senior debt issued by the Tribune Company (“Tribune”) on behalf of various senior debt holders. Montpelier Re, along with thousands of other named defendants, formerly owned Tribune common shares and tendered such common shares pursuant to a 2007 leveraged buyout led by Tribune management (the “Tribune LBO”). Tribune subsequently filed for bankruptcy protection at the end of 2008 and emerged from bankruptcy on December 31, 2012.
The plaintiffs are suing all tendering shareholders, including Montpelier Re, on the grounds of fraudulent conveyance and seek recovery of the proceeds received pursuant to the Tribune LBO on the basis that the transaction was undertaken without fair consideration and left Tribune insolvent. The various lawsuits are still pending and, in December 2011, were consolidated in the Federal District Court for the Southern District of New York by the U.S. Judicial Panel on Multidistrict Litigation.
Montpelier Re was also named in a similar suit filed by the Official Committee of Unsecured Creditors in the Tribune bankruptcy case. This suit was filed in the U.S. Bankruptcy Court for the District of Delaware and also asserts a fraudulent conveyance claim involving the Tribune LBO.
F-22
Table of Contents
In the event that the plaintiffs in these suits were to fully prevail, Montpelier Re would have to return the $4.4 million in cash proceeds it received in connection with the Tribune common shares tendered pursuant to the Tribune LBO.
NOTE 6. Debt, Letter of Credit Facilities and Trust Arrangements
Senior Unsecured Debt Due 2022 (“2022 Senior Notes”)
On October 5, 2012, the Company issued $300.0 million in principal amount of 2022 Senior Notes. The 2022 Senior Notes bear interest at a fixed rate of 4.70% per annum, payable semi-annually in arrears on April 15 and October 15 of each year and were issued at a price of 99.682% of their principal amount, providing an effective yield to investors of 4.74%. The 2022 Senior Notes are scheduled to mature on October 15, 2022, and do not contain any covenants regarding financial ratios or specified levels of net worth or liquidity to which the Company or any of its subsidiaries must adhere. The Company may redeem the 2022 Senior Notes at any time, in whole or in part, at a “make-whole” redemption price, plus accrued and unpaid interest.
The net proceeds from the issuance of the 2022 Senior Notes, after deducting the issuance discount and debt issuance costs, were $296.4 million. These net proceeds were used to redeem the 2013 Senior Notes and for general corporate purposes. The associated debt issuance costs of $2.7 million have been capitalized within other assets in the Company’s Consolidated Balance Sheets and are being amortized over the life of the 2022 Senior Notes.
The carrying value of the 2022 Senior Notes at December 31, 2014 and 2013 was $299.3 million and $299.2 million, respectively.
The Company incurred interest expense on the 2022 Senior Notes of $14.1 million, $14.1 million and $3.4 million during the years ended December 31, 2014, 2013 and 2012, respectively. The Company paid $14.1 million and $14.5 million in interest on the 2022 Senior Notes during the years ended December 31, 2014 and 2013, respectively. The Company was not obligated to pay any interest on the 2022 Senior Notes during the year ended December 31, 2012.
Senior Unsecured Debt Due 2013 (“2013 Senior Notes”)
During 2003 the Company issued $250.0 million in principal amount of 2013 Senior Notes of which, at the time of its redemption, $228.0 million in principal amount remained outstanding. The 2013 Senior Notes bore interest at a fixed rate of 6.125% per annum, payable semi-annually in arrears on February 15 and August 15 of each year and were originally scheduled to mature in August 2013.
In November 2012 the Company fully redeemed the 2013 Senior Notes at a “make-whole” redemption price of $237.6 million (or 104.2% of the principal thereof), plus accrued and unpaid interest to the redemption date. In connection with the redemption of the 2013 Senior Notes, the Company recorded a loss on early extinguishment of debt of $9.7 million, which is reflected in the Company’s 2012 Consolidated Statement of Operations and Comprehensive Income.
The Company incurred and paid interest on the 2013 Senior Notes of $11.7 million and $17.1 million, respectively, during the year ended December 31, 2012.
UST Contract
In anticipation of refinancing the 2013 Senior Notes, in July 2012 the Company entered into a derivative contract (the “UST Contract”) with a third-party which was designed to help insulate it against future movements in the 10-year U.S. Treasury rate through a specified date. The UST Contract, which had a notional value of $250 million, had a tenor of ten years and was required to be terminated on or before August 15, 2013.
In October 2012 the Company terminated the UST Contract and recognized a gain of $0.6 million, which was recorded within net income (loss) from derivative instruments on the Company’s 2012 Consolidated Statement of Operations and Comprehensive Income. The fair value of the UST Contract was derived based on other observable (Level 2) inputs. See Note 7.
Trust Preferred Securities
In January 2006 the Company, through Montpelier Capital Trust III, participated in a private placement of $100.0 million of capital securities (the “Trust Preferred Securities”). The Trust Preferred Securities mature on March 30, 2036, are redeemable at Montpelier Capital Trust III’s option at par, and require quarterly distributions of interest to the holders. The Trust Preferred Securities bear interest at a floating rate equal to the 3-month LIBOR plus 380 basis points, reset quarterly. This floating rate varied from 4.03% to 4.06% during 2014, from 4.05% to 4.11% during 2013 and from 4.11% to 4.38% during 2012.
F-23
Table of Contents
The Trust Preferred Securities do not contain any covenants regarding financial ratios or specified levels of net worth or liquidity to which the Company or any of its subsidiaries must adhere.
The Company incurred and paid interest on the Trust Preferred Securities of $4.1 million, $4.1 million and $4.3 million during the years ended December 31, 2014, 2013 and 2012, respectively.
LIBOR Swap
In February 2012 the Company entered into a five-year swap agreement with a third-party (the “LIBOR Swap”) which results in the future net cash flows in connection with the Trust Preferred Securities, for the five-year period beginning March 30, 2012, being the same as if these securities bore interest at a fixed rate of 4.905%, provided the Company holds the LIBOR Swap to its maturity. Net realized and unrealized gains and losses associated with the LIBOR Swap are reported within net income (loss) from derivative instruments on the Company’s Consolidated Statements of Operations and Comprehensive Income, as opposed to interest and financing expenses. The fair value of the LIBOR Swap is derived based on other observable (Level 2) inputs. See Note 7.
Credit Agreements
In May 2014 BCRH entered into a 364-day unsecured credit agreement (the “BCRH Credit Agreement”) which permits it to borrow up to $20.0 million on a revolving basis for working capital and general corporate purposes. Borrowings under the BCRH Credit Agreement bear interest, set at the time of the borrowing, at a rate equal to the 3-month LIBOR rate plus 100 basis points.
The Company serves as a guarantor of BCRH’s obligations under the BCRH Credit Agreement and receives an annual guarantee fee from BCRH equal to 0.125% of the facility’s total capacity. See Note 14.
As of December 31, 2014, BCRH had $8.0 million of outstanding borrowings under the BCRH Credit Agreement. Of these borrowings, $4.0 million was repaid on January 26, 2015, and (while outstanding) was subject to an annual interest rate of 1.33%, and $4.0 million must be repaid no later than April 10, 2015, and is subject to an annual interest rate of 1.32%.
BCRH incurred $0.1 million in non-recurring fees in establishing the BCRH Credit Agreement and is subject to an ongoing annual commitment and administrative fee of 0.375% of the facility’s total capacity.
BCRH incurred and paid interest on its borrowings under the BCRH Credit Agreement of less than $0.1 million during the year ended December 31, 2014.
The BCRH Credit Agreement contains covenants that limit BCRH’s and, to a lesser extent, the Company’s ability to, among other things, grant liens on its assets, sell assets, merge or consolidate, incur debt and enter into certain transactions with affiliates. The BCRH Credit Agreement also contains covenants that require: (i) BCRH to maintain a debt to total capitalization ratio less than or equal to 22.5%; (ii) the Company to maintain a financial strength rating from Fitch Ratings Ltd. of at least “BBB+”; and (iii) each of BCRH and the Company to maintain at least 70% of its net worth as of the date of the BCRH Credit Agreement. If BCRH or the Company were to fail to comply with any of these covenants, the lender could revoke the facility and exercise remedies against BCRH or the Company. As of December 31, 2014, BCRH and the Company (as a guarantor) were in compliance with each of the covenants associated with the BCRH Credit Agreement.
In May 2014 the BCGR Listed Fund entered into a 364-day unsecured credit agreement (the “BCGR Credit Agreement”) which permits it to borrow up to $20.0 million on a revolving basis for working capital and general corporate purposes. Borrowings under the BCGR Credit Agreement bear interest, set at the time of the borrowing, at a rate equal to the 3-month LIBOR rate plus 100 basis points.
The Company serves as a guarantor of the BCGR Listed Fund’s obligations under the BCGR Credit Agreement and receives an annual guarantee fee from the BCGR Listed Fund equal to 0.125% of the facility’s total capacity.
As of December 31, 2014, the BCGR Listed Fund had a $4.0 million outstanding borrowing under the BCGR Credit Agreement. This borrowing was repaid by the BCGR Listed Fund on February 3, 2015, and (while outstanding) was subject to an annual interest rate of 1.27%.
F-24
Table of Contents
The BCGR Credit Agreement contains covenants that limit the BCGR Listed Fund’s and, to a lesser extent, the Company’s ability, among other things, to grant liens on its assets, sell assets, merge or consolidate, incur debt and enter into certain transactions with affiliates. The BCGR Credit Agreement also contains a financial covenant that requires the Company to maintain a leverage ratio at or below 30%. If the BCGR Listed Fund or the Company were to fail to comply with any of these covenants, the lender could revoke the facility and exercise remedies against the BCGR Listed Fund or the Company. As of December 31, 2014, the BCGR Listed Fund and the Company (as a guarantor) were in compliance with each of the covenants associated with the BCGR Credit Agreement.
Letter of Credit Facilities
Montpelier Re maintains letter of credit facilities and provides letters of credit to third parties as a means of providing collateral and/or statutory credit in varying amounts to certain of its cedants. These letter of credit facilities were secured by collateral accounts containing cash and investments totaling $33.8 million and $32.0 million as of December 31, 2014 and 2013, respectively. The following table outlines these facilities as of December 31, 2014:
|
|
|
Total
Capacity |
|
Amount
Drawn |
|
Expiry
Date |
|
|
Secured Operational Letter of Credit Facilities |
|
|
|
|
|
|
|
|
Bilateral Facility |
|
$ |
75.0 |
|
$ |
18.9 |
|
None |
|
|
Four Year Committed Facility |
|
75.0 |
|
3.4 |
|
Oct. 2016 |
|
|
|
|
|
|
|
|
|
|
|
The agreements governing these letter of credit facilities contain covenants that limit Montpelier’s ability, among other things, to grant liens on its assets, sell assets, merge or consolidate, incur debt and enter into certain burdensome agreements. In addition, the secured facilities require the Company to maintain debt leverage of no greater than 30% and Montpelier Re to maintain an A.M. Best financial strength rating of no less than “B++.” If the Company or Montpelier Re were to fail to comply with these covenants or fail to meet these financial ratios, the lenders could revoke the facilities and exercise remedies against the collateral. As of December 31, 2014 and 2013, the Company and Montpelier Re were in compliance with all covenants.
Montpelier Re’s Bilateral Facility, which has a capacity of $75.0 million, is subject to an annual commitment fee of 0.45% on drawn balances. As of December 31, 2014, there were $18.9 million in outstanding letters of credit drawn under this facility.
Montpelier Re’s Four Year Committed Facility, which has a capacity of $75.0 million, is subject to an annual commitment fee of between 0.25% and 0.35% on drawn balances (depending on the type of collateral provided) and 0.125% on undrawn balances. As of December 31, 2014, there were $3.4 million in outstanding letters of credit drawn under this facility.
In June 2012 Montpelier Re’s former syndicated 364-day facility, which had a capacity of $250.0 million, expired in accordance with its terms and was not renewed. While active, this facility was subject to an annual commitment fee of 0.45% on drawn balances and an annual commitment fee of 0.10% on undrawn balances.
In June 2012 Montpelier Re’s former syndicated 5-year facility (II), which had a capacity of $215.0 million, expired in accordance with its terms and was not renewed. While active, this facility was subject to an annual commitment fee of 0.225% on drawn balances and an annual commitment fee of 0.08% on undrawn balances.
Trust Arrangements
Blue Water Re and Blue Capital Re have each established trusts as a means of providing collateralized reinsurance protection to cedants.
Blue Capital Re ILS has established the Blue Capital Re ILS Trusts as a means of collateralizing its insurance-linked security obligations for the benefit of third parties.
Montpelier Re has established the MUSIC Trust as a means of providing statutory credit to MUSIC.
Montpelier Re has established the Reinsurance Trust as a means of providing statutory credit to certain of Montpelier Re’s U.S. cedants.
Montpelier Re has established the FL Trust in connection with its reduced collateral requirements to cedants domiciled in Florida.
Montpelier has established the Lloyd’s Capital Trust in order to meet MCL’s ongoing FAL requirements.
F-25
Table of Contents
Syndicate 5151’s premium receipts are required to be received into the Premiums Trust Funds.
See Note 5 for further information regarding the aforementioned trust agreements.
NOTE 7. Derivative Instruments
Montpelier enters into derivative instruments from time to time in order to manage certain of its business risks and to supplement its investing and underwriting activities.
Foreign currency risk, specifically Montpelier’s risk associated with making claim payments in foreign currencies, is managed through the use of foreign currency exchange agreements (“Foreign Exchange Contracts”).
As an extension of Montpelier’s investing activities, certain of its investment managers have entered into credit derivative arrangements (“Credit Derivatives”), interest rate contracts (“Interest Rate Contracts”) and investment options and futures (“Investment Options and Futures”), as well as Foreign Exchange Contracts.
In order to help insulate the Company against future movements in the 10-year U.S. Treasury in connection with the its refinancing of the 2013 Senior Notes, the Company entered into the UST Contract. See Note 6.
In order to fix the future net cash flows associated with its Trust Preferred Securities to be a set amount each period, the Company entered into the LIBOR Swap. See Note 6.
As a means of managing its underwriting risk, Montpelier has entered into ILW swap contracts (the “Outward ILW Swaps”), which provided reinsurance-like protection for specific loss events associated with certain lines of its business.
As an extension of its underwriting activities, Montpelier has sold ILW protection (the “Inward ILW Swap”), which provided reinsurance-like protection to a third-party for specific loss events associated with certain lines of business.
Montpelier uses an independent service provider for assistance with its derivative accounting function. This service provider, as well as Montpelier’s investment managers, use pricing services and brokers to assist with the determination of the fair value of the Credit Derivatives, the Interest Rate Contracts, the Investment Options and Futures and certain of the Foreign Exchange Contracts. Montpelier reviews these values as it is ultimately management’s responsibility to ensure that the fair values reflected in the Company’s financial statements are appropriate.
For the remaining Foreign Exchange Contracts, the UST Contract and the LIBOR Swap, Montpelier determines the fair values on the basis of information received from counterparties and verification by reference to published rates. The Outward ILW Swaps and the Inward ILW Swap were valued on the basis of models developed by Montpelier.
In accordance with GAAP, the valuation techniques used by Montpelier and its pricing services maximize the use of observable inputs. Unobservable inputs are used to measure fair value only to the extent that observable inputs are unavailable. Montpelier uses both the market and income approaches in valuing its derivatives. There have been no significant changes in the Company’s use of valuation techniques or related inputs during the periods presented.
None of Montpelier’s derivatives are formally designated as hedging instruments.
The following tables present the fair values, notional values (expressed in millions of notional units) and balance sheet location of Montpelier’s derivative instruments recorded at December 31, 2014 and 2013 and the net income (loss) from such derivative instruments during the years ended December 31, 2014, 2013 and 2012:
F-26
Table of Contents
|
|
|
|
|
December 31, 2014 |
|
December 31, 2013 |
|
|
Derivative Instrument |
|
Balance Sheet
Location |
|
Fair
Value |
|
Notional
Units |
|
Fair
Value |
|
Notional
Units |
|
|
Foreign Exchange Contracts: |
|
|
|
|
|
|
|
|
|
|
|
|
U.S. Dollars purchased |
|
Other Investments |
|
$ |
— |
|
— |
|
$ |
0.6 |
|
288 |
|
|
U.S. Dollars sold |
|
Other Investments |
|
(0.1 |
) |
36 |
|
(0.1 |
) |
279 |
|
|
Cross-currency |
|
Other Investments |
|
0.7 |
|
155 |
|
0.4 |
|
84 |
|
|
Credit Derivatives |
|
Other Investments |
|
1.8 |
|
224 |
|
(0.2 |
) |
231 |
|
|
Interest Rate Contracts |
|
Other Investments |
|
— |
|
557 |
|
1.5 |
|
2,806 |
|
|
Investment Options and Futures - long |
|
Other Investments |
|
— |
|
176 |
|
3.8 |
|
6,627 |
|
|
Investment Options and Futures - short |
|
Other Liabilities |
|
— |
|
— |
|
(1.3 |
) |
1,748 |
|
|
LIBOR Swap |
|
Other Investments |
|
(0.3 |
) |
100 |
|
(0.5 |
) |
100 |
|
|
Outward ILW Swaps |
|
Other Assets |
|
— |
|
— |
|
0.2 |
|
3 |
|
|
Inward ILW Swap |
|
Other Liabilities |
|
— |
|
— |
|
(1.5 |
) |
10 |
|
|
|
|
|
|
|
|
|
|
|
|
|
|
|
|
|
|
Year Ended December 31, |
|
|
Income (Loss) From Derivative Instruments |
|
2014 |
|
2013 |
|
2012 |
|
|
Foreign Exchange Contracts - underwriting activities |
|
$ |
(0.1 |
) |
$ |
(4.5 |
) |
$ |
7.5 |
|
|
Foreign Exchange Contracts - investing activities |
|
2.0 |
|
2.0 |
|
(3.9 |
) |
|
Credit Derivatives |
|
(5.0 |
) |
(16.9 |
) |
(0.4 |
) |
|
Interest Rate Contracts |
|
(3.7 |
) |
5.0 |
|
2.7 |
|
|
Investment Options and Futures |
|
(8.9 |
) |
(3.7 |
) |
(0.3 |
) |
|
UST Contract |
|
— |
|
— |
|
0.6 |
|
|
LIBOR Swap |
|
(0.7 |
) |
0.4 |
|
(2.2 |
) |
|
Outward ILW Swaps |
|
(4.3 |
) |
(7.6 |
) |
(0.8 |
) |
|
Inward ILW Swap |
|
2.1 |
|
— |
|
— |
|
|
Net income (loss) from derivative instruments |
|
$ |
(18.6 |
) |
$ |
(25.3 |
) |
$ |
3.2 |
|
A description of each of Montpelier’s derivative instrument activities follows:
Foreign Exchange Contracts
From time to time Montpelier, either directly through its investment managers or otherwise, enters into foreign currency agreements which constitute obligations to buy or sell specified currencies at future dates at prices set at the inception of each contract. Montpelier enters into these agreements in connection with both its underwriting and investing activities.
Foreign Exchange Contracts designed to protect Montpelier’s insurance and reinsurance balances against movements in foreign currency exchange rates do not eliminate fluctuations in the actual value of Montpelier’s assets and liabilities denominated in foreign currencies; rather, they provide an offsetting benefit or detriment against such exchange rate movements. Foreign Exchange Contracts related to Montpelier’s investing activities are designed to either protect Montpelier’s cash and invested assets from movements in foreign currency exchange rates or to enhance Montpelier’s investment performance.
The fair value of the Foreign Exchange Contracts is derived based on other observable (Level 2) inputs.
Credit Derivatives
From time to time Montpelier’s investment managers enter into various credit derivative instruments in the form of either: (i) index positions; or (ii) instruments whose values are derived from the credit risk associated with underlying bonds, loans or other financial instruments. In such transactions, Montpelier is effectively the buyer or seller of credit protection, depending on the specific instrument. When Montpelier is buying credit protection, the value of its derivative position increases (or decreases) when the associated credit risk of the instrument increases (or decreases). Conversely, when Montpelier is selling credit protection, the value of its derivative position decreases (or increases) when the associated credit risk of the instrument increases (or decreases).
The fair value of the Credit Derivatives is derived based on other observable (Level 2) inputs.
F-27
Table of Contents
Interest Rate Contracts
From time to time Montpelier’s investment managers enter into various interest rate derivative instruments whose values are based on the right to pay or receive a notional amount of money at a given interest rate. These instruments are either used to limit Montpelier’s exposure to fluctuations in specified interest rates or to address an anticipated change in interest rates.
The fair value of the Interest Rate Contracts is derived based on other observable (Level 2) inputs.
Investment Options and Futures
From time to time Montpelier enters into various exchange-traded investment options and futures as part of its investing strategy.
The fair value of the Investment Options and Futures was derived based on other observable (Level 2) inputs.
Outward ILW Swaps
From time to time Montpelier enters into various Outward ILW swaps, whose values are based on the right to receive a floating, notional payment in the event of certain losses incurred by the insurance industry as a whole, rather than by losses incurred by Montpelier. There were no Outward ILW Swaps in force as of December 31, 2014. As of December 31, 2013, Montpelier’s only in-force Outward ILW Swap provided protection against Syndicate 5151’s construction and engineering exposures. Montpelier is not aware of any industry loss events occurring during the periods presented that would have triggered any payments to Montpelier under the Outward ILW swaps.
The fair values of Outward ILW Swaps are derived based on unobservable (Level 3) inputs.
Inward ILW Swap
In December 2013 Blue Capital Re ILS entered into the Inward ILW Swap with a third-party under which qualifying loss payments would be triggered by reference to the level of losses incurred by the insurance industry as a whole, rather than by losses incurred by the insured. During the term of the Inward ILW Swap, Blue Capital Re ILS provided protection against losses incurred from specified natural catastrophes in the U.S., Europe, Japan, Australia and New Zealand. The Inward ILW Swap expired in December 2014. Blue Capital Re ILS is not aware of any industry loss event occurring that would have triggered a payment obligation under the Inward ILW Swap.
The fair value of Inward ILW Swap is derived based on unobservable (Level 3) inputs.
NOTE 8. Shareholders’ Equity
The Company’s share capital consists of Preferred Shares and Common Shares, each with a 1/6 cent par value per share. Holders of Preferred Shares have no voting rights with respect to matters that generally require the approval of voting shareholders but are entitled to vote in certain extraordinary instances, separately as a single class. Holders of Common Shares are entitled to one vote for each share held, subject to any voting limitations imposed by the Company’s Bye-Laws.
Preferred Shares
As of December 31, 2014 and 2013, there were 6.0 million Preferred Shares outstanding with a liquidation preference of $25.00 per share representing $150.0 million in face value. The Preferred Shares have no stated maturity, are not subject to any sinking fund or mandatory redemption and are not convertible into any other securities. Except in certain limited circumstances, the Preferred Shares are not redeemable prior to May 10, 2016. After that date, the Company may redeem at its option, in whole or in part, the Preferred Shares at a price of $25.00 per share plus any declared and unpaid dividends.
Dividends on Preferred Shares are non-cumulative. Consequently, holders of Preferred Shares will be entitled to receive cash dividends only when, as and if declared by the Company’s Board of Directors (the “Board”) or by a duly authorized committee of the Board, quarterly in arrears on or about the 15th day of January, April, July and October of each year. These dividends will accrue, with respect to a particular dividend period, on the liquidation preference amount of $25.00 per share at an annual rate of 8.875%. So long as any Preferred Shares remain outstanding, no dividend shall be paid or declared on Common Shares or any other securities ranking junior to Preferred Shares (other than a dividend payable solely in Common Shares or in other junior securities), unless the full dividend for the latest completed dividend period on all outstanding Preferred Shares has been declared and paid or otherwise provided for.
F-28
Table of Contents
Common Shares
The following table summarizes the Company’s Common Share activity during the years ending December 31, 2014, 2013 and 2012:
|
|
|
Year Ended December 31, |
|
|
(in Common Shares) |
|
2014 |
|
2013 |
|
2012 |
|
|
Beginning Common Shares outstanding |
|
49,274,165 |
|
55,269,690 |
|
60,864,174 |
|
|
Common Shares repurchased and retired |
|
(5,348,998 |
) |
(6,248,302 |
) |
(5,549,789 |
) |
|
Common Shares repurchased and placed in treasury |
|
(861,417 |
) |
(342,244 |
) |
(431,800 |
) |
|
Issuances of Common Shares in satisfaction of vested RSU obligations |
|
555,374 |
|
595,021 |
|
387,105 |
|
|
Ending Common Shares outstanding |
|
43,619,124 |
|
49,274,165 |
|
55,269,690 |
|
As of December 31, 2014, the Company had 43,619,124 Common Shares outstanding consisting of 45,113,841 Common Shares issued less 1,494,717 Common Shares held in treasury. As of December 31, 2013, the Company had 49,274,165 Common Shares outstanding consisting of 50,462,839 Common Shares issued less 1,188,674 Common Shares held in treasury.
2014 Common Share activity
The Company repurchased 6,210,415 Common Shares during 2014 pursuant to a publicly announced share repurchase program at an average price of $29.93 per share. Of these Common Shares repurchased in 2014, 5,348,998 Common Shares were retired and 861,417 Common Shares were placed in the Company’s treasury for re-issuance to employees and directors in satisfaction of existing and future share-based obligations.
During 2014 the Company issued 555,374 Common Shares in satisfaction of vested RSU obligations. See Note 9. The Common Shares were issued from the Company’s treasury resulting in a net loss on issuance of $4.0 million, which was recorded as a reduction to retained earnings.
2013 Common Share activity
The Company repurchased 6,121,324 Common Shares during 2013 pursuant to a publicly announced share repurchase program at an average price of $25.56 per share. Of these Common Shares repurchased in 2013, 5,779,080 Common Shares were retired and 342,244 Common Shares were placed in the Company’s treasury for re-issuance to employees and directors in satisfaction of existing and future share-based obligations.
On March 7, 2013, the Board authorized the private purchase of 469,222 Common Shares from Mr. Thomas G.S. Busher, the Company’s former Chief Operating Officer (“COO”) and Head of European Operations, in connection with his planned retirement on December 31, 2013. The price negotiated and paid to Mr. Busher was $24.62 per share, which was $0.63 less than the market price (as per the New York Stock Exchange) at the time the agreement was reached. See Note 14. The Common Shares purchased from Mr. Busher were retired.
During 2013 the Company issued 595,021 Common Shares in satisfaction of vested RSU obligations. See Note 9. The Common Shares were issued from the Company’s treasury resulting in a net loss on issuance of $4.7 million, of which $0.6 million was recorded as a reduction to additional paid-in capital and $4.1 million was recorded as a reduction to retained earnings.
2012 Common Share activity
The Company repurchased 5,981,589 Common Shares during 2012 pursuant to a publicly announced share repurchase program at an average price of $20.22 per share. Of the total Common Shares repurchased in 2012, 5,549,789 Common Shares were retired and 431,800 Common Shares were placed in the Company’s treasury for re-issuance to employees and directors in satisfaction of existing and future share-based obligations.
During 2012 the Company issued 387,105 Common Shares in satisfaction of vested RSU obligations. See Note 9. The Common Shares were issued from the Company’s treasury resulting in a net loss on issuance of $1.6 million, which was recorded as a reduction to additional paid-in capital.
Common Share Repurchase Authorization
As of December 31, 2014, the Company had a remaining Common Share repurchase authorization of $281.7 million. Common Shares may be purchased in the open market or through privately negotiated transactions. There is no stated expiration date associated with the Company’s Common Share repurchase authorization.
F-29
Table of Contents
Dividends Declared and Paid
The Company declared, on a quarterly basis, regular cash dividends per Common Share and RSU during the years ended December 31, 2014, 2013 and 2012 totaling $0.65, $0.47 and $0.43, respectively. The total amount of dividends paid to holders of Common Shares and RSUs during the years ended December 31, 2014, 2013 and 2012, was $27.2 million, $24.2 million and $24.4 million, respectively. As of December 31, 2014 and 2013, the Company had $8.9 million and $6.2 million of dividends payable to holders of Common Shares and RSUs.
The Company declared, on a quarterly basis, cash dividends per Preferred Share totaling $2.219 during each of the years ended December 31, 2014, 2013 and 2012, respectively. The total amount of dividends paid to holders of Preferred Shares during each of the years ended December 31, 2014, 2013 and 2012, was $13.3 million. As of December 31, 2014 and 2013, the Company had $3.3 million of dividends payable to holders of Preferred Shares.
Dividends payable are included within accounts payable, accrued expenses and other liabilities on the Company’s Consolidated Balance Sheets.
NOTE 9. Share-Based Compensation
At the discretion of the Board’s Compensation and Nominating Committee (the “Compensation Committee”), incentive awards, the value of which are based on Common Shares, may be made to eligible employees, consultants and non-employee directors of the Company and its subsidiaries.
The Montpelier Re Holdings Ltd. 2012 Long-Term Incentive Plan (the “2012 LTIP”), which was approved by the Company’s shareholders in May 2012, permits the issuance of up to 4,700,000 Common Shares to selected Montpelier employees, non-employee directors and consultants. Incentive awards that may be granted under the 2012 LTIP consist of RSUs, restricted Common Shares, incentive share options (on a limited basis), non-qualified share options, share appreciation rights, deferred share units, performance compensation awards, performance units, cash incentive awards and other equity-based awards. During each of the years presented herein, Montpelier’s share-based incentive awards consisted solely of RSUs.
RSUs are phantom (as opposed to actual) Common Shares which, depending on the individual award, vest in equal tranches over a one to five-year period, subject to the recipient maintaining a continuous relationship with Montpelier through the applicable vesting date. RSUs are payable in Common Shares upon vesting (the amount of which may be reduced by applicable statutory income tax withholdings at the recipient’s option). RSUs do not require the payment of an exercise price and are not entitled to voting rights, but they are entitled to receive payments equivalent to any dividends and distributions declared on the Common Shares underlying the RSUs.
The Company currently uses variable RSUs (“Variable RSUs”) as the principal component of its ongoing long-term incentive compensation for participating employees. Variable RSUs are awarded based on Company performance during the first year of the applicable performance period (the “Initial RSU Period”) and are earned ratably each year based on continued employment over a four year vesting period. Since the number of RSUs to be awarded is dependent upon Company performance during the Initial RSU Period, the number of RSUs estimated to be awarded for that cycle may fluctuate throughout the Initial RSU Period.
The number of Variable RSUs expected to be formally awarded to employees is subject to the Company’s increase in its fully converted book value per Common Share (“FCBVPCS”). FCBVPCS is computed by dividing the Company’s common shareholders’ equity available to the Company by the sum of its ending Common Shares and unvested RSUs outstanding. The Company’s calculation of the growth in FCBVPCS represents the increase in its FCBVPCS during the Initial RSU Period, after taking into account dividends on Common Shares declared during such period.
The Company also uses fixed RSUs (“Fixed RSUs”) as a supplemental component of its ongoing long-term incentive compensation for certain employees and its non-employee directors. Unlike Variable RSUs, the number of Fixed RSUs is fixed on the grant date. Fixed RSUs are typically granted for the following purposes: (i) to induce individuals to join Montpelier; (ii) to retain certain key employees; (iii) to reward employees for exhibiting outstanding individual performance; and (iv) as remuneration to non-management members of the Board. Additionally, when the actual number of Variable RSUs to be awarded in any given year has been formally determined, they are effectively converted into Fixed RSUs.
F-30
Table of Contents
As of December 31, 2014, the Company’s Variable RSUs outstanding consisted of those for the 2014-2017 cycle. The number of Variable RSUs to be awarded for this cycle will be determined based on the Company’s actual 2014 increase in its FCBVPCS versus a target increase in FCBVPCS of 10.0% (“Target”). If Target is achieved, the Company would expect to grant 494,340 Variable RSUs to participants. At an increase in FCBVPCS of 3.0% or less (“Threshold”), the Company would not expect to grant any Variable RSUs to participants, and at an increase in FCBVPCS of 17.0% or more (“Maximum”), the Company would expect to grant 988,680 Variable RSUs to participants.
The following table summarizes the Company's RSU activity for the years ended December 31, 2014, 2013 and 2012:
|
|
|
Year Ended December 31, |
|
|
|
|
2014 |
|
2013 |
|
2012 |
|
|
|
|
RSUs
Outstanding |
|
Unamortized
Grant Date
Fair Value |
|
RSUs
Outstanding |
|
Unamortized
Grant Date
Fair Value |
|
RSUs
Outstanding |
|
Unamortized
Grant Date
Fair Value |
|
|
Beginning of period |
|
1,448,374 |
|
$ |
12.2 |
|
1,327,041 |
|
$ |
10.3 |
|
761,279 |
|
$ |
4.7 |
|
|
Fixed RSUs Awarded |
|
49,000 |
|
1.5 |
|
35,000 |
|
0.8 |
|
50,700 |
|
1.1 |
|
|
Variable RSUs, 2014-2017 cycle: |
|
|
|
|
|
|
|
|
|
|
|
|
|
|
RSUs projected to be awarded |
|
850,262 |
|
23.2 |
|
— |
|
— |
|
— |
|
— |
|
|
Variable RSUs, 2013-2016 cycle: |
|
|
|
|
|
|
|
|
|
|
|
|
|
|
RSUs projected to be awarded |
|
— |
|
— |
|
900,800 |
|
19.4 |
|
— |
|
— |
|
|
RSU payout adjustments |
|
(17,263 |
) |
(0.3 |
) |
— |
|
— |
|
— |
|
— |
|
|
Variable RSUs, 2012-2015 cycle: |
|
|
|
|
|
|
|
|
|
|
|
|
|
|
RSUs projected to be awarded |
|
— |
|
— |
|
— |
|
— |
|
1,058,304 |
|
17.6 |
|
|
RSU payments |
|
(751,568 |
) |
— |
|
(791,716 |
) |
— |
|
(476,426 |
) |
— |
|
|
RSU forfeitures |
|
(58,041 |
) |
0.2 |
|
(22,751 |
) |
(0.3 |
) |
(66,816 |
) |
(1.0 |
) |
|
RSU expense recognized |
|
— |
|
(19.8 |
) |
— |
|
(18.0 |
) |
— |
|
(12.1 |
) |
|
End of period |
|
1,520,764 |
|
$ |
17.0 |
|
1,448,374 |
|
$ |
12.2 |
|
1,327,041 |
|
$ |
10.3 |
|
RSU Awards and Payments - 2014 Awards and Payouts
During 2014 the Company awarded a total of 49,000 Fixed RSUs to its non-management directors and certain employees. Of the total Fixed RSUs awarded during that year, 30,000 RSUs were awarded for a one-year cycle, 4,000 RSUs were awarded for a two-year cycle, 11,000 RSUs were awarded for a three-year cycle and 4,000 RSUs were awarded for a five-year cycle.
On the basis of the Company’s preliminary determination of its increase in FCBVPCS achieved during 2014, the Company anticipated issuing 850,262 Variable RSUs for the 2014-2017 award cycle as of December 31, 2014, or 172% of the in force Target RSUs for that cycle at that time. The actual number of Variable RSUs to be awarded for the 2014-2017 cycle will be formally determined by the Compensation Committee on February 26, 2015.
During 2014 the Company paid out 751,568 vested RSUs and withheld, at the recipient’s election, 196,194 RSUs in satisfaction of statutory income tax liabilities. As a result, the Company issued 555,374 Common Shares from its treasury throughout the year. See Note 8. The fair value of the RSUs paid out during 2014 was $24.3 million.
RSU Awards and Payments - 2013 Awards and Payouts
During 2013 the Company awarded 35,000 Fixed RSUs to its non-management directors and certain employees. Of the total Fixed RSUs awarded during the year, 18,000 RSUs represented annual one-year Fixed RSU awards to directors, 12,000 RSUs represented one-time three-year Fixed RSU awards to two newly-appointed directors and 5,000 RSUs represented an annual one-year Fixed RSU award to Mr. Harris pursuant to his new service agreement, which was approved by the Board in May 2013.
On the basis of the Company’s preliminary determination of its increase in FCBVPCS achieved during 2013, the Company anticipated awarding 900,800 Variable RSUs for the 2013-2016 award cycle at December 31, 2013, or 170% of the in force target RSUs for that cycle at that time. Based on actual 2013 results achieved, and as formally approved by the Compensation Committee in February 2014, the actual number of Variable RSUs awarded for the 2013-2016 cycle was reduced during the first quarter of 2014 by 17,263 RSUs in order to fix the number of Variable RSUs awarded to be 883,537 RSUs, or 166% of the in force target RSUs for that cycle.
F-31
Table of Contents
During 2013 the Company paid out 791,716 vested RSUs and withheld, at the recipient’s election, 196,695 RSUs in satisfaction of statutory income tax liabilities. As a result, the Company issued 595,021 Common Shares from its treasury throughout the year. See Note 8. The fair value of the RSUs paid out during 2013 was $21.5 million.
RSU Awards and Payments - 2012 Awards and Payouts
During 2012 the Company awarded 50,700 Fixed RSUs to its non-management directors and certain employees. Of the total Fixed RSUs awarded during the year, 18,000 RSUs represented annual one-year Fixed RSU awards to directors, 6,000 RSUs represented a one-time three-year Fixed RSU award to a newly-appointed director, 16,200 RSUs represented four-year Fixed RSU awards to employees and 10,500 RSUs represented five-year Fixed RSU awards to employees.
On the basis of the Company’s preliminary determination of its increase in FCBVPCS achieved during 2012, the Company anticipated awarding 1,058,304 Variable RSUs for the 2012-2015 award cycle at December 31, 2012, or 200% of the in force target RSUs for that cycle at that time. The actual number of Variable RSUs awarded for the 2012-2015 cycle was formally determined to be 1,058,304 by the Compensation Committee in February 2013.
During 2012 the Company paid out 476,426 vested RSUs and withheld, at the recipient’s election, 89,321 RSUs in satisfaction of statutory income tax liabilities. As a result, the Company issued 387,105 Common Shares from its treasury throughout the year. See Note 8. The fair value of the RSUs paid out during 2012 was $10.3 million.
RSU Forfeitures, Forfeiture Assumptions and Other RSU Adjustments
For the years presented, the Company assumed a zero to 8.8% forfeiture rate depending on the nature and term of individual awards and past experience. The Company’s forfeiture assumptions serve to reduce the unamortized grant date fair value of outstanding RSUs as well as the associated RSU expense. As RSUs are actually forfeited, the number of RSUs outstanding is reduced and the remaining unamortized grant date fair value is compared to assumed forfeiture levels. True-up adjustments are made as deemed necessary.
The Company revises its expected RSU forfeiture assumptions in light of actual forfeitures experienced. As a result, the Company increased (reduced) the unamortized grant date fair value of its RSUs outstanding during the years ended December 31, 2014, 2013 and 2012 by $0.2 million, $(0.3) million and $(1.0) million, respectively.
In connection with the planned retirement of Mr. Busher on December 31, 2013, the Company agreed to accelerate the vesting of certain of his RSU awards. See Note 14. The acceleration of the vesting of Mr. Busher’s outstanding RSUs awards resulted in the Company recognizing an additional $1.7 million of RSU expense in 2013 which would have otherwise been recognized in future periods.
RSUs Outstanding at December 31, 2014
The following table summarizes all RSUs outstanding and the unamortized grant date fair value of such RSUs at December 31, 2014 for each award cycle:
|
|
|
RSUs
Outstanding |
|
Unamortized
Grant Date
Fair Value |
|
|
Award Date and Cycle |
|
|
|
|
|
|
Five-year RSU awards granted in 2011 |
|
14,000 |
|
— |
|
|
Three-year RSU awards granted in 2012 |
|
2,000 |
|
— |
|
|
Four-year RSU awards granted in 2012 |
|
224,103 |
|
1.3 |
|
|
Five-year RSU awards granted in 2012 |
|
6,300 |
|
— |
|
|
Three-year RSU awards granted in 2013 |
|
8,000 |
|
0.1 |
|
|
Four-year RSU awards granted in 2013 |
|
377,932 |
|
3.7 |
|
|
One-year RSU awards granted in 2014 |
|
22,500 |
|
0.3 |
|
|
Two-year RSU awards granted in 2014 |
|
4,000 |
|
0.1 |
|
|
Three-year RSU awards granted in 2014 |
|
7,667 |
|
0.1 |
|
|
Four-year RSU awards granted in 2014 (those awards in their Initial Award Period) |
|
850,262 |
|
11.3 |
|
|
Five-year RSU awards granted in 2014 |
|
4,000 |
|
0.1 |
|
|
|
|
|
|
|
|
|
Total RSUs outstanding at December 31, 2014 |
|
1,520,764 |
|
$ |
17.0 |
|
|
|
|
|
|
|
|
The Company expects to incur future RSU expense associated with its currently outstanding RSUs of $10.7 million, $4.8 million and $1.5 million during 2015, 2016 and 2017 & beyond, respectively.
F-32
Table of Contents
NOTE 10. Income Taxes
The Company is domiciled in Bermuda and has subsidiaries domiciled in several countries, primarily Bermuda, the U.K. and the U.S. The Company, BCRH, Montpelier Re, Blue Water Re, Blue Capital Re and Blue Capital Re ILS intend to conduct substantially all of their operations in Bermuda in a manner such that it is improbable that they would be subject to direct taxation in the U.K. or the U.S. However, because there is no definitive authority regarding activities that constitute taxable activities in the U.K. or the U.S., there can be no assurance that those jurisdictions will not contend, perhaps successfully, that the Company, BCRH, Montpelier Re, Blue Water Re, Blue Capital Re and/or Blue Capital Re ILS is engaged in a trade or business in the U.S. and is therefore subject to taxation. In that event, those entities would be subject to U.K. income taxes, or U.S. income and branch profits taxes, on income that is connected with or attributable to such activities unless the corporation is entitled to relief under an applicable tax treaty.
Montpelier has subsidiaries domiciled in the U.K. and the U.S. which are subject to the respective foreign and/or federal income taxes in those jurisdictions. The Company’s U.S.- domiciled subsidiaries are also subject to state and local income taxes. The provision for U.S. federal income taxes has been determined under the principles of the consolidated tax provisions of the U.S. Internal Revenue Code and Regulations.
The Company has no current intention, or liquidity need, to repatriate any earnings from its U.K. and U.S. operations to Bermuda. Additionally, the Company’s current structure is such that any distributions of earnings from its subsidiaries outside of Bermuda would not subject Montpelier to a significant amount of incremental taxation.
Bermuda
The Company and its Bermuda-domiciled subsidiaries have received an assurance from the Bermuda government exempting them from all local income, withholding and capital gains taxes until March 31, 2035. At the present time, no such taxes are levied in Bermuda.
U.K.
MAL, MUSL, MCL and their parent, Montpelier Holdings Limited, are subject to U.K. income taxes. Of these U.K. entities, only MCL remained in a cumulative net operating loss position at December 31, 2014. The cumulative net operating loss associated with MCL’s operations may be carried forward to offset future taxable income generated by that entity and do not expire with time.
The pretax income associated with any of these U.K. entities is generally taxable to Montpelier unless: (i) that entity has prior year net operating losses that may be utilized to fully or partially offset its current income tax liability; or (ii) another entity within Montpelier’s U.K. group of companies experiences a current year pretax loss which is eligible to be used to fully or partially offset any other entity’s current income tax liability (“Group Relief”).
During the years ended December 31, 2014 and 2012, each of the entities within Montpelier’s U.K. group of companies generated taxable income so Montpelier was unable to utilize Group Relief to offset its U.K. net current income tax liabilities in those years. During 2013 Montpelier was able to utilize a combination of net operating losses and Group Relief to partially offset its U.K. net current income liabilities for that year.
The U.K. statutory corporate income tax rate applicable to Montpelier’s U.K. entities was 21%, 23% and 24% with respect to the years ended December 31, 2014, 2013 and 2012, respectively. The U.K. has legislated a 20% statutory corporate income tax rate applicable to Montpelier’s U.K. entities for 2015 and future tax years.
The tax years open to examination by the HM Revenue & Customs for Montpelier’s U.K. entities are from 2013 to present and no examinations are currently pending. HM Revenue & Customs may open an inquiry up to the later of twelve months after the statutory filing date or the date the return was filed. Each of Montpelier’s U.K. entities has filed its respective U.K. income tax returns on a timely basis since its inception.
United States
MUI, MTR, Cladium and their parent, MRUSHL, are subject to federal, state and local corporate income taxes and other taxes applicable to U.S. corporations and are currently in a cumulative net operating loss position. The net operating losses associated with these operations may be carried forward to offset future taxable income in that jurisdiction and will begin to expire in 2027. The provision for U.S. federal income taxes associated with Montpelier’s U.S. operations has been determined under the principles of a consolidated tax provision within the U.S. Internal Revenue Code and Regulations.
F-33
Table of Contents
The U.S. Federal statutory corporate income tax rate applicable to Montpelier’s U.S. entities was 35% with respect to each of the years ended December 31, 2014, 2013 and 2012.
The tax years open to examination by the Internal Revenue Service for Montpelier’s U.S. subsidiaries are from 2012 to present and no examinations are currently pending. The Internal Revenue Service may open an inquiry up to the later of three years after the statutory filing date or the date the return was filed. During 2014, the IRS conducted an examination of the 2011 tax year. There were no material changes to the return or to the tax assets reported as a result of that examination. Each of Montpelier’s U.S. entities has filed its U.S. income tax returns on a timely basis since its inception, inclusive of permitted automatic filing extensions.
Montpelier’s consolidated income tax provision (benefit) for the years ended December 31, 2014, 2013 and 2012 consisted of the following:
|
|
|
Year Ended December 31, |
|
|
|
|
2014 |
|
2013 |
|
2012 |
|
|
Current tax provision: |
|
|
|
|
|
|
|
|
Bermuda |
|
$ |
— |
|
$ |
— |
|
$ |
— |
|
|
U.K. |
|
1.9 |
|
(0.4 |
) |
0.7 |
|
|
U.S. Federal and state |
|
0.1 |
|
0.1 |
|
0.1 |
|
|
Current tax provision (benefit) |
|
$ |
2.0 |
|
$ |
(0.3 |
) |
$ |
0.8 |
|
|
|
|
|
|
|
|
|
|
|
Deferred tax benefit: |
|
|
|
|
|
|
|
|
Bermuda |
|
$ |
— |
|
$ |
— |
|
$ |
— |
|
|
U.K. |
|
(4.7 |
) |
0.2 |
|
(0.5 |
) |
|
U.S. Federal and state |
|
— |
|
— |
|
— |
|
|
Deferred tax provision (benefit) |
|
$ |
(4.7 |
) |
$ |
0.2 |
|
$ |
(0.5 |
) |
|
|
|
|
|
|
|
|
|
|
Total income tax provision (benefit) |
|
$ |
(2.7 |
) |
$ |
(0.1 |
) |
$ |
0.3 |
|
Deferred income taxes reflect the net tax effects of temporary differences between the carrying amounts of assets and liabilities for financial reporting purposes and the amounts for tax purposes.
A breakdown of the significant components of Montpelier’s deferred tax assets and liabilities at December 31, 2014 and 2013 follows:
|
|
|
December 31, |
|
|
|
|
2014 |
|
2013 |
|
|
Deferred tax assets: |
|
|
|
|
|
|
U.S. net operating loss carryforwards |
|
$ |
12.7 |
|
$ |
12.7 |
|
|
Non-U.S. net operating loss carryforwards |
|
6.7 |
|
3.1 |
|
|
Share-based compensation |
|
2.1 |
|
2.7 |
|
|
Other items |
|
1.1 |
|
1.2 |
|
|
Total gross deferred tax assets |
|
22.6 |
|
19.7 |
|
|
Less: deferred tax asset valuation allowance |
|
(15.6 |
) |
(19.2 |
) |
|
Total recognized deferred tax assets |
|
$ |
7.0 |
|
$ |
0.5 |
|
|
Deferred tax liabilities - Deferred profit of Syndicate 5151 |
|
$ |
1.8 |
|
$ |
— |
|
|
Net deferred tax asset (included in other assets) |
|
$ |
5.2 |
|
$ |
0.5 |
|
Montpelier’s net deferred tax assets of $5.2 million and $0.5 million at December 31, 2014 and 2013, respectively, related entirely to its U.K. entities.
Montpelier records a valuation allowance against its deferred tax assets if it becomes more likely than not that all or a portion of a deferred tax asset will not be realized. Changes in valuation allowances from period to period represent an income tax benefit or provision within the period of change. In determining whether or not a valuation allowance, or a change in valuation allowance, is warranted, Montpelier considers such factors as prior taxable earnings history, expected taxable future earnings, the expiration date of remaining net operating loss carryforwards and any tax strategies that, if executed, would result in the realization of a deferred tax asset.
F-34
Table of Contents
The deferred tax asset valuation allowance established at December 31, 2014 primarily reflects the inception-to-date losses incurred by Montpelier’s U.S. operations and the uncertainty at this time of whether such operations will generate sufficient taxable income in future periods to utilize their deferred tax asset balances.
The deferred tax asset valuation allowance established at December 31, 2013 reflects the inception-to-date losses incurred by Montpelier’s U.K. and U.S. operations and the uncertainty at that time of whether such operations would generate sufficient taxable income in future periods to utilize their deferred tax asset balances.
During the year ended December 31, 2014, Montpelier released its remaining U.K. deferred tax asset valuation allowance in light of: (i) the expected future taxable earnings of its U.K. entities; and (ii) the fact that its U.K. net operating loss carryforwards do not expire. The release of these U.K. deferred tax valuation allowances resulted in the recognition of a $2.9 million income tax benefit during 2014.
A reconciliation of actual income taxes to the amount calculated using Bermuda’s income tax rate of zero is as follows:
|
|
|
Year Ended December 31, |
|
|
|
|
2014 |
|
2013 |
|
2012 |
|
|
Income before income taxes |
|
$ |
245.3 |
|
$ |
210.5 |
|
$ |
227.9 |
|
|
|
|
|
|
|
|
|
|
|
Income taxes at the expected income tax rate of Bermuda |
|
$ |
— |
|
$ |
— |
|
$ |
— |
|
|
|
|
|
|
|
|
|
|
|
Foreign tax provision (benefit) at actual rates: |
|
|
|
|
|
|
|
|
U.K. |
|
$ |
(2.8 |
) |
$ |
(0.2 |
) |
$ |
0.2 |
|
|
U.S. |
|
0.1 |
|
0.1 |
|
0.1 |
|
|
|
|
|
|
|
|
|
|
|
Total income tax provision (benefit) |
|
$ |
(2.7 |
) |
$ |
(0.1 |
) |
$ |
0.3 |
|
|
|
|
|
|
|
|
|
|
|
Effective income tax rate |
|
(1.1 |
)% |
— |
% |
0.1 |
% |
The components of the Company’s income (loss) before income taxes were as follows:
|
|
|
Year Ended December 31, |
|
|
|
|
2014 |
|
2013 |
|
2012 |
|
|
Domestic: |
|
|
|
|
|
|
|
|
Bermuda |
|
$ |
246.7 |
|
$ |
205.3 |
|
$ |
232.2 |
|
|
|
|
|
|
|
|
|
|
|
Foreign: |
|
|
|
|
|
|
|
|
U.K. |
|
(2.8 |
) |
4.6 |
|
(4.4 |
) |
|
U.S. |
|
1.4 |
|
0.6 |
|
0.1 |
|
|
|
|
|
|
|
|
|
|
|
Income before income taxes |
|
$ |
245.3 |
|
$ |
210.5 |
|
$ |
227.9 |
|
During the years ended December 31, 2014, 2013 and 2012, Montpelier paid total income taxes of $0.5 million, $0.5 million and $0.1 million, respectively.
Montpelier currently believes that it has no uncertain tax positions which, if challenged on technical merits, would cause a material effect on the Company’s consolidated financial statements.
NOTE 11. Fair Value of Financial Instruments
GAAP requires disclosure of fair value information for certain financial instruments. For those financial instruments in which quoted market prices are not available, fair values are estimated by discounting future cash flows using current market rates or quoted market prices for similar obligations. Because considerable judgment is used, these estimates are not necessarily indicative of amounts that could be realized in a current market exchange. Montpelier carries its assets and liabilities that constitute financial instruments on its Consolidated Balance Sheets at fair value with the exception of its debt and its other investments carried at net asset value.
At December 31, 2014, the fair value of the 2022 Senior Notes (based on quoted market prices, which represent Level 2 inputs) was $306.3 million, which compared to a carrying value of $299.3 million. At December 31, 2013, the fair value of the 2022 Senior Notes (based on quoted market prices, which represent Level 2 inputs) was $303.2 million, which compared to a carrying value of $299.2 million.
F-35
Table of Contents
At December 31, 2014, the fair value of the Trust Preferred Securities (based on quoted market prices, which represent Level 2 inputs) was $92.0 million, which compared to a carrying value of $100.0 million. At December 31, 2013, the fair value of the Trust Preferred Securities (based on quoted market prices, which represent Level 2 inputs) was $89.5 million, which compared to a carrying value of $100.0 million. See Note 6.
At December 31, 2014, the fair value of BCRH’s outstanding borrowings under the BCRH Credit Agreement, which must be repaid in early 2015, approximated their carrying value of $8.0 million. See Note 6.
At December 31, 2014 and 2013, the fair value and net asset value of Montpelier’s other investments carried on the Company’s balance sheets were approximately the same. See Note 5.
NOTE 12. Segment Reporting
The Company currently operates through three reportable segments: Montpelier Bermuda, Montpelier at Lloyd’s, and Collateralized Reinsurance. Each segment constitutes a separate underwriting platform through which Montpelier writes insurance and reinsurance business. The Company’s segment disclosures present the operations of these underwriting platforms prior to the effects of certain inter-segment quota share reinsurance agreements among them.
The Company has made its segment determination based on consideration of the following criteria: (i) the nature of the business activities of each of the Company’s subsidiaries and affiliates; (ii) the manner in which the Company’s subsidiaries and affiliates are organized; and (iii) the organization of information provided to the Board and senior management.
The Company and certain intermediate holding and service companies, intercompany eliminations relating to inter- segment reinsurance agreements and the MUSIC Run-Off business are collectively referred to as “Corporate and Other.”
The following table summarizes Montpelier’s identifiable assets by segment as of December 31, 2014 and 2013:
|
|
|
December 31,
2014 |
|
December 31,
2013 |
|
|
|
|
|
|
|
|
|
Montpelier Bermuda |
|
$ |
2,550.0 |
|
$ |
2,773.9 |
|
|
Montpelier at Lloyd’s |
|
573.5 |
|
543.4 |
|
|
Collateralized Reinsurance |
|
476.1 |
|
394.4 |
|
|
Corporate and Other, including inter-segment eliminations |
|
29.5 |
|
46.8 |
|
|
|
|
|
|
|
|
|
Total assets |
|
$ |
3,629.1 |
|
$ |
3,758.5 |
|
A summary of Montpelier’s Consolidated Statements of Operations by segment for the years ended December 31, 2014, 2013 and 2012 follows:
|
Year Ended December 31, 2014 |
|
Montpelier
Bermuda |
|
Montpelier at
Lloyd’s |
|
Collateralized
Reinsurance |
|
Corporate
and Other |
|
Total |
|
|
|
|
|
|
|
|
|
|
|
|
|
|
|
Gross premiums written |
|
$ |
416.4 |
|
$ |
273.0 |
|
$ |
83.4 |
|
$ |
(32.5 |
) |
$ |
740.3 |
|
|
Ceded reinsurance premiums |
|
(102.1 |
) |
(19.7 |
) |
— |
|
32.4 |
|
(89.4 |
) |
|
Net premiums written |
|
314.3 |
|
253.3 |
|
83.4 |
|
(0.1 |
) |
650.9 |
|
|
Change in net unearned premiums |
|
1.6 |
|
(8.5 |
) |
1.2 |
|
— |
|
(5.7 |
) |
|
Net premiums earned |
|
315.9 |
|
244.8 |
|
84.6 |
|
(0.1 |
) |
645.2 |
|
|
|
|
|
|
|
|
|
|
|
|
|
|
|
Loss and LAE |
|
(23.0 |
) |
(142.3 |
) |
(23.2 |
) |
(1.1 |
) |
(189.6 |
) |
|
Acquisition costs |
|
(37.1 |
) |
(59.9 |
) |
(13.2 |
) |
— |
|
(110.2 |
) |
|
General and administrative expenses |
|
(38.7 |
) |
(39.8 |
) |
(7.3 |
) |
(37.9 |
) |
(123.7 |
) |
|
Underwriting income |
|
217.1 |
|
2.8 |
|
40.9 |
|
(39.1 |
) |
221.7 |
|
|
Net investment income |
|
40.6 |
|
4.5 |
|
0.2 |
|
1.5 |
|
46.8 |
|
|
Other revenues |
|
0.1 |
|
— |
|
— |
|
2.8 |
|
2.9 |
|
|
Net investment and foreign currency gains |
|
(2.8 |
) |
17.0 |
|
0.1 |
|
0.5 |
|
14.8 |
|
|
Net losses from derivative instruments |
|
(17.4 |
) |
(0.2 |
) |
(0.4 |
) |
(0.6 |
) |
(18.6 |
) |
|
Interest and other financing expenses |
|
(0.2 |
) |
(0.1 |
) |
— |
|
(18.6 |
) |
(18.9 |
) |
|
Other expenses |
|
(0.8 |
) |
— |
|
(0.2 |
) |
(2.4 |
) |
(3.4 |
) |
|
Income before income taxes |
|
$ |
236.6 |
|
$ |
24.0 |
|
$ |
40.6 |
|
$ |
(55.9 |
) |
$ |
245.3 |
|
F-36
Table of Contents
|
Year Ended December 31, 2013 |
|
Montpelier
Bermuda |
|
Montpelier at
Lloyd’s |
|
Collateralized
Reinsurance |
|
Corporate
and Other |
|
Total |
|
|
|
|
|
|
|
|
|
|
|
|
|
|
|
Gross premiums written |
|
$ |
429.4 |
|
$ |
235.2 |
|
$ |
39.8 |
|
$ |
1.6 |
|
$ |
706.0 |
|
|
Ceded reinsurance premiums |
|
(75.8 |
) |
(23.0 |
) |
(3.0 |
) |
(1.1 |
) |
(102.9 |
) |
|
Net premiums written |
|
353.6 |
|
212.2 |
|
36.8 |
|
0.5 |
|
603.1 |
|
|
Change in net unearned premiums |
|
5.6 |
|
1.5 |
|
(10.6 |
) |
— |
|
(3.5 |
) |
|
Net premiums earned |
|
359.2 |
|
213.7 |
|
26.2 |
|
0.5 |
|
599.6 |
|
|
|
|
|
|
|
|
|
|
|
|
|
|
|
Loss and LAE |
|
(17.0 |
) |
(105.9 |
) |
(2.2 |
) |
(1.4 |
) |
(126.5 |
) |
|
Acquisition costs |
|
(34.4 |
) |
(52.6 |
) |
(3.2 |
) |
(0.3 |
) |
(90.5 |
) |
|
General and administrative expenses |
|
(39.3 |
) |
(36.5 |
) |
(3.5 |
) |
(39.9 |
) |
(119.2 |
) |
|
Underwriting income |
|
268.5 |
|
18.7 |
|
17.3 |
|
(41.1 |
) |
263.4 |
|
|
Net investment income |
|
57.7 |
|
5.4 |
|
— |
|
0.9 |
|
64.0 |
|
|
Other revenues |
|
0.1 |
|
— |
|
0.6 |
|
(0.3 |
) |
0.4 |
|
|
Net investment and foreign currency losses |
|
(52.7 |
) |
(10.2 |
) |
— |
|
(2.2 |
) |
(65.1 |
) |
|
Net losses from derivative instruments |
|
(27.0 |
) |
1.8 |
|
(0.5 |
) |
0.4 |
|
(25.3 |
) |
|
Interest and other financing expenses |
|
(0.2 |
) |
— |
|
— |
|
(18.6 |
) |
(18.8 |
) |
|
Other expenses |
|
— |
|
— |
|
— |
|
(8.1 |
) |
(8.1 |
) |
|
Income before income taxes |
|
$ |
246.4 |
|
$ |
15.7 |
|
$ |
17.4 |
|
$ |
(69.0 |
) |
$ |
210.5 |
|
|
Year Ended December 31, 2012 |
|
Montpelier
Bermuda |
|
Montpelier at
Lloyd’s |
|
Collateralized
Reinsurance |
|
Corporate
and Other |
|
Total |
|
|
|
|
|
|
|
|
|
|
|
|
|
|
|
Gross premiums written |
|
$ |
480.5 |
|
$ |
246.0 |
|
$ |
2.4 |
|
$ |
6.4 |
|
$ |
735.3 |
|
|
Ceded reinsurance premiums |
|
(99.8 |
) |
(15.9 |
) |
— |
|
(3.9 |
) |
(119.6 |
) |
|
Net premiums written |
|
380.7 |
|
230.1 |
|
2.4 |
|
2.5 |
|
615.7 |
|
|
Change in net unearned premiums |
|
(11.2 |
) |
(12.8 |
) |
— |
|
24.8 |
|
0.8 |
|
|
Net premiums earned |
|
369.5 |
|
217.3 |
|
2.4 |
|
27.3 |
|
616.5 |
|
|
|
|
|
|
|
|
|
|
|
|
|
|
|
Loss and LAE |
|
(159.5 |
) |
(107.6 |
) |
— |
|
(19.3 |
) |
(286.4 |
) |
|
Acquisition costs |
|
(40.5 |
) |
(46.6 |
) |
(0.1 |
) |
(9.4 |
) |
(96.6 |
) |
|
General and administrative expenses |
|
(44.2 |
) |
(38.2 |
) |
(1.7 |
) |
(32.1 |
) |
(116.2 |
) |
|
Underwriting income |
|
125.3 |
|
24.9 |
|
0.6 |
|
(33.5 |
) |
117.3 |
|
|
Net investment income |
|
63.2 |
|
2.9 |
|
— |
|
1.0 |
|
67.1 |
|
|
Other revenues |
|
0.2 |
|
0.6 |
|
— |
|
— |
|
0.8 |
|
|
Net investment and foreign currency gains |
|
84.8 |
|
(15.0 |
) |
— |
|
(0.2 |
) |
69.6 |
|
|
Net income from derivative instruments |
|
1.8 |
|
3.0 |
|
— |
|
(1.6 |
) |
3.2 |
|
|
Interest and other financing expenses |
|
(0.8 |
) |
(1.9 |
) |
— |
|
(17.7 |
) |
(20.4 |
) |
|
Other expenses |
|
— |
|
— |
|
— |
|
(9.7 |
) |
(9.7 |
) |
|
Income before income taxes |
|
$ |
274.5 |
|
$ |
14.5 |
|
$ |
0.6 |
|
$ |
(61.7 |
) |
$ |
227.9 |
|
F-37
Table of Contents
Gross Written Premiums By Line of Business and Geography
The following tables present Montpelier’s gross premiums written, by line of business and reportable segment, during the years ended December 31, 2014, 2013 and 2012:
|
Year Ended December 31, 2014 |
|
Montpelier
Bermuda |
|
Montpelier
at Lloyd’s |
|
Collateralized
Reinsurance |
|
Corporate and
Other (1) |
|
Total |
|
|
|
|
|
|
|
|
|
|
|
|
|
|
|
Property Catastrophe - Treaty |
|
$ |
256.1 |
|
$ |
3.4 |
|
$ |
83.4 |
|
$ |
(31.9 |
) |
$ |
311.0 |
|
|
Property Specialty - Treaty |
|
54.0 |
|
3.8 |
|
— |
|
— |
|
57.8 |
|
|
Other Specialty - Treaty |
|
76.4 |
|
93.2 |
|
— |
|
(0.5 |
) |
169.1 |
|
|
Property and Specialty Individual Risk |
|
29.9 |
|
172.6 |
|
— |
|
(0.1 |
) |
202.4 |
|
|
Total gross premiums written |
|
$ |
416.4 |
|
$ |
273.0 |
|
$ |
83.4 |
|
$ |
(32.5 |
) |
$ |
740.3 |
|
|
|
|
Montpelier |
|
Montpelier |
|
Collateralized |
|
Corporate and |
|
|
|
|
Year Ended December 31, 2013 |
|
Bermuda |
|
at Lloyd’s |
|
Reinsurance |
|
Other (1) |
|
Total |
|
|
|
|
|
|
|
|
|
|
|
|
|
|
|
Property Catastrophe - Treaty |
|
$ |
279.0 |
|
$ |
4.7 |
|
$ |
39.8 |
|
$ |
1.0 |
|
$ |
324.5 |
|
|
Property Specialty - Treaty |
|
50.3 |
|
4.3 |
|
— |
|
0.1 |
|
54.7 |
|
|
Other Specialty - Treaty |
|
68.7 |
|
78.3 |
|
— |
|
(0.1 |
) |
146.9 |
|
|
Property and Specialty Individual Risk |
|
31.4 |
|
147.9 |
|
— |
|
0.6 |
|
179.9 |
|
|
Total gross premiums written |
|
$ |
429.4 |
|
$ |
235.2 |
|
$ |
39.8 |
|
$ |
1.6 |
|
$ |
706.0 |
|
|
|
|
Montpelier |
|
Montpelier |
|
Collateralized |
|
Corporate and |
|
|
|
|
Year Ended December 31, 2012 |
|
Bermuda |
|
at Lloyd’s |
|
Reinsurance |
|
Other (1) |
|
Total |
|
|
|
|
|
|
|
|
|
|
|
|
|
|
|
Property Catastrophe - Treaty |
|
$ |
332.8 |
|
$ |
10.9 |
|
$ |
2.4 |
|
$ |
3.9 |
|
$ |
350.0 |
|
|
Property Specialty - Treaty |
|
47.5 |
|
6.1 |
|
— |
|
— |
|
53.6 |
|
|
Other Specialty - Treaty |
|
70.4 |
|
82.1 |
|
— |
|
— |
|
152.5 |
|
|
Property and Specialty Individual Risk |
|
29.8 |
|
146.9 |
|
— |
|
2.5 |
|
179.2 |
|
|
Total gross premiums written |
|
$ |
480.5 |
|
$ |
246.0 |
|
$ |
2.4 |
|
$ |
6.4 |
|
$ |
735.3 |
|
(1) Represents: (i) the elimination of inter-segment reinsurance arrangements between Montpelier Bermuda and Montpelier at Lloyd’s; and (ii) premiums written within the Company’s former MUSIC Run-Off segment.
Montpelier seeks to diversify its exposures across geographic zones around the world in order to obtain a prudent spread of risk. The spread of these exposures is also a function of market conditions and opportunities.
Montpelier monitors its geographic exposures on a company-wide basis, rather than by segment. The following table sets forth a breakdown of Montpelier’s gross premiums written by geographic area of risks insured:
|
|
|
Year Ended December 31, |
|
|
|
|
2014 |
|
2013 |
|
2012 |
|
|
U.S. and Canada |
|
$ |
344.6 |
|
47 |
% |
$ |
346.2 |
|
49 |
% |
$ |
351.7 |
|
48 |
% |
|
Worldwide (1) |
|
239.3 |
|
32 |
|
210.4 |
|
30 |
|
231.5 |
|
31 |
|
|
Western Europe, excluding the U.K. and Ireland |
|
34.6 |
|
5 |
|
31.9 |
|
4 |
|
30.7 |
|
4 |
|
|
Worldwide, excluding U.S. and Canada (2) |
|
26.9 |
|
4 |
|
33.8 |
|
5 |
|
23.1 |
|
3 |
|
|
Australia and Oceania |
|
26.8 |
|
4 |
|
20.4 |
|
3 |
|
23.4 |
|
3 |
|
|
U.K. and Ireland |
|
18.5 |
|
2 |
|
20.1 |
|
3 |
|
24.1 |
|
3 |
|
|
Japan |
|
16.8 |
|
2 |
|
22.1 |
|
3 |
|
27.5 |
|
4 |
|
|
Other |
|
32.8 |
|
4 |
|
21.1 |
|
3 |
|
23.3 |
|
4 |
|
|
Total gross premiums written |
|
$ |
740.3 |
|
100 |
% |
$ |
706.0 |
|
100 |
% |
$ |
735.3 |
|
100 |
% |
(1) “Worldwide” comprises insurance and reinsurance contracts that insure or reinsure risks in more than one geographic area and do not specifically exclude the U.S. and Canada.
(2) “Worldwide, excluding U.S. and Canada” comprises insurance and reinsurance contracts that insure or reinsure risks in more than one geographic area but specifically exclude the U.S. and Canada.
F-38
Table of Contents
Net Earned Premiums By Line of Business and Geography
The following tables present Montpelier’s net earned premiums, by line of business and reportable segment, during the years ended December 31, 2014, 2013 and 2012:
|
|
|
Montpelier |
|
Montpelier |
|
Collateralized |
|
Corporate and |
|
|
|
|
Year Ended December 31, 2014 |
|
Bermuda |
|
at Lloyd’s |
|
Reinsurance |
|
Other (1) |
|
Total |
|
|
|
|
|
|
|
|
|
|
|
|
|
|
|
Property Catastrophe - Treaty |
|
$ |
174.6 |
|
$ |
3.4 |
|
$ |
84.6 |
|
$ |
(0.3 |
) |
$ |
262.3 |
|
|
Property Specialty - Treaty |
|
55.5 |
|
3.8 |
|
— |
|
0.1 |
|
59.4 |
|
|
Other Specialty - Treaty |
|
64.0 |
|
92.2 |
|
— |
|
(0.2 |
) |
156.0 |
|
|
Property and Specialty Individual Risk |
|
21.8 |
|
145.4 |
|
— |
|
0.3 |
|
167.5 |
|
|
Total net earned premiums |
|
$ |
315.9 |
|
$ |
244.8 |
|
$ |
84.6 |
|
$ |
(0.1 |
) |
$ |
645.2 |
|
|
|
|
Montpelier |
|
Montpelier |
|
Collateralized |
|
Corporate and |
|
|
|
|
Year Ended December 31, 2013 |
|
Bermuda |
|
at Lloyd’s |
|
Reinsurance |
|
Other (1) |
|
Total |
|
|
|
|
|
|
|
|
|
|
|
|
|
|
|
Property Catastrophe - Treaty |
|
$ |
229.5 |
|
$ |
4.1 |
|
$ |
26.2 |
|
0.7 |
|
260.5 |
|
|
Property Specialty - Treaty |
|
47.3 |
|
5.1 |
|
— |
|
(0.3 |
) |
52.1 |
|
|
Other Specialty - Treaty |
|
59.6 |
|
83.0 |
|
— |
|
— |
|
142.6 |
|
|
Property and Specialty Individual Risk |
|
22.8 |
|
121.5 |
|
— |
|
0.1 |
|
144.4 |
|
|
Total net earned premiums |
|
$ |
359.2 |
|
$ |
213.7 |
|
$ |
26.2 |
|
0.5 |
|
599.6 |
|
|
|
|
Montpelier |
|
Montpelier |
|
Collateralized |
|
Corporate and |
|
|
|
|
Year Ended December 31, 2012 |
|
Bermuda |
|
at Lloyd’s |
|
Reinsurance |
|
Other (1) |
|
Total |
|
|
|
|
|
|
|
|
|
|
|
|
|
|
|
Property Catastrophe - Treaty |
|
$ |
235.4 |
|
$ |
11.6 |
|
$ |
2.4 |
|
$ |
0.2 |
|
$ |
249.6 |
|
|
Property Specialty - Treaty |
|
44.5 |
|
7.0 |
|
— |
|
— |
|
51.5 |
|
|
Other Specialty - Treaty |
|
63.7 |
|
79.2 |
|
— |
|
0.7 |
|
143.6 |
|
|
Property and Specialty Individual Risk |
|
25.9 |
|
119.5 |
|
— |
|
26.4 |
|
171.8 |
|
|
Total net earned premiums |
|
$ |
369.5 |
|
$ |
217.3 |
|
$ |
2.4 |
|
$ |
27.3 |
|
$ |
616.5 |
|
(1) Represents: (i) the elimination of inter-segment reinsurance arrangements between Montpelier Bermuda and Montpelier at Lloyd’s; and (ii) premiums earned within the Company’s former MUSIC Run-Off segment.
The following table sets forth a breakdown of Montpelier’s net earned premiums by geographic area of risks insured:
|
|
|
Year Ended December 31, |
|
|
|
|
2014 |
|
2013 |
|
2012 |
|
|
U.S. and Canada |
|
$ |
338.5 |
|
52 |
% |
$ |
328.6 |
|
55 |
% |
$ |
350.9 |
|
57 |
% |
|
Worldwide (1) |
|
166.5 |
|
26 |
|
124.1 |
|
21 |
|
123.0 |
|
20 |
|
|
Western Europe, excluding the U.K. and Ireland |
|
35.4 |
|
6 |
|
31.7 |
|
5 |
|
30.9 |
|
5 |
|
|
Worldwide, excluding U.S. and Canada (2) |
|
26.2 |
|
4 |
|
33.2 |
|
5 |
|
22.2 |
|
3 |
|
|
Australia and Oceania |
|
19.5 |
|
3 |
|
18.7 |
|
3 |
|
17.3 |
|
3 |
|
|
Japan |
|
19.4 |
|
3 |
|
22.6 |
|
4 |
|
26.2 |
|
4 |
|
|
U.K. and Ireland |
|
18.0 |
|
3 |
|
21.1 |
|
4 |
|
22.6 |
|
4 |
|
|
Other |
|
21.7 |
|
3 |
|
19.6 |
|
3 |
|
23.4 |
|
4 |
|
|
Total net earned premiums |
|
$ |
645.2 |
|
100 |
% |
$ |
599.6 |
|
100 |
% |
$ |
616.5 |
|
100 |
% |
(1) “Worldwide” comprises insurance and reinsurance contracts that insure or reinsure risks in more than one geographic area and do not specifically exclude the U.S. and Canada.
(2) “Worldwide, excluding U.S. and Canada” comprises insurance and reinsurance contracts that insure or reinsure risks in more than one geographic area but specifically exclude the U.S. and Canada.
F-39
Table of Contents
NOTE 13. Regulation and Capital Requirements
Insurance and reinsurance entities are highly regulated in most countries, although the degree and type of regulation varies significantly from one jurisdiction to another with reinsurers generally subject to less regulation than primary insurers. The Company, Montpelier Re, Blue Water Re, Blue Capital Re, Blue Capital Re ILS and BCML are regulated by the Bermuda Monetary Authority (the “BMA”). MAL is subject to regulation by the Prudential Regulation Authority (the “PRA”) and the Financial Conduct Authority (the “FCA”), each is a successor to the former U.K. Financial Services Authority. MAL and MCL are regulated by Lloyd’s. MUI is subject to approval by Lloyd’s as a Coverholder for Syndicate 5151.
Bermuda
Montpelier Re
Montpelier Re is registered under the Insurance Act 1978 of Bermuda and related regulations, as amended (the “Insurance Act”) as a Class 4 insurer. Under the Insurance Act, Class 4 insurers are required to annually prepare and file statutory and GAAP financial statements and a statutory financial return. The Insurance Act also requires Montpelier Re to maintain minimum levels of statutory net assets (“Statutory Capital and Surplus”), to maintain minimum liquidity ratios and to meet minimum solvency margins. Failure to meet such requirements may subject an entity to regulatory actions by the BMA. For all periods presented herein, Montpelier Re believes that it has satisfied these requirements.
The Bermuda risk-based regulatory capital adequacy and solvency requirements implemented with effect from December 31, 2008 (termed the Bermuda Solvency Capital Requirement or “BSCR”), provide a risk-based capital model as a tool to assist the BMA both in measuring risk and in determining appropriate levels of capitalization. The BSCR employs a standard mathematical model that correlates the risk underwritten by Bermuda insurers and reinsurers to the capital that is dedicated to their businesses. The framework that has been developed applies a standard measurement format to the risk associated with an insurer’s or reinsurer’s assets, liabilities and premiums, including a formula to take account of the catastrophe risk exposure. Montpelier Re is only required to supply its BSCR to the BMA annually, on or before April 30 of each year.
As of December 31, 2014 and 2013, Montpelier Re’s Statutory Capital and Surplus was $1,819.2 million and $1,844.7 million, respectively. The principal differences between Montpelier Re’s Statutory Capital and Surplus and its net assets determined in accordance with GAAP include statutory deductions for deferred acquisition costs, fixed assets and investment securities held in trust for the benefit of MCL through the Lloyd’s Capital Trust. Such differences totaled $237.3 million and $184.2 million at December 31, 2014 and 2013, respectively.
For the year ended December 31, 2013, Montpelier Re’s Statutory Capital and Surplus of $1,844.7 million comfortably exceeded its 2013 BSCR of $549.0 million. Montpelier Re expects that it will also comfortably satisfy this requirement for the year ended December 31, 2014, although its 2014 BSCR will not be completed and filed with the BMA until April 2015.
The Company will disclose Montpelier Re’s 2014 BSCR in its Form 10-Q for the quarterly period ended March 31, 2015.
Montpelier Re’s 2014, 2013 and 2012 statutory net income was $270.5 million, $298.4 million and $281.6 million, respectively.
Where an insurer or reinsurer believes that its own means of measuring risk and determining appropriate levels of capital better reflects the inherent risk of its business, it may apply to the BMA for approval to use its internal capital model in substitution for the BSCR model. Montpelier Re may apply to the BMA for approval to use its internal capital model in substitution for the BSCR model, but has not yet done so.
The Insurance Act limits the maximum amount of annual dividends and distributions that may be paid by Montpelier Re. The payment of dividends in any year which would exceed 25% of its prior year-end Statutory Capital and Surplus requires the approval of the BMA. Additionally, annual distributions that would result in a reduction of the prior year-end balance of statutory capital (defined as an insurer’s Statutory Capital and Surplus less its statutory earnings retained) by more than 15% also requires the approval of the BMA.
The Insurance Act also provides a minimum liquidity ratio and requires general business insurers and reinsurers to maintain the value of their relevant assets at not less than 75% of the amount of their relevant liabilities. Montpelier Re exceeded its minimum liquidity requirements at December 31, 2014 and 2013 by $1,663.4 million and $1,990.3 million, respectively.
F-40
Table of Contents
With respect to the year ended December 31, 2014, Montpelier Re had the ability to dividend up to $461.2 million to the Company without BMA approval of which $250.0 million was actually declared and paid. With respect to the year ended December 31, 2013, Montpelier Re had the ability to dividend up to $455.2 million to the Company without BMA approval of which $225.0 million was actually declared and paid.
Blue Water Re
Blue Water Re is registered with the BMA as a Special Purpose Insurer, meaning that its insurance and reinsurance contracts must be fully-collateralized and the parties to the transactions must be sophisticated. Special Purpose Insurers benefit from an expedited application process, less regulatory stringency and minimal capital and surplus requirements.
Blue Water Re is required to notify the BMA of each reinsurance contract it writes. Blue Water Re, however, is not required to prepare and file statutory financial statements or statutory financial returns annually with the BMA, although beginning December 31, 2014, Blue Water Re is required to prepare and file annual audited GAAP financial statements with the BMA.
Blue Water Re is not subject to the BMA’s BSCR requirements. However, the Insurance Act limits the maximum amount of annual dividends and distributions that may be paid by Blue Water Re. If Blue Water Re were to fail to meet its minimum solvency margin on the last day of any financial year, it would be prohibited from declaring or paying any dividends during the next financial year without the approval of the BMA.
There is no minimum solvency margin or liquidity ratio that must be maintained by Blue Water Re so long as the value of its GAAP assets exceed the value of its GAAP liabilities. As of December 31, 2014 and 2013, Blue Water Re’s assets exceeded the value of its liabilities by $238.2 million and $212.8 million, respectively.
As of December 31, 2014 and 2013, Blue Water Re had the ability to dividend up to $238.2 million and $212.8 million, respectively, to its parent without BMA approval.
Blue Water Re’s 2014, 2013 and 2012 net income (loss) was $29.1 million, $20.3 million and $(2.3) million, respectively, and it did not declare or pay any dividends during those years.
Blue Capital Re
Blue Capital Re is registered with the BMA as a Class 3A insurer. As a result of the approvals received from the BMA and the terms of Blue Capital Re’s business plan, Blue Capital Re’s reinsurance contracts must be fully-collateralized. While Blue Capital Re is not required to prepare and file statutory financial statements or statutory financial returns annually with the BMA, beginning December 31, 2014, Blue Capital Re is required to prepare and file annual audited GAAP financial statements with the BMA.
Blue Capital Re has received exemptions from the BMA’s BSCR requirements for 2014 and 2013. However, the Insurance Act limits the maximum amount of annual dividends and distributions that may be paid by Blue Capital Re and provides that the value of the assets of an insurer must exceed the value of its liabilities by an amount greater than its prescribed minimum solvency margin. If Blue Capital Re were to fail to meet its minimum solvency margin on the last day of any financial year, it would be prohibited from declaring or paying any dividends during the next financial year without the approval of the BMA. Blue Capital Re’s minimum solvency margin has been set by the BMA to be $1.0 million at all times, so long as: (i) Blue Capital Re only enters into contracts of reinsurance that are fully-collateralized; and (ii) each transaction represents no material deviation from the original business plan filed with BMA at the time of Blue Capital Re’s registration.
The Insurance Act also limits the maximum amount of annual dividends and distributions that may be paid by Blue Capital Re. Blue Capital Re may not reduce its total capital by 15% or more, as set out in its previous year’s financial statements, unless it has received the prior approval of the BMA. Total capital consists of the insurer’s paid in share capital, its contributed surplus (sometimes called additional paid in capital) and any other fixed capital designated by the BMA as capital. With respect to the year ended December 31, 2014 and 2013, Blue Capital Re had the ability to distribute up to $24.0 million of its total capital to its parent without BMA approval.
Blue Capital Re has not declared or paid any dividends or distributed any of its total capital since its inception.
F-41
Table of Contents
The Insurance Act further provides a minimum liquidity ratio and requires general business insurers and reinsurers to maintain the value of their relevant assets at not less than 75% of the amount of their relevant liabilities. Blue Capital Re exceeded its minimum liquidity requirements at December 31, 2014 and 2013 by $188.1 million and $159.0 million, respectively.
Blue Capital Re’s 2014 and 2013 net income was $19.5 million and less than $0.1 million, respectively.
BCML
BCML is licensed and supervised by the BMA: (i) to carry on investment business; and (ii) as an insurance agent/manager, and is a registered investment advisor with the SEC. BCML is not subject to any material minimum solvency requirements.
Montpelier Group
The BMA serves as Montpelier’s group supervisor. In this instance, an “insurance group” is defined as a group of companies that conducts insurance business.
Where the BMA determines that it should act as the group supervisor, it shall designate a specified insurer that is a member of the insurance group to be the designated insurer in respect of that insurance group for the purposes of the Insurance Act (the “Designated Insurer”) and it shall give to the Designated Insurer and other competent authorities written notice of its intention to act as group supervisor. Once the BMA has been designated as group supervisor, the Designated Insurer must ensure that an approved group actuary is appointed to provide an opinion as to the adequacy of the insurance group’s insurance reserves as reported in its group statutory financial statements. Montpelier Re has been designated by the BMA to act as Montpelier’s Designated Insurer.
As group supervisor, the BMA performs a number of supervisory functions including: (i) coordinating the gathering and dissemination of information which is of importance for the supervisory task of other competent authorities; (ii) carrying out a supervisory review and assessment of the insurance group; (iii) carrying out an assessment of the insurance group’s compliance with the rules on solvency, risk concentration, intra-group transactions and good governance procedures as may be prescribed by or under the Insurance Act; (iv) planning and coordinating through regular meetings held at least annually or by other appropriate means with other competent authorities, supervisory activities in respect of the insurance group, both as a going concern and in emergency situations; (v) coordinating any enforcement action that may need to be taken against the insurance group or any of its members; and (vi) planning and coordinating meetings of colleges of supervisors (consisting of insurance regulators) to be clarified by the BMA in order to facilitate the carrying out of the functions described above.
In carrying out its group supervisor functions, the BMA may make rules for: (i) assessing the financial situation and the solvency position of the insurance group and its members; and (ii) regulating intra-group transactions, risk concentration, governance procedures, risk management and regulatory reporting and disclosure.
Other international supervisory authorities are not, at the current time, under any obligation to accept or otherwise rely on the BMA’s determination that it is acting as group supervisor, rather the BMA’s decision defines the scope and extent of the BMA’s interest in Montpelier’s operations group-wide.
The Bermuda Companies Act 1981 (the “Companies Act”)
The Companies Act also limits the Company’s, BCRH’s, Montpelier Re’s, Blue Water Re’s, Blue Capital Re’s and Blue Capital Re ILS’ ability to pay dividends and/or make distributions to their shareholders in that none of the Company, BCRH, Montpelier Re, Blue Water Re, Blue Capital Re or Blue Capital Re ILS is permitted to declare or pay a dividend or make a distribution out of its contributed surplus, if it is, or would after the payment be, unable to pay its liabilities as they become due or if the realizable value of its assets would be less than its liabilities.
U.K.
Montpelier participates in the Lloyd’s market through Syndicate 5151, which is managed by MAL and is capitalized through MCL. MAL is regulated by the PRA and the FCA and is also subject to the oversight of the Council of Lloyd’s.
The PRA, which is a subsidiary of the Bank of England, is responsible for promoting the stable and prudent operation of the U.K. financial system through regulation of all deposit-taking institutions, insurers, Lloyd’s managing agents and investment banks. The PRA has the responsibility for promoting the safety and soundness of Lloyd’s and its members taken together, including the Lloyd’s New Central Fund, and the prudential regulation of managing agents.
F-42
Table of Contents
The FCA is responsible for regulation of conduct in financial markets and the infrastructure that supports those markets. The FCA also has responsibility for the prudential regulation of firms that do not fall under the PRA’s scope. The FCA regulates Lloyd’s and its managing agents and, on a prudential and conduct basis, its members’ agents, advisors and brokers. Particular conduct issues include the management of the auction whereby members can buy and sell syndicate capacity and the handling of policyholders’ complaints.
The PRA and the FCA form a supervisory college for Lloyd’s and maintain cooperation arrangements with Lloyd’s in support of their activities. They also have powers of direction over Lloyd’s and consult with each other in the exercise of such powers.
The Council of Lloyd’s is responsible under the Lloyd’s Act 1982 for the management and supervision of Lloyd’s, including its members, syndicates and managing agents, and has rule-making and enforcement powers. The Council of Lloyd’s may discharge some of its functions directly by making decisions and issuing resolutions, requirements, rules and byelaws. Other decisions are delegated to the Lloyd’s Franchise Board and associated committees. The PRA and FCA, when relevant, coordinate with each other and Lloyd’s over its use of enforcement powers.
MAL, as a Lloyd’s Managing Agent, is subject to capital requirements and minimum solvency tests established by Lloyd’s and the PRA. MAL’s statutory net assets, as reported to Lloyd’s as of December 31, 2014 and 2013, totaled $1.1 million and $1.2 million, respectively. MAL’s restricted net assets (the amount of its statutory net assets that were not available to dividend or distribute to its parent without Lloyd’s approval) at December 31, 2014 and 2013 totaled $0.8 million and $0.9 million, respectively. Any amount of MAL’s statutory net assets in excess of its net restricted assets may be distributed to its parent without Lloyd’s approval.
MAL’s net income, as reported to Lloyd’s for each of the years ended December 31, 2014, 2013 and 2012, was $0.2 million.
MCL, Syndicate 5151’s corporate underwriting member at Lloyd’s, provides 100% of the stamp capacity of Syndicate 5151. Stamp capacity is a measure of the amount of premium a syndicate is authorized to write by Lloyd’s. Syndicate 5151’s stamp capacity for 2014, 2013 and 2012 was £180 million.
As the corporate underwriting member of Lloyd’s, MCL is bound by the rules of Lloyd’s, which are prescribed by Byelaws and Requirements made by the Council of Lloyd’s under powers conferred by the Lloyd’s Act 1982. These rules, among other matters, prescribe MCL’s membership subscription, the level of its contribution to the Lloyd’s New Central Fund and the assets it must deposit with Lloyd’s in support of its underwriting. The Council of Lloyd’s has broad powers to sanction breaches of its rules, including the power to restrict or prohibit a member’s participation in Lloyd’s syndicates.
At the syndicate level, managing agents are required to calculate the capital resources requirement of the members of each syndicate they manage. In the case of Syndicate 5151’s underwriting years of account prior to 2013, MAL carried out a syndicate Individual Capital Assessment (“ICA”) according to detailed rules prescribed by the PRA under the Individual Capital Adequacy Standards regime in force. In the case of Syndicate 5151’s subsequent underwriting years of account, MAL carried out a Solvency Capital Requirement (“SCR”) assessment in addition to the ICA, utilizing the Syndicate’s own internal model according to Solvency II principles, which was subsequently reconciled to the ICA.
Both the ICA and SCR evaluate the risks faced by the syndicate, including insurance risk, operational risk, market risk, credit risk, liquidity risk and group risk, and assess the amount of capital that syndicate members should hold against those risks.
Lloyd’s reviews each syndicate’s SCR annually and may challenge it. In order to ensure that Lloyd’s aggregate capital is maintained at a high enough level to support its overall security rating, Lloyd’s adds an uplift to the overall market capital resources requirement produced by the SCR, and each syndicate is allocated its proportion of the uplift. The aggregate amount is known as a syndicate’s Economic Capital Assessment, which is used by Lloyd’s to determine the syndicate’s required FAL.
MCL is required to deposit cash, securities or letters of credit (or a combination of these assets) with Lloyd’s in order to satisfy its FAL requirements, which are met through the Lloyd’s Capital Trust. The assets held in the Lloyd’s Capital Trust are provided by Montpelier Re.
F-43
Table of Contents
MCL’s combined statutory net assets of $212.8 million and $160.2 million at December 31, 2014 and 2013, respectively, which consist of the assets held in the Lloyd’s Capital Trust, exceeded MCL’s restricted net assets (the amount of its combined statutory net assets that were not available to dividend or distribute to its parent without Lloyd’s approval) of $194.0 million and $156.3 million at such dates, respectively. Any amount of MCL’s combined statutory net assets in excess of its restricted net assets may be distributed to its parent, subject to passing a Lloyd’s release test.
MCL’s net income, as reported to Lloyd’s for the years ended December 31, 2014, 2013 and 2012, was $16.9 million, $23.2 million and $26.8 million, respectively.
Premiums received by Syndicate 5151 are received into the Premiums Trust Funds. Under the Premiums Trust Funds’ deeds, assets may only be used for the payment of claims and valid expenses. Profits held within the Premiums Trust Funds, including investment income earned thereon, may be distributed to MCL annually, subject to meeting Lloyd’s requirements. Premiums Trust Fund assets not required to meet cash calls and/or loss payments may also be used towards MCL’s ongoing capital requirements. Upon the closing of an open underwriting year, normally after three years, all undistributed profits held within the Premiums Trust Funds applicable to the closed underwriting year may be distributed to MCL.
As of December 31, 2014, Syndicate 5151 held $249.8 million in investment securities (including accrued interest) and $34.7 million in cash and cash equivalents (including restricted cash), within the Premiums Trust Funds. As of December 31, 2013, Syndicate 5151 held $293.3 million in investment securities (including accrued interest) and $33.1 million in cash and cash equivalents (including restricted cash), within the Premiums Trust Funds.
NOTE 14. Related Party Transactions
Management Transition
On December 31, 2013, Mr. Busher retired from his role as the Company’s Chief Operating Officer and Head of European Operations. Mr. Busher continues to serve as a director and the non-executive Chairman of the Board of Directors of MAL.
In order to promote a smooth transition of Mr. Busher’s duties and responsibilities, the Company entered into a transition letter with him on February 21, 2013 pursuant to which he agreed to: (i) retire from the Board, effective May 17, 2013, the end of his existing term as a Class B director, (ii) transition his executive roles with the Company during 2013; and (iii) retire as Chief Operating Officer and Head of European Operations on December 31, 2013 (the date Mr. Busher’s service agreement expired).
Pursuant to the transition letter, Mr. Busher waived all rights to severance and other termination payments set forth in his service agreement, including any entitlement to payments upon expiration or non-renewal of his service agreement. In consideration for Mr. Busher’s waiver of these and other rights under his service agreement, as well as his release of any claims against the Company and his continued compliance with the restrictive covenants contained in his service agreement, the Company agreed to the following treatment of his outstanding RSUs awards: (i) the RSUs that were originally granted to Mr. Busher pursuant to the 2010-2013 and 2012-2015 Variable RSU cycles, which were scheduled to vest on December 15, 2013, were vested fully on March 15, 2013; (ii) the RSUs that were originally granted to Mr. Busher as part of the 2012-2015 Variable RSU cycle, which were scheduled to vest on December 15, 2014 or later, vested fully on December 15, 2013; and (iii) the RSUs that were granted to Mr. Busher as part of the 2013-2016 Variable RSU cycle, which were scheduled to vest on December 15, 2014 or later, vested fully on March 14, 2014. See Note 9.
In connection with Mr. Busher’s planned retirement, on March 7, 2013 he sold 469,222 Common Shares to the Company in a private transaction. The price negotiated and paid to Mr. Busher was $24.62 per share, which was $0.63 less than the market price (as per the New York Stock Exchange) at the time the agreement was reached.
BCRH
BCRH provides fully-collateralized property catastrophe reinsurance and invests in various insurance-linked securities through its subsidiaries Blue Capital Re and Blue Capital Re ILS. BCRH commenced its operations in November 2013 and, pursuant to the BCRH IPO, its common shares are listed on the New York Stock Exchange and the Bermuda Stock Exchange. As of December 31, 2014 and 2013, Montpelier owned 33.3% and 28.6%, respectively, of BCRH’s outstanding common shares. Montpelier increased its ownership in BCRH during 2014 through a series of open-market purchases of BCRH common shares.
F-44
Table of Contents
In connection with the BCRH IPO, Montpelier: (i) reimbursed BCRH for the underwriting discount it incurred, which was equal to 5% of the gross proceeds it received from third parties ($6.2 million); (ii) paid a structuring fee to a third- party equal to 1% of the gross proceeds BCRH received from third parties ($1.3 million); and (iii) paid $0.9 million of BCRH’s offering expenses (representing BCRH’s offering expenses in excess of $1.0 million). The BCRH underwriting discount and structuring fees paid by Montpelier were recorded as a non-underwriting expense on the Company’s 2013 Consolidated Statement of Operations and Comprehensive Income.
The underwriting decisions and operations of BCRH and its subsidiaries are managed by BCML, which uses Montpelier’s reinsurance underwriting expertise and infrastructure to conduct its business. In addition, Blue Water Re, the Company’s wholly-owned special purpose insurance vehicle, is a significant source of reinsurance business for BCRH.
Mr. William Pollett, the Company’s Chief Corporate Development and Strategy Officer and Treasurer, serves as a director and the Chief Executive Officer of BCRH and Mr. Michael Paquette, the Company’s Chief Financial Officer, serves as BCRH’s Chief Financial Officer. Further, Mr. Christopher Harris, the Company’s Chief Executive Officer, serves as Chairman of BCRH.
Montpelier provides services to BCRH and its subsidiaries through the following arrangements:
BW Retrocessional Agreement. Through a retrocessional contract dated December 31, 2013 (the “BW Retrocessional Contract”), between Blue Capital Re and Blue Water Re, Blue Water Re has the option to cede to Blue Capital Re up to 100% of its participation in the ceded reinsurance business it writes, provided that such business is in accordance with BCRH’s underwriting guidelines. Pursuant to the BW Retrocessional Contract, Blue Capital Re may participate in: (i) retrocessional, quota share or other agreements between Blue Water Re and Montpelier Re or other third-party reinsurers, which provides it with the opportunity to participate in a diversified portfolio of risks on a proportional basis; and (ii) fronting agreements between Blue Water Re and Montpelier Re or other well capitalized third- party rated reinsurers, which allows Blue Capital Re to transact business with counterparties who prefer to enter into contracts with rated reinsurers.
Investment Management Agreement. BCRH has entered into an Investment Management Agreement with BCML (the “Investment Management Agreement”). Pursuant to the terms of the Investment Management Agreement, BCML has full discretionary authority, including the delegation of the provision of its services, to manage BCRH’s assets, subject to BCRH’s underwriting guidelines, the terms of the Investment Management Agreement and the oversight of BCRH’s board of directors.
Underwriting and Insurance Management Agreement. BCRH, Blue Capital Re and BCML have entered into an Underwriting and Insurance Management Agreement (the “Underwriting and Insurance Management Agreement”). Pursuant to the Underwriting and Insurance Management Agreement, BCML provides underwriting, risk management, claims management, ceded retrocession agreements management, and actuarial and reinsurance accounting services to Blue Capital Re. BCML has full discretionary authority to manage the underwriting decisions of Blue Capital Re, subject to BCRH’s underwriting guidelines, the terms of the Underwriting and Insurance Management Agreement and the oversight of BCRH’s and Blue Capital Re’s boards of directors.
Administrative Services Agreement. BCRH has entered into an Administrative Services Agreement with BCML, as amended on November 13, 2014 (the “Administrative Services Agreement”). Pursuant to the terms of the Administrative Services Agreement, BCML provides BCRH with support services, including the services of Messrs. Pollett and Paquette, as well as finance and accounting, claims management and policy wording, modeling software licenses, office space, information technology, human resources and administrative support.
BCRH and its subsidiaries may not terminate the Investment Management Agreement, the Underwriting and Insurance Management Agreement or the Administrative Services Agreement until the fifth anniversary of the completion of the BCRH IPO, whether or not BCML’s performance is satisfactory. Upon any termination or non-renewal of either of the Investment Management Agreement or the Underwriting and Insurance Management Agreement (other than for a material breach by, or the insolvency of, BCML), BCRH and/or its subsidiaries must pay a one-time termination fee to BCML equal to 5% of its GAAP shareholders’ equity, calculated as of the most recently completed quarter prior to the date of termination (approximately $9.0 million as of December 31, 2014).
F-45
Table of Contents
BCRH Credit Agreement. The Company serves as a guarantor for the BCRH Credit Agreement and is entitled to an annual fee equal to 0.125% of the facility’s total capacity. See Note 6.
On a stand-alone basis, any fees incurred pursuant to the Investment Management Agreement, the Underwriting and Insurance Management Agreement or the Administrative Services Agreement, including any fees triggered upon termination or non-renewal of any of them, represent expenses to BCRH and /or its subsidiaries and revenues to BCML. On a consolidated basis, the portion of such fees incurred by BCRH’s non-controlling interests pursuant to these agreements represent a decrease to the net income attributable to non-controlling interests on the Company’s Consolidated Statement of Operations and Comprehensive Income, thereby increasing the net income and comprehensive income available to the Company.
During 2014, Montpelier earned a total of $2.6 million and $0.6 million pursuant to services it provided to BCRH and its subsidiaries under the Investment Management Agreement and the Administrative Services Agreement, respectively. Montpelier earned less than $0.1 million during 2014 pursuant to the Underwriting and Insurance Management Agreement.
During 2013, Montpelier earned a total of $0.4 million and $0.1 million pursuant to services it provided to BCRH and its subsidiaries under the Investment Management Agreement and the Administrative Services Agreement, respectively. Montpelier did not earn any amounts in 2013 pursuant to the Underwriting and Insurance Management Agreement.
As of December 31, 2014 and 2013, BCRH and its subsidiaries owed Montpelier $0.5 million for the services performed pursuant to the aforementioned agreements.
NOTE 15. Commitments and Contingent Liabilities
Commitments
As of December 31, 2014, Montpelier had an unfunded commitment to invest: (i) $7.9 million into a private investment fund; and (ii) up to $15.5 million into a private placement fixed maturity investment.
Montpelier’s letter of credit facilities and trust arrangements are secured by collateral accounts containing cash, cash equivalents and investments that are required to be maintained at specified levels. See Note 6.
Montpelier leases office space under noncancellable operating leases that expire on various dates. During the year ended December 31, 2014, Montpelier incurred $4.4 million of expense associated with its leased office space. Future annual minimum commitments under existing noncancellable leases for Montpelier’s office space are $4.7 million, $2.8 million, $1.7 million, $1.6 million and $7.5 million for 2015, 2016, 2017, 2018 and 2019 and beyond, respectively.
Montpelier also has various other operating lease obligations that are immaterial in the aggregate.
BCRH and/or its subsidiaries are parties to the Investment Management Agreement, the Underwriting and Insurance Management Agreement and the Administrative Services Agreement. See Note 14.
Lloyd’s New Central Fund
The Lloyd’s New Central Fund is available to satisfy claims if a member of Lloyd’s is unable to meet its obligations to policyholders. The Lloyd’s New Central Fund is funded by an annual levy imposed on members which is determined annually by Lloyd’s as a percentage of each member’s written premiums (0.5% with respect to 2014, 2013 and 2012). In addition, the Council of Lloyd’s has power to call on members to make an additional contribution to the Lloyd’s New Central Fund of up to 3.0% of their underwriting capacity each year should it decide that such additional contributions are necessary. Montpelier currently estimates that its 2015 obligation to the Lloyd’s New Central Fund will be approximately $1.1 million.
Lloyd’s also imposes other charges on its members and the syndicates on which they participate, including an annual subscription charge (0.5% of written premiums with respect to 2014, 2013 and 2012) and an overseas business charge, levied as a percentage of gross international premiums (defined as business outside the U.K. and the Channel Islands), with the percentage depending on the type of business written. Lloyd’s also has power to impose additional charges under Lloyd’s Powers of Charging Byelaw. Montpelier currently estimates that its 2015 obligation to Lloyd’s for such charges will be approximately $1.3 million.
F-46
Table of Contents
Litigation
Montpelier is subject to litigation and arbitration proceedings in the normal course of its business. Such proceedings often involve insurance or reinsurance contract disputes which are typical for the insurance and reinsurance industry. Montpelier’s estimates of possible losses incurred in connection with such legal proceedings are provided for as loss and loss adjustment expenses on its Consolidated Statements of Operations and Comprehensive Income and are included within loss and loss adjustment expense reserves on its Consolidated Balance Sheets.
During 2011, Montpelier Re was named in a series of lawsuits filed by a group of plaintiffs in their capacity as trustees for senior debt issued by Tribune on behalf of various senior debt holders. See Note 5.
Other than the Tribune litigation referred to above, Montpelier had no other unresolved legal proceedings, other than those in the normal course of its business, at December 31, 2014.
Concentrations of Credit and Counterparty Risk
Financial instruments which potentially subject Montpelier to significant concentrations of credit risk consist principally of investment securities, insurance and reinsurance balances receivable and reinsurance recoverables as described below.
Montpelier’s investment guidelines prohibit it from owning an undue concentration of a single issue or issuer, other than U.S.-backed securities, and it did not own an aggregate fixed maturity investment in a single entity, other than securities issued by the U.S. government and U.S. government-sponsored enterprises, in excess of 10% of the Company’s common shareholders’ equity at December 31, 2014.
In accordance with its investment controls and guidelines, Montpelier routinely monitors the credit quality of its fixed maturity investments, including those involving investments in: (i) European sovereign nations; (ii) U.S. state and local municipalities, Alternative A, subprime and commercial mortgage-backed securities; (iii) non-agency collateralized residential mortgage obligations; and (iv) those securities that benefit from credit enhancements provided by third-party financial guarantors.
Montpelier’s derivative instruments are subject to counterparty risk. Montpelier routinely monitors this risk in accordance with the Company’s Derivative Use Plan.
Montpelier underwrites the majority of its business through independent insurance and reinsurance brokers. Credit risk exists to the extent that any of these brokers may be unable to fulfill their contractual obligations to Montpelier. For example, Montpelier is frequently required to pay amounts owed on claims under policies to brokers, and these brokers, in turn, pay these amounts to the ceding companies that have reinsured a portion of their liabilities with Montpelier. In some jurisdictions, if a broker fails to make such a payment, Montpelier might remain liable to the ceding company for the deficiency. In addition, in certain jurisdictions, when the ceding company pays premiums for these policies to brokers, these premiums are considered to have been paid and the ceding insurer is no longer liable to Montpelier for those amounts, whether or not the premiums have actually been received.
Montpelier remains liable for losses it incurs to the extent that any third-party reinsurer is unable or unwilling to make timely payments under reinsurance agreements. Montpelier would also be liable in the event that its ceding companies were unable to collect amounts due from underlying third-party reinsurers.
Under Montpelier’s reinsurance security policy, its reinsurers are typically required to be rated “A-” (Excellent) or better by A.M. Best (or an equivalent rating with another recognized rating agency) at the time the policy is written. Montpelier also considers reinsurers that are not rated or do not fall within this threshold on a case-by-case basis if collateralized up to policy limits, net of any premiums owed. Montpelier monitors the financial condition and ratings of its reinsurers on an ongoing basis.
F-47
Table of Contents
MANAGEMENT’S RESPONSIBILITY FOR FINANCIAL STATEMENTS
Management is responsible for the preparation and fair presentation of the financial statements included in this report. The financial statements have been prepared in conformity with GAAP. The preparation of financial statements in conformity with GAAP requires management to make estimates and assumptions that affect the reported amounts of assets and liabilities as of the date of the financial statements and the reported amounts of revenues and expenses during the reporting period. Actual results could differ from those estimates.
The Audit Committee of the Board, which is comprised entirely of independent, qualified directors, is responsible for the oversight of our accounting policies, financial reporting and internal control, including the appointment and compensation of our independent registered public accounting firm. The Audit Committee meets periodically with management, our independent registered public accounting firm and our internal auditors to ensure they are carrying out their responsibilities. The Audit Committee is also responsible for performing an oversight role by reviewing our financial reports. Our independent registered public accounting firm and internal auditors have full and unlimited access to the Audit Committee, with or without management present, to discuss the adequacy of internal control over financial reporting and any other matters which they believe should be brought to their attention.
MANAGEMENT’S ANNUAL REPORT ON INTERNAL CONTROL OVER FINANCIAL REPORTING
Management is responsible for establishing and maintaining adequate internal control over financial reporting as defined in Rules 1 3a-15(f) and 15d-15(f) under the Securities Exchange Act of 1934. There are inherent limitations in the effectiveness of any internal control over financial reporting, including the possibility of human error and the circumvention or overriding of internal control. Accordingly, because of its inherent limitations, internal control over financial reporting may not prevent or detect misstatements. Also projections of any evaluation of effectiveness to future periods are subject to the risk that controls may become inadequate because of changes in conditions, or that the degree of compliance with the policies or procedures may deteriorate.
We assessed the effectiveness of the Company’s internal control over financial reporting as of December 31, 2014. In making our assessment, we used the criteria set forth by the Committee of Sponsoring Organizations of the Treadway Commission (COSO) in Internal Control - Integrated Framework (2013). Based on this assessment, we have concluded that the Company maintained effective internal control over financial reporting as of December 31, 2014. Management has reviewed the results of its assessment with the Audit Committee.
PricewaterhouseCoopers Ltd., the Company’s independent registered public accounting firm, has audited the effectiveness of the Company’s internal control over financial reporting as of December 31, 2014 as stated in their report which appears on page F-49.
|
February 25, 2015 |
|
|
|
|
|
|
|
/s/ Christopher L. Harris |
|
/s/ Michael S. Paquette |
|
President and Chief Executive Officer |
|
Executive Vice President and Chief Financial Officer |
|
(Principal Executive Officer) |
|
(Principal Financial Officer & Principal Accounting Officer) |
F-48
Table of Contents
REPORT OF INDEPENDENT REGISTERED PUBLIC ACCOUNTING FIRM
To The Board of Directors and Shareholders of Montpelier Re Holdings Ltd.
In our opinion, the consolidated financial statements listed in the index appearing under Item 15(a) present fairly, in all material respects, the financial position of Montpelier Re Holdings Ltd. and its subsidiaries at December 31, 2014 and December 31, 2013, and the results of their operations and their cash flows for each of the three years in the period ended December 31, 2014 in conformity with accounting principles generally accepted in the United States of America. In addition, in our opinion, the financial statement schedules listed in the index appearing under Item 15(a) present fairly, in all material respects, the information set forth therein when read in conjunction with the related consolidated financial statements. Also in our opinion, the Company maintained, in all material respects, effective internal control over financial reporting as of December 31, 2014, based on criteria established in Internal Control - Integrated Framework (2013) issued by the Committee of Sponsoring Organizations of the Treadway Commission (COSO). The Company’s management is responsible for these financial statements and financial statement schedules, for maintaining effective internal control over financial reporting and for its assessment of the effectiveness of internal control over financial reporting, included in the accompanying Management’s Annual Report on Internal Control over Financial Reporting. Our responsibility is to express opinions on these financial statements, on the financial statement schedules, and on the Company’s internal control over financial reporting based on our integrated audits. We conducted our audits in accordance with the standards of the Public Company Accounting Oversight Board (United States). Those standards require that we plan and perform the audits to obtain reasonable assurance about whether the financial statements are free of material misstatement and whether effective internal control over financial reporting was maintained in all material respects. Our audits of the financial statements included examining, on a test basis, evidence supporting the amounts and disclosures in the financial statements, assessing the accounting principles used and significant estimates made by management, and evaluating the overall financial statement presentation. Our audit of internal control over financial reporting included obtaining an understanding of internal control over financial reporting, assessing the risk that a material weakness exists, and testing and evaluating the design and operating effectiveness of internal control based on the assessed risk. Our audits also included performing such other procedures as we considered necessary in the circumstances. We believe that our audits provide a reasonable basis for our opinions.
A company’s internal control over financial reporting is a process designed to provide reasonable assurance regarding the reliability of financial reporting and the preparation of financial statements for external purposes in accordance with generally accepted accounting principles. A company’s internal control over financial reporting includes those policies and procedures that (i) pertain to the maintenance of records that, in reasonable detail, accurately and fairly reflect the transactions and dispositions of the assets of the company; (ii) provide reasonable assurance that transactions are recorded as necessary to permit preparation of financial statements in accordance with generally accepted accounting principles, and that receipts and expenditures of the company are being made only in accordance with authorizations of management and directors of the company; and (iii) provide reasonable assurance regarding prevention or timely detection of unauthorized acquisition, use, or disposition of the company’s assets that could have a material effect on the financial statements.
Because of its inherent limitations, internal control over financial reporting may not prevent or detect misstatements. Also, projections of any evaluation of effectiveness to future periods are subject to the risk that controls may become inadequate because of changes in conditions, or that the degree of compliance with the policies or procedures may deteriorate.
|
/s/ PricewaterhouseCoopers Ltd. |
|
|
|
|
|
Hamilton, Bermuda
February 25, 2015 |
|
F-49
Table of Contents
MONTPELIER RE HOLDINGS LTD.
SELECTED QUARTERLY FINANCIAL DATA
(Unaudited)
Selected quarterly financial data for 2014 and 2013 is shown in the following table. The quarterly financial data includes, in the opinion of management, all recurring adjustments necessary for a fair presentation of the consolidated results of operations for the interim periods.
|
|
|
2014 Three Months Ended |
|
2013 Three Months Ended |
|
|
Millions, except per share amounts |
|
Dec. 31 |
|
Sept. 30 |
|
June 30 |
|
Mar. 31 |
|
Dec. 31 |
|
Sept. 30 |
|
June 30 |
|
Mar. 31 |
|
|
Net insurance and reinsurance premiums earned |
|
$ |
160.6 |
|
$ |
165.2 |
|
$ |
162.6 |
|
$ |
156.8 |
|
$ |
148.0 |
|
$ |
153.0 |
|
$ |
138.9 |
|
$ |
159.7 |
|
|
Net investment income |
|
9.6 |
|
11.9 |
|
12.4 |
|
12.9 |
|
14.2 |
|
16.7 |
|
16.7 |
|
16.4 |
|
|
Net realized and unrealized investment gains (losses) |
|
(19.5 |
) |
(17.6 |
) |
19.8 |
|
22.7 |
|
8.1 |
|
4.6 |
|
(61.2 |
) |
(0.7 |
) |
|
Net foreign currency gains (losses) |
|
10.1 |
|
9.9 |
|
(8.8 |
) |
(1.8 |
) |
(9.4 |
) |
(22.3 |
) |
(5.3 |
) |
21.1 |
|
|
Net income (loss) from derivative instruments |
|
(2.2 |
) |
(0.1 |
) |
(11.2 |
) |
(5.1 |
) |
(11.0 |
) |
(6.7 |
) |
(12.2 |
) |
4.6 |
|
|
Other revenues |
|
0.2 |
|
1.7 |
|
0.7 |
|
0.3 |
|
0.4 |
|
— |
|
— |
|
— |
|
|
Total revenues |
|
158.8 |
|
171.0 |
|
175.5 |
|
185.8 |
|
150.3 |
|
145.3 |
|
76.9 |
|
201.1 |
|
|
|
|
|
|
|
|
|
|
|
|
|
|
|
|
|
|
|
|
|
Underwriting expenses |
|
97.4 |
|
122.3 |
|
124.8 |
|
79.0 |
|
58.2 |
|
82.6 |
|
95.8 |
|
99.6 |
|
|
Interest and other financing expenses |
|
4.8 |
|
4.7 |
|
4.7 |
|
4.7 |
|
4.7 |
|
4.7 |
|
4.7 |
|
4.7 |
|
|
Other expenses |
|
0.9 |
|
1.5 |
|
1.0 |
|
— |
|
8.1 |
|
— |
|
— |
|
— |
|
|
Total expenses |
|
103.1 |
|
128.5 |
|
130.5 |
|
83.7 |
|
71.0 |
|
87.3 |
|
100.5 |
|
104.3 |
|
|
|
|
|
|
|
|
|
|
|
|
|
|
|
|
|
|
|
|
|
Income (loss) before income taxes |
|
55.7 |
|
42.5 |
|
45.0 |
|
102.1 |
|
79.3 |
|
58.0 |
|
(23.6 |
) |
96.8 |
|
|
Income tax benefit (provision) |
|
3.0 |
|
(0.2 |
) |
(0.2 |
) |
0.1 |
|
— |
|
(0.1 |
) |
0.4 |
|
(0.2 |
) |
|
Net income (loss) |
|
58.7 |
|
42.3 |
|
44.8 |
|
102.2 |
|
79.3 |
|
57.9 |
|
(23.2 |
) |
96.6 |
|
|
Net income attributable to non-controlling interests |
|
(6.6 |
) |
(4.2 |
) |
(4.3 |
) |
(9.0 |
) |
(2.6 |
) |
(1.6 |
) |
(0.7 |
) |
(1.2 |
) |
|
Net income (loss) available to the Company |
|
52.1 |
|
38.1 |
|
40.5 |
|
93.2 |
|
76.7 |
|
56.3 |
|
(23.9 |
) |
95.4 |
|
|
Dividends declared on Preferred Shares |
|
(3.3 |
) |
(3.3 |
) |
(3.4 |
) |
(3.3 |
) |
(3.3 |
) |
(3.3 |
) |
(3.4 |
) |
(3.3 |
) |
|
Net income (loss) available to common shareholders |
|
$ |
48.8 |
|
$ |
34.8 |
|
$ |
37.1 |
|
$ |
89.9 |
|
$ |
73.4 |
|
$ |
53.0 |
|
$ |
(27.3 |
) |
$ |
92.1 |
|
|
|
|
|
|
|
|
|
|
|
|
|
|
|
|
|
|
|
|
|
Amounts per Common Share: |
|
|
|
|
|
|
|
|
|
|
|
|
|
|
|
|
|
|
Basic and diluted earnings (loss) |
|
$ |
1.09 |
|
$ |
0.75 |
|
$ |
0.78 |
|
$ |
1.84 |
|
$ |
1.44 |
|
$ |
1.02 |
|
$ |
(0.52 |
) |
$ |
1.65 |
|
|
Fully converted book value |
|
$ |
33.19 |
|
$ |
32.27 |
|
$ |
31.74 |
|
$ |
31.01 |
|
$ |
29.42 |
|
$ |
28.06 |
|
$ |
27.03 |
|
$ |
27.49 |
|
F-50
Table of Contents
SCHEDULE I
MONTPELIER RE HOLDINGS LTD.
SUMMARY OF INVESTMENTS — OTHER THAN
INVESTMENTS IN RELATED PARTIES
At December 31, 2014
|
Millions |
|
Cost |
|
Value |
|
Amount
at which
shown in
the
balance
sheet |
|
|
Fixed maturity investments: |
|
|
|
|
|
|
|
|
Bonds: |
|
|
|
|
|
|
|
|
Corporate bonds and asset-backed securities |
|
$ |
1,299.1 |
|
$ |
1,295.5 |
|
$ |
1,295.5 |
|
|
U.S. Government and government agencies and authorities (1) |
|
408.3 |
|
408.7 |
|
408.7 |
|
|
Non-U.S. governments and agencies |
|
98.9 |
|
98.7 |
|
98.7 |
|
|
Convertibles and bonds with warrants attached |
|
45.2 |
|
46.3 |
|
46.3 |
|
|
Public utilities |
|
31.9 |
|
32.4 |
|
32.4 |
|
|
States, municipalities, and political subdivisions |
|
19.5 |
|
19.4 |
|
19.4 |
|
|
Total fixed maturity investments |
|
$ |
1,902.9 |
|
$ |
1,901.0 |
|
$ |
1,901.0 |
|
|
|
|
|
|
|
|
|
|
|
Equity securities: |
|
|
|
|
|
|
|
|
Industrial, miscellaneous and other |
|
$ |
159.3 |
|
$ |
168.6 |
|
$ |
168.6 |
|
|
Non-redeemable preferred stocks |
|
4.5 |
|
4.5 |
|
4.5 |
|
|
Total equity securities |
|
$ |
163.8 |
|
$ |
173.1 |
|
$ |
173.1 |
|
|
|
|
|
|
|
|
|
|
|
Other investments |
|
$ |
642.4 |
|
$ |
642.0 |
|
$ |
642.0 |
|
|
Total investments |
|
$ |
2,709.1 |
|
$ |
2,716.1 |
|
$ |
2,716.1 |
|
(1) Includes mortgage-backed securities issued by GNMA, FNMA and FHLMC.
FS-1
Table of Contents
SCHEDULE II
MONTPELIER RE HOLDINGS LTD.
CONDENSED FINANCIAL INFORMATION OF THE REGISTRANT
CONDENSED BALANCE SHEETS
|
|
|
December 31, |
|
|
Millions |
|
2014 |
|
2013 |
|
|
Assets: |
|
|
|
|
|
|
Cash and cash equivalents |
|
$ |
4.7 |
|
$ |
2.6 |
|
|
Other investments |
|
(0.3 |
) |
(0.5 |
) |
|
Restricted cash |
|
1.2 |
|
1.1 |
|
|
Investments in subsidiaries and affiliates, on the equity method of accounting |
|
2,398.4 |
|
2,344.9 |
|
|
Intercompany receivables |
|
14.5 |
|
10.4 |
|
|
Other assets |
|
2.8 |
|
3.0 |
|
|
Total Assets |
|
$ |
2,421.3 |
|
$ |
2,361.5 |
|
|
Liabilities: |
|
|
|
|
|
|
Debt |
|
$ |
399.3 |
|
$ |
399.2 |
|
|
Intercompany payables |
|
86.7 |
|
57.7 |
|
|
Accounts payable and other liabilities |
|
20.8 |
|
17.6 |
|
|
Total Liabilities |
|
506.8 |
|
474.5 |
|
|
Shareholders’ Equity: |
|
|
|
|
|
|
Preferred shareholders’ equity |
|
150.0 |
|
150.0 |
|
|
Common shareholders’ equity |
|
1,498.2 |
|
1,492.1 |
|
|
Non-controlling interests |
|
266.3 |
|
244.9 |
|
|
Total Shareholders’ Equity |
|
1,914.5 |
|
1,887.0 |
|
|
Total Liabilities and Shareholders’ Equity |
|
$ |
2,421.3 |
|
$ |
2,361.5 |
|
CONDENSED STATEMENTS OF OPERATIONS AND COMPREHENSIVE INCOME
|
|
|
Year Ended December 31, |
|
|
Millions |
|
2014 |
|
2013 |
|
2012 |
|
|
Revenues |
|
$ |
0.1 |
|
$ |
— |
|
$ |
— |
|
|
Expenses |
|
(53.8 |
) |
(66.1 |
) |
(63.3 |
) |
|
Parent only net loss |
|
(53.7 |
) |
(66.1 |
) |
(63.3 |
) |
|
Equity in earnings of subsidiaries and affiliates |
|
301.7 |
|
276.7 |
|
290.9 |
|
|
Net income |
|
248.0 |
|
210.6 |
|
227.6 |
|
|
Net income attributable to non-controlling interests |
|
(24.1 |
) |
(6.1 |
) |
— |
|
|
Net income available to the Company |
|
223.9 |
|
204.5 |
|
227.6 |
|
|
Dividends declared on Preferred Shares |
|
(13.3 |
) |
(13.3 |
) |
(13.3 |
) |
|
Net income available to the Company’s common shareholders |
|
$ |
210.6 |
|
$ |
191.2 |
|
$ |
214.3 |
|
|
Net income |
|
$ |
248.0 |
|
$ |
210.6 |
|
$ |
227.6 |
|
|
Net change in foreign currency translation |
|
(2.4 |
) |
0.9 |
|
0.8 |
|
|
Comprehensive income |
|
245.6 |
|
211.5 |
|
228.4 |
|
|
Net income attributable to non-controlling interests |
|
(24.1 |
) |
(6.1 |
) |
— |
|
|
Comprehensive net income available to the Company |
|
$ |
221.5 |
|
$ |
205.4 |
|
$ |
228.4 |
|
FS-2
Table of Contents
SCHEDULE II
(continued)
MONTPELIER RE HOLDINGS LTD.
CONDENSED FINANCIAL INFORMATION OF THE REGISTRANT
CONDENSED STATEMENTS OF CASH FLOWS
|
|
|
Year Ended December 31, |
|
|
Millions |
|
2014 |
|
2013 |
|
2012 |
|
|
Cash flows from operations: |
|
|
|
|
|
|
|
|
Net income |
|
$ |
248.0 |
|
$ |
210.6 |
|
$ |
227.6 |
|
|
Charges (credits) to reconcile net income to net cash from operations: |
|
|
|
|
|
|
|
|
Equity in earnings of subsidiaries and affiliates |
|
(301.7 |
) |
(276.7 |
) |
(290.9 |
) |
|
Dividends received from subsidiaries and affiliates |
|
250.1 |
|
225.0 |
|
76.8 |
|
|
Net losses (gains) on investment-related derivative instruments |
|
0.7 |
|
(0.4 |
) |
1.6 |
|
|
Expense recognized for RSUs |
|
19.8 |
|
18.0 |
|
12.1 |
|
|
Net amortization and depreciation of assets and liabilities |
|
0.1 |
|
0.1 |
|
0.2 |
|
|
Net change in other assets and other liabilities |
|
19.8 |
|
31.5 |
|
54.7 |
|
|
Net cash provided from operations |
|
236.8 |
|
208.1 |
|
82.1 |
|
|
Cash flows from investing activities: |
|
|
|
|
|
|
|
|
Returns of capital received from subsidiaries and affiliates |
|
0.6 |
|
— |
|
6.4 |
|
|
Settlements of investment-related derivative instruments |
|
(0.9 |
) |
(0.8 |
) |
0.3 |
|
|
Net change in restricted cash |
|
(0.1 |
) |
1.3 |
|
(2.4 |
) |
|
Net cash (used for) provided from investing activities |
|
(0.4 |
) |
0.5 |
|
4.3 |
|
|
Cash flows from financing activities: |
|
|
|
|
|
|
|
|
Redemptions of 2013 Senior Notes |
|
— |
|
— |
|
(228.0 |
) |
|
Proceeds from 2022 Senior Note issuance |
|
— |
|
— |
|
299.1 |
|
|
Debt issuance costs of 2022 Senior Notes |
|
— |
|
— |
|
(2.7 |
) |
|
Purchases of non-controlling interest |
|
(7.9 |
) |
— |
|
— |
|
|
Repurchases of Common Shares |
|
(185.9 |
) |
(171.4 |
) |
(117.5 |
) |
|
Dividends paid on Common Shares |
|
(27.2 |
) |
(24.2 |
) |
(24.4 |
) |
|
Dividends paid on Preferred Shares |
|
(13.3 |
) |
(13.3 |
) |
(13.3 |
) |
|
Net cash used for financing activities |
|
(234.3 |
) |
(208.9 |
) |
(86.8 |
) |
|
Net increase (decrease) in cash and cash equivalents during the year |
|
2.1 |
|
(0.3 |
) |
(0.4 |
) |
|
Cash and cash equivalents - beginning of year |
|
2.6 |
|
2.9 |
|
3.3 |
|
|
Cash and cash equivalents - end of year |
|
$ |
4.7 |
|
$ |
2.6 |
|
$ |
2.9 |
|
FS-3
Table of Contents
SCHEDULE III
MONTPELIER RE HOLDINGS LTD.
SUPPLEMENTARY INSURANCE INFORMATION
(Millions)
|
|
|
Column B |
|
Column C |
|
Column D |
|
Column E |
|
Column F |
|
Column G |
|
Column H |
|
Column I |
|
Column J |
|
Column K |
|
|
|
|
|
|
Reserves for |
|
|
|
|
|
|
|
|
|
|
|
|
|
|
|
|
|
|
|
|
|
|
unpaid |
|
|
|
|
|
|
|
|
|
|
|
|
|
|
|
|
|
|
|
|
Deferred |
|
claims and |
|
|
|
Other policy |
|
|
|
|
|
Claims and |
|
Amortization |
|
|
|
|
|
|
|
|
policy |
|
claim |
|
|
|
claims and |
|
Net |
|
Net |
|
claims |
|
of policy |
|
Other |
|
Net |
|
|
Column A |
|
acquisition
costs |
|
adjustment
expenses (1) |
|
Unearned
premiums (2) |
|
benefits
payable |
|
premiums
earned (3) |
|
investment
income (4) |
|
adjustment
expenses (5) |
|
acquisition
costs (6) |
|
underwriting
expenses (7) |
|
premiums
written (8) |
|
|
December 31, 2014: |
|
|
|
|
|
|
|
|
|
|
|
|
|
|
|
|
|
|
|
|
|
|
Montpelier Bermuda |
|
$ |
19.7 |
|
$ |
408.8 |
|
$ |
131.6 |
|
$ |
— |
|
$ |
315.9 |
|
$ |
40.6 |
|
$ |
23.0 |
|
$ |
37.1 |
|
$ |
38.7 |
|
$ |
314.3 |
|
|
Montpelier at Lloyd’s |
|
32.5 |
|
349.8 |
|
134.6 |
|
— |
|
244.8 |
|
4.5 |
|
142.3 |
|
59.9 |
|
39.8 |
|
253.3 |
|
|
Collateralized Reinsurance |
|
1.1 |
|
12.4 |
|
9.4 |
|
— |
|
84.6 |
|
0.2 |
|
23.2 |
|
13.2 |
|
7.3 |
|
83.4 |
|
|
|
|
|
|
|
|
|
|
|
|
|
|
|
|
|
|
|
|
|
|
|
|
|
December 31, 2013: |
|
|
|
|
|
|
|
|
|
|
|
|
|
|
|
|
|
|
|
|
|
|
Montpelier Bermuda |
|
$ |
18.9 |
|
$ |
520.9 |
|
$ |
130.6 |
|
$ |
— |
|
$ |
359.2 |
|
$ |
57.7 |
|
$ |
17.0 |
|
$ |
34.4 |
|
$ |
39.3 |
|
$ |
353.6 |
|
|
Montpelier at Lloyd’s |
|
31.5 |
|
337.3 |
|
135.5 |
|
— |
|
213.7 |
|
5.4 |
|
105.9 |
|
52.6 |
|
36.5 |
|
212.2 |
|
|
Collateralized Reinsurance |
|
1.1 |
|
0.6 |
|
10.6 |
|
— |
|
26.2 |
|
— |
|
2.2 |
|
3.2 |
|
3.5 |
|
36.8 |
|
|
|
|
|
|
|
|
|
|
|
|
|
|
|
|
|
|
|
|
|
|
|
|
|
December 31, 2012: |
|
|
|
|
|
|
|
|
|
|
|
|
|
|
|
|
|
|
|
|
|
|
Montpelier Bermuda |
|
$ |
17.2 |
|
$ |
728.2 |
|
$ |
139.1 |
|
$ |
— |
|
$ |
369.5 |
|
$ |
63.2 |
|
$ |
159.5 |
|
$ |
40.5 |
|
$ |
44.2 |
|
$ |
380.7 |
|
|
Montpelier at Lloyd’s |
|
31.2 |
|
354.0 |
|
131.0 |
|
— |
|
217.3 |
|
2.9 |
|
107.6 |
|
46.6 |
|
38.2 |
|
230.1 |
|
|
Collateralized Reinsurance |
|
— |
|
— |
|
— |
|
— |
|
2.4 |
|
— |
|
— |
|
0.1 |
|
1.7 |
|
2.4 |
|
(1) Excludes amounts related to Montpelier’s Corporate and Other operations and inter-segment eliminations of $4.7 million, $22.8 million and $30.2 million for 2014, 2013 and 2012, respectively.
(2) Excludes amounts related to Montpelier’s Corporate and Other operations of $(0.2) million, zero and zero for 2014, 2013 and 2012, respectively.
(3) Excludes amounts related to Montpelier’s Corporate and Other operations of $(0.1) million,$0.5 million and $27.3 million for 2014, 2013 and 2012, respectively.
(4) Excludes amounts related to Montpelier’s Corporate and Other operations of $1.5 million, $0.9 million and $1.0 million for 2014, 2013 and 2012, respectively.
(5) Excludes amounts related to Montpelier’s Corporate and Other operations of $1.1 million, $1.4 million and $19.3 million for 2014, 2013 and 2012, respectively.
(6) Excludes amounts related to Montpelier’s Corporate and Other operations of zero million, $0.3 million and $9.4 million for 2014, 2013 and 2012, respectively.
(7) Excludes amounts related to Montpelier’s Corporate and Other operations of $37.9 million, $39.9 million and $32.1 million for 2014, 2013 and 2012, respectively.
(8) Excludes amounts related to Montpelier’s Corporate and Other operations of $(0.1) million, $0.5 million and $2.5 million for 2014, 2013 and 2012, respectively.
FS-4
Table of Contents
SCHEDULE IV
MONTPELIER RE HOLDINGS LTD.
REINSURANCE
($ in millions)
|
Column A |
|
Column B |
|
Column C |
|
Column D |
|
Column E |
|
Column F |
|
|
Net premiums written by segment |
|
Direct
amount |
|
Ceded to
other
companies (1) |
|
Assumed
from other
companies (2) |
|
Net
amount (3) |
|
Percentage of
amount
assumed to net |
|
|
|
|
|
|
|
|
|
|
|
|
|
|
|
December 31, 2014: |
|
|
|
|
|
|
|
|
|
|
|
|
Montpelier Bermuda |
|
$ |
18.0 |
|
$ |
(102.1 |
) |
$ |
398.4 |
|
$ |
314.3 |
|
127 |
% |
|
Montpelier at Lloyd’s |
|
157.5 |
|
(19.7 |
) |
115.5 |
|
253.3 |
|
46 |
% |
|
Collateralized Reinsurance |
|
— |
|
— |
|
83.4 |
|
83.4 |
|
100 |
% |
|
|
|
|
|
|
|
|
|
|
|
|
|
|
December 31, 2013: |
|
|
|
|
|
|
|
|
|
|
|
|
Montpelier Bermuda |
|
$ |
19.8 |
|
$ |
(75.8 |
) |
$ |
409.6 |
|
$ |
353.6 |
|
116 |
% |
|
Montpelier at Lloyd’s |
|
123.1 |
|
(23.0 |
) |
112.1 |
|
212.2 |
|
53 |
% |
|
Collateralized Reinsurance |
|
— |
|
(3.0 |
) |
39.8 |
|
36.8 |
|
108 |
% |
|
|
|
|
|
|
|
|
|
|
|
|
|
|
December 31, 2012: |
|
|
|
|
|
|
|
|
|
|
|
|
Montpelier Bermuda |
|
$ |
18.4 |
|
$ |
(99.8 |
) |
$ |
462.1 |
|
$ |
380.7 |
|
121 |
% |
|
Montpelier at Lloyd’s |
|
118.5 |
|
(15.9 |
) |
127.5 |
|
230.1 |
|
55 |
% |
|
Collateralized Reinsurance |
|
— |
|
— |
|
2.4 |
|
2.4 |
|
100 |
% |
(1) Excludes amounts related to Montpelier’s Corporate and Other operations and inter-segment eliminations of $32.4 million, $(1.1) million and $(3.9) million for 2014, 2013 and 2012, respectively.
(2) Excludes amounts related to Montpelier’s Corporate and Other operations and inter-segment eliminations of $(32.5) million, $1.6 million and $6.4 million for 2014, 2013 and 2012, respectively.
(3) Excludes amounts related to Montpelier’s Corporate and Other operations and inter-segment eliminations of $(0.1) million, $0.5 million and $2.5 million for 2014, 2013 and 2012, respectively.
FS-5
Table of Contents
SCHEDULE VI
MONTPELIER RE HOLDINGS LTD.
SUPPLEMENTAL INFORMATION CONCERNING PROPERTY AND CASUALTY INSURANCE OPERATIONS
(Millions)
|
|
|
|
|
Column B |
|
Column C |
|
Column D |
|
Column E |
|
Column F |
|
Column G |
|
Column H |
|
Column I |
|
Column J |
|
Column K |
|
|
|
|
|
|
|
|
Reserves for |
|
|
|
|
|
|
|
|
|
Claims and claims |
|
|
|
|
|
|
|
|
|
|
|
|
Deferred |
|
unpaid claims |
|
Discount, if |
|
|
|
|
|
|
|
adjustment expenses |
|
Amortization |
|
Paid claims |
|
|
|
|
|
|
|
|
policy |
|
and claims |
|
any, |
|
|
|
Net |
|
Net |
|
incurred related to |
|
of policy |
|
and claims |
|
Net |
|
|
|
|
|
|
acquisition |
|
adjustment |
|
deducted in |
|
Unearned |
|
premiums |
|
investment |
|
current |
|
prior |
|
acquisition |
|
adjustment |
|
premiums |
|
|
Column A |
|
|
|
costs |
|
expenses (1) |
|
Column C |
|
premiums (2) |
|
earned (3) |
|
income (4) |
|
year (5) |
|
year (6) |
|
costs (7) |
|
expenses (8) |
|
written (9) |
|
|
Montpelier Bermuda: |
|
|
|
|
|
|
|
|
|
|
|
|
|
|
|
|
|
|
|
|
|
|
|
|
|
|
|
|
2014 |
|
$ |
19.7 |
|
$ |
408.8 |
|
$ |
— |
|
$ |
131.6 |
|
$ |
315.9 |
|
$ |
40.6 |
|
$ |
148.2 |
|
$ |
(125.2 |
) |
$ |
37.1 |
|
$ |
131.6 |
|
$ |
314.3 |
|
|
|
|
2013 |
|
18.9 |
|
520.9 |
|
— |
|
130.6 |
|
359.2 |
|
57.7 |
|
123.7 |
|
(106.7 |
) |
34.4 |
|
185.3 |
|
353.6 |
|
|
|
|
2012 |
|
17.2 |
|
728.2 |
|
— |
|
139.1 |
|
369.5 |
|
63.2 |
|
205.4 |
|
(45.9 |
) |
40.5 |
|
174.8 |
|
380.7 |
|
|
|
|
|
|
|
|
|
|
|
|
|
|
|
|
|
|
|
|
|
|
|
|
|
|
|
|
|
Montpelier at Lloyd’s: |
|
|
|
|
|
|
|
|
|
|
|
|
|
|
|
|
|
|
|
|
|
|
|
|
|
|
|
|
2014 |
|
$ |
32.5 |
|
$ |
349.8 |
|
$ |
— |
|
$ |
134.6 |
|
$ |
244.8 |
|
$ |
4.5 |
|
$ |
169.8 |
|
$ |
(27.5 |
) |
$ |
59.9 |
|
$ |
102.3 |
|
$ |
253.3 |
|
|
|
|
2013 |
|
31.5 |
|
337.3 |
|
— |
|
135.5 |
|
213.7 |
|
5.4 |
|
145.0 |
|
(39.1 |
) |
52.6 |
|
123.7 |
|
212.2 |
|
|
|
|
2012 |
|
31.2 |
|
354.0 |
|
— |
|
131.0 |
|
217.3 |
|
2.9 |
|
148.6 |
|
(41.0 |
) |
46.6 |
|
99.2 |
|
230.1 |
|
|
|
|
|
|
|
|
|
|
|
|
|
|
|
|
|
|
|
|
|
|
|
|
|
|
|
|
|
Collateralized Reinsurance: |
|
|
|
|
|
|
|
|
|
|
|
|
|
|
|
|
|
|
|
|
|
|
|
|
|
|
|
|
2014 |
|
$ |
1.1 |
|
$ |
12.4 |
|
$ |
— |
|
$ |
9.4 |
|
$ |
84.6 |
|
$ |
0.2 |
|
$ |
23.4 |
|
$ |
(0.2 |
) |
$ |
13.2 |
|
$ |
11.4 |
|
$ |
83.4 |
|
|
|
|
2013 |
|
1.1 |
|
0.6 |
|
— |
|
10.6 |
|
26.2 |
|
— |
|
2.2 |
|
— |
|
3.2 |
|
1.6 |
|
36.8 |
|
|
|
|
2012 |
|
— |
|
— |
|
— |
|
— |
|
2.4 |
|
— |
|
— |
|
— |
|
0.1 |
|
— |
|
2.4 |
|
(1) Excludes amounts related to Montpelier’s Corporate and Other operations and inter-segment eliminations of $4.7 million, $22.8 million and $30.2 million for 2014, 2013 and 2012, respectively.
(2) Excludes amounts related to Montpelier’s Corporate and Other operations of $(0.2) million, zero and zero for 2014, 2013 and 2012, respectively.
(3) Excludes amounts related to Montpelier’s Corporate and Other operations of $(0.1) million,$0.5 million and $27.3 million for 2014, 2013 and 2012, respectively.
(4) Excludes amounts related to Montpelier’s Corporate and Other operations of $1.5 million, $0.9 million and $1.0 million for 2014, 2013 and 2012, respectively.
(5) Excludes amounts related to Montpelier’s Corporate and Other operations of zero million, zero million and $19.8 million for 2014, 2013 and 2012, respectively.
(6) Excludes amounts related to Montpelier’s Corporate and Other operations of $1.1 million, $1.4 million and $(0.5) million for 2014, 2013 and 2012, respectively.
(7) Excludes amounts related to Montpelier’s Corporate and Other operations of zero million, $0.3 million and $9.4 million for 2014, 2013 and 2012, respectively.
(8) Excludes amounts related to Montpelier’s Corporate and Other operations of $13.1 million, $13.7 million and $14.1 million for 2014, 2013 and 2012, respectively.
(9) Excludes amounts related to Montpelier’s Corporate and Other operations of $(0.1) million, $0.5 million and $2.5 million for 2014, 2013 and 2012, respectively.
FS-6