
Annual Report for the year ended December 31, 2024
Calpine Corporation
(A Delaware Corporation)
I.R.S. Employer Identification No. 77-0212977 717
Texas Avenue, Suite 1000, Houston, Texas 77002
Telephone: (713) 830-2000
CALPINE CORPORATION AND SUBSIDIARIES
ANNUAL REPORT
For the Year Ended December 31, 2024
TABLE OF CONTENTS
| Page | ||
| PART I | ||
| Item 1. | Business | 3 |
| Item 1A. | Risk Factors | 24 |
| Item 1B. | Unresolved Staff Comments | 39 |
| Item 2. | Properties | 39 |
| Item 3. | Legal Proceedings | 39 |
| Item 4. | Mine Safety Disclosures | 39 |
| PART II | ||
| Item 5. | Market for Registrant’s Common Equity, Related Stockholder Matters and Issuer Purchases of Equity Securities | 40 |
| Item 7. | Management’s Discussion and Analysis of Financial Condition and Results of Operations | 41 |
| Item 7A. | Quantitative and Qualitative Disclosures about Market Risk | 60 |
| Item 8. | Financial Statements and Supplementary Data | 62 |
| Item 9. | Changes in and Disagreements with Accountants on Accounting and Financial Disclosure | 62 |
| Item 9B. | Other Information | 62 |
| PART III | ||
| Item 10. | Directors, Executive Officers and Corporate Governance | 63 |
| Item 12. | Security Ownership of Certain Beneficial Owners and Management and Related Stockholder Matters | 66 |
| Item 13. | Certain Relationships and Related Transactions and Director Independence | 67 |
| Item 14. | Principal Accounting Fees and Services | 68 |
| PART IV | ||
| Item 15. | Exhibits, Financial Statement Schedule | 69 |
| Item 16. | Form 10-K Summary | 73 |
| Signatures | 74 | |
| Index to Consolidated Financial Statements | 75 | |
| i |
DEFINITIONS
As used in this report for the year ended December 31, 2024 (this “Report”), the following abbreviations and terms have the meanings as listed below. Additionally, the terms “Calpine,” “we,” “us,” “our,” and "the Company" refer to Calpine Corporation and its consolidated subsidiaries unless the context clearly indicates otherwise. The term “Calpine Corporation” refers only to Calpine Corporation and not to any of its subsidiaries. Unless and as otherwise stated, any references in this Report to any agreement means such agreement and all schedules, exhibits and attachments in each case as amended, restated, supplemented or otherwise modified to the date of the issuance of this Report.
| ABBREVIATION | DEFINITION | |
| 2026 First Lien Notes | Collectively, the $625 million initial aggregate principal amount of 5.25% Senior Secured Notes due 2026, issued May 31, 2016, and the $560 million initial aggregate principal amount of 5.25% Senior Secured Notes due 2026, issued December 15, 2017. | |
| 2026 First Lien Term Loans | Collectively, the $950 million first lien senior secured term loan, issued April 5, 2019, and the $750 million first lien senior secured term loan, issued August 12, 2019. | |
| 2027 First Lien Term Loan | The $1.0 billion first lien senior secured term loan, issued December 16, 2020. In January 2024, we amended our 2027 First Lien Term Loan to reduce the applicable margin. | |
| 2028 First Lien Notes | The $1.25 billion initial aggregate and current outstanding principal amount of 4.50% senior secured notes due 2028, issued December 20, 2019. | |
| 2028 Senior Unsecured Notes | The $1.4 billion initial aggregate and current outstanding principal amount of 5.125% senior unsecured notes due 2028, issued December 27, 2019. | |
| 2029 Senior Unsecured Notes | The $650 million initial aggregate and current outstanding principal amount of 4.625% senior unsecured notes due 2029, issued August 10, 2020. | |
| 2031 First Lien Term Loans | The $1.7 billion first lien senior secured term loan are our legacy 2026 First Lien Term Loans as refinanced in January 2024, and repriced and consolidated in December 2024 extending the maturity. | |
| 2031 First Lien Notes | The $900 million initial aggregate and current outstanding principal amount of 3.75% senior secured notes due 2031, issued December 16, 2020. | |
| 2031 Senior Unsecured Notes | The $850 million initial aggregate and current outstanding principal amount of 5.00% senior unsecured notes due 2031, issued August 10, 2020. | |
| 2032 First Lien Term Loan | The $1.0 billion first lien senior secured term loan are our legacy 2027 First Lien Term Loans as refinanced in December 2024 extending the maturity. | |
| AB | Assembly Bill | |
| AB 32 | California Assembly Bill 32 | |
| Accounts Receivable Sales Program | The receivables purchase agreement between Calpine Solutions and Calpine Receivables and the purchase and sale agreement between Calpine Receivables and an unaffiliated financial institution, which together, allows for the revolving sale of up to $500 million in certain trade accounts receivables to third parties. | |
| AOCI | Accumulated Other Comprehensive Income | |
| ASC | Accounting Standards Codification | |
| ASU | Accounting Standards Update | |
| Average Availability | Represents the total hours during the period that our plants were in-service or available for service as a percentage of the total hours in the period. |
| ii |
| ABBREVIATION | DEFINITION | |
| Average Capacity Factor, excluding Peakers | A measure of total actual power generation as a percent of total potential power generation. It is calculated by dividing (1) the total MWh generated by our power plants, excluding peakers, by (2) the product of multiplying (a) the average total MW in operation, excluding peakers, during the period by (b) the total hours in the period. | |
| BART | Best Achievable Retrofit Technology | |
| Board of Directors | Calpine Corporation Board of Directors | |
| Btu | British thermal unit(s), a measure of heat content | |
| CAA | Federal Clean Air Act, U.S. Code Title 42, Chapter 85 | |
| CAISO | California Independent System Operator is an entity that manages the power grid and operates the competitive power market in California. | |
| CAMT | Corporate Alternative Minimum Tax | |
| CARB | California Air Resources Board | |
| Calpine Receivables | Calpine Receivables, LLC, an indirect, wholly-owned subsidiary of Calpine, was established as a bankruptcy-remote, special-purpose subsidiary and is responsible for administering the Accounts Receivable Sales Program. | |
| Calpine Solutions | Calpine Energy Solutions, LLC, an indirect, wholly-owned subsidiary of Calpine, is a supplier of power to commercial and industrial retail customers in the United States with customers in 18 states, including presence in California, Texas, the Mid-Atlantic and the Northeast. | |
| Cap-and-Trade | A government-imposed emissions reduction program that would place a cap on the amount of emissions that can be emitted from certain sources, such as power plants. In its simplest form, the cap amount is set as a reduction from the total emissions during a base year, and for each year over a period of years, the cap amount would be reduced to achieve the targeted overall reduction by the end of the period. Allowances or credits for emissions equal to the cap would be issued or auctioned to companies with facilities, permitting them emissions up to a specified cap during each applicable period. After allowances have been distributed or auctioned, they can be transferred or traded. | |
| CCA | Community Choice Aggregators (CCA) are local governments that procure power on behalf of their residents, businesses and municipal accounts from an alternative supplier while still receiving transmission and distribution services from their existing utility. | |
| CCFC | Calpine Construction Finance Company, L.P. (CCFC), is an indirect, wholly-owned subsidiary of Calpine. | |
| CCFC Term Loan | The $1.9 billion first lien senior secured term loan dated December 15, 2017, as amended on June 6, 2024, and September 16, 2024, issued by CCFC and due July 31, 2030. | |
| CCUS | Carbon capture, utilization and storage. | |
| CDHI | Calpine Development Holdings, LLC (CDHI) is an indirect, wholly-owned subsidiary of Calpine. | |
| CDHI Credit Agreement | The approximately $1.2 billion aggregate amount letter of credit, reimbursement, and revolving credit agreement dated March 29, 2023, as amended and restated, issued by CDHI Intermediate Holdco, LLC and Calpine York Holdings, LLC. | |
| CERCLA | Comprehensive Environmental Response, Compensation and Liability Act | |
| CFTC | Commodities Futures Trading Commission (CFTC) | |
| Chapter 11 | Chapter 11 of the U.S. Bankruptcy Code |
| iii |
| ABBREVIATION | DEFINITION | |
| Class A Common Shares | The common stock class of the Company held by CPN Management, L.P. and comprising 95.14% of all common stock outstanding of Calpine. Class A common shares retain all voting rights in relation to Calpine as well as the rights and obligations as specified under the Stockholders Agreement and the Fifth Amended and Restated Certificate of Incorporation of Calpine. | |
| Class B Common Shares | Class of common stock of the Company comprising 4.86% of all common stock outstanding. Class B common shares have no voting rights in relation to Calpine. The rights and obligations of this class of common shares are specified under the Stockholders Agreement and the Fifth Amended and Restated Certificate of Incorporation of Calpine. | |
| CO2 | Carbon dioxide | |
| Cogeneration | The use of all or portion of the steam generated in the power generating process to supply a customer with the steam for use in the customer's operations. | |
| Commodity Expense | The sum of our expenses from fuel and purchased energy expense, commodity transmission and transportation expense, environmental compliance expense, ancillary retail expense and realized settlements from our marketing, hedging and optimization activities, including natural gas and fuel oil transactions hedging future power sales. | |
| Commodity-linked Revolver | The $1.8 billion commodity-linked revolving credit facility between Calpine Corporation, as a borrower, the lender's parties thereto, MUFG Bank, Ltd., as administrative agent, and MUFG Union Bank, N.A., as collateral agent, dated July 21, 2022, as amended. In July 2024, the facility was extended for a term through July 18, 2025. | |
| Commodity Margin | Commodity Margin is a non-GAAP measure of segment profit or loss under FASB ASC 280, which is used by our chief operating decision maker to assess segment performance and make decisions about allocating resources to specific segments. Commodity Margin is calculated as Commodity revenue less Commodity expense, adjusted to exclude one-time and non-cash GAAP-related items including, but not limited to, levelization adjustments to revenues required on long-term PPA contracts and non-cash amortization of intangible assets/liabilities associated with contracts recorded at fair value. | |
| Commodity Revenue | Revenues recognized on our wholesale and retail power sales activity, electric capacity sales, REC sales, steam sales and realized settlements from our marketing, hedging, optimization and trading activities, excluding natural gas and fuel oil transactions, which are reflected in Commodity expense. | |
| Company | Calpine Corporation, a Delaware corporation and its subsidiaries | |
| Corporate Revolving Facility | The approximately $2.5 billion aggregate amount revolving credit facility agreement, dated December 10, 2010, as amended. | |
| CPN Management | CPN Management, L.P., which owns all of the Class A common shares of Calpine Corporation as of December 31, 2024. | |
| CPUC | California Public Utilities Commission | |
| CSAPR | Cross-State Air Pollution Rule | |
| DOJ | Department of Justice | |
| EBITDA | Earnings (Net Income) Before Interest, Taxes, Depreciation and Amortization | |
| EGU | Electric Generating Units | |
| EIA | Energy Information Administration of the U.S. Department of Energy | |
| EPA | U.S. Environmental Protection Agency |
| iv |
| ABBREVIATION | DEFINITION | |
| ERCOT | Electric Reliability Council of Texas, which is an entity that manages the flow of electric power to Texas customers representing approximately 90% of the state’s electric load. | |
| FASB | Financial Accounting Standards Board | |
| FDIC | U.S. Federal Deposit Insurance Corporation | |
| FERC | U.S. Federal Energy Regulatory Commission | |
| First Lien Notes | Collectively, the 2026 First Lien Notes, the 2028 First Lien Notes and the 2031 First Lien Notes | |
| First Lien Term Loans | Collectively, the 2032 First Lien Term Loan and the 2031 First Lien Term Loans | |
| Geysers Assets | Our geothermal power plant assets, including our steam extraction and gathering assets, located in northern California consisting of 13 operating power plants. | |
| GHGs | Greenhouse gas(es), primarily carbon dioxide (CO2), including methane (CH4), nitrous oxide (N2O), sulfur hexafluoride (SF6), hydrofluorocarbons (HFCs) and perfluorocarbons (PFCs) | |
| GPC | Geysers Power Company, LLC, an indirect, wholly-owned subsidiary of Calpine | |
| GPC Term Loan | The $1.8 billion first lien senior secured term loan and $250 million letter of credit facility issued by GPC on June 9, 2020, and subsequently amended on November 9, 2021, and May 31, 2022. | |
| Greenfield LP | Effective September 5, 2023, Greenfield Energy Centre LP, became an indirect, wholly-owned subsidiary of Calpine, after our purchase of the partnership’s outstanding 50% ownership interest from a third party. Prior to September 5, 2023, we owned 50% of the ownership interest of Greenfield LP. | |
| Greenfield Term Loan Facility | The loan agreement issued by Greenfield LP in 2008, as amended, comprised of a Term Facility of $500 million CAD, a revolving working capital facility of $48 million CAD, and two other letter of credit facilities. | |
| Gregory Power Holdings, LLC | Gregory Power Holdings, LLC owns and operates a 385 MW combined cycle generation facility located in Corpus Christi, Texas. Effective December 29, 2023, Calpine Corporation, through a wholly-owned subsidiary, purchased an investment in Gregory Power Holdings, LLC, with the remaining ownership interest in the entity held by a third party, Gregory Power Investments, LLC. | |
| Heat Rate(s) | A measure of the amount of fuel required to produce a unit of power. | |
| ICE | Intercontinental Exchange | |
| IESO | Independent Electricity System Operator, which operates the electricity market in the province of Ontario, Canada. | |
| IRA | Inflation Reduction Act of 2022, signed into law on August 16, 2022, created a new corporate alternative minimum tax effective for periods beginning after December 31, 2022, and includes provisions intended to mitigate climate change by, among others, providing tax credit incentives for reductions in greenhouse gas emissions. | |
| IRS | U.S. Internal Revenue Service | |
| ISO(s) | Independent System Operator(s), which is an entity that coordinates, controls and monitors the operation of an electric power system. | |
| ISO-NE | ISO New England Inc., is an independent nonprofit RTO serving states in the New England area, including Connecticut, Maine, Massachusetts, New Hampshire, Rhode Island and Vermont. |
| v |
| ABBREVIATION | DEFINITION | |
| ITC | Investment Tax Credit | |
| KWh | Kilowatt hour(s), a measure of power produced, purchased, or sold. | |
| LIBOR | London Inter-Bank Offered Rate, effective July 1, 2023, all outstanding debt agreements and interest rate instruments priced against LIBOR were converted from LIBOR to SOFR. | |
| LTSA(s) | Long-Term Service Agreement(s) | |
| Lyondell | LyondellBasell Industries N.V. | |
| Market Heat Rate(s) | The regional power price divided by the corresponding regional natural gas price. | |
| MATS | Mercury and Air Toxics Standards | |
| Merger | Merger of Volt Merger Sub, Inc. with and into Calpine under the terms of the Merger Agreement, which was consummated on March 8, 2018. | |
| MMBtu | Million Btu | |
| MW | Megawatt(s), a measure of plant capacity | |
| MWh | Megawatt hour(s), a measure of power produced, purchased, or sold | |
| NAAQS | National Ambient Air Quality Standards | |
| NERC | North American Electric Reliability Council | |
| NOL(s) | Net operating loss(es) | |
| Nova Power, LLC | An indirect, wholly-owned subsidiary of Calpine that is constructing the Nova Power Battery Storage Facilities. | |
| Nova Credit Agreement | A credit agreement issued by Nova Power, LLC on December 21, 2023, comprising of certain credit facilities totaling more than $1 billion, including (a) a construction facility in an aggregate principal amount of $655 million, (b) a bridge facility in an aggregate principal amount of $256 million, available until the facility’s investment tax credits are received and (c) letter of credit facilities available to support various obligations with $94 million of total available capacity. The bridge facility was fully repaid in September 2024. The credit agreement was converted to a first lien term loan on October 31, 2024. | |
| NOx | Nitrogen oxides | |
| NPCC | Northeast Power Coordinating Council | |
| NPNS | Normal purchase-normal sale | |
| NYISO | New York ISO which operates competitive wholesale markets to manage the flow of electricity across New York. | |
| NYMEX | New York Mercantile Exchange | |
| OCI | Other Comprehensive Income | |
| OTC | Over-the-Counter |
| vi |
| ABBREVIATION | DEFINITION | |
| PJM | PJM Interconnection is an RTO that coordinates the movement of wholesale electricity in all or parts of Delaware, Illinois, Indiana, Kentucky, Maryland, Michigan, New Jersey, North Carolina, Ohio, Pennsylvania, Tennessee, Virginia, West Virginia and the District of Columbia. | |
| PPAs | Any term power purchase agreement or other contract for a physically settled sale (as distinguished from a financially settled future, option, or swap) of any power product, including power, capacity and/or ancillary services, in the form of a bilateral agreement or a written or oral confirmation of a transaction between two parties to a master agreement, including sales related to a tolling transaction in which the purchaser provides the fuel required by us to generate such power and we receive a variable payment to convert the fuel into power and steam. | |
| PUCT | Public Utility Commission of Texas | |
| QFs | Qualifying facilities are cogeneration facilities and certain small power production facilities eligible to be “qualifying facilities” under PURPA, provided that they meet certain power and thermal energy production requirements and efficiency standards. QF status provides an exemption from the books and records requirement of PUHCA 2005 and grants certain other benefits to the QF. | |
| RECs | Renewable energy credit(s) | |
| Report | This Annual Report for the year ended December 31, 2024, posted to our website on February 18, 2025. | |
| RFC | Reliability First Corporation | |
| RGGI | Regional Greenhouse Gas Initiative | |
| Risk Management Policy | Calpine’s policy applicable to all employees, contractors, representatives and agents, which defines the risk management framework and corporate governance structure for commodity risk, interest rate risk, currency risk and other risks. | |
| RMR Contract(s) | Reliability Must Run contract(s) | |
| RPS | Renewable Portfolio Standard | |
| RTO(s) | Regional Transmission Organization(s) are entities that coordinate, control and monitor the operation of an electric power system and administrate the transmission grid on a regional basis. | |
| SEC | U.S. Securities and Exchange Commission | |
| Senior Unsecured Notes | Collectively, the 2028 Senior Unsecured Notes, the 2029 Senior Unsecured Notes and the 2031 Senior Unsecured Notes. | |
| SERC | Southeastern Electric Reliability Council | |
| SIP | State Implementation Plans | |
| SO2 | Sulfur dioxide | |
| SOx | Sulfur oxides | |
| SOFR | A rate equal to the secured overnight financing rate as administered by the Federal Reserve Bank of New York. | |
| Spark Spread(s) | The difference between the sales price of power per MWh and the cost of natural gas to produce it. |
| vii |
| ABBREVIATION | DEFINITION | |
| Steam Adjusted Heat Rate | The adjusted Heat Rate for our natural gas-fired power plants, excluding peakers. It is calculated by dividing (a) the fuel consumed in Btu, reduced by the net equivalent Btu in steam exported to a third party by (b) the KWh generated. Steam Adjusted Heat Rate is a measure of fuel efficiency, so the lower our Steam Adjusted Heat Rate, the lower our cost of generation. | |
| Stockholders Agreement | Collectively, the Stockholders Agreement of Calpine Corporation, dated March 8, 2018, and the First Amended and Restated Stockholders Agreement of Calpine Corporation, dated June 13, 2022, by and between Calpine Corporation and CPN Management, L.P., and such other stockholders who become parties thereto from time to time. | |
| TRE | Texas Reliability Entity, Inc. | |
| U.S. GAAP | Generally accepted accounting principles in the U.S. | |
| VAR | Value-at-risk | |
| VIE(s) | Variable interest entity(ies) | |
| WECC | Western Electricity Coordinating Council | |
| Winter Storm Uri | A winter weather event in Texas during February 2021 that resulted in temperatures well below freezing for more than five days and ERCOT declaring a system emergency and initiating firm load shedding, or blackouts, from February 15, 2021, through February 19, 2021. |
| viii |
FORWARD-LOOKING STATEMENTS
This Report includes forward-looking statements that reflect our current views with respect to, among other things, our operations and financial performance. Forward-looking statements include all statements that are not historical facts. These forward-looking statements are included throughout this Report, including, without limitation, the “Management’s Discussion and Analysis” section. We have used the words “anticipate,” “assume,” “believe,” “continue,” “could,” “estimate,” “expect,” “intend,” “may,” “plan,” “potential,” “predict,” “project,” “future,” “will,” “seek,” “foreseeable,” “should,” the negative version of these words or similar terms and phrases to identify forward-looking statements.
The forward-looking statements contained in this Report are based on management’s current expectations and are not guarantees of future performance. The forward-looking statements are subject to various risks, uncertainties, assumptions, or changes in circumstances that are difficult to predict or quantify. Our expectations, beliefs and projections are expressed in good faith, and we believe there is a reasonable basis for them. However, there can be no assurance that management’s expectations, beliefs and projections will result or be achieved. Actual results may differ materially from these expectations due to changes in global, regional, or local economic, business, competitive, market, regulatory and other factors, many of which are beyond our control. We believe that these factors include but are not limited to those described under the “Management’s Discussion and Analysis” section.
The statements we make regarding the following matters are forward-looking by their nature:
| · | Financial results that may be volatile and may not reflect historical trends due to, among other things, seasonality and other changes in demand, fluctuations in prices for commodities such as natural gas and power, changes in U.S. macroeconomic conditions, fluctuations in liquidity and volatility in the energy commodities markets and our ability and the extent to which we hedge risks; |
| · | Laws, regulations and market rules in the wholesale and retail markets in which we participate and our ability to effectively respond to changes in laws, regulations, or market rules or the interpretation thereof, including those related to the environment, derivative transactions and market design in the regions in which we operate; |
| · | Our ability to manage interest rate risk, our liquidity needs, including collateral requirements, access the capital markets when necessary and comply with covenants under our Senior Unsecured Notes, First Lien Term Loans, First Lien Notes, Corporate Revolving Facility, Calpine Development Holdings, LLC Credit Agreement (“CDHI Credit Agreement”), Calpine Construction Finance Company, L.P. Term Loan (“CCFC Term Loan”), Geysers Power Company Term Loan (“GPC Term Loan”) and other existing financing obligations; |
| · | Risks associated with the operation, construction and development of power plants, battery storage facilities and carbon capture facilities, including unscheduled outages or delays and plant efficiencies; |
| · | Risks related to our geothermal resources, including the adequacy of our steam reserves, unusual or unexpected steam field well and pipeline maintenance requirements, variables associated with the injection of water to the steam reservoir, and potential regulations or other requirements related to seismicity concerns that may delay or increase the cost of developing or operating geothermal resources; |
| · | Extensive competition in our wholesale and retail businesses, including challenges from renewable sources of power, interference by states in competitive power markets through subsidies or similar support for new or existing power plants, new and existing federal subsidies, lower prices and other incentives offered by retail competitors and other risks associated with marketing and selling power in the evolving energy markets; |
| · | Structural changes in the supply and demand of power, resulting from the development of new fuels or technologies and continued development of demand-side management tools (such as power storage, distributed generation and other technologies); |
| · | The expiration or early termination of our power purchase agreements (“PPAs”) and the related results on revenues; |
| · | Future capacity revenue may not occur at expected levels; |
| · | Natural disasters, such as hurricanes, earthquakes, droughts, floods, extreme winter weather and wildfires, acts of terrorism or cyber-attacks that may affect our power plants and battery storage facilities or the markets our power plants, battery storage facilities, or retail operations serve and our corporate offices as well as pandemics, such as COVID-19, and the impact on our business, suppliers, customers, employees and supply chains; |
| · | Disruptions in or limitations on the transportation of natural gas or fuel oil and the transmission of power; |
1
| · | Our ability to manage our counterparty and customer exposure and credit risk, including our commodity positions or if a significant customer were to seek bankruptcy protection under Chapter 11 of the U.S. Bankruptcy Code; |
| · | Our ability to attract, motivate and retain key employees; |
| · | The impact of changes to federal and state legislative and tax regulations, including, but not limited, to the Inflation Reduction Act (“IRA”) and all corresponding rules and regulations on our financial condition, results of operations or cash flows; |
| · | Present and possible future claims and litigation, including litigation arising out of Winter Storm Uri and enforcement actions that may arise from noncompliance with market rules promulgated by the U.S. Securities and Exchange Commission (“SEC”), Commodities Futures Trading Commission (“CFTC”), U.S. Federal Energy Regulatory Commission (“FERC”) and other regulatory bodies; and |
| · | Other risks identified in this Report. |
Given the risks and uncertainties surrounding forward-looking statements, you should not place undue reliance on these statements. Many of these factors are beyond our ability to control or predict. Our forward-looking statements speak only as of the date of this Report. Factors or events that could cause our actual results to differ may emerge from time to time, and it is not possible for us to predict all of them. We may not actually achieve the plans, intentions or expectations disclosed in our forward-looking statements, and you should not place undue reliance on our forward-looking statements. We undertake no obligation to publicly update or review any forward-looking statement, whether because of new information, future developments, or otherwise, except as may be required by any applicable securities laws.
Where You Can Find Other Information
Our website is www.calpine.com. Information contained on our website is not part of this Report. Our historical SEC filings made prior to August 21, 2020, including exhibits filed therewith, are available directly on the SEC’s website at www.sec.gov. As of August 21, 2020, we ceased filing all reports with the SEC. All future financial reports will be posted on our website. In November 2024, we issued our 2023 sustainability report, which is posted on our website and highlights Calpine’s (“Calpine Corporation," "the Company” or “CALPINE CORP”) performance through an environmental, social and governance (“ESG”) perspective. The report content and disclosures were developed with consideration from the Global Reporting Initiative Standards and Sustainability Accounting Standards Board Standard for Electric Utilities and Power Generators.
2
PART I
Item 1. BUSINESS
Business and Strategy
Calpine is America’s largest generator of electricity from natural gas and geothermal resources, according to S&P Global Market Intelligence. We sell electricity and other related energy products to load-serving entities such as utilities and public power customers, end users such as commercial, industrial and residential customers and to state and regional wholesale market operators. We have a significant presence in the major competitive wholesale and retail power markets in California, Texas and the Northeast and Mid-Atlantic regions of the United States. We own and operate approximately 28 Gigawatts (“GW”) of power facilities, enough to power approximately 27 million homes, consisting of natural gas, geothermal, solar and battery storage assets.
Our business strategy is to deliver long-term value to our stockholders and customers by focusing on operational excellence and a disciplined capital allocation strategy.
Since our inception in 1984, we have led the way in helping America move towards cleaner electricity. We believe our continued investment in sustainable power generation technologies has positioned us as a leader in developing, constructing, owning and operating an environmentally responsible portfolio of flexible and reliable power plants. Data gathered by the EIA show that our Geysers Assets (“Geysers,” or “The Geysers”), located in northern California, represent the largest geothermal power generation portfolio in the United States (“U.S.”), as well as the largest single renewable energy asset in California. Our modern natural gas fleet serves as a key part of the backbone of the U.S. electrical grid, enabling the transition away from coal-fired generation and the growth of intermittent renewable resources while maintaining reliability. We have championed environmental progress in the power sector through our own investments and by supporting government rules and regulations related to air emissions and water use. We have remained committed to these founding principles while expanding our portfolio geographically across the United States and into new, low-emission generation technologies. With one of the largest gas-fired generation fleets in California, Texas, the Mid-Atlantic and New England, we have a significant presence in these markets, which provides us with operational and strategic benefits.
We are pursuing an “inside-out” growth strategy, starting with our people, our capabilities, our sites and our power plants. This strategy includes a major effort to organically grow our retail businesses, a modest expansion of our geothermal footprint at The Geysers, our large-scale energy storage development effort — initially in the West and with expectations to expand in the East and potentially most significantly an industry-leading effort to attempt to develop profitable CCS facilities at natural gas plants.
Our wholesale customers include utilities, municipalities, cooperatives, retail power providers, large industrial companies, power marketers and governmental entities. We manage our portfolio through a combination of long-term customer contracts, forward hedging transactions and spot market participation. Our customer focus and relationships enable mutually beneficial opportunities through customized contract structures. For example, we operate the largest cogeneration fleet in the United States. Our cogeneration fleet is composed of plants that offer not only power but also steam products to our customers. By offering both steam and power, we provide efficient and reliable thermal and power products that are highly customized for our wholesale industrial customers.
Proposed Merger
On January 10, 2025, the Company announced that it entered into an Agreement and Plan of Merger (the "Plan of Merger Agreement") with Constellation Energy Corporation ("Constellation") under which Constellation will acquire Calpine in a cash and stock transaction. See Part II, Item 7. Management Discussion and Analysis and Note 19 to the Consolidated Financial Statements for additional details relating to the Plan of Merger Agreement and 1A. Risk Factors for a discussion of the risks related to the Plan of Merger Agreement.
Reportable Segments
We operate four reportable segments based primarily on region. We assess our business on a regional basis due to the effects that the differing characteristics of these regions have on our financial performance, particularly concerning competition, regulation and other factors affecting supply and demand. Our four reportable segments are:
| · | West: Includes our power plants and battery storage facilities located in California in the CAISO region, as well as our power plants in Arizona and Oregon; |
3
| · | Texas: Includes our power plants located in the ERCOT region; |
| · | East: Includes our power plants located in PJM, ISO-NE, NYISO, MISO, SERC and the Canadian IESO; and |
| · | Retail: Includes our retail operations throughout the country. |
See Note 18, Segment and Significant Customer Information of the Consolidated Financial Statements, for a discussion of financial information by reportable segment and geographic area and significant customer information for the years ended December 31, 2024, 2023 and 2022.
Our Core Business Functions
We manage our platform through five core business functions: 1) power plant operational excellence; 2) wholesale hedging and optimization and a customer-focused origination effort; 3) new asset development efforts, including power plants, energy storage, and potential carbon capture for sequestration; 4) retail businesses that provide products directly to end customers; and 5) active external engagement with our communities, regulators and governments, including on behalf of our customers. Our business functions leverage relationships and knowledge from each business, employ skilled, cross-functional teams and benefit from our scale to drive development opportunities and make informed commercial decisions. Our ability to leverage the entire Calpine platform allows us to provide innovative and cross-functional solutions to customers. Calpine’s core competencies are complementary, providing the business with a value greater than the sum of each of its individual parts. Our scale and operational expertise across these five functions allow us to proactively pursue growth opportunities, placing us at a competitive advantage over companies only involved in a subset of these five functions.
Our Markets
Calpine operates across eight wholesale power markets in the United States and Canada. Approximately 87% of Calpine’s electrical generation, as measured by our capacity, is concentrated within CAISO, ERCOT, PJM and ISO-NE.
CAISO
CAISO covers customers primarily in California, managing the dispatch of installed capacity to 32 million customers. Approximately 7.2 GW, or 26% of our generation fleet as measured by net interest with peaking operates within CAISO as of December 31, 2024. Our portfolio within CAISO is 11% geothermal, 88% natural gas-fired, and 1% storage. Operating as a fully functioning ISO since 1998, CAISO is a competitive wholesale electricity market with day-ahead and real-time energy markets, ancillary services and congestion revenue rights. The CAISO also operates a real-time imbalance market across much of the West. Although CAISO does not operate a centralized capacity market, it does use mandatory resource requirements supported through bilateral contracts in its Resource Adequacy (“RA”) program.
California is pursuing ambitious climate and energy policies with the goal of transitioning away from carbon-emitting fuels and toward cleaner energy sources. These cleaner energy sources include solar, wind and geothermal. In 2022, Governor Gavin Newsom set benchmarks for the state to reach 90% carbon-free electricity, inclusive of post-combustion carbon capture gas units, by 2035 to keep pace with the state’s previously stated goal of reaching 100% by 2045. To grow the state’s renewable energy portfolio, the RPS required California utilities procure 33% of retail sales from renewable resources by 2020 and will require 60% come from renewable sources by 2030. The state’s aggressive energy transition agenda has come alongside operational challenges as it works through its transition. Rolling blackouts throughout the state forced California officials to delay the retirement of three gas-fired power plants in 2023, extending their lives through 2026. These delays allowed the state to retain essential gas-fired power to maintain grid reliability during extreme weather events like wildfires and heat waves.
ERCOT
ERCOT coordinates the movement of electricity to 27 million customers in Texas. Approximately 9.7 GW, or 35% of our generation fleet, as measured by net interest with peaking, operates within ERCOT as of December 31, 2024. Our portfolio in ERCOT is comprised entirely of natural gas generation. ERCOT is a competitive electricity market that manages approximately 90% of Texas’ load and an electric grid covering approximately 75% of the state. ERCOT oversees transactions associated with Texas’ competitive wholesale and retail power markets and does not operate a capacity market.
ERCOT has seen weather-related disruptions, including extreme cold weather of winter storms Uri in 2021. With electric demand and load forecasted to grow substantially in the coming years, ERCOT President and CEO Pablo Vegas unveiled a comprehensive strategy in April 2024, called the New Era of Planning, designed to ensure all areas of system planning, including generation, load interconnections and transmission development, can meet the state’s growing energy needs. In July 2024, State representatives announced their intent to double the Texas Energy Fund from $5 billion to $10 billion to incentivize the construction of new gas-fired power plants.
4
PJM
PJM serves a population of 65 million in all or parts of 13 states and the District of Columbia. Approximately 5.3 GW, or 19% of our generation fleet, as measured by net interest with peaking, operates within PJM as of December 31, 2024. Our portfolio within PJM is 86% gas-fired generation and 14% steam as of December 31, 2024. All of our gas-fired generation facilities in PJM are dual-fuel systems that can also run on oil. This enables our fleet to continue operating during periods when gas may be constrained, such as recent winter storms. PJM is a competitive wholesale electricity market that consists of a locationally based energy market, a forward capacity market and ancillary service markets.
PJM is the largest and one of the most advanced power markets in the United States, with a capacity market, intended to ensure the future availability of power supplies three years in advance.
PJM may see a significant retirement of coal in the future due to issues arising from aging assets, competitive gas-fired generation and environmental targets. To offset these retirements and prepare for growing electric demand in the region, the ISO is scheduled to increase renewables. However, a recent report from independent developers in PJM suggested that most new generation is unlikely to come online before 2030 due to barriers in the grid interconnection and transmission planning processes. Additionally, PJM has implemented winter readiness measures to bolster system reliability in reaction to recent extreme weather events like Winter Storm Elliott, which resulted in the temporary shutdown of more than 25% of PJM’s generation fleet and led to load shedding in four nearby states in territories outside of PJM’s footprint.
ISO-NE
ISO-NE manages installed capacity across six states — Connecticut, Maine, Massachusetts, New Hampshire, Rhode Island and Vermont. Approximately 2.0 GW, or 7% of our generation fleet, as measured by net interest with peaking, operates within ISO-NE as of December 31, 2024. ISO-NE is a competitive wholesale electricity market with broad authority over the day-day operation of the transmission system. ISO-NE operates a day-ahead and real-time wholesale energy market, a forward capacity market and an ancillary services market.
ISO-NE stated in March 2024 that the region’s grid would need up to $1 billion in annual transmission investments until 2050 to support the clean energy transition. Though NERC has forecasted the ISO’s reserve margin level to be approximately 13%, access to fuel can be uncertain during winter when the region’s pipelines run at or near capacity, according to ISO-NE.
Other Markets
Our other markets include SERC, WECC, IESO, MISO and NYISO. As measured by net interest with peaking, Approximately 13% of our generation fleet operates in these markets, with 4% in WECC, 4% in IESO, 3% in SERC, 1% in MISO and 1% in NYISO.
Power Plant Operational Excellence
As of December 31, 2024, our generation fleet had a generating capacity of 27,802 MW and produced 121 Terawatt-hours (“TWh”) of electricity in 2024. As of December 31, 2024, our fleet included 79 operational power plants and facilities, including the newly acquired Quail Run Energy Center. Additionally, our fleet includes four battery storage facilities in operation, where one battery storage facility has four of five phases operational, with the final phase scheduled for commercial operations during the first half of 2025. Our fleet provides dispatchable, intermittent and peak power generation. As of December 31, 2024, our leading generation and battery storage fleet operated in 18 states and Canada, with most of our generating capacity located in the ERCOT, CAISO and PJM. Further details on our generation and battery storage fleet are included below in the section titled “Item 1. Business — Description of our Operations — Table of Operating Power Plants and Projects Under Construction.”
Since Calpine’s inception in 1984, we have focused on excellence in operations, continuously working to meet or exceed our goals. Our employees’ expertise allows us to optimize the value and profitability of our electric facilities, enhance our retail brands, and prudently manage the risks inherent in our business. We consider the proactive management and continuous improvement of safety and health risks crucial to our long-term business success. As a result, Calpine’s world-class safety performance routinely ranks among the best in the industry based on lost-time incidents and total recordable incident rates, the primary indicators of industrial safety performance. Reinforcing our stringent safety principles, several of our power plants have earned Star worksite certification through the Voluntary Protection Programs administered by the U.S. Department of Labor’s Occupational Safety and Health Administration, and others are working toward earning this distinction.
5
Description of Our Operations
Natural Gas Fleet
Our natural gas-fired power plants primarily use four types of designs: 1,500 MW of simple cycle combustion turbines, or peakers, 17,632 MW of combined cycle combustion turbines, 5,697 MW of cogeneration power plants and a small portion from conventional natural gas/oil-fired boilers with steam turbines. As of December 31, 2024, we own and operate 60 natural gas-fired power plants, making us the owner of the largest natural gas fleet in the United States. Our natural gas portfolio has an average capacity-weighted age of approximately 20 years. The efficiency of natural gas-fired power plants is demonstrated by our 2024 Steam Adjusted Heat Rate of 7,411 Btu/KW, which results in a power conversion efficiency of approximately 46%. Simple cycle combustion turbines burn natural gas or fuel oil to spin an electric generator to produce power. A combined cycle unit combusts fuel like a simple cycle combustion turbine, and boiler, which captures the exhaust heat to create steam, which can then spin a steam turbine. Each of our power plants currently in operation can produce power for sale to a utility, another third-party end user, our retail customers, or an intermediary such as a marketing company. At 13 of our power plants, we also produce thermal energy (primarily steam and chilled water), which can be sold to industrial and commercial users. These cogeneration power plants are also called combined heat and power facilities or cogens.
Geothermal Fleet
At The Geysers, located in the Mayacamas Mountains in northern California, we use a natural, clean energy source, geothermal energy, which is heat from the Earth’s interior, to produce electricity. Calpine’s wholly owned subsidiary, GPC owns and operates our Geysers Assets. Our Geysers Assets include a 725 MW fleet of 13 operating power plants, including steam extraction and gathering assets in northern California. This facility is the world’s largest geothermal power plant complex, and in 2024, our Geysers Assets were responsible for approximately 31% of the country’s total generation of electricity from geothermal sources in the United States. Geothermal energy is classified as clean and renewable as it does not require burning fossil fuel to create electricity. Steam is produced below the Earth’s surface from reservoirs of hot water, both naturally occurring and injected. The steam is piped directly from the underground production wells to the power plants and used to spin turbines to generate power.
6
We inject water back into the steam reservoir, which extends the useful life of the resource and helps to maintain the output of our Geysers Assets. The water we inject primarily comes from water purchase agreements for reclaimed water and the condensate associated with the steam extracted to generate power. As a result of these recharge projects, MWh production has been relatively constant. We expect that, as a result of the water injection program, the reservoir at our Geysers Assets will be able to supply economic quantities of steam for the foreseeable future.
We lease the geothermal steam fields from which we extract steam for our Geysers Assets. We have leasehold mineral interests in 105 leases comprising approximately 29,000 acres of federal, state and private geothermal resource lands in The Geysers region of northern California. Our leases cover one contiguous area of property that comprises approximately 45 square miles in Sonoma and Lake County. The approximate breakout by volume of steam removed under the above leases for the year ended December 31, 2024, is as follows:
| · | 25% related to leases with the Federal Government via the Bureau of Land Management; |
| · | 23% related to leases with the California State Lands Commission; and |
| · | 53% related to leases with private landowners/leaseholders. |
In general, our geothermal leases grant us the exclusive right to drill for, produce and sell geothermal resources from these properties and the right to use the surface for related purposes. Each lease requires the payment of annual rent and royalty payments. In general, lease royalty calculations are based upon its percentage of revenue as calculated by its steam generated relative to the total steam generated by our Geysers Assets as a whole.
Our geothermal leases are generally for initial terms varying from five to 20 years and for so long thereafter as geothermal resources are produced and sold. Most of our geothermal leases were signed more than 30 years ago and continue uninterrupted. Our federal leases typically span an initial ten-year period with renewal clauses for an additional 40 years for a maximum of 50 years. In 2024, four of our federal leases were renewed through 2064. Most of our other leases run through the economic life of our Geysers Assets and provide for renewals so long as geothermal resources are being produced or used, or are capable of being produced or used, in commercial quantities from the leased land or from land unitized with the leased land. Although we believe that we will be able to renew our leases through the economic life of our Geysers Assets on terms that are acceptable to us, it is possible that certain of our leases may not be renewed or may be renewed on less favorable terms.
Unlike other renewable resources, such as wind or solar, which depend on intermittent sources to generate power, geothermal power provides a consistent source of energy, as evidenced by our Geysers Assets’ availability of approximately 91% in 2024. Additionally, many growth projects and new capital expenditures at The Geysers may be eligible for investment tax credits, as provided within the IRA.
Other Technologies
We also have four MW of capacity from solar power generation technology at our Vineland Solar Energy Center in New Jersey and 105 MW of solar power generation under construction at our Pastoria Solar Energy Center. As of December 31, 2024, we have four battery storage projects in California that are fully operational representing 738 MW of capacity, and one facility in California (Pastoria) that is under construction, representing approximately 80 MW of capacity. Among the world's largest battery storage projects is our 680 MW Nova asset. The development is financed and fully contracted. The first four phases of the Nova power battery storage facility came online during the summer of 2024, with phase five expected to be operational in the first half of 2025. We also have 725 MW of conventional steam turbine technology at our Edge Moor Energy Center.
7
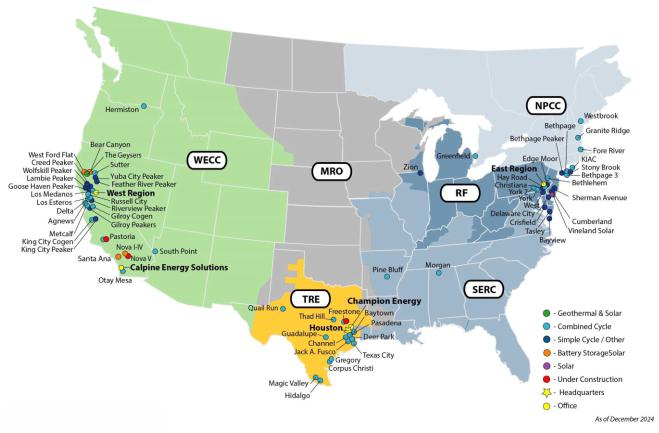
Table of Operating Power Plants, Battery Storage Facilities and Projects Under Construction
Set forth below is certain information regarding our operating power plants, battery storage facilities and projects under construction as of December 31, 2024.
| SEGMENT/Power Plant | NERC
Region | U.S.
State or Canadian Province | Technology | Calpine
Interest Percentage | Calpine
Net Interest Baseload (MW)(1)(3) | Calpine Net Interest With Peaking (MW)(2)(3) | 2024 Total MWh Generated(4) | |||||||||||||||
| WEST | ||||||||||||||||||||||
| Geothermal | ||||||||||||||||||||||
| McCabe #5 & #6 | WECC | CA | Renewable | 100 | % | 84 | 84 | 483,907 | ||||||||||||||
| Ridge Line #7 & #8 | WECC | CA | Renewable | 100 | % | 76 | 76 | 617,457 | ||||||||||||||
| Calistoga | WECC | CA | Renewable | 100 | % | 69 | 69 | 468,760 | ||||||||||||||
| Eagle Rock | WECC | CA | Renewable | 100 | % | 68 | 68 | 518,774 | ||||||||||||||
| Big Geysers | WECC | CA | Renewable | 100 | % | 61 | 61 | 398,742 | ||||||||||||||
| Lake View | WECC | CA | Renewable | 100 | % | 54 | 54 | 495,151 | ||||||||||||||
| Quicksilver | WECC | CA | Renewable | 100 | % | 53 | 53 | 403,220 | ||||||||||||||
| Sonoma | WECC | CA | Renewable | 100 | % | 53 | 53 | 447,631 | ||||||||||||||
| Cobb Creek | WECC | CA | Renewable | 100 | % | 51 | 51 | 362,971 | ||||||||||||||
| Socrates | WECC | CA | Renewable | 100 | % | 50 | 50 | 362,705 | ||||||||||||||
| Sulphur Springs | WECC | CA | Renewable | 100 | % | 47 | 47 | 441,958 | ||||||||||||||
| Grant | WECC | CA | Renewable | 100 | % | 41 | 41 | 282,313 | ||||||||||||||
| Aidlin | WECC | CA | Renewable | 100 | % | 18 | 18 | 81,308 | ||||||||||||||
| Natural Gas-Fired | ||||||||||||||||||||||
| Delta Energy Center | WECC | CA | Combined Cycle | 100 | % | 860 | 882 | 1,860,563 | ||||||||||||||
| Pastoria Energy Center | WECC | CA | Combined Cycle | 100 | % | 780 | 759 | 2,630,642 | ||||||||||||||
| Hermiston Power Project | WECC | OR | Combined Cycle | 100 | % | 566 | 635 | 3,519,891 | ||||||||||||||
| Russell City Energy Center | WECC | CA | Combined Cycle | 100 | % | 572 | 619 | 745,909 | ||||||||||||||
| Otay Mesa Energy Center | WECC | CA | Combined Cycle | 100 | % | 513 | 608 | 1,792,894 | ||||||||||||||
| Metcalf Energy Center | WECC | CA | Combined Cycle | 100 | % | 584 | 625 | 1,550,422 | ||||||||||||||
| Sutter Energy Center | WECC | CA | Combined Cycle | 100 | % | 542 | 578 | 1,214,035 | ||||||||||||||
| Los Medanos Energy Center | WECC | CA | Cogen | 100 | % | 518 | 572 | 2,567,898 | ||||||||||||||
| South Point Energy Center | WECC | AZ | Combined Cycle | 100 | % | 520 | 530 | 2,583,896 | ||||||||||||||
| Los Esteros Critical Energy Facility | WECC | CA | Combined Cycle | 100 | % | 243 | 309 | 207,010 | ||||||||||||||
| Gilroy Energy Center | WECC | CA | Simple Cycle | 100 | % | — | 141 | 16,231 | ||||||||||||||
| Gilroy Cogeneration Plant | WECC | CA | Combined Cycle | 100 | % | 109 | 130 | 23,752 | ||||||||||||||
| King City Cogeneration Plant | WECC | CA | Combined Cycle | 100 | % | 120 | 120 | 14,732 | ||||||||||||||
| Wolfskill Energy Center | WECC | CA | Simple Cycle | 100 | % | — | 48 | 1,536 | ||||||||||||||
| Yuba City Energy Center | WECC | CA | Simple Cycle | 100 | % | — | 47 | 41,512 | ||||||||||||||
| Feather River Energy Center | WECC | CA | Simple Cycle | 100 | % | — | 47 | 39,036 | ||||||||||||||
| Creed Energy Center | WECC | CA | Simple Cycle | 100 | % | — | 47 | 4,138 | ||||||||||||||
| Lambie Energy Center | WECC | CA | Simple Cycle | 100 | % | — | 47 | 6,609 | ||||||||||||||
| Goose Haven Energy Center | WECC | CA | Simple Cycle | 100 | % | — | 47 | 7,522 | ||||||||||||||
| Riverview Energy Center | WECC | CA | Simple Cycle | 100 | % | — | 47 | 20,944 | ||||||||||||||
| King City Peaking Energy Center | WECC | CA | Simple Cycle | 100 | % | — | 44 | 3,282 | ||||||||||||||
| Agnews Power Plant | WECC | CA | Combined Cycle | 100 | % | 28 | 28 | 5,261 | ||||||||||||||
| Battery Storage Facilities | ||||||||||||||||||||||
| Santa Ana I - III(5) | WECC | CA | Battery Storage | 100 | % | 80 | 80 | 97,729 | ||||||||||||||
| Nova Battery Power Bank(9) | WECC | CA | Battery Storage | 100 | % | 620 | 620 | 691,219 | ||||||||||||||
| Bear Canyon battery storage project(10) | WECC | CA | Battery Storage | 100 | % | 13 | 13 | 5,477 | ||||||||||||||
| West Ford Flat battery storage project(10) | WECC | CA | Battery Storage | 100 | % | 25 | 25 | 8,301 | ||||||||||||||
| Subtotal | 7,418 | 8,373 | 25,025,338 | |||||||||||||||||||
8
| SEGMENT/Power Plant | NERC
Region | U.S.
State or Canadian Province | Technology | Calpine
Interest Percentage | Calpine
Net Interest Baseload (MW)(1)(3) | Calpine Net Interest With Peaking (MW)(2)(3) | 2024 Total MWh Generated(4) | |||||||||||||||
| TEXAS | ||||||||||||||||||||||
| Deer Park Energy Center | TRE | TX | Cogen | 100 | % | 1,116 | 1,217 | 7,936,876 | ||||||||||||||
| Guadalupe Energy Center | TRE | TX | Combined Cycle | 100 | % | 1,049 | 1,040 | 6,860,790 | ||||||||||||||
| Baytown Energy Center | TRE | TX | Cogen | 100 | % | 810 | 896 | 4,768,009 | ||||||||||||||
| Channel Energy Center | TRE | TX | Cogen | 100 | % | 760 | 845 | 4,945,918 | ||||||||||||||
| Pasadena Power Plant(6) | TRE | TX | Cogen/Combined Cycle | 100 | % | 763 | 781 | 4,976,217 | ||||||||||||||
| Thad Hill Energy Center | TRE | TX | Combined Cycle | 100 | % | 770 | 792 | 2,814,268 | ||||||||||||||
| Freestone Energy Center | TRE | TX | Combined Cycle | 75 | % | 809 | 776 | 5,042,951 | ||||||||||||||
| Magic Valley Generating Station | TRE | TX | Combined Cycle | 100 | % | 682 | 712 | 1,670,580 | ||||||||||||||
| Jack A. Fusco Energy Center | TRE | TX | Combined Cycle | 100 | % | 523 | 609 | 3,738,906 | ||||||||||||||
| Corpus Christi Energy Center | TRE | TX | Cogen | 100 | % | 446 | 520 | 2,541,226 | ||||||||||||||
| Texas City Power Plant | TRE | TX | Cogen | 100 | % | 400 | 453 | 2,003,732 | ||||||||||||||
| Hidalgo Energy Center | TRE | TX | Combined Cycle | 78.5 | % | 413 | 395 | 440,000 | ||||||||||||||
| Quail Run Energy Center | TRE | TX | Combined Cycle | 100 | % | 550 | 550 | 915,317 | ||||||||||||||
| Gregory Energy Center(13) | TRE | TX | Combined Cycle | 28.5 | % | 110 | 110 | 238,111 | ||||||||||||||
| Subtotal | 9,201 | 9,696 | 48,892,901 | |||||||||||||||||||
| EAST | ||||||||||||||||||||||
| Bethlehem Energy Center(7) | RFC | PA | Combined Cycle | 100 | % | 960 | 1,130 | 5,980,570 | ||||||||||||||
| Hay Road Energy Center(7) | RFC | DE | Combined Cycle | 100 | % | 931 | 1,130 | 1,706,133 | ||||||||||||||
| York 2 Energy Center(7) | RFC | PA | Combined Cycle | 100 | % | 668 | 828 | 5,533,730 | ||||||||||||||
| Morgan Energy Center | SERC | AL | Cogen | 100 | % | 720 | 807 | 4,094,869 | ||||||||||||||
| Fore River Energy Center(7) | NPCC | MA | Combined Cycle | 100 | % | 750 | 731 | 2,950,781 | ||||||||||||||
| Edge Moor Energy Center(7) | RFC | DE | Steam Cycle | 100 | % | — | 725 | 344,014 | ||||||||||||||
| Granite Ridge Energy Center | NPCC | NH | Combined Cycle | 100 | % | 745 | 695 | 3,447,295 | ||||||||||||||
| York Energy Center(7) | RFC | PA | Combined Cycle | 100 | % | 464 | 565 | 2,905,911 | ||||||||||||||
| Westbrook Energy Center | NPCC | ME | Combined Cycle | 100 | % | 552 | 552 | 2,864,339 | ||||||||||||||
| Greenfield Energy Center(8) | NPCC | ON | Combined Cycle | 100 | % | 863 | 1,058 | 3,958,183 | ||||||||||||||
| Zion Energy Center(7) | RFC | IL | Simple Cycle | 100 | % | — | 503 | 387,686 | ||||||||||||||
| Pine Bluff Energy Center | SERC | AR | Cogen | 100 | % | 184 | 215 | 1,221,233 | ||||||||||||||
| Cumberland Energy Center(7) | RFC | NJ | Simple Cycle | 100 | % | — | 191 | 72,093 | ||||||||||||||
| Kennedy International Airport Power Plant(7) | NPCC | NY | Cogen | N/A | 110 | 125 | 350,835 | |||||||||||||||
| Sherman Avenue Energy Center(7) | RFC | NJ | Simple Cycle | 100 | % | — | 92 | 25,736 | ||||||||||||||
| Bethpage Energy Center 3 | NPCC | NY | Combined Cycle | 100 | % | 60 | 80 | 180,514 | ||||||||||||||
| Bethpage Power Plant | NPCC | NY | Combined Cycle | 100 | % | 55 | 56 | 197,281 | ||||||||||||||
| Christiana Energy Center | RFC | DE | Simple Cycle | 100 | % | — | 53 | 172 | ||||||||||||||
| Bethpage Peaker | NPCC | NY | Simple Cycle | 100 | % | — | 48 | 66,095 | ||||||||||||||
| Stony Brook Power Plant(7) | NPCC | NY | Cogen | 100 | % | 45 | 47 | 277,240 | ||||||||||||||
| Tasley Energy Center | RFC | VA | Simple Cycle | 100 | % | — | 33 | 693 | ||||||||||||||
| Delaware City Energy Center | RFC | DE | Simple Cycle | 100 | % | — | 23 | 4,327 | ||||||||||||||
| West Energy Center | RFC | DE | Simple Cycle | 100 | % | — | 20 | 4,105 | ||||||||||||||
| Bayview Energy Center | RFC | VA | Simple Cycle | 100 | % | — | 12 | 886 | ||||||||||||||
| Crisfield Energy Center | RFC | MD | Simple Cycle | 100 | % | — | 10 | 682 | ||||||||||||||
| Vineland Solar Energy Center | RFC | NJ | Renewable | 100 | % | — | 4 | 5,779 | ||||||||||||||
| Subtotal | 7,107 | 9,733 | 36,581,182 | |||||||||||||||||||
| Total operating power plants and battery storage facilities | 79 | 23,726 | 27,802 | 110,499,421 | ||||||||||||||||||
9
| SEGMENT/Power Plant | NERC
Region | U.S.
State or Canadian Province | Technology | Calpine
Interest Percentage | Calpine
Net Interest Baseload (MW)(1)(3) | Calpine Net Interest With Peaking (MW)(2)(3) | 2024 Total MWh Generated(4) | |||||||||||||||
| Projects under construction | ||||||||||||||||||||||
| Nova Power Storage Project - Phase V(9) | WECC | CA | Battery Storage | 100 | % | 60 | 60 | n/a | ||||||||||||||
| North Geysers Development(11) | WECC | CA | Renewable | 100 | % | 25 | 25 | n/a | ||||||||||||||
| Pin Oak Creek Energy Center, LLC(12) | TRE | TX | Combined Cycle | 100 | % | — | 425 | n/a | ||||||||||||||
| Pastoria Solar Project | WECC | CA | Renewable | 100 | % | 105 | 105 | n/a | ||||||||||||||
| Total operating power plants, battery storage facilities and projects under construction | 23,916 | 28,417 | ||||||||||||||||||||
| (1) | Natural gas-fired fleet capacities are generally derived on as-built as-designed outputs, including upgrades, based on site specific annual average temperatures and average process steam flows for cogeneration. |
| (2) | Natural gas-fired fleet peaking capacities are primarily derived on as-built-as-designed peaking outputs based on site-specific average summer temperatures and include power enhancement features such as heat recovery steam generator duct-firing, gas turbine power augmentation and/or other power augmentation features. For certain power plants with definitive contracts, capacities at contract conditions have been included. Oil-fired capacities reflect capacity test results. Battery storage capacity is based on installed MW. |
| (3) | These outputs do not factor in the typical MW loss and recovery profiles over time, which natural gas-fired turbine power plants display associated with their planned major maintenance schedules. |
| (4) | MWh generation for our power generation facilities and capacity for our battery storage facilities is shown here as our net operating interest. |
| (5) | The Santa Ana battery storage facility is a four-hour duration battery installation comprised of three phases with a total capacity of 80 MW - phase I for 20 MW/80 MWh, phase II for 20 MW/80 MWh and phase III for 40 MW/160 MWh. |
| (6) | Pasadena comprises 260 MW of CoGen technology and 521 MW of combined cycle (non-CoGen) technology. |
| (7) | These power plants have dual-fuel capability. |
| (8) | Prior to September 5, 2023, Calpine held a 50% partnership interest in Greenfield L.P. (“Greenfield Energy Centre L.P.”, “Greenfield Energy Centre”) through its subsidiaries. On September 5, 2023, we acquired the remaining 50% partner's interest. The facility continues to be operated by a third party. |
| (9) | The Nova Battery Power Bank is a four-hour duration battery installation comprised of five phases. Phases I-IV are currently operational (620 MW/2,480 MWh) and Phase V is currently under construction (60 MW/240 MWh). |
| (10) | The Bear Canyon battery storage facility is a four-hour duration battery installation (13 MW/52 MWh), and West Ford Flat battery storage facility is a four-hour duration battery installation (25 MW/100 MWh). |
| (11) | North Geysers development represents a drilling expansion project expected to increase capacity at our Geysers Assets by 25 MW. |
| (12) | Pin Oak Creek Energy Center, LLC is a new 425 MW peaking facility that will be adjacent to our Freestone Energy Center and is currently under construction. |
| (13) | As of December 31, 2024, we own a 33% non-economic interest and a 28.5% economic interest in Gregory Power Holdings, LLC, an entity that owns a 385 MW combined cycle generation facility in Texas. We have entered into an LLC agreement with a third party, who currently owns the remaining 71.5% economic interest in the entity, and we have agreed to contribute up to a 45% economic interest in Gregory Power Holdings, LLC over time. |
Substantially, all the power plants and battery storage facilities in which we have an interest are located on sites we either own or lease long-term.
10
Wholesale Hedging, Optimization and Origination Efforts
Our commercial approach and platform allow us to enhance the value of individual power plants and our fleet as a whole. Our hedging program’s goal is to enhance profitability by making informed risk-adjusted decisions around power sales and fuel procurement. We have standing agreements in place that enable us to transact with an extensive number of customers and trading counterparties. This allows efficient access to markets and bilateral commercial opportunities. We also hold extensive natural gas transportation and storage agreements that allow us to source reliable and cost-effective fuel for our facilities and to benefit from fuel price variations across the United States. This participation in the markets yields market knowledge and perspectives that inform our hedging decisions. Starting and replicating a commercial platform of this scale and diversity would be a difficult and costly multi-year effort, if possible.
At any point, the relative quantity of our products hedged or sold under longer-term contracts is determined by the availability of forward product sales opportunities and our view of the attractiveness of the pricing available for forward sales. We have economically hedged a portion of our expected generation and natural gas portfolio as well as retail load supply obligations, where appropriate, primarily through power and natural gas forward physical and financial transactions, including retail power sales; however, we currently remain susceptible to significant price movements for 2025 and beyond. When we elect to enter into these transactions, we are able to economically hedge a portion of our Spark Spread at predetermined generation and price levels.
We have also historically used interest rate derivative instruments to adjust the mix between our fixed and variable rate debt. To the extent eligible, our interest rate derivative instruments have been designated as cash flow hedges. Changes in fair value are recorded in OCI, with gains and losses reclassified into earnings in the same period during which the hedged forecasted transaction affects earnings.
New Asset Development Efforts
We are pursuing a growth strategy that leverages our specific expertise and complements our existing operations. We expect our growth to stem from three broad channels: growth from our existing assets, development of new assets and inorganic growth. Since 1998, Calpine has developed approximately 28 GW of generation across the United States, enough electricity to power approximately 27 million homes. We have successfully developed natural gas, geothermal, battery storage and solar assets, and our experienced development team continually seeks out and evaluates opportunities to grow our businesses organically. We have expertise in all areas of the project development process, from state and federal permitting to interconnection evaluation, equipment procurement, thermal design, project financing and construction management. We have multiple battery storage, geothermal and natural gas assets under development. In addition to new generation facilities, we are working towards potential retrofits of existing natural gas facilities to capture carbon dioxide (“CO2”) from the flue gas for permanent storage in geologic formations.
Battery Storage
We are currently operational on Phases I – IV (out of five total phases) of one of the world’s largest battery storage projects, the 680 MW Nova Power Battery Storage Facilities in Menifee, California, and we have several other battery storage projects under construction or in development. Our pipeline of identified projects is primarily comprised of sites where we have existing land, infrastructure and/or transmission rights, which greatly facilitate the development of new battery storage.
Geothermal
As the owners of the world’s largest geothermal power plant complex, The Geysers, we look for opportunities to both increase the efficiency of our existing fleet and to expand and build new generating assets. We currently have an expansion underway at The Geysers that is expected to increase capacity by 25 MW via additional steam production wells in the northern part of the field. We continue to pursue opportunities to increase the output of our Geysers project as we look to increase the supply of low-carbon, dispatchable power that we are able to provide from our geothermal fleet.
Natural Gas
We believe that natural gas-fired generation will play a critical role in the U.S., given its low air emissions, high reliability and potential for future carbon abatement opportunities. In Texas, we are under construction for the 425 MW Pin Oak Creek Energy Center, LLC project adjacent our existing Freestone facility, and we are advancing the development of a natural gas combined cycle gas turbine (“CCGT”) expansion at the Gregory Facility in Corpus Christi in partnership with an industrial customer. We also have additional gas developments underway in cooperation with our customers. Our development team has significant expertise in developing gas projects, which allows us to successfully develop new gas projects in an environment where others may be challenged.
11
Carbon Capture
Our fleet includes multiple facilities located proximate to favorable carbon dioxide sequestration geology, and we have identified an initial pipeline of facilities that we believe might be good candidates for the application of post-combustion carbon capture technology. As part of our effort to advance these potential projects, we have completed or commenced front-end engineering design studies at five facilities partially funded by the Department of Energy (“DOE”), have executed the first phase with DOE’s Office of Clean Energy Demonstrations for cost-sharing awards of up to $270 million each for two full-scale demonstration projects — at our Baytown Energy Center east of Houston in Texas and our Sutter Energy Center near Sacramento in California. We are currently operating with a partner, Ion Energy, a DOE-funded pilot-scale carbon capture facility at our Los Medanos facility in California, the only pilot attached to an operating natural gas combined cycle facility in the world. The Baytown and Sutter projects have the potential to sequester up to 3.75 million metric tons of CO2 annually. Decisions to move construction forward on both projects are contingent on successfully completing several remaining milestones, including achieving sufficient returns after executing long-term customer contracts for decarbonized generation facility output.
Our Retail Businesses
Calpine is one of the nation’s largest retail energy providers, supplying electricity, gas and energy solutions to a diverse mix of customers across the United States. Calpine Retail, comprised of Calpine Energy Solutions, LLC and Champion Energy Marketing, LLC (“Champion,” “Champion Energy Services” or “Champion Energy”), engages our retail customers in a consultative sales approach to create innovative, tailored energy management products and services. We offer a wide range of retail power and gas products, both fixed price and index, with tenors varying based on the needs of each customer segment. By design, our retail operations overlap with our generation business, as this facilitates our ability to provide customers with access to clean, flexible and reliable electricity. Our leading retail business has a presence across all competitive retail markets in America, with our service area of 21 states.
Calpine Energy Solutions
Solutions, one of the largest energy suppliers in North America, is a licensed retail energy provider in every deregulated state. Solutions’ customers are mostly large commercial, industrial or institutional entities whose energy needs represent a significant part of their businesses, with a peak load of approximately 6,600 MW. Solutions employs a direct, consultative sales approach, offers bespoke products and leverages a proprietary framework to help customers manage their energy cost, risk and carbon exposure. In 2024, Solutions was re-accredited as a silver renewable energy partner by the Carbon Disclosure Project (“CDP”), which runs the world’s leading disclosure system for environmental impact.
Champion Energy Services
Champion is widely known for its customer service and straightforward and innovative pricing plans in Texas. Its peak load is approximately 1,700 MW and comprises residential, commercial and industrial customers, with coverage in most of the broadly deregulated states, largely Texas for residential customers.
Active External Engagement
Calpine’s business is at the intersection of heavy capital deployment, complex microeconomics and high-profile public policy. Through active external engagement with key stakeholders on behalf of our business and customers, we believe we can support the effective design and operation of the electric markets. As America’s largest generator of electricity from natural gas and geothermal resources, according to S&P Global Market Intelligence, and the owner of one of the nation’s largest retail energy providers, we bring an informed perspective to public policy discussions at the state, regional and national levels. Our Government and Regulatory Affairs personnel have become trusted experts on important issues affecting electric reliability and economics, earning us a seat at the table when key issues are being debated.
12
Emissions and Our Environmental Profile
The environmental profile of our power plants reflects our commitment to environmental stewardship. We believe we have invested the capital necessary to develop a power generation portfolio with substantially lower air emissions than our major competitors’ power plants that use other fossil fuels, such as coal. In addition, we strive to preserve our nation’s valuable water and land resources. With efficient technology and use of cleaner fuel, our plants have a smaller footprint and less hazardous waste generation compared to coal. In 2023, our GHG emissions from natural gas combustion amounted to approximately 48.9 million metric tons with a net electric generation of approximately 119 million megawatts-hour. In addition, we aim to further reduce our environmental footprint in the future by implementing carbon capture technology at many of our facilities and further developing and using battery storage facilities, which is expected to lower our emissions intensity per kilowatt-hour provided, as the battery storage facilities are expected to primarily be charged by renewable power.
Natural Gas-Fired Generation
Our fleet consumes significantly less fuel to generate power than conventional boiler/steam turbine power plants. It emits fewer air pollutants per MWh of power produced as compared to coal-fired or oil-fired power plants. Our power plants all have air emissions controls, which seek to reduce emissions such as Nitrogen Oxides (“NOx”), a precursor of atmospheric ozone and acid rain. The table below summarizes approximate air pollutant emission rates from our power plants compared to the average emission rates from U.S. coal, oil and natural gas-fired power plants as a group, based on the most recent statistics available.
| Air Pollutant Emission Rates - Pounds of Pollutant Emitted Lbs/MWh of Power Generated | ||||||||||||
| Air Pollutants | Average
U.S. Coal, Oil and Natural Gas-Fired Power Plant(1) | Calpine Power Plants (2) | Advantage Compared to Average U.S. Coal, Oil and Natural Gas- Fired Power Plant | |||||||||
| Nitrogen Oxides, NOx | 0.98 | 0.13 | 87.2 | % | ||||||||
| Acid rain, smog and fine particulate formation | ||||||||||||
| Sulfur Dioxide, SO2 | 0.7450 | 0.0046 | 99.4 | % | ||||||||
| Acid rain and fine particulate formation | ||||||||||||
| Mercury Compounds(3) | 0.000002400 | 0.000000029 | 98.8 | % | ||||||||
| Neurotoxin | ||||||||||||
| Carbon Dioxide, CO2 | 1,345 | 906 | 32.7 | % | ||||||||
| Principal GHG - contributor to climate change | ||||||||||||
| (1) | The average U.S. coal, oil and natural gas-fired power plants’ emission rates were obtained from the U.S. Department of Energy’s Electric Power Annual Report for 2023. Emission rates are based on 2023 emissions and net generation. The U.S. Department of Energy has not yet released 2024 information. | |
| (2) | Our natural gas-fired, combined cycle power plant estimated emission rates are based on our 2023 emissions and power generation data from our natural gas-fired, combined power plants (excluding combined heat power plants) as measured under the Environmental Protection Agency (“EPA”) reporting requirements. | |
| (3) | The U.S. coal, oil and natural gas-fired power plant air emissions of mercury compounds were obtained from the EPA Toxics Release Inventory for 2024. Emission rates are based on 2023 emissions and net generation from the U.S. Department of Energy’s Electric Power Annual Report for 2023. |
Geothermal Generation
As a renewable energy source, our Geysers Assets do not burn fossil fuel and produce power with only negligible emissions of naturally emitted CO2, NOx and SO2 from the steam. Our Geysers Assets, which produce 8% of the renewable energy and 49% of the geothermal power in California, are helping to meet the state’s clean energy goals.
Water Conservation and Reclamation
We have also invested substantially in technologies and systems that reduce the effect of our operations on water as a natural resource:
| · | We procure and inject an average of approximately 16 million gallons of reclaimed water per day into the geothermal steam reservoir at The Geysers where the water is naturally heated by the Earth, creating additional steam to fuel our Geysers Assets. Approximately 13 million gallons per day are received from the Santa Rosa Geysers Recharge Project, a wastewater utilization project jointly developed with the City of Santa Rosa, and we received, on average, approximately three million gallons a day from the Southeast Geysers Effluent Pipeline Project from Lake County in 2024. We do not compete with other consumers for the water received for injection at our Geysers Assets as costly additional wastewater treatment and disposal infrastructure would be required if our Geysers Assets were not taking the water. |
13
| · | In our combined cycle power plants, we use mechanical draft cooling towers, which use up to 90% less water than conventional once-through cooling systems. | |
| · | Three of our power plants (Sutter Energy Center, Otay Mesa Energy Center and Fore River Energy Center) employ air-cooled condensers for cooling, consuming virtually no water for cooling. | |
| · | In 7 of our operating natural gas-fired power plants equipped with cooling towers, we reuse treated water from municipal treatment systems for cooling. By reusing water in these cooling towers, we avoided using approximately 4.3 billion gallons in 2023 of valuable surface and/or groundwater for cooling. |
Governmental and Regulatory Matters
As participants in wholesale and retail energy markets and owners and operators of power plants and battery storage facilities in various regions around the country, certain Calpine entities are subject to regulation by various federal and state government agencies. These include the FERC, CFTC, NERC, as well as other public utility commissions, federal and state environmental protection agencies and reliability organizations in states or regions where Calpine’s generation assets are located, or where Calpine provides retail energy services. In addition, Calpine is subject to the market rules, procedures and protocols of the various ISO and RTO markets in which it participates. Federal and state legislative and regulatory actions, including those by ISOs and RTOs, continue to influence our business. We are actively participating in these debates at the federal, regional, state and ISO/RTO levels. Some of the more significant governmental and regulatory matters that affect our business are discussed below.
Since President Trump took office on January 20, 2025, the Trump Administration has issued a series of Executive Orders and agency memoranda generally intended to pause and review Biden-era programs and spending (to include renewable energy and environmental programs, as well as diversity, inclusion, and equity initiatives); reshape the federal government and workforce; and advance new priorities, to include supporting traditional energy exploration and production and ensuring AI dominance. As one example, by executive order, the Trump Administration temporarily paused the disbursement of IRA and Infrastructure Investment and Jobs Act (“IIJA”) funding, subject to future review and approval. We are evaluating impacts of these executive actions to Calpine’s businesses, including to our CCS development projects that benefit from IIJA-funded grants.
Power and Natural Gas Matters
Power Regions
The following is a brief overview of our core power regions – CAISO, ERCOT, PJM, ISO-NE, NYISO and Canadian IESO. The CAISO market is in our West segment. The ERCOT market is in our Texas segment. Our East segment includes the PJM, ISO-NE, NYISO and Canadian IESO markets. These markets are constantly evolving in response to external factors that may disrupt the competitive balance within the wholesale markets.
State and federal actions to provide out-of-market financial subsidies to support the development or continued operation of zero-carbon generation and battery storage resources continue. As these actions grow, they could adversely affect capacity and energy prices in the deregulated electricity markets, which in turn could have a material adverse effect on our business prospects and financial results.
West
Most of our power plants and battery storage facilities in our West segment are in California, in the CAISO region. We also own one power plant in Arizona and one in Oregon. The various wholesale markets in which our subsidiaries operate are subject to various controls, such as price caps and mitigation of bids when transmission constraints arise. The controls and the markets are subject to regulatory change at any time.
CPUC is addressing grid reliability through mandates for more than 15 GW of new capacity (primarily storage) in addition to the 3.3 GW of new capacity ordered in 2019. To the extent these additional resources are successfully procured and begin operation, they could impact pricing in California’s electricity market. We have actively participated in solicitations to meet these mandates with the storage resources we are developing, and capacity uprates to The Geysers. The CPUC is also considering new long-term “programmatic” procurement requirements for capacity and clean energy. In addition, the CPUC recently authorized (but did not mandate) “central procurement” of 10.6 GW of long lead-time resources, including geothermal, offshore wind and long-duration storage, with on-line dates in the 2030s. The Department of Water Resources would procure on behalf of all CPUC-jurisdictional loads with CPUC oversight. This procurement provides an opportunity for Calpine to develop additional geothermal and long-duration storage resources. On the other hand, to the extent that offshore wind is procured and developed, it is likely to depress energy and capacity prices for our portfolio.
14
The CPUC also administers a Resource Adequacy program, which requires load-serving entities to procure capacity through bilateral contracting. The CPUC recently adopted new rules that entail capacity requirements that vary by hour-of-day. The 2024 calendar year is a test year for these new rules. Full implementation will take place in 2025. The planning reserve margin for the program ultimately determines procurement requirements. The CPUC continues to consider a new and likely higher planning reserve margin for the program and plans to adopt a new planning reserve margin next year. In addition, CAISO is considering changes to the aspects of the RA program it administers, including requirements to replace capacity on planned outages and availability incentives. Further, the CPUC and CAISO continue to express interest in derating the capacity that can be sold from gas generation, such as ours, to reflect its historical forced outage performance.
CAISO administers the spot energy and ancillary service markets for most of California. Important market design changes currently contemplated by CAISO include expanding its day-ahead market outside of California, energy and ancillary service pricing that better reflects scarcity. While better scarcity pricing could increase our energy revenues, it is also likely to be complemented by additional mitigation, which could lower our revenues.
In addition, CAISO manages the interconnection of new resources. CAISO is dealing with a significant backlog of interconnection requests, primarily for new solar and storage resources. To manage the backlog, CAISO recently introduced (and FERC approved) significant changes to its interconnection process to favor resources that are presumed more viable. One of the criteria to determine viability is whether a resource has a long-term contract with a load-serving entity. This change gives more leverage to buyers in negotiations over contracts for new resources, such as the battery storage projects we are developing.
CARB continues to consider changes to California’s carbon emissions cap-and-trade program authorized by AB 32, including lowering the 2030 cap and caps in the intervening years. CARB also plans for the program to continue past 2030. While the program is only authorized in legislation through 2030, CARB has asserted that it is authorized to continue the program post 2030. In addition, legislation may provide clear authorization for the program to continue post 2030. We cannot predict how this will unfold or what the ultimate impact on Calpine will be. For additional details, see “California: GHG — Cap-and-Trade Regulation” below.
In October 2023, California Governor Gavin Newsom signed into law two state Senate Bills and one state Assembly Bill that collectively require certain public and private U.S. companies that perform certain business activities in California to disclose information related to their GHG emissions, climate-related financial risks, Voluntary Carbon Offsets (“VCOs”) and certain climate-related emission claims, these. These laws could impact Calpine.
First, SB 253, the “Climate Corporate Data Accountability Act,” requires CARB to adopt regulations, which would require us to annually disclose our scope 1 and scope 2 emissions from the prior fiscal year beginning in 2026 and scope 3 emissions by 2027. The regulations promulgated by CARB also require various levels of assurance of the reported emissions over time for the different emission scopes. SB 253 would require us to publish emissions data on a public digital platform. Second, SB 261 would require us to (1) prepare a climate-related financial risk report following the Task Force on Climate-Related Financial Disclosures framework and (2) indicate the measures adopted to reduce and/or adapt to these risks on or before January 1, 2026, and to update the report every subsequent two years. The report must be made publicly available on our website. Third, AB 1305, which went into effect on January 1, 2024, requires entities that either market or sell VCOs within California and make certain climate-related emission claims regarding those VCOs to disclose substantiating information about their emissions claims, including whether an independent third-party has verified the company data and claims. The relevant disclosures must all take place on the entity’s website. We do not believe that AB 1305 currently applies to any of our products or services.
On September 27, 2024, SB 219 (Wiener, Statutes of 2024, Chapter 766) amended state law to extend the date for CARB to adopt the regulations specified in SB 253 from January 1, 2025, to July 1, 2025. The first reports by reporting entities will still be due in 2026 on a date to be established by CARB in its rulemaking. Those first reports will cover scope 1 and scope 2 emissions during the reporting entity’s prior fiscal year. On December 5, 2024, CARB issued an enforcement notice notifying entities that it has decided to exercise enforcement discretion for the first reporting cycle and not take enforcement action for incomplete reporting.
To date, CARB has not proposed regulations pursuant to SB 253 and SB 261, which are both now subject to litigation. We believe we are subject to these laws and will continue to assess our reporting and disclosure requirements as the regulations are developed.
15
Texas
Our subsidiaries that own power plants in Texas have power generation company status at the PUCT and sell at market-based rates in ERCOT. ERCOT generally ensures resource adequacy through an energy-only market design. There is also a market offer price cap for energy and ancillary services purchased to serve customers in ERCOT. Under certain market conditions, the offer cap could be set lower than the maximum offer cap. Our subsidiaries are subject to the offer cap rules, but only for sales of power and ancillary services in ERCOT.
Several bills were passed in the 2023 Texas Legislative session that will impact the competitive wholesale electricity market in Texas, and implementation work is ongoing. First, House Bill 1500 codifies the Performance Credit Mechanism (“PCM”) but caps the cost at $1 billion, potentially limiting the mechanism’s effectiveness to provide reliability without other products. Second, House Bill 1500 requires ERCOT to create a new ancillary service called Dispatchable Reliability Reserve Service (“DRRS”) for dispatchable resources to provide flexibility to address intra-hour operational challenges. ERCOT and the PUCT are currently working on implementing DRRS products. Both changes are generally favorable for Calpine’s fleet.
In November 2023, Texas voters approved a state constitutional amendment to create a Texas Energy Fund (“TEF”), which will provide up to $7.2 billion of 3% loans and completion bonuses for a maximum of ten GW of new dispatchable generation in Texas. While the Texas legislature has only appropriated $5 billion of state funding for the TEF, we believe they will likely appropriate an additional $5 billion during the 2025 legislative session. In Spring 2024, the PUCT finalized rules determining how the TEF funding will be allocated to eligible generation developers and subsequently received applications from 38 GW of new capacity to potentially receive funding. Project awards were announced in Fall 2024, including a 425 MW peaking facility for Calpine. Calpine is undergoing due diligence with the PUCT and expects to be awarded in Mid-2025. Although Calpine applied for funding under TEF for its Peak Oak Creek Energy Center development project, we believe the out-of-market subsidies are unnecessary for a well-functioning, competitive ERCOT market.
ERCOT is continuing to implement changes to its markets to ensure operational reliability and is also conducting a broader examination of all ancillary services, such as frequency regulation, spinning reserves and non-spinning reserves. It is too early to tell whether further changes to the suite of ancillary services will be made and how those changes might impact pricing. Additionally, in February 2024, an appeal was filed challenging PUCT’s approval of ECRS, which was added to support grid reliability. This appeal remains pending, and we cannot predict what the outcome will be or its impact on pricing.
East
PJM
PJM operates wholesale power markets consisting of a locationally based energy market, a forward capacity market and ancillary service markets in all or parts of 13 states and the District of Columbia. PJM also performs transmission planning and operation for the region. The rules and regulations affecting PJM power markets and transmission are subject to change over time.
In January 2024, FERC approved revisions to PJM’s capacity market rules to better reflect winter reliability risk, correlated resource outages, fuel availability and the performance of intermittent and energy-limited resources during the periods of highest system stress. As more intermittent resources are added to an already constrained grid, the reliability and stability our gas assets provide become more critical and, therefore, more valuable. While the most recent PJM capacity auction for Delivery Year 2025/2026 cleared the premium load zones at revenue numbers consistent with the last 8 years, the RTO zone cleared meaningfully higher than the historically low 2024/2025 auction, prompting several complaints to be filed at FERC. These complaints relate in part to how reliability must run ("RMR") resources, i.e., resources kept on-line through out-of-market contracts that would otherwise retire, participate in the capacity market and various aspects of how the demand curves for PJM’s capacity market are determined, and requirements for intermittent and storage resources to participate in the capacity market. In response to these complaints and on its initiative, PJM submitted several FERC tariff filings with changes to the market to be implemented before the next capacity auction to be held in December 2025 for the 2026/2027 delivery year. FERC has since approved PJM’s market changes. While most of the proposed changes are likely to lower prices, their impact is expected to be offset by the robust increase in load and the associated increase in capacity demand. In addition, PJM is continuing to refine its capacity market rules through its normal stakeholder process. A few focus areas include how much historical data is used to determine how resources count towards capacity requirements and whether and how to shift from an annual to a seasonal capacity market construct. At this juncture, we cannot predict how these future changes may impact our portfolio.
In December 2024, Pennsylvania Governor Josh Shapiro filed a FERC complaint against PJM seeking to lower PJM’s capacity market price cap. The complaint drew support from the governors of Delaware, Illinois, Maryland and New Jersey, and joined two other pending FERC complaints seeking a range price-lowering reforms in PJM. In January, PJM and Governor Shapiro announced a settlement to resolve the complaint by implementing a price collar for the next two auctions, effectively a $325/MW-day cap and a $175/MW-day floor. The collar proposal will be filed at FERC in mid-February, joining a suite of pending PJM capacity market reforms—though the collar proposal will be one of the more consequential proposals awaiting FERC action. We can’t predict at this time how FERC will rule on the settlement, or the underlying complaint, so the impact on Calpine is unknown.
16
Illinois
In September 2021, Illinois Governor JB Pritzker signed into law the Climate and Equitable Jobs Act, which, among other things, establishes a schedule for eliminating CO2 emissions by EGUs. Under that schedule, privately owned natural gas units that exceed an established level of NOx and SOx emissions and are located within three miles of an environmental justice community, or an equity investment-eligible community must permanently eliminate CO2 emissions by January 1, 2030, subject to certain reliability exceptions. Left unchanged, this legislation will impact our Zion Energy Center and could require it to eliminate its CO2 emissions or shut down by January 2030.
Pennsylvania
The Pennsylvania Department of Environmental Protection finalized its CO2 Budget Trading Program regulations in the fall of 2021, establishing Pennsylvania’s participation in the Regional Greenhouse Gas Initiative (“RGGI”). The Senate and House Republicans subsequently filed with the Commonwealth Court claims against the Environmental Quality Board (“EQB”) seeking to permanently block the promulgation of the RGGI regulations because the EQB does not have the authority to implement the regulations. The legislators also filed a Petition for Preliminary Injunction. A second complaint and Petition for Preliminary Injunction were filed on April 25, 2022, by various industry groups, including labor and coal interests. On July 8, 2022, the Commonwealth Court granted the Petitions for Preliminary Injunction and, as a result, the Pennsylvania RGGI regulations, including Calpine’s obligation to purchase allowances for CO2 emissions, were stayed. On November 1, 2023, the Commonwealth Court issued a decision granting the petitions for a permanent injunction, finding EQB’s regulations directing Pennsylvania to join RGGI are void and unenforceable. As a result of this decision, the EQB is barred from enforcing the Pennsylvania RGGI regulations. The EQB and non-governmental organizations appealed the Commonwealth Court’s decision to the Pennsylvania Supreme Court. The appeal is still pending.
We cannot predict at this time whether the Pennsylvania Supreme Court will grant the appeal or, if it did, whether the Commonwealth will continue the process of RGGI participation. While ultimate Pennsylvania participation in RGGI would not be positive for Calpine, we are unable to predict the ultimate effect on our financial condition, results of operations, or cash flows.
New Jersey
The New Jersey Department of Environmental Protection issued final regulations on January 17, 2023, that impose new CO2 emissions limits on certain EGUs in New Jersey, depending on the nameplate capacity of the EGU and whether the EGU is existing or new. Our Carlls Corner and Mickleton facilities were shut down on June 1, 2024. Our Sherman and Cumberland facilities are also expected to be impacted in 2027, and our Cumberland 2 facility is expected to be impacted in 2035.
ISO-NE
In our East segment, we have three power plants located in Massachusetts, Maine and New Hampshire, all of which participate in the regional wholesale market administered by the ISO-NE RTO.
ISO-NE continues to pursue significant changes to its capacity market, including a transition from an annual and 3-year forward market to a prompt/year-ahead seasonal market and the introduction of more accurate resource counting similar to approaches recently adopted in NYISO, MISO and PJM. The ISO plans to implement the changes through multiple tariff filings in 2025 and 2026 for implementation for FCA 19, the capacity auction for the 2028-2029 delivery year. A critical aspect of ISO-NE’s proposed approach for resource counting is the representation of regional gas supply constraints, which ultimately could limit capacity sales from resources without firm fuel. The dual fuel capability of our largest plant in the region, Fore River, could provide firm fuel. We are exploring contractual and other firm fuel options for our other plants. Overall, we cannot predict what impact, if any, these ISO-NE efforts will have on our business.
NYISO
We have five power plants in our East segment located in New York. NYISO is the RTO which manages the transmission system in New York and operates the state’s wholesale power markets. NYISO manages both day-ahead and real-time energy and a forward capacity market where capacity prices are determined through auctions.
17
NYISO recently implemented significant changes to resource accreditation in its capacity market. As in New England and PJM, these changes attempt to accurately capture how different resources contribute to reliability under a range of weather and resource performance conditions. Also, like New England, NYISO continues to develop additional accreditation changes that reflect regional gas supply constraints. We continue to monitor how these changes might ultimately impact the capacity we can sell from our resources in New York.
Regulation of Transportation and Sale of Natural Gas
Since most of our power generating capacity is derived from natural gas-fired power plants, we are broadly affected by federal regulation of natural gas transportation and sales. We own two Texas pipelines that are subject to Texas Railroad Commission regulation as Texas gas utilities. We also operate a proprietary pipeline system in California, regulated by the U.S. Department of Transportation and the Pipeline and Hazardous Materials Safety Administration. Additionally, some of our power plants own and operate short pipeline laterals that connect the natural gas-fired power plants to the North American natural gas grid. Some of these laterals are subject to state and/or federal pipeline safety regulations.
Federal Regulation of Futures and Other Derivatives
The CFTC has regulatory oversight of futures markets, including trading on NYMEX for energy and licensed futures professionals such as brokers, clearing members and large traders. In connection with its oversight of the futures markets and NYMEX, the CFTC regularly investigates market irregularities and potential manipulation of those markets. Specific laws also give the CFTC certain powers with respect to broker-type markets referred to as “exempt commercial markets” or (“ECMs,”) including the ICE. The CFTC monitors activities in the OTC, ECM and physical markets that may be undertaken for the purpose of influencing futures prices. With respect to ECMs, the CFTC exercises only light-handed regulation primarily related to trade reporting, price dissemination and record retention (including retention of fraudulent claims and allegations).
Environmental Matters
The environmental profile of our power plants reflects our commitment to environmental leadership and stewardship. We have invested the capital necessary to develop a power generation portfolio with substantially lower air emissions than our major competitors’ power plants that use other fossil fuels, such as coal.
Federal Air Emissions Regulations
Clean Air Act
The CAA provides for the regulation of air quality and air emissions, mainly through state implementation of federal requirements. We believe that all our operating power plants comply with existing federal and state performance standards mandated under the CAA. In addition to regulating air emissions at the federal level, several states where we conduct business have implemented regulations that go beyond current federal environmental requirements. We continue to monitor and actively participate in federal and state initiatives that further our environmental and business objectives and where we anticipate an impact on our business.
The CAA requires the EPA to regulate emissions of harmful pollutants to public health and the environment. The EPA has set NAAQS for six “criteria” pollutants: carbon monoxide, lead, NO2, particulate matter, ozone and SO2. In addition, the CAA regulates many air pollutants known to cause or may reasonably be anticipated to cause adverse effects to human health or adverse environmental effects, known as Hazardous Air Pollutants (“HAPs”). The EPA must issue technology-based National Emissions Standards for Hazardous Air Pollutants (“NESHAPs”) to limit the release of specified HAPs from specific industrial sectors. The EPA also regulates emissions of certain pollutants that affect visibility in national parks and wilderness areas through the Regional Haze Program (“Regional Haze”). Finally, the EPA has begun regulating GHG emissions from various industries, including the power sector.
These CAA regulations primarily affect higher-emitting units in the national power-generating fleet. Our commitment to environmental stewardship is reflected in our history of investing in lower-emitting power plant technologies. As a result, these regulations generally do not have a significant direct adverse effect on our generating fleet, although they may impose substantial costs on the power industry overall.
GHG Emissions
On May 9, 2024, the EPA issued a final rule to regulate GHG emissions from existing coal-fired power plants and new natural gas turbines under Sections 111(b) and 111(d) of the CAA. If implemented, the new 111(b) rule would require all new gas plants built in the United States to either capture the carbon produced or significantly limit the number of hours per year that any new plant could operate, which could impact the ultimate operations of our development projects based on the CO2 emissions limitations contained within the rule. However, multiple parties have filed petitions for review of the rules in the D.C. Circuit Court of Appeals. Multiple parties filed requests to stay the rule pending litigation, but the D.C. Circuit and the U.S. Supreme Court denied such requests for a stay. Oral argument before the D.C. Circuit Court was held on December 6, 2024. The timing for the court’s action is unclear, and the current presidential Administration is expected to significantly change course by seeking to revise, replace or reverse the rule.
18
NAAQS — Ozone
As part of its ongoing CAA obligation to periodically review NAAQS to ensure that air quality is protective of human health and the environment, on October 1, 2015, the EPA set a new standard for ground-level ozone of 70 parts per billion, down from the standard set in 2008 of 75 parts per billion. This requirement is significant to the power sector because ground-level ozone is a product of complex chemical reactions contributed by NOx, one of the primary emissions of concern from power plants.
Air quality in Houston, where six of our power plants are located, has improved over the last two decades. As a result, the Houston area was determined by the EPA to be attaining the 1-hour ozone standard, effective November 19, 2015, and the 1997 8-hour ozone standard, effective January 29, 2016. The Houston area remains in nonattainment relative to the 2008 ozone standard and was downgraded in overall status relative to that standard effective September 23, 2019. The area’s status is also in nonattainment under the 2015 ozone standard, which could lead to further, more stringent regulation of NOx emissions from mobile sources and several industry sources, particularly the power industry.
Under authority granted under the CAA, the Texas Commission on Environmental Quality adopted regulations to attain the earlier NAAQS for ozone, including the establishment of a Cap-and-Trade program for NOx emitted by industrial sources in the Houston-Galveston-Brazoria ozone nonattainment area, including power plants. Our six power plants participating in this program received free NOx allowances based on historical operating profiles. Our Houston-area power plants have sufficient NOx allowances to meet forecasted obligations under the program. Due to the ongoing noncompliance of the Houston-Galveston-Brazoria area with the 2008 and 2015 standards, allowable NOx emissions could be reduced in the future under this program, which could cause us to incur additional compliance costs.
On June 5, 2023, the EPA published the final “Federal Implementation Plan Addressing Regional Ozone Transport for the 2015 Ozone National Ambient Air Quality Standard” in the Federal Register, and the rules went into effect on August 4, 2023. The EPA adopted this action under the “good neighbor” or “interstate transport” provision of the CAA. As adopted, 23 states are subject to tighter emissions budgets for fossil fuel-fired power plants, including some plants owned by Calpine, in the NOx Ozone Season Group 3 Trading Program. However, multiple states have challenged the rule. In June, the U.S. Supreme Court upheld a stay of the rule implementation in its entirety, pending a decision from the D.C. Circuit Court of Appeals on the merits of the various legal challenges. We do not expect this further litigation to be resolved in the next several years and will continue to monitor the litigation and its impact on Calpine as it proceeds through the courts.
Regional Haze
The EPA first issued the Regional Haze rule in 1999, focusing on emissions of SO2, NOx and particulate matter, particularly PM2.5. The Regional Haze program includes two major components: demonstration of Reasonable Further Progress, and installation of Best Achievable Retrofit Technology (“BART”). States submit State Implementation Plans (“SIP”) to the EPA for approval. These SIPs delineate all relevant emission control programs in the state and demonstrate that the state is making reasonable progress toward the Regional Haze program visibility goals.
In the eastern United States, regional NOx and SO2 programs are relied upon in Regional Haze SIPs to achieve much of the required emission reductions. EPA policy also allows them to substitute for the installation of BART. If the EPA does not approve a SIP, it may instead issue a Federal Implementation Plan, which will specify the control requirements for sources in a state.
On July 1, 2024, the EPA agreed to issue final agency actions for over 30 outstanding state plan revisions under the Regional Haze program between July 30, 2024, and December 31, 2026. The consent decree ends a suit by environmental groups alleging that the agency had impermissibly delayed the approvals or denials of state plan revisions.
Hazardous Air Pollutants
In 2012, the EPA adopted MATS for coal- and oil-fired power plants.
After multiple court challenges and rule modifications by different EPA administrations, in April 2024, the EPA finalized strict standards for non-mercury HAP metals and mercury emissions from lignite-fired power plants. The new mercury limit aligns with the existing limit for all other coal-fired EGUs set in 2012; for lignite-fired power plants, this represents a 70% reduction in their allowable mercury emissions. EGUs must reduce their non-mercury HAP emissions by 66% compared to the 2012 MATS standard. The 2024 final rule has now been challenged in the D.C. Circuit Court of Appeals by various states and industry groups.
19
If the MATS were invalidated because of the pending litigation challenging the EPA’s decisions in 2016 or 2020 in the development of the rule or as a result of any litigation concerning the EPA’s finalized rule, then coal-fired power plants would no longer be required to operate their emissions controls, which could disadvantage our cleaner gas-fired power plants in markets where they compete directly with coal-fired power plants.
State Air Emissions Regulations
In addition to federal GHG rules, several states and regional organizations have developed state-specific or regional initiatives to reduce GHG emissions through mandatory programs. The most advanced programs include California’s suite of GHG policies promulgated pursuant to AB 32, including its Cap-and-Trade program, Massachusetts’ CO2 reduction program and RGGI in the Northeast. The evolution of these programs could have a material effect on our business.
In these programs, a cap is established defining the maximum allowable emissions of GHGs emitted by sources subject to the program. Affected sources must hold one allowance for each ton of CO2 emitted (and, in the case of California’s program, other GHGs) during the applicable compliance period. The California and RGGI programs also contain provisions using qualified offsets instead of allowances. Allowances are distributed through auctions or allocations to affected companies. In addition, there are functional secondary markets for allowances. We obtain allowances in various ways, including through bilateral or exchange transactions and under the terms of PPAs.
California: GHG — Cap-and-Trade Regulation
California’s climate policies and GHG reduction targets are among the most ambitious and aggressive in the world. AB 32, as amended by Senate Bill (“SB”) 32 in 2016, requires California to reduce statewide GHG emissions to 1990 levels by 2020 and to at least 40% below 1990 levels by 2030. The California Climate Crisis Act was enacted in 2022 and further establishes the state's policy to achieve net zero GHG emissions as soon as possible, but no later than 2045, and to reduce statewide anthropogenic GHG emissions to 85% below 1990 levels by 2045. To achieve these targets, CARB has promulgated complementary regulatory measures, including the Cap-and-Trade Program and Mandatory Greenhouse Gas Emissions Reporting Regulation. Covered entities, such as our power plants, must surrender compliance instruments, which include both allowances and offset credits, in an amount equivalent to their GHG emissions. AB 398, enacted in 2017, authorized the extension of the Cap-and-Trade Program through 2030 and required several changes to the program, including establishing a price ceiling and other price mitigative mechanisms and limiting the amount of offsets allowed to comply with the regulation.
Northeast GHG Regulation: RGGI
As of December 31, 2024, 11 states in the Northeast participate in RGGI, a Cap-and-Trade program, which affects our power plants in Maine, Massachusetts, New Hampshire, New Jersey, New York and Delaware. Virginia participated but exited participation in RGGI in 2023 through a regulatory, not legislative, process. Due to a legal challenge, a Circuit Court Judge in Virginia ruled in November that legislation is required for Virginia to exit RGGI and struck down the attempted RGGI repeal. Governor Younkin has indicated he will appeal the decision. Unless the Circuit Court decision is stayed pending an appeal, the Virginia Department of Environmental Quality must move forward to allow Virginia RGGI participation. Virginia's participation in RGGI will not have a material impact on Calpine, regardless. Conversely, as discussed more fully in the PJM section above, Pennsylvania joined RGGI in 2022, but that action is being challenged in state court. The court has issued a preliminary injunction prohibiting Pennsylvania from participating in RGGI while litigation continues.
We receive annual allocations from New York’s long-term contract set-aside pool to cover some of the CO2 emissions attributable to our PPA at the Stony Brook Power Plant.
Massachusetts: Global Warming Solutions Act
In addition to participating in RGGI, on August 17, 2017, the Massachusetts Department of Environmental Protection promulgated regulations establishing an annually declining cap on CO2 emissions from in-state electricity generators. The program became effective on January 1, 2018, and established an allowance trading system and auction platform. This program covers CO2 emissions from our Fore River Energy Center, and we will continue to comply with its provisions.
20
Other Environmental Regulations
Renewal Portfolio Standard ("RPS")
We are subject to RPS in multiple states where we conduct business. Generally, RPS requires each retail electricity seller to include in its resource portfolio (the resources procured by the retail seller to supply its retail customers) a certain amount of power generated from renewable or clean energy resources by a certain date.
California SB 100, passed in 2018, sets the California RPS mandating that by 2030, retail power providers generate or procure 60% of the power they sell to retail customers from renewable resources. Further, beginning in 2021, retail power providers must meet 65% of their compliance obligations for contracts with terms of ten years or longer. Finally, per the legislation, all the state’s electricity must come from carbon-free resources by 2045. Behind-the-meter solar generally does not count towards California’s RPS requirements, and there are limits on different “buckets” of procurement that can be used to satisfy the RPS. Load-serving entities must satisfy a growing fraction of their compliance obligations with renewable power from resources located in California or delivered into California within the hour, such as our Geysers Assets.
Additionally, California SB 1020, passed in 2022, establishes interim clean electricity targets of 90% and 95% for 2035 and 2040. As discussed above, the CPUC is implementing “programmatic” procurement requirements to meet the targets. While the RPS (and associated clean energy requirements) generally depress wholesale energy prices, the intermittency of many renewable resources raises operational flexibility challenges that present opportunities for natural gas-fired generation to provide capacity and ancillary services products. In addition, the RPS could result in the retirement of less efficient, non-renewable generating units, creating opportunities for our fleet. Further, California’s clean energy goals continue to encourage our battery development pipeline. They could, subject to additional measures to support recognition of carbon sequestration within the California RPS, eventually support carbon capture retrofits to our existing gas fleet.
Several additional states have RPS in place. Existing state-specific RPS requirements may change due to regulatory and/or legislative initiatives, and other states may consider implementing an enforceable RPS in the future. Our retail subsidiaries operate in states with RPS in place. They must procure a certain amount of power from renewable sources or purchase renewable energy credits to comply with the RPS requirements.
Clean Water Act
The federal Clean Water Act establishes requirements relating to the discharge of pollutants into United States waters, including from cooling water intake structures. Section 316(b) of the Clean Water Act requires that the location, design, construction and capacity of cooling water intake structures reflect the best technology available for minimizing environmental adverse effects. We are required to obtain wastewater and storm-water discharge permits for wastewater and runoff, respectively, for some of our assets. We are subject to the requirements for cooling water intake structures at many of our power plants. In addition, we are required to maintain spill prevention control and countermeasure plans for some of our assets. We do not use once-through cooling technology at any of the power plants in our fleet. We believe that our facilities, subject to the Clean Water Act, comply with applicable discharge requirements of the Clean Water Act.
Safe Drinking Water Act
Part C of the Safe Drinking Water Act establishes the underground injection control program that regulates the disposal of wastes by means of deep well injection. Although geothermal production wells, which bring steam to the surface, are exempt under the Energy Policy Act of 2005, we use geothermal re-injection wells to inject reclaimed wastewater back into the steam reservoir, which is subject to the underground injection control program. We believe that we are in compliance with Part C of the Safe Drinking Water Act and its implementing regulations.
Comprehensive Environmental Response, Compensation and Liability Act
CERCLA, also referred to as the Superfund, requires the clean-up of sites from which there has been a release or threatened release of hazardous substances and authorizes the EPA to take any necessary response action at Superfund sites, including ordering potentially responsible parties liable for the release to pay for such actions. Potentially responsible parties are broadly defined under CERCLA to include past and present owners and operators of a site, as well as generators of wastes sent to a site, and liability under CERCLA can be strict, joint and several. As of the filing of this Report, we are not subject to any material liability for any Superfund matters. However, we generate certain wastes, including hazardous wastes, and send such wastes to third-party waste disposal sites. As a result, there can be no assurance that we will not incur a liability under CERCLA in the future.
21
Changing Governmental and Regulatory Environment
In addition to controls on air emissions, our power plants and battery storage facilities and the equipment necessary to support them are subject to other extensive federal, state and local laws and regulations adopted for the protection of the environment and to regulate land use. The laws and regulations applicable to us primarily involve the discharge of wastewater and water use. Still, they can also include wetlands protection and preservation, protection of endangered species, hazardous materials handling and disposal, waste disposal and noise regulations. Noncompliance with environmental laws and regulations can result in the imposition of administrative, civil, or criminal fines or penalties. In some instances, environmental laws may also impose clean-up or other remedial obligations in the event of a release of pollutants or contaminants into the environment. The federal laws listed above are among the more significant environmental laws that apply to us. In most cases, analogous state laws also exist that may impose similar and, in some cases, more stringent requirements on us than those discussed above. We believe the environmental profile of our portfolio affords us some advantage over our competitors in complying with these laws.
The IRA was signed into law on August 16, 2022. This legislation provides energy tax credits for the development of renewable resources, nuclear, CCS, hydrogen, and electric vehicles and introduces new tax provisions, including the CAMT, as a means to fund continued renewable energy investment. While we cannot currently quantify the long-term effect of this legislation on Calpine, nor can we predict future legislative changes to the IRA, to the extent the IRA stays in place in whole or in part in the future, the IRA’s energy tax credit provisions could have a lasting effect on the power markets in which Calpine operates and provide opportunities for the continued development of renewable resources in the Calpine fleet. Further, the expanded 45Q tax credits benefit our efforts to reduce carbon dioxide emissions from power generation assets by pursuing CCS. While we are not currently subject to the CAMT, we continue to monitor and evaluate the effect of CAMT provisions on Calpine.
In June 2024, the U.S. Supreme Court issued decisions in Loper Bright Enterprises v. Raimondo and Corner Post, Inc. v. Board of Governors, both of which could change the landscape of administrative law in the United States. In Loper, the Court cut back on the deference that courts provide to federal agencies to interpret ambiguous laws they administer, ruling that courts should rely on their own interpretation of ambiguous laws. In Corner Post, the Court made certain agency rules vulnerable to legal challenges under the Administrative Procedure Act years after they were finalized. It is still too early to tell exactly how these decisions may impact the agencies with which Calpine interacts.
Human Capital
We are a commercially focused asset-based organization. We are guided by our stated set of values (“ASPIRE values”). Our ASPIRE values are embedded in our Company’s policies, practices and business decisions. We are successful because of our people. Our employees bring a wealth of talent, experience, intelligence and resourcefulness to us. Our people use these skills to deliver reliable electricity and energy products to our customers. Our people's knowledge base and expertise allow us to optimize the value and profitability of our electric facilities and our retail power provider brands and prudently manage the risks inherent in our business. Our employees are committed to working safely, securely and responsibly.
We provide our employees with a challenging and rewarding performance-based work environment that values diversity, equity and inclusion and allows for professional development and opportunities for advancement. We focus on attracting and retaining talented individuals to manage our operations and provide key support in executing our business strategy.
Health and Safety
Occupational health and safety are core values and are foundational to our culture. Best-in-class health and safety practices mitigate risks to our business and enable us to protect our employees, our environment, our communities and our assets.
Our Executive Safety Committee provides leadership and oversight surrounding health and safety and meets quarterly, focusing on lessons learned from fleet events. At the plant level, each plant location has a safety committee. Importantly, we believe safety is everyone’s responsibility and strive to instill accountability, engagement and continuous learning at all levels of our organization to drive risk recognition and mitigation.
All employees and contractors working on our sites are required to abide by our health and safety policies, procedures and protocols. Our "Three Safety Tenants,” “Event-Free Operations Guidelines,” and “Six Cardinal Rules of Hazard Recognition & Mitigation" inform day-to-day safety practices across our plants and offices. Further, our “Stop Work Obligation Policy” provides that all employees, contractors and visitors have the obligation and right to stop work if a job cannot be done safely.
22
As of December 31, 2024, we employed approximately 2,500 full-time employees, of whom 184 were represented by collective bargaining agreements. Two collective bargaining agreements, representing a total of 29 employees, will expire within one year. We have never experienced a work stoppage or a strike. While we believe that we have excellent depth throughout all levels of management and in all key skill levels of our employees, the loss of the services of one or more members of our senior management or numerous employees with critical skills could have a negative effect on our business, financial conditions and results of operations and future growth. For a discussion of the risk relating to employees with critical skills, see the section titled “Item 1A. Risk Factors.”
23
Item 1A. RISK FACTORS
The following summarizes the principal factors that make an investment in our company speculative or risky, which are more fully described in the section below. This summary should not be relied upon as an exhaustive summary of our business's material risks. The following factors could result in harm to our business, financial condition, results of operations, cash flows and prospects, among other impacts:
Risk Related to the Proposed Merger between Calpine and Constellation
Calpine will be subject to business uncertainties while the Plan of Merger is pending, which could adversely affect our respective businesses.
Uncertainty about the effect of the Plan of Merger on employees, industry contacts and business partners may have an adverse effect on Constellation and Calpine. These uncertainties may impair Calpine’s ability to attract, retain and motivate key personnel until the Plan of Merger is completed and for a period of time thereafter and could cause industry contacts, business partners and others that deal with Calpine to seek to change their existing business relationships with Calpine. Employee retention at Calpine may be particularly challenging during the pendency of the Plan of Merger, as employees may experience uncertainty about their roles with Constellation following the Plan of Merger. In addition, the Plan of Merger Agreement requires Calpine to follow certain interim operation covenants until completion of the Plan of Merger. These restrictions may negatively affect the businesses, operations and financial results during the pendency of the Plan of Merger.
Risks Related to Our Business
Power Operations
Our power operations performance involves significant risks and hazards and may be below expected levels of output or efficiency.
The operation of power plants and battery storage facilities involves risks, including the breakdown or failure of power generation or storage equipment, transmission lines, pipelines or other equipment or processes, performance below expected levels of output or efficiency and risks related to the creditworthiness of our contract counterparties and the creditworthiness of our counterparties’ customers or other parties, such as steam hosts, with whom our counterparties have contracted. From time to time, our power plants and battery storage facilities have experienced unplanned outages, including extensions of scheduled outages due to equipment breakdowns, failures or other problems, which are inherent risks to our business. Unplanned outages typically can result in lost revenues, inability to perform and potential recognition of liquidated damages owed and/or termination of existing long-term PPAs, increase our maintenance expenses and may reduce our profitability, which could have a material adverse effect on our financial condition, results of operations and cash flows.
Our power operations are inherently hazardous and may lead to catastrophic events, including loss of life, personal injury and property destruction. These events may also subject us to future claims, litigation and enforcement.
Our power plants and battery storage facilities operations are inherently hazardous. They may lead to catastrophic events, including loss of life, personal injury and destruction of property and subject us to litigation. Natural gas is highly explosive, and power generation and energy storage operations involve hazardous activities, including acquiring, transporting and delivering fuel, operating large pieces of rotating equipment and delivering power to transmission and distribution systems. These and other hazards include, but are not limited to, the risk of events such as wildfires, other natural disasters or extreme weather events, that may affect the ability for our power plants and battery storage facilities to operate, can cause severe damage to and destruction of property, plant and equipment and suspension of operations. In the worst circumstances, catastrophic events can cause significant personal injury or loss of life. Further, any of these events may result in us being named as a defendant in lawsuits asserting claims for substantial damages. We maintain an amount of insurance protection that we consider adequate; however, we cannot provide any assurance that the insurance will be sufficient or effective under all circumstances and against all hazards or liabilities to which we are subject.
We rely on power transmission and fuel distribution facilities owned and operated by other companies.
We depend on facilities and assets that we do not own or control for the transmission to our customers of the power products from our power plants and battery storage facilities and the distribution of natural gas or fuel oil to our power plants. If these transmission and distribution systems are disrupted or the capacity of those systems is inadequate, our ability to sell and deliver power products or obtain fuel may be hindered. ISOs that oversee transmission systems in regional power markets have imposed price limitations and other mechanisms to address volatility in their power markets. Existing congestion, as well as the expansion of transmission systems, could affect our performance, which in turn could adversely affect our business.
24
Our project development and construction activities may not be completed on schedule or within budget and may not be successful.
As of December 31, 2024, we are developing additional battery storage capacity, various natural gas and renewable power generation facilities and carbon capture facilities. We expect to continue to develop and construct other facilities in the future. The development and construction of power plants and battery storage facilities are subject to substantial risks. In connection with the development of a project, we must generally obtain:
| · | necessary power generation or storage equipment; | |
| · | governmental permits and approvals, including environmental permits and approvals; | |
| · | fuel supply and transportation agreements; | |
| · | sufficient equity capital and debt financing; | |
| · | power transmission agreements; | |
| · | long-term customer contracts; | |
| · | water supply and wastewater discharge agreements or permits; and | |
| · | site agreements and construction contracts. |
To the extent that our development and construction activities continue or expand, we may be unsuccessful on a timely and profitable basis. Although we may attempt to minimize the financial risks of these activities by securing a favorable PPA and arranging adequate financing prior to the commencement of construction, the development of a battery storage facility or power project may require us to expend significant cash sums for preliminary engineering, permitting, legal and other expenses before we can determine whether a project is feasible, economically attractive or financeable. The process for obtaining governmental permits, approvals and/or grants is complicated and lengthy, often taking more than one year, and is subject to significant uncertainties. These permits and approvals are usually subject to litigation, prolonging the development timeline by several years. We may be unable to obtain all necessary licenses, permits, approvals and certificates for proposed projects and completed battery storage facilities or power plants may not comply with all applicable permit conditions, statutes or regulations. In addition, regulatory compliance for the construction and operation of our facilities can be costly and time-consuming. Intricate and changing environmental and other regulatory requirements may necessitate substantial expenditures to obtain and maintain permits. A project may be unable to function as planned due to changing requirements, loss of required permits or regulatory status or local opposition. In that case, it may create expensive delays, extended periods of non-operation or significant loss of value in a project, resulting in potential impairments and loss of PPAs.
We are dependent on third-party contractors for the successful completion of our construction projects, and these contractors may not be able to complete these projects on time, within budget and in accordance with agreed-upon specifications.
Our construction projects could be subject to delays, cost overruns, reduced performance outcomes and other factors that could have a material adverse effect on our business, financial condition, operating results, cash flow, liquidity and prospects. The timely and cost-effective completion of our projects in compliance with agreed specifications is central to our business strategy. It is highly dependent on several factors, including the performance of third-party equipment suppliers as well as engineering, procurement and construction (“EPC”) contractors pursuant to their agreements with us.
We have not yet entered into definitive agreements with all the contractors and suppliers necessary for our projects' development and construction. We may not be able to successfully enter into such supply and construction contracts on terms or at prices that are acceptable to us, including because skilled EPC contractors (particularly those with experience in solar, battery storage and carbon capture facilities) and significant items of equipment are in high demand and equipment supply chains continue to be constrained.
The ability of our EPC contractors to perform successfully under their agreements with us is dependent on several factors, including, but not limited to, their ability to:
| · | design, engineer and receive critical components and equipment necessary for each of our facilities to operate in accordance with specifications and address any start-up and operational issues that may arise in connection with the commencement of commercial operations; | |
| · | engage and retain third-party subcontractors and procure equipment and supplies; | |
| · | effectively respond to difficulties such as equipment failure, delivery delays, supply chain issues, schedule changes and failures to perform by subcontractors; |
25
| · | attract, develop and retain laborers and skilled personnel, including engineers; | |
| · | post required construction bonds and comply with the terms thereof; | |
| · | manage the construction process in compliance with the requirements of the IRA; | |
| · | manage the construction process generally, including coordinating with other contractors and regulatory agencies and dealing with inclement weather conditions; and | |
| · | maintain their financial condition, including adequate working capital. |
Our EPC contracts and equipment supply contracts are also subject to a number of other risks that may result in delays, price overruns and reduced performance outcomes, including equipment and materials availability and changes in laws, including import tariffs. Although some of our EPC contracts may provide for liquidated damages to be paid to us if the contractor is delayed in completing a project or if the project fails to achieve certain performance standards, any liquidated damages that we receive may be delayed, capped or otherwise insufficient to cover the damages that we suffer because of any such delay or reduced performance outcome.
Furthermore, we may have disagreements with our contractors about different elements of the construction process, which could lead to the assertion of rights and remedies under their contracts that increase the cost of the applicable facility or result in a contractor’s unwillingness to perform further work. If any contractor is unable or unwilling to perform according to the negotiated terms and timetable of its respective agreement for any reason, we would be required to engage a substitute contractor, which could be particularly difficult as demand for skilled and experienced EPC contractors increases. This substitution would likely result in significant project delays and increased costs and the damages provided under the applicable EPC contract may be inadequate to compensate us for the cost of such substitution fully.
Since some of our projects will be developed and constructed using an EPC contractor and one or more equipment suppliers, the different contractors may attribute equipment or project defects or damages to the other contractor. In this event, there may be disputes between us and one or more contractors regarding which contractor is responsible for project or equipment defects and damage. Further, one contractor or supplier could damage or delay the work of another, forcing us to grant relief to the aggrieved contractor. This could result in delays and/or additional project costs.
Delays in completing a project may require us to pay liquidated damages under our customer contracts under certain circumstances, result in contract terminations, or otherwise have a material adverse effect on our financial condition and results of operations. Delays may also cause costs to bring a project to completion to be greater than expected, which could reduce the project’s profitability and/or result in damages payable by us.
In addition, delays in completing a project could result in a default under the financing agreement for the project. In such an event, there is no assurance that we will be able to obtain waivers from lenders or refinance loan agreements on acceptable terms or at all. We may be required to post additional security under any such loan agreements and agree to additional covenants that could restrict our ability to finance our future operations and capital needs.
We may be unable to obtain an adequate fuel supply in the future or face transmission constraints.
We obtain substantially all our physical natural gas and fuel oil supply from third parties under arrangements that vary in terms of pricing structure, firmness and delivery flexibility. Our physical natural gas and fuel oil supply arrangements must be coordinated with transportation agreements, balancing agreements, storage services, financial hedging transactions and other contracts so that the natural gas and fuel oil are delivered to our power plants at times, in the quantities, and otherwise in a manner that meets the needs of our generation portfolio and our customers. We must also comply with laws and regulations governing natural gas transportation.
Additionally, the PJM and ISO-NE power markets have recently experienced an increase in natural gas-fired generation assets that supply electricity to the area. As a result, there has been a corresponding increase in the need for natural gas transmission assets to supply the generation assets with fuel to generate power. When extreme cold temperatures rapidly increase the demand for natural gas for residential heating, it can also create constraints on natural gas pipelines that serve power generation assets. When these conditions exist, they could interrupt the fuel supply to our natural gas-fired power plants in these power markets. However, some of our natural gas-fired power plants in this region are dual-fuel and benefit from the ability to operate on both natural gas and fuel oil.
26
Adequate supplies of natural gas and fuel oil are currently available to us at prices we believe are reasonable for each of our power plants. Availability of supply is generally not an issue; localized shortages (especially in extreme weather conditions in and around population centers), transportation availability and supplier financial stability issues can and do occur. We are exposed to increases in the price of natural gas and fuel oil, and it is possible that sufficient supplies to operate our portfolio profitably may not continue to be available to us. In addition, we face risks regarding the delivery to and the use of natural gas and fuel oil by our power plants, including the following:
| · | transportation may be unavailable if pipeline infrastructure is damaged or disabled due to natural disasters or other events; | |
| · | pipeline tariff changes may adversely affect our ability to, or cost to, deliver natural gas and fuel oil supply; | |
| · | new pipelines and pipeline expansions may not be permitted in a timely manner due to environmental concerns or prolonged regulatory processes; | |
| · | third-party suppliers may default on natural gas supply obligations, and we may be unable to replace supplies currently under contract; | |
| · | market liquidity for physical natural gas and fuel oil or availability of natural gas and fuel oil services (e.g., storage) may be insufficient or available only at prices that are not acceptable to us; | |
| · | natural gas and fuel oil quality variation may adversely affect our power plant operations; | |
| · | our natural gas and fuel oil operations capability may be compromised due to various events such as natural disasters, loss of key personnel or loss of critical infrastructure; | |
| · | fuel supplies diverted to residential heating for humanitarian reasons; and | |
| · | any other reasons. |
If we were to experience a significant reduction in our expected revenues and operating cash flows for an extended period, our power plants, battery storage facilities and construction projects could be subject to impairments.
If we were to experience a significant reduction in our expected revenues and operating cash flows for an extended period due to a prolonged economic downturn or advances or changes in technologies, we could experience future impairments of our power plant and battery storage assets. There can be no assurance that any such losses or impairments to the carrying value of our financial assets would not have a material adverse effect on our financial condition, results of operations and cash flows.
For example, during the year ended December 31, 2022, we recorded impairment losses of approximately $46 million related to our Carlls Corner Energy Center, Mickleton Energy Center, Sherman Avenue Energy Center and Cumberland Energy Center because of legislation signed into law in January 2023. The Company recorded no impairment losses during the year ended December 31, 2023, and no impairment losses during the year ended December 31, 2024.
Our geothermal resources may be inadequate for our operations.
In connection with each geothermal power plant, we estimate the productivity of the geothermal resource and the expected decline in productivity. The productivity of a geothermal resource may decline more than anticipated, resulting in insufficient reserves being available for sustained generation of the desired power capacity. In addition, we may not be able to successfully manage the development and operation of our geothermal reservoirs or accurately estimate the quantity or productivity of our steam reserves. An incorrect estimate, an inability to manage our geothermal reserves, or a decline in productivity could adversely affect the results of our operations or financial condition. In addition, the development and operation of geothermal power resources are subject to substantial risks and uncertainties. The successful exploitation of a geothermal power resource ultimately depends upon many factors, including the following:
| · | the heat content of the extractable steam or fluids; | |
| · | the geology of the reservoir; | |
| · | the total amount of recoverable reserves; | |
| · | operating expenses relating to the extraction of steam or fluids; | |
| · | price levels relating to the extraction of steam, fluids or power generated; and | |
| · | capital expenditure requirements relating primarily to the drilling of new wells. |
27
Significant events beyond our control, such as natural disasters, weather-related events or acts of terrorism, could damage our power plants, battery storage facilities or corporate offices, cause a loss of system load and may affect us in unpredictable ways.
Certain of our geothermal and natural gas-fired power plants and battery storage facilities, particularly in the West, have been in the past and remain subject to frequent low-level seismic disturbances. More significant seismic disturbances are possible. In addition, extreme weather events, including winter storms such as Winter Storm Uri, tornadoes, tropical storms or hurricanes and bouts of extreme temperature, may impact areas in which we operate. A hurricane, tropical storm or other severe wind or rain event could substantially affect operations at our corporate offices in Houston, Texas. Any significant loss of system load resulting from a weather-related event could negatively impact our wholesale business and retail subsidiaries. Such events could damage or shut down our power plants, battery storage, power transmission or the fuel supply facilities upon which our wholesale business and retail subsidiaries depend. We have also experienced damage and outages at other facilities due to extreme weather events such as hurricanes and winter storms, including fuel supply disruptions. Our existing power plants and battery storage facilities are built and maintained to reduce exposure to severe weather events and/or relatively significant seismic disturbances. We believe our insurance policies are adequate to cover damage caused by most natural disasters, weather-related events, acts of terrorism or earthquakes. However, our property damage or business interruption insurance may be inadequate to cover all potential losses sustained in the event of extensive damage to multiple power plants and battery storage facilities or large-scale disruptions to our wholesale and retail operations due to natural disasters. Moreover, as insurance companies adjust their approaches to reflect changing risk patterns, there can be no guarantee that such insurance policies will continue to be available in the future on terms we find acceptable.
Periodic wildfires, particularly in California, could damage our power plants and battery storage facilities, cause a loss of system load and affect us in unpredictable ways.
Our geothermal and natural gas-fired power plants and battery storage facilities in the West have been in the past and remain subject to an ongoing risk of wildfires. Severe drought conditions, unseasonably warm temperatures and stronger winds have increased the severity and prevalence of wildfires in various areas where we operate, particularly California. For example, our Geysers Assets have been adversely affected by wildfires several times in the last ten years, including damage sustained by the Kincaid and Valley wildfires. Wildfires and other extreme weather events may materially and adversely affect our operations in the future. Such events could damage or shut down our power plants, battery storage, power transmission or the fuel supply facilities upon which our power plants or battery storage facilities are dependent or cause serious injuries, fatalities, property damage or service interruptions, which could expose us to liabilities that could be material. We believe our insurance policies adequately cover damage caused by most wildfires. However, our property damage or business interruption insurance may be inadequate to cover all potential losses sustained in the event of extensive damage to multiple power plants and battery storage facilities or large-scale disruptions to our operations due to wildfires. Wildfires in California and other areas may exacerbate these insurance risks by leading to adverse changes in insurance deductibles, premiums, coverage and/or limits. If we incur substantial liability and the damages are above our estimates for self-insured claims, or such damages are not covered by our insurance policies or exceed policy limits or if we incur liability at a time when we do not have liability insurance, our results of operations and cash flows could be materially and adversely affected.
In addition, electric utilities in many states within our West segment may shut down power for public safety reasons, such as during periods of extreme fire hazard, if the utility reasonably believes that there is an imminent and significant risk that strong winds may topple power lines or cause vegetation to make contact with power lines leading to increased risk of fire. We have previously experienced shutdowns for public safety reasons at The Geysers. Any shutdown of power for public safety reasons may reduce our revenues by halting operations at our power plants and battery storage facilities and/or reducing the market for power.
Our business is subject to physical, market and economic risks relating to the potential effects of climate change. Policies at the national, regional and state levels to regulate greenhouse gas emissions and mitigate climate change could adversely impact our results of operations, financial condition and cash flows.
Fluctuations in weather and other environmental conditions, including temperature and precipitation levels, may affect customer demand for electricity or natural gas. In addition, the potential physical effects of climate change, such as increased frequency and severity of storms, floods and other climatic events, could disrupt our operations and supply chain and cause us to incur significant costs in preparing for or responding to these effects. These or other climate changes could increase operating costs or capital expenses. Our customers may also experience the potential physical impacts of climate change. They may incur significant costs in preparing for or responding to these efforts, including changing the fuel mix and resiliency of their energy solutions and supply.
Climate change's contribution to the frequency or intensity of weather-related events could affect our operations and planning process. Climate change could also affect the availability of a secure and economical water supply in some locations, which is essential for the continued operation of our generation plants. If it is determined that extreme weather events could impact projected generation levels at any plant, risk mitigation efforts are identified and evaluated for implementation; however, there can be no guarantee that such efforts will be successful.
Further, demand for our energy-related services could be similarly impacted by customers’ preferences or market or regulatory factors favoring energy efficiency, lower-carbon energy sources or reduced electricity or natural gas usage. To the extent markets prefer alternative energy technologies different from those we operate, it may impact our ability to retain or attract additional customers or otherwise adversely affect our business.
28
Our operations depend on the availability of sufficient water resources.
Various forms of power generation, including natural gas and geothermal and energy-intensive activities, such as data centers, depend on water access to function. Certain of our assets in the West and Texas Regions, including The Geysers, have experienced drought conditions in the recent past. Disruptions in water availability — whether natural, such as droughts, or artificial, such as curtailment or high prices — may impact our ability to generate energy or serve customers, adversely impacting our operations and financial condition. Further, disruptions in water availability at The Geysers may affect the water injection program, steam production and generation levels at The Geysers.
We are subject to a series of risks regarding various sustainability and related “environmental, social and governance” (“ESG”) matters.
Companies across industries face increasing scrutiny from various stakeholders regarding environmental sustainability, climate change, water, natural capital, diversity, equity and inclusion (“DEI”), human rights and other ESG matters. Stakeholder actions and increased regulatory activity regarding such matters could adversely impact our operations, costs of or access to capital, demand for our products/services and otherwise impact or limit business plans. Our management of ESG matters may require us to incur additional costs and may not have the desired effects.
Additionally, there are and may continue to be, increasing levels of regulation, disclosure-related and otherwise, concerning ESG matters. For example, policymakers such as the SEC and the State of California have adopted, and other policymakers are considering adopting, requirements for significant additional disclosures of climate- or other sustainability-related information, which may require us to incur costs for compliance. Various stakeholders also use ESG considerations in their decision-making. Unfavorable perceptions of our ESG profile may negatively impact our business, whether from a reputational perspective or our attractiveness to capital providers, employees, customers and business partners. Simultaneously, some stakeholders have attempted to reduce companies’ efforts on certain ESG-related matters. Both advocates and opponents of certain ESG matters increasingly resort to various forms of activism, including media campaigns and litigation, to advance their perspectives. To the extent we are subject to such efforts, we may incur costs or otherwise adversely impact our business. Such risks may also affect certain of our suppliers or customers, resulting in indirect impacts, including those that may not be known to us.
Our business, financial condition and results of operations could be adversely affected by strikes or work stoppages by unionized employees or by our inability to replace key employees.
As of December 31, 2024, approximately 7% of our employees are subject to collective bargaining agreements. If our union employees participate in a strike, work stoppage or other forms of labor disruption, we would be responsible for procuring replacement labor. We could experience reduced power generation or outages.
In addition, our success largely depends on our people's skills, experience and efforts. The market for highly skilled workers in our industry is extremely competitive, particularly where many of our key personnel are located. The loss of the services of one or more members of our senior management or numerous employees with critical skills could harm our business, financial condition, results of operations and future growth if we could not replace them. We also do not currently maintain any key person life insurance policies.
Our operations are subject to hazards and risks that require significant and continuous oversight. If one or more such risks occur and we cannot respond quickly or adequately, it could affect our results of operations and financial condition.
Our operations are subject to various hazards and risks that require significant and continuous oversight, many of which are described in more detail in Item 1A. Risk Factors section, including explosions, fires, severe weather, geological events, global health crises, such as epidemics and pandemics, labor disputes, geopolitical tensions, terrorist attacks, sabotage, civil unrest or cyberattacks. Our business and operations may be disrupted if we do not respond, or are perceived not to respond, in an appropriate manner to any of these hazards and risks or any other major crisis or if we are unable to restore or replace affected operational components and capacity efficiently. Countermeasures to address global health crises, epidemics or pandemics may result in disruptions to our supply chain, the global economy or financial or commodity markets; disruptions in our contractual arrangements with our service providers, suppliers and other counterparties; failures by our suppliers, contract manufacturers, contractors, joint venture partners and external business partners, to meet their obligations to us; reduced workforce productivity; and voluntary or involuntary curtailments. Further, our insurance may not be adequate to compensate us for all resulting losses described above, and the cost to obtain adequate coverage may increase for us in the future or may not be available. Any of these factors could materially increase our costs, negatively impact our revenues and damage our financial condition, results of operations, cash flows and liquidity position.
29
Negative publicity may damage our reputation or brand and negatively impact our business, financial condition and results of operations.
Our reputation and brand could be damaged for numerous reasons, including negative views of our environmental impact, sustainability goals, supply chain practices, product and service offerings and public statements made by our officials. Additionally, we are sometimes named in investigations, claims and lawsuits arising in the ordinary course of business, and customers have in the past communicated complaints to consumer protection organizations, regulators or the media. Negative claims or publicity regarding us or our operations, offerings, practices or customer service may damage our brands or reputation, even if such claims are untrue. We may also experience criticism or backlash from media, customers, employees, government entities, advocacy groups and other stakeholders who disagree with positions taken by us or our executives. If our brand or reputation is damaged, it could negatively impact our business, financial condition, results of operations and ability to attract and retain highly qualified employees.
Commercial Operations
Our financial performance is affected by commodity price fluctuations in the wholesale and retail power and natural gas markets and other market factors beyond our control.
Market prices for power, generation capacity, ancillary services, natural gas, fuel oil and RECs are unpredictable and tend to fluctuate substantially. Electric power generally must be produced concurrently with its use. As a result, power prices are subject to significant volatility due to supply and demand imbalances, especially in the day-ahead and spot markets. Depending upon the price risk management activity we undertake, a decline in market prices for power, generation capacity and ancillary services may adversely affect our financial performance. Long- and short-term power and natural gas prices may also fluctuate substantially due to other factors outside of our control, including:
| · | changes in generation capacity in our markets, including the addition of new supplies of power as a result of the development of new plants, expansion of existing plants, the continued operation of uneconomic power plants due to state or federal subsidies, retirement of existing plants or addition of new transmission capacity; | |
| · | changes in power transmission or fuel transportation capacity constraints or inefficiencies; | |
| · | changes in power and gas transmission infrastructure; | |
| · | volatile weather conditions, particularly unusually hot or mild summers or unusually cold or warm winters in our market areas; | |
| · | an economic downturn that could negatively affect demand for power; | |
| · | supply disruptions caused by power plant outages or transmission disruptions or shortages of commodities used as fuel sources for power generation, including but not limited to coal, natural gas and fuel oil; | |
| · | changes in the demand for power or in patterns of power usage, including (1) electrification, data center usage, manufacturing and on-shoring, (2) the potential development of demand-side management tools, (3) continued expansion and technological advancements in power storage capability and (4) the development of new fuels or new technologies for the production or storage of power; | |
| · | federal and state power, market, tax and environmental regulation and legislation, such as the 2022 Inflation Reduction Act, that results in a mandated RPS or creating financial or tax incentives, each resulting in new renewable or other energy generation capacity creating oversupply; | |
| · | changes in prices related to RECs and other environmental allowance products; and | |
| · | changes in energy and capacity prices and energy and capacity markets. |
These factors have caused our operating results to fluctuate in the past and will continue to cause them to do so in the future.
We may not be able to pass through price fluctuations and other changes in our costs to our end-user customers due to the following factors, which are beyond our control:
| · | rate caps, price limitations and bidding rules imposed by ISOs, RTOs and other market regulators that may impair our ability to recover our costs and limit our return on our capital investments; | |
| · | regulations promulgated by FERC, the CFTC and state public utility commissions; | |
| · | sufficient liquidity in the forward commodity markets to conduct our desired trading and hedging activities; |
30
| · | some of our competitors (mainly utilities) receive entitlement-guaranteed rates of return on their capital investments, with returns that exceed market returns and may affect our ability to sell our power at economical rates; | |
| · | structure and operating characteristics of capacity and energy markets in which we operate, such as the PJM and ISO-NE capacity auctions and the NYISO and California energy markets; and | |
| · | regulations and market rules related to our RECs. |
Accounting for derivative hedging activities and trading may increase the volatility in our quarterly and annual financial results.
We engage in commodity-related marketing and price-risk management activities to economically hedge our forward commodity market price risk exposure using both physical and financial commodity purchases and sales commitments. Some of these contracts are accounted for as derivatives under U.S. GAAP, which requires us to record the fair value of the commitment on the balance sheet with changes in the fair value of all derivatives reflected within current period earnings if hedge accounting is not applied. We also engage, to a substantially lesser extent compared to our hedging activities, in proprietary derivative transactions that are not intended to hedge our own risk but are instead intended to make a profit by capitalizing on arbitrage opportunities with basis, time, quality or geographic spreads related to the energy products we sell. Proprietary derivative transactions, by their nature, expose us to changes in the underlying commodity prices of the proprietary positions taken. Any adverse changes could result in losses, which can be further exacerbated in the financial and other markets. As current period earnings are impacted by non-cash mark-to-market gains/losses associated with price risk management hedges of future period activity that are accounted for as derivatives, we are unable to accurately predict the effect that our risk management decisions may have on our quarterly and annual financial results prepared in accordance with U.S. GAAP.
The use of hedging agreements and trading may not work as planned or fully protect us and could result in financial losses.
In accordance with internal policies and procedures designed to monitor hedging activities and positions and proprietary trading, we enter into hedging agreements and proprietary derivative transactions, including contracts to purchase or sell commodities at future dates and at fixed prices, to manage our commodity price risks. As part of this, the portfolio may be positioned net long or net short power or gas at any given time. Although intended to mitigate price volatility and enhance portfolio value, these activities expose us to risks related to commodity price movements, deviations in weather and other risks. When we sell power forward, we may be required to post significant amounts of cash collateral or other credit support to our counterparties, and we give up the opportunity to sell power at higher prices if spot prices are higher in the future. Further, if the values of the financial contracts change in a manner that we do not anticipate, or if a counterparty or customer fails to perform under a contract, it could harm our financial condition, results of operations and cash flows.
We do not typically hedge the entire exposure of our operations against commodity price volatility. To the extent we do not hedge against commodity price volatility, our financial condition, results of operations and cash flows may be diminished based upon adverse movement in commodity prices.
Our ability to enter into hedging agreements and derivative transactions and manage our counterparty and customer credit risk could adversely affect us.
Our wholesale counterparties, retail customers and suppliers may experience deteriorating credit. These conditions could cause counterparties in the natural gas and power markets, particularly in the energy commodity derivative markets we rely on for our hedging activities, to withdraw from participating in those markets. If multiple parties withdraw from those markets, market liquidity may be threatened, adversely affecting our business, and creating more earnings volatility. Additionally, these conditions may cause our counterparties or customers to seek bankruptcy protection under Chapter 11 or liquidation under Chapter 7 of the U.S. Bankruptcy Code. Our credit risk may be exacerbated to the extent that collateral held by us cannot be realized or is liquidated at prices insufficient to recover the full amount of the exposure due to us. There can be no assurance that any such losses or impairments to the carrying value of our financial assets would not materially and adversely affect our financial condition, results of operations and cash flows.
Extensive competition in our wholesale and retail businesses could adversely affect our performance.
The power industry is characterized by intense competition, including from utilities, industrial companies, marketing and trading companies and other independent power producers. This competition may pressure power utilities to lower their costs, including the cost of purchased power. In addition, construction during the last decade has created excess power supply and higher reserve margins in certain power trading markets, putting downward pressure on prices.
31
Other companies we compete with may have greater liquidity, greater access to credit and other financial resources, lower cost structures, greater ability to incur losses, longer-standing relationships with customers, greater potential for profitability from ancillary services, or greater flexibility in the timing of their sale of generation capacity and ancillary services than we do.
Additionally, extensive competition exists in the retail power markets in which our retail subsidiaries operate. Competitors may offer lower prices or other incentives to attract customers away from our retail subsidiaries. We may also face competition from several other energy service providers, other energy industry participants or nationally branded providers of consumer products and services who may develop businesses that will compete with our retail subsidiaries.
In certain situations, the counterparty or customer may terminate our PPAs and other contractual arrangements, including construction agreements, commodity contracts, maintenance agreements and other arrangements and/or allow the counterparty or customer to seek liquidated damages.
The counterparty or customer may terminate our PPAs, construction agreements, commodity contracts, maintenance agreements and other contractual arrangements. They may also seek to enforce the liquidated damages provisions contained in such agreements.
The situations that could allow a counterparty or customer to terminate the contract and/or seek liquidated damages include:
| · | our inability to satisfy certain minimum availability or energy output requirements contained in our PPAs; | |
| · | the cessation or abandonment of the development, construction, maintenance or operation of a power plant; | |
| · | failure of a power plant to achieve construction milestones or commercial operation by agreed-upon deadlines; | |
| · | failure of a power plant to achieve certain output or efficiency minimums; | |
| · | our failure to make any of the payments owed to the counterparty or to establish, maintain, restore, extend the term of or increase any required collateral; | |
| · | failure of a power plant to obtain material permits and regulatory approvals by agreed-upon deadlines; | |
| · | a material breach of a representation or warranty or our failure to observe, comply with or perform any other material obligation under the contract; or | |
| · | events of liquidation, dissolution, insolvency or bankruptcy. |
Revenue may be reduced significantly upon expiration or termination of our PPAs.
A material portion of the capacity or energy from our existing portfolio is sold under long-term PPAs that expire at various times. We seek to extend contracts or sell any capacity not sold under long-term PPAs on a short-term basis as market opportunities arise. Our non-contracted capacity is generally sold on the spot market at current market prices as merchant energy. When the terms of each of our various PPAs expire, it is possible that the price paid to us for power generation under subsequent arrangements or in short-term markets may be significantly less than the price paid to us under the PPA. Without the benefit of long-term PPAs, we may not be able to sell any or all of the capacity from these power plants or battery storage facilities at commercially attractive rates, and these power plants and battery storage facilities may not be able to operate profitably. Certain of our PPAs have values above current market prices. If a counterparty to a PPA were to seek bankruptcy protection under Chapter 11 or liquidation under Chapter 7 of the U.S. Bankruptcy Code, they may be able to terminate the PPA. We risk losing margins to the extent that these contracts expire or are terminated, and we cannot replace them on comparable terms.
The introduction or expansion of competing technologies for power generation and demand-side management tools could adversely affect our performance.
The power generation business has substantially changed the technologies used to produce and store power. With federal and state incentives for developing and producing renewable power sources, we have seen market penetration of competing technologies, such as wind, solar and commercial-sized power storage. Additionally, the development of demand-side management tools and practices can affect peak demand requirements for some of our markets at certain times during the year. The continued development of subsidized, competing power generation and storage technologies and significant development of demand-side management tools and practices could alter the market and price structure for power and negatively affect our financial condition, results of operations and cash flows.
32
Supplier Concentration Risk
Supplier concentration, suppliers' inability to meet their obligations and dependence on third-party service providers may expose us to performance and cost risks and adversely affect our results of operations, cash flows and financial condition.
We often rely on a single contracted supplier or a few suppliers for turbines and other key parts and services required to operate our facilities. We will be forced to use the marketplace if these or any other suppliers cannot perform these services. There can be no assurance that the marketplace can provide these services as, when, and where required or at comparable prices. The failure of any supplier to fulfill its contractual obligations to us, our inability to source products and services on acceptable terms, if at all, and the failure of third parties to provide services to its customers that are necessary for our operations could have a material adverse effect on our financial results. As a result, our facilities' financial performance depends on the credit quality and continued performance by suppliers, which cannot be guaranteed.
Risks Related to Capital Resources and Liquidity
We have substantial liquidity needs and could face liquidity pressure.
As of December 31, 2024 and 2023, our consolidated debt outstanding was $12,162 million and 11,829 million, respectively, of which approximately $7,646 million and $7,735 million was outstanding under our First Lien Term Notes, First Lien Notes and Senior Unsecured Notes. In addition, as of December 31, 2024 and 2023, we had 2,052 million and $2,051 million, respectively issued in letters of credit. We also have agreements, such as accounts receivable monetization facilities, which assist in managing our working capital liquidity needs. Although we significantly extended our maturities during the last several years, we could face liquidity challenges as our business operations require substantial debt and liquidity requirements. Our ability to make payments on our indebtedness, meet margin requirements and fund planned capital expenditures and development efforts will depend on our ability to generate cash from our operations and access the capital markets. This, to a certain extent, is dependent upon industry conditions and general economic, financial, competitive, legislative, regulatory and other factors beyond our control, as discussed further in Item 1A. Risk Factors above.
We also have exposure to many different financial institutions and counterparties, including those under our credit and financing arrangements, as we routinely execute transactions in connection with our hedging and optimization activities, including brokers and dealers, commercial banks, investment banks, wholesale counterparties, ISOs, retail customers and other institutions and industry participants. Many of these transactions expose us to credit risk if any of our lenders or counterparties cannot honor their commitments or otherwise default under a financing agreement. For example, our wholesale business currently has contracts with investor-owned California utilities, which could be affected should they be found liable for recent wildfires in California and, accordingly, incur substantial costs associated with the wildfires. See additional discussion regarding our capital resources and liquidity in Item 7. Management’s Discussion and Analysis of Financial Condition and Results of Operations — Results of Operations.
Our indebtedness could adversely affect our financial health and limit our operations.
Our indebtedness has important consequences, including:
| · | limiting our ability to borrow additional amounts for working capital, capital expenditures, debt service requirements, potential growth or other purposes; | |
| · | limiting our ability to use operating cash flows in other areas of our business because we must dedicate a substantial portion of these funds to service our debt; | |
| · | increasing our vulnerability to general adverse economic and industry conditions and limiting our ability to manage collateral volatility; | |
| · | limiting our ability to capitalize on business opportunities and to react to competitive pressures and adverse changes in governmental regulation; | |
| · | limiting our ability or increasing the costs to refinance indebtedness; and | |
| · | limiting our ability to enter into marketing, hedging and optimization activities by reducing the number of counterparties with whom we can transact and the volume and type of those transactions. |
33
We may be unable to obtain additional financing or access the credit and capital markets in the future at prices that are beneficial to us or at all.
If our available cash, including future cash flows generated from operations, is insufficient in the near term to finance our operations, post collateral or satisfy our obligations as they become due, we may need to access the capital and credit markets. Our ability to arrange financing (including any extension or refinancing) and the cost of the financing depends upon numerous factors, including general economic and capital market conditions. Market disruptions such as those experienced in the United States and abroad in recent years may increase our borrowing costs or adversely affect our ability to access capital. Other factors include:
| · | low credit ratings may prevent us from obtaining any material amount of additional debt financing; | |
| · | conditions in energy commodity markets; | |
| · | regulatory developments; | |
| · | credit availability from banks or other lenders for us and our industry peers; | |
| · | investor confidence in the industry and us; | |
| · | the continued reliable operation of our current power plants and battery storage facilities; and | |
| · | provisions of tax, regulatory and securities laws conducive to raising capital. |
While we have used non-recourse or lease financing when appropriate, market conditions and other factors may prevent us from completing similar financings in the future. We may be unable to obtain the financing required to develop, construct, acquire or expand power plants, battery storage facilities or new ventures, including battery storage projects, on terms satisfactory to us. We have financed our existing power plants and battery storage facilities using a variety of leveraged financing structures, including senior secured and unsecured indebtedness, construction financing, project financing, term loans and lease obligations. In the event of a default under a financing agreement that we do not cure, the lenders or lessors would generally have rights to the power plant and any related assets. In the event of foreclosure after a default, we may not be able to retain any interest in the power plant or other collateral supporting such financing. In addition, any such default or foreclosure may trigger cross-default provisions in our other financing agreements.
Our debt instruments impose restrictions on us, and any failure to comply with these restrictions could have a material adverse effect on our liquidity and operations.
The restrictions under our debt instruments could adversely affect us by limiting our ability to plan for or react to market conditions or to meet our capital needs and, if we were unable to comply with these restrictions, could result in the event of default under these debt instruments. These restrictions require us to meet certain financial performance tests quarterly and limit or prohibit our ability, subject to certain exceptions to, among other things:
| · | incur or guarantee additional first lien indebtedness up to certain dollar amounts, consolidated net tangible asset ratios or other financial tests; | |
| · | enter into certain types of commodity hedge agreements that can be secured by first lien collateral; | |
| · | enter into sale and leaseback transactions; | |
| · | make certain investments; | |
| · | create or incur liens; | |
| · | consolidate or merge with or transfer all or substantially all of our assets to another entity, or allow substantially all of our subsidiaries to do so; | |
| · | lease, transfer or sell assets and use proceeds of permitted asset leases, transfers or sales; | |
| · | engage in certain business activities; and | |
| · | enter into certain transactions with our affiliates. |
Our debt instruments contain events of default customary for financings of their type, including a cross-default to debt other than non-recourse project financing debt, a cross-acceleration to non-recourse project financing debt and certain change of control events. If we fail to comply with the covenants and are unable to obtain a waiver or amendment, or a default exists and is continuing under such debt, the lenders, holders or trustee, as applicable, could give notice and declare outstanding borrowings and other obligations under such debt immediately due and payable.
Our ability to comply with these covenants may be affected by events beyond our control, and any material deviations from our forecasts could require us to seek waivers or amendments of covenants or alternative sources of financing or to reduce expenditures. We may not be able to obtain such waivers, amendments or alternative financing, or if obtainable, it could be on terms that are not acceptable to us. If we are unable to comply with the terms of our debt instruments, if we fail to generate sufficient cash flows from operations, or if it becomes necessary to obtain such waivers, amendments or alternative financing, it could adversely affect our financial condition, results of operations and cash flows.
34
Our credit status is below investment grade, which may restrict our operations, increase liquidity requirements and restrict financing opportunities.
Rating agencies evaluate several factors to arrive at credit ratings for us and our subsidiaries, including regulatory framework, ability to recover costs and earn returns, diversification, financial strength and liquidity. If one or more rating agencies downgrade us, borrowing costs would increase, the potential pool of investors and funding sources would likely decrease, and the terms of a number of commodity contracts, leases and other agreements may trigger cash or letter of credit collateral demands.
Our corporate and debt credit ratings are below investment grade. The table below shows our corporate and debt credit ratings as of December 31, 2024. There is no assurance that our credit ratings will improve, which may restrict the financing opportunities available to us or increase the cost of any available financing. Our current credit rating has resulted in the requirement that we provide additional collateral in the form of letters of credit or cash for credit support obligations, which may adversely affect our subsidiaries, our financial position and the results of our operations.
| Standard and Poor’s | Moody’s Investors Service |
|||
| First Lien Notes, First Lien Term Notes and Corporate Revolving Facility rating | BB+ | Ba2 | ||
| Senior Unsecured Notes | B+ | B2 | ||
| Corporate Rating | BB- | Ba3 |
We may not have sufficient liquidity to hedge market risks effectively or secure certain of our obligations by letters of credit or cash, which increase our costs. If we cannot provide such security, it may restrict our ability to conduct our business.
We face significant market and liquidity risks due to our use of derivatives and commodity contracts our involvement in purchasing and selling power, capacity, fuel, transmission services and emission allowances. Our hedging activities and commodity procurement necessitate posting cash collateral or issuing letters of credit to support our obligations, which can substantially increase our costs and adversely affect our liquidity.
We hedge commodity price risk through various contracts, including futures exchanges, which necessitate two types of cash collateral: initial margin and variation margin. The exchange requires an initial margin to transact, and these requirements can be substantial during high market volatility. Variation margin addresses daily changes in the value of our derivative instruments based on their fair value. The level of required collateral could rise as our hedging activities increase, commodity prices fluctuate or our credit ratings change. As of December 31, 2024 and 2023, we had $223 million and $673 million, respectively in cash collateral posted related to our commodity hedging activity. Additionally, we have $2.1 billion issued in letters of credit under our Corporate Revolving Facility and other facilities, at both December 31, 2024 and 2023, with $5.4 billion and $4.2 billion, respectively remaining available for borrowing or for letter of credit support. In addition, we have ratably secured our obligations under certain power and natural gas agreements that qualify as eligible commodity hedge agreements with the assets subject to liens under our First Lien Notes, First Lien Term Loans and Corporate Revolving Facility.
We use cash margin deposits, prepayments, surety bonds and letters of credit for commodity procurement and risk management. Many collateral agreements mandate that financial institutions issue letters of credit with a minimum “A” credit rating. Our financial institutions issuing credit facilities meet or exceed this criterion. However, if they fail to maintain this rating, we may need to post collateral from our cash and cash equivalents, negatively impacting our liquidity.
Additionally, we undertake purchase and sale activities through agreements with various counterparties, many of which require us to provide guarantees, offset or netting arrangements, letters of credit, a second lien on assets and/or cash collateral to protect the counterparties against the risk of our default or insolvency. The amount of such credit support typically is based on the difference between the commodity's price in a given contract and the commodity's market price. Significant movements in market prices can result in our being required to provide cash collateral and letters of credit in very large amounts. Without sufficient working capital to post as collateral, we may be unable to manage price volatility effectively or implement our strategy.
If any of our power plants or battery storage facilities experience unplanned outages, we may be required to procure replacement power at spot market prices to fulfill contractual commitments. Without adequate liquidity to meet margin and collateral requirements, we may be exposed to significant losses, miss significant opportunities and be more exposed to the volatility of spot markets.
Further, changes in market regulations can increase the use of credit support and collateral. These requirements increase our cost of doing business. They could adversely affect our overall liquidity, particularly if there is a call for a large amount of additional cash or letter of credit collateral due to an unexpected large movement in the market price of a commodity.
35
Our ability to receive future cash flows generated from the operation of our subsidiaries may be limited.
Almost all of our operations are conducted through our subsidiaries and other affiliates. As a result, we depend almost entirely upon their earnings and cash flows to service our indebtedness, post collateral and finance our ongoing operations. Certain project debt and other agreements restrict our ability to receive dividends and other distributions from our subsidiaries. Additionally, the financing agreements of certain of our subsidiaries and other affiliates generally restrict their ability to pay dividends, make distributions or otherwise transfer funds to us before the payment of their other obligations, including their outstanding debt, operating expenses, lease payments and reserves or during the existence of a default.
Risks Related to Government Regulation
We are subject to complex governmental regulations, including the rules and regulations of FERC, CFTC, DOJ, EPA, numerous state agencies, which could adversely affect our operations.
In the United States, our operations are regulated by FERC concerning wholesale service terms and the sale and transportation of natural gas, as well as by state agencies regarding the physical aspects of power plants and battery storage facilities. Most of our electricity generation is sold at market prices under the market-based rate authority granted by FERC. If we fail to meet specific conditions, FERC has the authority to revoke this and require sales to be made at cost-of-service rates, which could materially impact our business. Additionally, FERC can impose fines or other restrictions under certain conditions.
We are also subject to additional rules and regulations due to foreign investors in our securities, including those promulgated by the Committee on Foreign Investment in the United States (“CFIUS”), the U.S. Department of Energy or the states we operate in. Compliance with these rules and regulations may affect how we do business, may impose added costs on our business, could delay or deter any particular investment or could also affect the price that some investors are willing to pay for our common stock.
The construction and operation of power plants and battery storage facilities necessitate numerous permits, approvals and certificates from foreign, federal, state, tribal and local agencies, along with adherence to extensive environmental regulations and permitting requirements. Failure to comply with these regulations and requirements could force us to install costly pollution control measures, limit activities or even retire generating plants. Non-compliance could result in administrative, civil or criminal liabilities and fines and regulatory agencies could curtail our operations. Moreover, certain environmental laws hold us strictly liable for costs to clean up and restore sites contaminated by hazardous substances, regardless of when the contamination occurred or whether previous owners or third parties caused it. We are generally responsible for environmental liabilities for our facilities, including known and unknown soil or groundwater contamination.
We currently have several government awards for geothermal and carbon capture projects involving cost-share agreements with the U.S. Department of Energy, which could be affected by our failure to comply with certain laws, rules and regulations.
At five facilities, we have completed or commenced front-end engineering design studies for post-combustion carbon capture technology. We have executed the first phase with DOE’s Office of Clean Energy Demonstrations for cost-sharing awards of up to $270 million each for two full-scale demonstration projects. In addition, we have installed a pilot-scale carbon capture facility at our Los Medanos facility in California. The DOE partially funded the engineering design studies for post-combustion capture technology and the pilot-scale carbon capture facility. We have also received funding from the DOE for certain geothermal drilling technologies at The Geysers facilities. As a recipient of federal funds under grants and cooperative agreements, in addition to our ordinary contractual obligations, we must comply with various rules and regulations applicable to entities that perform awards in support of government entities. Many of these additional obligations are contained in the terms of the awards themselves and in federal regulations, which regulate the formation, administration and performance of non-procurement federal financial assistance awards, which are subject to change. We must also comply with various national policy requirements prescribed by statute, executive order, policy guidance issued by the Executive Office of the President or other regulations subject to change.
Additionally, our contractors must also comply with these federal requirements, and any non-compliance by our contractors or their subcontractors could similarly affect our grant status and expose us to additional risks and liabilities. While we will continue to implement strong audits and monitor contractual rights for our contractors, failure by our contractors' requirements to comply with all regulatory requirements fully could materially affect our business and prospects.
Our performance under our U.S. government awards and our compliance with the terms of those awards and applicable laws and regulations are subject to periodic investigation audits, reviews and investigations by various U.S. government agencies. The current environment may lead to increased regulatory scrutiny and sanctions for non-compliance by such agencies.
36
Compliance with these laws and regulations affects how we do business and may impose added costs on our business. Failure to comply may lead to penalties, including whole or partial suspension or termination of our U.S. government awards and/or suspension or debarment from contracting with federal agencies.
Federal and state tax regulations, current incentives for renewable sources of power, existing and proposed state RPS and energy efficiency standards and economic support for renewable sources of power under federal or state legislation could adversely affect our operations.
Renewables have the potential to take market share from us and offer lower wholesale power prices, which could negatively impact our operations. The IRA represents the largest investment in U.S. history to address clean energy and climate change, including approximately $400 billion in federal funding to address clean energy and climate change. Among other things, incentives for low-carbon resources were significantly bolstered by the IRA, including an investment tax credit for battery storage, an extended production tax credit for wind and solar resources, a tax credit for clean hydrogen production, investment tax credits for eligible geothermal projects and increases in the tax credit for eligible carbon sequestration projects. While the IRA supports our battery storage and geothermal and carbon capture development efforts, we also expect the IRA to drive continued renewables growth across many of our regional markets, which could decrease the demand for power generated by our natural gas-fired plants. The IRA is subject to future guidance and implementing regulations to be issued by the U.S. Department of the Treasury, as well as potential legislative changes. Legislative changes and final regulations (or interpretations thereof) could adversely impact us, our ability to use the tax credits for which we are currently eligible or the markets in which we operate.
Several states have established RPS, mandating that a certain percentage of energy come from renewable sources, thus reducing reliance on fossil fuel generation. California is aiming for 100% CO2-free electricity by 2045, and states including Maine, New York, Texas, Illinois and Wisconsin have various RPS in place. Changes to these standards or the introduction of enforceable RPS in other states could increase the supply of wind and solar power, potentially affecting the dispatch of our natural gas-fired power plants, especially in Texas and California.
Energy efficiency or future technology initiatives in some states could also decrease demand for power, negatively affecting our natural gas-fired plants. For example, New Jersey’s new emissions limits on certain generators led to the shutdown of our Mickleton Station and Carlls Corner facilities in June 2024. They could lead to further shutdowns of our fossil fuel generation facilities, including our natural gas-fired power plants, in the future.
We may be subject to additional taxes, adversely impacting our business and financial results.
Tax laws, regulations and administrative practices in the jurisdictions in which we or our subsidiaries are organized or operate may be subject to significant change. For example, the United States enacted the IRA. The IRA imposes, among other things, a 15% corporate alternative minimum tax on the adjusted financial statement income (“AFSI”) of certain taxpayers (“CAMT”) and a 1% excise tax on certain corporate stock repurchases occurring after December 31, 2023. While we are not currently subject to the CAMT, we continue to monitor and evaluate the effect of CAMT provisions on us and future guidance to be issued by the U.S. Department of the Treasury and potential legislative changes.
Our ability to use our net operating loss carryforwards and certain other tax attributes may be limited, potentially resulting in increased tax liabilities to us in the future.
In prior years, we have suffered losses for tax and financial statement purposes that generated significant federal and state net operating loss carryforwards. As of December 31, 2024, our NOL carryforwards consisted primarily of federal NOL carryforwards of approximately $3.0 billion, of which the majority expire between 2028 and 2037, and apportioned NOL carryforwards in 21 states and the District of Columbia totaling roughly $1.5 billion, which expire between 2025 and 2043. Although these net operating loss carryforwards may be used against taxable income in future periods, we will not receive any tax benefits from the losses we incurred unless, and only to the extent that we have taxable income during the period before their expiration. If earnings are insufficient to use carryforwards before expiration, this could result in recognition of future losses and increased tax payments at both state and federal levels. In addition, our ability to use the net operating loss carryforwards could be severely limited if we complete a transaction that results in an ownership change under Section 382 of the Internal Revenue Code of 1986, as amended.
37
Changes in the regulation of the power markets in which we operate could negatively affect us.
We have a significant presence in the major competitive power markets of California, Texas and the Northeast and Mid-Atlantic regions of the United States. While these markets are largely deregulated, they continue to evolve. Existing regulations within the markets in which we operate may be revised or reinterpreted, and new laws or regulations may be issued, including by FERC, ISOs, RTOs and other market regulators. We cannot predict the future development of regulation or legislation nor the ultimate effect such changes in these markets could have on our business; however, we could be negatively affected.
Additionally, state PUCs can set policies that either enhance or limit customer choice. Each state that has adopted retail electric choice creates its own laws, regulations and compliance requirements, which evolve over time and could negatively affect our ability to maintain or expand retail operations and our retail business.
State legislative and regulatory action could adversely affect our competitive position and business.
Certain states have taken or are considering taking anti-competitive actions by subsidizing or otherwise providing economic support to new and/or existing uneconomic power plants in a manner that could have an adverse effect on the deregulated power markets. In addition, certain states in which we have retail operations are taking actions that we believe limit customer choice, as well as other actions that we believe are anti-competitive and could negatively affect our retail operations. We are actively participating in many of the legislative, regulatory and judicial processes challenging these actions at the state and federal levels. If these anti-competitive actions are ultimately upheld and implemented, they could adversely affect capacity and energy prices in the deregulated electricity markets or impede our ability to maintain or expand our retail operations, which in turn could have a material adverse effect on our business prospects and financial results.
Existing and future anticipated GHG/Carbon and other environmental regulations could cause us to incur significant costs and adversely affect our operations generally or in a particular quarter when such costs are incurred.
Environmental laws and regulations have generally become more stringent over time. There is a potential that new or expanded carbon taxes or limits on carbon, CO2, GHG emissions and other emissions could be implemented at the federal, state or regional levels. We continue to monitor and actively participate in initiatives and rulemaking proceedings where we anticipate a material effect on our business.
For example, 11 states in the Northeast are required to comply with a Cap-and-Trade program, RGGI, to regulate CO2 emissions from power plants. California has implemented AB 32, which places a statewide cap on GHG emissions and requires the state to reduce emissions to 40% below 1990 levels by 2030. The California Climate Crisis Act was enacted in 2022 and further establishes the policy of the state to achieve net zero GHG emissions as soon as possible, but no later than 2045 and to reduce statewide anthropogenic GHG emissions to 85% below 1990 levels by 2045. The Massachusetts Department of Environmental Protection issued a final rule in August 2017 that imposes new GHG limits on power plants and other sources.
Environmental regulations could also affect the availability and price of natural gas used in our generation facilities. Permitting new natural gas transportation pipelines has become more difficult in some regions, such as the Northeast, and restrictions on natural gas production have been implemented or proposed in some locations.
If we were deemed to have market power in certain markets as a result of common ownership by certain significant investors, we could lose FERC authorization to sell power at wholesale market-based rates in such markets or be required to engage in mitigation in those markets.
Certain of our significant ownership groups currently, or in the future, may own power generating or battery storage assets or own significant equity interests in entities with such assets in markets where we currently own power plants or battery storage facilities. We could be determined to have market power if these existing significant owners or future owners acquire additional significant ownership or equity interest in other entities with such assets in the same markets where we generate, store and sell power.
If the FERC determines that we have market power, the FERC could, among other things, revoke market-based rate authority for the affected market-based companies or order them to mitigate that market power. If market-based rate authority were revoked for any of our market-based rate companies, those companies could be required to make wholesale sales of power based on cost-of-service rates, which could negatively affect their revenues. If we are required to mitigate market power, we could be required to sell certain power plants or battery storage facilities in regions where we are determined to have market power. A loss of our market-based rate authority or required sales of power plants or battery storage facilities, particularly if it affected several of our assets or was in a significant market, could have a material negative effect on our financial condition, results of operations and cash flows.
38
Risks Related to Insurance
We rely primarily on third-party insurance policies to insure our operations-related risks. If our insurance coverage is unavailable or insufficient for our business's needs or our insurance providers are unable to meet their obligations, we may not be able to mitigate the risks facing our business, which could adversely affect our business, financial condition and results of operations.
We procure third-party insurance policies to cover various operations-related risks, including property damage, automobile liability, employment practices liability, workers’ compensation, business interruptions, errors and omissions, cybersecurity and data breaches, crime, directors’ and officers’ liability and general business liabilities. For certain operations-related risks or future risks related to our new and evolving offerings, we may not be able to acquire insurance. In addition, we may not obtain enough insurance to mitigate such risks adequately, and we may face high premiums, co-insurance, self-insured retentions or deductibles for the coverage we do obtain. We rely on a limited number of insurance providers. If such providers discontinue or increase the cost of coverage, we cannot guarantee securing replacement coverage on reasonable terms or at all. If our insurance carriers change the terms of our policies unfavorably, our insurance costs increase. If the coverage we maintain is not adequate or if we are required to purchase additional insurance, we could incur significant costs. Additionally, if any of our insurance providers become insolvent, they will be unable to pay any claims.
If operations-related claims exceed our aggregate coverage limits, we would bear the excess in addition to amounts incurred with deductibles, self-insured retentions or co-insurance. Insurance providers have raised premiums and deductibles and may do so in the future. As a result, our insurance costs could increase, coverage could be reduced or we may decide to raise our deductibles or self-insured retentions. Our business, financial condition and results of operations could be adversely affected if: (1) costs, premiums, the severity of claims or the number of claims significantly exceeds our historical experience and coverage limits; (2) we experience a claim in excess of our coverage limits; (3) our insurance providers fail to pay on our insurance claims; (4) we experience a claim for which coverage is not provided or (5) the number of claims under our deductibles or self-insured retentions differs from historical averages.
We are also subject to contractual requirements, including financing requirements, to obtain insurance. If we are unable to obtain and maintain such insurance, we would violate these contractual requirements, which could lead to a default under such agreements. Additionally, we are subject to local laws, rules and regulations relating to insurance coverage, which could result in actions against us. Compliance with these rules and any related lawsuits or actions may require us to increase our insurance coverage, amend our insurance policy disclosure, increase our costs and disrupt our business.
Item 1B. UNRESOLVED STAFF COMMENTS
Not applicable.
Item 2. PROPERTIES
Our principal offices are located in Houston, Texas with the principal offices of our retail affiliates located in Houston, Texas and San Diego, California.
We either lease or own the land upon which our power plants and battery storage facilities are built. We believe that our properties are adequate for our current operations. A description of our power plants is included under Item 1. Business — Description of our Operations.
Item 3. LEGAL PROCEEDINGS
For a description of our legal proceedings, see Note 16, Commitments and Contingencies of the Notes to Consolidated Financial Statements.
Item 4. MINE SAFETY DISCLOSURES
Not applicable.
39
PART II
Item 5. MARKET FOR REGISTRANT’S COMMON EQUITY, RELATED STOCKHOLDER MATTERS AND ISSUER PURCHASES OF EQUITY SECURITIES
As of December 31, 2024 and 2023, 952,153 and 952,153 shares of Class A common stock and 48,651 and 47,847 shares of Class B common stock were issued and outstanding, resulting in a total of 1,000,804 and 1,000,000 common shares issued and outstanding, respectively.
40
Item 7. MANAGEMENT’S DISCUSSION AND ANALYSIS OF FINANCIAL CONDITION AND RESULTS OF OPERATIONS
Forward-Looking Information
This Management’s Discussion and Analysis of Financial Condition and Results of Operations should be read in conjunction with our accompanying Consolidated Financial Statements and related Notes to Consolidated Financial Statements. See the cautionary statement regarding forward-looking statements at the beginning of this Report for a description of important factors that could cause actual results to differ from expected results. See also Item 1A. Risk Factors.
Introduction And Overview
Calpine is America’s largest generator of electricity from natural gas and geothermal resources, according to S&P Global Market Intelligence. We produce and sell electricity, capacity and other related energy products to our customers. We serve commercial and industrial end users, utilities, retail customers and state and regional wholesale market operators. We have a significant presence in major competitive wholesale and retail power markets in California, Texas and the Northeast and Mid-Atlantic regions of the United States. We own approximately 28 GW of power facilities, enough to power approximately 27 million homes, consisting of natural gas, geothermal, solar and battery storage assets. Our Company employs approximately 2,500 people.
We operate four reportable segments:
| · | West: Includes our power plants and battery storage facilities located in California in the CAISO region, as well as our power plants in Arizona and Oregon | |
| · | Texas: Includes our power plants located in ERCOT | |
| · | East: Includes our power plants located in PJM, ISO-NE, NYISO, MISO, SERC and the Canadian IESO | |
| · | Retail: Includes our retail operations throughout the country |
Significant Events
The following significant events occurred during 2025, 2024 and 2023, as further described within this Management’s Discussion and Analysis and the Consolidated Financial Statements:
2025
Proposed Merger:
On January 10, 2025, the Company announced that it entered into a Merger Agreement with Constellation. The Merger Agreement provides for a series of Reorganization related transactions on terms set forth in the Merger Agreement. As a result of the Reorganization and Merger, Calpine will become an indirect, wholly owned subsidiary of Constellation. Subject to the terms and conditions of the Merger Agreement, Constellation will acquire Calpine in a cash and stock transaction valued at an equity purchase price of approximately $16.4 billion, composed of 50 million shares of Constellation stock and $4.5 billion in cash plus the assumption of approximately $12.7 billion of Calpine net debt. After accounting for cash that is expected to be generated by Calpine between signing and the expected closing date, as well as the value of tax attributes at Calpine, the net purchase price is $26.6 billion. See Note 19 of the Consolidated Financial Statements for additional details relating to the Merger and Item 1A. Risk Factors for a discussion of the risks related to the Merger.
2024
Acquisitions:
| · | In September 2024, we completed the purchase of a 100% ownership interest in Quail Run Energy Center, a 550 MW combined cycle, natural gas-fired generation facility located in Odessa, Texas. The purchase price was funded by a portion of the proceeds from the CCFC Term Loan refinancing that closed in September 2024. |
Strategic Growth and Operations:
| · | Through our integrated business model, we showed strong earnings through December 2024, with strong operations performance of our facilities and incremental value created through our retail and wholesale hedging and marketing activities. | |
| · | In the second and third quarters of 2024, the Company achieved commercial operations on Phase I and, subsequently, Phases II through IV, respectively, of the Nova Battery Storage Facilities. As a result, 620 MW of the total capacity of the project of 680 MW is currently in operation. Additionally, in September 2024, we, through our wholly-owned subsidiary, completed the sale of certain investment tax credits from the Nova Battery Storage Facilities for a total sales price of approximately $353 million. These proceeds were partially used to repay the outstanding principal on the Nova Bridge Loan of $183 million. |
41
| · | In July 2024, we achieved commercial operations on our Bear Canyon and West Ford Flat Battery Storage Facilities located at The Geysers. | |
| · | In July 2024, we signed Phase I agreements with the DOE on our Baytown Energy Center and Sutter Energy Center CCS Projects. | |
| · | In August 2024, we completed the sale of our investment tax credits related to Johanna Battery Facilities for a total sales price of approximately $23 million. |
Balance Sheet Management:
| · | In 2024, we completed multiple financing agreements to continue to manage our liquidity and capital resources. See the section titled “Item 7. Management’s Discussion and Analysis of Financial Condition and Results of Operations — Liquidity and Capital Resources” | |
| · | On November 1, 2024, the Company's existing $200 million loan executed under its master securities lending agreement with JPMorgan Chase, N.A. expired. This transaction was reflected as a non-cash transaction in our Consolidated Statements of Cash Flows. | |
| · | We paid dividends to our stockholders equal to $1.9 billion in the aggregate for the fiscal year ended December 31, 2024. |
2023
Acquisitions:
| · | In September 2023, we closed on the purchase of the remaining 50% ownership interest in Greenfield Energy Centre, adding contracted energy capacity to our fleet. | |
| · | In December 2023, we entered into a new joint venture agreement for an ownership interest in the Gregory Power Plant, a 385 MW combined cycle power plant located in Corpus Christi, Texas. |
Strategic Growth and Operations:
| · | We achieved commercial operations in the final phase of our Santa Ana Battery Facility. The final phase of the project is a 40 MW four-hour duration battery installation. |
Balance Sheet Management:
| · | In 2023, we executed one financing for an aggregate amount of more than $1 billion. See the section titled “Item 7. Management’s Discussion and Analysis of Financial Condition and Results of Operations — Liquidity and Capital Resources.” | |
| · | We paid dividends to our stockholders equal to $1.7 billion in the aggregate for the fiscal year ended December 31, 2023. |
Market Trends
The power market represents one of the largest industries in the United States and affects nearly every aspect of our economy and lives. The EIA estimated approximately $491 billion in power sales in the United States in 2023. Despite its centrality to the economy, United States power demand has been relatively flat for the past 20 years, growing at a low compounded annual growth rate. However, power demand in the United States is now expected to increase rapidly. This expected increase in power demand can be attributed primarily to three independent factors:
| · | Reindustrialization: The American manufacturing industry has grown significantly, propelled by federal domestic content requirements and the promotion of private investment through the CHIPS and Science Act and the IRA. Federal estimates indicate that since 2021, approximately $480 billion in commitments for industrial and manufacturing facilities have been announced, all of which will require significant power. | |
| · | Electrification: The electrification of transportation, buildings and industry could add to the demand for electricity in the U.S. Electrification of the broader economy, including industrial processes, home heating and others, is also expected to increase power demand. | |
| · | Growth of Data Centers, including for AI: Significant demand from data centers is expected to support the growth of artificial intelligence. |
42
With this expected increase in power demand, we believe that power prices and demand for our products will also increase.
In addition to demand growth, the power industry is undergoing a dramatic shift as the United States increases its focus on lower emissions sources of electricity. Over the past 20 years, the share of electricity generated using coal has fallen from 51% to 16%, while the share generated using gas has increased from 17% to 43% and the share generated by renewables (including hydro, geothermal, wind and solar) has increased from 9% to 21%. These shifts have enabled reductions in power sector carbon dioxide emissions over the same period. The share of electricity from nuclear resources has remained steady at approximately 20%.
Key Operating Metrics
We monitor the following key operating metrics to help us evaluate our business, identify trends affecting our business, formulate business plans and make strategic decisions. We believe the following key metrics provide insight into our generation and battery storage fleet’s ability to provide efficient and reliable power to the market.
MWh Generated — MWh Generated represents the generation and capacity of power plants and battery storage facilities that we consolidate and operate.
Average Availability — Average Availability represents the total hours during the period that our plants were in-service or available for service as a percentage of the total hours in the period.
Average Total Megawatt Hours in Operation — Average Total MWh in Operation indicates the total MWhs of our generation fleet that are operational and available to provide energy to the market.
Average Capacity Factor (excluding peakers) — Average Capacity Factor (excluding peakers) is a measure of total actual power generation and storage as a percent of total potential power generation and storage. It is calculated by dividing (1) total MWh Generated and stored by our power plants and battery storage facilities, excluding peakers, by (2) the product of multiplying (a) the average total MW in operation, excluding peakers, during the period by (b) the total hours in the period.
Steam Adjusted Heat Rate — Heat Rate is a measure of the amount of fuel required to produce a unit of power. Steam Adjusted Heat Rate is the adjusted Heat Rate for our natural gas-fired power plants, excluding peakers. It is calculated by dividing (1) the fuel consumed in Btu reduced by the net equivalent Btu in steam exported to a third party by (2) the KWh generated. We exclude our battery storage facilities from this metric because they do not generate energy. We also exclude our Geysers Assets from this metric because they use steam as a fuel source. Steam Adjusted Heat Rate is a measure of fuel efficiency, so the lower our Steam Adjusted Heat Rate, the lower our cost of generation. The following table presents the operational performance of our retail and generation segments for the years ended December 31, 2024 and 2023.
| Year Ended December 31, | |||||||||||||||||||||||||||||||
| West | Texas | East | Retail | ||||||||||||||||||||||||||||
| 2024 | 2023 | 2024 | 2023 | 2024 | 2023 | 2024 | 2023 | ||||||||||||||||||||||||
| Production Volumes: | |||||||||||||||||||||||||||||||
| (MWh in thousands) | |||||||||||||||||||||||||||||||
| MWh Generated | 31,752 | 32,736 | 51,114 | 51,125 | 37,974 | 34,305 | n/a | n/a | |||||||||||||||||||||||
| Average Total MW in Operations | 8,026 | 7,673 | 9,221 | 9,033 | 9,774 | 9,151 | n/a | n/a | |||||||||||||||||||||||
| Availability, Heat Rate, & Capacity Factor: | |||||||||||||||||||||||||||||||
| Average Availability | 85.3 | % | 86.3 | % | 83.0 | % | 85.3 | % | 85.8 | % | 86.5 | % | n/a | n/a | |||||||||||||||||
| Average Capacity Factor, excluding peakers and Geysers | 47.9 | % | 51.9 | % | 63.1 | % | 64.6 | % | 52.7 | % | 52.4 | % | n/a | n/a | |||||||||||||||||
| Steam Adjusted Heat Factor (Btu/KWh) | 7,374 | 7,373 | 7,290 | 7,265 | 7,610 | 7,654 | n/a | n/a | |||||||||||||||||||||||
| Retail Sales Volumes | |||||||||||||||||||||||||||||||
| (MW's) | |||||||||||||||||||||||||||||||
| Commercial and Industrial Sales | 5,966 | 5,667 | |||||||||||||||||||||||||||||
| Residential Sales | 332 | 338 | |||||||||||||||||||||||||||||
| Total Retail Electric Sales Volume | 6,298 | 6,005 | |||||||||||||||||||||||||||||
43
Market Pricing
| Year Ended December 31, | ||||||||
| 2024 | 2023 | |||||||
| Average Market On-Peak Power Prices ($/MWh)(1): | ||||||||
| CAISO NP 15 | $ | 41.44 | $ | 64.06 | ||||
| ERCOT Houston | $ | 35.06 | $ | 79.39 | ||||
| ERCOT North | $ | 33.63 | $ | 76.99 | ||||
| PJM West Hub | $ | 40.75 | $ | 39.34 | ||||
| ISO-NE | $ | 46.59 | $ | 41.36 | ||||
| Natural Gas Prices ($/MMBtu)(2): | ||||||||
| NYMEX Henry Hub | $ | 3.02 | $ | 2.52 | ||||
| PG&E Citygate | $ | 3.08 | $ | 6.09 | ||||
| Houston Ship Channel | $ | 1.87 | $ | 2.20 | ||||
| TETCOM 3 | $ | 2.07 | $ | 1.91 | ||||
| Algonquin Citygate | $ | 3.02 | $ | 2.97 | ||||
| Carbon Prices ($/Ton)(2): | ||||||||
| AB32 Posted Price | $ | 38.11 | $ | 34.03 | ||||
| Average Annual Market Spark Spread ($/MWh)(3): | ||||||||
| CAISO NP 15 to PG&E Citygate Spark Spread | $ | 5.58 | $ | 8.71 | ||||
| ERCOT Houston to Houston Ship Channel Spark Spread | $ | 21.99 | $ | 63.99 | ||||
| ERCOT North to Houston Ship Channel Spark Spread | $ | 20.55 | $ | 61.59 | ||||
| PJM West Hub to Tetco M 3 Spark Spread | $ | 23.19 | $ | 23.13 | ||||
| ISO-NE to Algonquin Spark Spread | $ | 25.47 | $ | 20.56 | ||||
| (1) | Reflects the average of day-ahead quoted prices for the periods presented and does not necessarily reflect prices we realized. |
| (2) | Reflects the average of daily quoted prices for the periods presented and does not reflect costs incurred by us. |
| (3) | NP-15 average spark spread calculated as a clean spark using an average 7 heat rate for all periods. PJM and ISO-NE spark spreads excludes the effect of carbon costs given different state participation in each program. |
Non-GAAP Financial Measures
This Report contains “non-GAAP financial measures," which are numerical measures of financial performance or cash flows that exclude (or include) amounts that are included in (or excluded from) the most directly comparable measure calculated and presented in accordance with U.S. GAAP. Specifically, we make use of the non-GAAP financial measure “Commodity Margin.” We believe these non-GAAP measures, together with our U.S. GAAP financial measures such as Net income (loss), Gross margin, cash provided by operating activities, are useful to assess our historical and prospective operating performance, to provide meaningful comparisons of operating performance across periods and to better understand trends in our business. These metrics are not necessarily comparable to similarly titled measures reported by other companies.
Commodity Margin is presented as a supplemental measure of operating performance. It is calculated as Commodity revenue less Commodity expense, adjusted to exclude non-recurring and non-cash U.S. GAAP-related items, including, but not limited to, levelization adjustments to revenues required on long-term PPA contracts and non-cash amortization of intangible assets/liabilities associated with contracts recorded at fair value.
44
Results of Operations December 31, 2024 and 2023
Below are our results of operations for the years ended December 31, 2024 and 2023, respectively, (in millions, except for percentages and operating performance metrics). A discussion regarding our results of operations for the years ended December 31, 2023 and 2022, respectively, can be found under Item 7. Management’s Discussion and Analysis of Financial Condition and Results of Operations — Results of Operations in our Annual Report for the fiscal year ended December 31, 2023, posted on our website at www.calpine.com on March 10, 2024. In the comparative tables below, increases in revenue/income or decreases in expense (favorable variances) are shown without brackets, while decreases in revenue/income or increases in expense (unfavorable variances) are shown with brackets.
| 2024 | 2023 | Change | % Change | |||||||||||||
| Operating revenues: | ||||||||||||||||
| Commodity revenue | $ | 12,247 | $ | 11,507 | $ | 740 | 6 | % | ||||||||
| Mark-to-market gain | 118 | 2,131 | (2,013 | ) | (94 | )% | ||||||||||
| Other revenue | 69 | 49 | 20 | 41 | % | |||||||||||
| Operating revenues | 12,434 | 13,687 | (1,253 | ) | (9 | )% | ||||||||||
| Operating expenses: | ||||||||||||||||
| Fuel and purchased energy expense: | ||||||||||||||||
| Commodity expense | 7,149 | 7,311 | 162 | 2 | % | |||||||||||
| Mark-to-market (gain) loss | (19 | ) | 1,248 | 1,267 | # | |||||||||||
| Fuel and purchased energy expense | 7,130 | 8,559 | 1,429 | 17 | % | |||||||||||
| Operating and maintenance expense | 1,458 | 1,353 | (105 | ) | (8 | )% | ||||||||||
| Depreciation and amortization expense | 770 | 735 | (35 | ) | (5 | )% | ||||||||||
| General and other administrative expense | 170 | 168 | (2 | ) | (1 | )% | ||||||||||
| Other operating expenses | 100 | 102 | 2 | 2 | % | |||||||||||
| Total operating expenses | 9,628 | 10,917 | 1,289 | 12 | % | |||||||||||
| Loss on sale of assets, net | 13 | — | (13 | ) | 100 | % | ||||||||||
| Loss (income) from unconsolidated subsidiaries | 4 | (3 | ) | (7 | ) | # | ||||||||||
| Income from operations | 2,789 | 2,773 | 16 | 1 | % | |||||||||||
| Interest expense | 584 | 555 | (29 | ) | (5 | )% | ||||||||||
| Loss on extinguishment of debt | 52 | 16 | (36 | ) | # | |||||||||||
| Other expense, net | 31 | 65 | 34 | 52 | % | |||||||||||
| Income before income taxes | 2,122 | 2,137 | (15 | ) | (1 | )% | ||||||||||
| Income tax expense | 460 | 542 | (82 | ) | (15 | )% | ||||||||||
| Net income | $ | 1,662 | $ | 1,595 | $ | 67 | 4 | % | ||||||||
| 2024 | 2023 | Change | % Change | |||||||||||||
| Operating Performance Metrics: | ||||||||||||||||
| MWh generated (in thousands)(1) | 120,804 | 118,166 | 2,638 | 2 | % | |||||||||||
| Average Availability | 84.7 | % | 86.0 | % | (1.3 | )% | (2 | )% | ||||||||
| Average total MW in operation(1) | 27,021 | 25,857 | 1,164 | 5 | % | |||||||||||
| Average capacity factor, excluding peakers | 55.1 | % | 56.9 | % | (1.8 | )% | (3 | )% | ||||||||
| Steam Adjusted Heat Rate, excluding peakers and Geysers(2) | 7,411 | 7,409 | 2 | — | % | |||||||||||
| # | Variance of 100% or greater |
| (1) | Represents generation and capacity from power plants that we both consolidate and operate. See Item 1. Business — Description of our Operations – Table of Operating Power Plants and Projects Under Construction for our total equity generation and capacities. On September 5, 2023, Calpine, through our wholly owned subsidiary, completed our acquisition of the remaining 50% of the equity interest of Greenfield LP. Subsequent to this date, 100% of the results of Greenfield Energy Center are included within these metrics. |
| (2) | Steam Adjusted Heat Rate excludes our Geysers and battery storage facilities. |
45
We evaluate our Commodity revenue and Commodity expense on a collective basis because the price of power and natural gas tends to move together as the price for power is generally determined by the variable operating cost of the next marginal generator to be dispatched to meet demand. The spread between our Commodity revenue and Commodity expense represents a significant portion of our Commodity Margin. Our financial performance is correlated to how we maximize our Commodity Margin through the management of our portfolio of power plants, as well as our hedging and optimization activities. See additional segment discussion in the section titled Item 7. Management’s Discussion and Analysis of Financial Condition and Results of Operations — Results of Operations: Reportable Segment Results.
Commodity revenue, net of Commodity expense, increased $902 million for the year ended December 31, 2024, compared to the year ended December 31, 2023, primarily due to (favorable variances are shown without brackets while unfavorable variances are shown with brackets):
| (in millions) | ||||
| $ | 935 | Higher margin driven by favorable hedging activity compared to the previous year across all regions, including increased contribution from load auction activity and increased resource adequacy capacity revenues in the West. Additionally, asset additions during the year contributed to higher margin across all regions, including the purchase of Quail Run Energy Center, the remaining 50% of Greenfield Energy Center, and the completion of a portion of our Nova Power Battery Storage Facilities. | ||
| (12 | ) | Lower regulatory capacity revenues in our East segment | ||
| (21 | ) | Period-over-period change in contract amortization, lease levelization relating to tolling contracts and other(1) | ||
| $ | 902 | |||
| (1) | Commodity Margin excludes amortization expense related to contracts recorded at fair value, non-cash GAAP-related adjustments to levelize revenues from tolling agreements and other unusual items or non-recurring items. |
Mark-to-market gain (loss), net from hedging, fuel supply and retail activities had an unfavorable variance of $746 million primarily driven by the mark-to-market gains recognized in 2023 associated with the reversal of unrealized losses recognized in prior periods. This unfavorable variance was partially offset by the increase in value of open positions due to changes in forward market pricing, along with the execution of new transactions.
Other revenue increased $20 million for the year ended December 31, 2024, as compared to the year ended December 31, 2023, primarily due to increased revenues associated with power plant maintenance services provided to third parties and recognition of proceeds received related to a historical sale of legacy wind development projects during the second quarter.
Our normal, recurring operating and maintenance expense, after excluding the effect of scheduled maintenance costs, portfolio changes, performance-based employee compensation and stock-based compensation costs, increased $55 million for the year ended December 31, 2024, as compared to the year ended December 31, 2023. This increase was primarily related to higher salaries and wages related to annual compensation adjustments and backfilling residual open pandemic positions, as well as increased activity related to our ongoing development and construction efforts.
Depreciation and amortization expense increased by $35 million for the year ended December 31, 2024, compared to the year ended December 31, 2023. This change primarily results from newly installed parts associated with normally scheduled maintenance events, depreciation related to the consolidation of Greenfield Energy Center in September 2023, the Quail Run Energy Center acquisition in September 2024, partial completion of the Nova Power Battery Storage Facilities and other ongoing development and construction efforts.
Our normal, recurring general and other administrative expense, after excluding non-recurring compensation costs, increased $14 million for the year ended December 31, 2024, compared to the year ended December 31, 2023. This increase was primarily related to higher consulting and legal costs associated with development and growth project initiatives, as well as higher information technology costs.
(Income) loss from unconsolidated subsidiaries increased $7 million for the year ended December 31, 2024, compared to the year ended December 31, 2023, primarily due to gains recognized through September 2023 at our Greenfield Energy Center where we completed the acquisition of the remaining 50% equity ownership interest in Greenfield LP, resulting in the consolidation of the entity effective September 2023.
Interest expense, excluding the effect of non-cash mark-to-market gains and losses, increased $17 million for the year ended December 31, 2024, compared to the year ended December 31, 2023, partially driven by interest expense recognized on the newly executed Nova Power Battery Storage Facilities construction and bridge loan facilities and increased interest expense resulting from the purchase of the remaining 50% ownership interest in our Greenfield Energy Center. Additionally, the unfavorable period-over-period change in non-cash mark-to-market activity of $11 million associated with previously undesignated interest rate swaps that are economic hedges of our interest rate exposure is also recognized within interest expense.
46
Loss on extinguishment of debt increased $36 million for the year ended December 31, 2024, compared to the year ended December 31, 2023, primarily from the refinancing of our First Lien Term Loans in January 2024 and December 2024, and the repricing of our CCFC Term Loan in June 2024.
Other expense, net, decreased $34 million for the year ended December 31, 2024, compared to the year ended December 31, 2023, primarily due to higher interest income earnings and a one-time legacy legal reserve recognized during the second quarter of 2023.
During the year ended December 31, 2024, we recorded an income tax expense of $460 million compared to an income tax expense of $542 million for the year ended December 31, 2023. This change is primarily due to lower income from operations in 2024 compared to the prior period.
47
Results of Operations: Reportable Segment Results
We use Commodity Margin to assess reportable segment performance. Commodity Margin includes revenues recognized on our wholesale and retail power sales activity, electric capacity sales, REC sales, steam sales, realized settlements associated with our marketing, hedging, optimization and trading activity less costs from our fuel and purchased energy expenses, commodity transmission and transportation expenses, environmental compliance expenses and ancillary retail expense. We believe that Commodity Margin is a useful tool for assessing the performance of our core operations and is a key operational measure of profit reviewed by our chief operating decision-maker.
Commodity Margin by Segment for the years ended December 31, 2024 and 2023.
The following tables show our Commodity Margin by segment and related operating performance metrics by regional segment for our wholesale business for the years ended December 31, 2024 and 2023. A discussion of our Commodity Margin by segment for the year ended December 31, 2023, as compared to the same period in 2022, can be found under Item 7. Management’s Discussion and Analysis of Financial Condition and Results of Operations — Results of Operations: Reportable Segment Results for the Years Ended December 31, 2023 and 2022 in our Annual Report for the fiscal year ended December 31, 2023, issued and posted on our website at www.calpine.com on March 10, 2024. In the comparative tables below, favorable variances are shown without brackets, while unfavorable variances are shown with brackets. The MWh generated by the regional segment below represents generation from power plants that we both consolidate and operate. Generation, Average Availability and Steam Adjusted Heat Rate exclude power plants and units that are inactive.
| Year Ended
December 31, | ||||||||||||||||
| West: | 2024 | 2023 | Change | % Change | ||||||||||||
| Commodity Margin (in millions) | $ | 2,000 | $ | 1,423 | $ | 577 | 41 | % | ||||||||
| Commodity Margin per MWh generated | $ | 62.99 | $ | 43.47 | $ | 19.52 | 45 | % | ||||||||
| MWh generated (in thousands) | 31,752 | 32,736 | (984 | ) | (3 | )% | ||||||||||
| Average Availability | 85.3 | % | 86.3 | % | (1.0 | )% | (1 | )% | ||||||||
| Average total MW in operation | 8,026 | 7,673 | 353 | 5 | % | |||||||||||
| Average capacity factor, excluding peakers | 47.9 | % | 51.9 | % | (4.0 | )% | (8 | )% | ||||||||
| Steam Adjusted Heat Rate | 7,374 | 7,373 | 1 | — | % | |||||||||||
West — The Commodity Margin in our West segment increased by $577 million, or 41%, for the year ended December 31, 2024, compared to 2023. The increase was primarily driven by increased resource adequacy capacity revenues and higher contribution from hedging activity associated with favorable hedged price levels compared to the previous year. Tolling contracts at our Nova Power Battery Storage Facilities also contributed to the increase, particularly in the second half of 2024.
| Year Ended
December 31, | ||||||||||||||||
| Texas: | 2024 | 2023 | Change | % Change | ||||||||||||
| Commodity Margin (in millions) | $ | 1,195 | $ | 1,032 | $ | 163 | 16 | % | ||||||||
| Commodity Margin per MWh generated | $ | 23.38 | $ | 20.21 | $ | 3.17 | 16 | % | ||||||||
| MWh generated (in thousands) | 51,114 | 51,125 | (11 | ) | — | % | ||||||||||
| Average Availability | 83.0 | % | 85.3 | % | (2.3 | )% | (3 | )% | ||||||||
| Average total MW in operation | 9,221 | 9,033 | 188 | 2 | % | |||||||||||
| Average capacity factor, excluding peakers | 63.1 | % | 64.6 | % | (1.5 | )% | (2 | )% | ||||||||
| Steam Adjusted Heat Rate | 7,290 | 7,265 | 25 | — | % | |||||||||||
Texas — The Commodity Margin in our Texas segment increased by $163 million, or 16%, for the year ended December 31, 2024, compared to 2023. This increase was primarily driven by higher contribution from hedging activity associated with favorable hedge price levels during the summer period compared to the previous year. These favorable hedging activities mitigated commodity margin from lower market spark spreads compared to the previous year. Additionally, our purchase of the Quail Run Energy Center during September 2024 contributed to higher results.
48
| Year Ended
December 31, | ||||||||||||||||
| East: | 2024 | 2023 | Change | % Change | ||||||||||||
| Commodity Margin (in millions) | $ | 1,174 | $ | 1,060 | $ | 114 | 11 | % | ||||||||
| Commodity Margin per MWh generated | $ | 30.92 | $ | 30.93 | $ | (0.01 | ) | — | % | |||||||
| MWh generated (in thousands) | 37,974 | 34,305 | 3,669 | 11 | % | |||||||||||
| Average Availability | 85.8 | % | 86.5 | % | (0.7 | )% | (1 | )% | ||||||||
| Average total MW in operation | 9,774 | 9,151 | 623 | 7 | % | |||||||||||
| Average capacity factor, excluding peakers | 52.7 | % | 52.4 | % | 0.3 | % | 1 | % | ||||||||
| Steam Adjusted Heat Rate | 7,610 | 7,654 | (44 | ) | (1 | )% | ||||||||||
East — Commodity Margin in our East segment increased by $114 million, or 11%, for the year ended December 31, 2024, compared to 2023. This increase was primarily driven by both higher market spark spreads, favorable hedged price levels compared to the previous year (including hedges executed through competitive load auctions) and increased generation from our Greenfield Energy Centre following the purchase of the remaining 50% equity interest of Greenfield LP in September 2023. This increase was partially offset by lower regulatory capacity revenues in PJM.
| Year Ended
December 31, | ||||||||||||||||
| Retail: | 2024 | 2023 | Change | % Change | ||||||||||||
| Commodity Margin (in millions) | $ | 716 | $ | 647 | $ | 69 | 11 | % | ||||||||
Retail — Commodity Margin in our retail segment increased by $69 million, or 11%, for the year ended December 31, 2024 compared to 2023, primarily driven by increased contribution from power and natural gas hedging optimization activities when compared to the same period during the prior year.
49
RISK MANAGEMENT AND COMMODITY ACCOUNTING
Our commercial hedging and optimization strategies are designed to maximize our risk-adjusted Commodity Margin by leveraging our knowledge, experience and fundamental views on natural gas and power. During 2023, as power prices increased in major markets, we were able to secure forward gains for 2024 at values higher than actual settled prices across all markets. Further, market volatility also created significant opportunities for both our Retail segment where we were able to capture value through hedging and optimization activities and also in our wholesale generation segments where opportunities for originated load and other transactions contributed additional margin.
Where available, we account for commodity derivatives under hedge accounting rules, recognizing the unrealized gain and/or loss associated with those hedges through other comprehensive income. All other derivative contracts are accounted for on a mark-to-market basis with the change in fair value recognized through mark-to-market earnings. Our hedging approach is also the key driver of changes in unrealized hedge gains and losses. Volumes sold forward against future generation create unrealized gains/losses on forward hedges as prices change. Since prices for power and natural gas and interest rates are volatile, there may be material changes in the fair value of our derivatives over time, driven both by price volatility and the changes in volume of open derivative transactions. Our derivative assets have increased to approximately $1,138 million at December 31, 2024, compared to approximately $1,109 million at December 31, 2023, and our derivative liabilities have increased to approximately $704 million at December 31, 2024, compared to approximately $655 million at December 31, 2023. The fair value of our level 3 derivative assets and liabilities at December 31, 2024 represents approximately 51% and 78% of our total assets and liabilities measured at fair value, respectively. See Note 10, Derivative Instruments of the Consolidated Financial Statements, for further discussion on our derivative assets and liabilities.
The change in fair value of our outstanding commodity and interest rate hedging instruments from January 1, 2024 through December 31. 2024, is summarized in the table below (in millions):
| Commodity Instruments | Interest
Rate Hedging Instruments | Total | ||||||||||
| Fair value of contracts outstanding at January 1, 2024(1) | $ | 125 | $ | 329 | $ | 454 | ||||||
| Items recognized or otherwise settled during the period(2)(3) | 288 | (171 | ) | 117 | ||||||||
| Fair value attributable to new contracts(4) | 95 | — | 95 | |||||||||
| Changes in fair value attributable to price movements | (114 | ) | 89 | (25 | ) | |||||||
| Changes in fair value attributable to nonperformance risk | 28 | — | 28 | |||||||||
| Changes in fair value attributable to margin allocation | (235 | ) | — | (235 | ) | |||||||
| Fair value of contracts outstanding at December 31, 2024(1) | $ | 187 | $ | 247 | $ | 434 | ||||||
| (1) | The Company nets all amounts allowed under the derivative accounting guidance on the balance sheet, which includes derivative transactions under enforceable master netting arrangements and related cash collateral. Net commodity and interest rate derivative assets and liabilities reported in Notes 9 and 10 of the Notes to Consolidated Financial Statements are shown net of collateral paid to and received from counterparties under legally enforceable master netting arrangements. |
| (2) | Commodity contract settlements consist of the realization of previously recognized gains on contracts not designated as hedging instruments of $138 million (represents a portion of Commodity revenue and Commodity expense as reported on our Consolidated Statements of Operations), $435 million related to realized losses from settlements of designated cash flow hedges and $9 million related to current period losses from other changes in derivative assets and liabilities not reflected in OCI or earnings. |
| (3) | Interest rate settlements consist of $128 million related to realized gains from settlements of designated cash flow hedges and $43 million related to roll-off of gains from settlements of undesignated interest rate swaps (represents a portion of interest expense as reported on our Consolidated Statements of Operations). |
| (4) | Fair value attributable to new contracts includes $145 million in losses related to commodity hedges acquired from Quail Run Energy Partners, and an additional $29 million and nil of fair value related to commodity contracts and interest rate hedging instruments, respectively, which are not reflected in OCI or earnings. | |
The net fair value of outstanding derivative commodity instruments, net of allocated collateral, as of December 31, 2024, based on price source and the period during which the instruments will mature, are summarized in the table below (in millions). The categories below are consistent with the fair value hierarchy as level 1 instruments use prices actively quoted, level 2 instruments use prices provided by other external sources and level 3 instruments use prices based on models and other valuation methods.
50
| Maturity dates of unrealized commodity contract net liability at December 31, 2024 | ||||||||||||||||||||
| Source of fair value | Less than 1 year | 1-3 years | 4-5 years | Excess of 5 years | Total | |||||||||||||||
| Prices provided by other external sources | $ | 159 | $ | (2 | ) | $ | (2 | ) | $ | — | $ | 155 | ||||||||
| Prices based on models | (21 | ) | (13 | ) | 6 | 60 | 32 | |||||||||||||
| Total | $ | 138 | $ | (15 | ) | $ | 4 | $ | 60 | $ | 187 | |||||||||
Liquidity and Capital Resources
We maintain a strong focus on our balance sheet, capital allocation and liquidity. We manage our liquidity to provide access to sufficient funding to meet our business needs and financial obligations.
Our business is capital-intensive, and successful implementation of our business strategy is dependent on the continued availability of capital at attractive terms. Continued commodity price volatility places a higher priority on access to liquidity and liquidity management. We believe that we have adequate liquidity that includes a combination of revolving credit facilities, letter of credit facilities, other liquidity and collateral-specific facilities, such as accounts receivable monetization facilities, cash and cash equivalents on hand and cash expected to be generated from future operations. This liquidity allows us to continue to meet our obligations as they become due. Further, we continue to opportunistically increase liquidity sources through the execution of new facilities and/or increasing capacity under existing facilities. We executed the following transactions in line with our balance sheet management strategy:
| · | In January 2024, the Company completed a refinancing of its $950 million First Lien Senior Secured Term Loan, issued April 5, 2019, and the $750 million First Lien Senior Secured Term Loan, issued August 12, 2019 (collectively, the “2031 First Lien Term Loans”), extending the maturity on the total $1.7 billion principal amount from April and August 2026, respectively, to January 2031 and a repricing of its $700 million First Lien Senior Secured Term Loan, issued December 16, 2020, as amended (the “2027 First Lien Term Loan”), to reduce the applicable spread over the SOFR. | |
| · | In January 2024, the Company also extended the term on its $2.5 billion Corporate Revolving Facility from January 2027 to January 2029 for a total notional amount of $2.225 billion, with the remaining $275 million expiring in January 2027. On December 16, 2024, the Company amended the Corporate Revolving Facility commitments with $2.4 billion expiring January 2029 and the remaining $100 million expiring January 2027. | |
| · | In January 2024, the Company extended a $150 million bilateral letter of credit agreement from January 2025 to January 2027. | |
| · | In February 2024, the Company, through its wholly-owned subsidiary, Calpine Energy Services, L.P., renewed an existing $95 million loan executed under its master securities lending agreement with JPMorgan Chase, N.A. extending the term of the loan through November 1, 2024. The Company's existing $200 million loan executed under its master securities lending agreement with JPMorgan Chase, N.A. expired on November 1, 2024. This transaction was reflected as a non-cash transaction in our Consolidated Statements of Cash Flows. | |
| · | In June 2024, the Company, through its wholly-owned subsidiary, Calpine Construction Finance Company, L.P., completed a repricing of its $1.25 billion First Lien Senior Secured Term Loan dated December 15, 2017, as amended on August 2, 2023, issued by Calpine Construction Finance Company, L.P., and due July 31, 2030 (the “CCFC Term Loan”) to reduce the applicable spread over the SOFR and remove the quarterly principal repayment requirement prior to the maturity of the debt. | |
| · | In July 2024, the Company extended and upsized its $1.5 billion Commodity-linked Revolving Credit Facility between Calpine Corporation as borrower, the lenders parties thereto, MUFG Bank, Ltd., as administrative agent, and MUFG Union Bank, N.A., as collateral agent, dated July 21, 2022, as amended (the “Commodity-linked Revolver”) for a term through July 2025 and a borrowing base limit of $1.79 billion. | |
| · | In September 2024, the Company through its wholly-owned subsidiary, completed the sale of $380 million of investment tax credits related to our Nova Power Battery Storage Facilities to multiple third parties. The proceeds received in September of $353 million are associated with Phases I through IV of the project. Under the sales agreement, proceeds associated with sale of investment tax credits from the final phase of the project will be funded upon final phase achieving commercial operations in 2025. These proceeds were partially used to repay the outstanding principal balance of $183 million on the Bridge Facility under our Nova Credit Agreement in September 2024. |
51
| · | In September 2024, the Company, through its wholly-owned subsidiary, acquired 100% of the equity interest of Quail Run Energy Partners, LP, which owns Quail Run Energy Center, a 550 MW combined cycle, natural gas-fired generation facility located in Odessa, Texas. The acquisition was funded through cash on hand and proceeds from the September 2024 refinancing of the CCFC Term Loan, which was upsized by $631 million to a total notional principal amount of $1.9 billion due July 2030. Proceeds from the upsizing were used to fund the Company's acquisition of Quail Run Energy Center in September 2024 for an aggregate purchase price of $334 million, as well as to fund the redemption of $280 million of its 2026 First Lien Notes, which closed in October 2024. | |
| · | On October 31, 2024, Calpine Corporation, through its wholly-owned subsidiary Nova Power Holdco, converted the existing Nova Power Battery Storage Facilities construction loan to a first lien term loan with a total notional balance outstanding of $640 million and a term of seven years from the conversion date. | |
| · | In December 2024, the Company completed a refinancing of its 2027 First Lien Term Loan to increase the total principal balance by $160 million, to redeem the remaining $140 million 2026 First Lien Notes and pay origination, third party fees and interest payments totaling $20 million. The maturity date was extended to February 2032 and the spread was also adjusted from 200 bps to 175 bps. The redemption of the remaining $140 million 2026 First Lien Notes occurred in January 2025. | |
| · | In December 2024, the Company completed a repricing and consolidation of the 2031 First Lien Term Loans into a single term loan, reducing the rate. No change was made to any other terms, including the maturity date of January 31, 2031. | |
| · | During 2024, the Company increased its economic ownership interest in Gregory Power Holdings, LLC, an entity that owns a 385 MW combined cycle generation facility in Texas to 28.5%. We have entered into an LLC agreement with a third party, who currently owns the remaining 71.5% economic interest in the entity, and the Company has agreed to contribute up to a 45% economic interest in Gregory Power Holdings, LLC over time. | |
| · | During 2024, the Company commenced construction on Pin Oak Creek Energy Center, LLC, a new 425 MW peaking facility that will be adjacent to our Freestone Energy Center and is currently under construction. | |
| · | During 2024, the Company commenced construction on the Pastoria Solar Project a solar photovoltaic power-generating facility with up to 105 MW of capacity. | |
See further discussion of our available liquidity provided below and of the above facilities within Note 8, Debt of the Notes to Consolidated Financial Statements.
Liquidity Position
The following table provides a summary of our liquidity position (in millions):
| December 31, | ||||||||
| 2024 | 2023 | |||||||
| Cash and cash equivalents, corporate(1) | $ | 650 | $ | 141 | ||||
| Cash and cash equivalents, non-corporate(2) | 56 | 22 | ||||||
| Total cash and cash equivalents | 706 | 163 | ||||||
| Restricted cash(2) | 279 | 185 | ||||||
| Corporate Revolving Facility availability(3) | 2,227 | 2,024 | ||||||
| CDHI Credit Agreement availability(4) | 370 | 379 | ||||||
| Commodity-linked revolving credit facility availability(5) | 1,786 | 1,400 | ||||||
| Other facilities availability(6) | 51 | 52 | ||||||
| Total liquidity position(7) | $ | 5,419 | $ | 4,203 | ||||
| (1) | Our ability to use corporate cash and cash equivalents is unrestricted. |
| (2) | See the section titled “Restrictions on the Use of Non-Corporate Cash” below for a description of the restrictions on our use of non-corporate cash and cash equivalents and restricted cash. |
| (3) | Our ability to use our $2.5 billion Corporate Revolving Facility is unrestricted. On January 31, 2024, we extended the term on $2.225 billion of our Corporate Revolving Facility from January 2027 to January 2029 with the remaining $275 million expiring in January 2027. On December 16, 2024, the Company amended the Corporate Revolving Facility commitments with $2.4 billion expiring January 2029 and the remaining $100 million expiring January 2027. As of December 31, 2024, the approximately $2.5 billion in total capacity was comprised of $273 million in letters of credit outstanding, nil in borrowings outstanding, and roughly $2.227 billion in remaining available capacity. As of December 31, 2023, the approximately $2.5 billion in total capacity was comprised of $476 million in letters of credit outstanding, no borrowings outstanding, and $2.024 billion in remaining available capacity. |
52
| (4) | On March 29, 2023, we amended our CDHI Credit Agreement, upsizing the available capacity from $700 million to approximately $1.2 billion. The letter of credit facility has a limit of up to $400 million for construction loans that meet specified criteria. At December 31, 2024, the CDHI Credit Agreement is composed of $640 million in letters of credit outstanding, $148 million in borrowings outstanding and $370 million in remaining available capacity. |
| (5) | The Commodity-linked Revolver can be used to meet collateral posting requirements for eligible commodity hedge agreements, as defined in the agreement, and contains an aggregate borrowing base limit of $1.79 billion and $1.50 billion as of December 31, 2024 and 2023, respectively. On July 18, 2024, the agreement was extended through July 2025 and increased to a total borrowing base limit of $1.79 billion. |
| (6) | We have four secured bilateral letter of credit agreements, for up to $525 million and $525 million as of December 31, 2024 and 2023, respectively, of capacity with varying tenors, one of which was extended from 2025 to 2027 in January 2024. We also have several unsecured letter of credit facilities totaling approximately $325 million and $292 million at December 31, 2024 and 2023, respectively. The above amounts exclude available capacity under the Corporate Revolving Facility, the capacity of Calpine Development Holdings, LLC (“CDHI”) under the CDHI Credit Agreement, and under our project financing credit facilities at GPC, Greenfield L.P. and Nova Power, LLC. |
| (7) | Includes $327 million and $243 million of margin deposits posted with us by our counterparties as of December 31, 2024 and 2023, respectively. See Note 6, Property, Plant and Equipment, Net, and Note 11, Use of Collateral of the Consolidated Financial Statements, for further information related to our collateral. |
Our principal sources for future liquidity are cash on hand and cash flows generated from our operations and our financing arrangements. We believe that cash on hand and expected future cash flows from operations will be sufficient to meet our service, our indebtedness, post collateral and finance our ongoing operations, both in the near and long term. See the section titled “Item 7. Management’s Discussion and Analysis of Financial Condition and Results of Operations — Liquidity and Capital Resources — Cash Flow Activities” below for a further discussion of our change in cash, cash equivalents, and restricted cash.
Our principal uses of liquidity and capital resources, outside of those required for our operations, include but are not limited to collateral requirements to support our commercial hedging and optimization activities, debt service obligations, including principal and interest payments, capital expenditures for construction, project development and other growth initiatives, funding distributions to our shareholders and opportunistically repaying debt to manage our balance sheet. See the sections titled “Item 7. Management’s Discussion and Analysis of Financial Condition and Results of Operations — Capital Resources — Major Maintenance and Capital Spending,” “Dividends,” and “Commitments” below for further discussion.
Restrictions on the Use of Non-Corporate Cash
Certain of our debt agreements, lease agreements, or other agreements require us to establish and maintain segregated cash accounts, the use of which is restricted, making these cash funds unavailable for general use. These amounts are held by depository banks in order to comply with the contractual provisions requiring reserves for payments such as debt service, rent and major maintenance or with applicable regulatory requirements. Funds that can be used to satisfy obligations due during the next 12 months are classified as current restricted cash, with the remainder classified as non-current restricted cash. Restricted cash is generally invested in accounts earning market rates; therefore, the carrying value approximates fair value. Such cash is excluded from cash and cash equivalents on our Consolidated Balance Sheet.
The table below represents the components of our restricted cash (in millions):
| December 31, 2024 | December 31, 2023 | |||||||||||||||||||||||
| Current | Non- Current | Total | Current | Non- Current | Total | |||||||||||||||||||
| Construction/major maintenance | $ | 140 | $ | — | $ | 140 | $ | 56 | $ | — | $ | 56 | ||||||||||||
| Security/project/insurance | 133 | 133 | 121 | — | 121 | |||||||||||||||||||
| Other | 5 | 1 | 6 | 7 | 1 | 8 | ||||||||||||||||||
| Total | $ | 278 | $ | 1 | $ | 279 | $ | 184 | $ | 1 | $ | 185 | ||||||||||||
Liquidity Sensitivity
Significant changes in commodity prices and Market Heat Rates can affect our liquidity. These changes can affect margin deposits, cash prepayments and letters of credit as credit support with and received from our counterparties associated with our commodity procurement and risk management activities. We believe we have sufficient liquidity resources to mitigate normal collateral exposure from changes in commodity prices. These sensitivities represent an estimate as of a point in time and will change as new contracts or hedging activities are executed.
53
In order to manage the effect of commodity price volatility on our future results of operations, we have economically hedged a portion of our expected power generation and natural gas fuel supply portfolio requirements as well as retail load supply obligations, mostly through power and natural gas forward physical and financial transactions, including retail power sales. However, we currently remain susceptible to significant price movements for 2025 and beyond.
In addition to commodity market prices, our results of operations are highly dependent on other factors such as:
| · | the level of Market Heat Rate; | |
| · | our continued ability to successfully hedge our Commodity Margin (for a discussion of our non-GAAP financial measures, including Commodity Margin, and a reconciliation to the most comparable GAAP measure, see the section titled “Non-GAAP Financial Measures”; | |
| · | changes in U.S. macroeconomic conditions; | |
| · | maintaining acceptable availability levels for our fleet; | |
| · | the effect of current and pending environmental regulations in the markets in which we participate; | |
| · | improving the efficiency and profitability of our operations; | |
| · | increasing future contractual cash flows; and | |
| · | our significant counterparties performing under their contracts with us. |
It is difficult to predict future developments and the amount of credit support that we may need to provide under such conditions or if we experience an economic recession or energy commodity prices increase significantly. To manage such liquidity requirements, we maintain additional liquidity availability in the form of our Corporate Revolving Facility, our CDHI Credit Agreement and our Commodity-linked Revolver (noted in the table above), letters of credit, and the ability to grant certain first-priority liens for collateral support.
Capital Resources
Letter of Credit Facilities
The table below represents letters of credit issued under our line of credit facilities as of December 31, 2024 and 2023 (in millions):
| Year Ended December 31, | ||||||||
| 2024 | 2023 | |||||||
| Corporate Revolving Facility | $ | 273 | $ | 476 | ||||
| CDHI Credit Agreement | 640 | 590 | ||||||
| Project financing facilities | 290 | 246 | ||||||
| Other corporate facilities | 849 | 739 | ||||||
| Total | $ | 2,052 | $ | 2,051 | ||||
For further discussion of our line of credit facilities, see Note 8, Debt, Note 11, Use of Collateral of the Consolidated Financial Statements.
Credit Compliance
We complied with our covenants under our Corporate Revolving Facility, our CDHI Credit Agreement, our Commodity-linked Revolver and our letter of credit facilities as of December 31, 2024 and 2023.
NOLs and Valuation Allowance
We have significant NOLs that may provide future offset to taxable income during the applicable carryover periods. As of December 31, 2024, our consolidated gross federal NOLs totaled approximately $3.0 billion, and our gross post-apportioned state NOLs totaled approximately $1.5 billion, resulting in net tax-affected federal and post-apportioned state NOLs of $0.7 billion. Our valuation allowance is partially due to the uncertainty in our ability to use state NOLs prior to expiration, with the remaining valuation allowance primarily related to the 163(j) interest expense limitation where it is not more likely than not, we will be able to utilize the 163(j) carryforwards in future periods. See Note 12, Income Taxes of the Consolidated Financial Statements, for further discussion of our NOLs.
54
Cash Flow Activities
The following table summarizes our cash flow activities for the years ended December 31, 2024 and 2023, respectively (in millions):
| Year Ended December 31, |
||||||||
| 2024 | 2023 | |||||||
| Beginning cash, cash equivalents and restricted cash | $ | 348 | $ | 623 | ||||
| Net cash provided by (used in): | ||||||||
| Operating activities | 3,571 | 2,526 | ||||||
| Investing activities | (1,488 | ) | (940 | ) | ||||
| Financing activities | (1,446 | ) | (1,861 | ) | ||||
| Net increase (decrease) in cash, cash equivalents and restricted cash | 637 | (275 | ) | |||||
| Ending cash, cash equivalents and restricted cash | $ | 985 | $ | 348 | ||||
Net Cash Provided By Operating Activities
Cash provided by operating activities was $3,571 million for the year ended December 31, 2024, compared to $2,526 million for the year ended December 31, 2023. This increase was primarily due to cash proceeds from the sale of ITC for $377 million, an increase in Commodity Margin and a decrease in net working capital employed during 2024 as compared to 2023, including changes associated with collateral margin posting requirements on commodity hedges.
Net Cash Used In Investing Activities
Cash used in investing activity was $1,488 million for the year ended December 31, 2024, compared to $940 million for the year ended December 31, 2023. This increase was primarily due to the acquisition of the Quail Run Energy Center in September 2024 for a cash purchase price of $334 million. Additionally, the period-over-period increase relates to increased investment in development and growth projects, including Nova, West Ford Flat and Bear Canyon Battery Storage Facilities, which commenced operations in 2024.
Net Cash Used In Financing Activities
Cash used in financing activities was $1,446 million for the year ended December 31, 2024, compared to cash used by financing activities of $1,861 million for the year ended December 31, 2023 The cash used in financing activities during the year ending December 31, 2024, was primarily related to funding of dividend distributions to shareholders, the paydown of revolving facility draws made in the prior year and the payment of normal debt amortization balances. Cash used in financing activities was partially offset by upsizing CCFC Term Loan facility, First Lien Term Loans and borrowings made under the Nova Credit Agreement used to fund the ongoing construction of the Battery Storage Facilities.
2023 — 2022
A discussion of cash flow activities for the year ended December 31, 2023, as compared to the same period in 2022 can be found under Item 7 of Part II “Management’s Discussion and Analysis — Liquidity and Capital Resources — Cash Flow Activities — 2023–2022” in the Annual Report for the fiscal year ended December 31, 2023, posted on our website at www.calpine.com on March 10, 2024.
Credit Considerations
Our credit rating has, among other things, generally required us to post significant collateral with our hedging counterparties. Our collateral is generally in the form of cash deposits, letters of credit, or first liens on our assets. See also Note 11, Use of Collateral of the Consolidated Financial Statements, for our use of collateral. Our credit rating reduces the number of hedging counterparties willing to extend credit to us and reduces our ability to negotiate more favorable terms with them. However, we believe that we will continue to be able to work with our hedging counterparties to execute beneficial hedging transactions and provide adequate collateral. As of December 31, 2024 and 2023, our First Lien Notes, First Lien Term Loans, Corporate Revolving Facility, Senior Unsecured Notes and our corporate rating had the following ratings and commentary from Standard and Poor’s and Moody’s Investors Service:
| December 31, 2024 | December 31, 2023 | ||||||||||||
| Standard | Moody’s | Standard | Moody’s | ||||||||||
| and | Investors | and | Investors | ||||||||||
| Poor’s | Service | Poor’s | Service | ||||||||||
| First Lien Notes, First Lien Term Notes and Corporate Revolving Facility ratings | BB+ | Ba2 | BB+ | Ba2 | |||||||||
| Senior Unsecured Notes | B+ | B2 | B+ | B2 | |||||||||
| Corporate rating | BB- | Ba3 | BB- | Ba3 | |||||||||
| Commentary | Stable | Stable | Stable | Stable | |||||||||
55
Major Maintenance and Capital Spending
Our major maintenance and capital spending remains an important part of our business. Our expected expenditures for 2025 are as follows (in millions):
| 2025 | ||||
| Major maintenance expense | $ | 240 | ||
| Capital maintenance expenditures | 554 | |||
| Growth related capital expenditures(1) | 474 | |||
| Total major maintenance expense and capital spending | $ | 1,268 | ||
| (1) | Growth-related capital expenditures are primarily comprised of costs associated with the construction and development of our projects. These expenditures will be primarily sourced from debt financings or monetization of investment tax credits. |
Dividends
Our Board of Directors approved total cash dividends of approximately $1.9 billion, $1.7 billion and $0.6 billion for the years ended December 31, 2024, 2023 and 2022, respectively.
The declaration, amount and payment of any future dividends will be at the sole discretion of our Board of Directors. It will depend on, among other things, general and economic conditions, our results of operations and financial condition, our available cash and current and anticipated cash needs, capital requirements, contractual, legal, tax and regulatory restrictions and implications on the payment of dividends by us to our stockholders and such other factors as our Board of Directors may deem relevant. Our current credit agreements do not impose limitations on our ability to pay dividends to our stockholders. Still, there can be no guarantee that financing arrangements we enter in the future will not restrict our ability to pay cash dividends to our stockholders.
Commitments
Contractual Obligations — Our contractual obligations as of December 31, 2024, are as follows (in millions):
| Less than 1 | More than 5 | |||||||||||||||||||
| Total | Year | 1-3 Years | 3-5 Years | Years | ||||||||||||||||
| Purchase obligations: | ||||||||||||||||||||
| Commodity purchase obligations(1) | $ | 1,449 | $ | 447 | $ | 508 | $ | 233 | $ | 261 | ||||||||||
| LTSA(2) | 434 | 47 | 68 | 58 | 261 | |||||||||||||||
| Water agreements(3) | 261 | 18 | 36 | 33 | 174 | |||||||||||||||
| Other purchase obligations(4) | 142 | 21 | 89 | 31 | 1 | |||||||||||||||
| Total purchase obligations | 2,286 | 533 | 701 | 355 | 697 | |||||||||||||||
| Debt | 12,162 | 354 | 466 | 4,570 | 6,772 | |||||||||||||||
| Other contractual obligations: | ||||||||||||||||||||
| Interest payments on debt(5) | 2,406 | 575 | 974 | 552 | 305 | |||||||||||||||
| Liability for uncertain tax positions(6) | 21 | — | — | — | 21 | |||||||||||||||
| Interest rate hedging instruments(5) | 9 | 2 | 4 | 3 | — | |||||||||||||||
| Total other contractual obligations | 2,436 | 577 | 978 | 555 | 326 | |||||||||||||||
| Total contractual obligations | $ | 16,884 | $ | 1,464 | $ | 2,145 | $ | 5,480 | $ | 7,795 | ||||||||||
56
| (1) | The amounts presented here include contractually obligated amounts for the purchase, transportation or storage of commodities accounted for as executory contracts and, therefore, not recognized on our Consolidated Balance Sheets. |
| (2) | The amounts presented here are based on estimated payments in accordance with the stated payment terms in the contracts at the time of execution. |
| (3) | The amounts presented here are based on contractually obligated amounts over the life of the contracts, including assumed extensions. |
| (4) | The amounts presented here include costs to complete construction projects, parts supply agreements, maintenance agreements, information technology agreements and other purchase obligations. |
| (5) | Amounts are projected based on market interest rates as of December 31, 2024. |
| (6) | The amounts related to the liability for uncertain tax positions are included within the category “More than five years” due to uncertainty relating to the timing of resolution. |
See Note 4, Leases of the Consolidated Financial Statements for maturities of our operating and finance lease liabilities. See Note 8, Debt of the Consolidated Financial Statements for details of our long-term debt maturities. See Note 16, Commitments and Contingencies of the Consolidated Financial Statements, for further information on our contractual commitments.
Guarantee Commitments
As part of our normal business operations, we enter into various agreements providing or otherwise arranging financial or performance assurance to third parties on behalf of our subsidiaries in the ordinary course of such subsidiaries’ respective business. Such arrangements include guarantees, standby letters of credit and surety bonds for power and natural gas purchase and sale arrangements, retail contracts, contracts associated with the development, construction, operation and maintenance of our fleet of power plants and battery storage facilities, as well as our Accounts Receivable Sales Program. See Note 16, Commitments and Contingencies of the Consolidated Financial Statements, for further information on our guarantee commitments.
Off-Balance Sheet Arrangements
Arrangements with Unconsolidated Investments
As of December 31, 2024 and 2023, our unconsolidated investments consisted of our investment in the Gregory Power Plant Project located in south Texas, which has no outstanding debt and our investment in Calpine Receivables, LLC (“Calpine Receivables”). Any debt balance held by our unconsolidated investments would not be reflected on our Consolidated Balance Sheet. For additional details on our unconsolidated investments, see Note 7, Variable Interest Entities and Unconsolidated Investments of the Consolidated Financial Statements.
Special Purpose Subsidiaries
Pursuant to applicable transaction agreements, we have established certain of our entities separate from Calpine Corporation and our other subsidiaries. In accordance with applicable accounting standards, we consolidate these entities except for Calpine Receivables. (See Note 7, Variable Interest Entities and Unconsolidated Investments, Note 16, Commitments and Contingencies, Note 17, Related Party Transactions of the Consolidated Financial Statements, for further information related to Calpine Receivables). As of the date of filing of this Report, these entities included: GPC, Calistoga Holdings, LLC, Wildhorse Geothermal LLC, Geysers Intermediate Holdings LLC, Geysers Company, LLC, Bethpage Energy Center 3, LLC, Nova Power, LLC and Calpine Receivables.
Critical Accounting Policies and Estimates
The preparation of financial statements in conformity with U.S. GAAP requires that management apply accounting policies and make estimates and assumptions that affect the results of operations, and the amounts of assets and liabilities reported in the Consolidated Financial Statements. Management believes that the accounting policies described below require significant judgment in their application or incorporate estimates and assumptions that are inherently uncertain and that may change in subsequent periods. Additional information on the application of these accounting policies can be found in the Notes to Consolidated Financial Statements.
Fair Value Measurements
We use fair value to measure certain of our assets, liabilities and expenses in our financial statements. Fair value is the amount that would be received to sell an asset or paid to transfer a liability in an orderly transaction between market participants at the measurement date (i.e., the exit price). Generally, the determination of fair value requires the use of significant judgment and different approaches and models under varying circumstances. Under a market-based approach, we consider prices of similar assets, consult with brokers and experts, or employ other valuation techniques. Under an income-based approach, we generally estimate future cash flows and then discount them at a risk-adjusted rate.
57
Accordingly, the determination of fair value represents a critical accounting policy. Our most significant fair value measurements represent the valuation of our derivative assets and liabilities, which are measured on a recurring basis (each reporting period), and measurements of impairments and acquired assets and liabilities on a nonrecurring basis. We primarily apply the market approach and income approach for recurring fair value measurements (primarily our derivative assets and liabilities) using the best available information. We primarily use the income approach for nonrecurring fair value measurements such as impairments of our assets and the fair value of equity-based awards to our employees to calculate stock-based compensation expense, as market prices for similar assets and peer companies may not be readily available and may not incorporate the expected future returns from our assets. The income approach involves the estimate of the net present value of future cash flows for the asset or obligation at a reasonable discount rate to evaluate the overall fair value of the item. The determination of future cash flows is based on reasonable estimates of market-based cash flows. Further, upon issuance of new stock-based awards it is expected that we will transition to the market-based stock-based awards valuation approach using readily available market information to determine fair market value. We use valuation techniques that seek to maximize the use of observable inputs and minimize the use of unobservable inputs. We classify fair value balances based on the observability of those inputs. U.S. GAAP establishes a fair value hierarchy that classifies fair value measurements from level 1 through level 3 based on the inputs used to measure fair value:
Level 1 — Quoted prices (unadjusted) are available in active markets for identical assets or liabilities as of the reporting date. Active markets are those in which transactions for the asset or liability occur in sufficient frequency and volume to provide pricing information on an ongoing basis.
Level 2 — Pricing inputs include quoted prices for similar assets and liabilities in active markets and inputs other than quoted prices that are observable for the asset or liability, either directly or indirectly, for substantially the full term of the financial instrument.
Level 3 — Pricing inputs include significant inputs that are generally less observable or from unobservable sources. These inputs may be used with internally developed methodologies that result in management’s best estimate of fair value.
Derivative Instruments and Valuation Techniques
The primary factors affecting the fair value of our derivative instruments at any point in time are the volume of open derivative positions (MMBtu, MWh and $ notional amounts); changing commodity market prices, primarily for power and natural gas; ours, our counterparties’ and customers’ credit ratings for energy commodity derivatives; and prevailing interest rates for our interest rate hedging instruments. Prices for power and natural gas and interest rates are volatile, which can result in material changes in the fair value measurements reported in our financial statements in the future. Derivative contracts can be exchange-traded or OTC. For OTC derivatives that trade in liquid markets, model inputs can generally be verified, and model selection does not involve significant management judgment. Certain OTC derivatives trade in less liquid markets with limited pricing information, and the determination of fair value for these derivatives is inherently more difficult.
For our level 2 and level 3 derivative instruments, we may use models to measure fair value. Where models are used, the selection of a particular model to value an asset or liability depends upon the contractual terms and specific risks, as well as the availability of pricing information in the market. We generally use similar models to value similar instruments. Valuation models require a variety of inputs, including contractual terms, market prices, yield curves, credit curves and measures of volatility. These models are primarily industry-standard models, including the Black-Scholes option-pricing model. Substantially, all of these assumptions are observable in the marketplace throughout the full term of the instrument, can be derived from observable data, or are supported by observable levels at which transactions are executed in the marketplace. In cases where there is no corroborating market information available to support significant model inputs, we may incorporate historical correlation information and extrapolate available broker and other information to future periods.
Our derivative instruments that are traded on the NYMEX or ICE primarily consist of natural gas swaps, futures and options and are classified as level 1 fair value measurements.
Our derivative instruments, which primarily consist of interest rate hedging instruments and OTC power and natural gas forwards for which market-based pricing inputs in the principal or most advantageous market are representative of executable prices for market participants, are classified as level 2 fair value measurements. These inputs are observable at commonly quoted intervals for substantially the full term of the instruments.
58
Our OTC power and natural gas forwards and options where pricing inputs are unobservable, as well as other complex and structured transactions primarily for the sale of power to both wholesale counterparties and retail customers, are classified as level 3 fair value measurements. Complex or structured transactions are tailored to our customers’ needs. They can introduce the need for internally developed model inputs that might not be observable in, or corroborated by, the market. When such inputs have a significant effect on the measurement of fair value, the instrument is categorized in level 3. At each balance sheet date, we perform an analysis of all instruments subject to fair value measurement and include in level 3 all of those whose fair value is based on significant unobservable inputs.
The determination of fair value of our derivatives also includes consideration of our credit standing, the credit standing of our counterparties and customers, and the effect of credit enhancements, if any. We assess non-performance risk by adjusting the fair value of our derivatives based on our credit standing or the credit standing of our counterparties and customers involved and the effect of credit enhancements, if any. Such valuation adjustments represent the amount of probable loss due to default either by us or a third party. Our credit valuation methodology is based on a quantitative approach which allocates a credit adjustment to the fair value of derivative transactions based on the net exposure of each counterparty or customer. We develop our credit reserve based on our expectation of potential credit exposure. Our calculation of the credit reserve on net asset positions is based on available market information, including credit default swap rates, credit ratings and historical default information. We also incorporate non-performance risk in net liability positions based on an assessment of our potential risk of default.
See Note 9, Assets and Liabilities with Recurring Fair Value Measurements, and Note 10, Derivative Instruments of the Consolidated Financial Statements, for further discussion of our derivative instruments.
Impairment Evaluation of Long-Lived Assets (Including Goodwill, Intangibles and Investments)
We evaluate our long-lived assets, such as property, plant and equipment, equity method investments, turbine equipment and specifically identified intangibles, on an annual basis or when events or changes in circumstances indicate that the carrying value of such assets may not be recoverable. Examples of such events or changes in circumstances are:
| · | a significant decrease in the market price of a long-lived asset; | |
| · | a significant adverse change in the manner an asset is being used or its physical condition; | |
| · | an adverse action by a regulator or legislature or an adverse change in the business climate; | |
| · | an accumulation of costs significantly in excess of the amount originally expected for the construction or acquisition of an asset; | |
| · | a current-period loss combined with a history of losses or the projection of future losses; or | |
| · | a change in our intent about an asset from an intent to hold to a greater than 50% likelihood that an asset will be sold or disposed of before the end of its previously estimated useful life. |
When we determine that an impairment exists, we determine fair value using valuation techniques such as the present value of expected future cash flows. In order to estimate future cash flows, we consider historical cash flows, existing and future contracts and PPAs, changes in the market environment and other factors that may affect future cash flows. To the extent applicable, the assumptions we use are consistent with forecasts that we are otherwise required to make (for example, in preparing our other earnings forecasts). The use of this method involves inherent uncertainty. We use our best estimates in making these evaluations and consider various factors, including forward price curves for power and fuel costs and forecasted operating costs. However, actual future market prices and project costs could vary from the assumptions used in our estimates, and the effect of such variations could be material.
We also discount the estimated future cash flows associated with the asset using a single interest rate representative of the risk involved with such an investment, including contract terms, tenor and counterparty credit risk. We may also consider prices of similar assets, consult with brokers, or employ other valuation techniques. We use our best estimates in making these evaluations; however, actual future market prices and project costs could vary from the assumptions used in our estimates, and the effect of such variations could be material.
We assess goodwill and all intangible assets not subject to amortization for impairments at least annually or more frequently whenever an event or change in circumstances occurs that would more likely than not reduce the fair value of a reporting unit below its carrying amount. This assessment includes an annual goodwill impairment assessment in the third quarter of each year, or more frequently, if indicators of potential impairment exist. We test goodwill for impairment at the reporting unit level, which is identified as one level below the Company’s operating segments for which discrete financial information is available. Management regularly reviews the operating results to determine whether it is more likely than not that the fair value of a reporting unit in which goodwill resides is less than its carrying value. For reporting units in which this assessment concluded that it was more likely than not that the fair value was more than its carrying value, goodwill was not considered impaired. We were not required to perform the goodwill impairment test. Qualitative factors considered in this assessment included industry and market considerations, overall financial performance and other relevant events and factors that affected the reporting unit. For reporting units in which the impairment assessment concluded that it was more likely than not that the fair value was less than its carrying value, we performed the quantitative goodwill impairment test, which compared the fair value of the reporting unit to its carrying value. If the fair value of the reporting unit exceeded the carrying value of the net assets assigned to that unit, goodwill was not considered impaired, and we were not required to perform additional analysis. If the carrying value of the net assets assigned to the reporting unit exceeded the fair value of the reporting unit, then we would record an impairment loss equal to the difference not to exceed the goodwill balance assigned to the reporting unit.
59
All construction and development projects are reviewed for impairment whenever there is an indication of potential reduction in fair value. If it is determined that it is no longer probable that the projects will be completed and all capitalized costs recovered through future operations, the carrying values of the projects will be written down to their fair value. When we determine that our assets meet the assets held-for-sale criteria, they are reported at the lower of the carrying amount or fair value, less the cost to sell. We are also required to evaluate our equity method investments to determine whether or not they are impaired when the decline in value is considered “other than temporary.”
See Note 2, Summary of Significant Accounting Policies of the Notes to Consolidated Financial Statements, for further discussion of our impairment evaluation of long-lived assets.
New Accounting Pronouncements and Disclosure Requirements
See Note 2, Summary of Significant Accounting Policies of the Notes to Consolidated Financial Statements, for a discussion of new accounting pronouncements and disclosure requirements.
Item 7A. QUANTITATIVE AND QUALITATIVE DISCLOSURES ABOUT MARKET RISK
Commodity Price Risk
Commodity price risks result from exposure to changes in spot prices, forward prices, price volatilities and correlations between the prices of power, steam and natural gas. We manage commodity price risk and the variability in future cash flows from forecasted sales of power and purchases of natural gas of our entire portfolio of generating assets and contractual positions by entering into various derivative and non-derivative instruments.
We measure the energy commodity price risk in our portfolio on a daily basis using a VAR model to estimate the potential one-day risk of loss based on historical experience resulting from potential market movements. Our VAR is calculated for our entire portfolio, which comprises energy commodity derivatives, expected generation, natural gas consumption from our power plants, PPAs and other physical and financial transactions. We measure VAR using a variance/covariance approach based on a confidence level of 95%, a one-day holding period, and actual observed historical correlation. While we believe that our VAR assumptions and approximations are reasonable, different assumptions and/or approximations could produce materially different estimates.
The table below presents the high, low and average of our daily VAR (in millions):
| Year Ended December 31, | |||||||||
| 2024 | 2023 | ||||||||
| High | $ | 61 | $ | 135 | |||||
| Low | $ | 19 | $ | 29 | |||||
| Average | $ | 38 | $ | 54 | |||||
| As of the period end | $ | 26 | $ | 42 | |||||
Due to the inherent limitations of statistical measures such as VAR, the VAR calculation may not capture the full extent of our commodity price exposure. As a result, actual changes in the value of our energy commodity portfolio could be different from the calculated VAR and could have a material effect on our financial results. To evaluate the risks of our portfolio on a comprehensive basis and augment our VAR analysis, we also measure the risk of the energy commodity portfolio using several analytical methods including sensitivity analysis, non-statistical scenario analysis and daily position report analysis.
We use the forward commodity markets to hedge the price risk associated with our power plant portfolio. Our commercial hedging and optimization strategies are designed to maximize our risk-adjusted Commodity Margin by leveraging our knowledge, experience and fundamental views on natural gas and power. A description of risk management activities is included under “Item 1. Business — Wholesale Hedging, Optimization and Origination Efforts. See Note 10, Derivative Instruments included in the Consolidated Financial Statements that are a part of this Report.
60
Our ability to hedge relies in part on market liquidity and the number of counterparties with which to transact. If the number of counterparties in these markets were to decrease, it could decrease our ability to hedge our forward commodity price risk and create incremental volatility in our earnings. The effects of declining liquidity in the forward commodity markets are also mitigated by our retail subsidiaries, which provide us with an additional outlet to transact hedging activities related to our wholesale power plant portfolio.
The primary factors affecting our market risk and the fair value of our derivatives at any point in time are the volume of open derivative positions (MMBtu, MWh and $ notional amounts); changing commodity market prices, primarily for power and natural gas; our credit standing and that of our counterparties for energy commodity derivatives; and prevailing interest rates for our interest rate derivative instruments. Since prices for power and natural gas and interest rates are volatile, there may be material changes in the fair value of our derivatives over time, driven both by price volatility and the changes in the volume of open derivative transactions. See Note 9, Assets and Liabilities with Recurring Fair Value Measurements included in the Consolidated Financial Statements that are a part of this Report.
Inflation Risk
We do not believe that inflation has had a material effect on our business, results of operations, or financial condition. Nonetheless, if our costs were to become subject to significant inflationary pressures, we may not be able to offset such higher costs fully. Our inability or failure to do so could harm our business, financial condition, results of operations or prospects.
Interest Rate Risk
We are exposed to interest rate risk related to our variable rate debt. Interest rate risk represents the potential loss in earnings arising from adverse changes in market interest rates. Our variable rate financings are indexed to base rates, and currently, this rate is generally SOFR. The following table summarizes the contract terms as well as the fair values of our debt instruments exposed to interest rate risk as of December 31, 2024. All outstanding balances and fair values are shown gross of applicable premium or discount, if any (in millions):
| Fair Value December 31, | ||||||||||||||||||||||||||||||||
| 2025 | 2026 | 2027 | 2028 | 2029 | Thereafter | Total | 2024 | |||||||||||||||||||||||||
| Debt by Maturity Date: | ||||||||||||||||||||||||||||||||
| Fixed Rate | $ | 147 | $ | — | $ | — | $ | 2,650 | $ | 650 | $ | 1,796 | $ | 5,243 | $ | 4,942 | ||||||||||||||||
| Average Interest Rate | 5.3 | % | 4.2 | % | 4.2 | % | 4.8 | % | 4.6 | % | 4.2 | % | ||||||||||||||||||||
| Variable Rate | $ | 201 | $ | 237 | $ | 218 | $ | 206 | $ | 1,096 | $ | 5,044 | $ | 7,002 | $ | 6,990 | ||||||||||||||||
| Average Interest Rate(1) | 5.8 | % | 5.6 | % | 5.6 | % | 5.7 | % | 5.7 | % | 6.0 | % | ||||||||||||||||||||
| (1) | Projection based upon forward SOFR rates inferred from spot rates as of December 31, 2024. We have executed interest rate derivative instruments to hedge a portion of our interest rate risk on our variable rate debt. The rates above include the effect of our interest rate derivative instruments on our debt. |
Interest rate risk represents the potential loss in earnings arising from adverse changes in market interest rates. Our interest rate derivative instruments are with counterparties we believe are primarily high-quality credit institutions, and we do not believe that our interest rate derivative instruments expose us to any significant credit risk. Holding all other factors constant, we estimate that a 10% decrease in interest rates would result in a change in the fair value of our interest rate derivative instruments hedging our variable rate debt of approximately $55 million as of December 31, 2024.
Credit Risk
Credit risk relates to the risk of loss resulting from nonperformance or non-payment by our counterparties or customers related to their contractual obligations with us. Risks surrounding counterparty and customer performance and credit could ultimately affect the amount and timing of expected cash flows. We also have credit risk if counterparties or customers are unable to provide collateral or post margin. We monitor and manage our credit risk through credit policies that include:
| · | credit approvals; | |
| · | routine monitoring of counterparties’ and customer’s credit limits and their overall credit ratings; | |
| · | limiting our marketing, hedging and optimization activities with high-risk counterparties; | |
| · | margin, collateral, or prepayment arrangements; and |
| · | payment netting arrangements, or master netting arrangements that allow for the netting of positive and negative exposures of various contracts associated with a single counterparty. |
61
We have concentrations of credit risk with a few of our wholesale counterparties, ISO’s and retail customers relating to our sales of power and steam and our hedging, optimization and trading activities. For example, our wholesale business currently has contracts with investor-owned California utilities, which could be affected should they be found liable for recent wildfires in California and, accordingly, incur substantial costs associated with the wildfires.
We believe that our credit policies and portfolio of transactions adequately monitor and diversify our credit risk. Currently, our counterparties and customers are performing and financially settling timely, according to their respective agreements. We monitor and manage our total comprehensive credit risk associated with all our contracts. This is irrespective of whether they are accounted for as an executory contract, a normal purchase normal sale or whether they are marked-to-market and included in our derivative assets and liabilities on our Consolidated Balance Sheets. Our counterparty and customer credit quality associated with the net fair value of outstanding derivative commodity instruments is included in our derivative assets and (liabilities), net of allocated collateral, as of December 31, 2024, and the period during which the instruments will mature are summarized in the table below (in millions):
| Credit Quality (Based on Standard &
Poor’s Ratings as of December 31, 2024) | 2025 | 2026-2027 | 2028-2029 | After 2029 | Total | |||||||||||||||
| Investment grade | $ | (74 | ) | $ | (82 | ) | $ | (23 | ) | $ | 15 | $ | (164 | ) | ||||||
| Non-investment grade | 162 | 54 | 24 | 56 | 296 | |||||||||||||||
| No external ratings(1) | 50 | 13 | 3 | (11 | ) | 55 | ||||||||||||||
| Total fair value | $ | 138 | $ | (15 | ) | $ | 4 | $ | 60 | $ | 187 | |||||||||
| (1) | Primarily comprised of the fair value of derivative instruments held with customers that are not rated by third-party credit agencies due to the nature and size of the customers. |
Liquidity Risk
Liquidity risk arises from the general funding requirements needed to manage our activities and assets and liabilities. Fluctuating natural gas prices or Market Heat Rates can cause our collateral requirements for our wholesale and retail activities to increase or decrease. We estimate that as of December 31, 2024, the effect of a $1.00 change to natural gas prices at a Steam Adjusted Heat Rate of 8,000 would result in collateral posted of approximately $326 million. Our liquidity management framework is intended to maximize liquidity access and minimize funding costs during times of rising prices. See further discussion regarding our uses of collateral as they relate to our commodity procurement and risk management activities in Note 11, Use of Collateral included in the Consolidated Financial Statements that are a part of this Report.
Item 8. FINANCIAL STATEMENTS AND SUPPLEMENTARY DATA
The information required hereunder is set forth under “Report of Independent Registered Public Accounting Firm,” “Consolidated Statements of Operations,” “Consolidated Statements of Comprehensive Income (Loss),” “Consolidated Balance Sheets,” “Consolidated Statements of Stockholder's Equity,” “Consolidated Statements of Cash Flows” and “Notes to Consolidated Financial Statements” included in the Consolidated Financial Statements that are a part of this Report.
Item 9. CHANGES IN AND DISAGREEMENTS WITH ACCOUNTANTS ON ACCOUNTING AND FINANCIAL DISCLOSURE
Not applicable.
Item 9B. OTHER INFORMATION
Not applicable.
62
PART III
Item 10. DIRECTORS, EXECUTIVE OFFICERS AND CORPORATE GOVERNANCE
Executive Officers and Directors
Below is a list of our executive officers and directors, their respective ages as of February 18, 2025, and a brief account of each of their business experiences. The directors are selected in accordance with the Stockholders Agreement dated March 8, 2018, as amended, by and between Calpine Corporation and CPN Management (“CPN,” “CPN Management, L.P.”).
| Name | Age | Position | |||
| Andrew Novotny | 48 | President and Chief Executive Officer and Director | |||
| Zamir Rauf | 65 | Executive Vice President and Chief Financial Officer | |||
| Michael Del Casale | 64 | Executive Vice President of Power Operations | |||
| W. Thaddeus Miller | 74 | Executive Vice Chairman of the Board and Senior Advisor | |||
| John B. (Thad) Hill III | 57 | Executive Chairman of the Board | |||
| Andrew Gilbert | 38 | Director | |||
| Douglas W. Kimmelman | 64 | Director | |||
| Tyler G. Reeder | 51 | Director | |||
| Donald A. Wagner | 61 | Director |
Executive Officers
Andrew Novotny has served as our President and Chief Executive Officer and as a member of the Company’s Board of Directors since October 1, 2024. Prior to his current role, Mr. Novotny served as our President and Chief Operating Officer beginning in May 2023 and as our Executive Vice President and Chief Operating Officer from January 2021 to May 2023. Mr. Novotny is also the President of Calpine Energy Services, our wholesale trading and marketing subsidiary. In these roles, Mr. Novotny is responsible for our wholesale commercial and retail activity, power operations, human resources, information technology and shared services functions. Prior to the roles mentioned above, he served as Executive Vice President of Commercial Operations, co-leading our wholesale commercial operations and analytics functions while also providing oversight to our ISO and RTO advocacy across North America. Mr. Novotny joined Calpine in April 2012 as Vice President of Power Trading, holding a variety of trading leadership roles since that time. Before joining Calpine, Mr. Novotny served as Vice President of Financial Gas and Power Trading for the BG Group beginning in 2007. Prior to his time at the BG Group, Mr. Novotny was a Vice President with Duke Energy. Mr. Novotny received a Bachelor of Arts degree from Vanderbilt University, graduating magna cum laude with high honors in Economics. He also received a Master's in Business Administration degree from Rice University, where he was named a Jones Scholar.
Zamir Rauf has served as our Executive Vice President and Chief Financial Officer since December 2008, after serving as our Interim Chief Financial Officer beginning in June 2008. Previously, he served as our Senior Vice President, Finance and Treasurer from September 2007 until he was appointed Interim Chief Financial Officer. Since joining the Company in February 2000, Mr. Rauf has served as Manager, Finance from February 2000 to April 2001, Director, Finance from April 2001 to December 2002, Vice President, Finance from December 2002 to July 2005 and Senior Vice President, Finance from July 2005 to September 2007. Prior to joining the Company, Mr. Rauf held various accounting and finance roles with Enron North America and Dynegy Inc., as well as credit and lending roles with Comerica Bank. Mr. Rauf earned his Bachelor of Arts degree in Business and Commerce and Master's in Business Administration — Finance degree from the University of Houston.
Michael Del Casale has served as Executive Vice President of Power Operations since January 2023. Previously, he served as the company's Senior Vice President of Power Operations since October 2017, and his role was expanded in January 2021 to include Asset Performance Management. Previously, Mr. Del Casale had served as Vice President of Regional Operations and Construction since October 2016 and as Vice President of Engineering and Construction beginning in February 2015. Mr. Del Casale joined Calpine as part of the Conectiv Energy acquisition in 2010 and earlier served as Calpine's East Region Asset Manager and Plant Manager at the York Energy Center. Before the acquisition, he was involved with a number of plant construction and commissioning projects, along with other operations and engineering positions throughout his career. Mr. Del Casale worked at the Philadelphia Naval Shipyard for several years before joining Delmarva Power and Light, which later became Conectiv Energy. He has a bachelor's degree in mechanical engineering from Villanova University.
63
W. Thaddeus Miller retired from his position as Executive Vice President and Chief Legal Officer of the Company on December 31, 2023, and he currently remains an employee serving in a Senior Advisor role. Mr. Miller was nominated by ECP and elected as a voting member of the Calpine Board of Directors in August 2022. He continues in his role as a Director of Calpine Board of Directors. Mr. Miller previously served as our Executive Vice Chairman, Executive Vice President and Chief Legal Officer from April 2018 through December 31, 2023. Previously, Mr. Miller served as Executive Vice President, Chief Legal Officer and Secretary since August 2008. Prior to joining the Company, Mr. Miller served as Executive Vice President and Chief Legal Officer of Texas Genco LLC from December 2004 until February 2006. From 2002 to 2004, Mr. Miller was a consultant to Texas Pacific Group, a private equity firm. From 1999 to 2002, he served as Executive Vice President and Chief Legal Officer of Orion Power Holdings, Inc., an independent power producer. From 1994 to 1999, Mr. Miller was a Vice President of Goldman Sachs & Co., where he focused on wholesale electric and other energy commodity trading. Before joining Goldman Sachs & Co., Mr. Miller was a partner in a New York law firm. Mr. Miller currently serves on the board of RMG Acquisition Corp. III since December 2020. Previously, Mr. Miller served on the board of RMG Acquisition Corp. from January 2020 to December 2020 and RMG Acquisition Corp. II from September 2020 to August 2021. Mr. Miller earned his Bachelor of Science degree from the U.S. Merchant Marine Academy and his Juris Doctor degree from St. John’s School of Law. In addition, Mr. Miller was an officer in the U.S. Coast Guard from 1973 through 1976. Mr. Miller’s extensive experience in legal, regulatory and governmental matters related to the power sector, along with his breadth and knowledge of the Company’s legal matters, make him a valuable member of our Board of Directors.
Directors
Biographical information for Mr. Novotny and Mr. Miller can be found above under Item 10. Directors, Executive Officers And Corporate Governance — Executive Officers and Directors
John B. (Thad) Hill has served on our Board of Directors since May 2014 and as Executive Chairman since October 1, 2024. Prior to his current role, Mr. Hill previously served as our Chief Executive Officer from June 2023 through September 2024, as our President and Chief Executive Officer from May 2014 through May 2023, as our President and Chief Operating Officer from December 2012 to May 2014, as our Executive Vice President and Chief Operating Officer from November 2010 to December 2012 and as our Executive Vice President and Chief Commercial Officer from September 2008 to November 2010. Prior to joining the Company, Mr. Hill served as Executive Vice President of NRG Energy, Inc. from February 2006 to September 2008 and President of NRG Texas LLC from December 2006 to September 2008. Prior to joining NRG Energy, Inc., Mr. Hill was Executive Vice President of Strategy and Business Development at Texas Genco LLC from 2005 to 2006. From 1995 to 2005, Mr. Hill was with Boston Consulting Group, Inc., where he rose to Partner and Managing Director and led the North American energy practice, serving companies in the power and natural gas sectors with a focus on commercial and strategic issues. Mr. Hill has served on the board of J.B. Hunt, a Nasdaq-listed company, since 2021. Mr. Hill received his Bachelor of Arts degree from Vanderbilt University and a Master's in Business Administration degree from the Amos Tuck School of Dartmouth College. Mr. Hill was nominated to our Board of Directors in accordance with the terms of the Stockholders Agreement. Mr. Hill’s expertise in the power sector, power operations and energy commodities, along with his knowledge of the Company’s day-to-day operations and overall strategic plan, make him a valuable member of our Board of Directors.
Andrew Gilbert has served on our Board of Directors since March 2018. Mr. Gilbert is a Partner of Energy Capital Partners ("Energy Capital Partners"), a private equity firm focused on investments in the energy industry and is involved in all areas of Energy Capital Partners’ investment activities, with a particular emphasis on fossil and renewable power generation and environmental services. Mr. Gilbert serves as a member of the firm’s Investment Committee and Valuation Committee. Prior to joining Energy Capital Partners in 2010, Mr. Gilbert was a member of Citigroup’s Global Energy Investment Banking Group, where he focused on the midstream sector. Mr. Gilbert currently serves on the boards of numerous Energy Capital Partners portfolio companies. Mr. Gilbert received a Bachelor of Science degree in Finance and Economics from New York University Stern School of Business and is a Chartered Financial Analyst. He was nominated to our Board of Directors by Energy Capital Partners in accordance with the terms of the Stockholders Agreement. Mr. Gilbert’s knowledge and expertise regarding financial and investment matters and the power generation industry make him a valuable member of our Board of Directors, ECP Management Committee, Compensation Committee and Chairman of our Audit Committee.
Douglas W. Kimmelman has served on our Board of Directors since March 2018. Mr. Kimmelman founded Energy Capital Partners in April 2005 and serves as its Senior Partner. Energy Capital Partners is an affiliate of Calpine. Mr. Kimmelman serves as a member of the firm’s Management Committee, Partnership Committee and Investment Committee. Prior to founding Energy Capital Partners, Mr. Kimmelman spent 22 years with Goldman Sachs, starting in 1983 in the firm’s Pipeline and Utilities Department within the Investment Banking Division. He remained exclusively focused on the energy and utility sectors in the Investment Banking Division until 2002 when he transferred to the firm’s J. Aron commodity group. He was named a General Partner of the firm in 1996. From 2002 to 2005, Mr. Kimmelman played a leadership role at Goldman Sachs in building a power generation asset portfolio through the J. Aron commodity group. Mr. Kimmelman currently serves on the board of USD Partners, LP. Mr. Kimmelman also sits on the boards of numerous Energy Capital Partners portfolio companies and other private, charitable and nonprofit boards. Mr. Kimmelman received a Bachelor of Arts degree in Economics from Stanford University and a Master's in Business Administration degree from the Wharton School at the University of Pennsylvania. He was nominated to our Board of Directors by Energy Capital Partners in accordance with the terms of the Stockholders Agreement. Mr. Kimmelman’s approximately 35 years of experience in the power generation and energy industries provide him with strong leadership and insight, particularly with regard to power sector strategy and management matters, and make him a valuable member of our Board of Directors.
64
Tyler G. Reeder has served on our Board of Directors since March 2018. Mr. Reeder is a Managing Partner of Energy Capital Partners. He is involved in all areas of Energy Capital Partners’ investment activities, with a particular emphasis on fossil power generation and environmental infrastructure and services. Mr. Reeder serves as a member of the firm’s Investment Committee, Valuation Committee and Strategy Committee. Prior to joining Energy Capital Partners in 2006, he was a member of the Texas Genco, LLC management team until the sale of the company to NRG Energy, Inc. in 2006. While at Texas Genco, LLC, Mr. Reeder was the head of the asset optimization desk and managed the generation portfolio’s power and fuel positions. From 1998 to 2002, he was a Director for Energy Markets and a Finance Manager at Orion Power Holdings, Inc., where he was responsible for power marketing, transaction analysis and execution. From 1996 to 1998, he worked at Goldman Sachs. Mr. Reeder currently serves on the boards of ECP Gopher Holdings GP, LLC, LTR Intermediate Holdings, Inc., and Double Eagle Parent, LLC and previously served on the board of ECP Environmental Growth Opportunities Corp. and Fast Radius Inc. Mr. Reeder currently serves on the boards of numerous Energy Capital Partners portfolio companies. He also previously served as a director for Dynegy, Inc. from February to November 2017 and Ramaco Resources, Inc. through February 2021. Mr. Reeder received a Bachelor of Arts degree in Economics from Colgate University. He was nominated to our Board of Directors by Energy Capital Partners in accordance with the terms of the Stockholders Agreement. Mr. Reeder’s knowledge and expertise with power generation companies provide him with strong insight, particularly regarding commercial and power operations, power sector strategy, regulatory compliance and capital allocation, and make him a valuable member of our Board of Directors and our Audit Committee and Chairman of our Compensation Committee.
Donald A. Wagner has served on our Board of Directors since March 2018. Mr. Wagner is a Senior Managing Director of Access Industries, Inc. (“Access”), having been with Access since 2010. Access is an affiliate of Calpine. He is responsible for sourcing and executing new investment opportunities in North America, and he oversees Access’ current North American investments. From 2000 to 2009, Mr. Wagner was a Senior Managing Director of Ripplewood Holdings L.L.C., responsible for investments in several areas and heading the industry group focused on investments in basic industries. Previously, Mr. Wagner was a Managing Director of Lazard Freres & Co. LLC and had a 15-year career at that firm and its affiliates in New York and London. He is a board member of NYSE-listed Warner Music Group since July 2011 and BMC Software, an Access portfolio company, since October 2018. He previously served on the board of various publicly traded or privately held companies in the past. Mr. Wagner graduated summa cum laude with a Bachelor of Arts degree in physics from Harvard College. He was nominated to our Board of Directors by Access in accordance with the terms of the Stockholders Agreement. Mr. Wagner’s 25 years of experience with private equity investments, including in the energy industry, in addition to his extensive experience as a director of public companies, makes him a valuable member of our Board of Directors and our Audit and Compensation Committee.
Code of Conduct and Ethics
Our Code of Conduct applies to all directors, officers and employees and requires that each individual deal fairly, honestly and constructively with governmental and regulatory bodies, customers, suppliers and competitors. It prohibits any individual’s taking unfair advantage through manipulation, concealment, abuse of privileged information or misrepresentation of material facts. Further, it imposes an express duty to act in the best interests of the Company and to avoid influences, interests or relationships that could give rise to an actual or apparent conflict of interest. If any question as to a potential conflict of interest arises, employees are directed to notify their supervisors and the General Counsel and, in the case of directors and the Chief Executive Officer, the Audit Committee of our Board of Directors. We require our executives to comply with our Code of Conduct as a condition of employment.
Our Code of Conduct also prohibits directors, officers and employees from competing with us, using Company property or information, or such employee’s position, for personal gain, and taking corporate opportunities for personal gain. Waivers of our Code of Conduct must be explicit. Any director, officer or employee seeking a waiver must provide his supervisor and the General Counsel with all pertinent information and, if the General Counsel recommends approval of a waiver, it shall present such information and the recommendation to the Audit Committee of our Board of Directors. A waiver may only be granted if (i) the Audit Committee is satisfied that all relevant information has been provided and (ii) adequate controls have been instituted to ensure that the interests of the Company remain protected. In the case of our Chief Executive Officer and our directors, any waiver must also be approved by the Audit Committee. Any waiver that is granted, and the basis for granting the waiver, will be publicly communicated as appropriate, including posting on our website, as soon as practicable. We granted no waivers under our Code of Conduct in 2024.
65
Audit Committee
Our Board of Directors has a separately designated audit committee established in accordance with Section 3(a)(58)(A) of the U.S. Exchange Act of 1933, as amended. The members of the Audit Committee are Andrew Gilbert, who serves as chair, Tyler G. Reeder, and Donald A. Wagner. The Board of Directors has also determined that each member of the Audit Committee have sufficient knowledge and understanding of the Company’s financial statements to serve on the Audit Committee and satisfy the definition of “audit committee financial expert” as defined under the federal securities laws. We currently do not have any outstanding stock listed on a national securities exchange; thus, there are no independence standards applicable to us associated with our Audit Committee members.
Item 12. SECURITY OWNERSHIP OF CERTAIN BENEFICIAL OWNERS AND MANAGEMENT AND RELATED STOCKHOLDER MATTERS
The following table sets forth certain information known to the Company regarding the beneficial ownership of its Class A common stock, the class of common stock with voting rights, as of February 18, 2025, by (1) each person known by the Company to be the beneficial owner of more than 5% of the outstanding shares of its Class A common stock, (2) each of our directors, (3) each of our named executive officers and (4) all of our executive officers and directors serving as a group. Unless otherwise stated, the address of each named executive officer and director is c/o Calpine Corporation, 717 Texas Avenue, Suite 1000, Houston, Texas 77002.
| Name | Common
Shares Beneficially Owned(1) | Shares Individuals Have the Right to Acquire Within 60 Days | Total
Number of Shares Beneficially Owned(1) | Percent of Class | |||||||||
| 5% or Greater Owners | |||||||||||||
| CPN Management(1) | 952,153 | — | 952,153 | 100 | % | ||||||||
| Named Executive Officers and Directors | |||||||||||||
| Andrew Novotny | — | — | — | — | |||||||||
| Zamir Rauf | — | — | — | — | |||||||||
| Michael Del Casale | — | — | — | — | |||||||||
| W. Thaddeus Miller | — | — | — | — | |||||||||
| John B. (Thad) Hill III | — | — | — | ||||||||||
| Andrew Gilbert | — | — | — | — | |||||||||
| Douglas W. Kimmelman(2) | 952,153 | — | 952,153 | 100 | % | ||||||||
| Tyler G. Reeder(2) | 952,153 | — | 952,153 | 100 | % | ||||||||
| Donald A. Wagner | — | — | — | — | |||||||||
| All executive officers and directors as a group (9 persons) | 952,153 | — | 952,153 | 100 | % | ||||||||
| (1) | The principal business address of CPN Management, L.P., is 40 Beachwood Road, Summit, New Jersey 07901. | |
| (2) | ECP ControlCo, LLC is the sole managing member of Energy Capital Partners III, LLC, which is the sole managing member of Volt Parent GP, LLC, which is the general partner of each of Volt Parent, LP and CPN Management. Douglas Kimmelman, Andrew Singer, Peter Labbat, Tyler Reeder and Rahman D’Argenio are the managing members of ECP ControlCo, LLC, and share the power to vote and dispose of the securities beneficially owned by ECP ControlCo, LLC. As such, each of ECP ControlCo, LLC, Energy Capital Partners III, LLC, Volt Parent GP, LLC and Messrs. Kimmelman, Singer, Labbat, Reeder and D’Argenio may be deemed to have or share beneficial ownership of the common stock held directly by CPN Management. Each such entity or individual disclaims any such beneficial ownership. The principal business address of each of the entities and individuals listed in this footnote is 40 Beachwood Road, Summit, New Jersey 07901. |
Securities Authorized for Issuance under Equity Compensation Plans
As of December 31, 2024, no securities were authorized for issuance under Calpine Corporation's compensation plans.
66
Item 13. CERTAIN RELATIONSHIPS AND RELATED TRANSACTIONS, AND DIRECTOR INDEPENDENCE
Certain Relationships and Related Transactions
Except as described below and as previously disclosed, for the years ended December 31, 2023 and 2022, there were no actual or proposed transactions to be disclosed in which we were a participant and the amount involved exceeded $120,000 and in which any related person, including our executives and directors, had or will have a direct or indirect material interest.
In June 2024, Champion Energy Services, LLC ("Champion") entered into an agreement with Kraken Technologies Limited ("Kraken"), in which Kraken will provide Champion with a new Customer Information System to manage Champion's teas residential book. Services rendered by Kraken is scheduled to begin in December 2025 and is for a five-year initial term, following a one-year rental term. The estimated notional value is approximately $11 million.
In May 2024, Calpine Energy Services, L.P. entered into an agreement to purchase RECs from Sunnova Energy Corporation with total payments approximating $3 million during the year ended December 31, 2024.
In September 2023, Calpine Solutions executed a transaction for the purchase of renewable energy credits under the California RPS program with Pattern Energy Management Services LLC, an affiliate of CPPIB. The term of the transaction is September 30, 2023 through December 31, 2024, with total payments between $5 million and $8 million.
In October 2019, one of our subsidiaries entered into a steam contract with Pasadena Performance Products, LLC, a subsidiary of Next Wave Energy Partners, LP, (“Next Wave”) to sell steam over an initial term of ten years commencing with the commercial operations of a chemical facility. Pasadena Performance Products, LLC is an affiliate of Energy Capital Partners. The chemical facility met commercial operations on December 28, 2023 resulting in the commencement of the steam contract, with approximately $24 million in revenues recognized from the contract during the year ended December 31, 2024.
Business Relationships and Related Person Transactions Policy
We have adopted a written policy regarding approval requirements for related person transactions. Under our related person transactions policy, our Chief Risk Officer and General Counsel are primarily responsible for the development and implementation of processes and controls to obtain information from the directors and executive officers with respect to related person transactions and for then determining, based on the relevant facts and circumstances, whether a related person has a direct or indirect material interest in the transaction. Under our policy, transactions (1) that involve directors, director nominees, executive officers, significant owners, or other “related persons” in which the We have adopted a written policy regarding approval requirements for related person transactions. Under our related person transactions policy, our General Counsel is primarily responsible for the development and implementation of processes and controls to obtain information from the directors and executive officers with respect to related person transactions and for then determining, based on the relevant facts and circumstances, whether a related person has a direct or indirect material interest in the transaction. Under our policy, transactions (i) that involve directors, director nominees, executive officers, significant owners or other “related persons” in which the Company is or will be a participant and (ii) of the type that must be disclosed under the SEC’s rules must be referred by the General Counsel to our Audit Committee for the purpose of determining whether such transactions are in the best interests of the Company. Under our policy, it is the responsibility of the individual directors, director nominees, executive officers and holders of five percent or more of the Company’s common stock to promptly report to our General Counsel all proposed or existing transactions in which the Company and they, or any related person of theirs, are parties or participants. The General Counsel (or the Chief Executive Officer, in the event the transaction in question involves the General Counsel or a related person of the General Counsel) is then required to furnish to the Chairman of the Audit Committee reports relating to any transaction that, in the General Counsel’s judgment, may require reporting pursuant to the SEC’s rules or may otherwise be the type of transaction that should be brought to the attention of the Audit Committee. The Audit Committee considers material facts and circumstances concerning the transaction in question, consults with counsel and other advisors as it deems advisable and makes a determination or recommendation to the Board of Directors and appropriate officers of the Company with respect to the transaction in question. In its review, the Audit Committee considers the nature of the related person’s interest in the transaction, the material terms of the transaction, the relative importance of the transaction to the related person, the relative importance of the transaction to the Company and any other matters deemed important or relevant. Upon receipt of the Audit Committee’s recommendation, the Board of Directors or officers take such action as deemed appropriate in light of their respective responsibilities under applicable laws and regulations.
67
Our Board of Directors approved guidelines to the related persons transaction policy for the approval of transactions with three entities (and their subsidiaries or affiliates) that have been determined to have the ability to control or significantly influence the management or operating policies of the Company. These entities are as follows:
| · | ECP ControlCo, LLC | |
| · | CPPIB Calpine Canada, Inc. | |
| · | Access Industries, Inc. |
Ordinary course of business transactions between Calpine and any of the above entities or their subsidiaries or affiliates are approved and authorized provided that (a) transactions shall be executed at market-based prices/rates, (b) a list of existing transactions meeting the criteria under (a) will be provided to the Chair of the Audit Committee on a quarterly basis, and (c) transactions or amendments with a notional value in excess of $10 million or any individual transaction with a term of longer than five years will be presented to the Audit Committee for approval in accordance with the related person transaction policy described above.
Director Independence
Following the consummation of the Merger, we are no longer an issuer whose securities are listed on a national securities exchange or in an inter-dealer quotation system which has requirements that a majority of the Board of Directors be independent. However, if we were a listed issuer whose securities were traded on the New York Stock Exchange (“NYSE”) and subject to such requirements, we would be entitled to rely on the controlled company exception contained in the NYSE Listing Manual, Section 303A.00 for the exception from the independence requirements related to the majority of our Board of Directors and for the independence requirements related to our Compensation Committee. Pursuant to NYSE Listing Manual, Section 303A.00, a company of which more than 50% of the voting power for the election of directors is held by an individual, a group or another company is exempt from the requirements that its Board of Directors consist of a majority of independent directors and that the compensation committee (and, if applicable, the nominating committee) of such company be comprised solely of independent directors. CPN Management beneficially owns 100% of the voting power of the Company, which would qualify the Company as a controlled company eligible for exemption under the rule.
Item 14. PRINCIPAL ACCOUNTING FEES AND SERVICES
Audit Fees
The following table presents fees for professional services rendered by Deloitte & Touche LLP for the years ended December 31, 2024, 2023 and 2022 respectively (in millions). Deloitte & Touche LLP did not bill us for other services during those respective periods.
| Year Ended December 31, | ||||||||||||
| 2024 | 2023 | 2022 | ||||||||||
| Audit Fees(1) | $ | 7.2 | $ | 4.5 | $ | 4.3 | ||||||
| Tax Fees(2) | $ | 1.7 | $ | 0.8 | $ | — | ||||||
| (1) | Our Audit fees consisted of fees for the audits and quarterly reviews of our Consolidated Financial Statements, offerings for Calpine Corporation, the audits and reviews of certain of our subsidiaries as well as audits of other reporting requirements. |
| (2) | Tax Fees for the years ended December 31, 2024 and 2023 consist of fees for tax compliance services provided by Deloitte & Touche LLP. Deloitte did not provide us with any material tax consulting services for the year ended December 31, 2022. |
Audit Committee Pre-Approval Policies and Procedures
All audit and non-audit services provided by our independent registered public accounting firm must be pre-approved by our Audit Committee. Any service proposals submitted by our independent registered public accounting firm need to be discussed and approved by the Audit Committee during its meetings, which take place at least four times a year. Once a proposed service is approved, we or our subsidiaries formalize the engagement of the service. The approval of any audit and non-audit services to be provided by our independent registered public accounting firm is specified in the minutes of our Audit Committee meetings. In addition, the members of our Board of Directors are briefed on matters discussed by the different Committees of our Board of Directors.
68
PART IV
Item 15. EXHIBITS, FINANCIAL STATEMENT SCHEDULE
| Page | |
| (a)-1. Financial Statements and Other Information | |
| Calpine Corporation and Subsidiaries | |
| Independent Auditor's Report | 76 |
| Consolidated Statements of Operations for the Years Ended December 31, 2024, 2023 and 2022 | 78 |
| Consolidated Statements of Comprehensive Income (Loss) for the Years Ended December 31, 2024, 2023 and 2022 | 79 |
| Consolidated Balance Sheets at December 31, 2024 and 2023 | 80 |
| Consolidated Statements of Changes In Stockholders’ Equity for the Years Ended December 31, 2024, 2023 and 2022 | 81 |
| Consolidated Statements of Cash Flows for the Years Ended December 31, 2024, 2023 and 2022 | 82 |
| Notes to Consolidated Financial Statements for the Years Ended December 31, 2024, 2023 and 2022 | 84 |
| (a)-2. Financial Statement Schedule | |
| Calpine Corporation and Subsidiaries | |
| Schedule II — Valuation and Qualifying Accounts for the Years Ended December 31, 2024, 2023 and 2022 | 137 |
(b) Exhibits
| Exhibit
Number |
Description | |
| 2.1 | Debtors’ Sixth Amended Joint Plan of Reorganization Pursuant to Chapter 11 of the United States Bankruptcy Code (incorporated by reference to Exhibit 2.1 to Calpine’s Current Report on Form 8-K, filed with the SEC on December 27, 2007, File No. 001-12079). | |
| 2.2 | Findings of Fact, Conclusions of Law, and Order Confirming Sixth Amended Joint Plan of Reorganization Pursuant to Chapter 11 of the U.S. Bankruptcy Code (incorporated by reference to Exhibit 2.2 to Calpine’s Current Report on Form 8-K, filed with the SEC on December 27, 2007, File No. 001-12079). | |
| 2.3 | Agreement and Plan of Merger, dated as of August 17, 2017, by and among Calpine Corporation, Volt Parent, LP and Volt Merger Sub, Inc. (incorporated by reference to Exhibit 2.1 to Calpine’s Current Report on Form 8-K, filed with the SEC on August 22, 2017). | |
| 2.4 | Agreement and Plan of Merger, dated as of January 10, 2025, by and among Calpine Corporation, CPN CS Holdo Corp., CPN CKS Corp., Constellation Energy Corporation, Cascade Transco, Inc., Cascade Transco -1, LLC and Volt Energy Holdings GP, LLC solely in its capacity as the stockholders' representative of Calpine Corporation.* | |
| 3.1 | Fourth Amended and Restated Certificate of Incorporation of Calpine Corporation (incorporated by reference to Exhibit 3.1 to the Company’s Current Report on Form 8-K filed with the SEC on April 13, 2018). | |
| 3.2 | Third Amended and Restated By-Laws of Calpine Corporation (incorporated by reference to Exhibit 3.3 to the Company’s Current Report on Form 8-K filed with the SEC on April 13, 2018). | |
| 3.3 | Fifth Amended and Restated Certificate of Incorporation of Calpine Corporation (incorporated by reference to Exhibit 3.1 to the Company’s Quarterly Report on Form 10-Q dated August 18, 2022). | |
| 4.1 | Indenture, dated as of May 31, 2016, for the senior secured notes due 2026 among each of the Company, the guarantors party thereto and Wilmington Trust, National Association, as trustee (the “Trustee”) (incorporated by reference to Exhibit 4.1 to the Company’s Current Report on Form 8-K filed with the SEC on June 1, 2016). | |
| 4.2 | Indenture, dated as of December 20, 2019, for the senior secured notes due 2028 among each of Calpine Corporation, the guarantors party thereto and Wilmington Trust Company, National Association, as trustee (incorporated by reference to Exhibit 4.1 to Calpine’s Current Report on Form 8-K, filed with the SEC on December 23, 2019). |
69
| Exhibit Number |
Description | |
| 4.3 | Indenture, dated as of December 27, 2019, for the senior notes due 2028 among Calpine Corporation and Wilmington Trust, National Association, as trustee (incorporated by reference to Exhibit 4.1 to Calpine’s Current Report on Form 8-K, filed with the SEC on December 27, 2019). | |
| 4.4 | Indenture, dated as of August 10, 2020, for the senior notes due 2029 between Calpine Corporation and Wilmington Trust, National Association, as trustee (incorporated by reference to Exhibit 4.1 to Calpine’s Current Report on Form 8-K, filed with the SEC on August 10, 2020). | |
| 4.5 | Indenture, dated as of August 10, 2020, for the senior notes due 2031 between Calpine Corporation and Wilmington Trust, National Association, as trustee (incorporated by reference to Exhibit 4.2 to Calpine’s Current Report on Form 8-K, filed with the SEC on August 10, 2020). | |
| 4.6 | Indenture, dated as of December 16, 2020, for the senior secured notes due 2031 among each of Calpine Corporation, the guarantors pay thereto and Wilmington Trust, National Association, as trustee (incorporated by reference to Exhibit 4.1 to Calpine’s Current Report on Form 8-K dated August 10, 2020). | |
| 4.7 | Stockholders Agreement, dated March 8, 2018, by and between Calpine Corporation and CPN Management, L.P. (incorporated by reference to Exhibit 4.1 to the Company’s Current Report on Form 8-K filed with the SEC on March 8, 2018). | |
| 10.1 | Financing Agreements. | |
| 10.1.1 | Credit Agreement, dated as of December 10, 2010, among Calpine Corporation, Goldman Sachs Bank USA, as administrative agent, Goldman Sachs Credit Partners L.P., as collateral agent, the lenders party thereto and other parties thereto (incorporated by reference to Exhibit 10.1 to Calpine’s Current Report on Form 8-K, filed with the SEC on December 13, 2010, File No. 001-12079). | |
| 10.1.2 | Amended and Restated Guarantee and Collateral Agreement, dated as of December 10, 2010, made by the Company and certain of the Company’s subsidiaries party thereto in favor of Goldman Sachs Credit Partners, L.P., as collateral agent (incorporated by reference to Exhibit 10.1 to Calpine’s Quarterly Report on Form 10-Q for the quarter ended June 30, 2011, filed with the SEC on July 29, 2011, File No. 001-12079). | |
| 10.1.3 | Amendment No. 1 to the December 10, 2010 Credit Agreement, dated as of June 27, 2013, among Calpine Corporation, as borrower, Goldman Sachs Bank USA, as administrative agent, Goldman Sachs Credit Partners L.P., as collateral agent, and the lenders party thereto (incorporated by reference to Exhibit 10.1 to the Company’s Current Report on Form 8-K, filed with the SEC on July 1, 2013). | |
| 10.1.4 | Amendment No. 2 to the Credit Agreement, dated as of July 30, 2014, among Calpine Corporation, as borrower, Goldman Sachs Bank USA, as administrative agent, Goldman Sachs Credit Partners L.P., as collateral agent, and the lenders party thereto (incorporated by reference to Exhibit 10.1 to the Company’s Current Report on Form 8-K filed with the SEC on July 31, 2014). | |
| 10.1.5 | Credit Agreement, dated as of May 28, 2015 among Calpine Corporation, as borrower, the lenders party thereto, Morgan Stanley Senior Funding, Inc., as administrative agent, Goldman Sachs Credit Partners L.P., as collateral agent, and Goldman Sachs Bank USA, MUFG Union Bank, N.A., Barclays Bank Plc and Royal Bank of Canada, as co-documentation agents (incorporated by reference to Exhibit 10.1 to the Company’s Current Report on Form 8-K filed with the SEC on May 28, 2015). | |
| 10.1.6 | Amendment No. 3 to the Credit Agreement, dated as of February 8, 2016, among Calpine Corporation, as borrower, the guarantors party thereto, Goldman Sachs Bank USA, as administrative agent, Goldman Sachs Credit Partners L.P., as collateral agent, The Bank of Tokyo-Mitsubishi UFJ Ltd, as successor administrative agent, MUFG Union Bank, N.A., as successor collateral agent, and the lenders party thereto (incorporated by reference to Exhibit 10.1.19 to the Company’s Annual Report on Form 10-K for the year ended December 31, 2015, filed with the SEC on February 12, 2016). | |
| 10.1.7 | Amendment No. 4 to the Credit Agreement, dated as of December 1, 2016, among Calpine Corporation, as borrower, the guarantors party thereto, Goldman Sachs Bank USA, as administrative agent, Goldman Sachs Credit Partners L.P., as collateral agent, The Bank of Tokyo-Mitsubishi UFJ Ltd, as successor administrative agent, MUFG Union Bank, N.A., as successor collateral agent, and the lenders party thereto (incorporated by reference to Exhibit 10.2 to the Company’s Current Report on Form 8-K filed with the SEC on December 2, 2016). |
70
| Exhibit Number |
Description | |
| 10.1.8 | Amendment No. 1 to Credit Agreement, dated as of December 21, 2016, among Calpine Corporation, as borrower, the guarantors, Credit Suisse AG, as the initial new lender and Morgan Stanley Senior Funding, Inc. as administrative agent, and amends the Credit Agreement dated as of May 28, 2015 entered into among the borrower, the institutions from time to time party thereto as lenders, the administrative agent and MUFG Union Bank, N.A., as collateral agent (incorporated by reference to Exhibit 10.1.18 to the Calpine’s Annual Report on Form 10-K for the year ended December 31, 2016, filed with the SEC on February 10, 2017). | |
| 10.1.9 | Amendment No. 5 to the Credit Agreement, dated as of September 15, 2017, among Calpine Corporation as borrower, the guarantors party thereto, The Bank of Tokyo-Mitsubishi UFJ Ltd, as administrative agent, MUFG Union Bank, N.A., as collateral agent, and the lenders party thereto (incorporated by reference to Exhibit 10.1 to Calpine’s Current Report on Form 8-K, filed with the SEC on September 20, 2017). | |
| 10.1.10 | Amendment No. 6 to the Credit Agreement, dated as of October 20, 2017, among the Company, as borrower, the guarantors party thereto, The Bank of Tokyo-Mitsubishi UFJ Ltd, as administrative agent, MUFG Union Bank, N.A., as collateral agent, and the lenders party thereto (incorporated by reference to Exhibit 10.1 to Calpine’s Current Report on Form 8-K, filed with the SEC on October 26, 2017). | |
| 10.1.11 | Credit Agreement, dated December 15, 2017, among CCFC as borrower, the lender's party hereto, and Credit Suisse AG, Cayman Islands Branch, as administrative agent and collateral agent (incorporated by reference to Exhibit 10.1 to Calpine’s Current Report on Form 8-K, filed with the SEC on December 18, 2017). | |
| 10.1.12 | Amendment No. 8 to the Credit Agreement, dated as of May 18, 2018, among Calpine Corporation as borrower, the guarantors party thereto, The Bank of Tokyo-Mitsubishi UFJ Ltd, as administrative agent, MUFG Union Bank, N.A., as collateral agent, and the lenders party thereto (incorporated by reference to Exhibit 10.1 to the Company’s Current Report on Form 8-K filed with the SEC on May 21, 2018). | |
| 10.1.13 | Amendment No. 9 to the Credit Agreement, dated as of April 5, 2019, among Calpine Corporation as borrower, the guarantors party thereto, MUFG Bank, Ltd, as administrative agent, MUFG Union Bank, N.A., as collateral agent, and the lenders party thereto (incorporated by reference to Exhibit 10.1 to the Company’s Current Report on Form 8-K filed with the SEC on April 5, 2019). | |
| 10.1.14 | Credit Agreement, dated April 5, 2019, among Calpine Corporation, as borrower, the lenders party thereto, Morgan Stanley Senior Funding, Inc., as administrative agent, and MUFG Union Bank, N.A., as collateral agent (incorporated by reference to Exhibit 10.2 to the Company’s Current Report on Form 8-K filed with the SEC on April 5, 2019). | |
| 10.1.15 | Amendment No. 10 to the Credit Agreement, dated as of August 12, 2019, among Calpine Corporation as borrower, the guarantors party thereto, MUFG Bank, Ltd, as administrative agent, MUFG Union Bank, N.A., as collateral agent, and the lenders party thereto (incorporated by reference to Exhibit 10.1 to the Company’s Current Report on Form 8-K filed with the SEC on August 16, 2019). | |
| 10.1.16 | Credit Agreement, dated August 12, 2019 among Calpine Corporation, as borrower, the lender's party thereto, Credit Suisse AG, Cayman Islands Branch, as administrative agent, and MUFG Union Bank, N.A., as collateral agent (incorporated by reference to Exhibit 10.2 to the Company’s Current Report on Form 8-K filed with the SEC on August 16, 2019). | |
| 10.1.17 | Amendment No. 11 to the Credit Agreement, dated as of December 16, 2020, among Calpine Corporation, as borrower, the guarantors party thereto, MUFG Bank, Ltd as administrative agent, MUFG Union Bank, N.A., as collateral agent, and the lenders party thereto (incorporated by reference to Exhibit 10.2 to the Company’s Current Report on Form 8-K dated December 16, 2020). | |
| 10.1.18 | Amendment No. 4 to the Credit Agreement, dated as of December 16, 2020, among Calpine Corporation as borrower, the guarantors, Credit Suisse AG, Cayman Islands Branch as initial 2020 new lender and administrative agent, MUFG Union Bank N.A., as collateral agent and amends the Credit Agreement dated as of May 28, 2015 (incorporated by reference to Exhibit 10.1 to the Company’s Current Report on Form 8-K dated December 16, 2020). | |
| 10.1.19 | Sixth Amended and Restated Letter of Credit, Reimbursement and Revolving Credit Agreement, dated as of October 12, 2021, among Calpine Development Holdings, Inc., CDHI Intermediate Holdco, LLC, and Calpine York Holdings, LLC, as borrowers, and MUFG Bank, Ltd., as administrative agent and syndication agent, MUFG Union Bank, N.A., as collateral agent, and the lenders and issuing banks party thereto from time to time (incorporated by reference to Exhibit 4.1 to the Company’s Quarterly Report on Form 10-Q dated November 12, 2021). |
71
| Exhibit Number |
Description | |
| 10.1.20 | Amended and Restated Pledge and Security Agreement, dated as of October 29, 2021, among CDHI Intermediate Holdco, LLC, Calpine York Holdings, LLC, Calpine Development Holdings, LLC, MUFG Union Bank, N.A., as collateral agent, and each of the grantors party thereto from time to time (incorporated by reference to Exhibit 4.2 to the Company’s Quarterly Report on Form 10-Q dated November 12, 2021). | |
| 10.1.21 | Credit Agreement dated as of June 9, 2020 (as amended by the Omnibus Amendment, dated as of November 9, 2021), among Geysers Power Company, LLC, the guarantors party thereto, MUFG Bank, Ltd., as administrative agent, MUFG Union Bank, N.A., as First Lien Collateral Agent, and the lenders and issuing banks parties thereto (incorporated by reference to Exhibit 4.3 to the Company’s Quarterly Report on Form 10-Q dated November 12, 2021). | |
| 10.1.22 | Amendment No. 12 to the Credit Agreement, dated as of January 14, 2022, among Calpine Corporation, as borrower, the guarantors party thereto, MUFG Bank, Ltd. as administrative agent, MUFG Union Bank, N.A., as collateral agent, and the lenders party thereto (incorporated by reference to Exhibit 10.1.22 to the Company’s Annual Report dated March 11, 2022). | |
| 10.1.23 | Credit Agreement dated as of June 9, 2020 (as amended by the Omnibus Amendment, dated as of November 9, 2021, and the Second Omnibus Amendment Agreement, dated as of May 31, 2022), among Geysers Power Company, LLC, the guarantors party thereto, MUFG Bank, Ltd., as administrative agent, MUFG Union Bank, N.A., as first lien collateral agent, and the lenders and issuing banks parties thereto (incorporated by reference to Exhibit 4.1 to the Company’s Quarterly Report on Form 10-Q dated August 18, 2022). | |
| 10.1.24 | Amended and Restated Credit Agreement, dated as of July 5, 2022, among Calpine Corporation, as borrower, and the lenders party thereto, and Citibank, N.A., as administrative agent (incorporated by reference to Exhibit 4.2 to the Company’s Quarterly Report on Form 10-Q dated August 18, 2022). | |
| 10.1.25 | Credit Agreement dated as of July 21, 2022, among Calpine Corporation, as borrower, and the lenders party thereto, and MUFG Bank, Ltd., as administrative agent, and MUFG Union Bank, N.A., as collateral agent (incorporated by reference to Exhibit 4.3 to the Company’s Quarterly Report on Form 10-Q dated August 18, 2022). | |
| 10.1.26 | Seventh Amended and Restated Letter of Credit, Reimbursement and Revolving Credit Agreement, dated as of March 29, 2023, among CDHI Intermediate Holdco, LLC and Calpine York Holdings, LLC, as borrowers, and MUFG Bank, Ltd., as administrative agent and syndication agent, MUFG Union Bank, N.A., as collateral agent, and the lenders and issuing banks party thereto from time to time (incorporated by reference to Exhibit 4.1 to the Company’s Quarterly Report on Form 10-Q dated May 11, 2023). | |
| 10.1.27 | Amended and Restated Credit Agreement, originally dated as of December 15, 2017, and as amended and restated as of August 2, 2023, among Calpine Construction Finance Company, L.P. as a borrower, and the lenders party hereto, and Credit Suisse AG, Cayman Islands Branch, as administrative agent and collateral agent (incorporated by reference to Exhibit 4.1 to the Company’s Quarterly Report on Form 10-Q dated November 7, 2023). | |
| 10.1.28 | Third Amending Agreement to Second Amended and Restated Credit Agreement, dated as of November 14, 2023, among Greenfield Energy Centre L.P., as a borrower, and MUFG Bank, Ltd, as administrative agent and those institutions party hereto as lenders.* | |
| 10.1.29 | Credit Agreement by and among Nova Power, LLC, as a borrower, and the lenders and issuing banks party hereto from time to time, ING Capital LLC, as the administrative agent and U.S. Bank Trust Company, National Association, as the collateral agent, dated as of December 21, 2023 (incorporated by reference to Exhibit 10.1 to the Company’s Current Report on Form 8-K dated January 3, 2024). | |
| 10.1.30 | Amendment No. 4 to the Credit Agreement, dated as of January 31, 2024, among Calpine Corporation, as a borrower, the guarantor's, Credit Suisse AG, Cayman Islands Branch, as administrative agent, U.S. Bank National Association, as collateral agent, and the lenders party thereto.* | |
| 10.1.31 | Amendment No. 3 to the Credit Agreement, dated as of January 31, 2024, among Calpine Corporation, as a borrower, the guarantor's, Credit Suisse AG, Cayman Islands Branch, as administrative agent, U.S. Bank National Association, as collateral agent, and the lenders party thereto.* | |
| 10.1.32 | Amendment No. 6 to the Credit Agreement, dated as of January 31, 2024, among Calpine Corporation, as a borrower, the guarantor's, Credit Suisse AG, Cayman Islands Branch, as administrative agent, U.S. Bank National Association, as collateral agent, and the lenders party thereto.* |
72
| Exhibit Number |
Description | |
| 10.1.33 | Amendment No. 13 to the Credit Agreement, dated as of January 31, 2024, among Calpine Corporation, as a borrower, the guarantor's, MUFG Bank, Ltd., as administrative agent, U.S. Bank National Association, as collateral agent, and the lenders party thereto.* | |
| 10.1.34 | Amendment No. 14 to the Credit Agreement, dated as of December 16, 2024, among Calpine Corporation, as a borrower, the guarantor's, MUFG Bank, Ltd., as administrative agent and the extending lender, U.S. Bank National Association, ,as collateral agent, and the lenders party thereto.* | |
| 10.1.35 | Amendment No. 4 to the Credit Agreement, dated as of December 20, 2024, among Calpine Corporation, as a borrower, the guarantor's, BMO Capital Markets Corp., as the Initial 2024-2 term lender, and as the 2024 additional term lender, and Bank of Montreal, as administrative agent, U.S. Bank National Association, ,as collateral agent, and the lenders party thereto.* | |
| 10.1.36 | Amendment No. 7 to the Credit Agreement, dated as of December 20, 2024, among Calpine Corporation, as a borrower, the guarantor's, BMO Capital Markets Corp., as the Initial 2024-2 term lender, and as the 2024 additional term lender, and Bank of Montreal, as administrative agent, U.S. Bank National Association, ,as collateral agent, and the lenders party thereto.* | |
| 21.1 | Subsidiaries of the Company.* |
| * | Filed herewith. |
Item 16. FORM 10-K SUMMARY
Not applicable.
73
SIGNATURES
Calpine has duly caused this Report to be signed on its behalf by the undersigned thereunto duly authorized.
| CALPINE CORPORATION | ||
| By: | /s/ ZAMIR RAUF | |
| Zamir Rauf | ||
| Executive Vice President and Chief Financial Officer | ||
| (Principal Financial Officer) | ||
Date: February 18, 2025
74
CALPINE CORPORATION AND SUBSIDIARIES
INDEX TO CONSOLIDATED FINANCIAL STATEMENTS
December 31, 2024
| Page | |||
| Independent Auditor's Report | 76 | ||
| Consolidated Statements of Operations for the Years Ended December 31, 2024, 2023 and 2022 | 78 | ||
| Consolidated Statements of Comprehensive Income (Loss) for the Years Ended December 31, 2024, 2023 and 2022 | 79 | ||
| Consolidated Balance Sheets at December 31, 2024 and 2023 | 80 | ||
| Consolidated Statements of Changes In Stockholders’ Equity for the Years Ended December 31, 2024, 2023 and 2022 | 81 | ||
| Consolidated Statements of Cash Flows for the Years Ended December 31, 2024, 2023 and 2022 | 82 | ||
| Notes to Consolidated Financial Statements for the Years Ended December 31, 2024, 2023 and 2022 | 84 |
75
INDEPENDENT AUDITOR'S REPORT
To the Board of Directors and Stockholders’ of Calpine Corporation
Opinion
We have audited the consolidated financial statements of Calpine Corporation and subsidiaries (the "Company"), which comprise the consolidated balance sheets as of December 31, 2024 and 2023, and the related consolidated statements of operations, comprehensive income (loss), stockholders’ equity, and cash flows for each of the three years in the period ended December 31, 2024, and the related notes (collectively referred to as the "financial statements").
In our opinion, the accompanying financial statements present fairly, in all material respects, the financial position of the Company as of December 31, 2024 and 2023, and the results of its operations and its cash flows for each of the three years in the period ended December 31, 2024 in accordance with accounting principles generally accepted in the United States of America.
Basis for Opinion
We conducted our audits in accordance with auditing standards generally accepted in the United States of America (GAAS). Our responsibilities under those standards are further described in the Auditor's Responsibilities for the Audit of the Financial Statements section of our report. We are required to be independent of the Company and to meet our other ethical responsibilities, in accordance with the relevant ethical requirements relating to our audits. We believe that the audit evidence we have obtained is sufficient and appropriate to provide a basis for our audit opinion.
Responsibilities of Management for the Financial Statements
Management is responsible for the preparation and fair presentation of the financial statements in accordance with accounting principles generally accepted in the United States of America, and for the design, implementation, and maintenance of internal control relevant to the preparation and fair presentation of financial statements that are free from material misstatement, whether due to fraud or error.
In preparing the financial statements, management is required to evaluate whether there are conditions or events, considered in the aggregate, that raise substantial doubt about the Company's ability to continue as a going concern for one year after the date that the financial statements are available to be issued.
Auditor's Responsibilities for the Audit of the Financial Statements
Our objectives are to obtain reasonable assurance about whether the financial statements as a whole are free from material misstatement, whether due to fraud or error, and to issue an auditor's report that includes our opinion. Reasonable assurance is a high level of assurance but is not absolute assurance and therefore is not a guarantee that an audit conducted in accordance with GAAS will always detect a material misstatement when it exists. The risk of not detecting a material misstatement resulting from fraud is higher than for one resulting from error, as fraud may involve collusion, forgery, intentional omissions, misrepresentations, or the override of internal control. Misstatements are considered material if there is a substantial likelihood that, individually or in the aggregate, they would influence the judgment made by a reasonable user based on the financial statements.
76
In performing an audit in accordance with GAAS, we:
| · | Exercise professional judgment and maintain professional skepticism throughout the audit. |
| · | Identify and assess the risks of material misstatement of the financial statements, whether due to fraud or error, and design and perform audit procedures responsive to those risks. Such procedures include examining, on a test basis, evidence regarding the amounts and disclosures in the financial statements. |
| · | Obtain an understanding of internal control relevant to the audit in order to design audit procedures that are appropriate in the circumstances, but not for the purpose of expressing an opinion on the effectiveness of the Company's internal control. Accordingly, no such opinion is expressed. |
| · | Evaluate the appropriateness of accounting policies used and the reasonableness of significant accounting estimates made by management, as well as evaluate the overall presentation of the financial statements. |
| · | Conclude whether, in our judgment, there are conditions or events, considered in the aggregate, that raise substantial doubt about the Company's ability to continue as a going concern for a reasonable period of time. |
We are required to communicate with those charged with governance regarding, among other matters, the planned scope and timing of the audit, significant audit findings, and certain internal control-related matters that we identified during the audit.
Other Information Included in the Annual Report
Management is responsible for the other information included in the annual report. The other information comprises the information included in the annual report but does not include the financial statements and our auditor's report thereon. Our opinion on the financial statements does not cover the other information, and we do not express an opinion or any form of assurance thereon.
In connection with our audits of the financial statements, our responsibility is to read the other information and consider whether a material inconsistency exists between the other information and the financial statements, or the other information otherwise appears to be materially misstated. If, based on the work performed, we conclude that an uncorrected material misstatement of the other information exists, we are required to describe it in our report.
/s/ DELOITTE & TOUCHE LLP
Houston, TX
February 18, 2025 (December 9, as to the effects of the adjustment to goodwill discussed in Note 2)
77
CALPINE CORPORATION AND SUBSIDIARIES
CONSOLIDATED STATEMENTS OF OPERATIONS
(in millions)
| Year Ended December 31, | ||||||||||||
| 2024 | 2023 | 2022 | ||||||||||
| Operating revenues: | ||||||||||||
| Commodity revenue | $ | 12,247 | $ | 11,507 | $ | 12,999 | ||||||
| Mark-to-market gain (loss) | 118 | 2,131 | (573 | ) | ||||||||
| Other revenue | 69 | 49 | 45 | |||||||||
| Operating revenues | 12,434 | 13,687 | 12,471 | |||||||||
| Operating expenses: | ||||||||||||
| Fuel and purchased energy expense: | ||||||||||||
| Commodity expense | 7,149 | 7,311 | 9,433 | |||||||||
| Mark-to-market (gain) loss | (19 | ) | 1,248 | 121 | ||||||||
| Fuel and purchased energy expense | 7,130 | 8,559 | 9,554 | |||||||||
| Operating and maintenance expense | 1,458 | 1,353 | 1,362 | |||||||||
| Depreciation and amortization expense | 770 | 735 | 708 | |||||||||
| General and other administrative expense | 170 | 168 | 291 | |||||||||
| Other operating expenses | 100 | 102 | 70 | |||||||||
| Total operating expenses | 9,628 | 10,917 | 11,985 | |||||||||
| Impairment losses | — | — | 46 | |||||||||
| Loss on sale of assets, net | 13 | — | — | |||||||||
| Loss (income) from unconsolidated subsidiaries | 4 | (3 | ) | 20 | ||||||||
| Income from operations | 2,789 | 2,773 | 420 | |||||||||
| Interest expense | 584 | 555 | 422 | |||||||||
| Loss on extinguishment of debt | 52 | 16 | 2 | |||||||||
| Other expense, net | 31 | 65 | 46 | |||||||||
| Income (loss) before income taxes | 2,122 | 2,137 | (50 | ) | ||||||||
| Income tax expense | 460 | 542 | 120 | |||||||||
| Net income (loss) | $ | 1,662 | $ | 1,595 | $ | (170 | ) | |||||
The accompanying notes are an integral part of these Consolidated Financial Statements.
78
CALPINE CORPORATION AND SUBSIDIARIES
CONSOLIDATED STATEMENTS OF COMPREHENSIVE INCOME (LOSS)
(in millions)
| Year Ended December 31, | ||||||||||||
| 2024 | 2023 | 2022 | ||||||||||
| Net income (loss) | $ | 1,662 | $ | 1,595 | $ | (170 | ) | |||||
| Cash flow hedging activities: | ||||||||||||
| Gain (loss) on cash flow hedges before reclassification adjustment for cash flow hedges realized in net income (loss) | 67 | 181 | (604 | ) | ||||||||
| Reclassification adjustment for loss (gain) on cash flow hedges realized in net income (loss) | 165 | 194 | (26 | ) | ||||||||
| Unrealized actuarial gain arising during period | 4 | — | 2 | |||||||||
| Foreign currency translation gain (loss) | (1 | ) | 15 | (6 | ) | |||||||
| Income tax (expense) benefit | (59 | ) | (94 | ) | 154 | |||||||
| Other comprehensive income (loss) | 176 | 296 | (480 | ) | ||||||||
| Comprehensive income (loss) | $ | 1,838 | $ | 1,891 | $ | (650 | ) | |||||
The accompanying notes are an integral part of these Consolidated Financial Statements.
79
CALPINE CORPORATION AND SUBSIDIARIES
CONSOLIDATED BALANCE SHEETS
(in millions)
| December 31, | ||||||||
| 2024 | 2023 | |||||||
| ASSETS | ||||||||
| Current assets: | ||||||||
| Cash and cash equivalents ($38 and $18 attributable to VIEs) | $ | 706 | $ | 163 | ||||
| Accounts receivable, net of allowance of $12 and $13 | 1,038 | 1,041 | ||||||
| Inventories ($127 and $114 attributable to VIEs) | 955 | 844 | ||||||
| Margin deposits and other prepaid expense | 144 | 298 | ||||||
| Restricted cash, current ($140 and $71 attributable to VIEs) | 278 | 184 | ||||||
| Derivative assets, current | 579 | 530 | ||||||
| Other current assets ($15 and $16 attributable to VIEs) | 23 | 23 | ||||||
| Total current assets | 3,723 | 3,083 | ||||||
| Property, plant and equipment, net ($4,033 and $3,549 attributable to VIEs) | 12,579 | 11,877 | ||||||
| Restricted cash, net of current portion (nil and $1 attributable to VIEs) | 1 | 1 | ||||||
| Investments in unconsolidated subsidiaries | 77 | 21 | ||||||
| Long-term derivative assets ($69 and $62 attributable to VIEs) | 559 | 579 | ||||||
| Intangible assets, net | 189 | 212 | ||||||
| Goodwill | 242 | 242 | ||||||
| Other assets ($73 and $125 attributable to VIEs) | 425 | 491 | ||||||
| Total assets | $ | 17,795 | $ | 16,506 | ||||
| LIABILITIES & STOCKHOLDERS’ EQUITY | ||||||||
| Current liabilities: | ||||||||
| Accounts payable | $ | 1,132 | $ | 990 | ||||
| Accrued interest payable | 87 | 93 | ||||||
| Debt, current portion ($166 and $246 attributable to VIEs) | 355 | 613 | ||||||
| Derivative liabilities, current | 316 | 381 | ||||||
| Other current liabilities ($98 and $131 attributable to VIEs) | 1,345 | 1,008 | ||||||
| Total current liabilities | 3,235 | 3,085 | ||||||
| Debt, net of current portion ($4,132 and $3,295 attributable to VIEs) | 11,807 | 11,216 | ||||||
| Deferred income tax liability | 752 | 360 | ||||||
| Long-term derivative liabilities | 388 | 274 | ||||||
| Other long-term liabilities | 629 | 528 | ||||||
| Total liabilities | 16,811 | 15,463 | ||||||
| Commitments and contingencies (see Note 16) | ||||||||
| Stockholders’ equity: | ||||||||
| Common stock (see Note 14) Class A shares: par value $0.001; number of shares authorized - 1,200,000; number of shares issued and outstanding at December 31, 2024 952,153 and December 31, 2023 - 952,153 Class B shares: par value $0.001; number of shares authorized - 200,000; number of shares issued and outstanding at December 31, 2024 - 48,651 and December 31, 2023 - 47,847 | — | — | ||||||
| Additional paid-in capital | 9,931 | 9,929 | ||||||
| Accumulated deficit | (8,838 | ) | (8,601 | ) | ||||
| Accumulated other comprehensive loss | (109 | ) | (285 | ) | ||||
| Total stockholders’ equity | 984 | 1,043 | ||||||
| Total liabilities and stockholders’ equity | $ | 17,795 | $ | 16,506 | ||||
The accompanying notes are an integral part of these Consolidated Financial Statements.
80
CALPINE CORPORATION AND SUBSIDIARIES
CONSOLIDATED STATEMENTS OF CHANGES IN STOCKHOLDERS' EQUITY
(in millions)
Common Stock | Treasury Stock | Additional Paid-In Capital | Accumulated Deficit | Accumulated Other Comprehensive Loss | Total Stockholders’ Equity | |||||||||||||||||||
| Balance, December 31, 2021 | $ | — | $ | — | $ | 9,651 | $ | (7,753 | ) | $ | (101 | ) | $ | 1,797 | ||||||||||
| Stock-based compensation (Note 15) | — | — | 260 | — | — | 260 | ||||||||||||||||||
| Dividends | — | — | — | (570 | ) | — | (570 | ) | ||||||||||||||||
| Net loss | — | — | — | (170 | ) | — | (170 | ) | ||||||||||||||||
| Other comprehensive loss | — | — | — | — | (480 | ) | (480 | ) | ||||||||||||||||
| Balance, December 31, 2022 | $ | — | $ | — | $ | 9,911 | $ | (8,493 | ) | $ | (581 | ) | $ | 837 | ||||||||||
| Stock-based compensation (Note 15) | — | — | 18 | — | — | 18 | ||||||||||||||||||
| Dividends | — | — | — | (1,703 | ) | — | (1,703 | ) | ||||||||||||||||
| Net income | — | — | — | 1,595 | — | 1,595 | ||||||||||||||||||
| Other comprehensive income | — | — | — | — | 296 | 296 | ||||||||||||||||||
| Balance, December 31, 2023 | $ | — | $ | — | $ | 9,929 | $ | (8,601 | ) | $ | (285 | ) | $ | 1,043 | ||||||||||
| Stock-based compensation (Note 15) | — | — | 2 | — | — | 2 | ||||||||||||||||||
| Dividends | — | — | — | (1,899 | ) | — | (1,899 | ) | ||||||||||||||||
| Net income | — | — | — | 1,662 | — | 1,662 | ||||||||||||||||||
| Other comprehensive income | — | — | — | — | 176 | 176 | ||||||||||||||||||
| Balance, December 31, 2024 | $ | — | $ | — | $ | 9,931 | $ | (8,838 | ) | $ | (109 | ) | $ | 984 | ||||||||||
The accompanying notes are an integral part of these Consolidated Financial Statements.
81
CALPINE CORPORATION AND SUBSIDIARIES
CONSOLIDATED STATEMENTS OF CASH FLOWS
(in millions)
| Year Ended December 31, | ||||||||||||
| 2024 | 2023 | 2022 | ||||||||||
| Cash flows from operating activities: | ||||||||||||
| Net income (loss) | $ | 1,662 | $ | 1,595 | $ | (170 | ) | |||||
| Adjustments to reconcile net income (loss) to net cash provided by operating activities: | ||||||||||||
| Depreciation and amortization(1) | 811 | 781 | 718 | |||||||||
| Loss on extinguishment of debt | 38 | 10 | 1 | |||||||||
| Deferred income taxes | 338 | 494 | 92 | |||||||||
| Proceeds from Sale of ITC | 377 | — | — | |||||||||
| Impairment losses | — | — | 46 | |||||||||
| Mark-to-market activity, net | (107 | ) | (864 | ) | 591 | |||||||
| Loss (income) from unconsolidated subsidiaries | 4 | (3 | ) | 20 | ||||||||
| Stock-based compensation expense | 2 | 18 | 260 | |||||||||
| Other | 24 | 56 | 20 | |||||||||
| Change in operating assets and liabilities: | ||||||||||||
| Accounts receivable | 12 | 1,670 | (1,666 | ) | ||||||||
| Accounts payable and accrued expenses | 12 | (1,527 | ) | 1,387 | ||||||||
| Margin deposits and other prepaid expense | (46 | ) | 296 | (141 | ) | |||||||
| Other assets and liabilities, net | 228 | (227 | ) | (31 | ) | |||||||
| Derivative instruments, net | 216 | 227 | (699 | ) | ||||||||
| Net cash provided by operating activities | 3,571 | 2,526 | 428 | |||||||||
| Cash flows from investing activities: | ||||||||||||
| Purchases of property, plant and equipment | (1,104 | ) | (908 | ) | (538 | ) | ||||||
| Acquisition of Power plants, net of cash acquired, and other | (340 | ) | (51 | ) | — | |||||||
| Cash contributions to Gregory Power Holdings, LLC | (44 | ) | — | — | ||||||||
| Other | — | 19 | 45 | |||||||||
| Net cash used in investing activities | (1,488 | ) | (940 | ) | (493 | ) | ||||||
| Cash flows from financing activities: | ||||||||||||
| Borrowings under CCFC Term Loans and | 798 | 296 | — | |||||||||
| Repayments of CCFC Term Loans, Corp First Lien Term Loan, and Corp First Lien Notes | (291 | ) | (305 | ) | (37 | ) | ||||||
| Borrowings under revolving facilities | 200 | 952 | 1,824 | |||||||||
| Repayments of revolving facilities | (342 | ) | (1,438 | ) | (1,160 | ) | ||||||
| Borrowings from construction loan facilities, project financing, notes payable and other | 477 | 549 | 303 | |||||||||
| Repayments of project financing, notes payable and other | (341 | ) | (157 | ) | (143 | ) | ||||||
| Debt issuance costs | (36 | ) | (38 | ) | (38 | ) | ||||||
| Dividends paid | (1,899 | ) | (1,703 | ) | (564 | ) | ||||||
| Other | (12 | ) | (17 | ) | (15 | ) | ||||||
| Net cash provided by (used in) financing activities | (1,446 | ) | (1,861 | ) | 170 | |||||||
| Net increase (decrease) in cash, cash equivalents and restricted cash | 637 | (275 | ) | 105 | ||||||||
| Cash, cash equivalents and restricted cash, beginning of period | 348 | 623 | 518 | |||||||||
| Cash, cash equivalents and restricted cash, end of period(2) | $ | 985 | $ | 348 | $ | 623 | ||||||
The accompanying notes are an integral part of these Consolidated Financial Statements.
82
CALPINE CORPORATION AND SUBSIDIARIES
CONSOLIDATED STATEMENTS OF CASH FLOWS — (Continued)
(in millions)
| Year Ended December 31, | ||||||||||||
| 2024 | 2023 | 2022 | ||||||||||
| Cash paid during the period for: | ||||||||||||
| Interest, net of amounts capitalized | $ | 516 | $ | 489 | $ | 462 | ||||||
| Income taxes | $ | 88 | $ | 46 | $ | 27 | ||||||
| Supplemental disclosure of non-cash investing and financing activities: | ||||||||||||
| Capital expenditures included in accounts payable and other assets and liabilities, net | $ | 327 | $ | 206 | $ | 100 | ||||||
| Contribution to Calpine Receivables, LLC | $ | 15 | $ | — | $ | 12 | ||||||
| Capital expenditures transferred from other assets to property, plant and equipment(3) | $ | (137 | ) | $ | (224 | ) | $ | — | ||||
| Recognition of loans related to master securities lending transaction | $ | — | $ | 95 | $ | 200 | ||||||
| Extended maturity of loans related to master securities lending transaction | $ | — | $ | (95 | ) | $ | — | |||||
| Maturity of loans related to JPM Master Securities Lending Agreement | $ | (200 | ) | $ | — | $ | — | |||||
| Initial recognition of asset retirement obligation asset and liability | $ | 53 | $ | 14 | $ | 6 | ||||||
| Recognition of investment tax credits related to battery storage facilities | $ | 57 | $ | — | $ | — | ||||||
| (1) | Includes amortization included in Commodity revenue and Commodity expense associated with intangible assets and amortization recorded in interest expense associated with debt issuance costs and discounts. |
| (2) | Our cash and cash equivalents, restricted cash, current and restricted cash, net of current portion are stated as separate line items on our Consolidated Balance Sheets. |
| (3) | Deposit and milestone payments made for property, plant and equipment prior to the acquisition of the fixed asset are initially recognized within Other assets on our Consolidated Balance Sheets and as a cash outflow within Operating activities on our Consolidated Statements of Cash Flows. These amounts are subsequently transferred from Other assets to property, plant and equipment on our Consolidated Balance Sheets when the property, plant and equipment is acquired by Calpine and are not included within the Cash flows from investing activities section of our Consolidated Statements of Cash Flows. |
The accompanying notes are an integral part of these Consolidated Financial Statements.
83
CALPINE CORPORATION AND SUBSIDIARIES
NOTES TO CONSOLIDATED FINANCIAL STATEMENTS
| 1. | Organization and Operations |
Calpine Corporation (“Calpine” or “the Company”) is one of the largest power generators in the U.S. measured by power produced. Calpine owns and operates primarily natural gas-fired, geothermal, and battery storage power plants in North America and have a significant presence in major competitive wholesale and retail power markets in California, Texas, and the Northeast and Mid-Atlantic regions of the U.S. The Company sells power, steam, capacity, renewable energy credits (“RECs”) and ancillary services to its customers. The Company's wholesale customer base includes but is not limited to utilities, power marketers, retail power providers, municipalities, community choice aggregators, independent electric system operators, industrial companies and other governmental entities. Additionally, through Calpine's retail brands, retail energy and related products are marketed to commercial, industrial, governmental and residential customers. The Company continues to focus on providing products and services that are beneficial to wholesale and retail customers. The Company purchases primarily natural gas and fuel oil as fuel for its power plants and engages in related natural gas transportation and storage transactions. The Company also purchases power and related products for sale to customers and purchases electric transmission rights to deliver power to customers. Additionally, consistent with the Company's risk management policy, it enters into natural gas, power, environmental products, fuel oil and other physical and financial commodity contracts to hedge certain business risks and optimize the portfolio of power plants.
| 2. | Summary of Significant Accounting Policies |
Basis of Presentation and Principles of Consolidation
The Company's Consolidated Balance Sheet as of December 31, 2024 and 2023, the related Consolidated Statements of Operations, Consolidated Statements of Comprehensive Income (Loss), Consolidated Statements of Stockholder's Equity and Consolidated Statements of Cash Flows for the years ended December 31, 2024, 2023, and 2022 and the related notes Item 15. Exhibits, Financial Statement Schedule (collectively referred to as the “Consolidated Financial Statements,” and “financial statements”) have been prepared in accordance with generally accepted accounting principles in the U.S. (“U.S. GAAP,” and “GAAP”) and include the accounts of all majority-owned subsidiaries that are not variable interest entities (“VIEs”) and all VIEs where it was determined the Company is the primary beneficiary. All significant intercompany transactions and balances have been eliminated in consolidation.
Equity Method Investments and Investments without readily determinable fair value — The Company uses the equity method or other method of accounting to record net interests in entities where it was determined that the Company does not control the investment and is not the primary beneficiary, which as of December 31, 2024, includes Gregory Power Holdings, LLC, and Calpine Receivables, LLC (“Calpine Receivables”). Calpine Receivables, an indirect, wholly-owned subsidiary of Calpine, was established as a bankruptcy-remote, special purpose subsidiary responsible for administering the Accounts Receivable Sales Program. Prior to September 5, 2023, the Company owned 50% of the equity interest of Greenfield Energy Centre L.P. (“Greenfield L.P.”, and “Greenfield Energy Centre”), which was accounted for as an equity method investment until that date. See Note 5, Acquisitions and LLC Agreement, for further discussion of the Greenfield L.P. acquisition and our investment in Gregory Power Holdings, LLC. For our equity method investments, the Company's share of Net income (loss) is calculated according to its equity ownership percentage or according to the terms of the applicable agreements. The Company's investments without a readily determinable fair value are not material as of December 31, 2024. See Note 7, Variable Interest Entities and Unconsolidated Investments for further discussion of VIEs and unconsolidated investments.
Jointly-Owned Plants — Certain of Calpine's subsidiaries own undivided interests in jointly-owned plants. These plants are maintained and operated pursuant to their joint ownership participation and operating agreements. The Company is responsible for its subsidiaries’ share of operating costs and direct expenses and include its proportionate share of the facilities and related revenues and direct expenses in these jointly-owned plants in the corresponding balance sheet and income statement captions of the Consolidated Financial Statements. The following table summarizes the proportionate ownership interest held in jointly-owned power plants (in millions, except percentages):
| As of December 31, 2024 | Ownership Interest | Property, Plant & Equipment | Accumulated Depreciation | Construction in Progress | ||||||||||||
| Freestone Energy Center | 75.0 | % | $ | 367 | $ | (170 | ) | $ | — | |||||||
| Hidalgo Energy Center | 78.5 | % | $ | 249 | $ | (100 | ) | $ | (1 | ) | ||||||
84
| As of December 31, 2023 | Ownership Interest | Property, Plant & Equipment | Accumulated Depreciation | Construction in Progress | ||||||||||||
| Freestone Energy Center | 75.0 | % | $ | 378 | $ | (180 | ) | $ | — | |||||||
| Hidalgo Energy Center | 78.5 | % | $ | 235 | $ | (106 | ) | $ | 1 | |||||||
Use of Estimates in Preparation of Financial Statements
The preparation of financial statements in conformity with U.S. GAAP requires management to make estimates and assumptions that affect the reported amounts of assets, liabilities, revenues, expenses and related disclosures included in the Consolidated Financial Statements. Actual results could differ from those estimates.
Fair Value of Financial Instruments and Derivatives
See Note 8, Debt, for disclosures regarding the fair value of debt instruments and Note 9, Assets and Liabilities with Recurring Fair Value Measurements, for disclosures regarding the fair values of derivative instruments and related margin deposits and certain of cash balances.
Concentrations of Credit Risk
Financial instruments that potentially subject the Company to credit risk consist of cash and cash equivalents, restricted cash, accounts and notes receivable, as well as derivative financial instruments. Certain of cash and cash equivalents, as well as restricted cash balances, are invested in money market accounts with investment banks that are not U.S. Federal Deposit Insurance Corporation (“FDIC”) insured. The Company places its cash and cash equivalents and restricted cash in what it believes to be creditworthy financial institutions and certain of its money market accounts agencies to invest in United States (“U.S.”) Treasury securities or other obligations issued or guaranteed by the U.S. Government, its agencies, or instrumentalities. Additionally, the Company actively monitors the credit risk of its counterparties and customers, including receivable, commodity and derivative transactions. The Company's accounts and notes receivable are concentrated within entities engaged in the energy industry, mainly within the United States. Generally we have not collected collateral for accounts receivable from utilities and end-user customers; however, the Company may require collateral in the future. For financial and commodity derivative counterparties and customers, the Company evaluates the net accounts receivable, accounts payable and fair value of commodity contracts. The Company may require security deposits, cash margin or letters of credit to be posted if our exposure reaches a certain level or their credit rating declines.
The Company's counterparties and customers primarily consist of four categories of entities that participate in the energy markets:
| · | financial institutions and trading companies; |
| · | regulated utilities, municipalities, cooperatives, independent system operators (“ISOs”) and other retail power suppliers; |
| · | oil, natural gas, chemical, and other energy-related industrial companies; and |
| · | commercial, industrial and residential retail customers. |
The Company has concentrations of credit risk with a few of its wholesale counterparties and retail customers relating to its sales of power and steam and our hedging, optimization and trading activities. The Company has exposure to trends within the energy industry, including declines in the creditworthiness of our counterparties and customers for our commodity and derivative transactions. Certain Company counterparties and customers within the energy industry have below-investment-grade credit ratings. Our risk control group manages counterparty and customer credit risk and monitors our net exposure with each counterparty or customer daily. The analysis is performed on a mark-to-market basis using forward curves. The net exposure is compared against a credit risk threshold. This threshold is determined based on each counterparty's and customers' credit rating and evaluation of their financial statements. We use these thresholds to determine if additional collateral or restriction of activity with the counterparty or customer is needed. We believe that our credit policies and portfolio of transactions adequately monitor and diversify our credit risk. Our wholesale counterparties and retail customers are performing and financially settling in a timely manner according to their respective agreements.
Cash and Cash Equivalents
The Company considers all highly liquid investments with an original maturity of three months or less to be cash and cash equivalents. We have cash and cash equivalents held in non-corporate accounts relating to certain project finance facilities and lease agreements that require us to establish and maintain segregated cash accounts. These accounts have been pledged as security in favor of the lenders under such project finance facilities, and the use of certain cash balances on deposit are limited from time to time based on the status of the project.
85
Restricted Cash
Certain Company debt agreements, lease agreements or other agreements require us to establish and maintain segregated cash accounts, the use of which is restricted, making these cash funds unavailable for general use. These amounts are held by depository banks in order to comply with the contractual provisions requiring reserves for payments such as debt service, rent and major maintenance or with applicable regulatory requirements. Restricted cash is generally invested in accounts earning market rates; therefore, the carrying value approximates fair value. Such cash is excluded from cash and cash equivalents on our Consolidated Balance Sheets.
The table below represents the components of our restricted cash (in millions):
| December 31, | ||||||||||||||||||||||||
| 2024 | 2023 | |||||||||||||||||||||||
| Current | Non- Current | Total | Current | Non- Current | Total | |||||||||||||||||||
| Construction/major maintenance | $ | 140 | $ | — | $ | 140 | $ | 56 | $ | — | $ | 56 | ||||||||||||
| Security/project/insurance | 133 | — | 133 | 121 | — | 121 | ||||||||||||||||||
| Other | 5 | 1 | 6 | 7 | 1 | 8 | ||||||||||||||||||
| Total | $ | 278 | $ | 1 | $ | 279 | $ | 184 | $ | 1 | $ | 185 | ||||||||||||
Cash and Cash Equivalents and Restricted Cash
The following table provides a reconciliation of cash and cash equivalents and restricted cash reported in the Consolidated Statements of Cash Flows to the total of the same amounts reported in the Consolidated Balance Sheets (in millions):
| December 31, | ||||||||
| 2024 | 2023 | |||||||
| Cash and cash equivalents | $ | 706 | $ | 163 | ||||
| Restricted cash included in current and non-current assets | 279 | 185 | ||||||
| Total cash and cash equivalents and restricted cash | $ | 985 | $ | 348 | ||||
Business Interruption Proceeds
The Company records business interruption insurance proceeds when they are realizable. For the years ended December 31, 2024, 2023 and 2022 we recorded approximately nil, $39 million and $73 million of business interruption proceeds in operating revenues. Business interruption proceeds recognized in 2023 is related to extended outages at several facilities, including the Geysers Assets (“Geysers”) and the Pasadena Cogeneration facility.
Accounts Receivable and Payable
Accounts receivable and payable represent amounts due from customers and owed to vendors, respectively. Accounts receivables are recorded at invoiced amounts, net of reserves and allowances, and do not bear interest as the balances are short-term in nature. We use a variety of information to determine our allowance for expected credit losses based on multiple factors, including the length of time receivables are past due, current, and future economic trends and conditions affecting our customer base, significant one-time events, historical write-off experience and forward-looking information such as internally developed forecasts. Our allowance for expected credit losses totaled $12 million and $13 million as of December 31, 2024 and 2023, respectively. The accounts receivable and payable balances also include settled but unpaid amounts relating to our marketing, hedging and optimization activities. These receivables and payables with individual counterparties are subject to master netting arrangements whereby we legally have a right of offset and settle the balances net. However, for balance sheet presentation purposes and to be consistent with the way we present the majority of amounts related to marketing, hedging and optimization activities on our Consolidated Statements of Operations, we present our receivables and payables on a gross basis. We do not have any significant off-balance sheet credit exposure related to our customers.
86
Inventory
Inventory primarily consists of spare parts, stored natural gas and fuel oil, environmental products and natural gas exchange imbalances. Other than spare parts, inventory is stated primarily at the lower of cost or net realizable value under the weighted average cost method. Spare parts inventory is valued at weighted average cost and is expensed to operating and maintenance expense or capitalized to property, plant and equipment as the parts are used and consumed.
Collateral
The Company uses margin deposits, prepayments and letters of credit as credit support for commodity procurement and risk management activities with and from our counterparties and customers. Calpine has granted priority liens on the Company’s assets, as collateral in accordance with power and natural gas agreements, under the 2026 First Lien Notes, 2028 First Lien Notes and 2031 First Lien Notes (collectively, the “First Lien Notes”), our 2032 First Lien Term Loan and 2031 First Lien Term Loan (collectively, the “First Lien Term Loans”) and Corporate Revolving Facility. These agreements qualify as “Eligible Commodity Hedge Agreements” under our First Lien Notes, First Lien Term Loans and Corporate Revolving Facility. The first priority liens have been granted in order to reduce the cash collateral and letters of credit that we would otherwise be required to provide to our counterparties under such agreements. The counterparties under such agreements would ratably share the benefits of the collateral subject to such first priority liens with the lenders under our First Lien Notes, First Lien Term Loans and Corporate Revolving Facility. Interest rate hedging instruments are related to project financings collateralized by first-priority liens on the underlying assets. See Note 11, Use of Collateral, for a further discussion.
Property, Plant and Equipment, Net
Property, plant and equipment is stated at cost. The Company capitalizes costs incurred in connection with the construction of power plants and battery storage facilities, the development of geothermal properties and the refurbishment of major turbine generator equipment. When capital improvements to leased power plants meets the Company's capitalization criteria, they are capitalized as leasehold improvements and amortized over the shorter term of the lease or the economic life of the capital improvement. The Company expenses maintenance costs when the service performed does not meet the capitalization criteria. The Company's current capital expenditures at its' geothermal power plant assets, including steam extraction and gathering assets, located in northern California include those incurred for proven reserves and reservoir replenishment (primarily water injection), pipeline and power generation assets and drilling of “development wells” as all drilling activity has been performed within the known boundaries of the steam reservoir. Significant additions or improvements extending asset lives are capitalized as incurred, while repairs and maintenance that do not improve or extend the life of the respective asset are charged to expense as incurred. The Company purchased our Geysers Assets as a proven steam reservoir and all well costs, except well work overs and routine repairs and maintenance, have been capitalized since its purchase date.
The Company depreciates assets under the straight-line method over the shorter of the useful life or the lease term. For natural gas-fired power plants, an estimated salvage value that approximates 10.0% of the depreciable cost basis is used on power plants the Company has full ownership or has favorable option to purchase at the end of lease term. For Geysers Assets, no salvage value is used. A de minimis amount of the depreciable costs basis is used for componentized equipment. The component depreciation method is used for natural gas-fired power plant rotable parts, certain componentized balance of plant parts, and information technology equipment. The composite depreciation method is used for other natural gas-fired power plant asset groups and Geysers Assets.
Under the composite depreciation method, upon asset normal retirement the costs of assets are retired against accumulated depreciation, and no gain or loss is recorded. For retirement of assets under the component depreciation method, the costs and related accumulated depreciation are removed from Consolidated Balance Sheets, and any gain or loss is recognized as operating and maintenance expense in the Consolidated Statements of Operations.
Goodwill and Intangible Assets
In accordance with ASC 350, Intangibles—Goodwill and Other (“ASC 350”), the Company recognizes goodwill for the excess cost of an acquired entity over the net value assigned to assets acquired and liabilities assumed. Goodwill represents the excess of the purchase price over the fair value of the net assets acquired at acquisition.
Goodwill resulted from the acquisition of the Company's Retail business. As such, the goodwill balance was allocated to the Retail segment. The Company did not record any changes in the carrying value of our goodwill as of December 31, 2024 and 2023. As of December 31, 2024 and 2023, the Company's goodwill is $242 million and $242 million, respectively.
The Company traditionally has elected the private company option to amortize intangible goodwill balances. Pursuant to Securities and Exchange Commission (“SEC”) Regulation S-X Rule 3-05 for financial statements of businesses acquired or to be acquired, as a result of the Plan of Merger agreement with Constellation, the Company has reinstated all goodwill balances to the initially recorded amount of $242 million adjusting accumulated amortization by approximately $73 million, $48 million and $24 million for the years ended December 31, 2024, 2023 and 2022, respectively.
87
The Company recognizes intangible assets, such as acquired contracts, customer relationships and trademark and trade names, at their estimated fair values at acquisition. All available information is used to estimate fair values, including quoted market prices, and other widely accepted valuation techniques. Certain estimates and judgments are required in the application of the methods used to measure the fair value of our intangible assets, including estimates of future cash flows, selling prices, replacement costs, economic lives and the selection of a discount rate, which are not observable in the market and represent a level 3 measurement. All recognized intangible assets consist of rights and obligations with finite lives.
Intangible assets components were as follows (in millions):
| December 31, | ||||||||||||
| 2024 | 2023 | Lives | ||||||||||
| Customer relationships | $ | 356 | $ | 351 | 14 Years | |||||||
| Trademark and trade name | 40 | 40 | 15 Years | |||||||||
| Other(1) | 26 | 22 | 4-33 Years | |||||||||
| 422 | 413 | |||||||||||
| Less: Accumulated amortization | (233 | ) | (202 | ) | ||||||||
| Intangible assets, net | $ | 189 | $ | 211 | ||||||||
| (1) | The Other category includes approximately $8 million and $8 million as of December 31, 2024 and 2023, respectively, associated with the fair value of a power purchase agreement (“PPA”) contract acquired in the Greenfield L.P. acquisition and $10 million and $10 million as of December 31, 2024 and 2023, respectively, related to an acquired interconnection agreement for a battery storage project. |
Amortization expense related to intangible assets for the years ended December 31, 2024, 2023 and 2022 was $31 million, $29 million, and $35 million, respectively.
The estimated aggregate amortization expense of intangible assets for the next five years is as follows (in millions):
| 2025 | $ | 33 | |||
| 2026 | $ | 33 | |||
| 2027 | $ | 31 | |||
| 2028 | $ | 28 | |||
| 2029 | $ | 29 |
Impairment Evaluation of Long-Lived Assets (Including Goodwill, Intangibles and Investments)
Long-lived assets, such as property, plant and equipment, equity method investments and finite-lived intangible assets are evaluated for impairment when events or changes in circumstances indicate that the carrying value of such assets may be unrecoverable. Equipment assigned to each power plant is not evaluated for impairment separately; instead, operating power plants and related equipment are evaluated as a whole unit. When an impairment condition occurs, an impairment loss estimate is calculated using undiscounted future cash flows associated with a long-lived asset or group of long-lived assets at the lowest level for which identifiable cash flows are largely independent of the cash flows of other assets and liabilities for long-lived assets that are expected to be held and used. The Company's multi-year forecast is prepared using a fundamental long-term view of the power market based on long-term production volumes, price curves and operating costs together with the regulatory and environmental requirements within each individual market. Power sales are managed and marketed as a portfolio rather than at the individual power plant or customer level within each designated market, pool or segment. As a result, power plants are grouped based on the corresponding market for valuation purposes. If it is determined that the undiscounted cash flows from an asset or group of assets to be held and used are less than the associated carrying amount, or if an asset has been classified as held for sale, the fair value must be estimated to determine the amount of any impairment loss.
The carrying amount of goodwill is assessed for impairment annually each third quarter and when events or changes in circumstances indicate the carrying value of the goodwill and/or intangible asset is not in excess of fair value. The annual goodwill impairment assessment is performed at the reporting unit level, which is identified as one level below the Company’s operating segments for which discrete financial information is available. The assessment includes a review of qualitative factors, including industry and market considerations, overall financial performance, and other relevant events and factors that affected the reporting unit. For reporting units in which the impairment assessment concludes that it was more-likely-than-not that the fair value was less than its carrying value, we perform the quantitative goodwill impairment test, which compares the fair value of the reporting unit to its carrying value. If the fair value of the reporting unit exceeds the carrying value of the net assets assigned to that unit, goodwill is not considered impaired and we are not required to perform additional analysis. If the carrying value of the net assets assigned to the reporting unit exceeds the fair value of the reporting unit, then we will record an impairment loss equal to the difference not to exceed the goodwill balance assigned to the reporting unit.
88
No impairment was recorded for our goodwill for the years ended December 31, 2024, 2023 and 2022.
All construction and development projects are reviewed for impairment whenever there is an indication of potential reduction in fair value. If it is determined that a construction or development project is no longer probable of completion and the capitalized costs will not be recovered through future operations, the carrying value of the project will be written down to its fair value.
To estimate future cash flows, historical cash flows, existing contracts, capacity prices PPAs, changes in the market environment and other factors are used which may affect future cash flows. To the extent applicable, the assumptions used are consistent with internally generated forecasts that, (for example, are used in preparing earnings forecasts). The use of this method involves inherent uncertainty. Best estimates are used in making these evaluations and consider various factors, including forward price curves for power and fuel costs and forecasted operating costs. However, actual future market prices and project costs could vary from the assumptions used in these estimates, and the effect of such variations could be material. When it is determined that assets meet the assets held-for-sale criteria, they are reported at the lower of carrying amount or fair value, less the cost to sell. Equity method investments are also evaluated to determine whether or not they are impaired when the value is considered an “other than a temporary” decline in value.
Generally, fair value will be determined using valuation techniques such as the present value of expected future cash flows. Estimated, discounted future cash flows are used which employ single interest rate representative of the risk involved with the asset, including contract terms, tenor and credit risk of counterparties. Factors considered also include prices of similar assets, consultations with brokers or employment of other valuation techniques. Best estimates are used in these evaluations which consider various factors, including forward price curves for power and fuel costs and forecasted operating costs. However, actual future market prices and project costs could vary from the assumptions used in estimates, and the effect of such variations could be material.
No impairment losses were recorded for the years ended December 31, 2024 and 2023. An impairment loss of $46 million was recorded during the year ended December 31, 2022, related to Carlls Corner Energy Center, Mickleton Energy Center, Sherman Avenue Energy Center and Cumberland Energy Center, as a result of legislation signed into law in January 2023.
Accrued Compensation
As of December 31, 2024 and 2023, $313 million and $252 million were recorded, respectively. This balance is included in other current liabilities on the Consolidated Balance Sheets.
Current Environmental Liability
As of December 31, 2024 and 2023, we recognized a current liability of $470 million and $389 million, respectively, associated with renewable portfolio standard and emission obligations in accordance with regulatory compliance programs. This balance is included in other current liabilities on the Consolidated Balance Sheets.
Asset Retirement Obligation
The Company accounts for AROs in accordance with ASC 410-20, Asset Retirement Obligations, or ASC 410-20. Retirement obligations associated with long-lived assets included within the scope of ASC 410-20 are those for which a legal obligation exists under enacted laws, statutes, and written or oral contracts, including obligations arising under the doctrine of promissory estoppel, and for which the timing and/or method of settlement may be conditional on a future event. ASC 410-20 requires an entity to recognize the fair value of a liability for an ARO in the period in which it is incurred, and a reasonable estimate of fair value can be made. Upon initial recognition of a liability for an ARO, the Company capitalizes the asset retirement cost by increasing the carrying amount of the related long-lived asset by the same amount. Over time, the liability is accreted to its present value each period and the capitalized cost is depreciated over the useful life of the related asset.
89
As of December 31, 2024 and 2023, the asset retirement obligation liability was $179 million and $115 million, respectively, primarily relating to land leases upon which power plants are built and the requirement that the property meets specific conditions upon its return. This balance is included in other long-term liabilities on the Consolidated Balance Sheets. The following table summarizes the changes to our asset retirement obligations (in millions):
| December 31, | ||||||||
| 2024 | 2023 | |||||||
| Balance, beginning of period | $ | 115 | $ | 92 | ||||
| Accretion expense | 11 | 9 | ||||||
| Adjustments for new asset retirement obligations | 53 | 14 | ||||||
| Balance, end of period | $ | 179 | $ | 115 | ||||
Leases
It is determined at contract inception, if the contract is or contains a lease, which involves the contract conveying the right to control the use of explicitly or implicitly identified property, plant or equipment for a period of time in exchange for consideration.
Right-of-use (“ROU”) assets represent the Company's right to use an underlying asset for the lease term and lease liabilities represent the Company's obligation to make lease payments arising from the lease. ROU assets and lease liabilities are recognized at the commencement date of the underlying lease based on the present value of lease payments over the lease term. The Company's secured incremental borrowing rate is used and is based on information available at lease commencement to determine the present value of lease payments. Operating leases are included in ROU assets, operating lease liabilities (current) and operating lease liabilities (non-current) on the Consolidated Balance Sheet. Finance leases are included in property, plant and equipment, other current liabilities, other non-current liabilities and deferred credits on the Consolidated Balance Sheets. The lease term includes options to extend or terminate the lease when it is reasonably certain that the option will be exercised. The Company applies the practical expedient permitted by ASC 842 Leases, to not separate lease and non-lease components for most lease asset classes.
Leases with an initial lease term of 12 months or less are not recorded on the balance sheet. Lease expense is recognized for these leases on a straight-line basis over the lease term. There are no material operating and finance subleases. See Note 4, Leases, for further discussion.
Debt Issuance Costs
Costs incurred related to the issuance of debt instruments are deferred and amortized over the term of the related debt using a method that approximates the effective interest rate method. However, when the timing of debt transactions involves contemporaneous exchanges of cash between the Company and the same creditor(s) in connection with the issuance of a new debt obligation and satisfaction of an existing debt obligation, debt issuance costs are accounted for depending on whether the transaction qualifies as an extinguishment or modification, which requires us to either write-off the original debt issuance costs and capitalize the new issuance costs, or continue to amortize the original debt issuance costs and immediately expense the new issuance costs. Debt issuance costs related to a recognized debt liability are presented as a direct deduction from the carrying amount of the related debt liability, which is consistent with the presentation of debt discounts.
Accounting for Derivative Instruments
The Company accounts for derivative instruments under ASC 815, Derivatives and Hedging, which requires the Company to record all derivatives on the balance sheet at fair value and changes in fair value in earnings unless they qualify for the NPNS exception.
The Company enters into various derivative instruments, including both exchange-traded and over-the-counter (“OTC”) power and natural gas forwards, options as well as instruments that settle on the power price to natural gas price relationships (Heat Rate swaps and options), and interest rate derivative instruments. All derivative instruments that qualify for derivative accounting treatment are recognized as either assets or liabilities and are measured at fair value unless they qualify for and are designated under the NPNS exemption. Accounting for derivatives at fair value requires estimation of future prices during periods for which price quotes may not be available from external sources in which case internally developed price estimates are relied upon. Hedge accounting requires formal documentation, designation, and an assessment of the effectiveness of hedge accounting transactions.
Cash Flow Hedges — The Company typically designates its derivative instruments as cash flow hedges if they meet the criteria specified in ASC 815, Derivatives and Hedging. Beginning on January 1, 2022, the Company has elected to designate certain commodity derivative instruments in cash flow hedging relationships under the accounting rules. As a result, hedge accounting is applied to a portion of interest rate and commodity hedging instruments with the change in fair value of all other hedging instruments recorded through earnings. The Company reports the mark-to-market gain or loss on interest rate and commodity hedging instruments designated and qualifying as a cash flow hedging instrument as a component of other comprehensive income (“OCI”) and reclassifies such gains and losses into earnings, including the related tax effects, in the same period during which the hedged forecasted transaction affects earnings. If it is determined that the forecasted transaction is no longer probable of occurring, then hedge accounting is discontinued prospectively with future changes in fair value recorded in earnings. If the hedging instrument is terminated or de-designated prior to the occurrence of the hedged forecasted transaction, the net accumulated gain or loss associated with the changes in fair value of the hedging instrument remains deferred in accumulated other comprehensive income (“AOCI”) until the forecasted transaction affects earnings or until it is determined that the forecasted transaction is probable of not occurring.
90
See Note 10, Derivative Instruments, for further discussion.
Revenue Recognition
Operating revenues are comprised of the following:
| · | power and steam revenue consisting of variable payments related to generation, power revenues consisting of fixed and variable capacity payments not related to generation - including capacity payments received from regional transmission organizations (“RTO”) and ISO capacity auctions – REC revenue from our Geysers Assets, and other revenues such as RMR contracts, resource adequacy, and certain ancillary service revenues, |
| · | retail power and gas sales activities, |
| · | realized settlements from our marketing, hedging, optimization and trading activities, |
| · | unrealized mark-to-market revenues from derivative instruments as a result of our marketing, hedging, optimization and trading activities; and |
| · | sales of natural gas and other service revenues. |
For further information about the Company's accounting for revenue from contracts with customers, see Note 3, Revenue from Contracts with Customers
Realized Settlements of Commodity Derivative Instruments — The realized value of power sales and commodity purchase contracts that are net settled, or settled as gross sales and purchases but could have been net settled, are reflected on a net basis and included in Commodity revenue on our Consolidated Statements of Operations.
Mark-to-Market (Gain) Loss — Changes in the realized mark-to-market value of power-based commodity derivative instruments are reflected on a net basis as a separate component of operating revenues.
Gross vs. Net Accounting — We determine at contract inception whether the financial statement presentation of revenues should be on a gross or net basis. Where the Company acts as principal, settlement of physical commodity contracts is recorded on a gross or net basis dependent upon whether the contract results in the physical delivery of the underlying product. With respect to our physical executory contracts, where we do not take title to the commodities but receives a variable payment to convert natural gas into power and steam in a tolling operation, revenues are recorded on a net basis.
Fuel and Purchased Energy Expense
Fuel and purchased energy expense is comprised of the cost of natural gas and fuel oil purchased from third parties for the purposes of power plant consumption in our power plants as fuel, the cost of power purchased from third parties for sale to retail customers, the cost of power and natural gas purchased from third parties for marketing, hedging and optimization activities, and realized settlements and mark-to-market gains and losses resulting from general market price movements against certain derivative natural gas and power contracts. This includes financial natural gas transactions economically hedging anticipated future power sales that either do not qualify as hedges under the hedge accounting guidelines or qualify under the hedge accounting guidelines and the hedge accounting designation has not been elected.
Realized and Mark-to-Market Expenses from Commodity Derivative Instruments
Realized Settlements of Commodity Derivative Instruments — The realized value of natural gas commodity purchase and sales contracts that are net settled are reflected on a net basis and included in Commodity expense on our Consolidated Statements of Operations. Power purchase commodity contracts that result in the physical delivery of power, and that also supplement our power generation, are reflected on a gross basis and are included in Commodity expense on our Consolidated Statements of Operations.
91
Mark-to-Market (Gain) Loss — Changes in the mark-to-market value of natural gas-based and certain power-based commodity derivative instruments are reflected on a net basis as a separate component of fuel and purchased energy expense.
Operating and Maintenance Expense
Operating and maintenance expenses primarily include employee expenses, utilities, chemicals, repairs and maintenance (including equipment failure and major maintenance), insurance and property taxes. These expenses are recognized when the service is performed or in the period to which the expense relates.
Income Taxes
Income taxes are accounted for using the asset and liability method in accordance with ASC 740, Income Taxes. Deferred tax assets and liabilities are recognized for the future tax consequences attributable to differences between the financial statement carrying values of existing assets and liabilities and their respective tax basis, tax credit and net operating loss (“NOL”) carryforwards. Deferred tax assets and liabilities are measured using enacted tax rates expected to apply to taxable income in the years in which temporary differences are expected to be recovered or settled. The effect on deferred tax assets and liabilities due to a change in tax rates is recognized in income in the period that includes the enactment date.
The recognize the financial statement effects of a tax position are recognized when it is more-likely-than-not, based on the technical merits, that the position will be sustained upon examination. A tax position that meets the more-likely-than-not recognition threshold is measured as the largest amount of tax benefit that is greater than 50% likely to be realized upon ultimate tax authority settlement. Previously recognized tax positions are reversed in the first period in which it is no longer more-likely-than-not that the tax position will be sustained upon examination. See Note 12, Income Taxes, for further discussion.
New Accounting Pronouncements and Disclosure Requirements
Improvements to Reportable Segment Disclosures
In November 2023, the Financial Accounting Standards Board (“FASB”) issued ASU 2023-07, “Segment Reporting (Topic 280): Improvements to Reportable Segment Disclosures.” The Accounting Standards Update (“ASU”) requires public entities to disclose significant segment expenses regularly provided to the chief operating decision maker (“CODM”) and the amount and composition of other segment items that reconcile segment revenue less significant expenses to the reported measures of a segment’s profit or loss. Other disclosure requirements include the CODM’s title and position, as well as how the CODM uses the reported measures of a segment’s profit or loss to assess segment performance and allocate resources. The ASU also extends certain annual disclosures to interim periods but does not change how a company identifies its operating segments, aggregates those operating segments, or applies quantitative thresholds to determine its reportable segments. Calpine adoption of ASU 2023-07 was effective as of December 31, 2024, which did not have a material effect on our Consolidated Financial Statements. See Note 18, Segment and Significant Customer Information for additional disclosures required by Topic 280.
Improvements to Income Tax Disclosures
In December 2023, the FASB issued ASU 2023-09, “Improvements to Income Tax Disclosures,” which requires a tabular reconciliation of the expected tax to the reported tax using both percentages and amounts broken out into specific categories, with certain reconciling items at or above 5% of the expected tax further broken out by nature and/or jurisdiction. Entities are also required to disclose income taxes paid, broken out between federal, state/local, and foreign, as well as to an individual jurisdiction for 5% or more of the total income taxes paid. The ASU is effective for fiscal years beginning after December 15, 2024, with early adoption permitted, and can be applied prospectively or retrospectively. The Company is currently assessing the impact of adopting ASU 2023-09 on the financial statement disclosure.
92
Expense Disaggregation Disclosures
In November 2024, the FASB issued ASU 2024-03, “Expense Disaggregation (Topic 220-40): Disaggregation of Income Statement Expenses.” The ASU requires disclosure, in the notes to financial statements, of specified information about certain costs and expenses. The amendments require that at each interim and annual reporting period an entity: (1) disclose the amounts of (a) purchases of inventory, (b) employee compensation, (c) depreciation, (d) intangible asset amortization, and (e) depreciation, depletion, and amortization recognized as part of oil-and gas-producing activities (“DD&A”) (or other amounts of depletion expense) included in each relevant expense caption. A relevant expense caption is an expense caption presented on the face of the income statement within continuing operations that contains any of the expense categories listed in (a)–(e); (2) include certain amounts that are already required to be disclosed under current U.S. GAAP in the same disclosure as the other disaggregation requirements; (3) disclose a qualitative description of the amounts remaining in relevant expense captions that are not separately disaggregated quantitatively; and (4) disclose the total amount of selling expenses and, in annual reporting periods, an entity’s definition of selling expenses. The ASU is effective for annual reporting periods beginning after December 15, 2026, and interim reporting periods beginning after December 15, 2027. Early adoption is permitted. The ASU should be applied either (1) prospectively to financial statements issued for reporting periods after the effective date of this Update or (2) retrospectively to any or all prior periods presented in the financial statements. While the Company is not a public company, it is currently assessing the impact of adopting ASU 2024-03 on its financial statement disclosure.
| 3. | Revenue from Contracts with Customers |
Disaggregation of Revenues with Customers
The following tables represent a disaggregation of revenue by reportable segment (in millions). See Note 18, Segment and Significant Customer Information for a description of these segments.
| Year Ended December 31, 2024 | ||||||||||||||||||||||||
| Wholesale | ||||||||||||||||||||||||
| West | Texas | East | Retail | Elimination | Total | |||||||||||||||||||
| Third-Party: | ||||||||||||||||||||||||
| Energy & other products | $ | 867 | $ | 1,184 | $ | 1,616 | $ | 1,058 | $ | — | $ | 4,725 | ||||||||||||
| Capacity | 603 | 368 | 369 | — | — | 1,340 | ||||||||||||||||||
| Revenues relating to physical or executory contracts – third-party | $ | 1,470 | $ | 1,552 | $ | 1,985 | $ | 1,058 | $ | — | $ | 6,065 | ||||||||||||
| Affiliate(1): | $ | 197 | $ | 284 | $ | 67 | $ | 56 | $ | (604 | ) | $ | — | |||||||||||
| Revenues relating to leases and derivative instruments(2) | $ | 6,369 | ||||||||||||||||||||||
| Other | — | |||||||||||||||||||||||
| Total operating revenues | $ | 12,434 | ||||||||||||||||||||||
| Year Ended December 31, 2023 | ||||||||||||||||||||||||
| Wholesale | ||||||||||||||||||||||||
| West | Texas | East | Retail | Elimination | Total | |||||||||||||||||||
| Third-Party: | ||||||||||||||||||||||||
| Energy & other products | $ | 1,589 | $ | 1,619 | $ | 905 | $ | 1,091 | $ | — | $ | 5,204 | ||||||||||||
| Capacity | 470 | 447 | 348 | — | — | 1,265 | ||||||||||||||||||
| Revenues relating to physical or executory contracts – third-party | $ | 2,059 | $ | 2,066 | $ | 1,253 | $ | 1,091 | $ | — | $ | 6,469 | ||||||||||||
| Affiliate(1): | $ | 140 | $ | 296 | $ | 66 | $ | 144 | $ | (646 | ) | $ | — | |||||||||||
| Revenues relating to leases and derivative instruments(2) | $ | 7,217 | ||||||||||||||||||||||
| Other | 1 | |||||||||||||||||||||||
| Total operating revenues | $ | 13,687 | ||||||||||||||||||||||
93
| Year Ended December 31, 2022 | ||||||||||||||||||||||||
| Wholesale | ||||||||||||||||||||||||
| West | Texas | East | Retail | Elimination | Total | |||||||||||||||||||
| Third-Party: | ||||||||||||||||||||||||
| Energy & other products | $ | 2,228 | $ | 2,156 | $ | 969 | $ | 1,223 | $ | — | $ | 6,576 | ||||||||||||
| Capacity | 462 | 255 | 419 | — | — | 1,136 | ||||||||||||||||||
| Revenues relating to physical or executory contracts – third-party | $ | 2,690 | $ | 2,411 | $ | 1,388 | $ | 1,223 | $ | — | $ | 7,712 | ||||||||||||
| Affiliate(1): | $ | 151 | $ | 59 | $ | 65 | $ | 58 | $ | (333 | ) | $ | — | |||||||||||
| Revenues relating to leases and derivative instruments(2) | $ | 4,758 | ||||||||||||||||||||||
| Other | 1 | |||||||||||||||||||||||
| Total operating revenues | $ | 12,471 | ||||||||||||||||||||||
| (1) | Affiliate energy, other, and capacity revenues reflect revenues on transactions between wholesale and retail affiliates, excluding affiliate activity related to leases and derivative instruments. All such activity supports retail supply needs from the wholesale business and/or allows for collateral margin netting efficiencies at Calpine. |
| (2) | Revenues relating to contracts accounted for as leases and derivatives include energy and capacity revenues relating to PPAs which must be accounted for as operating leases and physical and financial commodity derivative contracts, primarily relating to power, natural gas, and environmental products. Lease revenues were not material for the years ended December 31, 2024, 2023 and 2022, as further discussed in Note 4, Leases. Revenue related to derivative instruments includes revenue recorded in Commodity revenue and mark-to-market gain (loss) within operating revenues on the Consolidated Statements of Operations. |
Energy and Other Products
Variable payments for power and steam that are based on generation, including retail sales of power, are recognized over time as the underlying commodity is generated or purchased and control is transferred to the customer upon transmission and delivery. Ancillary service revenues are also included within energy related revenues and are recognized over time as the service is provided.
For power, steam and ancillary service contracts we have elected the practical expedient which allows us to recognize revenue at the amount which we are entitled to invoice to the extent we determine such amounts correspond directly with the value provided to date. To the extent this practical expedient cannot be used, revenue is recognized over time, based on the quantity of the commodity delivered to the customer for power and steam sales, and as the service is provided for ancillary service sales.
Energy and other revenues also include revenues generated from the sale of natural gas and environmental products, including RECs, and are recognized at either a point-in-time or over time when control of the commodity has transferred. Revenues from the sale of RECs are primarily related to credits that are generated upon generation of renewable power from the Geysers Assets and are recognized over the same period of time as the timing of the related energy sale. Revenues from sales of RECs or other environmental products that are generated by third parties are recognized once all certifications have been completed and the credits are delivered to the customer at a point in time. Revenues from natural gas sales are recognized at a point in time when delivery of the natural gas is provided. Revenues from natural gas and emission product sales are generally at the contracted transaction price, which may be fixed or index-based.
Capacity
Capacity revenues include fixed and variable capacity payments, which are based on generation volumes and include capacity payments received from RTO and ISO capacity auctions as well as contractual capacity under long-term PPAs. For these contracts, we have elected the practical expedient which allows us to recognize revenue equivalent to the amount invoiced. To the extent this practical expedient cannot be used, we recognize revenue over time as the service is provided to the customer.
94
Performance Obligations and Contract Balances
The Company's contracts may have multiple performance obligations. The revenues associated with each individual performance obligation are based on the relative stand-alone sales price of each good or service or, when not available, is based on a cost incurred plus margin approach. For a significant portion of these contracts with multiple performance obligations, management has applied the practical expedient that results in recognition of revenue commensurate with the invoiced amount and no allocation is required as all performance obligations are transferred over the same period.
The Company's contracts may also include volumetric optionality based on customer needs. The transaction price within these contracts is based on a stand-alone sale price of the good or service being provided and revenue is recognized based on customer usage. On a monthly basis, revenue is recognized based on estimated or actual usage by the customer at the transaction price. To the extent estimated usage is used in the recognition of revenue, revenues are adjusted for actual usage once known; however, this adjustment is not material to the revenues recognized. Generally, we apply the practical expedient that allows us to recognize revenue based on the invoiced amount.
Changes in contract estimates are not material and revisions to estimates are recognized when the amounts can be reasonably estimated. Unbilled retail sales are based upon estimates of customer usage since the date of the last meter reading provided by the ISOs or electric distribution companies by applying the estimated revenue per Kilowatt hour (“KWh”) by customer class to the estimated number of KWh delivered but not yet billed. Estimated amounts are adjusted when actual usage is known and billed. During the years ended December 31, 2024, 2023 and 2022, there were no significant changes to revenue amounts recognized in prior periods resulting from a change in estimates. Sales and other taxes collected concurrent with revenue-producing activities are excluded from operating revenues.
Billing requirements for wholesale customers generally result in billing customers on a monthly basis in the month following the delivery of the good or service. Once billed, payment is generally required within 20 days resulting in payment for the delivery of the good or service in the month following delivery of the good or service. Billing requirements for our retail customers are generally once every 30 days and may result in billed amounts relating to retail customers extending up to 60 days. Based on the terms of customer agreements, payment is generally received at or shortly after good or service delivery.
Changes in customer accounts receivable are primarily due to the timing difference between payment and when the goods or services are provided. As of December 31, 2024 and 2023 there were no significant changes in accounts receivable other than normal billing and collections, and there were no material credit or impairment losses recognized related to customer accounts receivable balances. As such, the unbilled accounts receivable balance for all revenue streams totaled $891 million and $865 million, as of December 31, 2024 and 2023, respectively, and is included within accounts receivable, net on the Consolidated Balance Sheets.
When consideration from a customer is received prior to transferring goods or services to the customer it is recorded as deferred revenue, which represents a contract liability. Such deferred revenue typically results from consideration received prior to the transfer of goods and services relating to our capacity contracts and the sale of RECs that are not generated from power plants. Based on the nature of these contracts and the timing between when consideration is received and delivery of the good or service is provided, these contracts do not contain any material financing elements.
As of December 31, 2024, the deferred revenue balance related to contracts with customers primarily relates to environmental products and capacity sales, and are included in other current liabilities on the Consolidated Balance Sheets. The balance outstanding as of December 31, 2024 and 2023 was $112 million and $66 million, respectively. Revenue recognized during the years ended December 31, 2024, 2023 and 2022, relating to the deferred revenue balance at the beginning of the period, was $61 million, $57 million and $58 million, respectively, and resulted from performance under our customer contracts. The change in the deferred revenue balance as of December 31, 2024 and 2023 was primarily due to the timing difference of when consideration was received and when the related good or service was transferred.
Contract Costs
For certain retail contracts, third-party incremental broker costs are incurred and are capitalized on the Consolidated Balance Sheets. Capitalized contract costs are amortized on a straight-line basis over the term of the underlying sales contract to the extent the term extends beyond one year. Contract costs associated with sales contracts that are less than one year are expensed as incurred under a practical expedient.
As of December 31, 2024 and 2023, respectively, the capitalized contract cost balance was not material. There were no impairment losses or changes in amortization during the years ended December 31, 2024, 2023 and 2022, and amortization of contract costs during these periods was immaterial.
95
Performance Obligations not yet Satisfied
As of December 31, 2024, the Company has entered into certain contracts for fixed and determinable amounts with customers under which performance obligations have not been completed, which primarily includes agreements for which we are providing capacity from our generating facilities. These revenues are related to the sale of capacity through participation in various ISO capacity auctions estimated based upon cleared volumes and the sale of capacity to customers of $469 million, $424 million, $374 million, $281 million and $226 million, that will be recognized during the years ending December 31, 2025, 2026, 2027, 2028 and 2029, respectively, and $487 million thereafter. Revenues under these contracts will be recognized as control of the commodities is transferred to customers.
4. Leases
Accounting for Leases – Lessee
Contracts are evaluated for lease accounting at contract inception and lease classification is assessed at the lease commencement date. A right-of-use asset is recognized for leases and corresponding lease obligation liability at the lease commencement date where the lease obligation liability is measured at the present value of the minimum lease payments. For operating leases, the right-of-use asset amortization and the accretion of lease obligation liability results in a single straight-line expense recognized over the lease term.
The discount rate determined is associated with operating and finance leases using the Company’s incremental borrowing rate at lease commencement. For operating leases, an interest rate is used which is commensurate with the interest rate to borrow on a collateralized basis over a similar term with an amount equal to the lease payments. Factors management considered in the calculation of the discount rate include, the amount of the borrowing, the lease term, including options that are reasonably certain of exercise, the current interest rate environment and the credit rating of the entity. For finance leases, the interest rate used is commensurate with the interest rate for a project finance borrowing arrangement with similar collateral package, repayment terms, restrictive covenants and guarantees.
The Company’s operating leases are primarily related to office space for corporate and regional offices, as well as land and operating-related leases for power plants which contain renewal options to extend the lease term. The inclusion of these lease term renewal periods in the minimum lease payments is dependent on specific facts and circumstances for each lease and whether it is determined to be reasonably certain that the extension option will be exercised. Operating leases do not contain any material restrictive covenants or residual value guarantees. As lessee, lease and non-lease components are not separated for current classes of underlying leased assets.
The Company has entered into finance lease agreements for certain power plants and related equipment with original terms that range up to 30 years (including lease renewal options). Finance leases require the lessee to pay taxes, maintenance, insurance, and other operating costs for the leased property.
The Company has made an accounting policy election to not recognize lease assets and liabilities for leases with a term of 12 months or less, which are immaterial. There are not material subleases associated with these operating and finance leases.
96
The operating and finance lease expense components are as follows for the periods presented (in millions):
| Year Ended December 31, | ||||||||||||
| 2024 | 2023 | 2022 | ||||||||||
| Operating leases | ||||||||||||
| Operating lease expense(1) | $ | 19 | $ | 19 | $ | 21 | ||||||
| Finance leases | ||||||||||||
| Depreciation of property, plant and equipment | 4 | 4 | 7 | |||||||||
| Interest expense | 2 | 3 | 5 | |||||||||
| Finance lease expense | $ | 6 | $ | 7 | $ | 12 | ||||||
| Variable lease expense(2) | 3 | 6 | 10 | |||||||||
| Total lease expense | $ | 28 | $ | 32 | $ | 43 | ||||||
| (1) | Operating lease expense is recognized within operating and maintenance expense or general and other administrative expenses based upon the lease arrangement. |
| (2) | Variable lease expense relates to operating leases where common area maintenance and similar variable charges are incurred. |
The following is a schedule by year of future minimum lease payments associated with our operating and finance leases, together with the present value of the net minimum lease payments as of December 31, 2024 (in millions):
| Operating Leases(1) | Finance Leases(2) | ||||||||
| 2025 | $ | 17 | $ | 7 | |||||
| 2026 | 16 | 6 | |||||||
| 2027 | 15 | 6 | |||||||
| 2028 | 15 | 6 | |||||||
| 2029 | 15 | — | |||||||
| Thereafter | 155 | — | |||||||
| Total minimum lease payments | 233 | 25 | |||||||
| Less: Amount representing interest(3) | (79 | ) | (4 | ) | |||||
| Total lease obligation | 154 | 21 | |||||||
| Less: current lease obligation | (9 | ) | (5 | ) | |||||
| Long-term lease obligation | $ | 145 | $ | 16 | |||||
| (1) | The lease liabilities associated with operating leases are included in other current liabilities and other long-term liabilities on the Consolidated Balance Sheets. |
| (2) | The lease liabilities associated with finance leases are included in debt, current portion and debt, net of current portion on our Consolidated Balance Sheets. |
| (3) | The amount representing interest is recorded in operating lease expense for operating leases and interest expense for our finance leases on the Consolidated Statements of Operations. |
97
Supplemental balance sheet information related to operating and finance leases is as follows (in millions, except lease term and discount rate):
| December 31, | ||||||||
| 2024 | 2023 | |||||||
| Operating leases(1) | ||||||||
| Right-of-use assets associated with operating leases | $ | 140 | $ | 146 | ||||
| Finance leases(2) | ||||||||
| Property, plant and equipment, gross | 104 | 99 | ||||||
| Accumulated amortization | (43 | ) | (45 | ) | ||||
| Property, plant and equipment, net | $ | 61 | $ | 54 | ||||
| Weighted average remaining lease term (in years) | ||||||||
| Operating leases | 15.7 | 15.2 | ||||||
| Finance leases | 3.8 | 4.7 | ||||||
| Weighted average discount rate | ||||||||
| Operating leases | 5.4 | % | 5.3 | % | ||||
| Finance leases | 8.2 | % | 8.1 | % | ||||
| (1) | The right-of-use assets associated with operating leases are included in other assets on the Consolidated Balance Sheets. |
| (2) | The right-of-use assets associated with finance leases are included in property, plant and equipment, net on the Consolidated Balance Sheets. |
Supplemental cash flow information related to operating and finance leases is as follows for the periods presented (in millions):
| Year Ended December 31, | ||||||||||
| 2024 | 2023 | 2022 | ||||||||
| Cash paid for amounts included in the measurement of lease liabilities | ||||||||||
| Operating cash flows from operating leases | $ | 19 | $ | 25 | $ | 32 | ||||
| Operating cash flows from finance leases | $ | 3 | $ | 3 | $ | 4 | ||||
| Financing cash flows from finance leases | $ | 6 | $ | 16 | $ | 12 | ||||
| Right-of-use assets obtained in exchange for lease obligations | ||||||||||
| Operating leases | $ | 5 | $ | 19 | $ | 3 | ||||
| Finance leases | $ | — | $ | — | $ | — | ||||
Accounting for Leases – Lessor
The Company applies lease accounting to PPAs that meet the definition of a lease and determines lease classification treatment at agreement commencement. Currently, there are no contracts which are accounted for as sales-type leases or direct financing leases and all leases in which the Company is the lessor are classified as operating leases.
Revenue from contracts accounted for as operating leases, such as certain tolling agreements, with minimum lease rentals (capacity payments), which vary over time, must be levelized. These contract revenues are levelized on a straight-line basis over the term of the contract. Operating leases that have commenced contain terms extending through May 2042. These contracts also contain variable payment components based on volumes or operating efficiency. Revenues associated with the variable payments are recognized over time as the goods or services are provided to the lessee. These operating leases generally do not contain renewal or purchase options or residual value guarantees. The Company has elected not to separate lease and non-lease components as the lease components reflect the predominant characteristics of these agreements.
98
Revenue recognized related to fixed lease payments on operating leases for the periods presented is as follows (in millions):
| Year Ended December 31, | ||||||||||||
| 2024 | 2023 | 2022 | ||||||||||
| Operating leases(1) | ||||||||||||
| Fixed lease payments | $ | 153 | $ | 196 | $ | 197 | ||||||
| (1) | Revenues associated with operating leases are included in Commodity revenue and other revenue on the Consolidated Statements of Operations. |
The total contractual future minimum lease rentals for contracts that have commenced and are accounted for as operating leases at December 31, 2024, are as follows (in millions):
| 2025 | $ | 206 | |||
| 2026 | 198 | ||||
| 2027 | 163 | ||||
| 2028 | 158 | ||||
| 2029 | 153 | ||||
| Thereafter | 1,151 | ||||
| Total | $ | 2,029 |
Lease receivables associated with operating leases are not recognized as the long-lived assets subject to the lease contracts are recorded on the Consolidated Balance Sheets and are being depreciated over their estimated useful lives. Amounts recorded on the Consolidated Balance Sheets associated with the long-lived assets subject to our operating leases are as follows (in millions):
| December 31, | ||||||||
| 2024 | 2023 | |||||||
| Assets subject to contracts accounted for as operating leases | ||||||||
| Property, plant and equipment, gross | $ | 1,303 | $ | 688 | ||||
| Accumulated depreciation | (346 | ) | (314 | ) | ||||
| Property, plant and equipment, net(1)(2) | $ | 957 | $ | 374 | ||||
| (1) | Assets are subject to contracts that are accounted for as operating leases, which primarily consist of power plants and are subject to tolling contracts. |
| (2) | The increase in Property, plant and equipment, net is primarily attributable to the commercial operations of new battery facilities during the year ended December 31, 2024. |
Lease levelization assets and liabilities are recorded for any difference between the timing of the contractual payments made related to operating lease contracts and revenue recognized on a straight-line basis. These balances are included in current and long-term assets and liabilities on the Consolidated Balance Sheets.
5. Acquisitions and LLC Agreement
Quail Run Energy Partners, LP
On September 17, 2024, Calpine, through its wholly-owned subsidiary, completed the purchase of Quail Run Energy Centre, a 550 Megawatt (“MW”) natural gas-fired, combined cycle generation facility located in Odessa, Texas, and included within the Texas segment. The purchase price, as specified in the purchase and sale agreement, including working capital and other adjustments, was $334 million. The acquisition was funded through cash on hand and proceeds from the September 2024 refinancing of the CCFC Term Loan. The purchase price was primarily allocated to property, plant and equipment, net of the fair value of associated out of-the-money Heat Rate call options.
99
Greenfield Energy Centre L.P.
Prior to September 5, 2023, Calpine, through its subsidiaries, held a 50% equity interest in Greenfield L.P., a limited partnership with the remaining 50% interest held by subsidiaries of Mitsui & Co., Ltd. Greenfield L.P. operates Greenfield Energy Centre, a 1,038 MW natural gas-fired, combined cycle power plant located in Ontario, Canada. On September 5, 2023, the Company, through its wholly-owned subsidiary, Calpine Canada Energy LTD., completed the acquisition of Mitsui and Co., Ltd.’s 50% ownership interest of Greenfield L.P. for approximately $103 million CAD ($76 million USD). The purchase is accounted for as a business combination achieved in stages, as we previously owned 50% of the equity interest of Greenfield L.P. and accounted for the investment under the equity method of accounting. An immaterial net loss was recognized on the acquisition as a result of the recognition of the newly acquired equity interest at fair value offset by the write-off of the legacy investment and related balances. Subsequent to the acquisition, Greenfield L.P. became the Company's wholly-owned subsidiary and is accounted for as a consolidated subsidiary, with its balances and operating results included in our Consolidated Financial Statements.
Gregory Power Holdings, LLC Agreement
On December 29, 2023, the Company entered into an investment agreement with Gregory Power Holdings, LLC through the execution of an amended and restated Limited Liability Company Agreement (“LLC Agreement”) for Gregory Power Holdings, LLC. Gregory Power Holdings, LLC, through its wholly owned subsidiary, owns and operates a 385 MW combined cycle generation facility located in Texas. Under the terms of the LLC Agreement, the Company has obtained a 33% non-economic (for certain voting rights) and a 28.5% economic interest in Gregory Power Holdings, LLC, with an obligation to fund future cash contributions to Gregory Power Holdings, LLC until such a time as the Company's economic investment interest reaches 45% ownership in the entity. After such time, future contributions will be made by the Company and its partner in accordance with the respective ownership interests and the terms of the LLC Agreement. See Note 7, Variable Interest Entities and Unconsolidated Investments, for further discussion.
6. Property, Plant and Equipment, Net
The components of property plant and equipment are stated at cost less accumulated depreciation as follows (in millions):
| December 31, | |||||||||||
| 2024 | 2023 | Depreciable Lives | |||||||||
| Buildings, machinery and equipment | $ | 17,921 | $ | 16,675 | 1.5 – 35 Years | ||||||
| Geothermal properties | 1,811 | 1,792 | 13 – 58 Years | ||||||||
| Other | 407 | 357 | 3 – 35 Years | ||||||||
| 20,139 | 18,824 | ||||||||||
| Less: Accumulated depreciation | (8,237 | ) | (7,841 | ) | |||||||
| 11,902 | 10,983 | ||||||||||
| Land | 115 | 115 | |||||||||
| Construction in progress | 562 | 779 | |||||||||
| Property, plant and equipment, net(1) | $ | 12,579 | $ | 11,877 | |||||||
| (1) | Calpine, through its wholly-owned subsidiary, completed the acquisition of the remaining 50% equity interest of Greenfield L.P. on September 5, 2023, as further discussed in Note 5, Acquisitions and LLC Agreement. As of the date of acquisition, property, plant, and equipment, net at Greenfield L.P. totaled $320 million and consisted primarily of buildings, machinery, property, plant and equipment net at Greenfield LP related to the combined cycle generation facility. The carrying value of the long-lived assets is depreciated based on our depreciable lives. |
Total depreciation expense, including amortization of finance lease assets, recorded for the years ended December 31, 2024, 2023 and 2022, was $727 million, $697 million and $661 million, respectively.
The Company has various debt instruments which are collateralized by its property, plant and equipment. See Note 8, Debt for a discussion of such instruments.
100
Buildings, Machinery and Equipment
This component primarily includes power plants and related equipment. Included in buildings, machinery and equipment are assets under finance leases. See Note 4, Leases for further information regarding these assets under finance leases.
Geothermal Properties
This component primarily includes power plants and related equipment associated with our Geysers Assets.
Other
This component primarily includes software and hardware as well as emission reduction credits that are power plant specific and not available to be sold.
Capitalized Interest
The total amount of interest capitalized was $43 million, $27 million and $3 million for the years ended December 31, 2024, 2023 and 2022, respectively.
7. Variable Interest Entities and Unconsolidated Investments
The Company consolidates all of its VIEs where it has been determined that the Company is the primary beneficiary. Except for the changes discussed below, there were no changes to the determination of whether the Company is the primary beneficiary of these VIEs for the year ended December 31, 2024. As discussed in Note 5, Acquisitions and LLC Agreement, the acquisition of the remaining 50% interest in Greenfield L.P. was completed on September 5, 2023, and the Company owns 100% of the equity interest of Greenfield L.P. through its wholly-owned subsidiaries. It was determined that the Company is the primary beneficiary of Greenfield L.P. and has consolidated the results of the partnership in the Consolidated Financial Statements, effective September 5, 2023. See Note 5, Acquisitions and LLC Agreement, for further information regarding the acquisition of Greenfield L.P.
On December 21, 2023, the Company, through its wholly-owned subsidiary, Nova Power, LLC ("Nova Power"), entered into a credit agreement with more than $1 billion in total capacity to finance a portion of the costs of the development, construction, and operation of the Nova Power Battery Storage Facilities. The Company has determined that Nova Power, LLC meets the criteria of a VIE. Calpine is the primary beneficiary of Nova Power and will continue to consolidate its results in the Consolidated Financial Statements. See Note 8, Debt, for further information regarding the Nova Power credit facilities.
The following types of VIEs are consolidated in the Consolidated Financial Statements:
Subsidiaries with Project Debt — All subsidiaries with project debt not guaranteed by Calpine have PPAs that provide financial support and are thus considered VIEs. The Company retains ownership and absorbs the full risk of loss and potential for reward once the project debt is paid in full. Actions by the lender to assume control of collateral can occur only under limited circumstances such as upon the occurrence of an event of default. See Note 8, Debt, for further information regarding project debt and Note 2, Summary of Significant Accounting Policies, for information regarding restricted cash balances.
Subsidiaries with PPAs — The Company's majority-owned subsidiaries have PPAs that limit the risk and reward of its' ownership and thus constitute a VIE.
Consolidation of VIEs
VIEs are consolidated when it is determined that the Company has both the power to direct the activities of a VIE that most significantly affect the VIE’s economic performance and the obligation to absorb losses or receive benefits from the VIE. It was determined that the Company has the obligation to absorb losses and receive benefits in almost all of its VIEs where majority equity interest is held. Therefore, the determination of whether to consolidate is based upon which variable interest holder has the power to direct the most significant activities of the VIE (the primary beneficiary). This analysis includes consideration of the following primary activities that have a significant effect on a power plant’s financial performance: operations and maintenance, plant dispatch and fuel strategy, as well as the ability to control or influence contracting and overall plant strategy. The approach to determining which entity holds the powers and rights is based on powers held as of the balance sheet date. Contractual terms that may change the powers held in future periods, such as a purchase or sale option, are not considered in this analysis. Based on the analysis, the Company holds the power and rights to direct the most significant activities for most majority-owned VIEs.
101
Under the consolidation policy and under U.S. GAAP, the Company also:
| · | performs an ongoing reassessment each reporting period of whether it is the primary beneficiary of the VIEs and | |
| · | evaluate if an entity is a VIE and whether we are the primary beneficiary whenever any changes in facts and circumstances occur, such as contractual changes where the holders of the equity investment at risk, as a group, lose the power from voting rights or similar rights of those investments to direct the activities of a VIE that most significantly affect the VIE’s economic performance or when there are other changes in the powers held by individual variable interest holders. |
VIE Disclosures
The Company's consolidated VIEs include natural gas-fired and geothermal power plants and battery storage facilities with an aggregate capacity of 8,365 MW and 7,090 MW, in operation at December 31, 2024 and 2023, respectively. For these VIEs, other operational and administrative support may be provided through various affiliate contractual arrangements among the VIEs, Calpine Corporation, and its other wholly owned subsidiaries, whereby the VIE is supported through the reimbursement of costs and/or the purchase and sale of energy. Other than amounts contractually required, no additional material support was provided to the VIEs in the form of cash and other contributions during each of the years ended December 31, 2024 and 2023.
U.S. GAAP requires separate disclosure on the face of the Consolidated Balance Sheets of the significant assets of a consolidated VIE that can be used only to settle obligations of the consolidated VIE and the significant liabilities of a consolidated VIE for which creditors (or beneficial interest holders) do not have recourse to the general credit of the primary beneficiary. In determining which VIE assets VIEs meet the separate disclosure criteria, the Company considered that this separate disclosure requirement is met where Calpine Corporation is substantially limited or prohibited from access to assets (including cash and cash equivalents, restricted cash and property, plant and equipment), and where its VIEs have project financing that prohibits the VIE from providing guarantees on the debt of others. In determining which VIE liabilities meet the separate disclosure criteria, the Company considered that this separate disclosure requirement is met where there are agreements that prohibit the debt holders of the VIEs from recourse to the general credit of Calpine Corporation.
Unconsolidated VIEs and Investments in Unconsolidated Subsidiaries
Prior to the acquisition of Greenfield L.P. on September 5, 2023, the Company held a 50% partnership interest in Greenfield L.P., which was a VIE; however, the Company did not have the power to direct the most significant activities of this entity, and therefore did not consolidate it. As discussed above, the Company consolidated its investment in Greenfield L.P. subsequent to the acquisition of the remaining 50% equity interest in the partnership as the Company is the primary beneficiary of Greenfield L.P.
Calpine Receivables is a VIE and a bankruptcy remote entity created for the special purpose of purchasing trade accounts receivable from Calpine Energy Solutions, LLC ("Calpine Solutions") under the Accounts Receivable Sales Program. The Company determined that it does not have the power to direct the activities of the VIE that most significantly affect the VIE’s economic performance, nor the obligation to absorb losses or receive benefits from the VIE. Accordingly, it was determined that the Company is not the primary beneficiary of Calpine Receivables because it does not have the power to affect its financial performance as the unaffiliated financial institutions that purchase the receivables from Calpine Receivables control the selection criteria of the receivables sold and appoint the servicer of the receivables which controls the management of default. Thus, the Company does not consolidate Calpine Receivables in its Consolidated Financial Statements and use the equity method of accounting to record our net interest in Calpine Receivables.
As of December 31, 2024, the Company has a 33% non-economic (for certain voting rights) and 28.5% economic interest in Gregory Power Holdings, LLC, with an obligation to fund future cash contributions to Gregory Power Holdings, LLC until such time as its economic investment reaches 45% ownership in the entity. The Company made cash contributions of $44 million and nil in the investment in the years ended December 31, 2024 and 2023, respectively. Its net interest in Gregory Power Holdings, LLC is accounted for as an equity method investment at December 31, 2024. See Note 5, Acquisitions and LLC Agreement, for further details of the investment in Gregory Power Holdings, LLC, which has no outstanding debt. It was determined that the Company should not consolidate this investment, and it does not exert significant influence over it.
102
For the period that these entities meet the criteria of an unconsolidated investment, it accounts for them under the equity method of accounting and includes its net equity interest in investments in unconsolidated subsidiaries on the Consolidated Balance Sheets. The Company's investments included on the Consolidated Balance Sheets were comprised of the following (in millions):
| December 31, | ||||||||
| 2024 | 2023 | |||||||
| Calpine Receivables(1) | 25 | 14 | ||||||
| Gregory Power Holdings, LLC(2) | 44 | — | ||||||
| Total investment in unconsolidated subsidiaries under the equity method of accounting(3) | $ | 69 | $ | 14 | ||||
| (1) | The Company's ownership interest as of December 31, 2024 and 2023 was 100%. Its investment in Calpine Receivables is accounted for using the equity method of accounting. |
| (2) | The Company's ownership interest as of December 31, 2024 was 28.5%. Its investment in Gregory Power Holdings, LLC is accounted for using the equity method of accounting. |
| (3) | In addition to its investment in the table above, the Company also held a cost investment of $7 million and $7 million related to an additional entity as of December 31, 2024 and 2023, respectively. |
The Company's risk of loss related to its investment in Calpine Receivables is $100 million and $79 million as of December 31, 2024 and 2023, respectively, which consists of any notes receivable from Calpine Receivables and its investment associated with Calpine Receivables. The Company has $45 million and $30 million as of December 31, 2024 and 2023, respectively, of related party debt outstanding with Calpine Receivables offset against its investment in the entity. See Note 17, Related Party Transactions, for further information associated with related party activity with Calpine Receivables.
Holders of the debt of the Company's unconsolidated investments do not have recourse to Calpine Corporation and its other subsidiaries; therefore, the debt of unconsolidated investments is not reflected on the Consolidated Balance Sheets.
Our equity interest in the net income/loss from our investments in unconsolidated subsidiaries is recorded in (income) loss from unconsolidated subsidiaries. The following table sets forth details of our (income) loss from unconsolidated subsidiaries for the years indicated (in millions):
| (Income) loss from Unconsolidated Subsidiaries | Distributions | |||||||||||||||||||||||
| Year Ended December 31, | Year Ended December 31, | |||||||||||||||||||||||
| 2024 | 2023 | 2022 | 2024 | 2023 | 2022 | |||||||||||||||||||
| Greenfield L.P.(1) | $ | — | $ | (12 | ) | $ | 18 | $ | — | $ | — | $ | — | |||||||||||
| Calpine Receivables | 4 | 9 | 2 | — | — | — | ||||||||||||||||||
| Gregory Power Holdings, LLC | — | — | — | — | — | — | ||||||||||||||||||
| Total | $ | 4 | $ | (3 | ) | $ | 20 | $ | — | $ | — | $ | — | |||||||||||
| (1) | The (income) loss from unconsolidated investments and distributions from Greenfield L.P. only include the results of the Company's investment in Greenfield L.P. through September 5, 2023. Subsequent to the acquisition of the remaining 50% equity interest in Greenfield L.P., all of the results of operations of the partnership are included within the consolidated results in the Consolidated Statements of Operations. See Note 5, Acquisitions and LLC Agreement, for further details of the acquisition. |
103
| 8. | Debt |
The Company's debt is summarized in the table below (in millions):
| December 31, | ||||||||
| 2024 | 2023 | |||||||
| Revolving facilities | $ | 148 | $ | 301 | ||||
| First Lien Term Loans | 2,484 | 2,301 | ||||||
| CCFC Term Loan | 1,864 | 1,231 | ||||||
| GPC Term Loan | 1,486 | 1,542 | ||||||
| Construction loan facilities, project financing, notes payable and other | 997 | 993 | ||||||
| Senior Unsecured Notes | 2,886 | 2,882 | ||||||
| First Lien Notes | 2,276 | 2,552 | ||||||
| Finance lease obligations | 21 | 27 | ||||||
| Subtotal | 12,162 | 11,829 | ||||||
| Less: Current maturities | (355 | ) | (613 | ) | ||||
| Total long-term debt | $ | 11,807 | $ | 11,216 | ||||
The Company's debt agreements contain covenants that could permit lenders to accelerate the repayment of its debt by providing notice, the lapse of time or both, if certain events of default remain uncured after any applicable grace period. The Company was in compliance with all of the covenants in its debt agreements as of December 31, 2024. The Company's effective interest rate on the consolidated debt, including the cash settlement contribution of interest rate hedging instruments, was 4.9% as of December 31, 2024. The effective interest rate excludes the impacts of capitalized interest and unrealized mark-to-market gains and losses on interest rate derivative instruments.
Annual Debt Maturities
Contractual annual principal repayments or maturities of debt instruments as of December 31, 2024, are as follows (in millions):
| 2025 | $ | 355 | ||
| 2026 | 242 | |||
| 2027 | 224 | |||
| 2028 | 2,862 | |||
| 2029 | 1,746 | |||
| Thereafter | 6,841 | |||
| Subtotal | 12,270 | |||
| Less: Debt issuance costs | (86 | ) | ||
| Less: Discount | (22 | ) | ||
| Total debt | $ | 12,162 |
104
Revolving Facilities
Revolving facilities are summarized in the table below (in millions, except for interest rates):
| Outstanding at | Weighted Average | |||||||||||||||
| December 31, | Effective Interest Rates(1) | |||||||||||||||
| 2024 | 2023 | 2024 | 2023 | |||||||||||||
| Corporate Revolving Facility | $ | — | $ | — | 4.8 | % | 7.7 | % | ||||||||
| CDHI Credit Agreement | 148 | 189 | 4.6 | % | 7.3 | % | ||||||||||
| Commodity-linked Revolver Facility | — | 100 | — | % | 6.3 | % | ||||||||||
| Geysers(2) | — | 12 | 6.7 | % | 7.0 | % | ||||||||||
| Total | $ | 148 | $ | 301 | ||||||||||||
| (1) | The weighted average interest rate calculation for revolving facilities does not include the amortization of debt issuance costs and the cash settlement contribution of interest rate hedging instruments, as applicable. | |
| (2) | During the year ended December 31, 2024 and 2023, GPC drew approximately $38 million and $12 million, respectively, revolving loans on the Geysers Credit Agreementassociated with the Bear Canyon and West Ford Flat battery storage projects. In August 2024, the entire $50 million revolving loan was converted to a term loan following the commercial operations of Bear Canyon and West Ford Flat. |
The table below represents amounts issued under letter of credit facilities (in millions):
| December 31, | ||||||||
| 2024 | 2023 | |||||||
| Corporate Revolving Facility | $ | 273 | $ | 476 | ||||
| CDHI Credit Agreement | 640 | 590 | ||||||
| Project financing facilities(1)(2) | 290 | 246 | ||||||
| Other corporate facilities | 849 | 739 | ||||||
| Total | $ | 2,052 | $ | 2,051 | ||||
| (1) | The letters of credit issued within project financing facilities include the GPC, Greenfield and Nova Power credit facilities. As of December 31, 2024, the Greenfield Term Loan Facility issued $57 million CAD ($39 million USD), respectively, in letters of credit used to support the partnership’s operations and debt obligations. Refer to Construction Loan Facilities, Project Financing, Notes Payable and Other for further details. | |
| (2) | As of December 31, 2024, no letters of credit were issued under the Nova Power credit facilities. Refer to Construction Loan Facilities, Project Financing, Notes Payable and Other for further details. |
Corporate Revolving Facility
On January 14, 2022, the Company amended its Corporate Revolving Facility, originally dated December 10, 2010, to increase the capacity from approximately $2.2 billion to $2.5 billion and extended the maturity date from December 16, 2025, to January 14, 2027, with additional options to extend. On January 31, 2024, the maturity was further extended on $2.225 billion of the facility to January 2029, while the remaining $275 million retained the original January 2027 maturity date.
In December 2024, the Company amended the Corporate Revolving Credit Agreement to replace the existing schedule of revolving commitment amounts with a new schedule. This converted a $175 million Class D Revolving Commitment into a Class E Revolving Commitment, which extended its expiration date to match the Class E Original Termination Date of January 31, 2029. Now, $2.4 billion of Class E commitments expire January 2029, while only a $100 million commitment remains as Class D, with termination date of January 2027.
The Corporate Revolving Facility represents the Company's primary revolving facility. Borrowings under the Corporate Revolving Facility bear interest, optionally, at either a base rate or SOFR. Base rate borrowings shall be at the base rate plus an applicable margin of 1.00% or 1.25% as provided in the Corporate Revolving Facility credit agreement. Base rate is defined as the highest of (1) the Federal Funds Rate, as published by the Federal Reserve Bank of New York, plus 0.50%, (2) the rate the administrative agent announces from time to time as its prime per annum rate and (3) the Adjusted Term SOFR for a one-month tenor plus 1.00%. SOFR borrowings shall be at the applicable rate published by the Federal Reserve Bank of New York for the interest period as selected by us as one, three, or six months, plus an applicable margin of 2.00% or 2.25%. An unused commitment fee is incurred ranging from 0.25% to 0.50% on the unused amount of commitments under the Corporate Revolving Facility.
105
The Corporate Revolving Facility does not contain any requirements for mandatory prepayments. However, the Company may voluntarily repay, in whole or in part, the Corporate Revolving Facility, together with any accrued but unpaid interest, with prior notice and without premium or penalty. Amounts repaid may be re-borrowed, and we may also voluntarily reduce the commitments under the Corporate Revolving Facility without premium or penalty.
The Corporate Revolving Facility is guaranteed and secured by certain current domestic subsidiaries and will also be additionally guaranteed by future domestic subsidiaries that are required to provide such a guarantee in accordance with the terms of the Corporate Revolving Facility. The Corporate Revolving Facility ranks equally in right of payment with all of the Company and the guarantors’ other existing and future senior indebtedness and will be effectively subordinated in right of payment to all existing and future liabilities of our subsidiaries that do not guarantee the Corporate Revolving Facility. The Corporate Revolving Facility also requires compliance with financial covenants that include a minimum cash interest coverage ratio and a maximum net leverage ratio.
CDHI Credit Agreement
On March 29, 2023, the Company amended its CDHI Credit Agreement upsizing the available capacity from $700 million to approximately $1.2 billion and extending the maturity date to March 29, 2028. The facility can be used for general corporate purposes with a limit up to $400 million for construction loans that meet specified criteria. At December 31, 2024, we had $148 million in borrowing outstanding under the facility.
Borrowings bear interest optionally at either a base rate or SOFR. Base rate borrowings shall be at the base rate plus an applicable margin of 1.00%. Base rate is defined as the highest of (a) the rate the administrative agent announces from time to time as its prime per annum rate, (b) the Federal Funds Effective Rate, as published by the Federal Reserve Bank of New York, plus 0.50% or (c) the Term SOFR in effect for a one-month period then in effect plus 1.00%. SOFR borrowings shall be at the Term SOFR Reference Rate for the tenor compared to the applicable interest period plus an applicable margin ranging from 2.25% to 2.375%. The applicable margin relating to a specific loan is dependent on the nature of the loan and when the loan agreement was entered. An unused commitment fee of 0.50% is incurred on the unused amount of commitments under the facility.
Borrowings under the CDHI Credit Agreement are required to be repaid over time prior to the maturity date, depending on the nature of the loan. However, the Company may voluntarily repay, in whole or in part, the outstanding borrowings, together with any accrued but unpaid interest, with prior notice and without premium or penalty. Amounts repaid may be re-borrowed, and the Company may also voluntarily reduce the commitments without premium or penalty.
The CDHI Credit Agreement is guaranteed and secured by the assets of certain of domestic subsidiaries in accordance with the terms of the agreement. The credit agreement provides for certain requirements to be met for distributions to be made from the subsidiaries guaranteeing the credit agreement to Calpine Corporation including meeting certain financial covenant requirements such as a leverage ratio.
Commodity-linked Revolving Credit Facility
On July 21, 2022, the Company entered into a one-year Commodity-linked Revolving Credit Facility and extended the credit facility in July 2023, with a maturity date of July 19, 2024. Additionally, on July 18, 2024, the Company extended the Commodity-linked Revolver through July 18, 2025, and increased the total borrowing base limit from $1.5 billion to $1.79 billion. Borrowings from the Commodity-linked Revolver can be solely used to meet collateral posting requirements for eligible commodity hedge agreements, as defined in the agreement. Draws on the Commodity-linked Revolver are limited to the weekly mark-to-market value change of qualified natural gas and power hedge transactions, as specified in the agreement. To the extent that outstanding borrowings would exceed the limit, a repayment will be made to reduce outstanding borrowings to be less than or equal to the limit. At December 31, 2024, the Company had no borrowings outstanding under the Commodity-linked Revolver.
The loans outstanding on the Commodity-linked Revolver may bear interest, optionally, on either a base rate or SOFR rate, as specified in the agreement. Base rate borrowings shall be at the base rate plus an applicable margin of 1.00% to 1.25%, as specified in the agreement, based on the current leverage ratio. The base rate is defined as the highest of: (1) the Prime Rate, (2) the Federal Funds Rate, as published by the Federal Reserve Bank of New York, plus 0.50%, or (3) the Term SOFR for a one-month tenor plus 1.00%. SOFR borrowings shall be the applicable SOFR rate for the interest period as selected by the Company as one, three, or six months, plus an applicable margin of 2.00% or 2.25%. An applicable revolving commitment fee is incurred ranging from 0.375% to 0.625% under the facility in accordance with the agreement.
106
The Commodity-linked Revolver does not contain any requirements for mandatory prepayments outside of the requirement for the borrowings to be under the limit, as described above. However, the Company may voluntarily repay, in whole or in part, the outstanding borrowings, together with any accrued but unpaid interest, without premium or penalty. Amounts repaid can be re-borrowed during the facility's term.
The Commodity-linked Revolver is secured pari passu on substantially the same collateral and guaranteed by the same guarantors as the Corporate Revolving Facility. Borrowings under this facility are therefore guaranteed and secured by certain of our current domestic subsidiaries and will also be additionally guaranteed by future domestic subsidiaries that are required to provide such a guarantee in accordance with the terms of the agreements. The facility ranks equally in right of payment with all of the Company's and the guarantors’ other existing and future senior indebtedness and will be effectively subordinated in right of payment to all existing and future liabilities of subsidiaries that do not guarantee the facilities.
Other corporate facilities
The Company has several unsecured letters of credit facilities with third-party financial institutions totaling approximately $325 million and $292 million as of December 31, 2024 and 2023, respectively. There are also four bilateral letter of credit agreements for up to $525 million and $525 million of capacity with varying tenors as of December 31, 2024 and 2023, respectively. On January 31, 2024, the Company extended one bilateral letter of credit agreements with a notional amount of $150 million from January 2025 to January 2027.
First Lien Term Loans
First Lien Term Loans are summarized in the table below (in millions, except for interest rates):
| Outstanding at December 31, |
Weighted Average Effective Interest Rates(1) |
|||||||||||||||
| 2024 | 2023 | 2024 | 2023 | |||||||||||||
| 2032 First Lien Term Loan | $ | 851 | $ | 691 | 3.0 | % | 3.9 | % | ||||||||
| 2031 First Lien Term Loans | 1,633 | 1,610 | 3.6 | % | 3.6 | % | ||||||||||
| Total | $ | 2,484 | $ | 2,301 | ||||||||||||
| (1) | The weighted average interest rate calculation includes the amortization of debt issuance costs and debt discount, as well as the cash settlement contribution of interest rate hedging instruments. |
2032 First Lien Term Loans
On December 16, 2020, the Company entered into a $1.0 billion first lien senior secured term loan, referred to as the 2027 First Lien Term Loan, which bears interest, at the Company's option, at either (1) the Base Rate, equal to the highest of (a) the Federal Funds Effective Rate plus 0.50% per annum, (b) the Prime Rate or (c) Adjusted term SOFR for a one month tenor in effect plus 1.00% (in each case, as such terms are defined in the term loan agreement), plus an applicable margin of 1.50% per annum, or (2) Adjusted Term SOFR Rate plus an applicable margin of 2.50% per annum and matures on December 16, 2027. On January 31, 2024, the 2027 First Lien Term Loan was amended to reduce the applicable margin to 1.00% per annum for Base Rate loans and 2.00% per annum for Term SOFR Rate loans. An aggregate amount equal to 0.25% of the aggregate principal amount is payable at the end of each quarter, with the remaining balance payable on the maturity date. An upfront fee was paid in an amount equal to 1.00% of the aggregate principal amount, which is structured as an original issue discount and recorded approximately $12 million in debt issuance costs during the fourth quarter of 2020 related to the issuance of the 2027 First Lien Term Loan. The 2027 First Lien Term Loan contains substantially similar covenants, qualifications, exceptions and limitations as the First Lien Term Loans and First Lien Notes.
On August 3, 2023, the Company used the excess proceeds from the CCFC Term Loan refinancing, along with cash on hand, to pay down $275 million of the borrowings outstanding under the 2027 First Lien Term Loan, leaving a remaining outstanding principal of $691 million as of December 31, 2023. This resulted in a loss on debt extinguishment of $4 million, consisting of the write-off of unamortized debt issuance costs.
107
In December 2024, a refinancing of the 2027 First Lien Term Loans was completed, extending the maturity on the new total $860 million principal amount from December 2027 to February 2032. The refinancing reduced the applicable margin to 0.75% per annum for Base Rate loans and 1.75% per annum for Term SOFR Rate loans. The 2032 First Lien Term Loans no longer have quarterly amortizations. In addition, the Company recognized a loss on extinguishment of debt of $6 million related to the refinancing.
2031 First Lien Term Loans
On August 12, 2019 and on April 5, 2019, the Company entered into $750 million and $950 million first lien senior secured term loans, respectively, collectively, referred to as the 2026 First Lien Term Loans. On January 31, 2024, the Company refinanced the 2026 First Lien Term Loans into the 2031 First Lien Term Loans totaling $1.7 billion in principal, with the original $750 million loan refinanced to $730 million and the original $950 million loan refinanced to $925 million. The maturity was extended from the original April and August 2026 dates to January 2031.
These loans bear interest, at the Company's option, at either (1) the Base Rate, equal to the highest of (a) the Federal Funds Effective Rate plus 0.50% per annum, (b) the Prime Rate, or (c) Adjusted Term SOFR for a one-month tenor in effect plus 1.00% (in each case, as such terms are defined in the credit agreement) plus an applicable margin of 1.00% or (2) Adjusted Term SOFR plus 2.00% per annum (with a 0% floor). An aggregate amount equal to 0.25% of the aggregate principal amount is payable quarterly, with the remaining balance due at the January 2031 maturity. The Company paid an upfront fee in an amount equal to 0.50% and 1.0% of the $750 million and $950 million principal amounts, respectively, which were structured as original issue discounts. Debt issuance costs of approximately $11 million and $7 million were recorded in the third and second quarters of 2019, respectively. The 2031 First Lien Term Loans contained substantially similar covenants, qualifications, exceptions and limitations as the other First Lien Term Loans and First Lien Notes.
In December 2024, a repricing of the 2031 First Lien Term Loans was completed and consolidated into a single term loan, reducing the applicable margin to 0.75% per annum for Base Rate loans and 1.75% per annum for Term SOFR Rate loans. The 2031 First Lien Term Loans no longer have quarterly amortizations. The term remained unchanged through January 2031. In addition, the Company recognized a loss of $4.7 million, related to the repricing and consolidation.
CCFC Term Loan
The CCFC Term Loan is summarized in the table below (in millions, except for interest rates):
| Outstanding at December 31, | Weighted Average Effective Interest Rates(1) | |||||||||||||||
| 2024 | 2023 | 2024 | 2023 | |||||||||||||
| CCFC Term Loan | $ | 1,864 | $ | 1,231 | 5.2 | % | 3.9 | % | ||||||||
| (1) | The weighted average interest rate calculation includes the amortization of debt issuance costs and debt discount, as well as the cash settlement contribution of interest rate hedging instruments. |
On December 15, 2017, CCFC entered into a credit agreement providing for a $1.0 billion first-lien senior secured term loan facility. On August 2, 2023, CCFC amended the CCFC Term Loan facility, increasing the total capacity to $1.25 billion and extending the maturity to July 31, 2030. On June 6, 2024, the facility was further amended through repricing that reduced the applicable SOFR spread and removed quarterly principal payments prior to maturity. Subsequently, on September 16, 2024, CCFC refinanced to increase the total principal amount to $1.9 billion. The term of the credit agreement remained unchanged through June 2030.
The CCFC Term Loan bears interest, at CCFC’s option, at either (1) the Base Rate, equal to the highest of (a) the Federal Funds Effective Rate plus 0.50% per annum, (b) the Prime Rate or (c) the Term SOFR for a month tenor (as such terms are defined in the Credit Agreement) plus 1.00% per annum, plus an applicable margin of 1.00% per annum, or (2) Term SOFR plus 2.00% per annum. The Company paid an upfront fee of an amount equal to 0.75% of the aggregate principal amount, which is structured as an original issue discount, and recorded approximately $15 million in debt issuance costs during the third quarter of 2023 related to the refinancing. In addition, a loss on extinguishment of debt of $11 million was recognized including, the write-off of unamortized debt issuance costs of $2 million and costs incurred during the refinancing of $9 million.
The CCFC Term Loan is secured by certain real and personal property of CCFC, consisting primarily of seven natural gas-fired power plants. The CCFC Term Loan is not guaranteed by Calpine Corporation and is without recourse to Calpine Corporation or any of its non-CCFC subsidiaries or assets; however, CCFC generates the majority of its cash flows from an intercompany tolling agreement with Calpine Energy Services, L.P. and has various service agreements in place with other subsidiaries of Calpine Corporation.
108
GPC Term Loan
The GPC Term Loan is summarized in the table below (in millions, except for interest rates):
| Outstanding at December 31, | Weighted Average Effective Interest Rates(1) | |||||||||||||||
| 2024 | 2023 | 2024 | 2023 | |||||||||||||
| GPC Term Loan | $ | 1,486 | $ | 1,542 | 4.3 | % | 4.3 | % | ||||||||
| (1) | The weighted average interest rate calculation includes the amortization of debt issuance costs and debt discount, as well as the cash settlement contribution of interest rate hedging instruments. |
On November 9, 2021, Geysers Power Company, LLC (“GPC”) and the guarantor's party thereto amended the existing seven-year $900 million first lien senior secured term loan facility upsizing the facility, to $1.5 billion and extending the maturity to November 9, 2028. Additionally, the three senior secured revolving letter of credit facilities totaling $200 million were amended to a single revolving letter of credit facility with an available capacity of $250 million and a maturity date of November 9, 2028.
On May 31, 2022, GPC amended the then existing seven-year $1.5 billion first lien senior secured term loan facility by upsizing the facility to $1.77 billion, extending the maturity to May 31, 2029, and adjusting the interest rate from the London Inter-Bank Offered Rate (“LIBOR”) + 162.5 basis points (“bps”) to SOFR + 150 bps, reducing the all-in rate by 12.5 bps. Additionally, the revolving letter of credit facility with an available capacity of $250 million was amended, extending the maturity date to May 31, 2029, and providing the ability to draw up to $50 million in loans for eligible battery projects based on terms within the amended agreement. Proceeds from the amended GPC Term Loan were used for general corporate purposes, including but not limited to the repayment of other Calpine debt and future renewable project development.
The GPC Term Loan is certified under the Climate Bonds Standard. Any letters of credit issued under the GPC Term Loan letter of credit facilities must be at the request of, and for, the account of GPC. The GPC Term Loan bears interest, at GPC’s option, at either (1) the Base Rate, equal to the highest of (a) the Federal Funds Rate plus 0.5% per annum, (b) the Prime Rate published by the Wall Street Journal, or (c) Adjusted one-month Term SOFR plus 1.00%, or (2) SOFR plus an applicable margin of 1.50% per annum, increasing by 0.125% every three years. The GPC Term Loan includes amortizing payments over the seven-year term with a final payment at maturity but may be prepaid at any time upon irrevocable notice to the Administrative Agent.
The GPC Term Loan is secured by certain real and personal property of GPC and its restricted subsidiaries consisting primarily of the Geysers Assets. The GPC Term Loan is not guaranteed by Calpine Corporation and is without recourse to Calpine Corporation or any of its non-GPC subsidiaries or assets; however, GPC generates a portion of its cash flows from an intercompany tolling agreement with Calpine Energy Services, L.P. and has various service agreements in place with other subsidiaries of Calpine Corporation.
Construction Loan Facilities, Project Financing, Notes Payable and Other
The Company's construction loan facilities, project financing, notes payable and other debt are summarized in the table below (in millions, except for interest rates):
| Outstanding at December 31, |
Weighted Average Effective Interest Rates(1) |
|||||||||||||||
| 2024 | 2023 | 2024 | 2023 | |||||||||||||
| Nova | $ | 607 | $ | 372 | 7.8 | % | 6.9 | % | ||||||||
| Pasadena(2) | 4 | 10 | 8.4 | % | 8.5 | % | ||||||||||
| Bethpage Energy Center 3 due 2025(3) | 7 | 15 | 6.8 | % | 6.8 | % | ||||||||||
| Greenfield | 332 | 367 | 6.5 | % | 8.2 | % | ||||||||||
| Other(4) | 47 | 229 | 3.9 | % | 4.0 | % | ||||||||||
| Total | $ | 997 | $ | 993 | ||||||||||||
109
| (1) | The weighted average interest rate calculation includes the amortization of debt issuance costs and debt discount, as well as the cash settlement contribution of interest rate hedging instruments, as applicable. |
| (2) | Represents a failed sale-leaseback transaction that is accounted for as a financing transaction under U.S. GAAP. |
| (3) | Represents a weighted average of first and second-lien loans for the weighted average effective interest rates. |
| (4) | Approximately nil and $200 million of notional debt balance as of December 31, 2024 and 2023, respectively, relates to loans issued under a master securities lending transaction with JPMorgan Chase, N.A, which were fully paid during the year ended December 31, 2024. The Company also has $45 million and $30 million as of December 31, 2024 and 2023, respectively, of related party debt outstanding with Calpine Receivables offset against its investment in the entity. |
Nova Power Credit Facility
On December 21, 2023, the Company, through its wholly-owned subsidiary, Nova Power, LLC, entered into a credit agreement comprising certain credit facilities to finance a portion of the costs of the development, construction, and operation of the Nova power battery storage project. The credit facilities total more than $1 billion, including (a) an aggregate principal amount of $655 million (“Construction Facility”), (b) an aggregate principal amount of $256 million (“Bridge Facility”), available until the facility’s investment tax credits are received, and (c) letter of credit facilities available to support various obligations with $94 million of total available capacity. The financing received Climate Bond Certification as green financing. On September 17, 2024, proceeds of $353 million were used from the sale of certain investment tax credits related to the Nova battery storage facilities to repay the outstanding $183 million principal and interest balance on the Bridge Facility in full. This activity resulted in a total drawn principal balance of $607 million as of December 31,2024, on the Nova Credit Agreement. On October 31, 2024, Calpine Corporation, through its wholly-owned subsidiary Nova Power Holdco, converted the existing Nova Power Battery Facility construction loan to a first-lien term loan with a total notional balance outstanding of $640 million and a term of seven years from the conversion date. The Term Loan maturity date is the seventh anniversary of the Term Loan Conversion Date.
SOFR-based loans under the Nova Credit Agreement will bear interest at the Daily Compounded SOFR plus 1.75%. Alternate Base Rate ("ABR") Loans, as defined in the agreement, will bear interest at the ABR rate, defined as the per annum rate equal to the greatest of: (a) the Prime Rate in effect on such day, (b) the Federal Funds Effective Rate in effect on such day plus 1/2 of 1.00% and (c) the Daily Compounded SOFR then in effect (assuming a one-month Interest Period) plus 1.00%, plus an applicable margin. The applicable margin for both SOFR Loans and ABR Loans varies based on the nature of the loan and other considerations, as specified in the credit agreement. Approximately $23 million in debt issuance costs were recorded during the fourth quarter of 2023 related to the Nova Credit Agreement.
The Nova Credit Agreement is secured by all of Nova Power's real and personal property. In addition, Nova Power Holdco, LLC, the parent of Nova Power, LLC, has agreed to secure its equity interest in Nova Power, LLC to the lenders, along with its rights to certain intercompany agreements related to the purchase of equipment for the project. Additionally, certain assets of additional wholly-owned subsidiaries of Calpine have pledged certain equity interests and certain third-party agreements to the creditors. The Nova Credit Agreement is not guaranteed by Calpine Corporation and is without recourse to Calpine Corporation other than the bridge facility.
Greenfield Credit Facility
On September 5, 2023, we completed the acquisition of the remaining 50% equity interest of Greenfield L.P. as detailed in Note 5, Acquisitions and LLC Agreement. As of the acquisition date, the debt balance held by Greenfield L.P. totaled $263 million CAD ($193 million USD) with a term through September 2028. On November 14, 2023, Greenfield L.P. entered into the second amended and restated credit agreement, which increased the notional amount of the term loan to $500 million CAD and extended the term of the credit agreement through November 14, 2030 (“Greenfield Credit Agreement”). As of December 31, 2024, the Greenfield Credit Agreement is comprised of a term loan facility with an outstanding balance of $486 million CAD ( $338 million USD) and several letter of credit facilities with a total available capacity of $104 million CAD ( $79 million USD) to support various obligations of Greenfield LP and is secured by the real and personal property of Greenfield L.P. without recourse to Calpine Corporation or any of its non-Greenfield subsidiaries or assets.
Proceeds from the amended credit agreement will primarily be used to construct an expansion upgrade at the Greenfield facility. The term loan incurs interest based on either the Canada Prime Rate or the Canada Overnight Repo Rate Average (“CORRA”) plus an applicable margin, as defined in the credit agreement. We recorded approximately $12 million CAD in debt issuance costs during the fourth quarter of 2023 related to the refinancing of the Greenfield Credit Agreement.
110
Master Securities Lending Transaction
On December 13, 2022, the Company, through its wholly-owned subsidiary, Calpine Energy Services, L.P., entered into a master securities lending transaction with JPMorgan Chase, N.A. that allows for JPMorgan Chase, N.A. to lend U.S. Treasury securities to this subsidiary in exchange for letters of credit. This subsidiary uses the U.S. Treasury securities to post collateral for commodity transactions on market exchanges. The total value of the letters of credit provided as collateral for the Treasury securities is based on the fair market value of the U.S. Treasury securities and will fluctuate daily. The subsidiary pays a loan fee for all amounts not collateralized by cash collateral, as specified in the agreement.
On June 1, 2023, Calpine Energy Services, L.P. renewed an existing $95 million loan executed under the master securities lending transaction, extending the term of the loan through February 15, 2024. On February 15, 2024, the loan was further extended to November 1, 2024. As of December 31, 2023, the Company had entered into an underlying loan with a notional amount of $105 million for a term through November 1, 2024, and posted letters of credit as collateral totaling $200 million for the above two loans. The agreement expired on November 1, 2024. As of December 31, 2024, the Company has no outstanding balance for the above two loans. This agreement was accounted for as a financing transaction on the Consolidated Balance Sheets.
Outside of the master securities lending transaction discussed above, project financings are collateralized solely by the capital stock or partnership interests, physical assets, contracts and/or cash flows attributable to the entities that own the power plants. The lenders’ recourse under these specific project financings is limited to such collateral.
Senior Unsecured Notes
The Senior Unsecured Notes are summarized in the table below (in millions, except for interest rates):
| Outstanding at December 31, |
Weighted Average Effective Interest Rates(1) |
|||||||||||||||
| 2024 | 2023 | 2024 | 2023 | |||||||||||||
| 2028 Senior Unsecured Notes | $ | 1,395 | $ | 1,393 | 5.3 | % | 5.3 | % | ||||||||
| 2029 Senior Unsecured Notes | 646 | 646 | 4.8 | % | 4.8 | % | ||||||||||
| 2031 Senior Unsecured Notes | 845 | 843 | 5.1 | % | 5.2 | % | ||||||||||
| Total | $ | 2,886 | $ | 2,882 | ||||||||||||
| (1) | The weighted average interest rate calculation includes the amortization of debt issuance costs. |
On December 27, 2019, the Company issued $1.4 billion in aggregate principal amount of 5.13% senior unsecured notes due 2028 in a private placement (“2028 Senior Unsecured Notes”). The 2028 Senior Unsecured Notes bear interest at 5.13% per annum, with interest payable semi-annually on March 15 and September 15 of each year, beginning on September 15, 2020. The 2028 Senior Unsecured Notes mature on March 15, 2028.
On August 10, 2020, the Company issued $650 million in aggregate principal amount of 4.63% senior unsecured notes due 2029 ("2029 Senior Unsecured Notes") and $850 million in aggregate principal amount of 5.00% senior unsecured notes due 2031(“2031 Senior Unsecured Notes”) in private placements. The 2029 Senior Unsecured Notes bear interest at 4.63% per annum, and the 2031 Senior Unsecured Notes bear interest at 5.00% per annum, with interest payable on both series of notes semi-annually on February 1 and August 1 of each year, beginning on February 1, 2021.
The Senior Unsecured Notes are:
| · | general unsecured obligations of Calpine; | |
| · | rank equally in right of payment with all of Calpine’s existing and future senior indebtedness; | |
| · | effectively subordinated to Calpine’s secured indebtedness to the extent of the value of the collateral securing such indebtedness; | |
| · | structurally subordinated to any existing and future indebtedness and other liabilities of Calpine’s subsidiaries; and | |
| · | senior in right of payment to any of Calpine’s subordinated indebtedness. |
111
First Lien Notes
The First Lien Notes are summarized in the table below (in millions, except for interest rates):
| Outstanding at December 31, |
Weighted Average Effective Interest Rates(1) |
|||||||||||||||
| 2024 | 2023 | 2024 | 2023 | |||||||||||||
| 2026 First Lien Notes | $ | 139 | $ | 418 | 6.2 | % | 5.4 | % | ||||||||
| 2028 First Lien Notes | 1,244 | 1,242 | 4.7 | % | 4.7 | % | ||||||||||
| 2031 First Lien Notes | 893 | 892 | 3.9 | % | 3.9 | % | ||||||||||
| Total | $ | 2,276 | $ | 2,552 | ||||||||||||
| (1) | The weighted average interest rate calculation includes the amortization of debt issuance costs and debt discount. |
2026 First Lien Notes
On December 15, 2017, the Company issued $560 million in aggregate principal amount of 5.25% senior secured notes due 2026 in a private placement. Additionally, on May 31, 2016, the Company issued $625 million in aggregate principal amount of 5.25% senior secured notes due 2026 in a private placement. The 2026 First Lien Notes bear interest at 5.25% payable semi-annually on June 1 and December 1 of each year. The 2026 First Lien Notes mature on June 1, 2026, and contain substantially similar covenants, qualifications, exceptions, and limitations as the First Lien Notes.
On September 25, 2024, the Company issued notice to redeem the outstanding principal of the 2026 First Lien Notes, and on October 25, 2024, a partial redemption for $286 million was completed, including accrued interest. On December 10, 2024, the Company issued notice to redeem the remaining outstanding principal of the 2026 First Lien Notes, and on January 9, 2025, a redemption for $140 million was completed, including accrued interest.
Approximately $8 million in debt issuance costs was recorded during the fourth quarter of 2017 related to the issuance of a portion of the 2026 First Lien Notes and approximately $9 million in debt issuance costs during the second quarter of 2016 related to the issuance of a portion of the 2026 First Lien Notes.
2031 First Lien Notes
On December 16, 2020, the Company issued $900 million in aggregate principal amount of 3.75% senior secured notes due 2031 in a private placement. The 2031 First Lien Notes bear interest at 3.75%, payable semiannually on March 1 and September 1 of each year beginning on September 1, 2021. The 2031 First Lien Notes mature on March 1, 2031, and contain substantially similar covenants, qualifications, exceptions, and limitations as the First Lien Notes. Approximately $12 million in debt issuance costs was recorded during the fourth quarter of 2020 related to the issuance of the 2031 First Lien Notes.
2028 First Lien Notes
On December 20, 2019, the Company issued $1.25 billion in aggregate principal amount of 4.50% senior secured notes due 2028 in a private placement. The 2028 First Lien Notes bear interest at 4.50% payable semi-annually on February 15 and August 15 of each year, beginning on August 15, 2020. The 2028 First Lien Notes mature on February 15, 2028, and contain substantially similar covenants, qualifications, exceptions, and limitations as our First Lien Notes. We recorded approximately $16 million in debt issuance costs during the fourth quarter of 2019 related to the issuance of the 2028 First Lien Notes.
First Lien Notes
The First Lien Notes are secured equally and ratably with indebtedness incurred under the First Lien Term Loans and Corporate Revolving Facility, subject to certain exceptions and permitted liens, on substantially all of the Company's and certain of the guarantors’ existing and future assets. Additionally, the First Lien Notes rank equally in right of payment with all the Company's and the guarantors’ other existing and future senior indebtedness and will be effectively subordinated in right of payment to all existing and future liabilities of subsidiaries that do not guarantee the First Lien Notes.
112
Subject to certain qualifications and exceptions, the First Lien Notes will, among other things, limit the Company's ability and the ability of the guarantors to:
| · | incur or guarantee additional first-lien indebtedness; | |
| · | enter into certain types of commodity hedge agreements that can be secured by first lien collateral; | |
| · | enter into sale and leaseback transactions; | |
| · | create or incur liens; and | |
| · | consolidate, merge, or transfer all or substantially all of Company assets and the assets of restricted subsidiaries on a combined basis. |
Finance Lease Obligations
See Note 4, Leases, for disclosures related to finance lease obligations.
Fair Value of Debt
The Company records debt instruments based on contractual terms, net of any applicable premium or discount, and debt issuance costs. The following table details the fair values and carrying values of debt instruments (in millions):
| December 31, | ||||||||||||||||
| 2024 | 2023 | |||||||||||||||
| Fair Value | Carrying Value |
Fair Value | Carrying Value |
|||||||||||||
| Senior Unsecured Notes | $ | 2,750 | $ | 2,886 | $ | 2,728 | $ | 2,882 | ||||||||
| First Lien Term Loans | 2,502 | 2,484 | 2,328 | 2,301 | ||||||||||||
| First Lien Notes | 2,139 | 2,275 | 2,400 | 2,552 | ||||||||||||
| CCFC Term Loan | 1,870 | 1,864 | 1,246 | 1,231 | ||||||||||||
| GPC Term Loan | 1,508 | 1,486 | 1,570 | 1,542 | ||||||||||||
| Construction loan facilities, project financing, notes payable and other(1) | 1,014 | 993 | 1,005 | 983 | ||||||||||||
| Revolving facilities | 148 | 148 | 301 | 301 | ||||||||||||
| Total | $ | 11,931 | $ | 12,136 | $ | 11,578 | $ | 11,792 | ||||||||
| (1) | Excludes a lease that is accounted for as a failed sale-leaseback transaction under U.S. GAAP. |
The Company's Senior Unsecured Notes, First Lien Term Loans, First Lien Notes and CCFC Term Loan are categorized as level 2 within the fair value hierarchy. The GPC Term Loan, revolving facilities, construction loan facilities, project financing, notes payable and other debt instruments are categorized as level 3 within the fair value hierarchy. the Company does not have any debt instruments with fair value measurements categorized as level 1 within the fair value hierarchy.
9. Assets and Liabilities with Recurring Fair Value Measurements
Cash Equivalents — Highly liquid investments that meet the definition of cash equivalents, primarily investments in money market accounts and other interest-bearing accounts, are included in both cash and cash equivalents and restricted cash on the Consolidated Balance Sheets. Certain of our money market accounts involve investing in U.S. Treasury securities or other obligations issued or guaranteed by the U.S. Government, its agencies, or instrumentalities. The Company does not have any cash equivalents invested in institutional prime money market funds, which require the use of a floating net asset value and are subject to liquidity fees and redemption restrictions. Certain of our cash equivalents are classified within level 1 of the fair value hierarchy.
Derivatives — The Company’s derivative instruments include physical and financial commodity contracts as well as interest rate swap agreements that meet the definition of a derivative instrument. The primary factors affecting the fair value of derivative instruments at any point in time are the volume of open derivative positions (Million British thermal units (“MMBtu”), Megawatt hour (“MWh”), and $ notional amounts) changing commodity market prices, primarily for power and natural gas; the Company’s credit standing and that of its counterparties and customers for energy commodity derivatives; and prevailing interest rates for interest rate instruments. Prices for power and natural gas and interest rates are volatile, which can result in material changes in the fair value measurements reported in future financial statements.
113
The Company uses market data, such as pricing services and broker quotes, and assumptions that it believes market participants would use in pricing its assets or liabilities, including assumptions about the risks inherent to the inputs in the valuation technique. These inputs can be readily observable, market-corroborated or generally unobservable. The market data obtained from broker pricing services is evaluated to determine the nature of the quotes obtained and, where accepted as a reliable quote, used to validate the assessment of fair value. The Company uses other qualitative assessments to determine the level of activity in any given market. The Company primarily applies the market approach and income approach for recurring fair value measurements and uses the best available information. Valuation techniques are used which seek to maximize the use of observable inputs and minimize the use of unobservable inputs. Fair value balances are classified based on the observability of those inputs.
The fair value of our derivatives includes consideration of the Company’s credit standing, the credit standing of its counterparties and customers, and the effect of credit enhancements, if any. Credit reserves have been recorded in the determination of fair value based on the expectation of how market participants would determine fair value. Such valuation adjustments are generally based on market evidence, if available, or best estimate.
Level 1 fair value derivative instruments primarily consist of power and natural gas swaps, futures and options traded on the NYMEX or ICE.
Level 2 fair value derivative instruments primarily consist of interest rate instruments and OTC power and natural gas forwards for which market-based pricing inputs in the principal or most advantageous market are representative of executable prices for market participants. These inputs are observable at commonly quoted intervals for substantially the full term of the instruments. In certain instances, Level 2 derivative instruments may use models to measure fair value. These models are industry-standard models, including the Black-Scholes option-pricing model, which incorporates various assumptions, including quoted interest rates, correlation, volatility, as well as other relevant economic measures. All assumptions are observable in the marketplace throughout the full term of the instrument, it can be derived from observable data, or are supported by observable levels at which transactions are executed in the marketplace.
Level 3 fair value derivative instruments may consist of OTC power and natural gas forwards and options where pricing inputs are unobservable, as well as other complex and structured transactions primarily for the sale and purchase of power and natural gas to both wholesale counterparties and retail customers. Complex or structured transactions are tailored to customer’s needs and can introduce the need for internally developed model inputs which might not be observable in or corroborated by the market. When such inputs have a significant effect on the measurement of fair value, the instrument is categorized in level 3. Valuation models used may incorporate historical correlation information and extrapolate available broker and other information to future periods.
114
Financial assets and liabilities are classified in their entirety based on the lowest level of input that is significant to the fair value measurement at period end. Determining the significance of a particular input to the fair value measurement requires judgment and may affect the fair value estimate of assets and liabilities and their placement within the fair value hierarchy. The following tables present the Company’s assets and liabilities that were accounted for at fair value on a recurring basis by level within the fair value hierarchy:
| Assets
and Liabilities with Recurring Fair Value Measures as of December 31, 2024 | ||||||||||||||||
| Level 1 | Level 2 | Level 3 | Total | |||||||||||||
| (in millions) | ||||||||||||||||
| Assets: | ||||||||||||||||
| Cash equivalents(1) | $ | 295 | $ | — | $ | — | $ | 295 | ||||||||
| Commodity instruments: | ||||||||||||||||
| Commodity exchange-traded derivatives contracts | 1,768 | — | — | 1,768 | ||||||||||||
| Commodity forward contracts(2) | — | 567 | 649 | 1,216 | ||||||||||||
| Interest rate derivative instruments | — | 257 | — | 257 | ||||||||||||
| Effect of netting and allocation of collateral(3)(4) | (1,768 | ) | (270 | ) | (65 | ) | (2,103 | ) | ||||||||
| Total assets | $ | 295 | $ | 554 | $ | 584 | $ | 1,433 | ||||||||
| Liabilities: | ||||||||||||||||
| Commodity instruments: | ||||||||||||||||
| Commodity exchange-traded derivatives contracts | $ | 1,782 | $ | — | $ | — | $ | 1,782 | ||||||||
| Commodity forward contracts(2) | — | 399 | 600 | 999 | ||||||||||||
| Interest rate hedging instruments | — | 10 | — | 10 | ||||||||||||
| Effect of netting and allocation of collateral(3)(4) | (1,782 | ) | (257 | ) | (48 | ) | (2,087 | ) | ||||||||
| Total liabilities | $ | — | $ | 152 | $ | 552 | $ | 704 | ||||||||
| Assets
and Liabilities with Recurring Fair Value Measures as of December 31, 2023 | ||||||||||||||||
| Level 1 | Level 2 | Level 3 | Total | |||||||||||||
| (in millions) | ||||||||||||||||
| Assets: | ||||||||||||||||
| Cash equivalents(1) | $ | 176 | $ | — | $ | — | $ | 176 | ||||||||
| Commodity instruments: | ||||||||||||||||
| Commodity exchange-traded derivatives contracts | 2,792 | — | — | 2,792 | ||||||||||||
| Commodity forward contracts(2) | — | 526 | 660 | 1,186 | ||||||||||||
| Interest rate derivative instruments | — | 339 | — | 339 | ||||||||||||
| Effect of netting and allocation of collateral(3)(4) | (2,792 | ) | (353 | ) | (63 | ) | (3,208 | ) | ||||||||
| Total assets | $ | 176 | $ | 512 | $ | 597 | $ | 1,285 | ||||||||
| Liabilities: | ||||||||||||||||
| Commodity instruments: | ||||||||||||||||
| Commodity exchange-traded derivatives contracts | $ | 3,020 | $ | — | $ | — | $ | 3,020 | ||||||||
| Commodity forward contracts(2) | — | 551 | 501 | 1,052 | ||||||||||||
| Interest rate derivative instruments | — | 10 | — | 10 | ||||||||||||
| Effect of netting and allocation of collateral(3)(4) | (3,020 | ) | (353 | ) | (54 | ) | (3,427 | ) | ||||||||
| Total liabilities | $ | — | $ | 208 | $ | 447 | $ | 655 | ||||||||
115
| (1) | As of December 31, 2024 and 2023, there were cash equivalents of $35 million and $28 million included in cash and cash equivalents and $260 million and $148 million included in restricted cash, respectively. | |
| (2) | Includes OTC swaps and options. | |
| (3) | Fair value amounts recognized for derivative instruments executed with the same counterparty under a master netting arrangement were offset for financial statement presentation; therefore, amounts recognized for the right to reclaim, or the obligation to return, cash collateral are presented net with the corresponding derivative instrument fair values. See Note 10, Derivative Instruments, for further discussion of our derivative instruments subject to master netting arrangements. | |
| (4) | Cash collateral posted with (received from) counterparties allocated to Level 1, Level 2 and Level 3 derivative instruments totaled $14 million, $(13) million and $(17) million, respectively, as of December 31, 2024. Cash collateral posted with (received from) counterparties allocated to Level 1, Level 2, and Level 3 derivative instruments totaled $228 million, nil and $9 million, respectively, as of December 31, 2023. |
As of December 31, 2024 and 2023, respectively, the derivative instruments classified as Level 3 primarily included commodity contracts. As noted in the table below, forward commodity prices are the significant unobservable input resulting in a Level 3 classification. Significant changes in forward commodity prices would have a direct impact on the fair values of the Level 3 derivatives which could be material. Increases (decreases) in the forward commodity price in isolation would result in significantly higher (lower) fair values for long positions (contracts that give us the obligation or option to purchase a commodity), with offsetting impacts to short positions (contracts that give us the obligation or right to sell a commodity). Further, interrelationships exist between market prices of natural gas and power which will also impact the change in fair value of these instruments. For example, an increase in natural gas pricing would potentially have a similar impact on forward power markets.
The following table presents quantitative information regarding Level 3 fair value measurements as of December 31, 2024 and 2023. As noted in the tables presented below, the range in prices noted did not result in a significant shift in the fair value of Level 3 derivatives.
| Quantitative Information about Level 3 Fair Value Measurements | ||||||||||||
| December 31, 2024 | ||||||||||||
| Fair Value, | Significant | |||||||||||
| Net Asset | Valuation | Unobservable | ||||||||||
| (Liability) | Technique | Input | Range | Average | ||||||||
| (in millions) | ||||||||||||
| Power Contracts(1) | $ | (65 | ) | Discounted cash flow | Market price (per MWh) | $3.83 - $269.92/MWh | $63.78/ MWh | |||||
| Power Congestion Products | $ | 32 | Discounted cash flow | Market price (per MWh) | $(26.03) - $125.37/MWh | $(3.20)/ MWh | ||||||
| Natural Gas Contracts | $ | 65 | Discounted cash flow | Market price (per MMBtu) | $1.97 - $17.00/MMBtu | $6.35 MMBtu | ||||||
| Quantitative Information about Level 3 Fair Value Measurements | ||||||||||||
| December 31, 2023 | ||||||||||||
| Fair Value, | Significant | |||||||||||
| Net Asset | Valuation | Unobservable | ||||||||||
| (Liability) | Technique | Input | Range | Average | ||||||||
| (in millions) | ||||||||||||
| Power Contracts(1) | $ | 166 | Discounted cash flow | Market price (per MWh) | $17.83 - $197.47/MWh | $49.60/ MWh | ||||||
| Power Congestion Products | $ | 9 | Discounted cash flow | Market price (per MWh) | $(37.21) - $17.54/MWh | $(7.43)/ MWh | ||||||
| Natural Gas Contracts | $ | (25 | ) | Discounted cash flow | Market price (per MMBtu) | $1.38 - $20.64/MMBtu | $6.02/ MMBtu | |||||
| (1) | Power contracts include power and Heat Rate instruments classified as Level 3 in the fair value hierarchy. |
116
The following table sets forth a reconciliation of changes in the fair value of net derivative assets (liabilities) classified as Level 3 in the fair value hierarchy (in millions):
| Year Ended December 31, | ||||||||||||
| 2024 | 2023 | 2022 | ||||||||||
| Balance, beginning of period | $ | 150 | $ | (304 | ) | $ | 33 | |||||
| Realized and mark-to-market gains (losses): | ||||||||||||
| Included in net income (loss): | ||||||||||||
| Included in operating revenues(1) | (169 | ) | 162 | (364 | ) | |||||||
| Included in fuel and purchased energy expense(2) | 44 | (20 | ) | (228 | ) | |||||||
| Changes in collateral | (8 | ) | 19 | (8 | ) | |||||||
| Purchases and issuances: | ||||||||||||
| Purchases | 33 | 27 | — | |||||||||
| Settlements | (30 | ) | 308 | 113 | ||||||||
| Transfers into and/or out of level 3(3): | ||||||||||||
| Transfers into level 3(4) | 8 | (11 | ) | 9 | ||||||||
| Transfers out of level 3(5) | 4 | (31 | ) | 141 | ||||||||
| Balance, end of period | $ | 32 | $ | 150 | $ | (304 | ) | |||||
| Change in unrealized gains (losses) included in net income (loss) relating to instruments still held at the end of the period | $ | (125 | ) | $ | 142 | $ | (592 | ) | ||||
| (1) | For power contracts and other power-related products, included on the Consolidated Statements of Operations. | |
| (2) | For natural gas and power contracts, swaps and options, are included in the Consolidated Statements of Operations. | |
| (3) | Amounts transferred among levels of the fair value hierarchy as of the period end. There were no transfers into or out of Level 1 during the years ended December 31, 2024, 2023 and 2022. | |
| (4) | There were $8 million in gains, $11 million in losses and $9 million in gains transferred out of Level 2 into Level 3 for the years ended December 31, 2024, 2023 and 2022, respectively, due to changes in market liquidity in various power markets. | |
| (5) | There were $4 million in losses, $31 million in gains transferred out of level 3 into 2 for the years ended December 31, 2024 and 2023. We had $52 million in losses transferred out of level 3 into level 2 for the year ended December 31, 2022 due to changes in market liquidity in various power markets and $89 million in losses transferred out of level 3 during the year ended December 31, 2022 consisting of long-term structured deals previously accounted for as derivative contracts that were classified as normal purchase normal sale with the associated mark-to-market amount reclassified from derivative assets/liabilities to other assets/liabilities. |
10. Derivative Instruments
Types of Derivative Instruments and Volumetric Information
Commodity Instruments — The Company is exposed to changes in prices for the purchase and sale of power, natural gas, fuel oil, environmental products and other energy commodities. The Company uses derivatives, including physical and financial commodity instruments such as OTC and exchange-traded swaps, futures, options, forward agreements and instruments that settle on power price to natural gas price relationships (Heat Rate swaps and options) or price relationships between delivery points in order to maximize risk-adjusted returns through economically hedging a portion of the commodity price risk associated with our assets. By entering into these transactions, a portion of the Spark Spread can be economically hedged at estimated generation and prevailing price levels.
The Company also engages in limited trading activities related to its commodity derivative portfolio as authorized by the Board of Directors and monitored by the Chief Risk Officer and Risk Management Committee of senior management. These transactions are executed primarily for the purpose of providing improved price and price volatility discovery, greater market access and profiting from market knowledge, all of which benefit asset hedging activities. Trading results were not material for the years ended December 31, 2024, 2023 and 2022.
Interest Rate Instruments — A portion of debt is indexed to base rates, currently primarily SOFR. Effective July 1, 2023, debt agreements and interest rate instruments based on LIBOR were converted to SOFR, resulting in no material impact on the results of operations. The Company has historically used interest rate derivative instruments to adjust the mix between fixed and variable rate debt to hedge our interest rate risk for potential adverse changes in interest rates.
117
The net forward notional buy (sell) position of outstanding commodity derivative instruments that did not qualify or were not designated under the normal purchase normal sale exemption and the aggregate notional amount of interest rate derivative instruments were as follows:
| Notional Amounts | ||||||||||
| December 31, | ||||||||||
| Derivative Instruments | 2024 | 2023 | Unit of Measure | |||||||
| Power (MWh) | (288 | ) | (221 | ) | Million MWh | |||||
| Natural gas (MMBtu) | 1,536 | 1,265 | Million MMBtu | |||||||
| Environmental credits (Tonnes) | 25 | 28 | Million Tonnes | |||||||
| Interest rate derivative instruments(1) | $ | 5.8 | $ | 6.1 | Billion U.S. dollars | |||||
| (1) | The Company completed the acquisition of the remaining 50% equity interest of Greenfield L.P. on September 5, 2023, as further detailed in Note 5, Acquisitions and LLC Agreement. Approximately $365 million CAD (approximately $254 million USD) notional amount of interest rate derivative instruments is held by Greenfield L.P. as of December 31, 2024, and extend through November 2030. Additionally, during the fourth quarter of 2023, Nova Power, LLC entered into a Nova Credit Agreement for approximately $500 million notional amount of interest rate swap derivative instruments. |
Certain of derivative instruments contain credit risk-related contingent provisions that require maintaining collateral balances consistent with the Company’s credit ratings. If the Company’s credit rating were to be downgraded, it could require posting additional collateral or could potentially allow the counterparty to request immediate, full settlement on certain derivative instruments in liability positions. The aggregate fair value of derivative liabilities with credit risk-related contingent provisions as of December 31, 2024, was $61 million for which we have posted collateral of $32 million, by posting margin deposits, letters of credit or granting additional first priority liens on the assets currently subject to first priority liens under the First Lien Notes, First Lien Term Loans and Corporate Revolving Facility. However, if the Company’s credit rating were downgraded by one notch from its current level, it is estimated that $2 million of additional collateral would be required and that no counterparty could request immediate, full settlement.
Accounting for Derivative Instruments
All derivative instruments are recognized that qualify for derivative accounting treatment as either assets or liabilities and those instruments are measured at fair value unless they qualify for the normal purchase normal sale exemption. For transactions in which the Company elects the normal purchase normal sale exemption, gains and losses are not reflected on the Consolidated Statements of Operations until the period of delivery. Revenues and expenses derived from instruments that qualify for hedge accounting or represent an economic hedge are recorded in the same financial statement line item as the item being hedged. Hedge accounting requires formal documentation, designation and assessment of the effectiveness of transactions that receive hedge accounting. Cash flows from derivatives are presented in the same category as the item being hedged (or economically hedged) within operating activities on the Consolidated Statements of Cash Flows unless they contain an other-than-insignificant financing element, in which case their cash flows are classified within financing activities.
Cash Flow Hedges — The Company has elected to designate certain of commodity and interest rate derivative instruments in cash flow hedging relationships where the accounting rules permit. As a result, hedge accounting is applied to a portion of interest rate and commodity hedging instruments with the change in fair value of all other hedging instruments recorded through earnings. Mark-to-market gains or losses on interest rate and commodity hedging instruments designated and qualifying as a cash flow hedging instrument are reported as a component of OCI and reclassified as gains and losses into earnings in the same period during which the hedged forecasted transaction affects earnings. If it is determined that the forecasted transaction is no longer probable to occur, then hedge accounting will be discontinued prospectively, and future changes in fair value will be recorded in earnings. If the hedging instrument is terminated or de-designated prior to the occurrence of the hedged forecasted transaction, the net accumulated gain or loss associated with the changes in fair value of the hedging instrument remains deferred in AOCI until such time as the forecasted transaction affects earnings or until it is determined that the forecasted transaction is probable of not occurring.
Derivatives Not Designated as Hedging Instruments — The Company enters into power, natural gas, interest rate, environmental product and fuel oil transactions as economic hedges of underlying forward exposure. The instruments primarily act as hedges to asset and interest rate portfolios but do not qualify for hedge accounting under the accounting guidelines. Changes in the fair value of commodity derivatives not designated as hedging instruments are recognized currently in earnings and are separately stated on the Consolidated Statements of Operations in mark-to-market gain/loss as a component of operating revenues (for physical and financial power and Heat Rate and commodity option activity) and fuel and purchased energy expense (for physical and financial natural gas, power, environmental product and fuel oil activity). Changes in the fair value of interest rate derivatives not designated as hedging instruments are recognized currently in earnings within interest expense.
118
Derivatives Included on the Consolidated Balance Sheets
Fair value amounts are offset which are associated with derivative instruments and related cash collateral and margin deposits on Consolidated Balance Sheets that are executed with the same counterparty under master netting arrangements. These netting arrangements include a right to set off or net together purchases and sales of comparable products in the margining or settlement process. In some instances, cross-commodity netting rights were negotiated, which allow for the net presentation of activity with a given counterparty, regardless of product purchased or sold. Cash collateral in support of derivative instruments is posted and/or received which may also be subject to a master netting arrangement with the same counterparty.
The following tables present the fair values of derivative instruments and the net exposure after offsetting amounts subject to a master netting arrangement with the same counterparty to derivative instruments recorded on the Consolidated Balance Sheets by location and hedge type (in millions):
| December 31, 2024 | ||||||||||||
| Gross Amounts | Net Amount | |||||||||||
| Gross Amounts | Offset on the | Presented on the | ||||||||||
| of Assets and | Consolidated | Consolidated | ||||||||||
| (Liabilities) | Balance Sheet | Balance Sheet(1) | ||||||||||
| Derivative assets: | ||||||||||||
| Commodity exchange-traded derivatives contracts | $ | 1,230 | $ | (1,230 | ) | $ | — | |||||
| Commodity forward contracts | 685 | (216 | ) | 469 | ||||||||
| Interest rate derivative instruments | 110 | — | 110 | |||||||||
| Total current derivative assets(2) | $ | 2,025 | $ | (1,446 | ) | $ | 579 | |||||
| Commodity exchange-traded derivatives contracts | 538 | (538 | ) | — | ||||||||
| Commodity forward contracts | 531 | (119 | ) | 412 | ||||||||
| Interest rate derivative instruments | 147 | — | 147 | |||||||||
| Total long-term derivative assets(2) | $ | 1,216 | $ | (657 | ) | $ | 559 | |||||
| Total derivative assets | $ | 3,241 | $ | (2,103 | ) | $ | 1,138 | |||||
| Derivative (liabilities): | ||||||||||||
| Commodity exchange-traded derivatives contracts | $ | (1,212 | ) | $ | 1,212 | $ | — | |||||
| Commodity forward contracts | (515 | ) | 201 | (314 | ) | |||||||
| Interest rate derivative instruments | (2 | ) | — | (2 | ) | |||||||
| Total current derivative (liabilities)(2) | $ | (1,729 | ) | $ | 1,413 | $ | (316 | ) | ||||
| Commodity exchange-traded derivatives contracts | (570 | ) | 570 | — | ||||||||
| Commodity forward contracts | (484 | ) | 104 | (380 | ) | |||||||
| Interest rate derivative instruments | (8 | ) | — | (8 | ) | |||||||
| Total long-term derivative (liabilities)(2) | $ | (1,062 | ) | $ | 674 | $ | (388 | ) | ||||
| Total derivative (liabilities) | $ | (2,791 | ) | $ | 2,087 | $ | (704 | ) | ||||
| Net derivative assets (liabilities) | $ | 450 | $ | (16 | ) | $ | 434 | |||||
119
| December 31, 2023 | ||||||||||||
| Gross Amounts | Net Amount | |||||||||||
| Gross Amounts | Offset on the | Presented on the | ||||||||||
| of Assets and | Consolidated | Consolidated | ||||||||||
| (Liabilities) | Balance Sheet | Balance Sheet(1) | ||||||||||
| Derivative assets: | ||||||||||||
| Commodity exchange-traded derivatives contracts | $ | 2,136 | $ | (2,136 | ) | $ | — | |||||
| Commodity forward contracts | 632 | (274 | ) | 358 | ||||||||
| Interest rate derivative instruments | 172 | — | 172 | |||||||||
| Total current derivative assets(3) | $ | 2,940 | $ | (2,410 | ) | $ | 530 | |||||
| Commodity exchange-traded derivatives contracts | 656 | (656 | ) | — | ||||||||
| Commodity forward contracts | 554 | (142 | ) | 412 | ||||||||
| Interest rate derivative instruments | 167 | — | 167 | |||||||||
| Total long-term derivative assets(3) | $ | 1,377 | $ | (798 | ) | $ | 579 | |||||
| Total derivative assets | $ | 4,317 | $ | (3,208 | ) | $ | 1,109 | |||||
| Derivative (liabilities): | ||||||||||||
| Commodity exchange-traded derivatives contracts | $ | (2,428 | ) | $ | 2,428 | $ | — | |||||
| Commodity forward contracts | (651 | ) | 270 | (381 | ) | |||||||
| Interest rate derivative instruments | — | — | — | |||||||||
| Total current derivative (liabilities)(3) | $ | (3,079 | ) | $ | 2,698 | $ | (381 | ) | ||||
| Commodity exchange-traded derivatives contracts | (592 | ) | 592 | — | ||||||||
| Commodity forward contracts | (401 | ) | 137 | (264 | ) | |||||||
| Interest rate derivative instruments | (10 | ) | — | (10 | ) | |||||||
| Total long-term derivative (liabilities)(3) | $ | (1,003 | ) | $ | 729 | $ | (274 | ) | ||||
| Total derivative (liabilities) | $ | (4,082 | ) | $ | 3,427 | $ | (655 | ) | ||||
| Net derivative assets | $ | 235 | $ | 219 | $ | 454 | ||||||
| (1) | As of December 31, 2024 and 2023, there were $(87) million and $211 million, respectively, of collateral under master netting arrangements that were not offset against our derivative instruments on the Consolidated Balance Sheets primarily related to initial margin requirements. |
| (2) | As of December 31, 2024, current and long-term derivative assets are shown net of collateral of $(201) million and $(72) million, respectively, and current and long-term derivative liabilities are shown net of collateral of $169 million and $88 million, respectively. |
| (3) | As of December 31, 2023, current and long-term derivative assets are shown net of collateral of $(151) million and $(82) million, respectively, and current and long-term derivative liabilities are shown net of collateral of $439 million and $13 million, respectively. |
120
| December 31, 2024 | December 31, 2023 | |||||||||||||||
| Fair
Value of Derivative Assets | Fair
Value of Derivative Liabilities | Fair
Value of Derivative Assets | Fair
Value of Derivative Liabilities | |||||||||||||
| Derivatives designated as cash flow hedging instruments: | ||||||||||||||||
| Commodity hedging instruments | $ | 19 | $ | 166 | $ | (27 | ) | $ | 179 | |||||||
| Interest rate hedging instruments | 257 | 10 | 300 | 10 | ||||||||||||
| Total derivatives designated as cash flow hedging instruments | $ | 276 | $ | 176 | $ | 273 | $ | 189 | ||||||||
| Derivatives not designated as hedging instruments: | ||||||||||||||||
| Commodity derivative instruments | $ | 862 | $ | 528 | $ | 797 | $ | 466 | ||||||||
| Interest rate derivative instruments | — | — | 39 | — | ||||||||||||
| Total derivatives not designated as hedging instruments | $ | 862 | $ | 528 | $ | 836 | $ | 466 | ||||||||
| Total derivatives | $ | 1,138 | $ | 704 | $ | 1,109 | $ | 655 | ||||||||
Derivatives Included on the Consolidated Statements of Operations
Changes in the fair values of our derivative instruments are reflected in cash for option premiums paid or collected, in OCI, net of tax, for derivative instruments which qualify for, and where cash flow hedge accounting treatment was elected, or on the Consolidated Statements of Operations as a component of mark-to-market activity within our earnings.
The following tables detail the components of total activity for both the net realized gain (loss) and the net mark-to-market gain (loss) recognized from derivative instruments in earnings and where these components were recorded on the Consolidated Statements of Operations (in millions):
| Year Ended December 31, | ||||||||||||
| 2024 | 2023 | 2022 | ||||||||||
| Realized gain (loss)(1)(2) | ||||||||||||
| Commodity derivative instruments | $ | (206 | ) | $ | 488 | $ | 186 | |||||
| Interest rate derivative instruments | 4 | 27 | 4 | |||||||||
| Total realized gain (loss) | $ | (202 | ) | $ | 515 | $ | 190 | |||||
| Mark-to-market gain (loss)(3) | ||||||||||||
| Commodity derivative instruments | $ | 137 | $ | 883 | $ | (694 | ) | |||||
| Interest rate derivative instruments | (30 | ) | (18 | ) | 103 | |||||||
| Total mark-to-market gain (loss) | $ | 107 | $ | 865 | $ | (591 | ) | |||||
| Total activity, net | $ | (95 | ) | $ | 1,380 | $ | (401 | ) | ||||
| (1) | Does not include the realized value associated with derivative instruments that settle through physical delivery. | |
| (2) | Includes amortization of acquisition date fair value of financial derivative activity related to the acquisition of Calpine Solutions. | |
| (3) | In addition to changes in market value on derivatives not designated as hedges, changes in mark-to-market gain (loss) also include adjustments to reflect changes in credit default risk exposure. |
| Year Ended December 31, | ||||||||||||
| 2024 | 2023 | 2022 | ||||||||||
| Realized and mark-to-market gain (loss)(1) | ||||||||||||
| Derivatives contracts included in operating revenues(2)(3) | $ | 477 | $ | 2,666 | $ | (2,659 | ) | |||||
| Derivatives contracts included in fuel and purchased energy expense(2)(3) | (546 | ) | (1,295 | ) | 2,151 | |||||||
| Interest rate derivative instruments included in interest expense | (26 | ) | 9 | 107 | ||||||||
| Total activity, net | $ | (95 | ) | $ | 1,380 | $ | (401 | ) | ||||
121
| (1) | In addition to changes in market value on derivatives not designated as hedges, changes in mark-to-market gain (loss) also include adjustments to reflect changes in credit default risk exposure. | |
| (2) | Does not include the realized value associated with derivative instruments that settle through physical delivery. | |
| (3) | Includes amortization of acquisition date fair value of financial derivative activity related to the acquisition of Calpine Solutions. |
Derivatives Included in OCI and AOCI
The following table details the effect of net derivative instruments that qualified for hedge accounting treatment and are included in OCI and AOCI (in millions):
| Gain (Loss) Recognized in OCI | Gain (Loss) Reclassified from AOCI into Income(2) | |||||||||||||||||||||||||
| Year Ended December 31, | Year Ended December 31, | Affected Line Item on the Consolidated Statements of | ||||||||||||||||||||||||
| 2024 | 2023 | 2022 | 2024 | 2023 | 2022 | Operations | ||||||||||||||||||||
| Interest rate hedging instruments | $ | (52 | ) | $ | (129 | ) | $ | 346 | $ | 138 | $ | 158 | $ | 30 | Interest expense | |||||||||||
| Interest rate hedging instruments | 1 | 1 | 4 | (1 | ) | (1 | ) | (4 | ) | Depreciation and amortization expense | ||||||||||||||||
| Commodity hedging instruments | (46 | ) | 1,221 | (1,405 | ) | (2 | ) | (418 | ) | — | Commodity revenue | |||||||||||||||
| Commodity hedging instruments | 329 | (718 | ) | 425 | (300 | ) | 67 | — | Commodity expense | |||||||||||||||||
| Total(1) | $ | 232 | $ | 375 | $ | (630 | ) | $ | (165 | ) | $ | (194 | ) | $ | 26 | |||||||||||
| (1) | Income tax benefits (expense) of $(59) million, $(94) million and $154 million for the years ended December 31, 2024, 2023 and 2022, respectively, in AOCI related to our cash flow hedging activities. |
| (2) | Cumulative net cash flow hedge losses attributable to Calpine, net of tax, remaining in AOCI were $(86) million, $(259) million and $(540) million for the years ended December 31, 2024, 2023 and 2022, respectively. |
As of December 31, 2024, the maximum length of time over which interest rate and commodity derivative instruments as cash flow hedges were used was 7 years and 6 years, respectively. It is estimated that pre-tax $60 million in net gains will be reclassified from AOCI into interest expense, $6 million in net losses will be reclassified from AOCI into Commodity revenue and $23 million in net losses will be reclassified from AOCI into Commodity expense during the next 12 months as the hedged transactions settle; however, the actual amounts that will be reclassified will likely vary based on changes in interest rates and commodity prices. Therefore, it is not possible to predict what the actual reclassification from AOCI into earnings (positive or negative) will be for the next 12 months.
11. Use of Collateral
Margin deposits, prepayments and letters of credit are used as credit support with and from counterparties for commodity procurement and risk management activities. In addition, the Company has granted additional first-priority liens on the assets currently subject to first-priority liens under various debt agreements as collateral under certain of our power and natural gas agreements and certain interest rate derivative instruments in order to reduce the cash collateral and letters of credit that would otherwise be provided to the counterparties under such agreements. The counterparties under such agreements share the benefits of the collateral subject to such first priority liens pro rata with the lenders under various debt agreements.
122
The table below summarizes the balances outstanding under margin deposits, natural gas and power prepayments and exposure under letters of credit and first priority liens for commodity procurement and risk management activities (in millions):
| December 31, | ||||||||
| 2024 | 2023 | |||||||
| Margin deposits(1) | $ | 223 | $ | 673 | ||||
| Natural gas and power prepayments | 37 | 39 | ||||||
| Total margin deposits and natural gas and power prepayments with our counterparties(2) | $ | 260 | $ | 712 | ||||
| Letters of credit issued | $ | 1,855 | $ | 1,856 | ||||
| First-priority liens under power and natural gas agreements | 350 | 274 | ||||||
| Total letters of credit and first priority liens with our counterparties | $ | 2,205 | $ | 2,130 | ||||
| Margin deposits posted with us by our counterparties(1)(3) | $ | 327 | $ | 243 | ||||
| Letters of credit posted with us by our counterparties | 128 | 63 | ||||||
| Total margin deposits and letters of credit posted with us by our counterparties | $ | 455 | $ | 306 | ||||
| (1) | The Company offsets fair value amounts recognized for derivative instruments executed with the same counterparty under a master netting arrangement for financial statement presentation; therefore, amounts recognized for the right to reclaim, or the obligation to return, cash collateral are presented net with the corresponding derivative instrument fair values. See Note 10, Derivative Instruments, for further discussion of derivative instruments subject to master netting arrangements. | |
| (2) | As of December 31, 2024 and 2023, $175 million and $434 million, respectively, amounts were included in current and long-term derivative assets and liabilities, $78 million and $271 million, respectively, were included in margin deposits and other prepaid expense and $7 million and $7 million, respectively, were included in other assets on the Consolidated Balance Sheets. | |
| (3) | As of December 31, 2024 and 2023, $192 million and $215 million, respectively, amounts were included in current and long-term derivative assets and liabilities, $135 million and $28 million, respectively, were included in other current liabilities, and no material balance was included in other long-term liabilities on the Consolidated Balance Sheets. |
Future collateral requirements for cash, first priority liens and letters of credit may increase or decrease based on the extent of the Company’s involvement in hedging and optimization contracts, movements in commodity prices and also based on Calpine’s credit ratings and general perception of creditworthiness in the market.
12. Income Taxes
Income Tax Expense (Benefit)
The jurisdictional components of income (loss) from continuing operations before income tax expense (benefit) attributable to Calpine are as follows (in millions):
| Year Ended December 31, | ||||||||||||
| 2024 | 2023 | 2022 | ||||||||||
| The U.S. | $ | 2,116 | $ | 2,125 | $ | (32 | ) | |||||
| International | 6 | 12 | (18 | ) | ||||||||
| Total | $ | 2,122 | $ | 2,137 | $ | (50 | ) | |||||
123
The components of income tax expense (benefit) from continuing operations consist of the following (in millions):
| Year Ended December 31, | ||||||||||||
| 2024 | 2023 | 2022 | ||||||||||
| Current: | ||||||||||||
| Federal | $ | — | $ | — | $ | — | ||||||
| State | 93 | 43 | 28 | |||||||||
| Foreign | — | 5 | — | |||||||||
| Total current | 93 | 48 | 28 | |||||||||
| Deferred: | ||||||||||||
| Federal | 372 | 393 | 70 | |||||||||
| State | (8 | ) | 92 | 27 | ||||||||
| Foreign | 3 | 9 | (5 | ) | ||||||||
| Total deferred | 367 | 494 | 92 | |||||||||
| Total income tax expense (benefit) | $ | 460 | $ | 542 | $ | 120 | ||||||
For the years ended December 31, 2024, 2023 and 2022, effective income tax rates did not bear a customary relationship to statutory income tax rates, primarily as a result of the effect of valuation allowances, state income taxes, and various permanent book and tax differences. A reconciliation of the federal statutory rate of 21.0% to the effective rate from continuing operations is as follows:
| Year Ended December 31, | ||||||||||||
| 2024 | 2023 | 2022 | ||||||||||
| Federal statutory tax rate | 21.0 | % | 21.0 | % | 21.0 | % | ||||||
| State tax expense, net of federal benefit | 3.2 | 5.1 | (91.8 | ) | ||||||||
| Valuation allowances against future tax benefits | (1.8 | ) | 0.6 | (71.9 | ) | |||||||
| Federal return to provision | (0.1 | ) | (0.6 | ) | (10.7 | ) | ||||||
| Distributions from foreign affiliates and foreign taxes | — | 0.2 | — | |||||||||
| Local tax rate true up | — | — | 5.4 | |||||||||
| Tax credits | 1.6 | (1.3 | ) | 4.3 | ||||||||
| Stock-based compensation | — | 0.2 | (111.0 | ) | ||||||||
| Depletion in excess of the basis | (0.2 | ) | (0.1 | ) | 8.0 | |||||||
| ITC basis adjustment | (2.1 | ) | — | — | ||||||||
| Other differences | 0.1 | 0.3 | 6.7 | |||||||||
| Effective income tax rate | 21.7 | % | 25.4 | % | (240.0 | )% | ||||||
124
Deferred Tax Assets and Liabilities
The components of deferred income taxes are as follows (in millions):
| December 31, | ||||||||
| 2024 | 2023 | |||||||
| Deferred tax assets: | ||||||||
| NOL and credit carryforwards | $ | 796 | $ | 1,013 | ||||
| Impairments and development cost | 55 | 41 | ||||||
| Limited interest expense carryforward | 32 | 75 | ||||||
| Other differences | 174 | 116 | ||||||
| Deferred tax assets before valuation allowance | 1,057 | 1,245 | ||||||
| Valuation allowance | (91 | ) | (152 | ) | ||||
| Total deferred tax assets | 966 | 1,093 | ||||||
| Deferred tax liabilities: | ||||||||
| Property, plant and equipment | (1,555 | ) | (1,383 | ) | ||||
| Taxes related to derivative mark-to-market and risk management hedging activities | (163 | ) | (70 | ) | ||||
| Total deferred tax liabilities | (1,718 | ) | (1,453 | ) | ||||
| Net deferred tax asset (liability) | $ | (752 | ) | $ | (360 | ) | ||
NOL Carryforwards — As of December 31, 2024, our NOL carryforwards consisted primarily of federal NOL carryforwards of approximately $3.0 billion gross, of which the majority expire between 2028 and 2037 and NOL carryforwards in 21 states and the District of Columbia totaling approximately $1.5 billion, majority of which expire between 2025 and 2043. A portion of state NOLs is offset with a valuation allowance to address potential limitations on NOL usage prior to expiration. Certain state NOL carryforwards are subject to limitations on their annual usage in accordance with current state regulations and statutes. Additionally, as a result of the ownership change associated with the merger of Volt Merger Sub, Inc. with and into Calpine, pursuant to the terms of the Merger Agreement on March 8, 2018 (the “Merger”), the Company's ability to utilize certain NOL carryforwards are subject to limitations under Section 382 of the Internal Revenue Code of 1986, as amended.
Income Tax Audits — The Company remains subject to periodic audits and reviews by taxing authorities; however, these audits are not expected to have a material effect on the tax provision. Any NOLs claimed in future years to reduce taxable income could be subject to the Internal Revenue Service ("IRS") examination regardless of when the NOLs were generated. Any adjustment of state or federal returns could result in a reduction of deferred tax assets, rather than a cash payment of income taxes in tax jurisdictions where we have NOLs. The Company is currently under various state income tax audits for various periods.
Valuation Allowance — U.S. GAAP requires that we consider all available evidence, both positive and negative, and future earnings to determine whether, based on the weight of that evidence, a valuation allowance is needed to offset the value of deferred tax assets. As of December 31, 2024, we do not have a valuation allowance on our federal NOLs. We have a valuation allowance on portions of our state and foreign NOLs to address potential limitations on NOL usage prior to expiration. Majority of our interest expense is not limited. However, we have a full valuation allowance on the 163(j) interest expense deduction limitation carryforward that we do have. During the years ended December 31, 2024, 2023 and 2022, we recorded a change of worldwide valuation allowance in the amount of $(61) million, $19 million and $32 million, respectively. Changes are primarily related to the annual interest expense deduction limitation where it is not more likely than not we will be able to utilize the resulting carry forward in future periods. Future realization of the tax benefit of an existing deductible temporary difference or carryforward ultimately depends on the existence of sufficient taxable income of the appropriate character within the carryback or carryforward periods available under the tax law. As noted above, for purposes of this evaluation, we consider both the existence of future taxable earnings and the future reversal of existing temporary differences. To the extent that future expected sources of earnings materially changes, this could result in the reduction or increase in our valuation allowance in future periods.
The Inflation Reduction Act of 2022 — The Inflation Reduction Act of 2022 (the “IRA”) was signed into law on August 16, 2022. The IRA applies to tax years beginning after December 31, 2022, and introduces a 15% corporate alternative minimum tax (“CAMT”) for corporations whose average annual adjusted financial statement income (“AFSI”) for any consecutive three-tax year period preceding the tax year exceeds $1 billion. The IRS has issued multiple interim guidance in Notices 2023-7, 2023-20, 2023-64 and 2024-10. These guidelines should continue to be relied on for the tax years ending on or before September 13, 2024.
125
Subsequently, on September 12, 2024, the Treasury Department and the IRS released proposed regulations, Regulation 112129-23, which provides guidance on the application of certain sections of the CAMT. The proposed regulations include definitions and general rules for determining applicable financial statement income and address certain adjustments to AFSI as well as certain consolidated tax return issues. Generally, the proposed regulations will apply to tax years ending after September 13, 2024, with certain sections proposed to apply to years ending after the date of publication of final regulations in the Federal Register, with certain special applicability dates for tax consolidated groups. Provisions that may impact Calpine include, but are not limited to, AFSI adjustments for hedging transactions and hedged items and adjustments for section 168 property related to depreciation and impairment of property, plant, and equipment. The Company is currently assessing the impact of these proposed regulations. Should the Company become subject to CAMT, it could impact our future tax expense, cash taxes and effective tax rate.
The IRA includes provisions providing tax credit incentives for emerging technologies. The details of the implementation of these incentives are subject to ongoing regulations both proposed and finalized, by the Department of the Treasury. Calpine is monitoring these developments and will continue to evaluate opportunities to use these incentives in the future. Some of the notable Regulations issued by the IRS included the Final regulation on IRC 48 for Investment Tax Credit issued on December 12, 2024, as well as the Final regulation on IRC 45Y and 48E for tech-neutral ITC issued on January 15, 2025. Calpine continues to assess the impact of these final regulations but do not expect them to have a material impact on our operations. See additional discussion relating to the IRA in Item 1. Business — Governmental and Regulatory Matters.
Calpine accounts for the receipt of federal investment tax credits in the period an eligible project achieves commercial operation. Upon receipt of credit, the Company has elected to recognize the value of the credit either as a reduction in the cost basis of the underlying project assets, or as a deferred credit, with a corresponding recognition of a deferred tax asset in the same period. During the tax year ending December 31, 2024, the Company has received in excess of $400 million of investment tax credits. An aggregate of approximately $405 million in investment tax credits was sold for approximately $377 million, recognizing the discount loss on sale through Income Tax Expense and including within the annual effective tax rate calculation. All proceeds are reported in the Operating section of the consolidated statement of cash flows.
Limitation on Deductions of Net Business Interest Expense — For tax years starting on or after January 1, 2022, depreciation, amortization, and depletion may no longer be added back to the Adjusted Taxable Income calculation for purposes of determining deductibility of business interest expense. With this change, the amount of annual business interest expense Calpine can deduct is limited. Based on actual results for the year ended December 31, 2024, this limitation did not have a material impact on the financial results for the year ended December 31, 2024.
Unrecognized Tax Benefits
As of December 31, 2024 and 2023 there were unrecognized tax benefits of $25 million and $26 million, respectively; if recognized, $25 million of unrecognized tax benefits could affect the annual effective tax rate and no amount related to deferred tax assets, could be offset against the recorded valuation allowance resulting in no effect to the effective tax rate. The Company had accrued interest and penalties of $6 million and $5 million for income tax matters as of December 31, 2024 and 2023, respectively. We recognize interest and penalties related to unrecognized tax benefits in income tax expense (benefit) on the Consolidated Statements of Operations and recorded $1 million, $2 million, and nil for the years ended December 31, 2024, 2023 and 2022, respectively. The Company monitors and evaluates any changes in fact that could affect and/or modify the existing unrecognized tax benefit accrual as well as any new tax positions that require unrecognized tax benefits to be recorded. As of December 31, 2024, the Company performed a remeasurement of the prior year's uncertain tax position and a review for new positions. This review did not result in a material change to our recorded unrecognized current tax benefit.
A reconciliation of the beginning and ending amounts of unrecognized tax benefits is as follows (in millions):
| Year Ended December 31, | ||||||||||||
| 2024 | 2023 | 2022 | ||||||||||
| Balance, beginning of period | $ | (26 | ) | $ | (30 | ) | $ | (34 | ) | |||
| Decreases related to prior year tax positions | 1 | 4 | 4 | |||||||||
| Balance, end of period | $ | (25 | ) | $ | (26 | ) | $ | (30 | ) | |||
126
| 13. | Defined Contribution and Defined Benefit Plans |
There are two defined contribution savings plans that are intended to be tax-exempt under Sections 401(a) and 501(a) of the Internal Revenue Code (“IRC”). The non-union plan generally covers employees who are not covered by a collective bargaining agreement, and the union plan covers employees who are covered by a collective bargaining agreement. In 2018, an enhanced feature was added to the defined contribution plan for non-union employees consisting of a non-elective contribution for certain eligible employees who are active employees as of December 31. Expenses were recorded for these plans of approximately $28 million, $25 million and $21 million for the years ended December 31, 2024, 2023 and 2022, respectively. Employer matching contributions are 100% of the first 5% of compensation a participant defers for the non-union plan. The employee deferral limit is 75% of eligible compensation under both plans.
The Company also maintains defined benefit pension plans whereby retirement benefits are primarily a function of age attained, years of participation, years of service, vesting and level of compensation. Only approximately 3% of employees are eligible to participate in a defined benefit pension plan. As of December 31, 2024 and 2023, there were approximately $29 million and $28 million, respectively, in plan assets and approximately $29 million and $31 million, respectively, in pension liabilities. The net pension liability recorded on the Consolidated Balance Sheets as of December 31, 2024 and 2023 was approximately $0.1 million and $3 million, respectively. For the years ended December 31, 2024, 2023 and 2022, net periodic benefit costs of approximately $0.4 million, $1 million and $1 million, respectively. Net periodic benefit cost is included in operating and maintenance expense on the Consolidated Statements of Operations. As of December 31, 2024, 2023 and 2022, the total amount recognized in AOCI for actuarial (gains) losses related to pension obligation was approximately $(2) million, $1 million and $1 million, respectively.
Estimates of pension obligation and related costs use discount rates, an increase of compensation rates, and rates of return on assets that are reasonable. Due to the relatively small size of the pension liability (which is not considered material), significant changes in these assumptions would not have a material effect on pension liability. During the years ended December 31, 2024, 2023 and 2022, the Company made contributions of approximately $$0.1 million, $1 million and $2 million, respectively, and estimated contributions to the pension plan are expected to be approximately $0.2 million in 2025. Estimated future benefit payments to participants in each of the next five years are expected to be approximately $1.8 million to $2.2 million each year.
| 14. | Capital Structure |
Common Stock
As of December 31, 2024, the Company's authorized common stock consists of 1.4 million shares of Calpine Corporation common stock, consisting of 1.2 million Class A common shares and 200,000 Class B common shares, all of which have a par value of $0.001 per share. As of December 31, 2023, the Company's issued and outstanding common stock consisted of 952,153 Class A common shares, all held by CPN Management, L.P. and 47,847 Class B common shares held by certain members of the Company’s management. During the year ended December 31, 2024, we issued 804 Class B common shares, resulting in total issued and outstanding Class B shares of 48,651 at December 31, 2024. There were no changes to the number of issued and outstanding Class A common shares during the year ended December 31, 2024, which totaled 952,153 at December 31, 2024.
The Class B common shares outstanding in connection with the Fifth Amended and Restated Certificate of Incorporation of Calpine do not have voting rights, and all voting rights continue to be held by CPN Management, L.P. through its ownership of all Class A common shares. All rights and obligations of each class of shares are specified under the Stockholders Agreement and the Fifth Amended and Restated Certificate of Incorporation. There was no common stock activity as of December 31, 2024.
127
| 15. | Stock-Based Compensation |
Equity-based compensation agreement – Class B common shares of Calpine Corporation
Calpine Corporation issued 47,847 shares of Class B common shares on June 8, 2022, which were transferred by CPN Management, L.P. to certain members of Calpine management in exchange for and conversion of all outstanding vested and unvested Class B partnership interests held by such individuals in CPN Management, L.P. under the Third Amended and Restated Limited Partnership Agreement of CPN Management, L.P. The Class B common shares represent approximately 4.86% of the total shares of Calpine outstanding and will retain rights to the dividends of Calpine based on the ownership percentage pursuant to the terms in the Stockholders Agreement dated as of March 8, 2018, as amended (“Stockholders Agreement”) and the Fifth Amended and Restated Certificate of Incorporation of Calpine. The Class B common shares granted in June 2022 are fully vested as of December 31, 2024. During March 2024, Calpine Corporation granted an additional 804 shares of Class B common stock to members of Calpine management. All shares granted will vest three years from the grant date. As of December 31, 2024, the Class B common shares issued and outstanding represent approximately 4.86% of total outstanding shares of Calpine stock. All issued shares retain rights to the dividends of Calpine based on the ownership percentage pursuant to the terms in the Stockholders Agreement and the Fifth Amended and Restated Certificate of Incorporation of Calpine.
The Class B common shares qualify as an equity-classified award issued to members of management and resulted in approximately $2 million, $18 million, and $260 million of compensation expense recognized in the Consolidated Financial Statements for the years ended December 31, 2024, 2023 and 2022, respectively. Stock-based compensation expense is recognized over the period in which the related employee services are provided. Management used the results of a recently consummated continuation fund transaction among the controlling owners and their limited partner investors in June 2022 as the basis to estimate the fair value of employee Class B common shares on the grant date for measuring compensation expense. The fair value calculation is based on a discounted cash flow model incorporating key assumptions related to expected future distributions, a terminal value based on the consummated third-party transaction, and a discount rate with an appropriate risk adjustment to address market variability and the subjectivity associated with the key assumptions. For the years ended December 31, 2024, 2023 and 2022 cash payments to the Class B common shareholders were made related to dividends declared and paid by the Company.
Other Management Compensation
In addition to the Class B shares held by management accounted for as stock-based compensation at December 31, 2024 discussed above, certain members of management hold profit interest rights issued by CPN Management, L.P. This profit interest right will expire during 2025 if the required financial thresholds are not met. The second profit interest tranche was granted to members of management in fiscal year 2023. This grant has a service period requirement for management as well as additional financial performance thresholds, both of which must be met for the profit interest grant to vest. Both profit interest grants will be accounted for as stock-based compensation for management, and while the obligation will be held by CPN Management, L.P., which holds a 100% ownership interest in Calpine, any costs will be recognized by Calpine Corporation at the time vesting is deemed probable. No amounts have been recognized during the years ended December 31, 2024, 2023 and 2022.
| 16. | Commitments and Contingencies |
Long-Term Parts Supply and Construction Agreements
As of December 31, 2024, the total estimated commitments related to long-term parts supply and construction agreements associated with the development and construction of development projects, including battery storage and solar facilities, total approximately $54 million of which no was payments have been made to date. These commitments are payable over the remaining terms of the respective agreements over the next 2 years. The future commitment estimates for these agreements are based on the lesser of the statement payment terms in the contract at the time of execution or the termination payment that would be required if the Company terminated the agreement.
Long-Term Service Agreements
As of December 31, 2024, the total estimated commitments for Long-Term Service Agreements (“LTSAs”) associated with turbine maintenance services at certain facilities that are in operation were approximately $434 million. These commitments are payable over the remaining terms of the respective agreements, which range from 1 to 22 years. LTSA future commitment estimates are based on the stated payment terms in the contracts at the time of execution. Certain of these agreements have terms that allow for cancellation of the contracts for a fee. If such contracts are cancelled, the estimated commitments remaining for LTSAs will be reduced.
128
Production Royalties
The Company is obligated under numerous geothermal contracts and right-of-way, easement and surface agreements to pay production royalties from the Geysers Assets. The geothermal contracts generally provide for royalties based on production revenue with reductions for property taxes paid. The right-of-way, easement, and surface agreements are based on flat rates or adjusted based on consumer price index changes and are not material. Under the terms of most geothermal contracts, the royalties accrue as a percentage of power revenues. Certain properties also have net profits and overriding royalty interests in addition to the land base contract royalties. Some contracts contain clauses providing for minimum payments if production temporarily ceases or if production falls below a specified level. Production royalties for geothermal power plants for the years ended December 31, 2024, 2023 and 2022 were $25 million, $26 million and $26 million, respectively.
Gregory Holdings, LLC Agreement
On December 29, 2023, the Company entered into an investment agreement with Gregory Power Holdings, LLC through the execution of an amended and restated Limited Liability Company Agreement for Gregory Power Holdings, LLC. Gregory Power Holdings, LLC, through its wholly owned subsidiary, owns and operates a 385 MW combined cycle generation facility located in Texas. Under the terms of the LLC Agreement, the Company has obtained a 33% non-economic (for certain voting rights) and a 28.5% economic interest in Gregory Power Holdings, LLC, with an obligation to fund future cash contributions to Gregory Power Holdings, LLC until such a time as the Company's economic investment interest reaches 45% ownership in the entity. After such time, future contributions will be made by the Company and its partner in accordance with the respective ownership interests and the terms of the LLC Agreement. See Note 7, Variable Interest Entities and Unconsolidated Investments, for further discussion.
Commodity Purchases
The Company enters into commodity purchase contracts of various terms with third parties to supply fuel to natural gas-fired power plants and power to retail customers. The majority of purchases are made in the spot market or under index-priced contracts. These contracts are accounted for as executory contracts and therefore not recognized as liabilities on our Consolidated Balance Sheets. As of December 31, 2024, there are future commitments for the purchase, transportation or storage of commodities as detailed below (in millions):
| 2025 | $ | 447 | ||
| 2026 | 322 | |||
| 2027 | 186 | |||
| 2028 | 159 | |||
| 2029 | 74 | |||
| Thereafter | 261 | |||
| Total | $ | 1,449 |
Guarantees and Indemnifications
As part of normal business operations, the Company enters into various agreements providing, or otherwise arranging, financial or performance assurance to third parties on behalf of its subsidiaries in the ordinary course of such subsidiaries’ respective business. Such arrangements include guarantees, standby letters of credit, and surety bonds for power and natural gas purchase and sale arrangements, retail contracts, contracts associated with the development, construction, operation and maintenance of the fleet of power plants and battery storage facilities, and the Accounts Receivable Sales Program. The Accounts Receivable Sales Program is a receivables purchase agreement between Calpine Energy Solutions, LLC and Calpine Receivables, LLC, and the purchase and sale agreement between Calpine Receivables, LLC, and an unaffiliated financial institution, both which allows for the revolving sale of up to $500 million in certain trade accounts receivables to third parties.
These arrangements are entered into primarily to support or enhance the creditworthiness otherwise attributed to a subsidiary on a stand-alone basis, thereby facilitating the extension of sufficient credit to accomplish the subsidiaries’ intended commercial purposes.
129
As of December 31, 2024, standbys and the guarantee under the Accounts Receivable Sales Program and their respective expiration dates were as follows (in millions):
| Guarantee Commitments | 2025 | 2026 | 2027 | 2028 | 2029 | Thereafter | Total | |||||||||||||||||||||
| Guarantee of subsidiary obligations(1) | 8 | 6 | 6 | 5 | — | 12 | 37 | |||||||||||||||||||||
| Standby letters of credit(2)(3)(4) | 1,897 | 155 | — | — | — | — | 2,052 | |||||||||||||||||||||
| Surety bonds(4) | 114 | 4 | — | — | — | 309 | 427 | |||||||||||||||||||||
| Guarantee under Accounts Receivable Sales Program(5) | 391 | — | — | — | — | — | 391 | |||||||||||||||||||||
| Total | $ | 2,410 | $ | 165 | $ | 6 | $ | 5 | $ | — | $ | 321 | $ | 2,907 | ||||||||||||||
| (1) | Represents Calpine Corporation guarantees of certain power plant leases and related interest. All guaranteed finance leases are recorded on our Consolidated Balance Sheets. |
| (2) | The standby letters of credit disclosed above represent those disclosed in Note 8, Debt. |
| (3) | Letters of credit are renewed annually and as such all amounts are reflected in the year of letter of credit expiration. The related commercial obligations extend for multiple years, therefore, renewal of the letter of credit will likely follow the term of the associated commercial obligation. |
| (4) | These are contingent off-balance sheet obligations, and the majority of surety bonds do not have expiration or cancellation dates. As of December 31, 2024, no cash collateral is outstanding related to these bonds. |
| (5) | Calpine has guaranteed the performance of Calpine Energy Solutions, LLC under the Accounts Receivable Sales Program. The Accounts Receivable Sales Program was renewed on November 18, 2024, and expires on November 17, 2025. |
Issuance of letters of credit and various forms of surety bonds to third parties are routinely arranged in support of subsidiaries’ contractual arrangements of the types described above and may guarantee the operating performance of some partially-owned subsidiaries up to the Company’s ownership percentage. The letters of credit issued under various credit facilities support risk management and other operational and construction activities. In the event a subsidiary were to fail to perform its obligations under a contract supported by such a letter of credit or surety bond, and the issuing bank or surety were to make payment to the third party, the Company would be responsible for reimbursing the issuing bank or surety within an agreed timeframe, typically a period of one to five days. To the extent liabilities are incurred because of activities covered by letters of credit or surety bonds, such liabilities are included on the Consolidated Balance Sheets.
Commercial Agreements — In connection with the purchase and sale of power, natural gas, environmental products and fuel oil to and from third parties with respect to the operation of power plants and retail subsidiaries, there may be a requirement to guarantee a portion of the obligations of certain subsidiaries. The Company may also be required to guarantee performance obligations associated with marketing, hedging, optimization and trading activities to manage its exposure to changes in prices for energy commodities. These guarantees may include future payment obligations and effectively guarantee future performance under certain agreements.
Asset Acquisition and Disposition Agreements — In connection with purchase and sale agreements, the Company has frequently provided for indemnification to the counterparty for liabilities incurred as a result of a breach of a representation, warranty, or covenant by the indemnifying party. These indemnification obligations generally have a discrete term and are intended to protect the parties against risks that are difficult to predict or impossible to quantify at the time of the consummation of a particular transaction.
The potential exposure under guarantee and indemnification obligations can range from a specified amount to an unlimited dollar amount, depending on the nature of the claim and the particular transaction. The total maximum exposure under our guarantee and indemnification obligations is not estimable due to uncertainty as to whether claims will be made or how any potential claim will be resolved. As of December 31, 2024, there are no material outstanding claims related to guarantee and indemnification obligations, and is not anticipated that there will be a requirement to make any material payments under these guarantee and indemnification obligations.
130
Litigation
The Company is a party to various litigation matters, including regulatory and administrative proceedings arising out of the normal course of business. At the present time, it is not expected that the outcome of any of these proceedings, individually or in aggregate, will have a material adverse effect on the financial condition, results of operations, or cash flows.
On a quarterly basis, litigation activities are reviewed to determine if an unfavorable outcome is considered “remote,” “reasonably possible,” or “probable” as defined by U.S. GAAP. Where an unfavorable outcome is probable and is reasonably estimable, potential litigation losses are accrued. The liability ultimately incurred with respect to such litigation matters, in the event of a negative outcome, may be in excess of amounts currently accrued, if any; however, it is not expected that the reasonably possible outcome of these litigation matters would, individually or in the aggregate, have a material adverse effect on the Company’s financial condition, results of operations or cash flows. Where it is determined an unfavorable outcome is not probable or reasonably estimable, potential litigation losses are not accrued. The ultimate outcome of these litigation matters cannot presently be determined, nor can the liability that could potentially result from a negative outcome be reasonably estimated. As a result, no assurance is given that such litigation matters would, individually or in the aggregate, not have a material adverse effect on the Company’s financial condition, results of operations, or cash flows.
Winter Storm Uri
Regulatory Investigations and Other Litigation Matters — In the wake of the extreme weather event, Winter Storm Uri, a significant number of personal injuries, wrongful death and insurance subrogation lawsuits related to Winter Storm Uri were filed against ERCOT and participants in the ERCOT market, some of which name Calpine as a defendant. Calpine is vigorously defending itself against the claims alleged in the lawsuits. The lawsuits are now the subject of a Multi-District Litigation process for pretrial proceedings in the District Court in Harris County, Texas. The District Court ruled on initial motions to dismiss, granting, and denying various claims against Calpine and its subsidiaries in select “Bellweather” cases. Petitions for writs of mandamus appealing the District Court’s denial of the motions to dismiss the remaining claims were filed. The First District Court of Appeals reversed the District Court and dismissed the Bellweather cases against power generators, including Calpine. A motion for rehearing of the First Court’s decision was denied. Petitions for writs of mandamus are now currently pending before the Supreme Court of Texas.
Repricing Challenges — In addition, beginning in March 2021, various market participants filed appeals, lawsuits and a variety of other legal proceedings, including bankruptcy proceedings, challenging the PUCT’s and ERCOT’s actions during Winter Storm Uri seeking to reprice all or portions of the ERCOT energy prices during the week of the storm. Additionally, Calpine understands that various market participants have submitted numerous settlement disputes with ERCOT over power prices and other issues during Winter Storm Uri. Calpine is participating in some of these appeals, lawsuits, and other legal proceedings to protect its rights and defend against a retroactive repricing of the ERCOT market. Several such proceedings in which Calpine is involved are now pending before various federal, state, and appellate courts in Texas.
In the leading case, Luminant Energy Company, LLC v. PUCT, brought in March 2021, the Supreme Court of Texas rejected challenges to the PUCT's emergency orders during Winter Storm Uri and rendered judgement-affirming the PUCT's orders, holding (1) the PUCT did not violate its substantive authority under the Texas Utilities Code, and (2) the PUCT substantially complied with the Texas Administrative Procedure Act. While the Luminant outcome is positive for Calpine, a variety of legal proceedings, including bankruptcy proceedings and ERCOT settlement disputes, challenging the PUCT's and ERCOT's actions during Winter Storm Uri. Calpine will continue to participate in some of these other legal proceedings to protect its rights and defend against a retroactive repricing of the ERCOT market until these additional proceedings are dismissed or otherwise concluded in light of the Luminant decision.
The full impact of this litigation on our business, financial condition, results of operations, or cash flows cannot be estimated at this time. Accordingly, we will continue to monitor this situation through the conclusion of the remaining matters. For additional details of legislative actions, see Item 1. “Business — Governmental and Regulatory Matters.”
Environmental Matters
The Company is subject to complex and stringent environmental laws and regulations related to the operation of power plants. On occasion, environmental fees, penalties and fines associated with the operation of our power plants may be incurred. At the present time, there are no environmental violations or other matters that would have a material effect on the financial condition, results of operations or cash flows or that would significantly change operations.
131
| 17. | Related Party Transactions |
The Company has entered into various agreements with related parties associated with business operation. A description of these related party transactions is provided below.
Accounts Receivable Sales Program
On December 1, 2016, in conjunction with the acquisition of Calpine Solutions, the Company entered into the Accounts Receivable Sales Program which, as amended, allows the sale of, at a discount, up to $500 million in certain trade accounts receivable, arising from the sale of power and natural gas, from Calpine Solutions to Calpine Receivables which in turn sells 100% of the receivables to an unaffiliated financial institution, subject to certain contractual limitations. The Accounts Receivable Sales Program was renewed on November 18, 2024, and expires on November 17, 2025. Calpine Solutions services the receivables sold in exchange for a servicing fee, which was $19 million and $15 million for the years ended December 31, 2024 and 2023, respectively, and not material for the year ended December 31, 2022. The Company is not the primary beneficiary of Calpine Receivables and, accordingly, does not consolidate this entity in its Consolidated Financial Statements. See Note 7, Variable Interest Entities and Unconsolidated Investments, for a further discussion of unconsolidated VIEs. Any portion of the purchase price for the sold receivables which is not paid in cash is recorded as a note receivable. The note receivable is recorded at fair value. It does not materially differ from the carrying value of the trade accounts receivable held prior to the sale due to the short-term nature of the receivables and the high credit quality of the retail customers involved. Receivables sold under the Accounts Receivable Sales Program are accounted for as sales and excluded from accounts receivable on the Consolidated Balance Sheets and reflected as cash provided by operating activities on the Consolidated Statements of Cash Flows. Calpine has guaranteed the performance of Calpine Solutions under the Accounts Receivable Sales Program. See Note 16, Commitments and Contingencies, for a further description of guarantees.
Under the Accounts Receivable Sales Program, as of December 31, 2024 and 2023, there were $391 million and $360 million, respectively, in trade accounts receivable outstanding that were sold under the Accounts Receivable Sales Program and $75 million and $65 million, respectively, in notes receivable which were recorded on the Consolidated Balance Sheets as of December 31, 2024 and 2023, respectively. An aggregate of approximately $3,522 million, $3,537 million and $3,890 million in trade accounts receivable was sold and proceeds of approximately $3,511 million, $3,552 million and $3,852 million were recorded during the years ended December 31, 2024, 2023 and 2022, respectively. Interest charges and fees incurred on the sale of trade accounts receivable were $22 million, $23 million and immaterial for the years ended December 31, 2024, 2023 and 2022, respectively.
Lyondell — There is a ground lease agreement with Houston Refining, LP (“Houston Refining”), a subsidiary of LyondellBasell Industries N.V. (“Lyondell”), for the Channel Energy Center site from which power, capacity, and steam is sold to Houston Refining under a PPA. The Company also purchases refinery gas and raw water from Houston Refining under a facilities service agreement. One of the entities that has a material ownership interest in Calpine also has an ownership interest in Lyondell, whereby it may significantly influence the management and operating policies of Lyondell. The terms of the PPA with Lyondell were negotiated prior to the Merger closing. For the years ended December 31, 2024, 2023 and 2022, $65 million, $67 million and $140 million in operating revenues was recorded, respectively, and $14 million, $19 million and $36 million in operating expenses was recorded, respectively, associated with Lyondell. As of December 31, 2024 and 2023, the related party receivable associated with the Lyondell contract was $8 million and $5 million, respectively. As of December 31, 2024 and 2023, the related party payable associated with the Lyondell contract was immaterial.
Pasadena Performance Products — In October 2019, one of Calpine's subsidiaries entered into a steam contract with Pasadena Performance Products, LLC, a subsidiary of Next Wave Energy Partners, LP (“Next Wave”), to sell steam over an initial term of ten years commencing with the commercial operations of a chemical facility. One of the entities which has a material ownership interest in Calpine also has an ownership interest in Next Wave, whereby it may significantly influence the management and operating policies of Next Wave. The chemical facility met commercial operations on December 28, 2023, resulting in the commencement of the steam contract. During the year ended December 31, 2024 we recorded operating revenues of $24 million for the sale of steam and $5 million related to the successful completion of the construction of the interconnection from the chemical facility to our power plant. There were no revenues recognized from the contract during the year ended December 31, 2023. As of December 31, 2024 and 2023, the related party receivables and payables associated with the Pasadena Performance Products contracts were immaterial.
Gregory Power Holdings, LLC — During the year ended December 31, 2024, the Company made cash contributions of $44 million to Gregory Power Holdings, LLC. The revenues recognized for providing management services to Gregory Power Holdings, LLC for the year ended December 31, 2024, are immaterial. There were no revenues recognized for providing management services to Gregory Power Holdings, LLC during the years ended December 31, 2023 and 2022. As of December 31, 2024, the related party receivables and payables associated with Gregory Power Holdings, LLC were immaterial. As of December 31, 2023, there was no related party receivable and payable associated with Gregory Power Holdings, LLC.
132
Other — Other related party contracts for the sale or purchase of power, natural gas, capacity, steam and RECs were identified which are entered into in the ordinary course of business. Most of these contracts relate to the sale or purchase of commodities and capacity for varying tenors. For the years ended December 31, 2024, 2023 and 2022, $6 million, $3 million and $2 million in operating revenues were recorded, respectively, and $24 million, $24 million and $32 million in operating expenses were recorded, respectively, associated with these related party transactions. Additionally, for the years ended December 31, 2024 and 2023, the Company purchased $14 million and $7 million, respectively, of RECs from related parties. For the year ended December 31, 2022, we purchased RECs from related parties in an immaterial amount. The Company has also entered into a long-term land lease agreement with a related party. As of December 31, 2024 and 2023, the related party receivable and payable associated with these transactions were immaterial.
| 18. | Segment and Significant Customer Information |
Segment reporting is based on the management approach, using the method that management organizes the Company’s reportable segments for which separate financial information is made available to, and evaluated regularly by, the Company’s chief operating decision maker (“CODM”) in allocating resources and in assessing performance. The Company’s CODM is its Chief Executive Officer (“CEO”). The Company's business is assessed on a regional basis because differing characteristics of each region impact financial performance, particularly with respect to competition, regulation and other factors affecting supply and demand. At December 31, 2024, geographic reportable segments for the wholesale business are West (including geothermal), Texas, East (including Canada), and the Retail business. The results of Greenfield L.P. are included within the East segment within consolidated results effective September 5, 2023, as the acquisition of the remaining 50% equity interest of Greenfield LP was completed, detailed in Note 5, Acquisitions and LLC Agreement. The Company continues to evaluate the optimal manner in which performance is assessed, including segments, and future changes may result in changes to the geographic segments composition. Corporate (including consolidation and elimination entries) represents the remaining non-segment operations, primarily consisting of general corporate expenses, interest, taxes and other expenses related to support functions that provide shared services to operating segments as well as the elimination of intercompany activity.
133
The Company’s CODM evaluates financial performance of each segment using a variety of measures including Commodity Margin, Gross Margin, Net Income, Adjusted Net Income, Adjusted Free Cash Flow, Adjusted Unlevered Free Cash Flow and the allocation of capital. For the purposes of the disclosure we have included the measures most closely aligned with GAAP. The tables below show financial data for the segments which is evaluated by the CODM for the periods indicated (in millions):
| Year Ended December 31, 2024 | ||||||||||||||||||||||||
| Wholesale | ||||||||||||||||||||||||
| West | Texas | East | Retail | Consolidation and Elimination | Total | |||||||||||||||||||
| Operating revenues: | ||||||||||||||||||||||||
| Commodity revenue | $ | 3,901 | $ | 3,351 | $ | 2,675 | $ | 4,645 | $ | (2,325 | ) | $ | 12,247 | |||||||||||
| Mark-to-market gain (loss) | 307 | 90 | (207 | ) | (103 | ) | 31 | 118 | ||||||||||||||||
| Other revenue | 32 | 49 | 56 | — | (68 | ) | 69 | |||||||||||||||||
| Operating revenues | $ | 4,240 | $ | 3,490 | $ | 2,524 | $ | 4,542 | $ | (2,362 | ) | $ | 12,434 | |||||||||||
| Operating expenses: | ||||||||||||||||||||||||
| Fuel and purchased energy expense | ||||||||||||||||||||||||
| Commodity expense | 1,914 | 2,146 | 1,490 | 3,925 | (2,326 | ) | 7,149 | |||||||||||||||||
| Mark-to-market gain (loss) | 176 | (13 | ) | (197 | ) | (16 | ) | 31 | (19 | ) | ||||||||||||||
| Fuel and purchased energy expense | 2,090 | 2,133 | 1,293 | 3,909 | (2,295 | ) | 7,130 | |||||||||||||||||
| Operating and maintenance expense associated with margin generation activities | 510 | 369 | 381 | 203 | — | 1,463 | ||||||||||||||||||
| Depreciation and amortization expense associated with margin generation activities | 293 | 204 | 209 | 37 | — | 743 | ||||||||||||||||||
| Gross margin | $ | 1,347 | $ | 784 | $ | 641 | $ | 393 | $ | (67 | ) | $ | 3,098 | |||||||||||
| Operating and maintenance expense associated with general corporate cost | 14 | 16 | 11 | 22 | (68 | ) | (5 | ) | ||||||||||||||||
| Depreciation and amortization expense associated with general corporate cost | — | — | — | — | 27 | 27 | ||||||||||||||||||
| General and other administrative expense | 46 | 65 | 43 | 16 | — | 170 | ||||||||||||||||||
| Other operating expenses | 59 | 26 | 11 | 4 | — | 100 | ||||||||||||||||||
| Loss on sale of assets, net | — | 13 | — | — | — | 13 | ||||||||||||||||||
| Loss from unconsolidated subsidiaries | — | — | — | 4 | — | 4 | ||||||||||||||||||
| Income (loss) from operations | 1,228 | 664 | 576 | 347 | (26 | ) | 2,789 | |||||||||||||||||
| Interest expense | 220 | 208 | 157 | 3 | (4 | ) | 584 | |||||||||||||||||
| Loss on extinguishment of debt | 16 | 23 | 13 | — | — | 52 | ||||||||||||||||||
| Other expense, net | 1 | (13 | ) | (4 | ) | 43 | 4 | 31 | ||||||||||||||||
| Income before income taxes | 991 | 446 | 410 | 301 | (26 | ) | 2,122 | |||||||||||||||||
| Income tax expense | 137 | 196 | 121 | 6 | — | 460 | ||||||||||||||||||
| Net income (loss) | $ | 854 | $ | 250 | $ | 289 | $ | 295 | $ | (26 | ) | $ | 1,662 | |||||||||||
134
| Year Ended December 31, 2023 | ||||||||||||||||||||||||
| Wholesale | ||||||||||||||||||||||||
| West | Texas | East | Retail | Consolidation and Elimination | Total | |||||||||||||||||||
| Operating revenues: | ||||||||||||||||||||||||
| Commodity revenue | $ | 3,812 | $ | 4,071 | $ | 2,316 | $ | 4,511 | $ | (3,203 | ) | $ | 11,507 | |||||||||||
| Mark-to-market gain (loss) | 1,923 | 37 | 217 | 675 | $ | (721 | ) | 2,131 | ||||||||||||||||
| Other revenue | 24 | 34 | 51 | — | (60 | ) | 49 | |||||||||||||||||
| Operating revenues | $ | 5,759 | $ | 4,142 | $ | 2,584 | $ | 5,186 | $ | (3,984 | ) | $ | 13,687 | |||||||||||
| Operating expenses: | ||||||||||||||||||||||||
| Fuel and purchased energy expense | ||||||||||||||||||||||||
| Commodity expense | 2,387 | 3,008 | 1,256 | 3,863 | (3,203 | ) | 7,311 | |||||||||||||||||
| Mark-to-market gain (loss) | 551 | 16 | 518 | 884 | (721 | ) | 1,248 | |||||||||||||||||
| Fuel and purchased energy expense | 2,938 | 3,024 | 1,774 | 4,747 | (3,924 | ) | 8,559 | |||||||||||||||||
| Operating and maintenance expense associated with margin generation activities | 495 | 320 | 330 | 194 | — | 1,339 | ||||||||||||||||||
| Depreciation and amortization expense associated with margin generation activities | 278 | 203 | 191 | 38 | — | 710 | ||||||||||||||||||
| Gross margin | $ | 2,048 | $ | 595 | $ | 289 | $ | 207 | $ | (60 | ) | $ | 3,079 | |||||||||||
| Operating and maintenance expense associated with general corporate cost | 20 | 20 | 16 | 18 | (60 | ) | 14 | |||||||||||||||||
| Depreciation and amortization expense associated with general corporate cost | — | — | — | — | 25 | 25 | ||||||||||||||||||
| General and other administrative expense | 46 | 60 | 44 | 18 | — | 168 | ||||||||||||||||||
| Other operating expenses | 44 | 23 | 30 | 5 | — | 102 | ||||||||||||||||||
| Loss (income) from unconsolidated subsidiaries | — | — | (12 | ) | 9 | — | (3 | ) | ||||||||||||||||
| Income (loss) from operations | 1,938 | 492 | 211 | 157 | (25 | ) | 2,773 | |||||||||||||||||
| Interest expense | 209 | 198 | 150 | 3 | (5 | ) | 555 | |||||||||||||||||
| Loss on extinguishment of debt | 6 | 6 | 4 | — | — | 16 | ||||||||||||||||||
| Other expense, net | 9 | 7 | 8 | 37 | 4 | 65 | ||||||||||||||||||
| Income before income taxes | 1,714 | 281 | 49 | 117 | (24 | ) | 2,137 | |||||||||||||||||
| Income tax expense | 154 | 211 | 171 | 6 | — | 542 | ||||||||||||||||||
| Net income (loss) | $ | 1,560 | $ | 70 | $ | (122 | ) | $ | 111 | $ | (24 | ) | $ | 1,595 | ||||||||||
Significant Customers
For the years ended December 31, 2024 and 2023, no customer individually accounted for more than 10% of consolidated revenues. For the year ended December 31, 2022, one customer (representing 11% of consolidated revenues) individually accounted for more than 10% of consolidated revenues.
135
| 19. | Subsequent Events |
On January 9, 2025, the Company completed the redemption of the remaining $140 million of the outstanding principal of the 2026 First Lien Notes.
On January 10, 2025, the Company announced that it entered into a Plan of Merger Agreement with Constellation Energy Corporation. The Plan of Merger Agreement provides for a series of Reorganization related transactions on terms set forth in the Merger Agreement. As a result of the Reorganization and Plan of Merger, Calpine will become an indirect, wholly owned subsidiary of Constellation. Subject to the terms and conditions of the Plan of Merger Agreement, Constellation will acquire Calpine in a cash and stock transaction valued at an equity purchase price of approximately $16.4 billion, composed of 50 million shares of Constellation stock and $4.5 billion in cash plus the assumption of approximately $12.7 billion of Calpine net debt. After accounting for cash that is expected to be generated by Calpine between signing and the expected closing date, as well as the value of tax attributes at Calpine, the net purchase price is $26.6 billion. Both Constellation and Calpine’s Board of Directors unanimously approved the Plan of Merger Agreement. The completion of the Plan of Merger does not require approval of the Constellation stockholders.
Consummation of the Plan of Merger is subject to the satisfaction or waiver of specified closing conditions, including obtaining regulatory approvals which may require the divestiture of certain generation facilities of the combined entities in the future. The Plan of Merger Agreement may be terminated by either Constellation or Calpine under certain circumstances, including if the Plan of Merger is not consummated by December 31, 2025 (which date may be automatically extended to June 1, 2026, as provided in the Plan of Merger Agreement).
136
CALPINE CORPORATION AND SUBSIDIARIES
SCHEDULE II VALUATION AND QUALIFYING ACCOUNTS
(Unaudited)
| Description | Balance at Beginning of Year | Charged to Expense | Charged to Other Accounts | Deductions(1) | Balance at End of Year | |||||||||||||||
| (in millions) | ||||||||||||||||||||
| Year Ended December 31, 2024 | ||||||||||||||||||||
| Allowance for doubtful accounts | $ | 13 | $ | 5 | $ | (6 | ) | $ | — | $ | 12 | |||||||||
| Deferred tax asset valuation allowance | $ | 152 | $ | (61 | ) | $ | — | $ | — | $ | 91 | |||||||||
| Year Ended December 31, 2023 | ||||||||||||||||||||
| Allowance for doubtful accounts | $ | 13 | $ | 6 | $ | (6 | ) | $ | — | $ | 13 | |||||||||
| Deferred tax asset valuation allowance | $ | 133 | $ | 22 | $ | (3 | ) | $ | — | $ | 152 | |||||||||
| (1) | Deductions related to the allowance for doubtful accounts represent write-offs of accounts considered to be uncollectible and previously reserved. Deductions related to the valuation allowance represent write-offs of the deferred tax asset balances that have expired and were previously reserved. |
137