January 2018
This presentation and the other information furnished by or on behalf of the Company includes certain forward‐looking statements, forecasts, projections and estimates,
including statements regarding the Company’s capital structure, proposed refinancing transaction and Q4 and full year 2017 estimated financial performance, and such
forward‐looking statements, forecasts, projections and estimates (including those contained in certain visual depictions) should not be viewed as facts. Any such forward‐
looking statements, forecasts, projections or estimates reflect current expectations and/or beliefs concerning future events, and are based on various assessments and
assumptions by the Company (not all of which are included herein). No representations or warranties are made by the Company or any of its affiliates as to the accuracy or
completeness of any such forward‐looking statements, forecasts, projections or estimates (or the assessments or assumptions on which they are based). Any such forward‐
looking statements, forecasts, projections and estimates are subject to a number of risks and uncertainties, both known and unknown, that may cause actual performance to
differ materially from that implied or expressed in such forward‐looking statements, forecasts, projections and estimates and are not a guarantee of financial performance.
Whether or not any such forward‐looking statements, forecasts, projections or estimates are in fact achieved will depend upon future events, many of which are not within the
control of the Company. Accordingly, actual results may vary from the results expressed in such forward‐looking statements, forecasts, projections or estimates, and such
variations may be material. As a result, you should not place undue reliance on any forward‐looking statements, forecasts, projections or estimates. These forward‐looking
statements, forecasts, projections and estimates speak only as of the date they were developed, and the Company and its affiliates do not undertake any obligation to update,
supplement or revise any forward‐looking statements, forecasts, projections or estimates, whether as a result of new information, future events or otherwise. This
presentation contains information about certain proposed transactions, including a potential refinancing of the Company’s existing indebtedness. There can be no assurance
that any such transactions will be consummated on the terms described herein or at all.
This presentation includes certain non‐GAAP financial measures of the Company, including Adjusted EBITDA and Free Cash Flow. Such non‐GAAP measures are not recognized
under accounting principles generally accepted in the United States, or “GAAP” and the items excluded therefrom are significant components in understanding and assessing
the Company’s financial performance. Because not all companies calculate these measures identically (if at all), the presentations herein may not be comparable to other
similarly titled measures used by other companies. Further, any non‐GAAP financial measures presented in this presentation should not be considered in isolation or as
substitutes for the information contained in the historical financial information of the Company prepared in accordance with GAAP as an indicator of the Company’s financial
performance or liquidity. Reconciliations of these non‐GAAP financial measures are provided in the Appendix to this presentation.
The preliminary Q4 and full year 2017 financial results included in this presentation are preliminary, unaudited and subject to completion, and may change as a result of
management’s review of results and other factors, including a wide variety of significant business, economic and competitive risks and uncertainties. Such preliminary results
are subject to the closing of the fourth quarter and full year of 2017 and finalization of fourth quarter and full year financial and accounting procedures (which have yet to be
performed) and should not be viewed as a substitute for our audited annual financial statements prepared in accordance with accounting principles generally accepted in the
U.S. We caution you that the preliminary financial results are not guarantees of future performance or outcomes, and that actual results may differ materially from
management’s current estimates. Neither our independent registered public accounting firm nor any other independent registered public accounting firm has audited,
reviewed or compiled, examined or performed any procedures with respect to the preliminary 2017 financial results, nor have they expressed any opinion or any other form of
assurance on the preliminary results.
Forward‐Looking Statements and Non‐
GAAP Measures
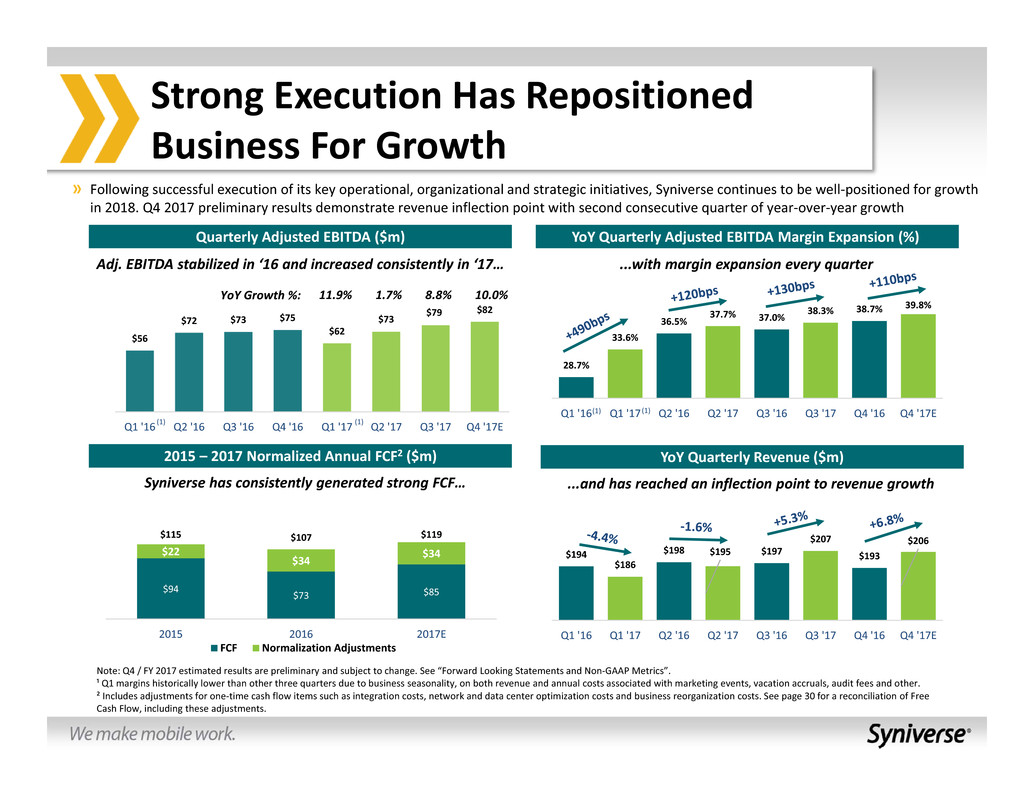
$79
$56
$72 $73 $75
$62
$73
$82
Q1 '16 Q2 '16 Q3 '16 Q4 '16 Q1 '17 Q2 '17 Q3 '17 Q4 '17E
Strong Execution Has Repositioned
Business For Growth
Quarterly Adjusted EBITDA ($m)
Adj. EBITDA stabilized in ‘16 and increased consistently in ‘17…
YoY Quarterly Adjusted EBITDA Margin Expansion (%)
28.7%
33.6%
36.5%
37.7% 37.0%
38.3% 38.7%
39.8%
Q1 '16 Q1 '17 Q2 '16 Q2 '17 Q3 '16 Q3 '17 Q4 '16 Q4 '17E
...with margin expansion every quarter
Note: Q4 / FY 2017 estimated results are preliminary and subject to change. See “Forward Looking Statements and Non‐GAAP Metrics”.
¹ Q1 margins historically lower than other three quarters due to business seasonality, on both revenue and annual costs associated with marketing events, vacation accruals, audit fees and other.
² Includes adjustments for one‐time cash flow items such as integration costs, network and data center optimization costs and business reorganization costs. See page 30 for a reconciliation of Free
Cash Flow, including these adjustments.
(1) (1)
$94
$73 $85
$22
$34
$34
$115 $107 $119
2015 2016 2017E
FCF Normalization Adjustments
2015 – 2017 Normalized Annual FCF2 ($m)
Syniverse has consistently generated strong FCF…
YoY Quarterly Revenue ($m)
...and has reached an inflection point to revenue growth
(1) (1)
Following successful execution of its key operational, organizational and strategic initiatives, Syniverse continues to be well‐positioned for growth
in 2018. Q4 2017 preliminary results demonstrate revenue inflection point with second consecutive quarter of year‐over‐year growth
$195
$206
$194
$186
$198 $197
$207
$193
Q1 '16 Q1 '17 Q2 '16 Q2 '17 Q3 '16 Q3 '17 Q4 '16 Q4 '17E
YoY Growth %: 11.9% 1.7% 8.8% 10.0%
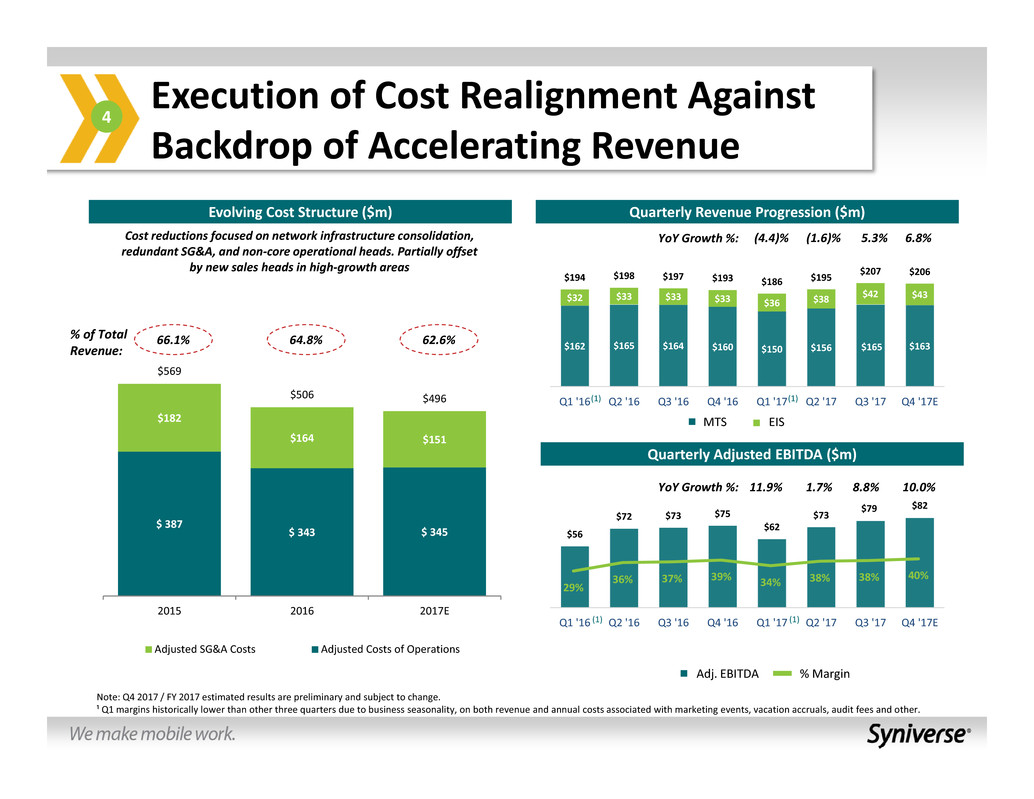
$79
$56
$72 $73 $75
$62
$73
$82
Q1 '16 Q2 '16 Q3 '16 Q4 '16 Q1 '17 Q2 '17 Q3 '17 Q4 '17E
29%
36% 37% 39% 34% 38% 38%
40%
$162 $165 $164 $160 $150 $156 $165 $163
$32 $33 $33 $33 $36 $38
$42 $43
$194 $198 $197 $193 $186 $195
$207 $206
Q1 '16 Q2 '16 Q3 '16 Q4 '16 Q1 '17 Q2 '17 Q3 '17 Q4 '17E
$ 387
$ 343 $ 345
$182
$164 $151
$569
$506 $496
2015 2016 2017E
Adjusted SG&A Costs Adjusted Costs of Operations
Execution of Cost Realignment Against
Backdrop of Accelerating Revenue
Evolving Cost Structure ($m) Quarterly Revenue Progression ($m)
Quarterly Adjusted EBITDA ($m)
4
MTS EIS
Adj. EBITDA % Margin
Cost reductions focused on network infrastructure consolidation,
redundant SG&A, and non‐core operational heads. Partially offset
by new sales heads in high‐growth areas
% of Total
Revenue:
66.1% 64.8% 62.6%
Note: Q4 2017 / FY 2017 estimated results are preliminary and subject to change.
¹ Q1 margins historically lower than other three quarters due to business seasonality, on both revenue and annual costs associated with marketing events, vacation accruals, audit fees and other.
YoY Growth %: (4.4)% (1.6)% 5.3% 6.8%
YoY Growth %: 11.9% 1.7% 8.8% 10.0%
(1) (1)
(1) (1)
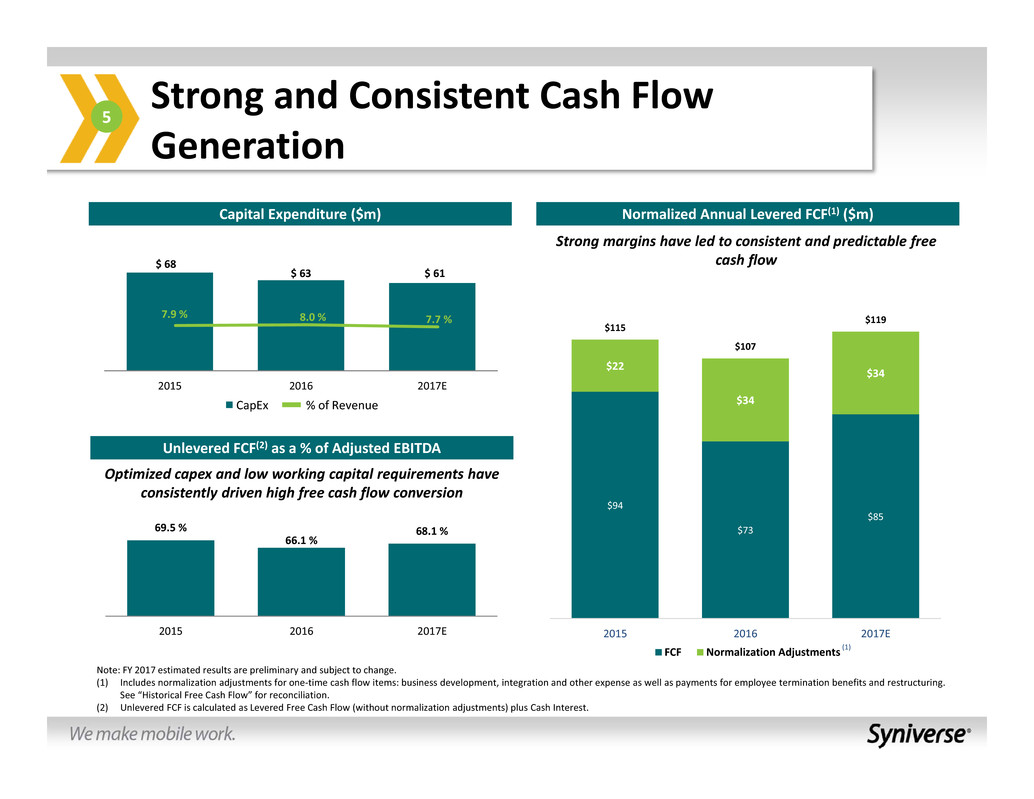
$ 68
$ 63 $ 61
2015 2016 2017E
7.9 % 8.0 % 7.7 %
Strong and Consistent Cash Flow
Generation
Capital Expenditure ($m)
Note: FY 2017 estimated results are preliminary and subject to change.
(1) Includes normalization adjustments for one‐time cash flow items: business development, integration and other expense as well as payments for employee termination benefits and restructuring.
See “Historical Free Cash Flow” for reconciliation.
(2) Unlevered FCF is calculated as Levered Free Cash Flow (without normalization adjustments) plus Cash Interest.
Unlevered FCF(2) as a % of Adjusted EBITDA
CapEx % of Revenue
5
Normalized Annual Levered FCF(1) ($m)
(1)
Strong margins have led to consistent and predictable free
cash flow
Optimized capex and low working capital requirements have
consistently driven high free cash flow conversion
69.5 %
66.1 %
68.1 %
2015 2016 2017E
$94
$73
$85
$22
$34
$34
$115
$107
$119
2015 2016 2017E
FCF Normalization Adjustments

$75
$82
Q4 2016 Q4 2017E
38.7%
39.8%
2017 Q4 Preliminary Results Highlights
2017 Q4 revenue of ~$206 million represents a 6.8% increase year‐over‐
year, continuing to demonstrate revenue inflection with second
consecutive quarter of year‐over‐year growth
The Company’s MTS business grew 2% year‐over‐year as CDMA declines of $3
million were more than offset by growth of $6 million within the Company's LTE
portfolio, which includes IPX and LTE signaling, as well as the Company's policy and
charging solutions
Year‐over‐year growth in EIS revenue totaled 29%, driven primarily by growth in
A2P, which continues to benefit from strong industry tailwinds
2017 Q4 Adjusted EBITDA of ~$82 million grew 10.0% and generated a
39.8% margin representing year‐over‐year margin expansion of 110bps
Enhanced revenue growth and improved cost structure has resulted in the
Company's fourth consecutive quarter of year‐over‐year Adjusted EBITDA growth
and year‐over‐year margin expansion
Cost reduction and realignment initiatives completed over the last three years have
improved cost structure, yielding over $100 million of cost savings and increasing
the Company's ability to invest in future growth
Margin profile of MTS growth products more than offsetting margin impact of
declines in high margin legacy business
Revenue ($m)
Adjusted EBITDA ($m)
$160 $163
$33 $43
$193
$206
Q4 2016 Q4 2017E
MTS EIS
Adjusted EBITDA Margin
Note: The preliminary Q4 and full year 2017 financial results included in this presentation are preliminary, unaudited and subject to completion, and may change as a result of management’s
review of results and other factors, including a wide variety of significant business, economic and competitive risks and uncertainties. Such preliminary results are subject to the closing of the
fourth quarter and full year of 2017 and finalization of fourth quarter and full year financial and accounting procedures (which have yet to be performed) and should not be viewed as a
substitute for our audited annual financial statements prepared in accordance with accounting principles generally accepted in the U.S. We caution you that the preliminary financial results are
not guarantees of future performance or outcomes, and that actual results may differ materially from management’s current estimates. Neither our independent registered public accounting
firm nor any other independent registered public accounting firm has audited, reviewed or compiled, examined or performed any procedures with respect to the preliminary 2017 financial
results, nor have they expressed any opinion or any other form of assurance on the preliminary results.
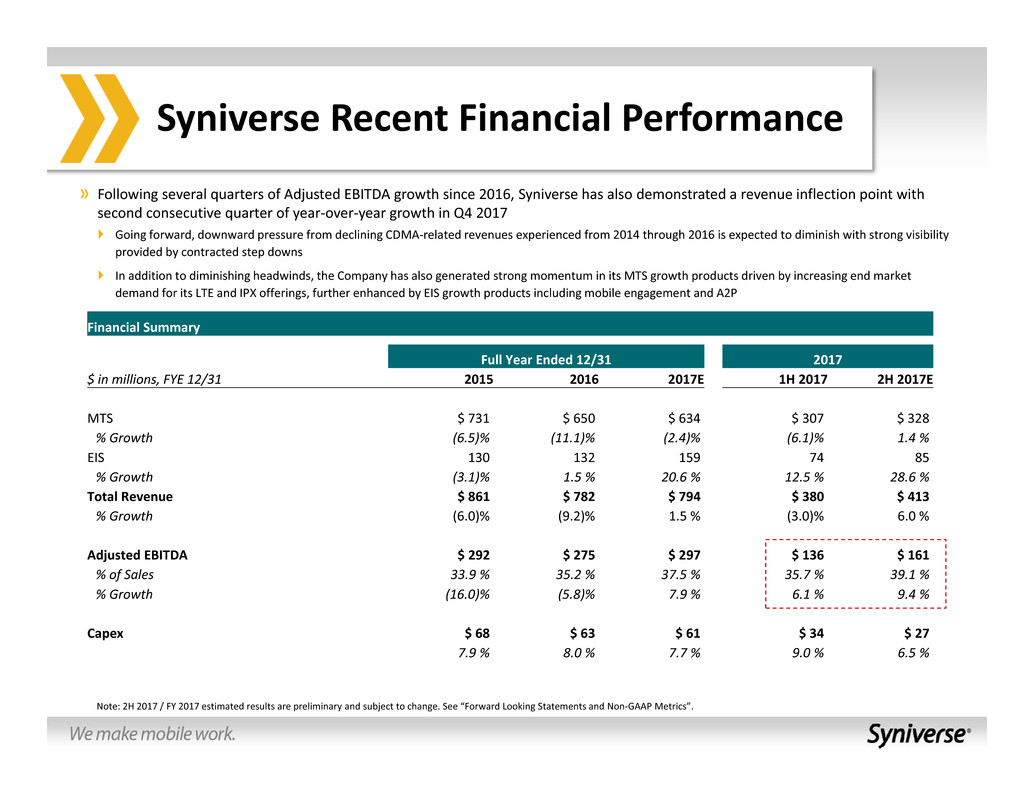
Syniverse Recent Financial Performance
Following several quarters of Adjusted EBITDA growth since 2016, Syniverse has also demonstrated a revenue inflection point with
second consecutive quarter of year‐over‐year growth in Q4 2017
Going forward, downward pressure from declining CDMA‐related revenues experienced from 2014 through 2016 is expected to diminish with strong visibility
provided by contracted step downs
In addition to diminishing headwinds, the Company has also generated strong momentum in its MTS growth products driven by increasing end market
demand for its LTE and IPX offerings, further enhanced by EIS growth products including mobile engagement and A2P
Financial Summary
Full Year Ended 12/31 2017
$ in millions, FYE 12/31 2015 2016 2017E 1H 2017 2H 2017E
MTS $ 731 $ 650 $ 634 $ 307 $ 328
% Growth (6.5)% (11.1)% (2.4)% (6.1)% 1.4 %
EIS 130 132 159 74 85
% Growth (3.1)% 1.5 % 20.6 % 12.5 % 28.6 %
Total Revenue $ 861 $ 782 $ 794 $ 380 $ 413
% Growth (6.0)% (9.2)% 1.5 % (3.0)% 6.0 %
Adjusted EBITDA $ 292 $ 275 $ 297 $ 136 $ 161
% of Sales 33.9 % 35.2 % 37.5 % 35.7 % 39.1 %
% Growth (16.0)% (5.8)% 7.9 % 6.1 % 9.4 %
Capex $ 68 $ 63 $ 61 $ 34 $ 27
7.9 % 8.0 % 7.7 % 9.0 % 6.5 %
Note: 2H 2017 / FY 2017 estimated results are preliminary and subject to change. See “Forward Looking Statements and Non‐GAAP Metrics”.
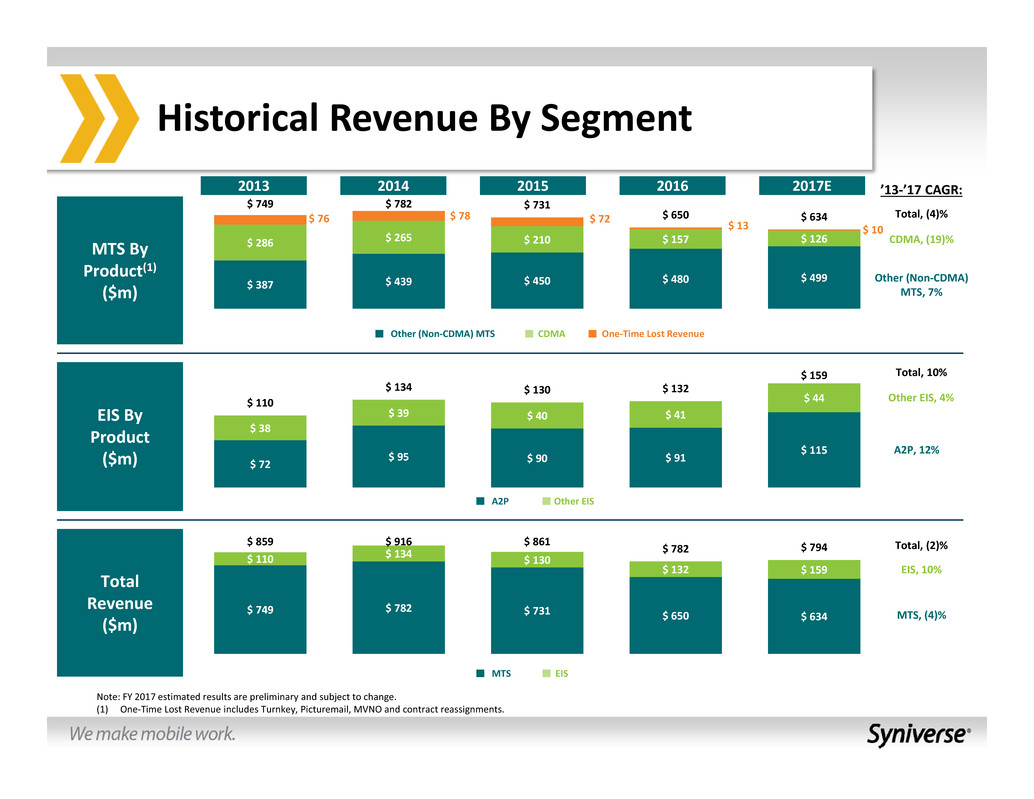
Historical Revenue By Segment
2013 2014 2015 2016 2017E
MTS By
Product(1)
($m)
’13‐’17 CAGR:
Other (Non‐CDMA)
MTS, 7%
CDMA, (19)%
MTS EIS
EIS, 10%
MTS, (4)%
A2P, 12%
Other EIS, 4%
EIS By
Product
($m)
Total, (4)%
Total, 10%
Total, (2)%
Total
Revenue
($m)
A2P Other EIS
Note: FY 2017 estimated results are preliminary and subject to change.
(1) One‐Time Lost Revenue includes Turnkey, Picturemail, MVNO and contract reassignments.
$ 387 $ 439 $ 450 $ 480
$ 499
$ 286 $ 265 $ 210 $ 157 $ 126
$ 76 $ 78 $ 72
$ 13 $ 10
$ 749 $ 782 $ 731
$ 650 $ 634
Other (Non‐CDMA) MTS CDMA One‐Time Lost Revenue
$ 72
$ 95 $ 90 $ 91
$ 115
$ 38
$ 39 $ 40 $ 41
$ 44 $ 110
$ 134 $ 130 $ 132
$ 159
$ 749 $ 782 $ 731 $ 650 $ 634
$ 110 $ 134 $ 130
$ 132 $ 159
$ 859 $ 916 $ 861
$ 782 $ 794
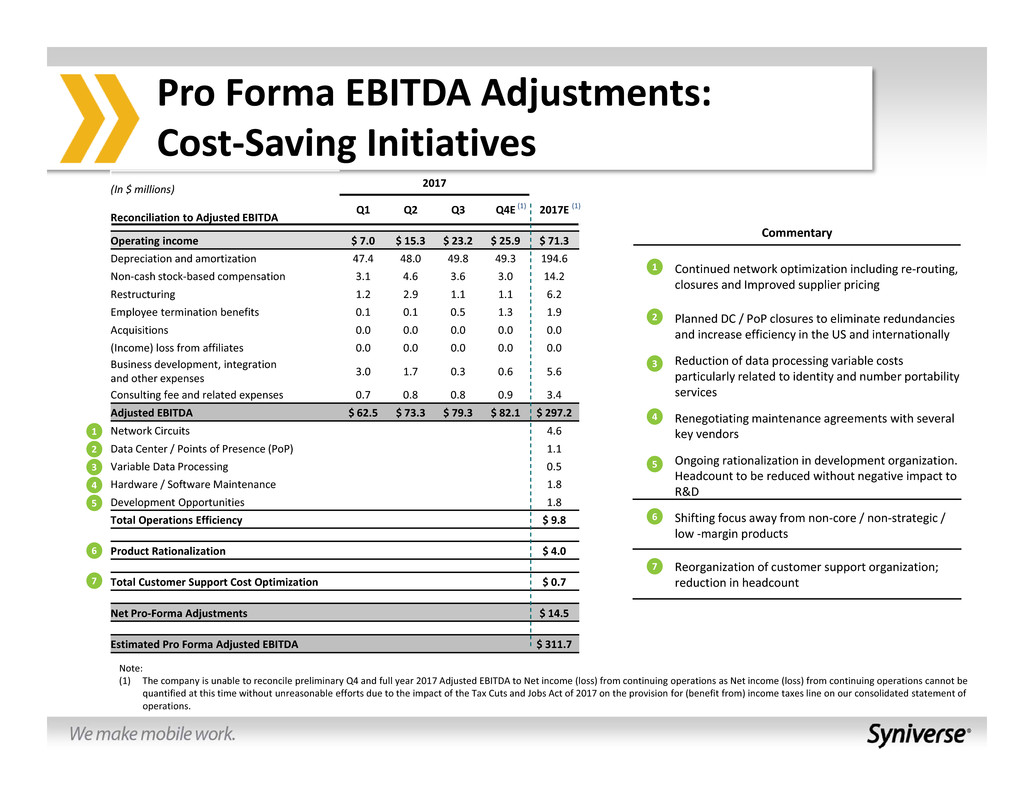
(In $ millions)
Reconciliation to Adjusted EBITDA
2017
Q1 Q2 Q3 Q4E 2017E
Operating income $ 7.0 $ 15.3 $ 23.2 $ 25.9 $ 71.3
Depreciation and amortization 47.4 48.0 49.8 49.3 194.6
Non‐cash stock‐based compensation 3.1 4.6 3.6 3.0 14.2
Restructuring 1.2 2.9 1.1 1.1 6.2
Employee termination benefits 0.1 0.1 0.5 1.3 1.9
Acquisitions 0.0 0.0 0.0 0.0 0.0
(Income) loss from affiliates 0.0 0.0 0.0 0.0 0.0
Business development, integration
and other expenses
3.0 1.7 0.3 0.6 5.6
Consulting fee and related expenses 0.7 0.8 0.8 0.9 3.4
Adjusted EBITDA $ 62.5 $ 73.3 $ 79.3 $ 82.1 $ 297.2
Network Circuits 4.6
Data Center / Points of Presence (PoP) 1.1
Variable Data Processing 0.5
Hardware / Software Maintenance 1.8
Development Opportunities 1.8
Total Operations Efficiency $ 9.8
Product Rationalization $ 4.0
Total Customer Support Cost Optimization $ 0.7
Net Pro‐Forma Adjustments $ 14.5
Estimated Pro Forma Adjusted EBITDA $ 311.7
Pro Forma EBITDA Adjustments:
Cost‐Saving Initiatives
Note:
(1) The company is unable to reconcile preliminary Q4 and full year 2017 Adjusted EBITDA to Net income (loss) from continuing operations as Net income (loss) from continuing operations cannot be
quantified at this time without unreasonable efforts due to the impact of the Tax Cuts and Jobs Act of 2017 on the provision for (benefit from) income taxes line on our consolidated statement of
operations.
(1) (1)
1
Commentary
Continued network optimization including re‐routing,
closures and Improved supplier pricing
Planned DC / PoP closures to eliminate redundancies
and increase efficiency in the US and internationally
Reduction of data processing variable costs
particularly related to identity and number portability
services
Renegotiating maintenance agreements with several
key vendors
Ongoing rationalization in development organization.
Headcount to be reduced without negative impact to
R&D
Shifting focus away from non‐core / non‐strategic /
low ‐margin products
Reorganization of customer support organization;
reduction in headcount
2
3
4
5
1
2
3
4
5
6
7
6
7
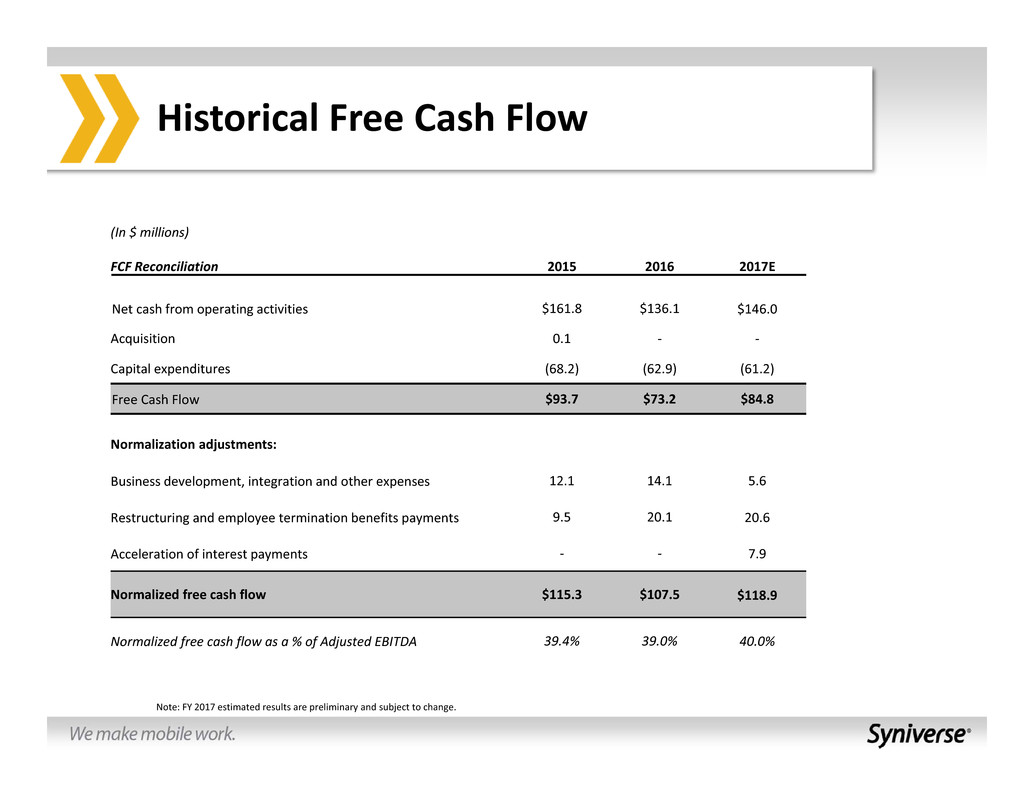
(In $ millions)
FCF Reconciliation 2015 2016 2017E
Net cash from operating activities $161.8 $136.1 $146.0
Acquisition 0.1 ‐ ‐
Capital expenditures (68.2) (62.9) (61.2)
Free Cash Flow $93.7 $73.2 $84.8
Normalization adjustments:
Business development, integration and other expenses 12.1 14.1 5.6
Restructuring and employee termination benefits payments 9.5 20.1 20.6
Acceleration of interest payments ‐ ‐ 7.9
Normalized free cash flow $115.3 $107.5 $118.9
Normalized free cash flow as a % of Adjusted EBITDA 39.4% 39.0% 40.0%
Historical Free Cash Flow
Note: FY 2017 estimated results are preliminary and subject to change.
Appendix: Supplementary Materials
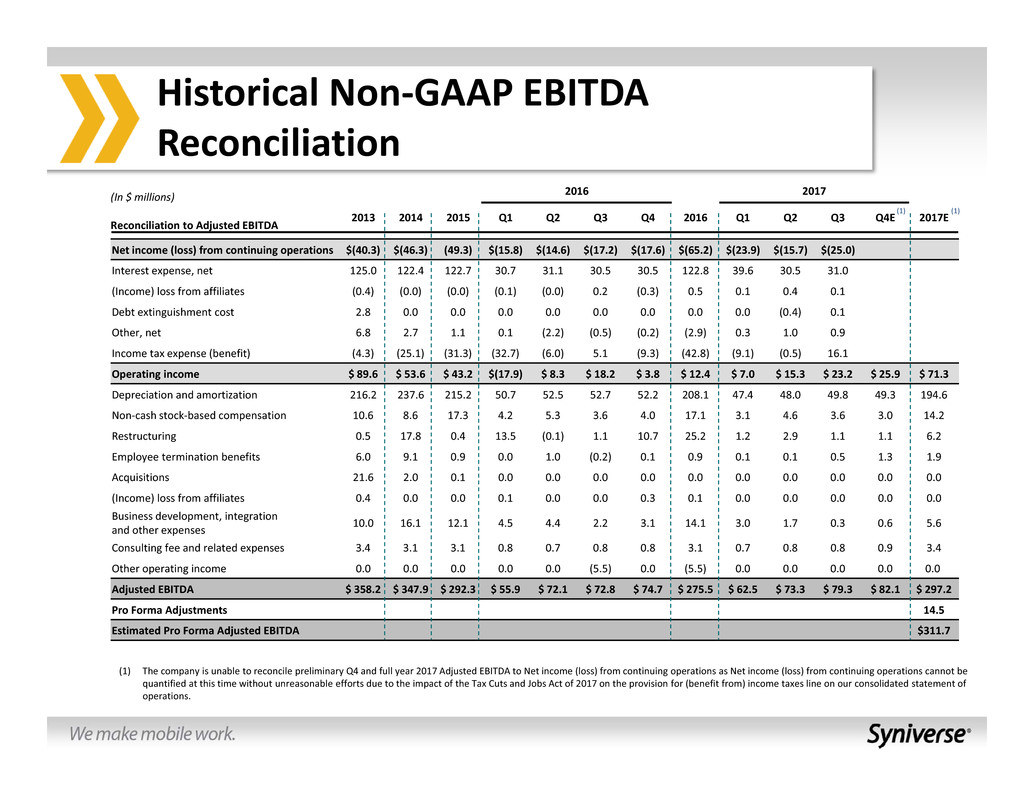
(In $ millions)
Reconciliation to Adjusted EBITDA
2016 2017
2013 2014 2015 Q1 Q2 Q3 Q4 2016 Q1 Q2 Q3 Q4E 2017E
Net income (loss) from continuing operations $(40.3) $(46.3) (49.3) $(15.8) $(14.6) $(17.2) $(17.6) $(65.2) $(23.9) $(15.7) $(25.0)
Interest expense, net 125.0 122.4 122.7 30.7 31.1 30.5 30.5 122.8 39.6 30.5 31.0
(Income) loss from affiliates (0.4) (0.0) (0.0) (0.1) (0.0) 0.2 (0.3) 0.5 0.1 0.4 0.1
Debt extinguishment cost 2.8 0.0 0.0 0.0 0.0 0.0 0.0 0.0 0.0 (0.4) 0.1
Other, net 6.8 2.7 1.1 0.1 (2.2) (0.5) (0.2) (2.9) 0.3 1.0 0.9
Income tax expense (benefit) (4.3) (25.1) (31.3) (32.7) (6.0) 5.1 (9.3) (42.8) (9.1) (0.5) 16.1
Operating income $ 89.6 $ 53.6 $ 43.2 $(17.9) $ 8.3 $ 18.2 $ 3.8 $ 12.4 $ 7.0 $ 15.3 $ 23.2 $ 25.9 $ 71.3
Depreciation and amortization 216.2 237.6 215.2 50.7 52.5 52.7 52.2 208.1 47.4 48.0 49.8 49.3 194.6
Non‐cash stock‐based compensation 10.6 8.6 17.3 4.2 5.3 3.6 4.0 17.1 3.1 4.6 3.6 3.0 14.2
Restructuring 0.5 17.8 0.4 13.5 (0.1) 1.1 10.7 25.2 1.2 2.9 1.1 1.1 6.2
Employee termination benefits 6.0 9.1 0.9 0.0 1.0 (0.2) 0.1 0.9 0.1 0.1 0.5 1.3 1.9
Acquisitions 21.6 2.0 0.1 0.0 0.0 0.0 0.0 0.0 0.0 0.0 0.0 0.0 0.0
(Income) loss from affiliates 0.4 0.0 0.0 0.1 0.0 0.0 0.3 0.1 0.0 0.0 0.0 0.0 0.0
Business development, integration
and other expenses
10.0 16.1 12.1 4.5 4.4 2.2 3.1 14.1 3.0 1.7 0.3 0.6 5.6
Consulting fee and related expenses 3.4 3.1 3.1 0.8 0.7 0.8 0.8 3.1 0.7 0.8 0.8 0.9 3.4
Other operating income 0.0 0.0 0.0 0.0 0.0 (5.5) 0.0 (5.5) 0.0 0.0 0.0 0.0 0.0
Adjusted EBITDA $ 358.2 $ 347.9 $ 292.3 $ 55.9 $ 72.1 $ 72.8 $ 74.7 $ 275.5 $ 62.5 $ 73.3 $ 79.3 $ 82.1 $ 297.2
Pro Forma Adjustments 14.5
Estimated Pro Forma Adjusted EBITDA $311.7
Historical Non‐GAAP EBITDA
Reconciliation
(1) The company is unable to reconcile preliminary Q4 and full year 2017 Adjusted EBITDA to Net income (loss) from continuing operations as Net income (loss) from continuing operations cannot be
quantified at this time without unreasonable efforts due to the impact of the Tax Cuts and Jobs Act of 2017 on the provision for (benefit from) income taxes line on our consolidated statement of
operations.
(1) (1)