Please wait
 Management Discussion & Analysis
 Management of Algonquin Power & Utilities Corp. ("AQN", "Company" or the "Corporation") has prepared the following discussion and analysis to provide information to assist its securityholders' understanding of the financial results for the three and twelve months ended December 31, 2024. This Management Discussion & Analysis ("MD&A") should be read in conjunction with AQN's annual consolidated financial statements for the years ended December 31, 2024 and 2023. This material is available on SEDAR+ at www.sedarplus.com, on EDGAR at www.sec.gov/edgar and on the AQN website at www.algonquinpower.com. Additional information about AQN, including the most recent Annual Information Form ("AIF"), can be found on SEDAR+ at www.sedarplus.com and on EDGAR at www.sec.gov/edgar.
Contents
| | | | | |
| Explanatory Notes | |
| Caution Concerning Forward-Looking Statements and Forward-Looking Information | |
| Caution Concerning Non-GAAP Measures | |
| Overview and Business Strategy | |
| Significant Updates | |
| |
2024 Fourth Quarter Results From Operations | |
2024 Annual Results From Operations | |
| 2024 Net Earnings Summary | |
| 2024 Adjusted EBITDA Summary | |
| |
| Regulated Services Group | |
| |
Corporate Group | |
Hydro Group | |
AQN: Other expenses | |
Discontinued Operations | |
| Non-GAAP Financial Measures | |
| |
| Summary of Property, Plant and Equipment Expenditures | |
| Liquidity and Capital Reserves | |
| Share-Based Compensation Plans | |
| Management of Capital Structure | |
| Enterprise Risk Management | |
| Quarterly Financial Information | |
| |
| Disclosure Controls and Procedures | |
| |
| Critical Accounting Estimates and Policies | |
| | | | | |
| |
| Algonquin Power & Utilities Corp. - Management Discussion & Analysis | 1 |
Explanatory Notes
Unless otherwise indicated, financial information provided for the years ended December 31, 2024 and 2023 has been prepared in accordance with generally accepted accounting principles in the United States ("U.S. GAAP"). As a result, the Company's financial information may not be comparable with financial information of other Canadian companies that provide financial information on another basis.
All monetary amounts are in U.S. dollars, except where otherwise noted. We denote any amounts denominated in Canadian dollars with "C$" immediately prior to the stated amount. Certain amounts in this MD&A may not total due to rounding.
Capitalized terms used herein and not otherwise defined have the meanings assigned to them in the Company's most recent AIF.
The term "rate base" is used in this document. Rate base is a measure specific to rate-regulated utilities that is not intended to represent any financial measure as defined by U.S. GAAP. The measure is used by the regulatory authorities in the jurisdictions where the Company's rate-regulated subsidiaries operate. The calculation of this measure may not be comparable to similarly-titled measures used by other companies.
Unless noted otherwise, this MD&A is based on information available to management as of March 7, 2025.
Renewables business sale
On January 8, 2025, the Company completed the previously announced sale of its renewable energy business (excluding hydro) (the "Renewables Sale") to a wholly-owned subsidiary of LS Power (“LS Buyer”) for proceeds of approximately $2.1 billion, after subtracting taxes, transaction fees and other preliminary closing adjustments, including an adjustment for estimated remaining completion costs for in-construction assets. Approximately $1.95 billion of such proceeds were received upon the closing of the transaction and approximately $150 million of such proceeds are currently expected to be received at a later date in 2025 upon monetization of tax attributes on certain in-construction projects. Additionally, the Company can receive up to $220 million in cash pursuant to an earn out agreement relating to certain wind assets (the “Earn Out”). This represents an increase to the Company’s previously disclosed estimated net proceeds as a result of the buy-out of the Clearview solar project during the fourth quarter of 2024, resulting in consolidation of $232.9 million of construction debt. The amount and timing of the ultimate net cash proceeds will be dependent on final completion costs for in-construction assets, the associated monetization of tax credits on certain of these projects and other final closing adjustments.
During the third quarter of 2024, the Company concluded that the consolidated assets within its former renewable energy group (excluding hydro) met the accounting requirements to be presented as “Held for Sale”. As a result, the renewable energy group (excluding hydro) was classified as "discontinued operations". The Company recorded a total impairment loss of $1,357.3 million in 2024 as a result of the classification of the renewable energy group (excluding hydro) as “discontinued operations”. However, the ultimate loss recorded will be dependent on the final net proceeds received by the Company for the Renewables Sale which will be impacted by, among other things, the timing and amount of future capital expenditures relating to the assets disposed of, the associated monetization of tax credits on certain projects and other final closing adjustments.
The discontinued operations operated as a distinct segment and had no impact on the operations of the Regulated Services Group operating segment, other than sharing certain corporate support functions and benefiting from corporate debt and equity funding. This MD&A reflects the results of continuing operations, unless otherwise noted.
| | | | | | |
| | |
| Algonquin Power & Utilities Corp. - Management Discussion & Analysis | 2 | |
Caution Concerning Forward-Looking Statements and Forward-Looking Information
This document may contain statements that constitute "forward-looking information" within the meaning of applicable securities laws in each of the provinces and territories of Canada and the respective policies, regulations and rules under such laws or "forward-looking statements" within the meaning of the U.S. Private Securities Litigation Reform Act of 1995 (collectively, "forward-looking information"). The words "aims", "anticipates", "believes", "budget", "could", "estimates", "expects", "forecasts", "intends", "may", "might", "plans", "projects", "schedule", “seeks”, "should", “strives”, “targets”, "will", "would", “pursue” (and grammatical variations of such terms) and similar expressions are often intended to identify forward-looking information, although not all forward-looking information contains these identifying words. Specific forward-looking information in this document includes, but is not limited to, statements relating to: expected future investments and growth, earnings and results of operations; the Renewables Sale and the anticipated impact thereof on the Corporation, including expectations regarding the timing and amount of expected future net proceeds therefrom, the use of proceeds therefrom and the ultimate impairment loss to be recorded; the anticipated impact of the sale of the Company’s interest in Atlantica (as defined herein) on the Company; the Company’s integrated customer solution technology platform; liquidity, capital resources and operational requirements; sources of funding, including adequacy and availability of credit facilities, cash flows from operations, capital markets financing, and asset dispositions; potential acquisitions, dispositions, projects, initiatives or other transactions; expected management changes; financing plans; expectations regarding future macroeconomic conditions; expectations regarding the Company's corporate development activities and the results thereof; expectations regarding regulatory hearings, motions, filings, appeals and approvals, including rate reviews, and the timing, impacts and outcomes thereof; expectations regarding the redemption of outstanding notes; expected future generation, capacity and production of the Company's energy facilities; expectations regarding future capital investments, including expected timing, investment plans, sources of funds and impacts; capital management plans and objectives; expectations regarding the outcome of legal claims and disputes; strategy and goals; dividends to shareholders; share price appreciation; credit ratings and equity credit from rating agencies; expectations regarding debt repayment and refinancing; the impact on the Company of actual or proposed laws, regulations and rules, including the EIFEL rules and the GMTA (each as defined herein); the expected impact of changes in customer usage on the Regulated Services Group's revenue; accounting estimates; interest rates, including the anticipated effect of an increase thereof; financing costs; the expected impact of tariffs imposed by the U.S. and Canada; and currency exchange rates. All forward-looking information is given pursuant to the "safe harbour" provisions of applicable securities legislation.
The forecasts and projections that make up the forward-looking information contained herein are based on certain factors or assumptions which include, but are not limited to: the receipt of applicable regulatory approvals and requested rate decisions; the absence of material adverse regulatory decisions being received and the expectation of regulatory stability; the absence of any material equipment breakdown or failure; availability of financing including self-monetization transactions for U.S. federal tax credits on commercially reasonable terms; the stability of credit ratings of the Corporation and its subsidiaries; the absence of unexpected material liabilities or uninsured losses; the continued availability of commodity supplies and stability of commodity prices; the absence of interest rate increases or significant currency exchange rate fluctuations; the absence of significant operational, financial or supply chain disruptions or liability, including relating to additional import controls and tariffs; the continued ability to maintain systems and facilities to ensure their continued performance; the absence of a severe and prolonged downturn in general economic, credit, social or market conditions; the successful and timely development and construction of new projects; the absence of capital project or financing cost overruns; sufficient liquidity and capital resources; the continuation of long-term weather patterns and trends; the absence of significant counterparty defaults; the continued competitiveness of electricity pricing when compared with alternative sources of energy; the realization of the anticipated benefits of the Corporation's dispositions, acquisitions and joint ventures; the absence of a change in applicable laws, political conditions, public policies and directions by governments materially negatively affecting the Corporation; the ability to obtain and maintain licenses and permits; maintenance of adequate insurance coverage; the absence of material fluctuations in market energy prices; the absence of material disputes with taxation authorities or changes to applicable tax laws; continued maintenance of information technology infrastructure and the absence of a material breach of cybersecurity; the successful implementation and operation of new information technology systems and infrastructure; favourable relations with external stakeholders; favourable labour relations; that the Corporation will be able to successfully integrate newly acquired entities, and the absence of any material adverse changes to such entities prior to closing; the absence of undisclosed liabilities of entities being acquired; the absence of any significant indemnification claims arising from the Renewables Sale; the absence of any reputational harm to the Corporation as a result of the Renewables Sale; the absence of adverse reactions or changes in business relationships or relationships with employees following the Renewables Sale; and the ability of the Corporation to realize the anticipated benefits from the Renewables Sale and the sale of its interest in Atlantica.
The forward-looking information contained herein is subject to risks, uncertainties and other factors that could cause actual results to differ materially from historical results or results anticipated by the forward-looking information. Factors which could cause results or events to differ materially from current expectations include, but are not limited to: changes in general economic, credit, social or market conditions; changes in customer energy usage patterns and energy demand; reductions in the liquidity of energy markets; global climate change; the incurrence of environmental liabilities; natural
| | | | | |
| |
| Algonquin Power & Utilities Corp. - Management Discussion & Analysis | 3 |
disasters, diseases, pandemics, public health emergencies and other force majeure events and the collateral consequences thereof, including the disruption of economic activity, volatility in capital and credit markets and legislative and regulatory responses; critical equipment breakdown or failure; supply chain disruptions; the impact of existing import controls and tariffs and the imposition of additional import controls or tariffs; the failure of information technology infrastructure and other cybersecurity measures to protect against data, privacy and cybersecurity breaches; failure to successfully implement and operate, and cost overruns and delays in connection with, new information technology systems and infrastructure; physical security breach; the loss of key personnel and/or labour disruptions; seasonal fluctuations and variability in weather conditions and natural resource availability; reductions in demand for electricity, natural gas and water due to developments in technology; reliance on transmission systems owned and operated by third parties; issues arising with respect to land use rights and access to the Corporation's facilities; terrorist attacks; fluctuations in commodity and energy prices; capital expenditures; reliance on subsidiaries; the incurrence of an uninsured loss; a credit rating downgrade; an increase in financing costs or limits on access to credit and capital markets; inflation; increases and fluctuations in interest rates and failure to manage exposure to credit and financial instrument risk; currency exchange rate fluctuations; restricted financial flexibility due to covenants in existing credit agreements; an inability to refinance maturing debt on favourable terms; disputes with taxation authorities or changes to applicable tax laws; requirement for greater than expected contributions to post-employment benefit plans; default by a counterparty; inaccurate assumptions, judgments and/or estimates with respect to asset retirement obligations; failure to maintain required regulatory authorizations; changes in, or failure to comply with, applicable laws and regulations; failure of compliance programs; failure to dispose of assets (at all or at a competitive price) to fund the Company’s operations and strategic objectives; delays and cost overruns in the design and construction of projects; loss of key customers; a third party joint venture partner acting in a manner contrary to the Corporation’s interests; facilities being condemned or otherwise taken by governmental entities; increased external stakeholder activism adverse to the Corporation's interests; fluctuations in the price and liquidity of the Corporation's common shares and the Corporation's other securities; the failure to implement the Corporation's strategic objectives or achieve expected benefits relating to acquisitions, dispositions or other initiatives, including with respect to the Renewables Sale and the sale of the Corporation’s interest in Atlantica; and risks related to the Renewables Sale and its impact on the Corporation’s remaining business, including the possibility of adverse reactions or changes in business relationships or relationships with employees resulting from the Renewables Sale. Although the Corporation has attempted to identify important factors that could cause actual actions, events or results to differ materially from those described in forward-looking information, there may be other factors that cause actions, events or results not to be as anticipated, estimated or intended. Some of these and other factors are discussed in more detail under the heading "Enterprise Risk Management" in this MD&A and under the heading "Enterprise Risk Factors" in the Corporation's most recent AIF.
Forward-looking information contained herein (including any financial outlook) is provided for the purposes of assisting the reader in understanding the Corporation and its business, operations, risks, financial performance, financial position and cash flows as at and for the periods indicated and to present information about management's current expectations and plans relating to the future, and the reader is cautioned that such information may not be appropriate for other purposes. Forward-looking information contained herein is made as of the date of this document and based on the plans, beliefs, estimates, projections, expectations, opinions and assumptions of management on the date hereof. There can be no assurance that forward-looking information will prove to be accurate, as actual results and future events could differ materially from those anticipated in such forward-looking information. Accordingly, readers should not place undue reliance on forward-looking information. While subsequent events and developments may cause the Corporation's views to change, the Corporation disclaims any obligation to update any forward-looking information or to explain any material difference between subsequent actual events and such forward-looking information, except to the extent required by applicable law. All forward-looking information contained herein is qualified by these cautionary statements.
Caution Concerning Non-GAAP Measures
AQN uses a number of financial measures to assess the performance of its business lines. Some measures are calculated in accordance with U.S. GAAP, while other measures do not have a standardized meaning under U.S. GAAP. These non-GAAP measures include non-GAAP financial measures and non-GAAP ratios, each as defined in Canadian National Instrument 52-112 Non-GAAP and Other Financial Measures Disclosure. AQN's method of calculating these measures may differ from methods used by other companies and therefore may not be comparable to similar measures presented by other companies.
The terms "Adjusted Net Earnings", "Adjusted Earnings Before Interest, Taxes, Depreciation and Amortization" ("Adjusted EBITDA"), "Adjusted Funds from Operations", and "Net Utility Sales", which are used throughout this MD&A, are non-GAAP financial measures. An explanation of each of these non-GAAP financial measures is set out below and a reconciliation to the most directly comparable U.S. GAAP measure, in each case, can be found in this MD&A. In addition, "Adjusted Net Earnings" is presented throughout this MD&A on a per common share basis. Adjusted Net Earnings per common share is a non-GAAP ratio and is calculated by dividing Adjusted Net Earnings by the weighted average number of common shares outstanding during the applicable period.
AQN does not provide reconciliations for forward-looking non-GAAP financial measures as AQN is unable to provide a meaningful or accurate calculation or estimation of reconciling items and the information is not available without unreasonable effort. This is due to the inherent difficulty of forecasting the timing or amount of various events that have not yet occurred, are out of AQN's control and/or cannot be reasonably predicted, and that would impact the most directly
| | | | | |
| |
| Algonquin Power & Utilities Corp. - Management Discussion & Analysis | |
comparable forward-looking U.S. GAAP financial measure. For these same reasons, AQN is unable to address the probable significance of the unavailable information. Forward-looking non-GAAP financial measures may vary materially from the corresponding U.S. GAAP financial measures.
The composition of Adjusted EBITDA has been changed compared to AQN's MD&A for the three and twelve months ended December 31, 2023 to include expenses related to corporate administrative expenses, which are now included within operating expenses. This change was made as these expenses are used by management to evaluate the operating performance of each business unit. Comparative figures have been adjusted for this new composition.
Adjusted EBITDA
Adjusted EBITDA is a non-GAAP financial measure used by many investors to compare companies on the basis of ability to generate cash from operations. AQN uses these calculations to monitor the amount of cash generated by AQN. AQN uses Adjusted EBITDA to assess the operating performance of AQN without the effects of (as applicable): depreciation and amortization expense, income tax expense or recoveries, acquisition and transition costs (including costs related to the 2023 strategic review of the Company's renewable energy business), certain litigation expenses, interest expense, gain or loss on derivative financial instruments, write down of intangibles and property, plant and equipment, earnings attributable to non-controlling interests exclusive of Hypothetical Liquidation at Book Value ("HLBV") income (which represents the value of net tax attributes earned in the period from electricity generated by certain of its U.S. wind power and U.S. solar generation facilities), non-service pension and post-employment costs, cost related to tax equity financing, costs related to management succession and executive retirement, costs related to prior period adjustments due to changes in tax law, costs related to condemnation proceedings, gain or loss on foreign exchange, earnings or loss from discontinued operations, changes in value of investments carried at fair value, gains and losses on disposition of assets, prior period adjustments included in the gain (loss) from equity method investments not operated by the Company, and other typically non-recurring or unusual items. AQN adjusts for these factors as they may be non-cash, unusual in nature and are not factors used by management for evaluating the operating performance of the Company. AQN believes that presentation of this measure will enhance an investor's understanding of AQN's operating performance. The Company also presents Adjusted EBITDA for each of its operating segments separately. For Adjusted EBITDA for the Regulated Services Group please see 2024 Regulated Services Group Adjusted EBITDA on page 22 of this MD&A. For Adjusted EBITDA for the Corporate Group and for the Hydro Group, please see Corporate Group Adjusted EBITDA and Hydro Group Adjusted EBITDA on page 31 of this MD&A. The Company previously referred to these segmented measures as "Divisional Operating Profit" and has changed the description to Adjusted EBITDA to align with industry practice. No change was made to the composition or computation thereof. Adjusted EBITDA is not intended to be representative of cash provided by operating activities or results of operations determined in accordance with U.S. GAAP, and can be impacted positively or negatively by these items. For a reconciliation of Adjusted EBITDA to net earnings, see Non-GAAP Financial Measures starting on page 36 of this MD&A. Adjusted Net Earnings
Adjusted Net Earnings is a non-GAAP financial measure used by many investors to compare net earnings from operations without the effects of certain volatile primarily non-cash items that generally have no current economic impact or items such as acquisition expenses or certain litigation expenses that are viewed as not directly related to a company’s operating performance. AQN uses Adjusted Net Earnings to assess its performance without the effects of (as applicable): gains or losses on foreign exchange, foreign exchange forward contracts, interest rate swaps, acquisition and transition costs (including costs related to the 2023 strategic review of the Company's renewable energy business), one-time costs of arranging tax equity financing, certain litigation expenses and write down of intangibles and property, plant and equipment, earnings or loss from discontinued operations, unrealized mark-to-market revaluation impacts, costs related to management succession and executive retirement, costs related to prior period adjustments due to changes in tax law, costs related to condemnation proceedings, changes in value of investments carried at fair value, gains and losses on disposition of assets, prior period adjustments included in the gain (loss) from equity method investments not operated by the Company and other typically non-recurring or unusual items as these are not reflective of the performance of the underlying business of AQN. AQN believes that analysis and presentation of net earnings or loss on this basis will enhance an investor’s understanding of the operating performance of its businesses. Adjusted Net Earnings is not intended to be representative of net earnings or loss determined in accordance with U.S. GAAP, and can be impacted positively or negatively by these items. For a reconciliation of Adjusted Net Earnings to net earnings, see Non-GAAP Financial Measures starting on page 37 of this MD&A. Adjusted Funds from Operations
Adjusted Funds from Operations is a non-GAAP financial measure used by investors to compare cash provided by operating activities without the effects of certain volatile items that generally have no current economic impact or items such as acquisition expenses that are viewed as not directly related to a company's operating performance. AQN uses Adjusted Funds from Operations to assess its performance without the effects of (as applicable): changes in working capital balances, acquisition and transition costs, certain litigation expenses, cash provided by or used in discontinued operations, cash provided by disposition of assets and other typically non-recurring items affecting cash from operations as these are
| | | | | |
| |
| Algonquin Power & Utilities Corp. - Management Discussion & Analysis | 5 |
not reflective of the long-term performance of the underlying businesses of AQN. AQN believes that analysis and presentation of funds from operations on this basis will enhance an investor's understanding of the operating performance of its businesses. Adjusted Funds from Operations is not intended to be representative of cash provided by operating activities as determined in accordance with U.S. GAAP, and can be impacted positively or negatively by these items. For a reconciliation of Adjusted Funds from Operations to cash provided by operating activities, see Non-GAAP Financial Measures starting on page 38 of this MD&A. Net Utility Sales
Net Utility Sales is a non-GAAP financial measure used by investors to identify utility revenue after commodity costs, either water, natural gas or electricity, where these commodity costs are generally included as a pass through in rates to its utility customers. AQN uses Net Utility Sales to assess its utility revenues without the effects of fluctuating commodity costs as such costs are predominantly passed through and paid for by utility customers. AQN believes that analysis and presentation of Net Utility Sales on this basis will enhance an investor's understanding of the revenue generation of the Regulated Services Group. It is not intended to be representative of revenue as determined in accordance with U.S. GAAP. For a reconciliation of Net Utility Sales to revenue, see 2024 Regulated Services Group Adjusted EBITDA on page 22 of this MD&A.
| | | | | |
| |
| Algonquin Power & Utilities Corp. - Management Discussion & Analysis | |
Overview and Business Strategy
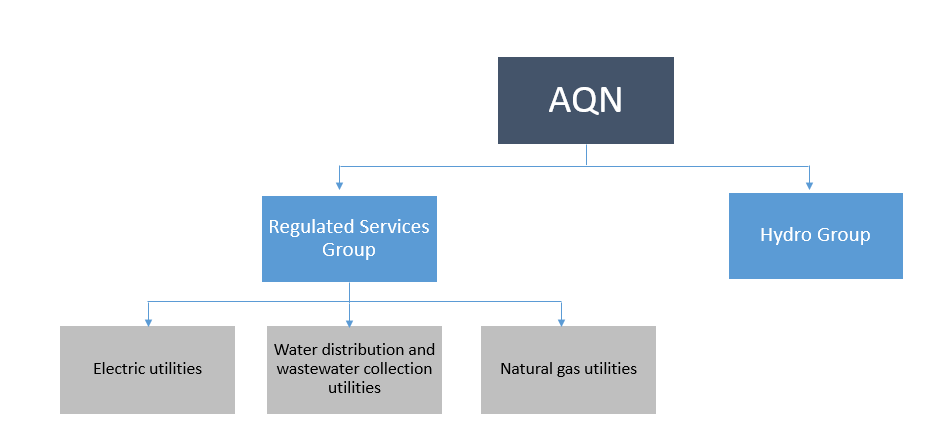
AQN is incorporated under the Canada Business Corporations Act. Subsequent to the signing of the transaction agreement in respect of the Renewables Sale and the sale of the Company's ownership stake in Atlantica Sustainable Infrastructure plc (“Atlantica”) during the year, AQN revised its business units in connection with its transformation into a pure-play regulated utility and to align with strategic priorities and internal governance. The Company's operations are now organized across two business units consisting of (i) the Regulated Services Group, which primarily owns and operates a portfolio of regulated electric, water distribution and wastewater systems and natural gas utility systems and transmission operations in the United States, Canada, Bermuda and Chile; and (ii) the Hydro Group, which consists of hydroelectric generation facilities located in Canada that were not sold as part of the Renewables Sale. Additionally, the Company has a corporate function, the Corporate Group, consisting of corporate and shared services that primarily support the Regulated Services Group and the Hydro Group, in addition to holding certain ancillary investments. The Company's investment in Atlantica, which previously formed part of the Corporate Group, was sold during the fourth quarter of 2024. The Company’s former renewable energy group (excluding hydro) is reported as discontinued operations (see Note 24 to the audited consolidated financial statements - Assets held for sale) and was sold by the Company on January 8, 2025. The new business units align with how the Company assesses financial performance and makes decisions regarding resource allocations. Through its activities, the Company aims to drive growth in earnings and cash flows to support a sustainable dividend and share price appreciation. AQN strives to achieve these results while also seeking to maintain a business risk profile consistent with its BBB flat investment grade credit ratings and a strong focus on Environmental, Social and Governance factors.
Summary Structure of the Business
The following chart depicts, in summary form, AQN's key operating business units. A more detailed description of AQN's organizational structure as of the date of the AIF can be found in the most recent AIF.
| | | | | |
| |
| Algonquin Power & Utilities Corp. - Management Discussion & Analysis | 7 |
Regulated Services Group
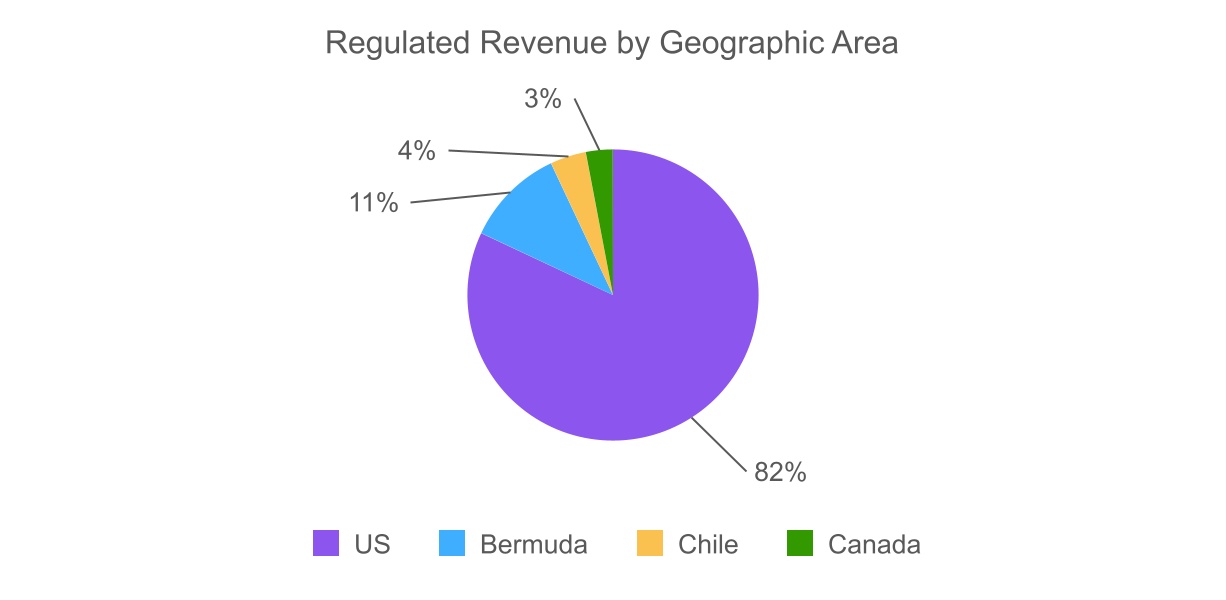
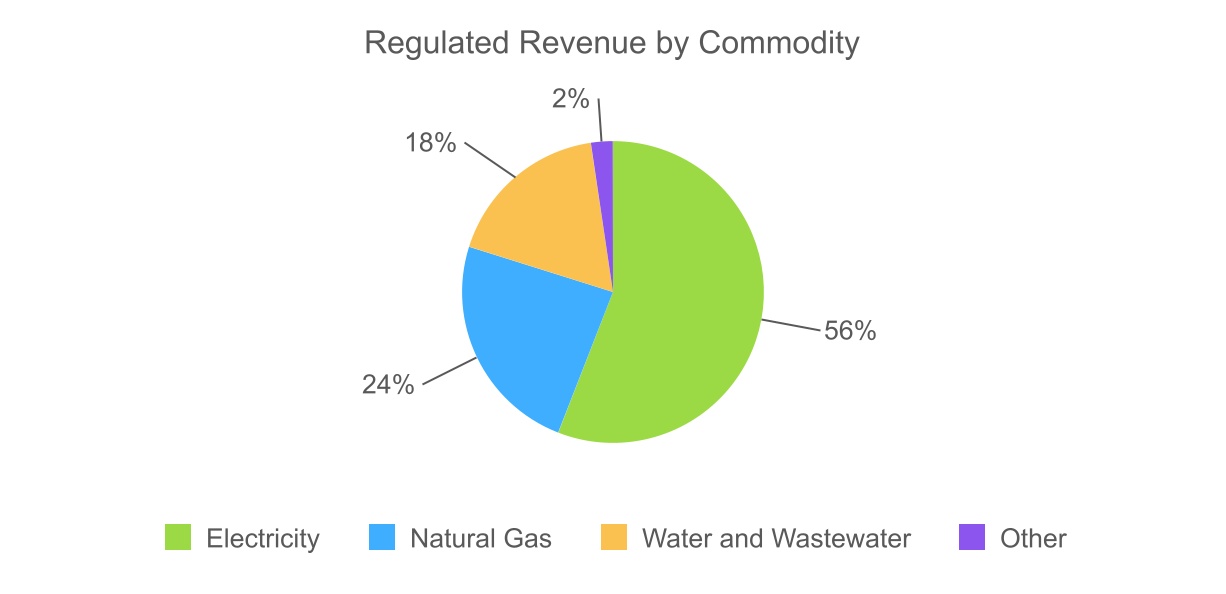
The Regulated Services Group primarily operates a diversified portfolio of regulated utility systems located in the United States, Canada, Bermuda and Chile serving approximately 1,265,000 customer connections as at December 31, 2024 (using an average of 2.5 customers per connection, this translates into approximately 3,162,500 customers). The Regulated Services Group seeks to provide safe, high quality, and reliable services to its customers and to deliver stable and predictable earnings to AQN. The Regulated Services Group seeks to deliver long-term growth within its service territories, including through the pursuit of capital investment opportunities and other initiatives.
The Regulated Services Group's regulated electrical distribution utility systems and related generation assets are located in the U.S. states of Arkansas, California, Kansas, Missouri, Nevada, New Hampshire and Oklahoma, as well as in Bermuda, which together served approximately 310,000 electric customer connections as at December 31, 2024. The group also owns and operates generating assets with a gross capacity of approximately 2.0 GW and has investments in generating assets with approximately 0.3 GW of net generation capacity.
The Regulated Services Group's regulated water distribution and wastewater utility systems are located in the U.S. States of Arizona, Arkansas, California, Illinois, Missouri, New York, and Texas as well as in Chile which together served approximately 577,000 customer connections as at December 31, 2024.
The Regulated Services Group's regulated natural gas distribution utility systems are located in the U.S. States of Georgia, Illinois, Iowa, Massachusetts, Missouri New Hampshire, and New York, and in the Canadian Province of New Brunswick, which together served approximately 378,000 natural gas customer connections as at December 31, 2024.
Below is a breakdown of the Regulated Services Group's Revenue by geographic area and by commodity for the twelve months ended December 31, 2024.
| | | | | |
| |
| Algonquin Power & Utilities Corp. - Management Discussion & Analysis | |
Hydro Group
The Hydro Group represents hydroelectric assets that were not sold as a part of the Renewables Sale. The Hydro Group generates and sells electrical energy produced by its 14 hydroelectric generating facilities located in the Canadian provinces of Alberta, Ontario, New Brunswick and Quebec with a combined gross generating capacity of approximately 115 MW and a net generating capacity of approximately 111 MW.
Corporate Group
The Corporate Group primarily consists of AQN’s corporate and shared services and corporate debt, in addition to certain ancillary investments. Prior to the sale of the Company's investment in Atlantica on December 12, 2024, the Corporate Group also included the Company’s interest in Atlantica.
The Company’s former renewable energy group (excluding hydro) is reported as “discontinued operations” and was sold by the Company on January 8, 2025.
| | | | | |
| |
| Algonquin Power & Utilities Corp. - Management Discussion & Analysis | |
Significant Updates
Operating Results
AQN's operating results relative to the same period last year are as follows:
| | | | | | | | | | | | | | | | | | | | | | | | | | | | | | | | | | | | | | | | | | | | | | | |
| (all dollar amounts in $ millions except per share information) | Three months ended | | Twelve months ended | | | | |
| December 31, | | December 31, | | | | | | | | | | | | |
| 2024 | | 2023 | | Change | | 2024 | | 2023 | | Change | | | | | | | | | | | | |
Net earnings (loss) from continuing operations attributable to shareholders | $ | (107.5) | | | $ | 169.8 | | | (163) | % | | $ | 65.3 | | | $ | (14.4) | | | 553 | % | | | | | | | | | | | | |
Net earnings (loss) attributable to shareholders including discontinued operations1 | $ | (186.4) | | | $ | 186.3 | | | (200) | % | | $ | (1,380.5) | | | $ | 28.7 | | | (4,910) | % | | | | | | | | | | | | |
Adjusted Net Earnings2 | $ | 45.2 | | | $ | 81.3 | | | (44) | % | | $ | 232.1 | | | $ | 279.4 | | | (17) | % | | | | | | | | | | | | |
Adjusted EBITDA2 | $ | 248.6 | | | $ | 262.1 | | | (5) | % | | $ | 1,039.3 | | | $ | 1,013.2 | | | 3 | % | | | | | | | | | | | | |
Net earnings (loss) per common share from continuing operations | $ | (0.14) | | | $ | 0.24 | | | (158) | % | | $ | 0.07 | | | $ | (0.03) | | | 333 | % | | | | | | | | | | | | |
Net earnings (loss) per common share including discontinued operations | $ | (0.25) | | | $ | 0.27 | | | (193) | % | | $ | (1.90) | | | $ | 0.03 | | | (6,433) | % | | | | | | | | | | | | |
Adjusted Net Earnings per common share2 | $ | 0.06 | | | $ | 0.12 | | | (50) | % | | $ | 0.30 | | | $ | 0.39 | | | (23) | % | | | | | | | | | | | | |
| | | | | |
| 1 | The net loss attributable to the Company for the three and twelve months ended December 31, 2024 was primarily driven by an impairment loss of $55.7 million and $1,357.3 million on the assets of the renewable energy group (excluding hydro) upon classification as held-for-sale. |
| 2 | See Caution Concerning Non-GAAP Measures. |
| |
| |
Management Changes
Subsequent to the year-end, on January 31, 2025, the Company announced that Roderick (Rod) West will join the Company as Chief Executive Officer, effective at 12:00 p.m. (Eastern time) on March 7, 2025, replacing Chris Huskilson, who will continue to serve as a director on the Company’s Board of Directors (the “Board”).
In addition, subsequent to the year-end, the Company announced that Darren Myers will resign as Chief Financial Officer following reporting of the Company’s fourth quarter 2024 results. Darren is leaving Algonquin to pursue another opportunity. Brian Chin, Vice President of Investor Relations will assume the role of Interim Chief Financial Officer, effective March 7, 2025. A nationally recognized search firm has been engaged to identify a permanent Chief Financial Officer.
Sale of the Renewable Energy Business
On January 8, 2025, the Company completed the sale of its renewable energy business (excluding hydro) to LS Buyer. Please refer to the section titled “Explanatory Notes” above for additional details regarding the Renewables Sale.
Sale of investment in Atlantica
On May 28, 2024, the Company entered into a support agreement with Atlantica and a private limited company controlled by Energy Capital Partners (“Bidco”) pursuant to which the Company and its subsidiary, Liberty (AY Holdings) B.V., which held approximately 42.2% of the shares of Atlantica, agreed to cause such shares to be voted in favour of a transaction separately announced by Atlantica and Bidco. On December 12, 2024, Bidco completed the acquisition of Atlantica, including the 42.2% equity interest in Atlantica held by Liberty (AY Holdings) B.V. for $22.00 per share in cash. The Company used the net proceeds of $1,077.2 million from the sale to reduce debt as part of its ongoing strategic transition to a pure play regulated utility.
| | | | | |
| |
| Algonquin Power & Utilities Corp. - Management Discussion & Analysis | 10 |
Final Deployment of Integrated Customer Solution Technology Platform
In the second quarter of 2024, the Company completed the final deployment of its integrated customer solution technology platform, which includes customer billing, enterprise resource planning systems and asset management systems. Implementation of this platform along with other organizational restructuring are intended to optimize the performance of the Company’s regulated business over the longer term. The platform continues to experience certain challenges associated with the impact of the new systems and required changes in processes. On February 27, 2025, the Missouri Public Service Commission ("MPSC") ordered Commission Staff to investigate the company's electric, water and natural gas customer service and billing practices. In addition, as part of a settlement agreement in the Granite State Electric rate case (which is pending New Hampshire Public Utilities Commission approval), the Company agreed to an information technology audit which may encompass all elements of the Company’s conversion to its integrated customer solution technology platform. The costs of this audit will be borne by shareholders.
Settlement of Green Equity Units
On March 28, 2024, the Company successfully remarketed its $1,150.0 million aggregate principal amount of 1.18% Senior Notes due June 15, 2026 (the "Notes"). The Notes were originally issued in June 2021, together with the related purchase contracts (the "Purchase Contracts"), as a component of the Company's corporate units (the "Green Equity Units"). In connection with the remarketing, the interest rate on the Notes was reset to 5.365%, with the maturity date remaining as June 15, 2026. The proceeds from the remarketing of the Notes were used to purchase a portfolio of treasury securities that matured on June 13, 2024. Subsequently, on June 17, 2024, all outstanding Purchase Contracts were settled. In connection with the settlement of the Purchase Contracts, holders of Green Equity Units received, following payment of $50.00 for each Purchase Contract, 3.3439 Common Shares for each Purchase Contract held. The payment obligation of holders was satisfied with the proceeds of the treasury portfolio purchased in connection with the remarketing of the Notes. In aggregate, the Company received proceeds of $1,150.0 million in exchange for the issuance of approximately 76.9 million common shares upon settlement of the Purchase Contracts. The Company used the proceeds from the settlement of the Purchase Contracts to reduce existing indebtedness of the Company and its subsidiaries and for general corporate purposes.
Issuance of approximately $305.5 million of Securitized Utility Tariff Bonds
On January 30, 2024, Empire District Bondco, LLC, a wholly owned subsidiary of The Empire District Electric Company, completed an offering of approximately $180.5 million of aggregate principal amount of 4.943% Securitized Utility Tariff Bonds with a maturity date of January 1, 2035 and $125.0 million aggregate principal amount of 5.091% Securitized Utility Tariff Bonds with a maturity date of January 1, 2039 (collectively, the "Securitization Bonds"), to recover previously incurred qualified extraordinary costs associated with the February 2021 extreme winter storm conditions experienced in Texas and parts of the central U.S. (the "Midwest Extreme Weather Event”) and energy transition costs related to the retirement of the Asbury generating plant. The principal asset securing the Securitization Bonds is the securitized utility tariff property.
Issuance of approximately $850 million of Senior Unsecured Notes
On January 12, 2024, Liberty Utilities Co. ("Liberty Utilities") completed an offering of $500 million aggregate principal amount of 5.577% senior notes due January 31, 2029 (the "2029 Notes") and $350 million aggregate principal amount of 5.869% senior notes due January 31, 2034 ( the "2034 Notes" and, together with the 2029 Notes, the "Senior Note"). Liberty Utilities used the net proceeds from the sale of the Senior Notes to repay indebtedness.
| | | | | |
| |
| Algonquin Power & Utilities Corp. - Management Discussion & Analysis | |
2024 Fourth Quarter Results From Operations1
| | | | | | | | | | | |
Key Financial Information | Three months ended December 31 |
| (all dollar amounts in $ millions except per share information) | 2024 | | 2023 |
| Revenue | $ | 584.8 | | | $ | 588.2 | |
Net Revenue | 442.1 | | | 412.2 | |
Net earnings (loss) attributable to shareholders from continuing operations | (107.5) | | | 169.8 | |
Net earnings (loss) attributable to shareholders from discontinued operations | (78.9) | | | 16.5 | |
Net earnings (loss) attributable to common shareholders from continuing operations and discontinued operations | (189.1) | | | 184.2 | |
| Cash provided by operating activities | 48.1 | | | 200.7 | |
Adjusted Net Earnings2 | 45.2 | | | 81.3 | |
Adjusted EBITDA2 | 248.6 | | | 262.1 | |
Adjusted EBITDA for Regulated Services Group | 234.4 | | | 229.0 | |
Adjusted EBITDA for Hydro Group | 6.1 | | | 7.0 | |
Adjusted EBITDA for Corporate Group | 8.1 | | | 26.1 | |
Adjusted Funds from Operations2 | 81.7 | | | 151.6 | |
| Dividends declared to common shareholders | 50.4 | | | 75.6 | |
| Weighted average number of common shares outstanding | 767,466,000 | | | 688,567,000 | |
| Per share | | | |
Basic net earnings (loss) from continuing operations | $ | (0.14) | | | $ | 0.24 | |
| | | |
| Basic net earnings (loss) from discontinued operations | $ | (0.10) | | | $ | 0.02 | |
Diluted net earnings (loss) from continuing operations | $ | (0.14) | | | $ | 0.24 | |
| Diluted net earnings (loss) from discontinued operations | $ | (0.10) | | | $ | 0.02 | |
Adjusted Net Earnings2 | $ | 0.06 | | | $ | 0.12 | |
| Dividends declared to common shareholders | $ | 0.07 | | | $ | 0.11 | |
| | | |
| | | | | |
| 1 | Reflects results of continuing operations unless marked otherwise (see Explanatory Notes). |
| 2 | See Caution Concerning Non-GAAP Measures. |
| |
For the three months ended December 31, 2024, AQN reported net loss attributable to shareholders of $107.5 million and basic net loss per common share of $0.14. During the comparative period in 2023, the Company reported net earnings attributable to shareholders of $169.8 million and basic net earnings per common share of $0.24. The net earnings attributable to shareholders decreased by $277.3 million and the basic net earnings decreased by $0.38.
The net loss attributable to shareholders of $107.5 million for the three months ended December 31, 2024 includes loss from continuing operations of $127.3 million and HLBV and other adjustments attributable to non-controlling interests of $19.7 million. The net earnings attributable to shareholders was primarily driven by:
•Adjusted Net Earnings of $45.2 million, as further discussed below (see Caution Concerning Non-GAAP Measures); offset by:
•valuation allowance on Canadian deferred tax assets of $154.6 million as a result of the sale of the Renewable Energy Business; and
•other net losses of $5.4 million (net of tax) mainly relating to miscellaneous write-offs.
The net earnings attributable to shareholders of $169.8 million for the three months ended December 31, 2023 includes earnings from continuing operations of $161.6 million and HLBV and other adjustments attributable to non-controlling interests of $8.2 million. It was primarily driven by:
•Adjusted Net Earnings of $81.3 million, as further discussed below (see Caution Concerning Non-GAAP Measures); and
•a gain on investments carried at fair value (primarily the Company's investment in Atlantica) of $101.9 million (net of tax); partially offset by:
•other net losses of $7.5 million (net of tax) primarily due to costs associated with the strategic review and the pursuit of the Renewables Sale and write-offs of deferred financing costs on the redemption of debt.
| | | | | |
| |
| Algonquin Power & Utilities Corp. - Management Discussion & Analysis | 12 |
For the three months ended December 31, 2024, AQN reported Adjusted Net Earnings per common share of $0.06 as compared to $0.12 per common share during the same period in 2023, a decrease of $0.06 (see Caution Concerning Non-GAAP Measures). Adjusted Net Earnings decreased by $36.1 million period over period (see Caution Concerning Non-GAAP Measures). This decrease was primarily driven by:
•an increase of $5.4 million in the Regulated Services Group's Adjusted EBITDA, (see Caution Concerning Non-GAAP Measures), primarily due to the implementation of new rates; offset by:
•a decrease in the Corporate Group's Adjusted EBITDA of $17.8 million primarily due to a lower dividend from Atlantica as result of the sale of the Corporation's interest in Atlantica on December 12, 2024;
•an increase of $8.5 million in depreciation expense driven by additional capital invested by the Company; and
•an increase in interest expense of $13.6 million including a reclassification of $6.8 million in expense previously shown within non-controlling interests due to the reclassification of the $306.5 million secured credit facility held, prior to its repayment on June 20, 2024 by Liberty Development Energy Solutions B.V. (the "Margin Loan") and had no overall impact on net earnings and $5.7 million from borrowings at corporate facilities used to fund capital expenditures at the Renewable Energy Business.
For the three months ended December 31, 2024, basic net earnings per common share and Adjusted Net Earnings per common share were also impacted by the issuance of an aggregate of 76,909,700 common shares on June 17, 2024 in connection with the settlement of the Purchase Contracts that were components of the Company’s Green Equity Units (see Caution Concerning Non-GAAP Measures and Note 13 to the audited consolidated financial statements - Shareholder's capital).
For the three months ended December 31, 2024, AQN experienced an average exchange rate of Canadian to U.S. dollars of approximately 0.7148 as compared to 0.7343 in the same period in 2023, and an average exchange rate of Chilean pesos to U.S. dollars of approximately 0.0010 for the three months ended December 31, 2024 as compared to 0.0011 for the same period in 2023. As such, any period over period variance in revenue or expenses, in local currency, at any of AQN's Canadian or Chilean entities is affected by a change in the average exchange rate upon conversion to AQN's reporting currency.
For the three months ended December 31, 2024, AQN reported total revenue of $584.8 million as compared to $588.2 million during the same period in 2023, a decrease of $3.4 million or 1%. The major factors impacting AQN's revenue in the three months ended December 31, 2024 as compared to the same period in 2023 are as follows:
| | | | | |
| (all dollar amounts in $ millions) | Three months ended December 31 |
| Comparative Prior Period Revenue | $ | 588.2 | |
| REGULATED SERVICES GROUP | |
Electricity: Increase is due to the implementation of new rates at the BELCO, CalPeco (CA) and Empire District Electric Systems, partially offset by decrease due to lower pass through commodity costs. | 8.3 | |
Natural Gas: Decrease is primarily due to lower pass through commodity costs, partially offset by increase due to the implementation of new rates at the Peach State (GA) and Midstates (IL) Gas Systems.
| (15.2) | |
Water: Increase is primarily due to the implementation of new rates at the New York (NY) and Liberty Park (CA) Water Systems, partially offset by decrease due to the loss of the drought decoupling mechanism at the Liberty Park Water System. | 5.9 | |
Other:
| 0.7 | |
| |
| |
| |
| |
| |
| |
| Foreign Exchange | (2.2) | |
| |
| |
| |
| HYDRO GROUP | (0.8) | |
| |
| |
| Foreign Exchange | (0.1) | |
| |
| |
| |
| |
| |
| |
| |
| |
| |
| |
| |
| |
| |
| |
| |
| |
| Current Period Revenue | $ | 584.8 | |
| |
| | | | | |
| |
| Algonquin Power & Utilities Corp. - Management Discussion & Analysis | |
2024 Annual Results From Operations1
| | | | | | | | | | | | | | | | | | | | | | | | |
Key Financial Information | Twelve months ended December 31 | |
| (all dollar amounts in $ millions except per share information) | 2024 | | 2023 | | 2022 | | | | | |
| Revenue | $ | 2,319.5 | | | $ | 2,403.9 | | | $ | 2,422.5 | | | | | | |
Net Revenue | 1,748.9 | | | 1,686.9 | | | 1,597.8 | | | | | | |
Net earnings (loss) attributable to shareholders from continuing operations | 65.3 | | | (14.4) | | | (140.4) | | | | | | |
Net earnings (loss) attributable to shareholders from discontinued operations | (1,445.8) | | | 43.1 | | | (71.5) | | | | | | |
Net earnings (loss) attributable to common shareholders from continuing operations and discontinued operations | (1,391.0) | | | 20.3 | | | (220.7) | | | | | | |
| | | | | | | | | | |
| | | | | | | | | | |
| Cash provided by operating activities | 481.7 | | | 628.0 | | | 711.8 | | | | | | |
Adjusted Net Earnings2 | 232.1 | | | 279.4 | | | 319.9 | | | | | | |
Adjusted EBITDA2 | 1,039.3 | | | 1,013.2 | | | 923.9 | | | | | | |
Adjusted EBITDA for Regulated Services Group | 940.2 | | | 902.7 | | | 817.2 | | | | | | |
Adjusted EBITDA for Hydro Group | 27.1 | | | 26.5 | | | 26.0 | | | | | | |
Adjusted EBITDA for Corporate Group | 72.0 | | | 84.0 | | | 80.7 | | | | | | |
Adjusted Funds from Operations2 | 515.7 | | | 586.2 | | | 956.8 | | | | | | |
| Dividends declared to common shareholders | 260.0 | | | 301.8 | | | 486.0 | | | | | | |
| Weighted average number of common shares outstanding | 731,721,000 | | | 688,739,000 | | | 677,862,207 | | | | | | |
| Per share | | | | | | | | | | |
| | | | | | | | | | |
Basic net earnings (loss) from continuing operations | $ | 0.07 | | | $ | (0.03) | | | $ | (0.22) | | | | | | |
| | | | | | | | | | |
Diluted net earnings (loss) from continuing operations | $ | 0.07 | | | $ | (0.03) | | | $ | (0.22) | | | | | | |
| | | | | | | | | | |
Basic net earnings (loss) from discontinued operations | $ | (1.97) | | | $ | 0.06 | | | $ | (0.11) | | | | | | |
Diluted net earnings (loss) from discontinued operations | $ | (1.97) | | | $ | 0.06 | | | $ | (0.11) | | | | | | |
Adjusted Net Earnings2 | $ | 0.30 | | | $ | 0.39 | | | $ | 0.46 | | | | | | |
| Dividends declared to common shareholders | $ | 0.35 | | | $ | 0.43 | | | $ | 0.71 | | | | | | |
Total assets - Continuing and discontinued operations | 16,961.8 | | | 18,374.0 | | | 17,627.6 | | | | | | |
Long-term debt - Continuing and discontinued operations | 8,047.5 | | | 8,516.0 | | | 7,512.0 | | | | | | |
| | | | | |
| |
| |
| 1 | Reflects results of continuing operations unless marked otherwise (see Explanatory Notes). |
| 2 | See Caution Concerning Non-GAAP Measures. |
For the twelve months ended December 31, 2024, AQN reported net earnings attributable to shareholders of $65.3 million and basic net earnings per common share of $0.07. During the comparative period in 2023, the Company reported net loss attributable to shareholders of $14.4 million and basic net loss per common share of $0.03. The net earnings attributable to shareholders increased by $79.7 million and the basic net earnings per common share increased by $0.10.
The net earnings attributable to shareholders of $65.3 million for the twelve months ended December 31, 2024 includes loss from continuing operations of $9.6 million offset by HLBV and other adjustments attributable to non-controlling interests of $74.9 million. The net earnings attributable to shareholders was primarily driven by:
•Adjusted Net Earnings of $232.1 million, as further discussed below (see Caution Concerning Non-GAAP Measures); and
•a net gain on investments carried at fair value (primarily the Company's investment in Atlantica) of $18.9 million (net of tax and legal costs associated with the sale); partially offset by:
•deferred tax expense of $168.6 million mainly relating to the valuation allowance on Canadian deferred tax assets; and;
•other net losses of $15.9 million (net of tax), mainly relating to restructuring costs and other miscellaneous write-offs.
| | | | | |
| |
| Algonquin Power & Utilities Corp. - Management Discussion & Analysis | 14 |
The net loss attributable to shareholders of $14.4 million for the twelve months ended December 31, 2023 includes loss from continuing operations of $25.1 million partially offset by HLBV and other adjustments attributable to non-controlling interests of $10.6 million. The net loss attributable to shareholders was primarily driven by:
•Adjusted Net Earnings of $279.4 million, as further discussed below (see Caution Concerning Non-GAAP Measures); offset by:
•a loss on investments carried at fair value (primarily the Company's investment in Atlantica) of $186.8 million (net of tax);
•loss on foreign exchange of $12.2 million (net of tax) due to exchange rate fluctuations between U.S. dollars and Canadian dollars; and
•other net losses of $91.6 million (net of tax) primarily due to $63.5 million of costs written off at Empire related to securitization and $46.5 million incurred as a result of the termination of the purchase agreement pursuant to which Liberty Utilities had agreed to acquire Kentucky Power Company and AEP Kentucky Transmission Company Inc. (the "Kentucky Power Transaction Termination").
For the twelve months ended December 31, 2024, AQN reported Adjusted Net Earnings per common share of $0.30 compared to $0.39 per common share during the same period in 2023, a decrease of $0.08 (see Caution Concerning Non-GAAP Measures). Adjusted Net Earnings decreased by $47.3 million year over year (see Caution Concerning Non-GAAP Measures), primarily due to:
•an increase of $37.5 million in the Regulated Services Group's Adjusted EBITDA (see Caution Concerning Non-GAAP Measures) primarily due to the implementation of new rates; offset by:
•a decrease in the Corporate Group's Adjusted EBITDA of $11.0 million primarily due to a lower dividend from Atlantica as result of the sale of the Company's ownership interest in Atlantica on December 12, 2024;
•an increase in interest expense of $55.2 million including a reclassification of $25.9 million in expense previously shown in non-controlling interest due to reclassification of the Margin Loan and had no overall impact on net earnings, $13.6 million attributable to an increase in interest rates and $15.7 million from borrowings at corporate facilities used to fund capital expenditures at the Renewable Energy Business; and
•an increase in depreciation expense of $41.6 million, driven by additional capital invested by the Company.
For the twelve months ended December 31, 2024, basic net earnings per common share and Adjusted Net Earnings per common share were also impacted by the issuance of an aggregate of 76,909,700 common shares on June 17, 2024 in connection with the settlement of the Purchase contracts that were components of the Company’s Green Equity Units (see Caution Concerning Non-GAAP Measures and Note 13 to the audited consolidated financial statements - Shareholder's capital).
For the twelve months ended December 31, 2024, AQN experienced an average exchange rate of Canadian to U.S. dollars of approximately 0.7299 as compared to 0.7410 in the same period in 2023, and an average exchange rate of Chilean pesos to U.S. dollars of approximately 0.0011 for the twelve months ended December 31, 2024 as compared to 0.0012 for the same period in 2023. As such, any year-over-year variance in revenue or expenses, in local currency, at any of AQN's Canadian or Chilean entities is affected by a change in the average exchange rate upon conversion to AQN's reporting currency.
For the twelve months ended December 31, 2024, AQN reported total revenue of $2,319.5 million as compared to $2,403.9 million during the same period in 2023, a decrease of $84.4 million or 3.5%. The major factors resulting in the decrease in AQN's revenue for the twelve months ended December 31, 2024 as compared to the same period in 2023 are as follows:
| | | | | |
| |
| Algonquin Power & Utilities Corp. - Management Discussion & Analysis | |
| | | | | |
| (all dollar amounts in $ millions) | Twelve months ended December 31 |
| Comparative Prior Period Revenue | $ | 2,403.9 | |
| REGULATED SERVICES GROUP | |
Electricity: Decrease is primarily due to lower pass through costs, partially offset by increase due to the implementation of new rates at the BELCO, CalPeco (CA), and Empire District Electric Systems and temporary rates at the Granite State (NH) Electric System. One-time revenues in the second quarter of 2023 from a retroactive rate increase at the CalPeco (CA) Electric System partially offset the increase in revenue | (14.0) | |
Natural Gas: Decrease is primarily due to lower pass through commodity costs, partially offset by increase due to the implementation of new rates at the Peach State (GA), Midstates (IL) and St. Lawrence (NY) Gas Systems and temporary rates at the EnergyNorth (NH) Gas System. | (75.3) | |
Water: Increase is primarily due to the implementation of new rates at the New York (NY), Pine Bluff (AR), and Liberty Park (CA) Water Systems. | 17.5 | |
| Other: | (1.2) | |
| Foreign Exchange | (12.0) | |
| |
| |
| HYDRO GROUP | 0.6 | |
| |
| |
| |
| |
| |
| |
| |
| |
| |
| |
| |
| |
| |
| |
| |
| |
| |
| |
| Current Period Revenue | $ | 2,319.5 | |
| | | | | |
| |
| Algonquin Power & Utilities Corp. - Management Discussion & Analysis | |
2024 Net Earnings Summary
For the three months ended December 31, 2024, the Company reported net loss attributable to shareholders of $107.5 million, which includes loss from continuing operations of $127.3 million partially offset by HLBV and other adjustments attributable to non-controlling interests of $19.7 million. The net earnings attributable to shareholders was $169.8 million for the comparable period in 2023, which includes loss from continuing operations of $161.6 million and HLBV and other adjustments attributable to non-controlling interests of $8.2 million. The net earnings from continuing operations attributable to shareholders decreased by $277.3 million or 163.3%.
For the twelve months ended December 31, 2024, the Company reported net earnings attributable to shareholders of $65.3 million, which includes loss from continuing operations of $9.6 million offset by HLBV and other adjustments attributable to non-controlling interests of $74.9 million. The net loss attributable to shareholders was $14.4 million for the comparable period in 2023, which includes loss from continuing operations of $25.1 million partially offset by HLBV and other adjustments attributable to non-controlling interests of $10.6 million. The net earnings from continuing operations attributable to shareholders increased by $79.7 million or 553.5%.
The following table outlines the changes to net earnings (loss) attributable to shareholders for the three and twelve months ended December 31, 2024 as compared to the same period in 2023.
| | | | | | | | | | | | | |
Change in net earnings (loss) attributable to shareholders1 | Three months ended | | Twelve months ended | | |
| December 31 | | December 31 | | |
| (all dollar amounts in $ millions) | 2024 | | 2024 | | |
Net earnings / (loss) attributable to shareholders – Prior Period Balance | $ | 169.8 | | | $ | (14.4) | | | |
Adjusted EBITDA2 | (13.5) | | | 26.1 | | | |
| Depreciation and amortization | (8.5) | | | (41.6) | | | |
| Foreign exchange | 5.7 | | | 10.1 | | | |
| Interest expense | (13.6) | | | (55.2) | | | |
| Change in value of investments carried at fair value | (119.5) | | | 237.0 | | | |
| Other net losses | 3.2 | | | 94.7 | | | |
| | | | | |
| Pension and post-employment non-service costs | 1.0 | | | 5.8 | | | |
| Gain on derivative financial instruments | (0.2) | | | (3.8) | | | |
Income tax expense | (140.5) | | | (223.9) | | | |
| Asset impairment charge | 1.5 | | | 1.5 | | | |
| | | | | |
| | | | | |
| | | | | |
Net earnings attributable to non-controlling interests, exclusive of HLBV | 7.1 | | | 29.0 | | | |
| Net earnings attributable to shareholders – Current Period Balance | $ | (107.5) | | | $ | 65.3 | | | |
| | | | | |
Change in Net Earnings (loss) ($) | $ | (277.3) | | | $ | 79.7 | | | |
Change in Net Earnings (loss) (%) | 163.3 | % | | 553.5 | % | | |
| | | | | |
| 1 | Reflects results of continuing operations unless marked otherwise (see Explanatory Notes). |
| 2 | See Caution Concerning Non-GAAP Measures. |
During the three months ended December 31, 2024, cash provided by operating activities totaled $48.1 million as compared to $200.7 million during the same period in 2023, a decrease of $152.6 million primarily as a result of changes in working capital items of $86.7 million (see Note 22 to the audited consolidated financial statements - Non Cash Operating Items) and a decrease of $15.9 million in distributions received from equity investments (net of income). During the three months ended December 31, 2024, Adjusted Funds from Operations totaled $81.7 million as compared to $151.6 million during the same period in 2023, a decrease of $69.9 million (see Caution Concerning Non-GAAP Measures).
During the twelve months ended December 31, 2024, cash provided by operating activities totaled $481.7 million as compared to $628.0 million during the same period in 2023, a decrease of $146.3 million primarily as a result of changes in working capital items of $53.1 million (see Note 22 to the audited consolidated financial statements - Non Cash Operating Items) and a decrease of $30.5 million in distributions received from equity investments (net of income). During the twelve months ended December 31, 2024, Adjusted Funds from Operations totaled $515.7 million as compared to
| | | | | |
| |
| Algonquin Power & Utilities Corp. - Management Discussion & Analysis | 17 |
$586.2 million during the same period in 2023, a decrease of $70.5 million (see Caution Concerning Non-GAAP Measures).
2024 Adjusted EBITDA Summary1
Adjusted EBITDA for the three months ended December 31, 2024 totaled $248.6 million as compared to $262.1 million during the same period in 2023, a decrease of $13.5 million or 5.2% (see Caution Concerning Non-GAAP Measures). Adjusted EBITDA for the twelve months ended December 31, 2024 totaled $1,039.3 million as compared to $1,013.2 million during the same period in 2023, an increase of $26.1 million or 2.6%. The breakdown of Adjusted EBITDA by the Company's main business units and a summary of changes are shown below.
| | | | | | | | | | | | | | | | | | | | | | | |
| Three months ended | | Twelve months ended |
Adjusted EBITDA2 by business units | December 31 | | December 31 |
| (all dollar amounts in $ millions) | 2024 | | 2023 | | 2024 | | 2023 |
Adjusted EBITDA for Regulated Services Group2 | $ | 234.4 | | | $ | 229.0 | | | $ | 940.2 | | | $ | 902.7 | |
Adjusted EBITDA for Hydro Group2 | 6.1 | | | 7.0 | | | 27.1 | | | 26.5 | |
Adjusted EBITDA for Corporate Group2 | 8.1 | | | 26.1 | | | 72.0 | | | 84.0 | |
Total AQN Adjusted EBITDA2 | $ | 248.6 | | | $ | 262.1 | | | $ | 1,039.3 | | | $ | 1,013.2 | |
Change in Adjusted EBITDA2 ($) | $ | (13.5) | | | | | $ | 26.1 | | | |
Change in Adjusted EBITDA2 (%) | (5.2) | % | | | | 2.6 | % | | |
| | | | | | | | | | | | | | |
Change in Adjusted EBITDA2 Breakdown | Three months ended December 31, 2024 |
| (all dollar amounts in $ millions) | Regulated Services | Hydro | Corporate | Total |
| Prior period balances | $ | 229.0 | | $ | 7.0 | | $ | 26.1 | | $ | 262.1 | |
Electricity | 0.5 | | — | | — | | 0.5 | |
Natural Gas | 5.8 | | — | | — | | 5.8 | |
Water | (0.1) | | — | | — | | (0.1) | |
Atlantica | — | | — | | $ | (10.9) | | (10.9) | |
Other | 0.2 | | (1.1) | | (7.1) | | (8.0) | |
| Foreign Exchange Impact | (1.0) | | 0.2 | | — | | (0.8) | |
| | | | |
| Total change during the period | $ | 5.4 | | $ | (0.9) | | $ | (18.0) | | $ | (13.5) | |
| Current period balances | $ | 234.4 | | $ | 6.1 | | $ | 8.1 | | $ | 248.6 | |
| | | | | | | | | | | | | | |
Change in Adjusted EBITDA2 Breakdown | Twelve months ended December 31, 2024 |
| (all dollar amounts in $ millions) | Regulated Services | Hydro | Corporate | Total |
| Prior period balances | $ | 902.7 | | $ | 26.5 | | $ | 84.0 | | $ | 1,013.2 | |
Electricity | 59.6 | | — | | — | | 59.6 | |
Natural Gas | (11.5) | | — | | — | | (11.5) | |
Water | 1.1 | | — | | — | | 1.1 | |
Atlantica | — | | — | | 76.3 | | 76.3 | |
Other | (8.0) | | 0.7 | | (88.3) | | (95.6) | |
| Foreign Exchange Impact | (3.7) | | (0.1) | | — | | (3.8) | |
| Total change during the period | $ | 37.5 | | $ | 0.6 | | $ | (12.0) | | $ | 26.1 | |
| Current period balances | $ | 940.2 | | $ | 27.1 | | $ | 72.0 | | $ | 1,039.3 | |
| | | | | |
| 1 | Reflects results of continuing operations unless marked otherwise (see Explanatory Notes). |
| 2 | See Caution Concerning Non-GAAP Measures. |
| | | | | |
| |
| Algonquin Power & Utilities Corp. - Management Discussion & Analysis | |
REGULATED SERVICES GROUP
The Regulated Services Group primarily operates rate-regulated utilities that as of December 31, 2024 provided electric generation and transmission services as well as distribution services in the electric, natural gas and water and wastewater sectors to approximately 1,265,000 customer connections, which is an increase of approximately 9,000 customer connections as compared to December 31, 2023.
In addition to pursuing organic growth within its service territories, the Regulated Services Group may seek to deliver long-term growth through acquisitions of additional utility systems and pursuing capital investment opportunities.
| | | | | | | | | | | | | | | | | | | | | | | |
| Utility System Type | As at December 31 |
| 2024 | | 2023 |
| (all dollar amounts in $ millions) | Assets | Net Utility Sales1 | Total Customer Connections2 | | Assets | Net Utility Sales1 | Total Customer Connections2 |
| Electricity | 5,454.5 | | 910.4 | | 310,000 | | | 5,134.3 | | 865.7 | | 309,000 | |
| Natural Gas | 1,921.4 | | 363.2 | | 378,000 | | | 1,830.4 | | 354.2 | | 375,000 | |
| Water and Wastewater | 1,786.0 | | 384.6 | | 577,000 | | | 1,672.6 | | 379.5 | | 572,000 | |
| | | | | | | |
| | | | | | | |
| Other | 116.5 | | 29.7 | | | | 308.4 | | 24.6 | | |
| Total | $ | 9,278.4 | | $ | 1,687.9 | | 1,265,000 | | | $ | 8,945.7 | | $ | 1,624.0 | | 1,256,000 | |
| | | | | | | |
| Accumulated Deferred Income Taxes Liability | $ | 833.6 | | | | | $ | 750.8 | | | |
| | | | | |
| 1 | Net Utility Sales for the twelve months ended December 31, 2024 and 2023. See Caution Concerning Non-GAAP Measures. |
| 2 | Total Customer Connections represents the sum of all active and vacant customer connections. |
The Regulated Services Group aggregates the performance of its utility operations by utility system type – electricity, natural gas, and water and wastewater systems.
The electric distribution,generation and transmission systems are comprised of regulated electrical distribution utility systems that served approximately 310,000 customer connections in the U.S. States of Arkansas, California, Kansas, Missouri, Nevada, New Hampshire and Oklahoma, as well as in Bermuda at December 31, 2024.
The natural gas distribution systems are comprised of regulated natural gas distribution utility systems that served approximately 378,000 customer connections located in the U.S. States of of Georgia, Illinois, Iowa, Massachusetts, Missouri, New Hampshire and New York, and in the Canadian Province of New Brunswick as at December 31, 2024.
The water and wastewater distribution systems are comprised of regulated water distribution and wastewater utility systems that served approximately 577,000 customer connections located in the U.S. States of Arizona, Arkansas, California, Illinois, Missouri, New York, and Texas, as well as in Chile, as at December 31, 2024.
| | | | | |
| |
| Algonquin Power & Utilities Corp. - Management Discussion & Analysis | 19 |
2024 Annual Usage Results
| | | | | | | | | | | | | | | | | | | | | | | |
| Electric Distribution Systems | Three months ended December 31 | | Twelve months ended December 31 |
| | 2024 | | 2023 | | 2024 | | 2023 |
| Average Active Electric Customer Connections For The Period | | | | | | | |
| Residential | 263,300 | | | 262,900 | | | 263,400 | | | 262,700 | |
| Commercial and industrial | 43,200 | | | 42,900 | | | 43,000 | | | 42,700 | |
| Total Average Active Electric Customer Connections For The Period | 306,500 | | | 305,800 | | | 306,400 | | | 305,400 | |
| | | | | | | |
| Customer Usage (GW-hrs) | | | | | | | |
| Residential | 583.3 | | | 635.1 | | | 2,777.8 | | | 2,741.5 | |
| Commercial and industrial | 900.7 | | | 902.2 | | | 3,721.7 | | | 3,820.0 | |
| Total Customer Usage (GW-hrs) | 1,484.0 | | | 1,537.3 | | | 6,499.5 | | | 6,561.5 | |
For the three months ended December 31, 2024, the electric distribution systems' usage totaled 1,484.0 GW-hrs as compared to 1,537.3 GW-hrs for the same period in 2023, a decrease of 53.3 GW-hrs or 3.5%. The decrease in electricity consumption is primarily due to unfavorable weather at the Empire District Electric System.
For the twelve months ended December 31, 2024, the electric distribution systems' usage totaled 6,499.5 GW-hrs as compared to 6,561.5 GW-hrs for the same period in 2023, a decrease of 62 GW-hrs or 0.9%. The decrease in electricity consumption is primarily due to unfavorable weather at the Empire District Electric System.
Approximately 47% of the Regulated Services Group's electric distribution systems' revenues are not expected to be impacted by changes in customer usage, as they are subject to volumetric decoupling or represent fixed fee billings.
| | | | | | | | | | | | | | | | | | | | | | | |
| Natural Gas Distribution Systems | Three months ended December 31 | | Twelve months ended December 31 |
| 2024 | | 2023 | | 2024 | | 2023 |
| Average Active Natural Gas Customer Connections For The Period | | | | | | | |
| Residential | 322,700 | | | 319,100 | | | 323,000 | | | 321,100 | |
| Commercial and industrial | 40,300 | | | 40,300 | | | 40,000 | | | 39,800 | |
| Total Average Active Natural Gas Customer Connections For The Period | 363,000 | | | 359,400 | | | 363,000 | | | 360,900 | |
| | | | | | | |
| Customer Usage (MMBTU) | | | | | | | |
| Residential | 4,941,000 | | | 4,664,000 | | | 19,770,000 | | | 19,128,000 | |
| Commercial and industrial | 5,114,000 | | | 5,298,000 | | | 20,301,000 | | | 20,619,000 | |
| Total Customer Usage (MMBTU) | 10,055,000 | | | 9,962,000 | | | 40,071,000 | | | 39,747,000 | |
For the three months ended December 31, 2024, usage at the natural gas distribution systems totaled 10,055,000 MMBTU as compared to 9,962,000 MMBTU during the same period in 2023, an increase of 93,000 MMBTU, or 0.9%. The increase is primarily due to a one-time billing that occurred in the first quarter of 2024 pertaining to usage in the fourth quarter of 2023 at the Midstates Gas System, partially offset by unfavorable weather at the EnergyNorth Gas System.
For the twelve months ended December 31, 2024, usage at the natural gas distribution systems totaled 40,071,000 MMBTU as compared to 39,747,000 MMBTU during the same period in 2023, an increase of 324,000 MMBTU, or 0.8%. The increase is primarily due to a one-time billing that occurred in the first quarter of 2024 pertaining to usage in the fourth quarter of 2023 at the Midstates Gas System
Approximately 86% of the Regulated Services Group's gas distribution systems' revenues are not expected to be impacted by changes in customer usage, as they are subject to volumetric decoupling or represent fixed fee billings.
| | | | | |
| |
| Algonquin Power & Utilities Corp. - Management Discussion & Analysis | 20 |
| | | | | | | | | | | | | | | | | | | | | | | |
| Water and Wastewater Distribution Systems | Three months ended December 31 | | Twelve months ended December 31 |
| 2024 | | 2023 | | 2024 | | 2023 |
| Average Active Customer Connections For The Period | | | | | | | |
| Wastewater customer connections | 55,600 | | | 55,500 | | | 55,700 | | | 55,600 | |
| Water distribution customer connections | 513,300 | | | 506,300 | | | 510,600 | | | 504,800 | |
| Total Average Active Customer Connections For The Period | 568,900 | | | 561,800 | | | 566,300 | | | 560,400 | |
| | | | | | | |
| Gallons Provided (millions of gallons) | | | | | | | |
| Wastewater treated | 963 | | | 902 | | | 3,716 | | | 3,541 | |
| Water provided | 10,204 | | | 10,188 | | | 39,747 | | | 41,078 | |
| Total Gallons Provided (millions of gallons) | 11,167 | | | 11,090 | | | 43,463 | | | 44,619 | |
For the three months ended December 31, 2024, the water and wastewater distribution systems provided approximately 10,204 million gallons of water to customers and treated approximately 963 million gallons of wastewater. This is compared to 10,188 million gallons of water provided and 902 million gallons of wastewater treated during the same period in 2023, an increase in total gallons provided of 16 million or 0.2% and an increase in total gallons treated of 61 million or 6.8%. This increase in water provided is primarily due to customer growth at the New York Water System. The increase in wastewater treated is primarily due to the opening of a new wastewater treatment plant at the Litchfield Park Water System.
For the twelve months ended December 31, 2024, the water and wastewater distribution systems provided approximately 39,747 million gallons of water to customers and treated approximately 3,716 million gallons of wastewater. This is compared to 41,078 million gallons of water provided and 3,541 million gallons of wastewater treated during the same period in 2023, a decrease in total gallons provided of 1,330 million or 3.2% and an increase in total gallons treated of 175 million or 4.9%. This decrease in water provided is due to one-time billing adjustments related to the prior year in the first three quarters of 2023, partially offset by customer growth at the New York Water System. The increase in wastewater treated is primarily due to customer growth and the opening of a new wastewater treatment plant at the Litchfield Park Water System.
Approximately 50% of the Regulated Services Group's water and wastewater distribution systems' revenues are not expected to be impacted by changes in customer usage, as they are subject to volumetric decoupling or represent fixed fee billings.
| | | | | |
| |
| Algonquin Power & Utilities Corp. - Management Discussion & Analysis | |
2024 Regulated Services Group Adjusted EBITDA
| | | | | | | | | | | | | | | | | | | | | | | |
| Three months ended | | Twelve months ended |
| December 31 | | December 31 |
| (all dollar amounts in $ millions) | 2024 | | 2023 | | 2024 | | 2023 |
| Revenue | | | | | | | |
| Regulated electricity distribution | $ | 304.6 | | | $ | 297.0 | | | $ | 1,276.1 | | | $ | 1,295.5 | |
| Less: Regulated electricity purchased | (85.1) | | | (95.7) | | | (365.7) | | | (429.8) | |
Net Utility Sales – electricity1 | 219.5 | | | 201.3 | | | 910.4 | | | 865.7 | |
| Regulated gas distribution | 152.5 | | | 167.4 | | | 546.4 | | | 621.3 | |
| Less: Regulated gas purchased | (51.1) | | | (71.6) | | | (183.2) | | | (267.1) | |
Net Utility Sales – natural gas1 | 101.4 | | | 95.8 | | | 363.2 | | | 354.2 | |
| Regulated water reclamation and distribution | 104.0 | | | 100.5 | | | 406.1 | | | 399.1 | |
| Less: Regulated water purchased | (6.5) | | | (5.9) | | | (21.5) | | | (19.6) | |
Net Utility Sales – water reclamation and distribution1 | 97.5 | | | 94.6 | | | 384.6 | | | 379.5 | |
| | | | | | | |
Other revenue2 | 15.2 | | | 11.5 | | | 53.4 | | | 51.1 | |
Less: Other Cost of Sales | (7.6) | | | (7.9) | | | (23.7) | | | (26.5) | |
Net Utility Sales1,3 | 426.0 | | — | | 395.3 | | — | | 1,687.9 | | — | | 1,624.0 | |
| Operating expenses | (223.2) | | | (194.7) | | | (861.8) | | | (811.6) | |
Income from long-term investments | 10.4 | | | 11.6 | | | 33.5 | | | 45.0 | |
HLBV4 | 21.2 | | | 16.8 | | | 80.6 | | | 45.3 | |
Adjusted EBITDA 1,5 | $ | 234.4 | | | $ | 229.0 | | | $ | 940.2 | | | $ | 902.7 | |
| | | | | |
| 1 | See Caution Concerning Non-GAAP Measures. |
| 2 | See Note 20 in the audited consolidated financial statements. |
| 3 | This table contains a reconciliation of Net Utility Sales to revenue. The relevant sections of the table are derived from and should be read in conjunction with the consolidated statement of operations and Note 20 in the audited consolidated financial statements, "Segmented Information". This supplementary disclosure is intended to more fully explain disclosures related to Net Utility Sales and provides additional information related to the operating performance of the Regulated Services Group. Investors are cautioned that Net Utility Sales should not be construed as an alternative to revenue. |
| 4 | HLBV income represents the value of net tax attributes monetized by the Regulated Services Group in the period at the Luning and Turquoise Solar Facilities and the Neosho Ridge, Kings Point and North Fork Ridge Wind Facilities. |
| 5 | This table contains a reconciliation of Adjusted EBITDA to revenue for the Regulated Services Group. The relevant sections of the table are derived from and should be read in conjunction with the audited consolidated statement of operations and Note 20 in the audited consolidated financial statements, "Segmented Information". This supplementary disclosure is intended to more fully explain disclosures related to Adjusted EBITDA and provides additional information related to the operating performance of the Regulated Services Group. Investors are cautioned that Adjusted EBITDA should not be construed as an alternative to revenue. |
| |
| | | | | |
| |
| Algonquin Power & Utilities Corp. - Management Discussion & Analysis | 22 |
2024 Fourth Quarter Operating Results
For the three months ended December 31, 2024, the Regulated Services Group reported revenue of $561.1 million (comprised of $304.6 million of regulated electricity distribution, $152.5 million of regulated gas distribution and $104.0 million of regulated water reclamation and distribution) as compared to revenue of $564.9 million in the comparable period in the prior year (comprised of $297.0 million of regulated electricity distribution, $167.4 million of regulated gas distribution and $100.5 million of regulated water reclamation and distribution).
For the three months ended December 31, 2024, the Regulated Services Group reported Adjusted EBITDA of $234.4 million as compared to $229.0 million for the comparable period in the prior year (see Caution Concerning Non-GAAP Measures).
Highlights of the changes are summarized in the following table:
| | | | | |
| (all dollar amounts in $ millions) | Three months ended December 31 |
Prior Period Adjusted EBITDA1 | $ | 229.0 | |
| |
Electricity: Increase is due to implementation of new rates at the BELCO, CalPeco (CA) and Empire District Electric Systems; partially offset by higher operating expenses at Empire District Electric System including approximately $3.6 million of one-time lower wind maintenance expenses in the fourth quarter of 2023, higher bad debt expense of $2 million and higher insurance costs of $3.9 million. | 0.5 | |
Natural Gas: Increase is primarily due to the implementation of new rates at the Peach State (GA) and Midstates (IL) Gas Systems, higher Gas System Enhancement Plan mechanism revenues at the New England (MA) Gas System and lower bad debt expense at the EnergyNorth (NH) Gas System. | 5.8 | |
Water: Decrease due to the loss of the drought revenue mechanism at the Liberty Park Water (CA) System which had a $4 million impact. The decrease is also driven by approximately $2.0 million of one-time revenues from the sale of effluent credits at the Litchfield Park (AZ) Water System and Gold Canyon (AZ) Sewer Systems water and sewer system recorded in 2023. It was offset by an increase due to the implementation of new rates at the New York (NY) and Liberty Park (CA) Water Systems. | (0.1) | |
| Other: | 0.2 | |
| |
| |
| |
| |
| |
| |
| |
| Foreign Exchange | (1.0) | |
| |
| |
Current Period Adjusted EBITDA1 | $ | 234.4 | |
| | | | | |
| 1 | See Caution Concerning Non-GAAP Measures. |
| | | | | |
| |
| Algonquin Power & Utilities Corp. - Management Discussion & Analysis | 23 |
2024 Annual Operating Results
For the twelve months ended December 31, 2024, the Regulated Services Group reported revenue of $2,228.6 million (comprised of $1,276.1 million of regulated electricity distribution revenue, $546.4 million of regulated natural gas distribution revenue and $406.1 million of regulated water reclamation and distribution revenue) as compared to revenue of $2,315.7 million in the same period in the prior year (comprised of $1,295.5 million of regulated electricity distribution revenue, $621.3 million of regulated natural gas distribution revenue and $399.1 million of regulated water reclamation and distribution revenue).
For the twelve months ended December 31, 2024, the Regulated Services Group reported Adjusted EBITDA of $940.2 million as compared to $902.7 million in the comparable period in the prior year (see Caution Concerning Non-GAAP Measures).
Highlights of the changes are summarized in the following table:
| | | | | |
| (all dollar amounts in $ millions) | Twelve months ended December 31 |
Prior Period Adjusted EBITDA1 | $ | 902.7 | |
| |
Electricity: Increase is primarily due to: –implementation of new rates of $33.9 million at the BELCO (effective in the second quarter of 2024, retroactive to the first quarter of 2024), CalPeco (CA), and Empire District Electric Systems, partially offset by one-time revenues in the second quarter of 2023 from a retroactive rate increase at the CalPeco (CA) Electric System. –higher HLBV income of $35.2 million as a result of normalized wind resources; –recovery of securitized regulatory assets of $31.6 million at the Empire District Electric System; partially offset by: –unfavourable weather of $2.2 million; and –higher operating expenses of $38 million, primarily at the Empire District Electric System, Calpeco and the Granite State Electric System. The increased operating expenses include increased bad debt expense of $4.4 million, increased insurance and property tax expense of $8.3 million and $9.7 million of one time regulatory assets write-offs and capitalization true-ups. The remaining increase in operating expense is primarily driven by increased labour costs as a result of inflationary pressure on salaries, as well as lower capitalization as the Company reduces its capital intensity, these labour cost increases were partially offset by cost saving initiatives implemented during 2024. | 59.6 | |
| |
Natural Gas: Decrease is primarily related to: –$9.6 million one-time capitalization correction; and –an increase in bad debt expense of approximately $6.1 million; partially offset by: –implementation of new rates of $4.2 million at the Peach State (GA), Midstates (IL) and St. Lawrence (NY) Gas Systems and temporary rates at the EnergyNorth (NH) Gas System. | (11.5) | |
Water: Increase is primarily due to: –implementation of new rates of $17.0 million at the New York (NY) (effective in the third quarter of 2024, retroactive to the second quarter of 2024), Pine Bluff (AR), and Liberty Park (CA) Water Systems; partially offset by increased operating expense including: –$1.7 million one-time regulatory asset write-off relating to the New York (NY) Water System rate order, –$3.3 million of increased operating costs related to opening the Sarival treatment plant at the Litchfield Park (AZ) Water and Sewer Systems –$3.8 million in higher insurance and property tax expense. –approximately $4.0 million of one-time revenues from the sale of effluent credits at the Litchfield Park (AZ) Water System and Gold Canyon (AZ) Sewer Systems recorded in 2023. | 1.1 | |
| |
Other: Decrease is primarily due to lower interest income on regulatory asset accounts primarily related to the Empire District Electric System bond securitization. Proceeds from securitization were used to repay long-term debt resulting in decreased interest expense. | (8.0) | |
| |
| |
| |
| Foreign Exchange | (3.7) | |
Current Period Adjusted EBITDA1 | $ | 940.2 | |
1 See Caution Concerning Non-GAAP Measures. | |
| | | | | |
| |
| Algonquin Power & Utilities Corp. - Management Discussion & Analysis | 24 |
Regulatory Proceedings
2024 represents the most active rate case schedule in the Company’s history as the Company focuses on improving its earnings. In the fourth quarter of 2024, the Company filed rate cases at its Empire District Electric (Missouri) and St. Lawrence Gas Systems and anticipates filing rate cases for its Empire District Gas System, Litchfield Park Water System, and New England Natural Gas System in the first half of 2025. Timing of the filing of these rate cases is dependent on, among other things, the successful adoption and use of the Company's recently deployed customer solution technology platform.
The following table summarizes the major regulatory proceedings currently underway or completed or effective in 2024 within the Regulated Services Group.
| | | | | | | | | | | | | | | | | | | | |
| Utility | Jurisdiction | Regulatory Proceeding Type | Rate Request
(millions) | Current Status | | |
| Completed Rate Reviews | | | | | | |
| BELCO | Bermuda | General Rate Case ("GRC") | $34.8 | On September 30, 2021, filed its revenue allowance application in which it requested a $34.8 million increase for 2022 and a $6.1 million increase for 2023. On March 18, 2022, the Regulatory Authority ("RA") approved an annual increase of $22.8 million, for a revenue allowance of $224.1 million for 2022 and $226.2 million for 2023. The RA authorized a 7.16% rate of return, comprised of a 62% equity and an 8.92% return on equity ("ROE"). In April 2022, BELCO filed an appeal in the Supreme Court of Bermuda challenging the decisions made by the RA through the recent Retail Tariff Review. On February 23, 2024, the Bermuda Supreme Court issued an order denying the BELCO appeal. | | |
Empire District Electric | Arkansas | GRC | $7.3 | On February 14, 2023, filed an application seeking an increase in revenues of $7.3 million based on an ROE of 10.25% and an equity ratio of 56% to be phased in over three years. On December 7, 2023, the Arkansas Public Service Commission issued an order approving the settlement agreement authorizing a revenue increase of $5.3 million based on a 44% equity ratio phased in over three years. New rates became effective January 1, 2024. | | |
| BELCO | Bermuda | GRC | $59.1 | On October 17, 2023, filed its revenue allowance application in which it requested a $59.1 million increase for 2024 and 2025 based on a weighted average cost of capital of 10.13%. On May 30, 2024, the RA issued a final order authorizing a revenue increase of $33.6 million for 2024 and 2025 based on a weighted average cost of capital of 7.79%. New base rates became effective August 1, 2024. | | |
| | | | | | |
| | | | | |
| |
| Algonquin Power & Utilities Corp. - Management Discussion & Analysis | 25 |
| | | | | | | | | | | | | | | | | | | | |
| Utility | Jurisdiction | Regulatory Proceeding Type | Rate Request
(millions) | Current Status | | |
| Midstates Gas | Illinois | GRC | $5.3 | On December 20, 2023, filed an application seeking an increase in revenues of $5.3 million based on an ROE of 10.80% and an equity ratio of 54%. On April 24, 2024, Staff of the Illinois Commerce Commission ("ICC Staff") filed testimony recommending a $0.6 million rate decrease. On May 16, 2024, the Company filed updated rebuttal testimony revising its proposed revenue increase to $4.6 million. On June 20, 2024, ICC Staff filed its rebuttal testimony recommending a base rate revenue increase of $2.1 million, and the Company filed surrebuttal testimony revising its proposed revenue increase to $4.1 million. A hearing was held on June 27, 2024. On July 25, 2024, the ICC Staff filed a legal brief recommending a revenue increase of $3.1 million. On October 31, 2024, the ICC issued a final order approving a total increase of $3.2 million or 22.32% in base rate revenues. The rate increase reflects an approved rate of return of 7.54% that incorporates a ROE of 9.90% and long-term debt cost rate of 5.60%. New rates took effect November 15, 2024. | | |
| Midstates Gas | Missouri | GRC | $13.2 | On February 9, 2024, filed an application seeking an increase in revenues of $13.2 million based on an ROE of 10.80% and an equity ratio of 52.92%. On July 18, 2024, the Staff of the Missouri Public Service Commission and Office of the Public Counsel ("OPC") filed direct testimony. Staff proposed a base revenue increase of $4.4 million based on a 50% equity ratio and 9.45% ROE. OPC recommended a 47.5% equity ratio and 9.50% ROE. On August 22, 2024 the parties filed rebuttal testimony. On September 19, 2024 the parties filed surrebuttal testimony. On October 9, 2024, Staff filed a motion to suspend the procedural schedule and evidentiary hearing given that the parties reached a settlement resolving all issues. The parties filed a stipulation agreement on October 22, 2024 agreeing to an increase in annual distribution revenues of $9.1 million. On November 6, 2024, the Commission unanimously voted to approve the settlement agreement. A written order was issued January 2, 2025 with new rates effective January 8, 2025. | | |
| New York Water | New York | GRC | $39.7 | On May 4, 2023, filed an application seeking an increase in revenues of $39.7 million based on an ROE of 10% and an equity ratio of 50%. On May 31, 2024, the Staff of the Department of Public Service and the Company filed a joint proposal resolving all contested issues. On July 16, 2024, an evidentiary hearing was held on the joint proposal. On August 15, 2024, the Commission issued an order approving the joint proposal and authorizing a $38.6 million increase in revenues over a three-year rate plan ($26.3 million in Year 1, $6.1 million in Year 2 and $6.2 million in Year 3). New rates became effective September 1, 2024 and are being collected retroactive to April 1, 2024 through a make whole surcharge that will be in effect from September 1, 2024 through March 31, 2026. | | |
| | | | | |
| |
| Algonquin Power & Utilities Corp. - Management Discussion & Analysis | |
| | | | | | | | | | | | | | | | | | | | |
| Utility | Jurisdiction | Regulatory Proceeding Type | Rate Request
(millions) | Current Status | | |
New Brunswick Gas | New Brunswick | GRC | $1.6 | On April 15, 2024, filed an application seeking an increase in revenues of $1.6 million based on an ROE of 9.80% and an equity ratio of 45%. On August 16, 2024 The Office of the Public Intervenor filed testimony. On September 27, 2024 the Company filed rebuttal testimony. An evidentiary hearing was held on October 4, 7 and 8, 2024. On December 31, 2024, the New Brunswick Energy & Utilities Board issued an order authorizing an annual increase in revenue of $1.2 million. | | |
Completed Rate Reviews subsequent to year-end | | | | | | |
| Missouri Water | Missouri | GRC | $8.1 | On March 13, 2024, filed an application seeking an increase in revenues of $8.1 million based on an ROE of 10.62% and an equity ratio of 52.6%. On August 20, 2024 Staff filed direct testimony recommending an increase in annual revenues of $7.8 million based on an ROE of 9.45% and an equity ratio of 50%. The City of Bolivar recommended an increase in annual revenues of $7.5 million. On September 27, 2024 the parties filed rebuttal testimony. Surrebuttal testimony was filed on October 24, 2024. On December 6, 2024, a Unanimous Global Stipulation & Agreement was filed with the MPSC with an annual revenue increase of approximately $6.2 million. The MPSC issued an order approving the settlement on January 23, 2025. New rates will be effective on March 1, 2025. | | |
| Arkansas Water | Arkansas | GRC | $2.3 | On March 14, 2024, filed an application seeking an increase in revenues of $2.3 million based on an ROE of 10.62% and an equity ratio of 52.5%. On August 27, 2024, Staff filed testimony recommending an annual revenue increase of $1.5 million, based on an ROE of 9.80%. On September 24, 2024, the Company filed rebuttal testimony updating its proposed annual revenue increase to $1.8 million. Surrebuttal testimony was filed by the parties on October 22, 2024 and the Company's surrebuttal testimony was filed on October 29, 2024. On November 12, 2024, the Company and the Staff of the Arkansas Public Service Commission (“APSC”) filed a settlement with an annual revenue increase of $1.5 million. On January 14, 2025, the APSC issued an order approving the settlement agreement and ordered compliance tariffs to be filed within seven days of the January 14, 2025 order. The APSC approved the compliance tariffs on February 7, 2025. New rates are effective March 1, 2025. | | |
| | | | | | |
| | | | | | |
| | | | | |
| |
| Algonquin Power & Utilities Corp. - Management Discussion & Analysis | |
| | | | | | | | | | | | | | | | | | | | |
| Utility | Jurisdiction | Regulatory Proceeding Type | Rate Request
(millions) | Current Status | | |
| Pending Rate Reviews | | | | | | |
| Granite State Electric | New Hampshire | GRC | $15.5 | On May 5, 2023, filed an application seeking a permanent increase in revenues of $15.5 million based on an ROE of 10.35% and an equity ratio of 55%. Temporary rates of $5.5 million were implemented on July 1, 2023. On December 13, 2023, the Department of Energy ("DOE") filed a motion seeking to dismiss the case. An evidentiary hearing was held on January 23, 2024. The case has been stayed by the New Hampshire Public Utilities Commission ("NHPUC") until May 15, 2024 so that it may contemplate the motion and the Company's third-party review of its financial information. On April 2, 2024 the NHPUC directed the Company to cooperate with the DOE and all other parties to develop a mutually-agreeable scope of work for the third-party report, to be filed with the NHPUC no later than April 15, 2024. Because there was not agreement on the scope of work, the Company filed the third-party report which concluded that the accounting information included in the rate filing provides a sufficient basis for determining the Company’s revenue requirement and that 2023 accounting data provides a sufficient basis for inclusion in the Company’s regulatory filings. On April 24, 2024, the Company filed an updated revenue requirement, seeking an increase in revenues of $14.7 million. On April 30, 2024, the NHPUC rejected the scope of the third-party report that was submitted, ordered an independent audit facilitated by the DOE with a procedural schedule for the next phase of the proceeding due no later than May 20, 2024, and deferred a ruling on the DOE motion to dismiss. The NHPUC extended the stay until September 16, 2024 to assess the issues that have been raised in the docket and called for a status report required by August 30, 2024. On September 30, 2024, the Company notified the NHPUC that the parties were engaged in settlement discussions. The parties filed a settlement agreement on November 18, 2024. A hearing on the settlement agreement was held on January 15, 2025. Initial briefs on the Commission's authority to approve the settlement were filed January 31, 2025. Another hearing is scheduled for March 20, 2025. | | |
| | | | | |
| |
| Algonquin Power & Utilities Corp. - Management Discussion & Analysis | |
| | | | | | | | | | | | | | | | | | | | |
| Utility | Jurisdiction | Regulatory Proceeding Type | Rate Request
(millions) | Current Status | | |
| EnergyNorth Gas | New Hampshire | GRC | $27.5 | On July 27, 2023, filed an application seeking an increase in revenues of $27.5 million based on an ROE of 10.35% and an equity ratio of 55%. Temporary rates of $8.7 million were approved by the Commission on October 31, 2023. The temporary rate increase is retroactive to October 1, 2023. On February 5, 2024, the Company requested that the NHPUC stay the case until April 12, 2024 so that the Company can provide the Commission with a third-party review of the financial information upon which the revenue requirement is predicated. On February 16, 2024, the DOE filed a motion seeking to dismiss the case. On March 14, 2024 the Commission issued an order staying the case until June 7, 2024, so that it may contemplate the motion and so that the Company can provide the NHPUC with a third-party review of the financial information within the rate application. On April 17, 2024, the Company filed a proposed scope for the third-party review. On August 16, 2024 the DOE filed a status update informing NHPUC that the parties met to discuss a comprehensive settlement of all issues in the case and intend to more fully engage in settlement discussions once a settlement in the Granite State Electric case is reached. On November 20, 2024, the NHPUC extended the stay of the proceeding to accommodate settlement negotiations until January 21, 2025. On January 23, 2025, the NHPUC further extended the stay of the proceeding until April 24, 2025. | | |
| Rio Rico Water & Sewer, Bella Vista Water, Beardsley Water, Cordes Lakes Water | Arizona | GRC | $6 | On December 28, 2023, filed an application seeking an increase in revenues of $6.0 million based on an ROE of 10.95% and an equity ratio of 54%. On June 26, 2024, the Arizona Corporation Commission ("ACC") granted the Company's request to extend the procedural schedule with a hearing on the merits scheduled for March 24-28, 2025. Staff testimony, which recommends an increase of $2.9 million in revenue based on an ROE of 9.4% and an equity ratio of 54%, was filed and supplemented on January 8, 2025. On February 5, 2025, the Company notified the ACC that the parties had reached a settlement in principle that would resolve all matters in the rate case. The parties filed a settlement agreement on February 21, 2025, which would result in an increase in revenues of $4.2 million. | | |
| Park Water | California | GRC | $9.3 | On January 2, 2024, filed an application seeking an increase in revenues of $9.3 million based on an ROE of 9.35% and an equity ratio of 57%. On July 24, 2024, the Public Advocates Office at the California Public Utilities Commission filed testimony recommending a $2.4 million decrease in revenues for 2025. On September 23, 2024, the Company served rebuttal testimony seeking $9.0 million revenue increase. Legal briefs were filed in December 2024. On December 5, 2024, in the Cost of Capital proceeding for Small Class A Water Utilities, the California PUC issued an order increasing Park Water's ROE to 9.57%. | | |
| | | | | |
| |
| Algonquin Power & Utilities Corp. - Management Discussion & Analysis | |
| | | | | | | | | | | | | | | | | | | | |
| Utility | Jurisdiction | Regulatory Proceeding Type | Rate Request
(millions) | Current Status | | |
| Apple Valley Water | California | GRC | $3.1 | On January 2, 2024, filed an application seeking an increase in revenues of $3.1 million based on an ROE of 9.35% and an equity ratio of 57%. On July 24, 2024, the Public Advocates Office at the California Public Utilities Commission (the "California PUC") filed testimony recommending a $3.9 million decrease in revenues for 2025. On September 23, 2024, the Company served rebuttal testimony seeking $2.9 million revenue increase. Legal briefs were filed in December 2024. On December 5, 2024, in the Cost of Capital proceeding for Small Class A Water Utilities, the California PUC issued an order increasing Apple Valley Water’s ROE to 9.57%. | | |
CalPeco Electric | California | GRC | $39.8 | On September 20, 2024, filed an application seeking an increase in revenues of $39.8 million based on an ROE of 11% and an equity ratio of 52.5%. On March 5, 2025, the Company filed a motion requesting that interim rates be set at 50% of the Company's proposed Revenue Requirement, on a monthly basis as of June 1, 2025. | | |
Empire Electric | Missouri | GRC | $92.1 | On November 6, 2024, filed an application seeking an increase in net operating revenues of $92.1 million based on an ROE of 10% and an equity ratio of 53.1%. On February 3, 2025, Staff of the MPSC and the Office of the Public Counsel filed motions to dismiss the case. The Company withdrew its tariff sheets on February 26, 2025 and refiled revised tariff sheets on the same day seeking a base rate revenue increase of $152.8 million; when considering the rebasing of test year revenues for fuel and purchased power costs and the energy efficiency cost recovery rate, the filing continues to seek a net operating revenue increase of $92.1 million. On March 5, 2025, the MPSC suspended the new tariff sheets until January 2, 2026 and ordered the parties to file an updated procedural schedule no later than March 26, 2025. | | |
St.Lawrence Gas | New York | GRC | $2.2 | On November 27, 2024, filed an application seeking an increase of revenues of $2.2 million based on an ROE of 9.9% and an equity ratio of 48%. | | |
| | | | | |
| |
| Algonquin Power & Utilities Corp. - Management Discussion & Analysis | |
CORPORATE GROUP ADJUSTED EBITDA
Key financial information related to the Corporate Group is as follows:
| | | | | | | | | | | | | | | | | | | | | | | |
2024 Corporate Group Adjusted EBITDA1,2 |
| Three months ended | | Twelve months ended |
| December 31 | | December 31 |
| (all dollar amounts in $ millions) | 2024 | | 2023 | | 2024 | | 2023 |
| | | | | | | |
| Revenue | 0.4 | | | 0.5 | | | 1.4 | | | 1.4 | |
Add: Interest, dividend, equity and other income | 11.7 | | | 29.3 | | | 80.0 | | | 86.6 | |
| Less: Operating expenses | 4.0 | | | 3.7 | | | 9.4 | | | 4.0 | |
Corporate Group Adjusted EBITDA1 | 8.1 | | | 26.1 | | | 72.0 | | | 84.0 | |
| | | | | |
| 1 | See Caution Concerning Non-GAAP Measures. |
| 2 | This table contains a reconciliation of Adjusted EBITDA to revenue for the Corporate Group. The relevant sections of the table are derived from and should be read in conjunction with the audited consolidated statement of operations and Note 20 in the audited consolidated financial statements, "Segmented Information". This supplementary disclosure is intended to more fully explain disclosures related to Adjusted EBITDA and provides additional information related to the operating performance of the Corporate Group. Investors are cautioned that Adjusted EBITDA should not be construed as an alternative to revenue. |
For the three months ended December 31, 2024 the interest, dividend, equity and other income, primarily includes dividends from Atlantica of $10.9 million as compared to $21.6 million during the same period in 2023. For the twelve months ended December 31, 2024, the interest, dividend, equity and other income, primarily includes dividends from Atlantica of $76.3 million as compared to $87.2 million during the same period in 2023. The decrease is primarily due to a lower dividend from Atlantica as result of closing of the sale of the Company's ownership interest in Atlantica on December 12, 2024.
For the three and the twelve months ended December 31, 2024, the increase in operating expenses was primarily due to indirect allocations that were not allocated from the Corporate Group to the renewable energy group (excluding hydro) as a result of it being classified as discontinued operations.
HYDRO GROUP ADJUSTED EBITDA
Key financial information related to the Hydro Group is as follows:
| | | | | | | | | | | | | | | | | | | | | | | |
2024 Hydro Group Adjusted EBITDA1,2 |
| Three months ended | | Twelve months ended |
| December 31 | | December 31 |
| (all dollar amounts in $ millions) | 2024 | | 2023 | | 2024 | | 2023 |
| | | | | | | |
| | | | | | | |
| | | | | | | |
| | | | | | | |
| Revenue | $ | 8.1 | | | $ | 8.6 | | | $ | 35.3 | | | $ | 34.3 | |
Less: Cost of Sales - Hydro | — | | | 0.1 | | | 0.2 | | | 0.5 | |
Add: Other income | — | | | 0.3 | | | 0.8 | | | 1.3 | |
Less: Operating expenses | 2.0 | | | 1.8 | | | 8.8 | | | 8.6 | |
Hydro Group Adjusted EBITDA1 | $ | 6.1 | | | $ | 7.0 | | | $ | 27.1 | | | $ | 26.5 | |
| | | | | |
| 1 | See Caution Concerning Non-GAAP Measures. |
| 2 | This table contains a reconciliation of Adjusted EBITDA to revenue for the Hydro Group. The relevant sections of the table are derived from and should be read in conjunction with the consolidated statement of operations and Note 20 in the audited consolidated financial statements, "Segmented Information". This supplementary disclosure is intended to more fully explain disclosures related to Adjusted EBITDA and provides additional information related to the operating performance of the Hydro Group. Investors are cautioned that Adjusted EBITDA should not be construed as an alternative to revenue. |
| |
| | | | | |
| |
| Algonquin Power & Utilities Corp. - Management Discussion & Analysis | 31 |
AQN: OTHER EXPENSES
| | | | | | | | | | | | | | | | | | | | | | | |
| Three months ended | | Twelve months ended |
| December 31 | | December 31 |
| (all dollar amounts in $ millions) | 2024 | | 2023 | | 2024 | | 2023 |
Other expenses: | | | | | | | |
| | | | | | | |
| Loss on foreign exchange | (0.3) | | | 5.4 | | | 3.5 | | | 13.7 | |
| | | | | | | |
| Interest expense | 89.4 | | | 75.8 | | | 363.6 | | | 308.4 | |
| Depreciation and amortization | 99.6 | | | 91.1 | | | 395.7 | | | 354.1 | |
| Change in value of investments carried at fair value | 2.0 | | | (117.5) | | | (21.7) | | | 215.3 | |
Interest, dividend, equity, and other income | (11.9) | | | (29.3) | | | (79.8) | | | (86.5) | |
| Pension and other post-employment non-service costs | 3.7 | | | 4.7 | | | 14.1 | | | 19.9 | |
| Other net losses | 7.1 | | | 10.3 | | | 27.0 | | | 121.7 | |
| | | | | | | |
| Gain on derivative financial instruments | (0.4) | | | (0.6) | | | (0.8) | | | (4.6) | |
| Income tax expense (recovery) | 153.5 | | | 13.0 | | | 186.8 | | | (37.1) | |
2024 Fourth Quarter Other Expenses
For the three months ended December 31, 2024, interest expense totaled $89.4 million as compared to $75.8 million in the same period in 2023. The increase was primarily driven by increase in interest rates, increased borrowings to support growth initiatives as well as reclassification of the Margin Loan as debt.
For the three months ended December 31, 2024, depreciation expense totaled $99.6 million as compared to $91.1 million in the same period in 2023.
For the three months ended December 31, 2024, change in investments carried at fair value totaled a loss of $2.0 million as compared to a gain of $117.5 million in the same period in 2023. The Company records certain of its investments, including Atlantica, using the fair value method and accordingly any change in the fair value of the investment is recorded in the consolidated statement of operations (see Note 8 in the audited consolidated financial statements). During the quarter, the Company sold its investment in Atlantica.
For the three months ended December 31, 2024, pension and post-employment non-service costs totaled $3.7 million as compared to $4.7 million in the same period in 2023. The decrease was primarily due to higher expected return on plan assets.
For the three months ended December 31, 2024, other net losses were $7.1 million as compared to $10.3 million in the same period in 2023. The decrease was due to regulatory asset write-downs and other miscellaneous write downs, not material year over year. See Note 18 in the audited consolidated financial statements.
For the three months ended December 31, 2024, the gain on derivative financial instruments totaled $0.4 million as compared to a gain of $0.6 million in the same period in 2023. AQN uses derivative instruments to manage exposure to changes in commodity prices, foreign exchange rates, and interest rates.
For the three months ended December 31, 2024, an income tax expense of $153.5 million was recorded as compared to an income tax expense of $13.0 million during the same period in 2023. The increase in income tax expense was primarily due to the valuation allowance on Canadian deferred tax assets and the effect from the restructuring of certain intercompany financing arrangements which were executed in advance of the implementation of global minimum tax rules in the various jurisdictions in which the Company operates. These tax impacts were partially offset by the tax effects from the investment in Atlantica and lower earnings.
2024 Annual Other Expenses
For the twelve months ended December 31, 2024, interest expense totaled $363.6 million as compared to $308.4 million in the same period in 2023. The increase was primarily due to increase in interest rates, increased borrowings to support growth initiatives as well as reclassification of the Margin Loan as debt.
For the twelve months ended December 31, 2024, depreciation expense totaled $395.7 million as compared to $354.1 million in the same period in 2023. The increase was primarily due to higher overall property, plant and equipment.
For the twelve months ended December 31, 2024, change in investments carried at fair value totaled a gain of $21.7 million as compared to a loss of $215.3 million in the same period in 2023. The Company records certain of its
| | | | | |
| |
| Algonquin Power & Utilities Corp. - Management Discussion & Analysis | 32 |
investments, including Atlantica, using the fair value method and accordingly any change in the fair value of the investment is recorded in the consolidated statement of operations (see Note 8 in the audited consolidated financial statements). The Company sold its investment in Atlantica during the fourth quarter of 2024.
For the twelve months ended December 31, 2024, pension and post-employment non-service costs totaled $14.1 million as compared to $19.9 million in the same period in 2023. The decrease was primarily due to higher expected return on plan assets.
For the twelve months ended December 31, 2024, other net losses were $27.0 million as compared to $121.7 million in the same period in 2023. The decrease was primarily due to a loss of $46.5 million related to the Kentucky Power Transaction Termination and securitization costs related to the Empire District Electric Systems of $63.5 million written off during the twelve months ended December 31, 2023, partially offset by a $12.0 million contingent gain recorded in 2023 resulting from settlement of the purchase price of the Suralis Water System acquired in 2020. See Note 18 in the audited consolidated financial statements.
For the twelve months ended December 31, 2024, the gain on derivative financial instruments totaled $0.8 million as compared to a gain of $4.6 million in the same period in 2023. AQN uses derivative instruments to manage exposure to changes in commodity prices, foreign exchange rates, and interest rates.
For the twelve months ended December 31, 2024, an income tax expense of $186.8 million was recorded as compared to an income tax recovery of $37.1 million during the same period in 2023. The increase in income tax expense was primarily due to the valuation allowance on Canadian deferred tax assets, the tax impact from the investment in Atlantica, the effect from the restructuring of certain intercompany financing arrangements which were executed in advance of the implementation of global minimum tax rules in the various jurisdictions in which the Company operates, and the tax impact of higher earnings.
| | | | | |
| |
| Algonquin Power & Utilities Corp. - Management Discussion & Analysis | 33 |
DISCONTINUED OPERATIONS: RENEWABLE ENERGY GROUP
The former renewable energy group (excluding hydro), presented as discontinued operations, generated and sold electrical energy produced by its diverse portfolio of renewable power generation and clean power generation facilities located in the United States and Canada. The renewable energy group (excluding hydro) was sold by the Company on January 8, 2025.
Key financial information related to the discontinued operations is as follows:
For the three months ended December 31, 2024, the renewable energy group's facilities generated operating revenue of $99.2 million as compared to $81.1 million in the comparable period in the prior year. The net loss attributable to the Company for the three months ended December 31, 2024 was $78.9 million and was primarily driven by loss from operations of $177.1 million, partially offset by income tax recoveries of $80.4 million and HLBV and other adjustments attributable to non-controlling interests of $17.9 million. The net income attributable to the Company for the same period in 2023 was $16.5 million, which included loss from operations of $9.1 million, offset by income tax recoveries of $14.2 million and HLBV and other adjustments attributable to non-controlling interests of $11.4 million.
For the twelve months ended December 31, 2024, the renewable energy group's facilities generated operating revenue of $339.7 million as compared to $294.1 million in the comparable period in the prior year. The net loss attributable to the Company for the twelve months ended December 31, 2024 was $1,445.8 million and was primarily driven by loss from operations of $1,634.6 million mainly due to loss on classification as held-for-sale of $1,357.3 million, offset by income tax recoveries of $128.3 million and HLBV and other adjustments attributable to non-controlling interests of $60.5 million. The net income attributable to the Company for the same period in 2023 was $43.1 million, which included loss from operations of $57.5 million, offset by income tax recoveries of $49.2 million and HLBV and other adjustments attributable to non-controlling interests of $51.4 million.
| | | | | | | | | | | | | | | | | | | | | | | |
2024 discontinued operations results |
| Three months ended | | Twelve months ended |
| December 31 | | December 31 |
| (all dollar amounts in $ millions) | 2024 | | 2023 | | 2024 | | 2023 |
| | | | | | | |
| | | | | | | |
| | | | | | | |
| | | | | | | |
| Revenue | $ | 99.2 | | | $ | 81.1 | | | $ | 339.7 | | | $ | 294.1 | |
| Operating income (loss) | $ | 57.3 | | | $ | (9.9) | | | $ | 47.9 | | | $ | (1.4) | |
| | | | | | | |
| | | | | | | |
| | | | | | | |
| Net income (loss) attributable to AQN | $ | (78.9) | | | $ | 16.5 | | | $ | (1,445.8) | | | $ | 43.1 | |
As at December 31, 2024, the total assets of the renewable energy group were $3,695.6 million as compared to $4,187.0 million as at December 31, 2023, a decrease of $491.4 million, mainly due to loss on classification as held-for-sale of $1,357.3 million, partially offset by $356.3 million due to the acquisitions of Shady Oaks II, Sandy Ridge II, New Market Solar, Carvers Creek and Clearview Solar during the year.
Total liabilities of the renewable energy group as at December 31, 2024,were $1,727.3 million as compared to $1,373.8 million as at December 31, 2023 including $1,348.7 million of long term indebtedness consisting of senior unsecured notes and credit facilities. The increase of $353.5 million was mainly due to an increase of $196.2 million and $227.5 million in credit facilities associated with construction financing at the Carvers Creek and Clearview solar facilities.
During the three months ended December 31, 2024, cash provided by operating activities totaled $41.8 million as compared to $49.8 million during the same period in 2023, a decrease of $8.0 million. During the twelve months ended December 31, 2024, cash provided by operating activities totaled $121.3 million as compared to $128.5 million during the same period in 2023, a decrease of $7.2 million. The decrease during the three months and twelve months ended December 31, 2024 was primarily as a result of changes in working capital items.
| | | | | | | | | | | |
2024 discontinued operations balances and cash flows |
| December 31 | | December 31 |
| (all dollar amounts in $ millions) | 2024 | | 2023 |
| | | |
| | | |
| | | |
| | | |
| Total assets held for sale | $ | 3,695.6 | | | $ | 4,187.0 | |
| Total liabilities associated with assets held for sale | $ | 1,727.3 | | | $ | 1,373.8 | |
| | | |
| | | |
| | | |
| | | |
| | | |
| | | |
| | | |
| | | | | |
| |
| Algonquin Power & Utilities Corp. - Management Discussion & Analysis | 34 |
| | | | | | | | | | | | | | | | | | | | | | | |
| Three months ended | | Twelve months ended |
| December 31 | | December 31 |
| 2024 | | 2023 | | 2024 | | 2023 |
Cash flows provided by (used in) | | | | | | |
Operating activities | $ | 41.8 | | | $ | 49.8 | | | $ | 121.3 | | | $ | 128.5 | |
| Investing activities | (61.7) | | | 16.6 | | | (196.0) | | | (225.1) | |
| | | | | | | |
Bank Credit Facilities
The following table sets out the bank credit facilities available to AQN related to discontinued operations as at December 31, 2024:
| | | | | | | | | | | | | |
| | As at December 31, 2024 | | | As at December 31, 2023 |
| (all dollar amounts in $ millions) | | Total | | | Total |
Revolving credit facilities & uncommitted letter of credit facilities | | $ | 1,100.0 | | | 1 | $ | 1,100.0 | |
Funds drawn on facilities | | (180.7) | | | | (262.6) | |
| Letters of credit issued | | (411.2) | | | | (392.0) | |
| Liquidity available under the facilities | | 508.1 | | | | 445.4 | |
| Undrawn portion of uncommitted letter of credit facilities | | (188.8) | | | | (214.6) | |
| Cash on hand | | 56.7 | | | | 31.1 | |
| Total Liquidity and Capital Reserves | | $ | 376.0 | | | | $ | 261.9 | |
| | | | | |
1 Includes $600 million of uncommitted standalone letter of credit facilities. |
As at December 31, 2024, the renewable energy group's $500.0 million senior unsecured syndicated revolving credit facility (the "Renewable Energy Credit Facility") had $180.7 million drawn and had no amounts drawn in outstanding letters of credit. The Renewable Energy Credit Facility matures on July 22, 2027.
As at December 31, 2024, the renewable energy group's bank lines consisted of $600.0 million letter of credit facilities (the "Renewable Energy LC Facilities"), including a $250.0 million uncommitted bilateral letter of credit facility and a $350.0 million uncommitted letter of credit facility. As at December 31, 2024, the Renewable Energy LC Facilities had $411.2 million in outstanding letters of credit.
Repayment of $163.7 million construction loan
On July 19, 2024, the Company repaid a $163.7 million third-party construction loan assumed on acquisition of the remaining 50% ownership interest in the Shady Oaks II Wind Facility.
Summary of Property, Plant and Equipment Expenditures
During the three months ended December 31, 2024, the renewable energy group made capital expenditures of $284.9 million as compared to $55.8 million during the same period in 2023. The renewable energy group's investments during the fourth quarter of 2024 were primarily related to the acquisition of the previously unowned portion of the Clearview Solar facility, as well as the development and/or construction of various projects and ongoing maintenance capital at existing operating sites.
During the twelve months ended December 31, 2024, the renewable energy group made capital expenditures of $983.3 million as compared to $287.7 million during the same period in 2023. The renewable energy group's investments in 2024 were primarily related to the acquisition of the previously unowned portion of the Shady Oaks II Wind facility, the Sandy Ridge II Wind facility, the New Market Solar facility, the Carvers Creek Solar facility, and the Clearview Solar facility, as well as the development and/or construction of various projects and ongoing maintenance capital at existing operating sites.
| | | | | |
| |
| Algonquin Power & Utilities Corp. - Management Discussion & Analysis | 35 |
NON-GAAP FINANCIAL MEASURES
Reconciliation of Adjusted EBITDA to Net Earnings
The following table is derived from and should be read in conjunction with the consolidated statement of operations. This supplementary disclosure is intended to more fully explain disclosures related to Adjusted EBITDA and provides additional information related to the operating performance of AQN. Investors are cautioned that this measure should not be construed as an alternative to U.S. GAAP consolidated net earnings.
| | | | | | | | | | | | | | | | | | | | | | | |
| Three months ended | | Twelve months ended |
| December 31 | | December 31 |
| (all dollar amounts in $ millions) | 2024 | | 2023 | | 2024 | | 2023 |
| Net earnings (loss) attributable to shareholders | $ | (186.4) | | | $ | 186.3 | | | $ | (1,380.5) | | | $ | 28.7 | |
| Add (deduct): | | | | | | | |
| Net earnings attributable to the non-controlling interest, exclusive of HLBV | 1.5 | | | 8.6 | | | 5.7 | | | 34.7 | |
| Loss from discontinued operations, net of tax | 78.9 | | | (16.5) | | | 1,445.9 | | | (43.1) | |
| Income tax expense (recovery) | 153.5 | | | 13.0 | | | 186.8 | | | (37.1) | |
| | | | | | | |
| Interest expense | 89.4 | | | 75.8 | | | 363.6 | | | 308.4 | |
Other net losses1 | 7.1 | | | 10.3 | | | 27.0 | | | 121.7 | |
| | | | | | | |
| | | | | | | |
| Asset impairment charge | — | | | 1.5 | | | — | | | 1.5 | |
| | | | | | | |
| Pension and post-employment non-service costs | 3.7 | | | 4.7 | | | 14.1 | | | 19.9 | |
| | | | | | | |
Change in value of investments carried at fair value2 | 2.0 | | | (117.5) | | | (21.7) | | | 215.3 | |
| | | | | | | |
| | | | | | | |
| Gain on derivative financial instruments | (0.4) | | | (0.6) | | | (0.8) | | | (4.6) | |
| | | | | | | |
| | | | | | | |
| Loss on foreign exchange | (0.3) | | | 5.4 | | | 3.5 | | | 13.7 | |
| Depreciation and amortization | 99.6 | | | 91.1 | | | 395.7 | | | 354.1 | |
| Adjusted EBITDA | $ | 248.6 | | | $ | 262.1 | | | $ | 1,039.3 | | | $ | 1,013.2 | |
| | | | | |
| |
| |
| 1 | See Note 18 in the audited consolidated financial statements. |
| |
| 2 | See Note 8 in the audited consolidated financial statements. |
| |
| | | | | |
| |
| Algonquin Power & Utilities Corp. - Management Discussion & Analysis | 36 |
Reconciliation of Adjusted Net Earnings to Net Earnings
The following table is derived from and should be read in conjunction with the consolidated statement of operations. This supplementary disclosure is intended to more fully explain disclosures related to Adjusted Net Earnings and provides additional information related to the operating performance of AQN. Investors are cautioned that this measure should not be construed as an alternative to consolidated net earnings in accordance with U.S. GAAP.
The following table shows the reconciliation of net earnings to Adjusted Net Earnings exclusive of these items:
| | | | | | | | | | | | | | | | | | | | | | | |
| Three months ended | | Twelve months ended |
| December 31 | | December 31 |
| (all dollar amounts in $ millions except per share information) | 2024 | | 2023 | | 2024 | | 2023 |
| Net earnings (loss) attributable to shareholders | $ | (186.4) | | | $ | 186.3 | | | $ | (1,380.5) | | | $ | 28.7 | |
| Add (deduct): | | | | | | | |
Loss (Earnings) from discontinued operations | 78.9 | | | (16.5) | | | 1,445.9 | | | (43.1) | |
| | | | | | | |
| Gain on derivative financial instruments | (0.4) | | | (0.6) | | | (0.8) | | | (4.6) | |
| | | | | | | |
| | | | | | | |
Other net losses1 | 7.1 | | | 10.3 | | | 27.0 | | | 121.7 | |
| Asset impairment charge | — | | | 1.5 | | | — | | | 1.5 | |
| | | | | | | |
| Loss on foreign exchange | (0.3) | | | 5.4 | | | 3.5 | | | 13.7 | |
| | | | | | | |
| | | | | | | |
| | | | | | | |
Change in value of investments carried at fair value2 | 2.0 | | | (117.5) | | | (21.7) | | | 215.3 | |
| | | | | | | |
| | | | | | | |
| | | | | | | |
| Adjustment for taxes related to above | 144.3 | | | 12.4 | | | 158.7 | | | (53.8) | |
| Adjusted Net Earnings | $ | 45.2 | | | $ | 81.3 | | | $ | 232.1 | | | $ | 279.4 | |
| Adjusted Net Earnings per common share | $ | 0.06 | | | $ | 0.12 | | | $ | 0.30 | | | $ | 0.39 | |
| | | | | |
| |
| 1 | See Note 18 in the audited consolidated financial statements. |
| |
| 2 | See Note 8 in the audited consolidated financial statements. |
| |
For the three months ended December 31, 2024, Adjusted Net Earnings totaled $45.2 million as compared to Adjusted Net Earnings of $81.3 million for the same period in 2023, a decrease of $36.1 million.
For the twelve months ended December 31, 2024, Adjusted Net Earnings totaled $232.1 million as compared to Adjusted Net Earnings of $279.4 million for the same period in 2023, a decrease of $47.3 million.
| | | | | |
| |
| Algonquin Power & Utilities Corp. - Management Discussion & Analysis | 37 |
Reconciliation of Adjusted Funds from Operations to Cash Provided by Operating Activities
The following table is derived from and should be read in conjunction with the consolidated statement of operations and consolidated statement of cash flows. This supplementary disclosure is intended to more fully explain disclosures related to Adjusted Funds from Operations and provides additional information related to the operating performance of AQN. Investors are cautioned that this measure should not be construed as an alternative to cash provided by operating activities in accordance with U.S GAAP.
The following table shows the reconciliation of cash provided by operating activities to Adjusted Funds from Operations exclusive of these items:
| | | | | | | | | | | | | | | | | | | | | | | |
| Three months ended | | Twelve months ended |
| December 31 | | December 31 |
| (all dollar amounts in $ millions) | 2024 | | 2023 | | 2024 | | 2023 |
| Cash provided by operating activities | $ | 48.1 | | | $ | 200.7 | | | $ | 481.7 | | | $ | 628.0 | |
| Add (deduct): | | | | | | | |
Cash provided by operating activities of discontinued operations | (41.8) | | | (49.8) | | | (121.3) | | | (128.5) | |
Changes in non-cash operating items for continuing operations | 84.9 | | | (1.8) | | | 139.4 | | | 86.3 | |
Changes in non-cash operating items from discontinued operations | (9.5) | | | 2.5 | | | 13.9 | | | (0.8) | |
| | | | | | | |
| | | | | | | |
| Production based cash contribution from non-controlling interest for continuing operations | — | | | — | | | 2.0 | | | — | |
| | | | | | | |
| | | | | | | |
| Costs related to tax equity financing | — | | | — | | | — | | | 1.2 | |
| | | | | | | |
| | | | | | | |
| Adjusted Funds from Operations | $ | 81.7 | | | $ | 151.6 | | | $ | 515.7 | | | $ | 586.2 | |
For the three months ended December 31, 2024, Adjusted Funds from Operations totaled $81.7 million as compared to Adjusted Funds from Operations of $151.6 million for the same period in 2023, a decrease of $69.9 million.
For the twelve months ended December 31, 2024, Adjusted Funds from Operations totaled $515.7 million as compared to Adjusted Funds from Operations of $586.2 million for the same period in 2023, a decrease of $70.5 million.
| | | | | |
| |
| Algonquin Power & Utilities Corp. - Management Discussion & Analysis | 38 |
SUMMARY OF PROPERTY, PLANT AND EQUIPMENT EXPENDITURES | | | | | | | | | | | | | | | | | | | | | | | |
| Three months ended | | Twelve months ended |
| | December 31 | | December 31 |
| (all dollar amounts in $ millions) | 2024 | | 2023 | | 2024 | | 2023 |
| Regulated Services Group | | | | | | | |
Rate Base Maintenance1 | $ | 97.7 | | | $ | 89.1 | | | $ | 387.1 | | | $ | 346.2 | |
| Rate Base Growth | $ | 160.8 | | | $ | 137.7 | | | $ | 369.1 | | | $ | 394.6 | |
| | | | | | | |
| $ | 258.5 | | | $ | 226.8 | | | $ | 756.2 | | | $ | 740.8 | |
| | | | | | | |
| | | | | | | |
| | | | | | | |
| | | | | | | |
| | | | | | | |
| Hydro Group | $ | 1.7 | | | $ | 1.6 | | | $ | 6.6 | | | $ | 6.7 | |
| Corporate Group | $ | 0.3 | | | $ | 0.3 | | | $ | 1.0 | | | $ | 1.2 | |
| | | | | | | |
| | | | | | | |
| | | | | | | |
| Total Capital Expenditures | $ | 260.5 | | | $ | 228.7 | | | $ | 763.8 | | | $ | 748.7 | |
| | | | | | | | |
| 1 | Maintenance expenditures are calculated based on the depreciation expense for the period. |
| |
2024 Fourth Quarter Property, Plant and Equipment Expenditures
During the three months ended December 31, 2024, the Regulated Services Group made capital expenditures of $258.5 million as compared to $226.8 million during the same period in 2023. The Regulated Services Group's investments during the fourth quarter of 2024 were primarily related to the construction of transmission and distribution main replacements, work on new and existing substation assets, and initiatives relating to the safety and reliability of water, electric and natural gas systems.
During the three months ended December 31, 2024, the Hydro Group made capital expenditures of $1.7 million as compared to $1.6 million during the same period in 2023. Investments during the fourth quarter of 2024 were primarily related to ongoing repairs and maintenance at existing operating sites.
During the three months ended December 31, 2024, the Corporate Group incurred sustaining capital expenditures of $0.3 million as compared to $0.3 million during the same period in 2023.
2024 Property, Plant and Equipment Expenditures
During the twelve months ended December 31, 2024, the Regulated Services Group incurred capital expenditures of $756.2 million as compared to $740.8 million during the same period in 2023. The Regulated Services Group's investments in 2024 were primarily related to the construction of transmission and distribution main replacements, work on new and existing substation assets, and initiatives relating to the safety and reliability of electric and natural gas systems.
During the twelve months ended December 31, 2024, the Hydro Group made capital expenditures of $6.6 million as compared to $6.7 million during the same period in 2023. Investments in 2024 were primarily related to ongoing repairs and maintenance at existing operating sites.
During the twelve months ended December 31, 2024, the Corporate Group incurred sustaining capital expenditures of $1.0 million as compared to $1.2 million during the same period in 2023.
| | | | | |
| |
| Algonquin Power & Utilities Corp. - Management Discussion & Analysis | 39 |
LIQUIDITY AND CAPITAL RESERVES
AQN has revolving credit and letter of credit facilities as well as separate credit facilities for the Regulated Services Group to manage liquidity and working capital requirements (collectively the "Bank Credit Facilities").
Bank Credit Facilities
The following table sets out the Bank Credit Facilities available to AQN and its operating groups as at December 31, 2024:
| | | | | | | | | | | | | |
| | | As at December 31, 2024 | | | As at December 31, 2023 |
| (all dollar amounts in $ millions) | | Total | | | Total |
| Revolving and term credit facilities | | $ | 2,380.3 | | | 1 | $ | 3,462.0 | |
| Funds drawn on facilities / commercial paper issued | | (814.8) | | | | (2,630.3) | |
| Letters of credit issued | | (26.2) | | | | (77.1) | |
| Liquidity available under the facilities | | 1,539.3 | | | | 754.6 | |
| Undrawn portion of uncommitted letter of credit facilities | | (63.3) | | | | (39.4) | |
| Cash on hand | | 34.8 | | | | 25.1 | |
| Total Liquidity and Capital Reserves | | $ | 1,510.8 | | | | $ | 740.3 | |
| | | | | |
1 Includes a $75 million uncommitted standalone letter of credit facility and $180.3 million fully drawn term facilities of Suralis and BELCO as at December 31, 2024 ($176.5 million as at December 31, 2023). |
Regulated Services Group
As at December 31, 2024, the Regulated Services Group's $1.0 billion senior unsecured revolving credit facility (the "Long-Term Regulated Services Credit Facility") had no amounts drawn and had $13.7 million of outstanding letters of credit. The Long-Term Regulated Services Credit Facility matures on April 29, 2027. As at December 31, 2024, the Regulated Services Group had $383.0 million of commercial paper issued and outstanding. On October 25, 2024, the $500.0 million short term regulated services credit facility terminated on its maturity and the $610.4 million senior unsecured syndicated delayed draw term facility was repaid on its maturity date.
As at December 31, 2024, the Regulated Services Group's $100.0 million senior unsecured revolving credit facility (the "Bermuda Credit Facility") had $65.4 million drawn. On January 29, 2024, the Company amended the Bermuda Credit
Facility, increasing the limit by $25 million to $100 million. On November 18, 2024, the Company extended the maturity of the Bermuda Credit Facility from December 31, 2024 to December 31, 2025.
As at December 31, 2024, the Regulated Services Group's $25.0 million senior unsecured revolving credit facility (the "Bermuda Working Capital Facility") had $3.5 million drawn. On October 30, 2024, the Company extended the maturity of the Bermuda Working Capital Facility to June 24, 2025.
Corporate Group
As at December 31, 2024, the $1.0 billion senior unsecured revolving credit facility (the "Corporate Credit Facility") had $182.6 million drawn and had $0.8 million of outstanding letters of credit. The Corporate Credit Facility matures on March 31, 2028.
On January 8, 2024, the maturity date of the fully drawn $306.5 million Margin Loan was extended to September 30, 2024. The Company reclassified the Margin Loan from redeemable non-controlling interest held by related party to long-term debt as at January 4, 2024. On June 20, 2024, the $306.5 million Margin Loan was repaid in full.
As at December 31, 2024, the Company had issued $11.7 million of letters of credit from its $75.0 million uncommitted letter of credit facility.
| | | | | |
| |
| Algonquin Power & Utilities Corp. - Management Discussion & Analysis | 40 |
Long-Term Debt
Issuance of $850 Million of Senior Unsecured Notes
On January 12, 2024, Liberty Utilities completed the offering of $500 million aggregate principal amount of 2029 Notes and $350 million aggregate principal amount of 2034 Notes. The Senior Notes are unsecured and unsubordinated obligations of Liberty Utilities and rank equally with all of Liberty Utilities' existing and future unsecured and unsubordinated indebtedness and senior in right of payment to any existing and future Liberty Utilities subordinated indebtedness. The 2029 Notes were priced at an issue price of 99.996% of their face value and the 2034 Notes were priced at an issue price of 99.995% of their face value. Liberty Utilities used the net proceeds from the sale of the Senior Notes to repay indebtedness.
On April 30, 2024, the Company repaid a $70.0 million senior unsecured note on its maturity.
Issuance of $305.5 Million of Securitized Utility Tariff Bonds
On January 30, 2024, Empire District Bondco, LLC, a wholly owned subsidiary of The Empire District Electric Company, completed an offering of Securitization Bonds comprised of approximately $180.5 million of aggregate principal amount of 4.943% Securitized Utility Tariff Bonds with a maturity date of January 1, 2035 and $125.0 million aggregate principal amount of 5.091% Securitized Utility Tariff Bonds with a maturity date of January 1, 2039, to recover previously incurred qualified extraordinary costs associated with the Midwest Extreme Weather Event and energy transition costs related to the retirement of the Asbury generating plant. The principal asset securing the Securitization Bonds is the securitized utility tariff property.
Remarketing of 1.18% Senior Notes
On March 28, 2024, the Company successfully remarketed its $1,150 million aggregate principal amount of Notes. The Notes were originally issued in June 2021, together with the related Purchase Contracts, as a component of the Green Equity Units. In connection with the remarketing, the interest rate on the Notes was reset to 5.365%, with the maturity date remaining as June 15, 2026. The proceeds from the remarketing of the Notes were used to purchase a portfolio of treasury securities that matured on June 13, 2024. The funds generated upon maturity of the treasury portfolio were used on June 17, 2024 to settle the Purchase Contracts. In connection with the settlement of the Purchase Contracts, the Company issued approximately 76.9 million common shares for proceeds of $1,150.0 million. The Company used the proceeds from the settlement of the Purchase Contracts to reduce existing indebtedness of the Company and its subsidiaries and for general corporate purposes.
Credit Ratings
AQN has a long-term consolidated corporate credit rating of BBB from Standard & Poor's Financial Services LLC, ("S&P"), a BBB rating from DBRS Limited ("DBRS") and a BBB issuer rating from Fitch Ratings Inc. ("Fitch").
Liberty Utilities has a corporate credit rating of BBB from S&P, a BBB issuer rating from Fitch and a Baa2 issuer rating from Moody's Investor Service, Inc. ("Moody's"). Debt issued by Liberty Utilities has a rating of BBB from S&P, BBB+ from Fitch and Baa2 from Moody's. Debt issued by Liberty Utilities Finance GP1 ("Liberty GP") has a rating of BBB (high) from DBRS, BBB+ from Fitch, BBB from S&P and Baa2 from Moody's. Empire has an issuer rating of BBB from S&P and a Baa1 rating from Moody's. Liberty Utilities (Canada) LP, the parent company for the Canadian regulated utilities under the Regulated Services Group, has an issuer rating of BBB from DBRS. The fixed-rate securitized utility tariff bonds (series 2024-A) issued by Empire District Bondco, LLC have a rating of AAA (sf) from S&P and Moody's.
| | | | | |
| |
| Algonquin Power & Utilities Corp. - Management Discussion & Analysis | 41 |
Contractual Obligations
Information concerning contractual obligations from continuing operations as of December 31, 2024 is shown below:
| | | | | | | | | | | | | | | | | | | | | | | | | | | | | |
| (all dollar amounts in $ millions) | Total | | Due in less
than 1 year | | Due in 1
to 3 years | | Due in 4
to 5 years | | Due after
5 years |
Principal repayments on debt obligations1,2 | $ | 6,732.8 | | | $ | 610.0 | | | $ | 1,652.3 | | | $ | 1,121.3 | | | $ | 3,349.2 | |
| | | | | | | | | |
| Advances in aid of construction | 102.9 | | | 1.0 | | | — | | | — | | | 101.9 | |
Interest on long-term debt obligations2 | 4,762.6 | | | 383.9 | | | 562.1 | | | 404.6 | | | 3,412.0 | |
| Purchase obligations | 667.4 | | | 667.4 | | | — | | | — | | | — | |
| Environmental obligations | 48.9 | | | 7.8 | | | 17.2 | | | 3.1 | | | 20.8 | |
| Derivative financial instruments: | | | | | | | | | |
| Cross currency interest rate swaps | 19.8 | | | 0.6 | | | 0.9 | | | 0.2 | | | 18.1 | |
| | | | | | | | | |
Commodity contracts | 0.3 | | | 0.3 | | | — | | | — | | | — | |
| Purchased power | 214.7 | | | 47.2 | | | 24.9 | | | 25.8 | | | 116.8 | |
| Gas delivery, service and supply agreements | 503.4 | | | 101.5 | | | 129.6 | | | 105.4 | | | 166.9 | |
| Service agreements | 31.8 | | | 17.7 | | | 13.1 | | | 1.0 | | | — | |
| Capital projects | 1.1 | | | 1.1 | | | — | | | — | | | — | |
| Land easements | 94.3 | | | 3.2 | | | 6.5 | | | 6.8 | | | 77.8 | |
| | | | | | | | | |
| Other obligations | 4.3 | | | 0.7 | | | 2.0 | | | 1.4 | | | 0.2 | |
Total Obligations3 | $ | 13,184.3 | | | $ | 1,842.4 | | | $ | 2,408.6 | | | $ | 1,669.6 | | | $ | 7,263.7 | |
| | | | | |
| 1 | Exclusive of deferred financing costs, bond premium/discount, and fair value adjustments at the time of issuance or acquisition. |
| 2 | The Company's subordinated unsecured notes have a maturity in 2079 and 2082, respectively. However, the Company currently anticipates repaying such notes in advance of maturity upon exercise of the Company's redemption rights in accordance with the terms of the applicable indenture. |
| 3 | Excludes performance guarantees and other commitments on behalf of variable interest entities. See Note 8 in the audited consolidated financial statements. |
Equity
The common shares of AQN are publicly traded on the Toronto Stock Exchange and the New York Stock Exchange under the trading symbol "AQN". As at March 6, 2024, AQN had 767,452,437 issued and outstanding common shares.
AQN may issue an unlimited number of common shares. The holders of common shares are entitled to dividends, if and when declared; to one vote for each share at meetings of the holders of common shares; and to receive a pro rata share of any remaining property and assets of AQN upon liquidation, dissolution or winding up of AQN. All common shares are of the same class and with equal rights and privileges and are not subject to future calls or assessments.
AQN is also authorized to issue an unlimited number of preferred shares, issuable in one or more series, containing terms and conditions as approved by the Board. As at March 6, 2025, AQN had outstanding:
•4,800,000 Cumulative Rate Reset Preferred Shares, Series A, yielding 6.576% annually for the five-year period ending on December 31, 2028: and
•4,000,000 Cumulative Rate Reset Preferred Shares, Series D, yielding 6.853% annually for the five year period ending on March 31, 2029.
Declaration of 2025 First Quarter Dividend of $0.0650 (C$0.0934) per Common Share
The Board has declared a first quarter 2025 dividend of $0.0650 per common share payable on April 15, 2025 to shareholders of record on March 31, 2025.
The Canadian dollar equivalent for the first quarter 2025 dividend is C$0.0934 per common share.
Changes in the level of dividends paid by AQN are at the discretion of the Board, with dividend levels being reviewed periodically by the Board in the context of AQN's financial performance and growth prospects.
The previous four quarter U.S. and Canadian dollar equivalent dividends per common share have been as follows:
| | | | | |
| |
| Algonquin Power & Utilities Corp. - Management Discussion & Analysis | 42 |
| | | | | | | | | | | | | | | | | | | | |
| Q2 2024 | Q3 2024 | Q4 2024 | Q1 2025 | Total | | | |
| U.S. dollar dividend | $ | 0.1085 | | $ | 0.0650 | | $ | 0.0650 | | $ | 0.0650 | | $0.3035 | | | |
| Canadian dollar equivalent | $ | 0.1490 | | $ | 0.0893 | | $ | 0.0901 | | $ | 0.0934 | | $0.4218 | | | |
| | | | | | | | |
Dividend Reinvestment Plan
Effective March 16, 2023, AQN suspended its shareholder dividend reinvestment plan (the "Reinvestment Plan") for registered holders of common shares of AQN. Effective for the first quarter 2023 dividend (paid on April 14, 2023 to shareholders of record on March 31, 2023), shareholders participating in the Reinvestment Plan began receiving cash dividends. If the Company elects to reinstate the Reinvestment Plan in the future, shareholders who were enrolled in the Reinvestment Plan at its suspension and remain enrolled at reinstatement will automatically resume participation in the Reinvestment Plan.
As at December 31, 2024, 168,595,010 common shares representing approximately 22% of total common shares outstanding had been registered with the Reinvestment Plan.
SHARE-BASED COMPENSATION PLANS
For the twelve months ended December 31, 2024, AQN recorded $18.4 million in total share-based compensation expense, as compared to $10.5 million for the same period in 2023. The compensation expense is recorded as part of operating expenses in the consolidated statement of operations. The portion of share-based compensation costs capitalized as cost of construction is insignificant.
As at December 31, 2024, total unrecognized compensation costs related to non-vested share-based awards was $11.1 million and is expected to be recognized over a period of 1.4 years.
Stock Option Plan
AQN currently has a stock option plan that permits the grant of share options to officers, directors, employees and selected service providers. Except in certain circumstances, the term of an option shall not exceed ten (10) years from the date of the grant of the option.
AQN determines the fair value of options granted using the Black-Scholes option-pricing model. The estimated fair value of options, including the effect of estimated forfeitures, is recognized as an expense on a straight-line basis over the options' vesting periods while ensuring that the cumulative amount of compensation cost recognized at least equals the value of the vested portion of the award at that date. During the twelve months ended December 31, 2024, there were no stock options granted to the executives of the Company. No stock options were exercised during the twelve months ended December 31, 2024.
As at December 31, 2024, a total of 2,045,079 options were issued and outstanding under the stock option plan.
Performance and Restricted Share Units
AQN issues performance share units ("PSUs") and restricted share units ("RSUs") to certain employees as part of AQN's long-term incentive program. During the twelve months ended December 31, 2024, the Company granted (including dividends) a combined total of 2,863,298 PSUs and RSUs to employees of the Company. The awards vest based on the terms of each agreement ranging from January 2025 to January 2028. During the twelve months ended December 31, 2024, the Company settled 416,659 PSUs, of which 228,307 PSUs were exchanged for common shares issued from treasury and 188,352 PSUs and RSUs were settled at their cash value as payment for tax withholding related to the settlement of the awards.
As at December 31, 2024, a combined total of 5,190,970 PSUs and RSUs were granted and outstanding under the performance and restricted share unit plan.
Directors' Deferred Share Units
AQN has a Directors' Deferred Share Unit Plan. Under the plan, non-employee directors of AQN receive a portion of their annual compensation in deferred share units ("DSUs") and may elect to receive their cash remuneration in the form of DSUs, cash, or any combination of DSUs and cash. During the twelve months ended December 31, 2024, the Company issued 250,369 DSUs (including DSUs in lieu of dividends) to the non-employee directors of the Company. During the twelve months ended December 31, 2024, the Company settled 373,113 DSUs in exchange for 183,566 common shares issued from treasury, and 189,547 DSUs were settled at their cash value as payment for tax withholding related to the settlement of the awards. As at December 31, 2024, a total of 601,838 DSUs were outstanding under the Directors' Deferred Share Unit Plan.
| | | | | |
| |
| Algonquin Power & Utilities Corp. - Management Discussion & Analysis | 43 |
Bonus Deferral Restricted Share Units
The Company has a bonus deferral RSU program that is available to certain employees. The eligible employees have the option to receive a portion or all of their annual bonus payment in RSUs in lieu of cash. The RSUs provide for settlement in common shares, and therefore these RSUs are accounted for as equity awards. During the twelve months ended December 31, 2024, the Company settled 13,232 bonus deferral RSUs in exchange for 6,147 common shares issued from treasury, and 7,085 bonus deferral RSUs were settled at their cash value as payment for tax withholding related to the settlement of the awards. In addition, during the twelve months ended December 31, 2024, 51,776 bonus deferral RSUs were granted (including RSUs in lieu of dividends) to employees of the Company pursuant to the bonus deferral RSU program. Such RSUs are 100% vested.
Employee Share Purchase Plan
AQN has an Employee Share Purchase Plan (the "ESPP") which allows eligible employees to use a portion of their earnings to purchase common shares of AQN. The aggregate number of common shares reserved for issuance from treasury by AQN under this plan shall not exceed 6,500,000 shares. During the twelve months ended December 31, 2024, the Company issued 741,849 common shares to employees under the ESPP.
As at December 31, 2024, a total of 3,888,646 common shares had been issued under the ESPP.
MANAGEMENT OF CAPITAL STRUCTURE
AQN views its capital structure in terms of its debt and equity levels at its individual operating groups and at an overall company level.
AQN's objectives when managing capital are:
•To maintain its capital structure consistent with investment grade credit metrics appropriate to the sectors in which AQN operates;
•To maintain the utilities' capital structures consistent with capital structures approved by regulators in the jurisdictions in which the Company operates;
•To maintain appropriate debt and equity levels and to limit financial constraints on the use of capital;
•To have available capital to finance capital expenditures sufficient to maintain existing assets;
•To generate sufficient cash to fund sustainable dividends to shareholders as well as meet current tax and internal capital requirements; and
•To have appropriately sized revolving credit facilities available for ongoing investment in growth and development opportunities.
AQN monitors its cash position on a regular basis in an effort to have available funds to meet normal course capital and other expenditures.
ENTERPRISE RISK MANAGEMENT
The Corporation is subject to a number of risks and uncertainties, certain of which are described below. The risks discussed below are not intended to be a complete list of all risks that AQN, its subsidiaries and affiliates are encountering or may encounter. Please see the Company's most recent AIF available on SEDAR+ and EDGAR for a further discussion of risk factors to which the Company is subject. To the extent of any inconsistency, the risks discussed below are intended to provide an update on those that were previously disclosed.
Risks Related to Changes in Laws and Regulations
The operations and activities of the Company, its subsidiaries and its business units are subject to the laws, regulations, orders and other requirements of a variety of federal, state, provincial and local governments and courts, including regulatory commissions, environmental agencies and other regulatory bodies, which laws, regulations, decisions, orders, rules and other requirements affect the operations and activities of, and costs incurred by, the Company. The Company is accordingly subject to risks associated with: changing political conditions and changes in political leadership, changes in, modifications to, reinterpretations of or application of existing laws, rules, orders or regulations, the imposition of new laws, rules, orders or regulations (including the imposition of import controls and tariffs and the power of eminent domain), court decisions, and the taking of other action by governmental, judicial or regulatory authorities, including, but not limited to, a pause, reduction or elimination of relevant federal funding, incentives, credits or programs, revocation, lapse, limitation or non-renewal of utility franchises or other rights to provide utility services to existing or new customers, potential limitations on water rights used by utilities in providing service, eminent domain of assets, termination of contracts, actions to
| | | | | |
| |
| Algonquin Power & Utilities Corp. - Management Discussion & Analysis | 44 |
municipalize utility service areas or limitations on utility growth and/or expansions of service areas, any of which could adversely affect the Company's business, regulatory approvals, assets, results of operations and financial condition. If the Company or any of its subsidiaries or business units were found to be in violation of such applicable laws, regulations, orders or other requirements, they could be subject to significant penalties or legal actions and/or legal or regulatory decisions that could have a material impact on the Company.
Treasury Risk Management
Downgrade in the Company's Credit Rating Risk
AQN has a long-term consolidated corporate credit rating of BBB from S&P, a BBB issuer rating from DBRS and a BBB issuer rating from Fitch. Liberty Utilities, the parent company for the U.S. regulated utilities under the Regulated Services Group, has an issuer credit rating of BBB from S&P, a BBB issuer rating from Fitch and a Baa2 issuer rating from Moody's. Debt issued by Liberty Utilities has a rating of BBB from S&P, BBB+ from Fitch and Baa2 from Moody's. Debt issued by Liberty GP, a special purpose financing entity of Liberty Utilities, has a rating of BBB (high) from DBRS, BBB+ from Fitch, BBB from S&P and Baa2 from Moody's. Empire has a BBB issuer rating from S&P and a Baa1 issuer rating from Moody's. Liberty Utilities (Canada) LP, the parent company for the Canadian regulated utilities under the Regulated Services Group has a BBB issuer rating from DBRS. The fixed-rate securitized utility tariff bonds (series 2024-A) issued by Empire District Bondco, LLC have a rating of AAA (sf) from S&P and Moody's. There can be no assurance that any of the current ratings of AQN or its subsidiaries will remain in effect for any given period of time or that a rating will not be lowered or withdrawn entirely by a rating agency if, in its judgment, circumstances in the future so warrant.
The ratings indicate the agencies' assessment of the ability to pay the interest and principal of debt securities issued by such entities. A rating is not a recommendation to purchase, sell or hold securities and each rating should be evaluated independently of any other rating. The lower the rating, the higher the interest cost of the securities when they are sold. A downgrade in AQN's or any of its subsidiaries' issuer corporate credit ratings would result in an increase in AQN's borrowing costs under its bank credit facilities and future long-term debt securities issued. Any such downgrade could also adversely impact the market price of the outstanding securities of the Company, could impact the Company's ability to acquire additional regulated utilities and could require the Company or its subsidiaries to post additional or replacement security under certain contracts and hedging arrangements, which could result in increased costs to the Company. If any of AQN's ratings fall below investment grade (defined as BBB- or above for S&P and Fitch, BBB (low) or above for DBRS and Baa3 or above for Moody's), AQN's ability to issue short-term debt or other securities or to market those securities would be constrained or made more difficult or expensive. Therefore, any downgrade could have a material adverse effect on AQN's business, cost of capital, financial condition and results of operations.
The Company is not adopting or endorsing such ratings, and such ratings do not indicate AQN's assessment of its own ability to pay the interest or principal of debt securities it issues. The Company is providing such ratings only to assist with the assessment of future risks and effects of ratings on the Company's financing costs.
Each rating agency employs proprietary scoring methodologies that assess business and financial risks of the entity rated. There can be no assurance that the principles on which the rating is based remain consistently applied, and these principles are subject to change from time to time at each rating agency's discretion. For example, a rating agency's views on total allowable leverage, specific industry risk factors, the Company's business mix, and risk associated with countries and/or regulatory jurisdictions in which the business operates, among other factors, may change. Such changes could require AQN to adjust its business and strategy in order to maintain its credit ratings. The Company has completed the sale of the renewable energy business (excluding hydro) and its interest in Atlantica and expects to generate nearly all of its EBITDA from the Regulated Services Group.
Capital Markets and Liquidity Risk
As at December 31, 2024, the Company and its subsidiaries had approximately $8,047.5 million of long-term consolidated indebtedness, including $1,348.7 million of long-term indebtedness included in liabilities held for sale. Management of the Company believes, based on its current expectations as to the Company's future performance, that the cash flow from operations, the funds available under its credit facilities, the proceeds from the Renewables Sale or from other potential future dispositions, and its ability to access capital markets will be adequate to enable the Company to finance its operations, execute its business strategy and maintain an adequate level of liquidity. However, the Company's expected revenue and capital expenditures are only estimates. Moreover, actual cash flows from operations will depend on regulatory, market and other conditions that are beyond the Company's control and which may be impacted by the risk factors herein. As a result, there can be no assurance that management's expectations as to future performance will be realized.
The Company's ability to obtain additional debt or equity or issue other securities, on favourable terms or at all, may be adversely affected by negative perceptions of the Company, any adverse financial or operational performance, the price of Common Shares of the Company, financial market disruptions, the failure or collapse of any financial institution, prevailing
| | | | | |
| |
| Algonquin Power & Utilities Corp. - Management Discussion & Analysis | 45 |
market views and perceptions, or other factors outside the Company's control. In addition, the Company may at times incur indebtedness in excess of its long-term leverage targets, in advance of raising the additional equity or similar securities necessary to repay such indebtedness and maintain its long-term leverage target. Any increase in the Company's leverage or degradation of key credit metrics below threshold levels could, among other things: limit the Company's ability to obtain additional financing for working capital, investments in subsidiaries, capital expenditures, debt service requirements, acquisitions and general corporate or other purposes; restrict the Company's flexibility and discretion to operate its business; limit the Company's ability to declare dividends or maintain prior dividend levels; require the Company to dedicate a portion of cash flows from operations to the payment of interest on its existing indebtedness, in which case such cash flows would not be available for other purposes; cause rating agencies to re-evaluate or downgrade the Company's existing credit ratings; require the Company to post additional collateral security under some of its contracts and hedging arrangements; expose the Company to increased interest expense on borrowings at variable rates; limit the Company's ability to adjust to changing market conditions; place the Company at a competitive disadvantage compared to its competitors; make the Company vulnerable to any downturn in general economic conditions; render the Company unable to make expenditures that are important to its future growth strategies and require the Company to pursue alternative funding strategies.
The Company will need to refinance or reimburse amounts outstanding under the Company's existing consolidated indebtedness over time. There can be no assurance the Company will be successful in refinancing its indebtedness when necessary or that additional financing will be obtained when needed, on commercially reasonable terms or at all. In the event that the Company cannot refinance its indebtedness or raise additional indebtedness, or if the Company cannot refinance its indebtedness or raise additional indebtedness on terms that are no less favourable than the current terms, the Company's cash flows and ability to declare dividends or repay its indebtedness may be adversely affected.
The Company's ability to meet its debt service requirements will depend on its ability to generate cash in the future, which depends on many factors, including the Company's financial performance, debt service obligations, the realization of the anticipated benefits of acquisition, disposition and investment activities, and working capital and capital expenditure requirements. In addition, the Company's ability to borrow funds in the future to make payments on outstanding debt will depend on the satisfaction of covenants in existing credit agreements and other agreements. A failure to comply with any covenants or obligations under the Company's consolidated indebtedness could result in a default under one or more such instruments, which, if not cured or waived, could result in the termination of dividends by the Company and permit acceleration of the relevant indebtedness. There can be no assurance that, if such indebtedness were to be accelerated, the Company's assets would be sufficient to repay such indebtedness in full. There can also be no assurance that the Company will generate cash flow in amounts sufficient to pay its outstanding indebtedness or to fund the Company's liquidity needs.
Interest Rate Risk
The Company is exposed to interest rate risk from certain outstanding variable interest indebtedness, as well as any new borrowings on existing and new credit facilities and other debt issuances. Fluctuations in interest rates may also impact the costs to obtain other forms of capital and the feasibility of planned growth initiatives.
In addition, for the Regulated Services Group, costs resulting from interest rate increases may not be recoverable in whole or in part, and "regulatory lag" may cause a time delay in the payment to the Regulated Services Group of any such costs that are recoverable.
As a result, fluctuations in interest rates could materially increase the Corporation's financing costs, limit the Corporation's options for financing or investment and adversely affect its results of operations, cash flows, key credit metrics, borrowing capacity and ability to implement its business strategy.
As at December 31, 2024, approximately 89% of debt outstanding in AQN and its subsidiaries was subject to a fixed rate of interest and as a result, such debt is not subject to significant interest rate risk in the short-term time horizon.
Borrowings subject to variable interest rates can fluctuate significantly from month to month, quarter to quarter and year to year. AQN's target is to maintain a minimum of 85% fixed rate debt. As a result, the Company hedges the interest rate risk on its variable interest rate borrowings from time to time.
Based on amounts outstanding as at December 31, 2024, the impact to interest expense on variable rate loans from changes in interest rates are as follows:
•the Corporate Credit Facility is subject to a variable interest rate and had $182.6 million outstanding as at December 31, 2024. As a result, a 100 basis point change in the variable rate charged would impact interest expense by $1.8 million annually;
•the Long-Term Regulated Services Credit Facility is subject to a variable interest rate and had no amounts outstanding as at December 31, 2024. As a result, a 100 basis point change in the variable rate charged would not impact interest expense;
| | | | | |
| |
| Algonquin Power & Utilities Corp. - Management Discussion & Analysis | 46 |
•the Bermuda Credit Facility is subject to a variable interest rate and had $65.4 million outstanding as at December 31, 2024. As a result, a 100 basis point change in the variable rate charged would impact interest expense by $0.7 million annually;
•the Bermuda Working Capital Facility is subject to a variable interest rate and had $3.5 million outstanding as at December 31, 2024. As a result, a 100 basis point change in the variable rate charged would impact interest expense by less than $0.04 million;
•the Regulated Services Group's commercial paper program is subject to a variable interest rate and had $383.0 million outstanding as at December 31, 2024. As a result, a 100 basis point change in the variable rate charged would impact interest expense by $3.8 million annually; and
•term facilities at Suralis that are subject to variable interest rates had $127.0 million outstanding as at December 31, 2024. As a result, a 100 basis point change in the variable rate charged would impact interest expense by $1.3 million annually.
The term loan facility at BELCO is subject to variable interest rates. However, the Company separately entered into an interest swap agreement to hedge the risk associated with interest rate fluctuation.
Foreign Currency Risk
The functional currency of most of AQN's operations is the U.S. dollar, however AQN is exposed to currency fluctuations from its Canadian and Chilean operations and may utilize equipment and/or commodities purchased from foreign suppliers.
AQN may enter into derivative contracts to hedge all or a portion of currency exchange rate exposure that is transactional in nature and where a natural economic hedge does not exist (see Note 24 (b)(iii) in the annual consolidated financial statements). To the extent that the Company does enter into currency hedges, the Company may not realize the full benefits of favourable exchange rate movement, and is subject to risks that the counterparty to the hedging contracts may prove unable or unwilling to perform their obligations under the contracts.
Canadian operations
The Company is exposed to currency fluctuations from its Canadian-based operations. AQN manages this risk primarily through the use of natural hedges by using long-term debt in Canadian Dollars to finance its Canadian operations and a combination of foreign exchange forward contracts and spot purchases.
Chilean operations
The Company is exposed to currency fluctuations from its Chilean-based operations. AQN manages this risk primarily through the use of natural hedges by using long-term debt in Chilean pesos or indexed to the Chilean Peso to finance its Chilean operations.
Tax Risk and Uncertainty
The Corporation is subject to income and other taxes primarily in the United States, Canada, Bermuda, and Chile; however, it is also subject to tax in other jurisdictions. Changes in tax laws or interpretations or applications thereof, which may or may not have a retroactive effect, in the jurisdictions in which the Corporation does business could adversely affect the Company's results from operations, returns to shareholders, and cash flows.
On June 20, 2024, Canada enacted the Excessive Interest and Financing Expenses Limitation ("EIFEL") rules (under the Income Tax Act (Canada)) and the Global Minimum Tax Act ("GMTA"). These legislative changes align with efforts of the Organization for Economic Co-operation and Development (“OECD”) to address base erosion and profit shifting, including by ensuring that multinational enterprises do not unduly reduce taxable income through interest and financing expenses and pay a minimum level of tax on their global income.
•Generally, under the EIFEL rules, the tax-deductible amount of a taxpayer’s interest and financing expenses is limited to a fixed ratio (generally equal to 30%) of such taxpayer’s earnings before interest, taxes, depreciation and amortization computed for tax purposes. The EIFEL rules are applicable to the Corporation for its 2024 and subsequent taxation years. Although at this time the Corporation does not expect a material impact on its financial results as a result of the enactment of the EIFEL rules, the Corporation cannot provide assurance that there will not be a material impact on its financial results in the future due to various factors, including changes in its capital structures, interpretations of the EIFEL rules, future events and other circumstances.
•The GMTA is intended to implement the income inclusion rule (“IIR”) and domestic minimum top-up tax (“DMTT”) rule that form part of the Global Anti-Base Erosion Model Rules published by the OECD (the “GloBE Rules”). The IIR and DMTT rules in the GMTA are applicable to the Corporation for its 2024 and subsequent taxation years. Based on existing guidance (including, inter alia, the explanatory notes relating to the
| | | | | |
| |
| Algonquin Power & Utilities Corp. - Management Discussion & Analysis | 47 |
GMTA and the commentary to the GloBE Rules published by the OECD), the Corporation does not expect the IIR or DMTT rules to have a material impact on its financial results; however, the Corporation cannot provide assurance that interpretations of the IIR and DMTT rules will not change, or additional guidance will not be issued that will negatively impact the Corporation’s current position.
The Corporation cannot provide assurance that the Canada Revenue Agency, the Internal Revenue Service or any other applicable taxation authority will agree with the tax positions taken by the Corporation, including with respect to claimed expenses and the cost amount of the Corporation's depreciable properties. A successful challenge by an applicable taxation authority regarding such tax positions could adversely affect the results of operations and financial position of the Corporation.
The Corporation relies in part on federal tax credits and other tax incentives with respect to the development and operation of renewable power generation facilities in the United States, including those sold as part of the Renewables Sale. The Inflation Reduction Act extended and expanded certain energy credits, providing greater certainty regarding the availability of these credits on a going forward basis. However, the rules governing these tax credits still include technical requirements for credit eligibility. If the Corporation is unable to complete construction on any project within certain deadlines or satisfy certain new requirements relating to prevailing wage and apprenticeship requirements, the reduced incentives or elimination of incentives may be insufficient to support continued development or may result in substantially reduced financial benefits from facilities that are completed. Further, recent political developments in the U.S. have introduced significant uncertainty with respect to funding under the Inflation Reduction Act, including federal tax credits and other tax incentives. A pause, reduction or elimination of tax credits and/or other tax incentives may have a significant adverse effect on the Corporation, including substantially reducing funds expected to be received by the Corporation. In addition, the Corporation has entered into certain tax equity financing transactions with financial partners for certain of its renewable power facilities in the United States, under which allocations of future cash flows to the Corporation from the applicable facility could be adversely affected in the event that there are changes in U.S. tax laws that apply to facilities previously placed in service.
Credit/Counterparty Risk
AQN and its subsidiaries are subject to credit risk with respect to the ability of customers and other counterparties to perform their obligations to the Company, including paying amounts that they owe to AQN or its subsidiaries. This credit risk exists with respect to utility customers, banks and other financing sources, as well as counterparties to long-term power purchase agreements (“PPAs”), unit contingent or fixed-shape offtake contract or other energy offtake or hedging arrangement (together with PPAs, “Offtake Contracts”), supply agreements, trade receivables, derivative financial instruments, and construction contracts, among others. Additionally, bank deposits in excess of deposit insurance limits are subject to the risk that such excess amounts could be lost or forfeited in the event of a bank failure.
AQN’s key businesses includes Regulated Services Group, Hydro Group, and Corporate Group. The company’s revenue is primarily earned by the Regulated Services Group.
The credit exposure attributed to the Regulated Services Group's accounts receivable balances at the water and wastewater distribution systems total $81.5 million which is spread over approximately 577,000 customer connections, resulting in an average outstanding balance of approximately $141 dollars per customer connection.
The natural gas distribution systems accounts receivable balances related to the natural gas utilities total $124.9 million, while electric distribution systems accounts receivable balances related to the electric utilities total $189.2 million. The natural gas and electrical utilities both derive over 95% of their revenue from residential customers and have a per customer connection average outstanding balance of $330 and $610 respectively. Counterparty performance risk also exists in the natural gas distribution utilities where suppliers could potentially fail to supply natural gas leading to disruptions and potentially higher procurement costs. These risks are mitigated through the receipt of collateral from counterparties.
Adverse conditions in the energy and water industries or in the general economy, as well as circumstances of individual customers or counterparties, may adversely affect the ability of a customer or counterparty to perform as required under its contract with the Company. Losses from a utility customer may not be offset by bad debt reserves approved by the applicable utility regulator. If a customer under an Offtake Contract with the Company is unable to perform, the Hydro Group may be unable to replace the contract on comparable terms, in which case sales of power from the facility would be subject to market price risk and may require refinancing of indebtedness related to the facility or otherwise have a material adverse effect on the Hydro Group. Default by other counterparties, including lenders and counterparties to supply and construction contracts, service contracts, hedging contracts that are in an asset position, short-term investments, agreements for the purchase of goods or services or other agreements, also could adversely affect the financial results of the Corporation. Losses associated with equipment failure, defects, design flaws or other issues resulting from counterparty non-performance may not be covered by warranties or insurance.
| | | | | |
| |
| Algonquin Power & Utilities Corp. - Management Discussion & Analysis | 48 |
Market Price Risk
A substantial portion of the output of the Hydro Group’s power generation facilities is sold under Offtake Contracts, under which a purchaser is obligated to purchase all or a specified portion of the output of the applicable facility and (in some cases) associated renewable energy credits. The breach, termination or expiry of any such Offtake Contract, unless replaced or renewed on equally favourable terms, could adversely affect the Company’s results of operations and cash flows and increase the Company’s exposure to risks of price fluctuations in the wholesale power market.
Merchant (uncontracted) generation may increase earnings volatility. In a rising price environment, merchant generation generally results in higher earnings than a fully contracted portfolio. In a falling price environment, merchant generation generally results in lower earnings than a fully contracted portfolio.
Commodity Price Risk
The Regulated Services Group is exposed to energy and natural gas price risks at its electric and natural gas systems.
The CalPeco Electric System provides electric service to the Lake Tahoe California basin and surrounding areas at rates approved by the CPUC. The CalPeco Electric System purchases the energy, capacity, and related service requirements for its customers from NV Energy via a PPA at rates reflecting NV Energy's system average costs.
The CalPeco Electric System's tariffs allow for the pass-through of energy costs to its rate payers on a dollar for dollar basis, through the Energy Cost Adjustment Clause ("ECAC") mechanism, which allows for the recovery or refund of changes in energy costs that are caused by the fluctuations in the price of fuel and purchased power. On a monthly basis, energy costs are compared to the CPUC approved base tariff energy rates and the difference is deferred to a balancing account. Annually, based on the balance of the ECAC balancing account, if the ECAC revenues were to increase or decrease by more than 5%, the CalPeco Electric System's ECAC tariff allows Calpeco to seek authority for a potential adjustment to its ECAC rates which would eliminate the risk associated with the fluctuating cost of fuel and purchased power.
The Granite State Electric System is an open access electric utility allowing for its customers to procure commodity services from competitive energy suppliers. For those customers who do not choose their own competitive energy supplier or community power aggregators, Granite State Electric System provides a Default Service offering to each class of customers through two processes. First is a competitive bidding process that is undertaken semi-annually for a defined portion of Default Service customers. The winning bidder is obligated to provide a full requirements service based on the actual needs of those Granite State Electric System's Default Service customers. Since this is a full requirements service, the winning bidder(s) take on the risk associated with fluctuating customer usage and commodity prices. The supplier is paid for the commodity by Granite State Electric System which in turn receives pass-through rate recovery through a formal filing and approval process with the NHPUC on a semi-annual basis. Granite State Electric System is only committed to the winning Default Service supplier(s) after approval by the NHPUC so that there is no risk of commodity commitment without pass-through rate recovery. Under the second process, which applies for the other portion of default service customers and in the event that the above described competitive bidding process is unsuccessful (no qualified bids received), Granite State Electric takes those portions of the Default Service load to the ISO New England market and purchases energy and other requirements on a daily basis, optimizing between the Day-Ahead and Real-Time markets in accordance with instructions and approval received from the NHPUC. The costs incurred through this market process are also pass-through costs that are reconciled and recovered as part of the same semi-annual process described above, similarly mitigating commodity risk.
The EnergyNorth Natural Gas System purchases pipeline capacity, storage and commodity from a variety of counterparties. The EnergyNorth Natural Gas System's portfolio of assets and its planning and forecasting methodology are periodically approved by the NHPUC through Least Cost Integrated Resource Plan filings which typically are filed every four years (the timing of the LCIRP process is currently in flux due to recent statutory changes). In addition, the EnergyNorth Natural Gas System files with the NHPUC for recovery of its transportation and commodity costs on an annual basis through the Cost of Gas ("COG") filing. The EnergyNorth Natural Gas System establishes rates for its customers based on the NHPUC's approval of its filed COG. These rates are designed to fully recover its anticipated transportation and commodity costs. In order to minimize commodity price fluctuations, the EnergyNorth Natural Gas System hedges a portion of its normal winter period purchases under a NHPUC approved hedging program. All costs associated with the hedging program are allowed to be a pass-through to customers as part of the COG filing and the approved rates in said filing. Should commodity prices change relative to the initial annual COG rate, the EnergyNorth Natural Gas System has the right to automatically increase its COG rates going forward up to 25% and decrease with no limit in order to minimize any under or over collection of its natural gas costs. In addition, any under and over collections may be carried forward with interest to the next year's corresponding COG period (i.e. winter to winter and summer to summer).
The Midstates Gas and Empire Gas Systems purchases pipeline capacity, storage and commodity from a variety of counterparties, and file with the individual state commissions for recovery of their respective transportation and commodity
| | | | | |
| |
| Algonquin Power & Utilities Corp. - Management Discussion & Analysis | 49 |
costs through an annual/monthly Purchase Gas Adjustment ("PGA") filing and approval process. The Midstates Gas Systems serves customers in Missouri, Illinois and Iowa and establishes rates for its customers within the PGA filing in each state and these rates are designed to fully recover its anticipated transportation, storage and commodity costs. In order to minimize commodity price fluctuations, the Midstates Gas System has implemented a commodity hedging program, consistent with regulator expectations and approvals, designed to hedge approximately 25-50% of its non-storage related commodity purchases. All gains and losses associated with the hedging program are allowed to be a pass-through to customers through the PGA filing and are embedded in the approved rates in said filing. Rates can be adjusted on a monthly or quarterly basis in order to account for any commodity price increase or decrease relative to the initial PGA rate, minimizing any under or over collection of its natural gas costs. Similar to the Midstates Gas System, the Empire Gas System serves customers in Missouri, and also implements a commodity hedging program designed to hedge 70% to 90% of its winter demand inclusive of storage volumes withdrawn during the winter period. All related costs are embedded in approved rates and allowed to be a pass through to customers in the PGA. The Empire Gas System is permitted to file an Actual Cost Adjustment ("ACA") once a year which also includes a PGA filing. In addition to the ACA filing, three more optional PGA filings are allowed during the year. The Empire Gas System's ACA year is from September 1 to August 31 for each year.
The Peach State Gas System purchases pipeline capacity, storage and commodity from a variety of counterparties, and files with the Georgia Public Service Commission ("PSC") for recovery of its transportation, storage and commodity costs through a monthly PGA filing process. The Peach State Gas System establishes rates for its customers within the PGA filings and these rates are designed to fully recover its anticipated transportation, storage and commodity costs. In order to minimize commodity price fluctuations, the annual Gas Supply Plan filed by the Company and approved by the Georgia PSC includes a commodity hedging program designed to hedge approximately 30% of its non-storage related commodity purchases during the winter months. All gains and losses associated with the hedging program are passed through to customers in the PGA filings and are embedded in the approved rates in such filings. Rates can be adjusted on a monthly basis in order to account for any differences in natural gas costs relative to the amounts assumed in the PGA filings, minimizing any under or over collection of its natural gas costs.
The Empire District Electric System's natural gas procurement program for electrical generation is designed to manage costs to mitigate volatile natural gas prices. The Empire District Electric System periodically enters into fixed price contracts with counterparties to hedge future natural gas prices in an attempt to lessen the volatility in fuel expenditures. Generally, the over/under variances associated with the hedging program are passed through to customers in the fuel adjustment clause assuming they are deemed to be prudently incurred.
BELCO purchases Heavy Fuel Oil and Light Fuel Oil (diesel) which are transported and stored in facilities in Bermuda until such time as they are delivered and consumed in its electricity generation operations. While the cost of this fuel is included in traditional rate filings through a Fuel Adjustment Rate ("FAR"), the variability in the commodity pricing has led the Regulatory Authority of Bermuda to establish a quarterly reconciliation and adjustment to the FAR. This filing evaluates current commodity pricing and usage as well as projected commodity pricing to develop the FAR for the upcoming quarter. Additionally, BELCO has periodically used hedging to lock in commodity rates in an effort to reduce pricing volatility and protect customer rates.
OPERATIONAL RISK MANAGEMENT
Dispositions
For financial, strategic and other reasons, the Corporation may from time to time dispose of, or desire to dispose of, businesses or assets (in whole or in part) that it owns. Any disposition by the Corporation may result in recognition of a loss upon such a sale and may result in a decrease to its revenues, cash flows and net income and a change to its business mix. A disposition may also result in less proceeds than expected or liabilities to the Corporation, including as a result of any post-closing indemnities or purchase price adjustments. In addition, the Corporation may not be able to dispose of businesses or assets that the Corporation desires or expects to sell at all or at a price acceptable to the Corporation. Failure to execute on any planned disposition may require the Corporation to seek alternative sources of funds, including one or more potential issuances of equity, or incur additional indebtedness, which may, among other things, cause rating agencies to re-evaluate or downgrade the Corporation's existing credit ratings. Each of the foregoing items may have an adverse effect on the Corporation's business, results of operations, cost of capital or financial condition.
Mechanical and Operational Risks
AQN's profitability could be impacted by, among other things, equipment failure, the failure of a major customer to fulfill its contractual obligations, reductions in average energy prices, a strike or lock-out at a facility, natural disasters, diseases and other force majeure events, trade and tariff disputes, interruptions in supply chains and expenses related to claims or clean-up to adhere to environmental and safety standards.
The Company's water and wastewater distribution systems operate under pressurized conditions within pressure ranges approved by regulators. Should a water distribution network become compromised or damaged, the resulting release of
| | | | | |
| |
| Algonquin Power & Utilities Corp. - Management Discussion & Analysis | 50 |
pressure could result in serious injury or death to individuals or damage to other property. In addition, contamination of water or equipment in a drinking water distribution system could result in severe injury, illness or death to those who consume the impacted water.
The Company's electric distribution systems are subject to storm events, usually winter storm events, whereby power lines can be brought down, with the attendant risk to individuals and property. Wildfires have occurred, and may in the future occur, within the Company's electric distribution service territories, including, without limitation, in California and other parts of the United States in which the Corporation operates, such as the Mountain View fire that occurred on November 17, 2020 within the CalPeco Electric System's service territory in California. Trees falling on and lightning strikes to, distribution lines or equipment, can ignite wildfires which may pose a risk to life and property. If the Company is accused or found to be responsible for such a fire (regardless of whether it is at fault or negligent), the Company could suffer costs, losses and damages, including inverse condemnation, all or some of which may not be recoverable through insurance, legal, regulatory recovery and other processes.
The Company's natural gas distribution systems are subject to risks which may lead to fire and/or explosion which may impact life and property. Risks include third-party damage, compromised system integrity, type/age of pipelines, and severe weather events.
The Company's hydro assets utilize dams to pond water for generation and if the dams fail/breach potentially catastrophic amounts of water would flood downriver from the facility. The dams can be subjected to drought conditions and lose the ability to generate during peak load conditions, causing the facilities to fall short of either hedged or PPA committed production levels. The risks of the hydro facilities are mitigated by regular dam inspections and a maintenance program of the facility to lessen the risk of dam failure.
The Company's assets could catch on fire and, depending on the season, could ignite significant amounts of forest or crop downwind from its facilities.
In general, these risks are, in part, mitigated through the diversification of AQN's operations, both operationally and geographically. In addition, AQN seeks to mitigate these risks through the use of regular maintenance programs, including pipeline safety programs and compliance programs, the provision of adequate insurance, an active Enterprise Risk Management program and the establishment of reserves for expenses.
Regulatory Risk
Profitability of AQN businesses is, in part, dependent on regulatory climates in the jurisdictions in which those businesses operate.
In the case of some of the Hydro Group’s hydroelectric facilities, water rights are owned by governments that reserve the right to control water levels, which may affect revenue. The failure to obtain all necessary licenses or permits for such facilities, including renewals thereof or modifications thereto, may result in an inability to operate the facility and could adversely affect cash generated from operating activities.
The Regulated Services Group’s facilities are subject to rate setting by its regulatory agencies. The Company operates utilities in 13 U.S. states, one Canadian province, Bermuda and Chile and therefore is subject to regulation from 17 different regulatory agencies, including FERC. The time between the incurrence of costs and the granting of the rates to recover those costs by regulatory agencies is known as regulatory lag. Regulatory lag, inflationary effects and timing delays may impact the ability to recover expenses and/or capital costs, and profitability could be impacted. In order to mitigate this exposure, the Company seeks to obtain approval for regulatory constructs in the states in which it operates to allow for timely recovery of operating expenses and capital costs. A fundamental risk faced by a regulated utility is the disallowance by the utility’s regulator of operating expenses or capital costs for which recovery is sought through regulatory proceedings. The Company has invested significant capital in its utilities for which it is or will be seeking cost recovery. There is a risk that the utilities’ regulators may not approve, or may otherwise delay recovery, of some or all of the Company’s invested capital. In addition, as the Company recently updated its technology infrastructure systems, there is additional risk that financial data required for rate filings could be difficult to produce or the data is deemed unreliable for ratemaking purposes. Further, customer billing concerns could negatively impact the risk of disallowance and/or regulatory lag. In addition, capital investments that have become stranded may pose additional risk for cost recovery and could be subject to legislation or rulings that would impact the extent to which such costs could be recovered. Similarly, recovery of extraordinary fuel expenses may pose additional risk for cost recovery and could be subject to legislation or regulatory action that would impact the extent to which such costs could be recovered. Further, there is a risk that utility regulators may scrutinize the Company's allocation of shared costs, including in the period following closing of the Renewables Sale. To the extent proposed costs are not included in a utility's rates, the utility will be required to find other efficiencies, growth opportunities or cost savings to achieve its allowed return.
| | | | | |
| |
| Algonquin Power & Utilities Corp. - Management Discussion & Analysis | 51 |
Furthermore, the economies of Canada and the United States each experienced a significant rise in the inflation rate in the post-pandemic era compared to recent historical inflation rates. While the inflation rate has subsided due, in part, to actions taken by the Bank of Canada and the U.S. Federal Reserve Bank, there remains uncertainty in the near-term outlook as to whether inflation will remain elevated. Increases in inflation raise the Company’s costs for labour, materials and services, and a failure to recover these increased costs could result in under-recovery. Cost recovery efforts could also face resistance from customers and other stakeholders especially in a rising cost environment, whether due to inflation or high fuel prices or otherwise, and/or in periods of economic decline or hardship. Significant increases in costs also could increase financing needs and otherwise adversely affect the Company’s business, financial position and results of operations.
In addition, there is a risk that the utility’s regulator will not approve the revenue requirements or rate adjustments requested in outstanding or future rate applications or will, on its own initiative, seek to reduce the existing revenue requirements or approved rates. Rate applications are subject to the utility regulator’s review process, usually involving participation from intervenors and other stakeholders that are involved in the case, and a public hearing process. There can be no assurance that resulting decisions or rate orders issued by the utility regulators will permit the Company to recover all costs actually incurred, costs of debt and income taxes, or to earn a particular return on equity.
The Company regularly works with its governing authorities to manage the affairs of the business, employing local, state level, and corporate resources.
Condemnation Expropriation Proceedings
The Company's distribution systems could be subject to condemnation or other methods of taking by government entities under certain conditions (including, without limitation, Liberty Utilities (Apple Valley Ranchos Water) Corp., which has been the subject of a condemnation lawsuit filed by the Town of Apple Valley and Liberty New York Water, which has received condemnation inquiries). There can be no assurance that the Corporation will receive fair market value for such assets or that the Corporation would not incur a loss.
Inflation Risk
AQN's profitability could be impacted by inflation increases above long-term averages. The Company's facilities are subject to rate setting by its regulatory agencies. The time between the incurrence of costs and the granting of the rates to recover those costs by regulatory agencies is known as regulatory lag. As a result of regulatory lag, inflationary effects and timing delays may impact the ability to recover expenses and/or capital costs, and profitability could be impacted. In the event of significant inflation, the impact of regulatory lag on the Company would be increased. In order to mitigate this exposure, the Company seeks to obtain approval for regulatory constructs in the states in which it operates to allow for timely recovery of operating expenses and capital costs.
Development and construction projects could experience a decrease in expected returns as a result of increased costs.
Tariff Risk
Changes in tariffs may adversely affect the capital expenditures required to maintain, develop or construct the Company’s projects or infrastructure. In the U.S., tariffs have been imposed in recent years to imports of aluminum and steel, among other goods and raw materials. More recently, political developments in the U.S. have introduced significant uncertainty with respect to the threat and imposition of tariffs by the U.S. on its key trading partners, including Canada, as well as the potential for retaliatory tariffs imposed on U.S. goods as a result. The eventuality, timing and rates of implementation of such tariffs are difficult to predict at this time. Any such tariffs could adversely affect the Company’s business, results of operations, financial condition and cash flows. In addition, import restrictions, border delays and seizures of products by governmental authorities may also increase the cost of projects and result in construction and placed-in-service delays. These occurrences may have adverse impacts to the Company, as the buyer and/or importer of goods, which could adversely affect the Company’s expected returns, results of operations and cash flows.
International Investment Risk
The Company operates in markets, or may pursue growth opportunities in new markets, that are subject to regulation by various foreign governments and regulatory authorities and to the application of foreign laws. Such foreign laws or regulations may not provide the same type of legal certainty and rights, in connection with the Company's contractual relationships in such countries, as are afforded to the Company in Canada and the U.S., which may adversely affect the Company's ability to receive revenues or enforce its rights in connection with any operations or projects in such jurisdictions. In addition, the laws and regulations of some countries may limit the Company's ability to hold a majority interest in certain projects, thus limiting the Company's ability to control the operations of such projects. Any existing or new operations or interests of the Company may also be subject to significant political, economic and financial risks, which
| | | | | |
| |
| Algonquin Power & Utilities Corp. - Management Discussion & Analysis | 52 |
vary by country, and may include: (i) changes in government laws, policies or personnel or a country's constitution; (ii) changes in general economic conditions; (iii) restrictions on currency transfer or convertibility; (iv) changes in labour relations; (v) political instability and civil unrest; (vi) regulatory or other changes adversely affecting the local market; (vii) breach or repudiation of important contractual undertakings and expropriation and confiscation of assets and facilities without compensation or compensation that is less than fair market value; (viii) less developed or efficient financial markets than in North America; (ix) the absence of uniform accounting, auditing and financial reporting standards, practices and disclosure requirements; (x) less government supervision and regulation; (xi) a less developed legal or regulatory environment, including uncertainty in outcomes and actions that may be inconsistent with the rule of law; (xii) heightened exposure to bribery and corruption risk; (xiii) political hostility to investments by foreign investors, including laws affecting foreign ownership; (xiv) less publicly available information in respect of companies; (xv) adversely higher or lower rates of inflation; (xvi) higher transaction costs; and (xvii) fewer investor protections.
The Company may suffer a significant loss resulting from fraud, bribery, corruption or other illegal acts, or from inadequate or failed internal processes or systems. The Company operates in multiple jurisdictions and it is possible that its operations and development activities may expand into new jurisdictions. Doing business in multiple jurisdictions requires the Company to comply with the laws and regulations of such jurisdictions. These laws and regulations may apply to the Company, its subsidiaries, individual directors, officers, employees and third-party agents. The Company is also subject to anti-bribery and anti-corruption laws, including the Canadian Corruption of Foreign Public Officials Act and the U.S. Foreign Corrupt Practices Act. As the Company makes acquisitions and pursues development activities internationally, it is exposed to increased corruption-related risks, including potential violations of applicable anti-corruption laws. Recently, consumer protection has taken on increased political importance in Chile. The Chilean National Consumer Service (“SERNAC”), being Chile’s consumer protection agency, and other consumers associations have initiated claims against certain water utilities operating in Chile for interruptions to water services. While to date Suralis has not been the subject of any such claims, there is a risk that SERNAC, a consumers association, or a consumer class action group may initiate a claim against Suralis in respect of such interruptions pursuant to Chile’s consumer protection legislation.
The final outcome with respect to such proceedings cannot be predicted with certainty, and unfavourable outcomes or developments relating to these proceedings or future proceedings, such as judgments for monetary damages, injunctions, denial or revocation of permits or regulatory authorizations, or settlement of claims could have an adverse effect on the Corporation’s financial condition, results of operations and cash flows. Such outcomes may not be covered by insurance. Even if the Corporation prevails in any such proceedings, the proceedings could result in a reputational risk, be costly, time-consuming and divert the attention of management and other personnel, which could adversely affect the Corporation.
The Company relies on its infrastructure, controls, systems and personnel to manage the risk of illegal and corrupt acts or failed systems. The Company also relies on its employees and certain third parties to comply with its policies and processes as well as applicable laws. The failure to adequately identify or manage these risks, and the acquisition of businesses with weak internal controls to manage the risk of illegal or corrupt acts, could result in direct or indirect financial loss, regulatory censure and/or harm to the Company's reputation.
Joint Venture Investment Risk
The Company has, and may in the future continue to have, an equity interest of less than 100% and/or partners in certain projects and facilities. As a result, the Company may not operate or control all or any decision-making in respect of such projects and facilities and its interest may be subject to the decision-making of third parties, and the Company may be reliant on a third-party's personnel, good faith, contractual compliance, expertise, historical performance, technical resources and information systems, proprietary information and judgment in providing the services. This may limit the Company's flexibility and financial returns with respect to these projects and facilities, and create risks to the Company, including that the joint venture partner may:
•have economic or business interests or goals that are inconsistent with the Company's economic or business interests or goals;
•take actions contrary to the Company's policies or objectives with respect to the Company's investments;
•contravene applicable anti-bribery laws that carry substantial penalties for non-compliance and could cause reputational damage and a material adverse effect on the business, financial position and results of operations of the joint venture and the Company;
•have to give its consent with respect to certain transactions and decisions, including among others, decisions relating to funding and transactions with affiliates;
•become bankrupt, limiting its ability to meet calls for capital contributions and potentially making it more difficult to refinance or sell assets;
| | | | | |
| |
| Algonquin Power & Utilities Corp. - Management Discussion & Analysis | 53 |
•become engaged in a dispute with the Company that might affect the Company's ability to develop, construct or operate a project;
•have competing interests in the Company's markets that could create conflict of interest issues; or
•have different accounting policies than the Company.
Please refer to Note 8 in the annual consolidated financial statements for a description of the Company's Long-Term Investments and Notes Receivable.
Asset Retirement Obligations
AQN and its subsidiaries complete periodic reviews of potential asset retirement obligations that may require recognition. As part of this process, AQN and its subsidiaries consider the contractual requirements outlined in their operating permits, leases, and other agreements, the probability of the agreements being extended, the ability to quantify such expense, the timing of incurring the potential expenses, as well as other factors which may be considered in evaluating if such obligations exist and in estimating the fair value of such obligations.
In conjunction with acquisitions and developed projects, the Company assumed certain asset retirement obligations. The asset retirement obligations mainly relate to legal requirements for: (i) removal or decommissioning of power generating facilities; (ii) cut (disconnect from the distribution system), purge (clean of natural gas and PCB contaminants), and cap natural gas mains within the natural gas distribution and transmission system when mains are retired in place, or dispose of sections of natural gas mains when removed from the pipeline system; (iii) clean and remove storage tanks containing waste oil and other waste contaminants; and (iv) remove asbestos upon major renovation or demolition of structures and facilities.
Cycles and Seasonality
The Company's demand for water is affected by weather conditions and temperature. Demand for water during warmer months is generally greater than cooler months due to requirements for irrigation, swimming pools, cooling systems and other outside water use. If there is above normal rainfall or rainfall is more frequent than normal, or if government restrictions are imposed on water usage during drought conditions, the demand for water may decrease, adversely affecting revenues.
The Company's demand for energy from its electric distribution systems is primarily affected by weather conditions and conservation initiatives. The Company provides information and programs to its customers to encourage the conservation of energy. In turn, demand may be reduced which could have short-term adverse impacts on revenues.
The Company's primary demand for natural gas from its natural gas distribution systems is driven by the seasonal heating requirements of its residential, commercial, and industrial customers. The colder the weather, the greater the demand for natural gas to heat homes and businesses. As such, the natural gas distribution systems demand profile typically peaks in the winter months of January and February and declines in the summer months of July and August. Year to year variability also occurs depending on how cold the weather is in any particular year.
There is a risk that climate change impacts the seasonality and demand for water, electricity and natural gas.
The Company attempts to mitigate the above noted risks by seeking regulatory mechanisms during rate review proceedings. While not all regulatory jurisdictions have approved mechanisms to mitigate demand fluctuations, to date, the Company has successfully obtained regulatory approval to implement such decoupling mechanisms in 7 of 13 states. An example of such a mechanism is seen at the Peach State Gas System in Georgia, where a weather normalization adjustment is applied to customer bills during the months of October through May that adjusts commodity rates to stabilize the revenues of the utility for changes in billing units attributable to weather patterns.
Development and Construction Risk
The Company engages in the development and construction of water and wastewater facilities, transmission and distribution assets and other complementary projects. In addition, each of the Company’s operating business units may occasionally undertake construction activities as part of normal course maintenance activities. There can be no assurance that the Company will be able to identify growth opportunities that improve the Company’s financial results or increase the amount of cash available for distribution. There is always a risk that material delays, technical issues with interconnection, required upgrades to interconnection facilities, required curtailments of generation and/or cost overruns or lost revenue could be incurred in any of the Company's future projects affecting the Company's overall performance. There are risks that actual costs may exceed budget estimates, delays may occur in obtaining permits and materials, suppliers and contractors may not perform as required under their contracts, warranties under contracts may be unfilled or insufficient, there may be inadequate availability, productivity or increased cost of qualified craft or local labour, start-up activities may take longer than planned, curtailment of a facility's output may be required, the scope, actual or expected returns, and timing of projects may change, and other events beyond the Company's control may occur, in each case that may materially affect the viability, schedule, budget, cost and performance of projects. Regulatory approvals can be challenged by a number of
| | | | | |
| |
| Algonquin Power & Utilities Corp. - Management Discussion & Analysis | 54 |
mechanisms which vary across federal, state and provincial jurisdictions. Such permitting challenges could identify issues that may result in permits being modified or revoked.
Litigation Risks and Other Contingencies
AQN and certain of its subsidiaries are involved in various litigation, claims and other legal and regulatory proceedings that arise from time to time in the ordinary course of business. Any accruals for contingencies related to these items are recorded in the financial statements at the time it is concluded that a material financial loss is likely and the related liability is estimable. Anticipated recoveries under existing insurance policies are recorded when reasonably assured of recovery.
Mountain View Fire
On November 17, 2020, a wildfire now known as the Mountain View Fire occurred in the territory of Liberty Utilities (CalPeco Electric) LLC ("Liberty CalPeco"). The cause of the fire remains in dispute, and CAL FIRE has not yet released its final report. There were 22 lawsuits filed that name certain subsidiaries of the Company as defendants in connection with the Mountain View Fire, as well as a non-litigation claim brought by the U.S. Department of Agriculture seeking reimbursement for alleged fire suppression costs and a notice from the U.S. Bureau of Land Management seeking damages for the alleged burning of public lands without authorization. Fifteen lawsuits were brought by groups of individual plaintiffs and a Native American group alleging causes of action including negligence, inverse condemnation, nuisance, trespass, and violations of Cal. Pub. Util. Code 2106 and Cal. Health and Safety Code 13007 (one of these 15 lawsuits also alleges the wrongful death of an individual and various subrogation claims on behalf of insurance companies). In six other lawsuits, insurance companies alleged inverse condemnation and negligence and seek recovery of amounts paid and to be paid to their insureds. In one other lawsuit, County of Mono, Antelope Valley Fire Protection District, and Bridgeport Indian Colony allege similar causes of action and seek damages for fire suppression costs, law enforcement costs, property and infrastructure damage, and other costs. Liberty CalPeco has resolved 20 of the lawsuits, and Liberty CalPeco is in the process of obtaining dismissals with prejudice of said lawsuits. Trial on the remaining two lawsuits is currently scheduled for April 15, 2025. The likelihood of success in these lawsuits is uncertain. Liberty CalPeco intends to vigorously defend them. The Company accrued estimated losses of $172.3 million for claims related to the Mountain View Fire, against which Liberty CalPeco has recorded recoveries through insurance of $116.0 million and Wildfire Expense Memorandum Account of $56.3 million. The resulting net charge to earnings was $nil. The estimate of losses is subject to change as additional information becomes available. The actual amount of losses may be higher or lower than these estimates. While the Company may incur a material loss in excess of the amount accrued, the Company cannot estimate the upper end of the range of reasonably possible losses that may be incurred. The Company has wildfire liability insurance that was applied up to applicable policy limits.
Apple Valley Condemnation Proceedings
On January 7, 2016, the Town of Apple Valley filed a lawsuit in California state court seeking to condemn the utility assets of Liberty Utilities (Apple Valley Ranchos Water) Corp. ("Liberty Apple Valley"). On May 7, 2021, the trial court issued a Tentative Statement of Decision denying the Town of Apple Valley's attempt to take the Apple Valley water system by eminent domain. The ruling confirmed that Liberty Apple Valley's continued ownership and operation of the water system is in the best interest of the community. On October 14, 2021, the trial court issued the Final Statement of Decision. The trial court signed and entered an Order of Dismissal and Judgment on November 12, 2021. On January 7, 2022, the Town filed a notice of appeal of the judgment entered by the trial court. On August 2, 2022, the trial court issued a ruling awarding Liberty Apple Valley approximately $13.2 million in attorney's fees and litigation costs. The Town filed a notice of appeal of the fee award on August 22, 2022. On January 14, 2025, the California Court of Appeal issued a decision reversing the trial court’s finding that the Town of Apple Valley does not have a right to take the assets of Liberty Apple Valley and reversing the award of attorney’s fees to Liberty Apple Valley. The Court of Appeal decision remands the condemnation proceedings to the trial court to determine whether to (i) allow the Town to take the water system, (ii) remand the matter to the Town for further administrative proceedings or (iii) hold a new trial and apply the appropriate burden of proof and standard of review. On February 21, 2025, Liberty Apple Valley filed a petition for review of the Court of Appeal decision with the California Supreme Court.
Information Security Risk
The Company relies upon its own and third-party information and operational technology networks, systems and devices to process, transmit and store electronic information and to manage and support a variety of business processes and activities and safely operate its assets. The Company also uses its own and third-party information technology systems to record, process and summarize financial information and results of operations for internal reporting purposes and to comply with financial reporting, legal and tax requirements. The Company's and certain of its third-party vendors' technology networks, systems and devices collect and store sensitive data, including system operating information and proprietary business information belonging to the Company and third parties, as well as personal information belonging to the Company's customers, employees and other stakeholders. As the Company operates critical infrastructure, it may be at an increased risk of cyber-attacks or other security threats by third parties.
The Company's, its third-party vendors' or other counterparties' technology systems and technology networks, devices and infrastructure may be vulnerable to damage, disruptions or shutdowns due to attacks by hackers or breaches due to
| | | | | |
| |
| Algonquin Power & Utilities Corp. - Management Discussion & Analysis | 55 |
employee error or malfeasance, disruptions during software or hardware upgrades, telecommunication failures, theft, politically-driven attacks (including as a result of geopolitical tension, and any associated sanctions imposed or actions taken by the United States, Canada or other countries or retaliatory measures by nation states or other actors), acts of war or terrorism, natural disasters or other similar events. In addition, certain sensitive information and data may be stored by the Company on physical devices, in physical files and records on its premises or transmitted to the Company verbally, subjecting such information and data to a risk of loss, theft, release and misuse. Methods used to attack critical assets could include social engineering and general purpose or industry specific malware or ransomware delivered via network transfer, removable media, viruses, attachments, or links in e-mails. The methods used by attackers are continuously evolving and can be difficult to predict and detect. The occurrence of any of these events could negatively impact the Company's operations, power generation facilities and utility distribution and transmission systems; could cause services disruptions or system failures; could adversely affect safety; could expose the Company, its customers or its employees to a risk of loss or misuse of information; could affect the ability to earn or collect revenue or correctly record, process and report financial information; and could result in increased costs, legal claims or proceedings, liability or regulatory penalties against the Company, damage the Company's reputation or otherwise harm the Company's business.
The long-term impact of terrorist attacks and cyber-attacks and the magnitude of the threat of future terrorist attacks and cyber-attacks on the utility and power generation industries in general, and on the Company in particular, cannot be known. Increased security measures to be taken by the Company as a precaution against possible terrorist attacks and cyber-attacks may result in increased costs to the Company. The Company must also comply with data privacy laws in each of the jurisdictions in which it operates. Certain data privacy laws and other cybersecurity regulations have expanded in recent years, leading to increased compliance obligations, and fines for breaches of such laws and regulations have increased. The Company may incur additional costs and require significant internal and external resources to maintain compliance, or may face significant financial penalties, in the event of a breach.
In general, the severity, volume and sophistication of targeted cyber-attacks are increasing by various actors, including state-sponsored attackers. The Company cannot accurately assess the probability that a security breach may occur or accurately quantify the potential impact of such an event. The Company provides no assurance that it will be able to identify, protect against and remedy all cybersecurity, physical security or system vulnerabilities or that unauthorized access or errors will be identified and remedied. Should a breach occur, the Company may suffer costs, losses and damages, all or some of which may not be recoverable through insurance, legal, regulatory, or other processes, and could materially adversely affect the Company's business and results of operations including its reputation with customers, regulators, governments and financial markets. Resulting costs could include, among others, response, recovery (including ransom costs) and remediation costs, increased protection or insurance costs, and costs arising from damages and losses incurred by third parties.
Uncertainty surrounding continued hostilities or sustained military campaigns may affect operations of the Company in unpredictable ways, including disruptions of supplies and markets for products of the Company, and the possibility that the Company's operations or facilities could be direct targets of, or indirect casualties of, an act of terror or cyber-security attack. The effects of hostilities, military campaigns or terrorist or cyber-security attacks could include disruption to the Company's generation, transmission and distribution systems or to the electrical grid in general, and could result in a decline in the general economy and have a material adverse effect on the Company.
Technology Infrastructure Implementation Risk
The Company relies upon various information and operational technology infrastructure systems to carry out its business processes and operations. This subjects the Company to inherent costs and risks associated with maintaining, upgrading, replacing and changing information and operational technology systems. This includes impairment of its technology systems, potential disruption of operations, business process and internal control systems, substantial capital expenditures, demands on management time and other risks of delays, and difficulties in upgrading, transitioning and integrating technology systems.
AQN and certain of its subsidiaries have completed the implementation of an integrated customer solution platform, which includes customer billing, enterprise resource planning systems and asset management systems. Transitioning operations to these new technology systems, or deficiencies in the design or implementation of these systems, could materially adversely affect the Company's operations, including its ability to monitor its business, pay its suppliers, bill its customers, and record and report financial information accurately and on a timely basis; lead to higher than expected costs; lead to increased regulatory scrutiny or adverse regulatory consequences; or result in the failure to achieve the expected benefits. As a result, the Company's operations, financial condition, cash flows and results of operations could be adversely affected.
| | | | | |
| |
| Algonquin Power & Utilities Corp. - Management Discussion & Analysis | 56 |
Energy Consumption and Advancement in Technologies Risk
The Company's generation, distribution and transmission assets are affected by energy and water demand, sales and operating costs, among other things, in the jurisdictions in which they operate. Demand, sales and operating costs may change as a result of, among other things, fluctuations in general economic conditions, energy and commodity prices, inflation, interest rates, employment levels, personal disposable income, customer preferences, advancements in new technologies, population or demographic changes and housing starts. Significantly reduced energy or water demand in the Company's service territories could reduce capital spending forecasts, and specifically capital spending related to new customer growth. A reduction in capital spending could, in turn, affect the Company's rate base and earnings growth. A downturn in economic conditions may have an adverse effect on the Company's results of operations, financial condition and cash flows despite regulatory measures, where applicable, available to compensate for some or all of the reduced demand and increased costs, which recovery, if any, may lag costs incurred by the Company. In addition, an extended decline in economic conditions could make it more difficult for customers to pay for the utility services they consume, thereby affecting the aging and collection of the utilities' trade receivables.
Initiatives designed to reduce greenhouse gas emissions and control or limit the effects of climate change have resulted in incentives and programs to increase energy efficiency and reduce water and energy consumption, including efforts to reduce the availability and reliance on natural gas. There may also be efforts to move to deregulation in certain of the markets in which the Company operates, which could adversely affect the Company's business, financial condition and results of operations.
Significant technological advancements are taking place in the generation and utility industry, including advancements related to self-generation and distributed energy technologies such as fuel cells, micro turbines, battery storage, wind turbines, solar panels and technologies related to lower energy, natural gas and water use. Adoption of these and other technologies may increase as a result of government subsidies or policies, improving economics and changing customer preferences.
Increased adoption of these practices, requirements and technologies could reduce demand for utility-scale electricity generation and electric, water, and natural gas distribution, and as a result, the Company's business, financial condition and results of operations could be adversely affected.
The Company may also invest in and use newly developed, less proven, technologies or generation methods in its development and construction projects or in maintaining or enhancing its existing operations and assets. There is no guarantee that such new technologies will perform as anticipated. The failure of a new technology or generation method to perform as anticipated may adversely affect the profitability of a particular development project or existing operations and assets.
The Company seeks to actively engage with regulators, governments and customers, as appropriate, in an effort to ensure these changes in consumption do not negatively impact the services provided.
Uninsured Risk
The Company maintains insurance coverage for certain exposures, but this coverage is limited and the Company is generally not fully insured against all potential significant losses. Insurance coverage for the Company is subject to policy conditions and exclusions, coverage limits, and various deductibles, and not all types of liabilities and losses may be covered by insurance. Further, certain assets and facilities of the Company are not fully insured, as the cost of the coverage may not be economically viable or may not otherwise be available. Insurance may not continue to be offered on an economically feasible basis, or at all, and may not cover all events that could give rise to a loss or claim involving the Company's assets or operations. There can also be no assurance that insurers will fulfill their obligations. The Company's ability to obtain and maintain insurance and the terms of any available insurance coverage could be materially adversely affected by international, national, state or local events and company-specific events, as well as the financial condition of insurers.
If the Company were to incur a significant uninsured loss or a loss significantly exceeding the limits of its insurance policies, the results could have a material adverse effect on the Company's business, results of operations, financial condition and cash flows. In the event of a large uninsured loss, including those caused by severe weather conditions, wildfires, natural disasters and certain other events beyond the control of the Regulated Services Group, the Company may make an application to an applicable regulatory authority for the recovery of these costs through customer rates to offset any loss. However, the Company cannot provide assurance that the regulatory authorities would approve any such application in whole or in part. This potential recovery mechanism is not available to the Hydro Group
| | | | | |
| |
| Algonquin Power & Utilities Corp. - Management Discussion & Analysis | 57 |
QUARTERLY FINANCIAL INFORMATION
The following is a summary of unaudited quarterly financial information for the eight quarters ended December 31, 2024:
| | | | | | | | | | | | | | | | | | | | | | | |
| (all dollar amounts in $ millions except per share information) | 1st Quarter 2024 | | 2nd Quarter 2024 | | 3rd Quarter 2024 | | 4th Quarter 2024 |
| Revenue | $ | 646.1 | | | $ | 515.4 | | | $ | 573.2 | | | $ | 584.8 | |
| | | | | | | |
| Net earnings (loss) attributable to shareholders | (89.1) | | | 200.8 | | | (1,305.7) | | | (186.4) | |
Net earnings (loss) attributable to shareholders from continuing operations | (56.9) | | | 180.2 | | | 49.5 | | | (107.5) | |
Net earnings (loss) attributable to shareholders from discontinued operations | (32.2) | | | 20.6 | | | (1,355.2) | | | (78.9) | |
| Net earnings (loss) per share | (0.13) | | | 0.28 | | | (1.71) | | | (0.25) | |
| Net earnings (loss) per share from continuing operations | (0.09) | | | 0.25 | | | 0.06 | | | (0.14) | |
Net earnings (loss) per share from discontinued operations | (0.04) | | | 0.03 | | | (1.77) | | | (0.10) | |
| Diluted net earnings (loss) per share | (0.13) | | | 0.28 | | | (1.71) | | | (0.25) | |
Adjusted Net Earnings1 | 79.8 | | | 42.2 | | | 64.9 | | | 45.2 | |
Adjusted Net Earnings per common share1 | 0.11 | | | 0.06 | | | 0.08 | | | 0.06 | |
Adjusted EBITDA1 | 285.4 | | | 240.9 | | | 264.4 | | | 248.6 | |
Total assets3 | 18,307.8 | | | 18,866.4 | | | 17,788.6 | | | 16,961.8 | |
Long-term debt2,3 | 9,089.9 | | | 8,292.9 | | | 8,725.0 | | | 8,047.5 | |
Dividends declared per common share | $ | 0.11 | | | $ | 0.11 | | | $ | 0.07 | | | $ | 0.07 | |
| | | | | | | |
| 1st Quarter 2023 | | 2nd Quarter 2023 | | 3rd Quarter 2023 | | 4th Quarter 2023 |
| Revenue | $ | 697.1 | | | $ | 556.4 | | | $ | 564.8 | | | $ | 585.7 | |
| | | | | | | |
| Net earnings (loss) attributable to shareholders | 270.1 | | | (253.2) | | | (174.5) | | | 186.3 | |
| | | | | | | |
Net earnings (loss) attributable to shareholders from continuing operations | 237.1 | | | (246.4) | | | (174.9) | | | 169.8 | |
Net earnings (loss) attributable to shareholders from discontinued operations | 33.0 | | | (6.8) | | | 0.4 | | | 16.5 | |
| Net earnings (loss) per share | 0.39 | | | (0.37) | | | (0.26) | | | 0.27 | |
| Net earnings (loss) per share from continuing operations | 0.34 | | | (0.36) | | | (0.26) | | | 0.24 | |
Net earnings (loss) per share from discontinued operations | 0.05 | | | (0.01) | | | — | | | 0.02 | |
| Diluted net earnings (loss) per share | 0.39 | | | (0.37) | | | (0.26) | | | 0.27 | |
Adjusted Net Earnings1 | 87.5 | | | 42.1 | | | 68.6 | | | 81.3 | |
Adjusted Net Earnings per common share1 | 0.12 | | | 0.06 | | | 0.10 | | | 0.12 | |
Adjusted EBITDA1 | 269.9 | | | 226.2 | | | 254.9 | | | 262.1 | |
Total assets3 | 17,927.1 | | | 17,968.7 | | | 17,982.8 | | | 18,374.0 | |
Long-term debt2,3 | 7,849.2 | | | 8,083.4 | | | 8,367.3 | | | 8,516.0 | |
Dividends declared per common share | $ | 0.11 | | | $ | 0.11 | | | $ | 0.11 | | | $ | 0.11 | |
| | | | | |
| 1 | See Caution Concerning Non-GAAP Measures. |
| 2 | Includes current portion of long-term debt and long-term debt. |
| 3 | Includes discontinued operations |
Quarterly revenues have fluctuated between $515.4 million and $697.1 million over the prior two year period. A number of factors impact quarterly results, including acquisitions, dispositions, seasonal fluctuations and customer rates. In addition, a factor impacting revenues year over year is the fluctuation in the strength of the Canadian dollar relative to the U.S. dollar which can result in significant changes in reported revenue from Canadian operations.
Quarterly net earnings attributable to shareholders have fluctuated between a loss of $1,305.7 million and earnings of $270.1 million over the prior two year period. Earnings have been impacted by non-cash factors such as impairment upon
| | | | | |
| |
| Algonquin Power & Utilities Corp. - Management Discussion & Analysis | 58 |
classification of the renewable energy group (excluding hydro) as held for sale, deferred tax recovery and expense, impairment of intangibles, property, plant and equipment and mark-to-market gains and losses on financial instruments.
DISCLOSURE CONTROLS AND PROCEDURES
AQN's management carried out an evaluation as of December 31, 2024, under the supervision of and with the participation of AQN's Chief Executive Officer ("CEO") and Chief Financial Officer ("CFO"), of the effectiveness of the design and operations of AQN's disclosure controls and procedures (as defined in Rule 13a-15(e) and Rule 15d-15(e) under the Securities Exchange Act of 1934, as amended (the "Exchange Act")). Based on that evaluation, the CEO and the CFO have concluded that as of December 31, 2024, AQN's disclosure controls and procedures are effective to provide reasonable assurance that information required to be disclosed by AQN in reports that it files or submits under the Exchange Act is recorded, processed, summarized, and reported within the time periods specified in rules and forms of the U.S. Securities and Exchange Commission, and is accumulated and communicated to management, including the CEO and CFO, as appropriate, to allow timely decisions regarding required disclosure.
Management Report on Internal Controls over Financial Reporting
Management, including the CEO and the CFO, is responsible for establishing and maintaining internal control over financial reporting to provide reasonable, but not absolute, assurance regarding the reliability of financial reporting and the preparation of financial statements for external purposes in accordance with U.S. GAAP.
Management assessed the effectiveness of the Company's internal control over financial reporting as of December 31, 2024, based on the framework established in Internal Control - Integrated Framework (2013) issued by the Committee of Sponsoring Organizations of the Treadway Commission. This assessment included review of the documentation of controls, evaluation of the design effectiveness of controls, testing of the operating effectiveness of controls, and a conclusion on this evaluation. Based on this assessment, management concluded that the Company's internal control over financial reporting was effective as of December 31, 2024 to provide reasonable assurance regarding the reliability of financial reporting and the preparation of consolidated financial statements for external reporting purposes in accordance with U.S. GAAP. Management reviewed the results of its assessment with the Audit & Finance Committee of the Board.
Changes in Internal Controls over Financial Reporting
For the twelve months ended December 31, 2024, there has been no change in the Company's internal controls over financial reporting that has materially affected, or is reasonably likely to materially affect, the Company's internal controls over financial reporting.
Inherent Limitations on Effectiveness of Controls
Due to its inherent limitations, disclosure controls and procedures or internal control over financial reporting may not prevent or detect all misstatements based on error or fraud. Further, the effectiveness of internal control is subject to the risk that controls may become inadequate because of changes in conditions, or that the degree of compliance with policies or procedures may change.
CRITICAL ACCOUNTING ESTIMATES AND POLICIES
AQN prepared its annual consolidated financial statements in accordance with U.S. GAAP. The preparation of the annual consolidated financial statements requires management to make estimates and assumptions that affect the reported amounts of assets and liabilities, related amounts of revenues and expenses, and disclosure of contingent assets and liabilities. Significant areas requiring the use of management judgment relate to the scope of consolidated entities, the recoverability of assets, the measurement of deferred taxes and the recoverability of deferred tax assets, rate-regulation, unbilled revenue, pension and post-employment benefits, fair value of derivatives and fair value of assets and liabilities acquired in a business combination. Actual results may differ from these estimates.
AQN's significant accounting policies and new accounting standards are discussed in Notes 1 and 2 in the annual consolidated financial statements, respectively. Management believes the following accounting policies involve the application of critical accounting estimates. Accordingly, these accounting estimates have been reviewed and discussed with the Audit & Finance Committee of the Board.
Estimated Useful Lives and Recoverability of Long-Lived Assets, Intangibles Assets, Goodwill and Long-term Investments
The Company makes judgments (a) to determine the recoverability of a development project, and the period over which the costs are capitalized during the development and construction of the project, (b) to assess the nature of the costs to be
| | | | | |
| |
| Algonquin Power & Utilities Corp. - Management Discussion & Analysis | |
capitalized, (c) to distinguish individual components and major overhauls, and (d) to determine the useful lives or unit-of-production over which assets are depreciated.
Depreciation rates on most utility assets are subject to regulatory review and approval, and depreciation expense is recovered through rates set by ratemaking authorities. The recovery of those costs is dependent on the ratemaking process.
The carrying value of long-lived assets, intangible assets, goodwill and long-term investments, is reviewed whenever events or changes in circumstances indicate that such carrying values may not be recoverable, and at least annually for goodwill. Equity method investments are reviewed to determine whether an other-than-temporary decline in value has occurred and an impairment exists. Some of the factors AQN considers as indicators of impairment include a significant change in energy pricing operational or financial performance, unexpected outcome from rate orders, natural disasters, and changes in regulation. When such events or circumstances are present, the Company assesses whether the carrying value will be recovered through the expected future cash flows. If the facility includes goodwill, the fair value of the facility is compared to its carrying value. Both methodologies are sensitive to the forecasted cash flows and in particular energy prices, long-term growth rate and, discount rate for the fair value calculation.
In 2024 and 2023, management assessed qualitative and quantitative factors for each of the reporting units that were allocated goodwill. No goodwill impairment provision was required.
Valuation of Deferred Tax Assets
In assessing the realization of deferred tax assets, management aims to consider all evidence, both positive and negative, to determine whether it is more likely than not that deferred tax assets will be realized. A piece of objective evidence evaluated is cumulative earnings or losses incurred over the three-year period. Even with a cumulative loss, management will typically review a forecast of future taxable income and consider tax planning strategies before making its final assessment.
Following the announced sale of the renewable energy business (excluding hydro), the Company shifted its method of accounting for deferred taxes on its investment in the renewable energy business from inside basis to outside basis. Based on the Company’s tax basis in the renewable energy business assets, the Renewables Sale is expected to result in a capital loss that is not likely to be realized. A full valuation allowance has been recorded on this outside basis deferred tax asset.
Management's assessment of the deferred tax assets in Canada is that it is no longer probable that most of the benefit of such assets will be realized. Following the Renewables Sale, the Company has limited Canadian entities that are operationally profitable. Management has evaluated all available positive and negative evidence applicable to the remaining entities in Canada and has concluded that it is not probable that the Canadian businesses will earn sufficient taxable profit to allow for the full utilization of available tax attributes prior to their expiry. A valuation allowance has been recorded against the majority of the Canadian deferred tax assets.
Accounting for Rate Regulation
Accounting guidance for regulated operations provides that rate-regulated entities account for and report assets and liabilities consistent with the recovery of those incurred costs in rates if the rates established are designed to recover the costs of providing the regulated service and if the competitive environment makes it probable that such rates can be charged and collected. This accounting guidance is applied to the Regulated Services Group's operations, with the exception of Suralis.
Certain expenses and revenues subject to utility regulation or rate determination normally reflected in income are deferred on the balance sheet as regulatory assets or liabilities and are recognized in income as the related amounts are included in service rates and recovered from or refunded to customers. Regulatory assets and liabilities are recorded when it is probable that these items will be recovered or reflected in future rates. Determining probability requires significant judgment on the part of management and includes, but is not limited to, consideration of testimony presented in regulatory hearings, proposed regulatory decisions, final regulatory orders and industry practice. If events were to occur that would make the recovery of these assets and liabilities no longer probable, these regulatory assets and liabilities would be required to be written off or written down.
| | | | | |
| |
| Algonquin Power & Utilities Corp. - Management Discussion & Analysis | 60 |
Unbilled Energy Revenues
Revenues related to natural gas, electricity and water delivery are generally recognized upon delivery to customers. The determination of customer billings is based on a systematic reading of meters throughout the month. At the end of each month, amounts of natural gas, energy or water provided to customers since the date of the last meter reading are estimated, and the corresponding unbilled revenue is recorded. Factors that can impact the estimate of unbilled energy include, but are not limited to, seasonal weather patterns compared to normal, total volumes supplied to the system, line losses, economic impacts, and composition of customer classes. Estimates are reversed in the following month and actual revenue is recorded based on subsequent meter readings.
Derivatives
AQN uses derivative instruments to manage exposure to changes in commodity prices, foreign exchange rates, and interest rates. Management's judgment is required to determine if a transaction meets the definition of a derivative and, if it does, whether the normal purchases and sales exception applies or whether individual transactions qualify for hedge accounting treatment. Management's judgment is also required to determine the fair value of derivative transactions. AQN determines the fair value of derivative instruments based on forward market prices in active markets obtained from external parties adjusted for nonperformance risk. A significant change in estimate could affect AQN's results of operations if the hedging relationship was considered no longer effective.
Pension and Post-employment Benefits
The obligations and related costs of defined benefit pension and other post-employment benefit plans ("OPEB") are calculated using actuarial concepts, which include critical assumptions related to the discount rate, mortality rate, compensation increase, expected rate of return on plan assets and medical cost trend rates. These assumptions are important elements of expense and/or liability measurement and are updated on an annual basis, or upon the occurrence of significant events. The mortality assumption for December 31, 2024 uses the Pri-2012 mortality table and the projected generationally scale MP-2021, adjusted to reflect the ultimate improvement rates in the 2021 Social Security Administration intermediate assumptions for plans in the United States. The mortality assumption for the Bermuda plan as of December 31, 2024 uses the 2014 Canadian Pensioners' Mortality Table combined with mortality improvement scale CPM-B.
The sensitivities of key assumptions used in measuring accrued benefit obligations and benefit plan cost for 2024 are outlined in the following table. They are calculated independently of each other. Actual experience may result in changes in a number of assumptions simultaneously. The types of assumptions and method used to prepare the sensitivity analysis has not changed from previous periods and is consistent with the calculation of the retirement benefit obligations and net benefit plan cost recognized in the consolidated financial statements.
| | | | | | | | | | | | | | | | | | | | | | | | | | | | | |
| 2024 Pension Plans | | 2024 OPEB Plans |
| (all dollar amounts in $ millions) | Accrued Benefit Obligation | Net Periodic Pension Cost | | Accumulated Postretirement Benefit Obligation | Net Periodic Postretirement Benefit Cost |
| Discount Rate | | | | | |
| 1% increase | | (51.7) | | | (2.3) | | | | (20.4) | | | (2.3) | |
| 1% decrease | | 61.4 | | | 3.1 | | | | 24.8 | | | 1.0 | |
| | | | | |
| Future compensation rate | | | | | |
| 1% increase | | 1.5 | | | 1.2 | | | | — | | | — | |
| 1% decrease | | (1.4) | | | (1.0) | | | | — | | | — | |
| | | | | |
| Expected return on plan assets | | | | | |
| 1% increase | | — | | | (4.4) | | | | — | | | (1.7) | |
| 1% decrease | | — | | | 4.4 | | | | — | | | 1.7 | |
| | | | | |
| Health care trend | | | | | |
| 1% increase | | — | | | — | | | | 23.5 | | | 2.9 | |
| 1% decrease | | — | | | — | | | | (19.6) | | | (3.7) | |
| | | | | |
| |
| Algonquin Power & Utilities Corp. - Management Discussion & Analysis | |