QUARTERLY REPORT PURSUANT TO SECTION 13 OR 15(d) OF THE SECURITIES EXCHANGE ACT OF 1934
For the quarterly period ended March 31, 2024
OR
☐
TRANSITION REPORT PURSUANT TO SECTION 13 OR 15(d) OF THE SECURITIES EXCHANGE ACT OF 1934
For the transition period from to
Commission File No. 001-36429
ARES MANAGEMENT CORPORATION
(Exact name of Registrant as specified in its charter)
Delaware
80-0962035
(State or other jurisdiction of incorporation or organization)
(I.R.S. Employer Identification Number)
2000 Avenue of the Stars, 12th Floor, Los Angeles, CA90067
(Address of principal executive office) (Zip Code)
(310) 201-4100
(Registrant’s telephone number, including area code)
N/A
(Former name, former address and former fiscal year, if changed since last report)
Securities registered pursuant to Section 12(b) of the Act:
Title of each class
Trading Symbol(s)
Name of each exchange on which registered
Class A common stock, par value $0.01 per share
ARES
New York Stock Exchange
Indicate by check mark whether the registrant (1) has filed all reports required to be filed by Section 13 or 15(d) of the Securities Exchange Act of 1934 during the preceding 12 months (or for such shorter period that the registrant was required to file such reports), and (2) has been subject to such filing requirements for the past 90 days: Yesx No ¨
Indicate by check mark whether the registrant has submitted electronically every Interactive Data File required to be submitted pursuant to Rule 405 of Regulation S-T (§232.405 of this chapter) during the preceding 12 months (or for such shorter period that the registrant was required to submit such files). Yesx No ¨
Indicate by check mark whether the registrant is a large accelerated filer, an accelerated filer, a non-accelerated filer, a smaller reporting company, or an emerging growth company. See definitions of “large accelerated filer,” “accelerated filer,” “smaller reporting company.” and “emerging growth company” in Rule 12b-2 of the Exchange Act.
Large Accelerated Filer
x
Accelerated Filer
☐
Non-Accelerated Filer
☐
Smaller Reporting Company
☐
Emerging Growth Company
☐
If an emerging growth company, indicate by check mark if the registrant has elected not to use the extended transition period for complying with any new or revised financial accounting standards provided pursuant to Section 13(a) of the Exchange Act. ¨
Indicate by check mark whether the registrant is a shell company (as defined in Rule 12b-2 of the Exchange Act). Yes ☐ No x
As of May 2, 2024 there were 191,203,721 of the registrant’s shares of Class A common stock outstanding, 3,489,911 of the registrant’s shares of non-voting common stock outstanding, 1,000 shares of the registrant’s Class B common stock outstanding, and 115,120,213 of the registrant’s Class C common stock outstanding.
This report contains forward-looking statements within the meaning of Section 27A of the Securities Act of 1933, as amended (the “Securities Act”), and Section 21E of the Securities Exchange Act of 1934, as amended (the “Exchange Act”), which reflect our current views with respect to, among other things, future events, operations and financial performance. You can identify these forward-looking statements by the use of forward-looking words such as “outlook,” “believes,” “expects,” “potential,” “continues,” “may,” “will,” “should,” “seeks,” “predicts,” “intends,” “plans,” “estimates,” “anticipates,” “foresees” or negative versions of those words, other comparable words or other statements that do not relate to historical or factual matters. The forward-looking statements are based on our beliefs, assumptions and expectations of our future performance, taking into account all information currently available to us. Such forward-looking statements are subject to various risks and uncertainties and assumptions relating to our operations, financial results, financial condition, business prospects, growth strategy and liquidity. Some of these factors are described in this report and in our Annual Report on Form 10-K for the year ended December 31, 2023, under the headings “Item 7. Management’s Discussion and Analysis of Financial Condition and Results of Operations” and “Item 1A. Risk Factors.” These factors should not be construed as exhaustive and should be read in conjunction with the risk factors and other cautionary statements that are included in this report and in our other periodic filings. If one or more of these or other risks or uncertainties materialize, or if our underlying assumptions prove to be incorrect, our actual results may vary materially from those indicated in these forward-looking statements. New risks and uncertainties arise over time, and it is not possible for us to predict those events or how they may affect us. Therefore, you should not place undue reliance on these forward-looking statements. Any forward-looking statement speaks only as of the date on which it is made. We do not undertake any obligation to publicly update or review any forward-looking statement, whether as a result of new information, future developments or otherwise, except as required by law.
References in this Quarterly Report on Form 10-Q to the “Ares Operating Group” refer to Ares Holdings L.P. (“Ares Holdings”). References in this Quarterly Report on Form 10-Q to an “Ares Operating Group Unit” or an “AOG Unit” refers to a partnership unit in the Ares Operating Group entity.
The use of any defined term in this report to mean more than one entities, persons, securities or other items collectively is solely for convenience of reference and in no way implies that such entities, persons, securities or other items are one indistinguishable group. For example, notwithstanding the use of the defined terms “Ares,” “we” and “our” in this report to refer to Ares Management Corporation and its subsidiaries, each subsidiary of Ares Management Corporation is a standalone legal entity that is separate and distinct from Ares Management Corporation and any of its other subsidiaries.
Under generally accepted accounting principles in the United States (“U.S.”) (“GAAP”), we are required to consolidate (i) entities other than limited partnerships and entities similar to limited partnerships in which we hold a majority voting interest or have majority ownership and control over the operational, financial and investing decisions of that entity, including Ares-affiliates and affiliated funds and co-investment vehicles, for which we are presumed to have controlling financial interests, and (ii) entities that we concluded are variable interest entities (“VIEs”), including limited partnerships and collateralized loan obligations, for which we are deemed to be the primary beneficiary. When an entity is consolidated, we reflect the assets, liabilities, revenues, expenses and cash flows of the entity in our unaudited condensed consolidated financial statements on a gross basis, subject to eliminations from consolidation, including the elimination of the management fees, carried interest, incentive fees and other fees that we earn from the entity. However, the presentation of performance related compensation and other expenses associated with generating such revenues is not affected by the consolidation process. In addition, as a result of the consolidation process, the net income attributable to third-party investors in consolidated entities is presented as net income attributable to non-controlling interests in Consolidated Funds within Condensed Consolidated Statements of Operations. We also consolidate joint ventures that we have established with third-party investors for strategic distribution and expansion purposes. The results of these entities are reflected on a gross basis in the unaudited condensed consolidated financial statements, subject to eliminations from consolidation, and net income attributable to third-party investors in the consolidated joint ventures is presented within net income attributable to redeemable interest and non-controlling interests in Ares Operating Group entities or an “AOG Entity,” which refers to, collectively, Ares Holdings and any future entity designated by our board of directors in its sole discretion as an Ares Operating Group entity.
In this Quarterly Report on Form 10-Q, in addition to presenting our results on a consolidated basis in accordance with GAAP, we present revenues, expenses and other results on a: (i) “segment basis,” which deconsolidates the consolidated funds and removes the proportional results attributable to third-party investors in the consolidated joint ventures, and therefore shows the results of our operating segments without giving effect to the consolidation of these entities; and (ii) “unconsolidated reporting basis,” which shows the results of our operating segments on a combined segment basis together with our Operations Management Group. In addition to our operating segments, we have an Operations Management Group (the “OMG”). The OMG consists of shared resource groups to support our operating segments by providing infrastructure and administrative support in the areas of accounting/finance, operations, information technology, legal, compliance, human resources, strategy
and relationship management and distribution. The OMG includes Ares Wealth Management Solutions, LLC (“AWMS”) that facilitates the product development, distribution, marketing and client management activities for investment offerings in the global wealth management channel. Additionally, the OMG provides services to certain of the Company’s managed funds and vehicles, which reimburse the OMG for expenses either equal to the costs of services provided or as a percentage of invested capital. The OMG’s revenues and expenses are not allocated to our operating segments but we consider the cost structure of the OMG when evaluating our financial performance. This information constitutes non-GAAP financial information within the meaning of Regulation G, as promulgated by the SEC. Our management uses this information to assess the performance of our operating segments and the OMG, and we believe that this information enhances the ability of shareholders to analyze our performance. For more information, see “Note 13. Segment Reporting,” within our unaudited condensed consolidated financial statements included in this Quarterly Report on Form 10-Q.
When used in this report, unless the context otherwise requires:
•“American-style waterfall” generally refers to carried interest that the general partner is entitled to receive after a fund investment is realized and the investors in the fund have received distributions in excess of the capital contributed for that investment and all prior realized investments (including allocable expenses) plus a preferred return;
•“Ares”, the “Company”, “AMC”, “we”, “us” and “our” refer to Ares Management Corporation and its subsidiaries;
•“Ares Operating Group entities” or an “AOG Entity” refers to, collectively, Ares Holdings, L.P. (“Ares Holdings”) and any future entity designated by our board of directors in its sole discretion as an Ares Operating Group entity;
•“Ares Operating Group Unit” or an “AOG Unit” refers to, collectively, a partnership unit in the Ares Operating Group entities including Ares Holdings and any future entity designated by our board of directors in its sole discretion as an Ares Operating Group entity;
•“assets under management” or “AUM” generally refers to the assets we manage. For our funds other than CLOs, our AUM represents the sum of the net asset value (“NAV”) of such funds, the drawn and undrawn debt (at the fund-level including amounts subject to restrictions) and uncalled committed capital (including commitments to funds that have yet to commence their investment periods). NAV refers to the fair value of the assets of a fund less the fair value of the liabilities of the fund. For the CLOs we manage, our AUM is equal to initial principal of collateral adjusted for paydowns. AUM also includes the proceeds raised in the initial public offerings of special purpose acquisition companies (“SPACs”) sponsored by us, less any redemptions;
•“AUM not yet paying fees” (also referred to as “shadow AUM”) refers to AUM that is not currently paying fees and is eligible to earn management fees upon deployment;
•“available capital” (also referred to as “dry powder”) is comprised of uncalled committed capital and undrawn amounts under credit facilities and may include AUM that may be canceled or not otherwise available to invest;
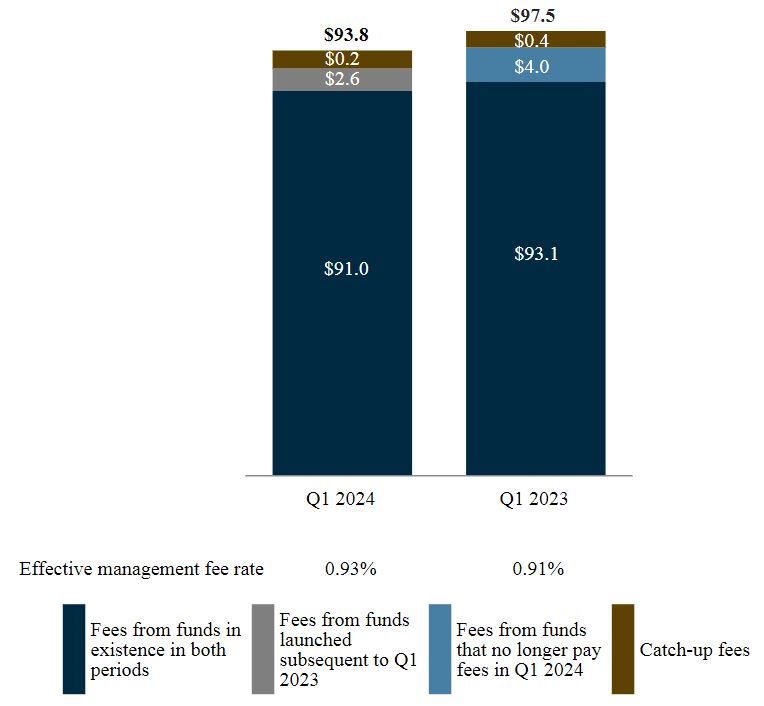
•“catch-up fees” refers to management fees charged retroactively on limited partner commitments to a fund following the initial close date of that fund. These fees are charged to ensure that all limited partners’ claims on the net assets of that fund are ratable with their commitment. Catch-up fees reflect the fees generated between the fund’s initial close date and the last day of the quarter prior to the new limited partner’s commitment;
•“CLOs” refers to “our funds” that are structured as collateralized loan obligations;
•“Consolidated Funds” refers collectively to certain Ares funds, co-investment vehicles, CLOs and SPACs that are required under GAAP to be consolidated in our consolidated financial statements;
•“Credit Facility” refers to the revolving credit facility of the Ares Operating Group;
•“effective management fee rate” represents annualized management fees divided by the average fee paying AUM for the period, excluding the impact of catch-up fees;
•“European-style waterfall” generally refers to carried interest that the general partner is entitled to receive after the investors in a fund have received distributions in an amount equal to all prior capital contributions plus a preferred return;
•“fee paying AUM” or “FPAUM” refers to the AUM from which we directly earn management fees. FPAUM is equal to the sum of all the individual fee bases of our funds that directly contribute to our management fees. For
our funds other than CLOs, our FPAUM represents the amount of limited partner capital commitments for certain closed-end funds within the reinvestment period, the amount of limited partner invested capital for the aforementioned closed-end funds beyond the reinvestment period and the portfolio value, gross asset value or NAV. For the CLOs we manage, our FPAUM is equal to the gross amount of aggregate collateral balance, at par, adjusted for defaulted or discounted collateral;
•“fee related earnings” or “FRE”, a non-GAAP measure, is used to assess core operating performance by determining whether recurring revenue, primarily consisting of management fees and fee related performance revenues, is sufficient to cover operating expenses and to generate profits. FRE differs from income before taxes computed in accordance with GAAP as FRE excludes net performance income, investment income from our funds and adjusts for certain other items that we believe are not indicative of our core operating performance. Fee related performance revenues, together with fee related performance compensation, is presented within FRE because it represents incentive fees from perpetual capital vehicles that are measured and eligible to be received on a recurring basis and are not dependent on realization events from the underlying investments;
•“fee related performance revenues” refers to incentive fees from perpetual capital vehicles that are: (i) measured and eligible to be received on a recurring basis; and (ii) not dependent on realization events from the underlying investments. Certain vehicles are subject to hold back provisions that limit the amounts paid in a particular year. Such hold back amounts may be paid in subsequent years, subject to their extended performance conditions;
•“GAAP” refers to accounting principles generally accepted in the United States of America;
•“Holdco Members” refers to Michael Arougheti, David Kaplan, Antony Ressler, Bennett Rosenthal, Ryan Berry and R. Kipp deVeer;
•“Incentive eligible AUM” or “IEAUM” generally refers to the AUM of our funds and other entities from which carried interest and incentive fees may be generated, regardless of whether or not they are currently generating carried interest and incentive fees. It generally represents the NAV plus uncalled equity or total assets plus uncalled debt, as applicable, of our funds for which we are entitled to receive carried interest and incentive fees, excluding capital committed by us and our professionals (from which we generally do not earn carried interest and incentive fees), as well as proceeds raised in the initial public offerings of SPACs sponsored by us, less any redemptions. With respect to Ares Capital Corporation (NASDAQ: ARCC) (“ARCC”), Ares Strategic Income Fund (“ASIF”) and Ares European Strategic Income Fund’s (“AESIF”) AUM, only Part II Fees may be generated from IEAUM;
•“Incentive generating AUM” or “IGAUM” refers to the AUM of our funds and other entities that are currently generating carried interest and incentive fees on a realized or unrealized basis. It generally represents the NAV or total assets of our funds, as applicable, for which we are entitled to receive carried interest and incentive fees, excluding capital committed by us and our professionals (from which we generally do not earn carried interest and incentive fees). ARCC, ASIF and AESIF are only included in IGAUM when Part II Fees are being generated;
•“management fees” refers to fees we earn for advisory services provided to our funds, which are generally based on a defined percentage of fair value of assets, total commitments, invested capital, net asset value, net investment income, total assets or par value of the investment portfolios managed by us. Management fees include Part I Fees, a quarterly fee based on the net investment income of certain funds;
•“net inflows of capital” refers to net new commitments during the period, including equity and debt commitments and gross inflows into our open-ended managed accounts and sub-advised accounts, as well as new debt and equity issuances by our publicly-traded vehicles minus redemptions from our open-ended funds, managed accounts and sub-advised accounts;
•“net performance income” refers to performance income net of related compensation that is typically payable to our professionals;
•“our funds” refers to the funds, alternative asset companies, trusts, co-investment vehicles and other entities and accounts that are managed or co-managed by the Ares Operating Group, and which are structured to pay fees. It also includes funds managed by Ivy Hill Asset Management, L.P., a wholly owned portfolio company of ARCC and an SEC-registered investment adviser;
•“Part I Fees” refers to a quarterly fee on the net investment income of ARCC, CION Ares Diversified Credit Fund (“CADC”), ASIF and AESIF. Such fees are classified as management fees as they are predictable and recurring in nature, not subject to contingent repayment and generally cash-settled each quarter, unless subject to a payment deferral;
•“Part II Fees” refers to fees from ARCC, ASIF and AESIF that are paid in arrears as of the end of each calendar year when the respective cumulative aggregate realized capital gains exceed the cumulative aggregate realized capital losses and aggregate unrealized capital depreciation, less the aggregate amount of respective Part II Fees paid in all prior years since inception;
•“performance income” refers to income we earn based on the performance of a fund that is generally based on certain specific hurdle rates as defined in the fund’s investment management or partnership agreements and may be either incentive fees earned from funds with stated investment periods or carried interest;
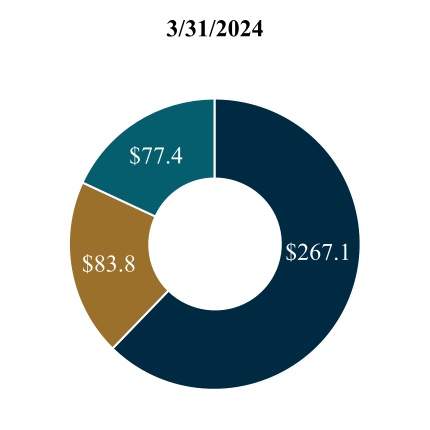
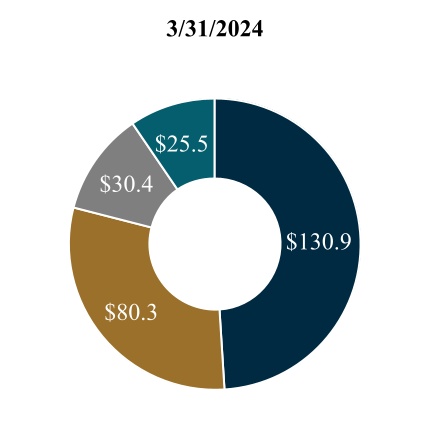
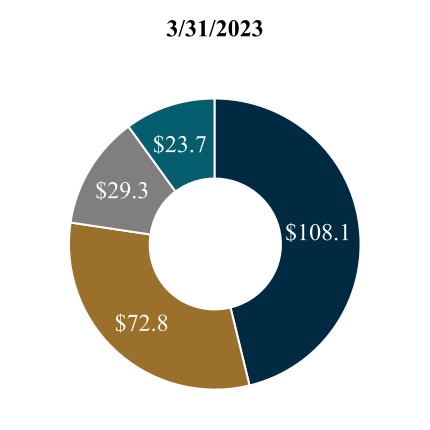
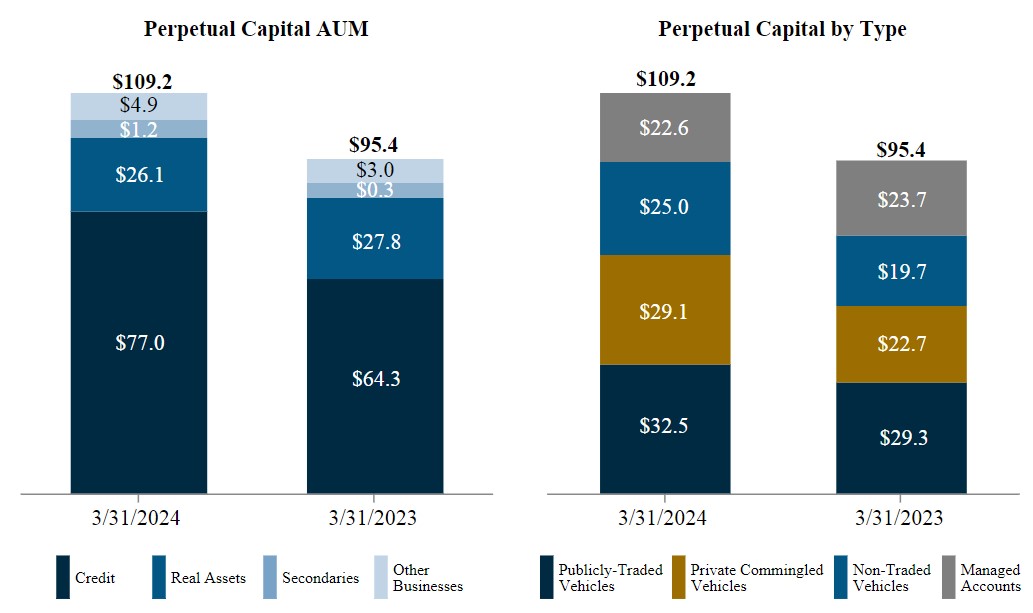
•“perpetual capital” refers to the AUM of: (i) our publicly-traded vehicles, including ARCC, Ares Commercial Real Estate Corporation (NYSE: ACRE) (“ACRE”) and Ares Dynamic Credit Allocation Fund, Inc. (NYSE: ARDC) (“ARDC”); (ii) our non-traded vehicles, including ASIF, CADC and AESIF, our non-traded real estate investment trusts (“REITs”) and Ares Private Markets Fund (“APMF”); (iii) Aspida Holdings Ltd. (together with its subsidiaries, “Aspida”); and (iv) certain other commingled funds and managed accounts that have an indefinite term, are not in liquidation, and for which there is no immediate requirement to return invested capital to investors upon the realization of investments. Perpetual Capital - Managed Accounts refers to managed accounts for single investors primarily in illiquid strategies that meet the perpetual capital criteria. Perpetual Capital - Private Commingled Funds refers to commingled funds that meet the perpetual capital criteria, not including our publicly-traded vehicles or non-traded vehicles. Perpetual capital may be withdrawn by investors under certain conditions, including through an election to redeem an investor’s fund investment or to terminate the investment management agreement, which in certain cases may be terminated on 30 days’ prior written notice. In addition, the investment management or advisory agreements of certain of our publicly-traded and non-traded vehicles have one year terms, which are subject to annual renewal by such vehicles;
•“realized income” or “RI”, a non-GAAP measure, is an operating metric used by management to evaluate performance of the business based on operating performance and the contribution of each of the business segments to that performance, while removing the fluctuations of unrealized income and losses, which may or may not be eventually realized at the levels presented and whose realizations depend more on future outcomes than current business operations. RI differs from income before taxes by excluding: (i) operating results of our Consolidated Funds; (ii) depreciation and amortization expense; (iii) the effects of changes arising from corporate actions; and (iv) unrealized gains and losses related to carried interest, incentive fees and investment performance; and adjusts for certain other items that we believe are not indicative of our operating performance. Changes arising from corporate actions include equity-based compensation expenses, the amortization of intangible assets, transaction costs associated with mergers, acquisitions and capital activities, underwriting costs and expenses incurred in connection with corporate reorganization. Placement fee adjustment represents the net portion of either expense deferral or amortization of upfront fees to placement agents that is presented to match the timing of expense recognition with the period over which management fees are expected to be earned from the associated fund for segment purposes but have been expensed in advance in accordance with GAAP. For periods in which the amortization of upfront fees for segment purposes is higher than the GAAP expense, the placement fee adjustment is presented as a reduction to RI;
•“SEC” refers to the Securities and Exchange Commission.
Many of the terms used in this report, including AUM, FPAUM, FRE and RI, may not be comparable to similarly titled measures used by other companies. In addition, our definitions of AUM and FPAUM are not based on any definition of AUM or FPAUM that is set forth in the agreements governing the funds that we manage and may differ from definitions of AUM or FPAUM set forth in other agreements to which we are a party or definitions used by the SEC or other regulatory bodies. Further, FRE and RI are not measures of performance calculated in accordance with GAAP. We use FRE and RI as measures of operating performance, not as measures of liquidity. FRE and RI should not be considered in isolation or as substitutes for operating income, net income, operating cash flows, or other income or cash flow statement data prepared in accordance with GAAP. The use of FRE and RI without consideration of related GAAP measures is not adequate due to the adjustments described above. Our management compensates for these limitations by using FRE and RI as supplemental measures to our GAAP results. We present these measures to provide a more complete understanding of our performance as our management measures it.
Amounts and percentages throughout this report may reflect rounding adjustments and consequently totals may not appear to sum.
Condensed Consolidated Statements of Financial Condition (Amounts in Thousands, ExceptShareData)
As of
March 31, 2024
December 31, 2023
(unaudited)
Assets
Cash and cash equivalents
$
346,331
$
348,274
Investments (includes accrued carried interest of $3,361,519 and $3,413,007 as of March 31, 2024 and December 31, 2023, respectively)
4,484,884
4,624,932
Due from affiliates
809,273
896,746
Other assets
519,292
429,979
Right-of-use operating lease assets
237,019
249,326
Intangible assets, net
1,030,076
1,058,495
Goodwill
1,130,085
1,123,976
Assets of Consolidated Funds:
Cash and cash equivalents
1,199,376
1,149,511
Investments held in trust account
529,887
523,038
Investments, at fair value
13,790,030
14,078,549
Due from affiliates
15,924
14,151
Receivable for securities sold
243,998
146,851
Other assets
77,095
86,672
Total assets
$
24,413,270
$
24,730,500
Liabilities
Accounts payable, accrued expenses and other liabilities
$
262,551
$
233,884
Accrued compensation
217,788
287,259
Due to affiliates
363,308
240,254
Performance related compensation payable
2,449,732
2,514,610
Debt obligations
3,046,182
2,965,480
Operating lease liabilities
308,336
319,572
Liabilities of Consolidated Funds:
Accounts payable, accrued expenses and other liabilities
189,556
189,523
Due to affiliates
12,727
3,554
Payable for securities purchased
548,032
484,117
CLO loan obligations, at fair value
11,906,346
12,345,657
Fund borrowings
78,241
125,241
Total liabilities
19,382,799
19,709,151
Commitments and contingencies
Redeemable interest in Consolidated Funds
529,787
522,938
Redeemable interest in Ares Operating Group entities
23,612
24,098
Non-controlling interests in Consolidated Funds
1,515,302
1,258,445
Non-controlling interests in Ares Operating Group entities
1,194,276
1,322,469
Stockholders’ Equity
Class A common stock, $0.01 par value, 1,500,000,000 shares authorized (191,057,860 shares and 187,069,907 shares issued and outstanding as of March 31, 2024 and December 31, 2023, respectively)
1,911
1,871
Non-voting common stock, $0.01 par value, 500,000,000 shares authorized (3,489,911 shares issued and outstanding as of March 31, 2024 and December 31, 2023)
35
35
Class B common stock, $0.01 par value, 1,000 shares authorized (1,000 shares issued and outstanding as of March 31, 2024 and December 31, 2023)
—
—
Class C common stock, $0.01 par value, 499,999,000 shares authorized (115,120,213 shares and 117,024,758 shares issued and outstanding as of March 31, 2024 and December 31, 2023, respectively)
1,151
1,170
Additional paid-in-capital
2,387,437
2,391,036
Accumulated deficit
(612,560)
(495,083)
Accumulated other comprehensive loss, net of tax
(10,480)
(5,630)
Total stockholders’ equity
1,767,494
1,893,399
Total equity
4,477,072
4,474,313
Total liabilities, redeemable interest, non-controlling interests and equity
$
24,413,270
$
24,730,500
See accompanying notes to the unaudited condensed consolidated financial statements.
Notes to the Unaudited Condensed Consolidated Financial Statements
(Dollars in Thousands, Except Share Data and As Otherwise Noted)
1. ORGANIZATION
Ares Management Corporation (the “Company”), a Delaware corporation, together with its subsidiaries, is a leading global alternative investment manager operating integrated groups across Credit, Real Assets, Private Equity and Secondaries. Information about segments should be read together with “Note 13. Segment Reporting.” Subsidiaries of the Company serve as the general partners and/or investment managers to various funds and managed accounts within each investment group (the “Ares Funds”). These subsidiaries provide investment advisory services to the Ares Funds in exchange for management fees.
The accompanying unaudited financial statements include the condensed consolidated results of the Company and its subsidiaries. The Company is a holding company that operates and controls all of the businesses and affairs of and conducts all of its material business activities through Ares Holdings L.P. (“Ares Holdings”). Ares Holdings represents all the activities of the “Ares Operating Group” or “AOG” and may be referred to interchangeably. The Company, indirectly through its wholly owned subsidiary, Ares Holdco LLC, is the general partner of the Ares Operating Group entity.
The Company manages or controls certain entities that have been consolidated in the accompanying financial statements as described in “Note 2. Summary of Significant Accounting Policies.” These entities include Ares funds, co-investment vehicles, collateralized loan obligations or funds (collectively “CLOs”) and special purpose acquisition companies (“SPACs”) (collectively, the “Consolidated Funds”).
Including the results of the Consolidated Funds significantly increases the reported amounts of the assets, liabilities, revenues, expenses and cash flows within the accompanying unaudited condensed consolidated financial statements. However, the Consolidated Funds results included herein have no direct effect on the net income attributable to Ares Management Corporation or to its Stockholders’ Equity, except where accounting for a redemption or liquidation preference requires the reallocation of ownership based on specific terms of a profit sharing agreement. Instead, economic ownership interests of the investors in the Consolidated Funds are reflected as redeemable and non-controlling interests in Consolidated Funds. Further, cash flows allocable to redeemable and non-controlling interest in Consolidated Funds are specifically identifiable within the Condensed Consolidated Statements of Cash Flows.
2. SUMMARY OF SIGNIFICANT ACCOUNTING POLICIES
Basis of Presentation
The accompanying unaudited condensed consolidated financial statements are prepared in accordance with the generally accepted accounting principles in the United States (“U.S.”) (“GAAP”) for interim financial information and instructions to the Quarterly Report on Form 10-Q. The unaudited condensed consolidated financial statements, including these notes, are unaudited and exclude some of the disclosures required in annual financial statements. Management believes it has made all necessary adjustments so that the unaudited condensed consolidated financial statements are presented fairly and that estimates made in preparing its unaudited condensed consolidated financial statements are reasonable and prudent, and that all such adjustments are of a normal recurring nature. The operating results presented for interim periods are not necessarily indicative of the results that may be expected for any other interim period or for the entire year. These unaudited condensed consolidated financial statements should be read in conjunction with the audited consolidated financial statements included in the Annual Report on Form 10-K for the year ended December 31, 2023 filed with the Securities and Exchange Commission (“SEC”).
The unaudited condensed consolidated financial statements include the accounts and activities of the Ares Operating Group entities (“AOG entities”), their consolidated subsidiaries and certain Consolidated Funds. All intercompany balances and transactions have been eliminated upon consolidation.
The Company has reclassified certain prior period amounts to conform to the current year presentation.
Recent Accounting Pronouncements
The Company considers the applicability and impact of all accounting standard updates (“ASU”) issued by the Financial Accounting Standards Board (“FASB”). ASUs not listed below were assessed and either determined to be not applicable or expected to have minimal impact on its unaudited condensed consolidated financial statements.
Notes to the Unaudited Condensed Consolidated Financial Statements (Continued)
(Dollars in Thousands, Except Share Data and As Otherwise Noted)
In November 2023, the FASB issued ASU 2023-07, Segment Reporting (Topic 280) Improvements to Reportable Segment Disclosures. ASU 2023-07 requires disclosure of significant segment expenses that are regularly provided to the chief operating decision maker (“CODM”) and included within each reported measure of segment profit or loss, an amount and description of its composition for other segment items to reconcile to segment profit or loss, and the title and position of the Company’s CODM. The amendments in this update also expand the interim segment disclosure requirements.ASU 2023-07 is effective for the Company’s fiscal year ending December 31, 2024 and for the Company’s interim periods beginning with the quarter ended March 31, 2025. Early adoption is permitted and the amendments in this update are required to be applied on a retrospective basis. The Company is currently evaluating the impact of this guidance.
In December 2023, the FASB issued ASU 2023-09, Income Taxes (Topic 740) Improvements to Income Tax Disclosures. ASU 2023-09requires disclosure of disaggregated income taxes paid in both U.S. and foreign jurisdictions, prescribes standard categories for the components of the effective tax rate reconciliation and modifies other income tax-related disclosures. ASU 2023-09 is effective for the Company’s fiscal year ending December 31, 2025. Early adoption is permitted and the amendments in this update should be applied on a prospective basis, though retrospective adoption is permitted. The Company is currently evaluating the impact of this guidance.
3. GOODWILL AND INTANGIBLE ASSETS
Intangible Assets, Net
The following table summarizes the carrying value, net of accumulated amortization, of the Company’s intangible assets:
Weighted Average Amortization Period (in years) as of March 31, 2024
As of March 31,
As of December 31,
2024
2023
Management contracts
4.2
$
580,635
$
604,242
Client relationships
8.3
200,920
200,920
Other
0.6
500
500
Finite-lived intangible assets
782,055
805,662
Foreign currency translation
(202)
1,126
Total finite-lived intangible assets
781,853
806,788
Less: accumulated amortization
(319,577)
(316,093)
Finite-lived intangible assets, net
462,276
490,695
Indefinite-lived management contracts
567,800
567,800
Intangible assets, net
$
1,030,076
$
1,058,495
During the three months ended March 31, 2023, the Company rebranded and discontinued the use of the SSG trade name acquired through the acquisition of SSG Capital Holdings Limited and its operating subsidiaries (“SSG”) in 2020. As a result, the Company recorded a non-cash impairment charge equal to the SSG trade name’s carrying value of $7.8 million to accelerate the amortization expense for the three months ended March 31, 2023.
Amortization expense associated with intangible assets, excluding the accelerated amortization described above, was $29.2 million and $33.6 million for the three months ended March 31, 2024 and 2023, respectively, and is presented within general, administrative and other expenses within the Condensed Consolidated Statements of Operations. During the three months ended March 31, 2024, the Company removed $24.9 million of fully-amortized intangible assets.
Notes to the Unaudited Condensed Consolidated Financial Statements (Continued)
(Dollars in Thousands, Except Share Data and As Otherwise Noted)
Goodwill
The following table summarizes the carrying value of the Company’s goodwill:
Credit Group
Real Assets Group
Private Equity Group
Secondaries Group
Total
Balance as of December 31, 2023
$
256,679
$
277,205
$
172,462
$
417,630
$
1,123,976
Acquisitions
—
6,710
644
—
7,354
Reallocation
55,658
—
(55,658)
—
—
Foreign currency translation
(1,242)
—
—
(3)
(1,245)
Balance as of March 31, 2024
$
311,095
$
283,915
$
117,448
$
417,627
$
1,130,085
In connection with the segment reorganization of the former special opportunities strategy as described in “Note 13. Segment Reporting,” the Company had an associated change in its reporting units and reallocated goodwill of $55.7 million from the Private Equity Group to the Credit Group using a relative fair value allocation approach.
There was no impairment of goodwill recorded during the three months ended March 31, 2024 and 2023. The impact of foreign currency translation is reflected within other comprehensive income within theCondensed Consolidated Statements of Comprehensive Income.
4. INVESTMENTS
The following table summarizes the Company’s investments:
As of
Percentage of total investments as of
March 31,
December 31,
March 31,
December 31,
2024
2023
2024
2023
Equity method investments:
Equity method - carried interest
$
3,361,519
$
3,413,007
75.0%
73.8%
Equity method private investment partnership interests - principal
545,153
535,292
12.1
11.6
Equity method private investment partnership interests and other (held at fair value)
420,033
418,778
9.4
9.0
Equity method private investment partnership interests and other
43,498
44,989
1.0
1.0
Total equity method investments
4,370,203
4,412,066
97.5
95.4
Collateralized loan obligations
20,010
20,799
0.4
0.4
Fixed income securities
1,578
105,495
—
2.3
Collateralized loan obligations and fixed income securities, at fair value
21,588
126,294
0.4
2.7
Common stock, at fair value
93,093
86,572
2.1
1.9
Total investments
$
4,484,884
$
4,624,932
Equity Method Investments
The Company’s equity method investments include investments that are not consolidated but over which the Company exerts significant influence. The Company evaluates each of its equity method investments to determine if any were significant as defined by guidance from the SEC. As of and for the three months ended March 31, 2024 and 2023, no individual equity method investment held by the Company met the significance criteria.
The following table presents the Company’s other income, net from its equity method investments, which were included within principal investment income, net realized and unrealized gains on investments, and interest and dividend income within the Condensed Consolidated Statements of Operations:
Three months ended March 31,
2024
2023
Total other income, net related to equity method investments
Notes to the Unaudited Condensed Consolidated Financial Statements (Continued)
(Dollars in Thousands, Except Share Data and As Otherwise Noted)
With respect to the Company’s equity method investments, the material assets are expected to generate either long term capital appreciation and/or interest income, the material liabilities are debt instruments collateralized by, or related to, the financing of the assets and net income is materially comprised of the changes in fair value of these net assets.
The following table summarizes the changes in fair value of the Company’s equity method investments held at fair value, which are included within net realized and unrealized gains on investments within the Condensed Consolidated Statements of Operations:
Three months ended March 31,
2024
2023
Equity method private investment partnership interests and other (held at fair value)
$
2,479
$
3,099
Investments of the Consolidated Funds
The following table summarizes investments held in the Consolidated Funds:
Fair Value as of
Percentage of total investments as of
March 31,
December 31,
March 31,
December 31,
2024
2023
2024
2023
Fixed income investments:
Loans and securitization vehicles
$
10,147,424
$
10,616,458
70.9%
72.7%
Money market funds and U.S. treasury securities
529,887
523,038
3.7
3.6
Bonds
513,801
578,949
3.6
4.0
Total fixed income investments
11,191,112
11,718,445
78.2
80.3
Partnership interests
1,721,331
1,642,489
12.0
11.2
Equity securities
1,407,474
1,240,653
9.8
8.5
Total investments, at fair value
$
14,319,917
$
14,601,587
As of March 31, 2024 and December 31, 2023, no single issuer or investment, including derivative instruments and underlying portfolio investments of the Consolidated Funds, had a fair value that exceeded 5.0% of the Company’s total assets.
5. FAIR VALUE
Fair Value of Financial Instruments Held by the Company and Consolidated Funds
The following tables summarize the financial assets and financial liabilities measured at fair value for the Company and the Consolidated Funds as of March 31, 2024:
Financial Instruments of the Company
Level I
Level II
Level III
Investments Measured at NAV
Total
Assets, at fair value
Investments:
Common stock and other equity securities
$
—
$
93,093
$
416,874
$
—
$
509,967
Collateralized loan obligations and fixed income securities
Notes to the Unaudited Condensed Consolidated Financial Statements (Continued)
(Dollars in Thousands, Except Share Data and As Otherwise Noted)
Financial Instruments of the Consolidated Funds
Level I
Level II
Level III
Investments Measured at NAV
Total
Assets, at fair value
Investments:
Fixed income investments:
Loans and securitization vehicles
$
—
$
9,508,106
$
639,318
$
—
$
10,147,424
Money market funds and U.S. treasury securities
529,887
—
—
—
529,887
Bonds
—
513,801
—
—
513,801
Total fixed income investments
529,887
10,021,907
639,318
—
11,191,112
Partnership interests
—
—
—
1,721,331
1,721,331
Equity securities
38,620
2,390
1,366,464
—
1,407,474
Total investments, at fair value
568,507
10,024,297
2,005,782
1,721,331
14,319,917
Derivatives-foreign currency forward contracts
—
5,590
—
—
5,590
Total assets, at fair value
$
568,507
$
10,029,887
$
2,005,782
$
1,721,331
$
14,325,507
Liabilities, at fair value
Loan obligations of CLOs
$
—
$
(11,906,346)
$
—
$
—
$
(11,906,346)
Derivatives:
Foreign currency forward contracts
—
(5,541)
—
—
(5,541)
Asset swaps
—
—
(1,574)
—
(1,574)
Total derivative liabilities, at fair value
—
(5,541)
(1,574)
—
(7,115)
Total liabilities, at fair value
$
—
$
(11,911,887)
$
(1,574)
$
—
$
(11,913,461)
The following tables summarize the financial assets and financial liabilities measured at fair value for the Company and the Consolidated Funds as of December 31, 2023:
Financial Instruments of the Company
Level I
Level II
Level III
Investments Measured at NAV
Total
Assets, at fair value
Investments:
Common stock and other equity securities
$
—
$
86,572
$
412,491
$
—
$
499,063
Collateralized loan obligations and fixed income securities
Notes to the Unaudited Condensed Consolidated Financial Statements (Continued)
(Dollars in Thousands, Except Share Data and As Otherwise Noted)
The following tables set forth a summary of changes in the fair value of the Level III measurements:
Level III Assets of the Company
Equity Securities
Fixed Income
Total
Balance as of December 31, 2022
$
121,785
$
76,934
$
198,719
Purchases(1)
52
1,194
1,246
Sales/settlements(2)
45
(1,536)
(1,491)
Realized and unrealized appreciation (depreciation), net
3,191
(1,423)
1,768
Balance as of March 31, 2023
$
125,073
$
75,169
$
200,242
Change in net unrealized appreciation/depreciation included in earnings related to financial assets still held at the reporting date
$
2,978
$
(1,211)
$
1,767
Level III Net Assets of Consolidated Funds
Equity Securities
Fixed Income
Partnership Interests
Derivatives, Net
Total
Balance as of December 31, 2022
$
730,880
$
869,668
$
368,655
$
(3,556)
$
1,965,647
Transfer in
—
284,198
—
—
284,198
Transfer out
—
(447,536)
—
—
(447,536)
Purchases(1)
180,372
188,232
49,000
—
417,604
Sales/settlements(2)
(122)
(173,502)
(48,889)
—
(222,513)
Realized and unrealized appreciation, net
21,505
11,744
5,283
1,858
40,390
Balance as of March 31, 2023
$
932,635
$
732,804
$
374,049
$
(1,698)
$
2,037,790
Change in net unrealized appreciation/depreciation included in earnings related to financial assets and liabilities still held at the reporting date
$
21,436
$
(20,602)
$
5,283
$
1,848
$
7,965
(1)Purchases include paid-in-kind interest and securities received in connection with restructurings.
(2)Sales/settlements include distributions, principal redemptions and securities disposed of in connection with restructurings.
Transfers out of Level III were generally attributable to certain investments that experienced a more significant level of market activity during the period and thus were valued using observable inputs either from independent pricing services or multiple brokers. Transfers into Level III were generally attributable to certain investments that experienced a less significant level of market activity during the period and thus were only able to obtain one or fewer quotes from a broker or independent pricing service.
Notes to the Unaudited Condensed Consolidated Financial Statements (Continued)
(Dollars in Thousands, Except Share Data and As Otherwise Noted)
The following tables summarize the quantitative inputs and assumptions used for the Company’s and the Consolidated Funds’ Level III measurements as of March 31, 2024:
Level III Measurements of the Company
Fair Value
Valuation Technique(s)
Significant Unobservable Input(s)
Range
Weighted Average
Assets
Equity securities
$
160,318
Discounted cash flow
Discount rate
18.5% - 30.0%
25.0%
117,952
Market approach
Multiple of book value
1.3x - 1.4x
1.3x
100,000
Transaction price(1)
N/A
N/A
N/A
6,179
Market approach
Enterprise value / Earnings multiple
15.4x
15.4x
32,425
Other
N/A
N/A
N/A
Fixed income investments
20,010
Broker quotes and/or 3rd party pricing services
N/A
N/A
N/A
1,578
Other
N/A
N/A
N/A
Total assets
$
438,462
Level III Measurements of the Consolidated Funds
Fair Value
Valuation Technique(s)
Significant Unobservable Input(s)
Range
Weighted Average
Assets
Equity securities
$
774,504
Discounted cash flow
Discount rate
10.0% - 16.0%
13.0%
587,252
Market approach
Multiple of book value
1.0x - 1.7x
1.3x
3,704
Market approach
EBITDA multiple(2)
5.4x - 35.3x
9.8x
871
Transaction price(1)
N/A
N/A
N/A
133
Other
N/A
N/A
N/A
Fixed income investments
500,420
Broker quotes and/or 3rd party pricing services
N/A
N/A
N/A
128,212
Market approach
Yield
8.8% - 17.1%
11.8%
6,410
Transaction price(1)
N/A
N/A
N/A
3,876
Discounted cash flow
Discount rate
12.3% - 12.7%
12.7%
400
Other
N/A
N/A
N/A
Total assets
$
2,005,782
Liabilities
Derivative instruments
$
(1,574)
Broker quotes and/or 3rd party pricing services
N/A
N/A
N/A
Total liabilities
$
(1,574)
(1)Transaction price consists of securities purchased or restructured. The Company determined that there was no change to the valuation based on the underlying assumptions used at the closing of such transactions.
(2)“EBITDA” in the table above is a non-GAAP financial measure and refers to earnings before interest, tax, depreciation and amortization.
Notes to the Unaudited Condensed Consolidated Financial Statements (Continued)
(Dollars in Thousands, Except Share Data and As Otherwise Noted)
The following tables summarize the quantitative inputs and assumptions used for the Company’s and the Consolidated Funds’ Level III measurements as of December 31, 2023:
Level III Measurements of the Company
Fair Value
Valuation Technique(s)
Significant Unobservable Input(s)
Range
Weighted Average
Assets
Equity securities
$
154,460
Discounted cash flow
Discount rate
20.0% - 30.0%
25.0%
118,846
Market approach
Multiple of book value
1.3x - 1.6x
1.5x
100,000
Transaction price(1)
N/A
N/A
N/A
6,447
Market approach
Enterprise value / Earnings multiple
15.4x
15.4x
32,738
Other
N/A
N/A
N/A
Fixed income investments
83,000
Transaction price(1)
N/A
N/A
N/A
20,799
Broker quotes and/or 3rd party pricing services
N/A
N/A
N/A
22,495
Other
N/A
N/A
N/A
Total assets
$
538,785
Level III Measurements of the Consolidated Funds
Fair Value
Valuation Technique(s)
Significant Unobservable Input(s)
Range
Weighted Average
Assets
Equity securities
$
648,581
Discounted cash flow
Discount rate
10.0% - 16.0%
13.0%
537,733
Market approach
Multiple of book value
1.0x - 1.7x
1.3x
3,909
Market approach
EBITDA multiple(2)
4.5x - 32.4x
8.9x
177
Other
N/A
N/A
N/A
Fixed income investments
548,264
Broker quotes and/or 3rd party pricing services
N/A
N/A
N/A
188,322
Market approach
Yield
8.3% - 24.1%
12.2%
2,974
Market approach
EBITDA multiple(2)
4.5x - 32.4x
9.0x
104
Discounted cash flow
Discount rate
12.3%
12.3%
449
Other
N/A
N/A
N/A
Total assets
$
1,930,513
Liabilities
Derivative instruments
$
(1,291)
Broker quotes and/or 3rd party pricing services
N/A
N/A
N/A
Total liabilities
$
(1,291)
(1)Transaction price consists of securities purchased or restructured. The Company determined that there has been no change to the valuation based on the underlying assumptions used at the closing of such transactions.
(2)“EBITDA” in the table above is a non-GAAP financial measure and refers to earnings before interest, tax, depreciation and amortization.
The Consolidated Funds have limited partnership interests in private equity funds managed by the Company that are valued using net asset value (“NAV”) per share. The terms and conditions of these funds do not allow for redemptions without certain events or approvals that are outside the Company’s control.
The following table summarizes the investments held at fair value and unfunded commitments of the Consolidated Funds interests valued using NAV per share:
Notes to the Unaudited Condensed Consolidated Financial Statements (Continued)
(Dollars in Thousands, Except Share Data and As Otherwise Noted)
6. DEBT
The following table summarizes the Company’s and its subsidiaries’ debt obligations:
As of March 31, 2024
As of December 31, 2023
Debt Origination Date
Maturity
Original Borrowing Amount
Carrying Value
Interest Rate
Carrying Value
Interest Rate
Credit Facility(1)
Revolving
3/31/2029
N/A
$
975,000
6.38%
$
895,000
6.37%
2024 Senior Notes(2)
10/8/2014
10/8/2024
$
250,000
249,612
4.21
249,427
4.21
2028 Senior Notes(3)
11/10/2023
11/10/2028
500,000
495,121
6.42
494,863
6.42
2030 Senior Notes(4)
6/15/2020
6/15/2030
400,000
397,162
3.28
397,050
3.28
2052 Senior Notes(5)
1/21/2022
2/1/2052
500,000
484,299
3.77
484,199
3.77
2051 Subordinated Notes(6)
6/30/2021
6/30/2051
450,000
444,988
4.13
444,941
4.13
Total debt obligations
$
3,046,182
$
2,965,480
(1)On March 28, 2024, the Company amended the Credit Facility to, among other things, increase the revolver commitments from $1.325 billion to $1.400 billion, with an accordion feature of $600.0 million, and extend the maturity date from March 2027 to March 2029. Ares Holdings is the borrower under the Credit Facility. The Credit Facility has a variable interest rate based on Secured Overnight Financing Rate (“SOFR”) or a base rate plus an applicable margin, which is subject to adjustment based on the achievement of certain environmental, social and governance (“ESG”)-related targets, with an unused commitment fee paid quarterly, which is subject to change with the Company’s underlying credit agency rating. As of March 31, 2024, base rate loans bear interest calculated based on the prime rate and the SOFR loans bear interest calculated based on SOFR plus 1.00%. The unused commitment fee is 0.10% per annum. There is a base rate and SOFR floor of zero. Due to the achievement of the ESG-related targets in the second quarter of 2023, the Company’s base rate and unused commitment fee have been reduced by 0.05% and 0.01%, respectively, from July 2023 through June 2024.
(2)The 2024 Senior Notes were issued in October 2014 by Ares Finance Co. LLC, an indirect subsidiary of the Company, at 98.27% of the face amount with interest paid semi-annually. The Company may redeem the 2024 Senior Notes prior to maturity, subject to the terms of the indenture governing the 2024 Senior Notes.
(3)The 2028 Senior Notes were issued in November 2023 by the Company, at 99.80% of the face amount with interest paid semi-annually. The Company may redeem the 2028 Senior Notes prior to maturity, subject to the terms of the indenture governing the 2028 Senior Notes.
(4)The 2030 Senior Notes were issued in June 2020 by Ares Finance Co. II LLC, an indirect subsidiary of the Company, at 99.77% of the face amount with interest paid semi-annually. The Company may redeem the 2030 Senior Notes prior to maturity, subject to the terms of the indenture governing the 2030 Senior Notes.
(5)The 2052 Senior Notes were issued in January 2022 by Ares Finance Co. IV LLC, an indirect subsidiary of the Company, at 97.78% of the face amount with interest paid semi-annually. The Company may redeem the 2052 Senior Notes prior to maturity, subject to the terms of the indenture governing the 2052 Senior Notes.
(6)The 2051 Subordinated Notes were issued in June 2021 by Ares Finance Co. III LLC, an indirect subsidiary of the Company with interest paid semi-annually at a fixed rate of 4.125%. Beginning June 30, 2026, the interest rate will reset on every fifth year based on the five-year U.S. Treasury Rate plus 3.237%. The Company may redeem the 2051 Subordinated Notes prior to maturity or defer interest payments up to five consecutive years, subject to the terms of the indenture governing the 2051 Subordinated Notes.
As of March 31, 2024, the Company and its subsidiaries were in compliance with all covenants under the debt obligations.
The Company typically incurs and pays debt issuance costs when entering into a new debt obligation or when amending an existing debt agreement. Debt issuance costs related to the 2024, 2028, 2030 and 2052 Senior Notes (the “Senior Notes”) and 2051 Subordinated Notes are recorded as a reduction of the corresponding debt obligation, and debt issuance costs related to the Credit Facility are included within other assets within the Condensed Consolidated Statements of Financial Condition. All debt issuance costs are amortized over the remaining term of the related obligation into interest expense within the Condensed Consolidated Statements of Operations.
The following table presents the activity of the Company’s debt issuance costs:
Credit Facility
Senior Notes
Subordinated Notes
Unamortized debt issuance costs as of December 31, 2023
$
4,213
$
11,784
$
5,059
Debt issuance costs incurred
1,784
—
—
Amortization of debt issuance costs
(329)
(410)
(46)
Unamortized debt issuance costs as of March 31, 2024
Notes to the Unaudited Condensed Consolidated Financial Statements (Continued)
(Dollars in Thousands, Except Share Data and As Otherwise Noted)
Loan Obligations of the Consolidated CLOs
Loan obligations of the Consolidated Funds that are CLOs (“Consolidated CLOs”) represent amounts due to holders of debt securities issued by the Consolidated CLOs. The Company measures the loan obligations of the Consolidated CLOs using the fair value of the financial assets of its Consolidated CLOs.
The following loan obligations were outstanding and classified as liabilities of the Consolidated CLOs:
As of March 31, 2024
As of December 31, 2023
Fair Value of Loan Obligations
Weighted Average Interest Rate
Weighted Average Remaining Maturity (in years)
Fair Value of Loan Obligations
Weighted Average Interest Rate
Weighted Average Remaining Maturity (in years)
Senior secured notes
$
11,162,856
6.66%
8.0
$
11,606,289
6.64%
8.2
Subordinated notes(1)
743,490
N/A
6.6
739,368
N/A
6.9
Total loan obligations of Consolidated CLOs
$
11,906,346
$
12,345,657
(1)The notes do not have contractual interest rates; instead, holders of the notes receive distributions from the excess cash flows generated by each Consolidated CLO.
Loan obligations of the Consolidated CLOs are collateralized by the assets held by the Consolidated CLOs, consisting of cash and cash equivalents, corporate loans, corporate bonds and other securities. The assets of one Consolidated CLO may not be used to satisfy the liabilities of another Consolidated CLO. Loan obligations of the Consolidated CLOs include floating rate notes, deferrable floating rate notes, revolving lines of credit and subordinated notes. Amounts borrowed under the notes are repaid based on available cash flows subject to priority of payments under each Consolidated CLO’s governing documents. Based on the terms of these facilities, the creditors of the facilities have no recourse to the Company.
Credit Facilities of the Consolidated Funds
Certain Consolidated Funds maintain credit facilities to fund investments between capital drawdowns. These facilities generally are collateralized by the unfunded capital commitments of the Consolidated Funds’ limited partners, bear an annual commitment fee based on unfunded commitments and contain various affirmative and negative covenants and reporting obligations, including restrictions on additional indebtedness, liens, margin stock, affiliate transactions, dividends and distributions, release of capital commitments and portfolio asset dispositions. The creditors of these facilities have no recourse to the Company and only have recourse to a subsidiary of the Company to the extent the debt is guaranteed by such subsidiary. As of March 31, 2024 and December 31, 2023, the Consolidated Funds were in compliance with all covenants under such credit facilities.
The Consolidated Funds had the following revolving bank credit facilities outstanding:
As of March 31, 2024
As of December 31, 2023
Maturity Date
Total Capacity
Outstanding Loan(1)
Effective Rate
Outstanding Loan(1)
Effective Rate
Credit Facilities:
7/1/2024
$
18,000
$
15,241
6.88%
$
15,241
6.88%
7/23/2024
125,000
63,000
8.29
110,000
8.29
9/24/2026
150,000
—
N/A
—
N/A
9/12/2027
54,000
—
N/A
—
N/A
Total borrowings of Consolidated Funds
$
78,241
$
125,241
(1)The fair values of the borrowings approximate the carrying value as the interest rate on the borrowings is a floating rate.
Notes to the Unaudited Condensed Consolidated Financial Statements (Continued)
(Dollars in Thousands, Except Share Data and As Otherwise Noted)
7. COMMITMENTS AND CONTINGENCIES
Indemnification Arrangements
Consistent with standard business practices in the normal course of business, the Company enters into contracts that contain indemnities for affiliates of the Company, persons acting on behalf of the Company or such affiliates and third parties. The terms of the indemnities vary from contract to contract and the Company’s maximum exposure under these arrangements cannot be determined and has not been recorded within the Condensed Consolidated Statements of Financial Condition. As of March 31, 2024, the Company has not had prior claims or losses pursuant to these contracts and expects the risk of loss to be remote.
Commitments
As of March 31, 2024 and December 31, 2023, the Company had aggregate unfunded commitments to invest in funds it manages or to support certain strategic initiatives of $986.3 million and $1,030.6 million, respectively.
Guarantees
The Company has entered into agreements with financial institutions to guarantee credit facilities held by certain funds. In the ordinary course of business, the guarantee of credit facilities held by funds may indicate control and result in consolidation of the fund. As of March 31, 2024 and December 31, 2023, the Company’s maximum exposure to losses from guarantees was $16.4 million and $122.3 million, respectively.
Contingent Liabilities
The Company acquired the investment management business and related operating entities collectively doing business as Crescent Point Capital (“Crescent Point”) (the “Crescent Point Acquisition”) during the fourth quarter of 2023. In connection with the Crescent Point Acquisition, the Company established a management incentive program (the “Crescent Point MIP”) with certain professionals. The Crescent Point MIP represents a contingent liability not to exceed $75.0 million and is based on the achievement of revenue targets from the fundraising of a future private equity fund during the measurement period.
The Company expects to settle the liability with a combination of 33% cash and 67% equity awards. Expense associated with the cash and equity components are recognized ratably over the measurement period, which represents the service period and will end on the final fundraising date for the fund. The Crescent Point MIP is remeasured each period with incremental changes in fair value included within compensation and benefits expense within the Condensed Consolidated Statements of Operations. Following the measurement period end date, the cash component will be paid and the equity component will be settled with shares of the Company’s Class A common stock and granted at fair value.
As of March 31, 2024 and December 31, 2023, the contingent liability was $75.0 million. As of March 31, 2024 and December 31, 2023, the Company has recorded $10.0 million and $5.0 million, respectively, within accrued compensation within the Condensed Consolidated Statements of Financial Condition. Compensation expense of $5.0 million for the three months ended March 31, 2024 is presented within compensation and benefits within the Condensed Consolidated Statements of Operations.
In connection with the acquisition of AMP Capital’s infrastructure debt platform (the “Infrastructure Debt Acquisition”) during the first quarter of 2022, the Company established a management incentive program (the “Infrastructure Debt MIP”) with certain professionals. The Infrastructure Debt MIP represents a contingent liability not to exceed $48.5 million and is based on the achievement of revenue targets from the fundraising of certain infrastructure debt funds during the measurement periods.
The Company expects to settle each portion of the liability with a combination of 15% cash and 85% equity awards. Expense associated with the cash components are recognized ratably over the respective measurement periods, which will end on the final fundraising date for each of the infrastructure debt funds included in the Infrastructure Debt MIP agreement. Expense associated with the equity component is recognized ratably over the service periods, which will continue for four years beyond each of the measurement period end dates. The Infrastructure Debt MIP is remeasured each period with incremental changes in value included within compensation and benefits expense within the Condensed Consolidated Statements of Operations. Following each of the measurement period end dates, the cash component will be paid and restricted units for the
Notes to the Unaudited Condensed Consolidated Financial Statements (Continued)
(Dollars in Thousands, Except Share Data and As Otherwise Noted)
portion of the Infrastructure Debt MIP award earned will be granted at fair value. The unpaid liability at the respective measurement period end dates will be reclassified from liability to additional paid-in-capital and any difference between the Infrastructure Debt MIP award earned at the respective measurement period end date and the previously recorded compensation expense will be recognized over the remaining four year service period as equity-based compensation expense.
The revenue target was achieved for one of the infrastructure debt funds during the fourth quarter of 2022 and the associated liability for this portion of the award was settled during the first quarter of 2023. As of March 31, 2024, the maximum contingent liability associated with the remaining Infrastructure Debt MIP was $15.0 million. As of March 31, 2024 and December 31, 2023, the contingent liability was $13.6 million. As of March 31, 2024 and December 31, 2023, the Company has recorded $4.9 million and $4.4 million, respectively, within accrued compensation within the Condensed Consolidated Statements of Financial Condition. Compensation expense associated with the remaining Infrastructure Debt MIP of $0.5 million and $0.6 million for the three months ended March 31, 2024 and 2023, respectively, is presented within compensation and benefits within the Condensed Consolidated Statements of Operations.
Carried Interest
Carried interest is affected by changes in the fair values of the underlying investments in the funds that are advised by the Company. Valuations, on an unrealized basis, can be significantly affected by a variety of external factors including, but not limited to, public equity market volatility, industry trading multiples and interest rates. Generally, if at the termination of a fund (and increasingly at interim points in the life of a fund), the fund has not achieved investment returns that (in most cases) exceed the preferred return threshold or (in all cases) the general partner receives net profits over the life of the fund in excess of its allocable share under the applicable partnership agreement, the Company will be obligated to repay carried interest that was received by the Company in excess of the amounts to which the Company is entitled. This contingent obligation is normally reduced by income taxes paid by the Company related to its carried interest.
Senior professionals of the Company who have received carried interest distributions are responsible for funding their proportionate share of any contingent repayment obligations. However, the governing agreements of certain of the Company’s funds provide that if a current or former professional does not fund his or her respective share for such fund, then the Company may have to fund additional amounts beyond what was received in carried interest, although the Company will generally retain the right to pursue any remedies under such governing agreements against those carried interest recipients who fail to fund their obligations.
Additionally, at the end of the life of the funds there could be a payment due to a fund by the Company if the Company has recognized more carried interest than was ultimately earned. The general partner obligation amount, if any, will depend on final realized values of investments at the end of the life of the fund.
As of March 31, 2024 and December 31, 2023, if the Company assumed all existing investments were worthless, the amount of carried interest subject to potential repayment, net of tax distributions, which may differ from the recognition of revenue, would have been approximately $77.7 million and $78.5 million, respectively, of which approximately $53.9 million and $54.5 million, respectively, is reimbursable to the Company by certain professionals who are the recipients of such carried interest. Management believes the possibility of all of the investments becoming worthless is remote. As of March 31, 2024 and December 31, 2023, if the funds were liquidated at their fair values, there would be no contingent repayment obligation or liability.
Litigation
From time to time, the Company is named as a defendant in legal actions relating to transactions conducted in the ordinary course of business. Although there can be no assurance of the outcome of such legal actions, in the opinion of management, the Company does not have a potential liability related to any current legal proceeding or claim that would individually or in the aggregate materially affect its results of operations, financial condition or cash flows.
Notes to the Unaudited Condensed Consolidated Financial Statements (Continued)
(Dollars in Thousands, Except Share Data and As Otherwise Noted)
Leases
The Company leases primarily consists of operating leases for office space and certain office equipment. The Company’s leases have remaining lease terms of one to 12 years. The tables below present certain supplemental quantitative disclosures regarding the Company’s operating leases:
Maturity of operating lease liabilities
As of March 31, 2024
2024
$
36,831
2025
51,927
2026
48,234
2027
37,498
2028
27,364
Thereafter
179,735
Total future payments
381,589
Less: interest
73,253
Total operating lease liabilities
$
308,336
Three months ended March 31,
Classification within general, administrative and other expenses
2024
2023
Operating lease expense
$
15,210
$
11,888
Three months ended March 31,
Supplemental information on the measurement of operating lease liabilities
2024
2023
Operating cash flows for operating leases
$
12,765
$
10,911
Leased assets obtained in exchange for new operating lease liabilities
705
12,047
As of March 31,
As of December 31,
Lease term and discount rate
2024
2023
Weighted-average remaining lease terms (in years)
8.4
8.4
Weighted-average discount rate
4.4%
4.3%
8. RELATED PARTY TRANSACTIONS
Substantially all of the Company’s revenue is earned from its affiliates. The related accounts receivable are included within due from affiliates within the Condensed Consolidated Statements of Financial Condition, except that accrued carried interest, which is predominantly due from affiliated funds, is presented separately within investments within the Condensed Consolidated Statements of Financial Condition.
The Company has investment management agreements with the Ares Funds that it manages. In accordance with these agreements, these Ares Funds may bear certain operating costs and expenses which are initially paid by the Company and subsequently reimbursed by the Ares Funds.
The Company is reimbursed for expenses incurred in providing administrative services to certain related parties, including publicly-traded and non-traded vehicles. In addition, certain private funds pay administrative fees based on invested capital. The Company is also party to agreements with certain funds which pay fees to the Company to provide various property-related services, such as acquisition, development and property management as well as fees for the sale and distribution of fund shares in non-traded vehicles.
Employees and other related parties may be permitted to participate in co-investment vehicles that generally invest in Ares Funds alongside fund investors. Participation is limited by law to individuals who qualify under applicable securities laws. These co-investment vehicles generally do not require these individuals to pay management fees, carried interest or incentive fees.
Notes to the Unaudited Condensed Consolidated Financial Statements (Continued)
(Dollars in Thousands, Except Share Data and As Otherwise Noted)
Carried interest and incentive fees from the funds can be distributed to professionals or their related entities on a current basis, subject, in the case of carried interest programs, to repayment by the subsidiary of the Company that acts as general partner of the relevant fund in the event that certain specified return thresholds are not ultimately achieved. The professionals have personally guaranteed, subject to certain limitations, the obligations of these subsidiaries in respect of this general partner obligation. Such guarantees are several, and not joint, and are limited to distributions received by the relevant recipient.
The Company considers its professionals and non-consolidated funds to be affiliates. Amounts due from and to affiliates were composed of the following:
As of March 31,
As of December 31,
2024
2023
Due from affiliates:
Management fees receivable from non-consolidated funds
$
589,231
$
560,629
Incentive fee receivable from non-consolidated funds
17,454
159,098
Payments made on behalf of and amounts due from non-consolidated funds and employees
202,588
177,019
Due from affiliates—Company
$
809,273
$
896,746
Amounts due from non-consolidated funds
$
15,924
$
14,151
Due from affiliates—Consolidated Funds
$
15,924
$
14,151
Due to affiliates:
Management fee received in advance and rebates payable to non-consolidated funds
$
11,006
$
9,585
Tax receivable agreement liability
236,135
191,299
Undistributed carried interest and incentive fees
110,672
33,374
Payments made by non-consolidated funds on behalf of and payable by the Company
5,495
5,996
Due to affiliates—Company
$
363,308
$
240,254
Amounts due to portfolio companies and non-consolidated funds
$
12,727
$
3,554
Due to affiliates—Consolidated Funds
$
12,727
$
3,554
Due from and Due to Ares Funds and Portfolio Companies
In the normal course of business, the Company pays certain expenses on behalf of Consolidated Funds and non-consolidated funds for which it is reimbursed. Conversely, Consolidated Funds and non-consolidated funds may pay certain expenses that are reimbursed by the Company. Certain expenses initially paid by the Company, primarily professional services, travel and other costs associated with particular portfolio company holdings, are subject to reimbursement by the portfolio companies.
9. INCOME TAXES
The Company’s income tax provision includes corporate income taxes and other entity level income taxes, as well as income taxes incurred by certain affiliated funds that are consolidated in these financial statements. The following table presents the income tax expense for the period:
Three months ended March 31,
2024
2023
Income tax expense
$
27,233
$
33,806
The Company’s effective income tax rate is dependent on many factors, including the estimated nature and amounts of income and expenses allocated to the non-controlling interests without being subject to federal, state and local income taxes at the corporate level. Additionally, the Company’s effective tax rate is influenced by the amount of income tax provision recorded for any affiliated funds and co-investment vehicles that are consolidated in the Company’s unaudited condensed consolidated financial statements. For the three months ended March 31, 2024 and 2023, the Company recorded its interim income tax provision utilizing the estimated annual effective tax rate.
The income tax effects of temporary differences give rise to significant portions of deferred tax assets and liabilities, which are presented on a net basis. As of March 31, 2024 and December 31, 2023, the Company recorded a net deferred tax
Notes to the Unaudited Condensed Consolidated Financial Statements (Continued)
(Dollars in Thousands, Except Share Data and As Otherwise Noted)
asset of $87.2 million and $21.5 million, respectively, within other assets within the Condensed Consolidated Statements of Financial Condition.
The Company files its tax returns as prescribed by the tax laws of the jurisdictions in which it operates. In the normal course of business, the Company is subject to examination by U.S. federal, state, local and foreign tax authorities. With limited exceptions, the Company is generally no longer subject to corporate income tax audits by taxing authorities for any years prior to 2020. Although the outcome of tax audits is always uncertain, the Company does not believe the outcome of any future audit will have a material adverse effect on the Company’s unaudited condensed consolidated financial statements.
10. EARNINGS PER SHARE
The Company has Class A and non-voting common stock outstanding. The non-voting common stock has the same economic rights as the Class A common stock; therefore, earnings per share is presented on a combined basis. Income of the Company has been allocated on a proportionate basis to the two common stock classes.
Basic earnings per share of Class A and non-voting common stock is computed by using the two-class method. Diluted earnings per share of Class A and non-voting common stock is computed using the more dilutive method of either the two-class method or the treasury stock method.
For the three months ended March 31, 2024 and 2023, the two-class method was the more dilutive method.
The following table presents the computation of basic and diluted earnings per common share:
Three months ended March 31,
2024
2023
Basic earnings per share of Class A and non-voting common stock:
Net income attributable to Ares Management Corporation Class A and non-voting common stockholders
$
73,027
$
94,039
Dividends declared and paid on Class A and non-voting common stock
(180,929)
(138,420)
Distributions on unvested restricted units
(7,272)
(5,314)
Dividends in excess of earnings available to Class A and non-voting common stockholders
$
(115,174)
$
(49,695)
Basic weighted-average shares of Class A and non-voting common stock
192,622,609
178,976,022
Dividends in excess of earnings per share of Class A and non-voting common stock
$
(0.60)
$
(0.28)
Dividend declared and paid per Class A and non-voting common stock
0.93
0.77
Basic earnings per share of Class A and non-voting common stock
$
0.33
$
0.49
Diluted earnings per share of Class A and non-voting common stock:
Net income attributable to Ares Management Corporation Class A and non-voting common stockholders
$
73,027
$
94,039
Distributions on unvested restricted units
(7,272)
(5,314)
Net income available to Class A and non-voting common stockholders
$
65,755
$
88,725
Effect of dilutive shares:
Restricted units
—
—
Options
—
—
Diluted weighted-average shares of Class A and non-voting common stock
192,622,609
178,976,022
Diluted earnings per share of Class A and non-voting common stock
Notes to the Unaudited Condensed Consolidated Financial Statements (Continued)
(Dollars in Thousands, Except Share Data and As Otherwise Noted)
11. EQUITY COMPENSATION
Equity Incentive Plan
Equity-based compensation is granted under the Company’s 2023 Equity Incentive Plan (the “Equity Incentive Plan”). The total number of shares available to be issued under the Equity Incentive Plan resets based on a formula defined in the Equity Incentive Plan and may increase on January 1 of each year. On January 1, 2024, the total number of shares available for issuance under the Equity Incentive Plan reset to 69,122,318 shares and as of March 31, 2024, 63,123,821 shares remained available for issuance.
Generally, unvested restricted units are forfeited upon termination of employment in accordance with the Equity Incentive Plan. The Company recognizes forfeitures as a reversal of previously recognized compensation expense in the period the forfeiture occurs.
Equity-based compensation expense, net of forfeitures, recorded by the Company for restricted units is presented in the following table:
Three months ended March 31,
2024
2023
Restricted units
$
92,422
$
69,252
Restricted Units
Each restricted unit represents an unfunded, unsecured right of the holder to receive a share of the Company’s Class A common stock on a specific date. The restricted units generally vest and are settled in shares of Class A common stock at a rate of either: (i) one-third per year, beginning on the third anniversary of the grant date; (ii) one-quarter per year, beginning on the second anniversary of the grant date or the holder’s employment commencement date; or (iii) one-third per year, beginning on the first anniversary of the grant date, in each case generally subject to the holder’s continued employment as of the applicable vesting date (subject to accelerated vesting upon certain qualifying terminations of employment or retirement eligibility provisions). Compensation expense associated with restricted units is recognized on a straight-line basis over the requisite service period of the award.
Restricted units are delivered net of the holder’s payroll related taxes upon vesting. For the three months ended March 31, 2024, 3.5 million restricted units vested and 1.9 million shares of Class A common stock were delivered to the holders. For the three months ended March 31, 2023, 3.3 million restricted units vested and 1.9 million shares of Class A common stock were delivered to the holders.
The holders of restricted units, other than awards that have not yet been issued as described in the subsequent sections, generally have the right to receive as current compensation an amount in cash equal to: (i) the amount of any dividend paid with respect to a share of Class A common stock multiplied by; and (ii) the number of restricted units held at the time such dividends are declared (“Dividend Equivalent”). When units are forfeited, the cumulative amount of Dividend Equivalents previously paid is reclassified to compensation and benefits expense within the Condensed Consolidated Statements of Operations.
The following table summarizes the Company’s dividends declared and Dividend Equivalents paid during the three months ended March 31, 2024:
Record Date
Dividends Per Share
Dividend Equivalents Paid
March 15, 2024
$
0.93
$
16,294
During the first quarter of 2024, the Company approved the future grant of restricted units to certain senior executives in each of 2025 and 2026, subject to the holder’s continued employment and acceleration in certain instances. These restricted awards vest before July 1, 2029, at a rate of either: (i) one-quarter per year, beginning on the first anniversary of the grant date; or (ii) one-third per year, beginning on the first anniversary of the grant date. Given that these future restricted units have been communicated to the recipient, the Company accounts for these awards as if they have been granted and recognizes the compensation expense on a straight-line basis over the service period. The restricted units that have been approved and communicated but not yet granted are not eligible to receive a Dividend Equivalent until the grant date.
Notes to the Unaudited Condensed Consolidated Financial Statements (Continued)
(Dollars in Thousands, Except Share Data and As Otherwise Noted)
The following table presents unvested restricted units’ activity:
Restricted Units
Weighted Average Grant Date Fair Value Per Unit
Balance as of December 31, 2023
17,359,829
$
59.20
Granted
4,581,087
121.09
Vested
(3,492,988)
51.99
Forfeited
(309,590)
85.96
Balance as of March 31, 2024
18,138,338
$
75.77
The total compensation expense expected to be recognized in all future periods associated with the restricted units is approximately $1,087.5 million as of March 31, 2024 and is expected to be recognized over the remaining weighted average period of 3.9 years.
Options
Upon exercise, each option entitles the holders to purchase from the Company one share of Class A common stock at the stated exercise price.
A summary of options activity during the three months ended March 31, 2024 is presented below:
Options
Weighted Average Exercise Price
Weighted Average Remaining Life (in years)
Aggregate Intrinsic Value
Balance as of December 31, 2023
79,524
$
19.00
0.3
$
7,946
Exercised
(79,524)
19.00
—
—
Balance as of March 31, 2024
—
$
—
0.0
$
—
Exercisable as of March 31, 2024
—
$
—
0.0
$
—
Net cash proceeds from exercises of stock options were $1.5 million for the three months ended March 31, 2024. The Company realized tax benefits of approximately $1.4 million from those exercises.
12. EQUITY AND REDEEMABLE INTEREST
Common Stock
The Company’s common stock consists of Class A, Class B, Class C and non-voting common stock, each $0.01 par value per share. The non-voting common stock has the same economic rights as the Class A common stock. Sumitomo Mitsui Banking Corporation (“SMBC”) is the sole holder of the non-voting common stock. The Class B common stock and Class C common stock are non-economic and holders are not entitled to dividends from the Company or to receive any assets of the Company in the event of any dissolution, liquidation or winding up of the Company. Ares Management GP LLC is the sole holder of the Class B common stock and Ares Voting LLC (“Ares Voting”) is the sole holder of the Class C common stock.
In January 2024, the Company's board of directors authorized the renewal of the stock repurchase program that allows for the repurchase of up to $150 million of shares of Class A common stock. Under the program, shares may be repurchased from time to time in open market purchases, privately negotiated transactions or otherwise, including in reliance on Rule 10b5-1 of the Securities Act. The program is scheduled to expire in March 2025. Repurchases under the program, if any, will depend on the prevailing market conditions and other factors. During the three months ended March 31, 2024 and 2023, the Company did not repurchase any shares as part of the stock repurchase program.
Notes to the Unaudited Condensed Consolidated Financial Statements (Continued)
(Dollars in Thousands, Except Share Data and As Otherwise Noted)
The following table presents the changes in each class of common stock:
Class A Common Stock
Non-Voting Common Stock
Class B Common Stock
Class C Common Stock
Total
Balance as of December 31, 2023
187,069,907
3,489,911
1,000
117,024,758
307,585,576
Issuance of common stock(1)
—
—
—
63,179
63,179
Exchanges of common stock
1,967,724
—
—
(1,967,724)
—
Stock option exercises
79,524
—
—
—
79,524
Vesting of restricted stock awards, net of shares withheld for tax
1,940,705
—
—
—
1,940,705
Balance as of March 31, 2024
191,057,860
3,489,911
1,000
115,120,213
309,668,984
(1) Issuances of Class C common stock corresponds with increases in Ares Owners Holdings L.P.’s ownership interest in the AOG entities.
The following table presents each partner’s Ares Operating Group Units (“AOG Units”) and corresponding ownership interest in each of the AOG entities, as well as its daily average ownership of AOG Units in each of the AOG entities:
Daily Average Ownership
As of March 31, 2024
As of December 31, 2023
Three months ended March 31,
AOG Units
Direct Ownership Interest
AOG Units
Direct Ownership Interest
2024
2023
Ares Management Corporation
194,547,771
62.82
%
190,559,818
61.95
%
62.32
%
60.14
%
Ares Owners Holdings, L.P.
115,120,213
37.18
117,024,758
38.05
37.68
39.86
Total
309,667,984
100.00
%
307,584,576
100.00
%
Redeemable Interest
The following table summarizes the activities associated with the redeemable interest in AOG entities:
Total
Balance as of December 31, 2022
$
93,129
Changes in ownership interests and related tax benefits
Notes to the Unaudited Condensed Consolidated Financial Statements (Continued)
(Dollars in Thousands, Except Share Data and As Otherwise Noted)
The following table summarizes the activities associated with the redeemable interest in Consolidated Funds:
Total
Balance as of December 31, 2022
$
1,013,282
Change in redemption value
10,504
Redemptions from Class A ordinary shares of Ares Acquisition Corporation (formerly NYSE: AAC) (“AAC I”)
(538,985)
Balance as of March 31, 2023
484,801
Gross proceeds from the initial public offering of Ares Acquisition Corporation II (NYSE: AACT) (“AAC II”)
500,000
Change in redemption value
15,948
Balance as of June 30, 2023
1,000,749
Change in redemption value
16,571
Redemptions from Class A ordinary shares of AAC I
(14,733)
Balance as of September 30, 2023
1,002,587
Change in redemption value
12,507
Redemptions from Class A ordinary shares of AAC I
(492,156)
Balance as of December 31, 2023
522,938
Change in redemption value
6,849
Balance as of March 31, 2024
$
529,787
As of March 31, 2024 and December 31, 2023, 50,000,000 of AAC II Class A ordinary shares are presented at the redemption amount within mezzanine equity within the Condensed Consolidated Statements of Financial Condition.
13. SEGMENT REPORTING
The Company operates through its distinct operating segments. On January 1, 2024, the Company changed its segment composition. The special opportunities strategy, historically part of the Private Equity Group, is now referred to as opportunistic credit and is presented within the Credit Group. The Company has modified historical results to conform with its current presentation. The Company operating segments are summarized below:
Credit Group: The Credit Group manages credit strategies across the liquid and illiquid spectrum, including liquid credit, alternative credit, opportunistic credit, direct lending and Asia-Pacific (“APAC”) credit.
Real Assets Group: The Real Assets Group manages comprehensive equity and debt strategies across real estate and infrastructure investments.
Private Equity Group: The Private Equity Group broadly categorizes its investment strategies as corporate private equity and APAC private equity.
Secondaries Group: The Secondaries Group invests in secondary markets across a range of alternative asset class strategies, including private equity, real estate, infrastructure and credit.
Other: Other represents a compilation of operating segments and strategic investments that seek to expand the Company’s reach and its scale in new and existing global markets but individually do not meet reporting thresholds. These results include activities from: (i) Ares Insurance Solutions (“AIS”), the Company’s insurance platform that provides solutions to insurance clients including asset management, capital solutions and corporate development; and (ii) the SPACs sponsored by the Company, among others.
The Operations Management Group (the “OMG”) consists of shared resource groups to support the Company’s operating segments by providing infrastructure and administrative support in the areas of accounting/finance, operations, information technology, legal, compliance, human resources, strategy, relationship management and distribution. The OMG includes Ares Wealth Management Solutions, LLC (“AWMS”) that facilitates the product development, distribution, marketing and client management activities for investment offerings in the global wealth management channel. Additionally, the OMG provides services to certain of the Company’s managed funds and vehicles, which reimburse the OMG for expenses either equal to the costs of services provided or as a percentage of invested capital. The OMG’s revenues and expenses are not allocated to the Company’s operating segments but the Company does consider the financial results of the OMG when evaluating its financial performance.
Notes to the Unaudited Condensed Consolidated Financial Statements (Continued)
(Dollars in Thousands, Except Share Data and As Otherwise Noted)
Segment Profit Measures: These measures supplement and should be considered in addition to, and not in lieu of, the Condensed Consolidated Statements of Operations prepared in accordance with GAAP.
Fee related earnings (“FRE”) is used to assess core operating performance by determining whether recurring revenue, primarily consisting of management fees and fee related performance revenues, is sufficient to cover operating expenses and to generate profits. FRE differs from income before taxes computed in accordance with GAAP as it excludes net performance income, investment income from Ares Funds and adjusts for certain other items that the Company believes are not indicative of its core operating performance. Fee related performance revenues, together with fee related performance compensation, is presented within FRE because it represents incentive fees from perpetual capital vehicles that is measured and eligible to be received on a recurring basis and not dependent on realization events from the underlying investments.
Realized income (“RI”) is an operating metric used by management to evaluate performance of the business based on operating performance and the contribution of each of the business segments to that performance, while removing the fluctuations of unrealized income and expenses, which may or may not be eventually realized at the levels presented and whose realizations depend more on future outcomes than current business operations. RI differs from income before taxes by excluding: (i) operating results of the Consolidated Funds; (ii) depreciation and amortization expense; (iii) the effects of changes arising from corporate actions; (iv) unrealized gains and losses related to carried interest, incentive fees and investment performance; and adjusts for certain other items that the Company believes are not indicative of operating performance. Changes arising from corporate actions include equity-based compensation expenses, the amortization of intangible assets, transaction costs associated with mergers, acquisitions and capital activities, underwriting costs and expenses incurred in connection with corporate reorganization. Placement fee adjustment represents the net portion of either expense deferral or amortization of upfront fees to placement agents that is presented to match the timing of expense recognition with the period over which management fees are expected to be earned from the associated fund for segment purposes but have been expensed in advance in accordance with GAAP. For periods in which the amortization of upfront fees for segment purposes is higher than the GAAP expense, the placement fee adjustment is presented as a reduction to RI. Management believes RI is a more appropriate metric to evaluate the Company’s current business operations.
Management makes operating decisions and assesses the performance of each of the Company’s business segments based on financial and operating metrics and other data that is presented before giving effect to the consolidation of any of the Consolidated Funds. Consequently, all segment data excludes the assets, liabilities and operating results related to the Consolidated Funds and non-consolidated funds. Total assets by segments is not disclosed because such information is not used by the Company’s chief operating decision maker in evaluating the segments.
Notes to the Unaudited Condensed Consolidated Financial Statements (Continued)
(Dollars in Thousands, Except Share Data and As Otherwise Noted)
The following table presents the components of the Company’s operating segments’ revenue, expenses and realized net investment income:
Three months ended March 31,
2024
2023
Segment revenues
Management fees
$
693,365
$
602,619
Fee related performance revenues
3,717
3,871
Other fees
15,543
16,055
Performance income—realized
23,181
31,136
Total segment revenues
$
735,806
$
653,681
Segment expenses
Compensation and benefits
$
205,858
$
193,064
General, administrative and other expenses
64,793
48,345
Performance related compensation—realized
13,156
23,859
Total segment expenses
$
283,807
$
265,268
Segment realized net investment expense
Investment loss—realized
$
(735)
$
(217)
Interest and other investment income —realized
15,568
17,673
Interest expense
(37,784)
(24,960)
Total segment realized net investment expense
$
(22,951)
$
(7,504)
The following table reconciles the Company’s consolidated revenues to segment revenue:
Three months ended March 31,
2024
2023
Total consolidated revenue
$
707,363
$
813,362
Performance (income) loss—unrealized
45,476
(127,713)
Management fees of Consolidated Funds eliminated in consolidation
12,453
11,601
Performance income of Consolidated Funds eliminated in consolidation
5,925
3,545
Administrative, transaction and other fees of Consolidated Funds eliminated in consolidation
113
4,843
Administrative fees(1)
(16,407)
(13,650)
OMG revenue
(4,333)
(4,640)
Principal investment income, net of eliminations
(7,050)
(22,758)
Net revenue of non-controlling interests in consolidated subsidiaries
(7,734)
(10,909)
Total consolidation adjustments and reconciling items
28,443
(159,681)
Total segment revenue
$
735,806
$
653,681
(1)Represents administrative fees from expense reimbursements that are presented within administrative, transaction and other fees within the Company’s Condensed Consolidated Statements of Operations and are netted against the respective expenses for segment reporting.
Notes to the Unaudited Condensed Consolidated Financial Statements (Continued)
(Dollars in Thousands, Except Share Data and As Otherwise Noted)
The following table reconciles the Company’s consolidated expenses to segment expenses:
Three months ended March 31,
2024
2023
Total consolidated expenses
$
538,493
$
628,636
Performance related compensation-unrealized
64,514
(85,150)
Expenses of Consolidated Funds added in consolidation
(17,708)
(19,641)
Expenses of Consolidated Funds eliminated in consolidation
12,995
12,132
Administrative fees(1)
(16,407)
(13,277)
OMG expenses
(144,637)
(131,139)
Acquisition and merger-related expense
(10,578)
(4,955)
Equity compensation expense
(92,422)
(69,077)
Acquisition-related compensation expense(2)
(5,504)
(642)
Placement fee adjustment
(5,540)
3,232
Depreciation and amortization expense
(36,644)
(45,659)
Expense of non-controlling interests in consolidated subsidiaries
(2,755)
(9,192)
Total consolidation adjustments and reconciling items
(254,686)
(363,368)
Total segment expenses
$
283,807
$
265,268
(1)Represents administrative fees from expense reimbursements that are presented within administrative, transaction and other fees within the Company’s Condensed Consolidated Statements of Operations and are netted against the respective expenses for segment reporting.
(2)Represents contingent obligations (“earnouts”) resulting from the Infrastructure Debt Acquisition and the Crescent Point Acquisition that are recorded as compensation expense and are presented within compensation and benefits within the Company’s Condensed Consolidated Statements of Operations.
The following table reconciles the Company’s consolidated other income to segment realized net investment income:
Three months ended March 31,
2024
2023
Total consolidated other income
$
62,178
$
56,396
Investment income—unrealized
(3,685)
(28,985)
Interest and other investment (income) loss—unrealized
(602)
208
Other income, net from Consolidated Funds added in consolidation
(79,977)
(62,917)
Other expense, net from Consolidated Funds eliminated in consolidation
902
(4,451)
OMG other (income) expense
(549)
651
Principal investment income (loss)
(2,666)
35,457
Other expense, net
131
91
Other (income) loss of non-controlling interests in consolidated subsidiaries
1,317
(3,954)
Total consolidation adjustments and reconciling items
Notes to the Unaudited Condensed Consolidated Financial Statements (Continued)
(Dollars in Thousands, Except Share Data and As Otherwise Noted)
The following table presents the reconciliation of income before taxes as reported in the Condensed Consolidated Statements of Operations to segment results of RI and FRE:
Three months ended March 31,
2024
2023
Income before taxes
$
231,048
$
241,122
Adjustments:
Depreciation and amortization expense
36,644
45,659
Equity compensation expense
92,421
68,704
Acquisition-related compensation expense(1)
5,504
642
Acquisition and merger-related expense
10,578
4,955
Placement fee adjustment
5,540
(3,232)
OMG expense, net
139,755
127,150
Other expense, net
131
91
Income before taxes of non-controlling interests in consolidated subsidiaries
(3,662)
(5,671)
Income before taxes of non-controlling interests in Consolidated Funds, net of eliminations
(65,586)
(27,171)
Total performance (income) loss—unrealized
45,476
(127,713)
Total performance related compensation—unrealized
(64,514)
85,150
Total investment income—unrealized
(4,287)
(28,777)
Realized income
429,048
380,909
Total performance income—realized
(23,181)
(31,136)
Total performance related compensation—realized
13,156
23,859
Total investment loss—realized
22,951
7,504
Fee related earnings
$
441,974
$
381,136
(1)Represents earnouts resulting from the Infrastructure Debt Acquisition and the Crescent Point Acquisition that are recorded as compensation expense and are presented within compensation and benefits within the Company’s Condensed Consolidated Statements of Operations.
Notes to the Unaudited Condensed Consolidated Financial Statements (Continued)
(Dollars in Thousands, Except Share Data and As Otherwise Noted)
14. CONSOLIDATION
Investments in Consolidated Variable Interest Entities
The Company consolidates entities in which the Company has a variable interest and as the general partner or investment manager, has both the power to direct the most significant activities and a potentially significant economic interest. Investments in the consolidated variable interest entities (“VIEs”) are reported at fair value and represent the Company’s maximum exposure to loss.
Investments in Non-Consolidated Variable Interest Entities
The Company holds interests in certain VIEs that are not consolidated as the Company is not the primary beneficiary. The Company’s interest in such entities generally is in the form of direct equity interests, fixed fee arrangements or both. The maximum exposure to loss represents the potential loss of assets by the Company relating to its direct investments in these non-consolidated entities. Investments in the non-consolidated VIEs are carried at fair value.
The Company’s interests in consolidated and non-consolidated VIEs, as presented within the Condensed Consolidated Statements of Financial Condition, its respective maximum exposure to loss relating to non-consolidated VIEs, and its net income attributable to non-controlling interests related to consolidated VIEs, as presented within the Condensed Consolidated Statements of Operations, are as follows:
As of March 31,
As of December 31,
2024
2023
Maximum exposure to loss attributable to the Company’s investment in non-consolidated VIEs(1)
$
399,885
$
503,376
Maximum exposure to loss attributable to the Company’s investment in consolidated VIEs(1)
908,198
910,600
Assets of consolidated VIEs
15,335,745
15,484,962
Liabilities of consolidated VIEs
13,058,395
13,409,257
(1)As of March 31, 2024 and December 31, 2023, the Company’s maximum exposure of loss for CLO securities was equal to the cumulative fair value of the Company’s capital interest in CLOs and totaled $83.2 million and $83.1 million, respectively.
Three months ended March 31,
2024
2023
Net income attributable to non-controlling interests related to consolidated VIEs
Notes to the Unaudited Condensed Consolidated Financial Statements (Continued)
(Dollars in Thousands, Except Share Data and As Otherwise Noted)
Consolidating Schedules
The following supplemental financial information illustrates the consolidating effects of the Consolidated Funds on the Company’s financial condition, results from operations and cash flows:
As of March 31, 2024
Consolidated Company Entities
Consolidated Funds
Eliminations
Consolidated
Assets
Cash and cash equivalents
$
346,331
$
—
$
—
$
346,331
Investments (includes $3,361,519 of accrued carried interest)
5,410,366
—
(925,482)
4,484,884
Due from affiliates
981,917
—
(172,644)
809,273
Other assets
519,292
—
—
519,292
Right-of-use operating lease assets
237,019
—
—
237,019
Intangible assets, net
1,030,076
—
—
1,030,076
Goodwill
1,130,085
—
—
1,130,085
Assets of Consolidated Funds
Cash and cash equivalents
—
1,199,376
—
1,199,376
Investments held in trust account
—
529,887
—
529,887
Investments, at fair value
—
13,790,030
—
13,790,030
Due from affiliates
—
27,358
(11,434)
15,924
Receivable for securities sold
—
243,998
—
243,998
Other assets
—
77,095
—
77,095
Total assets
$
9,655,086
$
15,867,744
$
(1,109,560)
$
24,413,270
Liabilities
Accounts payable, accrued expenses and other liabilities
$
273,985
$
—
$
(11,434)
$
262,551
Accrued compensation
217,788
—
—
217,788
Due to affiliates
363,308
—
—
363,308
Performance related compensation payable
2,449,732
—
—
2,449,732
Debt obligations
3,046,182
—
—
3,046,182
Operating lease liabilities
308,336
—
—
308,336
Liabilities of Consolidated Funds
Accounts payable, accrued expenses and other liabilities
—
189,556
—
189,556
Due to affiliates
—
185,371
(172,644)
12,727
Payable for securities purchased
—
548,032
—
548,032
CLO loan obligations, at fair value
—
12,020,005
(113,659)
11,906,346
Fund borrowings
—
78,241
—
78,241
Total liabilities
6,659,331
13,021,205
(297,737)
19,382,799
Commitments and contingencies
Redeemable interest in Consolidated Funds
—
529,787
—
529,787
Redeemable interest in Ares Operating Group entities
23,612
—
—
23,612
Non-controlling interest in Consolidated Funds
—
2,316,752
(801,450)
1,515,302
Non-controlling interest in Ares Operating Group entities
1,198,132
—
(3,856)
1,194,276
Stockholders’ Equity
Class A common stock, $0.01 par value, 1,500,000,000 shares authorized (191,057,860 shares issued and outstanding)
1,911
—
—
1,911
Non-voting common stock, $0.01 par value, 500,000,000 shares authorized (3,489,911 shares issued and outstanding)
35
—
—
35
Class B common stock, $0.01 par value, 1,000 shares authorized (1,000 shares issued and outstanding)
—
—
—
—
Class C common stock, $0.01 par value, 499,999,000 shares authorized (115,120,213 shares issued and outstanding)
1,151
—
—
1,151
Additional paid-in-capital
2,393,954
—
(6,517)
2,387,437
Accumulated deficit
(612,560)
—
—
(612,560)
Accumulated other comprehensive loss, net of tax
(10,480)
—
—
(10,480)
Total stockholders’ equity
1,774,011
—
(6,517)
1,767,494
Total equity
2,972,143
2,316,752
(811,823)
4,477,072
Total liabilities, redeemable interest, non-controlling interests and equity
Notes to the Unaudited Condensed Consolidated Financial Statements (Continued)
(Dollars in Thousands, Except Share Data and As Otherwise Noted)
15. SUBSEQUENT EVENTS
The Company evaluated all events or transactions that occurred after March 31, 2024 through the date the unaudited condensed consolidated financial statements were issued. During this period, the Company had the following material subsequent events that require disclosure:
In May 2024, the Company’s board of directors declared a quarterly dividend of $0.93 per share of Class A and non-voting common stock payable on June 28, 2024 to common stockholders of record at the close of business on June 14, 2024.
Item 2. Management’s Discussion and Analysis of Financial Condition and Results of Operations
Ares Management Corporation is a Delaware corporation. Unless the context otherwise requires, references to “Ares,” “we,” “us,” “our,” and the “Company” are intended to mean the business and operations of Ares Management Corporation and its consolidated subsidiaries. The following discussion analyzes the financial condition and results of operations of the Company. “Consolidated Funds” refers collectively to certain Ares funds, co-investment vehicles, CLOs and SPACs that are required under U.S. GAAP to be consolidated in our unaudited condensed consolidated financial statements included in this Quarterly Report on Form 10-Q. Additional terms used by the Company are defined in the Glossary and throughout the Management’s Discussion and Analysis in this Quarterly Report on Form 10-Q.
The following discussion and analysis should be read in conjunction with the unaudited condensed consolidated financial statements of Ares Management Corporation and the related notes included in this Quarterly Report on Form 10-Q and the audited financial statements and the related notes included in the 2023 Annual Report on Form 10-Kof Ares Management Corporation.
Amounts and percentages presented throughout our discussion and analysis of financial condition and results of operations may reflect rounded results in thousands (unless otherwise indicated) and consequently, totals may not appear to sum. In addition, illustrative charts may not be presented at scale.
Period-over-period analysis of current year compared to prior year may be deemed to be not meaningful and is designated as “NM” within the discussion and analysis of financial condition and results of operations.
Trends Affecting Our Business
We believe that our disciplined investment philosophy across our distinct but complementary investment groups contributes to the stability of our performance throughout market cycles. For the three months ended March 31, 2024, 95% of our management fees were derived from perpetual capital vehicles or long-dated funds. Our funds have a stable base of committed capital enabling us to invest in assets with a long-term focus over different points in a market cycle and to take advantage of market volatility. However, our results from operations, including the fair value of our AUM, are affected by a variety of factors. Conditions in the global financial markets and economic and political environments may impact our business, particularly in the U.S., Europe and Asia-Pacific.
The following table presents returns of selected market indices:
Returns (%)
Type of Index
Name of Index
Region
Three months ended March 31, 2024
High yield bonds
ICE BAML High Yield Master II Index
U.S.
1.5
High yield bonds
ICE BAML European Currency High Yield Index
Europe
1.7
Leveraged loans
Credit Suisse Leveraged Loan Index (“CSLLI”)
U.S.
2.5
Leveraged loans
Credit Suisse Western European Leveraged Loan Index
Europe
2.0
Equities
S&P 500 Index
U.S.
10.6
Equities
MSCI All Country World Ex-U.S. Index
Non-U.S.
4.7
Real estate equities
FTSE NAREIT All Equity REITs Index
U.S.
(2.3)
Real estate equities
FTSE EPRA/NAREIT Developed Europe Index
Europe
(3.5)
Global markets began the year positively amid modest inflation and optimistic signaling by central banks. Despite the headwinds and ongoing conflicts in the Middle East and Ukraine, U.S. and European high yield bonds and leveraged loans returned positive performance. The Asian-Pacific markets experienced mixed performance as the region overall continued to show growth primarily driven by resilient demand in Southeast Asia, India and Australia, while opportunities have been limited in China from uncertainty surrounding the economy. Overall, reduced lending activity by banks and limited capital accessibility continued to support private credit growth.
Global equity markets continued to rally into the first quarter of 2024 following a positive finish to 2023. While the public markets began the year positively, the private markets continued to experience challenges with downward pressure on valuations and muted opportunities for realizations. The private equity markets continue to experience a prolonged slowdown in deal activity and we believe potential liquidity constraints from investors have increased the need for flexible capital solutions. Businesses have struggled to navigate this challenging growth and uncertain macroeconomic environment, which we believe has heightened the need for partnerships with value-add managers. This environment underscores the importance of investing in
resilient industries where we have the ability to drive fundamental business growth and deliver a systematic approach to long-term value creation.
The commercial real estate markets continued to be impacted by the macroeconomic environment. European and U.S. real estate deal activity remained subdued with limited transactional liquidity. Given the higher interest rate environment, property valuations remain soft, though capitalization rate yields are beginning to stabilize following the sustained widening seen in 2023. We believe certain of these market trends will be offset by continued strong fundamentals, such as occupancy and rental rates, in property types that include multifamily and industrial.
The current market environment has had a more pronounced negative impact on certain industries, including energy, which is an industry in which few of our funds have made investments. As of March 31, 2024, 1% of our total AUM was invested in debt and equity investments in the energy sector (of which less than 1% of our total AUM was invested in midstream investments and also includes oil and gas exploration) and less than 1% of our total AUM was invested in renewable energy investments.
We believe our portfolios across all strategies are well positioned for a fluctuating interest rate environment. On a market value basis, approximately 85% of our debt assets and 56% of our total assets were floating rate instruments as of March 31, 2024.
We measure our business performance using certain operating metrics that are common to the alternative asset management industry, which are discussed below.
Assets Under Management
AUM refers to the assets we manage and is viewed as a metric to measure our investment and fundraising performance as it reflects assets generally at fair value plus available uncalled capital.
The tables below present rollforwards of our total AUM by segment ($ in millions):
Credit Group
Real Assets Group
Private Equity Group
Secondaries Group
Other Businesses
Total AUM
Balance at 12/31/2023
$
299,350
$
65,413
$
24,551
$
24,760
$
4,772
$
418,846
Acquisitions
—
—
—
—
71
71
Net new par/equity commitments
7,735
408
315
969
1,515
10,942
Net new debt commitments
6,112
—
—
—
—
6,112
Capital reductions
(1,485)
(128)
(2)
—
—
(1,615)
Distributions
(3,563)
(846)
(36)
(164)
(135)
(4,744)
Redemptions
(2,517)
(434)
(2)
—
—
(2,953)
Net allocations among investment strategies
715
—
(47)
—
(668)
—
Change in fund value
2,292
(309)
(303)
76
(76)
1,680
Balance at 3/31/2024
$
308,639
$
64,104
$
24,476
$
25,641
$
5,479
$
428,339
Credit Group
Real Assets Group
Private Equity Group
Secondaries Group
Other Businesses
Total AUM
Balance at 12/31/2022
$
239,299
$
66,061
$
21,029
$
21,961
$
3,647
$
351,997
Net new par/equity commitments
9,040
765
50
1,246
3,481
14,582
Net new debt commitments
1,423
—
—
—
—
1,423
Capital reductions
(2,081)
(403)
(3)
—
—
(2,487)
Distributions
(1,588)
(1,663)
(266)
(424)
(1,920)
(5,861)
Redemptions
(1,376)
(538)
—
—
(539)
(2,453)
Net allocations among investment strategies
816
—
—
—
(816)
—
Change in fund value
3,601
(108)
(154)
111
(356)
3,094
Balance at 3/31/2023
$
249,134
$
64,114
$
20,656
$
22,894
$
3,497
$
360,295
The components of our AUM are presented below ($ in billions):
AUM: $428.3
AUM: $360.3
FPAUM
Non-fee paying(1)
AUM not yet paying fees
(1) Includes $14.7 billion and $14.6 billion of AUM of funds from which we indirectly earn management fees as of March 31, 2024 and 2023, respectively, and includes $4.1 billion and $3.7 billion of non-fee paying AUM from our general partner and employee commitments as of March 31, 2024 and 2023, respectively.
Please refer to “— Results of Operations by Segment” for a more detailed presentation of AUM by segment for each of the periods presented.
Fee Paying Assets Under Management
FPAUM refers to AUM from which we directly earn management fees and is equal to the sum of all the individual fee bases of our funds that directly contribute to our management fees.
The tables below present rollforwards of our total FPAUM by segment ($ in millions):
Credit Group
Real Assets Group
Private Equity Group
Secondaries Group
Other Businesses
Total
Balance at 12/31/2023
$
185,280
$
41,338
$
13,124
$
19,040
$
3,575
$
262,357
Acquisitions
—
—
—
—
55
55
Commitments
3,778
296
—
900
1,321
6,295
Deployment/subscriptions/increase in leverage
7,221
862
—
61
—
8,144
Capital reductions
(2,764)
(12)
—
—
—
(2,776)
Distributions
(3,662)
(306)
—
(99)
(135)
(4,202)
Redemptions
(2,149)
(434)
(2)
—
—
(2,585)
Net allocations among investment strategies
886
—
—
—
(886)
—
Change in fund value
543
(404)
(19)
(2)
68
186
Change in fee basis
693
(504)
(538)
(9)
—
(358)
Balance at 3/31/2024
$
189,826
$
40,836
$
12,565
$
19,891
$
3,998
$
267,116
Credit Group
Real Assets Group
Private Equity Group
Secondaries Group
Other Businesses
Total
Balance at 12/31/2022
$
158,441
$
41,607
$
11,281
$
17,668
$
2,064
$
231,061
Commitments
1,081
596
—
107
2,372
4,156
Deployment/subscriptions/increase in leverage
4,984
221
—
110
—
5,315
Capital reductions
(1,533)
(279)
—
—
—
(1,812)
Distributions
(2,536)
(632)
—
(197)
(645)
(4,010)
Redemptions
(1,377)
(538)
—
—
—
(1,915)
Net allocations among investment strategies
816
—
—
—
(816)
—
Change in fund value
1,342
(47)
—
108
(240)
1,163
Change in fee basis
—
—
—
(49)
—
(49)
Balance at 3/31/2023
$
161,218
$
40,928
$
11,281
$
17,747
$
2,735
$
233,909
The charts below present FPAUM by its fee bases ($ in billions):
FPAUM: $267.1
FPAUM: $233.9
Invested capital/other(1)
Market value(2)
Collateral balances (at par)
Capital commitments
(1)Other consists of ACRE’s FPAUM, which is based on ACRE’s stockholders’ equity.
(2)Includes $60.3 billion and $55.3 billion from funds that primarily invest in illiquid strategies as of March 31, 2024 and 2023, respectively. The underlying investments held in these funds are generally subject to less market volatility than investments held in liquid strategies.
Please refer to “— Results of Operations by Segment” for detailed information by segment of the activity affecting total FPAUM for each of the periods presented.
Perpetual Capital Assets Under Management
The chart below presents our perpetual capital AUM by segment and type ($ in billions):
Management Fees By Type
We view the duration of funds we manage as a metric to measure the stability of our future management fees. For both the three months ended March 31, 2024 and 2023, 95% of management fees were earned from perpetual capital or long-dated funds. The charts below present the composition of our segment management fees by the initial fund duration:
Perpetual Capital - Publicly-Traded Vehicles
Perpetual Capital - Non-Traded Vehicles
Perpetual Capital - Managed Accounts
Perpetual Capital - Private Commingled Vehicles
Long-Dated Funds(1)
Other
(1) Long-dated funds generally have a contractual life of five years or more at inception.
Available Capital and Assets Under Management Not Yet Paying Fees
The charts below present our available capital and AUM not yet paying fees by segment ($ in billions):
Credit
Real Assets
Private Equity
Secondaries
Other Businesses
As of March 31, 2024, AUM Not Yet Paying Fees includes $64.6 billion of AUM available for future deployment that could generate approximately $621.5 million in potential incremental annual management fees. As of March 31, 2023, AUM Not Yet Paying Fees included $50.5 billion of AUM available for future deployment that could generate approximately $483.0 million in potential incremental annual management fees.
Incentive Eligible Assets Under Management and Incentive Generating Assets Under Management
The charts below present our IEAUM and IGAUM by segment ($ in billions):
As of March 31, 2024, perpetual capital IGAUM generating fee related performance revenues totaled $19.2 billion, composed of $18.2 billion within the Credit Group and $1.0 billion within the Secondaries Group. Fee related performance revenues are not recognized by us until such fees are crystallized and no longer subject to reversal. As of March 31, 2023, perpetual capital IGAUM from which we generated fee related performance revenues totaled $12.9 billion, composed of $12.6 billion within the Credit Group and $0.3 billion within the Secondaries Group.
Fund Performance Metrics
Fund performance information for our funds considered to be “significant funds” is included throughout this discussion with analysis to facilitate an understanding of our results of operations for the periods presented. Our significant funds are commingled funds that either contributed at least 1% of our total management fees or represented at least 1% of the Company’s total FPAUM for the past two consecutive quarters. In addition to management fees, each of our significant funds may generate carried interest or incentive fees upon the achievement of performance hurdles. The fund performance information reflected in this discussion and analysis is not indicative of our overall performance. An investment in Ares is not an investment in any of our funds. Past performance is not indicative of future results. As with any investment, there is always the potential for gains as well as the possibility of losses. There can be no assurance that any of these funds or our other existing and future funds will achieve similar returns.
Fund performance metrics for significant funds may be marked as “NM” as they may not be considered meaningful due to the limited time since the initial investment and/or early stage of capital deployment.
To further facilitate an understanding of the impact a significant fund may have on our results, we present our drawdown funds as either harvesting investments or deploying capital to indicate the fund’s stage in its life cycle. A fund harvesting investments is generally not seeking to deploy capital into new investment opportunities, while a fund deploying capital is generally seeking new investment opportunities.
Consolidation and Deconsolidation of Ares Funds
Consolidated Funds represented approximately 4% of our AUM as of March 31, 2024 and 1% of total revenues for the three months ended March 31, 2024. As of March 31, 2024, we consolidated 28 CLOs, 11 private funds and one SPAC, and as of March 31, 2023, we consolidated 25 CLOs, 10 private funds and one SPAC.
The activity of the Consolidated Funds is reflected within the unaudited condensed consolidated financial statement line items indicated by reference thereto. The impact of consolidation also typically will decrease management fees, carried interest allocation and incentive fees reported under GAAP to the extent these amounts are eliminated upon consolidation.
The assets and liabilities of our Consolidated Funds are held within separate legal entities and, as a result, the liabilities of our Consolidated Funds are typically non-recourse to us. Generally, the consolidation of our Consolidated Funds has a significant gross-up effect on our assets, liabilities and cash flows but has no net effect on the net income attributable to us or our stockholders’ equity, except where accounting for a redemption or liquidation preference requires the reallocation of ownership based on specific terms of a profit sharing agreement. The net economic ownership interests of our Consolidated Funds, to which we have no economic rights, are reflected as redeemable and non-controlling interests in the Consolidated Funds within our unaudited condensed consolidated financial statements. Redeemable interest in Consolidated Funds represent the shares issued by our SPACs that are redeemable for cash by the public shareholders in the event that the SPAC does not complete a business combination or tender offer associated with shareholder approval provisions.
We generally deconsolidate funds and CLOs when we are no longer deemed to have a controlling interest in the entity. During the three months ended March 31, 2024 and 2023, we did not deconsolidate any entities.
The performance of our Consolidated Funds is not necessarily consistent with, or representative of, the combined performance trends of all of our funds.
For the actual impact that consolidation had on our results and further discussion on consolidation and deconsolidation of funds, see “Note 14. Consolidation” within our unaudited condensed consolidated financial statements included herein.
Although the consolidated results presented below include the results of our operations together with those of the Consolidated Funds and other joint ventures, we separate our analysis of those items primarily impacting the Company from those of the Consolidated Funds.
The following table presents our summarized consolidated results of operations ($ in thousands):
Three months ended March 31,
Favorable (Unfavorable)
2024
2023
$ Change
% Change
Total revenues
$
707,363
$
813,362
$
(105,999)
(13)%
Total expenses
(538,493)
(628,636)
90,143
14
Total other income, net
62,178
56,396
5,782
10
Less: Income tax expense
27,233
33,806
6,573
19
Net income
203,815
207,316
(3,501)
(2)
Less: Net income attributable to non-controlling interests in Consolidated Funds
66,716
26,693
40,023
150
Net income attributable to Ares Operating Group entities
137,099
180,623
(43,524)
(24)
Less: Net income (loss) attributable to redeemable interest in Ares Operating Group entities
73
(1,824)
1,897
NM
Less: Net income attributable to non-controlling interests in Ares Operating Group entities
63,999
88,408
(24,409)
(28)
Net income attributable to Ares Management Corporation Class A and non-voting common stockholders
$
73,027
$
94,039
(21,012)
(22)
Three Months Ended March 31, 2024Compared to Three Months Ended March 31, 2023
Consolidated Results of Operations of the Company
The following discussion sets forth information regarding our consolidated results of operations:
Revenues
Three months ended March 31,
Favorable (Unfavorable)
2024
2023
$ Change
% Change
Revenues
Management fees
$
687,692
$
600,516
$
87,176
15%
Carried interest allocation
(32,478)
151,488
(183,966)
NM
Incentive fees
8,667
8,923
(256)
(3)
Principal investment income
7,050
22,758
(15,708)
(69)
Administrative, transaction and other fees
36,432
29,677
6,755
23
Total revenues
$
707,363
$
813,362
(105,999)
(13)
Management Fees. Capital deployment in direct lending, alternative credit and opportunistic credit funds within the Credit Group led to a rise in FPAUM and additional management fees of $54.8 million for the three months ended March 31, 2024 compared to the same period in 2023. Part I Fees contributed $22.8 million to the increase over the comparative periods. The increase in Part I Fees was primarily due to: (i) the increase in pre-incentive fee net investment income generated by ARCC and CADC, driven by an increase in the average size of their portfolios and the impact of rising interest rates, given their primarily floating-rate loan portfolios; and (ii) ASIF and AESIF that began generating Part I Fees after the first quarter of 2023. Within the Private Equity Group, funds that we manage as a result of the acquisition of the investment management business and related operating entities collectively doing business as Crescent Point Capital (“Crescent Point”) (the “Crescent Point Acquisition”), which was completed on October 2, 2023, generated $7.4 million in additional management fees for the three months ended March 31, 2024. For detail regarding the fluctuations of management fees within each of our segments see “—Results of Operations by Segment.”
Carried Interest Allocation. The activity was principally composed of the following ($ in millions):
Three months ended March 31, 2024
Primary Drivers
Three months ended March 31, 2023
Primary Drivers
Credit funds
$
219.6
Primarily from four direct lending funds, one alternative credit fund and three opportunistic credit funds with $35.8 billion of IGAUM generating returns in excess of their hurdle rates. Our direct lending funds have benefited from rising interest rates on predominately floating-rate loans. Ares Private Credit Solutions II, L.P. (“PCS II”), Ares Capital Europe V, L.P. (“ACE V”) and our sixth European direct lending fund generated carried interest allocation of $71.3 million, $39.7 million and $7.7 million, respectively, driven by net investment income on an increasing invested capital base. Ares Capital Europe IV, L.P. (“ACE IV”) generated carried interest allocation of $15.7 million driven by net investment income during the period. Within our alternative credit funds, Ares Pathfinder Fund, L.P. (“Pathfinder I”) generated carried interest allocation of $7.7 million driven by market appreciation of certain investments and net investment income during the period. In addition, within our opportunistic credit funds, Ares Special Opportunities Fund II, L.P. (“ASOF II”) generated carried interest allocation of $30.4 million, driven by improving operating performance of portfolio companies that operate in the retail and healthcare industries. Ares Special Situations Fund IV, L.P. (“SSF IV”) and Ares Special Opportunities Fund, L.P. (“ASOF I”) generated carried interest allocation of $29.8 million and $12.4 million, respectively, primarily due to market appreciation of their investments in Savers Value Village (“SVV”) driven by its higher stock price.
$
195.1
Primarily from two opportunistic credit funds, four direct lending funds and one alternative credit fund with $29.1 billion of IGAUM generating returns in excess of their hurdle rates. Appreciation across several portfolio company investments within opportunistic credit was primarily driven by improving operating performance metrics in companies that operate in the services and retail industries. SSF IV and ASOF I generated carried interest allocation of $53.1 million and $25.3 million, respectively. In addition, within our direct lending and alternative credit funds, ACE V generated carried interest allocation of $44.8 million driven by net investment income on an increasing invested capital base. ACE IV, PCS I, Ares Capital Europe III, L.P. (“ACE III”) and Pathfinder I generated carried interest allocation of $24.0 million, $14.6 million, $9.3 million and $3.4 million, respectively, primarily driven by net investment income during the period. Our direct lending and alternative credit funds have benefited from rising interest rates on predominately floating-rate loans.
Real assets funds
(6.9)
Reversal of unrealized carried interest of $10.8 million from two European real estate equity funds, $4.4 million from Ares European Real Estate Fund IV, L.P. (“EF IV”) and $3.0 million from Ares Real Estate Opportunity Fund III, L.P. (“AREOF III”), driven by lower valuations of certain office, hotel, retail and industrial properties. In addition, the reversal of unrealized carried interest of $1.6 million from Ares Climate Infrastructure Partners, L.P. (“ACIP”) was driven by lower valuations of certain investments. The reversal was partially offset by carried interest allocation of $12.8 million from Ares Infrastructure Debt Fund V, L.P. (“IDF V”), driven by net investment income during the period.
(12.8)
Reversal of unrealized carried interest of $16.5 million from three European real estate equity funds and $5.6 million from three U.S. real estate equity funds primarily driven by lower valuations of certain properties. In addition, reversal of unrealized carried interest of $7.8 million from Ares Energy Investors Fund V, L.P. (“EIF V”) was due to lower valuations of certain investments. Increased operating income and appreciation of certain properties generated carried interest allocation of $7.5 million from two U.S. real estate equity funds and $1.1 million from AREOF III. IDF V generated carried interest allocation of $6.4 million driven by net investment income during the period and ACIP generated carried interest allocation of $4.6 million driven by appreciation of certain investments.
Private equity funds
(236.4)
Reversal of unrealized carried interest allocation of $244.3 million from Ares Corporate Opportunities Fund V, L.P. (“ACOF V”) was driven by lower operating performance metrics of certain portfolio companies that primarily operate in the healthcare and energy industries. The reversal was partially offset by carried interest allocation generated from Ares Corporate Opportunities Fund VI, L.P. (“ACOF VI”) of $28.0 million, driven by appreciation across its investments in several portfolio companies that primarily operate in the services and retail industries and had positive operating performance during the period.
(30.2)
Reversal of unrealized carried interest allocation of $36.5 million from ACOF V was driven by lower operating performance metrics of certain portfolio companies that primarily operate in the healthcare industry. The reversal was partially offset by carried interest allocation of $10.1 million from ACOF VI, driven by appreciation across its investments in several portfolio companies that primarily operate in the services and retail industries.
Secondaries funds
(8.8)
Depreciation across several investments in Landmark Equity Partners XVI, L.P. (“LEP XVI”) and Landmark Equity Partners XVII, L.P. (“LEP XVII”), led to the reversal of unrealized carried interest of $4.5 million and $3.0 million, respectively.
(0.6)
Reversal of unrealized carried interest from LEP XVI driven by depreciation across several investments.
Incentive Fees. The activity was principally composed of the following ($ in millions):
Three months ended March 31, 2024
Primary Drivers
Three months ended March 31, 2023
Primary Drivers
Credit funds
$
2.0
Incentive fee generated from a U.S. direct lending fund following its liquidation and incentive fee adjustment from various U.S. and European direct lending funds following the measurement period.
$
1.1
Incentive fee adjustments from two U.S. direct lending funds and one European direct lending fund following the measurement period.
Real assets funds
3.7
Incentive fees generated from an open-ended industrial real estate fund.
4.5
Incentive fees generated from an open-ended industrial real estate fund.
Secondariesfunds
3.0
Incentive fees generated from APMF.
3.3
Incentive fees generated from APMF.
Incentive fees
$
8.7
$
8.9
Principal Investment Income. The activity for the three months ended March 31, 2024 was primarily composed of: (i) appreciation of our investments in certain funds in our opportunistic credit, U.S. and European direct lending and alternative credit strategies; (ii) dividend income from our investments in two European real estate funds; (iii) interest income earned in connection with our investment in an insurance fund, as new investors subsequently committed to the fund and were reallocated capital account balances from existing investors; and partially offset by (iv) unrealized losses from our investments in certain funds in our Asia-Pacific (“APAC”) credit, real estate secondaries and corporate private equity strategies.
The activity for the three months ended March 31, 2023 was primarily composed of appreciation of our investments in certain opportunistic credit and European direct lending funds and dividend income from various investments in funds within our opportunistic credit strategy.
Administrative, Transaction and Other Fees. The increase in administrative, transaction and other fees for the three months ended March 31, 2024 compared to the same period in 2023 was primarily driven by: (i) higher administrative fees of $4.3 million from a commercial finance fund during the second quarter of 2023 that were previously eliminated when this fund was consolidated into our results; (ii) higher administrative service fees of $4.4 million primarily from our non-traded vehicles; (iii) higher administrative service fees of $2.4 million that are based on invested capital and are primarily from certain private funds within our Credit Group; and partially offset by (iv) lower development fees of $2.0 million, resulting from a reduction in property-related activities within certain industrial U.S. real estate equity funds.
Expenses
Three months ended March 31,
Favorable (Unfavorable)
2024
2023
$ Change
% Change
Expenses
Compensation and benefits
$
412,951
$
360,781
$
(52,170)
(14)%
Performance related compensation
(50,532)
111,658
162,190
NM
General, administrative and other expenses
170,928
148,345
(22,583)
(15)
Expenses of Consolidated Funds
5,146
7,852
2,706
34
Total expenses
$
538,493
$
628,636
(90,143)
(14)
Compensation and Benefits. The increase in compensation and benefits was primarily driven by higher equity-based compensation expense of $23.2 million, which included expenses of $17.4 million and $10.0 million for the three months ended March 31, 2024 and 2023, respectively, in connection with the immediate vesting provisions of certain awards that occurs annually in the first quarter as a retirement benefit for eligible recipients. Further, the number of unvested restricted units being amortized has increased as has the value of these units with our rising stock price.
In addition, compensation and benefits increased due to: (i) an increase in salary expense of $13.7 million, primarily attributable to headcount growth to support the expansion of our business; (ii) higher Part I Fees compensation of $11.0 million; and (iii) an increase in payroll related taxes of $9.2 million, primarily due to our higher stock price associated with the restricted units that vested during the period. The increase in compensation and benefits for the three months ended March 31, 2024 compared to the same period in 2023 was partially offset by lower incentive-based compensation, which is dependent on our operating performance and is expected to fluctuate during the year. Average headcount increased by 12% to 2,868 professionals for the quarter-to-date period in 2024 from 2,558 professionals for the same period in 2023.
For detail regarding the fluctuations of compensation and benefits within each of our segments see “—Results of Operations by Segment.”
Performance Related Compensation. Changes in performance related compensation are directly associated with the changes in carried interest allocation and incentive fees described above and include associated payroll related taxes as well as carried interest and incentive fees allocated to charitable organizations as part of our philanthropic initiatives. Performance related compensation generally represents 60% to 80% of carried interest allocation and incentive fees recognized before giving effect to payroll taxes and will vary based on the mix of funds generating carried interest allocation and incentive fees for that period.
General, Administrative and Other Expenses. The increase in general, administrative and other expenses was primarily due to costs incurred to support fundraising for our funds and distribution of shares in our non-traded vehicles. Placement fees increased by $8.7 million for the three months ended March 31, 2024 compared to the same period in 2023 primarily due to new commitments to our third U.S. senior direct lending fund. Additionally, supplemental distribution fees were $10.8 million and increased by $8.4 million for the three months ended March 31, 2024 when compared to the same period in 2023. These fees will fluctuate with sales volumes and assets under management of our non-traded vehicles and we expect to incur higher supplemental distribution fees in future periods as we continue to develop our distribution relationships and expand our retail product offerings.
Additionally, certain expenses increased during the current period, including occupancy costs, information services and information technology costs. These expenses collectively increased by $10.2 million for the three months ended March 31, 2024 compared to the same period in 2023 to support our growing headcount and the expansion of our business, including occupancy costs for our new corporate headquarters that will be in use later this year.
The increase in general, administrative and other expenses was partially offset by the decrease in amortization expense for intangible assets. For the three months ended March 31, 2023, our results reflected a non-cash impairment charge of $7.8 million to the carrying value of the trade name of SSG Capital Holdings Limited and its operating subsidiaries (“SSG”) as we rebranded and discontinued the use of the SSG trade name. In addition, in the third quarter of 2023, we recognized non-cash impairment charges of $65.7 million to the fair value of certain client relationships from Landmark in connection with lower expected FPAUM in a private equity secondaries fund from existing investors. Excluding the impact non-cash impairment charges described above had on future amortization expense, amortization expense decreased by $3.4 million for the three months ended March 31, 2024 compared to the same period in 2023, as we are no longer amortizing the aforementioned intangible assets.
Other Income (Expense)
Three months ended March 31,
Favorable (Unfavorable)
2024
2023
$ Change
% Change
Other income (expense)
Net realized and unrealized gains on investments
$
10,516
$
1,515
$
9,001
NM
Interest and dividend income
5,382
3,839
1,543
40
Interest expense
(37,824)
(24,986)
(12,838)
(51)
Other income (expense), net
270
(923)
1,193
NM
Net realized and unrealized gains on investments of Consolidated Funds
34,424
10,700
23,724
222
Interest and other income of Consolidated Funds
257,276
222,938
34,338
15
Interest expense of Consolidated Funds
(207,866)
(156,687)
(51,179)
(33)
Total other income, net
$
62,178
$
56,396
5,782
10
Net Realized and Unrealized Gains on Investments. The activity for the three months ended March 31, 2024 included: (i) unrealized gains from the appreciation of our investments in APMF and in the subordinated notes of U.S. CLOs, as well as of our strategic investments in a U.S. energy company and in a company that manages real estate owned properties; and partially offset by (ii) unrealized losses from our strategic investment in a non-core insurance related investment and a company that manages portfolios of non-performing loans.
The activity for the three months ended March 31, 2023 was primarily attributable to: (i) unrealized gains from the appreciation of our investments in APMF and the same strategic investment in a company that manages real estate owned properties; and partially offset by (ii) unrealized losses from our investments in the subordinated notes of U.S. CLOs.
Interest Expense. Interest expense increased for the three months ended March 31, 2024 compared to the same period in 2023 primarily due to the issuance of the 2028 Senior Notes in November 2023 that increased interest expense by $8.2 million. In addition, higher average SOFR rates and a higher average outstanding balance of the Credit Facility also contributed to the increase over the comparative periods.
Other Income (Expense), Net. The activity for the three months ended March 31, 2024 and 2023 primarily included transaction gains (losses) associated with currency fluctuations impacting the revaluation of assets and liabilities denominated in foreign currencies other than an entity’s functional currency.
Income Tax Expense
Three months ended March 31,
Favorable (Unfavorable)
2024
2023
$ Change
% Change
Income before taxes
$
231,048
$
241,122
$
(10,074)
(4)%
Less: Income tax expense
27,233
33,806
6,573
19
Net income
$
203,815
$
207,316
(3,501)
(2)
The decrease in income tax expense was attributable to lower pre-tax income allocable to AMC for the three months ended March 31, 2024 compared to the same period in 2023as the income attributed to redeemable and non-controlling interests is generally passed through to partners and not subject to corporate income taxes. The calculation of income taxes is also sensitive to any changes in weighted average daily ownership.
The following table summarizes weighted average daily ownership:
Three months ended March 31,
2024
2023
AMC common stockholders
62.32
%
60.14
%
Non-controlling AOG unitholders
37.68
39.86
The change in ownership was primarily driven by the exchanges of AOG Units, issuance of Class A common stock in connection with stock option exercises, vesting of restricted stock awards and the Crescent Point Acquisition.
Redeemable and Non-Controlling Interests
Three months ended March 31,
Favorable (Unfavorable)
2024
2023
$ Change
% Change
Net income
$
203,815
$
207,316
$
(3,501)
(2)%
Less: Net income attributable to non-controlling interests in Consolidated Funds
66,716
26,693
40,023
150
Net income attributable to Ares Operating Group entities
137,099
180,623
(43,524)
(24)
Less: Net income (loss) attributable to redeemable interest in Ares Operating Group entities
73
(1,824)
1,897
NM
Less: Net income attributable to non-controlling interests in Ares Operating Group entities
63,999
88,408
(24,409)
(28)
Net income attributable to Ares Management Corporation Class A and non-voting common stockholders
$
73,027
$
94,039
(21,012)
(22)
The change in net income attributable to non-controlling interests in AOG entities over the comparative periods was a result of the respective changes in income before taxes and weighted average daily ownership, as presented above.
Consolidated Results of Operations of the Consolidated Funds
The following table presents the results of operations of the Consolidated Funds ($ in thousands):
Three months ended March 31,
Favorable (Unfavorable)
2024
2023
$ Change
% Change
Expenses of the Consolidated Funds
$
(5,146)
$
(7,852)
$
2,706
34%
Net realized and unrealized gains on investments of Consolidated Funds
34,424
10,700
23,724
222
Interest and other income of Consolidated Funds
257,276
222,938
34,338
15
Interest expense of Consolidated Funds
(207,866)
(156,687)
(51,179)
(33)
Income before taxes
78,688
69,099
9,589
14
Less: Income tax expense (benefit) of Consolidated Funds
(1,130)
478
1,608
NM
Net income
79,818
68,621
11,197
16
Less: Revenues attributable to Ares Management Corporation eliminated upon consolidation
8,776
32,688
(23,912)
(73)
Other income, net attributable to Ares Management Corporation eliminated upon consolidation
(4,759)
(9,583)
(4,824)
(50)
General, administrative and other expense attributable to Ares Management Corporation eliminated upon consolidation
433
343
(90)
(26)
Net income attributable to non-controlling interests in Consolidated Funds
$
66,716
$
26,693
40,023
150
The results of operations of the Consolidated Funds primarily represent activities from certain funds that we are deemed to control. When a fund is consolidated, we reflect the revenues and expenses of the entity on a gross basis, subject to eliminations from consolidation. Substantially all of our results of operations related to the Consolidated Funds are attributable to ownership interests that third parties hold in those funds. The Consolidated Funds are not necessarily the same funds in each year presented due to changes in ownership, changes in limited partners’ or investor rights, and the creation or termination of funds and entities. Accordingly, such amounts may not be comparable for the periods presented, and in any event have no material impact on net income attributable to Ares Management Corporation.
For segment reporting purposes, revenues and expenses are presented before giving effect to the results of our Consolidated Funds and the results attributable to non-controlling interests of joint ventures that we consolidate. As a result, segment revenues from management fees, fee related performance revenues, performance income and investment income are different than those presented on a consolidated basis in accordance with GAAP. Revenues recognized from Consolidated Funds are eliminated in consolidation and those attributable to the non-controlling interests of joint ventures have been excluded by us. Furthermore, expenses and the effects of other income (expense) are different than related amounts presented on a consolidated basis in accordance with GAAP due to the exclusion of the results of Consolidated Funds and the non-controlling interests of joint ventures.
Non-GAAP Financial Measures
We use the following non-GAAP measures to make operating decisions, assess performance and allocate resources:
•Fee Related Earnings (“FRE”)
•Realized Income (“RI”)
These non-GAAP financial measures supplement and should be considered in addition to and not in lieu of, the results of operations, which are discussed further under “—Components of Consolidated Results of Operations” and are prepared in accordance with GAAP.We operate through our distinct operating segments. In February 2024, we announced our intention to reclassify our special opportunities strategy, historically part of our Private Equity Group, to the Credit Group and renamed as opportunistic credit. Opportunistic credit has been reclassified effective January 1, 2024 and is now presented within the Credit Group. Historical periods have been modified to conform to the current period presentation.
The following table sets forth FRE and RI by reportable segment and the OMG ($ in thousands):
Income before provision for income taxes is the GAAP financial measure most comparable to RI and FRE. The following table presents the reconciliation of income before taxes as reported within the Condensed Consolidated Statements of Operations to RI and FRE of the reportable segments and the OMG ($ in thousands):
Three months ended March 31,
2024
2023
Income before taxes
$
231,048
$
241,122
Adjustments:
Depreciation and amortization expense
36,644
45,659
Equity compensation expense
92,421
68,704
Acquisition-related compensation expense(1)
5,504
642
Acquisition and merger-related expense
10,578
4,955
Placement fee adjustment
5,540
(3,232)
Other expense, net
131
91
Income before taxes of non-controlling interests in consolidated subsidiaries
(3,662)
(5,671)
Income before taxes of non-controlling interests in Consolidated Funds, net of eliminations
(65,586)
(27,171)
Total performance (income) loss—unrealized
45,476
(127,713)
Total performance related compensation—unrealized
(64,514)
85,150
Total net investment income—unrealized
(4,424)
(28,244)
Realized Income
289,156
254,292
Total performance income—realized
(23,181)
(31,136)
Total performance related compensation—realized
13,156
23,859
Total investment loss—realized
22,539
7,622
Fee Related Earnings
$
301,670
$
254,637
(1)Represents earnouts in connection with the acquisition of AMP Capital’s infrastructure debt platform (“Infrastructure Debt Acquisition”) and the Crescent Point Acquisition that are recorded as compensation expense and are presented within compensation and benefits within the Company’s Condensed Consolidated Statements of Operations.
For the specific components and calculations of these non-GAAP measures, as well as additional reconciliations to the most comparable measures in accordance with GAAP, see “Note 13. Segment Reporting” within our unaudited condensed consolidated financial statements included in this Quarterly Report on Form 10-Q. Discussed below are our results of operations for our reportable segments and the OMG.
Credit Group—Three Months Ended March 31, 2024Compared to Three Months Ended March 31, 2023
Fee Related Earnings
The following table presents the components of the Credit Group’s FRE ($ in thousands):
Three months ended March 31,
Favorable (Unfavorable)
2024
2023
$ Change
% Change
Management fees
$
510,966
$
430,467
$
80,499
19%
Fee related performance revenues
755
600
155
26
Other fees
9,911
9,149
762
8
Compensation and benefits
(134,849)
(121,900)
(12,949)
(11)
General, administrative and other expenses
(34,366)
(26,676)
(7,690)
(29)
Fee Related Earnings
$
352,417
$
291,640
60,777
21
Management Fees. The chart below presents Credit Group management fees and effective management fee rates ($ in millions):
Management fees from funds launched subsequent to the first quarter of 2023 primarily included Ares Pathfinder Fund II, L.P. (“Pathfinder II”), our third U.S. senior direct lending fund and our sixth European direct lending fund, which collectively contributed $16.9 million in additional management fees for the three months ended March 31, 2024.
Management fees from existing funds increased primarily from the deployment of capital in Pathfinder I, Ares Senior Direct Lending Fund II, L.P. (“SDL II”), ASOF II and an open-ended core alternative credit fund. These funds collectively generated additional management fees of $18.3 million for the three months ended March 31, 2024 compared to the same period in 2023. The remaining increase in management fees from funds in existence in both periods was primarily driven by
deployment of capital in other direct lending funds and separately managed accounts (“SMAs”). Management fees from ARCC, ASIF and CADC, excluding Part I Fees described below, increased by $16.4 million over the comparative periods primarily due to an increase in the average size of ARCC’s and CADC’s portfolio and additional capital raised in ASIF. Conversely, management fees from ACE III decreased by $4.1 million over the comparative periods due to a reduction in fee rate. Management fees from CLOs also increased for the three months ended March 31, 2024 compared to the same period in 2023 primarily due to the net addition of five CLOs for the three months ended March 31, 2024.
Part I Fees increased for the three months ended March 31, 2024 compared to the three months ended March 31, 2023 primarily due to an increase in pre-incentive fee net investment income generated by ARCC and CADC, driven by an increase in the average size of their portfolios and by the impact of rising interest rates, given their primarily floating-rate loan portfolios. Additionally, ASIF and AESIF contributed $6.0 million and $0.9 million, respectively, to the increase in Part I Fees as both funds began generating Part I Fees after the first quarter of 2023.
The increase in effective management fee rate for the three months ended March 31, 2024 compared to the three months ended March 31, 2023 was primarily driven by the increase in Part I Fees’ contribution to the effective management fee rate.
Other Fees. The increase in other fees for the three months ended March 31, 2024 compared to the three months ended March 31, 2023 was primarily driven by higher administrative service fees of $2.4 million, which were earned from certain private funds that pay on invested capital. The increase in other fees was partially offset by a decrease of $1.6 million in transaction fees primarily due to lower loan origination income from a U.S. direct lending fund, driven by limited capacity of investable capital from certain investors.
Compensation and Benefits. The increase in compensation and benefits for the three months ended March 31, 2024 compared to the three months ended March 31, 2023 was primarily driven by: (i) higher Part I Fees compensation of $11.0 million, corresponding to the increase in revenue; (ii) an increase in salary expense of $3.8 million, primarily attributable to headcount growth to support the expansion of our business; and (iii) an increase in payroll related taxes of $3.7 million, primarily due to our higher stock price associated with the restricted units that vested during the period. The increase in compensation and benefits over the comparative periods was partially offset by lower incentive-based compensation, which is dependent on our operating performance and is expected to fluctuate during the year.
Average headcount increased by 12% to 650 investment and investment support professionals for the quarter-to-date period in 2024 from 579 professionals for the same period in 2023 as we continued to add professionals, primarily to support our growing direct lending and APAC credit platforms.
General, Administrative and Other Expenses. In the effort to develop our distribution relationships and expand our retail product offerings, supplemental distribution fees increased by $3.7 million for the three months ended March 31, 2024 compared to the same period in 2023. Supplemental distribution fees fluctuate with sales volumes and managed assets of our non-traded vehicles.
Additionally, certain expenses increased during the current period, including occupancy costs and information technology costs. These expenses collectively increased by $1.7 million for the three months ended March 31, 2024 compared to the same period in 2023 to support our growing headcount and the expansion of our business, including occupancy costs for our new corporate headquarters that will be in use later this year. We also incurred higher professional service fees of $1.3 million for the three months ended March 31, 2024 compared to the same period in 2023, primarily related to non-reimbursable fund formation costs.
The following table presents the components of the Credit Group’s RI ($ in thousands):
Three months ended March 31,
Favorable (Unfavorable)
2024
2023
$ Change
% Change
Fee Related Earnings
$
352,417
$
291,640
$
60,777
21%
Performance income—realized
16,766
7,410
9,356
126
Performance related compensation—realized
(8,734)
(5,881)
(2,853)
(49)
Realized net performance income
8,032
1,529
6,503
NM
Investment income (loss)—realized
(398)
506
(904)
NM
Interest and other investment income—realized
4,930
8,113
(3,183)
(39)
Interest expense
(9,013)
(8,630)
(383)
(4)
Realized net investment loss
(4,481)
(11)
(4,470)
NM
Realized Income
$
355,968
$
293,158
62,810
21
Realized net performance income for the three months ended March 31, 2024 primarily included (i) tax distributions from Ares Private Credit Solutions, L.P. (“PCS I”) and an alternative credit fund; and (ii) incentive fees primarily from two U.S. direct lending funds and an alternative credit fund. Realized net performance income for the three months ended March 31, 2023 was primarily attributable to carried interest distributions from a U.S. direct lending fund and a European direct lending fund.
Realized net investment loss for the three months ended March 31, 2024 and 2023 largely represents interest expense exceeding investment income during these periods. The activity for both periods included interest income generated from our CLO investments, which we earned a similar level of income from 14 and 15 CLO investments for the three months ended March 31, 2024 and 2023, respectively. The activity for the three months ended March 31, 2023 also included income recognized in connection with distributions from our investment in a commercial finance fund that was sold during the second quarter of 2023.
Interest expense, which is allocated among our segments based on the cost basis of our balance sheet investments, increased over the comparative periods primarily due to the issuance of the 2028 Senior Notes in November 2023 and to higher average SOFR rates and a higher average outstanding balance of our Credit Facility.
The following table presents the accrued carried interest, also referred to as accrued performance income, and related performance compensation for the Credit Group. Accrued net performance income excludes net performance income that has been realized but not yet received as of the reporting date ($ in thousands):
As of March 31, 2024
As of December 31, 2023
Accrued Performance Income
Accrued Performance Compensation
Accrued Net Performance Income
Accrued Performance Income
Accrued Performance Compensation
Accrued Net Performance Income
Pathfinder I
$
162,875
$
138,444
$
24,431
$
155,136
$
131,866
$
23,270
ASOF I
369,420
258,891
110,529
357,016
250,198
106,818
ASOF II
111,339
77,937
33,402
80,926
56,648
24,278
PCS I
126,161
74,549
51,612
123,979
73,258
50,721
PCS II
110,672
65,346
45,326
38,128
22,573
15,555
ACE IV
165,299
107,327
57,972
149,584
97,123
52,461
ACE V
271,905
171,187
100,718
232,201
146,219
85,982
Other credit funds
438,334
283,083
155,251
414,318
263,581
150,737
Total Credit Group
$
1,756,005
$
1,176,764
$
579,241
$
1,551,288
$
1,041,466
$
509,822
The following table presents the change in accrued performance income for the Credit Group ($ in thousands):
The tables below present rollforwards of AUM for the Credit Group ($ in millions):
Liquid Credit
Alternative Credit
Opportunistic Credit
U.S. Direct Lending
European Direct Lending
APAC Credit
Other(1)
Total Credit Group
Balance at 12/31/2023
$
47,299
$
33,886
$
14,554
$
123,073
$
68,264
$
11,920
$
354
$
299,350
Net new par/equity commitments
695
1,828
—
2,462
2,692
—
58
7,735
Net new debt commitments
994
—
—
4,836
662
(380)
—
6,112
Capital reductions
(1,134)
—
—
(553)
51
151
—
(1,485)
Distributions
(45)
(438)
(289)
(1,487)
(1,199)
(105)
—
(3,563)
Redemptions
(1,695)
—
—
(720)
(102)
—
—
(2,517)
Net allocations among investment strategies
—
668
—
—
150
—
(103)
715
Change in fund value
133
537
291
1,570
(317)
77
1
2,292
Balance at 3/31/2024
$
46,247
$
36,481
$
14,556
$
129,181
$
70,201
$
11,663
$
310
$
308,639
Liquid Credit
Alternative Credit
Opportunistic Credit
U.S. Direct Lending
European Direct Lending
APAC Credit
Other(1)
Total Credit Group
Balance at 12/31/2022
$
43,864
$
21,363
$
13,720
$
98,327
$
50,642
$
11,383
$
—
$
239,299
Net new par/equity commitments
401
2,289
—
1,776
4,324
—
250
9,040
Net new debt commitments
466
—
—
740
217
—
—
1,423
Capital reductions
(62)
—
—
(838)
(1,181)
—
—
(2,081)
Distributions
(143)
(248)
(61)
(704)
(397)
(35)
—
(1,588)
Redemptions
(545)
(739)
—
(92)
—
—
—
(1,376)
Net allocations among investment strategies
4
812
—
—
—
—
—
816
Change in fund value
511
340
332
1,003
1,429
(14)
—
3,601
Balance at 3/31/2023
$
44,496
$
23,817
$
13,991
$
100,212
$
55,034
$
11,334
$
250
$
249,134
(1) Activity within Other represents equity commitments to the platform that either have not yet been allocated to an investment strategy or have been allocated in a subsequent period as commitments to an investment strategy.
The components of our AUM for the Credit Group are presented below ($ in billions):
AUM: $308.6
AUM: $249.1
FPAUM
AUM not yet paying fees
Non-fee paying(1)
(1) Includes $14.7 billion and $14.6 billion of AUM of funds from which we indirectly earn management fees as of March 31, 2024 and 2023, respectively, and includes $1.7 billion and $1.6 billion of non-fee paying AUM from our general partner and employee commitments as of March 31, 2024 and 2023, respectively.
The tables below present rollforwards of fee paying AUM for the Credit Group ($ in millions):
Liquid Credit
Alternative Credit
Opportunistic Credit
U.S. Direct Lending
European Direct Lending
APAC Credit
Total Credit Group
Balance at 12/31/2023
$
46,140
$
23,218
$
8,490
$
67,596
$
34,246
$
5,590
$
185,280
Commitments
1,223
—
—
2,549
6
—
3,778
Deployment/subscriptions/increase in leverage
—
1,233
340
3,474
1,875
299
7,221
Capital reductions
(967)
—
—
(1,324)
(455)
(18)
(2,764)
Distributions
(46)
(373)
(246)
(2,423)
(250)
(324)
(3,662)
Redemptions
(1,695)
—
—
(88)
(366)
—
(2,149)
Net allocations among investment strategies
—
886
—
—
—
—
886
Change in fund value
367
22
—
603
(478)
29
543
Balance at 3/31/2024
$
45,022
$
24,986
$
8,584
$
70,387
$
35,271
$
5,576
$
189,826
Liquid Credit
Alternative Credit
Opportunistic Credit
U.S. Direct Lending
European Direct Lending
APAC Credit
Total Credit Group
Balance at 12/31/2022
$
42,191
$
15,904
$
7,166
$
57,568
$
29,561
$
6,051
$
158,441
Commitments
415
25
—
641
—
—
1,081
Deployment/subscriptions/increase in leverage
254
987
703
1,415
1,359
266
4,984
Capital reductions
(62)
—
—
(1,279)
(3)
(189)
(1,533)
Distributions
(105)
(879)
(400)
(738)
(40)
(374)
(2,536)
Redemptions
(544)
(656)
—
(92)
(85)
—
(1,377)
Net allocations among investment strategies
4
812
—
—
—
—
816
Change in fund value
479
68
—
384
414
(3)
1,342
Balance at 3/31/2023
$
42,632
$
16,261
$
7,469
$
57,899
$
31,206
$
5,751
$
161,218
The charts below present FPAUM for the Credit Group by its fee bases ($ in billions):
FPAUM: $189.8
FPAUM: $161.2
Invested capital
Market value(1)
Collateral balances (at par)
Capital commitments
(1)Includes $36.8 billion and $30.9 billion from funds that primarily invest in illiquid strategies as of March 31, 2024 and 2023, respectively. The underlying investments held in these funds are generally subject to less market volatility than investments held in liquid strategies.
Credit Group—Fund Performance Metrics as of March 31, 2024
ARCC contributed approximately 34% of the Credit Group’s total management fees for the three months ended March 31, 2024. In addition, the Credit Group’s other significant funds, which are presented in the tables below, collectively contributed approximately 30% of the Credit Group’s management fees for the three months ended March 31, 2024.
The following table presents the performance data for our significant funds that are not drawdown funds in the Credit Group as of March 31, 2024 ($ in millions):
Returns(%)
Year of Inception
AUM
Current Quarter
Since Inception(1)
Primary Investment Strategy
Fund
Gross
Net
Gross
Net
ARCC(2)
2004
$
29,169
N/A
4.0
N/A
12.1
U.S. Direct Lending
CADC(3)
2017
5,569
N/A
2.8
N/A
6.6
U.S. Direct Lending
Open-ended core alternative credit fund(4)
2021
5,023
3.2
2.4
10.5
7.9
Alternative Credit
(1)Since inception returns are annualized.
(2)Returns are time-weighted rates of return and include the reinvestment of income and other earnings from securities or other investments and reflect the deduction of all trading expenses. Net returns are calculated using the fund’s NAV and assume dividends are reinvested at the closest quarter-end NAV to the relevant quarterly ex-dividend dates. Additional information related to ARCC can be found in its filings with the SEC, which are not part of this report.
(3)Returns are time-weighted rates of return and include the reinvestment of income and other earnings from securities or other investments and reflect the deduction of all trading expenses. Returns are shown for institutional share class. Shares of other classes may have lower returns due to higher selling commissions and fees. Net returns are calculated using the fund’s NAV and assume distributions are reinvested at the NAV on the date of distribution. Additional information related to CADC can be found in its filings with the SEC, which are not part of this report.
(4)Returns are time-weighted rates of return and include the reinvestment of income and other earnings from securities or other investments and reflect the deduction of all trading expenses. The fund is made up of a Main Class (“Class M”) and a Constrained Class (“Class C”). Class M includes investors electing to participate in all investments and Class C includes investors electing to be excluded from exposure to liquid investments. Returns presented in the table are for onshore Class M. The current quarter gross and net returns for Class M (offshore) are 3.4% and 2.5%, respectively. The since inception gross and net returns for Class M (offshore) are 10.5% and 7.5%, respectively. The current quarter gross and net returns for Class C (offshore) are 2.6% and 1.9%, respectively. The since inception gross and net returns for Class C (offshore) are 10.4% and 7.5%, respectively. Prior to the current period, returns were reported using the annualized since inception IRR and MoIC. The gross and net IRR for Class M (onshore) are 12.2% and 9.0%, respectively. The gross and net MoIC for Class M (onshore) are 1.1x and 1.1x, respectively. The gross and net IRR for Class M (offshore) are 12.2% and 8.8%, respectively. The gross and net MoIC for Class M (offshore) are 1.1x and 1.1x, respectively. The gross and net IRR for Class C (offshore) are 10.8% and 7.9%, respectively. The gross and net MoIC for Class C (offshore) are 1.2x and 1.1x, respectively.
The following table presents the performance data of the Credit Group’s significant drawdown funds as of March 31, 2024 ($ in millions):
Year of Inception
AUM
Original Capital Commitments
Capital Invested to Date
Realized Value(1)
Unrealized Value(2)
Total Value
MoIC
IRR(%)
Primary Investment Strategy
Fund
Gross(3)
Net(4)
Gross(5)
Net(6)
Funds Harvesting Investments
SDL I Unlevered
2018
$
4,684
$
922
$
872
$
380
$
688
$
1,068
1.3x
1.2x
9.2
7.1
U.S. Direct Lending
SDL I Levered
2,045
2,022
1,211
1,514
2,725
1.5x
1.3x
15.4
11.5
ACE IV Unlevered(7)
2018
9,996
2,851
2,265
934
1,914
2,848
1.3x
1.2x
8.2
5.8
European Direct Lending
ACE IV Levered(7)
4,819
3,838
2,184
3,052
5,236
1.5x
1.3x
11.1
8.3
ASOF I
2019
5,337
3,518
3,134
1,967
3,193
5,160
1.9x
1.6x
24.9
19.4
Opportunistic Credit
Funds Deploying Capital
Pathfinder I
2020
4,255
3,683
3,177
277
3,560
3,837
1.3x
1.2x
16.6
11.8
Alternative Credit
PCS II
2020
5,702
5,114
3,522
448
3,693
4,141
1.2x
1.1x
11.7
7.8
U.S. Direct Lending
ACE V Unlevered(8)
2020
16,901
7,026
5,095
810
5,172
5,982
1.2x
1.2x
11.5
8.5
European Direct Lending
ACE V Levered(8)
6,376
4,618
1,077
4,720
5,797
1.3x
1.2x
17.1
12.4
ASOF II
2021
7,746
7,128
4,062
10
4,580
4,590
1.2x
1.1x
15.4
10.4
Opportunistic Credit
SDL II Unlevered
2021
15,936
1,989
1,320
163
1,342
1,505
1.2x
1.1x
12.5
9.8
U.S. Direct Lending
SDL II Levered
6,047
3,896
758
3,995
4,753
1.3x
1.2x
20.4
15.5
(1)For funds other than our opportunistic credit funds, realized value represent the sum of all cash distributions to all partners and if applicable, exclude tax and incentive distributions made to the general partner. For our opportunistic credit funds, realized value represent the sum of all cash distributions to the fee-paying limited partners and if applicable, exclude tax and incentive distributions made to the general partner.
(2)Unrealized value represents the fund's NAV reduced by the accrued incentive allocation, if applicable. There can be no assurance that unrealized values will be realized at the valuations indicated. For funds other than our opportunistic credit funds, the unrealized value is based on all partners. For our opportunistic credit funds, the unrealized value is based on the fee-paying limited partners.
(3)The gross multiple of invested capital (“MoIC”) is calculated at the fund-level and is based on the interests of the fee-paying limited partners and if applicable, excludes interests attributable to the non-fee paying limited partners and/or the general partner which does not pay management fees or carried interest. The gross MoIC is before giving effect to management fees, carried interest and other expenses, as applicable, but after giving effect to credit facility interest expenses, as applicable. The funds may utilize a credit facility during the investment period and for general cash management purposes. Early in the life of a fund, the gross fund-level MoICs would generally have been lower had such fund called capital from its limited partners instead of utilizing the credit facility.
(4)The net MoIC is calculated at the fund-level and is based on the interests of the fee-paying limited partners and if applicable, excludes those interests attributable to the non-fee paying limited partners and/or the general partner which does not pay management fees or carried interest. The net MoIC is after giving effect to management fees and carried interest, other expenses and credit facility interest expenses, as applicable. The funds may utilize a credit facility during the investment period and for general cash management purposes. Early in the life of a fund, the net fund-level MoICs would generally have been lower had such fund called capital from its limited partners instead of utilizing the credit facility.
(5)The gross IRR is an annualized since inception gross internal rate of return of cash flows to and from the fund and the fund’s residual value at the end of the measurement period. Gross IRR reflects returns to the fee-paying limited partners and, if applicable, excludes interests attributable to the non-fee paying limited partners and/or the general partner which does not pay management fees or carried interest. The cash flow dates used in the gross IRR calculation are based on the actual dates of the cash flows. The gross IRRs are calculated before giving effect to management fees, carried interest and other expenses, as applicable, but after giving effect to credit facility interest expenses, as applicable. The funds may utilize a credit facility during the investment period and for general cash management purposes. Gross fund-level IRRs would generally have been lower had such fund called capital from its limited partners instead of utilizing the credit facility.
(6)The net IRR is an annualized since inception net internal rate of return of cash flows to and from the fund and the fund’s residual value at the end of the measurement period. Net IRRs reflect returns to the fee-paying limited partners and, if applicable, exclude interests attributable to the non-fee paying limited partners and/or the general partner which does not pay management fees or carried interest. The cash flow dates used in the net IRR calculations are based on the actual dates of the cash flows. The net IRRs are calculated after giving effect to management fees and carried interest, other expenses and credit facility interest expenses, as applicable. The funds may utilize a credit facility during the investment period and for general cash management purposes. Net fund-level IRRs would generally have been lower had such fund called capital from its limited partners instead of utilizing the credit facility.
(7)ACE IV is made up of four parallel funds, two denominated in Euros and two denominated in pound sterling: ACE IV (E) Unlevered, ACE IV (G) Unlevered, ACE IV (E) Levered and ACE IV (G) Levered and one feeder fund: ACE IV (D) Levered. ACE IV (E) Levered includes the ACE IV (D) Levered feeder fund. The gross and net IRR and MoIC presented in the table are for ACE IV (E) Unlevered and ACE IV (E) Levered. Metrics for ACE IV (E) Levered exclude the U.S. dollar denominated feeder fund. The gross and net IRR for ACE IV (G) Unlevered are 9.7% and 7.1%, respectively. The gross and net MoIC for ACE IV (G) Unlevered are 1.4x and 1.3x, respectively. The gross and net IRR for ACE IV (G) Levered are 12.8% and 9.1%, respectively. The gross and net MoIC for ACE IV (G) Levered are 1.5x and 1.4x, respectively. The gross and net IRR for ACE IV (D) Levered are 13.0% and 9.6%, respectively. The gross and net MoIC for ACE IV (D) Levered are 1.6x and 1.4x, respectively. Original capital commitments are converted to U.S. dollars at the prevailing exchange rate at the time of the fund’s closing. All other values for ACE IV Unlevered and ACE IV Levered are for the combined levered and unlevered parallel funds and are converted to U.S. dollars at the prevailing quarter-end exchange rate.
(8)ACE V is made up of four parallel funds, two denominated in Euros and two denominated in pound sterling: ACE V (E) Unlevered, ACE V (G) Unlevered, ACE V (E) Levered, and ACE V (G) Levered, and two feeder funds: ACE V (D) Levered and ACE V (Y) Unlevered. ACE V (E) Levered includes the ACE V (D) Levered feeder fund and ACE V (E) Unlevered includes the ACE V (Y) Unlevered feeder fund. The gross and net IRR and gross and net MoIC presented in the table are for ACE V (E) Unlevered and ACE V (E) Levered. Metrics for ACE V (E) Levered exclude the ACE V (D) Levered feeder fund and metrics for ACE V (E) Unlevered exclude the ACE V (Y) Unlevered feeder fund. The gross and net IRR for ACE V (G) Unlevered are 13.2% and 10.0%, respectively. The gross and net MoIC for ACE V (G) Unlevered are 1.3x and 1.2x, respectively. The gross and net IRR for ACE V (G) Levered are 17.8% and 13.1%, respectively. The gross and net MoIC for ACE V (G) Levered are 1.3x and 1.3x, respectively. The gross and net IRR for ACE V (D) Levered are 16.3% and 12.1%, respectively. The gross and net MoIC for ACE V (D) Levered are 1.3x and 1.2x, respectively. The gross and net IRR for ACE V (Y) Unlevered are 11.2% and 8.1%, respectively. The gross and net MoIC for ACE V (Y) Unlevered are 1.2x and 1.2x, respectively. Original capital commitments are converted to U.S. dollars at the prevailing exchange rate at the time of the fund's closing. All other values for ACE V Unlevered and ACE V Levered are for the combined levered and unlevered parallel funds and are converted to U.S. dollars at the prevailing quarter-end exchange rate.
Real Assets Group—Three Months Ended March 31, 2024Compared to Three Months Ended March 31, 2023
Fee Related Earnings
The following table presents the components of the Real Assets Group’s FRE ($ in thousands):
Three months ended March 31,
Favorable (Unfavorable)
2024
2023
$ Change
% Change
Management fees
$
93,814
$
97,470
$
(3,656)
(4)%
Other fees
5,075
6,462
(1,387)
(21)
Compensation and benefits
(37,918)
(37,986)
68
0
General, administrative and other expenses
(14,453)
(12,284)
(2,169)
(18)
Fee Related Earnings
$
46,518
$
53,662
(7,144)
(13)
Management Fees. The chart below presents Real Assets Group management fees and effective management fee rates ($ in millions):
Management fees decreased for the three months ended March 31, 2024 compared to the three months ended March 31, 2023 primarily due to the early termination of the advisory agreements of two U.S. industrial real estate equity funds, which generated make-whole termination fees of $3.3 million in the prior year period. Management fees decreased over the comparative periods by: (i) $2.3 million from Ares Industrial Real Estate Income Trust, Inc. (“AIREIT”), driven by a decrease in average capital base due to market-based asset depreciation; (ii) $1.7 million from Infrastructure Debt Fund IV, L.P. (“IDF IV”) due to distributions that reduced the fee base as the fund is past its investment period; and (iii) $1.3 million from AREOF III due to a contractual reduction in the fee base that was triggered at the expiration of the fund’s investment period.
The decrease in management fees over the comparative periods was partially offset by increases of: (i) $2.8 million from IDF V that was driven by the deployment of capital; (ii) $2.2 million, excluding catch-up fees of $0.2 million for each period, from our fourth U.S. opportunistic real estate equity fund that was driven by new capital commitments; and (iii) $2.5 million from our second climate infrastructure fund, driven by new capital commitments.
The increase in effective management fee rate for the three months ended March 31, 2024 compared to the three months ended March 31, 2023 was primarily driven by deployment of capital within our real estate equity funds. Certain of our private real estate equity funds pay a fee on committed capital that increases once that capital is invested. As a result, our effective management fee rate increases as capital is deployed.
Other Fees. The decrease in other fees for the three months ended March 31, 2024 compared to the three months ended March 31, 2023 was primarily attributable to the decrease in development fees resulting from a reduction in property-related activities within certain industrial U.S. real estate equity funds.
Compensation and Benefits. Compensation and benefits remained relatively flat for the three months ended March 31, 2024 compared to the three months ended March 31, 2023. The change over the comparative periods was composed of: (i) an increase in salary expense of $1.5 million, primarily attributable to headcount growth to support the expansion of our business; (ii) an increase in payroll related taxes of $2.1 million, primarily due to our higher stock price associated with the restricted units that vested during the period; and (iii) lower incentive-based compensation, which is dependent on our operating performance and is expected to fluctuate during the year.
Average headcount for the quarter-to-date period increased by 9% to 378 investment and investment support professionals for three months ended March 31, 2024 from 347 professionals for the same period in 2023.
General, Administrative and Other Expenses. The increase in general, administrative and other expenses for the three months ended March 31, 2024 compared to the same period in 2023 was primarily driven by $1.5 million in non-recurring legal expenses.
Realized Income
The following table presents the components of the Real Assets Group’s RI ($ in thousands):
Three months ended March 31,
Favorable (Unfavorable)
2024
2023
$ Change
% Change
Fee Related Earnings
$
46,518
$
53,662
$
(7,144)
(13)%
Performance income—realized
3,677
6,086
(2,409)
(40)
Performance related compensation—realized
(2,228)
(3,758)
1,530
41
Realized net performance income
1,449
2,328
(879)
(38)
Investment loss—realized
(457)
(1,772)
1,315
74
Interest and other investment income—realized
3,835
1,821
2,014
111
Interest expense
(5,949)
(3,896)
(2,053)
(53)
Realized net investment loss
(2,571)
(3,847)
1,276
33
Realized Income
$
45,396
$
52,143
(6,747)
(13)
Realized net performance income for the three months ended March 31, 2024 and 2023 was primarily attributable to incentive fees generated from an open-ended industrial real estate fund that vary due to a three-year measurement period calculated for each investor in the fund and to the fund’s performance during those periods. Realized net performance income for the three months ended March 31, 2023 also included distributions of net investment income from US Real Estate Fund VIII, L.P. (“US VIII”).
Realized net investment loss for the three months ended March 31, 2024 and 2023 largely represents interest expense exceeding investment income during these periods. Interest expense, which is allocated among our segments based on the cost basis of our balance sheet investments, increased over the comparative periods primarily due to the issuance of the 2028 Senior Notes in November 2023 and to higher average SOFR rates and a higher average outstanding balance of our Credit Facility.
Realized net investment loss for the three months ended March 31, 2024 was partially offset by dividend income received from a European real estate fund.
Realized net investment loss for the three months ended March 31, 2023 included realized losses recognized from a real estate debt vehicle, driven by interest expense with no associated investment income during the period. Such realized loss is not expected to recur in 2024 as we no longer hold the investment. Realized net investment loss for the prior year period was partially offset by distributions of net investment income from an infrastructure opportunities and an infrastructure debt vehicle.
The following table presents the accrued carried interest, also referred to as accrued performance income, and related performance compensation for the Real Assets Group. Accrued net performance income excludes net performance income that has been realized but not yet received as of the reporting date ($ in thousands):
As of March 31, 2024
As of December 31, 2023
Accrued Performance Income
Accrued Performance Compensation
Accrued Net Performance Income
Accrued Performance Income
Accrued Performance Compensation
Accrued Net Performance Income
US VIII
$
31,441
$
20,165
$
11,276
$
32,199
$
20,651
$
11,548
US Real Estate Fund IX, L.P. (“US IX”)
92,573
57,396
35,177
89,958
55,774
34,184
AREOF III
32,696
19,618
13,078
35,715
21,429
14,286
EF IV
44,790
26,874
17,916
49,150
29,490
19,660
EIF V
95,380
71,301
24,079
93,598
69,969
23,629
IDF V
67,478
40,497
26,981
56,065
33,677
22,388
Other real assets funds
124,182
82,160
42,022
140,167
92,468
47,699
Total Real Assets Group
$
488,540
$
318,011
$
170,529
$
496,852
$
323,458
$
173,394
The following table presents the change in accrued performance income for the Real Assets Group ($ in thousands):
The tables below present rollforwards of fee paying AUM for the Real Assets Group ($ in millions):
U.S. Real Estate Equity
European Real Estate Equity
Real Estate Debt
Infrastructure Opportunities
Infrastructure Debt
Total Real Assets Group
Balance at 12/31/2023
$
20,844
$
6,189
$
3,277
$
5,148
$
5,880
$
41,338
Commitments
296
—
—
—
—
296
Deployment/subscriptions/increase in leverage
246
119
102
39
356
862
Capital reductions
—
(12)
—
—
—
(12)
Distributions
(141)
(31)
(57)
(69)
(8)
(306)
Redemptions
(364)
—
(70)
—
—
(434)
Change in fund value
(290)
(125)
13
58
(60)
(404)
Change in fee basis
(504)
—
—
—
—
(504)
Balance at 3/31/2024
$
20,087
$
6,140
$
3,265
$
5,176
$
6,168
$
40,836
U.S. Real Estate Equity
European Real Estate Equity
Real Estate Debt
Infrastructure Opportunities
Infrastructure Debt
Total Real Assets Group
Balance at 12/31/2022
$
21,788
$
5,634
$
3,691
$
4,524
$
5,970
$
41,607
Commitments
581
15
—
—
—
596
Deployment/subscriptions/increase in leverage
19
18
39
46
99
221
Capital reductions
(245)
—
(34)
—
—
(279)
Distributions
(396)
(55)
(63)
—
(118)
(632)
Redemptions
(256)
—
(282)
—
—
(538)
Change in fund value
(191)
73
14
—
57
(47)
Balance at 3/31/2023
$
21,300
$
5,685
$
3,365
$
4,570
$
6,008
$
40,928
The charts below present FPAUM for the Real Assets Group by its fee bases ($ in billions):
FPAUM: $40.8
FPAUM: $40.9
Market value(1)
Invested capital/other(2)
Capital commitments
(1)Amounts represent FPAUM from funds that primarily invest in illiquid strategies. The underlying investments held in these funds are generally subject to less market volatility than investments held in liquid strategies.
(2)Other consists of ACRE’s FPAUM, which is based on ACRE’s stockholders’ equity.
Real Assets Group—Fund Performance Metrics as of March 31, 2024
The four significant funds presented in the tables below collectively contributed approximately 40% of the Real Assets Group’s management fees for the three months ended March 31, 2024.
The following table presents the performance data for our significant funds that are not drawdown funds in the Real Assets Group as of March 31, 2024 ($ in millions):
Returns(%)
Year of Inception
AUM
Year-To-Date
Since Inception(1)
Primary Investment Strategy
Fund
Gross
Net
Gross
Net
Ares Real Estate Income Trust, Inc. (“AREIT”)(2)
2012
$
5,289
N/A
(2.8)
N/A
6.3
U.S. Real Estate Equity
AIREIT(3)
2017
7,499
N/A
(4.0)
N/A
8.8
U.S. Real Estate Equity
Open-ended industrial real estate fund(4)
2017
4,666
(1.9)
(1.9)
18.7
15.2
U.S. Real Estate Equity
(1)Since inception returns are annualized.
(2)Performance is measured by total return, which includes income and appreciation and reinvestment of all distributions for the respective time period. Returns are shown for institutional share class. Shares of other classes may have lower returns due to higher selling commissions and fees. Actual individual stockholder returns will vary. Net returns are calculated using the fund’s NAV and assume distributions are reinvested at the NAV on the date of distribution. The inception date used in the calculation of the since inception return is the date in which the first shares of common stock were sold after converting to a NAV-based REIT. Additional information related to AREIT can be found in its filings with the SEC, which are not part of this report.
(3)Performance is measured by total return, which includes income and appreciation and reinvestment of all distributions for the respective time period. Returns are shown for institutional share class. Shares of other classes may have lower returns due to higher selling commissions and fees. Actual individual stockholder returns will vary. Net returns are calculated using the fund’s NAV and assume distributions are reinvested at the NAV on the date of distribution. Additional information related to AIREIT can be found in its filings with the SEC, which are not part of this report.
(4)Returns are time-weighted rates of return and include the reinvestment of income and other earnings from securities or other investments and reflect the deduction of all trading expenses. Gross returns do not reflect the deduction of management fees, incentive fees, as applicable, or other expenses. Net returns are calculated by subtracting the applicable management fees, incentive fees, as applicable and other expenses from the gross returns on a quarterly basis.
The following table presents the performance data of the Real Assets Group’s significant drawdown fund as of March 31, 2024 ($ in millions):
Year of Inception
AUM
Original Capital Commitments
Capital Invested to Date
Realized Value(1)
Unrealized Value(2)
Total Value
MoIC
IRR(%)
Primary Investment Strategy
Fund
Gross(3)
Net(4)
Gross(5)
Net(6)
Fund Deploying Capital
IDF V(7)
2020
$
4,768
$
4,585
$
3,645
$
566
$
3,455
$
4,021
1.1x
1.1x
12.4
9.5
Infrastructure Debt
(1)Realized value includes distributions of operating income, sales and financing proceeds received.
(2)Unrealized value represents the fund's NAV reduced by the accrued incentive allocation, if applicable. There can be no assurance that unrealized values will be realized at the valuations indicated.
(3)The gross MoIC is calculated at the fund-level and is based on the interests of the fee-paying limited partners and if applicable, excludes interests attributable to the non-fee paying limited partners and/or the general partner which does not pay management fees or carried interest. The gross MoIC is before giving effect to management fees, carried interest, as applicable, and other expenses, but after giving effect to credit facility interest expenses, as applicable. The funds may utilize a credit facility during the investment period and for general cash management purposes. Early in the life of a fund, the gross fund-level MoICs would generally have been lower had such fund called capital from its limited partners instead of utilizing the credit facility.
(4)The net MoIC is calculated at the fund-level and is based on the interests of the fee-paying limited partners and, if applicable, excludes interests attributable to the non fee-paying limited partners and/or the general partner which does not pay management fees or carried interest. The net MoIC is after giving effect to management fees, carried interest, as applicable, credit facility interest expense, as applicable, and other expenses. The funds may utilize a credit facility during the investment period and for general cash management purposes. Early in the life of a fund, the net fund-level MoICs would generally have been lower had such fund called capital from its limited partners instead of utilizing the credit facility.
(5)The gross IRR is an annualized since inception gross internal rate of return of cash flows to and from the fund and the fund’s residual value at the end of the measurement period. Gross IRR reflects returns to the fee-paying limited partners and, if applicable, excludes interests attributable to the non-fee paying limited partners and/or the general partner which does not pay management fees or carried interest. The cash flow dates used in the gross IRR calculation are based on the actual dates of the cash flows. The gross IRRs are calculated before giving effect to management fees, carried interest and other expenses, but after giving effect to credit facility interest expenses, as applicable. The funds may utilize a credit facility during the investment period and for general cash management purposes. Gross fund-level IRRs would generally have been lower had such fund called capital from its limited partners instead of utilizing the credit facility.
(6)The net IRR is an annualized since inception net internal rate of return of cash flows to and from the fund and the fund’s residual value at the end of the measurement period. Net IRRs reflect returns to the fee-paying limited partners and, if applicable, exclude interests attributable to the non-fee paying limited partners and/or the general partner which does not pay management fees or carried interest. The cash flow dates used in the net IRR calculations are based on the actual dates of the cash flows. The net IRRs are calculated after giving effect to management fees and carried interest, other expenses and credit facility interest expenses, as applicable. The funds may utilize a credit facility during the investment period and for general cash management purposes. Net fund-level IRRs would generally have been lower had such fund called capital from its limited partners instead of utilizing the credit facility.
(7)IDF V is made up of U.S. Dollar hedged, Euro unhedged, GBP hedged, Yen hedged, and single investor parallel funds. The gross and net IRR and MoIC presented in the table are for the U.S. Dollar hedged parallel fund. The gross and net IRR for the single investor U.S. Dollar parallel fund are 9.9% and 7.6%, respectively. The gross and net MoIC for the single investor U.S. Dollar parallel fund are 1.1x and 1.1x, respectively. The gross and net IRR for the Euro unhedged parallel fund are 11.9% and 9.0%, respectively. The gross and net MoIC for the Euro unhedged parallel fund are 1.1x and 1.1x, respectively. The gross and net IRR for the GBP hedged parallel fund are 12.0% and 8.9%, respectively. The gross and net MoIC for the GBP hedged parallel fund are 1.1x and 1.1x, respectively. The gross and net IRR for the Yen hedged parallel fund are 11.0% and 7.7%, respectively. The gross and net MoIC for the Yen hedged parallel fund are 1.1x and 1.1x, respectively. Original capital commitments are converted to U.S. Dollars at the prevailing exchange rate at the time of fund's closing. All other values for IDF V are for the combined fund and are converted to U.S. Dollars at the prevailing quarter-end exchange rate.
Private Equity Group—Three Months Ended March 31, 2024Compared to Three Months Ended March 31, 2023
Fee Related Earnings
The following table presents the components of the Private Equity Group’s FRE ($ in thousands):
Three months ended March 31,
Favorable (Unfavorable)
2024
2023
$ Change
% Change
Management fees
$
34,933
$
29,840
$
5,093
17%
Other fees
439
394
45
11
Compensation and benefits
(14,785)
(16,626)
1,841
11
General, administrative and other expenses
(5,216)
(4,485)
(731)
(16)
Fee Related Earnings
$
15,371
$
9,123
6,248
68
Management Fees. The chart below presents Private Equity Group management fees and effective management fee rates ($ in millions):
Management fees for the comparative periods increased primarily due to fees from funds that we manage as a result of the Crescent Point Acquisition that generated $7.4 million in additional fees for the three months ended March 31, 2024. The increase in management fees was partially offset by a decrease of $2.7 million in fees from an energy opportunities fund, driven by the change in fee base from capital commitments to invested capital and reduction in fee rate from 1.50% to 0.75%. Both the change in fee base and the reduction in fee rate were contractually triggered at the expiration of the fund’s investment period.
The increase in effective management fee rate for the three months ended March 31, 2024 compared to the three months ended March 31, 2023 was primarily driven by certain funds from the Crescent Point Acquisition that have a higher effective management fee rate than the average effective management fee rate of the funds within corporate private equity.
Compensation and Benefits. The decrease in compensation and benefits for the three months ended March 31, 2024 compared to the same period in 2023 was primarily driven by lower incentive-based compensation as it is dependent on our operating performance and is expected to fluctuate each period. The decrease for the three months ended March 31, 2024 compared to the same period in 2023 was partially offset by an increase in salary and benefits costs of $2.9 million related to the increase in headcount from the Crescent Point Acquisition.
Average headcount increased by 13% to 106 investment and investment support professionals for the quarter-to-date period in 2024 from 94 professionals for the same period in 2023, primarily due to the Crescent Point Acquisition.
General, Administrative and Other Expenses. The increase in general, administrative and other expenses for the three months ended March 31, 2024 compared to the same period in 2023 largely reflects Crescent Point’s operating expenses following the Crescent Point Acquisition.
Realized Income
The following table presents the components of the Private Equity Group’s RI ($ in thousands):
Three months ended March 31,
Favorable (Unfavorable)
2024
2023
$ Change
% Change
Fee Related Earnings
$
15,371
$
9,123
$
6,248
68%
Performance income—realized
2,738
17,640
(14,902)
(84)
Performance related compensation—realized
(2,194)
(14,220)
12,026
85
Realized net performance income
544
3,420
(2,876)
(84)
Investment income—realized
120
879
(759)
(86)
Interest and other investment income—realized
184
166
18
11
Interest expense
(5,889)
(4,805)
(1,084)
(23)
Realized net investment loss
(5,585)
(3,760)
(1,825)
(49)
Realized Income
$
10,330
$
8,783
1,547
18
Realized net performance income for the three months ended March 31, 2024 was attributable to realized gains from Ares Corporate Opportunities Fund IV, L.P. (“ACOF IV”) investment in an energy company. Realized net performance income for the three months ended March 31, 2023 included realized gains from the partial sale of ACOF IV’s investment in the AZEK Company (“AZEK”).
Realized net investment loss for the three months ended March 31, 2024 and 2023 was primarily attributable to interest expense exceeding investment income during these periods. Interest expense, which is allocated among our segments based on the cost basis of our balance sheet investments, increased over the comparative periods primarily due to the issuance of the 2028 Senior Notes in November 2023 and to higher average SOFR rates and a higher average outstanding balance of our Credit Facility.
The following table presents the accrued carried interest, also referred to as accrued performance income, and related performance compensation for the Private Equity Group ($ in thousands):
As of March 31, 2024
As of December 31, 2023
Accrued Performance Income
Accrued Performance Compensation
Accrued Net Performance Income
Accrued Performance Income
Accrued Performance Compensation
Accrued Net Performance Income
ACOF IV
$
164,181
$
131,474
$
32,707
$
181,317
$
145,197
$
36,120
ACOF V
230,560
184,887
45,673
474,878
380,807
94,071
ACOF VI
365,119
311,490
53,629
337,142
289,118
48,024
Other funds
49,505
36,552
12,953
55,178
42,295
12,883
Total Private Equity Group
$
809,365
$
664,403
$
144,962
$
1,048,515
$
857,417
$
191,098
The following table presents the change in accrued carried interest for the Private Equity Group ($ in thousands):
As of December 31, 2023
Activity during the period
As of March 31, 2024
Waterfall Type
Accrued Carried Interest
Change in Unrealized
Realized
Accrued Carried Interest
ACOF IV
American
$
181,317
$
(14,398)
$
(2,738)
$
164,181
ACOF V
American
474,878
(244,318)
—
230,560
ACOF VI
American
337,142
27,977
—
365,119
Other funds
European
46,078
(2,409)
—
43,669
Other funds
American
9,100
(3,264)
—
5,836
Total Private Equity Group
$
1,048,515
$
(236,412)
$
(2,738)
$
809,365
Private Equity Group—Assets Under Management
The tables below present rollforwards of AUM for the Private Equity Group ($ in millions):
Corporate Private Equity
APAC Private Equity
Other(1)
Total Private Equity Group
Balance at 12/31/2023
$
20,998
$
3,414
$
139
$
24,551
Net new par/equity commitments
254
3
58
315
Capital reductions
(2)
—
—
(2)
Distributions
(25)
(11)
—
(36)
Redemptions
—
(2)
—
(2)
Net allocations among investment strategies
150
—
(197)
(47)
Change in fund value
(145)
(158)
—
(303)
Balance at 3/31/2024
$
21,230
$
3,246
$
—
$
24,476
Corporate Private Equity
APAC Private Equity
Other
Total Private Equity Group
Balance at 12/31/2022
$
20,939
$
90
$
—
$
21,029
Net new par/equity commitments
50
—
—
50
Capital reductions
(3)
—
—
(3)
Distributions
(266)
—
—
(266)
Change in fund value
(155)
1
—
(154)
Balance at 3/31/2023
$
20,565
$
91
$
—
$
20,656
(1) Activity within Other represents equity commitments to the platform that either have not yet been allocated to an investment strategy or have been allocated in a subsequent period as commitments to an investment strategy.
The components of our AUM for the Private Equity Group are presented below ($ in billions):
AUM: $24.5
AUM: $20.6
FPAUM
Non-fee paying(1)
AUM not yet paying fees
(1) Includes $1.3 billion and $1.0 billion of non-fee paying AUM from our general partner and employee commitments as of March 31, 2024 and 2023, respectively.
Private Equity Group—Fee Paying AUM
The tables below present rollforwards of fee paying AUM for the Private Equity Group ($ in millions). There was no change in fee paying AUM for the Private Equity Group for the three months ended March 31, 2023:
The charts below present FPAUM for the Private Equity Group by its fee bases ($ in billions):
FPAUM: $12.6
FPAUM: $11.3
Invested capital
Capital commitments
Private Equity Group—Fund Performance Metrics as of March 31, 2024
The two significant funds presented in the table below collectively contributed approximately 71% of the Private Equity Group’s management fees for the three months ended March 31, 2024.
The following table presents the performance data of the Private Equity Group’s significant drawdown funds as of March 31, 2024 ($ in millions):
Year of Inception
AUM
Original Capital Commitments
Capital Invested to Date
Realized Value(1)
Unrealized Value(2)
Total Value
MoIC
IRR(%)
Primary Investment Strategy
Fund
Gross(3)
Net(4)
Gross(5)
Net(6)
Fund Harvesting Investments
ACOF V
2017
$
8,597
$
7,850
$
7,611
$
3,515
$
8,087
$
11,602
1.5x
1.4x
10.7
8.1
Corporate Private Equity
Funds Deploying Capital
ACOF VI
2020
7,575
5,743
5,129
746
6,745
7,491
1.4x
1.3x
23.6
16.7
Corporate Private Equity
(1)Realized value represents the sum of all cash dividends, interest income, other fees and cash proceeds from realizations of interests in portfolio investments. Realized value excludes any proceeds related to bridge financings.
(2)Unrealized value represents the fair market value of remaining investments. Unrealized value does not take into account any bridge financings. There can be no assurance that unrealized investments will be realized at the valuations indicated.
(3)The gross MoIC is calculated at the fund-level and is based on the interests of the fee-paying limited partners and if applicable, excludes interests attributable to the non-fee paying limited partners and/or the general partner which does not pay management fees or carried interest. The gross MoIC is before giving effect to management fees, carried interest, as applicable, and other expenses, but after giving effect to credit facility interest expenses, as applicable. The gross MoICs are also calculated before giving effect to any bridge financings. The funds may utilize a credit facility during the investment period and for general cash management purposes. Early in the life of a fund, the gross fund-level MoICs would generally have been lower had such fund called capital from its limited partners instead of utilizing the credit facility.
(4)The net MoIC is calculated at the fund-level. The net MoIC is based on the interests of the fee-paying limited partners and if applicable, excludes interests attributable to the non-fee paying limited partners and/or the general partner which does not pay management fees or performance fees. The net MoIC is after giving effect to management fees, carried interest, as applicable, and other expenses. The net MoICs are also calculated before giving effect to any bridge financings. Inclusive of bridge financings, the net MoIC would be 1.4x for ACOF V and 1.2x for ACOF VI. The funds may utilize a credit facility during the investment period and for general cash management purposes. Early in the life of a fund, the net fund-level MoICs would generally have been lower had such fund called capital from its limited partners instead of utilizing the credit facility.
(5)The gross IRR is an annualized since inception gross internal rate of return of cash flows to and from the fund and the fund’s residual value at the end of the measurement period. Gross IRRs reflect returns to the fee-paying limited partners and, if applicable, excludes interests attributable to the non-fee paying limited partners and/or the general partner which does not pay management fees or carried interest. The cash flow dates used in the gross IRR calculation are based on the actual dates of the cash flows. The gross IRRs are calculated before giving effect to management fees, carried interest, as applicable, and other expenses, but after giving effect to credit facility interest expenses, as applicable. The gross IRRs are also calculated before giving effect to any bridge financings. The funds may utilize a credit facility during the investment period and for general cash management purposes. Gross fund-level IRRs would generally have been lower had such fund called capital from its limited partners instead of utilizing the credit facility.
(6)The net IRR is an annualized since inception net internal rate of return of cash flows to and from the fund and the fund’s residual value at the end of the measurement period. Net IRRs reflect returns to the fee-paying limited partners and if applicable, exclude interests attributable to the non-fee paying limited partners and/or the general partner which does not pay management fees or carried interest. The cash flow dates used in the net IRR calculation are based on the actual dates of the cash flows. The net IRRs are calculated after giving effect to management fees, carried interest as applicable, and other expenses and exclude commitments by the general partner and Schedule I investors who do not pay either management fees or carried interest. The funds may utilize a credit facility during the investment period and for general cash management purposes. Net fund-level IRRs would generally have been lower had such fund called capital from its limited partners instead of utilizing the credit facility. The net IRRs are also calculated before giving effect to any bridge financings. Inclusive of bridge financings, the net IRRs would be 8.2% for ACOF V and 15.7% for ACOF VI.
Secondaries Group—Three Months Ended March 31, 2024 Compared to Three Months Ended March 31, 2023
Fee Related Earnings
The following table presents the components of the Secondaries Group’s FRE ($ in thousands):
Three months ended March 31,
Favorable (Unfavorable)
2024
2023
$ Change
% Change
Management fees
$
44,421
$
39,863
$
4,558
11%
Fee related performance revenues
2,962
3,271
(309)
(9)
Other fees
4
—
4
NM
Compensation and benefits
(12,714)
(13,412)
698
5
General, administrative and other expenses
(9,068)
(4,292)
(4,776)
(111)
Fee Related Earnings
$
25,605
$
25,430
175
1
Management Fees. The chart below presents Secondaries Group management fees and effective management fee rates ($ in millions):
Management fees increased for the three months ended March 31, 2024 compared to the three months ended March 31, 2023 primarily due to higher management fees from APMF of $3.0 million due to additional capital raised and also as we contractually agreed to a reduced fee rate of 0.25% from inception through March 31, 2023 that subsequently increased to 1.40% beginning in the second quarter of 2023. Management fees included catch-up fees of $0.2 million from our third infrastructure secondaries fund for the three months ended March 31, 2024 and $0.9 million from Landmark Real Estate Fund IX, L.P. (“LREF IX”) for the three months ended March 31, 2023. Excluding catch-up fees, management fees increased over the comparative periods by: (i) $0.6 million from our third infrastructure secondaries fund, which launched during the fourth quarter of 2023; and (ii) $1.7 million from LREF IX. The increases in management fees for these funds was primarily driven by capital commitments.
The increase in effective management fee rate for the three months ended March 31, 2024 compared to the three months ended March 31, 2023 was primarily due to additional capital raised by APMF, as well as the higher fee rate for APMF following the expiration of the fee waiver provided for the twelve months from the fund’s inception.
Compensation and Benefits. The decrease in compensation and benefits for the three months ended March 31, 2024 compared to the three months ended March 31, 2023 was primarily driven by lower fee related performance compensation of $2.0 million. Pursuant to a contractual expense limitation agreement with APMF to reduce its expense ratio, we have agreed to temporarily reimburse the fund for certain expenses in excess of 0.30% per annum of the average monthly net assets of each class of APMF shares. Such reimbursements, as well as supplemental distribution fees paid by us to brokerage firms, will result in a corresponding decrease in discretionary fee related performance compensation until reimbursed expenses have been recovered from fee related performance revenues earned from APMF. The decrease over the comparative period was partially offset by an increase in payroll related taxes of $0.8 million primarily due to our higher stock price associated with the restricted units that vested during the period.
Average headcount increased by 11% to 111 investment and investment support professionals for the quarter-to-date period in 2024 from 100 professionals for the same period in 2023.
General, Administrative and Other Expenses. In an effort to accelerate the growth of APMF’s assets, we entered into agreements beginning in the second quarter of 2023 that pay distribution partners a supplemental distribution fee based on assets and/or sales. These agreements resulted in $3.5 million of expenses for the three months ended March 31, 2024 and are expected to fluctuate with sales and the growth in assets. These supplemental distribution fees will reduce fee related performance compensation to the extent that fee related performance revenues are earned from APMF. Additionally, certain other expenses have also increased during the current period, primarily occupancy costs, which support our growing headcount based in higher cost locations, and information technology costs. Collectively, these expenses increased by $1.3 million for the three months ended March 31, 2024 compared to the same period in 2023.
Realized Income
The following table presents the components of the Secondaries Group’s RI ($ in thousands):
Three months ended March 31,
Favorable (Unfavorable)
2024
2023
$ Change
% Change
Fee Related Earnings
$
25,605
$
25,430
$
175
1%
Interest and other investment income—realized
210
1,225
(1,015)
(83)
Interest expense
(2,698)
(2,305)
(393)
(17)
Realized net investment loss
(2,488)
(1,080)
(1,408)
(130)
Realized Income
$
23,117
$
24,350
(1,233)
(5)
Realized net investment loss for the three months ended March 31, 2024 and 2023 largely represents interest expense exceeding investment income during these periods. Interest expense, which is allocated among our segments based on the cost basis of our balance sheet investments, increased over the comparative periods primarily due to the issuance of the 2028 Senior Notes in November 2023 and to higher average SOFR rates and a higher average outstanding balance of our Credit Facility. The activity for the three months ended March 31, 2023 also included dividend income received from APMF.
Secondaries Group—Performance Income
The following table presents the accrued carried interest, also referred to as accrued performance income, and related performance compensation for the Secondaries Group. Accrued net performance income excludes net performance income that has been realized but not yet received as of the reporting date ($ in thousands):
As of March 31, 2024
As of December 31, 2023
Accrued Performance Income
Accrued Performance Compensation
Accrued Net Performance Income
Accrued Performance Income
Accrued Performance Compensation
Accrued Net Performance Income
LEP XVI
$
124,175
$
106,272
$
17,903
$
128,650
$
110,053
$
18,597
Landmark Real Estate Fund VIII, L.P. (“LREF VIII”)
The following table presents the change in accrued performance income for the Secondaries Group ($ in thousands):
As of December 31, 2023
Activity during the period
As of March 31, 2024
Waterfall Type
Accrued Carried Interest
Change in Unrealized
Realized
Accrued Carried Interest
Accrued Carried Interest
LEP XVI
European
$
128,650
$
(4,475)
$
—
$
124,175
LREF VIII
European
97,366
(1,554)
—
95,812
Other secondaries funds
European
57,339
(3,399)
—
53,940
Total Secondaries Group
$
283,355
$
(9,428)
$
—
$
273,927
Secondaries Group—Assets Under Management
The table below presents the rollforwards of AUM for the Secondaries Group ($ in millions):
Private Equity Secondaries
Real Estate Secondaries
Infrastructure Secondaries
Credit Secondaries
Other
Total Secondaries Group
Balance at 12/31/2023
$
13,174
$
7,826
$
2,380
$
1,380
$
—
$
24,760
Net new par/equity commitments
536
150
215
68
—
969
Distributions
(140)
(23)
—
(1)
—
(164)
Change in fund value
10
22
29
15
—
76
Balance at 3/31/2024
$
13,580
$
7,975
$
2,624
$
1,462
$
—
$
25,641
Private Equity Secondaries
Real Estate Secondaries
Infrastructure Secondaries
Credit Secondaries
Other(1)
Total Secondaries Group
Balance at 12/31/2022
$
12,769
$
7,552
$
1,640
$
—
$
—
$
21,961
Net new par/equity commitments
21
237
—
938
50
1,246
Distributions
(258)
(96)
(70)
—
—
(424)
Change in fund value
138
(26)
(1)
—
—
111
Balance at 3/31/2023
$
12,670
$
7,667
$
1,569
$
938
$
50
$
22,894
(1) Activity within Other represents equity commitments to the platform that either have not yet been allocated to an investment strategy or have been allocated in a subsequent period as commitments to an investment strategy.
The components of our AUM for the Secondaries Group are presented below ($ in billions):
AUM: $25.6
AUM: $23.0
FPAUM
AUM not yet paying fees
Non-fee paying(1)
(1) Includes $0.5 billion of non-fee paying AUM from our general partner and employee commitments as of March 31, 2024 and 2023, respectively.
The table below presents the rollforwards of fee paying AUM for the Secondaries Group ($ in millions):
Private Equity Secondaries
Real Estate Secondaries
Infrastructure Secondaries
Credit Secondaries
Total Secondaries Group
Balance at 12/31/2023
$
11,204
$
5,978
$
1,763
$
95
$
19,040
Commitments
536
150
214
—
900
Deployment/subscriptions/increase in leverage
—
60
1
—
61
Distributions
(65)
(16)
—
(18)
(99)
Change in fund value
(35)
39
(6)
—
(2)
Change in fee basis
1
(8)
—
(2)
(9)
Balance at 3/31/2024
$
11,641
$
6,203
$
1,972
$
75
$
19,891
Private Equity Secondaries
Real Estate Secondaries
Infrastructure Secondaries
Credit Secondaries
Total Secondaries Group
Balance at 12/31/2022
$
11,062
$
5,313
$
1,293
$
—
$
17,668
Commitments
21
86
—
—
107
Deployment/subscriptions/increase in leverage
71
32
7
—
110
Distributions
(43)
(96)
(58)
—
(197)
Change in fund value
(78)
152
34
—
108
Change in fee basis
(35)
(14)
—
—
(49)
Balance at 3/31/2023
$
10,998
$
5,473
$
1,276
$
—
$
17,747
The chart below presents FPAUM for the Secondaries Group by its fee bases ($ in billions):
FPAUM: $19.9
FPAUM: $17.8
Market value(1)
Capital commitments
Invested capital/other
(1)Amounts represent FPAUM from funds that primarily invest in illiquid strategies. The underlying investments held in these funds are generally subject to less market volatility than investments held in liquid strategies.
Secondaries Group—Fund Performance Metrics as of March 31, 2024
LEP XVI contributed approximately 26% of the Secondaries Group’s management fees for the three months ended March 31, 2024.
The following table presents the performance data of the Secondaries Group’s significant drawdown fund as of March 31, 2024 ($ in millions):
Year of Inception
AUM
Original Capital Commitments
Capital Invested to Date
Realized Value(1)
Unrealized Value(2)
Total Value
MoIC
IRR(%)
Primary Investment Strategy
Fund
Gross(3)
Net(4)
Gross(5)
Net(6)
Fund Harvesting Investments
LEP XVI(7)
2016
$
4,691
$
4,896
$
3,806
$
1,990
$
3,116
$
5,106
1.5x
1.3x
24.3
16.1
Private Equity Secondaries
For the funds in the Secondaries Group, returns are calculated from results of the underlying portfolio that are generally reported on a three month lag and may not include the impact of economic and market activities occurring in the current reporting period.
(1)Realized value represents the sum of all cash distributions to all limited partners and if applicable, exclude tax and incentive distributions made to the general partner.
(2)Unrealized value represents the limited partners’ share of fund’s NAV reduced by the accrued incentive allocation, if applicable. There can be no assurance that unrealized values will be realized at the valuations indicated.
(3)The gross MoIC is calculated at the fund-level and is based on the interests of all partners. If applicable, limiting the gross MoIC to exclude interests attributable to the non-fee paying limited partners and/or the general partner who does not pay management fees or carried interest would have no material impact on the result. The gross MoIC is before giving effect to management fees, carried interest, as applicable, and other expenses, but after giving effect to credit facility interest expenses, as applicable. The funds may utilize a short-term credit facility for general cash management purposes, as well as a long-term credit facility as permitted by the respective fund’s governing documentation. The gross fund-level MoIC would have generally been lower had such fund called capital from its partners instead of utilizing the credit facility.
(4)The net MoIC is calculated at the fund-level and is based on the interests of the fee-paying limited partners and if applicable, excludes those interests attributable to the non-fee paying limited partners and/or the general partner which does not pay management fees or carried interest. The net MoIC is after giving effect to management fees and other expenses, carried interest and credit facility interest expense, as applicable. The funds may utilize a short-term credit facility for general cash management purposes, as well as a long-term credit facility as permitted by the respective fund’s governing documentation. The net fund-level MoICs would generally have been lower had such fund called capital from its limited partners instead of utilizing the credit facility.
(5)The gross IRR is an annualized since inception gross internal rate of return of cash flows to and from the fund and the fund’s residual value at the end of the measurement period. Gross IRR reflects returns to all partners. If applicable, limiting the gross IRR to exclude interests attributable to the non-fee paying limited partners and/or the general partner who does not pay management fees or carried interest would have no material impact on the result. The cash flow dates used in the gross IRR calculation are based on the actual dates of the cash flows. The gross IRRs are calculated before giving effect to management fees, carried interest, as applicable, and other expenses, but after giving effect to credit facility interest expenses, as applicable. The funds may utilize a short-term credit facility for general cash management purposes, as well as a long-term credit facility as permitted by the respective fund’s governing documents. The gross fund-level IRR would generally have been lower had such fund called capital from its partners instead of utilizing the credit facility.
(6)The net IRR is an annualized since inception net internal rate of return of cash flows to and from the fund and the fund’s residual value at the end of the measurement period. Net IRRs reflect returns to the fee-paying limited partners and, if applicable, exclude interests attributable to the non-fee paying limited partners and/or the general partner who does not pay management fees or carried interest. The cash flow dates used in the net IRR calculations are based on the actual dates of the cash flows. The net IRRs are calculated after giving effect to management fees and other expenses, carried interest and credit facility interest expenses, as applicable. The funds may utilize a short-term credit facility for general cash management purposes, as well as a long-term credit facility as permitted by the respective fund’s governing documents. Net fund-level IRRs would generally have been lower had such fund called capital from its limited partners instead of utilizing the credit facility.
(7)The results of each fund is presented on a combined basis with the affiliated parallel funds or accounts, given that the investments are substantially the same.
Operations Management Group—Three Months Ended March 31, 2024Compared to Three Months Ended March 31, 2023
Fee Related Earnings
The following table presents the components of the Operations Management Group’s FRE ($ in thousands):
Three months ended March 31,
Favorable (Unfavorable)
2024
2023
$ Change
% Change
Other fees
$
4,333
$
4,640
$
(307)
(7)%
Compensation and benefits
(94,157)
(84,967)
(9,190)
(11)
General, administrative and other expenses
(50,480)
(46,172)
(4,308)
(9)
Fee Related Earnings
$
(140,304)
$
(126,499)
(13,805)
(11)
Other Fees. The decrease in other fees for the three months ended March 31, 2024 compared to the three months ended March 31, 2023 was primarily driven by lower asset-based, net distribution fees associated with our non-traded REITs.
Compensation and Benefits. The increase in compensation and benefits for the three months ended March 31, 2024, compared to the three months ended March 31, 2023 was primarily driven by: (i) the expansion of our strategy and relationship management teams to support global fundraising; (ii) the expansion of our business operations teams to support the growth of our business and other strategic initiatives; (iii) increased compensation and benefits associated with our retail distribution channel, AWMS, which included higher employee commissions due to increased sales volumes from ASIF and APMF; and (iv) increase in payroll related taxes primarily due to our higher stock price associated with the restricted units that vested during the period. Average headcount increased by 13% to 1,593 professionals for the quarter-to-date period in 2024 from 1,415 professionals for the same period in 2023.
General, Administrative and Other Expenses. Certain expenses increased during the current period, including occupancy costs, information services and information technology costs. These expenses collectively increased by $5.1 million for the three months ended March 31, 2024 compared to the same period in 2023 to support our growing headcount and the expansion of our business, including occupancy costs for our new corporate headquarters that will be in use later this year.
Realized Income
The following table presents the components of the OMG’s RI ($ in thousands):
Three months ended March 31,
Favorable (Unfavorable)
2024
2023
$ Change
% Change
Fee Related Earnings
$
(140,304)
$
(126,499)
$
(13,805)
(11)%
Interest and other investment income (loss)—realized
452
(92)
544
NM
Interest expense
(40)
(26)
(14)
(54)
Realized net investment income (loss)
412
(118)
530
NM
Realized Income
$
(139,892)
$
(126,617)
(13,275)
(10)
Liquidity and Capital Resources
Management assesses liquidity in terms of our ability to generate cash to fund operating, investing and financing activities. Management believes that the Company is well-positioned and its liquidity will continue to be sufficient for its foreseeable working capital needs, contractual obligations, dividend payments, pending acquisitions and strategic initiatives.
Sources and Uses of Liquidity
Our sources of liquidity are: (i) cash on hand; (ii) net working capital; (iii) cash from operations, including management fees and fee related performance revenues, which are collected monthly, quarterly or semi-annually, and net realized performance income, which may be unpredictable as to amount and timing; (iv) fund distributions related to our investments that are unpredictable as to amount and timing; and (v) net borrowings from the Credit Facility. As of March 31, 2024, our cash and cash equivalents were $346.3 million and we have $425.0 million available under our Credit Facility. Our ability to draw from the Credit Facility is subject to leverage and other covenants. We remain in compliance with all covenants as of March 31, 2024. We believe that these sources of liquidity will be sufficient to fund our working capital requirements and to meet our commitments in the ordinary course of business and under the current market conditions for the foreseeable future.
Cash flows from management fees may be impacted by a slowdown in deployment, declines in valuations or negatively impacted fundraising. In addition, management fees may be subject to deferral and fee related performance revenues may be subject to hold backs. Declines or delays in transaction activity may impact our fund distributions and net realized performance income, which could adversely impact our cash flows and liquidity. Market conditions may make it difficult to extend the maturity or refinance our existing indebtedness or obtain new indebtedness with similar terms.
We expect that our primary liquidity needs will continue to be to: (i) provide capital to facilitate the growth of our existing investment management businesses; (ii) fund our investment commitments; (iii) provide capital to facilitate our expansion into businesses that are complementary to our existing investment management businesses as well as other strategic growth initiatives; (iv) pay operating expenses, including cash compensation to our employees; (v) fund capital expenditures; (vi) service our debt; (vii) pay income taxes and make payments under the tax receivable agreement (“TRA”); (viii) make dividend payments to our Class A and non-voting common stockholders in accordance with our dividend policy; and (ix) pay distributions to AOG unitholders.
In the normal course of business, we expect to pay dividends to our Class A and non-voting common stockholders that are aligned with our expected FRE after an allocation of current taxes paid. For the purposes of determining this amount, we allocate the current taxes paid to FRE and to realized performance and investment income in a manner that may be disproportionate to earnings generated by these metrics, and the actual taxes paid on these metrics should they be considered separately. Additionally, our methodology uses the tax benefits from certain expenses that are not included in these non-GAAP metrics, such as equity-based compensation from the vesting of restricted units and from the amortization of intangible assets, among others. We allocate the taxes by multiplying the statutory tax rate currently in effect by our net realized performance and net investment income and removing this amount from total current taxes. The remaining current tax paid is the amount that we allocate to FRE. We use this method to allocate the current provision for income taxes to approximate the amount of cash that is available to pay dividends to our stockholders. If cash flows from operations were insufficient to fund dividends over a sustained period of time, we expect that we would suspend or reduce paying such dividends. In addition, there is no assurance that dividends would continue at the current levels or at all.
Our ability to obtain debt financing and complete stock offerings provides us with additional sources of liquidity. For further discussion of financing transactions occurring in the current period, see “Cash Flows” within this section and “Note 6. Debt” and “Note 12. Equity and Redeemable Interest” within our unaudited condensed consolidated financial statements included in this Quarterly Report on Form 10-Q.
Our unaudited condensed consolidated financial statements reflect the cash flows of our operating businesses as well as those of our Consolidated Funds. The assets of our Consolidated Funds, on a gross basis, are significantly larger than the assets of our operating businesses and therefore have a substantial effect on the amounts reported within our condensed consolidated statements of cash flows. The primary cash flow activities of our Consolidated Funds include: (i) raising capital from third-party investors, which is reflected as non-controlling interests of our Consolidated Funds; (ii) financing certain investments by issuing debt; (iii) purchasing and selling investment securities; (iv) generating cash through the realization of certain investments; (v) collecting interest and dividend income; and (vi) distributing cash to investors. Our Consolidated Funds are generally accounted for as investment companies under GAAP; therefore, the character and classification of all Consolidated Fund transactions are presented as cash flows from operations. Liquidity available at our Consolidated Funds is not available for corporate liquidity needs, and debt of the Consolidated Funds is non–recourse to the Company except to the extent of the Company’s investment in the fund.
The following tables summarize our condensed consolidated statements of cash flows by activities attributable to the Company and Consolidated Funds. For more details on the activity of the Company and Consolidated Funds, refer to “Note 14. Consolidation” within our unaudited condensed consolidated financial statements included in this Quarterly Report on Form 10-Q.
Three months ended March 31,
2024
2023
Net cash provided by operating activities
$
458,363
$
148,315
Net cash provided by the Consolidated Funds’ operating activities, net of eliminations
251,682
559,257
Net cash provided by operating activities
710,045
707,572
Net cash used in the Company’s investing activities
(34,071)
(8,877)
Net cash used in the Company’s financing activities
(424,232)
(260,400)
Net cash used in the Consolidated Funds’ financing activities, net of eliminations
(242,400)
(560,744)
Net cash used in financing activities
(666,632)
(821,144)
Effect of exchange rate changes
(11,285)
4,711
Net change in cash and cash equivalents
$
(1,943)
$
(117,738)
The Consolidated Funds had no effect on cash flows attributable to the Company for the periods presented and are excluded from the discussion below. The following discussion focuses on cash flow by activities attributable to the Company.
Operating Activities
In the table below, cash flows from operations are summarized to present: (i) cash generated from our core operating activities, primarily consisting of profits generated principally from management fees and fee related performance revenues after covering for operating expenses and fee related performance compensation; (ii) net realized performance income; and (iii) net cash from investment related activities including purchases, sales, realized net investment income and interest payments. We generated meaningful cash flow from operations in each period presented.
Three months ended March 31,
Favorable (Unfavorable)
2024
2023
$ Change
% Change
Core operating activities
$
335,306
$
227,264
$
108,042
48%
Net realized performance income
50,733
(86,835)
137,568
(158)
Net cash provided by investment related activities
72,324
7,886
64,438
NM
Net cash provided by operating activities
$
458,363
$
148,315
310,048
209
Cash generated from our core operating activities increased as a result of growing fee revenues and sustained profitability. Additionally, cash generated from our core operating activities for the three months ended March 31, 2023 was lower when compared to the three months ended March 31, 2024 primarily due to timing of cash collection, including deferring cash collection of our fourth quarter 2022 Part I Fees from the first quarter of 2023 to April 2023.
Net realized performance income represents a source of cash and includes: (i) carried interest distributions that may represent tax distributions or other distributions of income; and (ii) incentive fees that are realized annually at the end of the measurement period, which is typically at the end of the calendar year. Cash received from carried interest distributions and the subsequent payments to employees may not necessarily occur in the same quarter. Cash from the incentive fee activities is generally received in the period subsequent to the measurement period. The increase in net realized performance income over the comparative periods was primarily due to timing of payments to employees for: (i) tax distributions that were both received and paid in the fourth quarter 2023, while tax distributions received in the fourth quarter of 2022 were paid in the first quarter of 2023; and (ii) carried interest distributions and incentive fees that were received in the first quarter of 2024 but not paid as of the end of the quarter.
Net cash provided by investment related activities for the three months ended March 31, 2024 and 2023 primarily represents: (i) distributions received from our capital investments and the repayment of loans that we have made; (ii) sales of our capital investments to employees; offset by (iii) purchases associated with funding capital commitments and strategic investments in our investment portfolio; and (iv) interest payments on our debt obligations. Our investment related activities may fluctuate depending on timing of capital investments and distributions of each fund from year to year. For further discussion of our capital commitments, see “Note 7. Commitments and Contingencies,” within our unaudited condensed consolidated financial statements included in this Quarterly Report on Form 10-Q.
Our working capital needs are generally rising to support the growth of our business, while the capital requirements needed to support fund-related activities vary based upon the specific investment activities being conducted during such period.
Investing Activities
Three months ended March 31,
2024
2023
Purchase of furniture, equipment and leasehold improvements, net of disposals
$
(26,071)
$
(8,877)
Acquisitions, net of cash acquired
(8,000)
—
Net cash used in investing activities
$
(34,071)
$
(8,877)
Net cash used in the Company’s investing activities was principally composed of cash to purchase furniture, fixtures, equipment and leasehold improvements during both periods to support the growth in our staffing levels and to expand our global presence. Net cash used in the Company’s investing activities for the three months ended March 31, 2024 was predominantly for the build out of our new corporate headquarters that will be in use later this year.
Financing Activities
Three months ended March 31,
2024
2023
Net borrowings of Credit Facility
$
80,000
$
95,000
Class A and non-voting common stock dividends
(190,504)
(145,386)
AOG unitholder distributions
(129,542)
(106,246)
Stock option exercises
1,511
9,180
Taxes paid related to net share settlement of equity awards
(186,731)
(113,431)
Other financing activities
1,034
483
Net cash used in the Company’s financing activities
$
(424,232)
$
(260,400)
As a result of generating higher fee related earnings, we increased the level of dividends paid to a growing shareholder base of Class A and non-voting common stockholders and distributions paid to AOG unitholders, resulting in net cash used in the Company’s financing activities for the three months ended March 31, 2024 and 2023.
In connection with the vesting of restricted units that are granted to our employees under the 2023 Equity Incentive Plan (the “Equity Incentive Plan”), we withhold shares equal to the fair value of our employees’ tax withholding liabilities and pay the taxes on their behalf in cash and thus net issue fewer shares. The use of cash increased from the prior year period as a result of our higher stock price, which resulted in employees recognizing additional compensation. For the three months ended March 31, 2024 and 2023, we net settled and did not issue 1.6 million shares and 1.4 million shares, respectively. The Company’s financing activities also included cash received from stock options exercises with 0.1 million and 0.5 million options exercised for the three months ended March 31, 2024 and 2023, respectively. There were no options outstanding as of March 31, 2024, and we will no longer receive cash or realize any tax benefit from the exercise of stock options.
We intend to use a portion of our available liquidity to pay cash dividends to our Class A and non-voting common stockholders on a quarterly basis in accordance with our dividend policy. Our ability to make cash dividends is dependent on a myriad of factors, including: (i) general economic and business conditions; (ii) our strategic plans and prospects; (iii) our business and investment opportunities; (iv) timing of capital calls by our funds in support of our commitments; (v) our financial condition and operating results; (vi) working capital requirements and other anticipated cash needs; (vii) contractual restrictions and obligations; (viii) legal, tax and regulatory restrictions; (ix) restrictions on the payment of distributions by our subsidiaries to us; and (x) other relevant factors.
We are required to maintain minimum net capital balances for regulatory purposes for our broker-dealer entities. These net capital requirements are met in part by retaining cash, cash equivalents and investment securities. Additionally, certain of our subsidiaries operating outside the U.S. are also subject to capital adequacy requirements in each of the applicable jurisdictions. As a result, we may be restricted in our ability to transfer cash between different operating entities and jurisdictions. As of March 31, 2024, we were required to maintain approximately $64.6 million in net assets within these subsidiaries to meet regulatory net capital and capital adequacy requirements. We remain in compliance with all regulatory requirements.
Holders of AOG Units, subject to the terms of the exchange agreement, may exchange their AOG Units for shares of our Class A common stock on a one-for-one basis. These exchanges are expected to result in increases in the tax basis of the tangible and intangible assets of AMC that otherwise would not have been available. These increases in tax basis may increase depreciation and amortization for U.S. income tax purposes and thereby reduce the amount of tax that we would otherwise be required to pay in the future. We entered into the TRA that provides payment to the TRA recipients of 85% of the amount of actual cash savings (“Cash Tax Savings”), if any, in U.S. federal, state, local and foreign income tax or franchise tax that we actually realize as a result of these increases in tax basis and of certain other tax benefits related to entering into the TRA, including tax benefits attributable to payments under the TRA and interest accrued thereon (“Tax Benefit Payment”). Effective as of May 1, 2023, pursuant to an amendment to the TRA, to the extent Ares Owners Holdings L.P. would have been a recipient of certain Tax Benefit Payments under the TRA for taxable exchanges on or after May 1, 2023, Ares Owners Holdings L.P. will no longer be entitled to any Tax Benefit Payment for such exchanges and 100% of any Cash Tax Savings will inure to us. Future payments under the TRA in respect of subsequent exchanges are expected to be substantial. The TRA liability balance was $236.1 million and $191.3 million as of March 31, 2024 and December 31, 2023, respectively.
For a discussion of our debt obligations, including the debt obligations of our consolidated funds, see “Note 6. Debt,” within our unaudited condensed consolidated financial statements included in this Quarterly Report on Form 10-Q.
Critical Accounting Estimates
We prepare our unaudited condensed consolidated financial statements in accordance with GAAP. In applying many of these accounting principles, we need to make assumptions, estimates or judgments that affect the reported amounts of assets, liabilities, revenues and expenses in our unaudited condensed consolidated financial statements. We base our estimates and judgments on historical experience and other assumptions that we believe are reasonable under the circumstances. These assumptions, estimates or judgments, however, are both subjective and subject to change, and actual results may differ from our assumptions and estimates. If actual amounts are ultimately different from our estimates, the revisions are included in our results of operations for the period in which the actual amounts become known. For a summary of our significant accounting policies, see “Note 2. Summary of Significant Accounting Policies,” to our unaudited condensed consolidated financial statements included in this Quarterly Report on Form 10-Q and in our Annual Report on Form 10-K for the year ended December 31, 2023. For a summary of our critical accounting estimates, please see “Management’s Discussion and Analysis of Financial Condition and Results of Operations—Critical Accounting Estimates” in our Annual Report on Form 10-K.
Recent Accounting Pronouncements
Information regarding recent accounting pronouncements and their impact on the Company can be found in “Note 2. Summary of Significant Accounting Policies,” within our unaudited condensed consolidated financial statements included in this Quarterly Report on Form 10-Q.
Commitments and Contingencies
In the normal course of business, we enter into contractual obligations that may require future cash payments. We may also engage in off-balance sheet arrangements, including transactions in derivatives, guarantees, capital commitments to funds,
indemnifications and potential contingent payment obligations. For further discussion of these arrangements, see “Note 7. Commitments and Contingencies” to our unaudited condensed consolidated financial statements included in this Quarterly Report on Form 10-Q.
Item 3. Quantitative and Qualitative Disclosures About Market Risk
Our primary exposure to market risk is related to our role as general partner or investment adviser to our funds and the sensitivity to movements in the fair value of their investments, including the effect on management fees, performance income and investment income.
Market Risk
The market price of investments may significantly fluctuate during the period of investment. Investments may decline in value due to factors affecting securities markets generally or particular industries represented in the securities markets. The value of an investment may decline due to general market conditions, which are not specifically related to such investment, such as real or perceived adverse economic conditions, changes in the general outlook for corporate earnings, changes in interest or currency rates or adverse investor sentiment generally. It may also decline due to factors that affect a particular industry or industries, such as labor shortages or increased production costs, supply chain constraints and competitive conditions within an industry.
Our credit orientation has been a central tenet of our business across our debt and equity investment strategies. We believe the combination of high-quality proprietary information flow and a consistent, rigorous approach to managing investments across our strategies has been, and we believe will continue to be, a major driver of our strong risk-adjusted returns and the stability and predictability of our income.
Exchange Rate Risk
We and our funds hold investments that are denominated in foreign currencies that may be affected by movements in the rate of exchange between those currencies and the U.S. dollar. Movements in the exchange rate between currencies impact the management fees, carried interest and incentive fees earned by funds with fee paying AUM denominated in foreign currencies as well as by funds with fee paying AUM denominated in U.S. dollars that hold investments denominated in foreign currencies. Additionally, movements in the exchange rate impact operating expenses for our global offices that transact in foreign currencies and the revaluation of assets and liabilities denominated in non-functional currencies, including cash balances and investments.
We manage our exposure to exchange rate risks through our regular operating activities, wherein we utilize payments received in foreign currencies to fulfill obligations in foreign currencies, and, when appropriate, through the use of derivative financial instruments to hedge the net foreign currency exposure in: the funds that we advise; the balance sheet exposure for certain direct investments denominated in foreign currencies; and the cash flow exposure for foreign currencies.
Credit Risk
We are party to agreements providing for various financial services and transactions that contain an element of risk in the event that the counterparties are unable to meet the terms of such agreements. In such agreements, we depend on the counterparty to make payment or otherwise perform. We generally endeavor to minimize our risk of exposure by limiting to reputable financial institutions the counterparties with which we enter into financial transactions. In other circumstances, availability of financing from financial institutions may be uncertain due to market events, and we may not be able to access these financing markets.
In the ordinary course of business, we may extend loans to our funds or guarantee credit facilities held by our funds and could be subject to risk of loss or repayment if our funds do not perform.
Certain of our funds’ investments include lower-rated and comparable quality unrated distressed investments and other instruments. These issuers can be more sensitive to adverse market conditions, such as a recession or increasing interest rates, as compared to higher rated issuers. We seek to minimize risk exposure by subjecting each prospective investment to our rigorous, credit-oriented investment approach.
As of March 31, 2024 and December 31, 2023, we had cash balances with financial institutions in excess of Federal Deposit Insurance Corporation insured limits. We seek to mitigate this exposure by monitoring the credit standing of these financial institutions.
There have been no material changes in our market risks for the three months ended March 31, 2024. For additional information on our market risks, refer to our Annual Report on Form 10-K for the year ended December 31, 2023, which is accessible on the SEC’s website at www.sec.gov.
Item 4. Controls and Procedures
Evaluation of Disclosure Controls and Procedures
We maintain disclosure controls and procedures (as that term is defined in Rules 13a-15(e) and 15d-15(e) under the Exchange Act) that are designed to ensure that information required to be disclosed in our reports under the Exchange Act is recorded, processed, summarized and reported within the time periods specified in the SEC’s rules and forms, and that such information is accumulated and communicated to our management, including our principal executive officer and principal financial officer, as appropriate, to allow timely decisions regarding required disclosures. Any controls and procedures, no matter how well designed and operated, can provide only reasonable assurance of achieving the desired control objectives. Our management, with the participation of our principal executive officer and principal financial officer, has evaluated the effectiveness of the design and operation of our disclosure controls and procedures as of March 31, 2024. Based upon that evaluation and subject to the foregoing, our principal executive officer and principal financial officer concluded that, as of March 31, 2024, the design and operation of our disclosure controls and procedures were effective to accomplish their objectives at the reasonable assurance level.
Changes in Internal Control over Financial Reporting
There have been no changes in our internal control over financial reporting (as defined in Rule 13a-15(f) and 15d-15(f) under the Exchange Act) during the quarter ended March 31, 2024 that have materially affected, or that are reasonably likely to materially affect, our internal control over financial reporting.
From time to time, we, our executive officers, directors and our funds and their investment advisers, and their respective affiliates and/or any of their respective principals and employees are subject to legal proceedings, including those arising from our management of such funds, and, as a result, incur significant costs and expenses in connection with such legal proceedings.
We and our funds and their investment advisers are also subject to extensive regulation, which, from time to time, results in requests for information from us or our funds and their investment advisers or legal or regulatory proceedings or investigations against us or our funds and their investment advisers, respectively. We incur significant costs and expenses in connection with any such information requests, proceedings and investigations.
Item 1A. Risk Factors
In addition to the other information set forth in this report, you should carefully consider the risk factors described in Part I, “Item 1A. Risk Factors” in our Annual Report on Form 10-K for the year ended December 31, 2023, which is accessible on the SEC’s website at www.sec.gov. The risks described in our Annual Report on Form 10-K for the year ended December 31, 2023 are not the only risks facing us. These risks and additional risks and uncertainties not currently known to us or that we currently deem to be immaterial also may materially and adversely affect our business, financial condition and/or operating results.
Item 2. Unregistered Sales of Equity Securities and Use of Proceeds
We did not sell any equity securities during the period covered in this report that were not registered under the Securities Act.
All unregistered purchases of equity securities during the period covered by this Quarterly Report were previously disclosed in our current reports on Form 8-K or quarterly reports on Form 10-Q.
As permitted by our policies and procedures governing transactions in our securities by our directors, executive officers and other employees, from time to time some of these persons may establish plans or arrangements complying with Rule 10b5-1 under the Exchange Act, and similar plans and arrangements relating to our Class A common stock.
During the three months ended March 31, 2024, certain executive officers and directors of the Company or a vehicle controlled by them (each, a “Plan Participant”) entered into Rule 10b5-1 trading plan (a “Rule 10b5-1 Trading Plan”) to sell shares of the Company’s Class A common stock, in each case, subject to any applicable volume limitations.
The table below provides certain information regarding each Plan Participant’s Rule 10b5-1 Trading Plan.
Name and Title
Plan Date
Maximum Shares That May Be Sold Under the Plan
Plan Expiration Date
R. Kipp deVeer, Director and Head of Credit Group
February 28, 2024
41,676
February 28, 2025
Bennett Rosenthal, Director, Co-Founder and Chairman of Private Equity Group
March 1, 2024
250,000
January 31, 2025
David Kaplan, Director and Co-Founder
March 1, 2024
250,000
January 31, 2025
A Rule 10b5-1 Trading Plan is a written document that pre-establishes the amounts, prices and dates (or formulas for determining the amounts, prices and dates) of future purchases or sales of the Company’s common stock, including, if applicable, shares issued upon exercise of stock options or vesting of restricted stock units.
Each Plan Participant’s Rule 10b5-1 Trading Plan was adopted during an authorized trading period and when such Plan Participant was not in possession of material non-public information and is intended to satisfy the affirmative defense of Rule 10b5-1(c) under the Exchange Act.
Second Amended and Restated Certificate of Incorporation of Ares Management Corporation (incorporated by reference to Exhibit 3.1 to the Registrant’s Quarterly Report on Form 10-Q (File No. 001-36429) filed with the SEC on May 6, 2021).
Bylaws of Ares Management Incorporation (incorporated by reference to Exhibit 99.4 to the Registrant’s Current Report on Form 8-K (File No. 001-36429) filed with the SEC on November 15, 2018).
Form of Annual Incentive Fee Award letter (incorporated by reference to Exhibit 10.26 to the Registrant's Annual Report on Form 10-K (File No. 001-36429) filed with the SEC on February 27, 2024).
Form of Annual Incentive Fee Restricted Unit Agreement under the 2023 Equity Incentive Plan (incorporated by reference to Exhibit 10.47 to the Registrant's Annual Report on Form 10-K (File No. 001-36429) filed with the SEC on February 27, 2024).
Amendment No. 12, dated as of March 28, 2024, to the Sixth Amended and Restated Senior Credit Agreement, dated as of April 21, 2014, by and among Ares Holdings L.P., the Guarantors party thereto, the Lenders party thereto and JPMorgan Chase Bank, N.A. (incorporated by reference to Exhibit 10.1 to the Registrant’s Current Report on Form 8-K (File No. 001-36429) filed with the SEC on April 3, 2024).
Certification of the Chief Executive Officer and Chief Financial Officer pursuant to 18 U.S.C. Section 1350.
101.INS
XBRL Instance Document - the instance document does not appear in the Interactive Data File because its XBRL tags are embedded within the Inline XBRL document.
Cover Page Interactive Data File - the cover page interactive data file does not appear in the Interactive Data File because its XBRL tags are embedded within the Inline XBRL document.
# Denotes a management contract or compensation plan or arrangement.
* Filed herewith. ** These certifications are not deemed filed by the SEC and are not to be incorporated by reference in any filing we make under the Securities Act of 1933 or the Securities Exchange Act of 1934, irrespective of any general incorporation language in any filings.
Pursuant to the requirements of the Securities Exchange Act of 1934, the registrant has duly caused this report to be signed on its behalf by the undersigned thereunto duly authorized.
ARES MANAGEMENT CORPORATION
Dated: May 9, 2024
By:
/s/ Michael J Arougheti
Name:
Michael J Arougheti
Title:
Co-Founder, Chief Executive Officer & President (Principal Executive Officer)