![]()
Year Ended December 31, 2025
| INTRODUCTION |
The following Management's Discussion and Analysis ("MD&A") of IAMGOLD Corporation ("IAMGOLD" or the "Company"), dated February 17, 2026, should be read in conjunction with IAMGOLD's audited consolidated financial statements and related notes as at and for the fiscal year ended December 31, 2025. All figures in this MD&A are in U.S. dollars and tabular dollar amounts are in millions, unless stated otherwise. Additional information on IAMGOLD can be found at www.iamgold.com. However, the information on the website is not in any way incorporated in or made a part of this MD&A.
| ABOUT IAMGOLD |
IAMGOLD is an intermediate gold producer and developer based in Canada with operating mines in North America and West Africa, including Côté Gold (Canada), Westwood (Canada) and Essakane (Burkina Faso). The Côté Gold Mine ("Côté" or "Côté Gold") is among the largest gold mines in production in Canada, which IAMGOLD operates in a 70|30 partnership with Sumitomo Metal Mining Co. Ltd. ("SMM"). In addition, the Company has an established portfolio of early stage and advanced exploration projects within high potential mining districts, including the large-scale Nelligan Mining Complex located in Quebec, Canada.
IAMGOLD employs approximately 3,700 people and is committed to maintaining its culture of accountable mining through high standards of Environmental, Social and Governance ("ESG") practices. IAMGOLD is listed on the New York Stock Exchange (NYSE:IAG) and the Toronto Stock Exchange (TSX:IMG).
| HIGHLIGHTS |
Operating and financial results
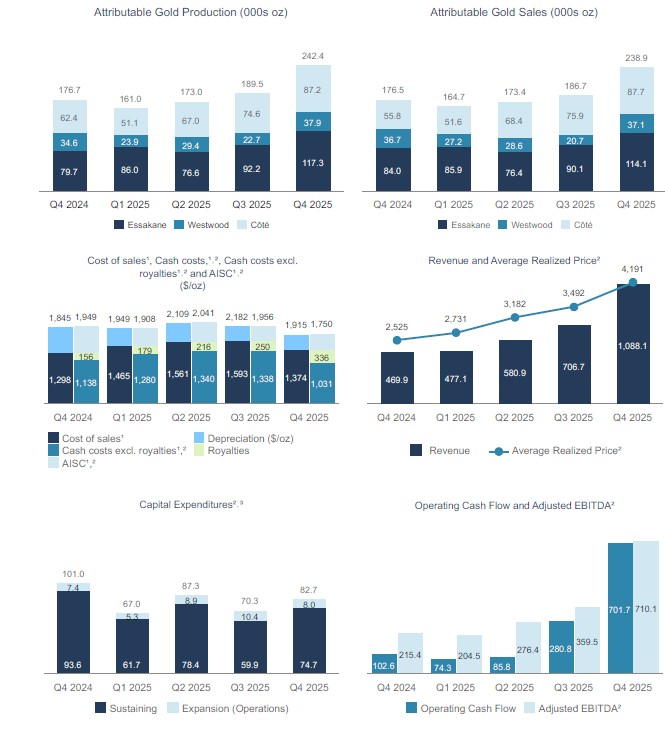
• Attributable gold production for the fourth quarter was 242,400 ounces and 765,900 ounces for the year, achieving the mid-point of the Company's 2025 production guidance of 735,000 to 820,000 ounces, following record quarterly production at all of its operations, including at Côté Gold which achieved the top end of its guidance target.
• Côté produced a record 87,200 attributable ounces (124,600 ounces | 100%) in the fourth quarter, and 279,900 attributable ounces (399,800 ounces | 100%) for the full year, achieving the top end of the attributable 2025 production guidance range of 250,000 to 280,000 ounces (360,000 to 400,000 ounces | 100%).
• Westwood produced a record 37,900 ounces in the fourth quarter and 113,900 ounces for the full year, below the bottom end of the 2025 guidance range of 125,000 to 140,000 ounces.
• Essakane produced 117,300 attributable ounces (a record 138,100 ounces | 100%) in the fourth quarter and 372,100 attributable ounces (427,200 ounces | 100%) for the full year, exceeding the mid-point of the production guidance range on a 100% basis.
• Revenues in the fourth quarter totaled $1,088.1 million from sales of 259,000 ounces at an average realized gold price of $4,191 per ounce1. For the year, revenues were $2,852.8 million from sales of 817,800 ounces at an average realized gold price of $3,482 per ounce1. The average realized gold price for the year ended 2025, excluding the impact of the 2024 gold prepay arrangement, was $3,549 per ounce (see "Financial Condition - Gold prepay arrangements").
• Cost of sales per ounce sold was $1,374 for the fourth quarter and $1,489 for the year.
• Cash cost1 per ounce sold, excluding royalties, was $1,031 for the fourth quarter and $1,230 for the year.
• Cash cost1 per ounce sold, including royalties, was $1,367 for the fourth quarter and $1,484 for the year, compared to the guidance range of $1,375 to $1,475.
• AISC1 per ounce sold was $1,750 for the fourth quarter and $1,900 for the year, within the guidance range of $1,830 to $1,930.
• Net earnings and adjusted net earnings attributable to equity holders1 was $406.6 million and $405.8 million for the fourth quarter, and $664.4 million and $709.2 million for the year, respectively.
• Net earnings and adjusted net earnings per share attributable to equity holders1 of $0.70 and $0.70 for the fourth quarter, respectively; for the year, net earnings and adjusted net earnings per share attributable to equity holders1 of $1.16 and $1.23 respectively.
• Net cash from operating activities was $701.7 million for the fourth quarter, and $1,142.6 million for the year. Net cash from operating activities, before movements in working capital and non-current ore stockpiles1, was $691.6 million for the fourth quarter and $1,204.4 million for the year.
___________________________
1. This is a non-GAAP financial measure. See "Non-GAAP Financial Measures".
• Earnings before interest, income taxes, depreciation and amortization ("EBITDA")1 was $685.5 million for the fourth quarter and $1,502.9 million for the year, and Adjusted EBITDA1 was $710.1 million for the fourth quarter and $1,550.5 million for the year.
• Record mine-site free cash flow1 of $626.6 million for the fourth quarter and $1,199.0 million for the year, including attributable mine-site free cash flow from Côté of $197.0 million for the fourth quarter.
• The Company has available liquidity1 of $868.6 million, mainly comprised of cash and cash equivalents of $421.9 million and the available balance of the revolving credit facility ("Credit Facility") of $445.7 as at December 31, 2025. Net debt was $344.4 million at December 31, 2025, a reduction of $514.9 million during the year.
• In health and safety, for the year ended December 31, 2025, the Company reported a total recordable injuries frequency rate ("TRIFR") of 0.60 for the year, tracking below the prior year performance. IAMGOLD is continuing to advance its critical risk management and visible leadership to improve safety and reduce high-potential incidents.
2026 Outlook
• Total attributable production for IAMGOLD in 2026 is expected to be in the range of 720,000 to 820,000 ounces, as operations at Côté Gold focus on sustainable operations at nameplate operating rates ahead of the technical report outlining the expansion plans which is expected to be announced in the fourth quarter 2026.
• Cash costs1, excluding royalties, are expected to average $1,100 to $1,250 per ounce sold. With the current strong gold price environment, royalties account for an average of approximately $325 per ounce sold - based on a gold price assumption for 2026 of $4,000 per ounce. Cash costs1, including royalties, are expected to average $1,425 to $1,575 per ounce sold.
Mineral Reserves and Resources Update
• On February 17, 2026, IAMGOLD announced its updated Mineral Reserves and Resources statement as of December 31, 2025.
• Proven and Probable ("P&P") Mineral Reserves (100% basis) total 9.9 million ounces of gold in 279.6 million tonnes ("Mt") at 1.10 g/t Au (7.5 million ounces attributable). P&P Mineral Reserves decreased 7%, or 796,000 ounces, from the prior year, primarily due to depletion at Côté Gold and Essakane partially offset by an increase in Mineral Reserves at Westwood.
• Measured and Indicated ("M&I") Mineral Resources (100% basis) increased 16% to 31.0 million ounces of gold in 1.0 billion tonnes ("Bt") at 0.94 g/t Au (24.6 million ounces attributable). The increase was primarily associated with the conversion of Inferred Mineral Resources in the Gosselin deposit at Côté Gold and Nelligan deposit, coupled with the inclusion of the Philibert and Chevrier deposits as part of the Northern Superior transaction towards the end of the year.
Corporate
• Allocated $400 million of free cash flows generated in the fourth quarter to repay the remaining balance of $300 million of the second lien term loan, repay $50 million of the Credit Facility and purchased 3 million shares for $50 million as part of the share buyback program. Subsequent to quarter end, the Company has purchased an additional 2.6 million shares for $50 million. Essakane's attributable free cash flow for 2026 is expected to be approximately $400 to $500 million at a $4,000 per ounce gold price. The Company intends to use this free cash flow to repurchase shares under its share buyback program as the cash is generated and repatriated from Essakane over the course of 2026.
• $291 million of cash was repatriated from Essakane in the fourth quarter and an additional $171 million subsequent to quarter end, using the new structure that enables payments to be made at any time of the year based on the cash generated in excess of working capital requirements by Essakane.
• Consolidation of Nelligan Mining Complex with the closing of the previously announced acquisitions of all of the issued and outstanding shares of each of Northern Superior Resources Inc. ("Northern Superior") and Mines d'Or Orbec Inc. ("Orbec") by way of a plan of arrangement on December 19, 2025, and December 22, 2025, respectively. The transactions consolidated the Chibougamau region with a dominant land position of approximately 134,000 hectares. The Northern Superior acquisition with the Philibert, Chevrier and Croteau2 projects together with Orbec acquisition with the Muus project are combined with IAMGOLD's Nelligan and Monster Lake Projects (together, the "Nelligan Mining Complex"). The newly combined assets, together, rank as one of the largest pre-production gold camps in Canada with Measured and Indicated Mineral Resources of 4.3 million ounces ("Moz Au") and Inferred Mineral Resources of 7.5 Moz Au. The close proximity of the primary deposits to each other supports the conceptual vision of a central processing facility being fed from multiple ore sources within a 17-kilometre radius.
____________________________
1. This is a non-GAAP financial measure. See "Non-GAAP Financial Measures".
2. At the time of the Northern Superior acquisition, disclosed estimates were 3.75 Moz Au Measured and Indicated Mineral Resources and 8.65 Moz Au Inferred Mineral Resources, which included Croteau. As at December 31, 2025, the Company opted to exclude the mineral resources previously associated with the Croteau property in its year end update, resulting in reported totals of 4.34 Moz Au Measured and Indicated Mineral Resources and 7.50 Moz Au Inferred Mineral Resources.
| OPERATING AND FINANCIAL RESULTS |
For more details and the Company's overall outlook for 2026, see "Outlook", and for individual mines performance, see "Operations". The following table summarizes certain operating and financial results for the three months ended December 31, 2025 (Q4 2025), December 31, 2024 (Q4 2024) and the years ended December 31 for 2025, 2024 and 2023.
| Q4 2025 | Q4 2024 | 2025 | 2024 | 2023 | |||||||||||
| Key Operating Statistics | |||||||||||||||
| ($ millions) | |||||||||||||||
| Gold production - attributable (000s oz) | 242.4 | 176.7 | 765.9 | 666.5 | 465.0 | ||||||||||
| - Côté Gold1 | 87.2 | 62.4 | 279.9 | 124.0 | - | ||||||||||
| - Westwood | 37.9 | 34.6 | 113.9 | 133.7 | 93.4 | ||||||||||
| - Essakane2 | 117.3 | 79.7 | 372.1 | 408.8 | 371.6 | ||||||||||
| Gold sales - attributable (000s oz) | 238.9 | 176.5 | 763.7 | 653.7 | 462.1 | ||||||||||
| - Côté Gold1 | 87.7 | 55.8 | 283.6 | 111.1 | - | ||||||||||
| - Westwood | 37.1 | 36.7 | 113.6 | 133.9 | 90.2 | ||||||||||
| - Essakane2 | 114.1 | 84.0 | 366.5 | 408.7 | 371.9 | ||||||||||
| Cost of sales3 ($/oz sold) | $ | 1,374 | $ | 1,298 | $ | 1,489 | $ | 1,156 | $ | 1,291 | |||||
| - Côté Gold1 | $ | 1,271 | $ | 1,083 | $ | 1,272 | $ | 1,035 | $ | - | |||||
| - Westwood | $ | 1,307 | $ | 1,155 | $ | 1,547 | $ | 1,177 | $ | 1,600 | |||||
| - Essakane2 | $ | 1,475 | $ | 1,504 | $ | 1,640 | $ | 1,182 | $ | 1,216 | |||||
| Cash costs4 - excluding royalties ($/oz sold) | $ | 1,031 | $ | 1,138 | $ | 1,230 | $ | 1,007 | $ | 1,158 | |||||
| - Côté Gold1 | $ | 949 | $ | 902 | $ | 1,020 | $ | 875 | $ | - | |||||
| - Westwood | $ | 1,288 | $ | 1,148 | $ | 1,530 | $ | 1,164 | $ | 1,588 | |||||
| - Essakane2 | $ | 1,011 | $ | 1,291 | $ | 1,300 | $ | 991 | $ | 1,053 | |||||
| Cash costs4 ($/oz sold) | $ | 1,367 | $ | 1,294 | $ | 1,484 | $ | 1,152 | $ | 1,261 | |||||
| - Côté Gold1 | $ | 1,265 | $ | 1,080 | $ | 1,268 | $ | 1,032 | $ | - | |||||
| - Westwood | $ | 1,288 | $ | 1,148 | $ | 1,530 | $ | 1,167 | $ | 1,591 | |||||
| - Essakane2 | $ | 1,471 | $ | 1,501 | $ | 1,636 | $ | 1,179 | $ | 1,181 | |||||
| AISC4 ($/oz sold) | $ | 1,750 | $ | 1,949 | $ | 1,900 | $ | 1,716 | $ | 1,783 | |||||
| - Côté Gold1 | $ | 1,688 | $ | 1,685 | $ | 1,636 | $ | 1,658 | $ | - | |||||
| - Westwood | $ | 1,719 | $ | 1,688 | $ | 2,117 | $ | 1,702 | $ | 2,344 | |||||
| - Essakane2 | $ | 1,674 | $ | 2,118 | $ | 1,888 | $ | 1,625 | $ | 1,521 | |||||
| Average realized gold price4,5 ($/oz) | $ | 4,191 | $ | 2,525 | $ | 3,482 | $ | 2,330 | $ | 1,955 |
1. Attributable portion for Côté Gold is based on IAMGOLD's ownership of 70%. Prior to November 30, 2024, IAMGOLD's attributable portion was 60.3%. See "Operations - Côté Gold, Canada" for more details.
2. IAMGOLD's Essakane ownership interest decreased from 90% to 85% effective June 20, 2025. See "Operations - Essakane, Burkina Faso" for more details. The attributable portion for Essakane is presented as 90% for the first half of 2025 and 85% for the second half of 2025 throughout this MD&A.
3. Throughout this MD&A, cost of sales, excluding depreciation, and cost of sales, excluding depreciation and royalties are disclosed in the segment note in the consolidated financial statements.
4. Refer to the "Non-GAAP Financial Measures" disclosure at the end of this MD&A for a description and calculation of these measures.
5. All prepay delivery obligations were completed by the end of the second quarter 2025. The average realized gold price for the year ended 2025, excluding the impact of the 2024 prepay arrangement (see "Financial Condition - Gold prepay arrangements"), was $3,549 per ounce.
| Q4 2025 | Q4 2024 | 2025 | 2024 | 2023 | ||||||||||||
| Financial Results | ||||||||||||||||
| ($ millions) | ||||||||||||||||
| Revenues | $ | 1,088.1 | $ | 469.9 | $ | 2,852.8 | $ | 1,633.0 | $ | 987.1 | ||||||
| Gross profit | $ | 593.6 | $ | 130.9 | $ | 1,206.2 | $ | 549.9 | $ | 124.1 | ||||||
| EBITDA1 | $ | 685.5 | $ | 259.5 | $ | 1,502.9 | $ | 1,323.0 | $ | 381.0 | ||||||
| - Continuing operations | $ | 685.5 | $ | 259.5 | $ | 1,502.9 | $ | 1,323.0 | $ | 366.6 | ||||||
| - Discontinued operations | $ | - | $ | - | $ | - | $ | - | $ | 14.4 | ||||||
| Adjusted EBITDA1 | $ | 710.1 | $ | 215.4 | $ | 1,550.5 | $ | 780.6 | $ | 338.5 | ||||||
| - Continuing operations | $ | 710.1 | $ | 215.4 | $ | 1,550.5 | $ | 780.6 | $ | 315.1 | ||||||
| - Discontinued operations | $ | - | $ | - | $ | - | $ | - | $ | 23.4 | ||||||
| Net earnings (loss) attributable to equity holders | $ | 406.6 | $ | 86.2 | $ | 664.4 | $ | 819.6 | $ | 94.3 | ||||||
| - Continuing operations | $ | 406.6 | $ | 86.2 | $ | 664.4 | $ | 819.6 | $ | 88.7 | ||||||
| - Discontinued operations | $ | - | $ | - | $ | - | $ | - | $ | 5.6 | ||||||
| Adjusted net earnings (loss) attributable to equity holders1 | $ | 405.8 | $ | 57.2 | $ | 709.2 | $ | 296.0 | $ | 59.3 | ||||||
| - Continuing operations | $ | 405.8 | $ | 57.2 | $ | 709.2 | $ | 296.0 | $ | 44.7 | ||||||
| - Discontinued operations | $ | - | $ | - | $ | - | $ | - | $ | 14.6 | ||||||
| Net earnings (loss) per share attributable to equity holders | $ | 0.70 | $ | 0.15 | $ | 1.16 | $ | 1.52 | $ | 0.18 | ||||||
| to equity holders1 | $ | 0.70 | $ | 0.10 | $ | 1.23 | $ | 0.55 | $ | 0.09 | ||||||
| Net cash from operating activities before changes in working capital1 - continuing operations | $ | 691.6 | $ | 127.2 | $ | 1,204.4 | $ | 600.4 | $ | 158.9 | ||||||
| Net cash from operating activities | $ | 701.7 | $ | 102.6 | $ | 1,142.6 | $ | 486.0 | $ | 159.4 | ||||||
| - Continuing operations | $ | 701.7 | $ | 102.6 | $ | 1,142.6 | $ | 486.0 | $ | 144.0 | ||||||
| - Discontinued operations | $ | - | $ | - | $ | - | $ | - | 15.4 | |||||||
| Mine-site free cash flow1 | $ | 626.6 | $ | 78.2 | $ | 1,199.0 | $ | 385.1 | $ | 54.1 | ||||||
| - Continuing operations | $ | 626.6 | $ | 78.2 | $ | 1,199.0 | $ | 385.1 | $ | 48.2 | ||||||
| - Discontinued operations | $ | - | $ | - | $ | - | $ | - | $ | 5.9 | ||||||
| Capital expenditures1,2 - sustaining | $ | 74.7 | $ | 93.6 | $ | 274.7 | $ | 290.8 | $ | 200.3 | ||||||
| Capital expenditures1,2 - expansion | $ | 8.0 | $ | 7.4 | $ | 32.6 | $ | 196.1 | $ | 656.8 | ||||||
| December 31 | December 31 | December 31 | ||||||||
| 2025 | 2024 | 2023 | ||||||||
| Financial Position ($ millions) | ||||||||||
| Cash and cash equivalents | $ | 421.9 | $ | 347.5 | $ | 367.1 | ||||
| Long-term debt | $ | 649.8 | $ | 1,028.9 | $ | 830.8 | ||||
| Net cash (debt)1 | $ | (344.4 | ) | $ | (859.3 | ) | $ | (649.5 | ) | |
| Available Credit Facility | $ | 445.7 | $ | 418.5 | $ | 387.0 | ||||
1. Refer to the "Non-GAAP Financial Measures" disclosure at the end of this MD&A for a description and calculation of these measures.
2. Sustaining and expansion capital expenditures represent incurred expenditures for property, plant and equipment and exploration and evaluation assets, and exclude right-of-use assets and working capital impacts.
____________________________
1. Cost of sales, including depreciation, cash costs and AISC are expressed on an attributable ounce sold basis (excluding the non-controlling interests at Essakane). See "Operations - Essakane, Burkina Faso".
2. This is a non-GAAP financial measure. See "Non-GAAP Financial Measures".
3. Côté capital expenditures reflect the proportionate interest in Côté Gold UJV on an incurred basis.
| OUTLOOK |
Production (000 oz)
| Actual 2025 | Full Year Guidance 2026 | |
| Côté Gold - (70%) | 279.9 | 270 - 310 |
| Westwood - (100%) | 113.9 | 110 - 130 |
| Essakane - (90% H1 2025 | 85% - H2 2025 and thereafter) | 372.1 | 340 - 380 |
| Total attributable production (000s oz) | 765.9 | 720 - 820 |
Total attributable production for IAMGOLD in 2026 is expected to be in the range of 720,000 to 820,000 ounces, as operations at Côté Gold focus on sustainable operations at nameplate operating rates ahead of the technical report outlining the expansion plans which is expected to be announced in the fourth quarter 2026. For further details, refer to the "Operations" section of each mine below.
The attributable guidance for Essakane is estimated according to IAMGOLD's 85% ownership interest. See "Operations - Essakane, Burkina Faso" for more details.
Costs
| Actual 2025 | Full Year Guidance 2026 | |
| Côté Gold | ||
| Cash costs - excluding royalties ($/oz sold) | $1,020 | $900 - $1,050 |
| Cash costs - including royalties ($/oz sold) | $1,268 | $1,200 - $1,350 |
| AISC ($/oz sold) | $1,636 | $1,775 - $1,925 |
| Westwood | ||
| Cash costs ($/oz sold) | $1,530 | $1,500 - $1,650 |
| AISC ($/oz sold) | $2,117 | $1,950 - $2,100 |
| Essakane | ||
| Cash costs - excluding royalties ($/oz sold) | $1,300 | $1,150 - $1,300 |
| Cash costs - including royalties ($/oz sold) | $1,636 | $1,600 - $1,750 |
| AISC ($/oz sold) | $1,888 | $2,000 - $2,150 |
| Consolidated | ||
| Cost of sales1 ($/oz sold) | $1,489 | $1,425 - $1,575 |
| Cash costs1,2 - excluding royalties ($/oz sold) | $1,230 | $1,100 - $1,250 |
| Cash costs1,2 - including royalties ($/oz sold) | $1,484 | $1,425 - $1,575 |
| AISC1,2 ($/oz sold) | $1,900 | $2,000 - $2,150 |
1. Consists of Côté Gold and Westwood on an attributable basis of 70% and 100%, respectively, and an attributable basis of 90% at Essakane for the first half of 2025 and 85% thereafter.
2. This is a non-GAAP financial measure. See "Non-GAAP Financial Measures".
Cash costs on a consolidated basis, excluding royalties, are expected to be in the range of $1,100 to $1,250 per ounce sold. With the current strong gold price environment, royalties account for an average of approximately $325 per ounce sold - based on a gold price assumption for 2026 of $4,000 per ounce. Cash costs, including royalties, are expected to average $1,425 to $1,575 per ounce sold. AISC for IAMGOLD are expected to be in the range of $2,000 and $2,150 per ounce sold.
The full year guidance for 2026 is based on the following assumptions (before the impact of hedging): an average realized gold price of $4,000 per ounce, USD/CAD exchange rate of 1.35, EUR/USD exchange rate of 1.18, average Brent oil price of $65 per barrel and West Texas Intermediate (WTI) price of $65 per barrel. For expected impacts from fluctuation in these assumptions, refer to the Sensitivity Impact table included in the "Financial Condition" section.
Royalty Sensitivities
| $ per ounce sold | |||
| Gold Price | Consolidated | Côté Gold | Essakane |
| $3,500 | $270 | $245 | $350 |
| $4,000 (guidance price) | $325 | $300 | $450 |
| $4,500 | $390 | $340 | $540 |
| $5,000 | $440 | $385 | $600 |
Capital Expenditures
| Actual 20251 | Full Year Guidance 20262 | |||||||||||||||||
| ($ millions) | Sustaining | Expansion | Total | Sustaining | Expansion | Total | ||||||||||||
| Côté Gold (IMG share) | $ | 103.8 | $ | 23.7 | $ | 127.5 | $ | 160 | $ | 85 | $ | 245 | ||||||
| Westwood | 63.9 | 1.5 | 65.4 | 55 | 30 | 85 | ||||||||||||
| Essakane | 106.9 | 7.4 | 114.3 | 165 | 5 | 170 | ||||||||||||
| $ | 274.6 | $ | 32.6 | $ | 307.2 | $ | 380 | $ | 120 | $ | 500 | |||||||
| Corporate | 0.1 | - | 0.1 | - | - | - | ||||||||||||
| Total3 | $ | 274.7 | $ | 32.6 | $ | 307.3 | $ | 380 | $ | 120 | $ | 500 | ||||||
1. 100% basis, for Westwood and Essakane, 70% for Côté Gold, all on an incurred basis.
2. Capital expenditures guidance (±5%).
3. Includes $7 million of capitalized exploration and evaluation expenditures also included in the Exploration Outlook guidance table.
Sustaining capital expenditures are expected to be approximately $380 million ±5%. Sustaining capital at Côté Gold, on an attributable basis, is expected to total $160 million ±5%, an increase from the prior year due to additional non-recurring plant and infrastructure design changes and improvements identified during the ramp-up to optimize operations and operating costs.
Expansion capital expenditures are expected to total $120 million ±5% in 2026. The Company intends to accelerate spending to de-risk the contemplated Côté expansion; early works include basic mill infrastructure and a significant pushback to expand the operating area of the pit. Additional expansion capital is associated with development works at Westwood to support the study of options to expand the mine in the eastern parts of Westwood underground that could be amenable to bulk mining.
Exploration Outlook
| Actual 2025 | Full Year Guidance 2026 | |||||||||||||||||
| ($ millions) | Capitalized | Expensed | Total | Capitalized | Expensed | Total | ||||||||||||
| Exploration projects - greenfield | $ | 0.2 | $ | 22.0 | $ | 22.2 | $ | 11 | $ | 34 | $ | 45 | ||||||
| Exploration projects - brownfield | 10.8 | 2.1 | 12.9 | 7 | 2 | 9 | ||||||||||||
| $ | 11.0 | $ | 24.1 | $ | 35.1 | $ | 18 | $ | 36 | $ | 54 | |||||||
Exploration expenditures for 2026 are expected to be approximately $54 million, the majority of which will be expensed. The largest exploration spend in 2026 is expected to be the Nelligan complex of approximately $24 million including the construction of certain infrastructure to support an expanding program, Côté Gold of approximately $5 million attributed to IAMGOLD, and Essakane at approximately $6 million.
Income Taxes Paid and Depreciation Outlook
| ($ millions) | Actual 2025 | Full Year Guidance 2026 |
| Depreciation expense | $420.9 | $480 (±5%) |
| Income taxes paid | $171.5 | $205 - $215 |
The Company expects to pay cash taxes in the range of $205 to $215 million during 2026. Cash tax payments do not occur evenly by quarter, as amounts paid in a quarter can include payments of the final balance of the prior year taxes and payments of instalments for the current year, both required to be made at times as prescribed by different countries. There are no significant cash taxes expected in respect of the new global minimum top-up taxes ("GloBE").
Depreciation expense for 2026 is expected to be $480 million (±5%) corresponding with production levels and depletion of certain pit phases for which waste stripping costs have been capitalized
| ENVIRONMENTAL, SOCIAL AND GOVERNANCE |
The Company is committed to maintaining its culture of accountable mining through high standards of Environmental, Social and Governance practices, in every aspect of its business. The Company tracks its ESG performance to understand progress and achievements across a range of material topics and indicators and draws upon various ESG frameworks and standards and internationally recognized methodologies such as the Global Reporting Initiative and Sustainability Accounting Standards Board to guide its Sustainability Report:
• On May 6, 2025, the Company released its annual Sustainability Report, outlining the Company's 2024 sustainability performance.
• On December 16, 2025, the Company released its 2024 Scope 3 Emissions Report. As a member of the Mining Association of Canada ("MAC"), the Company participates in the Towards Sustainable Mining ("TSM") initiative at its Westwood operation, as well as internationally at Essakane (Burkina Faso), which exceeds MAC's requirements of reporting only on Canadian operations. The Company conducted internal assessments of the 2024 TSM results for the Westwood and Essakane mines that were also externally verified and achieved an 'A' level or higher for all indicators within all protocols. The 2025 self-assessment reported improvement on some indicators.
In 2025, the Company set and achieved most of its ESG targets related to health and safety; equity, diversity, and inclusion; and environment, including:
• Integration of Critical Risk Management into operational processes including the development of a control verification tool,
• Embed cost of carbon into decision-making processes,
• Advance the catchment-based Water Framework at sites through the development of roadmaps, and
• Zero significant environmental and community incidents¹.
Health and Safety
IAMGOLD's TRIFR was 0.60 as of December 31, 2025, compared to 0.63 as of December 31, 2024. IAMGOLD is continuing to advance its critical risk management and visible leadership to improve safety and reduce high-potential incidents. This includes the integration of contractors in the critical risk management program. The Company continues to track a range of leading indicators around critical risk management, contractor management, and incident investigation quality.
Environmental
In 2025, the Company's key environmental focus areas were water and biodiversity. Building on the water stewardship framework developed in 2024, activities during the year focused on advancing initiatives identified in site-level water roadmaps, developing water performance scorecards, and re-assessing each operation's maturity against the Company's water stewardship framework. Following the establishment of the corporate biodiversity roadmap in 2024, the Company initiated work in 2025 on the development of site-specific regional biodiversity strategies. The Company also initiated work on determining a value of carbon approach for incorporating carbon considerations into decision-making.
The Company's three operating sites all have closure plans filed with the authorities supported by associated financial assurance to secure future restoration funds. In 2025, work to update each closure plan was undertaken to reflect current disturbance conditions and restoration concepts.
Essakane has been certified ISO 14001 for many years and conducted a management review of its environmental management system. The site continued to run an environmental 'stop incident' campaign to educate and empower employees to recognize and respond to environmental risks.
Westwood completed the pilot water recycling projects to reduce water withdrawal from the Bousquet River, and full-scale implementation is planned for 2026.
There were zero significant environmental or community incidents reported during 20251.
Social Performance
Throughout 2025, each operation continued to engage with their communities of interest and support community investment initiatives.
At Essakane, key engagements and activities included discussions on economic, social, security, and resettlement topics. In the fourth quarter 2024, IAMGOLD partnered with Project CURE to deliver two 40-foot containers of medical supplies to seven health centers in the Dori and Gorom-Gorom districts. After a needs assessment, IAMGOLD committed to funding two additional containers and four containers will be distributed in 2026 - three funded by IAMGOLD and one by Resource Capital Funds Foundation.
At Côté Gold, the Company hosted site tours with both elected local municipal and provincial officials, as well as Indigenous partner communities to share information about the mine and IAMGOLD's approach to responsible mining. The Company maintained ongoing communication with our neighbouring First Nation communities, local land users, communities' groups and government agencies through meetings, email, social media and school presentations.
At Westwood, the team continued to meet with Abitibiwinni First Nation related to the negotiation of an Impact Benefit Agreement.
________________________
1. IAMGOLD defines significant incidents as those assessed as Level 4 or 5 based on the Company's risk matrix, and/or resulting in fines greater than US$100,000. The Company's risk matrix includes a consequence matrix to determine incident severity that considers environmental, health and safety, social, and financial aspects.
Indigenous Relations
As a Canadian business committed to responding to the Truth and Reconciliation Commission of Canada's Calls to Action1, IAMGOLD launched a company-wide initiative in the first quarter 2025, that will help the Company articulate how it works with Indigenous peoples beyond reconciliation, towards a future that builds upon the Company's experiences and reflects its values. This work will lead to the creation of a coherent vision for reconciliation and a roadmap to help guide the Company's actions as an organization. During the fourth quarter 2025, IAMGOLD continued its work, supported by an Indigenous-owned business, to define a five-year plan for action in support of reconciliation.
Equity, Diversity and Inclusion
IAMGOLD includes annual objectives to support its efforts in integrating Equity, Diversity and Inclusion ("EDI") into the strategy and corporate scorecard, for the annual objectives, and tracks EDI metrics in site and corporate reports for visibility and measurement. IAMGOLD's executive leadership team has a 40% women representation.
Governance
The Board of Directors of IAMGOLD (the "Board") maintains diversity and renewal guidelines that reflect governance best practices. Membership should comprise, at a minimum, of the greater of (i) two women directors, or (ii) 30% women directors. The average tenure of the Board should not exceed ten years, and no director should serve as the chair of the Board or the chair of any committee for more than ten consecutive years.
Women represent 44% of all directors and 50% of independent directors. The average tenure of directors on the Board is approximately three years.
__________________________
1. The Truth and Reconciliation Commission of Canada (2015) released its Calls to Action report, which included a call to the Canadian corporate sector to support reconciliation
| OPERATIONS |
| Côté Gold, Canada |
The Côté District is located 125 kilometres southwest of Timmins and 175 kilometres north of Sudbury, Ontario, Canada. The mine is being operated through an unincorporated joint venture (the "Côté Gold UJV" or "UJV") between IAMGOLD, as the operator, and SMM. On November 30, 2024, the Company repurchased a 9.7% temporarily transferred interest (the "Funding Agreement with SMM") which returned IAMGOLD to its full 70% interest in the Côté Gold UJV. See "Funding Agreement with SMM" below.
Côté Gold Mine (IAMGOLD interest - 70% for 2025, 60.3% from January 2024 to November 2024 and 70% for December 2024)
| Q4 2025 | Q4 2024 | 2025 | 2024 | |||||||||
| Key Operating Statistics (100% basis, unless otherwise stated) | ||||||||||||
| Ore mined (000s t) | 4,514 | 3,637 | 14,640 | 10,849 | ||||||||
| Grade mined (g/t) | 1.04 | 1.07 | 0.94 | 0.97 | ||||||||
| Operating waste mined (000s t) | 6,555 | 4,765 | 24,830 | 16,666 | ||||||||
| Capital waste mined (000s t) | 12 | 2,445 | 5,638 | 11,821 | ||||||||
| Total material mined (000s t) | 11,081 | 10,847 | 45,108 | 39,336 | ||||||||
| Strip ratio1 | 1.5 | 2.0 | 2.1 | 2.6 | ||||||||
| Ore milled (000s t) | 2,874 | 2,433 | 10,889 | 4,948 | ||||||||
| Head grade (g/t) | 1.44 | 1.34 | 1.22 | 1.37 | ||||||||
| Recovery (%) | 94 | 91 | 93 | 92 | ||||||||
| Gold production (000s oz) - 100% | 124.6 | 96.1 | 399.8 | 199.1 | ||||||||
| Gold production (000s oz) - attributable | 87.2 | 62.4 | 279.9 | 124.0 | ||||||||
| Gold sales (000s oz) - 100% | 127.8 | 87.4 | 407.7 | 179.4 | ||||||||
| Gold sales (000s oz) - attributable | 87.7 | 55.8 | 283.6 | 111.1 | ||||||||
| Average realized gold price2,3 ($/oz) | $ | 4,212 | $ | 2,644 | $ | 3,572 | $ | 2,555 | ||||
| Financial Results ($ millions - attributable interest) | ||||||||||||
| Revenues4 | $ | 370.4 | $ | 147.9 | $ | 1,014.4 | $ | 284.3 | ||||
| Cost of sales4 | 111.7 | 60.6 | 360.8 | 115.0 | ||||||||
| Production costs | 80.5 | 52.8 | 286.7 | 107.2 | ||||||||
| (Increase)/decrease in finished goods | 3.4 | (2.1 | ) | 3.6 | (9.6 | ) | ||||||
| Royalties5 | 27.8 | 9.9 | 70.5 | 17.4 | ||||||||
| Cash costs2 | 111.1 | 60.4 | 359.6 | 114.7 | ||||||||
| Sustaining capital expenditures2 | 30.7 | 25.6 | 103.8 | 42.7 | ||||||||
| Expansion capital expenditures2 | 5.7 | 5.4 | 23.7 | 191.0 | ||||||||
| Total sustaining and expansion capital expenditures2 | 36.4 | 31.0 | 127.5 | 233.7 | ||||||||
| Earnings from operations | 203.0 | 44.2 | 464.6 | 105.6 | ||||||||
| Mine-site free cash flow2 | 197.0 | 16.9 | 484.1 | 40.2 | ||||||||
| Unit costs per tonne2 | ||||||||||||
| Mine costs per operating tonne mined2 | $ | 4.72 | $ | 4.19 | $ | 4.20 | $ | 3.90 | ||||
| Mill costs per tonne milled2 | $ | 20.91 | $ | 17.59 | $ | 20.00 | $ | 17.32 | ||||
| G&A costs per tonne milled2 | $ | 7.62 | $ | 7.35 | $ | 6.97 | $ | 8.49 | ||||
| Operating costs per ounce6 | ||||||||||||
| Cost of sales excluding depreciation ($/oz sold) | $ | 1,271 | $ | 1,083 | $ | 1,272 | $ | 1,035 | ||||
| Cash costs2 - excluding royalties ($/oz sold) | $ | 949 | $ | 902 | $ | 1,020 | $ | 875 | ||||
| Cash costs2 ($/oz sold) | $ | 1,265 | $ | 1,080 | $ | 1,268 | $ | 1,032 | ||||
| AISC2 ($/oz sold) | $ | 1,688 | $ | 1,685 | $ | 1,636 | $ | 1,658 |
1. Strip ratio is calculated as waste mined divided by ore mined.
2. This is a non-GAAP financial measure. See "Non-GAAP Financial Measures".
3. Average gold price realized on the attributable portion of sales excludes the impact of gold delivered into prepayment arrangements.
4. As per note 35 of the consolidated financial statements for revenues and cost of sales. Cost of sales is net of depreciation expense.
5. Includes the 7.5% gross margin royalty and various net smelter return royalties.
6. Cost of sales, cash costs excluding royalties cash costs and AISC per ounce sold may not be calculated based on amounts presented in this table due to rounding.
Operational Insights
• In its first full year of operations, Côté's attributable production was 279,900 ounces (399,800 ounces | 100%), achieving the top-end of the annual guidance range. The mine completed the ramp-up and achieved nameplate plant throughput of 36,000 tonnes per day ("tpd") over a period of thirty consecutive days ahead of schedule in June.
• Attributable gold production in the fourth quarter 2025 was a record 87,200 ounces (124,600 ounces | 100%), a 40% increase from the prior year period.
• Mining activity totaled 11.1 million tonnes in the fourth quarter 2025. Ore tonnes mined increased to a record 4.5 million tonnes, or 24% over the prior year period, with an associated strip ratio of 1.5:1 waste to ore. The average grade mined was 1.04 g/t in the fourth quarter 2025, in line with expectations, and the highest quarterly grade mined to date for the operation.
• Mill throughput in the fourth quarter 2025 totaled 2.9 million tonnes, an increase of 18% over the prior year period. The installation of the additional secondary crusher was completed in November and commissioned in December with both cone crushers tested and operating in parallel. The Company used a temporary contractor aggregate crusher to supplement crushing capacity during 2025 due to high wear caused by the abrasive ore impacting the availability of the secondary crushing circuit. The Company plans to phase out the temporary aggregate crushing circuit over the first half of 2026. The additional secondary cone crusher is expected to increase overall crushing capacity, optimize the particle size entering the high pressure grinding rolls (HPGR) allowing for improved maintenance cycles on the dry side, as well as the particle size entering the ball mill which has the potential to increase capacity in the wet side of the plant.
• Head grade for the fourth quarter was a record 1.44 g/t as a result of the combination of higher grade direct feed ore, a low strip ratio over the quarter and stockpiling of lower grade ore. Recoveries in the plant averaged a record 94% in the quarter. The reconciliation between the reserve models, grade control models, mill feed and production continues to be in line with expected tolerances.
Financial Highlights (attributable basis) - Q4 and 2025
• Revenue and cost of sales for the year are recognized at 70% in accordance with IAMGOLD's ownership interest.
• Production costs were $80.5 million and $286.7 million during the three and twelve months ended December 31, 2025, respectively. As outlined below, mining and milling per tonne unit costs continue to be elevated in part due to the ongoing reliance on the contractor aggregate crushing described above.
• Mining costs averaged $4.72 and $4.20 per tonne mined during the three and twelve months ended December 31, 2025, respectively. Mining costs in the fourth quarter continued to be impacted by the contractor aggregate crushing that increased rehandling and utilization of haul trucks. The impact is expected to reduce in 2026 as the contractor aggregate is phased out over the first half of 2026. Additional improvements to mining cost per tonne are expected through various measures including the continued transition to bulk mining, the improvement of the expected average life on haul truck tires and improving drilling practices to reduce the amount of redrilling required.
• Milling costs were $20.91 and $20.00 per tonne milled during the three and twelve months ended December 31, 2025, respectively. Unit costs remained higher in the fourth quarter as the temporary aggregate crusher was used extensively during the integration and commissioning of the additional secondary crusher. Milling costs were also higher due to the expensing of certain capital spares in 2025 as the life of the spares is expected to be less than a year until the benefits from the installation of the second secondary crusher are realized. Unit costs are expected to decline over the course of 2026 as the contractor aggregate crushing is phased out over the first half of the year.
• G&A costs were $7.62 and $6.97 per tonne milled during the three and twelve months ended December 31, 2025, respectively.
• Cost of sales, excluding depreciation, during the three and twelve months ended December 31, 2025, totaled $111.7 million and $360.8 million, respectively. Cost of sales per ounce sold, excluding depreciation, for the three and twelve months ended December 31, 2025, was $1,271 and $1,272, respectively.
• Cash costs, excluding royalties, during the three and twelve months ended December 31, 2025, totaled $83.3 million and $289.1 million, respectively, and cash cost per ounce sold, excluding royalties, was $949 and $1,020, respectively.
• Royalties during the three and twelve months ended December 31, 2025, were $27.8 million or $316 per ounce (25% of cash cost) and $70.5 million or $248 per ounce (20% of cash cost), respectively.
• Cash costs during the three and twelve months ended December 31, 2025, totaled $111.1 million and $359.6 million, respectively, and cash cost per ounce sold was $1,265 and $1,268, respectively.
• AISC during the three and twelve months ended December 31, 2025, was $1,688 and $1,636 per ounce sold, respectively.
• Capital expenditures, on a 100% and incurred basis, totaled $51.7 million in the fourth quarter 2025. Sustaining capital expenditures totaled $43.7 million ($30.7 million | 70%), including $29.2 million of capital projects related to operational improvements and ramp-up, $10.2 million of mobile equipment and critical spares, $2.3 million of other capital projects and $2.0 million of tailings infrastructure and related earthworks. Expansion capital of $8.0 million ($5.7 million | 70%) was primarily associated with the installation and commissioning of the additional secondary cone crusher completed during the fourth quarter of this year.
• Capital expenditures for the year, on a 100% and incurred basis, totaled $181.6 million. Sustaining capital expenditures totaled $148.0 million, ($103.8 million | 70%), including $46.0 million of capital projects related to operational improvements and ramp-up, $37.4 million of tailings expansion and related earthworks, $36.9 million of mobile equipment and critical spares, $21.1 million of capitalized stripping, and $6.6 million of other capital projects. Expansion capital of $33.6 million ($23.7 million | 70%) was primarily associated with the installation and commissioning of the additional secondary cone crusher during the fourth quarter of this year.
• Mine-site free cash flow was a record $197.0 million on an attributable basis for the three months ended December 31, 2025, on the strength of record revenues of $370.4 million with gold sales of 87,700 ounces at the realized gold price of $4,212 per ounce, resulting in operating cash flows of $241.8 million offset by capital expenditures totaling $44.8 million. For the year, mine-site free cash flow was $484.1 million on an attributable basis, with revenues of $1,014.4 million from the sale of 283,600 ounces at a realized gold price of $3,572 per ounce, resulting in operating cash flows of $606.8 million offset by capital expenditures totaling $122.7 million.
2026 Outlook
Côté Gold attributable production in 2026 is expected to be in the range of 270,000 to 310,000 ounces (390,000 to 440,000 ounces | 100%). The focus in 2026, now that the plant is operating at nameplate throughput, is on stabilization and optimization, improving the cost structure and preparing for the contemplated expansion of Côte. Short to medium term capital investment is planned to improve the operating efficiency and cost structure while also systematically investing in the expansion to derisk the larger build.
Mining activities in 2026 are planning a total of approximately 52 million tonnes of material mined. This includes a large pushback to open up the pit to improve mine efficiency and prepare for the contemplated expansion. Mill throughput is expected to average 36,000 tpd (nameplate) over the course of the year after the successful installation of the additional secondary crusher in the fourth quarter 2025. Plant head grades are expected to average between 1.00 g/t and 1.10 g/t. Gold production is expected to be higher in the second half of the year based on expected lower grades in the first half of the year followed by higher grades in the second half - as determined by the scheduled mine sequence.
Cash costs, excluding royalties, at Côté Gold are expected to be in the range of $900 to $1,050 per ounce sold, and including royalties (assuming a $4,000 per ounce gold price) in the range of $1,200 to $1,350 per ounce sold. AISC is expected to be in the range of $1,775 to $1,925 per ounce sold.
Sustaining capital expenditures guidance for Côté Gold is approximately $160 million ±5% ($230 million | 100%) that includes $50 million ($70 million | 100%) of non-recurring capital to improve the operating efficiency and the long-term operating cost structure.
Expansion capital of $85 million ±5% ($120 million | 100%) mainly relates to the planned strategic pit pushback that will provide both operational flexibility in the near term and optionality for the expansion, as well as the acceleration of certain expansion related plant construction activities, including an additional Vertimill in early 2027.
Exploration
The Gosselin zone is located immediately to the northeast of the Côté zone. Following the completion of the expansion and delineation diamond drilling program in 2024, the 2025 drilling plan was to continue with diamond drilling activities aimed at increasing the confidence in the existing resource and converting a large part of the Inferred Resource to the Indicated Resource category. A total of 45,000 metres was planned initially but this program was increased to approximately 53,750 metres for the year. Approximately 3,600 metres were completed in the fourth quarter 2025. In addition, approximately 5,550 metres tested the area to the north-east of the Gosselin zone.
The results of the Gosselin exploration program will be included in an updated Mineral Reserves and Mineral Resources estimate in the second quarter 2026 and will inform the planned updated technical report which will consider a larger scale Côté Gold Mine with a conceptual mine plan targeting both the Côté and Gosselin zones over the life of mine. This updated technical report is expected to be completed by the end of 2026.
Côté Zone Drilling
An infill drilling program of 20,000 metres was planned on the Côté zone which was initiated in the second quarter of 2025. Approximately 1,350 metres were completed in the fourth quarter 2025, for approximately 20,650 metres for the year. This infill drilling program was planned to improve resource confidence within the northeastern extension of the Côté deposit and convert Inferred Resources into the Indicated Resources category.
Mineral Resources and Reserves
Mineral Reserves decreased 301,000 ounces from the prior year period as updated estimates partially offset depletion (based on 10.9 Mt at 1.22 g/t for contained ounces of 428,100 ounces at 100% interest). The Côté Gold Mineral Reserve block model will be updated this year resulting in an updated mine plan incorporating both Côté and Gosselin.
Côté Gold (Côté and Gosselin) Measured & Indicated Mineral Resources, inclusive of Mineral Reserves and on a 100% basis, increased 12%, or approximately 2.0 million ounces, to an estimated 18.2 million ounces (12.7 million ounces attributable) as of December 31, 2025. Inferred Mineral Resources decreased approximately 2.0 million ounces to 2.2 million ounces.
The 2025 drilling plan at Côté and Gosselin prioritized increasing the confidence in the existing resource and converting a large part of the Inferred Resource to the Indicated Resource category. The program was increased to approximately 53,750 metres for the year at Gosselin. The results of the Gosselin drilling program will inform the planned updated technical report which will consider a larger scale Côté Gold Mine with a mine plan targeting both the Côté and Gosselin zones over the life of mine. (See "Mineral Resources and Reserves")
Funding Agreement with SMM
On December 19, 2022, the Company announced it had entered into the JV Funding and Amending Agreement with SMM, whereby SMM contributed the Company's funding obligations to the Côté Gold UJV and as a result, the Company transferred 9.7% of its interest in Côté Gold to SMM with a right to repurchase these transferred interests to return to its full 70% interest in the Côté Gold Mine.
On November 30, 2024, the Company exercised its right to repurchase the 9.7% interest in Côté Gold returning IAMGOLD to its full 70% interest in Côté Gold.
| Westwood Complex, Canada |
The Westwood Complex is located 35 kilometres northeast of Rouyn-Noranda and 80 kilometres west of Val d'Or in southwestern Québec, Canada. The Westwood Complex includes the Westwood underground mine and the Grand Duc open pit mine.
Westwood Complex (IAMGOLD interest - 100%)
| Q4 2025 | Q4 2024 | 2025 | 2024 | 2023 | |||||||||||
| Key Operating Statistics | |||||||||||||||
| Underground lateral development (metres) | 891 | 1,086 | 3,856 | 4,591 | 5,271 | ||||||||||
| Ore mined (000s t) - underground | 105 | 98 | 382 | 354 | 280 | ||||||||||
| Ore mined (000s t) - open pit | 174 | 283 | 996 | 662 | 742 | ||||||||||
| Ore mined (000s t) - total | 279 | 381 | 1,378 | 1,016 | 1,022 | ||||||||||
| Grade mined (g/t) - underground | 9.87 | 9.65 | 7.55 | 9.19 | 7.11 | ||||||||||
| Grade mined (g/t) - open pit | 1.02 | 1.33 | 1.09 | 1.75 | 1.71 | ||||||||||
| Grade mined (g/t) - total | 4.35 | 3.47 | 2.88 | 4.34 | 3.19 | ||||||||||
| Ore milled (000s t) | 299 | 267 | 1,154 | 1,107 | 1,034 | ||||||||||
| Head grade (g/t) - underground | 9.78 | 9.51 | 7.59 | 9.17 | 7.12 | ||||||||||
| Head grade (g/t) - open pit | 1.19 | 1.17 | 1.22 | 1.60 | 1.51 | ||||||||||
| Head grade (g/t) - total | 4.21 | 4.34 | 3.32 | 4.04 | 3.03 | ||||||||||
| Recovery (%) | 93 | 93 | 92 | 93 | 93 | ||||||||||
| Gold production (000s oz) | 37.9 | 34.6 | 113.9 | 133.7 | 93.4 | ||||||||||
| Gold sales (000s oz) | 37.1 | 36.7 | 113.6 | 133.9 | 90.2 | ||||||||||
| Average realized gold price1,2 ($/oz) | $ | 4,151 | $ | 2,652 | $ | 3,531 | $ | 2,403 | $ | 1,946 | |||||
| Financial Results ($ millions) | |||||||||||||||
| Revenues3 | $ | 155.0 | $ | 97.6 | $ | 403.0 | $ | 323.0 | $ | 176.6 | |||||
| Cost of sales3 | 48.5 | 42.3 | 175.7 | 157.5 | 144.6 | ||||||||||
| Production costs | 45.1 | 39.0 | 177.3 | 155.3 | 148.5 | ||||||||||
| (Increase)/decrease in finished goods | 3.4 | 3.3 | (1.6 | ) | 1.9 | (4.1 | ) | ||||||||
| Royalties | - | - | - | 0.3 | 0.2 | ||||||||||
| Cash costs1 | 47.8 | 42.2 | 173.8 | 156.3 | 143.7 | ||||||||||
| Sustaining capital expenditures1 | 15.1 | 18.5 | 63.9 | 66.1 | 65.0 | ||||||||||
| Expansion capital expenditures1 | 1.5 | (0.1 | ) | 1.5 | - | 0.6 | |||||||||
| Total sustaining and expansion capital expenditures1 | 16.6 | 18.4 | 65.4 | 66.1 | 65.6 | ||||||||||
| Earnings/(loss) from operations4 | 91.2 | 45.1 | 171.4 | 578.9 | (9.7 | ) | |||||||||
| Mine-site free cash flow1 | 89.2 | 41.3 | 148.6 | 94.4 | (42.8 | ) | |||||||||
| Unit costs per tonne1 | |||||||||||||||
| Underground mining cost per tonne mined | $ | 264.72 | $ | 233.72 | $ | 287.85 | $ | 250.86 | $ | 281.76 | |||||
| Open pit mining cost per operating tonne mined | $ | 6.82 | $ | 6.88 | $ | 7.29 | $ | 8.75 | $ | 8.86 | |||||
| Milling cost per tonne milled | $ | 25.53 | $ | 28.55 | $ | 27.32 | $ | 24.25 | $ | 23.56 | |||||
| G&A cost per tonne milled | $ | 22.69 | $ | 19.70 | $ | 20.31 | $ | 18.44 | $ | 21.30 | |||||
| Operating costs per ounce5 | |||||||||||||||
| Cost of sales excluding depreciation6 ($/oz sold) | $ | 1,307 | $ | 1,155 | $ | 1,547 | $ | 1,177 | $ | 1,600 | |||||
| Cash costs1 - excluding royalties ($/oz sold) | $ | 1,288 | $ | 1,148 | $ | 1,530 | $ | 1,164 | $ | 1,588 | |||||
| Cash costs1 ($/oz sold) | $ | 1,288 | $ | 1,148 | $ | 1,530 | $ | 1,167 | $ | 1,591 | |||||
| AISC1 ($/oz sold) | $ | 1,719 | $ | 1,688 | $ | 2,117 | $ | 1,702 | $ | 2,344 |
1. This is a non-GAAP financial measure. See "Non-GAAP Financial Measures".
2. Average realized gold price excludes the impact of gold delivered into prepayment arrangements.
3. As per note 35 of the consolidated financial statements for revenues and cost of sales. Cost of sales is net of depreciation expense.
4. Included in 2024 net earnings from operations is a $455.5 million gain on the reversal of the previously recorded impairment of the Westwood CGU.
5. Cost of sales, cash costs excluding royalties, cash costs and AISC per ounce sold may not be calculated based on amounts presented in this table due to rounding.
6. Includes non-cash ore stockpile and finished goods inventories NRV write-down of $3.2 million in 2023, which had an impact on cost of sales, excluding depreciation, per ounce sold of $36 for 2023).
Operational Insights
• Production was 113,900 ounces for the full year, below the bottom end of the guidance range of 125,000 to 140,000 ounces, due to lower grade stopes being mined earlier in the year after changes in the mine sequence to accommodate challenging ground conditions, combined with higher than expected underground dilution and lower mining recovery in certain areas.
• Production in the fourth quarter 2025 was 37,900 ounces, higher by 3,300 ounces or 10% compared with the same prior year period, a record level since the mine restarted in the second half of 2021. The fourth quarter included higher grade stopes which had been re-sequenced earlier in 2025 as described above.
• Mining activity for the year totaled 1.4 million tonnes of ore, an increase over the prior year of 0.4 million tonnes or 36% due to increased tonnes from both the underground mine and open pit. Mining activity in the fourth quarter 2025 of 279,000 tonnes of ore was lower by 102,000 tonnes or 27% than the same prior year period, primarily due to decreased volumes at the Grand Duc open pit. Underground mining activities in the fourth quarter averaged 1,139 tpd, translating to 105,000 tonnes in the quarter, a record volume from underground since the mine restart, with an average underground mined grade of 9.87 g/t Au.
• Mill throughput for the year was 1.2 million tonnes at an average head grade of 3.32 g/t, 4% higher and 18% lower, respectively, than the prior year. The lower head grades are due to a decrease in the grade from the underground mine as described above. Mill throughput in the fourth quarter 2025 was 299,000 tonnes, at an average grade of 4.21 g/t, 12% higher and 3% lower than the same prior year period, respectively.
• The mill achieved recoveries of 93% in the fourth quarter 2025, in line with the same prior year period.
• A renewed Collective Bargaining Agreement was ratified in the quarter extending through November 2030.
Financial Performance - Q4 2025 Compared to Q4 2024
• Production costs of $45.1 million were higher by $6.1 million or 16% than the same prior year period, due to increased underground mining activities. Underground mining costs per tonne mined were $264.72, the lowest level for the year due to the higher volumes mined. Mining costs included in production costs were higher due to an increased proportion of development activities in the fourth quarter supporting extraction and stope preparation activities relative to the same prior year period where there was a higher proportion of capital development activities, alongside an increase in the consumption of tires, explosives and related ground support components. Maintenance costs, increased over the fourth quarter 2025, continued in line with the year-to-date run rate as the mine continues to transition certain maintenance activities in house.
• Cost of sales, excluding depreciation, of $48.5 million was higher by $6.2 million or 15% compared to the same prior year period due to higher production costs. Cost of sales per ounce sold, excluding depreciation, of $1,307, was higher by $152 or 13% as a result, with sales volume in line with the same year prior period.
• Cash costs of $47.8 million were higher by $5.6 million or 13% compared to the prior year period. Cash costs per ounce sold of $1,288 were higher by $140 per ounce or 12%, due to the increase in production costs, with sales volume in line with the same year prior period.
• AISC per ounce sold of $1,719 was higher by $31 per ounce or 2%, primarily due to higher cash costs, partially offset by lower sustaining capital spend, with sales volume in line with the same year prior period.
• Sustaining capital expenditures of $15.1 million included mill and mobile equipment of $6.3 million, underground development and rehabilitation of $5.9 million, capitalized stripping at Grand Duc of $2.0 million, and other sustaining capital projects of $0.9 million. During the fourth quarter a work program commenced on the adjacent Eastwood deposit, with $1.5 million incurred in the period, to support the study of options to expand the mine in the eastern parts of Westwood underground that could be amenable to bulk mining.
• Mine-site free cash flow was $89.2 million for the three months ended December 31, 2025, based on the record revenues of $155.0 million with gold sales of 37,100 ounces at a realized gold price of $4,151 per ounce, generating operating cash flows of $106.1 million offset by capital expenditures totaling $16.9 million.
Financial Performance - 2025 Compared to 2024
• Production costs of $177.3 million were higher by $22.0 million or 14%, primarily due to higher mining costs due to an increase in underground mining activity resulting in increased consumption of explosives, tires and related components for required ventilation and ground support, alongside increasing maintenance and labour costs. Milling cost increased due to the rental cost of a mobile ore crusher to support higher mill throughput, and increased cost of mill consumables.
• Cost of sales, excluding depreciation, of $175.7 million was higher by $18.2 million or 12%, primarily due to higher production costs. Cost of sales per ounce sold, excluding depreciation, of $1,547 was higher by $370 or 31%, primarily due to higher production costs and lower production and sales volumes.
• Cash costs of $173.8 million were higher by $17.5 million or 11%, primarily due to higher production costs. Cash costs per ounce sold of $1,530 were higher by $363 or 31%, primarily due to higher production costs and lower production and sales volumes.
• AISC per ounce sold of $2,117 was higher by $415 or 24%, primarily due to higher cash costs, partially offset by lower production and sales volumes.
• Sustaining capital expenditures of $63.9 million included mill and mobile equipment of $29.7 million, underground development and rehabilitation of $28.0 million, capitalized stripping at Grand Duc of $2.0 million, and other sustaining capital projects of $4.2 million.
• Mine-site free cash flow was $148.6 million for the twelve months ended December 31, 2025, with record revenues of $403.0 million with gold sales of 113,600 ounces at a realized gold price of $3,531 per ounce, resulting in operating cash flows of $214.1 million offset by capital expenditures totaling $65.5 million. This increase of $54.2 million compared to the prior year period is primarily attributed to $80.0 million in higher revenues due to the higher realized gold price, partially offset by lower production and sales.
2026 Outlook
Westwood production is expected to be in the range of 110,000 to 130,000 ounces in 2026. Underground mining is planned for between 900 to 1,000 tonnes per day and the Grand Duc open pit life has been extended into 2027 based on the improved economics in the current gold price environment. Mill throughput is expected to average 1.2 million tonnes in 2026 with blended head grades expected to average 3.44 g/t over the course of the year.
Cash costs at Westwood are expected to be in the range of $1,500 to $1,650 per ounce sold and AISC in the range of $1,950 to $2,100 per ounce sold.
Sustaining capital expenditures guidance is $55 million (±5%), primarily consisting of underground development in support of the mine plan, the continued renewal of the mobile fleet and fixed equipment, and certain asset integrity projects at the Westwood mill. Expansion capital of $30 million is primarily associated with development works to support the study of options to expand the mine in the eastern parts of Westwood underground that could be amenable to bulk mining. Additional extensions to the Grand Duc pit will also be investigated this year.
Brownfield Exploration
During the three and twelve months ended December 31, 2025, approximately 7,700 metres and 28,400 metres respectively, of underground diamond drilling (including approximately 1,600 metres for the year of geotechnical drilling) were completed to support the continued ramp-up of underground mining operations. The Company is investigating high priority underground targets which could offer potential additional sources of high-grade material.
Mineral Resources and Reserves
Mineral Reserves from the underground increased 125,000 ounces and 20,000 ounces from the Grand Duc open pit, more than offsetting depletion, primarily as a result of the change in resource model and increased gold price assumption and reduction in the underground cut-off grade to 6.40 g/t Au (down from 6.82 g/t Au previously). (See "Mineral Resources and Reserves")
| Essakane, Burkina Faso |
The Essakane District is located in north-eastern Burkina Faso, West Africa approximately 330 kilometres northeast of the capital, Ouagadougou. The Essakane District includes the Essakane mine and the surrounding mining lease and exploration concessions totaling approximately 600 square kilometres. Effective June 20, 2025, in accordance with the amended Burkina Faso Mining Code, the government of Burkina Faso increased its ownership interest in the Essakane mine from 10% to 15%. As a result, the Company's interest decreased thereafter from 90% to 85%.
Essakane Mine (IAMGOLD interest - 90% for H1 2025 and prior, 85% thereafter)
| Q4 2025 | Q4 2024 | 2025 | 2024 | 2023 | |||||||||||
| Key Operating Statistics1 | |||||||||||||||
| Ore mined (000s t) | 4,123 | 2,170 | 11,910 | 9,714 | 9,586 | ||||||||||
| Grade mined (g/t) | 1.44 | 1.14 | 1.25 | 1.44 | 1.35 | ||||||||||
| Operating waste mined (000s t) | 4,649 | 4,036 | 22,087 | 13,315 | 19,530 | ||||||||||
| Capital waste mined (000s t) | 620 | 6,168 | 5,651 | 23,895 | 14,233 | ||||||||||
| Total material mined (000s t) | 9,392 | 12,374 | 39,648 | 46,924 | 43,349 | ||||||||||
| Strip ratio2 | 1.3 | 4.7 | 2.3 | 3.8 | 3.5 | ||||||||||
| Ore milled (000s t) | 3,241 | 2,948 | 12,560 | 12,087 | 11,283 | ||||||||||
| Head grade (g/t) | 1.50 | 1.07 | 1.18 | 1.33 | 1.26 | ||||||||||
| Recovery (%) | 88 | 87 | 90 | 88 | 90 | ||||||||||
| Gold production (000s oz) - 100% | 138.1 | 88.4 | 427.2 | 454.2 | 412.9 | ||||||||||
| Gold production (000s oz) - attributable | 117.3 | 79.7 | 372.1 | 408.8 | 371.6 | ||||||||||
| Gold sales (000s oz) - 100% | 134.2 | 92.9 | 420.6 | 454.0 | 413.2 | ||||||||||
| Average realized gold price3,4 ($/oz) | $ | 4,188 | $ | 2,680 | $ | 3,538 | $ | 2,383 | $ | 1,957 | |||||
| Financial Results ($ millions)1 | |||||||||||||||
| Revenues5 | $ | 562.7 | $ | 249.3 | $ | 1,489.5 | $ | 1,083.2 | $ | 809.6 | |||||
| Cost of sales5 | 198.0 | 139.7 | 689.2 | 536.8 | 502.4 | ||||||||||
| Production costs | 131.1 | 121.9 | 544.7 | 458.3 | 450.5 | ||||||||||
| (Increase)/decrease in finished goods | 5.2 | (1.7 | ) | 2.2 | (6.8 | ) | (0.8 | ) | |||||||
| Royalties6 | 61.7 | 19.5 | 142.3 | 85.3 | 52.7 | ||||||||||
| Cash costs3 | 197.4 | 139.4 | 687.7 | 535.5 | 488.0 | ||||||||||
| Sustaining capital expenditures3 | 28.9 | 49.0 | 106.9 | 180.4 | 134.9 | ||||||||||
| Expansion capital expenditures3 | 0.8 | 2.1 | 7.4 | 5.1 | 1.7 | ||||||||||
| Total sustaining and expansion capital expenditures3 | 29.7 | 51.1 | 114.3 | 185.5 | 136.6 | ||||||||||
| Earnings from operations | 297.0 | 77.4 | 608.1 | 384.4 | 92.0 | ||||||||||
| Mine-site free cash flow3 | 340.4 | 20.0 | 566.3 | 250.5 | 91.0 | ||||||||||
| Unit costs per tonne3 | |||||||||||||||
| Open pit mining cost per operating tonne mined | $ | 6.66 | $ | 5.37 | $ | 6.36 | $ | 5.34 | $ | 5.02 | |||||
| Milling cost per tonne milled | $ | 17.95 | $ | 20.35 | $ | 19.35 | $ | 19.26 | $ | 18.94 | |||||
| G&A cost per tonne milled | $ | 10.67 | $ | 9.83 | $ | 9.52 | $ | 8.50 | $ | 9.07 | |||||
| Operating costs per ounce7 | |||||||||||||||
| Cost of sales excluding depreciation ($/oz sold) | $ | 1,475 | $ | 1,504 | $ | 1,640 | $ | 1,182 | $ | 1,216 | |||||
| Cash costs3 - excluding royalties ($/oz sold) | $ | 1,011 | $ | 1,291 | $ | 1,300 | $ | 991 | $ | 1,053 | |||||
| Cash costs3 ($/oz sold) | $ | 1,471 | $ | 1,501 | $ | 1,636 | $ | 1,179 | $ | 1,181 | |||||
| AISC3 ($/oz sold) | $ | 1,674 | $ | 2,118 | $ | 1,888 | $ | 1,625 | $ | 1,521 |
1. 100% basis, unless otherwise stated.
2. Strip ratio is calculated as waste mined divided by ore mined.
3. This is a non-GAAP financial measure. See "Non-GAAP Financial Measures".
4. Average realized gold price excludes the impact of gold delivered into prepayment arrangements.
5. As per note 35 of the consolidated financial statements for revenues and cost of sales. Cost of sales is net of depreciation expense.
6. Includes contributions made by the Essakane mine to the development fund for local communities, equating to 1% of total revenues.
7. Cost of sales, cash costs excluding royalties, cash costs and AISC per ounce sold may not be calculated based on amounts presented in this table due to rounding.
Operational Insights
• Essakane delivered full year production of 427,200 ounces on a 100% basis, exceeding the midpoint of the guidance range when expressed on a 100% basis; on an attributable basis Essakane produced 372,100 ounces that include the impact of the mid-year change in ownership from 90% to 85%. During the fourth quarter 2025, Essakane produced a record 138,100 ounces, or 117,300 ounces on an attributable basis, an increase of 37,600 ounces or 47% from the prior year period, due to higher head grades compared to the same prior year period.
• Mining for the year totaled 39.6 million tonnes, 7.3 million tonnes or 16% lower than the prior year period in line with the mine plan, and included ore mined totaling 11.9 million tonnes at an average grade of 1.25 g/t, an increase of 23% and decrease of 13%, respectively over the prior year. Mining in the fourth quarter 2025 totaled 9.4 million tonnes, lower by 3.0 million tonnes or 24% compared to the same prior year period and included ore mined totaling 4.1 million tonnes in the quarter at an average grade of 1.44 g/t, an increase of 90% and 26%, respectively over the same year prior period. The average grade of mined ore in the fourth quarter was the highest grade mined in the year as the mine sequences deeper into Phase 7.
• Mill throughput for the year totaled 12.6 million tonnes at an average head grade of 1.18 g/t, 4% higher and 11% lower than prior year levels, respectively. Mill throughput in the fourth quarter 2025 was 3.2 million tonnes at an average head grade of 1.50 g/t, 10% higher and 40% higher than the same prior year period, respectively.
• The mill achieved recoveries of 90% for the year, 2% higher than the prior year. Recoveries were 88% in the fourth quarter 2025, 1% higher than the same prior year period.
• The security situation in Burkina Faso continues to be a focus for the Company. Security-related incidents are still occurring in the country, and more broadly, the West African region, which pressure supply chains. The Company continues to take proactive measures to ensure the safety and security of in-country personnel and is constantly adjusting its protocols and activity levels at the site in response to the security environment. The Company continues to invest in the security and supply chain infrastructure in the region and at the mine site. It is also incurring additional costs to bring employees, contractors, supplies, and inventory to the mine. The situation has placed the Government of Burkina Faso under significant financial constraint due to the high cost of funding its initiatives to defend itself against militant attacks. See "Risks and Uncertainties".
• Essakane declared a record dividend of approximately $855 million in June 2025. This dividend represents the full distribution of past undistributed retained earnings up to and including 2024. IAMGOLD's 85% portion of the dividend, net of taxes, is approximately $680 million at a foreign exchange rate of EUR/USD 1.15. See "Financial Condition - Dividend Payments from Essakane".
• On April 7, 2025, the Government of Burkina Faso enacted an update to the royalty decree increasing the minimum royalty rate applicable to gold prices above $3,000/oz to 8%, with the rate increasing by an additional 1% for each $500/oz thereafter. The previous rate was 7% on all gold sold at or above $2,000/oz. The average royalty rate was 10.0% in the fourth quarter and 8.6% for the full year 2025, in addition to the contributions to the development fund for local communities equating to 1% of total revenues.
Financial Performance - Q4 2025 Compared to Q4 2024
• Production costs of $131.1 million were higher by $9.2 million or 8%, primarily resulting from a higher proportion of mining costs being expensed, due to the lower strip ratio during the period due to the increased proportion of ore tonnes mined described above. Costs were also impacted by USD equivalent labour, contractor and facility costs, which have increased compared to the same prior year period due to the appreciation of the local XOF currency, which is pegged to the Euro.
• Cost of sales, excluding depreciation, of $198.0 million was higher by $58.3 million or 42%, primarily due to higher production costs and a 216% increase in royalties resulting from higher gold prices and the new royalty decree. Cost of sales per ounce sold, excluding depreciation, of $1,475 was lower by $29 per ounce or 2% primarily due to higher production and sales volumes due to higher average head grade in the quarter offsetting the impact of higher production costs and royalties. Royalties accounted for $460 per ounce, an increase of $250 per ounce.
• Cash costs, excluding royalties, of $135.7 million were higher by $15.8 million or 13%, primarily due to higher production costs. Cash costs per ounce sold, excluding royalties, of $1,011 per ounce were lower by $280 per ounce or 22%, primarily due to higher production and sales volumes offsetting the impact of higher production costs.
• Cash costs, including royalties, of $197.4 million were higher by $58.0 million or 42%, and total cash costs per ounce sold of $1,471 per ounce were lower by $30 or 2%.
• AISC per ounce sold of $1,674 was lower by $444 per ounce or 21% primarily due to lower sustaining capital expenditures and higher production and sales volumes, partially offset by higher production costs and royalties compared to the prior period.
• Total capitalized stripping of $4.2 million was lower by $28.9 million or 87%, as the mine fleet prioritized ore mining, resulting in lower overall waste tonnes mined in the period increasing the proportion of waste tonnes classified as operating waste consistent with the 2025 mine plan.
• Sustaining capital expenditures, excluding capitalized stripping, of $24.7 million included mobile and mill equipment of $13.3 million, capital spares of $4.9 million, tailings management of $2.8 million, resource development of $1.4 million, and other sustaining projects of $2.3 million.
• Mine-site free cash flow was $340.4 million for the three months ended December 31, 2025, with record revenues of $562.7 million with gold sales of 134,200 ounces at a realized gold price of $4,188 per ounce, resulting in operating cash flows of $367.2 million offset by capital expenditures totaling $26.8 million. This increase of $320.4 million compared to the same prior year period is primarily due to higher revenues from the higher realized gold price and higher production and sales volume, partially offset by higher production costs and royalty payments.
Financial Performance - 2025 Compared to 2024
• Production costs of $544.7 million were higher by $86.4 million or 19% than the prior year period, primarily resulting from a higher proportion of mining costs being expensed, due to the lower overall waste tonnages mined reducing the lower strip ratio and amount of deferred stripping during the period. Costs were also impacted by higher maintenance costs and higher energy costs.
• Cost of sales, excluding depreciation, of $689.2 million was higher by $152.4 million or 28%, primarily due to higher production costs and a 67% increase in royalties resulting from the higher gold prices and new royalty decree. Cost of sales per ounce sold, excluding depreciation, of $1,640 was higher by $458 or 39%, primarily due to higher production costs and increased royalties as well as lower production and sales volumes. Royalties were $336 per ounce, an increase of $148 per ounce due to higher realized gold prices.
• Cash costs, excluding royalties, of $545.4 million were higher by $95.2 million or 21%, primarily due to the higher cost of sales. Cash costs per ounce sold, excluding royalties, of $1,300 were higher by $309 or 31%, primarily due to higher production costs as described above.
• Cash costs, including royalties, of $687.7 million were higher by $152.2 million or 28%, and total cash costs per ounce sold of $1,636 were higher by $457 or 39% than the prior year period.
• AISC per ounce sold of $1,888 was higher by $263 per ounce or 16%, primarily due to higher cash cost and lower production and sales volume, partially offset by lower sustaining capital expenditures.
• Total capitalized stripping of $32.5 million was lower by $93.6 million or 74%, as the mine fleet continued to prioritize ore mining in Phase 7 and sequencing through mining phases with higher life of phase strip ratios, resulting in a higher proportion of waste tonnes classified as operating waste consistent with the 2025 mine plan.
• Sustaining capital expenditures, excluding capitalized stripping, of $74.4 million included mobile and mill equipment of $23.7 million, capital spares of $20.0 million, tailings management of $10.6 million, resource development of $8.6 million, generator overhaul of $1.9 million and other sustaining projects of $9.6 million.
• Mine-site free cash flow was $566.3 million for the twelve months ended December 31, 2025, with record revenues of $1,489.5 million from the sale of 420,600 ounces at a realized gold price of $3,538 per ounce resulting in operating cash flows of $672.9 million offset by capital expenditures totaling $106.6 million. This increase of $315.8 million compared to the prior year period is primarily due to higher revenues from the higher realized gold price, partially offset by lower production and sales and higher production costs of $86.4 million described above, $57.0 million in higher royalty payments in the year and higher cash tax payments of $66.5 million due to higher taxation based on higher profits in 2024.
2026 Outlook
Essakane attributable production is expected to be in the range of 340,000 to 380,000 ounces (400,000 to 440,000 ounces | 100%). Mining activities will predominantly target Phase 6 and 7 and the Lao pit that is adjacent to the Essakane Main Zone, with an estimated target of 42 to 43 million tonnes of material mined at a strip ratio between 2.5 to 3:1. Mill throughput is expected to total near 13 million tonnes with head grades averaging 1.10 g/t Au.
Cash costs, excluding royalties, are expected to be in the range of $1,150 to $1,300 per ounce sold, and including royalties, in the range of $1,600 to $1,750. AISC is expected to be in the range of $2,000 to $2,150 per ounce sold. Costs at Essakane are impacted by the Burkinabe royalty structure described above which are uncapped and tied to gold prices.
Sustaining capital expenditures guidance is approximately $165 million (±5%), including approximately $90 million of capitalized waste stripping to progress Phase 6 and into the Lao pit, as well as the ongoing replacement of certain equipment to improve efficiency and maintenance costs at Essakane, and the annual tailings dam program. The capitalized waste stripping is higher than estimated in the December 2023 technical report due to inclusion of the Lao pit and extension of estimated mine life into 2029.
Continued security incidents or related concerns could have a material adverse impact on future operating performance. In response to the security situation noted above, the Company continues to actively work with authorities and suppliers to mitigate potential impacts and manage supply continuity, while also investing in additional infrastructure and supply inventory levels designed to secure operational continuity. See "Risks and Uncertainties."
Brownfield Exploration
During the three and twelve months ended December 31, 2025, approximately 3,800 metres and 40,300 metres respectively, of diamond and reverse circulation drilling were completed as part of a step-out and infill drilling program to extend known mineralization and improve resource confidence within selected areas of Essakane North, Essakane Main Zone and the Lao satellite deposit and southern extension. The deposits remain open along strike and at depth. Exploration activities on concessions surrounding the mine lease continue to be suspended due to regional security constraints.
Mineral Resources and Reserves
Mineral Reserves decreased 640,000 ounces, primarily due to depletion (428,000 contained ounces milled) and geology model adjustments as mining activities continue to progress through the mine plan.
Essakane M&I Mineral Resources, inclusive of Mineral Reserves on a 100% basis (excluding Gossey), increased 11% to an estimated 4.4 million ounces (3.8 million ounces attributable) as of December 31, 2025, with a 50% increase in tonnes (to 150 Mt) offsetting a 26% decrease in grades (to 0.91 g/t Au, including stockpiles). The increase in tonnes and ounces underscores confidence in the potential for Essakane to extend its mine life within the fence beyond current guidance (last year Essakane processed 12.6 Mt of ore at an average head grade of 1.18 g/t Au). Inferred Mineral Resources (excluding Gossey) increased 20% from the year prior to an estimated 853,000 ounces at 1.10 g/t Au. (See "Mineral Resources and Reserves")
| Nelligan Mining Complex, Quebec, Canada |
On December 19, 2025, and December 22, 2025, the Company acquired all of the issued and outstanding shares of each of Northern Superior and Orbec, respectively, by way of court-approved plan of arrangement for consideration of approximately $329.0 million and $14.2 million, respectively, in shares of the Company and cash. The combined assets, together the "Nelligan Mining Complex", consolidates the Chibougamau region with a dominant land position of approximately 134,000 hectares. The Northern Superior acquisition with the Philibert, Chevrier, Lac Surprise and Croteau1 projects together with the Orbec acquisition with the Muus project are combined with IAMGOLD's Nelligan and Monster Lake Projects. The newly combined assets, together, rank as one of the largest pre-production gold camps in Canada. The close proximity of the primary deposits to each other supports the conceptual vision of a central processing facility being fed from multiple ore sources within a 17-kilometre radius.
On February 17, 2026, the Company announced its updated Mineral Resources for the Nelligan Mining Complex. On a consolidated basis, the Nelligan Mining Complex reported a significant increase in Indicated and Inferred Mineral Resources. Indicated Resources increased 1.1 million ounces to a total of 4.3 million ounces at an average grade of 0.99 g/t Au. Inferred ounces increased 1.9 million ounces to a total of 7.5 million ounces at an average grade of 1.08 g/t Au. The Nelligan deposit reported an increase of 575,000 ounces in Indicated Mineral Resources, to a total of 3.7 million ounces at an average grade of 0.95 g/t. The increase was primarily a result of the infill program conducted last year to increase the confidence in ounces from Inferred Mineral Resources. At the time of the Northern Superior acquisition, disclosed estimates were 3.75 Moz Au Measured and Indicated Mineral Resources and 8.65 Moz Au Inferred Mineral Resources, which included Croteau. The Company opted to exclude the mineral resources previously associated with the Croteau property in its year-end update, resulting in the reported totals above. (See "Mineral Resources and Reserves")
IAMGOLD has budgeted approximately $24 million for exploration activities within the Nelligan Mining Complex for 2026. The goal of the program will be to conduct thorough testing of Philibert, expand Nelligan and continue to test Monster Lake at depth, all in support of a conceptual preliminary economic assessment in 2027. The Company is planning to test high priority targets within the region.
Subsequent to the year-end, the Company exercised the option to acquire the remaining 25% interest in the Philibert property held by SOQUEM for the payment totaling C$3.5 million, completing the consolidation of 100% of the Philibert property.
Nelligan
The Company holds a 100% interest in Nelligan located approximately 45 kilometres south of the Chapais Chibougamau area in Québec.
The diamond drilling program of 13,000 metres of expansion and delineation drilling planned for 2025 was increased by more than 3,000 metres and ended at the end of the third quarter. No additional drilling was completed in the fourth quarter 2025 and approximately 16,700 metres were drilled for the year.
On September 15, 2025, the Company provided an update on the 2025 drilling program with assay results confirming the extension of the mineralized zones of Nelligan deposit. Highlights included: 20.6 m at 1.93 g/t Au and 13.5 m at 2.17 g/t Au in hole NE-25-239, and 36.5 m at 3.03 g/t Au in hole NE-25-265 in Zone 36; 24.5 m at 3.24 g/t Au in drill hole NE-25-244, and 28.8 m at 1.00 g/t Au in drill hole NE-25-248 in the Renard Zone; and 21.0 m at 2.23 g/t Au in drill hole NE-25-244, and 7.5 m at 7.48 g/t Au and 34.5 m at 1.22 g/t Au in drill hole NE-25-256A (see news release dated September 15, 2025). The Megane Zone mineralization extends at depth but will require further drilling to delineate potential mineralized lenses to add to the current resources.
Monster Lake
The Company holds a 100% interest in the Monster Lake Gold Project, which is located approximately 15 kilometres north of Nelligan in the Chapais Chibougamau area in Québec.
The 2025 diamond drilling program was initially planned for 17,000 metres and was slightly increased to approximately 17,600 metres, all of which were completed in the third quarter 2025. It tested exploration targets along the main Monster Lake Shear Zone structural corridor and known gold mineralized lateral and depth extensions.
___________________________
1. At the time of the Northern Superior acquisition, disclosed estimates were 3.75 Moz Au Measured and Indicated Mineral Resources and 8.65 Moz Au Inferred Mineral Resources, which included Croteau. As at December 31, 2025, the Company opted to exclude the mineral resources previously associated with the Croteau property in its year end update, resulting in reported totals of 4.34 Moz Au Measured and Indicated Mineral Resources and 7.50 Moz Au Inferred Mineral Resources.
Drilling activities were pursued in other prospective target areas of the general sector.
On September 15, 2025, the Company also provided an update on this 2025 drilling program with assay results indicating the persistence of the high-grade veins in the general down-plunge of the Megane zone. Highlights included: 3.0 m at 12.66 g/t Au in drill hole ML-25-282, and 9.0 m at 23.4 g/t Au in drill hole ML-25-292 in the Megane Zone; and 4.9 m at 127.3 g/t Au in drill hole ML-25-283, and 2.2 m at 39.4 g/t Au in drill hole ML-25-287 in the Lower Shear Zone (see news release dated September 15, 2025).
Anik
The Anik Gold Project is owned at 75% by IAMGOLD after the Company elected to exercise its first option to acquire an undivided interest of 75% in the project in May 2025 pursuant to an option agreement signed on May 20, 2020, with Auriginal Metals, successor to Kintavar Exploration Inc. The project is contiguous with the Nelligan Gold project to the north and east. The Company holds an option to earn up to an 80% interest in the project by meeting certain commitments.
The 2025 diamond drilling program was initially planned for 1,800 metres and was slightly increased to approximately 2,100 metres, all of which was completed in the first quarter 2025, testing different target areas.
| Exploration |
During the twelve months ended December 31, 2025, drilling activities on active projects and mine sites totaled approximately 194,000 metres. For additional information regarding the brownfield and greenfield exploration projects, see "Operations". The Company's exploration expenditures guidance for 2026 is $54 million.
| ($ millions) | Q4 2025 | Q4 2024 | 2025 | 2024 | 2023 | |||||
| Exploration projects - greenfield | $ | 4.7 | $ | 4.7 | $ | 22.2 | $ | 17.5 | $ | 11.0 |
| Exploration projects - brownfield1 | 2.5 | 2.4 | 12.9 | 8.9 | 6.3 | |||||
| Total - all operations | $ | 7.2 | $ | 7.1 | $ | 35.1 | $ | 26.4 | $ | 17.3 |
1. Exploration projects - brownfield for the fourth quarter 2025 included near-mine exploration and resource development of $2.0 million (fourth quarter 2024 - $2.0 million) and $10.8 million for 2025 (2024 - $6.5 million, 2023 - $4.4 million), which are capitalized.
Disposition of Royalty Interests
During the second quarter 2025, the Company completed a transaction with Summit Royalty Corporation affecting the sale of a portfolio of non-core royalty interests for aggregate cash proceeds of $10.0 million and 11.5 million shares in Summit Royalty. As part of the disposition, third party royalty holders exercised their Right of First Refusal and acquired certain interests for proceeds of $1.85 million.
| FINANCIAL CONDITION |
Liquidity and Capital Resources
The Company's capital allocation strategy is to maximize value through the allocation of internally generated cashflows to fund growth opportunities, return capital to its shareholders, and strengthen its balance sheet.
As at December 31, 2025, the Company had $421.9 million in cash and cash equivalents and net debt of $344.4 million. The Company has $200.0 million drawn on the Credit Facility and approximately $445.7 million remains available, resulting in liquidity at December 31, 2025 of approximately $868.6 million.
Within cash and cash equivalents,
• $53.5 million (70% basis) was held by the Côté Gold UJV. The Côté Gold UJV requires its joint venture partners to fund, in advance, two months of future expenditures and cash calls are made at the beginning of each month, resulting in the month end cash balance approximating the following month's expenditure.
• $197.5 million was held by Essakane. The Company uses dividends and a shareholder account structure to repatriate funds from Essakane (see "Dividend Payments from Essakane" below).
Restricted cash totaled $71.0 million and relates to deposits required for environmental closure costs obligations related to Essakane and the Westwood division.
The Company's liquidity position and capital allocation decisions will be substantially determined by the success or failure of the Company's operations, the price of gold, currency exchange rates and the Company's ability to successfully repatriate dividends from Burkina Faso.
The Company's liquidity position, comprised of cash and cash equivalents, short-term investments, and availability under the Credit Facility, together with expected cash flows from operations, is expected to be sufficient to support the Company's normal operating requirements, capital commitments, and service the debt obligations as they become due. The Company's ability to draw down on the Credit Facility is dependent on its ability to meet net debt to EBITDA and interest ratio covenants.
Readers are encouraged to read the "Caution Regarding Forward Looking Statements" and the "Risk Factors" sections contained in the Company's 2025 Annual Information Form, which is available on SEDAR at www.sedarplus.ca and the "Caution Regarding Forward Looking Statements" and "Risk and Uncertainties" section of this MD&A.
Dividend Payments from Essakane
Excess cash at Essakane is repatriated through dividend and shareholder account payments, of which the Company will receive its share based on its ownership, net of withholding taxes. The shareholder account structure functions like an inter-company loan and allows for the Company's portion of the dividend to be repaid using cash in excess of working capital requirements and aligns the interests of both IAMGOLD and the Government of Burkina Faso, including a preference for increased and/or more regular cash flow movements from Essakane.
Essakane declared a record dividend of approximately $855 million in June 2025. This dividend represents the full distribution of past undistributed retained earnings up to and including 2024. IAMGOLD's 85% portion of the dividend, net of taxes, is approximately $680.7 million at an EUR/USD exchange rate of 1.15. IAMGOLD received $291 million of dividend payments, shareholder account payments and interest up to December 31, 2025, and the remaining balance of $408 million at December 31, 2025, is expected to be fully paid over the next 6 to 12 months. Subsequent to year end, additional payments of $171 million of shareholder account payments were received.
| $ millions | Dividend | Shareholder account | ||
| 2025 dividend declared | $ | 855.0 | ||
| Government of Burkina Faso 15% share paid in June 2025 | (128.3) | |||
| Withholding tax paid in July 2025 | (46.0) | |||
| IAMGOLD's portion of 2025 dividend declared | 680.7 | |||
| Dividend paid to IAMGOLD | (98.0) | |||
| Balance converted to Shareholder account | (582.7) | 582.7 | ||
| Q4 2025 payments received | (184.8) | |||
| Interest payments received | (8.2) | |||
| Foreign exchange revaluation | 18.7 | |||
| Balance at December 31, 2025 | $ | 408.4 |
The dividend and shareholder loan are denominated in XOF which is pegged to the Euro. The timing of the repayment of the shareholder account is dependent upon the gold price, financial performance of Essakane, currency exchange rates and potential receipt of any value added tax ("VAT") balances owed to Essakane. See "Risks and Uncertainties".
Share Buyback Program
During the fourth quarter 2025, the Company repurchased and cancelled approximately 3 million shares for approximately $50 million at an average price of $16.87 per share through its share buyback program under a normal course issuer bid ("NCIB") that was approved by the Company's Board of Directors and the TSX. The approval allows for the purchase of up to 57,000,000 of its common shares over a twelve-month period, representing approximately 9.92% of IAMGOLD's public float as at November 30, 2025, through the facilities of the TSX, the NYSE, or any other eligible Canadian alternative trading system on which the common shares are listed. All common shares purchased under the NCIB will be either cancelled or placed under trust to satisfy future obligations under the Company's share incentive plan. This initiative reflects management's confidence in the Company's long-term value and its commitment to disciplined capital allocation. The program is expected to continue to be funded from operating cash flows.
The Company has established an automatic share purchase plan in connection with its NCIB to facilitate the purchase of common shares during times when IAMGOLD would ordinarily not be permitted to purchase common shares due to regulatory restrictions or self-imposed black-out periods. Before entering a black-out period, IAMGOLD may, but is not required to, instruct the broker to make purchases under the NCIB based on parameters set by IAMGOLD in accordance with the automatic share purchase plan, applicable securities laws and stock exchange rules. The actual number of common shares that may be purchased, if any, and the timing of such purchases, will be determined by the Company based on a number of factors, including the Company's financial performance, the availability of cash flows, and the consideration of other uses of cash, including capital investment opportunities, returns to shareholders, and debt reduction.
Cash and Working Capital
The following sets out the changes in cash balance from September 30, 2025, to December 31, 2025, and December 31, 2024, to December 31, 2025:
December 31, 2025 vs September 30, 2025 Cash balance
($ millions)
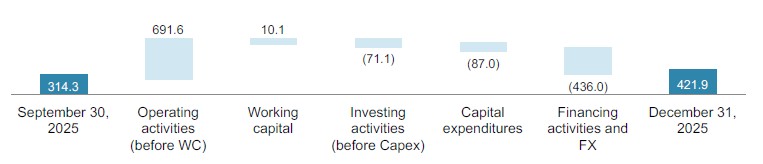
December 31, 2025 vs December 31, 2024 Cash balance
($ millions)
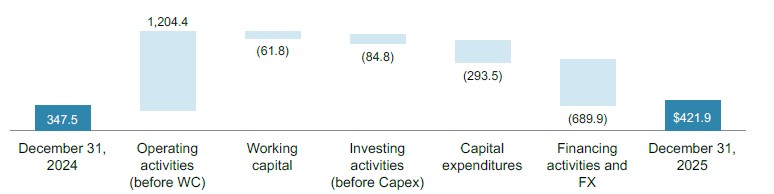
Current assets as at December 31, 2025, were $903.7 million, an increase of $235.4 million compared with December 31, 2024. The increase was due to higher inventories of $105.1 million, higher cash and cash equivalents of $74.4 million, higher receivables and other current assets of $30.7 million and assets classified as held for sale in 2025 of $25.2 million.
Current liabilities as at December 31, 2025, were $517.1 million, down $33.5 million compared with December 31, 2024. The decrease was primarily due to the $151.1 million reduction in the current portion of deferred revenue, a $27.7 million decrease in the current portion of other liabilities, and a decrease of $5.9 million in current portion of lease liabilities and provisions, partially offset by increased accounts payable and accrued liabilities of $64.3 million, an accrual of $50 million for the automatic share purchase plan for the period of January 1 to February 20, 2026, and an increase in income tax payable of $36.9 million.
Cash Flow
| ($ millions) | Q4 2025 | Q4 2024 | 2025 | 2024 | 2023 | ||||||||||
| Net cash from (used in) per consolidated financial statements: | |||||||||||||||
| Operating activities | $ | 701.7 | $ | 102.6 | $ | 1,142.6 | $ | 486.0 | $ | 159.4 | |||||
| Investing activities | (158.1 | ) | (102.5 | ) | (378.3 | ) | (582.4 | ) | (402.3 | ) | |||||
| Financing activities | (433.3 | ) | (194.9 | ) | (709.4 | ) | 83.3 | 201.7 | |||||||
| Effects of exchange rate fluctuation on cash and cash equivalents | (2.7 | ) | (11.3 | ) | 19.5 | (7.0 | ) | 1.3 | |||||||
| Increase (decrease) in cash and cash equivalents | $ | 107.6 | $ | (206.1 | ) | $ | 74.4 | $ | (20.1 | ) | $ | (39.9 | ) | ||
| Cash and cash equivalents, beginning of the period | 314.3 | 553.4 | 347.5 | 367.1 | 407.8 | ||||||||||
| Cash and cash equivalents, end of the period | $ | 421.9 | $ | 347.3 | $ | 421.9 | $ | 347.0 | $ | 367.9 | |||||
| Decrease (increase) in cash and cash equivalents - held for sale | $ | - | $ | 0.2 | $ | - | $ | 0.5 | $ | (0.8 | ) | ||||
| Cash and cash equivalents, end of the period | $ | 421.9 | $ | 347.5 | $ | 421.9 | $ | 347.5 | $ | 367.1 |
Operating Activities
Net cash flow from operating activities for the fourth quarter 2025 was $701.7 million, higher by $599.1 million compared to the same prior year period, primarily due to:
• Higher cash earnings of $514.0 million due to higher realized gold price and an increased sales volume,
• Net impact of $64.4 million from the deferred revenue recognized in prior year period,
• A decrease in receivables and other items of $38.3 million that includes the impact of VAT received in Burkina Faso,
• An increase in trade and other payables of $13.5 million relative to the prior year period, and
• A net increase in derivative settlements of $1.8 million,
Offset by:
• A net increase in inventories of $16.5 million, primarily due to an increase in the value of supplies inventory at the operations relative to the prior year period,
• Higher income tax payments of $14.9 million, and
• Higher disbursements related to asset retirement obligations of $1.5 million.
For the year, net cash flow from operating activities was $1,142.6 million, higher by $656.6 million compared to the same prior year period, primarily due to:
• Higher cash earnings of $768.7 million due to higher realized gold price and an increased sales volume,
• An increase in trade and other payables of $73.9 million due to the timing of supplier invoices, and
• Net reductions in receivables and other items of $34.0 million, including the impact of VAT received in Burkina Faso, Offset by:
• Higher income tax payments of $116.1 million,
• A net increase in inventories of $54.4 million primarily due to an increase in supplies inventory at the operations relative to the prior year period,
• Net impact of $37.9 million from the gold prepay arrangements, and
• Higher disbursements related to asset retirement obligations of $11.6 million.
Investing Activities
Net cash used in investing activities for the fourth quarter 2025 was $158.1 million, a decrease of $55.6 million from the same prior year period, primarily due to:
• Net cash proceeds of $35.5 million received from the sale of Karita and related assets in the prior year period,
• Cash component of acquisition costs for Northern and Orbec of $30.8 million, and
• Securitization of the Essakane VAT receivable into Government of Burkina Faso Bonds and other investing activities of $29.0 million than the same year prior period,
Offset by:
• A decrease in capital expenditures for property, plant and equipment of $32.8 million, mainly due to lower capitalized waste stripping in the period, and
• A decrease in capitalized borrowing costs of $6.9 million.
For the year, net cash used in investing activities was $378.3 million, lower by $204.1 million from the same prior year period, primarily due to:
• A decrease in capital expenditures for property, plant and equipment of $264.5 million, mainly due to the completion of the Côté Gold construction phase in 2024,
• A decrease in capitalized borrowing costs of $43.2 million, and
• $6.4 million lower in proceeds from the sale of marketable securities, other royalty interests and other dispositions.
Offset by:
• Net cash proceeds of $35.2 million received from the sale of Karita and related assets in the prior year period,
• Cash component of acquisition costs for Northern Superior and Orbec of $30.7 million,
• Securitization of the Essakane VAT receivable into Government of Burkina Faso Bonds and other investments of $25.9 million, and
• A one-time payment of $18.2 million arising from the closing of the Yatela asset in the current period.
Financing Activities
Net cash used in financing activities for the fourth quarter 2025 was $433.3 million, a decrease of $238.4 million from the same prior year period, primarily due to:
• A repayment of $300.0 million of the second lien term loan,
• A repurchase of $50.0 million of common shares in the fourth quarter 2025, and
• A repayment of $50.0 million on the Credit Facility in the fourth quarter 2025, compared to a $220 million draw in fourth quarter 2024,
Offset by:
• The repurchase of $376.9 million of transferred interest in 2024 from SMM, and
• Other financing outflows of $4.7 million.
For the year, net cash used in financing activities was $709.4 million, higher by $792.7 million from the same prior year period, primarily due to:
• A repayment of $400.0 million of the second lien term loan,
• The net proceeds of $283.6 million received in the same prior year period from the issuance of shares,
• A net reduction of the credit facility of $20.0 million in 2025, compared to a $220 million draw in 2024,
• A $110.3 million increase to the dividend paid to the Government of Burkina Faso compared to the same prior year period,
• An increase in the expensed portion of borrowing costs of $50.8 million,
• A repurchase of $50.0 million of common shares,
• The receipt of $44.4 million in proceeds received through the SMM funding arrangement in 2024, and
• Higher net reduction in lease principal and equipment loans of $7.3 million,
Offset by:
• The repurchase of $376.9 million of transferred interest in 2024 from SMM, and
• Lower option fee payments and other financing outflows of $16.8 million.
Long-term debt
The following table summarizes the carrying value of the Company's long-term debt:
| December 31 | December 31 | December 31 | |||||||
| ($ millions)1 | 2025 | 2024 | 2023 | ||||||
| Credit Facility | $ | 200.0 | $ | 220.0 | $ | - | |||
| 5.75% senior notes ($450 million principal outstanding) | 448.8 | 448.4 | 448.0 | ||||||
| Term Loan ($nil million principal outstanding) | - | 358.4 | 375.6 | ||||||
| Equipment loans | 1.0 | 2.1 | 7.2 | ||||||
| $ | 649.8 | $ | 1,028.9 | $ | 830.8 |
1. Long-term debt does not include leases in place of $112.0 million as at December 31, 2025 (December 31, 2024 - $124.2 million, December 31, 2023 - $121.3 million).
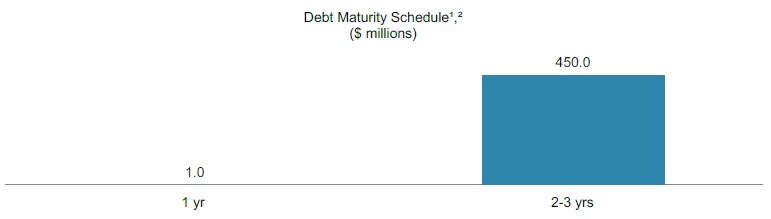
1. Includes principal for the 5.75% senior notes and equipment loans and leases.
2. Excludes the amounts drawn on the Credit Facility, which can be repaid at any time prior to maturity in 2028.
Credit Facility
The Company has a $650 million secured revolving Credit Facility, which was entered into in December 2017 and subsequently increased and extended by four years now maturing on December 20, 2028, in support of the Company's requirements for a senior revolving facility for its overall business.
The Credit Facility provides for an interest rate margin above the secured overnight financing rate (SOFR), banker's acceptance prime rate and base rate advances which vary, together with fees related thereto, according to the total net debt to EBITDA ratio of the Company. The Credit Facility is secured by certain of the Company's real assets, guarantees by certain of the Company's subsidiaries and pledges of shares of certain of the Company's subsidiaries. The key terms of the Credit Facility include certain limitations on incremental debt, certain restrictions on distributions and financial covenants, including net debt to EBITDA, Interest Coverage and a minimum liquidity requirement of $150 million. The Company was in compliance with its Credit Facility covenants as at December 31, 2025.
As at December 31, 2025, the Credit Facility was drawn in the amount of $200.0 million and the Company issued letters of credit under the Credit Facility in the amount of $3.9 million as a supplier payment guarantee and $0.4 million as guarantees for certain environmental indemnities to government agencies, with $445.7 million remaining available under the Credit Facility.
5.75% Senior notes
In September 2020, the Company completed the issuance of $450 million of senior notes at face value with an interest rate of 5.75% per annum (the "Notes"). The Notes are denominated in U.S. dollars and mature on October 15, 2028. The notes are callable at 100% of their face value. Interest is payable in arrears in equal semi-annual installments on April 15 and October 15 of each year, beginning on April 15, 2021, in the amount of approximately $12.9 million for each payment. The Notes are guaranteed by certain of the Company's subsidiaries.
Term Loan
In May 2023, the Company entered into a $400.0 million Term Loan. The Term Loan had a 3% original issue discount, bearing interest at a floating interest rate of either one month or three-month SOFR + 8.25% per annum. The Company repaid $100 million during the third quarter of 2025 and the balance of $300 million during the fourth quarter 2025. The early repayment included a 4% repayment penalty that amounted to $16 million. With the repayment completed, the Term Loan has been fully extinguished and is no longer in effect, including all associated covenants and obligations.
Leases
At December 31, 2025, the Company had lease obligations of $112.0 million at a weighted average borrowing rate of 7.25%.
On April 29, 2022, the Company, on behalf of the Côté Gold UJV, entered into a master lease agreement with Caterpillar Financial Services Limited for $125 million, which was subsequently amended to increase the facility to $175 million for the leasing of certain mobile equipment at Côté Gold. The final pieces of equipment were delivered during the first quarter 2025.
Equipment loan
At December 31, 2025, the Company had an equipment loan with a carrying value of $1.0 million secured by certain mobile equipment, with an interest rate of 5.3% which matures in 2026. The equipment loan is carried at amortized cost on the consolidated balance sheet.
Gold prepay arrangements
In December 2023 and April 2024, the Company entered into gold sale prepay arrangements and amendments to certain pre- existing prepay arrangements.
At June 30, 2025, the Company fulfilled all gold delivery obligations thereby concluding the gold prepay arrangements:
• 2024 Q1 Prepay Arrangements: In the first quarter 2024, the Company received an amount of $59.9 million at an effective gold price of $1,916 per ounce and was required to physically deliver 31,250 ounces of gold over the first quarter 2025 in equal monthly amounts.
• 2024 Q2 Prepay Arrangements: In the second quarter 2024, the Company received an amount of $59.4 million at an effective gold price of $1,900 per ounce with the requirement to physically deliver 31,250 ounces of gold over the second quarter 2025 in equal monthly amounts. The arrangement included a gold collar of $2,100 to $2,925 per ounce whereby the Company received cash payments at the time of delivery of the ounces, with the payment calculated as the difference between the spot price and $2,100 per ounce, capped at $2,925 per ounce. The Company received approximately $25.8 million in relation to the collar in the second quarter 2025.
• Amendment to pre-existing prepay arrangements: the Company deferred the delivery of 12,500 ounces that were previously scheduled for delivery in the first half of 2024 that were delivered in the first half of 2025.
Surety bonds and performance bonds
As at December 31, 2025, the Company had (i) C$274.7 million ($200.3 million) of surety bonds, issued pursuant to arrangements with insurance companies, in support of environmental closure costs obligations related to the Westwood division and Côté Gold and (ii) C$32.1 million ($23.4 million) of performance bonds in support of certain obligations primarily related to the construction of fish habitat at Côté Gold.
As at December 31, 2025, there is no collateral required to be in place for surety and performance bonds, and the balance of $223.7 million remains uncollateralized.
During the third quarter 2025, the Company increased the bonds required by C$16.9 million ($12.2 million) and will be required to increase bonds required further by C$19.0 million ($13.6 million) cumulatively during the second and third quarter of 2026.
Contractual Obligations
As at December 31, 2025, contractual obligations from operations with various maturities were approximately $1.2 billion, primarily comprising expected future contractual payments of long-term debt, including principal and interest, purchase obligations, capital expenditures obligations, asset retirement obligations and lease obligations, partially offset by cash collateralized letters of credit and restricted cash in support of environmental closure cost obligations for certain mines. The Company believes these obligations will be met through available cash resources and net cash from operating activities. The Company entered into derivative contracts for risk management purposes, which are not included in the contractual obligations.
Details of these contracts are included in "Financial Instruments".
| Payments due by period1 | |||||||||||||||
| At December 31, 2025 | Total | <1 yr | 2-3 yrs | 4-5 yrs | >5 yrs | ||||||||||
| Long-term debt | $ | 527.7 | $ | 25.9 | $ | 501.8 | $ | - | $ | - | |||||
| Equipment loan | 1.0 | 1.0 | - | - | - | ||||||||||
| Purchase obligations | 180.6 | 169.1 | 5.4 | 2.2 | 3.9 | ||||||||||
| Capital expenditure obligations | 37.4 | 37.4 | - | - | - | ||||||||||
| Lease obligations | 118.9 | 3.9 | 79.9 | 27.7 | 7.4 | ||||||||||
| Total contractual obligations | $ | 865.6 | $ | 237.3 | $ | 587.1 | $ | 29.9 | $ | 11.3 | |||||
| Asset retirement obligations | 372.5 | 5.8 | 39.0 | 53.5 | 274.2 | ||||||||||
| $ | 1,238.1 | $ | 243.1 | $ | 626.1 | $ | 83.4 | $ | 285.5 | ||||||
1. Excludes the amounts drawn on the credit facility, which can be repaid at any time prior to maturity in 2028.
Financial Instruments
The Company seeks to manage its exposure to fluctuations in foreign exchange rates and commodity prices by entering into derivative financial instruments from time to time. The Company establishes trading agreements with counterparties under which there is no requirement to post any collateral or make any margin calls on derivatives. Counterparties cannot require settlement solely because of an adverse change in the fair value of a derivative.
Foreign Currency Contracts
The Company's functional currency is the U.S. dollar with revenues primarily denominated in U.S. dollars which creates currency exchange risk exposure primarily associated with its expenditures denominated in Canadian dollars and Euros (input costs). Separately, additional currency exchange rate risk exists on earnings distributions from Essakane where total notional amount of the distribution is effectively denominated in EUR and converted to USD upon payment. The total amount of the distribution fluctuates based on EUR/USD rates and is realized based on the timing of distribution payments
At December 31, 2025, the Company's outstanding foreign currency contracts were as follows:
| 2026 | |
| Foreign Currency (Input Hedge)1 | |
| Canadian dollar contracts (millions of C$) | 276 |
| Rate range (USD/CAD) | 1.35 - 1.50 |
| Hedge ratio2 | 19% |
| Foreign Currency (Output Hedge)3 | |
| Euro contracts (millions of EUR) | 85 |
| Rate range (EUR/USD) | 1.15 - 1.22 |
| Hedge ratio4 | 21% |
1. Canadian dollar hedges exclude Canadian dollars on hand which functions as a natural hedge for the Company's Canadian dollar expenditures. USD/CAD hedges are CAD notional hedges.
2. The Company calculates the CAD hedge ratio based on future estimates of operating and capital expenditures such as its Canadian dollar operating and capital expenditures at Côté Gold, Westwood and its corporate office. Outstanding derivative contracts are allocated based on a specified allocation methodology.
3. Euro hedges are for the sale of EUR (purchase of USD) and are not a hedge of input costs.
4. The Company calculates the EUR hedge ratio based on the amount of the Essakane dividend distribution payable to the corporate office, including the portion of the 2024 dividend declared in June 2025 which is partially outstanding as an intercompany shareholder account.
| Q4 2025 | Q4 2024 | 2025 | 2024 | 2023 | |
| Average rates | |||||
| USD/CAD | 1.3947 | 1.3993 | 1.3978 | 1.3700 | 1.3497 |
| EUR/USD | 1.1634 | 1.0666 | 1.1300 | 1.0820 | 1.0816 |
| Closing rates | |||||
| USD/CAD | 1.3724 | 1.4384 | 1.3724 | 1.4384 | 1.3205 |
| EUR/USD | 1.1746 | 1.0354 | 1.1746 | 1.0354 | 1.1060 |
Commodity Contracts
Energy Contracts
The Company uses option structures to help mitigate the risk of fluctuations in the cost of energy, which is a major input in its ongoing mine-site operating costs.
At December 31, 2025, the Company's outstanding energy contracts were as follows:
| 2026 | |
| Energy Contracts | |
| Brent oil contracts (thousands of barrels) | 24 |
| Contract price range ($/barrel of crude oil) | 60 - 68.50 |
| Hedge ratio1 | 3% |
| WTI oil contracts (thousands of barrels) | 16 |
| Contract price range ($barrel of crude oil) | 55 - 70 |
| Hedge ratio1 | 11% |
1. The Company calculates hedge ratios based on future estimates of its fuel consumption for operating and capital activities at Côté Gold, Essakane and Westwood. Outstanding derivative contracts are allocated based on a specified allocation methodology.
Gold Contracts
The Company's primary source of revenue is gold that is denominated in U.S. dollars. To manage such risk, the Company may use various hedging strategies, including the use of put and call option contracts. Option contracts can also include put option contracts and call option contracts (collar structure), within a range of expiry dates and strike prices.
Gold prices remained highly volatile during the period, and this variability continued to impact the Company's operating and financial performance. Fluctuations in realized prices affected revenue, cash flow generation, and operating margins, in addition, the broader market's sensitivity to commodity price movements contributed to the increase in volatility in the Company's share price. Volatility in the gold price is expected to continue in the future which will continue to impact the Company's share price.
In the third quarter 2025, the Company purchased gold puts for the purpose of ensuring the timely payment of planned earnings distributions from the Essakane mine. The put purchase price is financed such that the cash outlay for the purchase price is aligned with the hedges' expiries occurring monthly in 2026. As the hedges are paid for with cash at the time of delivery, no call option was sold to finance the put purchase, and therefore the gold hedges allow unlimited participation in market spot gold prices above the put level (floor price).
At December 31, 2025, the Company's outstanding gold contracts were as follows:
| 2026 | |
| Gold Contracts | |
| Gold put options (thousands of ounces) | 200 |
| Put price level ($/ounce) | $3,100 |
The following table compares the market price of gold with the average price of gold:
| Q4 2025 | Q4 2024 | 2025 | 2024 | 2023 | |||||||||||
| Average market gold price ($/oz) | $ | 4,135 | $ | 2,663 | $ | 3,432 | $ | 2,386 | $ | 1,941 | |||||
| Average realized gold price1 ($/oz), inclusive of prepay deliveries: | $ | 4,191 | $ | 2,525 | $ | 3,482 | $ | 2,330 | $ | 1,955 | |||||
| Average realized gold price, excluding prepay deliveries ($/oz) | $ | 4,191 | $ | 2,664 | $ | 3,549 | $ | 2,414 | $ | 1,955 | |||||
| Average realized gold price of prepay deliveries2 | $ | - | $ | 2,031 | $ | 2,305 | $ | 1,997 | $ | - | |||||
| Closing market gold price ($/oz) | $ | 4,368 | $ | 2,609 | $ | 4,368 | $ | 2,609 | $ | 2,062 |
1. This is a non-GAAP financial measure. See "Non-GAAP Financial Measures".
2. No further deliveries are required. The Company delivered 75,000 ounces into the 2024 Prepay Arrangements in the first half of 2025 fully fulfilling the terms of the arrangements. See "Gold prepay arrangements" above.
Sensitivity Impact
The following table provides estimated cost per ounce sensitivities around certain inputs, excluding the impact of the Company's hedging program which can affect the Company's operating results, assuming guided 2026 production and costs levels:
| Change of | Annualized impact on | Annualized impact on | Annualized impact on | |
| Cost of Sales $/oz | Cash Costs1 $/oz | AISC1 $/oz | ||
| Oil price | $10/barrel | $7 | $7 | $8 |
| USD/CAD | $0.10 | $46 | $46 | $78 |
| EUR/USD | $0.10 | $14 | $14 | $22 |
1. This is a non-GAAP financial measure. See "Non-GAAP Financial Measures". Cash costs and AISC per ounce of gold sold consist of Côté Gold, Westwood and Essakane on an attributable basis of 70%, 100% and 85%, respectively.
The cost of sales and cash costs of the Company are impacted by the gold price linked payments and royalties at Côté Gold and Essakane. See "Outlook - Costs".
Compensation of Key Management Personnel
Compensation breakdown for key management personnel, comprising of the Company's directors and executive officers, is as follows:
| 2025 | 2024 | 2023 | |||||||
| Salaries and other benefits | $ | 5.1 | $ | 5.5 | $ | 7.2 | |||
| Retirement benefits | 2.7 | 0.7 | 2.1 | ||||||
| Share-based payments | 3.9 | 3.2 | 4.2 | ||||||
| $ | 11.7 | $ | 9.4 | $ | 13.5 |
Shareholders' Equity
| Number issued and outstanding (millions) | December 31, 2025 | February 17, 2026 | ||||
| Common shares | 591.1 | 588.8 | ||||
| Options1 | 2.2 | 2.1 |
1. Refer to note 25 of the consolidated financial statements for all outstanding equity awards.
| QUARTERLY FINANCIAL REVIEW |
| 2025 | 2024 | |||||||||||||||||||||||
| ($ millions, except where noted) | Q4 | Q3 | Q2 | Q1 | Q4 | Q3 | Q2 | Q1 | ||||||||||||||||
| Revenues | $ | 1,088.1 | $ | 706.7 | $ | 580.9 | $ | 477.1 | $ | 469.9 | $ | 438.9 | $ | 385.3 | $ | 338.9 | ||||||||
| Net earnings (loss) | $ | 444.7 | $ | 155.2 | $ | 85.9 | $ | 46.5 | $ | 91.1 | $ | 602.5 | $ | 92.5 | $ | 61.7 | ||||||||
| Net earnings (loss) attributable to equity holders | $ | 406.6 | $ | 139.4 | $ | 78.7 | $ | 39.7 | $ | 86.2 | $ | 594.1 | $ | 84.5 | $ | 54.8 | ||||||||
| Basic earnings (loss) per share attributable to equity holders | $ | 0.70 | $ | 0.24 | $ | 0.14 | $ | 0.07 | $ | 0.15 | $ | 1.04 | $ | 0.16 | $ | 0.11 | ||||||||
| Diluted earnings (loss) per share attributable to equity holders | $ | 0.70 | $ | 0.24 | $ | 0.14 | $ | 0.07 | $ | 0.15 | $ | 1.03 | $ | 0.16 | $ | 0.11 | ||||||||
In the third quarter 2024, net earnings from operations were higher due to the reversal of previous impairments in respect of the Westwood CGU, which includes the Doyon closed mine.
Revenues
Revenues were $1,088.1 million in the fourth quarter 2025 from record sales volume of 259,000 ounces at an average realized gold price of $4,191 per ounce, higher by $618.2 million or 132% than the prior year period, due primarily to the $1,666 per ounce increase in the realized gold price and the continued ramp-up of gold sales volume at the Côté Gold mine.
Revenues for the year were $2,852.8 million from sales of 817,800 ounces at an average realized gold price of $3,482 per ounce, higher by $1,219.8 million or 75% than the prior year period, primarily due to the $1,152 per ounce increase in realized gold price and higher gold sales volume as the Côté Gold mine only commenced gold sales from the second quarter 2024, partially offset by lower sales volumes at Essakane and Westwood and the impact of gold deliveries into the prepay arrangements in the first half of 2025, including 31,000 ounces delivered at a collar price of $2,925 per ounce, 31,000 ounces delivered at a forward price of $1,916 per ounce and 13,000 ounces delivered at a forward price of $1,753 per ounce.
Cost of sales
Cost of sales excluding depreciation was $358.2 million in the fourth quarter 2025, higher by $115.6 million or 48% than the prior year period, primarily due to the increase in gold sales volume resulting from the ramp-up of the Côté Gold mine, higher royalties at Côté and Essakane due to the higher gold price and higher cost of sales at the Essakane mine due to a combination of lower proportion of capitalized waste in the period, higher maintenance activities and the impact of an appreciation of the local XOF currency, which is pegged to the Euro, compared to the prior year period.
Cost of sales excluding depreciation for the year was $1,225.7 million, higher by $416.4 million or 51% than the prior year period, primarily due to the Côté Gold mine only commencing gold sales from the second quarter 2024, and the higher cost of sales at the Essakane mine due to a combination of lower proportion of capitalized waste in the period, higher maintenance activities and the impact of an appreciation of the local XOF currency, which is pegged to the Euro, compared to the prior year period.
Depreciation expense
Depreciation expense was $136.3 million in the fourth quarter 2025, higher by $39.9 million or 41% than the prior year period primarily due to the higher sales volume compared to the prior year period.
Depreciation expense for the year was $420.9 million, higher by $147.1 million or 54% than the prior year period primarily due to the Côté Gold mine commencing operations in the second quarter 2024, and the reversal of previous impairments for the Westwood mine complex in the third quarter of 2024, partially offset by lower production volumes at Essakane and Westwood and the amortization of deferred stripping assets at Essakane.
Exploration expense
Exploration expense was $5.7 million in the fourth quarter 2025, in line with the prior year period.
Exploration expense for the year was $27.2 million, higher by $5.5 million or 25% than the prior year period due to increased exploration expenditures at Chibougamau District and Côté Gold.
General and administrative expense
General and administrative expense was $14.9 million in the fourth quarter 2025, lower by $0.4 million or 3% than the prior year period, due to $3.8 million in lower salaries and labour costs due to reductions in headcount at the corporate office over the past year, partially offset by $1.9 million higher legal and other administrative costs incurred in the period and $1.5 million in cloud- based software implementation costs.
General and administrative expense for the year was $58.4 million, higher by $9.5 million or 19% than the prior year period, due to $10.9 million in restructuring and other administrative costs incurred in the period, $2.5 million in cloud-based software implementation costs, and $1.8 million in higher share based compensation resulting from the rise in the Company's share price, partially offset by $5.7 million in lower salaries and labour costs due to reductions in headcount at the corporate office.
Income tax expense
The Company is subject to tax in various jurisdictions, including Burkina Faso and Canada. There are a number of factors that can significantly impact the Company's effective tax rate, including the geographic distribution of income, varying rates in different jurisdictions, the non-recognition of tax assets, mining allowances, foreign currency exchange rate movements, changes in tax laws and the impact of specific transactions and assessments. Due to the number of factors that can potentially impact the effective tax rate and the sensitivity of the tax provision to these factors, it is expected that the Company's effective tax rate will fluctuate from one period to the next.
Income tax expense was $75.0 million in the fourth quarter 2025, higher by $40.7 million or 119% than the prior year period. It is comprised of a current income tax expense of $65.4 million and a deferred income tax expense of $9.6 million, higher than the prior year period for current income tax expense by $40.3 million or 161% and higher for deferred income tax expense by $0.4 million or 4%, respectively. The current income tax expense in the fourth quarter 2025 was higher primarily due to higher income in Essakane. The deferred income tax expense in the fourth quarter 2025 was higher primarily due to higher Canadian provincial mining taxes, offset by a deferred tax recovery in Essakane.
Income tax expense was $237.5 million for the year, higher by $108.1 million or 84% than the prior year period. It is comprised of a current income tax expense of $198.9 million and a deferred income tax expense of $38.6 million, higher than the prior year period for current income tax expense by $82.5 million or 71% and higher for deferred income tax expense by $25.6 million or 197%, respectively. The current income tax expense for the year was higher primarily due to higher income in Essakane as well as higher taxes related to the 2025 dividend declared by Essakane. The deferred income tax expense for the year was higher primarily due to higher Canadian provincial mining taxes, offset by a deferred tax recovery in Essakane.
DISCLOSURE CONTROLS AND PROCEDURES AND INTERNAL CONTROL OVER FINANCIAL REPORTING
Disclosure Controls and Procedures
The Company's disclosure controls and procedures are designed to provide reasonable assurance that all relevant information is communicated to senior management to allow timely decisions regarding required disclosure. An evaluation of the effectiveness of the Company's disclosure controls and procedures, as defined under the rules of the Canadian Securities Administration, was conducted as at December 31, 2025, under the supervision of the Company's Disclosure Committee and with the participation of management. Based on the results of that evaluation, the CEO and the CFO concluded that the Company's disclosure controls and procedures were effective as at December 31, 2025, providing reasonable assurance that the information required to be disclosed in the Company's annual filings, interim filings or other reports filed or submitted by it under securities legislation is recorded, processed, summarized and reported in accordance with securities legislation.
Internal Control over Financial Reporting
Internal control over financial reporting is designed to provide reasonable assurance regarding the reliability of the Company's financial reporting and the preparation of consolidated financial statements in compliance with IFRS as issued by the International Accounting Standards Board ("IASB"). The Company's internal control over financial reporting includes policies and procedures that:
• pertain to the maintenance of records that accurately and fairly reflect the transactions of the Company;
• provide reasonable assurance that transactions are recorded as necessary to permit the preparation of consolidated financial statements in accordance with IFRS as issued by the IASB;
• ensure the Company's receipts and expenditures are made only in accordance with authorization of management and the Company's directors; and
• provide reasonable assurance regarding the prevention or timely detection of unauthorized transactions that could have a material effect on the consolidated financial statements.
Following a restructuring of the Corporate office, the Company increased the scope of the functions managed by a third-party service provider regarding its Enterprise Resource Program (ERP) during the year. The Company implemented changes to its general information technology controls and processes related to the change, including additional manual controls during the transition period to augment the general information technology controls. There were no material changes in the Company's internal control over financial reporting during the period that have materially affected, or are reasonably likely to materially affect, the Company's internal control over financial reporting.
An evaluation of the effectiveness of the Company's internal control over financial reporting, including an evaluation of material changes, that may have materially affected or are reasonably likely to have materially affected the internal control over financial reporting based on the criteria established in Internal Control - Integrated Framework (2013) issued by the Committee of Sponsoring Organizations of the Treadway Commission, was conducted as of December 31, 2025 by the Company's management, including the CEO and the CFO. Based on this evaluation, management, including the CEO and the CFO, has concluded that the Company's internal control over financial reporting was effective as of December 31, 2025.
Limitations of Control and Procedures
The Company's management, including the CEO and the CFO, believe that any disclosure of controls and procedures and internal control over financial reporting, no matter how well designed, can have inherent limitations. Therefore, even those systems determined to be effective can provide only reasonable assurance that the objectives of the control system are met.
| CRITICAL JUDGMENTS, ESTIMATES AND ASSUMPTIONS |
The Company's management makes judgments in its process of applying the Company's accounting policies in the preparation of its consolidated financial statements. In addition, the preparation of financial data requires that the Company's management make assumptions on, and estimates of effects of, uncertain future events on the carrying amounts of the Company's assets and liabilities at the end of the reporting period and the reported amounts of revenues and expenses during the reporting period. Actual results may differ materially from those estimates as the estimation process is inherently uncertain. Estimates are reviewed on an ongoing basis based on historical experience and other factors that are considered to be relevant under the circumstances. Revisions to estimates and the resulting effects on the carrying amounts of the Company's assets and liabilities are accounted for prospectively. The critical judgments, estimates, and assumptions applied in the preparation of the Company's consolidated financial statements are reflected in note 3 of the Company's audited annual consolidated financial statements for the year ended December 31, 2025.
| MINERAL RESOURCES AND RESERVES |
MINERAL RESOURCES AND MINERAL RESERVES as of December 31, 20251,2,3,4,5,6,7,8
Mineral Resources are inclusive of Mineral Reserves
| Tonnes | Grade | Ounces | Attributable | ||||||||||
| Ounces | |||||||||||||
| (000s) | (g/t Au) | (000s) | (000s) | ||||||||||
| Côté Gold, Canada | 70 % | ||||||||||||
| Côté | |||||||||||||
| Proven Mineral Reserves | 116,055 | 1.05 | 3,902 | 2,731 | |||||||||
| Probable Mineral Reserves | 101,112 | 0.97 | 3,139 | 2,197 | |||||||||
| Subtotal P&P | 217,167 | 1.01 | 7,041 | 4,929 | |||||||||
| Measured Mineral Resources | 153,873 | 0.93 | 4,598 | 3,219 | |||||||||
| Indicated Mineral Resources | 268,833 | 0.77 | 6,697 | 4,688 | |||||||||
| Subtotal M&I (incl. of Reserves) | 422,707 | 0.83 | 11,295 | 7,907 | |||||||||
| Inferred Mineral Resources | 62,760 | 0.60 | 1,206 | 844 | |||||||||
| Gosselin | |||||||||||||
| Indicated Mineral Resources | 266,741 | 0.80 | 6,861 | 4,803 | |||||||||
| Inferred Mineral Resources | 37,840 | 0.79 | 959 | 671 | |||||||||
| Total M&I | 689,447 | 0.82 | 18,156 | 12,709 | |||||||||
| Total Inferred | 100,600 | 0.67 | 2,165 | 1,515 | |||||||||
| Westwood, Canada | 100 % | ||||||||||||
| Proven Mineral Reserves | 1,555 | 6.63 | 331 | 331 | |||||||||
| Probable Mineral Reserves | 3,803 | 6.68 | 817 | 817 | |||||||||
| Subtotal P&P | 5,358 | 6.67 | 1,148 | 1,148 | |||||||||
| Measured Mineral Resources | 1,619 | 7.21 | 375 | 375 | |||||||||
| Indicated Mineral Resources | 10,324 | 6.09 | 2,022 | 2,022 | |||||||||
| Subtotal M&I (incl. of Reserves) | 11,943 | 6.24 | 2,397 | 2,397 | |||||||||
| Inferred Mineral Resources | 4,507 | 10.46 | 1,515 | 1,515 | |||||||||
| Essakane, Burkina Faso | 85 % | ||||||||||||
| Proven Mineral Reserves | 22,178 | 0.64 | 457 | 388 | |||||||||
| Probable Mineral Reserves | 34,903 | 1.09 | 1,219 | 1,036 | |||||||||
| Subtotal P&P | 57,081 | 0.91 | 1,676 | 1,425 | |||||||||
| Measured Mineral Resources | 38,312 | 0.52 | 640 | 544 | |||||||||
| Indicated Mineral Resources | 111,683 | 1.05 | 3,772 | 3,207 | |||||||||
| Subtotal M&I (incl. of Reserves) | 149,995 | 0.91 | 4,412 | 3,750 | |||||||||
| Inferred Mineral Resources | 24,195 | 1.10 | 853 | 725 | |||||||||
| Gossey | |||||||||||||
| Indicated Mineral Resources | 14,795 | 0.75 | 355 | 302 | |||||||||
| Inferred Mineral Resources | 2,688 | 0.85 | 74 | 63 | |||||||||
| Total M&I | 164,790 | 0.90 | 4,767 | 4,052 | |||||||||
| Total Inferred | 26,883 | 1.07 | 927 | 788 | |||||||||
| Nelligan Mining Complex2, Canada | 100 % | ||||||||||||
| Nelligan | |||||||||||||
| Indicated Mineral Resources | 122,000 | 0.95 | 3,700 | 3,700 | |||||||||
| Inferred Mineral Resources | 151,000 | 0.96 | 4,647 | 4,647 | |||||||||
| Monster Lake | |||||||||||||
| Indicated Mineral Resources | 243 | 13.04 | 102 | 102 | |||||||||
| Inferred Mineral Resources | 1,046 | 14.83 | 499 | 499 | |||||||||
| Philibert7 | (75%) 7 | ||||||||||||
| Indicated Mineral Resources | 7,884 | 1.10 | 279 | 209 | |||||||||
| Inferred Mineral Resources | 48,465 | 1.10 | 1,709 | 1,282 | |||||||||
| Chevrier7 | |||||||||||||
| Indicated Mineral Resources | 6,400 | 1.26 | 260 | 260 | |||||||||
| Inferred Mineral Resources | 15,660 | 1.30 | 652 | 652 | |||||||||
| Total M&I | 136,527 | 0.99 | 4,341 | 4,271 | |||||||||
| Total Inferred | 216,171 | 1.08 | 7,507 | 7,079 | |||||||||
| Diakha-Siribaya, Mali8 | 90 % | ||||||||||||
| Indicated Mineral Resources | 27,937 | 1.48 | 1,325 | 1,193 | |||||||||
| Inferred Mineral Resources | 8,468 | 1.53 | 417 | 376 | |||||||||
| Total Proven & Probable Reserves | 279,606 | 1.10 | 9,865 | 7,502 | |||||||||
| Total Measured & Indicated Mineral Resources | 1,030,644 | 0.94 | 30,987 | 24,622 | |||||||||
| Total Inferred Mineral Resources | 356,628 | 1.09 | 12,530 | 11,273 | |||||||||
1. Figures may not add due to rounding.
2. In mining operations, Measured Mineral Resources and Indicated Mineral Resources that are not Mineral Reserves are considered uneconomic at the price used for Mineral Reserves estimations but are deemed to have a reasonable prospect of economic extraction.
3. See "Cautionary Note to U.S. Investors Regarding Disclosure of Mineral Reserves and Mineral Resources Estimates".
4. 2025 Mineral Reserves estimated as of December 31, 2025, using a gold price of $2,000 per ounce for Westwood (including Grand Duc) and Essakane; and $1,700 per ounce for Côté Gold.
5. 2025 Mineral Resources estimated as of December 31, 2025, using a gold price of: $2,500 per ounce for Essakane, Westwood (incl. Grand Duc), Nelligan, Monster Lake and Gossey; and $2,100/oz for Côté.
6. Diakha-Siribaya Mineral Resources are estimated at a gold price of $1,500 per ounce. The definitive agreement to sell the Diakha-Siribaya Gold Project in Mali to Managem S.A. expired on December 31, 2024, and was not extended. The Company is pursuing alternative options for the sale of this asset.
7. Philibert (75% with option to acquire 100% from SOQUEM for C$3.5M) and Chevrier were acquired with the closing of the Northern Superior transaction in December 2025. The Mineral Resources estimates for these assets are based on data as reported in the respective NI 43-101 Technical Reports. Chevrier Mineral Resources (including underground Inferred Resources)have been estimated as of September 23, 2022, using a $1,800/oz gold price and have been estimated in accordance with NI 43-101. Philibert Mineral Resources have been estimated as of September 22, 2023, using a $1,747/oz gold price and have been estimated in accordance with NI 43-101.
8. At the time of the Northern Superior acquisition, disclosed estimates were 3.75 Moz Au Measured and Indicated Mineral Resources and 8.65 Moz Au Inferred Mineral Resources, which included Croteau. The Company opted to exclude the mineral resources previously associated with the Croteau property in its year-end update, resulting in reported totals of 4.34 Moz Au Measured and Indicated Mineral Resources and 7.50 Moz Au Inferred Mineral Resources.
Qualified Person and Technical Information
The technical and scientific information relating to exploration activities disclosed in this document was prepared under the supervision of and verified and reviewed by Marie-France Bugnon, P.Geo., Vice President, Exploration, IAMGOLD. Ms. Bugnon is a "qualified person" as defined in National Instrument 43-101 - Standards of Disclosure for Mineral Projects ("NI 43-101").
Christine Beausoleil, P.Geo. (Senior Director, Mining Geology, IAMGOLD Corporation), is the qualified person responsible for the review and approval of all mineral resource estimates contained herein, as at December 31, 2025. Adrienne Rispoli, P. Eng. (Senior Director, Mining and Integrated Planning, IAMGOLD Corporation), is the qualified person responsible for the review and approval of all mineral reserve estimates contained herein, as at December 31, 2025.
For the recently acquired Philibert and Chevrier properties (acquired on December 19, 2025), the mineral resource estimates provided in this statement are based on data as reported in the respective NI 43-101 Technical Reports. The qualified persons responsible for these estimates have consented under NI 43-101 to the incorporation of their data in this report. IAMGOLD has not revised or altered the original information provided for these properties. For Philibert, the qualified persons Mr. Merouane Rachidi, P.Geo., and Mr. Claude Duplessis, P.Eng.; for Chevrier, the qualified persons are Ms. Susan Lomas, P.Geo., Mr. André Liboiron, P.Geo. and Mr. Jonathan Lavoie, P.Eng.
The technical information has been included herein with the consent and prior review of the above noted qualified persons, who have verified the data disclosed, and data underlying the information or opinions contained herein.
Data verification involves data input and review by senior project geologists at site, scheduled weekly and monthly reporting to senior exploration management and the completion of project site visits by senior exploration management to review the status of ongoing project activities and data underlying reported results. All drilling results for exploration projects or supporting resource and reserve estimates referenced in this MD&A have been previously reported in news release disclosures either by the Company or the project operator as the case may be (see referenced news releases) and have been prepared in accordance with NI 43-101. The sampling and assay data from drilling programs are monitored through the implementation of a quality assurance - quality control (QA-QC) program designed to follow industry best practices. Drill core (HQ and NQ size) samples are selected by the project geologists and sawn in half with a diamond saw at the project site. Half of the core is typically retained at the site for reference purposes. Generally, sample intervals are 1.0 to 1.5 metres in length, and reverse circulation holes are sampled at 1.0 metre intervals at the drill rig. Samples are prepared and analyzed at site for the Company's producing mines and at accredited regional laboratories for the Company's exploration projects, using analysis techniques such as standard fire assay with a 50 gram charge, fire assay with gravimetric finish, or LeachWELL rapid cyanide leach with fire assay with a 50 gram charge.
CAUTIONARY NOTE TO U.S. INVESTORS REGARDING DISCLOSURE OF MINERAL RESERVE AND MINERAL RESOURCE ESTIMATES
Disclosure regarding the Company's mineral properties, including with respect to mineral reserve and mineral resource estimates, included in this report, was prepared in accordance with the Canadian securities administrators' NI 43-101.
The SEC disclosure requirements and policies for mining properties were amended in 2019 to more closely align with current industry and global regulatory practices and standards, including NI 43-101. However, foreign private issuers that file their annual report on Form 40-F with the SEC pursuant to the Multijurisdictional Disclosure System ("MJDS"), such as the Company, may use NI 43-101 rather than the SEC's disclosure requirements and are not required to provide disclosure under subpart 1300 of Regulation S-K when filing MJDS registration statements and annual reports. Accordingly, information contained in this report may not be comparable to similar information disclosed by US companies. If the Company ceases to be a foreign private issuer or loses its eligibility to file its annual report on Form 40-F pursuant to MJDS, then the Company will be subject to reporting pursuant to subpart 1300 of Regulation S-K, which differ from the requirements of NI 43-101. US investors are urged to consider closely the disclosure on technical terminology under the heading "Technical Information" in the Company's AIF filed with Canadian securities regulatory authorities at www.sedarplus.ca and filed under Form 40-F with the SEC at http://www.sec.gov incorporated by reference into this MD&A.
| NEW ACCOUNTING STANDARDS |
For a discussion of new accounting standards adopted and new accounting standards issued but not yet effective that may impact the Company, refer to note 3 of the Company's consolidated financial statements.
| RISKS AND UNCERTAINTIES |
The Company is subject to various business, operational, geopolitical, security, market and financial risks that could materially adversely affect the Company's future business, operations and financial condition and could cause such future business, operational and financial condition to differ materially from the forward-looking statements and information contained in this MD&A and as described under the heading "Cautionary Statement On Forward-Looking Information".
Readers of this MD&A should consider the information included or incorporated by reference in this document and the Company's consolidated financial statements and related notes for the year ended December 31, 2025.
The inherently volatile nature of the Company's activities, the international geographies and emerging, undeveloped economies in which it operates mean that the Company's business, operations and financial condition are generally exposed to significant risk factors, known and unknown, stable and unstable, many of which are beyond its control. Managing these risks is a key component of the Company's business strategy and is supported by a risk management culture and an enterprise risk management ("ERM") system. The Company's view of risks is not static. An important component of the ERM approach is to identify evolving or emerging key risks, manage those risks and incorporate them into existing ERM assessment, measurement, monitoring and reporting processes. These practices are designed to ensure management is forward-looking in its assessment of risks. Identification of key risks occurs in the course of business activities, while pursuing approved strategies and as part of the execution of risk oversight responsibilities at the management and Board of Directors levels.
Readers are cautioned that no ERM framework or system, including that employed by the Company, can ensure that all risks to the Company, at any point in time, are accurately identified, assessed as to significance or impact, managed, effectively controlled or mitigated.
For a comprehensive discussion of the risk factors that may affect the Company, its business operations and financial performance, refer to the risk disclosure contained in the Company's latest annual information form ("AIF"), filed with Canadian securities regulatory authorities at www.sedarplus.ca and filed under Form 40-F with the United States Securities and Exchange Commission ("SEC") at www.sec.gov/edgar, and is hereby incorporated by reference into this MD&A.
| NON-GAAP1 FINANCIAL MEASURES |
The Company has included certain non-GAAP financial measures to supplement its consolidated financial statements, which are presented in accordance with IFRS, including the following:
• Average realized gold price per ounce sold
• Underground mining cost per ore tonne mined, open pit net mining cost per operating tonne mined, milling cost per tonne milled, and G&A cost per tonne milled
• Cash costs excluding royalties, cash costs, cash costs per ounce sold, all in sustaining cost and all in sustaining cost per ounce sold
• Net earnings (loss) attributable to shareholders and adjusted net earnings (loss) attributable to shareholders
• Net cash from operating activities, before movements in working capital and non-current ore stockpiles
___________________________
1. GAAP - Generally accepted accounting principle
• Earnings before interest, income taxes, depreciation and amortization ("EBITDA")
• Mine-site free cash flow
• Sustaining and expansion capital expenditures
The Company believes that, in addition to conventional financial measures prepared in accordance with IFRS, these non-GAAP financial measures will provide investors with an improved ability to evaluate the underlying performance of the Company. Non- GAAP financial measures do not have any standardized meaning prescribed by IFRS, may not be comparable to similar measures presented by other companies and should not be considered in isolation or as a substitute for measures of performance prepared in accordance with IFRS.
Average Realized Gold Price per Ounce Sold
Average realized gold price per ounce sold is intended to enable management to understand the average realized price of gold sold in each reporting period after removing the impact of non-gold revenues and by-product credits, which, in the Company's case, are not significant, and to provide investors a clearer view of the Company's financial performance based on the average realized proceeds from gold sales in the reporting period.
| ($ millions, except where noted) | Q4 2025 | Q4 2024 | 2025 | 2024 | 2023 | ||||||||||
| Revenues | $ | 1,088.1 | $ | 469.9 | $ | 2,852.8 | $ | 1,633.0 | $ | 987.1 | |||||
| By-product credits and other revenues | (1.9 | ) | (1.6 | ) | (4.8 | ) | (4.0 | ) | (2.6 | ) | |||||
| Gold revenues | $ | 1,086.2 | $ | 468.3 | $ | 2,848.0 | $ | 1,629.0 | $ | 984.5 | |||||
| Sales (000s oz) | 259.0 | 185.4 | 817.8 | 699.0 | 503.4 | ||||||||||
| Average realized gold price per ounce1,2,3 ($/oz) | $ | 4,191 | $ | 2,525 | $ | 3,482 | $ | 2,330 | $ | 1,955 |
1. Average realized gold price per ounce sold may not be calculated based on amounts presented in this table due to rounding.
2. Average realized gold price per ounce sold is calculated based on sales from the Company's Côté Gold mine at 70% and Westwood and Essakane mines at 100%.
3. Average realized gold price per ounce sold for 2025 includes 75,000 ounces at $2,305 per ounce as delivered into the 2024 Prepay Arrangements (Q4 2024 - 37,500 ounces at $2,031 per ounce, 2024 - 137,500 ounces at $2,012 per ounce as delivered in accordance with the 2022 Prepay Arrangement), 2023 - $nil. No deliveries were required in the fourth quarter 2025 as the delivery obligations were fulfilled in H1 2025.
Underground Mining Cost per Ore Tonne Mined, Open Pit Net Mining Cost per Operating Tonne Mined, Milling Cost per Tonne Milled, and G&A Cost per Tonne Milled
Underground mining cost per ore tonne mined and open pit net mining cost per operating tonne mined are defined as:
• Mining costs (as included in production costs), that exclude capitalized waste stripping for open pit mines, less changes in stockpile balances and non-production costs as these costs are not directly related to tonnes mined, divided by
• the sum of the tonnage of ore and operating waste mined.
Milling cost per tonne milled and general and administrative cost per tonne milled are defined as:
• Mill and general and administrative costs (as included in production costs), excluding selling costs and non-production costs as these costs are not directly related to tonnes milled, divided by
• the tonnage of ore milled.
IAMGOLD believes these non-GAAP financial performance measures provide further transparency and assist analysts, investors and other stakeholders of the Company in assessing the performance of mining operations by eliminating the impact of varying production levels. Management is aware, and investors should note that these per tonne measures of performance can be affected by fluctuations in mining and/or processing levels. This inherent limitation may be partially mitigated by using this measure in conjunction with production costs and other data prepared in accordance with IFRS. These measures do not have standardized meanings under IFRS and may not be comparable to similar measures presented by other mining companies. They should not be considered in isolation or as a substitute for measures of performance prepared in accordance with IFRS.
Côté Gold (100% basis)
| ($ millions, except where noted) | Q4 2025 | Q4 2024 | 2025 | 2024 | ||||||||
| Production cost | $ | 115.1 | $ | 83.7 | $ | 410.5 | $ | 174.0 | ||||
| Adjust for: | ||||||||||||
| Increase/decrease in stockpiles | 19.1 | 12.9 | 48.9 | 61.8 | ||||||||
| Adj. operating cost | $ | 134.2 | $ | 96.6 | $ | 459.4 | $ | 235.8 | ||||
| Included in adjusted operating cost: | ||||||||||||
| Open pit net mining cost [A] | 52.3 | 35.2 | 165.8 | 107.3 | ||||||||
| Milling cost [B], net of capitalized operating cost | 60.1 | 42.8 | 217.8 | 85.7 | ||||||||
| G&A cost [C] | 21.8 | 17.8 | 75.8 | 42.0 | ||||||||
| Open pit ore tonnes mined (000s t) | 4,514 | 3,637 | 14,640 | 10,849 | ||||||||
| Open pit operating waste tonnes mined (000s t) | 6,555 | 4,765 | 24,830 | 16,666 | ||||||||
| Open pit ore and operating waste tonnes mined (000s t) [D] | 11,069 | 8,402 | 39,470 | 27,515 | ||||||||
| Ore milled (000s t) [E] | 2,874 | 2,433 | 10,889 | 4,948 | ||||||||
| Open pit net mining cost per operating tonne mined ($/tonne) [A/D] | $ | 4.72 | $ | 4.19 | $ | 4.20 | $ | 3.90 | ||||
| Milling cost per tonne milled ($/tonne) [B/E] | $ | 20.91 | $ | 17.59 | $ | 20.00 | $ | 17.32 | ||||
| G&A cost per tonne milled ($/tonne) [C/E] | $ | 7.62 | $ | 7.35 | $ | 6.97 | $ | 8.49 |
$/tonne may not re-calculate based on amounts presented in this table due to rounding.
Westwood
| ($ millions, except where noted) | Q4 2025 | Q4 2024 | 2025 | 2024 | 2023 | ||||||||||
| Production cost | $ | 45.1 | $ | 39.0 | $ | 177.3 | $ | 155.3 | $ | 148.5 | |||||
| Adjust for: | |||||||||||||||
| Increase/decrease in stockpiles | (0.6 | ) | 1.4 | 3.9 | (0.1 | ) | 3.6 | ||||||||
| Adj. operating cost | $ | 44.5 | $ | 40.4 | $ | 181.2 | $ | 155.2 | $ | 152.1 | |||||
| Consisting of: | |||||||||||||||
| Underground mining cost [A] | 27.7 | 23.0 | 109.9 | 88.9 | 78.9 | ||||||||||
| Open pit net mining cost [B] | 2.4 | 4.6 | 16.4 | 19.1 | 26.9 | ||||||||||
| Milling cost [C] | 7.6 | 7.6 | 31.5 | 26.8 | 24.4 | ||||||||||
| G&A cost [D] | 6.8 | 5.2 | 23.4 | 20.4 | 21.9 | ||||||||||
| Underground ore tonnes mined (000s t) [E] | 105 | 98 | 382 | 354 | 280 | ||||||||||
| Open pit ore tonnes mined (000s t) | 174 | 283 | 996 | 662 | 742 | ||||||||||
| Open pit waste tonnes mined (000s t) | 176 | 389 | 1,249 | 1,522 | 2,291 | ||||||||||
| Open pit ore and operating waste tonnes mined (000s t) [F] | 350 | 672 | 2,245 | 2,184 | 3,033 | ||||||||||
| Ore milled (000s t) [G] | 299 | 267 | 1,154 | 1,107 | 1,034 | ||||||||||
| Underground mining cost per ore tonne mined ($/ tonne) [A/E] | $ | 264.72 | $ | 233.72 | $ | 287.85 | $ | 250.86 | $ | 281.76 | |||||
| Open pit net mining cost per operating tonne mined ($/tonne) [B/F] | $ | 6.82 | $ | 6.88 | $ | 7.29 | $ | 8.75 | $ | 8.86 | |||||
| Milling cost per tonne milled ($/tonne) [C/G] | $ | 25.53 | $ | 28.55 | $ | 27.32 | $ | 24.25 | $ | 23.56 | |||||
| G&A cost per tonne milled ($/tonne) [D/G] | $ | 22.69 | $ | 19.70 | $ | 20.31 | $ | 18.44 | $ | 21.30 |
$/tonne may not re-calculate based on amounts presented in this table due to rounding.
Essakane
| ($ millions, except where noted) | Q4 2025 | Q4 2024 | 2025 | 2024 | 2023 | ||||||||||
| Production cost | $ | 131.1 | $ | 121.9 | $ | 544.7 | $ | 458.3 | $ | 458.6 | |||||
| Adjust for: | |||||||||||||||
| Increase/decrease in stockpiles | 20.2 | 0.4 | 34.2 | 0.2 | 3.7 | ||||||||||
| Adj. operating cost | $ | 151.3 | $ | 122.3 | $ | 578.9 | $ | 458.5 | $ | 462.3 | |||||
| Consisting of: | |||||||||||||||
| Open pit net mining cost [A] | 58.4 | 33.3 | 216.1 | 122.9 | 146.2 | ||||||||||
| Milling cost [B] | 58.2 | 60.1 | 243.0 | 232.9 | 213.7 | ||||||||||
| G&A cost [C] | 34.7 | 28.9 | 119.8 | 102.7 | 102.4 | ||||||||||
| Open pit ore tonnes mined (000s t) | 4,123 | 2,170 | 11,910 | 9,714 | 9,586 | ||||||||||
| Open pit operating waste tonnes mined (000s t) | 4,649 | 4,036 | 22,087 | 13,315 | 19,530 | ||||||||||
| Open pit ore and operating waste tonnes mined (000s t) [D] | 8,772 | 6,206 | 33,997 | 23,029 | 29,116 | ||||||||||
| Ore milled (000s t) [E] | 3,241 | 2,948 | 12,560 | 12,087 | 11,283 | ||||||||||
| Open pit net mining cost per operating tonne mined ($/tonne) [A/D] | $ | 6.66 | $ | 5.37 | $ | 6.36 | $ | 5.34 | $ | 5.02 | |||||
| Milling cost per tonne milled ($/tonne) [B/E] | $ | 17.95 | $ | 20.35 | $ | 19.35 | $ | 19.26 | $ | 18.94 | |||||
| G&A cost per tonne milled ($/tonne) [C/E] | $ | 10.67 | $ | 9.83 | $ | 9.52 | $ | 8.50 | $ | 9.07 |
$/tonne may not re-calculate based on amounts presented in this table due to rounding.
Cash Costs Excluding Royalties, Cash Costs, Cash Costs per Ounce Sold, AISC and AISC per Ounce Sold
The Company reports cash costs excluding royalties, cash costs excluding royalties per ounce sold, cash costs, cash costs per ounce sold, AISC and AISC per ounce sold in order to provide investors with information about key measures used by management to monitor performance of mine sites in commercial production and its ability to generate positive cash flow.
Cash costs include mine-site operating costs such as mining, processing, administration, royalties, production taxes and realized derivative gains or losses, exclusive of depreciation, reclamation, capital expenditures and exploration and evaluation costs. AISC include cost of sales exclusive of depreciation expense, sustaining capital expenditures, which are required to maintain existing operations, capitalized exploration, sustaining lease principal payments, environmental rehabilitation accretion and amortization, by-product credits and corporate general and administrative costs. These costs are then divided by the Company's attributable gold ounces sold by mine sites in commercial production in the period to arrive at the cash costs excluding royalties per ounce sold, cash costs per ounce sold, and the AISC per ounce sold.
The following tables provide a reconciliation of cash costs excluding royalties, cash costs, AISC, cost of sales excluding depreciation per ounce sold, cash costs excluding royalties per ounce sold, cash costs per ounce sold and AISC per ounce sold on an attributable basis to cost of sales as per the consolidated financial statements.
Three months ended December 31, 2025
| ($ millions, except where noted) | Côté Gold | Westwood | Essakane | Corporate | Total | ||||||||||
| Cost of sales1 | 166.3 | 66.8 | 261.1 | 0.3 | 494.5 | ||||||||||
| Depreciation expense1 | (54.6 | ) | (18.3 | ) | (63.1 | ) | (0.3 | ) | (136.3 | ) | |||||
| Cost of sales, excluding depreciation expense | $ | 111.7 | $ | 48.5 | $ | 198.0 | $ | - | $ | 358.2 | |||||
| Royalties2 | 27.8 | - | 61.7 | - | 89.5 | ||||||||||
| Cost of sales, excluding depreciation expense and | $ | 83.9 | $ | 48.5 | $ | 136.3 | $ | - | $ | 268.7 | |||||
| royalties | |||||||||||||||
| Adjust for: | |||||||||||||||
| By-product credit | (0.6 | ) | (0.7 | ) | (0.6 | ) | - | (1.9 | ) | ||||||
| Cost attributed to non-controlling interests3 | - | - | (29.6 | ) | - | (29.6 | ) | ||||||||
| Cash costs - attributable | $ | 111.1 | $ | 47.8 | $ | 167.8 | $ | - | $ | 326.7 | |||||
| Adjust for: | |||||||||||||||
| Sustaining capital expenditures4 | 36.4 | 15.5 | 25.9 | - | 77.8 | ||||||||||
| Corporate general and administrative costs5 | - | - | - | 14.9 | 14.9 | ||||||||||
| Other costs6 | 0.8 | 0.6 | 1.4 | 0.2 | 3.0 | ||||||||||
| Cost attributable to non-controlling interests3 | - | - | (4.1 | ) | - | (4.1 | ) | ||||||||
| AISC - attributable | $ | 148.3 | $ | 63.9 | $ | 191.0 | $ | 15.1 | $ | 418.3 | |||||
| Total gold sales (000 oz) - attributable | 87.7 | 37.1 | 114.1 | - | 238.9 | ||||||||||
| Cost of sales excluding depreciation7($/oz sold) - attributable | $ | 1,271 | $ | 1,307 | $ | 1,475 | $ | - | $ | 1,374 | |||||
| Cash costs - excluding royalties7 ($/oz sold) - attributable | $ | 949 | $ | 1,288 | $ | 1,011 | $ | - | $ | 1,031 | |||||
| Cash costs7 ($/oz sold) - attributable | $ | 1,265 | $ | 1,288 | $ | 1,471 | $ | - | $ | 1,367 | |||||
| AISC7 all operations ($/oz sold) - attributable | $ | 1,688 | $ | 1,719 | $ | 1,674 | $ | 64 | $ | 1,750 |
1. As per note 35 of the consolidated financial statements for cost of sales and depreciation expense.
2. Includes contributions made by the Essakane mine to the development fund for local communities equating to 1% of total revenues.
3. Adjustments for the consolidation of Essakane (85%) to its attributable portion of cost of sales.
4. Sustaining capital expenditures are expenditures required to support current production levels at a mine site. Sustaining capital expenditures are further described below.
5. Corporate general and administrative costs exclude one-time material severance charges.
6. Other costs include sustaining lease principal payments and environmental rehabilitation accretion and amortization, partially offset by by-product credits.
7. Cost of sales excluding depreciation per ounce sold, cash costs per ounce sold, and AISC per ounce sold may not be calculated based on amounts presented in this table due to rounding.
Three months ended December 31, 2024
| ($ millions, except where noted) | Côté Gold | Westwood | Essakane | Corporate | Total | ||||||||||
| Cost of sales1 | $ | 101.6 | $ | 64.6 | $ | 172.2 | $ | 0.6 | $ | 339.0 | |||||
| Depreciation expense1 | (41.0 | ) | (22.3 | ) | (32.5 | ) | (0.6 | ) | (96.4 | ) | |||||
| Cost of sales, excluding depreciation expense | $ | 60.6 | $ | 42.3 | $ | 139.7 | $ | - | $ | 242.6 | |||||
| Royalties2 | 15.3 | - | 19.5 | - | 34.8 | ||||||||||
| Cost of sales, excluding depreciation expense and | $ | 45.3 | $ | 42.3 | $ | 120.2 | $ | - | $ | 207.8 | |||||
| royalties | |||||||||||||||
| Adjust for: | |||||||||||||||
| By-product credit | (0.2 | ) | (0.2 | ) | (0.2 | ) | - | (0.6 | ) | ||||||
| Cost attributed to non-controlling interests3 | - | - | (14.0 | ) | - | (14.0 | ) | ||||||||
| Cash costs - attributable | $ | 60.4 | $ | 42.1 | $ | 125.5 | $ | - | $ | 228.0 | |||||
| Adjust for: | |||||||||||||||
| Sustaining capital expenditures4 | 32.4 | 18.8 | 54.2 | 0.3 | 105.7 | ||||||||||
| Corporate general and administrative costs5 | - | - | - | 9.7 | 9.7 | ||||||||||
| Other costs6 | 1.3 | 1.1 | 3.1 | 0.1 | 5.6 | ||||||||||
| Cost attributable to non-controlling interests3 | - | - | (5.7 | ) | - | (5.7 | ) | ||||||||
| AISC - attributable | $ | 94.1 | $ | 62.0 | $ | 177.1 | $ | 10.1 | $ | 343.3 | |||||
| Total gold sales (000 oz) - attributable | 55.8 | 36.7 | 84.0 | - | 176.5 | ||||||||||
| Cost of sales excluding depreciation7 ($/oz sold) - attributable | $ | 1,083 | $ | 1,155 | $ | 1,504 | $ | - | $ | 1,298 | |||||
| Cash costs7 - excluding royalties ($/oz sold) - attributable | $ | 902 | $ | 1,148 | $ | 1,291 | $ | - | $ | 1,138 | |||||
| Cash costs7 ($/oz sold) - attributable | $ | 1,080 | $ | 1,148 | $ | 1,501 | $ | - | $ | 1,294 | |||||
| AISC7 all operations ($/oz sold) - attributable | $ | 1,685 | $ | 1,688 | $ | 2,118 | $ | 57 | $ | 1,949 |
1. As per note 35 of the consolidated financial statements for cost of sales and depreciation expense.
2. Includes contributions made by the Essakane mine to the development fund for local communities equating to 1% of total revenues.
3. Adjustments for the consolidation of Essakane (90%) to its attributable portion of cost of sales.
4. Sustaining capital expenditures are expenditures required to support current production levels at a mine site. Sustaining capital expenditures are further described below.
5. Corporate general and administrative costs exclude depreciation expense and one-time material severance charges.
6. Other costs include sustaining lease principal payments and environmental rehabilitation accretion and amortization, partially offset by by-product credits.
7. Cost of sales excluding depreciation per ounce sold, cash costs per ounce sold, and AISC per ounce sold may not be calculated based on amounts presented in this table due to rounding.
Twelve months ended December 31, 2025
| ($ millions, except where noted) | Côté Gold | Westwood | Essakane | Corporate | Total | ||||||||||
| Cost of sales1 | $ | 538.6 | $ | 230.6 | $ | 875.5 | $ | 1.9 | $ | 1,646.6 | |||||
| Depreciation expense1 | (177.8 | ) | (54.9 | ) | (186.3 | ) | (1.9 | ) | (420.9 | ) | |||||
| Cost of sales, excluding depreciation expense | $ | 360.8 | $ | 175.7 | $ | 689.2 | $ | - | $ | 1,225.7 | |||||
| Royalties2 | 70.5 | - | 142.3 | - | 212.8 | ||||||||||
| Cost of sales, excluding depreciation expense and | 290.3 | 175.7 | 546.9 | - | 1,012.9 | ||||||||||
| royalties | |||||||||||||||
| Adjust for: | |||||||||||||||
| By-product credit | (1.2 | ) | (1.9 | ) | (1.5 | ) | - | (4.6 | ) | ||||||
| Cost attributed to non-controlling interests3 | - | - | (87.8 | ) | - | (87.8 | ) | ||||||||
| Cash costs - attributable | $ | 359.6 | $ | 173.8 | $ | 599.9 | $ | - | $ | 1,133.3 | |||||
| Adjust for: | |||||||||||||||
| Sustaining capital expenditures4 | 102.0 | 64.1 | 99.2 | - | 265.3 | ||||||||||
| Corporate general and administrative costs5 | - | - | - | 58.4 | 58.4 | ||||||||||
| Other costs6 | 2.5 | 2.6 | 5.8 | (3.5 | ) | 7.4 | |||||||||
| Cost attributable to non-controlling interests3 | - | - | (12.8 | ) | - | (12.8 | ) | ||||||||
| AISC - attributable | $ | 464.1 | $ | 240.5 | $ | 692.1 | $ | 54.9 | $ | 1,451.6 | |||||
| Total gold sales (000 oz) - attributable | 283.6 | 113.6 | 366.5 | - | 763.7 | ||||||||||
| Cost of sales excluding depreciation7 ($/oz sold) - attributable | $ | 1,272 | $ | 1,547 | $ | 1,640 | $ | - | $ | 1,489 | |||||
| Cash costs7 - excluding royalties ($/oz sold) - attributable | $ | 1,020 | $ | 1,530 | $ | 1,300 | $ | - | $ | 1,230 | |||||
| Cash costs7 ($/oz sold) - attributable | $ | 1,268 | $ | 1,530 | $ | 1,636 | $ | - | $ | 1,484 | |||||
| AISC7 all operations ($/oz sold) - attributable | $ | 1,636 | $ | 2,117 | $ | 1,888 | $ | 72 | $ | 1,900 |
1. As per note 35 of the consolidated financial statements for cost of sales and depreciation expense.
2. Includes contributions made by the Essakane mine to the development fund for local communities equating to 1% of total revenues.
3. Adjustments for the consolidation of Essakane to its attributable portion of cost of sales. The attributable portion was calculated based on IAMGOLD's 85% ownership following the June 20, 2025, decrease in IAMGOLD's ownership interest from 90%; accordingly, the attributable portion preceding the ownership change was calculated based on IAMGOLD's 90% interest.
4. Sustaining capital expenditures are expenditures required to support current production levels at a mine site. Sustaining capital expenditures are further described below.
5. Corporate general and administrative costs exclude depreciation expense and one-time material severance charges.
6. Other costs include sustaining lease principal payments and environmental rehabilitation accretion and amortization, partially offset by by-product credits.
7. Cost of sales excluding depreciation per ounce sold, cash costs per ounce sold, and AISC per ounce sold may not be calculated based on amounts presented in this table due to rounding.
Twelve months ended December 31, 2024
| ($ millions, except where noted) | Côté Gold | Westwood | Essakane | Corporate | Total | ||||||||||
| Cost of sales1 | $ | 171.7 | $ | 211.2 | $ | 699.1 | $ | 1.1 | $ | 1,083.1 | |||||
| Depreciation expense1 | (56.7 | ) | (53.7 | ) | (162.3 | ) | (1.1 | ) | (273.8 | ) | |||||
| Cost of sales, excluding depreciation expense | $ | 115.0 | $ | 157.5 | $ | 536.8 | $ | - | $ | 809.3 | |||||
| Royalties2 | 27.6 | 0.3 | 85.3 | 113.2 | |||||||||||
| Cost of sales, excluding depreciation expense and | $ | 87.4 | $ | 157.2 | $ | 451.5 | $ | - | $ | 696.1 | |||||
| royalties | |||||||||||||||
| Adjust for: | |||||||||||||||
| By-product credit | (0.3 | ) | (1.3 | ) | (1.2 | ) | - | (2.8 | ) | ||||||
| Cost attributed to non-controlling interests3 | - | - | (53.6 | ) | - | (53.6 | ) | ||||||||
| Cash costs - attributable | $ | 114.7 | $ | 156.2 | $ | 482.0 | $ | - | $ | 752.9 | |||||
| Adjust for: | |||||||||||||||
| Exclusion of pre-production costs - Côté Gold | (22.5 | ) | - | - | - | (22.5 | ) | ||||||||
| Sustaining capital expenditures4 | 46.2 | 66.7 | 189.1 | 1.2 | 303.2 | ||||||||||
| Corporate general and administrative costs5 | - | - | - | 42.4 | 42.4 | ||||||||||
| Other costs5 | 1.5 | 5.0 | 13.0 | 0.4 | 19.9 | ||||||||||
| Cost attributable to non-controlling interests3 | - | - | (20.2 | ) | - | (20.2 | ) | ||||||||
| AISC - attributable | $ | 139.9 | $ | 227.9 | $ | 663.9 | $ | 44.0 | $ | 1,075.7 | |||||
| Total gold sales (000 oz) - attributable | 111.1 | 133.9 | 408.7 | - | 653.7 | ||||||||||
| Cost of sales excluding depreciation7 ($/oz sold) - attributable | $ | 1,035 | $ | 1,177 | $ | 1,182 | $ | - | $ | 1,156 | |||||
| Cash costs7 - excluding royalties ($/oz sold) - attributable | $ | 875 | $ | 1,164 | $ | 991 | $ | - | $ | 1,007 | |||||
| Cash costs7 ($/oz sold) - attributable | $ | 1,032 | $ | 1,167 | $ | 1,179 | $ | - | $ | 1,152 | |||||
| AISC7 all operations ($/oz sold) - attributable | $ | 1,658 | $ | 1,702 | $ | 1,625 | $ | 67 | $ | 1,716 |
1. As per note 35 of the consolidated financial statements for cost of sales and depreciation expense.
2. Includes contributions made by the Essakane mine to the development fund for local communities equating to 1% of total revenues.
3. Adjustments for the consolidation of Essakane (90%) to its attributable portion of cost of sales.
4. Sustaining capital expenditures are expenditures required to support current production levels at a mine site. Sustaining capital expenditures are further described below.
5. Corporate general and administrative costs exclude depreciation expense and one-time material severance charges.
6. Other costs include sustaining lease principal payments and environmental rehabilitation accretion and amortization, partially offset by by-product credits.
7. Cost of sales excluding depreciation per ounce sold, cash costs per ounce sold, and AISC per ounce sold may not be calculated based on amounts presented in this table due to rounding.
Twelve months ended December 31, 2023
| ($ millions, except where noted) | Westwood | Essakane | Corporate | Total | ||||||||
| Cost of sales1 | $ | 175.9 | $ | 686.0 | $ | 1.1 | $ | 863.0 | ||||
| Depreciation expense1 | (31.3 | ) | (183.6 | ) | (1.1 | ) | (216.0 | ) | ||||
| Cost of sales, excluding depreciation expense | $ | 144.6 | $ | 502.4 | $ | - | $ | 647.0 | ||||
| Royalties2 | 0.2 | 52.7 | - | 52.9 | ||||||||
| Cost of sales, excluding depreciation expense and royalties | $ | 144.4 | $ | 449.7 | $ | - | $ | 594.1 | ||||
| Adjust for: | ||||||||||||
| Abnormal portion of operating costs at Essakane | - | (13.5 | ) | - | (13.5 | ) | ||||||
| Other mining costs | (0.9 | ) | (0.9 | ) | - | (1.8 | ) | |||||
| Cost attributed to non-controlling interests3 | - | (48.8 | ) | - | (48.8 | ) | ||||||
| Cash costs - attributable | $ | 143.7 | $ | 439.2 | $ | - | $ | 582.9 | ||||
| Adjust for: | ||||||||||||
| Sustaining capital expenditures4 | 64.7 | 130.8 | 0.5 | 196.0 | ||||||||
| Corporate general and administrative costs5 | - | - | 45.7 | 45.7 | ||||||||
| Other costs6 | 3.3 | 9.8 | 0.5 | 13.6 | ||||||||
| Cost attributable to non-controlling interests3 | - | (14.1 | ) | - | (14.1 | ) | ||||||
| AISC - attributable | $ | 211.7 | $ | 565.7 | $ | 46.7 | $ | 824.1 | ||||
| Total gold sales (000 oz) - attributable | 90.2 | 371.9 | - | 462.1 | ||||||||
| Cost of sales excluding depreciation7 ($/oz sold) - attributable | $ | 1,600 | $ | 1,216 | $ | - | $ | 1,291 | ||||
| Cash costs7 - excluding royalties ($/oz sold) - attributable | $ | 1,588 | $ | 1,053 | $ | - | $ | 1,158 | ||||
| Cash costs7 ($/oz sold) - attributable | $ | 1,591 | $ | 1,181 | $ | - | $ | 1,261 | ||||
| AISC7 all operations ($/oz sold) - attributable | $ | 2,344 | $ | 1,521 | $ | 101 | $ | 1,783 | ||||
1. As per note 35 of the consolidated financial statements for cost of sales and depreciation expense.
2. Includes contributions made by the Essakane mine to the development fund for local communities equating to 1% of total revenues.
3. Adjustments for the consolidation of Essakane (90%) to its attributable portion of cost of sales.
4. Sustaining capital expenditures are expenditures required to support current production levels at a mine site. Sustaining capital expenditures are further described below.
5. Corporate general and administrative costs exclude depreciation expense and one-time material severance charges.
6. Other costs include sustaining lease principal payments and environmental rehabilitation accretion and amortization, partially offset by by-product credits.
7. Cost of sales excluding depreciation per ounce sold, cash costs per ounce sold, and AISC per ounce sold may not be calculated based on amounts presented in this table due to rounding.
Sustaining and Expansion Capital Expenditures
Sustaining capital expenditures are expenditures required to support current production levels at a mine site and exclude all expenditures at the Company's development projects as well as certain expenditures at the Company's operating sites that are deemed expansionary in nature which result in a material increase in annual or life of mine gold ounce production, net present value, or reserves. The distinctions between sustaining and expansion capital used by the Company align with the guidelines set out by the World Gold Council. Expansion capital is capital expenditures incurred at new projects and capital expenditures related to major projects or expansion at existing operations where these projects will materially benefit the operations. This non- GAAP financial measure provides investors with transparency regarding the capital expenditures required to support the ongoing operations at its mines, relative to its total capital expenditures.
Reconciliation of incurred capital expenditure per the segmented note in the financial statements to incurred sustaining and expansion capital for the three months ended December 31, 2025, and December 31, 2024:
| ($ millions, except where noted) | Sustaining | Expansion | Q4 2025 | Sustaining | Expansion | Q4 2024 | ||||||||||||
| Capital expenditures for property, plant and equipment | $ | 74.7 | $ | 8.0 | $ | 82.7 | $ | 96.2 | $ | 7.7 | $ | 103.9 | ||||||
| Less: Côté Gold (9.7% share up to repurchase date) | - | - | - | (2.6 | ) | (0.3 | ) | (2.9 | ) | |||||||||
| Subtotal | $ | 74.7 | $ | 8.0 | $ | 82.7 | $ | 93.6 | $ | 7.4 | $ | 101.0 | ||||||
| Côté Gold (IMG basis) | 30.7 | 5.7 | 36.4 | 25.6 | 5.4 | 31.0 | ||||||||||||
| Westwood | 15.1 | 1.5 | 16.6 | 18.5 | (0.1 | ) | 18.4 | |||||||||||
| Essakane | 28.9 | 0.8 | 29.7 | 49.0 | 2.1 | 51.1 | ||||||||||||
| Corporate | - | - | - | 0.5 | - | 0.5 |
Reconciliation of capital expenditure and exploration and evaluation expenditures per cash flow statement in the financial statements to cash payments for sustaining and expansion capital for the three months ended December 31, 2025, and December 31, 2024:
| ($ millions, except where noted) | Sustaining | Expansion | Q4 2025 | Sustaining | Expansion | Q4 2024 | ||||||||||||
| Capital expenditures for property, plant and equipment | $ | 74.7 | $ | 8.0 | $ | 82.7 | $ | 96.2 | $ | 7.7 | $ | 103.9 | ||||||
| Working capital adjustments | 4.6 | 1.2 | 5.8 | 13.7 | 2.8 | 16.5 | ||||||||||||
| Capital expenditures per statement of cash flows | 79.3 | 9.2 | 88.5 | 109.9 | 10.5 | 120.4 | ||||||||||||
| Less: Côté Gold (9.7% share up torepurchase date) | - | - | - | (3.3 | ) | (0.7 | ) | (4.0 | ) | |||||||||
| Subtotal | $ | 79.3 | $ | 9.2 | $ | 88.5 | $ | 106.6 | $ | 9.8 | $ | 116.4 | ||||||
| Côté Gold (IMG basis) | 36.4 | 8.4 | 44.8 | 33.3 | 7.8 | 41.1 | ||||||||||||
| Westwood | 16.9 | - | 16.9 | 18.8 | (0.1 | ) | 18.7 | |||||||||||
| Essakane | 26.0 | 0.8 | 26.8 | 54.2 | 2.1 | 56.3 | ||||||||||||
| Corporate | - | - | - | 0.3 | - | 0.3 |
Reconciliation of incurred capital expenditure per the segmented note in the financial statements to incurred sustaining and expansion capital for the twelve months ended December 31, 2025, and December 31, 2024:
| ($ millions, except where noted) | Sustaining | Expansion | 2025 | Sustaining | Expansion | 2024 | ||||||||||||
| Capital expenditures for property, plant and equipment | $ | 274.7 | $ | 32.6 | $ | 307.3 | $ | 296.2 | $ | 225.8 | $ | 522.0 | ||||||
| Less: Côté Gold (9.7% share up to repurchase date) | - | - | - | (5.4 | ) | (29.7 | ) | (35.1 | ) | |||||||||
| Subtotal | $ | 274.7 | $ | 32.6 | $ | 307.3 | $ | 290.8 | $ | 196.1 | $ | 486.9 | ||||||
| Côté Gold (IMG basis) | 103.8 | 23.7 | 127.5 | 42.7 | 191.0 | 233.7 | ||||||||||||
| Westwood | 63.9 | 1.5 | 65.4 | 66.1 | - | 66.1 | ||||||||||||
| Essakane | 106.9 | 7.4 | 114.3 | 180.4 | 5.1 | 185.5 | ||||||||||||
| Corporate | 0.1 | - | 0.1 | 1.6 | - | 1.6 |
Reconciliation of capital expenditure and exploration and evaluation expenditures per cash flow statement in the financial statements to cash payments for sustaining and expansion capital for the twelve months ended December 31, 2025, and December 31, 2024:
| ($ millions, except where noted) | Sustaining | Expansion | 2025 | Sustaining | Expansion | 2024 | ||||||||||||
| Capital expenditures for property, plant and equipment | $ | 274.7 | $ | 32.6 | $ | 307.3 | $ | 296.2 | $ | 225.8 | $ | 522.0 | ||||||
| Working capital adjustments | (7.8 | ) | (4.5 | ) | (12.3 | ) | 13.3 | 23.3 | 36.6 | |||||||||
| Capital expenditures per statement of cash flows | 266.9 | 28.1 | 295.0 | 309.5 | 249.1 | 558.6 | ||||||||||||
| Less: Côté Gold (9.7% share up to repurchase date) | - | - | - | (5.5 | ) | (32.7 | ) | (38.2 | ) | |||||||||
| Subtotal | $ | 266.9 | $ | 28.1 | $ | 295.0 | $ | 304.0 | $ | 216.4 | $ | 520.4 | ||||||
| Côté Gold (IMG basis) | 102.0 | 20.7 | 122.7 | 47.0 | 211.5 | 258.5 | ||||||||||||
| Westwood | 65.5 | - | 65.5 | 66.7 | - | 66.7 | ||||||||||||
| Essakane | 99.2 | 7.4 | 106.6 | 189.1 | 4.9 | 194.0 | ||||||||||||
| Corporate | 0.2 | - | 0.2 | 1.2 | - | 1.2 |
Reconciliation of incurred capital expenditure per the segmented note in the financial statements to incurred sustaining and expansion capital for the twelve months ended December 31, 2023:
| ($ millions, except where noted) | Sustaining | Expansion | 2023 | |||
| Capital expenditures for property, plant and equipment | $ | 200.3 | $ | 733.9 | $ | 934.2 |
| Less: Côté Gold (transferred share)1 | - | (77.1) | (77.1) | |||
| Subtotal | $ | 200.3 | $ | 656.8 | $ | 857.1 |
| Côté Gold (IMG basis) | - | 654.5 | 654.5 | |||
| Westwood | 65.0 | 0.6 | 65.6 | |||
| Essakane | 134.9 | 1.7 | 136.6 | |||
| Corporate | 0.4 | - | 0.4 |
1. Comparative values reflect the capital amount corresponding with the proportionate transferred interest during 2023.
Reconciliation of capital expenditure per cash flow statement in the financial statements to cash payments for sustaining and expansion capital for the twelve months ended December 31, 2023:
| ($ millions, except where noted) | Sustaining | Expansion | 2023 | |||
| Capital expenditures for property, plant and equipment | $ | 200.3 | $ | 733.9 | $ | 934.2 |
| Working capital adjustments | (4.3) | (22.6) | (26.9) | |||
| Capital expenditures per statement of cash flows | 196.0 | 711.3 | 907.3 | |||
| Less: Côté Gold (transferred share)1 | - | (77.1) | (77.1) | |||
| Subtotal | $ | 196.0 | $ | 634.2 | $ | 830.2 |
| Côté Gold (IMG basis) | - | 631.6 | 631.6 | |||
| Westwood | 64.7 | 0.6 | 65.3 | |||
| Essakane | 130.8 | 2.0 | 132.8 | |||
| Corporate | 0.5 | - | 0.5 |
1. Comparative values reflect the capital amount corresponding with the proportionate transferred interest during 2023.
EBITDA and Adjusted EBITDA
EBITDA (earnings before income taxes, depreciation and amortization, and finance costs) is an indicator of the Company's ability to produce operating cash flow to fund working capital needs, service debt obligations and fund capital expenditures.
Adjusted EBITDA represents EBITDA excluding certain impacts such as changes in estimates of asset retirement obligations at closed sites, unrealized (gain) loss on non-hedge derivatives, impairment charges and reversal of impairment charges, write- down of assets and foreign exchange (gain) loss which are non-cash items and certain cash items that are non-recurring or temporary in nature as such items are not indicative of recurring operating performance. Management believes this additional information is useful to investors in understanding the Company's ability to generate operating cash flow by excluding from the calculation these non-cash amounts and cash amounts that are not indicative of the recurring performance of the underlying operations for the periods presented.
The following table provides a reconciliation of EBITDA and Adjusted EBITDA to the consolidated financial statements:
| ($ millions, except where noted) | Q4 2025 | Q4 2024 | 2025 | 2024 | 2023 | ||||||||||||
| Earnings (loss) before income taxes | $ | 519.7 | $ | 125.4 | $ | 969.8 | $ | 977.2 | $ | 128.2 | |||||||
| Add: | |||||||||||||||||
| Depreciation | 136.3 | 96.7 | 420.9 | 275.0 | 217.4 | ||||||||||||
| Finance costs | 29.5 | 37.4 | 112.2 | 70.8 | 21.0 | ||||||||||||
| EBITDA | $ | 685.5 | $ | 259.5 | $ | 1,502.9 | $ | 1,323.0 | $ | 366.6 | |||||||
| Adjusting items: | |||||||||||||||||
| Unrealized (gain)/loss on non-hedge derivatives | 19.1 | (3.0 | ) | 26.7 | (23.3 | ) | (8.7 | ) | |||||||||
| NRV write-down/(reversal) of stockpiles/ finished goods | - | - | - | - | 3.2 | ||||||||||||
| Abnormal portion of operating costs at Essakane | - | - | - | - | 13.5 | ||||||||||||
| Write-down of Jubilee property | - | - | - | - | 1.3 | ||||||||||||
| Impairment charge (reversal) | - | - | 12.2 | (455.5 | ) | - | |||||||||||
| Foreign exchange (gain)/loss | 1.7 | 4.1 | 0.6 | 1.0 | 12.8 | ||||||||||||
| Gain on sale of Bambouk Assets | - | (34.1 | ) | - | (34.1 | ) | (109.1 | ) | |||||||||
| Insurance recoveries | - | - | - | (27.3 | ) | (0.6 | ) | ||||||||||
| Write-down of assets | - | 1.2 | 2.6 | 1.4 | 1.3 | ||||||||||||
| Changes in estimates of asset retirement obligations at closed sites | 4.0 | (13.0 | ) | 8.0 | (13.4 | ) | 9.7 | ||||||||||
| Fair value of deferred consideration from sale of Sadiola | (0.5 | ) | (0.4 | ) | (2.0 | ) | (1.8 | ) | 4.3 | ||||||||
| Gain on sale of Pitangui and Acurui Projects | - | - | - | - | (15.5 | ) | |||||||||||
| Gain on sale of royalties | - | - | (4.9 | ) | - | - | |||||||||||
| Forfeiture of carbon fines inventory | - | - | - | - | 13.5 | ||||||||||||
| Settlement of carbon fines matter | - | - | - | - | 15.0 | ||||||||||||
| Severance costs | - | 5.4 | 4.0 | 5.6 | 2.4 | ||||||||||||
| Other | 0.3 | (4.3 | ) | 0.4 | 5.0 | 5.4 | |||||||||||
| Adjusted EBITDA | $ | 710.1 | $ | 215.4 | $ | 1,550.5 | $ | 780.6 | $ | 315.1 | |||||||
| Including discontinued operations: | |||||||||||||||||
| EBITDA - discontinued operations | $ | - | $ | - | $ | - | $ | - | $ | 14.4 | |||||||
| Adjusted items: | |||||||||||||||||
| Loss on sale of Rosebel | - | - | - | - | 7.4 | ||||||||||||
| Severance costs | - | - | - | - | 1.5 | ||||||||||||
| Write-down of assets | - | - | - | - | 0.1 | ||||||||||||
| Adjusted EBITDA from discontinued operations | $ | - | $ | - | $ | - | $ | - | $ | 23.4 | |||||||
| EBITDA | $ | 685.5 | $ | 259.5 | $ | 1,502.9 | $ | 1,323.0 | $ | 381.0 | |||||||
| Adjusted EBITDA | $ | 710.1 | $ | 215.4 | $ | 1,550.5 | $ | 780.6 | $ | 338.5 | |||||||
Adjusted Net Earnings (Loss) Attributable to Equity Holders
Adjusted net earnings (loss) attributable to equity holders represents net earnings (loss) attributable to equity holders excluding certain impacts, net of taxes, such as changes in estimates of asset retirement obligations at closed sites, unrealized (gain) loss on non-hedge derivatives and warrants, impairment charges and reversal of impairment charges, write-down of assets and foreign exchange (gain) loss which are non-cash items and certain cash items that are non-recurring or temporary in nature as such items are not indicative of recurring operating performance. This measure is not necessarily indicative of net earnings (loss) or cash flows as determined under IFRS. Management believes this measure better reflects the Company's performance for the current period and is a better indication of its expected performance in future periods. As such, the Company believes that this measure is useful to investors in assessing the Company's underlying performance.
The following table provides a reconciliation of earnings (loss) before income taxes and non-controlling interests as per the consolidated statements of earnings (loss) to adjusted net earnings (loss) attributable to equity holders of the Company.
| ($ millions, except where noted) | Q4 2025 | Q4 2024 | 2025 | 2024 | 2023 | ||||||||||
| Earnings (loss) before income taxes and non-controlling interests | $ | 519.7 | $ | 125.4 | $ | 969.8 | $ | 977.2 | $ | 128.2 | |||||
| Adjusting items: | |||||||||||||||
| Unrealized gain/(loss) on non-hedge derivatives | 19.1 | (3.0 | ) | 26.7 | (23.3 | ) | (8.7 | ) | |||||||
| NRV write-down/(reversal) of stockpiles/ finished goods | - | - | - | - | 3.4 | ||||||||||
| Abnormal portion of operating costs at Essakane | - | - | - | - | 14.5 | ||||||||||
| Write-down of Jubilee property | - | - | - | - | 1.3 | ||||||||||
| Gain on sale of Pitangui and Acurui Projects | - | - | - | - | (15.5 | ) | |||||||||
| Other finance costs | (2.9 | ) | 0.6 | 5.4 | 4.2 | 7.9 | |||||||||
| Impairment charge (reversal) | - | - | 12.2 | (455.5 | ) | - | |||||||||
| Foreign exchange (gain)/loss | 1.7 | 4.1 | 0.6 | 1.0 | 12.8 | ||||||||||
| Gain on sale of Bambouk Assets | - | (34.1 | ) | - | (34.1 | ) | (109.1 | ) | |||||||
| Insurance recoveries | - | - | - | (27.3 | ) | (0.6 | ) | ||||||||
| Write-down of assets | - | 1.2 | 2.6 | 1.4 | 1.3 | ||||||||||
| Changes in estimates of asset retirement obligations at closed sites | 4.0 | (13.0 | ) | 8.0 | (13.4 | ) | 9.7 | ||||||||
| Fair value of deferred consideration from sale of Sadiola | (0.5 | ) | (0.4 | ) | (2.0 | ) | (1.8 | ) | 4.3 | ||||||
| Gain on sale of royalties | - | - | (4.9 | ) | - | - | |||||||||
| Prepayment premium on second lien term loan | 12.0 | - | 16.0 | - | - | ||||||||||
| Forfeiture of carbon fines inventory | - | - | - | - | 13.5 | ||||||||||
| Settlement of carbon fines matter | - | - | - | - | 15.0 | ||||||||||
| Severance costs | - | 5.4 | 4.0 | 5.6 | 2.4 | ||||||||||
| Other | 0.3 | (4.3 | ) | 0.4 | 5.0 | 5.4 | |||||||||
| Adjusted earnings before income taxes and non-controlling interests | $ | 553.4 | $ | 81.9 | $ | 1,038.8 | $ | 439.0 | $ | 85.8 | |||||
| Income taxes | (75.0 | ) | (34.3 | ) | (237.5 | ) | (129.4 | ) | (30.7 | ) | |||||
| Tax on foreign exchange translation of deferred income tax balances | (35.3 | ) | 9.9 | (21.8 | ) | 10.8 | (2.2 | ) | |||||||
| Tax impact of adjusting items | 0.8 | 4.6 | (2.4 | ) | 3.8 | 0.6 | |||||||||
| Non-controlling interests | (38.1 | ) | (4.9 | ) | (67.9 | ) | (28.2 | ) | (8.8 | ) | |||||
| Adjusted net earnings (loss) attributable to equity holders | $ | 405.8 | $ | 57.2 | $ | 709.2 | $ | 296.0 | $ | 44.7 | |||||
| Adjusted net earnings (loss) per share attributable to equity holders | $ | 0.70 | $ | 0.10 | $ | 1.23 | $ | 0.55 | $ | 0.09 | |||||
| Including discontinued operations: | |||||||||||||||
| Net earnings (loss) before income tax and non- controlling interest - discontinued operations | $ | - | $ | - | $ | - | $ | - | $ | 14.3 | |||||
| Adjusted items: | |||||||||||||||
| Loss on sale of Rosebel | - | - | - | - | 7.4 |
| Severance costs | - | - | - | - | 1.5 | ||||||||||
| Write-down of assets | - | - | - | - | 0.1 | ||||||||||
| Adjusted earnings before income taxes and non- controlling interests - discontinued operations | $ | - | $ | - | $ | - | $ | - | $ | 23.3 | |||||
| Income taxes | - | - | - | - | (8.0 | ) | |||||||||
| Non-controlling interests | - | - | - | - | (0.7 | ) | |||||||||
| Adjusted net earnings attributable to equity holders - discontinued operations | $ | - | $ | - | $ | - | $ | - | $ | 14.6 | |||||
| Adjusted net earnings per share attributable to equity holders - discontinued operations | $ | - | $ | - | $ | - | $ | - | $ | 0.03 | |||||
| Adjusted net earnings (loss) attributable to equity holders | $ | 405.8 | $ | 57.2 | $ | 709.2 | $ | 296.0 | $ | 59.3 | |||||
| Adjusted net earnings (loss) per share attributable to equity holders | $ | 0.70 | $ | 0.10 | $ | 1.23 | $ | 0.55 | $ | 0.12 | |||||
| Basic weighted average number of common shares outstanding (millions) | 577.7 | 571.3 | 575.1 | 539.8 | 480.6 |
Net Cash from Operating Activities before Changes in Working Capital
The Company makes reference to net cash from operating activities before changes in working capital which is calculated as net cash from operating activities less working capital items and non-current ore stockpiles. Working capital can be volatile due to numerous factors, including a build-up or reduction of inventories. Management believes that this non-GAAP measure, which excludes these non-cash items, provides investors with the ability to better evaluate the operating cash flow performance of the Company.
The following table provides a reconciliation of net cash from operating activities before changes in working capital to net cash from operating activities:
| ($ millions, except where noted) | Q4 2025 | Q4 2024 | 2025 | 2024 | 2023 | ||||||||||
| Net cash from operating activities | $ | 701.7 | $ | 102.6 | $ | 1,142.6 | $ | 486.0 | $ | 144.0 | |||||
| Adjusting items from working capital items and non- current ore stockpiles: | |||||||||||||||
| Receivables and other current assets | (35.7 | ) | 20.9 | 11.9 | 45.6 | (18.0 | ) | ||||||||
| Inventories and non-current ore stockpiles | 63.8 | 20.3 | 105.9 | 51.4 | 76.6 | ||||||||||
| Accounts payable and accrued liabilities | (38.2 | ) | (16.6 | ) | (56.0 | ) | 17.4 | (43.7 | ) | ||||||
| Net cash from operating activities before changes in working capital - continuing operations | $ | 691.6 | 127.2 | $ | 1,204.4 | 600.4 | 158.9 | ||||||||
| Net cash from operating activities before changes in working capital - discontinued operations | $ | - | $ | - | $ | - | $ | - | $ | 21.9 | |||||
| Net cash from operating activities before changes in working capital | $ | 691.6 | $ | 127.2 | $ | 1,204.4 | $ | 600.4 | $ | 180.8 |
Mine-Site Free Cash Flow
Mine-site free cash flow is calculated as cash flow from mine-site operating activities less capital expenditures from operating mine sites. The Company believes this measure is useful to investors in assessing the Company's ability to operate its mine sites without reliance on additional borrowing or usage of existing cash.
Three months ended December 31, 2025
| ($ millions, except where noted) | Côté Gold | Westwood | Essakane | Corporate & other |
Total | ||||||||||
| Net cash from operating activities | $ | 241.8 | $ | 106.1 | $ | 367.2 | $ | (13.4 | ) | $ | 701.7 | ||||
| Add: | |||||||||||||||
| Operating cash flow used by non-mine site activities | - | - | - | 13.4 | 13.4 | ||||||||||
| Cash flow from operating mine-sites | $ | 241.8 | $ | 106.1 | $ | 367.2 | $ | - | $ | 715.1 | |||||
| Capital expenditures | 44.8 | 16.9 | 26.8 | - | 88.5 | ||||||||||
| Less: | |||||||||||||||
| Capital expenditures from corporate and development projects | - | - | - | - | - | ||||||||||
| Capital expenditures from operating mine-sites | $ | 44.8 | $ | 16.9 | $ | 26.8 | $ | - | $ | 88.5 | |||||
| Mine-site cash flow | $ | 197.0 | $ | 89.2 | $ | 340.4 | $ | - | $ | 626.6 |
Three months ended December 31, 2024
| ($ millions, except where noted) | Côté Gold | Westwood | Essakane | Corporate & Other |
Total | ||||||||||
| Net cash from operating activities | $ | 61.8 | $ | 60.0 | $ | 76.3 | $ | (95.5 | ) | $ | 102.6 | ||||
| Add: | |||||||||||||||
| Operating cash flow used by non-mine site activities | - | - | - | 95.5 | 95.5 | ||||||||||
| Cash flow from operating mine-sites | $ | 61.8 | $ | 60.0 | $ | 76.3 | $ | - | $ | 198.1 | |||||
| Capital expenditures | 44.9 | 18.7 | 56.3 | 0.5 | 120.4 | ||||||||||
| Less: | |||||||||||||||
| Capital expenditures from construction and development projects and corporate | - | - | - | (0.5 | ) | (0.5 | ) | ||||||||
| Capital expenditures from operating mine-sites | $ | 44.9 | $ | 18.7 | $ | 56.3 | $ | - | $ | 119.9 | |||||
| Mine-site cash flow | $ | 16.9 | $ | 41.3 | $ | 20.0 | $ | - | $ | 78.2 |
Twelve months ended December 31, 2025
| ($ millions, except where noted) | Côté Gold | Westwood | Essakane | Corporate & other |
Total | ||||||||||
| Net cash from operating activities | $ | 606.8 | $ | 214.1 | $ | 672.9 | $ | (351.2 | ) | $ | 1,142.6 | ||||
| Add: | |||||||||||||||
| Operating cash flow used by non-mine site activities | - | - | - | 351.2 | 351.2 | ||||||||||
| Cash flow from operating mine-sites | $ | 606.8 | $ | 214.1 | $ | 672.9 | $ | - | $ | 1,493.8 | |||||
| Capital expenditures | 122.7 | 65.5 | 106.6 | 0.2 | 295.0 | ||||||||||
| Less: | |||||||||||||||
| Capital expenditures from corporate and | - | - | - | (0.2 | ) | (0.2 | ) | ||||||||
| development projects | |||||||||||||||
| Capital expenditures from operating mine-sites | $ | 122.7 | $ | 65.5 | $ | 106.6 | $ | - | $ | 294.8 | |||||
| Mine-site cash flow | $ | 484.1 | $ | 148.6 | $ | 566.3 | $ | - | $ | 1,199.0 |
Twelve months ended December 31, 2024
| ($ millions, except where noted) | Côté Gold | Westwood | Essakane | Corporate & Other |
Total | ||||||||||
| Net cash from operating activities | $ | 128.3 | $ | 161.1 | $ | 444.5 | $ | (247.9 | ) | $ | 486.0 | ||||
| Add: | |||||||||||||||
| Operating cash flow used by non-mine site activities | - | - | - | 247.9 | 247.9 | ||||||||||
| Cash flow from operating mine-sites | $ | 128.3 | $ | 161.1 | $ | 444.5 | $ | - | $ | 733.9 | |||||
| Capital expenditures | 88.1 | 66.7 | 194.0 | 209.8 | 558.6 | ||||||||||
| Less: | |||||||||||||||
| Capital expenditures from construction and development projects and corporate | - | - | - | (209.8 | ) | (209.8 | ) | ||||||||
| Capital expenditures from operating mine-sites | $ | 88.1 | $ | 66.7 | $ | 194.0 | $ | - | $ | 348.8 | |||||
| Mine-site cash flow | $ | 40.2 | $ | 94.4 | $ | 250.5 | $ | - | $ | 385.1 | |||||
Twelve months ended December 31, 2023
| ($ millions, except where noted) | Westwood | Essakane | Corporate & Other |
Total | ||||||||
| Net cash from operating activities - continuing operations | $ | 22.5 | $ | 223.8 | $ | (102.3 | ) | $ | 144.0 | |||
| Add: | ||||||||||||
| Operating cash flow used by non-mine site activities | - | - | 102.3 | 102.3 | ||||||||
| Cash flow from operating mine-sites - continuing operations | 22.5 | 223.8 | - | 246.3 | ||||||||
| Capital expenditures - continuing operations | 65.3 | 132.8 | 709.2 | 907.3 | ||||||||
| Less: | ||||||||||||
| Capital expenditures from construction and development projects and corporate | - | - | (709.2 | ) | (709.2 | ) | ||||||
| Capital expenditures from operating mine-sites - continuing operations | 65.3 | 132.8 | - | 198.1 | ||||||||
| Mine-site cash flow - continuing operations | (42.8 | ) | 91.0 | - | 48.2 | |||||||
| Cash flow from discontinued mine-sites | - | - | 15.4 | 15.4 | ||||||||
| Capital expenditures from discontinued operations | - | - | (9.5 | ) | (9.5 | ) | ||||||
| Mine-site cash flow - discontinued operations | - | - | 5.9 | 5.9 | ||||||||
| Total mine-site cash flow | $ | (42.8 | ) | $ | 91.0 | $ | 5.9 | $ | 54.1 |
Liquidity and Net Cash (Debt)
Liquidity is defined as cash and cash equivalents, short-term investments, and the credit available under the Credit Facility. Net cash (debt) is calculated as cash, cash equivalents and short-term investments less long-term debt, lease liabilities and the drawn portion of the Credit Facility. The Company believes this measure provides investors with additional information regarding the liquidity position of the Company.
| December 31 | December 31 | December 31 | |||||||
| ($ millions, except where noted) | 2025 | 2024 | 2023 | ||||||
| Cash and cash equivalents | $ | 421.9 | $ | 347.5 | $ | 367.1 | |||
| Short-term investments | 1.0 | 1.0 | - | ||||||
| Available Credit Facility | 445.7 | 418.5 | 387.0 | ||||||
| Available Liquidity | $ | 868.6 | $ | 767.0 | $ | 754.1 | |||
| December 31 | December 31 | December 31 | |||||||
| ($ millions, except where noted) | 2025 | 2024 | 2023 | ||||||
| Cash and cash equivalents | $ | 421.9 | $ | 347.5 | $ | 367.1 | |||
| Short-term investments | 1.0 | 1.0 | - | ||||||
| Lease liabilities | (112.0 | ) | (124.2 | ) | (121.3 | ) | |||
| Long-term debt1 | (651.0 | ) | (1,072.1 | ) | (857.3 | ) | |||
| Drawn letters of credit issued under Credit Facility | (4.3 | ) | (11.5 | ) | (38.0 | ) | |||
| Net cash (debt) | $ | (344.4 | ) | $ | (859.3 | ) | $ | (649.5 | ) |
1. Includes principal amount of the Notes of $450.0 million, Term Loan of $nil, Credit Facility of $200.0 million and equipment loan of $1.0 million (December 31, 2024 - $450.0 million, $400.0 million, $220.0 million, and $2.1 million, respectively, December 31, 2023 - $450.0 million, $400.0 million, $nil, and $7.3 million, respectively). Excludes deferred transaction costs and embedded derivatives on the Notes and Term Loan.
CAUTIONARY STATEMENT ON FORWARD-LOOKING INFORMATION
All information included or incorporated by reference in this MD&A, including any information as to the Company's vision, strategy, future financial or operating performance and other statements that express management's expectations or estimates of future performance or impact, including statements in respect of the prospects and/or development of the Company's projects, other than statements of historical fact, constitutes forward-looking information or forward-looking statements within the meaning of applicable securities laws (collectively referred to herein as "forward-looking statements") and such forward-looking statements are based on expectations, estimates and projections as of the date of this MD&A. Forward-looking statements are generally identifiable by the use of words such as "may", "will", "should", "would", "could", "continue", "expect", "budget", "aim", "can", "focus", "forecast", "anticipate", "estimate", "maintain", "believe", "intend", "plan", "schedule", "guidance", "outlook", "potential", "seek", "targets", "cover", "strategy", "during", "ongoing", "subject to", "future", "objectives", "opportunities", "committed", "prospective", "likely", "progress", "strive", "sustain", "effort", "extend", "remain", "pursue", "predict", or "project" or the negative of these words or other variations on these words or comparable terminology.
In particular, forward-looking statements in this MD&A include, without limitation, those under the headings "About IAMGOLD", "Highlights", "Outlook", "Environmental, Social and Governance", "Operations", "Financial Condition" and "Quarterly Financial Review" and include, but are not limited to, statements with respect to: the estimation of mineral reserves and mineral resources and the realization of such estimates; operational and financial performance including the Company's guidance for and actual results of production, ESG performance, costs and capital and other expenditures such as exploration and including depreciation expense and effective tax rate; long-term value and capital allocation; the updated life-of-mine plan, ramp-up assumptions and other project metrics including operating costs in respect to the Côté Gold Mine; expected production of the Côté Gold Mine; expected benefits from the operational improvements and de-risking strategies implemented or to be implemented by the Company; mine development activities; the Company's capital allocation and liquidity; the composition of the Company's portfolio of assets including its operating mines, development and exploration projects; the sale of its Malian asset; permitting timelines and the expected receipt of permits; inflation, including global inflation and inflationary pressures; global supply chain constraints; environmental verification, biodiversity, including commitments related thereto and social development projects; plans, targets, proposals and strategies with respect to sustainability, including third party data on which the Company relies, and their implementation; commitments with respect to sustainability and the impact thereof; commitments with respect to greenhouse gas emissions and energy transition; commitments related to social performance, including commitments in furtherance of Indigenous relations; the ability to secure alternative sources of consumables of comparable quality and on reasonable terms; workforce and contractor availability, labour costs and other labour impacts; the future price of gold and other commodities; equity financings, foreign exchange rates and currency fluctuations; financial instruments; hedging strategies; impairment assessments and assets carrying values estimates; safety and security concerns in the jurisdictions in which the Company operates and the impact thereof on the Company's operational and financial performance and financial condition; and government regulation of mining operations.
The Company cautions the reader that forward-looking statements are necessarily based upon a number of estimates and assumptions that, while considered reasonable by management, are inherently subject to significant business, financial, operational and other risks, uncertainties, contingencies and other factors, including those described below, which could cause actual results, performance or achievements of the Company to be materially different from results, performance or achievements expressed or implied by such forward-looking statements and, as such, undue reliance must not be placed on them. Forward-looking statements are also based on numerous material factors and assumptions, including as described in this MD&A with respect to: the Company's present and future business strategies; operations performance within expected ranges; anticipated future production and cash flows; local and global economic conditions and the environment in which the Company will operate in the future; the price of precious metals, other minerals and key commodities; projected mineral grades; international exchanges rates; anticipated capital and operating costs; the availability and timing of required governmental and other approvals for the construction of the Company's projects.
Risks, uncertainties, contingencies and other factors that could cause actual results, performance or achievements of the Company to be materially different from results, performance or achievements expressed or implied by such forward-looking statements include, without limitation: the Company's business strategies and its ability to execute thereon; the development and execution of implementing strategies to meet the Company's sustainability vision and targets; security risks, including civil unrest, war or terrorism and disruptions to the Company's supply chain and transit routes as a result of such security risks, particularly in Burkina Faso and the Sahel region surrounding the Company's Essakane mine; the availability of labour and qualified contractors; the availability of key inputs for the Company's operations and disruptions in global supply chains; tariffs and increase costs of supplies and equipment; the volatility of the Company's securities; litigation; contests over title to properties, particularly title to undeveloped properties; mine closure and rehabilitation risks; management of certain of the Company's assets by other companies or joint venture partners; the lack of availability of insurance covering all of the risks associated with a mining company's operations; unexpected geological conditions; competition and consolidation in the mining sector; the profitability of the Company being highly dependent on the condition and results of the mining industry as a whole, and the gold mining industry in particular; changes in the global prices for gold, and commodities used in the operation of the Company's business (including, but not limited to diesel, fuel oil and electricity); legal, litigation, legislative, political or economic risks and new developments in the jurisdictions in which the Company carries on business, including the imposition of tariffs by the United States on Canadian products; changes in taxes, including mining tax regimes; the failure to obtain in a timely manner from authorities key permits, authorizations or approvals necessary for transactions, exploration, development or operation, operating or technical difficulties in connection with mining or development activities, including geotechnical difficulties and major equipment failure; the availability of capital; the level of liquidity and capital resources; access to capital markets and financing; the Company's level of indebtedness; the Company's ability to satisfy covenants under its credit facilities; changes in interest rates; adverse changes in the Company's credit rating; the Company's choices in capital allocation; effectiveness of the Company's ongoing cost containment efforts; the Company's ability to execute on de-risking activities and measures to improve operations; availability of specific assets to meet contractual obligations; risks related to third-party contractors, including reduced control over aspects of the Company's operations and/or the failure and/or the effectiveness of contractors to perform; risks relating to acquisitions and divestitures; risks arising from holding derivative instruments; changes in U.S. dollar and other currency exchange rates or gold lease rates; capital and currency controls in foreign jurisdictions; assessment of carrying values for the Company's assets, including the ongoing potential for material impairment and/or write-downs of such assets; the speculative nature of exploration and development, including the risks of diminishing quantities or grades of reserves; the fact that reserves and resources, expected metallurgical recoveries, capital and operating costs are estimates which may require revision; the presence of unfavourable content in ore deposits, including clay and coarse gold; inaccuracies in life of mine plans; failure to meet operational targets; equipment malfunctions; information systems security threats and cybersecurity; laws and regulations governing the protection of the environment (including greenhouse gas emission reduction and other energy transition requirements; the uncertainty surrounding the interpretation of omnibus Bill C-59 and the related amendments to the Competition Act (Canada); employee relations and labour disputes; the maintenance of tailings storage facilities and the potential for a major spill or failure of the tailings facilities due to uncontrollable events, lack of reliable infrastructure, including access to roads, bridges, power sources and water supplies; physical and regulatory risks related to climate change; unpredictable weather patterns and challenging weather conditions at mine sites; disruptions from weather related events resulting in limited or no productivity such as forest fires, severe storms, flooding, drought, heavy snowfall, poor air quality, and extreme heat or cold; attraction and retention of key employees and other qualified personnel; availability and increasing costs associated with mining inputs and labour, negotiations with respect to new, reasonable collective labour agreements and/or collective bargaining agreements may not be agreed to; the ability of contractors to timely complete projects on acceptable terms; the relationship with the communities surrounding the Company's operations and projects; indigenous rights or claims; illegal mining; the potential direct or indirect operational impacts resulting from external factors, including infectious diseases, pandemics, or other public health emergencies; and the inherent risks involved in the exploration, development and mining business generally. Please see the Company's AIF available on SEDAR+ at www.sedarplus.ca or Form 40-F available on EDGAR at www.sec.gov/edgar for a comprehensive discussion of the risks faced by the Company and which may cause actual results, performance or achievements of the Company to be materially different from results, performance or achievements expressed or implied by forward-looking statements.
Although the Company has attempted to identify important factors that could cause actual results to differ materially from those contained in forward-looking statements, there may be other factors that cause results not to be as anticipated, estimated or intended. The Company disclaims any intention or obligation to update or revise any forward-looking statements whether as a result of new information, future events or otherwise except as required by applicable law.

CONSOLIDATED FINANCIAL STATEMENTS
As at December 31, 2025
INDEX
MANAGEMENT'S RESPONSIBILITY FOR FINANCIAL REPORTING
To the Shareholders and Board of Directors of IAMGOLD Corporation
The accompanying consolidated financial statements of IAMGOLD Corporation (the "Company"), their presentation and the information contained in Management's Discussion and Analysis including information determined by specialists, are the responsibility of management. The consolidated financial statements have been prepared in accordance with International Financial Reporting Standards ("IFRS") as issued by the International Accounting Standards Board ("IASB").
The financial information of the Company presented in the Management's Discussion and Analysis is consistent with that in the consolidated financial statements.
The integrity of the consolidated financial reporting process is the responsibility of management. Management maintains systems of internal controls designed to provide reasonable assurance that transactions are authorized, assets are safeguarded, and reliable financial information is produced. Management selects accounting principles and methods that are appropriate to the Company's circumstances, and makes certain determinations of amounts reported in which estimates or judgments are required.
The Board of Directors is responsible for ensuring that management fulfills its responsibility for financial reporting. The Board of Directors carries out this responsibility principally through its Audit and Finance Committee which consists of independent directors. The Board of Directors has also designated the Chairman of the Audit and Finance Committee as the Board's financial expert. The Audit and Finance Committee meets periodically with management and the external auditors to discuss internal controls, auditing matters and financial reporting requirements. The Audit and Finance Committee satisfies itself that each party is properly discharging its responsibilities; reviews the quarterly and annual consolidated financial statements and any reports by the external auditors; and recommends the appointment of the external auditors for review by the Board of Directors and approval by the shareholders.
The external auditors audit the annual consolidated financial statements on behalf of the shareholders of the Company. The external auditors have full and free access to management and the Audit and Finance Committee.
 |
 |
| Renaud Adams | Maarten Theunissen |
| President and Chief Executive Officer ("CEO") | Chief Financial Officer ("CFO") |
| February 17, 2026 | February 17, 2026 |
MANAGEMENT'S REPORT ON INTERNAL CONTROL OVER FINANCIAL REPORTING
The Company's management is responsible for establishing and maintaining adequate internal control over financial reporting. The Company's internal control over financial reporting is designed to provide reasonable assurance regarding the reliability of financial reporting and the preparation of the consolidated financial statements for external purposes in accordance with IFRS as issued by the IASB.
Because of its inherent limitations, internal control over financial reporting may not prevent or detect misstatements. Projections of any evaluation of effectiveness to future periods are subject to the risk that controls may become inadequate because of changes in conditions, or that the degree of compliance with the policies or procedures may deteriorate.
Management, including the CEO and CFO conducted an evaluation of the design, implementation and operating effectiveness of the Company's internal control over financial reporting as of December 31, 2025. Based on this evaluation, management, including the CEO and the CFO, has concluded that the Company's internal control over financial reporting was effective as of December 31, 2025
The effectiveness of the Company's internal control over financial reporting as of December 31, 2025 has been audited by KPMG LLP, Chartered Professional Accountants, as stated in their report located on page 58 of the consolidated financial statements.
REPORT OF INDEPENDENT REGISTERED PUBLIC ACCOUNTING FIRM
To the Shareholders and Board of Directors of IAMGOLD Corporation:
Opinion on the Consolidated Financial Statements
We have audited the accompanying consolidated balance sheets of IAMGOLD Corporation (the Company) as of December 31, 2025 and 2024, the related consolidated statements of earnings (loss), comprehensive income (loss), changes in equity, and cash flows for each of the years then ended, and the related notes (collectively, the consolidated financial statements). In our opinion, the consolidated financial statements present fairly, in all material respects, the financial position of the Company as of December 31, 2025 and 2024, and its financial performance and its cash flows for each of the years then ended, in conformity with International Financial Reporting Standards (IFRS) as issued by the International Accounting Standards Board (IASB).
We also have audited, in accordance with the standards of the Public Company Accounting Oversight Board (United States) (PCAOB), the Company's internal control over financial reporting as of December 31, 2025, based on criteria established in Internal Control - Integrated Framework (2013) issued by the Committee of Sponsoring Organizations of the Treadway Commission, and our report dated February 17, 2026 expressed an unqualified opinion on the effectiveness of the Company's internal control over financial reporting.
Basis for Opinion
These consolidated financial statements are the responsibility of the Company's management. Our responsibility is to express an opinion on these consolidated financial statements based on our audits. We are a public accounting firm registered with the PCAOB and are required to be independent with respect to the Company in accordance with the U.S. federal securities laws and the applicable rules and regulations of the Securities and Exchange Commission and the PCAOB.
We conducted our audits in accordance with the standards of the PCAOB. Those standards require that we plan and perform the audit to obtain reasonable assurance about whether the consolidated financial statements are free of material misstatement, whether due to error or fraud. Our audits included performing procedures to assess the risks of material misstatement of the consolidated financial statements, whether due to error or fraud, and performing procedures that respond to those risks. Such procedures included examining, on a test basis, evidence regarding the amounts and disclosures in the consolidated financial statements. Our audits also included evaluating the accounting principles used and significant estimates made by management, as well as evaluating the overall presentation of the consolidated financial statements. We believe that our audits provide a reasonable basis for our opinion.
Critical Audit Matter
The critical audit matter communicated below is a matter arising from the current period audit of the consolidated financial statements that was communicated or required to be communicated to the audit committee and that: (1) relates to accounts or disclosures that are material to the consolidated financial statements and (2) involved our especially challenging, subjective, or complex judgments. The communication of a critical audit matter does not alter in any way our opinion on the consolidated financial statements, taken as a whole, and we are not, by communicating the critical audit matter below, providing a separate opinion on the critical audit matter or on the accounts or disclosures to which it relates.
Assessment of the provision for asset retirement obligations
As discussed in Note 14 to the consolidated financial statements, the provision for asset retirement obligations was $287.6 million as of December 31, 2025. The Company makes a provision based on the best estimate of the future cost of rehabilitating mines and related production facilities. Asset retirement obligations may be revised on the basis of amendments to laws and regulations and the availability of new information, such as changes in reserves corresponding to a change in the LOM, changes in discount rates, approved closure plans and estimated costs of reclamation activities and acquisition or construction of a new mine.
We identified the provision for asset retirement obligations as a critical audit matter. Significant auditor judgment was required to evaluate the estimated future cash flows used as an input to the provision. This assumption was challenging to evaluate, as future costs are subject to variability that can be difficult to estimate reliably.
The following are the primary procedures we performed to address this critical audit matter. We evaluated the design and tested the operating effectiveness of certain internal controls over the Company's process to estimate the amount of future cash flows. For a selection of estimated future costs, we compared them to cost estimates prepared by management's third-party experts. We compared the planned reclamation activities included in management's estimate to government approved mine closure plans or current mine closure plans prepared in accordance with local laws and regulations. We evaluated the competency, capability and objectivity of the management's experts who produced the applicable mine closure plans and estimated the future reclamation costs of the mines by assessing their professional qualifications, industry experience and familiarity with applicable legislative requirements and leading industry practices.
/s/ KPMG LLP
Chartered Professional Accountants, Licensed Public Accountants
We have served as the Company's auditor since 1998.
Toronto, Canada
February 17, 2026
REPORT OF INDEPENDENT REGISTERED PUBLIC ACCOUNTING FIRM
To the Shareholders and Board of Directors of IAMGOLD Corporation:
Opinion on Internal Control Over Financial Reporting
We have audited IAMGOLD Corporation's (the Company) internal control over financial reporting as of December 31, 2025, based on criteria established in Internal Control - Integrated Framework (2013) issued by the Committee of Sponsoring Organizations of the Treadway Commission. In our opinion, the Company maintained, in all material respects, effective internal control over financial reporting as of December 31, 2025, based on criteria established in Internal Control - Integrated Framework (2013) issued by the Committee of Sponsoring Organizations of the Treadway Commission.
We also have audited, in accordance with the standards of the Public Company Accounting Oversight Board (United States) (PCAOB), the consolidated balance sheets of the Company as of December 31, 2025 and 2024, the related consolidated statements of earnings (loss), comprehensive income (loss), changes in equity, and cash flows for each of the years then ended, and the related notes (collectively, the consolidated financial statements), and our report dated February 17, 2026 expressed an unqualified opinion on those consolidated financial statements.
Basis for Opinion
The Company's management is responsible for maintaining effective internal control over financial reporting and for its assessment of the effectiveness of internal control over financial reporting, included in the accompanying Management's Report on Internal Control Over Financial Reporting. Our responsibility is to express an opinion on the Company's internal control over financial reporting based on our audit. We are a public accounting firm registered with the PCAOB and are required to be independent with respect to the Company in accordance with the U.S. federal securities laws and the applicable rules and regulations of the Securities and Exchange Commission and the PCAOB.
We conducted our audit in accordance with the standards of the PCAOB. Those standards require that we plan and perform the audit to obtain reasonable assurance about whether effective internal control over financial reporting was maintained in all material respects. Our audit of internal control over financial reporting included obtaining an understanding of internal control over financial reporting, assessing the risk that a material weakness exists, and testing and evaluating the design and operating effectiveness of internal control based on the assessed risk. Our audit also included performing such other procedures as we considered necessary in the circumstances. We believe that our audit provides a reasonable basis for our opinion.
Definition and Limitations of Internal Control Over Financial Reporting
A company's internal control over financial reporting is a process designed to provide reasonable assurance regarding the reliability of financial reporting and the preparation of financial statements for external purposes in accordance with generally accepted accounting principles. A company's internal control over financial reporting includes those policies and procedures that (1) pertain to the maintenance of records that, in reasonable detail, accurately and fairly reflect the transactions and dispositions of the assets of the company; (2) provide reasonable assurance that transactions are recorded as necessary to permit preparation of financial statements in accordance with generally accepted accounting principles, and that receipts and expenditures of the company are being made only in accordance with authorizations of management and directors of the company; and (3) provide reasonable assurance regarding prevention or timely detection of unauthorized acquisition, use, or disposition of the company's assets that could have a material effect on the financial statements.
Because of its inherent limitations, internal control over financial reporting may not prevent or detect misstatements. Also, projections of any evaluation of effectiveness to future periods are subject to the risk that controls may become inadequate because of changes in conditions, or that the degree of compliance with the policies or procedures may deteriorate.
/s/ KPMG LLP
Chartered Professional Accountants, Licensed Public Accountants
Toronto, Canada
February 17, 2026
CONSOLIDATED BALANCE SHEETS
| December 31, | December 31, | ||||||
| (In millions of U.S. dollars) | Notes | 2025 | 2024 | ||||
| Assets | |||||||
| Current assets | |||||||
| Cash and cash equivalents | $ | 421.9 | $ | 347.5 | |||
| Receivables and other current assets | 9 | 79.6 | 48.9 | ||||
| Inventories | 10 | 377.0 | 271.9 | ||||
| Assets held for sale | 6 | 25.2 | - | ||||
| 903.7 | 668.3 | ||||||
| Non-current assets | |||||||
| Property, plant and equipment | 11 | 4,162.8 | 4,269.4 | ||||
| Exploration and evaluation assets | 12 | 396.1 | 79.6 | ||||
| Restricted cash | 8 | 71.0 | 68.4 | ||||
| Inventories | 10 | 194.8 | 153.0 | ||||
| Other assets | 13 | 124.1 | 135.7 | ||||
| 4,948.8 | 4,706.1 | ||||||
| $ | 5,852.5 | $ | 5,374.4 | ||||
| Liabilities and Equity | |||||||
| Current liabilities | |||||||
| Accounts payable and accrued liabilities | $ | 329.1 | $ | 264.8 | |||
| Income taxes payable | 99.6 | 62.7 | |||||
| Current portion of provisions | 14 | 5.1 | 14.5 | ||||
| Current portion of lease liabilities | 15 | 32.3 | 28.8 | ||||
| Current portion of long-term debt | 18 | 1.0 | 1.0 | ||||
| Current portion of deferred revenue | 19 | - | 151.1 | ||||
| Other current liabilities | 17 | 50.0 | 27.7 | ||||
| 517.1 | 550.6 | ||||||
| Non-current liabilities | |||||||
| Deferred income tax liabilities | 16 | 52.6 | 14.0 | ||||
| Provisions | 14 | 308.3 | 285.1 | ||||
| Lease liabilities | 15 | 79.7 | 95.4 | ||||
| Long-term debt | 18 | 648.8 | 1,027.9 | ||||
| Other liabilities | 17 | 0.1 | 0.7 | ||||
| 1,089.5 | 1,423.1 | ||||||
| 1,606.6 | 1,973.7 | ||||||
| Equity | |||||||
| Attributable to equity holders | |||||||
| Common shares | 3,383.8 | 3,070.6 | |||||
| Contributed surplus | (27.4 | ) | 57.6 | ||||
| Retained earnings | 872.6 | 259.4 | |||||
| Accumulated other comprehensive income (loss) | (37.6 | ) | (50.9 | ) | |||
| 4,191.4 | 3,336.7 | ||||||
| Non-controlling interests | 54.5 | 64.0 | |||||
| 4,245.9 | 3,400.7 | ||||||
| Commitments | 14, 36 | ||||||
| Subsequent events | 23(c) | ||||||
| $ | 5,852.5 | $ | 5,374.4 |
The accompanying notes are an integral part of these consolidated financial statements.
Signed on behalf of the Board of Directors,
 |
 |
| David Smith, Chair | Murray Suey, Director |
CONSOLIDATED STATEMENTS OF EARNINGS (LOSS)
| Years ended December 31, | |||||||
| (In millions of U.S. dollars, except per share amounts) | Notes | 2025 | 2024 | ||||
| Revenues | $ | 2,852.8 | $ | 1,633.0 | |||
| Cost of sales | 26 | (1,646.6 | ) | (1,083.1 | ) | ||
| Gross profit (loss) | 1,206.2 | 549.9 | |||||
| General and administrative expenses | 27 | (58.4 | ) | (48.9 | ) | ||
| Exploration expenses | (27.2 | ) | (21.7 | ) | |||
| Impairment reversal (charge), net | 28 | (12.2 | ) | 455.5 | |||
| Other income (expenses) | 29 | (14.8 | ) | 9.2 | |||
| Earnings (loss) from operations | 1,093.6 | 944.0 | |||||
| Finance costs | 30 | (112.2 | ) | (70.8 | ) | ||
| Foreign exchange gain (loss) | (0.6 | ) | (1.0 | ) | |||
| Gain on sale of Bambouk assets | - | 34.1 | |||||
| Interest income, derivatives and other investment gains (losses) | 31 | (11.0 | ) | 70.9 | |||
| Earnings (loss) before income taxes | 969.8 | 977.2 | |||||
| Income tax expense | 16 | (237.5 | ) | (129.4 | ) | ||
| Net earnings (loss) | $ | 732.3 | $ | 847.8 | |||
| Net earnings (loss) attributable to: | |||||||
| Equity holders | $ | 664.4 | $ | 819.6 | |||
| Non-controlling interests | 67.9 | 28.2 | |||||
| Net earnings (loss) | $ | 732.3 | $ | 847.8 | |||
| Attributable to equity holders | |||||||
| Weighted average number of common shares outstanding (in millions) | |||||||
| Basic | 33 | 575.1 | 539.8 | ||||
| Diluted | 33 | 581.7 | 545.9 | ||||
| Basic earnings (loss) per share | 33 | $ | 1.16 | $ | 1.52 | ||
| Diluted earnings (loss) per share | 33 | $ | 1.14 | $ | 1.50 | ||
The accompanying notes are an integral part of these consolidated financial statements.
CONSOLIDATED STATEMENTS OF COMPREHENSIVE INCOME (LOSS)
| Years ended December 31, | |||||||
| (In millions of U.S. dollars) | Notes | 2025 | 2024 | ||||
| Net earnings (loss) | $ | 732.3 | $ | 847.8 | |||
| Other comprehensive income (loss), net of income taxes | |||||||
| Items that will not be reclassified to the statements of earnings (loss) | |||||||
| Movement in marketable securities fair value reserve | |||||||
| Net unrealized change in fair value of marketable securities | 11.0 | 3.1 | |||||
| Net realized change in fair value of marketable securities | 0.6 | 1.2 | |||||
| Tax impact | 16 | - | (0.2 | ) | |||
| 11.6 | 4.1 | ||||||
| Items that may be reclassified to the statements of earnings (loss) | |||||||
| Movement in cash flow hedge fair value reserve from continuing operations | |||||||
| Effective portion of changes in fair value of cash flow hedges | 20(b)(i) | (5.2 | ) | (39.7 | ) | ||
| Time value of options contracts excluded from hedge relationship | 20(b)(i) | 3.0 | 4.8 | ||||
| Net change in fair value of cash flow hedges reclassified to the statements of earnings (loss) | 20(b)(ii) | 2.6 | 23.8 | ||||
| Unrealized gain reclassified or adjusted from cash flow hedge reserve due to hedge de-designation | 20(b)(i) | - | 2.2 | ||||
| Tax impact | 16 | - | (0.1 | ) | |||
| 0.4 | (9.0 | ) | |||||
| Total other comprehensive income (loss) | 12.0 | (4.9 | ) | ||||
| Comprehensive income (loss) | $ | 744.3 | $ | 842.9 | |||
| Comprehensive income (loss) attributable to: | |||||||
| Equity holders | $ | 676.4 | $ | 814.7 | |||
| Non-controlling interests | 67.9 | 28.2 | |||||
| Comprehensive income (loss) | $ | 744.3 | $ | 842.9 | |||
The accompanying notes are an integral part of these consolidated financial statements.
CONSOLIDATED STATEMENTS OF CASH FLOWS
| Years ended December 31, | |||||||
| (In millions of U.S. dollars) | Notes | 2025 | 2024 | ||||
| Operating activities | |||||||
| Net earnings (loss) | $ | 732.3 | $ | 847.8 | |||
| Adjustments for: | |||||||
| Depreciation expense | 26 | 420.9 | 275.0 | ||||
| Impairment (reversal) charge | 28 | 12.2 | (455.5 | ) | |||
| Gain on sale of Bambouk assets | - | (34.1 | ) | ||||
| Deferred revenue recognized | 19 | (154.3 | ) | (235.7 | ) | ||
| Income tax expense | 16 | 237.5 | 129.4 | ||||
| Derivative (gain) loss | 29.8 | (20.4 | ) | ||||
| Finance costs | 30 | 112.2 | 70.8 | ||||
| Other non-cash items | 34(a) | 2.0 | (60.2 | ) | |||
| Adjustments for cash items: | |||||||
| Proceeds from gold prepayment arrangement | 19 | - | 119.3 | ||||
| Proceeds from insurance claim | - | 27.3 | |||||
| Settlement of derivatives | (2.6 | ) | (2.9 | ) | |||
| Disbursements related to asset retirement obligations | 14(a) | (14.1 | ) | (2.9 | ) | ||
| Other | - | (2.1 | ) | ||||
| Movements in non-cash working capital items and non-current ore stockpiles | 34(b) | (61.8 | ) | (114.4 | ) | ||
| Cash from operating activities, before income taxes paid | 1,314.1 | 541.4 | |||||
| Income taxes paid | (171.5 | ) | (55.4 | ) | |||
| Net cash from (used in) operating activities | 1,142.6 | 486.0 | |||||
| Investing activities | |||||||
| Capital expenditures for property, plant and equipment | (293.5 | ) | (558.6 | ) | |||
| Capitalized borrowing costs | 30 | (34.6 | ) | (77.8 | ) | ||
| Acquisitions of Northern Superior and Orbec | 5 | (30.8 | ) | - | |||
| Proceeds from sale of Bambouk assets | - | 35.5 | |||||
| Other investing activities | 34(c) | (19.4 | ) | 18.5 | |||
| Net cash from (used in) investing activities | (378.3 | ) | (582.4 | ) | |||
| Financing activities | |||||||
| Net proceeds from issuance of shares | 23 | 3.9 | 287.5 | ||||
| Repurchase of shares under the Normal Course Issuer Bid ("NCIB") | 23(c) | (50.0 | ) | - | |||
| Proceeds from credit facility | 34(e) | 130.0 | 280.0 | ||||
| Repayment of credit facility | 34(e) | (150.0 | ) | (60.0 | ) | ||
| Repayment of second lien term loan | 34(e) | (416.0 | ) | - | |||
| Dividends paid to non controlling interests | 24 | (128.3 | ) | (18.0 | ) | ||
| Net funding from (payment to) Sumitomo Metal Mining Co. Ltd. | - | (332.5 | ) | ||||
| Interest paid | 30 | (64.6 | ) | (13.8 | ) | ||
| Other financing activities | 34(d) | (34.4 | ) | (59.9 | ) | ||
| Net cash from (used in) financing activities | (709.4 | ) | 83.3 | ||||
| Effects of exchange rate fluctuation on cash and cash equivalents | 19.5 | (7.0 | ) | ||||
| Increase (decrease) in cash and cash equivalents - all operations | 74.4 | (20.1 | ) | ||||
| Decrease (increase) in cash and cash equivalents - held for sale | - | 0.5 | |||||
| Increase (decrease) in cash and cash equivalents | 74.4 | (19.6 | ) | ||||
| Cash and cash equivalents, beginning of the year | 347.5 | 367.1 | |||||
| Cash and cash equivalents, end of the year | $ | 421.9 | $ | 347.5 | |||
The accompanying notes are an integral part of these consolidated financial statements.
CONSOLIDATED STATEMENTS OF CHANGES IN EQUITY
| Attributable to equity holders of the Company | ||||||||||||||||||||||||
| Accumulated other | ||||||||||||||||||||||||
| comprehensive income (loss) | ||||||||||||||||||||||||
| Common | Contributed | Retained | Marketable | Cash flow | Non- | Total | ||||||||||||||||||
| (In millions of U.S. dollars) | Earnings | securities fair | hedge fair | Total | controlling | |||||||||||||||||||
| shares | surplus | (Deficit) | value reserve | value reserve | interests | equity | ||||||||||||||||||
| Balance, January 1, 2025 | $ | 3,070.6 | $ | 57.6 | $ | 259.4 | $ | (41.1 | ) | $ | (9.8 | ) | $ | 3,336.7 | $ | 64.0 | $ | 3,400.7 | ||||||
| Net earnings (loss) | - | - | 664.4 | - | - | 664.4 | 67.9 | 732.3 | ||||||||||||||||
| Other comprehensive income (loss) | - | - | - | 11.6 | 0.4 | 12.0 | - | 12.0 | ||||||||||||||||
| Total comprehensive income (loss) | - | - | 664.4 | 11.6 | 0.4 | 676.4 | 67.9 | 744.3 | ||||||||||||||||
| Issuance of common shares for | ||||||||||||||||||||||||
| Exploration and Evaluation asset acquisition (note 5) | 311.4 | - | - | - | - | 311.4 | - | 311.4 | ||||||||||||||||
| Issuance of flow-through common shares (note 23(b)) | 5.1 | - | - | - | - | 5.1 | - | 5.1 | ||||||||||||||||
| Issuance of common shares for share-based compensation | 12.7 | (8.9 | ) | - | - | - | 3.8 | - | 3.8 | |||||||||||||||
| Common shares repurchased under the NCIB (note 23(c))1 | (16.0 | ) | (35.0 | ) | - | - | - | (51.0 | ) | - | (51.0 | ) | ||||||||||||
| Accrual for automatic share purchase plan (note 23(c)) | - | (50.0 | ) | - | - | - | (50.0 | ) | - | (50.0 | ) | |||||||||||||
| Share-based compensation | - | 8.3 | - | - | - | 8.3 | - | 8.3 | ||||||||||||||||
| Net change in fair value and time value in property, plant and equipment | - | - | - | - | 1.3 | 1.3 | - | 1.3 | ||||||||||||||||
| Disposition to non-controlling interests (note 2) | - | - | (50.9 | ) | - | - | (50.9 | ) | 50.9 | - | ||||||||||||||
| Dividends to non-controlling interests (note 24) | - | - | - | - | - | - | (128.3 | ) | (128.3 | ) | ||||||||||||||
| Other | - | 0.6 | (0.3 | ) | - | - | 0.3 | - | 0.3 | |||||||||||||||
| Balance, December 31, 2025 | $ | 3,383.8 | $ | (27.4 | ) | $ | 872.6 | $ | (29.5 | ) | $ | (8.1 | ) | $ | 4,191.4 | $ | 54.5 | $ | 4,245.9 | |||||
1. For the year ended December 31, 2025, the repurchase of shares under the NCIB is reported inclusive of a 2% share buy back tax of $1.0 million.
| Balance, January 1, 2024 | $ | 2,732.1 | $ | 59.2 | $ | (538.3 | ) | $ | (45.2 | ) | $ | (1.8 | ) | $ | 2,206.0 | $ | 58.1 | $ | 2,264.1 | |||||
| Net earnings (loss) | - | - | 819.6 | - | - | 819.6 | 28.2 | 847.8 | ||||||||||||||||
| Other comprehensive income (loss) | - | - | - | 4.1 | (9.0 | ) | (4.9 | ) | - | (4.9 | ) | |||||||||||||
| Total comprehensive income (loss) | - | - | 819.6 | 4.1 | (9.0 | ) | 814.7 | 28.2 | 842.9 | |||||||||||||||
| Issuance of common shares | 319.6 | - | - | - | - | 319.6 | - | 319.6 | ||||||||||||||||
| Issuance of flow-through common shares (note 23(b)) | 4.7 | - | - | - | - | 4.7 | - | 4.7 | ||||||||||||||||
| Issuance of common shares for share-based compensation | 14.2 | (8.1 | ) | - | - | - | 6.1 | - | 6.1 | |||||||||||||||
| Share-based compensation | - | 6.2 | - | - | - | 6.2 | - | 6.2 | ||||||||||||||||
| Net change in fair value and | ||||||||||||||||||||||||
| time value in property, plant and equipment | - | - | - | - | 1.0 | 1.0 | - | 1.0 | ||||||||||||||||
| Acquisition of non-controlling interests | - | - | (21.9 | ) | - | - | (21.9 | ) | (3.0 | ) | (24.9 | ) | ||||||||||||
| Dividends to non-controlling interests (note 24) | - | - | - | - | - | - | (18.0 | ) | (18.0 | ) | ||||||||||||||
| Other | - | 0.3 | - | - | - | 0.3 | (1.3 | ) | (1.0 | ) | ||||||||||||||
| Balance, December 31, 2024 | $ | 3,070.6 | $ | 57.6 | $ | 259.4 | $ | (41.1 | ) | $ | (9.8 | ) | $ | 3,336.7 | $ | 64.0 | $ | 3,400.7 |
| NOTES TO CONSOLIDATED FINANCIAL STATEMENTS |
| For the Years Ended December 31, 2025 and 2024 (Amounts in notes and in tables are in millions of U.S. dollars, except where otherwise indicated) |
1. Corporate Information and Nature of Operations
IAMGOLD Corporation ("IAMGOLD" or the "Company") is a corporation governed by the Canada Business Corporations Act whose shares are publicly traded on the New York Stock Exchange (NYSE:IAG) and the Toronto Stock Exchange (TSX:IMG). The address of the Company's registered office is 150 King Street West, Suite 2200, Toronto, Ontario, Canada, M5H 1J9.
The Company has three operating mines: Côté Gold (Canada), Westwood (Canada) and Essakane (Burkina Faso). Côté Gold commenced production on March 31, 2024. The Company has an established portfolio of early stage and advanced exploration projects within highly prospective mining districts in Canada, including the Nelligan Mining Complex located in Quebec, Canada.
2. Basis of Preparation
(a) Statement of compliance
These consolidated financial statements of IAMGOLD and all of its subsidiaries and joint venture as at and for the years ended December 31, 2025 and 2024, have been prepared in accordance with IFRS as issued by the IASB.
These consolidated financial statements were prepared on a going concern basis. The material accounting policies applied in these consolidated financial statements are presented in note 3 and have been consistently applied in each of the years presented.
These consolidated financial statements of IAMGOLD were authorized for issue in accordance with a resolution of the Board of Directors on February 17, 2026.
(b) Basis of measurement
The consolidated financial statements have been prepared on a historical cost basis, except for items measured at fair value as discussed in note 21.
(c) Basis of consolidation
Subsidiaries and divisions related to significant properties of the Company are accounted for as outlined below.
| Property | Name | December 31, | December 31, | Type of | Accounting |
| (Location) | 2025 | 2024 | Arrangement | Method | |
| Côté Gold mine (Canada) |
Côté Gold division1,2 | 70% | 70% | Division | Proportionate share |
| Westwood complex (Canada) |
Westwood division1 | 100% | 100% | Division | Consolidation |
| Essakane mine (Burkina Faso) |
IAMGOLD Essakane S.A. ("Essakane S.A.") |
85% | 90% | Subsidiary | Consolidation |
| Nelligan Mining Complex (Canada) |
Northern Superior Resources Inc. |
100% | -% | Subsidiary | Consolidation |
| Mines D'Or Orbec Inc. | 100% | -% | Subsidiary | Consolidation | |
| Vanstar Resources Inc.3 ("Vanstar") |
-% | 100% | Subsidiary | Consolidation |
1. Part of IAMGOLD Corporation. The Westwood division includes the closed Doyon mine ("Doyon").
2. During 2022, the Company's interest was diluted to 60.3% and returned to 70% on November 30, 2024 as part of the SMM funding arrangement described in note 7. A third party holds a 7.5% gross margin interest in the mineral tenure comprising the project.
3. On February 13, 2024, the Company acquired all of the issued and outstanding common shares of Vanstar (note 5). Vanstar owned a 25% interest in the Nelligan Gold project, with the remaining 75% interest owned by IAMGOLD Corporation.
Effective June 20, 2025, in accordance with the amended Burkina Faso Mining Code, the government of Burkina Faso increased its ownership interest in the Essakane mine from 10% to 15%, decreasing the Company's interest from 90% to 85%. The decrease in the Company's ownership is reflected as a reduction in retained earnings and an increase in non-controlling interests based on the book value at June 20, 2025.
On September 23, 2025, the Company dissolved Vanstar Resources Inc. The 25% interest in the Nelligan Gold project has been transferred to IAMGOLD Corporation.
On December 19, 2025 and December 22, 2025, the Company acquired all of the issued and outstanding common shares of Northern Superior Resources Inc. and Mines D'Or Orbec Inc. respectively (note 5).
(i) Subsidiaries
Subsidiaries are entities over which the Company has the ability to exercise control. Control of an entity is defined to exist when the Company is exposed to variable returns from involvement with the entity and has the ability to affect those returns through power over the entity. Specifically, the Company controls an entity if the Company has all of the following: power over the entity (i.e. existing rights that give the Company the current ability to direct the relevant activities of the entity); exposure, or rights, to variable returns from involvement with the entity; and the ability to use power over the entity to affect its returns. Subsidiaries are consolidated from the acquisition date, which is the date on which the Company obtains control of the acquired entity. Where the Company's interest in a subsidiary is less than 100%, the Company recognizes a non-controlling interest. All intercompany balances, transactions, income, expenses and profits or losses have been eliminated on consolidation.
(ii) Unincorporated arrangements - Proportionate Share
The Company participates in unincorporated arrangements and has rights to its share of the undivided assets, liabilities, revenues and expenses of the properties, subject to the arrangements, rather than a right to a net return. All such amounts are measured in accordance with the terms of the arrangements, which is usually in proportion to the Company's interest in the assets, liabilities, revenues and expenses of the properties. These amounts are recorded in the Company's consolidated financial statements on the appropriate lines.
(d) Functional and presentation currency
The functional currency of the Company is the U.S. dollar. The presentation currency of the Company's consolidated financial statements is the U.S. dollar.
Transactions denominated in foreign currencies are translated into the entity's functional currency as follows:
• Monetary assets and liabilities are translated at the exchange rate in effect at the balance sheet date;
• Non-monetary assets and liabilities are translated at historical exchange rates prevailing at each transaction date;
• Deferred tax assets and liabilities recognized are translated at the exchange rate in effect at the balance sheet date with translation gains and losses recorded in income tax expense; and
• Revenues and expenses are translated at the average exchange rates throughout the reporting period, except depreciation, which is translated at the rates of exchange applicable to the related assets, and share-based compensation expense, which is translated at the rates of exchange applicable at the date of grant of the share- based compensation.
Exchange gains or losses on translation of transactions are included in the consolidated statements of earnings (loss). When a gain or loss on certain non-monetary items, such as financial assets at fair value through OCI ("FVTOCI"), is recognized in OCI, the translation differences are also recognized in OCI.
3. Summary of Material Accounting Policies
The accounting policies set out below have been applied consistently by the Company, for its subsidiaries, joint venture and associate in all periods presented in these consolidated financial statements.
(a) Financial instruments
The Company recognizes financial assets and financial liabilities on the date the Company becomes a party to the contractual provisions of the instruments. A financial asset is derecognized either when the Company has transferred substantially all the risks and rewards of ownership of the financial asset or when cash flows expire. A financial liability is derecognized when the obligation specified in the contract is discharged, cancelled or expired. Certain financial instruments are recorded at fair value in the consolidated balance sheets. Refer to note 21 on fair value measurements.
(i) Non-derivative financial instruments
Non-derivative financial instruments are recognized initially at fair value plus attributable transaction costs, where applicable for financial instruments not classified as fair value through profit or loss ("FVTPL"). Subsequent to initial recognition, non-derivative financial instruments are classified and measured as described below.
Financial assets at FVTPL
Cash and cash equivalents, restricted cash, short-term investments, bond fund investments and warrants are classified as financial assets at FVTPL and are measured at fair value. Cash equivalents are short-term investments with initial maturities of three months or less. Short-term investments have initial maturities of more than three months and less than 12 months. The unrealized gains or losses related to changes in fair value are reported in interest income, derivatives and other investment gains (losses) in the consolidated statements of earnings (loss).
Amortized cost
Trade and other receivables and fixed rate investments are classified as and measured at amortized cost using the effective interest rate method, less impairment losses, if any.
Financial assets at FVTOCI
The Company's investments in equity marketable securities are designated as financial assets at FVTOCI and are recorded at fair value on the trade date with directly attributable transaction costs included in the recorded amount. Subsequent changes in fair value are recognized in OCI.
Non-derivative financial liabilities
Accounts payable, accrued liabilities, senior notes, equipment loans, and borrowings under the credit facility are accounted for at amortized cost, using the effective interest rate method. The amortization of senior notes issue costs and equipment loans transaction costs are calculated using the effective interest rate method, and the amortization of credit facility issue costs is calculated on a straight-line basis over the term of the credit facility.
(ii) Non-hedge derivatives
The Company may hold derivative financial instruments to hedge its risk exposure to fluctuations of other currencies compared to the U.S. dollar, and fluctuations in commodity prices such as for gold, oil and fuel. All derivative financial instruments not designated in a hedge relationship that qualify for hedge accounting are classified as financial instruments at FVTPL. Derivative financial instruments at FVTPL, including embedded derivatives requiring separation from its host contract, are recorded in the consolidated balance sheets at fair value.
Changes in the estimated fair value of non-hedge derivatives at each reporting date are included in the consolidated statements of earnings (loss) as non-hedge derivative gain or loss.
Embedded derivatives in financial liabilities measured at amortized cost are separated from the host contract and accounted for separately if the economic characteristics and risks of the host contract and the embedded derivative are not closely related.
(iii) Hedge derivatives
The Company uses derivative financial instruments to hedge its exposure to exchange rate fluctuations on foreign currency denominated revenues, operating expenses and purchases of non-financial assets and its exposure to price fluctuations of consumable purchases.
The Company formally documents all relationships between hedging instruments and hedged items, as well as its risk management objectives and strategies for undertaking hedge transactions. This process includes linking all derivative hedging instruments to forecasted transactions. Hedge effectiveness is assessed based on the degree to which the cash flows from the derivative contracts are expected to offset the cash flows of the underlying transaction being hedged.
When a derivative is designated as a cash flow hedging instrument, the effective portion of changes in fair value is recognized in OCI, net of tax. For hedged items other than the purchase of non-financial assets, the amounts accumulated in OCI are reclassified to the consolidated statements of earnings (loss) when the underlying hedged transaction, identified at contract inception, affects profit or loss. When hedging a forecasted transaction that results in the recognition of a non-financial asset, the amounts accumulated in OCI are removed and added to the carrying amount of the non-financial asset.
Any ineffective portion of a hedge relationship is recognized immediately in the consolidated statements of earnings (loss). The Company has elected to exclude the time value component of options and the forward element of forward contracts from the hedging relationships, with changes in these amounts recorded in OCI and treated as a cost of hedging. For hedged items other than the purchase of non-financial assets, the cost of hedging amounts is reclassified to the consolidated statements of earnings (loss) when the underlying hedged transaction affects profit or loss. When hedging a forecasted transaction that results in the recognition of a non-financial asset, the cost of hedging is added to the carrying amount of the non-financial asset.
When derivative contracts designated as cash flow hedges are terminated, expired, sold or no longer qualify for hedge accounting, hedge accounting is discontinued prospectively. Any amounts recorded in OCI until the time the contracts do not qualify for hedge accounting remain in OCI. Amounts recognized in OCI are recognized in the consolidated statements of earnings (loss) in the period in which the underlying hedged transaction is completed. Gains or losses arising subsequent to the derivative contracts not qualifying for hedge accounting are recognized in the period incurred in the consolidated statements of earnings (loss).
If the forecasted transaction is no longer expected to occur, then the amounts accumulated in OCI are reclassified to the consolidated statements of earnings (loss) immediately.
(b) Inventories
Finished goods and ore stockpiles are measured at the lower of weighted average production cost and net realizable value. Finished goods includes both gold doré and gold in circuit. Mine supplies are measured at the lower of average purchase cost and net realizable value. Net realizable value is calculated as the difference between the estimated selling price and estimated costs to complete processing into a saleable form plus variable selling expenses.
Production costs include the cost of materials, labour, mine site production overheads and depreciation to the applicable stage of processing. Production overheads are allocated to inventory based on the normal capacity of production facilities.
The cost of ore stockpiles is increased based on the related current cost of production for the period, and decreases in stockpiles are charged to cost of sales using the weighted average cost per tonne. Stockpiles are segregated between current and non-current inventories in the consolidated balance sheets based on the period of planned usage.
The cost of inventory is reduced to net realizable value to reflect changes in grades, quantity or other economic factors and to reflect current intentions for the use of redundant or slow-moving items. Provisions for redundant and slow- moving supplies inventory are made by reference to specific items of inventory. The Company reverses write-downs when there is a subsequent increase in net realizable value and where the inventory is still on hand.
Spare parts, stand-by and servicing equipment held are generally classified as inventories. Major capital spare parts and stand-by equipment (insurance spares) are classified as a component of property, plant and equipment.
(c) Property, plant and equipment
Property, plant and equipment are measured at cost less accumulated depreciation and accumulated impairment charges.
The initial cost of an asset comprises its purchase or construction cost, any costs directly attributable to bringing the asset to a working condition for its intended use, the initial estimate of the asset retirement obligation ("ARO"), and for qualifying assets, borrowing costs.
The purchase price or the construction cost is the aggregate cash paid and the fair value of any other consideration given to acquire the asset.
Gains or losses on disposal of an item of property, plant and equipment are determined by comparing the proceeds from disposal with the carrying amount of property, plant and equipment, and are recognized in the consolidated statements of earnings (loss) in other expenses.
The cost of replacing part of an item of property, plant and equipment is recognized in the carrying amount of the item if it is probable that the future economic benefits embodied within the part will flow to the Company and its cost can be measured reliably. The carrying amount of the replaced part is de-recognized. Costs of the day-to-day servicing of property, plant and equipment are recognized in the consolidated statements of earnings (loss) as incurred.
Property, plant and equipment presented in the consolidated balance sheets represents the capitalized expenditures related to: construction in progress, mining properties, stripping costs, and plant and equipment, including corporate assets.
(i) Construction in progress
Upon determination of technical feasibility and commercial viability of extracting a mineral resource, the related exploration and evaluation assets (note 3(e)) are transferred to construction in progress costs. These amounts plus all subsequent mine development costs are capitalized. Costs are not depreciated until the project is ready for use as intended by management.
Mine construction costs include expenditures to develop new ore bodies, define further mineralization in existing ore bodies, and construct, install and complete infrastructure facilities.
Borrowing costs are capitalized and allocated specifically to qualifying assets when funds have been borrowed, either to specifically finance a project or for general borrowings during the period of construction.
Qualifying assets are defined as assets that require more than twelve months to be brought to the location and condition intended by management. Capitalization of borrowing costs ceases when such assets are ready for their intended use.
The date of transition from construction to production accounting is based on both qualitative and quantitative criteria such as substantial physical project completion, sustained level of mining, sustained level of processing activity, and passage of a reasonable period of time. Upon completion of mine construction activities (based on the determination of the commencement of production), costs are reclassified from construction in progress assets into the appropriate categories of property, plant and equipment.
Revenue from sales occurring from all production, including production from the commissioning stage, is recorded in the consolidated statements of earnings (loss).
(ii) Mining properties
Capitalized costs for evaluation on or adjacent to sites where the Company has mineral deposits, are classified as mining properties within property, plant and equipment.
(iii) Stripping costs
Costs associated with stripping activities in an open pit mine are expensed within cost of sales unless the stripping activity can be shown to improve access to further quantities of ore that will be mined in future periods, in which case, the stripping costs are capitalized to mining properties within property, plant and equipment. Furthermore, stripping costs are capitalized to inventory to the extent that the benefits of the stripping activity relate to gold production inventories or ore stockpiles.
(iv) Plant and equipment
Plant and equipment located at corporate locations includes the following categories of assets: furniture and equipment, computer equipment, software, scientific instruments and equipment, vehicles and leasehold improvements and at the mine site includes land and buildings, plant equipment, capital spares, and other equipment.
(d) Depreciation
Effective from the point an asset is available for its intended use, property, plant and equipment are depreciated using either the straight-line or units-of-production methods over the shorter of the estimated economic life of the asset or the mining operation. Depreciation is determined based on the method which best represents the use of the assets.
The reserve and resource estimates for each mining operation are the prime determinants of the life of a mine. In general, when the useful life of property, plant and equipment is akin to the life of the mining operation and the ore body's mineralization is reasonably well defined, the asset is depreciated on a units-of-production basis over its proven and probable mineral reserves. Non-reserve material may be included in depreciation calculations in limited circumstances where there is a high degree of confidence in its economic extraction. The Company evaluates the estimate of mineral reserves and resources at least on an annual basis and adjusts the units-of-production method calculation prospectively. When property, plant and equipment are depreciated on a straight-line basis, the useful life of the mining operation is determined based on the most recent life of mine ("LOM") plan. LOM plans are typically developed annually and are based on management's current best estimates of optimized mine and processing plans, future operating costs and the assessment of capital expenditures of a mine site.
Estimated useful lives normally vary from three to fifteen years for items of plant and equipment to a maximum of twenty years for buildings.
Amounts related to expected economic conversions of resources to reserves recorded in an asset acquisition or business combination are not depreciated until resources are converted into reserves. Amounts related to capitalized costs of exploration and evaluation assets and construction in progress are not depreciated as the assets are not available for use.
Capitalized stripping costs are depreciated over the reserves that directly benefit from the specific stripping activity using the units-of-production method.
Capitalized borrowing costs are depreciated over the useful life of the related asset.
Residual values, useful lives and depreciation methods are reviewed at least annually and adjusted if appropriate. The impact of changes to the estimated useful lives, depreciation method or residual values is accounted for prospectively.
(e) Mineral exploration and evaluation expenditures
Exploration activities relate to the collection of exploration data which consists of geological, geophysical, geochemical, sampling, drilling, trenching, analytical test work, assaying, mineralogical, metallurgical, and other similar information that is derived from activities undertaken to locate, investigate, define or delineate a mineral prospect or mineral deposit. Mineral exploration costs are expensed as incurred.
Evaluation costs are capitalized and relate to activities to evaluate the potential technical feasibility and commercial viability of extracting a mineral resource on sites where the Company does not have mineral deposits already being mined or constructed. The technical feasibility and commercial viability is based on management's evaluation of the geological properties of an ore body based on information obtained through evaluation activities, including metallurgical testing, resource and reserve estimates and economic assessment whether the ore body can be mined economically. Exploration properties acquired through asset acquisitions are also recognized as exploration and evaluation assets.
(f) Assets and liabilities held for sale and discontinued operations
Non-current assets and disposal groups are classified as held for sale if their carrying value will be recovered principally through a sale transaction rather than through continuing use. The criteria for held for sale classification are regarded as met only when the sale is highly probable and the asset or disposal group is available for immediate sale in its present condition. Actions required to complete the sale should indicate that it is unlikely that significant changes to the sale will be made or that the decision to sell will be withdrawn. Management must be committed to the plan to sell the asset or disposal group and the sale expected to be completed within one year from the date of the classification.
Non-current assets and disposal groups classified as held for sale are measured at the lower of their carrying amount and fair value less costs to sell ("FVLCS"). If the FVLCS is lower than the carrying amount, an impairment loss is recognized in the consolidated statements of earnings (loss). Non-current assets are not depreciated or amortized once classified as held for sale. Equity accounting ceases for the investment in associate and incorporated joint venture once classified as held for sale. Assets and liabilities classified as held for sale are presented separately as current items in the Company's consolidated balance sheets.
A disposal group qualifies as a discontinued operation if it is a component of the Company that either has been disposed of, or is classified as held for sale, and: (i) represents a separate major line of business or geographical area of operations; (ii) is part of a single coordinated plan to dispose of a separate major line of business or geographical area of operations; or (iii) is a subsidiary acquired exclusively with a view to resale. A component of the Company
comprises an operation and cash flows that can be clearly distinguished, operationally and for financial reporting purposes, from the rest of the Company. Further, a discontinued operation must be a component of the Company that was a cash generating unit ("CGU") while being held for use.
Discontinued operations are excluded from the results of continuing operations and are presented as a single amount as profit or loss after tax from discontinued operations in the consolidated statements of earnings (loss).
(g) Impairment and reversal of impairment
(i) Financial assets
The Company recognizes a loss allowance for expected credit losses on financial assets that are measured at amortized cost. At each reporting date, the Company measures the loss allowance for the financial asset at an amount equal to the lifetime expected credit losses if the credit risk on the financial asset has increased significantly since initial recognition. If at the reporting date, the credit risk on the financial asset has not increased significantly since initial recognition, the Company measures the loss allowance for the financial asset at an amount equal to twelve month expected credit losses. Impairment losses on financial assets carried at amortized cost are reversed in subsequent periods if the financial asset is no longer credit-impaired and the improvement can be related objectively to an event occurring after the impairment was recognized.
(ii) Non-financial assets
The carrying amounts of the Company's non-current assets, including property, plant and equipment and exploration and evaluation assets, are reviewed at each reporting date to determine whether there is any indication of impairment. If any such indicator exists, the Company performs an impairment test.
An impairment test requires the Company to determine the recoverable amount of an asset or group of assets. For non-current assets, including property, plant and equipment and exploration and evaluation assets, the recoverable amount is determined for an individual asset, unless the asset does not generate cash inflows that are largely independent of those from other assets or groups of assets. If this is the case, the individual assets are grouped together into a CGU for impairment testing purposes. A CGU for impairment testing is typically considered to be an individual mine site or a development project.
The recoverable amount is determined as the higher of the CGU's fair value less costs of disposal ("FVLCD") and value in use ("VIU"). If the carrying amount of the asset or CGU exceeds its recoverable amount, an impairment charge is recorded to the other long-lived assets in the CGU on a pro rata basis.
An assessment is made at each reporting date to determine whether there is an indication that previously recognized impairment losses may no longer exist or may be reduced. If it has been determined that the impairment has reversed, the carrying amount of the asset is increased to its recoverable amount to a maximum of the carrying amount that would have been determined had no impairment charge been recognized in prior periods. An impairment charge reversal is recognized in the consolidated statements of earnings (loss). Impairment charges recognized in relation to goodwill are not reversed for subsequent increases in a CGU's recoverable amount.
In the absence of market related comparative information, the FVLCD is generally determined based on the present value of estimated future cash flows from each long-lived asset or CGU. The significant assumptions used in determining the FVLCD for the CGUs are typically LOM production profiles, long-term commodity prices, reserves and resources, discount rates, foreign exchange rates, values of known reserves and resources not included in the LOM (i.e. un-modeled mineralization), operating and capital expenditures, net asset value ("NAV") multiples and expected commencement of production for exploration and evaluation and development projects. Management's assumptions and estimates of future cash flows are subject to risks and uncertainties, particularly in market conditions where higher volatility exists, and may be partially or totally outside of the Company's control. Therefore, it is reasonably possible that changes could occur with evolving economic conditions, which may affect the recoverability of the Company's long-lived assets. If the Company fails to achieve its valuation assumptions or if any of its long-lived assets or CGUs experience a decline in their fair value, this may result in an impairment charge in future periods, which would reduce the Company's earnings.
(h) Asset retirement obligations
The Company records legal and constructive obligations required to restore locations in the period in which the obligation is incurred with a corresponding increase in the carrying amount of the related property, plant and equipment, and if the effect of discounting is material, measures it at its present value. For locations where mining activities have ceased, changes to obligations are charged directly to the consolidated statements of earnings (loss). The obligation is generally considered to have been incurred when mine assets are constructed or the ground environment is disturbed at the production location. The discounted liability is adjusted at the end of each period to reflect the passage of time, based on a risk-free discount rate that reflects current market assessments, and changes in the estimated future cash flows underlying the obligation.
The Company also estimates the timing of the outlays, which are subject to change depending on continued operation or newly discovered reserves.
The periodic unwinding of the discount is recognized in earnings as accretion expense included in finance costs in the consolidated statements of earnings (loss). Additional disturbances or changes in restoration costs or in discount rates are recognized as changes to the corresponding assets and ARO when they occur. Environmental costs at operating mines, as well as changes to estimated costs and discount rates for closed mines, are charged to earnings in the period during which they occur.
(i) Other provisions
Provisions are recognized when a legal or constructive present obligation exists as a result of a past event, for which it is probable that an outflow of economic resources will be required to settle the obligation, and a reliable estimate can be made of the amount of the obligation.
Provisions are reviewed at the end of each reporting period and adjusted to reflect management's current best estimate of the expenditure required to settle the present obligation at the end of the reporting period. If it is no longer probable that an outflow of resources embodying economic benefits will be required to settle the obligation, the provision is reversed. Provisions are reduced by actual expenditures in respect of the obligation for which the provision was originally recognized.
Certain conditions may exist as of the date of the consolidated financial statements, which may result in a loss to the Company, but which will only be resolved when one or more future events will occur or fail to occur. If the assessment of a contingency determines that a loss is probable, and the amount can be reliably estimated, then a provision is recorded. When a contingent loss is not probable but is reasonably possible, then the contingent liability is disclosed in the consolidated financial statements.
(j) Income taxes
(i) Current income tax
Current income tax assets and liabilities for the current and prior periods are measured at the amount expected to be recovered from or paid to the taxation authorities. The tax rates and tax laws used to compute the amount are those that are enacted or substantively enacted by the balance sheet date.
Current income tax assets and current income tax liabilities are only offset if a legally enforceable right exists to set off the amounts, and the Company intends to settle on a net basis or to realize the asset and settle the liability simultaneously.
Current income taxes related to items recognized directly in equity are recognized directly in equity.
(ii) Deferred income tax
Deferred income tax is recognized in respect of temporary differences between the carrying amounts of assets and liabilities in the consolidated balance sheets and tax bases.
Deferred income tax liabilities are recognized for all taxable temporary differences, except:
• Where the deferred income tax liability arises from the initial recognition of goodwill or of an asset or liability in a transaction that is not a business combination and, at the time of the transaction, affects neither accounting profit nor taxable profit (tax loss); and
• In respect of taxable temporary differences associated with investments in subsidiaries, associate and joint venture, where the timing of the reversal of the temporary differences can be controlled by the parent or the joint venture and it is probable that the temporary differences will not reverse in the foreseeable future.
Deferred income tax assets are recognized for all deductible temporary differences, carry forward of unused tax credits and unused tax losses, to the extent that it is probable that taxable profit will be available against which the deductible temporary differences, the carry forward of unused tax credits and unused tax losses can be used, except:
• When the temporary difference results from the initial recognition of an asset or liability in a transaction that is not a business combination and, at the time of the transaction, affects neither accounting profit nor taxable profit (tax loss); and
• In respect of deductible temporary differences associated with investments in subsidiaries, associate and joint venture, deferred income tax assets are recognized only to the extent that it is probable that the temporary differences will reverse in the foreseeable future and taxable profit will be available against which the temporary differences can be used.
The carrying amount of deferred income tax assets is reviewed at each balance sheet date and reduced to the extent that it is no longer probable that sufficient taxable profit will be available to allow all or part of the deferred income tax asset to be used. Unrecognized deferred income tax assets are reassessed at each balance sheet date and are recognized to the extent that it has become probable that future taxable profit will be available to allow the deferred tax asset to be recovered.
A translation gain or loss may arise for deferred income tax purposes where the local tax currency is not the same as the functional currency for non-monetary assets. A deferred tax asset or liability is recognized on the difference between the carrying amount for accounting purposes (which reflects the historical cost in the entity's functional currency) and the underlying tax basis (which reflects the current local tax cost, translated into the functional currency using the current foreign exchange rate). The translation gain or loss is recorded in income taxes in the consolidated statements of earnings (loss).
Deferred income tax assets and liabilities are measured at the tax rates that are expected to apply to the year when the asset is expected to be realized or the liability settled, based on tax rates (and tax laws) that have been enacted or substantively enacted at the balance sheet date.
Deferred income taxes related to items recognized directly in equity are recognized directly in equity.
Deferred income tax assets and deferred income tax liabilities are offset, if a legally enforceable right exists to set off current income tax assets against current income tax liabilities and the deferred income taxes relate to the same taxable entity and the same taxation authority.
There is no certainty that future income tax rates will be consistent with current estimates.
(k) Earnings (loss) per share
The Company presents basic and diluted earnings (loss) per share data for its common shares. Basic earnings (loss) per share are calculated by dividing earnings (loss) attributable to equity holders by the weighted average number of common shares outstanding during the period. Diluted earnings per share is calculated using the treasury method for stock options and warrants, and the if converted method for equity settled share units. The treasury method assumes that outstanding stock options and warrants with an average exercise price below the market price of the underlying shares are assumed to be exercised and the assumed proceeds are used to purchase common shares of the Company from treasury at the average market price of the common shares for the period. The if converted method assumes that all equity settled share units have been converted in determining diluted earnings (loss) per share if they are in-the- money, except where such conversion would be anti-dilutive.
(l) Share-based compensation
The Company has the following share-based compensation plans with related costs included in general and administrative expenses.
(i) Share incentive plan
The Company has a number of equity-settled share-based compensation plans in respect to its directors and employees. Share-based compensation costs are measured based on the grant date fair value of the equity-settled instruments and recognized upon grant date over the related service period in the consolidated statements of earnings (loss) and credited to contributed surplus within shareholders' equity. The Company uses the graded vesting method for attributing share option expense over the vesting period.
The grant date fair value is based on the underlying market price of the common shares of the Company taking into account the terms and conditions upon which those equity-settled instruments were granted. The fair value of equity-settled instruments granted is estimated using the Black-Scholes model or other appropriate method and assumptions at grant date. Equity-settled awards are not re-measured subsequent to the initial grant date.
Determination of the grant date fair value requires management estimates such as risk-free interest rate, volatility and weighted average expected life. Share option expense incorporates an expected forfeiture rate which is estimated based on historical forfeiture rates and expectations of future forfeiture rates. The Company makes adjustments if the actual forfeiture rate differs from the expected rate.
The weighted average grant date fair value is the basis for which share-based compensation is recognized in earnings.
Upon exercise of options and/or issuance of shares, consideration paid by the holder, as well as the grant date fair value of the equity-settled instruments, are transferred to common shares.
(ii) Share purchase plan
The Company has adopted a share purchase plan where the Company contributes towards the purchase of shares on the open market. The Company's contribution vests on December 31 of each year and is charged to earnings in the year of contribution.
(m) Revenue recognition
Revenues include sales of gold and by-products.
The Company recognizes revenue when it transfers control of a product to the customer. The principal activity from which the Company generates its revenue is the sale of gold to third parties. Delivery of the gold is considered to be the only performance obligation. Revenue is measured based on the consideration specified in the contract with the customer.
(n) Deferred revenue
Deferred revenue is recognized in the consolidated balance sheets when a cash prepayment is received from a customer prior to the sale of gold. Revenue is subsequently recognized in the consolidated statements of earnings (loss) when control has been transferred to the customer.
The Company recognizes the time value of money, where there is a significant financing component and the period between the payment by the customer and the transfer of the contracted goods exceeds one year. Interest expense on deferred revenue is recognized in finance costs in the consolidated statements of earnings (loss), unless capitalized to construction in progress in accordance with the Company's policy on capitalized borrowing costs.
The Company determines the current portion of deferred revenue based on quantities anticipated to be delivered over the next twelve months.
(o) Leases
At inception of a contract, the Company assesses whether a contract is, or contains, a lease by determining whether the contract conveys the right to control the use of an identified asset for a period of time in exchange for consideration. A right-of-use ("ROU") asset and lease liability is recognized at the lease commencement date. The ROU asset is initially measured at cost, which comprises the initial amount of the lease liability adjusted for any lease payments made at or before the commencement date, plus any initial direct costs incurred, less any lease incentives received.
The ROU asset is subsequently depreciated using the straight-line method from the commencement date to the end of the lease term, including periods covered by an option to extend the lease if the Company is reasonably certain to exercise that option. In addition, the ROU asset is periodically reduced by impairment losses, if any, and adjusted for certain remeasurements of the lease liability.
The lease liability is initially measured at the present value of the lease payments that are not paid at the commencement date. The lease payments are discounted using the implicit interest rate in the lease. Variable lease payments that do not depend on an index or rate are not included in the measurement of the lease liability. If the rate cannot be readily determined, the Company's incremental rate of borrowing is used. Generally, the Company uses its incremental borrowing rate as the discount rate.
The lease liability is subsequently measured at amortized cost using the effective interest method whereby the balance is increased by interest expense and decreased by lease payments. It is remeasured when there is a change in future lease payments arising from a change in an index or rate, if there is a change in the Company's estimate of the amount expected to be payable under a residual value guarantee, or if the Company changes its assessment of whether it will exercise a purchase, extension or termination option.
The Company presents ROU assets within property, plant and equipment.
The Company has elected not to recognize ROU assets and lease liabilities for leases that have a lease term of 12 months or less and leases of low-value assets. The Company recognizes the lease payments associated with these leases as an expense on a straight-line basis over the lease term.
(p) Segmented information
The Company's operating segments are those operations whose operating results are reviewed by the Company's chief operating decision maker ("CODM") to make resource allocation decisions and assess their performance. The Company's CODM is its executive leadership team. Operating segments whose revenues, net earnings or losses or assets exceed 10% of the total consolidated revenues, net earnings or losses or assets, are reportable segments.
In order to determine the reportable operating segments, various factors are considered, including geographical location and managerial structure. It was determined that the Company's gold segment is divided into reportable geographic segments. The Company's other reportable segments have been determined to be exploration and evaluation and development and corporate operating segments, which includes royalty interests and investments in associate and joint venture.
(q) Significant accounting judgments, estimates and assumptions
The preparation of consolidated financial statements in conformity with IFRS requires management to make judgments, estimates and assumptions that affect the reported amounts of assets, liabilities and contingent liabilities at the date of the consolidated financial statements and reported amounts of revenues and expenses during the reporting period. Estimates and assumptions are continuously evaluated and are based on management's experience and other factors, including expectations of future events that are believed to be reasonable under the circumstances.
Assumptions about the future and other major sources of estimation uncertainty at the end of the reporting period have a significant risk of resulting in a material adjustment to the carrying amounts of assets and liabilities, within the next financial year. The most significant judgments and sources of estimation uncertainty that the Company believes could have a significant impact on the amounts recognized in its consolidated financial statements are described below.
(i) Mineral reserves and resources
Key sources of estimation uncertainty
Mineral reserves and resources have been estimated by qualified persons as defined in accordance with Canadian Securities Administrators' National Instrument 43-101 Standards of Disclosure for Mineral Projects requirements. Mineral reserve and resource estimates include numerous uncertainties and depend heavily on geological interpretations and statistical inferences drawn from drilling and other data, and require estimates of the future price for the commodity and the future cost of operations. The mineral reserve and resource estimates are subject to uncertainty and actual results may vary from these estimates. Results from drilling, testing and production, as well as material changes in metal prices and operating costs subsequent to the date of an estimate, may justify revision of such estimate.
A number of accounting estimates, as described in the relevant accounting policy notes, are impacted by the mineral reserve and resource estimates, which form the basis of the Company's LOM plans:
• Capitalization and depreciation of stripping costs (note 3(c)(iii));
• Determination of the useful life of property, plant and equipment and measurement of the depreciation expense (note 3(d));
• Exploration and evaluation of mineral resources and determination of technical feasibility and commercial viability (note 3(e)). The application of the Company's accounting policy for exploration and evaluation expenditures requires judgment in determining whether future economic benefits may be realized, which are based on assumptions about future events and circumstances;
• Impairment and reversal of impairment analysis of non-financial assets including evaluation of estimated future cash flows of CGUs (note 3(g)(ii)); and
• Estimates of timing of cash outlays for AROs (note 3(h)).
(ii) Impairment and reversal of impairment assessment of non-financial assets Key sources of estimation uncertainty
Management's assumptions and estimates of future cash flows used in the Company's impairment assessment of non-financial assets are subject to risk and uncertainties, particularly in market conditions where higher volatility exists, and may be partially or totally outside of the Company's control.
If an indication of impairment or reversal of a previous impairment charge exists, or if an exploration and evaluation asset is determined to be technically feasible and commercially viable, an estimate of a CGU's recoverable amount is calculated. The recoverable amount is based on the higher of FVLCD and VIU using a discounted cash flow methodology taking into account assumptions that would be made by market participants, unless there is a market price available based on a recent purchase or sale of a mine. Cash flows are for periods up to the date that mining is expected to cease which depends on a number of variables including recoverable mineral reserves and resources, expansion plans and the forecasted selling prices for such production (note 28).
In estimating the net realizable value of inventories, a significant estimate is made regarding the quantities of saleable metals included in stockpiles based on the quantities of ore, the grade of ore, the estimated recovery percentage, cost to complete and long-term commodity prices. There can be no assurance that actual quantities will not differ significantly from estimates used (note 10).
Judgments
Judgement is required in determining whether an indicator of impairment or impairment reversal exists at period end. Both internal and external sources of information are required to be considered when determining the presence of an impairment indicator or an indicator of reversal of a previous impairment. External sources of information the Company considers include changes in the market, economic and legal environment in which the Company operates that are not within its control and are expected to affect the recoverable amount of CGUs. Internal sources of information the Company considers include the manner in which mineral properties, plant and equipment are being used or are expected to be used and measures of economic performance of the assets.
The primary external factors considered are changes in forecast metal prices, changes in laws and regulations and the Company's market capitalization relative to its net asset carrying amount. The primary internal factors considered are the Company's current mine performance against expectations, changes in mineral reserves and resources, and life of mine plans.
Judgment is required to determine whether there are indications that the carrying amount of an exploration project is unlikely to be recovered in full from the successful development or the sale of the project.
(iii) Derivative financial instruments Judgments
Judgment is required to determine if an effective hedging relationship exists throughout the financial reporting period for derivative financial instruments classified as cash flow hedges. Management assesses the relationships on an ongoing basis to determine if hedge accounting is appropriate.
Key sources of estimation uncertainty
The Company monitors on a regular basis its hedge position for its risk exposure to fluctuations of the U.S. dollar compared to other currencies, and fluctuations in prices of commodities such as oil and gold. Forecasts are based on estimates of future transactions. For its derivative contracts, valuations are based on forward rates considering the market price, rate of interest and volatility, and take into account the credit risk of the financial instrument. Refer to note 20 for more detailed information and sensitivity analyses based on changes in currencies and commodity prices.
(iv) Provisions and recognition of a liability for loss contingencies Judgments
Judgments are required to determine if a present obligation exists at the end of the reporting period by considering all available evidence, including the opinion of experts. The most significant provisions that require judgment to determine if a present obligation exists are contingent losses related to claims and AROs. This includes an assessment of how to account for obligations based on the most recent closure plans and environmental regulations.
Key sources of estimation uncertainty
Provisions related to present obligations, including AROs, are management's best estimate of the amount of probable future outflow, expected timing of payments, and discount rates if the effect of discounting is material. Refer to note 14(a).
(v) Deferred revenue Judgments
In assessing the accounting for the Company's forward gold sale arrangement (note 19), the Company used judgment to determine that the upfront cash prepayment received was not a financial liability as the sale is expected to be settled through the delivery of gold, which is a non-financial item rather than through cash or other financial assets. The Company settled these arrangements through its own production during 2025.
4. Adoption of New Accounting Standards and New Accounting Standards Issued but Not Yet Effective
(a) Adoption of new accounting standards
The following new accounting pronouncement is effective for annual periods beginning on or after January 1, 2025 and has been incorporated into the consolidated interim financial statements:
• Lack of exchangeability (Amendments to IAS 21) The adoption of this pronouncement did not have a significant impact.
(b) New accounting standards issued but not effective
Certain pronouncements have been issued by the IASB that are mandatory for accounting periods after December 31, 2025:
• Amendments to the Classification and Measurement of Financial Instruments (Amendments to IFRS 9 and IFRS 7) which is effective for periods on or after January 1, 2026.
• Power Purchase Agreement (Amendments to IFRS 9) effective for periods on or after January 1, 2026.
• Annual Improvements to IFRS Accounting Standards (includes Amendments to IFRS 1, IFRS 7, IFRS 9, IFRS 10, and IAS 7) effective for periods on or after January 1, 2026
• Hyperinflationary presentation currency (Amendments to IAS 21) effective for periods on or after January 1, 2027
• Presentation and Disclosure in Financial Statements (IFRS 18) which is effective for periods on or after January 1, 2027.
• Sale or Contribution of Assets Between an Investor and its Associate or Joint Venture (Amendments to IFRS 10 and IAS 28) amendments were to be applied prospectively for annual periods beginning on or after January 1, 2016, however, on December 17, 2015 the IASB decided to defer the effective date for these amendments indefinitely. Early adoption is still permitted.
The Company does not intend to early adopt these standards. Pronouncements related to IFRS 1, IFRS 9, IFRS 7, IFRS 10, IAS 7, IAS 21 and IAS 28 are not expected to have a significant impact on the Company's consolidated financial statements upon adoption. The impact of IFRS 18 on the Company's consolidated financial statements includes revised presentation of the Company's statement of earnings (loss) including new categories and subtotals and the addition of disclosure reconciling and describing management performance measures.
5. Acquisitions
| 2025 | 2024 | |||||||||||
| Norther Superior | Mines D'Or Orbec | Total | Vanstar | |||||||||
| Resources Inc. | Inc. | |||||||||||
| Assets acquired and liabilities assumed | ||||||||||||
| Exploration and evaluation assets | $ | 330.1 | $ | 15.2 | $ | 345.3 | $ | 29.3 | ||||
| Current Assets | 3.3 | 1.0 | 4.3 | 0.3 | ||||||||
| Current Liabilities | (1.2 | ) | (1.6 | ) | (2.8 | ) | - | |||||
| Non Current Liabilities | (0.9 | ) | - | (0.9 | ) | - | ||||||
| $ | 331.3 | $ | 14.6 | $ | 345.9 | $ | 29.6 | |||||
| Consideration transferred | ||||||||||||
| Share consideration | $ | 304.0 | $ | 7.4 | $ | 311.4 | $ | 28.2 | ||||
| Cash and cash equivalents | 25.0 | 5.8 | 30.8 | (0.1 | ) | |||||||
| Existing Interest in Mines D'Or Orbec | - | 1.0 | 1.0 | - | ||||||||
| $ | 329.0 | $ | 14.2 | $ | 343.2 | $ | 28.1 | |||||
| Transaction costs | 2.3 | 0.4 | 2.7 | 1.5 | ||||||||
| $ | 331.3 | $ | 14.6 | $ | 345.9 | $ | 29.6 |
Northern Superior Resources Inc.
On December 19, 2025, the Company acquired all of the issued and outstanding shares of Northern Superior Resources Inc. ("Northern Superior") for total consideration of approximately $329.0 million which included 18.1 million common shares of the Company and cash of $25.0 million. The purchase price reflects the fair value of consideration at the acquisition date, including the Company's share consideration, measured using the Company's closing share price on the acquisition date, and the cash consideration described above.
The acquisition did not meet the IFRS definition of a business combination as the identifiable assets acquired are exploration stage properties with no identified economically recoverable reserves. Consequently, the transaction was recorded as an asset acquisition.
The total purchase price was allocated to the assets acquired and the liabilities assumed based on the fair value of the total consideration transferred at the closing date of the acquisition.
The Company also incurred transaction costs of $2.3 million which were capitalized to the exploration and evaluation assets acquired
Mines D'Or Orbec Inc.
On December 22, 2025, the Company acquired all of the issued and outstanding shares of Mines D'Or Orbec Inc. ("Orbec") for total consideration of approximately $14.2 million which included 0.4 million common shares of the Company and cash of $5.8 million.
The acquisition did not meet the IFRS definition of a business combination as the asset acquired is an exploration stage property with no identified economically recoverable reserves. Consequently, the transaction was recorded as an asset acquisition.
The total purchase price was allocated to the assets acquired and the liabilities assumed based on the fair value of the total consideration transferred at the closing date of the acquisition.
The Company also incurred transaction costs of $0.4 which were capitalized to the exploration and evaluation assets acquired.
Vanstar
On February 13, 2024, the Company acquired all of the issued and outstanding common shares of Vanstar for consideration of approximately 12.0 million common shares of the Company. Vanstar owned a 25% interest in the Nelligan Gold Project ("Nelligan") in Quebec, Canada. With the acquisition of Vanstar complete, the Company owns a 100% interest in Nelligan. In addition, the Company acquired a 1% NSR royalty held by Vanstar on select claims of Nelligan that were cancelled, as well as other early stage exploration properties in Northern Quebec. The total purchase price amounted to $29.6 million, which included transaction costs of $1.5 million, and was net of cash and cash equivalents acquired of $0.1 million. The transaction costs included 0.2 million common shares, with a value of $0.4 million, issued for professional services.
The acquisition did not meet the IFRS definition of a business combination as the primary asset is an exploration stage property with no identified economically recoverable reserves. Consequently, the transaction was recorded as an asset acquisition.
The total purchase price was allocated to the assets acquired and the liabilities assumed based on the fair value of the total consideration transferred at the closing date of the acquisition.
6. Assets and Liabilities Held for Sale
The Company is advancing a process to sell its exploration projects in Mali. During September 2025 the sale of these projects became highly probable to be completed in the next 12 months and therefore the underlying assets have been classified as held for sale. The Company has recorded an adjustment to the value of the assets to reflect the best estimate of consideration to be received in exchange for the Malian assets.
7. Unincorporated Arrangement and Sumitomo Metal Mining Co., Ltd. ("SMM") Funding Arrangement
The Company has a 70% interest in Côté Gold through, an unincorporated joint venture ("UJV") formed with SMM to construct and operate the Côté Gold mine. The UJV is governed by the Côté Gold Joint Venture Agreement ("UJV agreement"). The UJV agreement gives the Company and SMM interests and obligations in the underlying assets, liabilities, revenues and expenses.
On December 19, 2022, the Company announced it had entered into an amendment of the UJV agreement with SMM. Under the amended UJV agreement, commencing in January 2023, SMM contributed $250.0 million of the Company's funding obligations to Côté Gold. As a result of SMM funding such amounts, the Company transferred 9.7% of its interest in Côté Gold to SMM (the "Transferred Interests"). SMM did not make any further contributions on behalf of the Company.
On November 30, 2024, the Company exercised its right to repurchase the Transferred Interests ("Repurchase Option"), which returned the Company to its full 70% interest in Côté Gold. The final purchase price for the Repurchase Option was $377.7 million.
The total payment of the repurchase also included a repurchase option fee accrued during 2023 of $23.7 million. Commencing in 2024, the fee was payable in cash on a quarterly basis.
The repurchase option liability was accounted for under IFRS 15 and control was not deemed to have passed to SMM due to the Company's right to exercise the Repurchase Option. As a result, the Company continued to account for a 70% interest in the assets and liabilities in the UJV as the Transferred Interest was not recorded as a sale.
Up to the achievement of Commercial Production on September 1, 2024, 60.3% of revenue and expenses are proportionately consolidated and 9.7% of revenue and expenses are included in interest income, derivatives, and other investment gains (losses) (note 31) in the consolidated statements of earnings (loss), resulting in net income including 70% of the Côté Gold UJV net income. Subsequent to November 30, 2024, 70% of revenue and expenses are proportionately consolidated. Net cash from (used in) operating activities is included at 60.3% in the consolidated statements of cash flows up to the repurchase (November 30, 2024), and is subsequently included at 70%.
The Côté repurchase option liability as at December 31, 2025 consists of:
| December 31, | December 31, | ||||||
| Notes | 2025 | 2024 | |||||
| Repurchase price: | |||||||
| Balance, beginning of the year | $ | - | $ | 350.8 | |||
| Incremental funding by SMM due to increased ownership | - | 46.9 | |||||
| 9.7% pre-Commercial Production gold received by SMM | 31 | - | (18.4 | ) | |||
| Other | - | (1.6 | ) | ||||
| Repurchase of Transferred Interests | - | (377.7 | ) | ||||
| Balance, end of the year | - | - | |||||
| Fees and balances not included in repurchase price: | |||||||
| Balance, beginning of the year | - | (5.5 | ) | ||||
| Repurchase option fee accrued1 | 30 | - | 32.7 | ||||
| Repurchase option fee paid1 | - | (32.7 | ) | ||||
| Deferred cost on waiver of operator fee | - | (2.0 | ) | ||||
| Amortization of deferred operator fee | - | 7.5 | |||||
| Balance, end of the year | $ | - | $ | - | |||
| Côté repurchase option liability | $ | - | $ | - |
1. Repurchase option fees of $17.5 million were capitalized to Côté Gold construction in progress during the year ended December 31, 2024. At August 1, 2024, the repurchase option fees were included in finance costs (note 30). Commencing in 2024, the repurchase option fee was paid quarterly.
8. Restricted Cash
As at December 31, 2025, the Company had long-term restricted cash of XOF 38.0 billion (December 31, 2025 - $68 million; December 31, 2024 - XOF 34.6 billion, $54.6 million) in support of environmental closure costs obligations related to the Essakane mine and $nil (December 31, 2024 - $11.0 million) posted as cash collateral for a surety bond issued for guarantee of certain environmental closure cost obligations related to the Westwood division and the Côté Gold mine. Additionally, the Company has posted CAD$4.1 million (December 31, 2025 - $3.0 million; December 31, 2024 - CAD$4.1 million, $2.8 million) as security for certain environmental closure cost obligations at the Westwood division. The XOF currency, also referred to as the West African CFA franc, is issued by the Central Bank of West African States (BCEAO) and is the denomination of the long-term restricted cash related to the Essakane mine.
9. Receivables and Other Current Assets
| Notes | December 31, | December 31, | |||||
| 2025 | 2024 | ||||||
| Government receivables and investments | $ | 56.8 | $ | 26.7 | |||
| Gold receivables | 0.2 | 3.1 | |||||
| Other receivables | 3.9 | 4.9 | |||||
| Total receivables | 60.9 | 34.7 | |||||
| Short-term investments | 1.0 | 1.0 | |||||
| Prepaid expenses | 15.4 | 13.2 | |||||
| Hedge derivatives | 20(b)(i) | 2.3 | - | ||||
| $ | 79.6 | $ | 48.9 |
Government receivables and investments relate to Harmonized Sales Taxes in Canada, value added taxes ("VAT") in Burkina Faso and interest-bearing Government of Burkina Faso Bonds that were obtained through the securitization of a portion of the VAT receivable. $67.8 million (December 31, 2024 - $66.3 million) of the VAT receivable is classified as non- current and is net of a provision of $11.4 million (December 31, 2024 - $5.8 million) as the Company does not expect to recover these amounts within 12 months due to delays in receiving the refunds (note 13).
10. Inventories
| December 31, | December 31, | |||||
| 2025 | 2024 | |||||
| Finished goods | $ | 53.1 | $ | 56.5 | ||
| Ore stockpiles | 125.3 | 50.8 | ||||
| Mine supplies | 198.6 | 164.6 | ||||
| 377.0 | 271.9 | |||||
| Non-current ore stockpiles | 194.8 | 153.0 | ||||
| $ | 571.8 | $ | 424.9 |
11. Property, Plant and Equipment
| Construction | Mining | Plant and | Right-of-use | Total | |||||||||||
| in progress | properties | equipment | assets1 | ||||||||||||
| Cost | |||||||||||||||
| Balance, January 1, 2024 | $ | 2,409.4 | $ | 2,692.9 | $ | 1,554.6 | $ | 139.0 | $ | 6,795.9 | |||||
| Additions | 320.0 | 253.4 | 71.0 | 34.8 | 679.2 | ||||||||||
| Changes in asset retirement obligations | - | (21.4 | ) | - | - | (21.4 | ) | ||||||||
| Disposals/derecognition | - | - | (41.7 | ) | (8.6 | ) | (50.3 | ) | |||||||
| Transfers of Côté Gold Construction in progress | (2,367.1 | ) | 1,098.8 | 1,268.3 | - | - | |||||||||
| Transfers within property, plant and equipment | (254.7 | ) | 96.1 | 158.9 | (0.3 | ) | - | ||||||||
| Balance, December 31, 2024 | $ | 107.6 | $ | 4,119.8 | $ | 3,011.1 | $ | 164.9 | $ | 7,403.4 | |||||
| Additions | 123.2 | 123.6 | 106.5 | 12.8 | 366.1 | ||||||||||
| Changes in asset retirement obligations | - | 8.7 | - | - | 8.7 | ||||||||||
| Disposals/derecognition | - | - | (34.2 | ) | (4.4 | ) | (38.6 | ) | |||||||
| Transfers within property, plant and equipment | (35.6 | ) | 28.4 | 10.6 | (3.4 | ) | - | ||||||||
| Balance, December 31, 2025 | $ | 195.2 | $ | 4,280.5 | $ | 3,094.0 | $ | 169.9 | $ | 7,739.6 | |||||
| Construction | Mining | Plant and | Right-of-use | Total | |||||||||||
| in progress | properties | equipment | assets1 | ||||||||||||
| Accumulated Depreciation and Impairment | |||||||||||||||
| Balance, January 1, 2024 | $ | - | $ | 2,093.0 | $ | 1,169.9 | $ | 36.5 | $ | 3,299.4 | |||||
| Depreciation expense | - | 157.2 | 116.8 | 29.0 | 303.0 | ||||||||||
| Disposals/derecognition | - | - | (40.8 | ) | (7.9 | ) | (48.7 | ) | |||||||
| Net Impairment (reversal) charge | - | (371.8 | ) | (46.6 | ) | (1.3 | ) | (419.7 | ) | ||||||
| Balance, December 31, 2024 | $ | - | $ | 1,878.4 | $ | 1,199.3 | $ | 56.3 | $ | 3,134.0 | |||||
| Depreciation expense | - | 268.5 | 173.7 | 30.8 | 473.0 | ||||||||||
| Disposals/derecognition | - | - | (28.7 | ) | (1.5 | ) | (30.2 | ) | |||||||
| Transfers within property, plant and equipment | - | 2.1 | 0.5 | (2.6 | ) | - | |||||||||
| Balance, December 31, 2025 | $ | - | $ | 2,149.0 | $ | 1,344.8 | $ | 83.0 | $ | 3,576.8 | |||||
| Carrying amount, December 31, 2024 | $ | 107.6 | $ | 2,241.4 | $ | 1,811.8 | $ | 108.6 | $ | 4,269.4 | |||||
| Carrying amount, December 31, 2025 | $ | 195.2 | $ | 2,131.5 | $ | 1,749.2 | $ | 86.9 | $ | 4,162.8 |
1. Right-of-use assets ("ROU assets") consist of property, plant and equipment related to assets leased and accounted for under IFRS 16.
On August 1, 2024, Côté Gold was assessed to be ready for use as intended and the construction costs reported in construction in progress were reclassified to mining properties and plant and equipment. Depreciation commenced on the transferred amounts on August 1, 2024.
In 2025, borrowing costs attributable to qualifying assets associated with the Côté Gold, Essakane and Westwood mines totaling $35.4 million (2024 - $98.5 million) were capitalized using a weighted average interest rate of 6.41% (2024 - 8.90%) (note 30). The weighted average interest rate was based on the 5.75% senior notes, credit facility, second lien term loan, equipment loans, gold prepayments and leases.
As at December 31, 2025, mining properties included capitalized stripping costs of $246.5 million (December 31, 2024 - $319.1 million). Stripping costs of $49.3 million were capitalized during 2025 (2024 - $181.4 million), and $128.6 million were depreciated during 2025 (2024 - $61.5 million).
12. Exploration and Evaluation Assets
| Monster | Diakha, | ||||||||||||||||||
| Notes | Nelligan | Gosselin | Siribaya | Other | Total | ||||||||||||||
| Lake | Project | ||||||||||||||||||
| Balance, January 1, 2024 | $ | 1.8 | $ | 3.5 | $ | 7.8 | $ | - | $ | 1.3 | $ | 14.4 | |||||||
| Acquired exploration and evaluation assets1 | 29.3 | - | - | - | - | 29.3 | |||||||||||||
| Reclassification (from)/to assets held for sale | - | - | - | 34.1 | - | 34.1 | |||||||||||||
| Write-down | - | - | - | - | 0.8 | 0.8 | |||||||||||||
| Exploration and evaluation expenditures | - | 1.0 | - | - | - | 1.0 | |||||||||||||
| Balance, December 31, 2024 | $ | 31.1 | $ | 4.5 | $ | 7.8 | $ | 34.1 | $ | 2.1 | $ | 79.6 | |||||||
| Acquired exploration and evaluation assets2 | 345.3 | - | - | 3.2 | - | 348.5 | |||||||||||||
| Exploration and evaluation expenditures | - | 2.6 | 0.7 | - | 2.0 | 5.3 | |||||||||||||
| Reclassification from/(to) assets held for sale3 | 6 | - | - | - | (37.3 | ) | - | (37.3 | ) | ||||||||||
| Balance, December 31, 2025 | $ | 376.4 | $ | 7.1 | $ | 8.5 | $ | - | $ | 4.1 | $ | 396.1 |
1. On February 13, 2024, the Company acquired all of the issued and outstanding common shares of Vanstar, which owned a 25% interest in the Nelligan Project (note 5).
2. On December 19, 2025 and December 22, 2025, the Company acquired all issued and outstanding common shares of Northern Superior Inc. and Mines D'Or Orbec Inc. (note 5), respectively.
3. During 2025, the Company has advanced a process to sell its exploration projects in Mali (note 6). Amount reclassified to assets held for sale is prior to fair value adjustment.
13. Other Non-Current Assets
| Notes | December 31, | December 31, | |||||
| 2025 | 2024 | ||||||
| Government receivables and investments | 9 | $ | 67.8 | $ | 66.3 | ||
| Advances for the purchase of capital equipment | 7.7 | 16.4 | |||||
| Deferred consideration from the sale of Sadiola | 19.1 | 18.3 | |||||
| Royalty interests1 | - | 12.8 | |||||
| Marketable securities | 21(a) | 18.4 | 10.3 | ||||
| Income taxes receivable | 0.4 | 1.0 | |||||
| Bond fund investments | 21(a) | 1.0 | 1.0 | ||||
| Other | 9.7 | 9.6 | |||||
| $ | 124.1 | $ | 135.7 |
1. During the second quarter 2025, the Company sold royalty interests (note 31).
14. Provisions
| Notes | December 31, | December 31, | |||||
| 2025 | 2024 | ||||||
| Asset retirement obligations | (a) | $ | 287.6 | $ | 279.6 | ||
| Other | 25.8 | 20.0 | |||||
| $ | 313.4 | $ | 299.6 | ||||
| Current portion of provisions | $ | 5.1 | $ | 14.5 | |||
| Non-current provisions | 308.3 | 285.1 | |||||
| $ | 313.4 | $ | 299.6 |
(a) Asset retirement obligations
The Company's activities are subject to various laws and regulations regarding environmental restoration and closure for which the Company estimates future costs and recognizes a provision. The Company makes a provision based on the best estimate of the future cash flows required to close and rehabilitate mine sites and related production facilities on a discounted basis.
These provisions may be revised on the basis of amendments to such laws and regulations and the availability of new information, such as changes in reserves corresponding to a change in the LOM, changes in discount rates, approved closure plans and estimated costs of reclamation activities and acquisition or construction of a new mine.
The following table presents the reconciliation of the provision for asset retirement obligations:
| Years ended December 31, | |||||||
| Notes | 2025 | 2024 | |||||
| Balance, beginning of the year | $ | 279.6 | $ | 347.4 | |||
| Revision of estimated cash flows and discount rates: | |||||||
| Capitalized in property, plant and equipment | 11 | 8.7 | (21.4 | ) | |||
| Changes in asset retirement obligations at closed mines | 29 | 8.0 | (13.4 | ) | |||
| Impairment reversal | 28 | - | (35.8 | ) | |||
| Accretion expense | 30 | 5.3 | 5.7 | ||||
| Disbursements | (14.1 | ) | (2.9 | ) | |||
| Other | 0.1 | - | |||||
| Balance, end of the year | $ | 287.6 | $ | 279.6 | |||
| Less: current portion | (5.1 | ) | (14.5 | ) | |||
| Non-current portion | $ | 282.5 | $ | 265.1 | |||
As at December 31, 2025, the Company had restricted cash of XOF 38.0 billion (December 31, 2025 - $68.0 million; December 31, 2024 - XOF 34.6 billion; $54.6 million) for the guarantee of environmental closure costs obligations related to the Essakane mine (note 8).
As at December 31, 2025, the Company had CAD$224.3 million ($163.6 million); (December 31, 2024 - CAD$205.3 million ($142.5 million)) of surety bonds, issued pursuant to arrangements with insurance companies, for the guarantee of environmental closure costs obligations related to the Westwood division (note 18(e)). Additionally, the Company has posted CAD$4.1 million (December 31, 2025 - $3.0 million; December 31, 2024 - CAD$4.1 million, $2.8 million) as security for certain environmental closure cost obligations at the Westwood division (note 18(e)).
As at December 31, 2025, the Company had CAD$50.4 million ($36.7 million); (December 31, 2024 - CAD$50.4 million ($35.0 million)) of surety bonds, issued pursuant to arrangements with insurance companies, for the guarantee of environmental closure costs obligations related to the Côté Gold mine (note 18(e)).
As at December 31, 2025, the Company had posted letters of credit in the amount of $nil; (December 31, 2024 - CAD$10.6 million, $7.4 million) under the Credit Facility and $nil (December 31, 2024 - $10.9 million) in cash deposits as collateral for surety bonds, for the guarantee of environmental closure costs obligations related to the Westwood division and Cote Gold Mine (note 18(e)). The balance of $200.3 million remains uncollateralized (note 18(e)).
As at December 31, 2025, the schedule of estimated undiscounted future disbursements for rehabilitation was as follows:
| CAD$ million1 | $ million1 | |||||
| 2026 | $ | 6.8 | $ | 0.8 | ||
| 2027 | 22.1 | 2.0 | ||||
| 2028 | 20.7 | 5.8 | ||||
| 2029 | 25.0 | 10.0 | ||||
| 2030 | 16.2 | 13.6 | ||||
| 2031 onwards | 272.1 | 75.7 | ||||
| $ | 362.9 | $ | 107.9 |
1. Disbursements in US$ relate to the Essakane mine and CAD$ disbursements relate to the Westwood division, including Doyon, Côté Gold and other closed Canadian sites.
As at December 31, 2025, estimated undiscounted amounts of cash flows required to settle the obligations and expected timing of payments assumed in measuring the asset retirement obligations were as follows:
| Undiscounted | Undiscounted | Expected | |||||||
| Amounts | Amounts | ||||||||
| Required | Required | Timing of | |||||||
| (CAD$) | ($) | Payments | |||||||
| Côté Gold mine | $ | 78.2 | $ | - | 2026-2087 | ||||
| Essakane mine | - | 107.9 | 2026-2050 | ||||||
| Westwood division, including Doyon | 273.2 | - | 2026-2057 | ||||||
| Other Canadian sites | 11.5 | - | 2026-2125 | ||||||
| $ | 362.9 | $ | 107.9 |
15. Leases
| Years ended December 31, | |||||||
| Notes | 2025 | 2024 | |||||
| Balance, beginning of year | $ | 124.2 | $ | 121.3 | |||
| Additions | 12.8 | 34.1 | |||||
| Interest expense | 8.2 | 8.4 | |||||
| Foreign exchange impact | 7.0 | (11.0 | ) | ||||
| Principal lease payments | 34(d) | (31.7 | ) | (20.6 | ) | ||
| Interest payments | (8.5 | ) | (8.0 | ) | |||
| Balance, end of year | $ | 112.0 | $ | 124.2 | |||
| Current portion | $ | 32.3 | $ | 28.8 | |||
| Non-current portion | 79.7 | 95.4 | |||||
| $ | 112.0 | $ | 124.2 | ||||
Leases are entered into and exist to meet specific business requirements, considering the appropriate term and nature of the leased asset.
Extension options
Some property leases contain extension options exercisable by the Company up to one year before the end of the non- cancellable contract period. The extension options held are exercisable only by the Company and not by the lessors. The Company assesses at the lease commencement date whether it is reasonably certain to exercise the extension options. The Company reassesses whether it is reasonably certain to exercise the options if there is a significant event or significant changes in circumstances within its control.
Some mobile equipment leases contain extension options which are exercisable by the Company but require renegotiation or mutual agreement with the lessor. As these extension options are not exercisable only by the Company, the lease terms do not reflect the extension options and this resulted in some of the leases being classified as short-term.
Short-term and low-value leases and variable lease payments
Short-term leases are leases with a lease term of twelve months or less and leases of low-value assets are comprised of miscellaneous equipment. Such items are recognized in cost of sales or general and administrative expenses in the consolidated statements of earnings (loss).
Some lease payments are driven by variable rates which are based on time, usage or a combination of both. Variable lease payments are not included in the lease liability and are recognized in cost of sales or exploration expenses in the consolidated statements of earnings (loss) when incurred.
| Years ended December 31, | ||||||
| 2025 | 2024 | |||||
| Amounts recognized in statement of earnings (loss): | ||||||
| Short-term and low-value leases | $ | 52.1 | $ | 43.7 | ||
| Variable lease payments | $ | - | $ | 4.6 | ||
16. Income Taxes
The effective tax rates for the years ended December 31, 2025 and 2024 were 24.5% and 13.2%, respectively. Income tax expenses (recoveries) consisted of the following components:
| Years ended December 31, | ||||||
| 2025 | 2024 | |||||
| Current income taxes: | ||||||
| Canadian current income taxes | $ | 12.6 | $ | 11.6 | ||
| Foreign current income taxes | 186.3 | 104.8 | ||||
| 198.9 | 116.4 | |||||
| Deferred income taxes: | ||||||
| Canadian deferred income taxes - origination and reversal of temporary | 66.9 | 7.3 | ||||
| differences | ||||||
| Foreign deferred income taxes - origination and reversal of temporary | (28.3 | ) | 5.5 | |||
| differences | ||||||
| Changes in tax rates or imposition of new taxes | - | 0.2 | ||||
| 38.6 | 13.0 | |||||
| Total income tax expense (recovery) | $ | 237.5 | $ | 129.4 | ||
The Company is subject to income tax in several jurisdictions, at various tax rates. A number of factors other than the current year tax rates affect the relationship between the income or losses in a jurisdiction for financial accounting reporting purposes and the income tax provision required to be recognized for those same reporting purposes.
These factors are illustrated below on all of the consolidated earnings (loss) before income taxes after applying a tax rate of 26.5%, reflecting the combined federal and provincial Canadian statutory corporate income tax rates which apply to the Company as a legal entity for the years ended December 31, 2025 and December 31, 2024:
| Years ended December 31, | ||||||
| 2025 | 2024 | |||||
| Earnings (loss) before income taxes | $ | 969.8 | $ | 977.2 | ||
| Income tax provision - 26.5% | $ | 257.0 | $ | 259.0 | ||
| Increase (reduction) in income taxes resulting from: | ||||||
| Earnings in foreign jurisdictions subject to a different tax rate than 26.5% | (40.7 | ) | (36.5 | ) | ||
| Permanent items that are not included in income (losses) for tax purposes: | ||||||
| Non-deductible expenses | 13.8 | (4.4 | ) | |||
| Income (losses) not recognized for tax purposes | (4.5 | ) | 0.6 | |||
| Tax provisions not based on legal entity income or losses for the year: | ||||||
| Provincial mining duty tax | 78.7 | 15.9 | ||||
| Non-resident withholding tax | 42.3 | 14.3 | ||||
| Under (over) tax provisions | 5.9 | 3.0 | ||||
| Tax benefit of losses recognized | (27.7 | ) | (40.2 | ) | ||
| Changes in tax rates | - | 0.2 | ||||
| Other | 10.8 | 0.5 | ||||
| Other adjustments: | ||||||
| Change in unrecognized deferred tax assets | (84.5 | ) | (93.4 | ) | ||
| Foreign exchange related to deferred income taxes | (21.8 | ) | 10.7 | |||
| Taxes paid relating to sale of assets | 8.6 | - | ||||
| Other | (0.4 | ) | (0.3 | ) | ||
| Total income tax expense (recovery) | $ | 237.5 | $ | 129.4 | ||
The components that give rise to deferred income tax assets and liabilities are as follows:
| Years ended December 31, | ||||||
| 2025 | 2024 | |||||
| Deferred income tax assets: | ||||||
| Exploration and evaluation assets | $ | 315.3 | $ | 283.3 | ||
| Non-capital losses | 39.7 | - | ||||
| Asset retirement obligations | 54.5 | 52.6 | ||||
| Other assets | 85.4 | 61.3 | ||||
| 494.9 | 397.2 | |||||
| Deferred income tax liabilities: | ||||||
| Property, plant and equipment | (457.8 | ) | (383.1 | ) | ||
| Mining duties | (74.3 | ) | (7.4 | ) | ||
| Other liabilities | (15.4 | ) | (20.7 | ) | ||
| (547.5 | ) | (411.2 | ) | |||
| Net deferred income tax liabilities | $ | (52.6 | ) | $ | (14.0 | ) |
| Classification: | ||||||
| Non-current assets | $ | - | $ | - | ||
| Non-current liabilities | (52.6 | ) | (14.0 | ) | ||
| $ | (52.6 | ) | $ | (14.0 | ) | |
Income tax expense (recoveries) related to OCI consisted of the following components:
| Years ended December 31, | ||||||||
| 2025 | 2024 | |||||||
| Unrealized change in fair value of marketable securities | $ | - | $ | 0.2 | ||||
| Hedges | - | 0.1 | ||||||
| Total income taxes related to OCI | $ | - | $ | 0.3 | ||||
Unrecognized Deferred Income Tax Assets
As at December 31, 2025, the Company did not recognize the benefit related to the following deferred income tax assets for the above related items in its consolidated financial statements, as management did not consider it probable that the Company would be able to realize these deferred income tax assets in the future.
Deferred income tax assets have not been recognized in respect of the following deductible temporary differences:
| Years ended December 31, | ||||||||
| 2025 | 2024 | |||||||
| Non-capital losses | $ | 439.6 | $ | 778.7 | ||||
| Net capital losses | 92.5 | 93.8 | ||||||
| Exploration and evaluation assets | - | 155.4 | ||||||
| Deduction for future mining duty taxes | - | 18.9 | ||||||
| Other deductible temporary differences | 9.2 | 10.8 | ||||||
| Excessive interest and financing expenses | 13.5 | 60.7 | ||||||
| $ | 554.8 | $ | 1,118.3 | |||||
The net capital loss carry forwards are restricted in use against capital gains but may be carried forward indefinitely. The exploration and evaluation assets may be carried forward indefinitely. At December 31, 2025, the non-capital loss carry forwards expire as follows:
| Expiry Date | 2026 | 2027 | 2028 | 2029 | 2030+ | No Expiry | Total | ||||||||||||||
| Total unrecognized losses | $ | 2.5 | $ | 1.3 | $ | 0.9 | $ | 1.4 | $ | 429.1 | $ | 4.4 | $ | 439.6 |
The Company has not recognized a deferred income tax liability on temporary differences of $406.3 million (December 31, 2024 - $590.6 million) related to investments in certain subsidiaries and joint ventures because the Company can control the reversal of the temporary differences and the temporary differences are not expected to reverse in the foreseeable future.
The Company designates all dividends paid to its shareholders to be eligible dividends. The 2025 movement for net deferred income tax liabilities is summarized as follows:
| December 31, | Statements | December 31, | ||||||||||
| 2024 | of earnings (loss) | OCI | 2025 | |||||||||
| Deferred income tax assets: | ||||||||||||
| Exploration and evaluation assets | $ | 283.3 | $ | 32.0 | $ | - | $ | 315.3 | ||||
| Non-capital losses | - | 39.7 | - | 39.7 | ||||||||
| Asset retirement obligations | 52.6 | 1.9 | - | 54.5 | ||||||||
| Other assets | 61.3 | 24.1 | - | 85.4 | ||||||||
| Deferred income tax liabilities: | ||||||||||||
| Property, plant and equipment | (383.1 | ) | (74.7 | ) | - | (457.8 | ) | |||||
| Mining duties | (7.4 | ) | (66.9 | ) | - | (74.3 | ) | |||||
| Other liabilities | (20.7 | ) | 5.3 | - | (15.4 | ) | ||||||
| $ | (14.0 | ) | $ | (38.6 | ) | $ | - | $ | (52.6 | ) |
The 2024 movement for net deferred income tax liabilities is summarized as follows:
| December 31, | Statements | OCI | December 31, | |||||||||
| 2023 | of earnings (loss) | 2024 | ||||||||||
| Deferred income tax assets: | ||||||||||||
| Exploration and evaluation assets | $ | 442.4 | $ | (159.1 | ) | $ | - | $ | 283.3 | |||
| Asset retirement obligations | - | 52.6 | - | 52.6 | ||||||||
| Côté Gold repurchase option | 91.5 | (91.5 | ) | - | - | |||||||
| Other assets | 43.8 | 17.6 | (0.1 | ) | 61.3 | |||||||
| Deferred income tax liabilities: | ||||||||||||
| Property, plant and equipment | (572.8 | ) | 189.7 | - | (383.1 | ) | ||||||
| Mining duties | - | (7.4 | ) | - | (7.4 | ) | ||||||
| Other liabilities | (5.6 | ) | (14.9 | ) | (0.2 | ) | (20.7 | ) | ||||
| $ | (0.7 | ) | $ | (13.0 | ) | $ | (0.3 | ) | $ | (14.0 | ) |
17. Other Liabilities
| Notes | December 31, | December 31, | |||||
| 2025 | 2024 | ||||||
| Hedge derivatives | 20(b)(i) | $ | - | $ | 9.8 | ||
| Yatela liability | (a) | - | 18.5 | ||||
| Automatic Share Purchase Plan Liability | 23(c) | 50.0 | - | ||||
| Other liabilities | 0.1 | 0.1 | |||||
| $ | 50.1 | $ | 28.4 | ||||
| Current portion of other liabilities | $ | 50.0 | $ | 27.7 | |||
| Non-current portion of other liabilities | 0.1 | 0.7 | |||||
| $ | 50.1 | $ | 28.4 |
(a) Yatela liability
On February 5, 2025, Sadiola Exploration Limited ("SADEX"), an entity jointly held 50/50 by the Company and AngloGold Ashanti Limited, made a one-time payment of $36.4 million to the dedicated state account, corresponding to the estimated costs of completing the rehabilitation and closure of the Yatela mine, and also financing certain outstanding social programs. Upon completion and this payment being made, SADEX and its affiliated companies have been released of all obligations relating to the Yatela mine. The Company funded its portion of the payment of $18.2 million on closing.
18. Long-term Debt and Credit Facility
| Notes | December 31, | December 31, | |||||
| 2025 | 2024 | ||||||
| Credit facility | (a) | $ | 200.0 | $ | 220.0 | ||
| 5.75% senior notes | (b) | 448.8 | 448.4 | ||||
| Second lien term loan | (c) | - | 358.4 | ||||
| Equipment loans | (d) | 1.0 | 2.1 | ||||
| $ | 649.8 | $ | 1,028.9 | ||||
| Current portion of long-term debt | $ | 1.0 | $ | 1.0 | |||
| Non-current portion of long-term debt | 648.8 | 1,027.9 | |||||
| $ | 649.8 | $ | 1,028.9 |
The following are the contractual maturities related to the long-term debts, including interest payments:
| Payments due by period | |||||||||||||
| December 31, 2025 | Notes | Carrying | Contractual | 1 yr | 2-3 yrs | ||||||||
| amount | cash flows | ||||||||||||
| Notes | (b) | $ | 450.0 | $ | 527.7 | $ | 25.9 | $ | 501.8 | ||||
| Equipment loans | (d) | $ | 1.0 | $ | 1.0 | $ | 1.0 | $ | - | ||||
(a) Credit facility
On December 20, 2024, the Company executed an amendment to its existing secured revolving credit facility ("Credit Facility"), extending its maturity to December 20, 2028 and increasing the amount available under the Credit Facility from $425 million to $650 million.
| Years ended December 31, | |||||||
| Notes | 2025 | 2024 | |||||
| Available amount under Credit Facility, beginning of year | $ | 418.5 | $ | 387.0 | |||
| Increase (decrease) in available amount under Credit Facility1 | - | 225.0 | |||||
| Draws | 34(e) | (130.0 | ) | (280.0 | ) | ||
| Repayments | 34(e) | 150.0 | 60.0 | ||||
| Decrease (increase) in letters of credit2 | 7.2 | 26.5 | |||||
| Available amount under Credit Facility, end of year | $ | 445.7 | $ | 418.5 | |||
1. The amendment was determined to be a substantial modification to the Credit Facility, and therefore was accounted for as a debt extinguishment.
2. The letters of credit were issued under the Credit Facility as security for asset retirement obligations (notes 18(e) and 14(a)), as well as providing guarantee for utility services in Ontario.
The Credit Facility provides for an interest rate margin above Secured Overnight Financing Rate ("SOFR") prime rate, base rate advances and CORRA advances which vary, together with fees related thereto, according to the total Net Debt to Earnings Before Interest, Tax, Depreciation and Amortization ("EBITDA") ratio of the Company. The Credit Facility is secured by certain of the Company's real assets, guarantees by certain of the Company's subsidiaries and pledges of shares of certain of the Company's subsidiaries. The key terms of the Credit Facility include certain limitations on incremental debt, certain restrictions on distributions and financial covenants including Net Debt to EBITDA and Interest Coverage and a minimum liquidity requirement of $150 million. The Company was in compliance with its credit facility covenants as at December 31, 2025.
(b) 5.75% senior notes ("Notes")
On September 23, 2020, the Company completed the issuance of $450 million aggregate principal amount of Notes with an interest rate of 5.75% per annum. The Notes are denominated in U.S. dollars and mature on October 15, 2028. Interest is payable in arrears in equal semi-annual installments on April 15 and October 15 of each year. The Notes are guaranteed by certain of the Company's subsidiaries.
The Company has the right to redeem the Notes, in whole or in part, at the relevant redemption price (expressed as a percentage of the principal amount of the Notes) plus accrued and unpaid interest, if any, up to the redemption date. The redemption price for the Notes during the 12-month period beginning October 15, 2025 is 101.438% and October 15, 2026 and thereafter is 100%.
The prepayment options represent an embedded derivative asset to the Company and are presented as an offset to the Notes on the consolidated balance sheets.
Subsequently, the debt component is recognized at amortized cost using the effective interest rate method. The embedded derivative is classified as a financial asset at FVTPL. The fair value of the embedded derivative as at December 31, 2025 was $nil (December 31, 2024 - $nil) (note 21(a)).
(c) Second lien term loan ("Term Loan")
On May 16, 2023, the Company entered into a five year secured Term Loan of $400 million from three institutional lenders. The Term Loan had a floating interest rate of either one month or three month SOFR + 8.25% per annum and matures on May 16, 2028. The loan was denominated in U.S. dollars, and interest was payable upon each SOFR maturity date.
During the year ended December 31, 2025, the Company repaid $400.0 million of the Term Loan, reducing the principal value to $nil. The 4% prepayment premium of $16.0 million was expensed as a result of the reduction in principal of the Term Loan (note 30). The prepayment terms constituted an embedded derivative which was separately recognized at its fair value of $1.0 million on initial recognition of the Term Loan and presented as an offset to the Term Loan on the consolidated balance sheets. The embedded derivative was classified as FVTPL. The fair value of the embedded derivative was derecognized on repayment and had a $26.7 million balance at December 31, 2024 (note 21(a)).
(d) Equipment loan
The Company has an equipment loan with a carrying value of $1.0 million as at December 31, 2025 (December 31, 2024 - $2.1 million), secured by certain mobile equipment, with interest rates at 5.30% and which mature in 2026. The equipment loan is carried at amortized cost on the consolidated balance sheet.
(e) Surety bonds
As at December 31, 2025, the Company had CAD$274.7 million ($200.3 million) (December 31, 2024 - CAD$255.7 million, $177.5 million) of surety bonds, issued pursuant to arrangements with insurance companies, for guarantee of environmental closure costs obligations related to Doyon, the Westwood mine and the Côté Gold mine.
The Company posted letters of credit in the amount of $nil, (December 31, 2024 - CAD$10.6 million, $7.4 million) under the Credit Facility and $nil (December 31, 2024 - $10.9 million) in cash deposits as collateral for surety bonds. The balance of $200.3 million remains uncollateralized.
(f) Performance bonds
As at December 31, 2025, performance bonds of CAD$32.1 million ($23.4 million) (December 31, 2024 - CAD$32.0 million, $22.2 million) were outstanding in support of certain obligations related to the construction of the Côté Gold mine.
19. Deferred Revenue
During 2021, the Company entered into gold sale prepayment arrangements (the "2022 Prepay Arrangements") at a weighted average cost of 4.45% per annum in respect of 150,000 gold ounces. These arrangements had an average forward contract price of $1,753 per ounce on 50,000 gold ounces and a collar range of $1,700 to $2,100 per ounce on 100,000 gold ounces. The Company received $236.0 million over the course of 2022 under the 2022 Prepay Arrangements and the requirement on the part of the Company was required to physically deliver the agreed upon ounces to the counterparties over the course of 2024. 137,500 ounces were physically delivered during the year ended December 31, 2024 in relation to the 2022 Prepay Arrangements and the Company received $38.9 million in cash in relation to the collar, as the spot price exceeded the $1,700 per ounce floor price during 2024.
During December 2023, the Company amended one of the 2022 Prepay Arrangements to defer the delivery of 6,250 ounces from Q1 2024 to Q1 2025. The ounces that were deferred were previously funded at a price of $1,753 per ounce. The Company also entered into further gold sale prepayment arrangements (the "2024 Q1 Prepay Arrangements") at a weighted average cost of 11.3% per annum in respect of 31,250 gold ounces. These arrangements had an average funding price, after financing charges, of $1,916 per ounce. The Company received $59.9 million over the course of the first quarter 2024 under the 2024 Q1 Prepay Arrangements and was required to physically deliver the agreed upon ounces to the counterparties over the course of the first quarter of 2025.
During April 2024, the Company amended one of the 2022 Prepay Arrangements to defer the delivery of 6,250 ounces from Q2 2024 to Q2 2025. The ounces that were deferred were previously funded at a price of $1,753 per ounce. The Company also entered into further gold sale prepayment arrangements (the "2024 Q2 Prepay Arrangements") at a weighted average cost of 10% per annum in respect of 31,250 gold ounces. These arrangements had an average funding price, after financing charges, of $1,900 per ounce. These arrangements had a gold collar of $2,100 to $2,925 whereby the Company received a cash payment at the time of delivery of the ounces if the spot price of gold exceeded $2,100 per ounce, with the payment calculated as the difference between the spot price and $2,100 per ounce, capped at an average price of $2,925 per ounce. The Company received $59.4 million over the course of the second quarter 2024 under the 2024 Q2 Prepay Arrangements and was required to physically deliver the agreed upon ounces to the counterparties over the course of the second quarter of 2025.
These arrangements have been accounted for as contracts in the scope of IFRS 15 Revenue from Contracts with Customers whereby the cash prepayments are recorded as deferred revenue in the consolidated balance sheets when received and revenue is recognized as deliveries are made. The cash payments received on gold collars at the time of delivery were also recognized as revenue when the gold was delivered.
An interest cost, representing the financing component of the cash prepayment, was recognized as part of finance costs. The following table summarizes the change in deferred revenue:
| Notes | 2022 Prepay | 2024 Q1 Prepay | 2024 Q2 Prepay | Total | |||||||||
| Arrangements | Arrangements | Arrangements | |||||||||||
| Balance, January 1, 2024 | $ | 251.6 | $ | - | $ | - | $ | 251.6 | |||||
| Proceeds from gold prepayment | - | 59.9 | 59.4 | 119.3 | |||||||||
| Deferred revenue recognized | (235.7 | ) | - | - | (235.7 | ) | |||||||
| Finance costs | 30 | 6.7 | 5.6 | 3.6 | 15.9 | ||||||||
| Balance, December 31, 2024 | $ | 22.6 | $ | 65.5 | $ | 63.0 | $ | 151.1 | |||||
| Deferred revenue recognized | (21.9 | ) | (66.7 | ) | (65.7 | ) | (154.3 | ) | |||||
| Finance costs | 30 | (0.7 | ) | 1.2 | 2.7 | 3.2 | |||||||
| Balance, December 31, 2025 | $ | - | $ | - | $ | - | $ | - |
20. Financial Instruments
(a) Risks
The Company is subject to various financial risks that could have a significant impact on profitability, levels of operating cash flow and financial conditions. Ongoing financial market conditions may have an impact on interest rates, gold prices and currency rates.
The Company is exposed to various liquidity, credit and market risks associated with its financial instruments, and manages those risks as follows:
(i) Liquidity risk
Liquidity risk is the risk that an entity will encounter difficulty in meeting obligations associated with financial and other liabilities that are settled by delivering cash, another financial asset or physical production. The Company manages this risk through regular monitoring of its cash flow requirements to support ongoing operations and expansionary plans. The Company ensures that there are sufficient committed loan facilities to meet its anticipated business requirements, taking into account anticipated cash flows from operations and holdings of cash and cash equivalents. The Company ensures that it has sufficient cash and cash equivalents and loan facilities available to meet its anticipated short-term obligations.
The following table summarizes the maturity date and principal amount of the Company's obligations as at December 31, 2025:
| Notes | 2026 | 2027 | 2028 | 2029 | Total | |||||||||||
| onwards | ||||||||||||||||
| Accounts payable and accrued liabilities | $ | 329.1 | $ | - | $ | - | $ | - | $ | 329.1 | ||||||
| Lease liabilities | 15 | 41.4 | 37.1 | 19.5 | 14.0 | 112.0 | ||||||||||
| Equipment loan | 18(d) | 1.0 | - | - | - | 1.0 | ||||||||||
| Credit Facility | 18(a) | - | - | 200.0 | - | 200.0 | ||||||||||
| Notes | 18(b) | - | - | 450.0 | - | 450.0 | ||||||||||
| $ | 371.5 | $ | 37.1 | $ | 669.5 | $ | 14.0 | $ | 1,092.1 |
Included in the cash and cash equivalents balance of $421.9 million as at December 31, 2025 is $53.5 million held by the Côté UJV and $197.5 million held by Essakane. The Côté UJV requires its joint venture partners to fund, in advance, two months of future expenditures. The Company uses dividends and intercompany loans to repatriate funds from its operations and the timing of dividends may impact the liquidity position of the Company.
The Company has a treasury policy designed to support management of liquidity risk as follows:
• Evaluate, review and monitor on a periodic basis, credit ratings and limits for counterparties with whom funds are invested;
• Monitor cash balances within each operating entity;
• Perform short to medium-term cash flow forecasting, as well as medium and long-term forecasting incorporating relevant budget information; and
• Determine market risks inherent in the business, including currency, fuel and gold commodities and evaluate, implement and monitor hedging strategies through the use of derivative instruments.
Under the terms of the Company's derivative agreements, counterparties cannot require the immediate settlement of outstanding derivatives, except upon the occurrence of customary events of default such as covenant breaches, including financial covenants, insolvency or bankruptcy. The Company generally mitigates liquidity risk associated with these instruments by spreading out the maturity of its derivatives over time.
(ii) Credit risk
Credit risk is the risk that one party to a financial instrument will cause a financial loss for the other party by failing to discharge an obligation. The maximum amount of credit risk is equal to the balance of cash and cash equivalents, receivables, short-term investments, derivative assets and restricted cash. Where applicable, the measurement of the fair value of derivatives accounts for counterparty credit risk.
The Company holds cash and cash equivalents, short-term investments and restricted cash in creditworthy financial institutions that comply with the Company's investment policy and its credit risk parameters.
For derivatives, the Company mitigates credit risk by entering into derivatives with high quality counterparties, limiting the exposure per counterparty, and monitoring the financial condition of the counterparties.
Credit risk related to gold receivables is considered minimal as gold is sold to creditworthy counterparties and settled promptly, usually within two days of completing the sale.
Credit risk is also related to receivables from governments. The receivables from governments primarily relate to value added and sales taxes. The Company has rights to these receivables based on application of tax laws and regularly monitors collection of the amounts, however the timing of receiving the amounts could be prolonged.
(iii) Market risk
Market risk is the risk that the fair value or future cash flows of a financial instrument will fluctuate because of changes in market prices. For hedging activities, it is the risk that the fair value of a derivative might be adversely affected by a change in underlying commodity prices or currency exchange rates, and that this in turn affects the Company's financial condition.
The Company mitigates market risk by establishing and monitoring parameters that limit the types and degree of market risk that may be undertaken, establishing trading agreements with counterparties under which there are no requirements to post any collateral or make any margin calls on derivatives. Counterparties cannot require settlement solely because of an adverse change in the fair value of a derivative. Market risk comprises the following types of risks: share and commodity market price risk, currency risk, and interest rate risk.
Currency exchange rate risk
Movements in the Canadian dollar (CAD) and Euro (EUR) against the U.S. dollar (USD) have a direct impact on the Company's consolidated financial statements.
The Company manages its exposure to the Canadian dollar and Euro by executing option and forward contracts. The Company's objective is to hedge its exposure to the Canadian dollar and Euro resulting from operating and capital expenditure requirements at some of its mine sites, corporate offices and development projects.
The Company has designated option and forward contracts as cash flow hedges for its highly probable forecasted Canadian dollar and Euro expenditure requirements. The Company has elected to only designate the change in the intrinsic value of options in the hedging relationships. The change in fair value of the time value component of options is recorded in OCI as a cost of hedging (note 20(b)).
As at December 31, 2025, the Company's outstanding derivative contracts which qualified for hedge accounting and the periods in which the cash flows are expected to occur and impact the consolidated statements of earnings (loss) and property, plant and equipment balance on the consolidated balance sheets are as follows:
| 2026 | |||
| Cash flow hedges | |||
| Exchange rate risk | |||
| Canadian dollar forward and option contracts (CADM) | 276.0 | ||
| Rate range (USDCAD)1 | 1.35 - 1.50 |
1. The Company executed Canadian dollar collar options, which consist of Canadian dollar call and put options within the given range in 2025. The Company will recognize a gain from the difference between a lower market price and the Canadian dollar call strike price. The Company will incur a loss from the difference between a higher market price and the Canadian dollar put strike price.
The table below sets out the fair value of the Company's outstanding derivative contracts which qualified for hedge accounting as at December 31, 2025, and what the fair value would have been based on an increase or decrease of 10% in the U.S. dollar exchange rate. The entire change in fair value would be recorded in the consolidated statements of comprehensive income (loss) as OCI.
| December 31, | Increase of | Decrease of | |||||||
| 2025 | 10% | 10% | |||||||
| Canadian dollar (CAD$) | $ | 2.0 | $ | (6.9 | ) | $ | 19.5 |
Oil and fuel market price risk
Low sulfur diesel and fuel oil are key inputs to extract tonnage and, in some cases, to wholly or partially power operations, construction and development activities. Brent crude oil and West Texas Intermediate ("WTI") crude oil prices are components of diesel and fuel oil costs, respectively, such that changes in the price of crude oil directly impact diesel and fuel oil costs. The Company established a hedging strategy that allows it to hedge future consumption of diesel and fuel oil at its operations. The Company designates option contracts as cash flow hedges for the crude oil component of its highly probable forecasted low sulfur diesel and fuel oil purchases.
As at December 31, 2025, the Company has no outstanding crude oil derivative contracts.
Gold bullion market price risk
Movements in the spot price of gold have a direct impact on the Company's consolidated financial statements as gold bullion is sold at prevailing market prices which fluctuate in line with market forces. The Company's hedging strategy is designed to mitigate gold price risk should a decline in the gold price impact a contemplated transaction or scheduled debt payment.
The Company has designated option contracts as cash flow hedges for its highly probable forecasted gold bullion sales. The Company has elected to only designate the change in the intrinsic value of options in the hedging relationships. The changes in fair value of the time value component of options is recorded in OCI as a cost of hedging and reclassified to earnings (loss) when revenue for the underlying gold sale is recognized.
As at December 31, 2025, the Company's outstanding derivative contracts which qualified for hedge accounting and the periods in which the cash flows are expected to occur and impact to the consolidated statements of earnings (loss) are as follows:
| 2026 | |||
| Gold Bullion hedges | |||
| Gold put options (thousands of ounces) | 200.0 | ||
| Strike Price | |||
| $ | 3,100.0 | ||
The table below sets out the fair value of the Company's outstanding derivative contracts which qualified for hedge accounting as at December 31, 2025, and what the fair value would have been based on an increase or decrease of 10% in the gold price. The entire change in fair value would be recorded in the consolidated statements of comprehensive income (loss) as OCI.
| December 31, | Increase of | Decrease of | |||||||
| 2025 | 10% | 10% | |||||||
| Gold Price | $ | 0.3 | $ | 0.1 | $ | 1.6 |
(b) Cash flow hedge fair value reserve
(i) Reconciliation of cash flow hedge assets (liabilities)
| Canadian dollar | Oil contracts | Gold price | Total | |||||||||
| contracts | contracts | |||||||||||
| Balance, January 1, 2024 | $ | 1.6 | $ | 5.7 | $ | (9.2 | ) | $ | (1.9 | ) | ||
| Unrealized gain (loss) recognized in cash flow hedge reserve | (13.1 | ) | 1.6 | (28.2 | ) | (39.7 | ) | |||||
| Realized (gain) loss reclassified or adjusted from cash flow hedge reserve | 1.7 | (7.2 | ) | 30.3 | 24.8 | |||||||
| Realized time value related to premiums paid | - | - | 2.2 | 2.2 | ||||||||
| Time value excluded from hedge relationship | - | (0.1 | ) | 4.9 | 4.8 | |||||||
| Balance, December 31, 2024 | $ | (9.8 | ) | $ | - | $ | - | $ | (9.8 | ) | ||
| Unrealized gain (loss) recognized in cash flow hedge reserve | 5.3 | - | (10.5 | ) | (5.2 | ) | ||||||
| Realized (gain) loss reclassified or adjusted from cash flow hedge reserve | 3.8 | - | - | 3.8 | ||||||||
| Premiums accrued | - | - | 10.5 | 10.5 | ||||||||
| Time value excluded from hedge relationship | 2.7 | - | 0.3 | 3.0 | ||||||||
| Balance, December 31, 2025 | $ | 2.0 | $ | - | $ | 0.3 | $ | 2.3 | ||||
| Consisting of: | ||||||||||||
| Current portion of hedge asset | $ | 2.0 | $ | - | $ | 0.3 | $ | 2.3 | ||||
| $ | 2.0 | $ | - | $ | 0.3 | $ | 2.3 |
(ii) Allocation of realized hedge (gain) loss reclassified from cash flow hedge reserve
| Years ended December 31, | ||||||
| 2025 | 2024 | |||||
| Consolidated balance sheets | ||||||
| Property, plant and equipment | $ | 1.2 | $ | 1.0 | ||
| Consolidated statements of earnings (loss) | ||||||
| Revenues | - | 32.5 | ||||
| Cost of sales | 2.2 | (6.5 | ) | |||
| General and administrative expenses | 0.4 | - | ||||
| 2.6 | 26.0 | |||||
| $ | 3.8 | $ | 27.0 | |||
Revenues for the year ended December 31, 2025 include $nil (December 31, 2024 - $2.2 million) of losses related to premiums previously paid and realized during the year.
21. Fair Value Measurements
The fair value hierarchy categorizes into three levels the inputs to valuation techniques used to measure fair value. The fair value hierarchy gives the highest priority to quoted prices (unadjusted) in active markets for identical assets or liabilities (Level 1 inputs) and the lowest priority to unobservable inputs (Level 3 inputs).
• Level 1 inputs are quoted prices (unadjusted) in active markets for identical assets or liabilities which the entity can access at the measurement date.
• Level 2 inputs are inputs other than quoted prices included within Level 1 which are observable for the asset or liability, either directly or indirectly such as those derived from prices.
• Level 3 inputs are unobservable inputs for the asset or liability.
There have been no changes in the classification of the financial instruments in the fair value hierarchy since December 31, 2024.
(a) The Company's fair values of financial assets and liabilities
| December 31, 2025 | |||||||||||||||
| Carrying | Total Fair | ||||||||||||||
| Amount | Level 1 | Level 2 | Level 3 | Value | |||||||||||
| Assets | |||||||||||||||
| Cash and cash equivalents | $ | 421.9 | $ | 421.9 | $ | - | $ | - | $ | 421.9 | |||||
| Short-term investments | 1.0 | 1.0 | - | - | 1.0 | ||||||||||
| Restricted cash | 71.0 | 71.0 | - | - | 71.0 | ||||||||||
| Marketable securities | 18.4 | 18.4 | - | - | 18.4 | ||||||||||
| Bond fund investments | 1.0 | 1.0 | - | - | 1.0 | ||||||||||
| Other investments | 23.5 | 23.5 | - | - | 23.5 | ||||||||||
| Deferred consideration from the sale of Sadiola | 19.1 | - | - | 19.1 | 19.1 | ||||||||||
| Derivatives | |||||||||||||||
| Currency contracts | 2.0 | - | 2.0 | - | 2.0 | ||||||||||
| Gold bullion contracts | 0.3 | - | 0.3 | - | 0.3 | ||||||||||
| $ | 558.2 | $ | 536.8 | $ | 2.3 | $ | 19.1 | $ | 558.2 | ||||||
| Liabilities | |||||||||||||||
| Long-term debt - Notes1 | (451.7 | ) | (451.1 | ) | - | - | (451.1 | ) | |||||||
| Long-term debt - equipment loan | (1.0 | ) | - | (1.0 | ) | - | (1.0 | ) | |||||||
| Long-term debt - Credit Facility | (200.0 | ) | - | (200.0 | ) | - | (200.0 | ) | |||||||
| $ | (652.7 | ) | $ | (451.1 | ) | $ | (201.0 | ) | $ | - | $ | (652.1 | ) | ||
1. The carrying amount excludes unamortized deferred transaction costs of $2.9 million and the embedded derivative.
| December 31, 2024 | |||||||||||||||
| Carrying | Total Fair | ||||||||||||||
| Amount | Level 1 | Level 2 | Level 3 | Value | |||||||||||
| Assets | |||||||||||||||
| Cash and cash equivalents | $ | 347.5 | $ | 347.5 | $ | - | $ | - | $ | 347.5 | |||||
| Short-term investments | 1.0 | 1.0 | - | - | 1.0 | ||||||||||
| Restricted cash | 68.4 | 68.4 | - | - | 68.4 | ||||||||||
| Marketable securities and warrants | 10.3 | 10.3 | - | - | 10.3 | ||||||||||
| Bond fund investments | 1.0 | 1.0 | - | - | 1.0 | ||||||||||
| Deferred consideration from the sale of Sadiola | 17.1 | - | - | 17.1 | 17.1 | ||||||||||
| Embedded derivative - prepayment options on | |||||||||||||||
| Term Loan | 26.7 | - | 26.7 | - | 26.7 | ||||||||||
| $ | 472.0 | $ | 428.2 | $ | 26.7 | $ | 17.1 | $ | 472.0 | ||||||
| Liabilities | |||||||||||||||
| Derivatives | |||||||||||||||
| Currency contracts | $ | (9.8 | ) | $ | - | $ | (9.8 | ) | $ | - | $ | (9.8 | ) | ||
| Long-term debt - Notes1 | (452.0 | ) | (435.8 | ) | - | - | (435.8 | ) | |||||||
| Long-term debt - Term Loan2 | (400.8 | ) | - | (449.2 | ) | - | (449.2 | ) | |||||||
| Long-term debt - equipment loan | (2.1 | ) | - | (2.3 | ) | - | (2.3 | ) | |||||||
| Long-term debt - Credit Facility | (220.0 | ) | - | (220.0 | ) | - | (220.0 | ) | |||||||
| $ | (1,084.7 | ) | $ | (435.8 | ) | $ | (681.3 | ) | $ | - | $ | (1,117.1 | ) | ||
1. The carrying amount excludes unamortized deferred transaction costs of $3.6 million and the embedded derivative.
2. The carrying amount excludes unamortized deferred transaction costs of $3.7 million, the 3% original discount and the embedded derivative.
(b) Valuation techniques
Cash, cash equivalents, short-term investments and restricted cash
Cash, cash equivalents, short-term investments and restricted cash are included in Level 1 due to the short-term maturity of these financial assets.
Marketable securities and warrants
The fair value of marketable securities included in Level 1 is determined based on a market approach. The closing price is a quoted market price from the exchange market which is the principal active market for the particular security.
Bond fund investments
The fair value of bond fund investments included in Level 1 is measured using quoted prices (unadjusted) in active markets.
Deferred consideration from the sale of Sadiola
The significant estimates and assumptions used in determining the fair value of the contingent payments were the production profile and discount rate and therefore classified within Level 3 of the fair value hierarchy.
Embedded derivatives - Prepayment options on the Notes and Term Loan
The fair value of the embedded derivatives related to the Notes and the Term Loan as at December 31, 2025 was $nil (December 31, 2024 - $26.7 million asset) and is accounted for at FVTPL. The valuation is based on the discounted cash flows at the risk-free rate to determine the present value of the prepayment option. Key inputs used in the valuation include the credit spread, volatility parameter and the risk-free rate curve. Valuation of the prepayment option is therefore classified within Level 2 of the fair value hierarchy.
Unsecured High Yield Notes
The fair value of the Notes as at December 31, 2025 was $451.1 million (December 31, 2024 - $435.8 million). The fair value of the Notes is determined using quoted prices (unadjusted) in active markets, and is therefore classified within Level 1 of the fair value hierarchy.
Credit Facility
The fair value of the Credit Facility as at December 31, 2025 was $200.0 million (December 31, 2024 - $220 million) which approximates its carrying amount and drawn amount, and is therefore classified within Level 2 of the fair value hierarchy.
Term Loan
As the term loan was fully repaid during the year the fair value of the Term Loan as at December 31, 2025 was $nil (December 31, 2024 - $449.2 million). Key inputs' used in the valuation include the credit spread, volatility parameter and the risk-free rate curve. Valuation of the Term Loan is therefore classified within Level 2 of the fair value hierarchy.
Equipment loan
The fair value of the equipment loan as at December 31, 2025 was $1.0 million (December 31, 2024 - $2.3 million). The fair value of the equipment loan is determined by applying a discount rate, reflecting the credit spread based on the Company's credit ratings to future cash flows and is therefore classified within Level 2 of the fair value hierarchy.
Other financial assets and liabilities
The fair value of all other financial assets and liabilities of the Company approximate their carrying amounts.
22. Capital Management
IAMGOLD's objectives when managing capital are to:
• Ensure the Company has sufficient financial capacity to support its operations, current mine development plans, construction projects, and long-term growth strategy;
• Ensure the Company complies with its long-term debt covenants; and
• Protect the Company's value with respect to market and risk fluctuations.
| Notes | December 31, | December 31, | |||||
| 2025 | 2024 | ||||||
| Cash and cash equivalents | $ | 421.9 | $ | 347.5 | |||
| Capital items: | |||||||
| Long-term debt - Notes1 | 18(b | $ | 450.0 | $ | 450.0 | ||
| Long-term debt - Term Loan2 | 18(c) | - | 400.0 | ||||
| Credit facility available for use | 18(a) | 445.7 | 418.5 | ||||
| Common shares | 3,383.8 | 3,070.6 | |||||
| $ | 4,279.5 | $ | 4,339.1 |
1. The carrying amount of the long-term debt excludes unamortized deferred transaction costs of $2.9 million as at December 31, 2025 (December 31, 2024 - $3.6 million) and the embedded derivative.
2. The carrying amount was repaid in 2025.
The Company operates in a capital intensive industry that experiences lengthy development lead times as well as risks associated with capital costs and timing of project completion. Factors affecting these risks, which are beyond the Company's control, include the availability of resources, the issuance of necessary permits, costs of various inputs and the volatility of the gold price.
The adequacy of the Company's capital structure is assessed on an ongoing basis and adjusted as necessary after taking into consideration the Company's strategy, the forward gold price, the mining industry, the capital requirements of the Company's operations and projects, economic conditions and associated risks. In order to maintain or adjust its capital structure, the Company may adjust its capital spending, adjust the amount of dividend distributions, issue new shares, purchase shares for cancellation pursuant to normal course issuer bids, extend its credit facility, issue new debt, repay existing debt, sell all or a portion of one or more of its assets, purchase or sell gold bullion or enter into forward gold sale arrangements.
The Notes indenture contains a restriction on the use of proceeds from the sale of certain assets.
The credit facility agreement contains certain restrictions on the assumption of certain additional debt and the sale of certain assets.
23. Share Capital
The Company is authorized to issue an unlimited number of common shares, first preference shares issuable in series and second preference shares issuable in series.
| Years ended December 31, | |||||||
| Number of common shares (in millions) | Notes | 2025 | 2024 | ||||
| Outstanding, beginning of the year | 571.4 | 481.3 | |||||
| Equity issuance | 5 | 18.5 | 85.2 | ||||
| Shares repurchased under NCIB | (3.0 | ) | - | ||||
| Issuance of flow-through common shares | 0.8 | 1.9 | |||||
| Issuance of shares for share-based compensation | 25 | 3.4 | 3.0 | ||||
| Outstanding, end of the year | 591.1 | 571.4 | |||||
(a) Equity issuance
On December 19, 2025, the Company acquired all of the issued and outstanding shares of Northern Superior for total consideration of approximately $329.0 million which included 18.1 million common shares of the Company and cash of $25.0 million (note 5).
On December 22, 2025, the Company acquired all of the issued and outstanding shares of Orbec for total consideration of approximately $14.2 million which included 0.4 million common shares of the Company and cash of $5.8 million (note 5).
On May 21, 2024, the Company entered into a public equity offering of 72.0 million common shares at a price of $4.17 per common share for gross proceeds of $300.2 million. The issuance was completed on May 24, 2024. The Company received net proceeds of $287.5 million from the equity offering, after transaction costs of $12.7 million.
(b) Flow-through common shares
In February 2025, the Company issued 0.8 million flow-through common shares at CAD$12.25 per share for net proceeds of $6.8 million (CAD$10.0 million), which included a $1.7 million premium reported as a deferred gain on the balance sheet to be recognized in earnings as eligible expenditures are made. A total of $5.1 million was recognized in equity based on the quoted price of the shares on the date of the issue less issuance costs. The flow-through common shares were issued to fund exploration expenditures for the Company's exploration properties in Quebec, Canada. Flow-through common shares require the Company to incur an amount equivalent to the proceeds of the issue on prescribed expenditures in accordance with the applicable tax legislation.
In February 2024, the Company issued 1.9 million flow-through common shares at CAD$4.20 per share for net proceeds of $5.9 million (CAD$8.0 million), which included a $1.2 million premium reported as a deferred gain on the balance sheet to be recognized in earnings as eligible expenditures are made. A total of $4.7 million was recognized in equity based on the quoted price of the shares on the date of the issue less issuance costs. The flow-through common shares were issued to fund exploration expenditures for the Company's exploration properties in Quebec, Canada.
For the year ended December 31, 2025, $1.9 million (2024 - $1.1 million) was recognized as amortization of the gains related to the issuances of flow-through common shares and was included in interest income and derivatives and other investment gains in the consolidated statements of earnings (note 31).
(c) Normal Course Issuer Bid
On December 9, 2025, the Company received approval from the TSX of its normal course issuer bid ("NCIB") program. Under the program, the Company is authorized to purchase up to 57.0 million of its common shares during the period from December 12, 2025 to December 11, 2026.
The book value of any cancelled shares are treated as a reduction to common share capital. During the year ended December 31, 2025, the Company repurchased 3.0 million common shares for $50.0 million at an average price of $16.87 per share. The book value of the cancelled shares was $16.0 million and was treated as a reduction to common share capital.
On December 30, 2025, the Company initiated an automatic share purchase plan under its NCIB by authorizing its independent broker to purchase common shares of the Company up to $50.0 million based on certain market criteria. The instructions expire on February 20, 2026. The Company recognized a financial liability associated with the total maximum amount that may be repurchased during that period by the broker, with an offsetting entry in contributed surplus. The full amount of the financial liability was purchased subsequent to December 31, 2025, totaling 2.6 million common shares.
24. Non-Controlling Interests
Financial information of subsidiaries that have material non-controlling interests are provided below:
| December 31, 2025 | December 31, 2024 | |||||
| Essakane | Essakane | |||||
| Percentage of voting rights held by non-controlling interests | 15% | 10% | ||||
| Accumulated non-controlling interest | $ | 54.5 | $ | 64.0 | ||
| Net earnings (loss) attributable to non-controlling interests | $ | 67.9 | $ | 27.7 | ||
| Dividends paid to non-controlling interests1 | $ | 128.3 | $ | 18.0 |
1. For the year ended December 31, 2025, dividends paid to other non-controlling interests amounted to $ 128.3 million (December 31, 2024 - $18.0 million).
Selected summarized information relating to these subsidiaries are provided below, before any intercompany eliminations:
| December 31, 2025 | December 31, 2024 | |||||
| Essakane | Essakane | |||||
| Current assets | $ | 482.5 | $ | 324.0 | ||
| Non-current assets | 825.0 | 882.2 | ||||
| Current liabilities | (664.9 | ) | (175.0 | ) | ||
| Non-current liabilities | (203.5 | ) | (234.1 | ) | ||
| Net assets | $ | 439.1 | $ | 797.1 | ||
| Year ended | Year ended | |||||
| December 31, 2025 | December 31, 2024 | |||||
| Revenues | $ | 1,489.5 | $ | 1,084.3 | ||
| Net earnings (loss) and OCI | $ | 499.7 | $ | 277.5 | ||
| Net cash from (used in) operating activities | $ | 673.4 | $ | 444.6 | ||
| Net cash from (used in) investing activities | (137.3 | ) | (196.9 | ) | ||
| Net cash from (used in) financing activities | (468.8 | ) | (185.2 | ) | ||
| Net increase (decrease) in cash and cash equivalents | $ | 67.3 | $ | 62.5 |
The Company's ability to access or use the assets of Essakane to settle its liabilities is not significantly restricted by known current contractual or regulatory requirements, or from the protective rights of non-controlling interests. Dividends payable by Essakane must be approved by the Supervisory Boards, which includes representation from the non-controlling interest.
Euro Ressources
EURO Ressources S.A. ("EURO") is a French mining royalty and streaming company that was listed on the NYSE Euronext of Paris stock exchange under the symbol EUR. The Company owned 90% of EURO through its wholly owned subsidiary IAMGOLD France S.A.S. ("IAMGOLD France"), until February 27, 2024 when the Company completed the acquisition of all of the outstanding common shares of EURO that IAMGOLD France did not already own through a "squeeze-out" under French law, which was approved by the Autorité des marchés financiers on January 23, 2024. The Company paid cash consideration of €3.50 per share for an aggregate consideration of €21.9 million ($23.7 million). Following the acquisition, IAMGOLD France beneficially owns and controls 62.5 million common shares, representing 100% of the outstanding EURO shares.
The change in ownership interest in EURO was recorded as an equity transaction. Prior to the acquisition, the carrying amount of the non-controlling interests was $3.0 million. The difference between the carrying amount of the non-controlling interest of $3.0 million and cash consideration of $23.7 million resulted in a decrease in total equity of $20.7 million. Transaction costs of $1.2 million directly related to the acquisition resulted in a decrease in total equity.
25. Share-Based Compensation
| Years ended December 31, | ||||||||
| 2025 | 2024 | |||||||
| Options | $ | 1.2 | $ | 0.8 | ||||
| Share units | 7.1 | 5.4 | ||||||
| $ | 8.3 | $ | 6.2 | |||||
(a) Options
(i) Share option plan
The Company has a comprehensive share option plan for its full-time employees. The options vest over three or five years and expire no later than seven years from the grant date.
A maximum of 25,905,624 common shares have been reserved for issuance pursuant to the share option plan of which, as of December 31, 2025, 19,363,169 have been issued and 6,542,455 remain issuable. As of December 31, 2025, options to purchase 2,268,976 common shares were outstanding and options to purchase 4,273,479 common shares remained available for further grants under the plan.
| Year ended | Year ended | |||||||||||
| December 31, 2025 | December 31, 2024 | |||||||||||
| Weighted | Weighted | |||||||||||
| average | average | |||||||||||
| Options | exercise price | Options | exercise price | |||||||||
| (in millions) | (CAD/share)1 | (in millions) | (CAD/share) | |||||||||
| Outstanding, beginning of the year | 3.1 | $ | 4.13 | 5.2 | $ | 4.77 | ||||||
| Granted | 0.4 | 7.87 | 0.8 | 3.67 | ||||||||
| Exercised2 | (1.2 | ) | 4.76 | (1.6 | ) | 5.36 | ||||||
| Forfeited | (0.1 | ) | 4.05 | (0.3 | ) | 3.93 | ||||||
| Expired | - | - | (1.0 | ) | 5.24 | |||||||
| Outstanding, end of the year | 2.2 | $ | 4.53 | 3.1 | $ | 4.13 | ||||||
| Exercisable, end of the year | 1.0 | $ | 3.79 | 1.4 | $ | 4.57 | ||||||
1. Exercise prices are denominated in Canadian dollars. The USDCAD exchange rate at December 31, 2025 was $1.3715/CAD.
2. The weighted average share price on date of options exercised was CAD$12.20 (2024 - CAD$6.56).
The following table summarizes information related to options outstanding at December 31, 2025:
| Number | Weighted Average | Weighted Average | |||||||
| Range of Prices | Remaining | ||||||||
| Outstanding | Contractual Life | Exercise Price | |||||||
| CAD$/share | (millions) | (years) | (CAD$/share) | ||||||
| 1.01 - 5.00 | 1.8 | 4.0 | $ | 3.77 | |||||
| 5.01 - 10.00 | 0.4 | 6.2 | $ | 7.87 | |||||
| 2.2 | 4.4 | $ | 4.53 |
(ii) Fair value of options granted
The following were the weighted average inputs to the Black-Scholes model used in determining the fair value of the options granted during the year. The estimated fair value of the options is expensed over their expected life.
| Years ended December 31, | ||||||
| 2025 | 2024 | |||||
| Weighted average risk-free interest rate | 2.6 % | 3.7 % | ||||
| Weighted average expected volatility1 | 56.1 % | 58.3 % | ||||
| Weighted average dividend yield | - % | - % | ||||
| Weighted average expected life of options issued (years) | 4.5 | 4.5 | ||||
| Weighted average grant-date fair value (CAD per option) | $ | 3.85 | $ | 1.73 | ||
| Weighted average share price at grant date (CAD per share) | $ | 7.87 | $ | 3.50 | ||
| Weighted average exercise price (CAD per share) | $ | 7.87 | $ | 3.67 | ||
1. Expected volatility is estimated by considering historical average share price volatility based on the average expected life of the options.
(b) Other share-based compensation
(i) Share incentive plans
A maximum of 32,406,762 common shares have been reserved for issuance under the share purchase plan, the share bonus plan and the share unit plan of which, as of December 31, 2025, 14,723,510 have been issued and 17,683,252 remain issuable. As of December 31, 2025, an additional 5,130,729 common shares were subject to outstanding restricted share units, performance share units and deferred share units grants and 12,552,523 common shares remained available for further grants under these plans.
A summary of the status of the Company's outstanding share units issued to directors and employees under the Company's share incentive plan and changes during the year is presented below.
| Years ended December 31, | ||||||
| (in millions) | 2025 | 2024 | ||||
| Outstanding, beginning of the year | 6.7 | 6.1 | ||||
| Granted | 1.6 | 2.7 | ||||
| Issued | (2.2 | ) | (1.4 | ) | ||
| Forfeited | (1.0 | ) | (0.7 | ) | ||
| Outstanding, end of the year | 5.1 | 6.7 | ||||
(ii) Summary of share units granted Deferred share units
Directors can elect to receive the equity portion of their annual retainer in the form of deferred share units. Upon a director leaving the Board, the Company will issue that number of common shares equivalent to that number of deferred share units granted. As the deferred share units are equity settled, the cost to the Company is based on the grant date fair value.
The estimated fair value of the awards is expensed immediately.
| Years ended December 31, | |||||||
| 2025 | 2024 | ||||||
| Granted during the year (in millions) | 0.2 | 0.2 | |||||
| Grant-date fair value (CAD per unit)1 | $ | 12.9 | $ | 5.71 | |||
1. The grant-date fair value is equal to the share price on grant date.
Restricted share units
Executive officers and certain employees are granted restricted share units on an annual basis.
Employee restricted share unit grants vest over twelve to thirty-six months, have no restrictions upon vesting and are equity settled. There are no cash settlement alternatives and no vesting conditions other than service.
Restricted share units are granted to employees based on a fixed percentage which is reviewed on an annual basis by the Human Resources and Compensation Committee of the Board of Directors. The number of restricted share units granted is determined as part of the employees' overall compensation.
The estimated fair value of the awards is expensed over their vesting period.
| Years ended December 31, | |||||||
| 2025 | 2024 | ||||||
| Granted during the year (in millions) | 0.7 | 1.8 | |||||
| Grant-date fair value (CAD per unit)1 | $ | 8.0 | $ | 3.69 | |||
1. The grant-date fair value is equal to the share price on grant date.
Performance share units
Executive officers and certain employees are granted performance share units on an annual basis.
The performance share unit grants vest over thirty-six months and are equity settled. There are no cash settlement alternatives for these grants.
Performance share units are granted based on performance objectives and criteria determined on an annual basis based on guidelines established by the Human Resources and Compensation Committee of the Board of Directors. The number of performance share units granted is determined as part of the employees' overall compensation.
The estimated fair value of the awards is expensed over their vesting period.
| Years ended December 31, | ||||||||
| 2025 | 2024 | |||||||
| Granted during the year (in millions)1 | 0.7 | 0.7 | ||||||
| Grant-date fair value (CAD per unit)2 | $ | 8.0 | $ | 3.50 | ||||
1. Includes 0.4 million incremental units of performance-factor adjustments recognized as part of the final PSU performance outcomes.
2. The grant-date fair value was determined using a Monte Carlo model.
(c) Share purchase plan
The Company has a share purchase plan for employees with more than three months of continuous service. Participants determine their contribution as a whole percentage of their base salary from 1% to 10%. The Company matches 75% of the first 5% of employee contributions, to a maximum of 3.75% of the employee's salary, towards the purchase of shares on the open market. No shares are issued from treasury under the share purchase plan. The Company's contribution is expensed and is considered vested on December 31 of each calendar year.
26. Cost of Sales
| Years ended December 31, | |||||||
| Notes | 2025 | 2024 | |||||
| Operating costs1 | $ | 1,027.8 | $ | 715.1 | |||
| Royalties | 36(b) | 197.9 | 94.2 | ||||
| Depreciation expense | 420.9 | 273.8 | |||||
| $ | 1,646.6 | $ | 1,083.1 | ||||
1. Operating costs include mine production, transport and smelter costs, and site administrative expenses.
27. General and Administrative Expenses
| Years ended December 31, | |||||||
| Notes | 2025 | 2024 | |||||
| Salaries | $ | 24.3 | $ | 24.8 | |||
| Restructuring costs | 2.7 | 5.4 | |||||
| Directors' fees and expenses | 0.7 | 1.0 | |||||
| Professional and consulting fees | 13.3 | 6.0 | |||||
| Software and Technology costs | 7.1 | 2.6 | |||||
| Other administration costs | 3.1 | 4.1 | |||||
| Share-based compensation | 6.8 | 5.0 | |||||
| (Gain) loss on cash flow hedges | 0.4 | - | |||||
| $ | 58.4 | $ | 48.9 | ||||
28. Impairment Reversal (Charge)
| Years ended December 31, | ||||||
| 2025 | 2024 | |||||
| Fayolle | ||||||
| Mining properties | $ | - | $ | (6.8 | ) | |
| Westwood CGU | ||||||
| Mining properties, Plant and equipment and ROU assets | - | 426.5 | ||||
| Asset retirement obligations | - | 35.8 | ||||
| Exploration Assets held for Sale (note 6) | (12.2 | ) | - | |||
| $ | (12.2 | ) | $ | 455.5 | ||
The Company performs impairment testing for its property, plant and equipment and exploration assets when indicators of potential impairment or reversal of previously recognized impairment are identified.
During the second quarter 2024, the Company ceased mining activity at the Fayolle property and therefore does not expect to realize a future economic benefit from Fayolle. As a result the full mining properties balance was impaired to $nil.
During the third quarter 2024, the Company assessed that the increase in the long-term consensus price of gold to be an indicator of impairment reversal for the Westwood CGU. As a result, an assessment of the recoverable amount of the Westwood CGU was performed. It was determined that the recoverable amount exceeded the carrying amount plus the prior impairments recorded on the Westwood CGU and the Company recorded a $462.3 million reversal in the consolidated statements of earnings (loss).
The recoverable amount of the Westwood CGU was determined by calculating the fair value less cost of disposal ("FVLCD"). The FVLCD was determined by calculating the net present value of the estimated future cash flows using the Company's internal life of mine plan (level 3 of the fair value hierarchy). The significant estimates and assumptions used in determining the FVLCD were the life of mine production profile (including assumptions around conversion of resources into reserves), future operating and capital expenditures, gold prices, future foreign exchange rates and the discount rate.
The future cash flows used to calculate the FVLCD were discounted using a real discount rate of 5.5%, which reflects specific market risk factors and risks inherent to the Westwood CGU.
29. Other (Income) Expenses
| Years ended December 31, | |||||||
| Notes | 2025 | 2024 | |||||
| Changes in asset retirement obligations at closed mines | 14(a) | $ | 8.0 | $ | (13.4 | ) | |
| Write-down of assets | 3.6 | 0.9 | |||||
| Other | 3.2 | 3.3 | |||||
| $ | 14.8 | $ | (9.2 | ) | |||
30. Finance Costs
| Years ended December 31, | |||||||
| Notes | 2025 | 2024 | |||||
| Interest expense | $ | 110.2 | $ | 95.9 | |||
| Accretion expense - gold prepayment | 19 | 3.2 | 15.9 | ||||
| Repurchase option fee | 7 | - | 32.7 | ||||
| Credit Facility fees | 4.0 | 6.2 | |||||
| Prepayment premium on second lien term loan | 18(c) | 16.0 | - | ||||
| Accretion expense - asset retirement obligations | 14(a) | 5.3 | 5.7 | ||||
| Other finance costs | 8.9 | 12.9 | |||||
| $ | 147.6 | $ | 169.3 | ||||
| Borrowing costs attributable to qualifying assets | $ | (35.4 | ) | $ | (98.5 | ) | |
| $ | 112.2 | $ | 70.8 | ||||
| Interest paid1 | $ | 99.2 | $ | 91.6 | |||
1. Interest paid relates to interest charges on the Company's 5.75% senior notes, Term Loan, Credit Facility, equipment loans and leases.
31. Interest Income, Derivatives and Other Investment Gains (Losses)
| Years ended December 31, | |||||||
| Notes | 2025 | 2024 | |||||
| Interest income | $ | 8.1 | $ | 16.1 | |||
| Insurance recoveries | - | 27.3 | |||||
| Gains (losses) on non-hedge derivatives | (26.7 | ) | 16.1 | ||||
| Amortization of gain related to flow-through common shares | 1.9 | 1.1 | |||||
| 9.7% of Côté Gold pre-Commercial Production gold received by SMM | 7 | - | 18.4 | ||||
| 9.7% of Côté Gold expenses funded by SMM | - | (6.6 | ) | ||||
| Changes in fair value of deferred consideration from the sale of | 2.0 | 1.8 | |||||
| Sadiola | |||||||
| Gain on sale of royalties | 4.9 | - | |||||
| Other gains (losses) | (1.2 | ) | (3.3 | ) | |||
| $ | (11.0 | ) | $ | 70.9 | |||
During the second quarter 2025, the Company sold 13 royalties on various non-core exploration and development properties for cash consideration of $11.9 million and 11.5 million shares in Summit Royalty for total consideration of $19.4 million. The Company recognized a gain of $4.9 million.
For the year ended December 31, 2025, gains (losses) on non-hedge derivatives include $(26.7) million (December 31, 2024 - $21.6 million) of losses that relate to fair value movements of the embedded derivative related to prepayment options for the Term Loan (note 18(c)).
During the year ended December 31, 2024, the Company received proceeds of $27.3 million upon finalizing an insurance settlement agreement relating to the property and business interruption loss arising from the October 30, 2020 seismic event at the Westwood mine.
32. Expenses by Nature
The following employee benefits expenses are included in cost of sales, general and administrative expenses, exploration expenses and other expenses.
| Years ended December 31, | ||||||||
| 2025 | 2024 | |||||||
| Salaries, short-term incentives, and other benefits | $ | 247.3 | $ | 213.7 | ||||
| Share-based compensation | 8.1 | 5.7 | ||||||
| Other | 4.5 | 6.4 | ||||||
| $ | 259.9 | $ | 225.8 | |||||
33. Earnings Per Share
(a) Basic earnings (loss) per share computation
| Years ended December 31, | ||||||||
| 2025 | 2024 | |||||||
| Numerator | ||||||||
| Net earnings (loss) attributable to equity holders | $ | 664.4 | $ | 819.6 | ||||
| Denominator (in millions) | ||||||||
| Weighted average number of common shares (basic) | 575.1 | 539.8 | ||||||
| Basic earnings (loss) per share attributable to equity holders | $ | 1.16 | $ | 1.52 | ||||
(b) Diluted earnings (loss) per share computation
| Years ended December 31, | ||||||||
| 2025 | 2024 | |||||||
| Denominator (in millions) | ||||||||
| Weighted average number of common shares (basic) | 575.1 | 539.8 | ||||||
| Dilutive effect of options | 1.6 | 0.7 | ||||||
| Dilutive effect of share units | 5.0 | 5.4 | ||||||
| Weighted average number of common shares (diluted) | 581.7 | 545.9 | ||||||
| Diluted earnings (loss) per share attributable to equity holders | $ | 1.14 | $ | 1.50 | ||||
Equity instruments excluded from the computation of diluted earnings (loss) per share which could be dilutive in the future were as follows:
| Years ended December 31, | ||||||||
| (in millions) | 2025 | 2024 | ||||||
| Options | - | 0.2 | ||||||
34. Cash Flow Items
(a) Adjustments for other non-cash items within operating activities
| Years ended December 31, | |||||||
| Notes | 2025 | 2024 | |||||
| Share-based compensation | $ | 8.3 | $ | 5.7 | |||
| 9.7% of Côté Gold pre-Commercial Production gold received by SMM | 31 | - | (18.4 | ) | |||
| 9.7% of Côté Gold expenses funded by SMM | 31 | - | 6.6 | ||||
| Write-down of assets | 3.6 | 0.9 | |||||
| Write-down (reversal) of inventories | 3.8 | 3.6 | |||||
| Changes in estimates of asset retirement obligations at closed sites | 29 | 8.0 | (13.4 | ) | |||
| Interest income | 31 | (8.1 | ) | (16.1 | ) | ||
| Changes in fair value of deferred consideration from the sale of Sadiola | 31 | (2.0 | ) | (1.8 | ) | ||
| Gain on sale of royalties | 31 | (4.9 | ) | - | |||
| Amortization of gains related to flow-through common shares | 31 | (1.9 | ) | (1.1 | ) | ||
| Effects of exchange rate fluctuation on cash and cash equivalents | (19.5 | ) | 7.0 | ||||
| Effects of exchange rate fluctuation on restricted cash | (7.5 | ) | 4.1 | ||||
| Insurance recoveries | 31 | - | (27.3 | ) | |||
| Employee service provision | 3.0 | 2.6 | |||||
| Other | 19.2 | (12.6 | ) | ||||
| $ | 2.0 | $ | (60.2 | ) | |||
(b) Movements in non-cash working capital items and non-current ore stockpiles
| Years ended December 31, | |||||||
| 2025 | 2024 | ||||||
| Receivables and other current assets | $ | (11.9 | ) | $ | (45.6 | ) | |
| Inventories and non-current ore stockpiles | (105.9 | ) | (51.4 | ) | |||
| Accounts payable and accrued liabilities | 56.0 | (17.4 | ) | ||||
| $ | (61.8 | ) | $ | (114.4 | ) | ||
(c) Other investing activities
| Years ended December 31, | |||||||
| Notes | 2025 | 2024 | |||||
| Interest received | $ | 8.2 | $ | 12.6 | |||
| (Increase) decrease in restricted cash | 4.9 | 0.8 | |||||
| Capital expenditures for exploration and evaluation assets | 12 | (8.1 | ) | (0.5 | ) | ||
| (Acquisition)/Disposal of marketable securities | 12.5 | 7.0 | |||||
| Securitization of VAT into Government of Burkina Faso Bonds | (25.5 | ) | - | ||||
| Settlement of Yatela Sale | (18.2 | ) | - | ||||
| Proceeds from sale of royalties | 11.9 | - | |||||
| Other | (5.1 | ) | (1.4 | ) | |||
| $ | (19.4 | ) | $ | 18.5 | |||
(d) Other financing activities
| Years ended December 31, | |||||||
| Notes | 2025 | 2024 | |||||
| Proceeds from issuance of flow-through common shares | 23(b) | $ | 6.8 | $ | 5.9 | ||
| Repayment of equipment loans | 18(d) | (1.3 | ) | (5.1 | ) | ||
| Payment of lease obligations | 15 | (31.7 | ) | (20.6 | ) | ||
| Common shares issued for cash on exercise of stock options | 3.9 | 6.1 | |||||
| Payment of repurchase option fee | 7 | - | (32.7 | ) | |||
| Other | (12.1 | ) | (13.5 | ) | |||
| $ | (34.4 | ) | $ | (59.9 | ) | ||
(e) Reconciliation of long-term debt arising from financing activities
| 5.75% | |||||||||||||||
| Equipment | senior | Credit | |||||||||||||
| loans | notes | facility | Term Loan | Total | |||||||||||
| Balance, January 1, 2024 | $ | 7.2 | $ | 448.0 | $ | - | $ | 375.6 | $ | 830.8 | |||||
| Cash changes: | |||||||||||||||
| Proceeds | - | - | 280.0 | - | 280.0 | ||||||||||
| Repayments | (5.1 | ) | - | (60.0 | ) | - | (65.1 | ) | |||||||
| Non-cash changes: | |||||||||||||||
| Amortization of deferred financing charges | - | 0.9 | - | 4.4 | 5.3 | ||||||||||
| Change in fair value of embedded derivative | - | - | - | (21.6 | ) | (21.6 | ) | ||||||||
| Other | - | (0.5 | ) | - | - | (0.5 | ) | ||||||||
| Balance, December 31, 2024 | $ | 2.1 | $ | 448.4 | $ | 220.0 | $ | 358.4 | $ | 1,028.9 | |||||
| Cash changes: | |||||||||||||||
| Proceeds | - | - | 130.0 | - | 130.0 | ||||||||||
| Repayments | (1.3 | ) | - | (150.0 | ) | (400.0 | ) | (551.3 | ) | ||||||
| Non-cash changes: | |||||||||||||||
| Amortization of deferred financing charges | - | 1.0 | - | 15.6 | 16.6 | ||||||||||
| Foreign currency translation | 0.2 | - | - | - | 0.2 | ||||||||||
| Change in fair value of embedded derivative | - | - | - | 26.7 | 26.7 | ||||||||||
| Other | - | (0.6 | ) | - | (0.7 | ) | (1.3 | ) | |||||||
| Balance, December 31, 2025 | $ | 1.0 | $ | 448.8 | $ | 200.0 | $ | - | $ | 649.8 |
35. Segmented Information
The Company's gold mines are divided into geographic segments as follows:
• Côté Gold mine - Ontario, Canada;
• Westwood complex - Quebec, Canada; and
• Essakane mine - Burkina Faso.
The Company's non-gold mine segments are divided as follows:
• Exploration and evaluation and development; and
• Corporate.
| December 31, 2025 | December 31, 2024 | |||||||||||||||||
| Total non- | Total | Total | Total non- | Total | Total | |||||||||||||
| current | current | |||||||||||||||||
| assets | assets | liabilities | assets | assets | liabilities | |||||||||||||
| Gold mines | ||||||||||||||||||
| Côté Gold | $ | 2,881.8 | $ | 3,053.2 | $ | 276.9 | $ | 2,887.0 | $ | 3,016.0 | $ | 227.3 | ||||||
| Westwood complex | 801.0 | 841.2 | 233.6 | 788.0 | 822.2 | 199.7 | ||||||||||||
| Essakane | 825.0 | 1,307.5 | 310.0 | 882.2 | 1,206.2 | 281.9 | ||||||||||||
| Total gold mines | 4,507.8 | 5,201.9 | 820.5 | 4,557.2 | 5,044.4 | 708.9 | ||||||||||||
| Exploration and evaluation and development | 388.0 | 418.7 | 14.9 | 74.4 | 77.7 | 9.3 | ||||||||||||
| Corporate | 53.0 | 231.9 | 771.2 | 74.5 | 252.3 | 1,255.5 | ||||||||||||
| Total | $ | 4,948.8 | $ | 5,852.5 | $ | 1,606.6 | $ | 4,706.1 | $ | 5,374.4 | $ | 1,973.7 | ||||||
Year ended December 31, 2025
| Consolidated statements of earnings (loss) information | ||||||||||||||||||||||||||||
| Cost of | Depreciation | General | Earnings | Capital | ||||||||||||||||||||||||
| Revenues | and | Exploration | Impairment | Other | (loss) from | |||||||||||||||||||||||
| sales1 | expense | administrative3 | operations | expenditures2 | ||||||||||||||||||||||||
| Gold mines | ||||||||||||||||||||||||||||
| Côté Gold5 | $ | 1,014.4 | $ | 360.8 | $ | 177.8 | $ | - | $ | 8.9 | $ | - | $ | 2.3 | $ | 464.6 | $ | 127.5 | ||||||||||
| Westwood complex | 403.0 | 175.7 | 54.9 | - | - | - | 1.0 | 171.4 | 65.4 | |||||||||||||||||||
| Essakane | 1,489.5 | 689.2 | 186.3 | - | - | - | 5.9 | 608.1 | 114.3 | |||||||||||||||||||
| Total gold mines | 2,906.9 | 1,225.7 | 419.0 | - | 8.9 | - | 9.2 | 1,244.1 | 307.2 | |||||||||||||||||||
| Exploration and evaluation | - | - | - | 18.3 | 12.2 | 0.5 | (31.0 | ) | - | |||||||||||||||||||
| and development | - | |||||||||||||||||||||||||||
| Corporate3 | (54.1 | ) | - | 1.9 | 58.4 | - | - | 5.1 | (119.5 | ) | 0.1 | |||||||||||||||||
| Total | $ | 2,852.8 | $ | 1,225.7 | $ | 420.9 | $ | 58.4 | $ | 27.2 | $ | 12.2 | $ | 14.8 | $ | 1,093.6 | $ | 307.3 | ||||||||||
1. Excludes depreciation expense.
2. Includes incurred capital expenditures for property, plant and equipment, exploration and evaluation assets at the Company's gold mines, and excludes capitalized study costs, acquisition of Nelligan assets, capitalized borrowing costs and ROU assets. Côté Gold is presented at 70%.
3. Includes impact on revenues of delivering ounces into gold sale prepayment arrangements (note 19) and earnings from royalty interests.
Year ended December 31, 2024
| Consolidated statements of earnings (loss) information | |||||||||||||||||||||||||||
| Cost of | Depreciation | General | Impairment | Earnings | Capital | ||||||||||||||||||||||
| Revenues | and | Exploration | Other | (loss) from | |||||||||||||||||||||||
| sales1 | expense2 | administrative3 | (reversal) | operations | expenditures4 | ||||||||||||||||||||||
| Gold mines | |||||||||||||||||||||||||||
| Côté Gold5 | $ | 284.3 | $ | 115.0 | $ | 56.7 | $ | - | $ | 6.5 | $ | - | $ | 0.5 | $ | 105.6 | $ | 268.8 | |||||||||
| Westwood complex | 323.0 | 157.5 | 53.7 | - | - | (455.5 | ) | (11.6 | ) | 578.9 | 66.1 | ||||||||||||||||
| Essakane | 1,083.2 | 536.8 | 162.3 | - | - | - | (0.3 | ) | 384.4 | 185.5 | |||||||||||||||||
| Total operating gold mines | 1,690.5 | 809.3 | 272.7 | - | 6.5 | (455.5 | ) | (11.4 | ) | 1,068.9 | 520.4 | ||||||||||||||||
| Exploration and evaluation and development | - | - | - | - | 15.2 | - | 0.7 | (15.9 | ) | - | |||||||||||||||||
| Corporate6 | (57.5 | ) | - | 1.1 | 48.9 | - | - | 1.5 | (109.0 | ) | 1.6 | ||||||||||||||||
| Total | $ | 1,633.0 | $ | 809.3 | $ | 273.8 | $ | 48.9 | $ | 21.7 | $ | (455.5 | ) | $ | (9.2 | ) | $ | 944.0 | $ | 522.0 | |||||||
1. Excludes depreciation expense.
2. Depreciation expense excludes depreciation related to corporate office assets, which is included in general and administrative expenses.
3. Includes depreciation expense relating to corporate and exploration and evaluation assets.
4. Includes incurred capital expenditures for property, plant and equipment and exploration and evaluation assets and excludes capitalized borrowing costs and ROU assets. Côté Gold is presented at 70%.
5. Revenue and expenses include 60.3% of the Côté Gold UJV balances. 9.7% of the revenue and expenses from the Côté Gold UJV, $18.4 million and $6.6 million respectively, are included in interest income, derivatives and other investment gains (losses) as this was funded by SMM.
6. Includes impact on revenues of delivering ounces into gold sale prepayment arrangements (note 19) and earnings from royalty interests.
36. Commitments
| December 31, | December 31, | |||||
| 2025 | 2024 | |||||
| Purchase obligations | $ | 180.6 | $ | 155.0 | ||
| Capital expenditure obligations | 37.4 | 117.2 | ||||
| Lease obligations | 118.9 | 142.8 | ||||
| $ | 336.9 | $ | 415.0 |
(a) Commitments - payments due by period
| As at December 31, 2025 | Total | 1 yr1 | 2-3 yrs2 | 4-5 yrs3 | >5 yrs4 | ||||||||||
| Purchase obligations | $ | 180.6 | $ | 169.1 | $ | 5.4 | $ | 2.2 | $ | 3.9 | |||||
| Capital expenditure obligations | 37.4 | 37.4 | - | - | - | ||||||||||
| Lease obligations | 118.9 | 3.9 | 79.9 | 27.7 | 7.4 | ||||||||||
| $ | 336.9 | $ | 210.4 | $ | 85.3 | $ | 29.9 | $ | 11.3 |
1. Due over the period from January 1, 2026 to December 31, 2026.
2. Due over the period from January 1, 2027 to December 31, 2028.
3. Due over the period from January 1, 2029 to December 31, 2030.
4. Due from January 1, 2031 and beyond.
(b) Royalties included in Cost of sales
Production from certain mining operations is subject to third party royalties (included in cost of sales) based on various methods of calculation summarized as follows:
| December 31, | December 31, | |||||
| 2025 | 2024 | |||||
| Côté Gold | $ | 70.5 | $ | 19.4 | ||
| Westwood | - | 0.3 | ||||
| Essakane | 127.4 | 74.5 | ||||
| $ | 197.9 | $ | 94.2 |
37. Related Party Transactions
(a) Receivables from related parties
The Company had no receivables from related parties during the years ended December 31, 2025 and 2024.
(b) Compensation of key management personnel
Compensation breakdown for key management personnel, comprising of the Company's directors and executive officers, is as follows:
| Years ended December 31, | ||||||||
| 2025 | 2024 | |||||||
| Salaries and other benefits | $ | 5.1 | $ | 5.5 | ||||
| Retirement benefits | 2.7 | 0.7 | ||||||
| Share-based payments | 3.9 | 3.2 | ||||||
| $ | 11.7 | $ | 9.4 | |||||
![]()
IAMGOLD 2025 Fighting Against Forced Labour and Child Labour in Supply Chains Act Report
Message from our CEO
At IAMGOLD, we are committed to fostering a culture of responsibility, accountability, and innovation across our operations. This commitment is reflected in our environmental, social, and governance (ESG) practices, our active participation in the Mining Association of Canada's Towards Sustainable Mining Initiative, adherence to the World Gold Council's Responsible Gold Mining Principles and Conflict-Free Gold Standard®, and in the way we have worked with key industry groups to support the Consolidated Mining Standard Initiative (CMSI), already working towards integrating the CMSI into the way we work.
With operations in North America and Africa, and exploration activities extending into South America, we recognize that our influence reaches beyond the physical boundaries of our mines. As such, we recognize the importance of preventing, mitigating and managing risks across our global supply chain. The risk of forced labour and child labour is real in today's world, and we are committed to doing our part.
We believe in and follow internationally recognized human rights principles and expect the same from our employees, contractors, and suppliers. To identify, prevent and mitigate the risks of forced labour and child labour within our activities and throughout our supply chain, we have implemented key policies and processes at both the corporate and site levels to guide our approach.
For 2025, we continued to work on improving our human rights due diligence and controls. Key actions we took included:
• After completing our inherent risk assessment in 2024, we finalized the residual risk assessment this year for more than 500 tier 1 and high risk suppliers, further improving our supply chain due diligence program;
• Developed a remediation framework;
• Developed training materials on human rights and modern slavery for our global and site contracting and procurement teams and;
• Onboarded new supplier due diligence software that will enable us to better assess and mitigate modern slavery risks, which is set to go live the second quarter of 2026.
Addressing the risks of forced labour and child labour within our supply chain is a responsibility we take seriously. In 2026, we will begin implementing the priority controls identified through the residual risk assessment, continue strengthening our human rights due diligence processes, and enhance engagement with higher risk suppliers to support improved labour rights practices.
Sincerely,
Renaud Adams
President and CEO
About this report1
This Report constitutes IAMGOLD Corporation's ("IAMGOLD" or the "Company" or "we" or "our") third annual Report prepared under section 6(2) of the Fighting Against Forced Labour and Child Labour in Supply Chains Act ("Act"). It covers the Company's most recently completed financial year ending on December 31, 2025 ("Reporting Period"). The Report outlines the steps IAMGOLD has taken during the Reporting Period to prevent and reduce the risk that forced labour or child labour is used at any step of the production of goods in Canada or elsewhere by the entity or of goods imported into Canada by the Company. This Fighting Against Forced Labour and Child Labour in Supply Chains Act Report ("Report")2 is part of our annual reporting suite. Additional reports, including our Sustainability-related Reports can be found on our website.
FY2025 KEY HIGHLIGHTS
1. Steps taken during our previous financial year
We are committed to maintaining our culture of accountable mining through high standards of environmental, social and governance ("ESG") practices. This Report specifically reflects our commitment to respecting internationally recognized human rights. We are guided by the United Nations Guiding Principles on Business and Human Rights and are committed to establishing an organizational culture that respects internationally recognized human rights as set forth in the Universal Declaration of Human Rights and the International Labour Organization's Declaration on Fundamental Principles and Rights at Work. We expect all our employees and business partners, including contractors and suppliers, to respect internationally recognized human rights.
_____________________________________
1. Financial Information: All financial information is reported in US dollars (USD) unless otherwise stated.
2. IAMGOLD has prepared this Report based on information available to it at the time of preparation. This Report contains information or statements that express expectations or estimates of future performance, and all information or statements, other than statements of historical fact, constitutes forward-looking information or forward-looking statements within the meaning of applicable securities laws. Forward-looking statements may include, but are not limited to, statements relating to IAMGOLD's policies and practices with respect to forced labour and child labour risk management, including statements of current intention and expectation and statements of opinion. Forward-looking statements are generally identifiable by the use of words such as "may", "will", "should", "would", "could", "continue", "expect", "aim", "anticipate", "estimate", "strive", or "plan", or the negative of these words or other variations on these words or comparable terminology. There can be no assurance that such statements will prove to be accurate, as IAMGOLD's actual results and future events could differ materially from those anticipated in this forward-looking information because of the factors discussed in the "Risk Factors" section in IAMGOLD's Annual Information Form, which is available at www.iamgold.com or on SEDAR+ at www.sedarplus.ca. Except as required by applicable laws or regulations, IAMGOLD does not undertake to publicly update or review any forward-looking statements.
During the Reporting Period, we built upon our initial efforts to prevent and reduce the risk of forced labour or child labour within our business activities and supply chains.
Our key achievements for this financial year are illustrated above.
1.1 Structure
IAMGOLD is an intermediate gold producer and developer based in Canada with operating mines in North America and West Africa, including Côté Gold (Canada), Westwood (Canada), and Essakane (Burkina Faso).
The Côté Gold Mine achieved full production capacity in June 2025 and has the potential to be among the largest gold mines in Canada. IAMGOLD operates Côté Gold in partnership with Sumitomo Metal Mining Co. Ltd. In addition, the Company has an established portfolio of early stage and advanced exploration projects within high potential mining districts, including the Nelligan Mining Complex located in Québec, Canada. IAMGOLD employs approximately 4,600 people and is committed to maintaining its culture of accountable mining through high standards of ESG practices. IAMGOLD is listed on the New York Stock Exchange (NYSE: IAG) and the Toronto Stock Exchange (TSX: IMG).
The following graphic illustrates IAMGOLD's subsidiaries and divisions, together with the jurisdiction of incorporation of each such subsidiary, the projects held through each subsidiary or division and the percentage of ownership interest that the relevant subsidiary or division of IAMGOLD maintains.
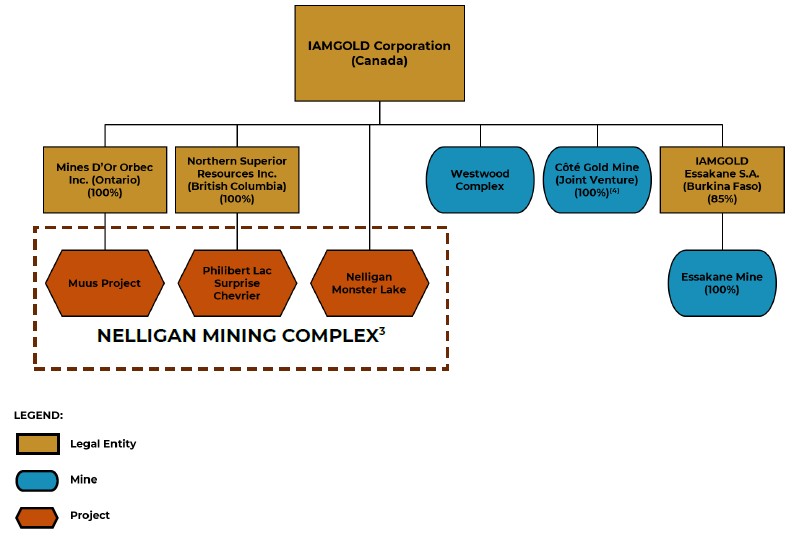
 |
The WGC champions the role gold plays as a strategic asset, shaping the future of a responsible and accessible gold supply chain. The WGC's Responsible Gold Mining Principles (RGMPs) establish a set of required practices for its members across all ESG aspects of gold mining. Additionally, the WGC's Conflict-Free Gold (CFG) Standard® helps companies to provide assurance that their gold is not contributing to conflict. IAMGOLD's RGMP and CFG reports are both externally assured. |
 |
The Mining Associate of Canada ("MAC") promotes a strong, sustainable mining industry that benefits all Canadians and supports continued prosperity across the country. MAC's Towards Sustainable Mining ("TSM") initiative is a globally recognized sustainability program that supports mining companies in the management of key environmental and social risks. As a member of MAC, the Company participates in the TSM initiative at its Westwood operation (Quebec), as well as internationally at Essakane (Burkina Faso), which exceeds MAC's requirements of reporting only on Canadian operations. The 2025 self-assessment results are available on the MAC TSM website. |
IAMGOLD is an active member of the World Gold Council (WGC) and the Mining Association of Canada (MAC).
1.2 Governance
Sustainability governance is overseen by the Board of Directors of IAMGOLD (the "Board") and integrated throughout our organization. The Board considers ESG central to IAMGOLD's strategy and performance. The Board oversees and monitors the Company's strategy, policies and standards, and practices through its five committees: Audit and Finance Committee, Human Resources and Compensation Committee, Nominating and Corporate Governance Committee, Sustainability Committee, and Technical Committee. The Sustainability Committee assists the Board in fulfilling its responsibilities under its mandate and applicable laws and regulations in respect of health, safety and security ("HSS") and ESG matters (including human rights and modern slavery) at all of the Company's operations, projects and properties. The Board and its Committees receive regular updates on the Company's activities and risks, including those related to ESG, on a monthly, quarterly, and yearly basis or as needed. The Board meets at least quarterly and holds additional ad hoc meetings for other matters when necessary.
In order to support our employees and contractors endorse and implement human rights principles, we have established key roles and responsibilities within the organization. The Executive Leadership Team has overall accountability for our approach to human rights and security, and is responsible for ensuring that policies, processes and tools are in place.
____________________________________
3. Sumitomo Metal Mining Co., Ltd. holds a 30% interest in the Côte Gold Mine.
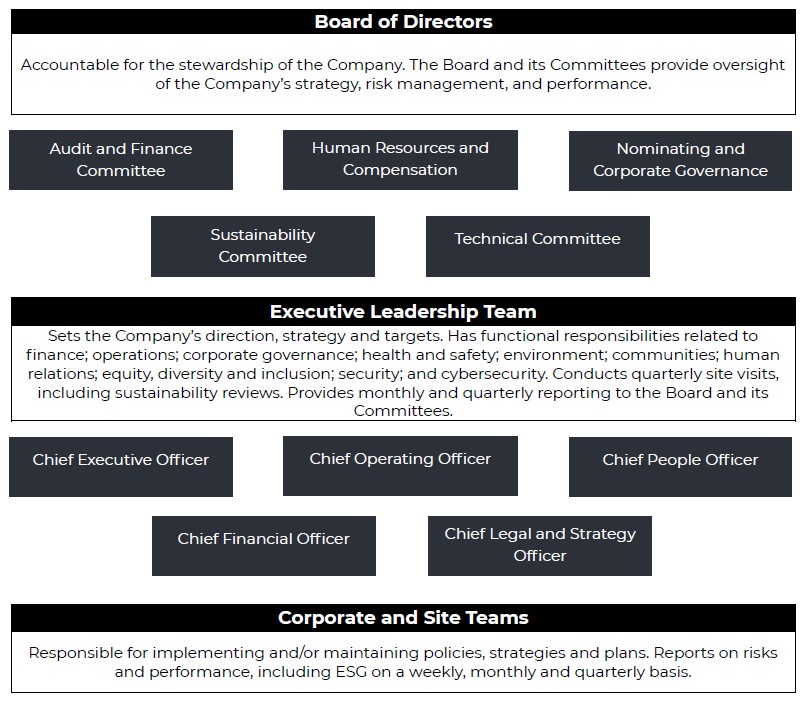
1.3 Activities
IAMGOLD has three active operating mines: Côté Gold in Ontario, Canada, Westwood in Quebec, Canada, and Essakane in Burkina Faso. Across our three mine sites, the 2025 global operation production saw 399,800 attributable ounces of gold produced.
| Mine | Côté Gold | Westwood | Essakane |
| Location | Ontario, Canada | Quebec, Canada | Burkina Faso, West Africa |
| Commodity | Gold | Gold | Gold |
| Ownership | 70% | 100% | 100%4 |
| Type of mine | Open pit | Underground and satellite open pit |
Open pit |
| Mineral processing |
Crushing; grinding; gravity concentration; ore leaching; carbon-in-pulp recovery; electrowinning; and smelting to doré | Crushing; grinding; carbon-in-pulp recovery; stripping; and smelting to doré | Crushing; grinding; gravity concentration; carbon-in-pulp recovery; electrowinning; and smelting to doré |
| Life of mine | Approximately 2041+ | Approximately 2033 | Approximately 2028 |
| Infrastructure | Open pit mine; mine rock area; ore stockpile; processing plant, tailings management facility; overburden stockpile; emulsion facility; accommodations complex; internal access roads; and gatehouses | Underground mine; Grand Duc open pit satellite deposit, waste rock storage facilities; tailings storage facilities; paste backfill plant; water management facility; office complex; and gate house | Three open pits; waste rock storage facilities; ore stockpiles; ore processing facilities; tailings storage facility; power generating plants, including a solar plant; maintenance workshops; airstrip and camp |
The Company also has an established portfolio of early stage and advanced exploration projects within high potential mining districts. Exploration plays a vital role in mining by enabling the identification and evaluation of mineral deposits. It requires significant time, resources and expertise to allow companies to make informed decisions on the mineral deposits, assess their quality and quantity and determine economic viability. In 2025, IAMGOLD grew its exploration activities ranging from greenfield early-stage exploration in Ontario, Quebec and Peru to more advanced deposit delineating drilling at our Côté Gold and Essakane mine sites.
__________________________________
4. The Global Industry Classification Standard (GICS) is a system used to categorize companies by sector, industry group, industry, and sub- industry. It was developed in 1999 by MSCI and Standard & Poor's (S&P) for use by the global financial community. The GICS structure consists of 11 sectors, 25 industry groups, 74 industries, and 163 sub-industries. In order to map our supply chain and conduct the risk assessments, we used the 2018 GICS codes.
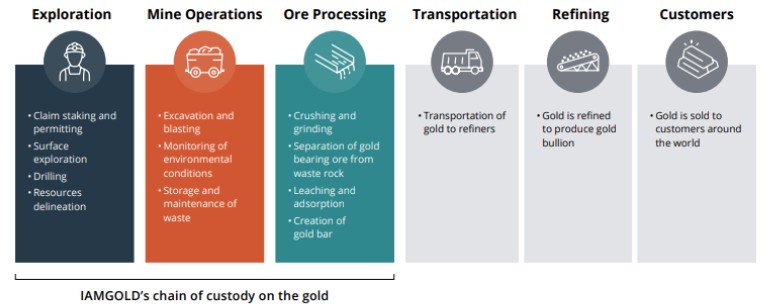
1.3 Supply chain
IAMGOLD's supply chain is global, diverse and dynamic. It spans continents and encompasses goods used for exploration and processing to transportation and refining. It includes a diversity of suppliers, subcontractors, intermediaries and stakeholders involved in each stage of the supply chain.
With the support of a third-party system solution, we mapped our supply chain using the Global Industry Classification Standard (GICS).5 This included aligning 92% of IAMGOLD's procurement spend to GICS sub- industry codes for a sample of our tier 1 suppliers with a net spend threshold of approximately $290,000 or more. In 2025, we expanded that mapping further, which enabled us to input all of our active suppliers and monitor their risk level in real time. The results of such mapping reflected the following statistics being High risk: 75, Medium/low risk: 2,161 and undefined (no information found): 1,257. Additionally, it encompassed tier 1 suppliers operating in high-risk industries (outlined in Section 3) and accounted for expenditures related to government entities. Amongst this segment of our supply chain, we procured the goods from suppliers operating across 6 continents - North America, South America, Europe, Asia, Africa, Oceania.
Top categories of our procurement spend
The majority of our procurement spend can be categorized into the following sub-industries as defined by the Global Industry Classification Standard (GICS):
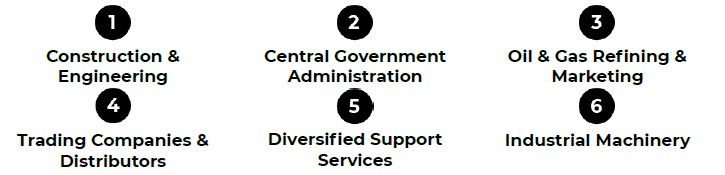
_____________________________________
5 The Global Industry Classification Standard (GICS) is a system used to categorize companies by sector, industry group, industry, and sub- industry. It was developed in 1999 by MSCI and Standard & Poor's (S&P) for use by the global financial community. The GICS structure consists of 11 sectors, 25 industry groups, 74 industries, and 163 sub-industries. In order to map our supply chain and conduct the risk assessments, we used the 2018 GICS codes.
IAMGOLD's supply chain is managed at two levels within the organization.
• Global Supply Chain team: this team is responsible for developing supply chain related policies, standards and strategies; providing guidance to sites; managing global third-party business relationships; and conducting market intelligence.
• Site-level Supply Chain team: Each operating site has a local Supply Chain team that is responsible for supporting the procurement needs of the site. The local Supply Chain teams align their approach and strategies with the respective operational plans, as well as IAMGOLD's policies on anti-bribery and anti- corruption, human rights, local sourcing, sustainable development, and health and safety. All procurement commitments must adhere to the Global Supply Chain teams processes, use standard contract templates, and follow corporate policies.
Suppliers must complete IAMGOLD's Supplier Code of Business Conduct and Ethics (the "Supplier Code") self- certification and are expected to have their sub-suppliers follow it. IAMGOLD has internal policies related to the purchase of goods and services that provide additional guidance and standards to help us manage the risks present in our global supply chain. This includes providing rules and guidelines to support cost efficiency, accountability and ethical business practices. It also sets out the hierarchy of responsibilities with senior management responsible for overseeing its review, approval and communicating key requirements.
Our Essakane operation utilizes a custom-built in-house tool to streamline its supplier engagement process. Potential suppliers undergo a pre-qualification process, which includes answering specific questions, confirming adherence to the Supplier Code of Conduct, and submitting mandatory documentation. Once approved, suppliers gain full access to the platform to view Requests for Proposals (RFP) and participate in inquiries, thereby fostering competition and collaboration. This approach aims to meet in- country obligations and reinforces IAMGOLD's commitment to sustainable development and community engagement.
2. Policies and due diligence processes
Embedded within IAMGOLD's long term strategy is our commitment to continually strive to reach high standards in human health and safety, minimize our environmental impact, and build collaborative relationships with our host communities. To support our vision, we have global policies and a management framework with specific guidance on community relations, environmental stewardship, risk management, health and safety, and human resources. We encourage and facilitate collaboration between our sites and corporate teams to develop and exchange best practices.
All employees, contractors, officers and directors are expected to uphold IAMGOLD's commitment to health, safety and sustainability, and adhere to our suite of corporate policies. To prevent, mitigate and manage forced labour and child labour risks within our activities and throughout our supply chain, we have established several key policies and processes at the corporate and site levels that guide our approach.
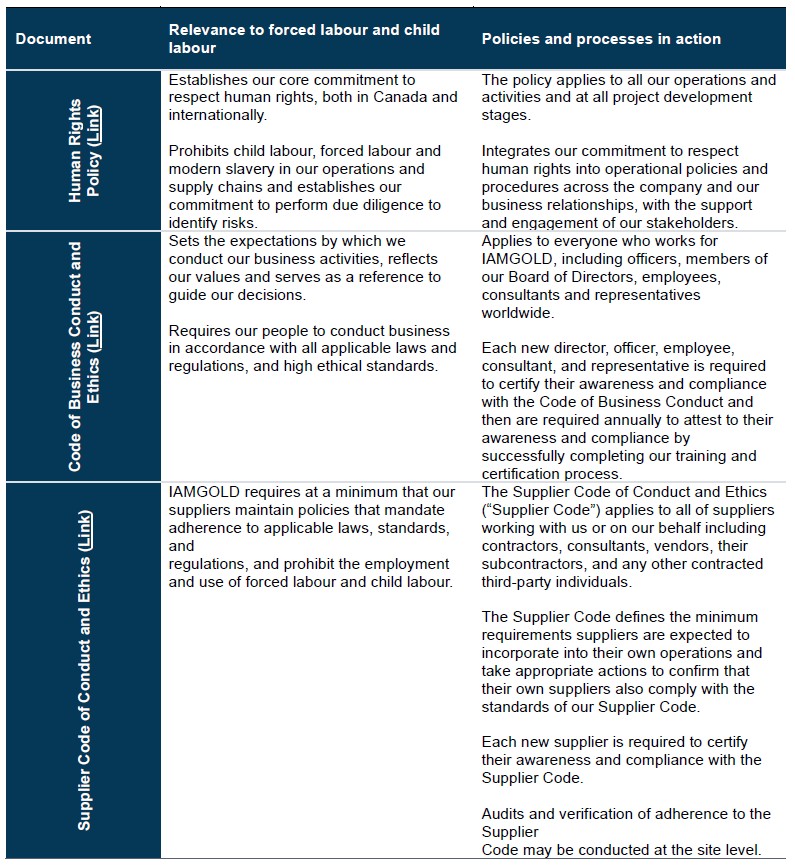
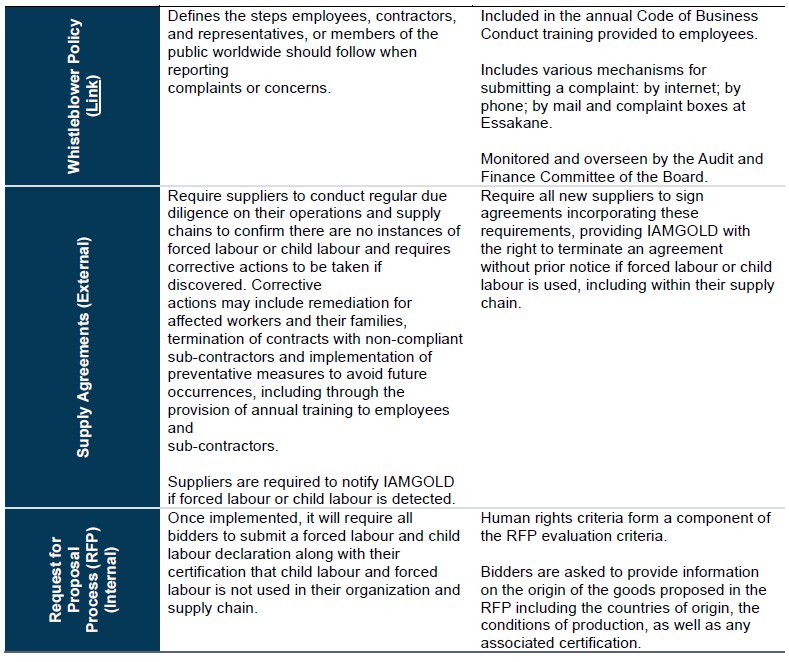
2. Policy spotlight: Our Supplier Code of Business Conduct and Ethics
Our Supplier Code was adopted in 2021, and defines minimum requirements that suppliers are expected to incorporate into their own operations and includes those working for the supplier through a third-party contract. We expect suppliers to take appropriate measures to have their own suppliers comply with our minimum standards.
Each new supplier is required to certify their awareness and compliance with the Supplier Code when signing a contract with IAMGOLD. To support adherence, we may seek to conduct due diligence verification on any supplier by requesting evidence of a recent audit or a direct audit of the primary facility where goods are manufactured. In the case of non-compliance with our minimum standards, we will work with the supplier to put in place mutually agreed upon corrective actions and a schedule for implementing them. If the supplier is unwilling or omits correct gaps identified, or is materially misaligned with our values, we may terminate our business relationship and procurement agreement.
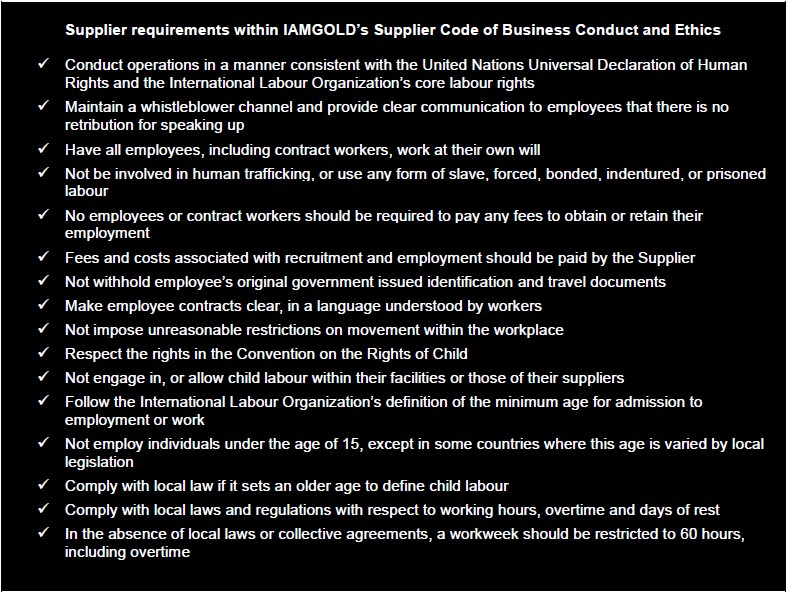
2.2 Multiple channels have been established for internal and external stakeholders to report grievances
We have set up multiple reporting channels to enable employees, contractors, representatives or members of the public to report perceived incidents of misconduct openly, confidentially, or anonymously. Reports can be made to the Chair of the Audit and Finance Committee, or to the Chair of the Nominating and Corporate Governance Committee, through the confidential reporting service, or directly to any member of the Company's management. Complaint boxes have also been established at select sites.
 |
Internet | www.clearviewconnects.com |
 |
Phone | 1 (866) 506-6954 Or by calling collect +1 (416) 385-6016 |
 |
Confidential post office box at: P.O. Box 11017, Toronto, Ontario M1E 1N0 | |
 |
The Chair of the Audit and Finance Committee or the Chair of the Nominating and Corporate Governance Committee service as follows: Chair_Audit@iamgold.com or Chair_NCGC@iamgold.com. |
|
 |
Complaint Boxes | Complaint boxes are opened monthly at Essakane through the independent oversight of the internal audit function and reported to the Audit and Finance Committee. |
Grievances received in 2025
None of the whistleblower complaints received by IAMGOLD in 2025 were related to human rights violations. All other complaints were investigated and reported to the Audit and Finance Committee.
2.3 Whistleblower investigation process
When an allegation of misconduct is reported either directly or anonymously through the above channels, the Chairs of the Audit and Finance and Nominating and Corporate Governance Committees are informed by management. Depending on the allegation's severity, the Audit and Finance and Nominating and Corporate Governance Committees, management, or another committee of the Board will investigate. Counsel, and internal or external auditors, may be involved.
IAMGOLD strictly prohibits retaliation against anyone who makes a report in good faith. Unless required by judicial or other legal processes, we will keep the identity of any individual who makes a report confidential. All records of reports, investigation results, and any actions taken during the investigation are retained for seven years.
3. Forced labour and child labour risks
Inherent risk refers to the likelihood of forced labour or child labour practices arising within a particular country, industry, or business operation, influenced by factors such as the intensity of labour, dependence on migrant workers, insufficient regulations, or economic instability. This helps the Company identify areas with a potential increased risk of forced or child labour, allowing organizations to pinpoint risk hotspots and prioritize time and financial investment into those sites and suppliers of highest inherent risk. However, identifying inherent risk does not imply that forced or child labour practices are currently occurring.
In January 2025, IAMGOLD onboarded a third-party platform that strengthened our ability to identify and monitor risks related to modern slavery across our supply chain. This allows us to leverage analyst-validated insights and multi-tier supplier assessments, so we can have greater visibility into potential human rights risks and prioritize areas requiring due diligence. The platform also has the functionality to track supplier improvements over time, providing transparency, accountability, and alignment with regulatory requirements.
We also utilized a third-party consultant who conducted a residual risk assessment with 20 vendors identified as carrying a potential high risk. These vendors were selected based on an inherent risk assessment conducted in 2024. The residual risk assessment found that while some suppliers have begun implementing foundational measures, such as internal due diligence processes, governance policies, and limited supply chain mapping, overall maturity remains low across the group. The findings highlight gaps in external due diligence, governance oversight, and training, underscoring the need for strengthened controls and broader capacity building to effectively identify, prevent, and mitigate risks of forced labour and child labour. As a result, 11 of these suppliers remain categorized as having a high potential of risk. We intend to review and consider mitigation plans to protect against potential violations in the future.
3.1 Risks in our activities
IAMGOLD conducts business operations in Canada and Burkina Faso. Each country has a distinct potential inherent risk profile for forced labour and child labour. We directly employ a diverse workforce to carry out operational activities at our corporate and mining sites. Our operational sites are supported by an indirect workforce employed by suppliers to whom we outsource certain tasks. The supply chain risks associated with these outsourced services, along with other goods and services we procure, are detailed in the following section.
Our Canadian employees located at our head office in Toronto manage our daily corporate operations. This segment of our operations has been assessed to have a low potential inherent risk of forced labour and child labour, primarily due to factors such as the employee's location in Canada and the predominantly high-skilled, low-labour intensity nature of their work.
At our Canadian mine sites located in Northern Ontario and Quebec, our direct workforce was engaged in exploration, mine construction, open pit and underground mining operations, and ore processing activities. These activities have been identified as having a medium potential inherent risk of forced labour and child labour, mainly driven by characteristics typical of the gold mining and construction industries rather than specific country-related risk factors. These characteristics include high labour intensity and potential worker exposure to remote worksite conditions.
Mining operations in Burkina Faso represent the area of our activities with the highest potential inherent risk of forced labour and child labour. Given the heightened geographic risks associated with these issues in Burkina Faso, the Essakane site has been evaluated as having a potential high inherent risk of child labour and a medium-high risk of forced labour. Generally, instances of child labour in Burkina Faso's mining sector are linked to informal and artisanal mining activities, rather than large-scale operations like our Essakane mine. Identified areas of heightened inherent risk do not account for IAMGOLD's existing controls, systems, and processes to mitigate the risk of child labour and forced labour occurring in our operations.
We also have a small office in Lima, Peru, where we are undertaking basic exploration including seeking governmental, landowner permits and cultivating our social license to operate. This activity is currently in its infancy and is being performed primarily by highly skilled geologists. If our exploration activities advance into extraction, we will consider it in future risk evaluations.
| Site | Inherent risk of child labour | Inherent risk of forced labour |
| Corporate Office (Ontario and Quebec) | Low | Low |
| Côté Gold Mine (Ontario) | Medium | Medium |
| Westwood Complex (Quebec) | Medium | Medium |
| Essakane Gold Mine (Burkina Faso) | High | Medium-High |
3.2 Risks in our supply chain
Our 2025 residual risk assessment focused on suppliers at our highest risk operation, Essakane, in Burkina Faso. We found that this segment of our supply chain exhibited relatively high levels of potential inherent risk, due to the nature of the goods and services we procure as a gold mining company, as well as our sourcing activities in regions with inherently higher risks, such as West Africa.
• Potential high-risk suppliers: Burkina Faso was identified as the only country with suppliers that have inherently high potential risk.
• Potential medium-high risk suppliers: These suppliers were found to be operating in Burkina Faso, Côte d'Ivoire, Ghana, Spain, the United States, and Turkey.
The suppliers with the greatest potential inherent risk of forced labour and child labour were identified across various industries, including Construction & Engineering, Construction Materials, Diversified Metals & Mining, Diversified Support Services, Human Resources & Employment Services, and Trucking.
In the inherent assessment that was conducted in January 2025, we evaluated 509 tier 1 suppliers, covering the majority of our 2024 procurement spend. This assessment found that 5% of suppliers assessed have a potential
medium-high risk of forced labour, while 2% have a potential high risk for child labour. Out of that assessment, we conducted our residual risk assessment on the 20 suppliers with the highest risk. These suppliers were mainly from the Construction & Engineering, Energy & Petroleum, and Logistics & Travel industries.
Results of Residual Risk Assessment - forced labour and child labour risk factors:
|
|
45% of suppliers assessed were identified to have a potential medium-high residual risk of forced labour, with: • Suppliers in Burkina Faso, operating in the Construction & Engineering, Human Resource & Employment Services, Diversified Metals & Mining, Diversified Support Services, Hotels, Industrial Machinery. |
|
|
50% of suppliers assessed were identified to have a potential high residual risk for child labour. • Suppliers in Burkina Faso, operating in the Construction & Engineering, Diversified Metals & Mining, Human Resource & Employment Services, and Diversified Support Services. |
IAMGOLD understands the residual risk assessment covered only a small subsect of our overall supply chain. However, by conducting this assessment, we now have a clearer understanding of supplier level forced labour and child labour risks on our highest risk suppliers, rather than the broader insight an inherent risk assessment would provide. The results show that these risks largely stem from weak due diligence practices, limited governance oversight, insufficient training, and unclear grievance mechanisms on the suppliers' parts. As a result, we understand that many suppliers have limited capacity and require engagement, guidance, and structured oversight.
3.3 Steps taken to manage risk at our sites
All of our operations follow local labour codes and national legislation, as well as the International Labour Organization's core labour standard.
3.3.1 Essakane
At our Essakane operations, we have implemented controls to help verify that workers meet legal working age requirements. Before commencing employment with IAMGOLD, prospective workers must provide official government documentation on proof of age, and a photocopy of this documentation is kept in their human resources file. The minimum age for employment at Essakane is 18 years old. Additionally, 98% of our Essakane employees are covered by collective bargaining agreements that outline working conditions, minimum working age, minimum wage, and maximum working hours based on local legislation.
3.3.2 Westwood
Westwood has established controls to confirm that workers meet the legal age requirements at our operations. As part of the hiring process, employees must provide their date of birth in hiring documentation and are required to present government- issued identification to verify their legal age. A photocopy of this identification is kept in their human resources file.
At Westwood, the minimum age for individuals to work underground is 18 years old. For those working on the surface of the mining site, the minimum working age is set at 16 years, in accordance with legal requirements in Québec. At Westwood, 64% of our employees are covered by collective bargaining agreements that mandate minimum working age, minimum wage, maximum working hours. A normal work week is defined as being between 30-48 hours, with a mandatory minimum of 9 hours rest time between work shifts.
3.3.3 Côté Gold
Côté Gold has established controls to confirm that workers meet the legal age requirements at our operations. As part of the hiring documentation, employees must complete a personal information form with their date of birth to verify their age. This form is kept in the human resources file.
At Côté Gold, the minimum age for individuals to work on site is 18 years, which is higher than the legal requirement in Ontario, which is set at 16 years. Our policy mandates a minimum of 11 hours of rest between shifts. To manage workloads effectively, we average schedules over a four-week period. For employees working a 14 on-14 off rotation, this results in an average of 42 hours per week.
4. Remediation measures
Currently, IAMGOLD has not identified any instances of forced labour or child labour within our activities or supply chains. We have an established grievance mechanism for reporting and investigating adverse impacts as previously discussed. In 2025, with the support of a third party, we developed a remediation plan should any instances of force labour or child labour be identified. This plan applies to both our activities and supply chains.
5. Remediation of loss of income
IAMGOLD acknowledges that efforts to prevent and reduce the risks of forced labour and child labour can unintentionally lead to a loss of income for the most vulnerable families. However, IAMGOLD is not aware of any instances to date where our efforts to mitigate the risk of forced or child labour have contributed to a loss of income for vulnerable families.
6. Training provided to employees on forced labour and child labour
All employees are required to complete the Code of Business Conduct and Ethics training upon joining IAMGOLD and recertify their awareness and compliance Code annually. In 2025, we achieved a 98% recertification rate for our active employees. As part of the Code of Business Conduct and Ethics training, there is a module on respect in the workplace that outlines our requirements on respect for individuals and their integrity. It underscores the importance of a workplace that is respectful of individuals, their integrity and their dignity, although it does not specifically call out forced labour and child labour at this time. This module emphasizes the requirement to conduct business in accordance with all applicable laws, rules, and regulations. It also provides information on how to report a Code violation through Clear View Connects and the subsequent investigation process.
In 2025, IAMGOLD worked in collaboration with a third party to develop training specific to human rights risks. This material is scheduled for deployment to all supply chain team members in 2026, in both French and English. The material is also being reviewed for potential incorporation into the annual mandatory training for all IAMGOLD employees.
7. Assessing effectiveness
We have not yet established a framework for measuring the effectiveness of our forced labour and child labour risk mitigation efforts. As our program matures overtime, we plan to develop a process to measure our progress.
Approval and attestation
In accordance with the requirements of the Fighting Against Forced Labour and Child Labour in Supply Chains Act (Act), and in particular section 11 thereof, I, Renaud Adams, in the capacity of President and CEO, attest that I have reviewed the
information contained in the report on behalf of the governing body of the entity listed above. Based on my knowledge, and having exercised reasonable diligence, I attest that the information in the report is true, accurate and complete in all material respects for the purposes of the Act, for the reporting year listed within this report.
/s/ "Renaud Adams"
_________________________________________
I have the authority to bind IAMGOLD Corporation
Renaud Adams
President and CEO
April 2, 2026
| SHAREHOLDER INFORMATION | DIRECTORS AND OFFICERS | ||
|
TRANSFER AGENT AND REGISTRAR AUDITORS SHARES LISTED |
INVESTOR INQUIRIES Graeme Jennings VP, Business Development & Investor Relations T: 416 388 6883 E: info@iamgold.com WEBSITE www.iamgold.com |
DIRECTORS David Smith2 Chair of the Board, North Vancouver, British Columbia Renaud Adams Director, President & Chief Executive Officer Toronto, Ontario Christiane Bergevin1,3 Independent Director Montreal, Quebec Ann K. Masse2,5 Independent Director Wilmington, Delaware Peter O'Hagan1,2 Independent Director New York City, New York Kevin O'Kane4,5 Independent Director Vancouver, British Columbia Murray Suey1,3 Independent Director Calgary, Alberta Anne Marie Toutant4,5 Independent Director Calgary, Alberta Audra Walsh3,4 Independent Director Crystal River, Florida |
OFFICERS Renaud Adams President & Chief Executive Officer Bruno Lemelin Chief Operating Officer Maarten Theunissen Chief Financial Officer Annie Torkia Lagacé Chief Legal and Strategy Officer Dorena Quinn Chief People Officer |
|
1 Member of the Audit and Finance Committee 2 Member of the Human Resources and Compensation Committee 3 Member of the Nominating and Corporate Governance Committee 4 Member of the Technical Committee 5 Member of the Sustainability Committee |
|||
FORWARD-LOOKING STATEMENTS
All statements, other than statements of historical fact, contained or incorporated by reference herein including, but not limited to, any statements or information with respect to the Company's mineral resources or mineral reserves, constitute "forward-looking information" or "forward-looking statements" and are based on expectations, estimates and projections as of the date of this Annual Report. Forward-looking statements contained herein, include, but are not limited to, those with respect to the Company's mineral resources or mineral reserves. Forward-looking statements are generally identifiable by, but not limited to, the use of the words "may", "will", "should", "continue", "expect", "budget", "forecast", "anticipate", "estimate", "believe", "prospective", "significant", "potential", "intend", "plan" or "project" or the negative of these words or other variations on these words or comparable terminology. Forward-looking statements are subject to a number of risks and uncertainties, many of which are beyond the Company's ability to control or predict, that may cause the actual results to differ materially from those discussed in the forward-looking statements. Factors that could cause actual results or events to differ materially from current expectations include, among other things, without limitation, the failure to accurately estimate mineral resources or mineral reserves, differences in the mineral content within the material identified as mineral resources or mineral reserves from that predicted, unexpected increases in all-in sustaining costs or other costs, unexpected increases in capital expenditures, operating expenditures and exploration expenditures, changes in development or mining plans due to changes in logistical, technical or other factors, the possibility that future exploration results will not be consistent with the Company's expectations, changes in world gold markets and other risks disclosed in IAMGOLD's most recent Form 40-F/Annual Information Form on file with the United States Securities and Exchange Commission and Canadian securities regulatory authorities, which are incorporated by reference herein. Any forward-looking statement speaks only as of the date on which it is made and, except as may be required by applicable securities laws, the Company disclaims any intent or obligation to update any forward-looking statement. The Company disclaims any intention or obligation to update or revise any forward-looking statements whether as a result of new information, future events or otherwise except as required by applicable law