
2025 Third Quarter Investor Presentation
2 Readers should carefully consider these risks alongside those detailed in Item 1A, 'Risk Factors' of our most recent Annual Report on Form 10-K filed with the Securities and Exchange Commission, and in subsequent filings available at www.sec.gov. We undertake no obligation to publicly update or revise any forward-looking statements, whether as a result of new information, future events, or otherwise. Safe Harbor Statement CAUTIONARY NOTE REGARDING FORWARD-LOOKING STATEMENTS The Private Securities Litigation Reform Act of 1995 provides a “safe harbor” for forward- looking statements. This presentation or any other written or oral statements made by or on behalf of the Company may include forward-looking statements, which reflect the Company’s current views with respect to future events and financial performance. All statements, other than statements of historical fact included in or incorporated by reference in this presentation are forward-looking statements. In some cases, these forward-looking statements can be identified by the use of forward-looking words such as "may", "should", "could", "anticipate", "estimate", "expect", "plan", "believe", "predict", "potential", "aim", "will", "target", "intend" or similar statements of a future or forward- looking nature or their negative or similar terminology. Forward-looking statements made in this presentation, such as those related to our performance, pricing, growth prospects, the outcome of our strategic initiatives, our expectations relating to our ability to successfully implement and manage technology initiatives – including artificial intelligence, our expectations about the current trade and geopolitical environment on our business, economic and market conditions, and other statements that are not historical facts, reflect our current views with respect to future events and financial performance and are made pursuant to the safe harbor provisions of the Private Securities Litigation Reform Act of 1995. Such statements involve risks and uncertainties that could cause actual results to differ materially, including without limitation: Insurance Risk: the cyclical nature of insurance and reinsurance business leading to periods with excess underwriting capacity and unfavorable premium rates; the frequency and severity of natural and man-made catastrophes; the effects of emerging claims, systemic risks, and coverage and regulatory issues; reserve adequacy; losses relating to geopolitical conflicts; the adverse impact of social and economic inflation; failure of our loss limitation methods; failure of our cedants to adequately evaluate risk; and our reliance on industry models. Strategic Risk: industry competition and consolidation; general economic, capital, and credit market conditions, including market illiquidity, fluctuations in interest rates, credit spreads, equity securities' prices, foreign currency exchange rates, and evolving impacts of tariffs, sanctions, and international trade tensions; our ability to increase the use of data and analytics and technology as part of our business strategy and adapt to new technologies; changes in the political environment of certain countries where we operate or underwrite business; loss of business provided to us by major brokers; rating agency actions; key personnel changes; potential strategic opportunities including acquisitions and our ability to achieve them; evolving expectations regarding environmental, social, and governance matters; and the effect of contagious diseases on our business. Credit and Market Risk: reinsurance availability and recoverability; premium collection risks; and counterparty defaults in our program business. Liquidity Risk: the inability to access sufficient cash to meet our obligations when they are due. Operational Risk: technology and cybersecurity challenges; failures in internal or outsourced operational processes, people, or systems; and changes in accounting policies or practices. Regulatory Risk: changes in laws and regulations and potential government intervention in our industry; and inadvertent non-compliance with sanctions, anti-corruption, data protection and privacy requirements. Risks Related to Taxation: changes in laws and regulations and potential government intervention in our industry; and inadvertent non-compliance with sanctions, anti-corruption, data protection and privacy requirements.
3 Be the leading Specialty Underwriter, generating consistent top-quartile diluted book value per common share (“DBVPS”) growth for shareholders AXIS Aspiration
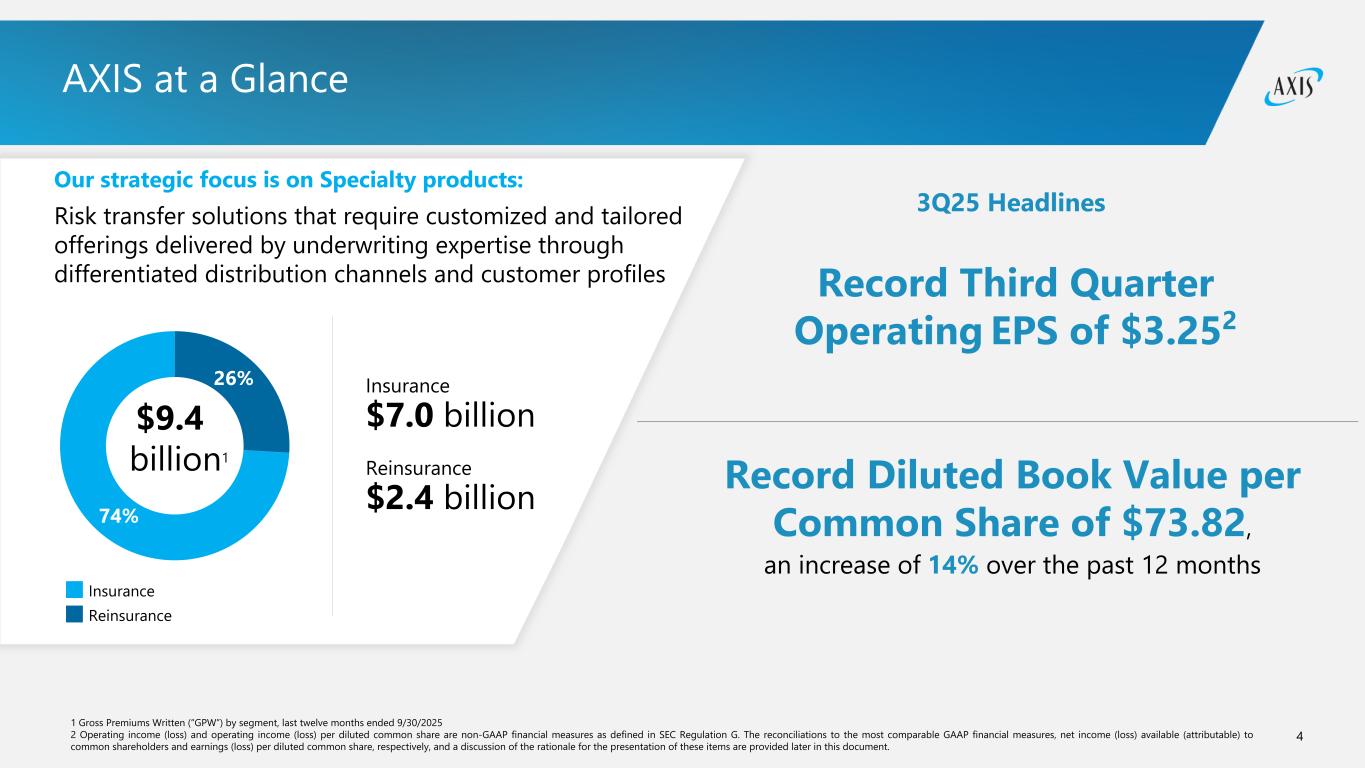
4 AXIS at a Glance Our strategic focus is on Specialty products: Risk transfer solutions that require customized and tailored offerings delivered by underwriting expertise through differentiated distribution channels and customer profiles Insurance Reinsurance Insurance $7.0 billion Reinsurance $2.4 billion $9.4 billion1 Record Third Quarter Operating EPS of $3.252 Record Diluted Book Value per Common Share of $73.82, an increase of 14% over the past 12 months 1 Gross Premiums Written (“GPW”) by segment, last twelve months ended 9/30/2025 2 Operating income (loss) and operating income (loss) per diluted common share are non-GAAP financial measures as defined in SEC Regulation G. The reconciliations to the most comparable GAAP financial measures, net income (loss) available (attributable) to common shareholders and earnings (loss) per diluted common share, respectively, and a discussion of the rationale for the presentation of these items are provided later in this document. 3Q25 Headlines 74% 26%
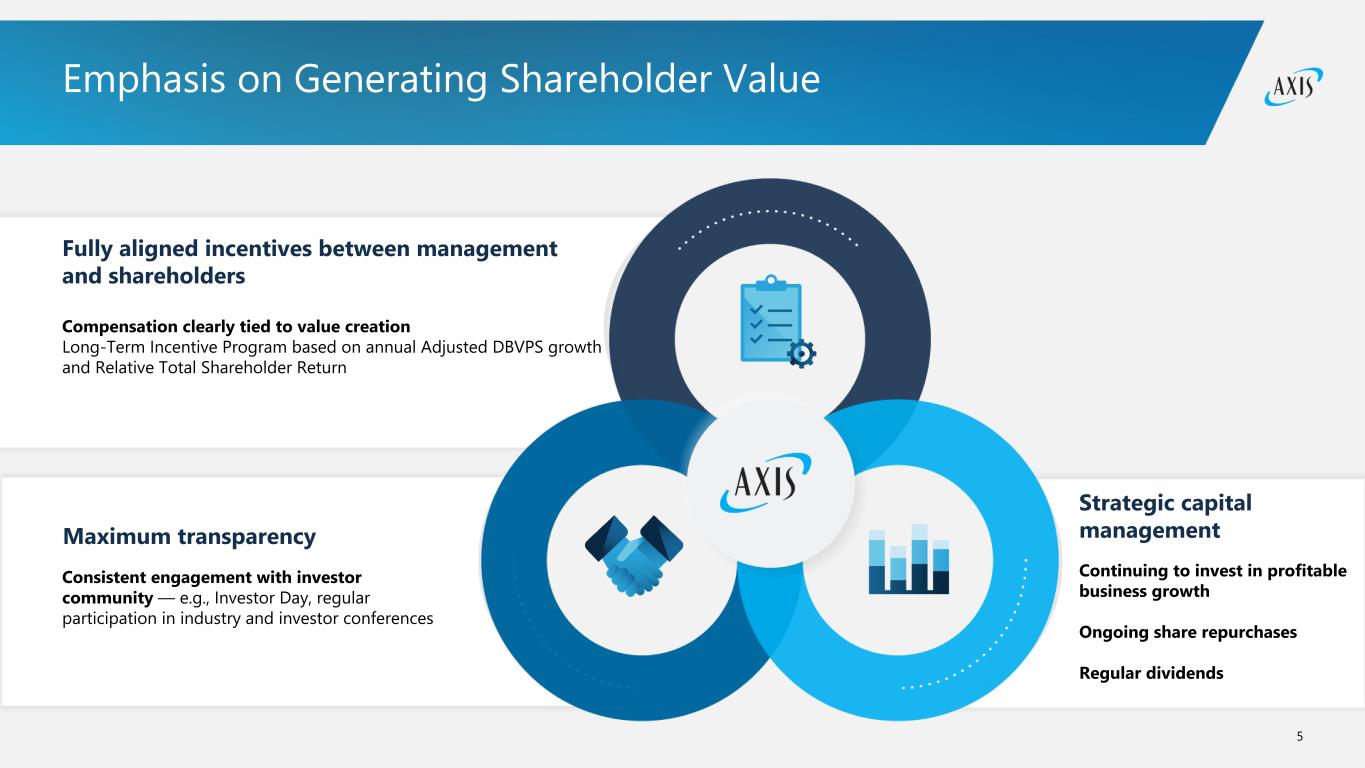
5 Compensation clearly tied to value creation Long-Term Incentive Program based on annual Adjusted DBVPS growth and Relative Total Shareholder Return Consistent engagement with investor community — e.g., Investor Day, regular participation in industry and investor conferences Maximum transparency Continuing to invest in profitable business growth Ongoing share repurchases Regular dividends Strategic capital management Fully aligned incentives between management and shareholders Emphasis on Generating Shareholder Value
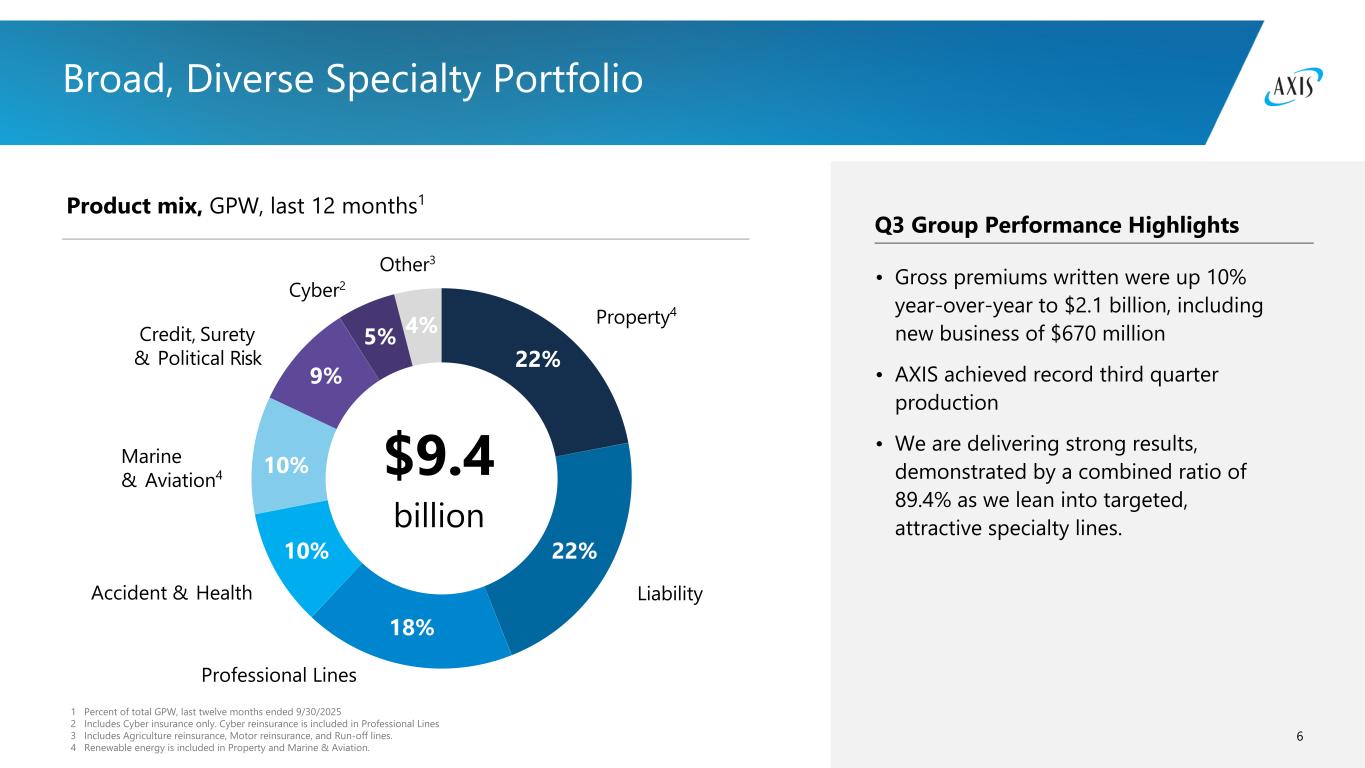
6 22% 22% 18% 10% 10% 9% 5% 4% 1 Percent of total GPW, last twelve months ended 9/30/2025 2 Includes Cyber insurance only. Cyber reinsurance is included in Professional Lines 3 Includes Agriculture reinsurance, Motor reinsurance, and Run-off lines. 4 Renewable energy is included in Property and Marine & Aviation. Broad, Diverse Specialty Portfolio Product mix, GPW, last 12 months1 Q3 Group Performance Highlights Property4 Cyber2 Liability Marine & Aviation4 Accident & Health Other3 Credit, Surety & Political Risk $9.4 billion • Gross premiums written were up 10% year-over-year to $2.1 billion, including new business of $670 million • AXIS achieved record third quarter production • We are delivering strong results, demonstrated by a combined ratio of 89.4% as we lean into targeted, attractive specialty lines. Professional Lines
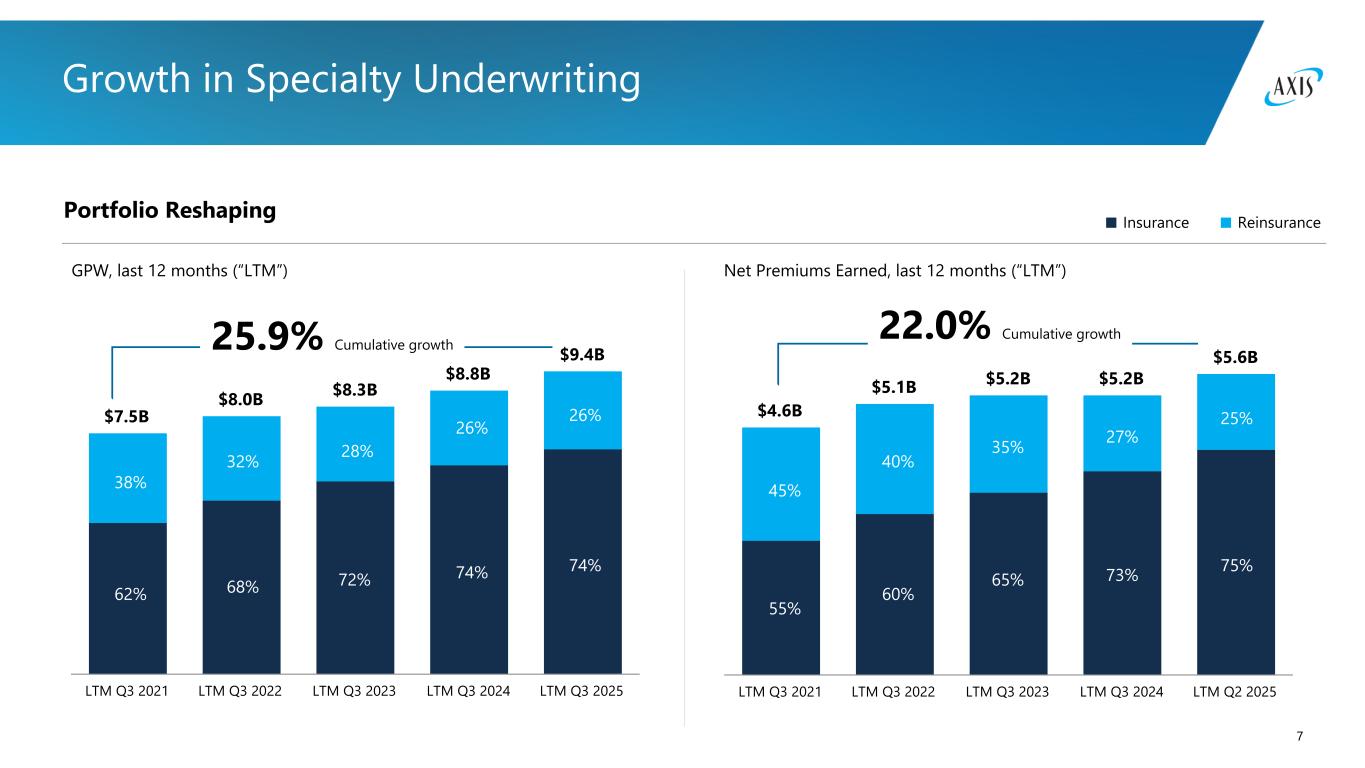
7 $4.6B $5.1B $5.2B $5.2B $5.6B $2.5B $3.0B $3.4B $3.8B $4.2B $2.1B $2.1B $1.8B $1.4B $1.4B LTM Q3 2021 LTM Q3 2022 LTM Q3 2023 LTM Q3 2024 LTM Q2 2025 $7.5B $8.0B $8.3B $8.8B $9.4B $4.7B $5.4B $6.0B $6.5B $7.0B $2.8B $2.6B $2.3B $2.3B $2.4B LTM Q3 2021 LTM Q3 2022 LTM Q3 2023 LTM Q3 2024 LTM Q3 2025 Growth in Specialty Underwriting Portfolio Reshaping ReinsuranceInsurance GPW, last 12 months (“LTM”) Net Premiums Earned, last 12 months (“LTM”) 25.9% Cumulative growth 22.0% Cumulative growth 62% 68% 72% 74% 74% 38% 32% 28% 6% 26% 45% 40% 35% 27% 25% 55% 60% 65% 73% 75%
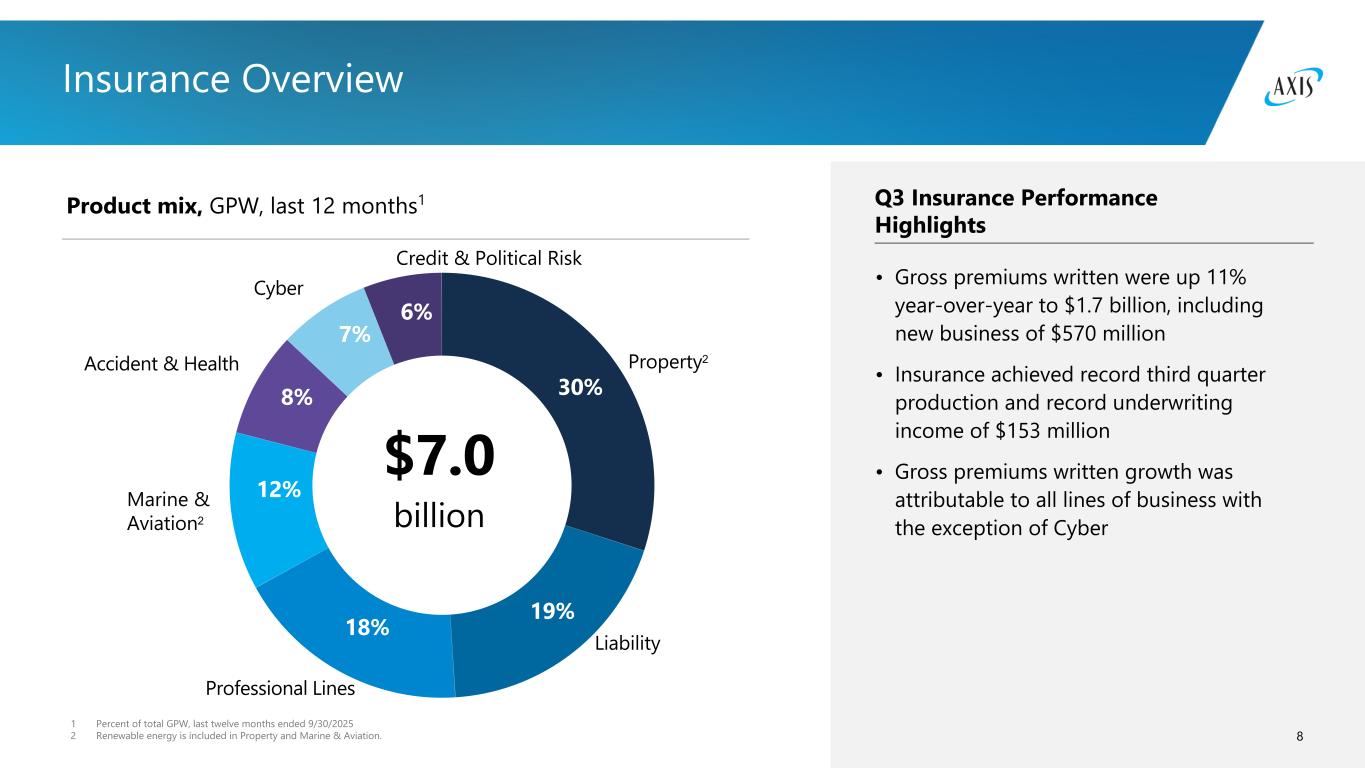
8 1 Percent of total GPW, last twelve months ended 9/30/2025 2 Renewable energy is included in Property and Marine & Aviation. Insurance Overview Product mix, GPW, last 12 months1 30% Property2 19% Professional Lines Cyber 18% Liability 12%Marine & Aviation2 8% 7% Accident & Health 6% $7.0 billion Credit & Political Risk Q3 Insurance Performance Highlights • Gross premiums written were up 11% year-over-year to $1.7 billion, including new business of $570 million • Insurance achieved record third quarter production and record underwriting income of $153 million • Gross premiums written growth was attributable to all lines of business with the exception of Cyber
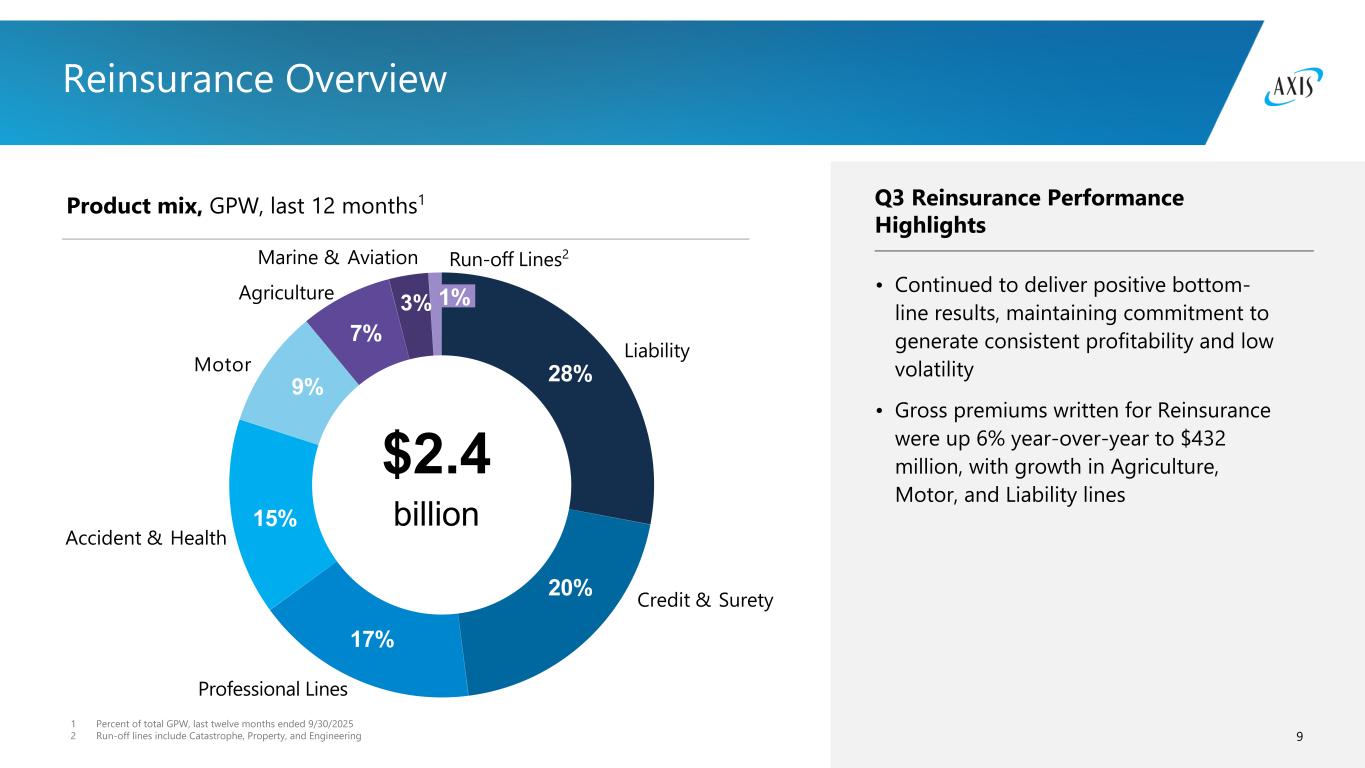
9 1 Percent of total GPW, last twelve months ended 9/30/2025 2 Run-off lines include Catastrophe, Property, and Engineering Reinsurance Overview Product mix, GPW, last 12 months1 Run-off Lines2Marine & Aviation 28% 20% Credit & Surety Motor 17% Liability 15% Professional Lines 9% 7% Agriculture $2.4 billion Accident & Health 3% 1% • Continued to deliver positive bottom- line results, maintaining commitment to generate consistent profitability and low volatility • Gross premiums written for Reinsurance were up 6% year-over-year to $432 million, with growth in Agriculture, Motor, and Liability lines Q3 Reinsurance Performance Highlights
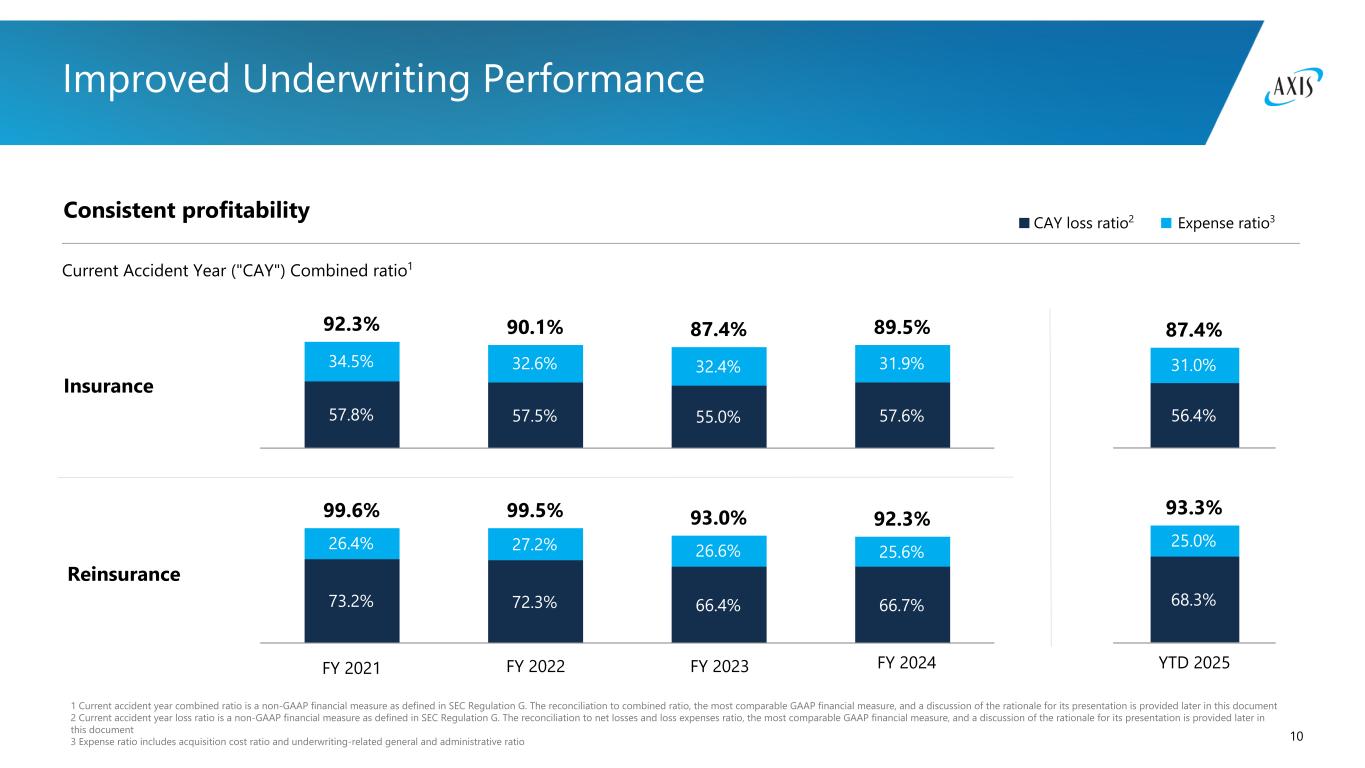
10 99.6% 99.5% 93.0% 92.3% 73.2% 72.3% 66.4% 66.7% 26.4% 27.2% 26.6% 25.6% 92.3% 90.1% 87.4% 89.5% 57.8% 57.5% 55.0% 57.6% 34.5% 32.6% 32.4% 31.9% 1 Current accident year combined ratio is a non-GAAP financial measure as defined in SEC Regulation G. The reconciliation to combined ratio, the most comparable GAAP financial measure, and a discussion of the rationale for its presentation is provided later in this document 2 Current accident year loss ratio is a non-GAAP financial measure as defined in SEC Regulation G. The reconciliation to net losses and loss expenses ratio, the most comparable GAAP financial measure, and a discussion of the rationale for its presentation is provided later in this document 3 Expense ratio includes acquisition cost ratio and underwriting-related general and administrative ratio Improved Underwriting Performance Consistent profitability Current Accident Year ("CAY") Combined ratio1 CAY loss ratio2 Expense ratio3 Insurance Reinsurance 93.3% 68.3% 25.0% 87.4% 56.4% 31.0% FY 2021 FY 2022 FY 2023 FY 2024 YTD 2025
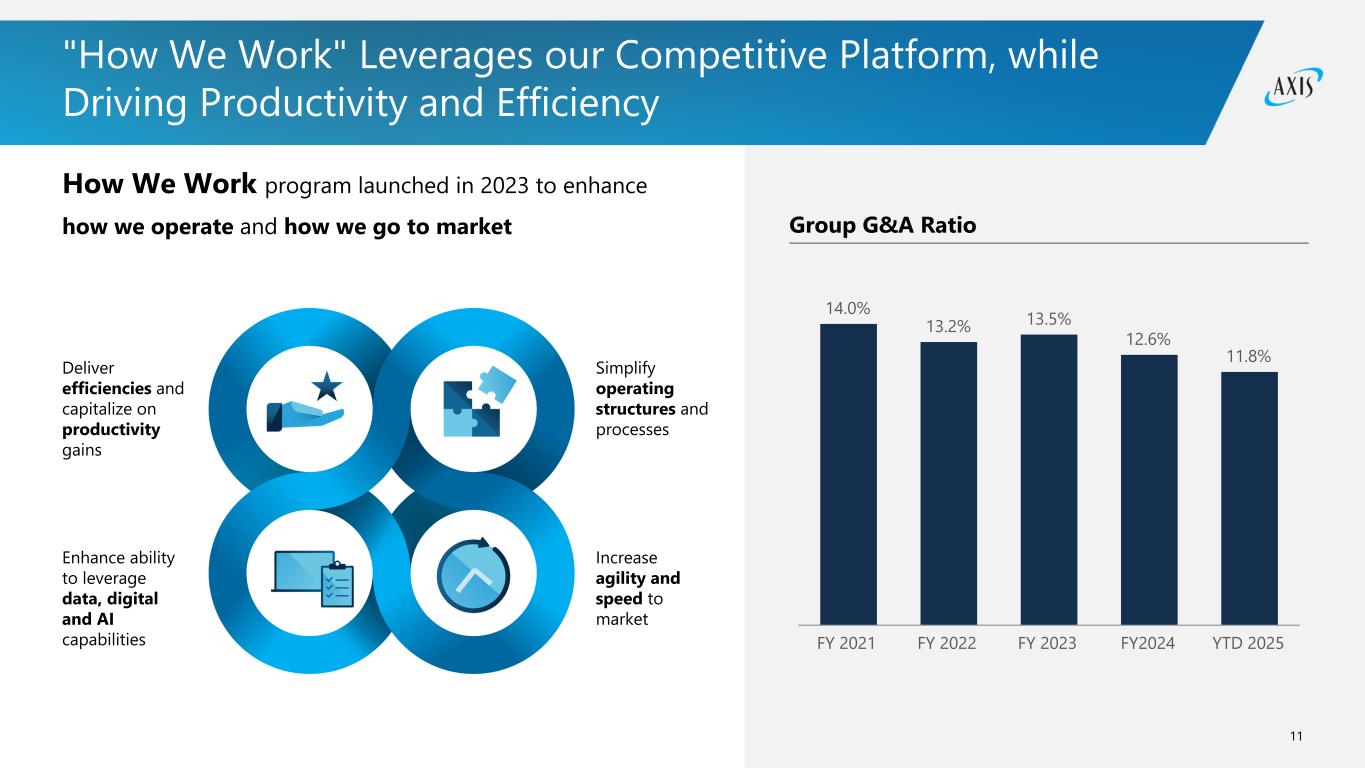
11 14.0% 13.2% 13.5% 12.6% 11.8% FY 2021 FY 2022 FY 2023 FY2024 YTD 2025 "How We Work" Leverages our Competitive Platform, while Driving Productivity and Efficiency How We Work program launched in 2023 to enhance how we operate and how we go to market Simplify operating structures and processes Increase agility and speed to market Deliver efficiencies and capitalize on productivity gains Enhance ability to leverage data, digital and AI capabilities Group G&A Ratio
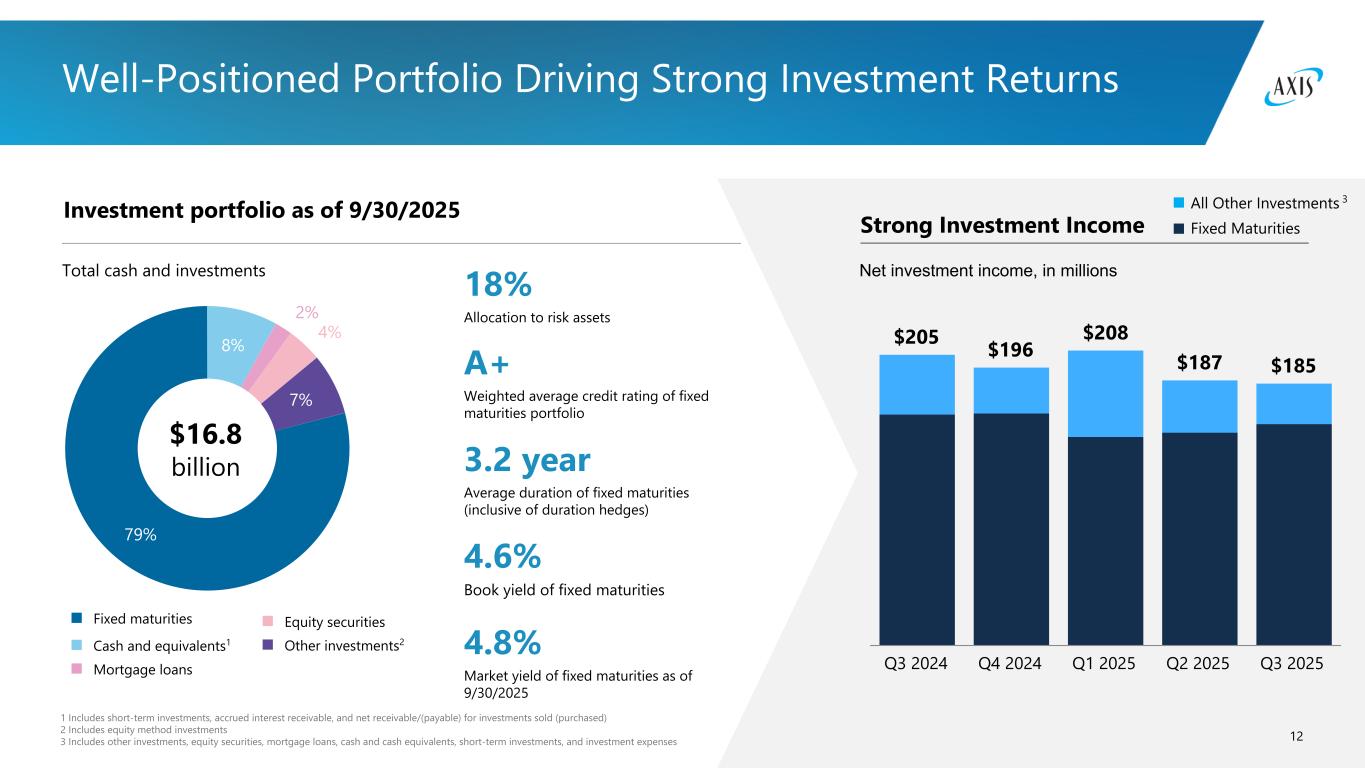
12 $205 $196 $208 $187 $185 Q3 2024 Q4 2024 Q1 2025 Q2 2025 Q3 2025 8% 2% 4% 7% 79% 1 Includes short-term investments, accrued interest receivable, and net receivable/(payable) for investments sold (purchased) 2 Includes equity method investments 3 Includes other investments, equity securities, mortgage loans, cash and cash equivalents, short-term investments, and investment expenses Well-Positioned Portfolio Driving Strong Investment Returns Investment portfolio as of 9/30/2025 Strong Investment Income Total cash and investments Net investment income, in millions All Other Investments 3 Fixed Maturities A+ Weighted average credit rating of fixed maturities portfolio 3.2 year Average duration of fixed maturities (inclusive of duration hedges) 4.8% Market yield of fixed maturities as of 9/30/2025 4.6% Book yield of fixed maturities 18% Allocation to risk assets $16.8 billion Fixed maturities Cash and equivalents1 Mortgage loans Equity securities Other investments2
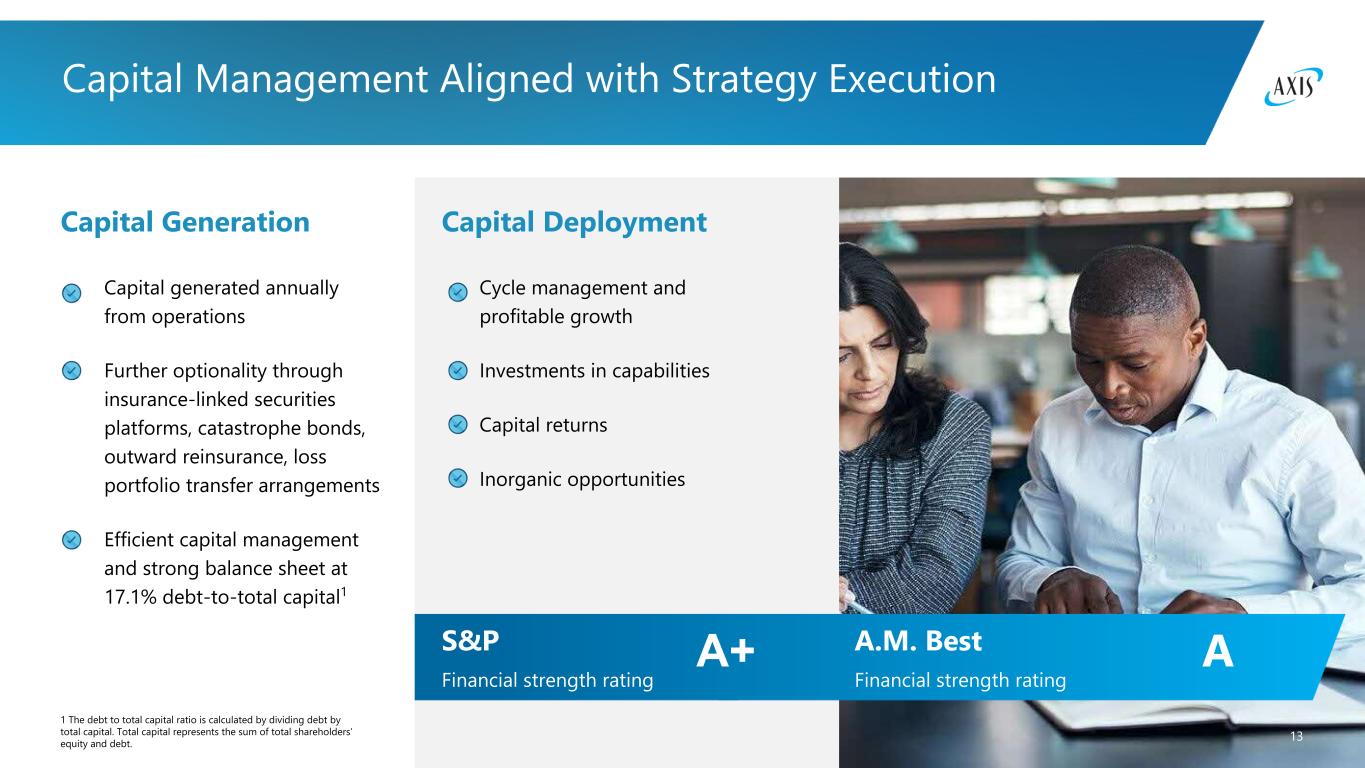
13 A.M. Best Financial strength rating AS&P Financial strength rating A+ Capital Management Aligned with Strategy Execution Capital Deployment Cycle management and profitable growth Investments in capabilities Capital returns Inorganic opportunities Capital Generation Capital generated annually from operations Further optionality through insurance-linked securities platforms, catastrophe bonds, outward reinsurance, loss portfolio transfer arrangements Efficient capital management and strong balance sheet at 17.1% debt-to-total capital1 1 The debt to total capital ratio is calculated by dividing debt by total capital. Total capital represents the sum of total shareholders’ equity and debt.
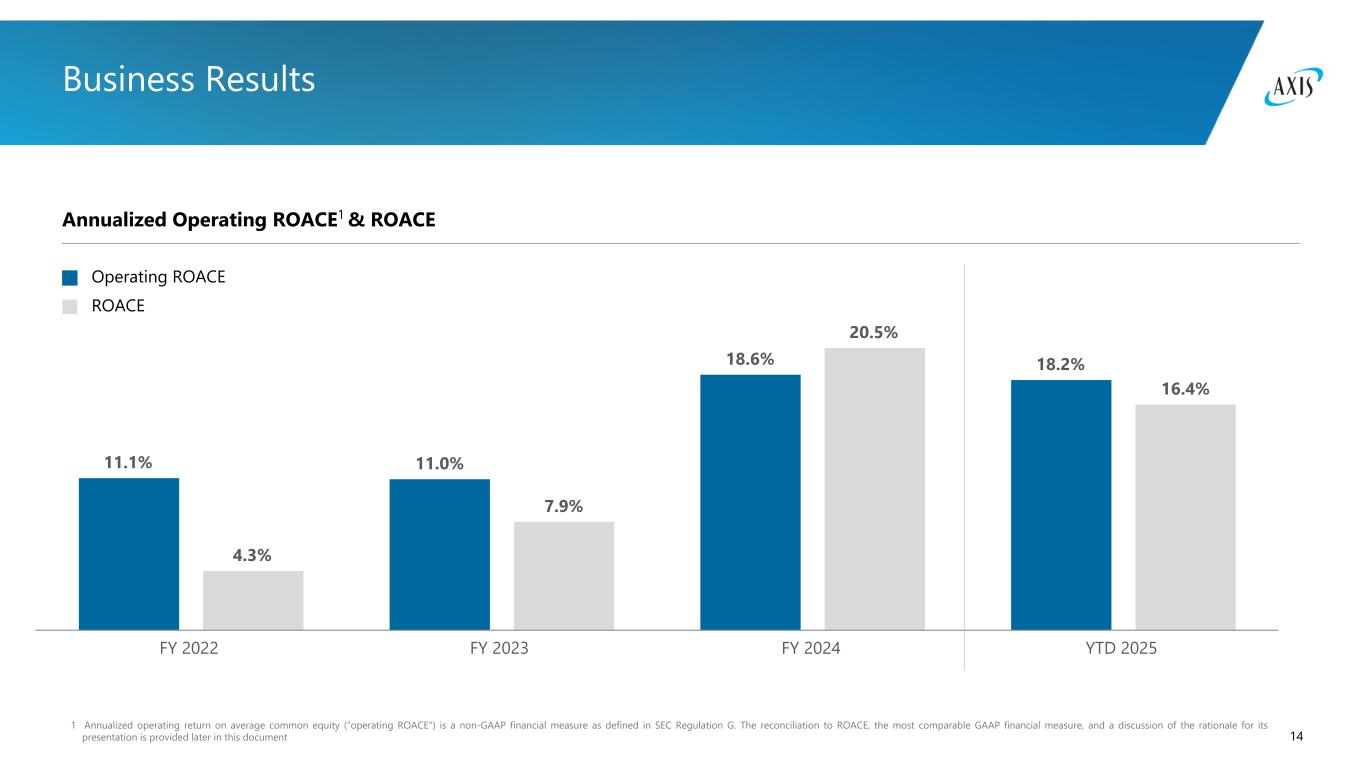
14 11.1% 11.0% 18.6% 18.2% 4.3% 7.9% 20.5% 16.4% FY 2022 FY 2023 FY 2024 YTD 2025 1 Annualized operating return on average common equity (“operating ROACE") is a non-GAAP financial measure as defined in SEC Regulation G. The reconciliation to ROACE, the most comparable GAAP financial measure, and a discussion of the rationale for its presentation is provided later in this document Business Results Annualized Operating ROACE1 & ROACE Operating ROACE ROACE
15

Appendix Non-GAAP Financial Measures Reconciliations
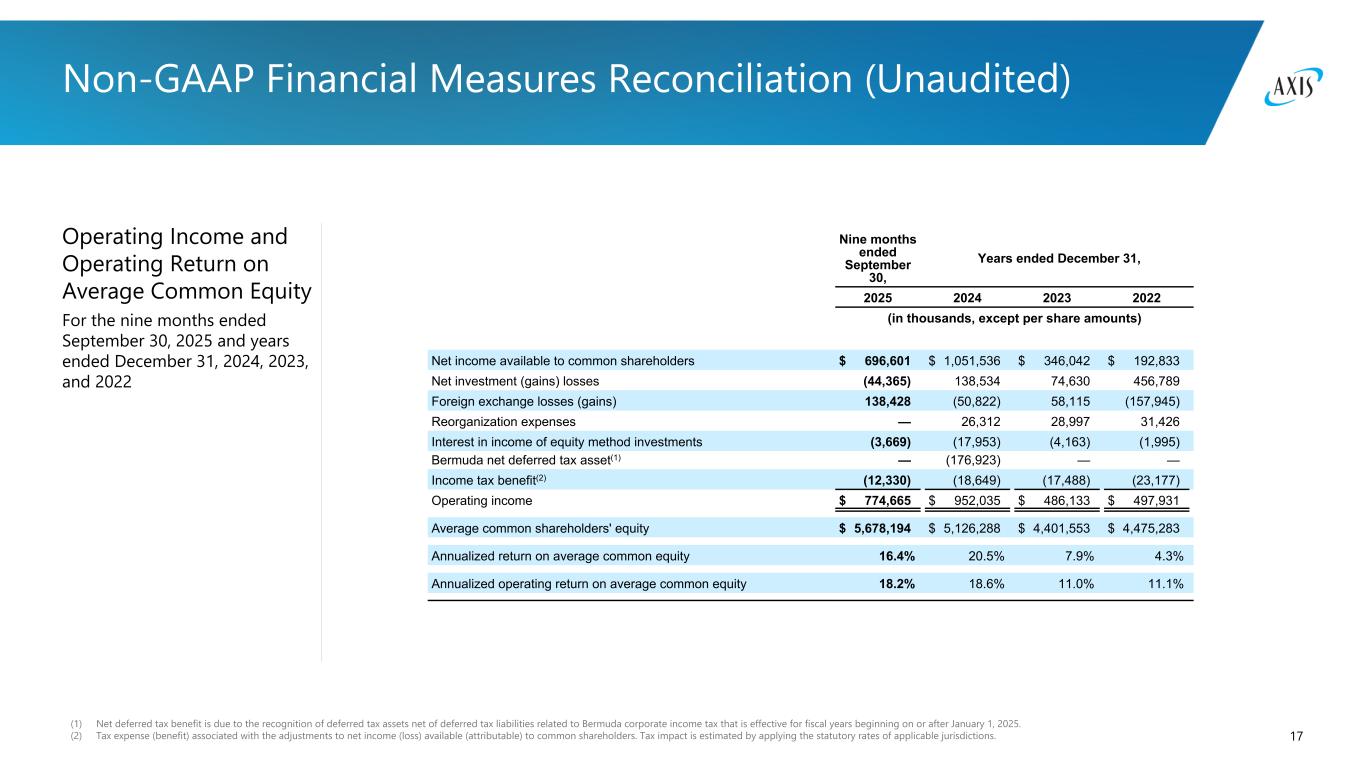
17 Operating Income and Operating Return on Average Common Equity For the nine months ended September 30, 2025 and years ended December 31, 2024, 2023, and 2022 (1) Net deferred tax benefit is due to the recognition of deferred tax assets net of deferred tax liabilities related to Bermuda corporate income tax that is effective for fiscal years beginning on or after January 1, 2025. (2) Tax expense (benefit) associated with the adjustments to net income (loss) available (attributable) to common shareholders. Tax impact is estimated by applying the statutory rates of applicable jurisdictions. Non-GAAP Financial Measures Reconciliation (Unaudited) Nine months ended September 30, Years ended December 31, 2025 2024 2023 2022 (in thousands, except per share amounts) Net income available to common shareholders $ 696,601 $ 1,051,536 $ 346,042 $ 192,833 Net investment (gains) losses (44,365) 138,534 74,630 456,789 Foreign exchange losses (gains) 138,428 (50,822) 58,115 (157,945) Reorganization expenses — 26,312 28,997 31,426 Interest in income of equity method investments (3,669) (17,953) (4,163) (1,995) Bermuda net deferred tax asset(1) — (176,923) — — Income tax benefit(2) (12,330) (18,649) (17,488) (23,177) Operating income $ 774,665 $ 952,035 $ 486,133 $ 497,931 Average common shareholders' equity $ 5,678,194 $ 5,126,288 $ 4,401,553 $ 4,475,283 Annualized return on average common equity 16.4% 20.5% 7.9% 4.3% Annualized operating return on average common equity 18.2% 18.6% 11.0% 11.1%
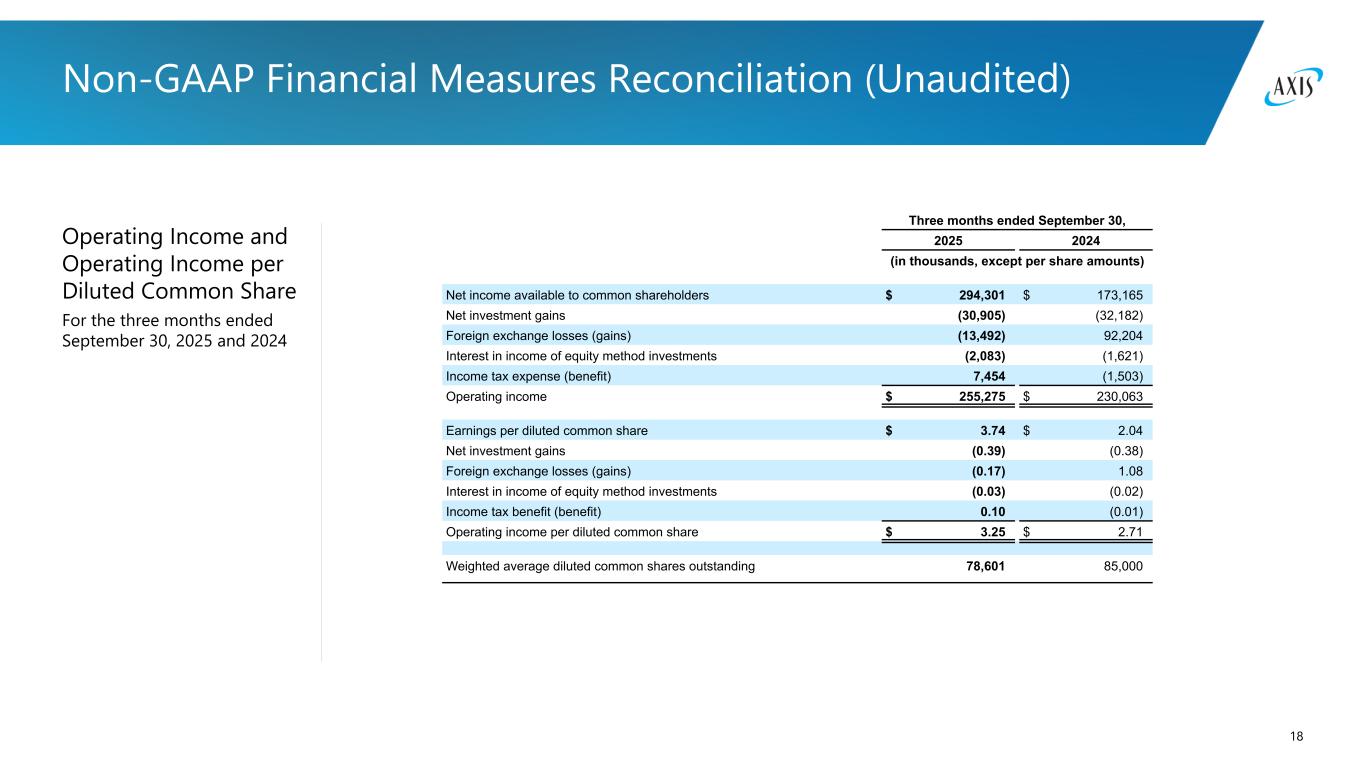
18 Operating Income and Operating Income per Diluted Common Share For the three months ended September 30, 2025 and 2024 Non-GAAP Financial Measures Reconciliation (Unaudited) Three months ended September 30, 2025 2024 (in thousands, except per share amounts) Net income available to common shareholders $ 294,301 $ 173,165 Net investment gains (30,905) (32,182) Foreign exchange losses (gains) (13,492) 92,204 Interest in income of equity method investments (2,083) (1,621) Income tax expense (benefit) 7,454 (1,503) Operating income $ 255,275 $ 230,063 Earnings per diluted common share $ 3.74 $ 2.04 Net investment gains (0.39) (0.38) Foreign exchange losses (gains) (0.17) 1.08 Interest in income of equity method investments (0.03) (0.02) Income tax benefit (benefit) 0.10 (0.01) Operating income per diluted common share $ 3.25 $ 2.71 Weighted average diluted common shares outstanding 78,601 85,000
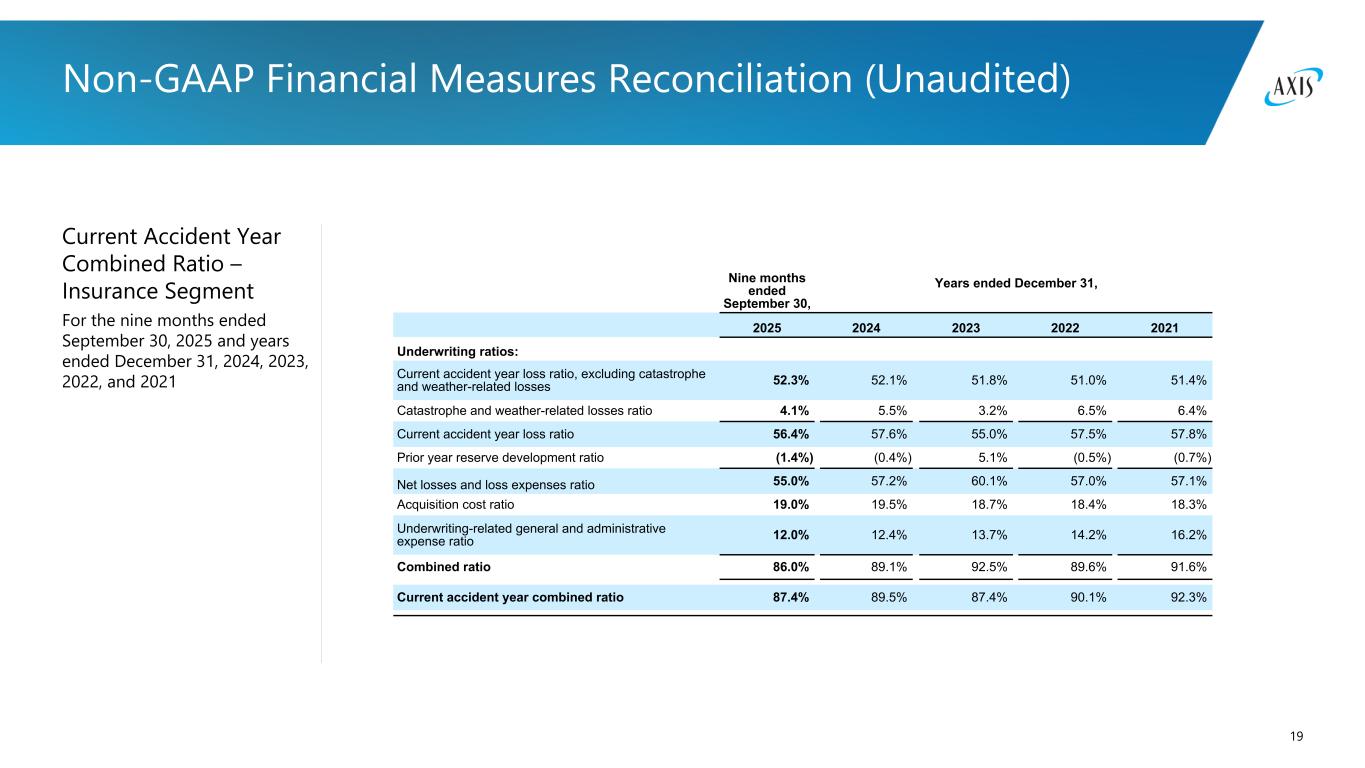
19 Current Accident Year Combined Ratio – Insurance Segment For the nine months ended September 30, 2025 and years ended December 31, 2024, 2023, 2022, and 2021 Non-GAAP Financial Measures Reconciliation (Unaudited) Nine months ended September 30, Years ended December 31, 2025 2024 2023 2022 2021 Underwriting ratios: Current accident year loss ratio, excluding catastrophe and weather-related losses 52.3% 52.1% 51.8% 51.0% 51.4% Catastrophe and weather-related losses ratio 4.1% 5.5% 3.2% 6.5% 6.4% Current accident year loss ratio 56.4% 57.6% 55.0% 57.5% 57.8% Prior year reserve development ratio (1.4%) (0.4%) 5.1% (0.5%) (0.7%) Net losses and loss expenses ratio 55.0% 57.2% 60.1% 57.0% 57.1% Acquisition cost ratio 19.0% 19.5% 18.7% 18.4% 18.3% Underwriting-related general and administrative expense ratio 12.0% 12.4% 13.7% 14.2% 16.2% Combined ratio 86.0% 89.1% 92.5% 89.6% 91.6% Current accident year combined ratio 87.4% 89.5% 87.4% 90.1% 92.3%
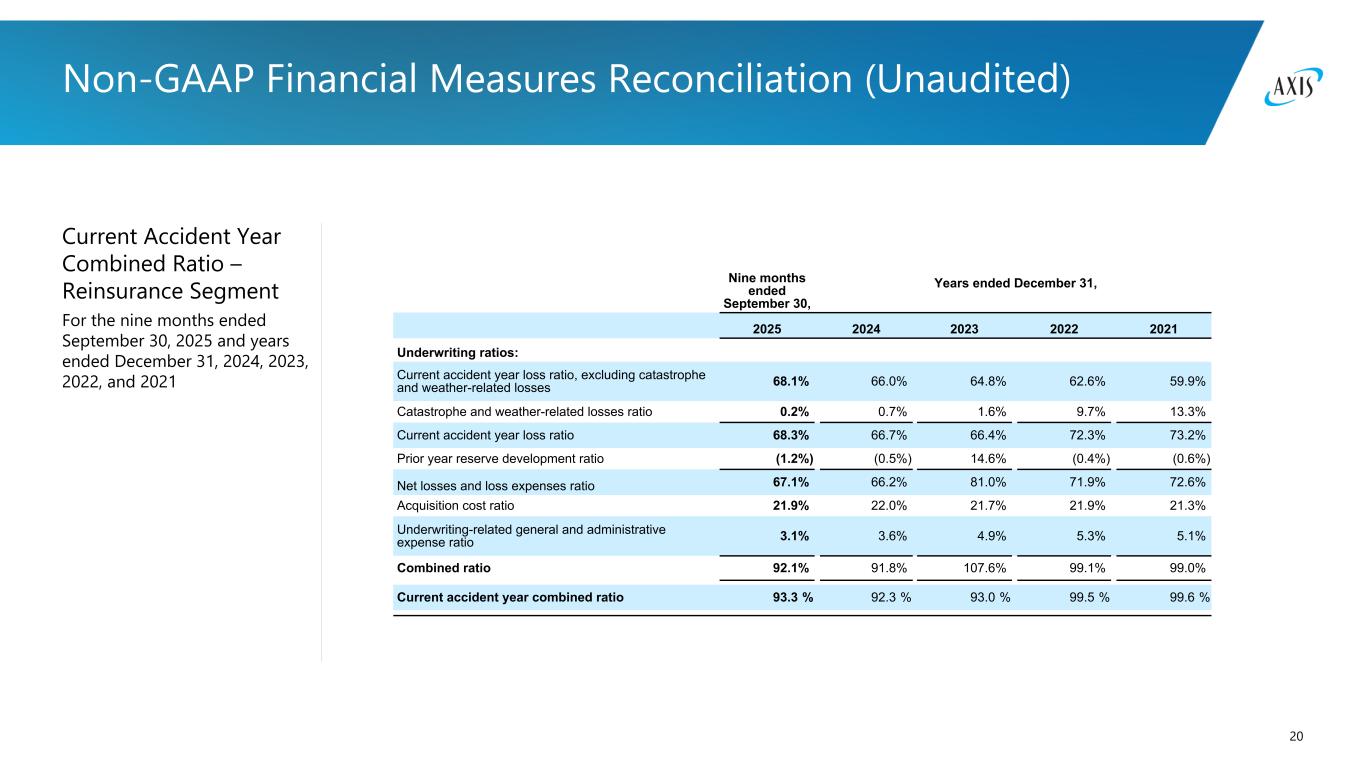
20 Current Accident Year Combined Ratio – Reinsurance Segment For the nine months ended September 30, 2025 and years ended December 31, 2024, 2023, 2022, and 2021 Non-GAAP Financial Measures Reconciliation (Unaudited) Nine months ended September 30, Years ended December 31, 2025 2024 2023 2022 2021 Underwriting ratios: Current accident year loss ratio, excluding catastrophe and weather-related losses 68.1% 66.0% 64.8% 62.6% 59.9% Catastrophe and weather-related losses ratio 0.2% 0.7% 1.6% 9.7% 13.3% Current accident year loss ratio 68.3% 66.7% 66.4% 72.3% 73.2% Prior year reserve development ratio (1.2%) (0.5%) 14.6% (0.4%) (0.6%) Net losses and loss expenses ratio 67.1% 66.2% 81.0% 71.9% 72.6% Acquisition cost ratio 21.9% 22.0% 21.7% 21.9% 21.3% Underwriting-related general and administrative expense ratio 3.1% 3.6% 4.9% 5.3% 5.1% Combined ratio 92.1% 91.8% 107.6% 99.1% 99.0% Current accident year combined ratio 93.3 % 92.3 % 93.0 % 99.5 % 99.6 %
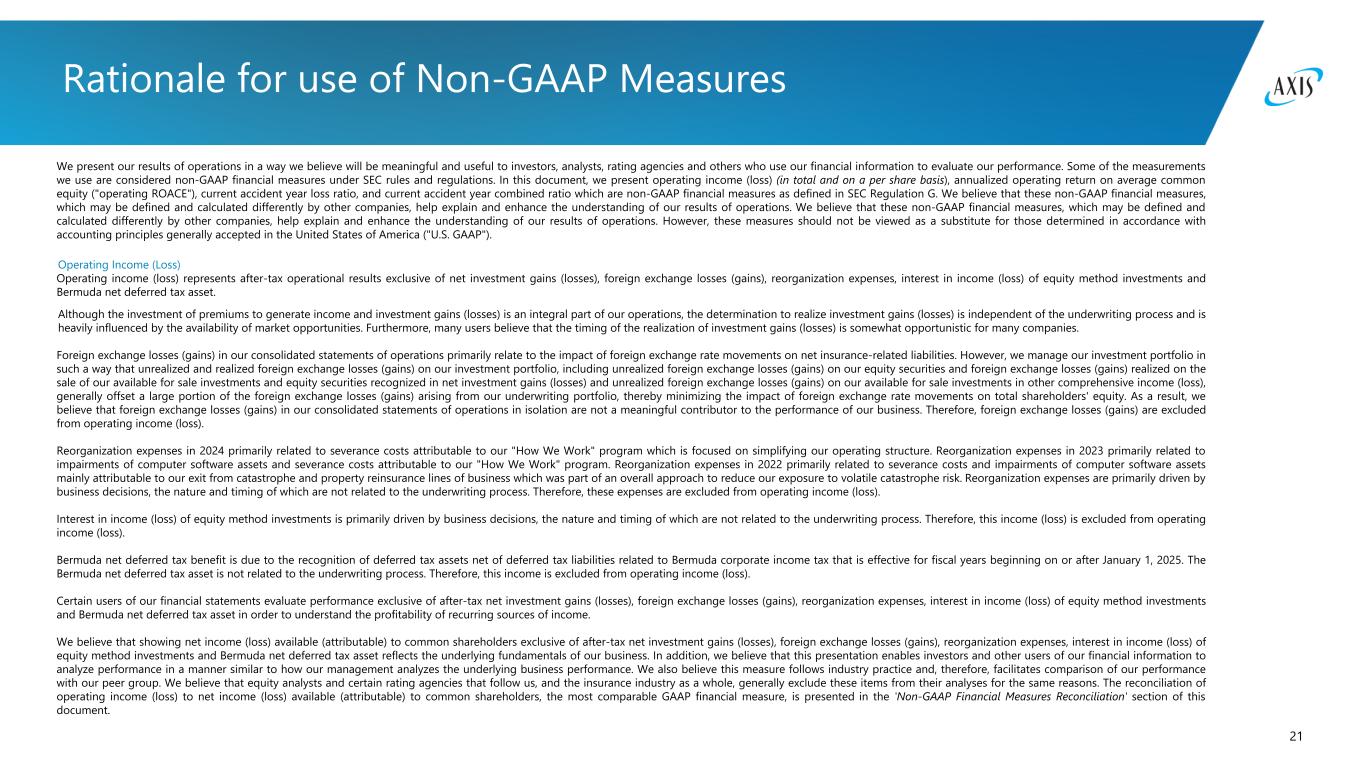
21 Rationale for use of Non-GAAP Measures We present our results of operations in a way we believe will be meaningful and useful to investors, analysts, rating agencies and others who use our financial information to evaluate our performance. Some of the measurements we use are considered non-GAAP financial measures under SEC rules and regulations. In this document, we present operating income (loss) (in total and on a per share basis), annualized operating return on average common equity ("operating ROACE"), current accident year loss ratio, and current accident year combined ratio which are non-GAAP financial measures as defined in SEC Regulation G. We believe that these non-GAAP financial measures, which may be defined and calculated differently by other companies, help explain and enhance the understanding of our results of operations. We believe that these non-GAAP financial measures, which may be defined and calculated differently by other companies, help explain and enhance the understanding of our results of operations. However, these measures should not be viewed as a substitute for those determined in accordance with accounting principles generally accepted in the United States of America ("U.S. GAAP"). Operating Income (Loss) Operating income (loss) represents after-tax operational results exclusive of net investment gains (losses), foreign exchange losses (gains), reorganization expenses, interest in income (loss) of equity method investments and Bermuda net deferred tax asset. Although the investment of premiums to generate income and investment gains (losses) is an integral part of our operations, the determination to realize investment gains (losses) is independent of the underwriting process and is heavily influenced by the availability of market opportunities. Furthermore, many users believe that the timing of the realization of investment gains (losses) is somewhat opportunistic for many companies. Foreign exchange losses (gains) in our consolidated statements of operations primarily relate to the impact of foreign exchange rate movements on net insurance-related liabilities. However, we manage our investment portfolio in such a way that unrealized and realized foreign exchange losses (gains) on our investment portfolio, including unrealized foreign exchange losses (gains) on our equity securities and foreign exchange losses (gains) realized on the sale of our available for sale investments and equity securities recognized in net investment gains (losses) and unrealized foreign exchange losses (gains) on our available for sale investments in other comprehensive income (loss), generally offset a large portion of the foreign exchange losses (gains) arising from our underwriting portfolio, thereby minimizing the impact of foreign exchange rate movements on total shareholders' equity. As a result, we believe that foreign exchange losses (gains) in our consolidated statements of operations in isolation are not a meaningful contributor to the performance of our business. Therefore, foreign exchange losses (gains) are excluded from operating income (loss). Reorganization expenses in 2024 primarily related to severance costs attributable to our "How We Work" program which is focused on simplifying our operating structure. Reorganization expenses in 2023 primarily related to impairments of computer software assets and severance costs attributable to our "How We Work" program. Reorganization expenses in 2022 primarily related to severance costs and impairments of computer software assets mainly attributable to our exit from catastrophe and property reinsurance lines of business which was part of an overall approach to reduce our exposure to volatile catastrophe risk. Reorganization expenses are primarily driven by business decisions, the nature and timing of which are not related to the underwriting process. Therefore, these expenses are excluded from operating income (loss). Interest in income (loss) of equity method investments is primarily driven by business decisions, the nature and timing of which are not related to the underwriting process. Therefore, this income (loss) is excluded from operating income (loss). Bermuda net deferred tax benefit is due to the recognition of deferred tax assets net of deferred tax liabilities related to Bermuda corporate income tax that is effective for fiscal years beginning on or after January 1, 2025. The Bermuda net deferred tax asset is not related to the underwriting process. Therefore, this income is excluded from operating income (loss). Certain users of our financial statements evaluate performance exclusive of after-tax net investment gains (losses), foreign exchange losses (gains), reorganization expenses, interest in income (loss) of equity method investments and Bermuda net deferred tax asset in order to understand the profitability of recurring sources of income. We believe that showing net income (loss) available (attributable) to common shareholders exclusive of after-tax net investment gains (losses), foreign exchange losses (gains), reorganization expenses, interest in income (loss) of equity method investments and Bermuda net deferred tax asset reflects the underlying fundamentals of our business. In addition, we believe that this presentation enables investors and other users of our financial information to analyze performance in a manner similar to how our management analyzes the underlying business performance. We also believe this measure follows industry practice and, therefore, facilitates comparison of our performance with our peer group. We believe that equity analysts and certain rating agencies that follow us, and the insurance industry as a whole, generally exclude these items from their analyses for the same reasons. The reconciliation of operating income (loss) to net income (loss) available (attributable) to common shareholders, the most comparable GAAP financial measure, is presented in the 'Non-GAAP Financial Measures Reconciliation' section of this document.
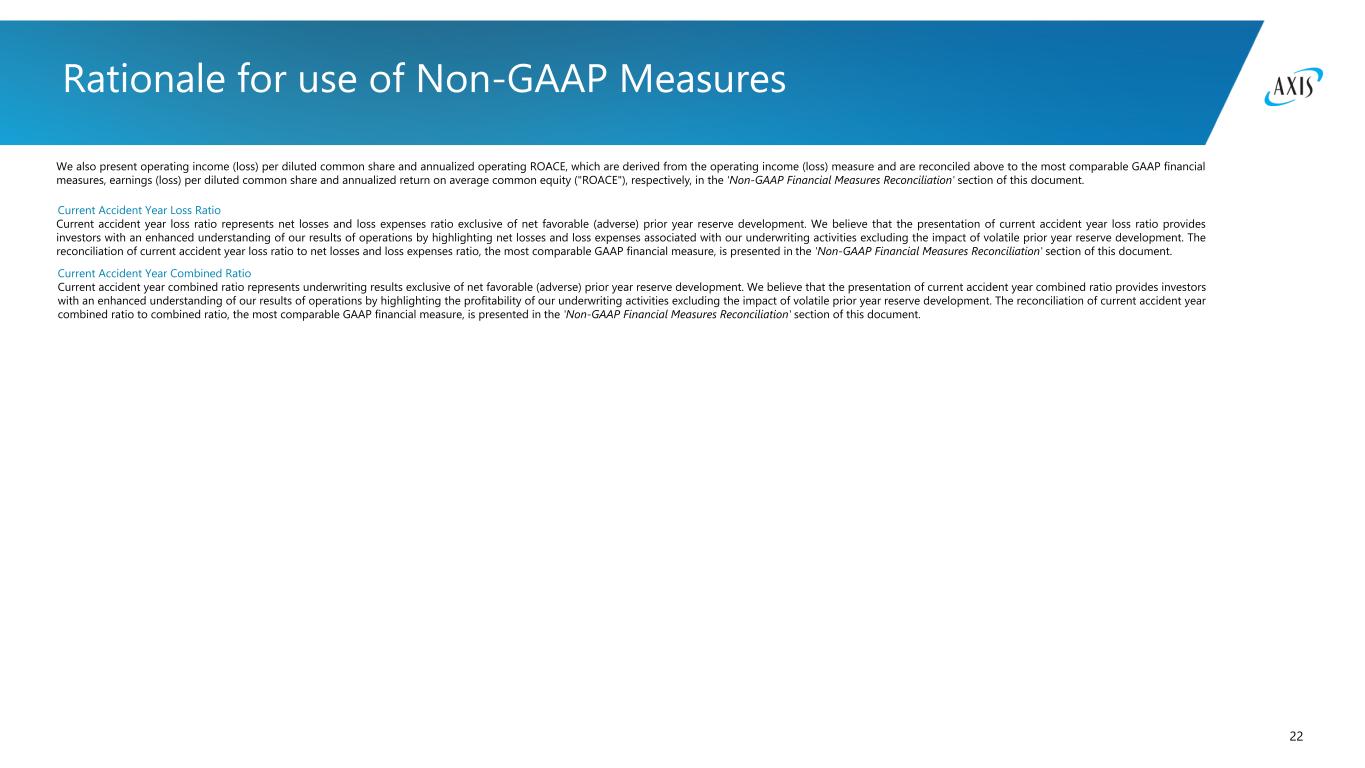
22 Rationale for use of Non-GAAP Measures We also present operating income (loss) per diluted common share and annualized operating ROACE, which are derived from the operating income (loss) measure and are reconciled above to the most comparable GAAP financial measures, earnings (loss) per diluted common share and annualized return on average common equity ("ROACE"), respectively, in the 'Non-GAAP Financial Measures Reconciliation' section of this document. Current Accident Year Loss Ratio Current accident year loss ratio represents net losses and loss expenses ratio exclusive of net favorable (adverse) prior year reserve development. We believe that the presentation of current accident year loss ratio provides investors with an enhanced understanding of our results of operations by highlighting net losses and loss expenses associated with our underwriting activities excluding the impact of volatile prior year reserve development. The reconciliation of current accident year loss ratio to net losses and loss expenses ratio, the most comparable GAAP financial measure, is presented in the 'Non-GAAP Financial Measures Reconciliation' section of this document. Current Accident Year Combined Ratio Current accident year combined ratio represents underwriting results exclusive of net favorable (adverse) prior year reserve development. We believe that the presentation of current accident year combined ratio provides investors with an enhanced understanding of our results of operations by highlighting the profitability of our underwriting activities excluding the impact of volatile prior year reserve development. The reconciliation of current accident year combined ratio to combined ratio, the most comparable GAAP financial measure, is presented in the 'Non-GAAP Financial Measures Reconciliation' section of this document.