Please wait
UNITED STATES
SECURITIES AND EXCHANGE COMMISSION
Washington, D.C. 20549
Form N-CSR
CERTIFIED SHAREHOLDER REPORT OF REGISTERED
MANAGEMENT INVESTMENT COMPANIES
Investment Company Act File Number: 811-21323
Eaton Vance Limited Duration Income Fund
(Exact Name of Registrant as Specified in Charter)
One Post Office Square, Boston, Massachusetts 02109
(Address of Principal Executive Offices)
Deidre E. Walsh
One
Post Office Square, Boston, Massachusetts 02109
(Name and Address of Agent for Services)
(617) 482-8260
(Registrant’s Telephone Number)
March 31
Date of
Fiscal Year End
March 31, 2025
Date of Reporting Period
Item 1. Reports to Stockholders
Eaton Vance
Limited Duration Income
Fund (EVV)
Annual Report
March 31, 2025
Commodity Futures Trading Commission Registration. The Commodity Futures Trading Commission (“CFTC”) has adopted regulations that subject registered investment companies and advisers to regulation by the CFTC if a fund invests more than a
prescribed level of its assets in certain CFTC-regulated instruments (including futures, certain options and swap agreements) or markets itself as providing investment exposure to such instruments. The investment adviser has claimed an exclusion
from the definition of “commodity pool operator” under the Commodity Exchange Act with respect to its management of the Fund. Accordingly, neither the Fund nor the adviser with respect to the operation of the Fund is subject to CFTC
regulation. Because of its management of other strategies, the Fund's adviser is registered with the CFTC as a commodity pool operator. The adviser is also registered as a commodity trading advisor.
Fund shares are not insured by the FDIC and are not deposits or
other obligations of, or guaranteed by, any depository institution. Shares are subject to investment risks, including possible loss of principal invested.
Annual Report March 31, 2025
Eaton Vance
Limited Duration Income Fund
Eaton Vance
Limited Duration Income Fund
March 31, 2025
Management’s Discussion of Fund Performance†
Economic and Market Conditions
During the opening quarter of the 12-month period starting
April 1, 2024, a global trend of rising bond yields was a headwind for fixed-income assets, resulting in flat to negative returns for major investment-grade indexes. In contrast, higher-yielding areas of the fixed-income markets, supported by
interest income, generally posted gains. The resilience of U.S. growth, coupled with persistent inflationary pressures, led markets to reduce the number of projected interest-rate cuts by the U.S. Federal Reserve (Fed) in 2024. At the same time,
several foreign central banks either continued lowering their rates, or began rate-easing cycles.
From July to September 2024, global financial markets posted
strong gains. Volatility spiked in early August due to a weak U.S. jobs report. However, markets quickly regained their footing in response to more favorable U.S. economic data, including a drop in jobless claims and the strongest growth in
retail sales in over a year. During this period, the words and actions of the Fed were key drivers of the broad bond-market rally.
At its July meeting, the Fed held interest rates steady, but
signaled a likely September rate cut. At the Fed’s August Jackson Hole Economic Symposium, Chair Jerome Powell said “the time has come” to start reducing rates. The Fed followed through on this dovish rhetoric, lowering the federal
funds rate 0.50% at its September meeting amid rising confidence that inflation was moving sustainably toward its 2% target. In addition, Fed officials projected another half-point rate cut by year-end. Against this backdrop, the U.S. dollar
weakened and government bond yields fell globally. Credit spreads widened in August during a brief bout of volatility, but finished the three-month period largely unchanged.
From October to December 2024, major equity and fixed-income
indexes generally posted negative returns. The losses were due to several factors, including a less-dovish outlook for Fed policy that pushed global bond yields higher. As anticipated, the Fed lowered interest rates 0.25% at each of its two meetings
during the quarter. However, at its December meeting, the central bank reduced its previous rate-cut estimate from four in 2025 to two, citing strength in the U.S. economy, slower progress on lowering inflation, and the potential for
then-President-elect Trump’s policies to rekindle price pressures.
The resetting of Fed rate expectations, combined with resilient
U.S. growth and Trump’s “America First” agenda, were strong tailwinds for the U.S. dollar. In the rates market, the 10-year U.S. Treasury yield rose more than 0.75% during the three-month period.
From January to March 2025, the world’s equity and
fixed-income markets registered broad gains. The U.S. stock market was a notable exception, with the S&P 500 Index posting its first quarterly loss since 2023. The decline in U.S. equities was largely driven by uncertainties surrounding
U.S. trade policy and the implications for domestic growth and inflation.
President Trump started his second term on January 20, 2025,
and soon announced sweeping import tariffs. They included 25% tariffs on products from Mexico and Canada -- with tariffs on some goods later suspended -- and additional levies on Chinese goods. There were sudden shifts in his tariff plans during the
first quarter of the year, and the lack of clarity weighed on U.S. consumer and business confidence, as well as investor sentiment. Several countries responded with retaliatory tariffs on U.S. products, further dampening investor sentiment.
Worries that tariffs might push U.S. inflation higher led markets to scale back expectations for further Fed interest-rate cuts.
America’s central bank held interest rates steady during
this stretch, as expected, but increased its 2025 inflation forecast and adopted a slightly more hawkish rate outlook for the year. In addition, the Fed lowered its annual growth estimate for 2025.
Fund Performance
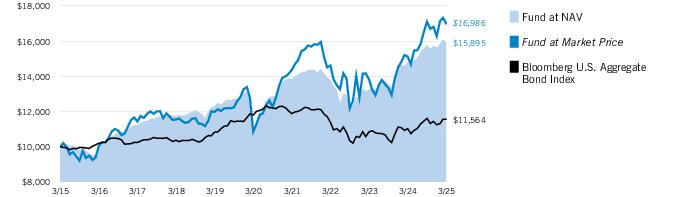
For the 12-month period ended March 31, 2025, Eaton Vance
Limited Duration Income Fund (the Fund) returned 7.37% at net asset value of its common shares (NAV), outperforming its primary benchmark, the Bloomberg U.S. Aggregate Bond Index (the Index), which returned 4.88%. The Fund also outperformed its
secondary benchmark -- 33.33% Morningstar® LSTA® US Leveraged Loan IndexSM, 33.34% ICE BofA U.S. Mortgage-Backed Securities Index, and 33.33% ICE BofA Single-B U.S.
High Yield Index (the Blended Index) -- which returned 6.39% during the period.
The Fund’s use of investment leverage -- not employed by
its primary or secondary benchmarks -- was among the largest contributors to Fund performance versus the Index during the period. As the Fund’s underlying investments were generally positive during the period, leverage served as a tailwind to
help lift Index-relative performance.
Among the
Fund’s Blended Index allocations, the management team’s decision to maintain an underweight exposure to mortgage-backed securities (MBS), and security selections within the sector, contributed to performance versus the Blended Index
during the period.
See Endnotes and Additional Disclosures in this report.
Past performance is no guarantee of future results.
Returns are historical and are calculated net of management fees and other expenses by determining the percentage change in net asset value (NAV) or market price (as applicable) with all distributions reinvested in accordance with the Fund’s
Dividend Reinvestment Plan. Furthermore, returns do not reflect the deduction of taxes that shareholders may have to pay on Fund distributions or upon the sale of Fund shares. Performance at market price will differ from performance at NAV due to
variations in the Fund’s market price versus NAV, which may reflect factors such as fluctuations in supply and demand for Fund shares, changes in Fund distributions, shifting market expectations for the Fund’s future returns and
distribution rates, and other considerations affecting the trading prices of closed-end funds. Investment return and principal value will fluctuate so that shares, when sold, may be worth more or less than their original cost. Performance for
periods less than or equal to one year is cumulative. Performance is for the stated time period only; due to market volatility, current Fund performance may be lower or higher than the quoted return. For performance as of the most recent month-end,
please refer to eatonvance.com.
Eaton Vance
Limited Duration Income Fund
March 31, 2025
Management’s
Discussion of Fund Performance† — continued
As the U.S. Treasury yield curve steepened and long-end
Treasury yields moved modestly upward during the period, the Fund’s preference for higher coupon fixed-rate agency MBS benefited Blended Index-relative returns versus the MBS component of the Blended Index. Generally, these securities carry
shorter durations and higher yields, and also benefited from elevated mortgage rates and slower prepayment speeds during the period. Some of the technical headwinds facing the agency MBS market persisted for much of the period, including
quantitative tightening by the U.S. Federal Reserve and reduced MBS demand from banks. However, strong demand from money managers and the potential for increased bank demand in an easier regulatory environment for banks had an offsetting effect, and
agency MBS spreads ended the period almost exactly where they began.
The Fund’s exposure to floating-rate corporate loans also
had a positive return and outperformed the Blended Index during the period. The Fund’s loan allocation included exposure to debt tranches of collateralized loan obligations, which outperformed the Blended Index and contributed to relative
performance. Additionally, loan selections within the pharmaceuticals and household durables industries added the most to Blended Index-relative performance during the period.
An underweight exposure to lower quality CCC-rated loans
benefited Blended Index-relative performance. In contrast, loan selections within the beverages and professional services industries detracted from Blended Index-relative returns. The Fund’s underweight exposure to the diversified
telecommunication services industry also detracted from Blended Index-relative performance. Meanwhile, the Fund’s out-of-Blended Index allocation to European floating-rate loans helped Fund performance relative to the Blended Index during the
period.
The Fund’s allocation to high yield
corporate bonds outperformed the Blended Index during the period. Within the Fund’s high yield allocation, an out-of-Blended Index exposure to CCC-rated bonds aided relative returns. An out-of-Blended Index exposure to BB-rated bonds was the
primary detractor from relative performance. An underweight allocation to B-rated bonds was additionally punitive, but was slightly offset by positive credit selections. Duration positioning within the Fund’s high yield allocation contributed
to Blended Index-relative performance during the period.
On a sector basis, the best-performing sectors within the
Fund’s high yield allocation during the period were cable & satellite TV, and technology. In cable & satellite TV, an overweight allocation and credit selections were the primary contributors to Blended Index-relative performance. An
out-of-Blended Index exposure to an American broadband connectivity and cable provider was the primary driver of relative outperformance within the sector. An underweight allocation and credit selection within the technology sector aided Blended
Index-relative performance. The top individual contributor within the sector was not owning an American corporation that sells print and digital document products and services.
In contrast, the worst-performing sectors within the
Fund’s high yield allocation were health care and telecommunications. Negative relative performance was due to an underweight allocation and challenging credit selections within both sectors. Within the health care sector, not owning a
specialty pharmaceutical company was the primary detractor from Blended Index-relative performance during the period. The top individual detractor within the telecommunications sector was not owning a U.S.-based technology and telecommunications
company that provides networking, cloud, and cybersecurity solutions to businesses and consumers.
In terms of the Fund’s out-of-Blended Index allocations,
exposures to commercial mortgage-backed securities and emerging-market debt were strong positive contributors to relative returns during the period.
See Endnotes and Additional Disclosures in this report.
Past performance is no guarantee of future results.
Returns are historical and are calculated net of management fees and other expenses by determining the percentage change in net asset value (NAV) or market price (as applicable) with all distributions reinvested in accordance with the Fund’s
Dividend Reinvestment Plan. Furthermore, returns do not reflect the deduction of taxes that shareholders may have to pay on Fund distributions or upon the sale of Fund shares. Performance at market price will differ from performance at NAV due to
variations in the Fund’s market price versus NAV, which may reflect factors such as fluctuations in supply and demand for Fund shares, changes in Fund distributions, shifting market expectations for the Fund’s future returns and
distribution rates, and other considerations affecting the trading prices of closed-end funds. Investment return and principal value will fluctuate so that shares, when sold, may be worth more or less than their original cost. Performance for
periods less than or equal to one year is cumulative. Performance is for the stated time period only; due to market volatility, current Fund performance may be lower or higher than the quoted return. For performance as of the most recent month-end,
please refer to eatonvance.com.
Eaton Vance
Limited Duration Income Fund
March 31, 2025
Performance
Portfolio Manager(s) Catherine
C. McDermott, Andrew Szczurowski, CFA, Kelley Gerrity, Tara O'Brien and Bo Hunt, each of Eaton Vance Management
| %
Average Annual Total Returns1,2 |
Inception
Date |
One
Year |
Five
Years |
Ten
Years |
| Fund
at NAV |
05/30/2003
|
7.37%
|
7.91%
|
4.74%
|
| Fund
at Market Price |
—
|
12.33
|
9.36
|
5.44
|
|
| Bloomberg
U.S. Aggregate Bond Index |
—
|
4.88%
|
(0.40)%
|
1.46%
|
| Blended
Index |
—
|
6.39
|
5.04
|
3.61
|
| %
Premium/Discount to NAV3 |
|
| As
of period end |
(3.95)%
|
| Distributions
4 |
|
| Total
Distributions per share for the period |
$0.94
|
| Distribution
Rate at NAV |
8.54%
|
| Distribution
Rate at Market Price |
8.89
|
| %
Total Leverage5 |
|
| Auction
Preferred Shares (APS) |
10.93%
|
| Borrowings
|
27.97
|
Growth of $10,000
This graph shows the change in value of a hypothetical
investment of $10,000 in the Fund for the period indicated. For comparison, the same investment is shown in the indicated index.
See Endnotes and Additional Disclosures in this report.
Past performance is no guarantee of future results.
Returns are historical and are calculated net of management fees and other expenses by determining the percentage change in net asset value (NAV) or market price (as applicable) with all distributions reinvested in accordance with the Fund’s
Dividend Reinvestment Plan. Furthermore, returns do not reflect the deduction of taxes that shareholders may have to pay on Fund distributions or upon the sale of Fund shares. Performance at market price will differ from performance at NAV due to
variations in the Fund’s market price versus NAV, which may reflect factors such as fluctuations in supply and demand for Fund shares, changes in Fund distributions, shifting market expectations for the Fund’s future returns and
distribution rates, and other considerations affecting the trading prices of closed-end funds. Investment return and principal value will fluctuate so that shares, when sold, may be worth more or less than their original cost. Performance for
periods less than or equal to one year is cumulative. Performance is for the stated time period only; due to market volatility, current Fund performance may be lower or higher than the quoted return. For performance as of the most recent month-end,
please refer to eatonvance.com.
Eaton Vance
Limited Duration Income Fund
March 31, 2025
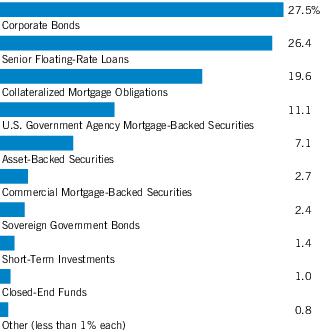
| Asset
Allocation (% of total investments)1 |
Footnotes:
|
1 |
Including
the Fund’s use of leverage, Asset Allocation as a percentage of the Fund's net assets amounted to 172.7%. |
Eaton Vance
Limited Duration Income Fund
March 31, 2025
The Fund's Investment
Objectives, Principal Strategies and Principal Risks‡
Investment Objectives. The
Fund’s investment objective is to provide a high level of current income. The Fund may, as a secondary objective, also seek capital appreciation to the extent consistent with its primary goal of high current income. Under normal market
conditions, the Fund expects to maintain an average duration of no more than five years (including the effect of anticipated leverage).
Principal Strategies. In
pursuing its investment objectives, the Fund normally invests at least 25% of its total assets in each of: (1) investments rated investment grade, including, but not limited to, U.S. Government securities (which may include U.S. Treasuries and
mortgage-backed securities (MBS) and other securities issued, backed, or otherwise guaranteed by the U.S. Government, or its agencies or instrumentalities), commercial MBS and corporate debt obligations; and (2) investments rated below investment
grade, including, but not limited to, senior loans, high-yield debt securities and collateralized loan obligations. Investment-grade investments are those rated BBB- or higher by S&P Global Ratings or Fitch Ratings, Baa3 or higher as determined
by Moody’s Investor Service, Inc. or, if not rated, determined to be of comparable credit quality by the Fund’s portfolio managers.
Under normal market conditions, the Fund structures and seeks
to maintain its portfolio of high-quality investments (such as MBS) and lower quality non-investment instruments and securities in such a manner that the Fund has an average dollar-weighted portfolio credit quality of investment grade. Within the
foregoing guideline, the Fund may invest in individual investments of any credit quality.
The Fund may invest without limit in foreign investments
denominated in U.S. dollars and may invest up to 15% of its net assets in foreign investments denominated in authorized foreign currencies, which include euros, British pounds, Swiss francs, Canadian dollars and Australian dollars. The Fund seeks to
hedge against foreign currency fluctuations through the use of currency exchange contracts and other permitted hedging strategies. Foreign investments may include emerging markets investments. The Fund may enter into forward commitments to buy or
sell agency MBS (to-be-announced transactions, or “TBAs”). The Fund may also invest in other types of investments that are not part of its principal strategy from time to time.
The Fund employs leverage to seek opportunities for additional
income. Leverage may amplify the effect on the Fund’s NAV of any increase or decrease in the value of investments held. There can be no assurance that the use of borrowings will be successful. The Fund has issued preferred shares and borrowed
to establish leverage. The Fund also may establish leverage through derivatives and reverse repurchase agreements. The Fund is permitted to invest up to 10% of its gross assets in credit default swaps (“CDS”) on below investment grade
corporate securities, senior floating-rate bank loans and/or indices related to such investments to gain exposure to such underlying credits or indices. In addition, the Fund may invest in CDS for risk management purposes, including
diversification.
When deemed by the investment adviser to
be relevant to its evaluation of creditworthiness and when applicable information is available, the investment adviser considers environmental, social and/or governance issues (referred to as ESG) which may impact the prospects of an issuer (or
obligor) or financial performance of an obligation. When considered, one or more ESG issues are taken into account alongside other factors in the investment decision-making process and are not the sole determinant of whether an investment can be
made or will remain in the Fund’s portfolio.
Principal Risks
Investment and Market Risk. An
investment in the Fund’s shares is subject to investment risk, including the possible loss of the entire principal amount invested. An investment in Fund’s shares represents an indirect investment in the securities owned by the Fund,
which will generally trade in the over-the-counter (“OTC”) markets. The Fund’s shares at any point in time may be worth less than the original investment, even after taking into account any reinvestment of
distributions.
The value of investments held by
the Fund may increase or decrease in response to social, economic, political, financial, public health crises or other disruptive events (whether real, expected or perceived) in the U.S. and global markets and include events at war, natural
disasters, epidemics and pandemics, terrorism, conflicts and social unrest. These events may negatively impact broad segments of businesses and populations and may exacerbate pre-existing risks to the Fund. The frequency and magnitude of resulting
changes in the value of the Fund’s investments cannot be predicted. Certain securities and other investments held by the Fund may experience increased volatility, illiquidity, or other potentially adverse effects in reaction to changing market
conditions. Monetary and/or fiscal actions taken by U.S. or foreign governments to stimulate or stabilize the global economy may not be effective and could lead to high market volatility. No active trading market may exist for certain investments
held by the Fund, which may impair the ability of the Fund to sell or to realize the current valuation of such investments in the event of the need to liquidate such assets.
Loans Risk. Loans are traded in
a private, unregulated inter-dealer or inter-bank resale market and are generally subject to contractual restrictions that must be satisfied before a loan can be bought or sold. These restrictions may impede the Fund’s ability to buy or sell
loans (thus affecting their liquidity) and may negatively impact the transaction price. See also “Investment and Market Risk” above. It also may take longer than seven days for transactions in loans to settle. The types of covenants
included in loan agreements generally vary depending on market conditions, the creditworthiness of the issuer, the nature of the collateral securing the loan and possibly other factors. Loans with fewer covenants that restrict activities of the
borrower may provide the borrower with more flexibility to take actions that may be detrimental to the loan holders and provide fewer investor protections in the event of such actions or if covenants are breached. The Fund may experience relatively
greater realized or unrealized losses or delays and expense in enforcing its rights with respect to loans with fewer restrictive covenants. Loans to entities located outside of the U.S. may have substantially different lender protections and
covenants as compared to loans to U.S. entities and may involve greater risks. The Fund may have difficulties and incur expenses enforcing its rights with
See Endnotes and Additional Disclosures in this report.
6
Eaton Vance
Limited Duration Income Fund
March 31, 2025
The Fund's Investment
Objectives, Principal Strategies and Principal Risks‡ — continued
respect to non-U.S. loans and such loans could be subject to bankruptcy laws
that are materially different than in the U.S. Loans may be structured such that they are not securities under securities law, and in the event of fraud or misrepresentation by a borrower, lenders may not have the protection of the anti-fraud
provisions of the federal securities laws. Loans are also subject to risks associated with other types of income investments, including credit risk and risks of lower rated investments.
Lower Rated Investments Risk.
Investments rated below investment grade and comparable unrated investments (sometimes referred to as “junk”) are speculative because of increased credit risk relative to other fixed income investments. Changes in economic conditions or
other circumstances typically have a greater effect on the ability of issuers of lower rated investments to make principal and interest payments than they do on issuers of higher rated investments. An economic downturn generally leads to a higher
non-payment rate, and a lower rated investment may lose significant value before a default occurs. Lower rated investments typically are subject to greater price volatility and illiquidity than higher rated investments.
Mortgage- and Asset-Backed Securities Risk. Mortgage- and asset-backed securities represent interests in “pools” of commercial or residential mortgages or other assets, including consumer loans or receivables. Movements in interest rates (both
increases and decreases) may quickly and significantly reduce the value of certain types of mortgage- and asset-backed securities. Although certain mortgage- and asset-backed securities are guaranteed as to timely payment of interest and principal
by a government entity, the market price for such securities is not guaranteed and will fluctuate. The purchase of mortgage- and asset-backed securities issued by non-government entities may entail greater risk than such securities that are issued
or guaranteed by a government entity. Mortgage and asset-backed securities issued by non-government entities may offer higher yields than those issued by government entities, but may also be subject to greater volatility than government issues and
can also be subject to greater credit risk and the risk of default on the underlying mortgages or other assets. Investments in mortgage- and asset-backed securities are subject to both extension risk, where borrowers pay off their debt obligations
more slowly in times of rising interest rates, and prepayment risk, where borrowers pay off their debt obligations sooner than expected in times of declining interest rates. Asset-backed securities represent interests in a pool of assets, such as
home equity loans, commercial mortgage backed securities (“CMBS”), automobile receivables or credit card receivables, and include collateralized loan obligations (“CLOs”) and stripped securities. Interests in collateralized
loan obligations (“CLOs”) are split into two or more portions, called tranches, which vary in risk, maturity, payment priority and yield. Each CLO tranche is entitled to scheduled debt payments from the underlying loans and assumes the
risk of a default by the underlying loans. The Fund will indirectly bear any management fees and expenses incurred by a CLO.
U.S. Government Securities
Risk. Different types of U.S. government securities are subject to different levels of credit risk, including the risk of default, depending on the nature of the particular government support for that security.
Although certain U.S. Government-sponsored agencies (such as the Federal Home Loan Mortgage Corporation and the Federal National Mortgage Association) may be chartered or sponsored by acts of Congress, their securities are neither issued nor
guaranteed by the U.S. Treasury. With respect to U.S. government securities that are not backed by the full faith and credit of the United States, there is a risk that the U.S. Government will not provide financial support to such U.S. government
agencies, instrumentalities or sponsored enterprises if not obligated to do so by law. U.S. Treasury and U.S. Government Agency securities generally have a lower return than other obligations because of their higher credit quality and market
liquidity.
Credit Risk. Investments in fixed income and other debt obligations, including loans (referred to below as “debt instruments”) are subject to the risk of non-payment of scheduled principal and interest. Changes in
economic conditions or other circumstances may reduce the capacity of the party obligated to make principal and interest payments on such instruments and may lead to defaults. Such non-payments and defaults may reduce the value of Fund shares and
income distributions. The value of debt instruments also may decline because of concerns about the issuer’s ability to make principal and interest payments. In addition, the credit ratings of debt instruments may be lowered if the financial
condition of the party obligated to make payments with respect to such instruments deteriorates. In the event of bankruptcy of the issuer of a debt instrument, the Fund could experience delays or limitations with respect to its ability to realize
the benefits of any collateral securing the instrument. In order to enforce its rights in the event of a default, bankruptcy or similar situation, the Fund may be required to retain legal or similar counsel, which may increase the Fund’s
operating expenses and adversely affect net asset value.
Interest Rate Risk. In general,
the value of income securities will fluctuate based on changes in interest rates. The value of these securities is likely to increase when interest rates fall and decline when interest rates rise. Duration measures the time-weighted expected cash
flows of a fixed-income security, while maturity refers to the amount of time until a fixed-income security matures. Generally, securities with longer durations or maturities are more sensitive to changes in interest rates than securities with
shorter durations or maturities, causing them to be more volatile. Conversely, fixed-income securities with shorter durations or maturities will be less volatile but may provide lower returns than fixed-income securities with longer durations or
maturities. In a rising interest rate environment, the duration of income securities that have the ability to be prepaid or called by the issuer may be extended. In a declining interest rate environment, the proceeds from prepaid or maturing
instruments may have to be reinvested at a lower interest rate.
Benchmark Reference Rates Risk.
Many debt securities, derivatives, and other financial instruments utilize benchmark or reference rates for variable interest rate calculations, including the Euro Interbank Offer Rate, Sterling Overnight Index Average Rate, and the Secured
Overnight Financing Rate (each a “Reference Rate”). Instruments in which the Fund invests may pay interest at floating rates based on such Reference Rates or may be subject to interest caps or floors based on such Reference Rates. The
Fund and issuers of instruments in which the Fund invests may also obtain financing at floating rates based on such Reference Rates. The elimination of a Reference Rate or any other changes to or reforms of the determination or supervision of
Reference Rates could have an adverse impact on the market for, or value of, any instruments or payments linked to those Reference Rates. For example, some Reference Rates, as well as other types of rates and indices, are described as
“benchmarks” and have been the subject of ongoing national and international regulatory reform, including under the European Union regulation on indices used as benchmarks in financial instruments and financial
See Endnotes and
Additional Disclosures in this report.
7
Eaton Vance
Limited Duration Income Fund
March 31, 2025
The Fund's Investment
Objectives, Principal Strategies and Principal Risks‡ — continued
contracts. As a result, the manner of administration of benchmarks has changed
and may further change in the future, with the result that relevant benchmarks may perform differently than in the past, the use of benchmarks that are not compliant with the new standards by certain supervised entities may be restricted, and
certain benchmarks may be eliminated entirely. Such changes could cause increased market volatility and disruptions in liquidity for instruments that rely on or are impacted by such benchmarks. Additionally, there could be other consequences which
cannot be predicted.
Foreign Investment Risk. Foreign investments can be adversely affected by political, economic and market developments abroad, including the imposition of economic and other sanctions by the United States or another country against a particular
country or countries, organizations, entities and/or individuals. There may be less publicly available information about foreign issuers because they may not be subject to reporting practices, requirements or regulations comparable to those to which
United States companies are subject. Adverse changes in investment regulations, capital requirements or exchange controls could adversely affect the value of the Fund’s investments. Foreign markets may be smaller, less liquid and more volatile
than the major markets in the United States, and as a result, Fund share values may be more volatile. Trading in foreign markets typically involves higher expense than trading in the United States. The Fund may have difficulties enforcing its legal
or contractual rights in a foreign country.
Emerging
Markets Investment Risk. Investment markets within emerging market countries are typically smaller, less liquid, less developed and more volatile than those in more developed markets like the United States, and may
be focused in certain sectors. Emerging market securities often involve greater risks than developed market securities. The information available about an emerging market issuer may be less reliable than for comparable issuers in more developed
capital markets. Emerging markets investments may also include investments through complex structures that may lack transparency.
Currency Risk. Exchange rates
for currencies fluctuate daily. The value of foreign investments may be affected favorably or unfavorably by changes in currency exchange rates in relation to the U.S. dollar. Currency markets generally are not as regulated as securities markets and
currency transactions are subject to settlement, custodial and other operational risks.
Derivatives Risk. The
Fund’s exposure to derivatives involves risks different from, or possibly greater than, the risks associated with investing directly in securities and other investments. The use of derivatives can lead to losses because of adverse movements in
the price or value of the security, instrument, index, currency, commodity, economic indicator or event underlying a derivative (“reference instrument”), due to failure of a counterparty or due to tax or regulatory constraints.
Derivatives may create leverage in the Fund, which represents a non-cash exposure to the underlying reference instrument. Leverage can increase both the risk and return potential of the Fund. Derivatives risk may be more significant when derivatives
are used to enhance return or as a substitute for a cash investment position, rather than solely to hedge the risk of a position held by the Fund. Use of derivatives involves the exercise of specialized skill and judgment, and a transaction may be
unsuccessful in whole or in part because of market behavior or unexpected events. Changes in the value of a derivative (including one used for hedging) may not correlate perfectly with the underlying reference instrument. Derivative instruments
traded in over-the-counter markets may be difficult to value, may be illiquid, and may be subject to wide swings in valuation caused by changes in the value of the underlying reference instrument. If a derivative’s counterparty is unable to
honor its commitments, the value of Fund shares may decline and the Fund could experience delays in (or be unable to achieve) the return of collateral or other assets held by the counterparty. The loss on derivative transactions may substantially
exceed the initial investment. A derivative investment also involves the risks relating to the reference instrument underlying the investment.
When-Issued and Forward Commitment Risk. Securities purchased on a when-issued or forward commitment basis are subject to the risk that when delivered they will be worth less than the agreed upon payment price.
Risks of Repurchase Agreements and Reverse Repurchase Agreements. In the event of the insolvency of the counterparty to a repurchase agreement or reverse repurchase agreement, recovery of the repurchase price owed to the Fund or, in the case of a reverse repurchase agreement, the
securities sold by the Fund, may be delayed. In a repurchase agreement, such insolvency may result in a loss to the extent that the value of the purchased securities decreases during the delay or that value has otherwise not been maintained at an
amount equal to the repurchase price. In a reverse repurchase agreement, the counterparty’s insolvency may result in a loss equal to the amount by which the value of the securities sold by the Fund exceeds the repurchase price payable by the
Fund; if the value of the purchased securities increases during such a delay, that loss may also be increased. When the Fund enters into a reverse repurchase agreement, any fluctuations in the market value of either the securities sold to the
counterparty or the securities which the Fund purchases with its proceeds from the agreement would affect the value of the Fund’s assets. As a result, such agreements may increase fluctuations in the net asset value of the Fund’s shares.
Reverse repurchase agreements, which are economically equivalent to secured borrowings create leverage for the Fund. If the Fund reinvests the proceeds of a reverse repurchase agreement at a rate lower than the cost of the agreement, entering into
the agreement will lower the Fund’s yield.
Leverage Risk. Certain Fund
transactions may give rise to leverage. Leverage can result from a non-cash exposure to an underlying reference instrument. Leverage can also result from borrowings, issuance of preferred shares or participation in residual interest bond
transactions. Leverage can increase both the risk and return potential of the Fund. The use of leverage may cause the Fund to maintain liquid assets or liquidate portfolio positions when it may not be advantageous to do so to satisfy its
obligations. Leverage may cause the Fund’s NAV to be more volatile than if it had not been leveraged, as certain types of leverage may exaggerate the effect of any increase or decrease in the value of the Fund’s portfolio securities. The
Fund may not be able to adjust its use of leverage rapidly enough to respond to interest rate volatility, inflation, and other changing market conditions. As a result, the Fund’s use of leverage may have a negative impact on the Fund’s
performance from time to time. The loss on leveraged investments may substantially exceed the initial investment.
See Endnotes and Additional Disclosures in this report.
8
Eaton Vance
Limited Duration Income Fund
March 31, 2025
The Fund's Investment
Objectives, Principal Strategies and Principal Risks‡ — continued
Liquidity Risk. The Fund is
exposed to liquidity risk when trading volume, lack of a market maker or trading partner, large position size, market conditions, or legal restrictions impair its ability to sell particular investments or to sell them at advantageous market prices.
Consequently, the Fund may have to accept a lower price to sell an investment or continue to hold it or keep the position open, sell other investments to raise cash or abandon an investment opportunity, any of which could have a negative effect on
the Fund’s performance. These effects may be exacerbated during times of financial or political stress.
Inflation Risk/Deflation Risk.
Inflation risk is the risk that the value of assets or income from investment will be worth less in the future as inflation decreases the value of money. As inflation increases, the real value of the Fund’s
shares and distributions thereon can decline. In addition, during periods of rising inflation, short-term interest rates and the Fund’s cost of leverage would likely increase, reducing returns to the Fund’s shareholders to the extent
that such increased cost is not offset by commensurately higher income. Deflation risk is the risk that prices throughout the economy decline over time − the opposite of inflation. Deflation may have an adverse affect on the creditworthiness
of issuers and may make issuer defaults more likely, which may result in a decline in the value of the Fund’s investments.
Income Risk. The Fund’s
income may decline due to falling interest rates or other factors. Issuers of securities held by the Fund call or redeem the securities during periods of falling interest rates, the Fund if issuers likely would be required to reinvest in securities
paying lower interest rates. Similarly, if an obligation held by the Fund is prepaid, the Fund may have to reinvest the prepayment in other obligations paying income at lower rates. The Fund’s ability to distribute income to shareholders will
depend on the yield available on the common shares held by the Fund. Changes in the dividend policies of companies held by the Fund could make it difficult for the Fund to provide a predictable level of income.
Call and Reinvestment Risks. If
interest rates fall, it is possible that issuers of callable bonds with high interest coupons will “call” (or prepay) their bonds before their maturity date. If a call were exercised by the issuer during a period of declining interest
rates, the Fund would likely replace such called security with a lower yielding security. If that were to happen, it could decrease the Fund’s dividends and possibly could affect the market price of Fund’s shares. Similar risks exist
when the Fund invests the proceeds from matured or traded municipal obligations at market interest rates that are below the Fund’s current earnings rate.
ESG Investment Risk. To the
extent that the investment adviser considers environmental, social and/or governance ("ESG") issues as a component in its investment decision-making process, the Fund's performance may be impacted. Additionally, the investment adviser’s
consideration of ESG issues in its investment decision-making process may require subjective analysis and the ability of the investment adviser to consider ESG issues may be difficult if data about a particular issuer (or obligor) is limited. The
investment adviser’s consideration of ESG issues may contribute to the investment adviser’s decision to forgo opportunities to buy certain securities. ESG issues with respect to an issuer (or obligor) or the investment adviser’s
assessment of such may change over time.
Cash and
Money Market Instruments; Temporary Defensive Positions. The Fund may invest in cash or money market instruments, including high quality short-term instruments or an affiliated investment company that invests in
such instruments. During unusual market conditions, including for temporary defensive purposes, the Fund may invest up to 100% of its assets in cash or money market instruments, which may be inconsistent with its investment objective(s) and other
policies, and as such, the Fund may not achieve its investment objective(s) during this period. Money market instruments may be adversely affected by market and economic events, such as a sharp rise in prevailing short-term interest rates; adverse
developments in the banking industry, which issues or guarantees many money market instruments; adverse economic, political or other developments affecting issuers of money market instruments; changes in the credit quality of issuers; and default by
a counterparty.
Market Discount Risk. As with any security, the market value of the common shares may increase or decrease from the amount initially paid for the common shares. The Fund’s common shares have traded both at a premium and at a discount
relative to NAV. The shares of closed-end management investment companies frequently trade at a discount from their NAV. This is a risk separate and distinct from the risk that the Fund’s NAV may decrease.
Risks Associated with Active Management. The success of the Fund’s investment strategy depends on portfolio management’s successful application of analytical skills and investment judgment. Active management involves subjective decisions and there
is no guarantee that such decisions will produce the desired results or expected returns.
Focused Investment Risk. To the
extent the Fund has substantial investments in a relatively small number of securities or issuers, or a particular market, industry, group of industries, country, region, group of countries, asset class or sector, the Fund’s performance will
be more susceptible to any single economic, market, political, or regulatory occurrence affecting those particular securities or issuers or that particular market, industry, group of industries, country, region, group of countries, assets class, or
sector than a fund that invests more broadly.
Recent
Market Conditions. Both U.S. and international markets have experienced significant volatility in recent months and years. As a result of such volatility, investment returns may fluctuate significantly. National
economies are substantially interconnected, as are global financial markets, which creates the possibility that conditions in one country or region might adversely impact issuers in a different country or region. However, the interconnectedness of
economies and/or markets may be diminishing, which may impact such economies and markets in ways that cannot be foreseen at this time.
See Endnotes and Additional Disclosures in this report.
9
Eaton Vance
Limited Duration Income Fund
March 31, 2025
The Fund's Investment
Objectives, Principal Strategies and Principal Risks‡ — continued
The U.S. government and the U.S. Federal Reserve, as well as
certain foreign governments and central banks, have from time to time taken steps to support financial markets. The U.S. government and the U.S. Federal Reserve may, conversely, reduce market support activities, including by taking action intended
to increase certain interest rates. This and other government intervention may not work as intended, particularly if the efforts are perceived by investors as being unlikely to achieve the desired results. Changes in government activities in this
regard, such as changes in interest rate policy, can negatively affect financial markets generally, increase market volatility and reduce the value and liquidity of securities in which the Fund invests.
Some countries, including the United States, have adopted more
protectionist trade policies. Slowing global economic growth, the rise in protectionist trade policies, changes to some major international trade agreements, risks associated with the trade agreement between the United Kingdom and the European
Union, and the risks associated with trade negotiations between the United States and China, could affect the economies of many nations in ways that cannot necessarily be foreseen at the present time. In addition, the current strength of the U.S.
dollar may decrease foreign demand for U.S. assets, which could have a negative impact on certain issuers and/or industries.
Regulators in the United States have proposed and adopted a
number of changes to regulations involving the markets and issuers, some of which apply to the Fund. The full effect of various newly adopted regulations is not currently known. Additionally, it is not currently known whether any of the proposed
regulations will be adopted. However, due to the scope of regulations being proposed and adopted, certain of these changes to regulation could limit the Fund’s ability to pursue its investment strategies or make certain investments, may make
it more costly for it to operate, or adversely impact performance.
Tensions, war, or open conflict between nations, such as
between Russia and Ukraine, in the Middle East, or in eastern Asia could affect the economies of many nations, including the United States. The duration of ongoing hostilities and any sanctions and related events cannot be predicted. Those events
present material uncertainty and risk with respect to markets globally and the performance of the Fund and its investments or operations could be negatively impacted.
There is widespread concern about the potential effects of
global climate change on property and security values. Certain issuers, industries and regions may be adversely affected by the impact of climate change in ways that cannot be foreseen. The impact of legislation, regulation and international accords
related to climate change may negatively impact certain issuers and/or industries.
Cybersecurity Risk. With the
increased use of technologies by Fund service providers to conduct business, such as the Internet, the Fund is susceptible to operational, information security and related risks. In general, cyber incidents can result from deliberate attacks or
unintentional events. Cybersecurity failures by or breaches of the Fund’s investment adviser or administrator and other service providers (including, but not limited to, the custodian or transfer agent), and the issuers of securities in which
the Fund invests, may disrupt and otherwise adversely affect their business operations. This may result in financial losses to the Fund, impede Fund trading, interfere with the Fund’s ability to calculate its net asset value, interfere with
Fund shareholders’ ability to transact business or cause violations of applicable privacy and other laws, regulatory fines, penalties, reputational damage, reimbursement or other compensation costs, or additional compliance costs.
Anti-Takeover Provisions. The
Fund’s Agreement and Declaration of Trust and Amended and Restated By-Laws (the “By-Laws”) include provisions that could have the effect of making it more difficult to acquire control of the Fund or to change the composition of its
Board.
General Fund Investing Risks. The Fund is not a complete investment program and there is no guarantee that the Fund will achieve its investment objective. It is possible to lose money by investing in the Fund. An investment in the Fund is not a
deposit in a bank and is not insured or guaranteed by the Federal Deposit Insurance Corporation or any other government agency.
There have been no material changes to the Fund’s
investment objective or principal investment strategies since March 31, 2024.
Important Notice to Shareholders
The following information in this annual report is a summary of
certain changes since March 1, 2024. This information may not reflect all of the changes that have occurred since you purchased this Fund.
On January 26, 2023, the Board voted to exempt, on a going
forward basis, all prior and, until further notice, new acquisitions of Fund shares that otherwise might be deemed “Control Share Acquisitions” under the By-Laws from the provisions of the By-Laws addressing “Control Share
Acquisitions.” On October 10, 2024, the Board adopted Amendment No. 2 to the By-Laws to formally eliminate the Control Share Provisions and to make certain related conforming changes.
Catherine C. McDermott, Andrew Szczurowski, Kelley Gerrity,
Tara O'Brien, Justin H. Bourgette and Clifton Bowie (“Bo”) Hunt comprise the Fund's portfolio management team. From April 18, 2024 through March 1, 2025, Mr. Hunt served as a portfolio manager to the Fund as an employee of Morgan Stanley
Investment Management Limited (“MSIM Ltd.”), an affiliate of Eaton Vance Management (“EVM”) that served as a sub-adviser to the Fund during that period. Effective March 1, 2025, in connection with a relocation, Mr. Hunt
serves as a portfolio manager to the Fund as an employee of EVM. In connection with this change, the sub-advisory agreement between EVM and MSIM Ltd. relating to the Fund has been terminated. Mr. Bourgette became a portfolio manager of the Fund
effective March 31, 2025.
See Endnotes and Additional Disclosures in this report.
10
Eaton Vance
Limited Duration Income Fund
March 31, 2025
Endnotes and
Additional Disclosures
| †
|
The views expressed in this
report are those of the portfolio manager(s) and are current only through the date stated at the top of this page. These views are subject to change at any time based upon market or other conditions, and Eaton Vance and the Fund(s) disclaim any
responsibility to update such views. These views may not be relied upon as investment advice and, because investment decisions are based on many factors, may not be relied upon as an indication of trading intent on behalf of any Eaton Vance fund.
This commentary may contain statements that are not historical facts, referred to as “forward-looking statements.” The Fund’s actual future results may differ significantly from those stated in any forward-looking statement,
depending on factors such as changes in securities or financial markets or general economic conditions, the volume of sales and purchases of Fund shares, the continuation of investment advisory, administrative and service contracts, and other risks
discussed from time to time in the Fund’s filings with the Securities and Exchange Commission. |
|
‡ |
The information contained
herein is provided for informational purposes only and does not constitute a solicitation of an offer to buy or sell Fund shares. Common shares of the Fund are available for purchase and sale only at current market prices in secondary market
trading. |
| |
|
| 1 |
Bloomberg U.S. Aggregate
Bond Index is an unmanaged index of domestic investment-grade bonds, including corporate, government and mortgage-backed securities.The Blended Index consists of 33.33% Morningstar® LSTA® US Leveraged Loan IndexSM, 33.33% ICE BofA Single-B U.S. High Yield Index and 33.34% ICE BofA U.S. Mortgage-Backed Securities Index, rebalanced monthly. Morningstar® LSTA® US Leveraged Loan
IndexSM is an unmanaged index of the institutional leveraged loan market. Morningstar® LSTA® Leveraged Loan indices are a product of Morningstar, Inc.
(“Morningstar”) and have been licensed for use. Morningstar® is a registered trademark of Morningstar licensed for certain use. Loan Syndications and Trading Association® and LSTA® are trademarks of the LSTA
licensed for certain use by Morningstar, and further sublicensed by Morningstar for certain use. Neither Morningstar nor LSTA guarantees the accuracy and/or completeness of the Morningstar® LSTA® US Leveraged Loan IndexSM or any data included therein, and shall have no liability for any errors, omissions, or interruptions therein. ICE BofA Single-B U.S. High Yield Index is an unmanaged index of
below-investment grade U.S. corporate bonds with a credit quality rating of B. ICE BofA U.S. Mortgage-Backed Securities Index is an unmanaged index of fixed rate residential mortgage pass-through securities issued by U.S. agencies. ICE®
BofA® indices are not for redistribution or other uses; provided “as is”, without warranties, and with no liability. Eaton Vance has prepared this report and ICE Data Indices, LLC does not endorse it, or guarantee, review, or
endorse Eaton Vance’s products. BofA® is a licensed registered trademark of Bank of America Corporation in the United States and other countries. Unless otherwise stated, index returns do not reflect the effect of any applicable sales
charges, commissions, expenses, taxes or leverage, as applicable. It is not possible to invest directly in an index. |
|
2 |
Performance
results reflect the effects of leverage. Included in the average annual total return at NAV for the ten-year period is the impact of the 2018 tender and repurchase of a portion of the Fund’s Auction Preferred Shares (APS) at 92% of the
Fund’s APS per share |
| |
liquidation preference. Had
this transaction not occurred, the total return at NAV would be lower for the Fund. Performance reflects expenses waived and/or reimbursed, if applicable. Without such
waivers and/or reimbursements, performance would have been lower. Pursuant to
the Fund’s Dividend Reinvestment Plan, if the NAV per share on the distribution payment date is equal to or less than the market price per share plus estimated brokerage commissions, then new shares are issued. The number of shares shall be
determined by the greater of the NAV per share or 95% of the market price. Otherwise, shares generally are purchased on the open market by the Plan’s agent. |
|
3 |
The shares
of the Fund often trade at a discount or premium to their net asset value. The discount or premium may vary over time and may be higher or lower than what is quoted in this report. For up-to-date premium/discount information, please refer to
https://funds.eatonvance.com/closed-end-fund-prices.php. |
|
4 |
The
Distribution Rate is based on the Fund’s last regular distribution per share in the period (annualized) divided by the Fund’s NAV or market price at the end of the period. The Fund’s distributions in any period may be more or less
than the net return earned by the Fund on its investments, and therefore should not be used as a measure of performance or confused with “yield” or “income.” Distributions in excess of Fund returns may include a return of
capital which, over time, will cause the Fund’s net assets and net asset value per share to erode. When the Fund’s distributions include amounts from sources other than net investment income, shareholders are notified. The final
determination of the tax characteristics of Fund distributions will occur after the end of the year, at which time that determination will be reported to shareholders. |
|
5 |
Leverage
represents the liquidation value of the Fund’s APS and borrowings outstanding as a percentage of Fund net assets applicable to common shares plus APS and borrowings outstanding. Use of leverage creates an opportunity for income, but creates
risks including greater price volatility. The cost of leverage rises and falls with changes in short-term interest rates. The Fund may be required to maintain prescribed asset coverage for its leverage and may be required to reduce its leverage at
an inopportune time. |
| |
Fund profile subject to
change due to active management. |
Eaton Vance
Limited Duration Income Fund
March 31, 2025
| Asset-Backed
Securities — 12.2% |
| Security
|
Principal
Amount
(000's omitted) |
Value
|
| Aimco
CLO 11 Ltd., Series 2020-11A, Class D1R2, 7.253%, (3 mo. SOFR + 2.95%), 7/17/37(1)(2) |
$
|
3,000
|
$ 3,009,885
|
| AMMC
CLO 15 Ltd., Series 2014-15A, Class ERR, 11.474%, (3 mo. SOFR + 7.172%), 1/15/32(1)(2) |
|
500
|
499,146
|
| ARES
XXXIV CLO Ltd., Series 2015-2A, Class ER, 11.415%, (3 mo. SOFR + 7.112%), 4/17/33(1)(2) |
|
2,000
|
1,996,220
|
| Babson
CLO Ltd., Series 2022-4A, Class D1R, 7.543%, (3 mo. SOFR + 3.25%), 10/20/37(1)(2) |
|
2,000
|
2,002,542
|
| Benefit
Street Partners CLO XII-B Ltd., Series 2017-12BRA, Class D1, 7.352%, (3 mo. SOFR + 3.05%), 10/15/37(1)(2) |
|
2,000
|
2,004,006
|
| Benefit
Street Partners CLO XV Ltd., Series 2018-15A, Class D2R, 8.802%, (3 mo. SOFR + 4.50%), 7/15/37(1)(2) |
|
1,000
|
1,006,838
|
| Benefit
Street Partners CLO XVIII Ltd., Series 2019-18A, Class ER, 11.314%, (3 mo. SOFR + 7.012%), 10/15/34(1)(2) |
|
4,500
|
4,515,835
|
| Benefit
Street Partners CLO XXII Ltd., Series 2020-22A, Class ER, 11.22%, (3 mo. SOFR + 6.93%), 4/20/35(1)(2) |
|
2,000
|
2,019,490
|
| Benefit
Street Partners CLO XXXII Ltd.: |
|
|
|
| Series
2023-32A, Class D, 8.55%, (3 mo. SOFR + 4.25%), 10/25/36(1)(2) |
|
3,000
|
3,032,967
|
| Series
2023-32A, Class E, 11.65%, (3 mo. SOFR + 7.35%), 10/25/36(1)(2) |
|
2,000
|
2,031,238
|
| BlueMountain
CLO Ltd.: |
|
|
|
| Series
2016-3A, Class ER, 10.535%, (3 mo. SOFR + 6.212%), 11/15/30(1)(2) |
|
2,000
|
1,819,238
|
| Series
2018-1A, Class E, 10.499%, (3 mo. SOFR + 6.212%), 7/30/30(1)(2) |
|
1,000
|
854,378
|
| BlueMountain
CLO XXIV Ltd., Series 2019-24A, Class ER, 11.395%, (3 mo. SOFR + 7.102%), 4/20/34(1)(2) |
|
1,000
|
917,499
|
| BlueMountain
CLO XXVI Ltd., Series 2019-26A, Class ER, 11.685%, (3 mo. SOFR + 7.392%), 10/20/34(1)(2) |
|
2,500
|
2,462,635
|
| BlueMountain
CLO XXX Ltd., Series 2020-30A, Class ER, 11.002%, (3 mo. SOFR + 6.70%), 4/15/35(1)(2) |
|
2,000
|
1,914,558
|
| BlueMountain
CLO XXXIV Ltd., Series 2022-34A, Class E, 11.84%, (3 mo. SOFR + 7.55%), 4/20/35(1)(2) |
|
1,000
|
985,068
|
| Brookhaven
Park CLO Ltd., Series 2024-1A, Class D, 7.893%, (3 mo. SOFR + 3.60%), 4/19/37(1)(2) |
|
3,000
|
3,018,507
|
| Bryant
Park Funding Ltd., Series 2023-21A, Class D, 9.743%, (3 mo. SOFR + 5.45%), 10/18/36(1)(2) |
|
3,000
|
3,047,040
|
| Canyon
Capital CLO Ltd., Series 2016-2A, Class ER, 10.564%, (3 mo. SOFR + 6.262%), 10/15/31(1)(2) |
|
3,350
|
3,309,894
|
| Carlyle
C17 CLO Ltd., Series C17A, Class DR, 10.549%, (3 mo. SOFR + 6.262%), 4/30/31(1)(2) |
|
1,750
|
1,689,123
|
| Carlyle
Global Market Strategies CLO Ltd.: |
|
|
|
| Series
2012-3A, Class DR2, 11.049%, (3 mo. SOFR + 6.762%), 1/14/32(1)(2) |
|
2,000
|
1,974,550
|
| Series
2014-4RA, Class D, 10.214%, (3 mo. SOFR + 5.912%), 7/15/30(1)(2) |
|
1,250
|
1,197,716
|
| Security
|
Principal
Amount
(000's omitted) |
Value
|
Carlyle
Global Market Strategies CLO Ltd.:
(continued) |
|
|
|
| Series
2015-5A, Class DR, 11.255%, (3 mo. SOFR + 6.962%), 1/20/32(1)(2) |
$
|
1,000
|
$ 991,708
|
| Carlyle
U.S. CLO Ltd.: |
|
|
|
| Series
2022-6A, Class DR, 9.05%, (3 mo. SOFR + 4.75%), 10/25/36(1)(2) |
|
5,400
|
5,482,372
|
| Series
2022-6A, Class ER, 12.20%, (3 mo. SOFR + 7.90%), 10/25/36(1)(2) |
|
2,000
|
2,006,320
|
| Dryden
41 Senior Loan Fund, Series 2015-41A, Class ER, 9.864%, (3 mo. SOFR + 5.562%), 4/15/31(1)(2) |
|
2,000
|
1,874,444
|
| Dryden
42 Senior Loan Fund, Series 2016-42A, Class ERR, 10.802%, (3 mo. SOFR + 6.50%), 7/15/37(1)(2) |
|
1,000
|
1,001,816
|
| Elmwood
CLO 14 Ltd., Series 2022-1A, Class E, 10.643%, (3 mo. SOFR + 6.35%), 4/20/35(1)(2) |
|
1,000
|
1,003,340
|
| Elmwood
CLO 32 Ltd., Series 2024-8A, Class D1, 7.647%, (3 mo. SOFR + 2.85%), 10/18/37(1)(2) |
|
3,000
|
3,000,621
|
| Elmwood
CLO VI Ltd., Series 2020-3A, Class D2RR, 8.643%, (3 mo. SOFR + 4.35%), 7/18/37(1)(2) |
|
1,000
|
1,004,779
|
| Elmwood
CLO VIII Ltd., Series 2021-1A, Class DR, 8.093%, (3 mo. SOFR + 3.80%), 4/20/37(1)(2) |
|
4,000
|
4,029,684
|
| Galaxy
33 CLO Ltd., Series 2024-33A, Class D1, 7.843%, (3 mo. SOFR + 3.55%), 4/20/37(1)(2) |
|
2,000
|
2,017,136
|
| Galaxy
XV CLO Ltd., Series 2013-15A, Class ER, 11.209%, (3 mo. SOFR + 6.907%), 10/15/30(1)(2) |
|
3,275
|
3,274,679
|
| Galaxy
XXI CLO Ltd., Series 2015-21A, Class ER, 9.805%, (3 mo. SOFR + 5.512%), 4/20/31(1)(2) |
|
1,100
|
1,101,712
|
| Golub
Capital Partners CLO 50B-R Ltd., Series 2020-50A, Class ER, 11.393%, (3 mo. SOFR + 7.10%), 4/20/35(1)(2) |
|
2,000
|
1,994,838
|
| Golub
Capital Partners CLO 72 B Ltd., Series 2024-72A, Class D, 8.30%, (3 mo. SOFR + 4.00%), 4/25/37(1)(2) |
|
2,000
|
2,017,282
|
| Harvest
U.S. CLO Ltd., Series 2024-2A, Class D1, 8.059%, (3 mo. SOFR + 3.25%), 10/15/37(1)(2) |
|
3,000
|
3,003,873
|
| Madison
Park Funding LV Ltd., Series 2022-55A, Class D1R, 7.443%, (3 mo. SOFR + 3.15%), 7/18/37(1)(2) |
|
3,000
|
3,008,616
|
| Madison
Park Funding XXXVI Ltd., Series 2019-36A, Class ERR, 9.898%, (3 mo. SOFR + 5.60%), 4/15/35(1)(2) |
|
3,000
|
2,948,280
|
| Madison
Park Funding XXXVII Ltd., Series 2019-37A, Class ER2, 10.902%, (3 mo. SOFR + 6.60%), 4/15/37(1)(2) |
|
3,500
|
3,509,660
|
| Magnetite
XXII Ltd.: |
|
|
|
| Series
2019-22A, Class DJ, 8.452%, (3 mo. SOFR + 4.15%), 7/15/36(1)(2) |
|
1,000
|
1,006,252
|
| Series
2019-22A, Class DRR, 7.202%, (3 mo. SOFR + 2.90%), 7/15/36(1)(2) |
|
3,000
|
3,005,865
|
| Marble
Point CLO XIX Ltd., Series 2020-3A, Class DR, 8.293%, (3 mo. SOFR + 4.00%), 1/19/34(1)(2) |
|
3,000
|
2,988,600
|
| Neuberger
Berman Loan Advisers CLO 48 Ltd., Series 2022-48A, Class E, 10.80%, (3 mo. SOFR + 6.50%), 4/25/36(1)(2) |
|
2,000
|
2,006,656
|
| NRZ
Excess Spread-Collateralized Notes, Series 2021-GNT1, Class A, 3.474%, 11/25/26(1) |
|
1,216
|
1,174,980
|
12
See Notes to Financial Statements.
Eaton Vance
Limited Duration Income Fund
March 31, 2025
Portfolio of
Investments — continued
| Security
|
Principal
Amount
(000's omitted) |
Value
|
| Oaktree
CLO Ltd., Series 2019-4A, Class D2RR, 8.993%, (3 mo. SOFR + 4.70%), 7/20/37(1)(2) |
$
|
2,000
|
$
2,012,640 |
| OCP
CLO Ltd.: |
|
|
|
| Series
2022-24A, Class D2R, 8.693%, (3 mo. SOFR + 4.40%), 10/20/37(1)(2) |
|
1,500
|
1,505,814
|
| Series
2023-27A, Class DR, 7.658%, (3 mo. SOFR + 3.35%), 7/16/35(1)(2) |
|
2,000
|
2,009,234
|
| Series
2024-32A, Class D1, 8.04%, (3 mo. SOFR + 3.75%), 4/23/37(1)(2) |
|
4,000
|
4,037,484
|
| Octagon
68 Ltd.: |
|
|
|
| Series
2023-1A, Class D, 8.493%, (3 mo. SOFR + 4.20%), 10/20/36(1)(2) |
|
5,000
|
5,045,930
|
| Series
2023-1A, Class E, 11.533%, (3 mo. SOFR + 7.24%), 10/20/36(1)(2) |
|
2,000
|
2,019,276
|
| Palmer
Square CLO Ltd.: |
|
|
|
| Series
2018-1A, Class CR, 8.193%, (3 mo. SOFR + 3.90%), 4/18/37(1)(2) |
|
3,000
|
3,038,931
|
| Series
2019-1A, Class DR, 11.08%, (3 mo. SOFR + 6.762%), 11/14/34(1)(2) |
|
2,000
|
2,006,854
|
| Series
2021-3A, Class E, 10.714%, (3 mo. SOFR + 6.412%), 1/15/35(1)(2) |
|
2,500
|
2,509,962
|
| Series
2023-3A, Class D, 8.993%, (3 mo. SOFR + 4.70%), 1/20/37(1)(2) |
|
3,500
|
3,542,318
|
| RAD
CLO 5 Ltd., Series 2019-5A, Class E, 11.258%, (3 mo. SOFR + 6.962%), 7/24/32(1)(2) |
|
4,550
|
4,572,072
|
| RAD
CLO 22 Ltd., Series 2023-22A, Class D, 9.293%, (3 mo. SOFR + 5.00%), 1/20/37(1)(2) |
|
3,000
|
3,028,866
|
| Regatta
XIII Funding Ltd., Series 2018-2A, Class D, 10.514%, (3 mo. SOFR + 6.212%), 7/15/31(1)(2) |
|
2,000
|
1,926,194
|
| Regatta
XIV Funding Ltd., Series 2018-3A, Class E, 10.512%, (3 mo. SOFR + 6.212%), 10/25/31(1)(2) |
|
1,000
|
998,518
|
| Sixth
Street CLO XXI Ltd., Series 2022-21A, Class D1R, 7.293%, (3 mo. SOFR + 3.00%), 10/21/37(1)(2) |
|
2,000
|
2,002,570
|
| Vibrant
CLO XI Ltd., Series 2019-11A, Class D, 11.325%, (3 mo. SOFR + 7.032%), 7/20/32(1)(2) |
|
575
|
569,142
|
| Voya
CLO Ltd.: |
|
|
|
| Series
2015-3A, Class DR, 10.755%, (3 mo. SOFR + 6.462%), 10/20/31(1)(2) |
|
3,000
|
2,848,881
|
| Series
2016-3A, Class DR, 10.635%, (3 mo. SOFR + 6.342%), 10/18/31(1)(2) |
|
1,400
|
1,264,201
|
| Series
2024-2A, Class D, 7.493%, (3 mo. SOFR + 3.20%), 7/20/37(1)(2) |
|
2,000
|
2,009,872
|
| Wellfleet
CLO Ltd., Series 2020-1A, Class D, 11.804%, (3 mo. SOFR + 7.502%), 4/15/33(1)(2) |
|
2,000
|
1,859,460
|
Total
Asset-Backed Securities
(identified cost $147,702,546) |
|
|
$ 147,570,105
|
| Security
|
Shares
|
Value
|
| BlackRock
Corporate High Yield Fund, Inc. |
|
2,188,579
|
$
20,966,587 |
Total
Closed-End Funds
(identified cost $26,062,179) |
|
|
$ 20,966,587
|
| Collateralized
Mortgage Obligations — 34.0% |
| Security
|
Principal
Amount
(000's omitted) |
Value
|
| Cascade
MH Asset Trust, Series 2022-MH1, Class A, 4.25% to 7/25/27, 8/25/54(1)(3) |
$
|
2,544
|
$ 2,456,274
|
| Champs
Trust: |
|
|
|
| Series
2024-1, Class A, 10.113%, 7/25/59(1)(4) |
|
9,590
|
9,938,753
|
| Series
2024-2, Class A, 9.07%, 11/25/59(1)(4) |
|
10,313
|
10,759,396
|
| Series
2025-1, Class A, 8.506%, 4/25/60(1)(4) |
|
11,783
|
12,250,846
|
| Federal
Home Loan Mortgage Corp.: |
|
|
|
| Series
2113, Class QG, 6.00%, 1/15/29 |
|
80
|
80,528
|
| Series
2122, Class K, 6.00%, 2/15/29 |
|
14
|
13,824
|
| Series
2130, Class K, 6.00%, 3/15/29 |
|
9
|
9,474
|
| Series
2167, Class BZ, 7.00%, 6/15/29 |
|
8
|
8,501
|
| Series
2182, Class ZB, 8.00%, 9/15/29 |
|
100
|
103,426
|
| Series
2198, Class ZA, 8.50%, 11/15/29 |
|
64
|
65,789
|
| Series
2458, Class ZB, 7.00%, 6/15/32 |
|
240
|
251,292
|
| Series
3762, Class SH, 1.066%, (9.771% - 30-day SOFR Average x 2.00), 11/15/40(5) |
|
338
|
284,105
|
| Series
4273, Class PU, 4.00%, 11/15/43 |
|
2,263
|
1,945,793
|
| Series
4273, Class SP, 0.088%, (11.695% - 30-day SOFR Average x 2.667), 11/15/43(5) |
|
503
|
412,238
|
| Series
4678, Class PC, 3.00%, 1/15/46 |
|
1,908
|
1,793,307
|
| Series
5083, Class SK, 0.00%, (3.867% - 30-day SOFR Average x 1.333, Floor 0.00%), 3/25/51(5) |
|
2,047
|
1,161,735
|
| Series
5327, Class B, 6.00%, 8/25/53 |
|
5,000
|
5,126,194
|
| Series
5353, Class AZ, 6.50%, 11/25/53 |
|
2,192
|
2,340,292
|
| Series
5410, Class KY, 6.00%, 5/25/54 |
|
36,000
|
37,332,439
|
| Series
5414, Class CZ, 5.50%, 5/25/54 |
|
10,516
|
10,478,456
|
| Series
5424, Class CZ, 6.00%, 6/25/54 |
|
16,048
|
16,643,299
|
| Series
5428, Class Z, 6.00%, 7/25/54 |
|
4,184
|
4,309,250
|
| Series
5429, Class DZ, 6.00%, 7/25/54 |
|
3,138
|
3,232,797
|
| Series
5453, Class DZ, 5.50%, 9/25/54 |
|
5,163
|
5,015,652
|
| Series
5478, Class SG, 5.963%, (15.51% - 30-day SOFR Average x 2.20), 12/25/54(5) |
|
7,879
|
8,052,536
|
| Series
5500, Class SC, 7.981%, (21.00% - 30-day SOFR Average x 3.00), 10/25/54(5) |
|
7,852
|
8,454,920
|
| Series
5508, Class AS, 7.981%, (21.00% - 30-day SOFR Average x 3.00), 2/25/55(5) |
|
7,840
|
8,462,089
|
| Series
5508, Class DS, 7.981%, (21.00% - 30-day SOFR Average x 3.00), 2/25/55(5) |
|
4,324
|
4,767,511
|
| Series
5508, Class SC, 7.981%, (21.00% - 30-day SOFR Average x 3.00), 2/25/55(5) |
|
9,792
|
10,731,197
|
| Series
5513, Class MQ, 8.131%, (30-day SOFR Average + 3.95%), 6/25/54(5) |
|
9,925
|
10,159,340
|
| Series
5516, Class HZ, 6.00%, 3/25/55 |
|
10,050
|
10,471,026
|
| Series
5535, Class MB, (30-day SOFR Average + 4.05%), 5/25/55(6) |
|
4,000
|
4,058,748
|
| Interest
Only:(7) |
|
|
|
| Series
284, Class S6, 1.637%, (5.986% - 30-day SOFR Average), 10/15/42(5) |
|
932
|
96,833
|
| Series
362, Class C7, 3.50%, 9/15/47 |
|
3,833
|
746,685
|
| Series
362, Class C11, 4.00%, 12/15/47 |
|
3,511
|
789,384
|
| Series
4067, Class JI, 3.50%, 6/15/27 |
|
214
|
5,448
|
| Series
4070, Class S, 1.637%, (5.986% - 30-day SOFR Average), 6/15/32(5) |
|
1,720
|
103,859
|
| Series
4094, Class CS, 1.537%, (5.886% - 30-day SOFR Average), 8/15/42(5) |
|
480
|
48,629
|
| Series
4095, Class HS, 1.637%, (5.986% - 30-day SOFR Average), 7/15/32(5) |
|
284
|
10,301
|
13
See Notes to Financial Statements.
Eaton Vance
Limited Duration Income Fund
March 31, 2025
Portfolio of
Investments — continued
| Security
|
Principal
Amount
(000's omitted) |
Value
|
| Interest
Only: (continued) |
|
|
|
| Series
4109, Class ES, 1.687%, (6.036% - 30-day SOFR Average), 12/15/41(5) |
$
|
81
|
$ 8,720
|
| Series
4110, Class SA, 1.187%, (5.536% - 30-day SOFR Average), 9/15/42(5) |
|
1,521
|
102,237
|
| Series
4149, Class S, 1.787%, (6.136% - 30-day SOFR Average), 1/15/33(5) |
|
919
|
59,336
|
| Series
4188, Class AI, 3.50%, 4/15/28 |
|
144
|
2,782
|
| Series
4203, Class QS, 1.787%, (6.136% - 30-day SOFR Average), 5/15/43(5) |
|
1,827
|
133,358
|
| Series
4408, Class IP, 3.50%, 4/15/44 |
|
1,229
|
149,973
|
| Series
4435, Class BI, 3.50%, 7/15/44 |
|
2,325
|
325,171
|
| Series
4629, Class QI, 3.50%, 11/15/46 |
|
1,066
|
193,410
|
| Series
4644, Class TI, 3.50%, 1/15/45 |
|
1,089
|
136,127
|
| Series
4744, Class IO, 4.00%, 11/15/47 |
|
1,801
|
373,140
|
| Series
4749, Class IL, 4.00%, 12/15/47 |
|
800
|
166,038
|
| Series
4793, Class SD, 1.737%, (6.086% - 30-day SOFR Average), 6/15/48(5) |
|
3,710
|
454,505
|
| Series
4966, Class SY, 1.596%, (5.936% - 30-day SOFR Average), 4/25/50(5) |
|
10,135
|
1,352,571
|
| Principal
Only:(8) |
|
|
|
| Series
242, Class PO, 0.00%, 11/15/36 |
|
1,477
|
1,204,463
|
| Series
259, Class PO, 0.00%, 4/15/39 |
|
965
|
772,093
|
| Series
3606, Class PO, 0.00%, 12/15/39 |
|
951
|
741,783
|
| Series
4417, Class KO, 0.00%, 12/15/43 |
|
184
|
128,038
|
| Series
4478, Class PO, 0.00%, 5/15/45 |
|
534
|
391,264
|
| Federal
National Mortgage Association: |
|
|
|
| Series
1996-57, Class Z, 7.00%, 12/25/26 |
|
21
|
20,757
|
| Series
1997-77, Class Z, 7.00%, 11/18/27 |
|
28
|
28,255
|
| Series
1998-44, Class ZA, 6.50%, 7/20/28 |
|
37
|
38,327
|
| Series
1999-45, Class ZG, 6.50%, 9/25/29 |
|
11
|
11,437
|
| Series
2000-22, Class PN, 6.00%, 7/25/30 |
|
169
|
171,911
|
| Series
2002-21, Class PE, 6.50%, 4/25/32 |
|
133
|
137,769
|
| Series
2005-75, Class CS, 6.383%, (23.742% - 30-day SOFR Average x 4.00), 9/25/35(5) |
|
436
|
491,005
|
| Series
2007-74, Class AC, 5.00%, 8/25/37 |
|
1,595
|
1,606,476
|
| Series
2011-49, Class NT, 6.00%, (64.855% - 30-day SOFR Average x 10.00, Cap 6.00%), 6/25/41(5) |
|
178
|
172,984
|
| Series
2012-134, Class ZT, 2.00%, 12/25/42 |
|
1,309
|
943,708
|
| Series
2013-6, Class TA, 1.50%, 1/25/43 |
|
833
|
745,896
|
| Series
2013-67, Class NF, 5.00%, (30-day SOFR Average + 1.114%, Cap 5.00%), 7/25/43(2) |
|
947
|
904,999
|
| Series
2017-15, Class LE, 3.00%, 6/25/46 |
|
357
|
349,831
|
| Series
2017-48, Class LG, 2.75%, 5/25/47 |
|
1,228
|
1,085,500
|
| Series
2019-29, Class WC, 1.734%, 6/25/48(4) |
|
815
|
0
|
| Series
2024-90, Class ES, 6.073%, (15.620% - 30-day SOFR Average x 2.20), 10/25/54(5) |
|
9,959
|
10,522,689
|
| Series
2024-98, Class J, 0.125%, 12/25/53 |
|
19,426
|
15,861,811
|
| Interest
Only:(7) |
|
|
|
| Series
2011-101, Class IC, 3.50%, 10/25/26 |
|
298
|
3,316
|
| Series
2011-101, Class IE, 3.50%, 10/25/26 |
|
97
|
1,049
|
| Series
2012-33, Class CI, 3.50%, 3/25/27 |
|
10
|
0
|
| Series
2012-118, Class IN, 3.50%, 11/25/42 |
|
2,494
|
478,537
|
| Series
2012-124, Class IO, 1.675%, 11/25/42(4) |
|
864
|
39,131
|
| Series
2012-125, Class IG, 3.50%, 11/25/42 |
|
7,871
|
1,601,137
|
| Series
2012-150, Class SK, 1.696%, (6.036% - 30-day SOFR Average), 1/25/43(5) |
|
1,425
|
158,343
|
| Series
2013-12, Class SP, 1.196%, (5.536% - 30-day SOFR Average), 11/25/41(5) |
|
191
|
3,338
|
| Security
|
Principal
Amount
(000's omitted) |
Value
|
| Interest
Only: (continued) |
|
|
|
| Series
2013-15, Class DS, 1.746%, (6.086% - 30-day SOFR Average), 3/25/33(5) |
$
|
2,532
|
$ 147,078
|
| Series
2013-16, Class SY, 1.696%, (6.036% - 30-day SOFR Average), 3/25/43(5) |
|
805
|
90,746
|
| Series
2013-64, Class PS, 1.796%, (6.136% - 30-day SOFR Average), 4/25/43(5) |
|
1,006
|
81,257
|
| Series
2013-75, Class SC, 1.796%, (6.136% - 30-day SOFR Average), 7/25/42(5) |
|
1,026
|
26,130
|
| Series
2014-32, Class EI, 4.00%, 6/25/44 |
|
299
|
55,537
|
| Series
2014-55, Class IN, 3.50%, 7/25/44 |
|
602
|
113,037
|
| Series
2014-89, Class IO, 3.50%, 1/25/45 |
|
809
|
154,481
|
| Series
2015-52, Class MI, 3.50%, 7/25/45 |
|
708
|
135,309
|
| Series
2018-21, Class IO, 3.00%, 4/25/48 |
|
3,353
|
563,162
|
| Series
2019-1, Class AS, 1.546%, (5.886% - 30-day SOFR Average), 2/25/49(5) |
|
5,257
|
401,845
|
| Series
2019-33, Class SK, 1.596%, (5.936% - 30-day SOFR Average), 7/25/49(5) |
|
3,508
|
373,274
|
| Series
2020-23, Class SP, 1.596%, (5.936% - 30-day SOFR Average), 2/25/50(5) |
|
3,130
|
420,612
|
| Principal
Only:(8) |
|
|
|
| Series
379, Class 1, 0.00%, 5/25/37 |
|
908
|
734,750
|
| Series
2006-8, Class WQ, 0.00%, 3/25/36 |
|
1,465
|
1,202,225
|
| Government
National Mortgage Association: |
|
|
|
| Series
2017-121, Class DF, 4.934%, (1 mo. SOFR + 0.614%, Cap 5.00%), 8/20/47(2) |
|
2,665
|
2,597,303
|
| Series
2017-137, Class AF, 4.934%, (1 mo. SOFR + 0.614%, Cap 5.00%), 9/20/47(2) |
|
1,389
|
1,353,378
|
| Series
2018-6, Class JZ, 4.00%, 1/20/48 |
|
5,526
|
4,347,760
|
| Series
2021-165, Class MZ, 2.50%, 9/20/51 |
|
9,561
|
5,788,269
|
| Series
2022-189, Class US, 6.804%, (22.733% - 30-day SOFR Average x 3.667), 11/20/52(5) |
|
3,663
|
3,954,801
|
| Series
2023-56, Class ZE, 6.00%, 4/20/53 |
|
11,216
|
11,687,284
|
| Series
2023-63, Class S, 6.621%, (22.55% - 30-day SOFR Average x 3.667), 5/20/53(5) |
|
3,474
|
3,681,545
|
| Series
2023-65, Class SD, 6.621%, (22.55% - 30-day SOFR Average x 3.667), 5/20/53(5) |
|
4,991
|
5,354,748
|
| Series
2023-96, Class BL, 6.00%, 7/20/53 |
|
4,326
|
4,448,474
|
| Series
2023-96, Class DB, 6.00%, 7/20/53 |
|
2,500
|
2,607,463
|
| Series
2023-97, Class CB, 6.00%, 7/20/53 |
|
10,000
|
10,240,079
|
| Series
2023-99, Class AL, 6.00%, 7/20/53 |
|
2,500
|
2,607,379
|
| Series
2023-102, Class SG, 6.356%, (22.546% - 30-day SOFR Average x 3.727), 7/20/53(5) |
|
6,075
|
6,217,276
|
| Series
2023-115, Class AL, 6.00%, 8/20/53 |
|
8,500
|
8,730,685
|
| Series
2023-116, Class CY, 6.00%, 8/20/53 |
|
5,000
|
5,109,154
|
| Series
2023-133, Class S, 8.567%, (21.60% - 30-day SOFR Average x 3.00), 9/20/53(5) |
|
3,074
|
3,278,910
|
| Series
2023-149, Class S, 8.417%, (21.45% - 30-day SOFR Average x 3.00), 10/20/53(5) |
|
3,508
|
3,827,207
|
| Series
2023-150, Class AS, 10.802%, (27.528% - 30-day SOFR Average x 3.85), 10/20/53(5) |
|
1,931
|
2,174,093
|
| Series
2023-153, Class SM, 10.623%, (28.00% - 30-day SOFR Average x 4.00), 10/20/53(5) |
|
2,416
|
2,719,594
|
| Series
2023-164, Class EL, 6.00%, 11/20/53 |
|
6,000
|
6,222,302
|
| Series
2023-165, Class DY, 6.00%, 11/20/53 |
|
12,000
|
12,437,419
|
| Series
2023-165, Class EY, 6.50%, 11/20/53 |
|
30,000
|
31,650,102
|
| Series
2023-173, Class AX, 6.00%, 11/20/53 |
|
6,000
|
6,222,320
|
| Series
2023-181, Class CL, 6.50%, 11/20/53 |
|
2,000
|
2,136,747
|
| Series
2023-182, Class EL, 6.00%, 12/20/53 |
|
3,000
|
3,115,477
|
| Interest
Only:(7) |
|
|
|
| Series
2017-104, Class SD, 1.766%, (6.086% - 1 mo. SOFR), 7/20/47(5) |
|
2,071
|
255,730
|
14
See Notes to Financial Statements.
Eaton Vance
Limited Duration Income Fund
March 31, 2025
Portfolio of
Investments — continued
| Security
|
Principal
Amount
(000's omitted) |
Value
|
| Interest
Only: (continued) |
|
|
|
| Series
2020-151, Class AI, 2.00%, 10/20/50 |
$
|
10,528
|
$
1,275,565 |
| Series
2020-154, Class PI, 2.50%, 10/20/50 |
|
9,414
|
1,268,388
|
| Series
2020-176, Class HI, 2.50%, 11/20/50 |
|
11,038
|
1,492,926
|
| Series
2021-131, Class QI, 3.00%, 7/20/51 |
|
8,334
|
1,134,015
|
| Series
2021-193, Class IU, 3.00%, 11/20/49 |
|
18,047
|
2,597,714
|
| Series
2021-209, Class IW, 3.00%, 11/20/51 |
|
11,758
|
1,607,392
|
| JPM
Lending Facility, 11.323%, (SOFR + 7.00%), 7/15/29(2) |
|
8,250
|
8,274,073
|
Total
Collateralized Mortgage Obligations
(identified cost $434,292,610) |
|
|
$ 409,960,396
|
| Commercial
Mortgage-Backed Securities — 4.6% |
| Security
|
Principal
Amount
(000's omitted) |
Value
|
| BAMLL
Commercial Mortgage Securities Trust: |
|
|
|
| Series
2019-BPR, Class ENM, 3.719%, 11/5/32(1)(4) |
$
|
910
|
$ 580,292
|
| Series
2019-BPR, Class FNM, 3.719%, 11/5/32(1)(4) |
|
3,505
|
913,746
|
| BBCMS
Mortgage Trust, Series 2017-C1, Class D, 3.548%, 2/15/50(1)(4) |
|
2,200
|
1,433,352
|
| BX
Commercial Mortgage Trust, Series 2021-VOLT, Class C, 5.534%, (1 mo. SOFR + 1.214%), 9/15/36(1)(2) |
|
2,000
|
1,976,434
|
| CFCRE
Commercial Mortgage Trust: |
|
|
|
| Series
2016-C3, Class C, 4.743%, 1/10/48(4) |
|
1,300
|
1,261,363
|
| Series
2016-C3, Class D, 3.052%, 1/10/48(1)(4) |
|
3,500
|
3,254,615
|
| COMM
Mortgage Trust: |
|
|
|
| Series
2013-CR11, Class D, 4.464%, 8/10/50(1)(4) |
|
5,910
|
5,659,088
|
| Series
2015-CR22, Class D, 4.044%, 3/10/48(1)(4) |
|
4,100
|
3,148,243
|
| CSMC
Trust: |
|
|
|
| Series
2016-NXSR, Class C, 4.421%, 12/15/49(4) |
|
2,770
|
2,463,462
|
| Series
2016-NXSR, Class D, 4.421%, 12/15/49(1)(4) |
|
3,000
|
2,304,503
|
| Federal
National Mortgage Association Multifamily Connecticut Avenue Securities Trust, Series 2019-01, Class M10, 7.704%, (30-day SOFR Average + 3.364%), 10/25/49(1)(2) |
|
1,406
|
1,430,574
|
| Fontainebleau
Miami Beach Mortgage Trust, Series 2024-FBLU, Class G, 9.969%, (1 mo. SOFR + 5.65%), 12/15/39(1)(2) |
|
5,000
|
5,023,322
|
| JPMBB
Commercial Mortgage Securities Trust: |
|
|
|
| Series
2014-C22, Class D, 4.51%, 9/15/47(1)(4) |
|
1,376
|
927,452
|
| Series
2014-C23, Class D, 3.966%, 9/15/47(1)(4) |
|
3,488
|
3,056,314
|
| JPMorgan
Chase Commercial Mortgage Securities Trust: |
|
|
|
| Series
2013-C13, Class D, 3.984%, 1/15/46(1)(4) |
|
338
|
319,542
|
| Series
2013-C16, Class D, 4.558%, 12/15/46(1)(4) |
|
2,572
|
2,420,383
|
| Series
2014-DSTY, Class B, 3.771%, 6/10/27(1) |
|
2,600
|
150,163
|
| Series
2021-MHC, Class C, 5.985%, (1 mo. SOFR + 1.664%), 4/15/38(1)(2) |
|
1,900
|
1,896,733
|
| Security
|
Principal
Amount
(000's omitted) |
Value
|
| Morgan
Stanley Bank of America Merrill Lynch Trust: |
|
|
|
| Series
2014-C16, Class B, 4.225%, 6/15/47(4)(9) |
$
|
39
|
$
38,658 |
| Series
2015-C23, Class D, 4.137%, 7/15/50(1)(4)(9) |
|
2,670
|
2,572,543
|
| Series
2016-C29, Class D, 3.00%, 5/15/49(1)(9) |
|
3,577
|
2,922,877
|
| Series
2016-C32, Class D, 3.396%, 12/15/49(1)(4)(9) |
|
1,600
|
1,221,020
|
| Morgan
Stanley Capital I Trust, Series 2016-UBS12, Class D, 3.312%, 12/15/49(1)(9) |
|
4,489
|
2,565,511
|
| UBS-Barclays
Commercial Mortgage Trust, Series 2013-C6, Class D, 3.859%, 4/10/46(1)(4) |
|
3,764
|
3,260,091
|
| Wells
Fargo Commercial Mortgage Trust: |
|
|
|
| Series
2015-C31, Class D, 3.852%, 11/15/48 |
|
2,475
|
2,174,881
|
| Series
2016-C35, Class D, 3.142%, 7/15/48(1) |
|
1,850
|
1,672,783
|
| Series
2016-C36, Class D, 2.942%, 11/15/59(1) |
|
1,500
|
1,075,066
|
Total
Commercial Mortgage-Backed Securities
(identified cost $63,085,470) |
|
|
$ 55,723,011
|
| Security
|
Shares
|
Value
|
| Aerospace
and Defense — 0.0% |
| IAP
Worldwide Services LLC(10)(11)(12) |
|
31
|
$
0 |
| |
|
|
$ 0
|
| Commercial
Services & Supplies — 0.0%† |
| Monitronics
International, Inc.(11)(12) |
|
26,092
|
$
345,719 |
| Phoenix
Services International LLC(11)(12) |
|
17,026
|
68,104
|
| Phoenix
Services International LLC(11)(12) |
|
1,554
|
6,216
|
| |
|
|
$ 420,039
|
| Containers
and Glass Products — 0.0%† |
| LG
Parent Holding Co.(11)(12) |
|
166,175
|
$
339,329 |
| |
|
|
$ 339,329
|
| Diversified
Financial Services — 0.0% |
| Sprint
IntermediateCo BV(10)(11)(12) |
|
6,079
|
$
0 |
| Sprint
IntermediateCo BV(10)(11)(12) |
|
16,949
|
0
|
| |
|
|
$ 0
|
| Electronic
Equipment, Instruments & Components — 0.1% |
| Range
Red Acquisitions LLC, Class A1(10)(11)(12) |
|
516
|
$
1,152,847 |
| |
|
|
$ 1,152,847
|
| Electronics/Electrical
— 0.0%† |
| Skillsoft
Corp.(11)(12) |
|
7,153
|
$
137,624 |
| |
|
|
$ 137,624
|
| Energy
— 0.1% |
| Enviva
LLC(11)(13) |
|
58,260
|
$
917,595 |
| |
|
|
$ 917,595
|
15
See Notes to Financial Statements.
Eaton Vance
Limited Duration Income Fund
March 31, 2025
Portfolio of
Investments — continued
| Security
|
Shares
|
Value
|
| Entertainment
— 0.0%† |
| New
Cineworld Ltd.(11)(12) |
|
12,854
|
$
276,040 |
| |
|
|
$ 276,040
|
| Health
Care — 0.1% |
| Akorn
Holding Co. LLC(10)(11)(12) |
|
42,374
|
$
0 |
| Envision
Parent, Inc.(11)(12) |
|
146,518
|
1,636,093
|
| |
|
|
$ 1,636,093
|
| Household
Durables — 0.2% |
| Serta
Simmons Bedding, Inc.(11)(12) |
|
246,099
|
$
2,337,940 |
| Serta
SSB Equipment Co.(10)(11)(12) |
|
246,099
|
0
|
| |
|
|
$ 2,337,940
|
| Investment
Companies — 0.0%† |
| Aegletes
BV(11)(12) |
|
11,215
|
$
7,312 |
| |
|
|
$ 7,312
|
| Nonferrous
Metals/Minerals — 0.1% |
| ACNR
Holdings, Inc., Class A(12) |
|
7,669
|
$
580,447 |
| |
|
|
$ 580,447
|
| Oil
and Gas — 0.0%† |
| AFG
Holdings, Inc.(10)(11)(12) |
|
29,751
|
$
0 |
| Frontera
Energy Corp. |
|
634
|
2,961
|
| |
|
|
$ 2,961
|
| Pharmaceuticals
— 0.3% |
| Endo,
Inc.(11)(12) |
|
12,600
|
$
302,400 |
| Mallinckrodt
International Finance SA(11)(12) |
|
31,584
|
2,863,627
|
| |
|
|
$ 3,166,027
|
| Retail
— 0.0% |
| Jubilee
Enterprise PCL, Class A1(10)(11)(12) |
|
807
|
$
0 |
| Jubilee
Enterprise PCL, Class A2(10)(11)(12) |
|
644,824
|
0
|
| |
|
|
$ 0
|
| Retailers
(Except Food and Drug) — 0.0% |
| Phillips
Feed Service, Inc.(10)(11)(12) |
|
582
|
$
0 |
| |
|
|
$ 0
|
| Telecommunications
— 0.0% |
| GEE
Acquisition Holdings Corp.(10)(11)(12) |
|
37,259
|
$
0 |
| |
|
|
$ 0
|
Total
Common Stocks
(identified cost $13,588,266) |
|
|
$ 10,974,254
|
| Security
|
Principal
Amount*
(000's omitted) |
Value
|
| Energy
— 0.1% |
| XPLR
Infrastructure LP, 2.50%, 6/15/26(1) |
|
1,205
|
$
1,151,980 |
| |
|
|
$ 1,151,980
|
| Security
|
Principal
Amount*
(000's omitted) |
Value
|
| Internet
Software & Services — 0.0%† |
| Delivery
Hero SE: |
|
|
|
| 2.125%,
3/10/29(14) |
EUR
|
300
|
$
286,181 |
| 3.25%,
2/21/30(14) |
EUR
|
100
|
104,660
|
| |
|
|
$ 390,841
|
| Real
Estate Investment Trusts (REITs) — 0.1% |
| Pebblebrook
Hotel Trust, 1.75%, 12/15/26 |
|
795
|
$
744,915 |
| |
|
|
$ 744,915
|
Total
Convertible Bonds
(identified cost $2,267,581) |
|
|
$ 2,287,736
|
| Security
|
Principal
Amount*
(000's omitted) |
Value
|
| Aerospace
and Defense — 1.1% |
| Bombardier,
Inc.: |
|
|
|
| 7.00%,
6/1/32(1) |
|
710
|
$
707,816 |
| 7.25%,
7/1/31(1) |
|
825
|
828,838
|
| 7.875%,
4/15/27(1) |
|
708
|
711,125
|
| 8.75%,
11/15/30(1) |
|
1,125
|
1,187,494
|
| Moog,
Inc., 4.25%, 12/15/27(1) |
|
955
|
920,911
|
| TransDigm,
Inc.: |
|
|
|
| 4.625%,
1/15/29 |
|
2,965
|
2,817,394
|
| 5.50%,
11/15/27 |
|
2,552
|
2,524,868
|
| 6.375%,
3/1/29(1) |
|
650
|
657,439
|
| 6.625%,
3/1/32(1) |
|
1,045
|
1,059,624
|
| 6.75%,
8/15/28(1) |
|
1,812
|
1,840,728
|
| |
|
|
$ 13,256,237
|
| Agriculture
— 0.1% |
| Darling
Ingredients, Inc., 6.00%, 6/15/30(1) |
|
814
|
$
809,771 |
| |
|
|
$ 809,771
|
| Air
Transport — 0.1% |
| Deutsche
Lufthansa AG, 4.382% to 2/12/26, 8/12/75(14)(15) |
EUR
|
200
|
$
216,811 |
| Gatwick
Airport Finance PLC, 4.375%, 4/7/26(14) |
GBP
|
300
|
381,567
|
| Heathrow
Finance PLC: |
|
|
|
| 4.125%,
9/1/29(14) |
GBP
|
100
|
117,818
|
| 6.625%,
3/1/31(14) |
GBP
|
220
|
281,819
|
| |
|
|
$ 998,015
|
| Airlines
— 0.2% |
| VistaJet
Malta Finance PLC/Vista Management Holding, Inc.: |
|
|
|
| 6.375%,
2/1/30(1) |
|
2,806
|
$
2,461,679 |
| 9.50%,
6/1/28(1) |
|
494
|
489,498
|
| |
|
|
$ 2,951,177
|
16
See Notes to Financial Statements.
Eaton Vance
Limited Duration Income Fund
March 31, 2025
Portfolio of
Investments — continued
| Security
|
Principal
Amount*
(000's omitted) |
Value
|
| Apparel
& Luxury Goods — 0.1% |
| Champ
Acquisition Corp., 8.375%, 12/1/31(1) |
|
1,366
|
$
1,414,542 |
| |
|
|
$ 1,414,542
|
| Automotive
— 1.4% |
| Asbury
Automotive Group, Inc.: |
|
|
|
| 4.625%,
11/15/29(1) |
|
512
|
$
480,293 |
| 4.75%,
3/1/30 |
|
1,134
|
1,061,913
|
| 5.00%,
2/15/32(1) |
|
217
|
196,967
|
| Clarios
Global LP/Clarios U.S. Finance Co.: |
|
|
|
| 4.375%,
5/15/26(14) |
EUR
|
150
|
162,137
|
| 6.25%,
5/15/26(1) |
|
666
|
666,220
|
| 6.75%,
2/15/30(1) |
|
715
|
722,436
|
| 8.50%,
5/15/27(1) |
|
3,484
|
3,491,349
|
| Dana
Financing Luxembourg SARL, 8.50%, 7/15/31(14) |
EUR
|
100
|
116,871
|
| Forvia
SE: |
|
|
|
| 2.75%,
2/15/27(14) |
EUR
|
100
|
104,893
|
| 5.50%,
6/15/31(14) |
EUR
|
223
|
232,894
|
| 8.00%,
6/15/30(1)(6) |
|
200
|
197,671
|
| Goodyear
Tire & Rubber Co., 5.00%, 7/15/29 |
|
1,433
|
1,330,750
|
| IHO
Verwaltungs GmbH: |
|
|
|
| 6.375%,
(6.375% cash or 7.125% PIK), 5/15/29(1)(16) |
|
200
|
193,413
|
| 7.00%,
(7.00% cash or 7.75% PIK), 11/15/31(14)(16) |
EUR
|
100
|
111,041
|
| 8.75%,
(8.75% cash or 9.50% PIK), 5/15/28(14)(16) |
EUR
|
100
|
113,131
|
| Lithia
Motors, Inc.: |
|
|
|
| 3.875%,
6/1/29(1) |
|
651
|
596,651
|
| 4.375%,
1/15/31(1) |
|
1,171
|
1,061,837
|
| 4.625%,
12/15/27(1) |
|
514
|
498,349
|
| Mahle
GmbH, 6.50%, 5/2/31(14) |
EUR
|
100
|
106,957
|
| RCI
Banque SA: |
|
|
|
| 4.75%
to 12/24/31, 3/24/37(14)(15) |
EUR
|
100
|
107,977
|
| 5.50%
to 7/9/29, 10/9/34(14)(15) |
EUR
|
100
|
112,697
|
| Real
Hero Merger Sub 2, Inc., 6.25%, 2/1/29(1) |
|
2,173
|
1,713,479
|
| Renault
SA, 2.375%, 5/25/26(14) |
EUR
|
100
|
107,217
|
| Sonic
Automotive, Inc.: |
|
|
|
| 4.625%,
11/15/29(1) |
|
1,297
|
1,195,588
|
| 4.875%,
11/15/31(1) |
|
1,081
|
971,446
|
| TI
Automotive Finance PLC, 3.75%, 4/15/29(14) |
EUR
|
185
|
200,824
|
| Volkswagen
International Finance NV, 7.875% to 9/6/32(14)(15)(17) |
EUR
|
200
|
241,483
|
| ZF
Finance GmbH, 5.75%, 8/3/26(14) |
EUR
|
100
|
110,024
|
| ZF
North America Capital, Inc.: |
|
|
|
| 6.75%,
4/23/30(1) |
|
150
|
142,711
|
| 6.875%,
4/23/32(1) |
|
150
|
139,344
|
| |
|
|
$ 16,488,563
|
| Beverages
— 0.1% |
| Primo
Water Holdings, Inc./Triton Water Holdings, Inc., 6.25%, 4/1/29(1) |
|
1,712
|
$
1,708,905 |
| |
|
|
$ 1,708,905
|
| Building
and Development — 2.5% |
| Ashton
Woods USA LLC/Ashton Woods Finance Co.: |
|
|
|
| 4.625%,
8/1/29(1) |
|
392
|
$
355,231 |
| Security
|
Principal
Amount*
(000's omitted) |
Value
|
| Building
and Development (continued) |
Ashton
Woods USA LLC/Ashton Woods Finance Co.:
(continued) |
|
|
|
| 4.625%,
4/1/30(1) |
|
1,097
|
$
993,120 |
| Builders
FirstSource, Inc.: |
|
|
|
| 4.25%,
2/1/32(1) |
|
2,498
|
2,236,601
|
| 5.00%,
3/1/30(1) |
|
1,085
|
1,037,934
|
| CP
Atlas Buyer, Inc., 7.00%, 12/1/28(1) |
|
2,055
|
1,627,118
|
| EMRLD
Borrower LP/Emerald Co-Issuer, Inc.: |
|
|
|
| 6.375%,
12/15/30(14) |
EUR
|
700
|
780,185
|
| 6.625%,
12/15/30(1) |
|
1,782
|
1,785,017
|
| HT
Troplast GmbH, 9.375%, 7/15/28(14) |
EUR
|
125
|
141,007
|
| James
Hardie International Finance DAC, 3.625%, 10/1/26(14) |
EUR
|
400
|
431,449
|
| KB
Home: |
|
|
|
| 4.00%,
6/15/31 |
|
86
|
77,273
|
| 4.80%,
11/15/29 |
|
556
|
530,945
|
| Masterbrand,
Inc., 7.00%, 7/15/32(1) |
|
1,620
|
1,618,868
|
| Miller
Homes Group Finco PLC: |
|
|
|
| 7.00%,
5/15/29(14) |
GBP
|
200
|
249,366
|
| 7.806%,
(3 mo. EURIBOR + 5.25%), 5/15/28(2)(14) |
EUR
|
200
|
217,652
|
| MIWD
Holdco II LLC/MIWD Finance Corp., 5.50%, 2/1/30(1) |
|
559
|
503,850
|
| Patrick
Industries, Inc.: |
|
|
|
| 4.75%,
5/1/29(1) |
|
1,187
|
1,115,115
|
| 6.375%,
11/1/32(1) |
|
995
|
965,637
|
| Quikrete
Holdings, Inc.: |
|
|
|
| 6.375%,
3/1/32(1) |
|
2,027
|
2,041,523
|
| 6.75%,
3/1/33(1) |
|
2,221
|
2,212,916
|
| Smyrna
Ready Mix Concrete LLC, 6.00%, 11/1/28(1) |
|
3,078
|
2,989,716
|
| Specialty
Building Products Holdings LLC/SBP Finance Corp., 7.75%, 10/15/29(1) |
|
1,764
|
1,631,241
|
| Standard
Building Solutions, Inc., 6.50%, 8/15/32(1) |
|
670
|
670,575
|
| Standard
Industries, Inc.: |
|
|
|
| 2.25%,
11/21/26(14) |
EUR
|
125
|
131,602
|
| 3.375%,
1/15/31(1) |
|
2,339
|
2,035,600
|
| 4.375%,
7/15/30(1) |
|
1,779
|
1,642,940
|
| Taylor
Morrison Communities, Inc., 5.875%, 6/15/27(1) |
|
808
|
808,118
|
| White
Cap Buyer LLC, 6.875%, 10/15/28(1) |
|
1,237
|
1,188,556
|
| |
|
|
$ 30,019,155
|
| Business
Equipment and Services — 0.6% |
| Adtalem
Global Education, Inc., 5.50%, 3/1/28(1) |
|
1,900
|
$
1,873,520 |
| Allied
Universal Holdco LLC, 7.875%, 2/15/31(1) |
|
630
|
638,549
|
| Allied
Universal Holdco LLC/Allied Universal Finance Corp.: |
|
|
|
| 6.00%,
6/1/29(1) |
|
1,426
|
1,311,615
|
| 9.75%,
7/15/27(1) |
|
1,148
|
1,152,518
|
| Allied
Universal Holdco LLC/Allied Universal Finance Corp./Atlas Luxco 4 SARL: |
|
|
|
| 3.625%,
6/1/28(14) |
EUR
|
240
|
246,287
|
| 4.625%,
6/1/28(1) |
|
1,316
|
1,243,493
|
| 4.625%,
6/1/28(1) |
|
549
|
520,500
|
| |
|
|
$ 6,986,482
|
17
See Notes to Financial Statements.
Eaton Vance
Limited Duration Income Fund
March 31, 2025
Portfolio of
Investments — continued
| Security
|
Principal
Amount*
(000's omitted) |
Value
|
| Cable
and Satellite Television — 1.6% |
| Altice
Financing SA: |
|
|
|
| 3.00%,
1/15/28(14) |
EUR
|
100
|
$
81,790 |
| 4.25%,
8/15/29(14) |
EUR
|
200
|
161,509
|
| 5.00%,
1/15/28(1) |
|
814
|
611,902
|
| 5.75%,
8/15/29(1) |
|
611
|
447,804
|
| CCO
Holdings LLC/CCO Holdings Capital Corp.: |
|
|
|
| 4.25%,
2/1/31(1) |
|
2,589
|
2,296,424
|
| 4.50%,
8/15/30(1) |
|
1,814
|
1,652,875
|
| 4.50%,
5/1/32 |
|
535
|
464,807
|
| 4.75%,
3/1/30(1) |
|
1,789
|
1,660,875
|
| 5.00%,
2/1/28(1) |
|
1,755
|
1,704,685
|
| 5.375%,
6/1/29(1) |
|
595
|
576,233
|
| 6.375%,
9/1/29(1) |
|
1,974
|
1,969,654
|
| DISH
Network Corp., 11.75%, 11/15/27(1) |
|
1,293
|
1,362,436
|
| Virgin
Media Finance PLC, 5.00%, 7/15/30(1) |
|
1,527
|
1,311,526
|
| Virgin
Media O2 Vendor Financing Notes V DAC, 7.875%, 3/15/32(1) |
GBP
|
120
|
151,222
|
| Virgin
Media Secured Finance PLC: |
|
|
|
| 4.50%,
8/15/30(1) |
|
1,042
|
917,908
|
| 5.25%,
5/15/29(14) |
GBP
|
200
|
240,977
|
| Virgin
Media Vendor Financing Notes III DAC, 4.875%, 7/15/28(14) |
GBP
|
725
|
869,473
|
| Virgin
Media Vendor Financing Notes IV DAC, 5.00%, 7/15/28(1) |
|
1,862
|
1,761,829
|
| VZ
Vendor Financing II BV, 2.875%, 1/15/29(14) |
EUR
|
200
|
193,639
|
| Ziggo
Bond Co. BV: |
|
|
|
| 3.375%,
2/28/30(14) |
EUR
|
230
|
216,542
|
| 5.125%,
2/28/30(1) |
|
560
|
488,840
|
| Ziggo
BV, 4.875%, 1/15/30(1) |
|
628
|
576,110
|
| |
|
|
$ 19,719,060
|
| Capital
Goods — 0.1% |
| BWX
Technologies, Inc.: |
|
|
|
| 4.125%,
6/30/28(1) |
|
948
|
$
896,102 |
| 4.125%,
4/15/29(1) |
|
733
|
685,134
|
| |
|
|
$ 1,581,236
|
| Chemicals
— 0.3% |
| Calderys
Financing II LLC, 11.75%, (11.75% cash or 12.50% PIK), 6/1/28(1)(16) |
|
1,360
|
$
1,351,550 |
| Calderys
Financing LLC, 11.25%, 6/1/28(1) |
|
2,315
|
2,441,000
|
| CTEC
II GmbH, 5.25%, 2/15/30(14) |
EUR
|
250
|
247,376
|
| |
|
|
$ 4,039,926
|
| Chemicals
and Plastics — 1.2% |
| ASK
Chemicals Deutschland Holding GmbH, 10.00%, 11/15/29(14) |
EUR
|
300
|
$
327,684 |
| Avient
Corp.: |
|
|
|
| 6.25%,
11/1/31(1) |
|
893
|
885,355
|
| 7.125%,
8/1/30(1) |
|
1,762
|
1,798,674
|
| Celanese
U.S. Holdings LLC: |
|
|
|
| 5.00%,
4/15/31 |
EUR
|
230
|
246,949
|
| 6.95%,
11/15/33 |
|
1,964
|
2,054,268
|
| Cerdia
Finanz GmbH, 9.375%, 10/3/31(1) |
|
2,419
|
2,480,951
|
| Herens
Holdco SARL, 4.75%, 5/15/28(1) |
|
545
|
490,960
|
| Herens
Midco SARL, 5.25%, 5/15/29(14) |
EUR
|
400
|
344,959
|
| Security
|
Principal
Amount*
(000's omitted) |
Value
|
| Chemicals
and Plastics (continued) |
| INEOS
Finance PLC: |
|
|
|
| 5.625%,
8/15/30(1) |
EUR
|
100
|
$
108,169 |
| 6.375%,
4/15/29(14) |
EUR
|
100
|
110,833
|
| Italmatch
Chemicals SpA, 10.00%, 2/6/28(14) |
EUR
|
400
|
453,592
|
| Nufarm
Australia Ltd./Nufarm Americas, Inc., 5.00%, 1/27/30(1) |
|
1,091
|
1,016,681
|
| Olympus
Water U.S. Holding Corp.: |
|
|
|
| 3.875%,
10/1/28(14) |
EUR
|
110
|
113,760
|
| 9.625%,
11/15/28(14) |
EUR
|
525
|
592,983
|
| 9.75%,
11/15/28(1) |
|
2,512
|
2,611,136
|
| Valvoline,
Inc., 3.625%, 6/15/31(1) |
|
1,403
|
1,220,688
|
| |
|
|
$ 14,857,642
|
| Clothing/Textiles
— 0.2% |
| Hanesbrands,
Inc., 9.00%, 2/15/31(1) |
|
1,710
|
$
1,803,736 |
| PrestigeBidCo
GmbH, 6.535%, (3 mo. EURIBOR + 3.75%), 7/1/29(2)(14) |
EUR
|
100
|
108,701
|
| |
|
|
$ 1,912,437
|
| Commercial
Services — 2.1% |
| Amber
Finco PLC, 6.625%, 7/15/29(1) |
EUR
|
165
|
$
185,493 |
| AMN
Healthcare, Inc.: |
|
|
|
| 4.00%,
4/15/29(1) |
|
1,696
|
1,529,920
|
| 4.625%,
10/1/27(1) |
|
156
|
150,096
|
| APi
Group DE, Inc., 4.75%, 10/15/29(1) |
|
2,510
|
2,345,254
|
| BCP
V Modular Services Finance II PLC, 4.75%, 11/30/28(14) |
EUR
|
100
|
105,023
|
| Belron
U.K. Finance PLC: |
|
|
|
| 4.625%,
10/15/29(1) |
EUR
|
230
|
251,031
|
| 5.75%,
10/15/29(1) |
|
2,115
|
2,102,204
|
| Boels
Topholding BV, 5.75%, 5/15/30(14) |
EUR
|
120
|
133,340
|
| Boost
Newco Borrower LLC, 7.50%, 1/15/31(1) |
|
1,328
|
1,383,359
|
| Boost
Newco Borrower LLC/GTCR W Dutch Finance Sub BV, 8.50%, 1/15/31(14) |
GBP
|
200
|
274,748
|
| Cimpress
PLC, 7.375%, 9/15/32(1) |
|
885
|
814,349
|
| HealthEquity,
Inc., 4.50%, 10/1/29(1) |
|
1,674
|
1,571,282
|
| IPD
3 BV, 8.00%, 6/15/28(14) |
EUR
|
425
|
481,319
|
| Korn
Ferry, 4.625%, 12/15/27(1) |
|
1,412
|
1,369,886
|
| Loxam
SAS, 2.875%, 4/15/26(14) |
EUR
|
100
|
107,792
|
| Mavis
Tire Express Services Topco Corp., 6.50%, 5/15/29(1) |
|
2,923
|
2,769,997
|
| NESCO
Holdings II, Inc., 5.50%, 4/15/29(1) |
|
1,647
|
1,522,406
|
| OT
Midco Ltd., 10.00%, 2/15/30(1) |
|
1,000
|
863,458
|
| Pachelbel
Bidco SpA: |
|
|
|
| 7.125%,
5/17/31(1) |
EUR
|
120
|
137,735
|
| 7.125%,
5/17/31(14) |
EUR
|
100
|
114,779
|
| Shift4
Payments LLC/Shift4 Payments Finance Sub, Inc., 6.75%, 8/15/32(1) |
|
1,046
|
1,055,138
|
| Spectrum
Brands, Inc., 3.875%, 3/15/31(1) |
|
266
|
227,904
|
| Techem
Verwaltungsgesellschaft 675 GmbH, 5.375%, 7/15/29(14) |
EUR
|
200
|
219,373
|
| Verisure
Holding AB: |
|
|
|
| 3.25%,
2/15/27(14) |
EUR
|
200
|
213,567
|
| 9.25%,
10/15/27(14) |
EUR
|
180
|
204,176
|
| VT
Topco, Inc., 8.50%, 8/15/30(1) |
|
2,193
|
2,301,420
|
18
See Notes to Financial Statements.
Eaton Vance
Limited Duration Income Fund
March 31, 2025
Portfolio of
Investments — continued
| Security
|
Principal
Amount*
(000's omitted) |
Value
|
| Commercial
Services (continued) |
| Wand
NewCo 3, Inc., 7.625%, 1/30/32(1) |
|
1,234
|
$
1,263,958 |
| WASH
Multifamily Acquisition, Inc., 5.75%, 4/15/26(1) |
|
2,060
|
2,044,205
|
| |
|
|
$ 25,743,212
|
| Computers
— 0.7% |
| Amentum
Holdings, Inc., 7.25%, 8/1/32(1) |
|
1,042
|
$
1,026,123 |
| Atos
SE: |
|
|
|
| 5.00%
to 12/18/25, 12/18/30(3)(14) |
EUR
|
152
|
134,441
|
| 9.00%
to 12/18/25, 12/18/29(3)(14) |
EUR
|
217
|
252,172
|
| Diebold
Nixdorf, Inc., 7.75%, 3/31/30(1) |
|
1,892
|
1,965,912
|
| Insight
Enterprises, Inc., 6.625%, 5/15/32(1) |
|
1,272
|
1,283,430
|
| McAfee
Corp., 7.375%, 2/15/30(1) |
|
2,175
|
1,926,890
|
| Seagate
HDD Cayman: |
|
|
|
| 4.091%,
6/1/29 |
|
418
|
394,000
|
| 9.625%,
12/1/32 |
|
1,800
|
2,026,469
|
| |
|
|
$ 9,009,437
|
| Containers
and Glass Products — 0.5% |
| Ardagh
Metal Packaging Finance USA LLC/Ardagh Metal Packaging Finance PLC: |
|
|
|
| 3.00%,
9/1/29(14) |
EUR
|
1,325
|
$
1,203,057 |
| 4.00%,
9/1/29(1) |
|
1,139
|
971,430
|
| Berry
Global, Inc., 5.625%, 7/15/27(1) |
|
968
|
967,796
|
| Canpack
SA/Canpack U.S. LLC, 3.875%, 11/15/29(1) |
|
2,027
|
1,838,729
|
| Crown
Americas LLC/Crown Americas Capital Corp. V, 4.25%, 9/30/26 |
|
660
|
647,663
|
| Crown
Americas LLC/Crown Americas Capital Corp. VI, 4.75%, 2/1/26 |
|
750
|
744,794
|
| |
|
|
$ 6,373,469
|
| Cosmetics/Toiletries
— 0.1% |
| Edgewell
Personal Care Co.: |
|
|
|
| 4.125%,
4/1/29(1) |
|
441
|
$
408,746 |
| 5.50%,
6/1/28(1) |
|
1,067
|
1,046,026
|
| Opal
Bidco SAS, 5.50%, 3/31/32 |
EUR
|
100
|
108,130
|
| |
|
|
$ 1,562,902
|
| Distribution
& Wholesale — 0.8% |
| BCPE
Empire Holdings, Inc., 7.625%, 5/1/27(1) |
|
1,107
|
$
1,090,050 |
| Performance
Food Group, Inc.: |
|
|
|
| 4.25%,
8/1/29(1) |
|
2,429
|
2,274,461
|
| 5.50%,
10/15/27(1) |
|
935
|
926,865
|
| 6.125%,
9/15/32(1) |
|
960
|
955,403
|
| Rexel
SA, 5.25%, 9/15/30(14) |
EUR
|
150
|
168,619
|
| Ritchie
Bros Holdings, Inc.: |
|
|
|
| 6.75%,
3/15/28(1) |
|
1,132
|
1,157,519
|
| 7.75%,
3/15/31(1) |
|
422
|
442,170
|
| SIG
PLC, 9.75%, 10/31/29(14) |
EUR
|
119
|
128,547
|
| Travis
Perkins PLC, 3.75%, 2/17/26(14) |
GBP
|
125
|
157,752
|
| Windsor
Holdings III LLC, 8.50%, 6/15/30(1) |
|
2,347
|
2,424,763
|
| |
|
|
$ 9,726,149
|
| Diversified
Financial Services — 1.1% |
| CI
Financial Corp., 4.10%, 6/15/51 |
|
1,380
|
$
992,819 |
| Security
|
Principal
Amount*
(000's omitted) |
Value
|
| Diversified
Financial Services (continued) |
| Encore
Capital Group, Inc., 7.035%, (3 mo. EURIBOR + 4.25%), 1/15/28(2)(14) |
EUR
|
100
|
$
108,895 |
| Focus
Financial Partners LLC, 6.75%, 9/15/31(1) |
|
1,600
|
1,579,410
|
| Hightower
Holding LLC, 9.125%, 1/31/30(1) |
|
1,441
|
1,484,185
|
| Jane
Street Group/JSG Finance, Inc.: |
|
|
|
| 4.50%,
11/15/29(1) |
|
1,101
|
1,040,718
|
| 6.125%,
11/1/32(1) |
|
2,040
|
2,008,753
|
| Macquarie
Airfinance Holdings Ltd.: |
|
|
|
| 6.40%,
3/26/29(1) |
|
465
|
481,167
|
| 6.50%,
3/26/31(1) |
|
562
|
585,721
|
| 8.125%,
3/30/29(1) |
|
1,530
|
1,606,824
|
| ProGroup
AG: |
|
|
|
| 5.125%,
4/15/29(14) |
EUR
|
164
|
175,294
|
| 5.375%,
4/15/31(14) |
EUR
|
233
|
245,431
|
| Rocket
Mortgage LLC/Rocket Mortgage Co-Issuer, Inc.: |
|
|
|
| 3.625%,
3/1/29(1) |
|
2,648
|
2,444,090
|
| 4.00%,
10/15/33(1) |
|
225
|
193,183
|
| Sherwood
Financing PLC, 7.625%, 12/15/29(14) |
EUR
|
390
|
426,978
|
| Unifin
Financiera SAB de CV: |
|
|
|
| 7.375%,
2/12/26(1)(10)(18) |
|
620
|
0
|
| 7.375%,
2/12/26(1)(10)(18) |
|
620
|
0
|
| |
|
|
$ 13,373,468
|
| Drugs
— 0.2% |
| Perrigo
Finance Unlimited Co.: |
|
|
|
| 4.90%,
6/15/30 |
|
2,255
|
$
2,156,278 |
| 4.90%,
12/15/44 |
|
588
|
466,532
|
| 5.375%,
9/30/32 |
EUR
|
250
|
274,344
|
| |
|
|
$ 2,897,154
|
| Ecological
Services and Equipment — 0.9% |
| Clean
Harbors, Inc.: |
|
|
|
| 4.875%,
7/15/27(1) |
|
551
|
$
543,671 |
| 5.125%,
7/15/29(1) |
|
332
|
324,106
|
| 6.375%,
2/1/31(1) |
|
643
|
650,563
|
| GFL
Environmental, Inc.: |
|
|
|
| 3.50%,
9/1/28(1) |
|
1,679
|
1,588,206
|
| 4.375%,
8/15/29(1) |
|
2,000
|
1,888,342
|
| 4.75%,
6/15/29(1) |
|
3,095
|
2,980,996
|
| Paprec
Holding SA, 7.25%, 11/17/29(14) |
EUR
|
100
|
113,780
|
| Reworld
Holding Corp.: |
|
|
|
| 4.875%,
12/1/29(1) |
|
1,536
|
1,430,213
|
| 5.00%,
9/1/30 |
|
319
|
296,185
|
| Wrangler
Holdco Corp., 6.625%, 4/1/32(1) |
|
690
|
703,218
|
| |
|
|
$ 10,519,280
|
| Electric
Utilities — 1.3% |
| Alpha
Generation LLC, 6.75%, 10/15/32(1) |
|
2,791
|
$
2,794,962 |
| Atlantica
Sustainable Infrastructure PLC, 4.125%, 6/15/28(1) |
|
660
|
621,060
|
| California
Buyer Ltd./Atlantica Sustainable Infrastructure PLC: |
|
|
|
| 5.625%,
2/15/32(1) |
EUR
|
385
|
421,292
|
| 5.625%,
2/15/32(14) |
EUR
|
100
|
109,543
|
| 6.375%,
2/15/32(1) |
|
1,115
|
1,082,400
|
| Clearway
Energy Operating LLC, 3.75%, 2/15/31(1) |
|
694
|
610,300
|
19
See Notes to Financial Statements.
Eaton Vance
Limited Duration Income Fund
March 31, 2025
Portfolio of
Investments — continued
| Security
|
Principal
Amount*
(000's omitted) |
Value
|
| Electric
Utilities (continued) |
| Electricite
de France SA, 7.50% to 9/6/28(14)(15)(17) |
EUR
|
400
|
$
474,737 |
| Enel
SpA, 6.625% to 4/16/31(14)(15)(17) |
EUR
|
300
|
356,518
|
| Nexans
SA, 4.125%, 5/29/29(14) |
EUR
|
100
|
108,974
|
| Pattern
Energy Operations LP/Pattern Energy Operations, Inc., 4.50%, 8/15/28(1) |
|
1,112
|
1,035,731
|
| Public
Power Corp. SA, 4.625%, 10/31/31(14) |
EUR
|
300
|
329,653
|
| TransAlta
Corp., 7.75%, 11/15/29 |
|
1,045
|
1,086,008
|
| WESCO
Distribution, Inc.: |
|
|
|
| 6.375%,
3/15/29(1) |
|
848
|
858,902
|
| 6.375%,
3/15/33(1) |
|
995
|
1,000,864
|
| 6.625%,
3/15/32(1) |
|
854
|
867,382
|
| 7.25%,
6/15/28(1) |
|
915
|
928,605
|
| XPLR
Infrastructure Operating Partners LP: |
|
|
|
| 4.50%,
9/15/27(1) |
|
1,207
|
1,125,849
|
| 8.375%,
1/15/31(1) |
|
760
|
748,023
|
| 8.625%,
3/15/33(1) |
|
765
|
744,913
|
| |
|
|
$ 15,305,716
|
| Electronics/Electrical
— 0.9% |
| Castello
BC Bidco SpA: |
|
|
|
| 6.855%,
(3 mo. EURIBOR + 4.50%), 11/14/31(2)(14) |
EUR
|
220
|
$
240,276 |
| 6.855%,
(3 mo. EURIBOR + 4.50%), 11/14/31(1)(2) |
EUR
|
125
|
136,521
|
| Coherent
Corp., 5.00%, 12/15/29(1) |
|
1,219
|
1,163,937
|
| EquipmentShare.com,
Inc., 8.625%, 5/15/32(1) |
|
825
|
851,416
|
| Imola
Merger Corp., 4.75%, 5/15/29(1) |
|
3,165
|
3,008,308
|
| Open
Text Corp., 3.875%, 2/15/28(1) |
|
1,009
|
951,383
|
| Open
Text Holdings, Inc., 4.125%, 2/15/30(1) |
|
883
|
806,318
|
| RWE
AG, 6.625% to 3/30/26, 7/30/75(14)(15) |
|
266
|
268,672
|
| Sensata
Technologies, Inc.: |
|
|
|
| 3.75%,
2/15/31(1) |
|
1,660
|
1,451,572
|
| 4.375%,
2/15/30(1) |
|
627
|
579,833
|
| 6.625%,
7/15/32(1) |
|
400
|
396,507
|
| SS&C
Technologies, Inc., 5.50%, 9/30/27(1) |
|
517
|
513,495
|
| |
|
|
$ 10,368,238
|
| Energy
— 0.2% |
| Sunoco
LP, 7.25%, 5/1/32(1) |
|
1,130
|
$
1,167,982 |
| Sunoco
LP/Sunoco Finance Corp., 4.50%, 4/30/30 |
|
1,692
|
1,583,603
|
| |
|
|
$ 2,751,585
|
| Engineering
& Construction — 0.7% |
| Arcosa,
Inc., 6.875%, 8/15/32(1) |
|
1,046
|
$
1,061,323 |
| Artera
Services LLC, 8.50%, 2/15/31(1) |
|
1,535
|
1,433,911
|
| Brundage-Bone
Concrete Pumping Holdings, Inc., 7.50%, 2/1/32(1) |
|
817
|
778,852
|
| Dycom
Industries, Inc., 4.50%, 4/15/29(1) |
|
1,389
|
1,299,941
|
| OHL
Operaciones SA, 9.75%, (5.10% cash and 4.65% PIK), 12/31/29(14) |
EUR
|
278
|
306,636
|
| TopBuild
Corp., 4.125%, 2/15/32(1) |
|
1,562
|
1,390,936
|
| VM
Consolidated, Inc., 5.50%, 4/15/29(1) |
|
1,899
|
1,803,532
|
| |
|
|
$ 8,075,131
|
| Entertainment
— 1.5% |
| Allwyn
Entertainment Financing U.K. PLC: |
|
|
|
| 7.25%,
4/30/30(14) |
EUR
|
525
|
$
598,524 |
| Security
|
Principal
Amount*
(000's omitted) |
Value
|
| Entertainment
(continued) |
Allwyn
Entertainment Financing U.K. PLC:
(continued) |
|
|
|
| 7.875%,
4/30/29(1) |
|
1,985
|
$
2,051,518 |
| Boyne
USA, Inc., 4.75%, 5/15/29(1) |
|
1,357
|
1,278,690
|
| Caesars
Entertainment, Inc.: |
|
|
|
| 4.625%,
10/15/29(1) |
|
529
|
486,644
|
| 6.00%,
10/15/32(1) |
|
1,090
|
1,018,850
|
| 6.50%,
2/15/32(1) |
|
1,068
|
1,065,322
|
| 7.00%,
2/15/30(1) |
|
800
|
811,459
|
| 8.125%,
7/1/27(1) |
|
538
|
542,125
|
| Churchill
Downs, Inc., 5.75%, 4/1/30(1) |
|
1,751
|
1,714,151
|
| Cirsa
Finance International SARL: |
|
|
|
| 4.50%,
3/15/27(14) |
EUR
|
200
|
216,588
|
| 6.50%,
3/15/29(14) |
EUR
|
200
|
225,009
|
| 7.875%,
7/31/28(14) |
EUR
|
100
|
113,231
|
| CPUK
Finance Ltd.: |
|
|
|
| 4.50%,
8/28/27(14) |
GBP
|
200
|
247,868
|
| 6.50%,
8/28/26(14) |
GBP
|
100
|
128,341
|
| 7.875%,
8/28/29(14) |
GBP
|
130
|
170,500
|
| Flutter
Treasury DAC, 5.00%, 4/29/29(14) |
EUR
|
135
|
149,779
|
| Inter
Media and Communication SpA, 6.75%, 2/9/27(14) |
EUR
|
746
|
818,171
|
| Light
& Wonder International, Inc., 7.00%, 5/15/28(1) |
|
1,647
|
1,647,361
|
| Live
Nation Entertainment, Inc., 4.75%, 10/15/27(1) |
|
1,226
|
1,196,419
|
| Lottomatica
Group SpA, 6.485%, (3 mo. EURIBOR + 4.00%), 12/15/30(2)(14) |
EUR
|
200
|
217,409
|
| Motion
Finco SARL: |
|
|
|
| 7.375%,
6/15/30(14) |
EUR
|
300
|
321,701
|
| 8.375%,
2/15/32(1) |
|
1,180
|
1,148,324
|
| Speedway
Motorsports LLC/Speedway Funding II, Inc., 4.875%, 11/1/27(1) |
|
1,515
|
1,450,575
|
| |
|
|
$ 17,618,559
|
| Financial
Intermediaries — 0.4% |
| Ally
Financial, Inc., Series B, 4.70% to 5/15/26(15)(17) |
|
2,198
|
$
2,052,424 |
| Alpha
Holding SA de CV: |
|
|
|
| 9.00%,
2/10/25(1)(18) |
|
721
|
5,409
|
| 10.00%,
12/19/22(1)(18) |
|
188
|
2,354
|
| Compass
Group Diversified Holdings LLC, 5.25%, 4/15/29(1) |
|
1,807
|
1,706,108
|
| MSCI,
Inc.: |
|
|
|
| 3.625%,
9/1/30(1) |
|
520
|
481,473
|
| 3.875%,
2/15/31(1) |
|
899
|
836,621
|
| |
|
|
$ 5,084,389
|
| Financial
Services — 0.2% |
| Viet
Nam Debt & Asset Trading Corp., 1.00%, 10/10/25(14) |
|
2,600
|
$
2,506,506 |
| |
|
|
$ 2,506,506
|
| Food
Products — 0.6% |
| Ingles
Markets, Inc., 4.00%, 6/15/31(1) |
|
1,502
|
$
1,358,477 |
| Irca
SpA/Gallarate, 6.251%, (3 mo. EURIBOR + 3.75%), 12/15/29(2)(14) |
EUR
|
130
|
140,753
|
20
See Notes to Financial Statements.
Eaton Vance
Limited Duration Income Fund
March 31, 2025
Portfolio of
Investments — continued
| Security
|
Principal
Amount*
(000's omitted) |
Value
|
| Food
Products (continued) |
| La
Doria SpA, 7.115%, (3 mo. EURIBOR + 4.50%), 11/12/29(2)(14) |
EUR
|
200
|
$
217,179 |
| Lion/Polaris
Lux 4 SA, 6.303%, (3 mo. EURIBOR + 3.625%), 7/1/29(1)(2) |
EUR
|
100
|
108,194
|
| Market
Bidco Finco PLC, 4.75%, 11/4/27(14) |
EUR
|
125
|
131,195
|
| Picard
Groupe SAS, 6.375%, 7/1/29(1) |
EUR
|
100
|
111,476
|
| Pilgrim's
Pride Corp.: |
|
|
|
| 3.50%,
3/1/32 |
|
1,979
|
1,742,038
|
| 6.875%,
5/15/34 |
|
740
|
798,030
|
| Post
Holdings, Inc., 6.25%, 2/15/32(1) |
|
1,176
|
1,184,373
|
| Premier
Foods Finance PLC, 3.50%, 10/15/26(14) |
GBP
|
125
|
159,313
|
| Quatrim
SAS, 8.50% PIK, 1/15/28(14) |
EUR
|
129
|
135,490
|
| Viking
Baked Goods Acquisition Corp., 8.625%, 11/1/31(1) |
|
1,425
|
1,324,078
|
| |
|
|
$ 7,410,596
|
| Food
Service — 1.1% |
| 1011778
BC ULC/New Red Finance, Inc.: |
|
|
|
| 3.875%,
1/15/28(1) |
|
1,906
|
$
1,823,336 |
| 4.00%,
10/15/30(1) |
|
2,705
|
2,450,378
|
| 4.375%,
1/15/28(1) |
|
1,014
|
976,235
|
| Chobani
Holdco II LLC, 8.75%, (8.75% cash or 9.50% PIK), 10/1/29(1)(16) |
|
2,470
|
2,690,970
|
| Chobani
LLC/Chobani Finance Corp., Inc.: |
|
|
|
| 4.625%,
11/15/28(1) |
|
175
|
168,585
|
| 7.625%,
7/1/29(1) |
|
2,278
|
2,343,360
|
| U.S.
Foods, Inc., 4.75%, 2/15/29(1) |
|
1,837
|
1,772,819
|
| Yum!
Brands, Inc., 3.625%, 3/15/31 |
|
603
|
540,706
|
| |
|
|
$ 12,766,389
|
| Food/Drug
Retailers — 0.3% |
| Albertsons
Cos., Inc./Safeway, Inc./New Albertsons LP/Albertsons LLC: |
|
|
|
| 4.875%,
2/15/30(1) |
|
1,028
|
$
983,336 |
| 5.875%,
2/15/28(1) |
|
2,145
|
2,146,314
|
| |
|
|
$ 3,129,650
|
| Forest
Products & Paper — 0.1% |
| WEPA
Hygieneprodukte GmbH, 5.625%, 1/15/31(14) |
EUR
|
660
|
$
732,468 |
| |
|
|
$ 732,468
|
| Health
Care — 2.9% |
| AHP
Health Partners, Inc., 5.75%, 7/15/29(1) |
|
337
|
$
313,083 |
| Cerba
Healthcare SACA, 3.50%, 5/31/28(14) |
EUR
|
516
|
451,038
|
| Chrome
Holdco SAS, 5.00%, 5/31/29(14) |
EUR
|
200
|
96,816
|
| CHS/Community
Health Systems, Inc., 6.875%, 4/15/29(1) |
|
1,213
|
787,830
|
| Concentra
Escrow Issuer Corp., 6.875%, 7/15/32(1) |
|
480
|
489,003
|
| Encompass
Health Corp.: |
|
|
|
| 4.625%,
4/1/31 |
|
683
|
640,672
|
| 4.75%,
2/1/30 |
|
639
|
615,212
|
| Ephios
Subco 3 SARL, 7.875%, 1/31/31(14) |
EUR
|
160
|
184,739
|
| Fortrea
Holdings, Inc., 7.50%, 7/1/30(1) |
|
1,029
|
936,979
|
| Heartland
Dental LLC/Heartland Dental Finance Corp., 10.50%, 4/30/28(1) |
|
4,006
|
4,213,984
|
| IQVIA,
Inc.: |
|
|
|
| 2.25%,
1/15/28(14) |
EUR
|
250
|
257,923
|
| Security
|
Principal
Amount*
(000's omitted) |
Value
|
| Health
Care (continued) |
| IQVIA,
Inc.: (continued) |
|
|
|
| 2.25%,
3/15/29(14) |
EUR
|
300
|
$
303,159 |
| 2.875%,
6/15/28(14) |
EUR
|
100
|
104,354
|
| 5.00%,
10/15/26(1) |
|
850
|
844,449
|
| 5.00%,
5/15/27(1) |
|
685
|
675,833
|
| 6.50%,
5/15/30(1) |
|
825
|
840,338
|
| LifePoint
Health, Inc.: |
|
|
|
| 5.375%,
1/15/29(1) |
|
2,888
|
2,538,151
|
| 9.875%,
8/15/30(1) |
|
825
|
871,490
|
| 10.00%,
6/1/32(1) |
|
375
|
358,185
|
| Medline
Borrower LP, 5.25%, 10/1/29(1) |
|
4,431
|
4,254,927
|
| Molina
Healthcare, Inc.: |
|
|
|
| 3.875%,
11/15/30(1) |
|
1,330
|
1,191,547
|
| 3.875%,
5/15/32(1) |
|
1,450
|
1,273,658
|
| 6.25%,
1/15/33(1) |
|
885
|
872,202
|
| Option
Care Health, Inc., 4.375%, 10/31/29(1) |
|
1,991
|
1,859,540
|
| Surgery
Center Holdings, Inc., 7.25%, 4/15/32(1) |
|
806
|
798,047
|
| Team
Health Holdings, Inc., 13.50%, (9.00% cash and 4.50% PIK), 6/30/28(1) |
|
1,662
|
1,793,084
|
| Tenet
Healthcare Corp.: |
|
|
|
| 4.375%,
1/15/30 |
|
187
|
175,492
|
| 5.125%,
11/1/27 |
|
1,607
|
1,584,661
|
| 6.125%,
10/1/28 |
|
1,593
|
1,586,707
|
| 6.875%,
11/15/31 |
|
878
|
899,566
|
| U.S.
Acute Care Solutions LLC, 9.75%, 5/15/29(1) |
|
2,195
|
2,191,417
|
| Varex
Imaging Corp., 7.875%, 10/15/27(1) |
|
558
|
567,086
|
| |
|
|
$ 34,571,172
|
| Home
Furnishings — 0.2% |
| Somnigroup
International, Inc.: |
|
|
|
| 3.875%,
10/15/31(1) |
|
1,932
|
$
1,698,470 |
| 4.00%,
4/15/29(1) |
|
968
|
899,936
|
| |
|
|
$ 2,598,406
|
| Homebuilders/Real
Estate — 0.0%† |
| M/I
Homes, Inc.: |
|
|
|
| 3.95%,
2/15/30 |
|
180
|
$
164,688 |
| 4.95%,
2/1/28 |
|
282
|
273,940
|
| |
|
|
$ 438,628
|
| Industrial
Equipment — 0.2% |
| Alstom
SA, 5.868% to 5/29/29(14)(15)(17) |
EUR
|
200
|
$
224,630 |
| Madison
IAQ LLC, 5.875%, 6/30/29(1) |
|
1,660
|
1,569,789
|
| TK
Elevator Holdco GmbH, 6.625%, 7/15/28(14) |
EUR
|
270
|
292,734
|
| TK
Elevator Midco GmbH, 4.375%, 7/15/27(14) |
EUR
|
525
|
565,199
|
| |
|
|
$ 2,652,352
|
| Insurance
— 1.0% |
| Alliant
Holdings Intermediate LLC/Alliant Holdings Co-Issuer: |
|
|
|
| 6.50%,
10/1/31(1) |
|
370
|
$
363,686 |
| 6.75%,
10/15/27(1) |
|
2,323
|
2,316,345
|
| 7.00%,
1/15/31(1) |
|
808
|
811,117
|
| 7.375%,
10/1/32(1) |
|
285
|
286,608
|
| AmWINS
Group, Inc., 4.875%, 6/30/29(1) |
|
1,010
|
952,963
|
| AssuredPartners,
Inc., 5.625%, 1/15/29(1) |
|
450
|
449,339
|
| Galaxy
Bidco Ltd., 8.125%, 12/19/29(14) |
GBP
|
400
|
532,433
|
21
See Notes to Financial Statements.
Eaton Vance
Limited Duration Income Fund
March 31, 2025
Portfolio of
Investments — continued
| Security
|
Principal
Amount*
(000's omitted) |
Value
|
| Insurance
(continued) |
| Jones
Deslauriers Insurance Management, Inc., 10.50%, 12/15/30(1) |
|
1,539
|
$
1,649,551 |
| Panther
Escrow Issuer LLC, 7.125%, 6/1/31(1) |
|
3,202
|
3,264,699
|
| Ryan
Specialty LLC, 5.875%, 8/1/32(1) |
|
1,398
|
1,381,997
|
| |
|
|
$ 12,008,738
|
| Internet
Software & Services — 0.7% |
| Arches
Buyer, Inc.: |
|
|
|
| 4.25%,
6/1/28(1) |
|
655
|
$
597,135 |
| 6.125%,
12/1/28(1) |
|
1,854
|
1,630,628
|
| Cars.com,
Inc., 6.375%, 11/1/28(1) |
|
1,770
|
1,758,572
|
| Match
Group Holdings II LLC, 3.625%, 10/1/31(1) |
|
1,727
|
1,489,962
|
| Science
Applications International Corp., 4.875%, 4/1/28(1) |
|
1,487
|
1,425,945
|
| Snap,
Inc., 6.875%, 3/1/33(1) |
|
1,610
|
1,611,335
|
| United
Group BV: |
|
|
|
| 6.50%,
10/31/31(1) |
EUR
|
245
|
266,817
|
| 6.75%,
2/15/31(14) |
EUR
|
120
|
132,038
|
| 6.806%,
(3 mo. EURIBOR + 4.25%), 2/15/31(2)(14) |
EUR
|
100
|
108,536
|
| |
|
|
$ 9,020,968
|
| Leisure
Goods/Activities/Movies — 1.9% |
| Acushnet
Co., 7.375%, 10/15/28(1) |
|
1,142
|
$
1,183,116 |
| Carnival
Corp.: |
|
|
|
| 5.75%,
3/1/27(1) |
|
1,316
|
1,317,650
|
| 5.75%,
1/15/30(14) |
EUR
|
100
|
114,550
|
| 6.00%,
5/1/29(1) |
|
2,862
|
2,843,743
|
| Cinemark
USA, Inc.: |
|
|
|
| 5.25%,
7/15/28(1) |
|
1,481
|
1,438,492
|
| 7.00%,
8/1/32(1) |
|
1,015
|
1,025,561
|
| LHMC
Finco 2 SARL, 7.25%, (7.25% cash or 8.00% PIK), 10/2/25(14)(16) |
EUR
|
158
|
171,613
|
| NCL
Corp. Ltd.: |
|
|
|
| 5.875%,
3/15/26(1) |
|
411
|
410,395
|
| 5.875%,
2/15/27(1) |
|
517
|
516,618
|
| 6.75%,
2/1/32(1) |
|
1,425
|
1,408,609
|
| 7.75%,
2/15/29(1) |
|
433
|
451,550
|
| NCL
Finance Ltd., 6.125%, 3/15/28(1) |
|
704
|
702,216
|
| Playtika
Holding Corp., 4.25%, 3/15/29(1) |
|
1,511
|
1,332,212
|
| Royal
Caribbean Cruises Ltd.: |
|
|
|
| 3.70%,
3/15/28 |
|
590
|
563,619
|
| 6.00%,
2/1/33(1) |
|
1,626
|
1,626,247
|
| 6.25%,
3/15/32(1) |
|
1,360
|
1,373,260
|
| TUI
AG, 5.875%, 3/15/29(14) |
EUR
|
600
|
671,795
|
| TUI
Cruises GmbH, 6.25%, 4/15/29(14) |
EUR
|
250
|
280,337
|
| Viking
Cruises Ltd.: |
|
|
|
| 5.875%,
9/15/27(1) |
|
2,472
|
2,461,036
|
| 6.25%,
5/15/25(1) |
|
1,690
|
1,691,599
|
| 7.00%,
2/15/29(1) |
|
658
|
660,637
|
| Viking
Ocean Cruises Ship VII Ltd., 5.625%, 2/15/29(1) |
|
422
|
415,770
|
| |
|
|
$ 22,660,625
|
| Lodging
and Casinos — 0.2% |
| Genting
New York LLC/GENNY Capital, Inc., 7.25%, 10/1/29(1) |
|
1,598
|
$
1,629,830 |
| Security
|
Principal
Amount*
(000's omitted) |
Value
|
| Lodging
and Casinos (continued) |
| TVL
Finance PLC, 10.25%, 4/28/28(14) |
GBP
|
220
|
$
287,223 |
| |
|
|
$ 1,917,053
|
| Machinery
— 0.4% |
| Chart
Industries, Inc., 9.50%, 1/1/31(1) |
|
1,984
|
$
2,119,503 |
| Dynamo
Newco II GmbH, 6.25%, 10/15/31(1) |
EUR
|
235
|
258,096
|
| Esab
Corp., 6.25%, 4/15/29(1) |
|
1,083
|
1,100,159
|
| EVOCA
SpA, 8.035%, (3 mo. EURIBOR + 5.25%), 4/9/29(2)(14) |
EUR
|
444
|
482,055
|
| IMA
Industria Macchine Automatiche SpA: |
|
|
|
| 3.75%,
1/15/28(14) |
EUR
|
121
|
129,125
|
| 6.535%,
(3 mo. EURIBOR + 3.75%), 4/15/29(2)(14) |
EUR
|
150
|
162,510
|
| |
|
|
$ 4,251,448
|
| Media
— 0.7% |
| CMG
Media Corp., 8.875%, 6/18/29(1) |
|
522
|
$
451,530 |
| CSC
Holdings LLC: |
|
|
|
| 3.375%,
2/15/31(1) |
|
1,080
|
774,640
|
| 4.125%,
12/1/30(1) |
|
701
|
508,524
|
| 5.50%,
4/15/27(1) |
|
855
|
792,361
|
| 11.75%,
1/31/29(1) |
|
1,051
|
1,019,961
|
| Outfront
Media Capital LLC/Outfront Media Capital Corp.: |
|
|
|
| 4.25%,
1/15/29(1) |
|
610
|
566,201
|
| 4.625%,
3/15/30(1) |
|
925
|
846,681
|
| 7.375%,
2/15/31(1) |
|
1,475
|
1,537,549
|
| Sinclair
Television Group, Inc., 8.125%, 2/15/33(1) |
|
945
|
933,121
|
| Summer
BidCo BV, 10.00%, (10.00% cash or 10.75% PIK), 2/15/29(14)(16) |
EUR
|
431
|
478,835
|
| |
|
|
$ 7,909,403
|
| Metals/Mining
— 1.4% |
| Arsenal
AIC Parent LLC, 11.50%, 10/1/31(1) |
|
3,254
|
$
3,542,565 |
| Compass
Minerals International, Inc., 6.75%, 12/1/27(1) |
|
1,376
|
1,322,471
|
| Constellium
SE: |
|
|
|
| 3.75%,
4/15/29(1) |
|
970
|
879,797
|
| 5.625%,
6/15/28(1) |
|
630
|
611,614
|
| First
Quantum Minerals Ltd.: |
|
|
|
| 8.00%,
3/1/33(1) |
|
730
|
740,589
|
| 9.375%,
3/1/29(1) |
|
2,198
|
2,314,265
|
| Freeport-McMoRan,
Inc., 5.45%, 3/15/43 |
|
1,600
|
1,501,623
|
| Hudbay
Minerals, Inc.: |
|
|
|
| 4.50%,
4/1/26(1) |
|
1,085
|
1,069,594
|
| 6.125%,
4/1/29(1) |
|
489
|
486,928
|
| Novelis
Corp.: |
|
|
|
| 3.25%,
11/15/26(1) |
|
690
|
667,675
|
| 3.875%,
8/15/31(1) |
|
669
|
582,262
|
| 4.75%,
1/30/30(1) |
|
1,068
|
996,802
|
| Novelis
Sheet Ingot GmbH, 3.375%, 4/15/29(14) |
EUR
|
600
|
617,814
|
| Roller
Bearing Co. of America, Inc., 4.375%, 10/15/29(1) |
|
1,513
|
1,422,268
|
| |
|
|
$ 16,756,267
|
22
See Notes to Financial Statements.
Eaton Vance
Limited Duration Income Fund
March 31, 2025
Portfolio of
Investments — continued
| Security
|
Principal
Amount*
(000's omitted) |
Value
|
| Miscellaneous
Manufacturing — 0.1% |
| Axon
Enterprise, Inc.: |
|
|
|
| 6.125%,
3/15/30(1) |
|
535
|
$
541,272 |
| 6.25%,
3/15/33(1) |
|
410
|
415,243
|
| |
|
|
$ 956,515
|
| Nonferrous
Metals/Minerals — 0.1% |
| Eldorado
Gold Corp., 6.25%, 9/1/29(1) |
|
1,333
|
$
1,314,543 |
| |
|
|
$ 1,314,543
|
| Oil
and Gas — 1.9% |
| Aethon
United BR LP/Aethon United Finance Corp., 7.50%, 10/1/29(1) |
|
1,475
|
$
1,501,234 |
| Civitas
Resources, Inc., 8.625%, 11/1/30(1) |
|
2,273
|
2,346,990
|
| Expand
Energy Corp., 4.75%, 2/1/32 |
|
1,485
|
1,405,927
|
| Matador
Resources Co., 6.50%, 4/15/32(1) |
|
1,400
|
1,388,587
|
| Nabors
Industries Ltd., 7.50%, 1/15/28(1) |
|
665
|
612,735
|
| Parkland
Corp.: |
|
|
|
| 4.50%,
10/1/29(1) |
|
376
|
354,856
|
| 4.625%,
5/1/30(1) |
|
1,501
|
1,410,079
|
| Permian
Resources Operating LLC: |
|
|
|
| 5.375%,
1/15/26(1) |
|
232
|
231,389
|
| 5.875%,
7/1/29(1) |
|
2,252
|
2,224,229
|
| 6.25%,
2/1/33(1) |
|
935
|
932,035
|
| 7.00%,
1/15/32(1) |
|
1,214
|
1,242,470
|
| Petroleos
de Venezuela SA: |
|
|
|
| 5.375%,
4/12/27(14)(18) |
|
1,233
|
170,391
|
| 5.50%,
4/12/37(14)(18) |
|
432
|
60,494
|
| 6.00%,
10/28/22(14)(18) |
|
460
|
58,416
|
| 6.00%,
5/16/24(14)(18) |
|
1,618
|
224,838
|
| 6.00%,
11/15/26(14)(18) |
|
949
|
132,820
|
| 8.50%,
10/27/20(14)(18) |
|
235
|
232,155
|
| 9.00%,
11/17/21(14)(18) |
|
644
|
98,256
|
| 9.75%,
5/17/35(14)(18) |
|
635
|
98,441
|
| 12.75%,
2/17/22(14)(18) |
|
517
|
82,640
|
| Petroleos
Mexicanos: |
|
|
|
| 6.75%,
9/21/47 |
|
290
|
198,583
|
| 6.84%,
1/23/30 |
|
713
|
653,962
|
| Petronas
Capital Ltd.: |
|
|
|
| 2.48%,
1/28/32(14) |
|
900
|
769,802
|
| 4.55%,
4/21/50(14) |
|
310
|
263,899
|
| Precision
Drilling Corp.: |
|
|
|
| 6.875%,
1/15/29(1) |
|
932
|
911,416
|
| 7.125%,
1/15/26(1) |
|
268
|
268,427
|
| SM
Energy Co., 7.00%, 8/1/32(1) |
|
1,070
|
1,051,160
|
| Transocean
Poseidon Ltd., 6.875%, 2/1/27(1) |
|
561
|
557,678
|
| Transocean,
Inc., 8.75%, 2/15/30(1) |
|
566
|
587,782
|
| Vital
Energy, Inc.: |
|
|
|
| 7.875%,
4/15/32(1) |
|
694
|
646,731
|
| 9.75%,
10/15/30 |
|
1,026
|
1,044,550
|
| Weatherford
International Ltd., 8.625%, 4/30/30(1) |
|
1,355
|
1,376,776
|
| Wintershall
Dea Finance 2 BV, Series NC5, 2.499% to 4/20/26(14)(15)(17) |
EUR
|
200
|
211,517
|
| |
|
|
$ 23,351,265
|
| Packaging
& Containers — 0.5% |
| Ball
Corp., 6.875%, 3/15/28 |
|
474
|
$
485,074 |
| Security
|
Principal
Amount*
(000's omitted) |
Value
|
| Packaging
& Containers (continued) |
| Clydesdale
Acquisition Holdings, Inc.: |
|
|
|
| 6.75%,
4/15/32(1)(6) |
|
1,485
|
$
1,496,476 |
| 8.75%,
4/15/30(1) |
|
1,350
|
1,370,034
|
| Kleopatra
Finco SARL, 4.25%, 3/1/26(14) |
EUR
|
140
|
140,241
|
| Owens-Brockway
Glass Container, Inc., 7.25%, 5/15/31(1) |
|
1,382
|
1,350,905
|
| Trivium
Packaging Finance BV: |
|
|
|
| 6.306%,
(3 mo. EURIBOR + 3.75%), 8/15/26(2)(14) |
EUR
|
300
|
324,771
|
| 8.50%,
8/15/27(1) |
|
810
|
806,821
|
| |
|
|
$ 5,974,322
|
| Pharmaceuticals
— 1.1% |
| 1261229
BC Ltd., 10.00%, 4/15/32(1)(6) |
|
2,660
|
$
2,646,574 |
| Bayer
AG, 5.375% to 6/25/30, 3/25/82(14)(15) |
EUR
|
500
|
532,878
|
| BellRing
Brands, Inc., 7.00%, 3/15/30(1) |
|
2,444
|
2,527,406
|
| Endo
Finance Holdings, Inc., 8.50%, 4/15/31(1) |
|
1,400
|
1,461,286
|
| Grifols
SA, 7.50%, 5/1/30(14) |
EUR
|
759
|
859,177
|
| Nidda
Healthcare Holding GmbH: |
|
|
|
| 5.625%,
2/21/30(1) |
EUR
|
120
|
131,953
|
| 7.50%,
8/21/26(14) |
EUR
|
264
|
292,149
|
| P&L
Development LLC/PLD Finance Corp., 12.00%, (9.00% cash and 3.50% PIK or 12.00% cash), 5/15/29(1)(16) |
|
892
|
908,998
|
| Prestige
Brands, Inc., 3.75%, 4/1/31(1) |
|
752
|
675,028
|
| Rossini
SARL, 6.75%, 12/31/29(14) |
EUR
|
455
|
514,469
|
| Teva
Pharmaceutical Finance Netherlands II BV, 7.875%, 9/15/31 |
EUR
|
400
|
510,729
|
| Teva
Pharmaceutical Finance Netherlands III BV, 4.10%, 10/1/46 |
|
3,621
|
2,620,764
|
| |
|
|
$ 13,681,411
|
| Pipelines
— 2.0% |
| Antero
Midstream Partners LP/Antero Midstream Finance Corp., 5.75%, 3/1/27(1) |
|
1,874
|
$
1,869,742 |
| Cheniere
Energy Partners LP, 4.00%, 3/1/31 |
|
2,706
|
2,538,981
|
| DT
Midstream, Inc., 4.125%, 6/15/29(1) |
|
1,449
|
1,365,022
|
| Energy
Transfer LP, 5.00%, 5/15/50 |
|
1,094
|
922,057
|
| EQM
Midstream Partners LP: |
|
|
|
| 4.50%,
1/15/29(1) |
|
1,253
|
1,214,700
|
| 4.75%,
1/15/31(1) |
|
1,086
|
1,044,995
|
| 6.50%,
7/1/27(1) |
|
702
|
720,962
|
| 7.50%,
6/1/30(1) |
|
1,010
|
1,091,987
|
| Global
Partners LP/GLP Finance Corp., 8.25%, 1/15/32(1) |
|
1,317
|
1,354,899
|
| ITT
Holdings LLC, 6.50%, 8/1/29(1) |
|
110
|
101,588
|
| Kinetik
Holdings LP, 5.875%, 6/15/30(1) |
|
2,308
|
2,285,633
|
| Plains
All American Pipeline LP, Series B, 8.695% to 5/1/25, (3 mo. SOFR + 4.372%)(2)(17) |
|
1,912
|
1,912,599
|
| Venture
Global LNG, Inc.: |
|
|
|
| 7.00%,
1/15/30(1) |
|
800
|
788,722
|
| 8.125%,
6/1/28(1) |
|
1,174
|
1,200,364
|
| 8.375%,
6/1/31(1) |
|
877
|
890,073
|
| 9.00%
to 9/30/29(1)(15)(17) |
|
2,160
|
2,051,522
|
| 9.50%,
2/1/29(1) |
|
1,623
|
1,741,375
|
| 9.875%,
2/1/32(1) |
|
355
|
377,262
|
| Western
Midstream Operating LP: |
|
|
|
| 4.05%,
2/1/30 |
|
1,187
|
1,133,376
|
23
See Notes to Financial Statements.
Eaton Vance
Limited Duration Income Fund
March 31, 2025
Portfolio of
Investments — continued
| Security
|
Principal
Amount*
(000's omitted) |
Value
|
| Pipelines
(continued) |
| Western
Midstream Operating LP: (continued) |
|
|
|
| 4.50%,
3/1/28 |
|
148
|
$
146,596 |
| |
|
|
$ 24,752,455
|
| Publishing
— 0.2% |
| McGraw-Hill
Education, Inc.: |
|
|
|
| 5.75%,
8/1/28(1) |
|
423
|
$
413,440 |
| 7.375%,
9/1/31(1) |
|
735
|
739,797
|
| 8.00%,
8/1/29(1) |
|
1,879
|
1,850,163
|
| |
|
|
$ 3,003,400
|
| Radio
and Television — 0.2% |
| Clear
Channel Outdoor Holdings, Inc.: |
|
|
|
| 7.75%,
4/15/28(1) |
|
2,088
|
$
1,797,332 |
| 7.875%,
4/1/30(1) |
|
1,227
|
1,204,171
|
| |
|
|
$ 3,001,503
|
| Real
Estate Investment Trusts (REITs) — 1.0% |
| AccorInvest
Group SA: |
|
|
|
| 5.50%,
11/15/31(14) |
EUR
|
454
|
$
486,460 |
| 6.375%,
10/15/29(14) |
EUR
|
165
|
184,185
|
| Adler
Financing SARL, 8.25% PIK, 12/31/28 |
EUR
|
407
|
451,441
|
| Akelius
Residential Property AB, 2.249% to 2/17/26, 5/17/81(14)(15) |
EUR
|
200
|
211,394
|
| Alexandrite
Monnet U.K. Holdco PLC, 10.50%, 5/15/29(14) |
EUR
|
700
|
829,762
|
| CTR
Partnership LP/CareTrust Capital Corp., 3.875%, 6/30/28(1) |
|
1,591
|
1,492,519
|
| Cushman
& Wakefield U.S. Borrower LLC: |
|
|
|
| 6.75%,
5/15/28(1) |
|
1,272
|
1,276,198
|
| 8.875%,
9/1/31(1) |
|
907
|
963,841
|
| Greystar
Real Estate Partners LLC, 7.75%, 9/1/30(1) |
|
2,048
|
2,142,695
|
| HAT
Holdings I LLC/HAT Holdings II LLC, 3.375%, 6/15/26(1) |
|
1,316
|
1,277,354
|
| Heimstaden
Bostad AB: |
|
|
|
| 3.00%
to 10/29/27(14)(15)(17) |
EUR
|
102
|
99,832
|
| 3.375%
to 1/15/26(14)(15)(17) |
EUR
|
250
|
261,032
|
| Pebblebrook
Hotel LP/PEB Finance Corp., 6.375%, 10/15/29(1) |
|
435
|
430,435
|
| Samhallsbyggnadsbolaget
I Norden Holding AB, 2.375%, 8/4/26(14) |
EUR
|
150
|
152,565
|
| VICI
Properties LP/VICI Note Co., Inc.: |
|
|
|
| 3.75%,
2/15/27(1) |
|
323
|
316,236
|
| 4.125%,
8/15/30(1) |
|
1,108
|
1,044,212
|
| 5.75%,
2/1/27(1) |
|
573
|
581,465
|
| |
|
|
$ 12,201,626
|
| Retail
— 1.3% |
| B&M
European Value Retail SA, 8.125%, 11/15/30(14) |
GBP
|
200
|
$
269,168 |
| Bertrand
Franchise Finance SAS: |
|
|
|
| 6.494%,
(3 mo. EURIBOR + 3.75%), 7/18/30(1)(2) |
EUR
|
120
|
130,406
|
| 6.50%,
7/18/30(14) |
EUR
|
100
|
111,061
|
| 6.50%,
7/18/30(1) |
EUR
|
100
|
111,061
|
| CD&R
Firefly Bidco PLC, 8.625%, 4/30/29(14) |
GBP
|
450
|
595,093
|
| Cougar
JV Subsidiary LLC, 8.00%, 5/15/32(1) |
|
1,737
|
1,792,851
|
| Security
|
Principal
Amount*
(000's omitted) |
Value
|
| Retail
(continued) |
| Dufry
One BV, 2.00%, 2/15/27(14) |
EUR
|
200
|
$
210,164 |
| Duomo
Bidco SpA, 6.91%, (3 mo. EURIBOR + 4.125%), 7/15/31(2)(14) |
EUR
|
150
|
163,476
|
| Evergreen
Acqco 1 LP/TVI, Inc., 9.75%, 4/26/28(1) |
|
1,458
|
1,518,831
|
| Ferrellgas
LP/Ferrellgas Finance Corp., 5.875%, 4/1/29(1) |
|
1,582
|
1,433,816
|
| Global
Auto Holdings Ltd./AAG FH U.K. Ltd.: |
|
|
|
| 8.375%,
1/15/29(1) |
|
442
|
399,215
|
| 8.75%,
1/15/32(1) |
|
506
|
426,737
|
| Group
1 Automotive, Inc.: |
|
|
|
| 4.00%,
8/15/28(1) |
|
1,328
|
1,250,834
|
| 6.375%,
1/15/30(1) |
|
455
|
457,115
|
| Ken
Garff Automotive LLC, 4.875%, 9/15/28(1) |
|
957
|
917,015
|
| LCM
Investments Holdings II LLC: |
|
|
|
| 4.875%,
5/1/29(1) |
|
1,652
|
1,551,776
|
| 8.25%,
8/1/31(1) |
|
262
|
272,206
|
| PEU
Fin PLC, 7.25%, 7/1/28(14) |
EUR
|
200
|
223,845
|
| Punch
Finance PLC, 6.125%, 6/30/26(14) |
GBP
|
125
|
160,843
|
| Raising
Cane's Restaurants LLC, 9.375%, 5/1/29(1) |
|
1,798
|
1,912,409
|
| Stonegate
Pub Co. Financing PLC, 9.181%, (3 mo. EURIBOR + 6.625%), 7/31/29(2)(14) |
EUR
|
100
|
110,859
|
| Suburban
Propane Partners LP/Suburban Energy Finance Corp., 5.00%, 6/1/31(1) |
|
824
|
744,742
|
| Waga
Bondco Ltd., 8.50%, 6/15/30(14) |
GBP
|
200
|
252,731
|
| Walgreens
Boots Alliance, Inc., 2.125%, 11/20/26 |
EUR
|
200
|
211,894
|
| |
|
|
$ 15,228,148
|
| Retailers
(Except Food and Drug) — 0.4% |
| Bath
& Body Works, Inc.: |
|
|
|
| 6.625%,
10/1/30(1) |
|
479
|
$
486,219 |
| 6.75%,
7/1/36 |
|
437
|
436,123
|
| 6.95%,
3/1/33 |
|
1,027
|
1,049,967
|
| Murphy
Oil USA, Inc., 5.625%, 5/1/27 |
|
560
|
558,234
|
| PetSmart,
Inc./PetSmart Finance Corp., 4.75%, 2/15/28(1) |
|
1,290
|
1,208,442
|
| Superior
Plus LP/Superior General Partner, Inc., 4.50%, 3/15/29(1) |
|
1,532
|
1,415,970
|
| |
|
|
$ 5,154,955
|
| Semiconductors
& Semiconductor Equipment — 0.1% |
| ON
Semiconductor Corp., 3.875%, 9/1/28(1) |
|
1,544
|
$
1,447,032 |
| |
|
|
$ 1,447,032
|
| Software
— 0.6% |
| Clarivate
Science Holdings Corp., 4.875%, 7/1/29(1) |
|
1,488
|
$
1,329,403 |
| Cloud
Software Group, Inc.: |
|
|
|
| 6.50%,
3/31/29(1) |
|
1,268
|
1,233,517
|
| 9.00%,
9/30/29(1) |
|
2,620
|
2,614,891
|
| Ellucian
Holdings, Inc., 6.50%, 12/1/29(1) |
|
1,363
|
1,343,821
|
| TeamSystem
SpA: |
|
|
|
| 6.285%,
(3 mo. EURIBOR + 3.50%), 7/31/31(1)(2) |
EUR
|
170
|
184,349
|
| 6.285%,
(3 mo. EURIBOR + 3.50%), 7/31/31(2)(14) |
EUR
|
100
|
108,441
|
| |
|
|
$ 6,814,422
|
24
See Notes to Financial Statements.
Eaton Vance
Limited Duration Income Fund
March 31, 2025
Portfolio of
Investments — continued
| Security
|
Principal
Amount*
(000's omitted) |
Value
|
| Software
and Services — 0.2% |
| Fair
Isaac Corp., 4.00%, 6/15/28(1) |
|
1,248
|
$
1,187,742 |
| Gartner,
Inc., 3.75%, 10/1/30(1) |
|
660
|
609,323
|
| Playtech
PLC, 4.25%, 3/7/26(14) |
EUR
|
86
|
92,977
|
| |
|
|
$ 1,890,042
|
| Specialty
Retail — 0.0%† |
| Fedrigoni
SpA, 6.355%, (3 mo. EURIBOR + 4.00%), 1/15/30(2)(14) |
EUR
|
260
|
$
280,873 |
| Fiber
Midco SpA: |
|
|
|
| 10.00%
PIK, 6/15/29(1) |
EUR
|
155
|
165,494
|
| 10.00%
PIK, 6/15/29(14) |
EUR
|
100
|
106,770
|
| |
|
|
$ 553,137
|
| Steel
— 0.5% |
| Allegheny
Ludlum LLC, 6.95%, 12/15/25 |
|
465
|
$
469,803 |
| ATI,
Inc., 5.875%, 12/1/27 |
|
320
|
318,043
|
| Big
River Steel LLC/BRS Finance Corp., 6.625%, 1/31/29(1) |
|
1,147
|
1,149,515
|
| Cleveland-Cliffs,
Inc.: |
|
|
|
| 7.375%,
5/1/33(1) |
|
1,325
|
1,272,782
|
| 7.50%,
9/15/31(1) |
|
1,110
|
1,084,742
|
| TMS
International Corp., 6.25%, 4/15/29(1) |
|
1,365
|
1,272,326
|
| |
|
|
$ 5,567,211
|
| Technology
— 0.8% |
| athenahealth
Group, Inc., 6.50%, 2/15/30(1) |
|
4,789
|
$
4,496,329 |
| International
Game Technology PLC: |
|
|
|
| 4.125%,
4/15/26(1) |
|
892
|
881,495
|
| 5.25%,
1/15/29(1) |
|
3,110
|
3,041,749
|
| 6.25%,
1/15/27(1) |
|
976
|
983,095
|
| |
|
|
$ 9,402,668
|
| Telecommunications
— 1.5% |
| C&W
Senior Finance Ltd., 9.00%, 1/15/33(1) |
|
780
|
$
768,442 |
| Ciena
Corp., 4.00%, 1/31/30(1) |
|
1,883
|
1,721,445
|
| EchoStar
Corp., 10.75%, 11/30/29 |
|
1,213
|
1,275,655
|
| Fibercop
SpA: |
|
|
|
| 1.625%,
1/18/29 |
EUR
|
100
|
97,717
|
| 7.75%,
1/24/33 |
EUR
|
340
|
425,555
|
| Iliad
Holding SASU: |
|
|
|
| 5.375%,
4/15/30(14) |
EUR
|
100
|
108,847
|
| 6.875%,
4/15/31(14) |
EUR
|
200
|
227,745
|
| 7.00%,
10/15/28(1) |
|
811
|
821,465
|
| 7.00%,
4/15/32(1) |
|
915
|
917,354
|
| 8.50%,
4/15/31(1) |
|
720
|
755,843
|
| Lorca
Telecom Bondco SA, 4.00%, 9/18/27(14) |
EUR
|
643
|
694,803
|
| Matterhorn
Telecom SA, 4.50%, 1/30/30(14) |
EUR
|
100
|
108,325
|
| Odido
Group Holding BV, 5.50%, 1/15/30(14) |
EUR
|
450
|
483,619
|
| PLT
VII Finance SARL, 6.001%, (3 mo. EURIBOR + 3.50%), 6/15/31(2)(14) |
EUR
|
100
|
108,265
|
| Sable
International Finance Ltd., 7.125%, 10/15/32(1) |
|
822
|
789,636
|
| Stagwell
Global LLC, 5.625%, 8/15/29(1) |
|
1,987
|
1,894,264
|
| Summer
(BC) Holdco A SARL, 9.25%, 10/31/27(14) |
EUR
|
126
|
137,256
|
| Summer
(BC) Holdco B SARL: |
|
|
|
| 6.789%,
(3 mo. EURIBOR + 4.25%), 2/15/30(1)(2) |
EUR
|
100
|
108,372
|
| Security
|
Principal
Amount*
(000's omitted) |
Value
|
| Telecommunications
(continued) |
| Summer
(BC) Holdco B SARL: (continued) |
|
|
|
| 6.789%,
(3 mo. EURIBOR + 4.25%), 2/15/30(2)(14) |
EUR
|
135
|
$
146,302 |
| Telefonica
Europe BV: |
|
|
|
| 2.88%
to 2/24/28(14)(15)(17) |
EUR
|
200
|
209,685
|
| 7.125%
to 8/23/28(14)(15)(17) |
EUR
|
400
|
473,629
|
| Vmed
O2 U.K. Financing I PLC: |
|
|
|
| 4.00%,
1/31/29(14) |
GBP
|
100
|
116,601
|
| 4.50%,
7/15/31(14) |
GBP
|
100
|
110,106
|
| 4.75%,
7/15/31(1) |
|
976
|
849,452
|
| 5.625%,
4/15/32(14) |
EUR
|
325
|
349,505
|
| 7.75%,
4/15/32(1) |
|
645
|
647,360
|
| Vodafone
Group PLC: |
|
|
|
| 2.625%
to 5/27/26, 8/27/80(14)(15) |
EUR
|
400
|
429,068
|
| 4.875%
to 7/3/25, 10/3/78(14)(15) |
GBP
|
350
|
450,619
|
| 8.00%
to 5/30/31, 8/30/86(14)(15) |
GBP
|
200
|
276,338
|
| Zegona
Finance PLC: |
|
|
|
| 6.75%,
7/15/29(14) |
EUR
|
550
|
628,539
|
| 8.625%,
7/15/29(1) |
|
2,450
|
2,599,707
|
| |
|
|
$ 18,731,519
|
| Transportation
— 0.5% |
| Cargo
Aircraft Management, Inc., 4.75%, 2/1/28(1) |
|
1,528
|
$
1,528,635 |
| Edge
Finco PLC, 8.125%, 8/15/31(14) |
GBP
|
400
|
527,680
|
| Seaspan
Corp., 5.50%, 8/1/29(1) |
|
1,911
|
1,733,386
|
| Stonepeak
Nile Parent LLC, 7.25%, 3/15/32(1) |
|
697
|
711,062
|
| Watco
Cos. LLC/Watco Finance Corp., 7.125%, 8/1/32(1) |
|
1,155
|
1,162,511
|
| |
|
|
$ 5,663,274
|
| Utilities
— 1.5% |
| Calpine
Corp.: |
|
|
|
| 4.50%,
2/15/28(1) |
|
1,073
|
$
1,041,079 |
| 4.625%,
2/1/29(1) |
|
680
|
653,293
|
| 5.00%,
2/1/31(1) |
|
910
|
869,530
|
| 5.125%,
3/15/28(1) |
|
1,511
|
1,488,045
|
| Leeward
Renewable Energy Operations LLC, 4.25%, 7/1/29(1) |
|
838
|
741,316
|
| NRG
Energy, Inc.: |
|
|
|
| 3.375%,
2/15/29(1) |
|
664
|
610,264
|
| 3.625%,
2/15/31(1) |
|
1,107
|
981,253
|
| 3.875%,
2/15/32(1) |
|
1,466
|
1,286,826
|
| 5.25%,
6/15/29(1) |
|
673
|
656,440
|
| 6.00%,
2/1/33(1) |
|
1,190
|
1,158,919
|
| 6.25%,
11/1/34(1) |
|
795
|
783,305
|
| 10.25%
to 3/15/28(1)(15)(17) |
|
1,753
|
1,935,442
|
| TerraForm
Power Operating LLC, 5.00%, 1/31/28(1) |
|
1,497
|
1,450,264
|
| Vistra
Operations Co. LLC: |
|
|
|
| 4.375%,
5/1/29(1) |
|
939
|
892,469
|
| 5.00%,
7/31/27(1) |
|
1,698
|
1,673,201
|
| 6.875%,
4/15/32(1) |
|
1,405
|
1,433,228
|
| |
|
|
$ 17,654,874
|
Total
Corporate Bonds
(identified cost $579,451,800) |
|
|
$ 572,826,828
|
25
See Notes to Financial Statements.
Eaton Vance
Limited Duration Income Fund
March 31, 2025
Portfolio of
Investments — continued
| Security
|
Shares
|
Value
|
| Technology
— 0.0%† |
| Cohesity
Global, Inc.: |
|
|
|
| Series
G(11) |
|
10,002
|
$
245,049 |
| Series
G1(11) |
|
6,910
|
169,295
|
Total
Preferred Stocks
(identified cost $346,696) |
|
|
$ 414,344
|
| Senior
Floating-Rate Loans — 45.6%(19) |
| Borrower/Description
|
Principal
Amount*
(000's omitted) |
Value
|
| Aerospace
and Defense — 0.8% |
| Aernnova
Aerospace SAU, Term Loan, 6.757%, (3 mo. EURIBOR + 4.00%), 2/27/30 |
EUR
|
1,000
|
$
1,084,792 |
| Air
Comm Corp. LLC: |
|
|
|
| Term
Loan, 7.322%, (SOFR + 3.00%), 11/21/31 |
|
1,408
|
1,402,414
|
| Term
Loan, 12/11/31(20) |
|
117
|
116,868
|
| HDI
Aerospace Intermediate Holding III Corp., Term Loan, 8.822%, (SOFR + 4.50%), 2/11/32 |
|
650
|
647,563
|
| IAP
Worldwide Services, Inc., Term Loan - Second Lien, 0.00%, 7/18/23(10)(18) |
|
216
|
172,975
|
| Novaria
Holdings LLC, Term Loan, 7.825%, (SOFR + 3.50%), 6/6/31 |
|
199
|
199,001
|
| TransDigm,
Inc.: |
|
|
|
| Term
Loan, 6.799%, (SOFR + 2.50%), 2/28/31 |
|
4,541
|
4,521,503
|
| Term
Loan, 7.049%, (SOFR + 2.75%), 3/22/30 |
|
1,313
|
1,312,522
|
| Vista
Management Holding, Inc., Term Loan, 3/26/31(21) |
|
600
|
596,625
|
| |
|
|
$ 10,054,263
|
| Air
Freight & Logistics — 0.1% |
| AIT
Worldwide Logistics, Inc., Term Loan, 8.302%, (SOFR + 4.00%), 4/8/30 |
|
648
|
$
648,712 |
| Edge
Finco PLC, Term Loan, 6.021%, (3 mo. EURIBOR + 3.50%), 8/22/31 |
EUR
|
500
|
540,407
|
| |
|
|
$ 1,189,119
|
| Airlines
— 0.1% |
| SkyMiles
IP Ltd., Term Loan, 8.043%, (SOFR + 3.75%), 10/20/27 |
|
658
|
$
665,235 |
| |
|
|
$ 665,235
|
| Apparel
& Luxury Goods — 0.2% |
| ABG
Intermediate Holdings 2 LLC: |
|
|
|
| Term
Loan, 6.575%, (SOFR + 2.25%), 12/21/28 |
|
247
|
$
244,409 |
| Term
Loan, 6.575%, (SOFR + 2.25%), 2/13/32 |
|
625
|
618,881
|
| Gloves
Buyer, Inc., Term Loan, 8.439%, (SOFR + 4.00%), 12/29/27 |
|
620
|
597,943
|
| Hanesbrands,
Inc., Term Loan, 7.075%, (SOFR + 2.75%), 3/7/32 |
|
649
|
648,860
|
| |
|
|
$ 2,110,093
|
| Borrower/Description
|
Principal
Amount*
(000's omitted) |
Value
|
| Auto
Components — 0.7% |
| Adient
U.S. LLC, Term Loan, 6.575%, (SOFR + 2.25%), 1/31/31 |
|
550
|
$
544,018 |
| Autokiniton
U.S. Holdings, Inc., Term Loan, 8.442%, (SOFR + 4.00%), 4/6/28 |
|
505
|
496,396
|
| Clarios
Global LP: |
|
|
|
| Term
Loan, 5.363%, (1 mo. EURIBOR + 3.00%), 7/16/31 |
EUR
|
913
|
980,175
|
| Term
Loan, 6.825%, (SOFR + 2.50%), 5/6/30 |
|
2,598
|
2,566,786
|
| DexKo
Global, Inc.: |
|
|
|
| Term
Loan, 6.363%, (1 mo. EURIBOR + 4.00%), 10/4/28 |
EUR
|
405
|
410,415
|
| Term
Loan, 6.363%, (1 mo. EURIBOR + 4.00%), 10/4/28 |
EUR
|
595
|
602,725
|
| Term
Loan, 8.189%, (SOFR + 3.75%), 10/4/28 |
|
800
|
747,618
|
| Garrett
LX I SARL, Term Loan, 6.537%, (SOFR + 2.25%), 1/17/32 |
|
629
|
624,944
|
| Lippert
Colipper, Term Loan, 6.82%, (SOFR + 2.50%), 3/25/32 |
|
350
|
347,812
|
| RealTruck
Group, Inc., Term Loan, 9.439%, (SOFR + 5.00%), 1/31/28 |
|
668
|
656,556
|
| |
|
|
$ 7,977,445
|
| Automobiles
— 0.2% |
| MajorDrive
Holdings IV LLC: |
|
|
|
| Term
Loan, 8.561%, (SOFR + 4.00%), 6/1/28 |
|
433
|
$
394,202 |
| Term
Loan, 9.949%, (SOFR + 5.50%), 6/1/29 |
|
1,601
|
1,472,460
|
| |
|
|
$ 1,866,662
|
| Beverages
— 0.1% |
| Celsius
Holdings, Inc., Term Loan, 3/21/32(21) |
|
550
|
$
551,719 |
| City
Brewing Co. LLC: |
|
|
|
| Term
Loan, 8.064%, (SOFR + 3.50%), 4/5/28 |
|
546
|
204,597
|
| Term
Loan, 10.814%, (SOFR + 6.25%), 4/5/28 |
|
177
|
72,441
|
| Term
Loan - Second Lien, 9.564%, (SOFR + 5.00%), 4/5/28 |
|
1,055
|
25,056
|
| |
|
|
$ 853,813
|
| Biotechnology
— 0.1% |
| Alltech,
Inc., Term Loan, 8.689%, (SOFR + 4.25%), 8/13/30 |
|
984
|
$
977,510 |
| |
|
|
$ 977,510
|
| Building
Products — 0.8% |
| CPG
International, Inc., Term Loan, 6.325%, (SOFR + 2.00%), 9/19/31 |
|
723
|
$
724,995 |
| Knife
River HoldCo, Term Loan, 6.292%, (SOFR + 2.00%), 3/8/32 |
|
250
|
249,688
|
| Kodiak
Building Partners, Inc., Term Loan, 8.046%, (SOFR + 3.75%), 12/4/31 |
|
550
|
529,768
|
| LHS
Borrower LLC, Term Loan, 9.175%, (SOFR + 4.75%), 2/16/29 |
|
1,113
|
951,326
|
| LSF12
Crown U.S. Commercial Bidco LLC, Term Loan, 8.573%, (SOFR + 4.25%), 12/2/31 |
|
2,050
|
2,017,538
|
| MI
Windows & Doors LLC, Term Loan, 7.325%, (SOFR + 3.00%), 3/28/31 |
|
1,265
|
1,245,754
|
| Oscar
AcquisitionCo LLC, Term Loan, 8.549%, (SOFR + 4.25%), 4/29/29 |
|
878
|
823,284
|
26
See Notes to Financial Statements.
Eaton Vance
Limited Duration Income Fund
March 31, 2025
Portfolio of
Investments — continued
| Borrower/Description
|
Principal
Amount*
(000's omitted) |
Value
|
| Building
Products (continued) |
| PHRG
Intermediate LLC, Term Loan, 8.322%, (SOFR + 4.00%), 2/20/32 |
|
950
|
$
929,812 |
| Sport
Group Holding GmbH, Term Loan, 6.757%, (3 mo. EURIBOR + 4.00%), 7/8/31 |
EUR
|
1,000
|
1,084,344
|
| Standard
Industries, Inc., Term Loan, 6.069%, (SOFR + 1.75%), 9/22/28 |
|
369
|
369,038
|
| Tarkett
Participation, Term Loan, 5.808%, (1 mo. EURIBOR + 3.45%), 4/21/28 |
EUR
|
1,000
|
1,081,505
|
| |
|
|
$ 10,007,052
|
| Capital
Markets — 1.4% |
| Advisor
Group, Inc., Term Loan, 7.825%, (SOFR + 3.50%), 8/17/28 |
|
1,123
|
$
1,115,662 |
| Aretec
Group, Inc., Term Loan, 7.825%, (SOFR + 3.50%), 8/9/30 |
|
1,686
|
1,674,033
|
| Athena
Holdco SAS, Term Loan, 5.855%, (3 mo. EURIBOR + 3.50%), 4/14/31 |
EUR
|
1,000
|
1,083,111
|
| Brookfield
Property REIT, Inc., Term Loan, 6.925%, (SOFR + 2.50%), 8/27/25 |
|
584
|
583,832
|
| CeramTec
AcquiCo GmbH, Term Loan, 5.999%, (3 mo. EURIBOR + 3.50%), 3/16/29 |
EUR
|
760
|
821,023
|
| Citco
Funding LLC, Term Loan, 6.934%, (SOFR + 2.75%), 4/27/28 |
|
763
|
765,799
|
| EIG
Management Co. LLC, Term Loan, 9.319%, (SOFR + 5.00%), 5/17/29 |
|
402
|
402,321
|
| FinCo
I LLC, Term Loan, 6.575%, (SOFR + 2.25%), 6/27/29 |
|
1,207
|
1,210,350
|
| Focus
Financial Partners LLC, Term Loan, 7.075%, (SOFR + 2.75%), 9/15/31 |
|
4,281
|
4,245,057
|
| Franklin
Square Holdings LP, Term Loan, 6.575%, (SOFR + 2.25%), 4/25/31 |
|
1,017
|
1,017,313
|
| HighTower
Holdings LLC, Term Loan, 7.291%, (SOFR + 3.00%), 2/3/32 |
|
1,006
|
1,000,789
|
| Kestra
Advisor Services Holdings A, Inc., Term Loan, 7.291%, (SOFR + 3.00%), 3/21/31 |
|
647
|
641,751
|
| Mariner
Wealth Advisors LLC, Term Loan, 6.799%, (SOFR + 2.50%), 8/18/28 |
|
973
|
971,200
|
| Orion
Advisor Solutions, Inc., Term Loan, 8.041%, (SOFR + 3.75%), 9/24/30 |
|
622
|
622,559
|
| Victory
Capital Holdings, Inc., Term Loan, 6.638%, (SOFR + 2.25%), 7/1/26 |
|
873
|
873,950
|
| |
|
|
$ 17,028,750
|
| Chemicals
— 2.3% |
| Aruba
Investments Holdings LLC, Term Loan, 6.363%, (1 mo. EURIBOR + 4.00%), 11/24/27 |
EUR
|
960
|
$
1,016,249 |
| Discovery
Purchaser Corp., Term Loan, 8.04%, (SOFR + 3.75%), 10/4/29 |
|
599
|
593,637
|
| Groupe
Solmax, Inc., Term Loan, 9.255%, (SOFR + 4.75%), 5/29/28(22) |
|
190
|
159,244
|
| INEOS
Enterprises Holdings II Ltd., Term Loan, 6.499%, (3 mo. EURIBOR + 4.00%), 7/7/30 |
EUR
|
500
|
541,701
|
| INEOS
Enterprises Holdings U.S. Finco LLC, Term Loan, 8.163%, (SOFR + 3.75%), 7/8/30 |
|
1,037
|
1,036,875
|
| INEOS
Finance PLC, Term Loan, 5.863%, (1 mo. EURIBOR + 3.50%), 6/23/31 |
EUR
|
1,194
|
1,275,655
|
| INEOS
Quattro Holdings U.K. Ltd.: |
|
|
|
| Term
Loan, 6.863%, (1 mo. EURIBOR + 4.50%), 4/2/29 |
EUR
|
1,000
|
1,059,090
|
| Borrower/Description
|
Principal
Amount*
(000's omitted) |
Value
|
| Chemicals
(continued) |
| INEOS
Quattro Holdings U.K. Ltd.: (continued) |
|
|
|
| Term
Loan, 8.175%, (SOFR + 3.75%), 3/14/30 |
|
418
|
$
393,553 |
| Term
Loan, 8.675%, (SOFR + 4.25%), 4/2/29 |
|
2,274
|
2,188,873
|
| INEOS
U.S. Finance LLC: |
|
|
|
| Term
Loan, 6.925%, (SOFR + 2.50%), 11/8/28 |
|
606
|
591,409
|
| Term
Loan, 7.325%, (SOFR + 3.00%), 2/7/31 |
|
1,045
|
1,001,396
|
| Term
Loan, 7.575%, (SOFR + 3.25%), 2/18/30 |
|
1,771
|
1,705,703
|
| Lonza
Group AG: |
|
|
|
| Term
Loan, 6.768%, (3 mo. EURIBOR + 3.93%), 7/3/28 |
EUR
|
1,000
|
1,029,262
|
| Term
Loan, 8.324%, (SOFR + 3.93%), 7/3/28 |
|
1,688
|
1,559,217
|
| Momentive
Performance Materials, Inc., Term Loan, 8.325%, (SOFR + 4.00%), 3/29/28 |
|
784
|
781,942
|
| Natgasoline
LLC, Term Loan, 3/29/30(21) |
|
525
|
512,531
|
| Nobian
Finance BV, Term Loan, 7/1/29(21) |
EUR
|
500
|
539,852
|
| Nouryon
Finance BV: |
|
|
|
| Term
Loan, 6.204%, (3 mo. EURIBOR + 3.50%), 4/3/28 |
EUR
|
750
|
812,025
|
| Term
Loan, 7.553%, (SOFR + 3.25%), 4/3/28 |
|
1,284
|
1,283,074
|
| Olympus
Water U.S. Holding Corp., Term Loan, 7.299%, (SOFR + 3.00%), 6/20/31 |
|
2,041
|
2,012,411
|
| Orion
Engineered Carbons GmbH: |
|
|
|
| Term
Loan, 4.755%, (3 mo. EURIBOR + 2.40%), 9/24/28 |
EUR
|
1,000
|
1,080,121
|
| Term
Loan, 6.549%, (SOFR + 2.15%), 9/24/28 |
|
362
|
345,591
|
| Paint
Intermediate III LLC, Term Loan, 7.302%, (SOFR + 3.00%), 10/9/31 |
|
525
|
525,328
|
| Rohm
Holding GmbH: |
|
|
|
| Term
Loan, 7.848%, (3 mo. EURIBOR + 5.25%), 7.598% cash, 0.25% PIK, 1/31/29 |
EUR
|
1,002
|
1,037,897
|
| Term
Loan, 9.737%, (SOFR + 5.50%), 1/31/29(22) |
|
906
|
872,848
|
| SCUR-Alpha
1503 GmbH, Term Loan, 9.791%, (SOFR + 5.50%), 3/29/30 |
|
907
|
847,570
|
| Tronox
Finance LLC: |
|
|
|
| Term
Loan, 6.549%, (SOFR + 2.25%), 4/4/29 |
|
474
|
462,441
|
| Term
Loan, 6.811%, (SOFR + 2.50%), 9/18/31(22) |
|
1,739
|
1,699,101
|
| W.R.
Grace & Co.-Conn., Term Loan, 7.549%, (SOFR + 3.25%), 9/22/28 |
|
1,088
|
1,079,594
|
| |
|
|
$ 28,044,190
|
| Commercial
Services & Supplies — 1.7% |
| Albion
Financing 3 SARL, Term Loan, 7.302%, (SOFR + 3.00%), 8/16/29 |
|
1,794
|
$
1,797,886 |
| Allied
Universal Holdco LLC: |
|
|
|
| Term
Loan, 6.113%, (1 mo. EURIBOR + 3.75%), 5/12/28 |
EUR
|
965
|
1,042,333
|
| Term
Loan, 8.175%, (SOFR + 3.75%), 5/12/28 |
|
2,644
|
2,644,613
|
| Armor
Holding II LLC, Term Loan, 12/11/28(21) |
|
200
|
199,813
|
| Befesa
SA, Term Loan, 5.362%, (3 mo. EURIBOR + 2.75%), 7/9/29 |
EUR
|
1,000
|
1,087,863
|
| Belfor
Holdings, Inc.: |
|
|
|
| Term
Loan, 5.863%, (1 mo. EURIBOR + 3.50%), 11/1/30 |
EUR
|
1,000
|
1,081,300
|
| Term
Loan, 7.325%, (SOFR + 3.00%), 11/1/30 |
|
570
|
569,705
|
| EnergySolutions
LLC, Term Loan, 7.575%, (SOFR + 3.25%), 9/20/30 |
|
3,725
|
3,722,303
|
27
See Notes to Financial Statements.
Eaton Vance
Limited Duration Income Fund
March 31, 2025
Portfolio of
Investments — continued
| Borrower/Description
|
Principal
Amount*
(000's omitted) |
Value
|
| Commercial
Services & Supplies (continued) |
| Flame
Newco LLC, Term Loan, 10.425%, (SOFR + 6.10%), 6/30/28 |
|
214
|
$
210,494 |
| Foundever
Group, Term Loan, 6.25%, (3 mo. EURIBOR + 3.75%), 8/28/28 |
EUR
|
500
|
337,636
|
| Foundever
Worldwide Corp., Term Loan, 8.178%, (SOFR + 3.75%), 8/28/28 |
|
1,834
|
1,104,491
|
| GFL
Environmental, Inc., Term Loan, 6.819%, (SOFR + 2.50%), 2/4/32 |
|
1,500
|
1,488,750
|
| Harsco
Corp., Term Loan, 6.689%, (SOFR + 2.25%), 6/9/28 |
|
385
|
379,706
|
| Heritage-Crystal
Clean, Inc., Term Loan, 8.303%, (SOFR + 4.00%), 10/17/30 |
|
691
|
692,550
|
| Monitronics
International, Inc., Term Loan, 12.087%, (SOFR + 7.50%), 6/30/28 |
|
1,416
|
1,410,705
|
| Prime
Security Services Borrower LLC, Term Loan, 6.325%, (SOFR + 2.00%), 10/13/30 |
|
945
|
942,354
|
| Tempo
Acquisition LLC, Term Loan, 6.075%, (SOFR + 1.75%), 8/31/28 |
|
669
|
664,647
|
| TMF
Group Holding BV: |
|
|
|
| Term
Loan, 5.986%, (3 mo. EURIBOR + 3.25%), 5/3/28 |
EUR
|
1,000
|
1,080,218
|
| Term
Loan, 7.046%, (SOFR + 2.75%), 5/3/28 |
|
370
|
368,635
|
| |
|
|
$ 20,826,002
|
| Construction
Materials — 0.7% |
| Construction
Partners, Inc., Term Loan, 6.827%, (SOFR + 2.50%), 11/3/31 |
|
524
|
$
521,506 |
| Quikrete
Holdings, Inc.: |
|
|
|
| Term
Loan, 6.575%, (SOFR + 2.25%), 3/19/29 |
|
2,110
|
2,092,892
|
| Term
Loan, 6.575%, (SOFR + 2.25%), 4/14/31 |
|
3,121
|
3,090,309
|
| Term
Loan, 6.575%, (SOFR + 2.25%), 2/10/32 |
|
1,750
|
1,732,552
|
| Star
Holding LLC, Term Loan, 8.825%, (SOFR + 4.50%), 7/31/31 |
|
846
|
828,662
|
| |
|
|
$ 8,265,921
|
| Consumer
Finance — 0.1% |
| Global
Blue Acquisition BV, Term Loan, 5.721%, (1 mo. EURIBOR + 3.25%), 12/5/30 |
EUR
|
1,000
|
$
1,085,609 |
| |
|
|
$ 1,085,609
|
| Consumer
Staples Distribution & Retail — 0.4% |
| Cardenas
Markets, Inc., Term Loan, 11.149%, (SOFR + 6.75%), 8/1/29 |
|
392
|
$
338,751 |
| Peer
Holding III BV: |
|
|
|
| Term
Loan, 5.605%, (3 mo. EURIBOR + 3.25%), 11/5/31 |
EUR
|
1,500
|
1,623,515
|
| Term
Loan, 6.799%, (SOFR + 2.50%), 10/28/30 |
|
1,089
|
1,089,174
|
| Term
Loan, 6.799%, (SOFR + 2.50%), 7/1/31 |
|
1,421
|
1,420,727
|
| |
|
|
$ 4,472,167
|
| Containers
& Packaging — 0.5% |
| Altium
Packaging LLC, Term Loan, 6.825%, (SOFR + 2.50%), 6/11/31 |
|
496
|
$
485,705 |
| Berlin
Packaging LLC, Term Loan, 7.82%, (SOFR + 3.50%), 6/7/31(22) |
|
1,213
|
1,209,935
|
| Clydesdale
Acquisition Holdings, Inc., Term Loan, 7.50%, (SOFR + 3.18%), 4/13/29 |
|
468
|
466,180
|
| Borrower/Description
|
Principal
Amount*
(000's omitted) |
Value
|
| Containers
& Packaging (continued) |
| Pactiv
Evergreen Group Holdings, Inc., Term Loan, 6.825%, (SOFR + 2.50%), 9/24/28 |
|
1,630
|
$
1,629,861 |
| Pregis
TopCo Corp., Term Loan, 8.325%, (SOFR + 4.00%), 7/31/26 |
|
616
|
616,867
|
| Pretium
PKG Holdings, Inc., Term Loan - Second Lien, 11.309%, (SOFR + 6.75%), 10/1/29 |
|
350
|
81,856
|
| Proampac
PG Borrower LLC, Term Loan, 8.31%, (SOFR + 4.00%), 9/15/28 |
|
1,111
|
1,106,338
|
| |
|
|
$ 5,596,742
|
| Distributors
— 0.4% |
| CD&R
Hydra Buyer, Inc., Term Loan, 8.425%, (SOFR + 4.00%), 3/25/31 |
|
842
|
$
809,645 |
| Parts
Europe SA, Term Loan, 5.954%, (3 mo. EURIBOR + 3.25%), 2/3/31 |
EUR
|
1,500
|
1,625,250
|
| Phillips
Feed Service, Inc., Term Loan, 11.425%, (SOFR + 7.00%), 11/13/26(10) |
|
104
|
63,756
|
| Rubix
Group Midco 3 Ltd., Term Loan, 6.535%, (3 mo. EURIBOR + 4.00%), 9/30/28 |
EUR
|
1,000
|
1,084,771
|
| Safic-Alcan
SAS, Term Loan, 5.855%, (3 mo. EURIBOR + 3.50%), 6/22/29 |
EUR
|
1,000
|
1,085,933
|
| Winterfell
Financing SARL, Term Loan, 7.539%, (3 mo. EURIBOR + 5.00%), 5/4/28 |
EUR
|
500
|
535,919
|
| |
|
|
$ 5,205,274
|
| Diversified
Consumer Services — 0.8% |
| Amber
Finco PLC, Term Loan, 5.855%, (3 mo. EURIBOR + 3.50%), 6/11/29 |
EUR
|
1,100
|
$
1,192,629 |
| Anticimex
International AB, Term Loan, 5.899%, (3 mo. EURIBOR + 3.40%), 11/16/28 |
EUR
|
1,000
|
1,079,781
|
| Ascend
Learning LLC: |
|
|
|
| Term
Loan, 7.325%, (SOFR + 3.00%), 12/11/28 |
|
631
|
623,744
|
| Term
Loan - Second Lien, 10.175%, (SOFR + 5.75%), 12/10/29 |
|
1,646
|
1,643,227
|
| Fugue
Finance BV, Term Loan, 5.949%, (3 mo. EURIBOR + 3.25%), 1/9/32 |
EUR
|
1,000
|
1,078,104
|
| KUEHG
Corp., Term Loan, 7.549%, (SOFR + 3.25%), 6/12/30 |
|
973
|
971,907
|
| Spring
Education Group, Inc., Term Loan, 8.299%, (SOFR + 4.00%), 10/4/30 |
|
1,343
|
1,343,221
|
| Wand
NewCo 3, Inc., Term Loan, 6.825%, (SOFR + 2.50%), 1/30/31 |
|
1,206
|
1,190,094
|
| |
|
|
$ 9,122,707
|
| Diversified
Financial Services — 0.2% |
| Concorde
Midco Ltd., Term Loan, 6.023%, (1 mo. EURIBOR + 3.50%), 3/1/30 |
EUR
|
1,000
|
$
1,074,093 |
| Sandy
BidCo BV, Term Loan, 6.261%, (6 mo. EURIBOR + 3.85%), 8/17/29 |
EUR
|
1,000
|
1,068,232
|
| |
|
|
$ 2,142,325
|
| Diversified
Telecommunication Services — 1.1% |
| Altice
France SA, Term Loan, 9.802%, (SOFR + 5.50%), 8/15/28 |
|
1,058
|
$
950,595 |
| Anuvu
Holdings 2 LLC: |
|
|
|
| Term
Loan, 12.645%, (SOFR + 8.25%), 3/23/26(10) |
|
869
|
318,619
|
28
See Notes to Financial Statements.
Eaton Vance
Limited Duration Income Fund
March 31, 2025
Portfolio of
Investments — continued
| Borrower/Description
|
Principal
Amount*
(000's omitted) |
Value
|
| Diversified
Telecommunication Services (continued) |
| Anuvu
Holdings 2 LLC: (continued) |
|
|
|
| Term
Loan, 14.395%, (SOFR + 10.00%), 8.395% cash, 6.00% PIK, 9/27/27(10) |
|
344
|
$
275,202 |
| Eircom
Finco SARL, Term Loan, 5.206%, (1 mo. EURIBOR + 2.75%), 5/15/29 |
EUR
|
1,786
|
1,927,173
|
| Lumen
Technologies, Inc.: |
|
|
|
| Term
Loan, 6.789%, (SOFR + 2.35%), 4/15/29 |
|
1,043
|
1,005,409
|
| Term
Loan, 6.789%, (SOFR + 2.35%), 4/15/30 |
|
1,043
|
1,004,094
|
| Telenet
International Finance SARL, Term Loan, 4.618%, (1 mo. EURIBOR + 2.25%), 4/30/29 |
EUR
|
1,750
|
1,856,898
|
| UPC
Broadband Holding BV: |
|
|
|
| Term
Loan, 4.868%, (1 mo. EURIBOR + 2.50%), 4/30/29 |
EUR
|
1,500
|
1,612,988
|
| Term
Loan, 5.293%, (1 mo. EURIBOR + 2.93%), 1/31/29 |
EUR
|
519
|
560,073
|
| Virgin
Media Bristol LLC, Term Loan, 7.684%, (SOFR + 3.25%), 1/31/29 |
|
1,150
|
1,129,352
|
| Virgin
Media Ireland Ltd., Term Loan, 5.943%, (1 mo. EURIBOR + 3.58%), 7/15/29 |
EUR
|
1,000
|
1,074,996
|
| Virgin
Media SFA Finance Ltd., Term Loan, 4.868%, (1 mo. EURIBOR + 2.50%), 1/31/29 |
EUR
|
600
|
637,144
|
| Zayo
Group Holdings, Inc., Term Loan, 5.613%, (1 mo. EURIBOR + 3.25%), 3/9/27 |
EUR
|
950
|
950,336
|
| |
|
|
$ 13,302,879
|
| Electric
Utilities — 0.3% |
| Kohler
Energy Co. LLC: |
|
|
|
| Term
Loan, 7.362%, (3 mo. EURIBOR + 4.75%), 5/1/31 |
EUR
|
1,500
|
$
1,629,719 |
| Term
Loan, 8.049%, (SOFR + 3.75%), 5/1/31 |
|
2,084
|
2,055,777
|
| |
|
|
$ 3,685,496
|
| Electrical
Equipment — 0.3% |
| AZZ,
Inc., Term Loan, 6.825%, (SOFR + 2.50%), 5/13/29 |
|
293
|
$
294,140 |
| Dynamo
Newco II GmbH, Term Loan, 10/1/31(21) |
EUR
|
500
|
542,272
|
| WEC
U.S. Holdings Ltd., Term Loan, 6.573%, (SOFR + 2.25%), 1/27/31 |
|
3,035
|
3,010,669
|
| |
|
|
$ 3,847,081
|
| Electronic
Equipment, Instruments & Components — 0.9% |
| Chamberlain
Group, Inc., Term Loan, 7.675%, (SOFR + 3.25%), 11/3/28 |
|
2,638
|
$
2,616,624 |
| Creation
Technologies, Inc., Term Loan, 10.058%, (SOFR + 5.50%), 10/5/28 |
|
948
|
922,112
|
| II-VI,
Inc., Term Loan, 6.325%, (SOFR + 2.00%), 7/2/29 |
|
769
|
768,618
|
| Minimax
Viking GmbH: |
|
|
|
| Term
Loan, 4.896%, (3 mo. EURIBOR + 2.50%), 2/20/32 |
EUR
|
1,500
|
1,626,410
|
| Term
Loan, 6.57%, (SOFR + 2.25%), 2/20/32 |
|
600
|
598,875
|
| Mirion
Technologies, Inc., Term Loan, 6.549%, (SOFR + 2.25%), 10/20/28 |
|
586
|
585,278
|
| Range
Red Operating, Inc.: |
|
|
|
| Term
Loan, 12.41%, (SOFR + 8.00%), 10/1/29 |
|
188
|
184,681
|
| Term
Loan - Second Lien, 12.41%, (SOFR + 8.00%), 10/1/29 |
|
788
|
774,712
|
| Sector
Alarm Holding AS, Term Loan, 5.999%, (3 mo. EURIBOR + 3.50%), 6/14/29 |
EUR
|
500
|
541,926
|
| Borrower/Description
|
Principal
Amount*
(000's omitted) |
Value
|
| Electronic
Equipment, Instruments & Components (continued) |
| Verifone
Systems, Inc., Term Loan, 9.942%, (SOFR + 5.50%), 8/18/28 |
|
1,065
|
$
947,581 |
| Verisure
Holding AB, Term Loan, 5.355%, (3 mo. EURIBOR + 3.00%), 3/27/28 |
EUR
|
1,000
|
1,080,354
|
| |
|
|
$ 10,647,171
|
| Energy
Equipment & Services — 0.4% |
| Ameriforge
Group, Inc.: |
|
|
|
| Term
Loan, 15.442%, (SOFR + 11.00%), 4.442% cash, 11.00% PIK, 12/31/25(10) |
|
125
|
$
35,989 |
| Term
Loan, 15.442%, (SOFR + 11.00%), 4.442% cash, 11.00% PIK, 12/31/25(10) |
|
1,082
|
311,647
|
| GIP
Pilot Acquisition Partners LP, Term Loan, 6.302%, (SOFR + 2.00%), 10/4/30 |
|
472
|
470,601
|
| Holding
Socotec, Term Loan, 5.605%, (3 mo. EURIBOR + 3.25%), 6/2/28 |
EUR
|
1,000
|
1,082,727
|
| New
Generation Gas Gathering LLC, Term Loan, 10.041%, (SOFR + 5.75%), 9/30/29 |
|
1,421
|
1,399,464
|
| PG
Investment Co. 59 SARL, Term Loan, 7.299%, (SOFR + 3.00%), 3/26/31 |
|
1,394
|
1,395,562
|
| |
|
|
$ 4,695,990
|
| Engineering
& Construction — 0.4% |
| American
Residential Services LLC, Term Loan, 7.541%, (SOFR + 3.25%), 2/2/32 |
|
552
|
$
550,620 |
| APi
Group DE, Inc., Term Loan, 6.075%, (SOFR + 1.75%), 1/3/29 |
|
1,248
|
1,245,020
|
| Arcosa,
Inc., Term Loan, 6.575%, (SOFR + 2.25%), 8/12/31 |
|
374
|
374,296
|
| Artera
Services LLC, Term Loan, 8.799%, (SOFR + 4.50%), 2/15/31 |
|
421
|
400,121
|
| Azuria
Water Solutions, Inc., Term Loan, 7.325%, (SOFR + 3.00%), 5/17/28 |
|
459
|
456,630
|
| Northstar
Group Services, Inc., Term Loan, 9.075%, (SOFR + 4.75%), 5/8/30 |
|
1,390
|
1,398,761
|
| Platea
BC Bidco AB: |
|
|
|
| Term
Loan, 4.924%, (1 mo. EURIBOR + 4.00%), 4/3/31(20) |
EUR
|
83
|
90,460
|
| Term
Loan, 6.355%, (3 mo. EURIBOR + 4.00%), 4/3/31 |
EUR
|
417
|
452,301
|
| |
|
|
$ 4,968,209
|
| Entertainment
— 0.4% |
| City
Football Group Ltd., Term Loan, 7.939%, (SOFR + 3.50%), 7/22/30 |
|
1,334
|
$
1,320,089 |
| Playtika
Holding Corp., Term Loan, 7.189%, (SOFR + 2.75%), 3/13/28 |
|
2,126
|
2,107,589
|
| Renaissance
Holding Corp., Term Loan, 8.325%, (SOFR + 4.00%), 4/5/30 |
|
936
|
919,993
|
| Vue
Entertainment International Ltd., Term Loan, 11.446%, (3 mo. EURIBOR + 8.40%), 3.046% cash, 8.40% PIK, 12/31/27 |
EUR
|
480
|
339,883
|
| Vue
International Bidco PLC, Term Loan, 11.046%, (6 mo. EURIBOR + 8.00%), 6/30/27 |
EUR
|
121
|
131,304
|
| |
|
|
$ 4,818,858
|
29
See Notes to Financial Statements.
Eaton Vance
Limited Duration Income Fund
March 31, 2025
Portfolio of
Investments — continued
| Borrower/Description
|
Principal
Amount*
(000's omitted) |
Value
|
| Equity
Real Estate Investment Trusts (REITs) — 0.1% |
| Iron
Mountain, Inc., Term Loan, 6.325%, (SOFR + 2.00%), 1/31/31 |
|
861
|
$
857,157 |
| |
|
|
$ 857,157
|
| Financial
Services — 1.1% |
| Boost
Newco Borrower LLC: |
|
|
|
| Term
Loan, 4.855%, (3 mo. EURIBOR + 2.50%), 1/31/31 |
EUR
|
1,496
|
$
1,622,320 |
| Term
Loan, 6.299%, (SOFR + 2.00%), 1/31/31 |
|
2,868
|
2,852,584
|
| Citrin
Cooperman Advisors LLC: |
|
|
|
| Term
Loan, 4/1/32(21) |
|
1,268
|
1,260,655
|
| Term
Loan, 4/1/32(21) |
|
82
|
81,333
|
| CohnReznick
LLP: |
|
|
|
| Term
Loan, 3/26/32(21) |
|
136
|
136,278
|
| Term
Loan, 3/26/32(21) |
|
589
|
588,722
|
| CPI
Holdco B LLC, Term Loan, 6.325%, (SOFR + 2.00%), 5/19/31 |
|
1,219
|
1,208,466
|
| Ditech
Holding Corp., Term Loan, 0.00%, 6/30/25(18) |
|
2,110
|
416,702
|
| Grant
Thornton Advisors LLC, Term Loan, 7.075%, (SOFR + 2.75%), 6/2/31 |
|
1,991
|
1,983,608
|
| NCR
Atleos LLC, Term Loan, 8.053%, (SOFR + 3.75%), 4/16/29 |
|
555
|
557,648
|
| Nuvei
Technologies Corp., Term Loan, 7.325%, (SOFR + 3.00%), 11/17/31 |
|
525
|
522,228
|
| Walker
& Dunlop, Inc., Term Loan, 6.319%, (SOFR + 2.00%), 3/14/32 |
|
725
|
722,281
|
| WEX,
Inc., Term Loan, 6.075%, (SOFR + 1.75%), 3/5/32 |
|
825
|
818,470
|
| |
|
|
$ 12,771,295
|
| Food
Products — 1.2% |
| Artisan
Newco BV, Term Loan, 6.115%, (3 mo. EURIBOR + 3.75%), 2/12/29 |
EUR
|
495
|
$
536,062 |
| CHG
PPC Parent LLC: |
|
|
|
| Term
Loan, 5.863%, (1 mo. EURIBOR + 3.50%), 12/8/28 |
EUR
|
2,000
|
2,168,006
|
| Term
Loan, 7.439%, (SOFR + 3.00%), 12/8/28 |
|
461
|
460,626
|
| Del
Monte Foods, Inc.: |
|
|
|
| Term
Loan, 12.469%, (SOFR + 8.15%), 8/2/28 |
|
210
|
209,484
|
| Term
Loan - Second Lien, 8.716%, (SOFR + 4.40%), 8/2/28 |
|
440
|
285,369
|
| Froneri
Lux Finco SARL: |
|
|
|
| Term
Loan, 5.098%, (6 mo. EURIBOR + 2.50%), 9/30/31 |
EUR
|
1,275
|
1,375,279
|
| Term
Loan, 6.237%, (SOFR + 2.00%), 9/17/31 |
|
2,107
|
2,095,556
|
| Monogram
Food Solutions LLC, Term Loan, 8.439%, (SOFR + 4.00%), 8/28/28 |
|
532
|
524,143
|
| Newly
Weds Foods, Inc., Term Loan, 6.566%, (SOFR + 2.25%), 3/15/32 |
|
1,200
|
1,194,000
|
| Nomad
Foods Europe Midco Ltd., Term Loan, 5.155%, (6 mo. EURIBOR + 2.50%), 6/24/28 |
EUR
|
3,000
|
3,261,465
|
| Pegasus
BidCo BV, Term Loan, 6.022%, (3 mo. EURIBOR + 3.50%), 7/12/29 |
EUR
|
940
|
1,020,087
|
| POP
Bidco SAS, Term Loan, 7.344%, (3 mo. EURIBOR + 4.50%), 11/26/31 |
EUR
|
500
|
542,734
|
| Borrower/Description
|
Principal
Amount*
(000's omitted) |
Value
|
| Food
Products (continued) |
| United
Petfood Finance BV, Term Loan, 5.171%, (6 mo. EURIBOR + 2.75%), 2/26/32 |
EUR
|
750
|
$
807,062 |
| Valeo
F1 Co. Ltd. (Ireland), Term Loan, 6.129%, (6 mo. EURIBOR + 3.75%), 9/29/28 |
EUR
|
500
|
537,187
|
| |
|
|
$ 15,017,060
|
| Health
Care Equipment & Supplies — 0.1% |
| Bayou
Intermediate II LLC, Term Loan, 9.052%, (SOFR + 4.50%), 8/2/28 |
|
726
|
$
727,155 |
| Medline
Borrower LP, Term Loan, 5.113%, (1 mo. EURIBOR + 2.75%), 10/23/28 |
EUR
|
1,000
|
1,081,300
|
| |
|
|
$ 1,808,455
|
| Health
Care Providers & Services — 2.8% |
| AEA
International Holdings (Lux) SARL, Term Loan, 7.049%, (SOFR + 2.75%), 9/7/28 |
|
1,040
|
$
1,031,268 |
| Biogroup-LCD,
Term Loan, 6.026%, (3 mo. EURIBOR + 3.50%), 2/9/28 |
EUR
|
750
|
791,552
|
| BW
NHHC Holdco, Inc., Term Loan - Second Lien, 12.299%, (SOFR + 8.00%), 10.049% cash, 2.25% PIK, 1/15/26 |
|
3,802
|
3,500,337
|
| CCRR
Parent, Inc., Term Loan, 8.825%, (SOFR + 4.25%), 3/6/28 |
|
504
|
224,862
|
| Cerba
Healthcare SAS, Term Loan, 6.063%, (1 mo. EURIBOR + 3.70%), 6/30/28 |
EUR
|
950
|
854,582
|
| CHG
Healthcare Services, Inc., Term Loan, 7.313%, (SOFR + 3.00%), 9/29/28 |
|
1,457
|
1,456,396
|
| CNT
Holdings I Corp., Term Loan, 6.802%, (SOFR + 2.50%), 11/8/32 |
|
674
|
670,623
|
| Concentra
Health Services, Inc., Term Loan, 6.325%, (SOFR + 2.00%), 7/26/31 |
|
374
|
374,062
|
| Electron
BidCo, Inc., Term Loan, 7.075%, (SOFR + 2.75%), 11/1/28 |
|
1,080
|
1,079,125
|
| Elsan
SAS, Term Loan, 6.156%, (3 mo. EURIBOR + 3.50%), 6/16/31 |
EUR
|
1,500
|
1,613,645
|
| Ensemble
RCM LLC, Term Loan, 7.291%, (SOFR + 3.00%), 8/1/29 |
|
2,296
|
2,296,588
|
| Hanger,
Inc.: |
|
|
|
| Term
Loan, 4.149%, (SOFR + 3.50%), 10/23/31(20) |
|
151
|
151,219
|
| Term
Loan, 7.825%, (SOFR + 3.50%), 10/23/31 |
|
1,174
|
1,174,470
|
| IVC
Acquisition Ltd.: |
|
|
|
| Term
Loan, 8.049%, (SOFR + 3.75%), 12/12/28 |
|
1,012
|
1,013,954
|
| Term
Loan, 9.574%, (SONIA + 5.75%), 12/12/28 |
GBP
|
1,000
|
1,296,497
|
| LSCS
Holdings, Inc., Term Loan, 8.799%, (SOFR + 4.50%), 3/4/32 |
|
475
|
474,853
|
| Medical
Solutions Holdings, Inc., Term Loan, 7.891%, (SOFR + 3.50%), 11/1/28 |
|
1,432
|
929,377
|
| Mehilainen
Yhtiot Oy, Term Loan, 6.255%, (3 mo. EURIBOR + 3.90%), 8/5/31 |
EUR
|
1,000
|
1,084,479
|
| Midwest
Physician Administrative Services LLC, Term Loan, 7.561%, (SOFR + 3.00%), 3/12/28 |
|
456
|
400,329
|
| National
Mentor Holdings, Inc.: |
|
|
|
| Term
Loan, 8.149%, (SOFR + 3.75%), 3/2/28 |
|
58
|
56,638
|
| Term
Loan, 8.17%, (SOFR + 3.75%), 3/2/28(22) |
|
1,999
|
1,942,079
|
| Option
Care Health, Inc., Term Loan, 6.575%, (SOFR + 2.25%), 10/27/28 |
|
411
|
413,398
|
30
See Notes to Financial Statements.
Eaton Vance
Limited Duration Income Fund
March 31, 2025
Portfolio of
Investments — continued
| Borrower/Description
|
Principal
Amount*
(000's omitted) |
Value
|
| Health
Care Providers & Services (continued) |
| Pacific
Dental Services LLC, Term Loan, 7.072%, (SOFR + 2.75%), 3/15/31 |
|
1,191
|
$
1,185,969 |
| Phoenix
Guarantor, Inc., Term Loan, 6.825%, (SOFR + 2.50%), 2/21/31 |
|
1,574
|
1,569,756
|
| Radnet
Management, Inc., Term Loan, 6.568%, (SOFR + 2.25%), 4/18/31 |
|
720
|
719,224
|
| Raven
Acquisition Holdings LLC: |
|
|
|
| Term
Loan, 3.25%, 11/19/31(20) |
|
108
|
107,160
|
| Term
Loan, 7.575%, (SOFR + 3.25%), 11/19/31 |
|
1,517
|
1,500,234
|
| Select
Medical Corp., Term Loan, 6.325%, (SOFR + 2.00%), 12/3/31 |
|
973
|
972,562
|
| Sound
Inpatient Physicians, Term Loan - Second Lien, 9.561%, (SOFR + 5.00%), 8.061% cash, 1.50% PIK, 6/28/28 |
|
412
|
378,324
|
| Surgery
Center Holdings, Inc., Term Loan, 7.072%, (SOFR + 2.75%), 12/19/30 |
|
933
|
933,114
|
| Synlab
Bondco PLC: |
|
|
|
| Term
Loan, 5.068%, (6 mo. EURIBOR + 2.50%), 7/1/27 |
EUR
|
500
|
537,736
|
| Term
Loan, 6.181%, (3 mo. EURIBOR + 3.50%), 12/20/30 |
EUR
|
125
|
135,340
|
| TTF
Holdings LLC, Term Loan, 8.002%, (SOFR + 3.75%), 7/18/31 |
|
1,421
|
1,400,116
|
| U.S.
Anesthesia Partners, Inc., Term Loan, 8.687%, (SOFR + 4.25%), 10/1/28 |
|
1,470
|
1,445,352
|
| |
|
|
$ 33,715,220
|
| Health
Care Technology — 0.3% |
| Imprivata,
Inc., Term Loan, 7.791%, (SOFR + 3.50%), 12/1/27 |
|
517
|
$
517,483 |
| PointClickCare
Technologies, Inc., Term Loan, 7.549%, (SOFR + 3.25%), 11/3/31 |
|
648
|
647,568
|
| Press
Ganey Holdings, Inc., Term Loan, 7.575%, (SOFR + 3.25%), 4/30/31 |
|
647
|
643,988
|
| Project
Ruby Ultimate Parent Corp., Term Loan, 7.439%, (SOFR + 3.00%), 3/10/28 |
|
1,011
|
1,008,822
|
| Waystar
Technologies, Inc., Term Loan, 6.575%, (SOFR + 2.25%), 10/22/29 |
|
1,037
|
1,034,645
|
| |
|
|
$ 3,852,506
|
| Hotels,
Restaurants & Leisure — 1.8% |
| Betclic
Everest Group, Term Loan, 5.785%, (3 mo. EURIBOR + 3.25%), 12/10/31 |
EUR
|
500
|
$
540,988 |
| Caesars
Entertainment, Inc., Term Loan, 6.563%, (SOFR + 2.25%), 2/6/31 |
|
2,252
|
2,240,989
|
| Carnival
Corp., Term Loan, 6.325%, (SOFR + 2.00%), 10/18/28 |
|
2,052
|
2,053,576
|
| Fertitta
Entertainment LLC, Term Loan, 7.825%, (SOFR + 3.50%), 1/27/29 |
|
4,086
|
4,029,240
|
| Flutter
Financing BV, Term Loan, 6.049%, (SOFR + 1.75%), 11/30/30 |
|
3,037
|
3,028,424
|
| Four
Seasons Hotels Ltd., Term Loan, 6.075%, (SOFR + 1.75%), 11/30/29 |
|
998
|
999,055
|
| GVC
Holdings (Gibraltar) Ltd., Term Loan, 5.619%, (3 mo. EURIBOR + 3.25%), 6/30/28 |
EUR
|
1,850
|
2,008,136
|
| Horizon
U.S. Finco LP, Term Loan, 9.177%, (SOFR + 4.75%), 10/31/31 |
|
1,047
|
996,181
|
| IRB
Holding Corp., Term Loan, 6.825%, (SOFR + 2.50%), 12/15/27 |
|
293
|
291,021
|
| Borrower/Description
|
Principal
Amount*
(000's omitted) |
Value
|
| Hotels,
Restaurants & Leisure (continued) |
| J&J
Ventures Gaming LLC, Term Loan, 7.825%, (SOFR + 3.50%), 4/26/30 |
|
550
|
$
543,125 |
| Ontario
Gaming GTA LP, Term Loan, 8.549%, (SOFR + 4.25%), 8/1/30 |
|
1,485
|
1,465,118
|
| Playa
Resorts Holding BV, Term Loan, 7.075%, (SOFR + 2.75%), 1/5/29 |
|
1,295
|
1,295,116
|
| Scientific
Games Holdings LP, Term Loan, 6.486%, (3 mo. EURIBOR + 3.75%), 4/4/29 |
EUR
|
1,000
|
1,085,582
|
| SeaWorld
Parks & Entertainment, Inc., Term Loan, 6.325%, (SOFR + 2.00%), 12/4/31 |
|
869
|
863,717
|
| Wyndham
Hotels & Resorts, Inc., Term Loan, 6.075%, (SOFR + 1.75%), 5/24/30 |
|
763
|
764,441
|
| |
|
|
$ 22,204,709
|
| Household
Durables — 1.3% |
| Hunter
Douglas, Inc., Term Loan, 5.605%, (3 mo. EURIBOR + 3.25%), 1/20/32 |
EUR
|
1,000
|
$
1,059,674 |
| Libbey
Glass, Inc., Term Loan, 10.95%, (SOFR + 6.50%), 11/22/27 |
|
9,288
|
9,047,684
|
| Madison
Safety & Flow LLC, Term Loan, 7.075%, (SOFR + 2.75%), 9/26/31 |
|
522
|
522,129
|
| Serta
Simmons Bedding LLC: |
|
|
|
| Term
Loan, 11.905%, (SOFR + 7.50%), 6/29/28 |
|
393
|
393,544
|
| Term
Loan, 11.914%, (SOFR + 7.50%), 6/29/28 |
|
3,620
|
3,394,205
|
| Tempur
Sealy International, Inc., Term Loan, 6.817%, (SOFR + 2.50%), 10/24/31(22) |
|
1,696
|
1,696,632
|
| |
|
|
$ 16,113,868
|
| Household
Products — 0.2% |
| Kronos
Acquisition Holdings, Inc., Term Loan, 8.299%, (SOFR + 4.00%), 7/8/31 |
|
1,841
|
$
1,587,647 |
| Nobel
Bidco BV, Term Loan, 5.639%, (6 mo. EURIBOR + 3.25%), 9/1/28 |
EUR
|
1,000
|
1,069,816
|
| |
|
|
$ 2,657,463
|
| Independent
Power and Renewable Electricity Producers — 0.1% |
| Thunder
Generation Funding LLC, Term Loan, 7.303%, (SOFR + 3.00%), 10/3/31(22) |
|
1,095
|
$
1,095,698 |
| |
|
|
$ 1,095,698
|
| Industrial
Conglomerates — 0.3% |
| Ammeraal
Beltech Holding BV, Term Loan, 7.355%, (3 mo. EURIBOR + 5.00%), 12/30/28 |
EUR
|
942
|
$
1,023,338 |
| Nvent
Electric Public Ltd. Co., Term Loan, 7.825%, (SOFR + 3.50%), 1/30/32 |
|
1,125
|
1,126,170
|
| Rain
Carbon GmbH, Term Loan, 7.426%, (3 mo. EURIBOR + 5.00%), 10/31/28 |
EUR
|
901
|
971,393
|
| |
|
|
$ 3,120,901
|
| Industrials
Conglomerates — 0.1% |
| AAG
U.S. GSI Bidco, Inc., Term Loan, 9.299%, (SOFR + 5.00%), 10/31/31 |
|
500
|
$
495,000 |
| John
Bean Technologies Corp., Term Loan, 6.675%, (SOFR + 2.25%), 1/2/32 |
|
725
|
725,529
|
| |
|
|
$ 1,220,529
|
31
See Notes to Financial Statements.
Eaton Vance
Limited Duration Income Fund
March 31, 2025
Portfolio of
Investments — continued
| Borrower/Description
|
Principal
Amount*
(000's omitted) |
Value
|
| Insurance
— 1.6% |
| Alliant
Holdings Intermediate LLC, Term Loan, 7.069%, (SOFR + 2.75%), 9/19/31 |
|
1,221
|
$
1,214,849 |
| AmWINS
Group, Inc., Term Loan, 6.575%, (SOFR + 2.25%), 1/30/32 |
|
4,239
|
4,209,774
|
| Broadstreet
Partners, Inc., Term Loan, 7.325%, (SOFR + 3.00%), 6/13/31 |
|
1,141
|
1,132,917
|
| Financiere
CEP SAS, Term Loan, 6.577%, (6 mo. EURIBOR + 4.00%), 6/18/27 |
EUR
|
1,750
|
1,899,730
|
| HUB
International Ltd., Term Loan, 6.787%, (SOFR + 2.50%), 6/20/30 |
|
5,286
|
5,270,030
|
| Ryan
Specialty Group LLC, Term Loan, 6.575%, (SOFR + 2.25%), 9/15/31 |
|
1,247
|
1,245,472
|
| Siaci
Saint Honore, Term Loan, 5.855%, (3 mo. EURIBOR + 3.50%), 11/16/28 |
EUR
|
1,000
|
1,082,992
|
| Truist
Insurance Holdings LLC, Term Loan, 7.049%, (SOFR + 2.75%), 5/6/31 |
|
276
|
274,428
|
| USI,
Inc., Term Loan, 6.549%, (SOFR + 2.25%), 11/21/29 |
|
3,011
|
2,986,073
|
| |
|
|
$ 19,316,265
|
| Interactive
Media & Services — 0.0%† |
| Foundational
Education Group, Inc., Term Loan, 8.302%, (SOFR + 3.75%), 8/31/28 |
|
532
|
$
485,564 |
| |
|
|
$ 485,564
|
| IT
Services — 1.8% |
| Asurion
LLC: |
|
|
|
| Term
Loan, 7.689%, (SOFR + 3.25%), 7/31/27 |
|
1,066
|
$
1,058,610 |
| Term
Loan, 8.425%, (SOFR + 4.00%), 8/19/28 |
|
990
|
980,787
|
| Term
Loan, 8.575%, (SOFR + 4.25%), 9/19/30 |
|
3,034
|
2,999,791
|
| Term
Loan - Second Lien, 9.689%, (SOFR + 5.25%), 1/31/28 |
|
1,350
|
1,282,500
|
| Endure
Digital, Inc., Term Loan, 7.929%, (SOFR + 3.50%), 2/10/28 |
|
2,695
|
1,974,088
|
| Gainwell
Acquisition Corp., Term Loan, 8.399%, (SOFR + 4.00%), 10/1/27 |
|
3,017
|
2,837,878
|
| Go
Daddy Operating Co. LLC, Term Loan, 6.075%, (SOFR + 1.75%), 11/9/29 |
|
145
|
144,785
|
| Informatica
LLC, Term Loan, 6.575%, (SOFR + 2.25%), 10/27/28 |
|
2,595
|
2,597,189
|
| NAB
Holdings LLC, Term Loan, 6.799%, (SOFR + 2.50%), 11/24/28 |
|
1,089
|
1,081,788
|
| Plano
HoldCo, Inc., Term Loan, 7.799%, (SOFR + 3.50%), 10/2/31 |
|
600
|
598,500
|
| Rackspace
Finance LLC: |
|
|
|
| Term
Loan, 10.687%, (SOFR + 6.25%), 5/15/28 |
|
1,452
|
1,493,832
|
| Term
Loan - Second Lien, 7.187%, (SOFR + 2.75%), 5/15/28 |
|
2,317
|
1,081,936
|
| Sedgwick
Claims Management Services, Inc., Term Loan, 7.313%, (SOFR + 3.00%), 7/31/31 |
|
1,203
|
1,200,119
|
| Synechron,
Inc., Term Loan, 8.041%, (SOFR + 3.75%), 10/3/31 |
|
875
|
873,906
|
| team.blue
Finco SARL, Term Loan, 6.055%, (3 mo. EURIBOR + 3.70%), 9/30/29 |
EUR
|
1,000
|
1,082,111
|
| |
|
|
$ 21,287,820
|
| Borrower/Description
|
Principal
Amount*
(000's omitted) |
Value
|
| Leisure
Products — 0.2% |
| Accell
Group NV, Term Loan, 9.468%, (3 mo. EURIBOR + 7.00%), 5/31/30 |
EUR
|
93
|
$
91,759 |
| Fender
Musical Instruments Corp., Term Loan, 8.425%, (SOFR + 4.00%), 12/1/28 |
|
302
|
260,022
|
| Pretzel
Parent, Inc., Term Loan, 8.825%, (SOFR + 4.50%), 10/1/31 |
|
1,000
|
1,002,030
|
| Recess
Holdings, Inc., Term Loan, 8.047%, (SOFR + 3.75%), 2/20/30 |
|
966
|
967,575
|
| Sprint
Holdco BV: |
|
|
|
| Term
Loan, 9.468%, (6 mo. EURIBOR + 7.00%), 5/31/30 |
EUR
|
85
|
53,874
|
| Term
Loan - Second Lien, 9.468%, (6 mo. EURIBOR + 7.00%), 6/30/31 |
EUR
|
49
|
8,171
|
| Sprint
MidCo BV: |
|
|
|
| Term
Loan, 9.468%, (6 mo. EURIBOR + 7.00%), 6/30/31 |
EUR
|
82
|
2,474
|
| Term
Loan - Second Lien, 9.468%, (6 mo. EURIBOR + 7.00%), 6/30/31 |
EUR
|
57
|
4,155
|
| |
|
|
$ 2,390,060
|
| Life
Sciences Tools & Services — 0.2% |
| LGC
Group Holdings Ltd., Term Loan, 5.80%, (1 mo. EURIBOR + 3.25%), 4/21/27 |
EUR
|
1,000
|
$
1,081,451 |
| Loire
Finco Luxembourg SARL, Term Loan, 8.325%, (SOFR + 4.00%), 1/31/30 |
|
335
|
334,216
|
| Normec
1 BV: |
|
|
|
| Term
Loan, 5.868%, (1 mo. EURIBOR + 3.50%), 4/16/31 |
EUR
|
490
|
530,680
|
| Term
Loan, 4/16/31(21) |
EUR
|
510
|
551,971
|
| |
|
|
$ 2,498,318
|
| Machinery
— 2.4% |
| American
Trailer World Corp., Term Loan, 8.175%, (SOFR + 3.75%), 3/3/28 |
|
612
|
$
497,408 |
| Apex
Tool Group LLC: |
|
|
|
| Term
Loan, 14.425%, (SOFR + 10.00%), 11.925% cash, 2.50% PIK, 2/8/30 |
|
1,970
|
1,689,077
|
| Term
Loan - Second Lien, 9.675%, (SOFR + 5.25%), 2/8/29 |
|
844
|
759,485
|
| Conair
Holdings LLC, Term Loan, 8.189%, (SOFR + 3.75%), 5/17/28 |
|
1,496
|
1,299,164
|
| CPM
Holdings, Inc., Term Loan, 8.823%, (SOFR + 4.50%), 9/28/28 |
|
299
|
294,106
|
| Crown
Equipment Corp., Term Loan, 6.819%, (SOFR + 2.50%), 10/10/31 |
|
1,050
|
1,048,467
|
| Cube
Industrials Buyer, Inc., Term Loan, 7.793%, (SOFR + 3.50%), 10/17/31 |
|
425
|
422,699
|
| Delachaux
Group SA, Term Loan, 6.112%, (3 mo. EURIBOR + 3.50%), 4/16/29 |
EUR
|
922
|
1,001,614
|
| EMRLD
Borrower LP: |
|
|
|
| Term
Loan, 6.799%, (SOFR + 2.50%), 8/4/31 |
|
1,045
|
1,036,450
|
| Term
Loan, 6.933%, (SOFR + 2.50%), 5/31/30 |
|
709
|
703,385
|
| Engineered
Machinery Holdings, Inc.: |
|
|
|
| Term
Loan, 6.105%, (3 mo. EURIBOR + 3.75%), 5/21/28 |
EUR
|
965
|
1,047,044
|
| Term
Loan, 8.311%, (SOFR + 3.75%), 5/19/28 |
|
2,585
|
2,589,962
|
| Filtration
Group Corp.: |
|
|
|
| Term
Loan, 5.863%, (1 mo. EURIBOR + 3.50%), 10/21/28 |
EUR
|
1,184
|
1,281,645
|
32
See Notes to Financial Statements.
Eaton Vance
Limited Duration Income Fund
March 31, 2025
Portfolio of
Investments — continued
| Borrower/Description
|
Principal
Amount*
(000's omitted) |
Value
|
| Machinery
(continued) |
| Filtration
Group Corp.: (continued) |
|
|
|
| Term
Loan, 7.325%, (SOFR + 3.00%), 10/21/28 |
|
726
|
$
725,912 |
| Gates
Global LLC, Term Loan, 6.075%, (SOFR + 1.75%), 6/4/31 |
|
3,582
|
3,551,159
|
| Icebox
Holdco III, Inc., Term Loan, 8.061%, (SOFR + 3.50%), 12/22/28 |
|
825
|
827,130
|
| INNIO
Group Holding GmbH, Term Loan, 6.011%, (3 mo. EURIBOR + 3.25%), 11/2/28 |
EUR
|
578
|
625,393
|
| Roper
Industrial Products Investment Co. LLC: |
|
|
|
| Term
Loan, 5.855%, (3 mo. EURIBOR + 3.50%), 11/22/29 |
EUR
|
491
|
533,374
|
| Term
Loan, 7.049%, (SOFR + 2.75%), 11/22/29 |
|
590
|
587,303
|
| SPX
Flow, Inc., Term Loan, 7.325%, (SOFR + 3.00%), 4/5/29 |
|
942
|
940,961
|
| Terex
Corp., Term Loan, 6.299%, (SOFR + 2.00%), 10/8/31 |
|
2,375
|
2,380,938
|
| TK
Elevator Topco GmbH, Term Loan, 6.223%, (6 mo. EURIBOR + 3.63%), 7/30/27 |
EUR
|
1,500
|
1,617,067
|
| TK
Elevator U.S. Newco, Inc., Term Loan, 7.737%, (SOFR + 3.50%), 4/30/30 |
|
1,986
|
1,982,920
|
| Zephyr
German BidCo GmbH, Term Loan, 5.932%, (3 mo. EURIBOR + 3.15%), 3/10/28 |
EUR
|
1,500
|
1,611,164
|
| |
|
|
$ 29,053,827
|
| Marine
Transportation — 0.1% |
| Boluda
Towage SL, Term Loan, 5.999%, (3 mo. EURIBOR + 3.50%), 1/31/30 |
EUR
|
1,000
|
$
1,087,074 |
| |
|
|
$ 1,087,074
|
| Media
— 0.4% |
| Aragorn
Parent Corp., Term Loan, 8.322%, (SOFR + 4.00%), 12/15/28 |
|
942
|
$
945,861 |
| Axel
Springer SE, Term Loan, 7.123%, (1 mo. EURIBOR + 4.75%), 12/18/26 |
EUR
|
1,000
|
1,083,333
|
| Charter
Communications Operating LLC, Term Loan, 6.56%, (SOFR + 2.25%), 12/15/31 |
|
574
|
572,200
|
| Emerald
X, Inc., Term Loan, 8.075%, (SOFR + 3.75%), 1/30/32 |
|
225
|
225,000
|
| Gray
Television, Inc., Term Loan, 7.437%, (SOFR + 3.00%), 12/1/28 |
|
919
|
844,431
|
| Hubbard
Radio LLC, Term Loan, 8.825%, (SOFR + 4.50%), 9/30/27 |
|
538
|
374,087
|
| iHeartCommunications,
Inc., Term Loan, 10.209%, (SOFR + 5.78%), 5/1/29 |
|
420
|
342,733
|
| MJH
Healthcare Holdings LLC, Term Loan, 7.675%, (SOFR + 3.25%), 1/28/29 |
|
490
|
488,068
|
| |
|
|
$ 4,875,713
|
| Metals/Mining
— 0.5% |
| AAP
Buyer, Inc., Term Loan, 7.075%, (SOFR + 2.75%), 9/9/31 |
|
474
|
$
472,629 |
| American
Consolidated Natural Resources, Inc., Term Loan - Second Lien, 13.00%, 12/11/29(23) |
|
416
|
408,484
|
| Arsenal
AIC Parent LLC, Term Loan, 7.075%, (SOFR + 2.75%), 8/19/30 |
|
739
|
734,747
|
| Minerals
Technologies, Inc., Term Loan, 6.322%, (SOFR + 2.00%), 11/26/31 |
|
524
|
523,688
|
| Borrower/Description
|
Principal
Amount*
(000's omitted) |
Value
|
| Metals/Mining
(continued) |
| Navoi
Mining & Metallurgical Co., Term Loan, 9.053%, (SOFR + 4.76%), 4/23/27 |
|
223
|
$
222,798 |
| Novelis
Corp., Term Loan, 6.292%, (SOFR + 2.00%), 3/11/32 |
|
950
|
950,199
|
| PMHC
II, Inc., Term Loan, 8.689%, (SOFR + 4.25%), 4/23/29 |
|
980
|
866,599
|
| WireCo
WorldGroup, Inc., Term Loan, 8.04%, (SOFR + 3.75%), 11/13/28 |
|
431
|
388,334
|
| Zekelman
Industries, Inc., Term Loan, 6.571%, (SOFR + 2.25%), 1/24/31 |
|
1,086
|
1,089,556
|
| |
|
|
$ 5,657,034
|
| Oil,
Gas & Consumable Fuels — 0.6% |
| Epic
Crude Services LP, Term Loan, 7.302%, (SOFR + 3.00%), 10/15/31 |
|
625
|
$
625,556 |
| Freeport
LNG Investments LLLP, Term Loan, 7.543%, (SOFR + 3.25%), 12/21/28 |
|
650
|
642,934
|
| Hilcorp
Energy I LP, Term Loan, 6.322%, (SOFR + 2.00%), 2/11/30 |
|
850
|
849,868
|
| ITT
Holdings LLC, Term Loan, 7.075%, (SOFR + 2.75%), 10/11/30 |
|
788
|
789,518
|
| Matador
Bidco SARL, Term Loan, 8.675%, (SOFR + 4.25%), 7/30/29 |
|
1,529
|
1,528,733
|
| Oryx
Midstream Services Permian Basin LLC, Term Loan, 6.569%, (SOFR + 2.25%), 10/5/28 |
|
1,011
|
1,010,917
|
| Oxbow
Carbon LLC, Term Loan, 7.825%, (SOFR + 3.50%), 5/10/30 |
|
487
|
487,135
|
| UGI
Energy Services LLC, Term Loan, 6.825%, (SOFR + 2.50%), 2/22/30 |
|
1,454
|
1,455,727
|
| |
|
|
$ 7,390,388
|
| Passenger
Airlines — 0.0%† |
| WestJet
Loyalty LP, Term Loan, 7.549%, (SOFR + 3.25%), 2/14/31 |
|
495
|
$
477,799 |
| |
|
|
$ 477,799
|
| Personal
Products — 0.1% |
| Rainbow
Finco SARL, Term Loan, 5.71%, (6 mo. EURIBOR + 3.25%), 2/23/29 |
EUR
|
1,000
|
$
1,076,191 |
| |
|
|
$ 1,076,191
|
| Pharmaceuticals
— 0.7% |
| AI
Sirona (Luxembourg) Acquisition SARL, Term Loan, 5.863%, (1 mo. EURIBOR + 3.50%), 9/30/28 |
EUR
|
1,000
|
$
1,083,078 |
| Bausch
Health Co., Inc., Term Loan, 9/25/30(21) |
|
850
|
819,188
|
| Ceva
Sante Animale: |
|
|
|
| Term
Loan, 5.355%, (3 mo. EURIBOR + 3.00%), 11/8/30 |
EUR
|
1,500
|
1,617,116
|
| Term
Loan, 7.065%, (SOFR + 2.75%), 11/8/30 |
|
396
|
395,348
|
| Jazz
Financing Lux SARL, Term Loan, 6.575%, (SOFR + 2.25%), 5/5/28 |
|
1,014
|
1,014,420
|
| Mallinckrodt
International Finance SA, Term Loan - Second Lien, 14.00%, (SOFR + 9.50%), 11/14/28 |
|
1,486
|
1,543,542
|
33
See Notes to Financial Statements.
Eaton Vance
Limited Duration Income Fund
March 31, 2025
Portfolio of
Investments — continued
| Borrower/Description
|
Principal
Amount*
(000's omitted) |
Value
|
| Pharmaceuticals
(continued) |
| Nidda
Healthcare Holding AG, Term Loan, 6.54%, (3 mo. EURIBOR + 4.00%), 2/21/30 |
EUR
|
750
|
$
812,710 |
| Recipharm
AB, Term Loan, 5.506%, (3 mo. EURIBOR + 2.95%), 2/17/28 |
EUR
|
1,000
|
1,066,313
|
| |
|
|
$ 8,351,715
|
| Professional
Services — 2.7% |
| AAL
Delaware Holdco, Inc., Term Loan, 7.075%, (SOFR + 2.75%), 7/30/31 |
|
697
|
$
692,371 |
| AlixPartners
LLP: |
|
|
|
| Term
Loan, 5.355%, (3 mo. EURIBOR + 3.00%), 2/4/28 |
EUR
|
960
|
1,039,127
|
| Term
Loan, 6.939%, (SOFR + 2.50%), 2/4/28 |
|
1,908
|
1,909,340
|
| Amspec
Parent LLC: |
|
|
|
| Term
Loan, 1.00%, 12/22/31(20) |
|
123
|
123,411
|
| Term
Loan, 8.549%, (SOFR + 4.25%), 12/22/31 |
|
802
|
802,172
|
| APFS
Staffing Holdings, Inc., Term Loan, 8.575%, (SOFR + 4.25%), 12/29/28 |
|
262
|
257,913
|
| Apleona
Holding GmbH, Term Loan, 5.312%, (3 mo. EURIBOR + 2.70%), 4/28/28 |
EUR
|
1,000
|
1,080,964
|
| Beauparc,
Term Loan, 8/24/28(21) |
EUR
|
750
|
809,795
|
| Camelot
U.S. Acquisition LLC, Term Loan, 7.075%, (SOFR + 2.75%), 1/31/31 |
|
2,086
|
2,059,992
|
| CoreLogic,
Inc., Term Loan, 7.939%, (SOFR + 3.50%), 6/2/28 |
|
2,021
|
1,987,056
|
| Corporation
Service Co., Term Loan, 6.325%, (SOFR + 2.00%), 11/2/29 |
|
261
|
260,148
|
| Crisis
Prevention Institute, Inc., Term Loan, 8.299%, (SOFR + 4.00%), 4/9/31 |
|
324
|
325,134
|
| Deerfield
Dakota Holding LLC, Term Loan, 8.049%, (SOFR + 3.75%), 4/9/27 |
|
2,027
|
1,928,023
|
| EAB
Global, Inc., Term Loan, 7.325%, (SOFR + 3.00%), 8/16/30 |
|
223
|
216,346
|
| Employbridge
Holding Co.: |
|
|
|
| Term
Loan, 3.25%, 1/19/30(20) |
|
405
|
351,932
|
| Term
Loan, 9.799%, (SOFR + 5.50%), 1/19/30 |
|
968
|
840,458
|
| Term
Loan - Second Lien, 9.311%, (SOFR + 4.75%), 1/19/30 |
|
2,165
|
922,872
|
| First
Advantage Holdings LLC, Term Loan, 7.575%, (SOFR + 3.25%), 10/31/31 |
|
2,226
|
2,215,480
|
| Fleet
Midco I Ltd., Term Loan, 7.055%, (SOFR + 2.75%), 2/21/31 |
|
659
|
658,633
|
| Galaxy
Bidco Ltd., Term Loan, 6.708%, (3 mo. EURIBOR + 4.00%), 12/19/29 |
EUR
|
1,000
|
1,086,993
|
| Genuine
Financial Holdings LLC, Term Loan, 7.553%, (SOFR + 3.25%), 9/27/30 |
|
394
|
387,708
|
| Lernen
Bidco Ltd., Term Loan, 8.589%, (SOFR + 4.00%), 10/27/31 |
|
549
|
548,971
|
| Mermaid
Bidco, Inc.: |
|
|
|
| Term
Loan, 6.312%, (3 mo. EURIBOR + 3.75%), 7/3/31 |
EUR
|
1,000
|
1,087,609
|
| Term
Loan, 7.553%, (SOFR + 3.25%), 7/3/31 |
|
547
|
548,808
|
| Neptune
Bidco U.S., Inc., Term Loan, 9.389%, (SOFR + 5.00%), 4/11/29 |
|
1,867
|
1,614,449
|
| PHM
Group Holding OYJ, Term Loan, 7.421%, (3 mo. EURIBOR + 4.75%), 6/24/31 |
EUR
|
500
|
538,963
|
| Planet
U.S. Buyer LLC, Term Loan, 7.319%, (SOFR + 3.00%), 2/7/31 |
|
1,191
|
1,189,386
|
| Borrower/Description
|
Principal
Amount*
(000's omitted) |
Value
|
| Professional
Services (continued) |
| Saphilux
SARL, Term Loan, 6.694%, (6 mo. EURIBOR + 4.00%), 7/18/28 |
EUR
|
500
|
$
544,186 |
| Stepstone
Group Midco 2 GmbH: |
|
|
|
| Term
Loan, 12/4/31(21) |
EUR
|
500
|
539,258
|
| Term
Loan, 12/4/31(21) |
|
825
|
815,719
|
| Techem
Verwaltungsgesellschaft 675 GmbH, Term Loan, 6.027%, (3 mo. EURIBOR + 3.50%), 7/15/29 |
EUR
|
1,826
|
1,980,496
|
| Teneo
Holdings LLC, Term Loan, 9.075%, (SOFR + 4.75%), 3/13/31 |
|
1,238
|
1,242,625
|
| Tidal
Waste & Recycling Holdings LLC, Term Loan, 7.799%, (SOFR + 3.50%), 10/24/31 |
|
650
|
651,320
|
| Trans
Union LLC, Term Loan, 6.075%, (SOFR + 1.75%), 6/24/31 |
|
1,239
|
1,236,770
|
| Vaco
Holdings LLC, Term Loan, 9.449%, (SOFR + 5.00%), 1/21/29 |
|
266
|
246,584
|
| |
|
|
$ 32,741,012
|
| Real
Estate Management & Development — 0.5% |
| Cushman
& Wakefield U.S. Borrower LLC: |
|
|
|
| Term
Loan, 7.075%, (SOFR + 2.75%), 1/31/30 |
|
2,975
|
$
2,970,818 |
| Term
Loan, 7.575%, (SOFR + 3.25%), 1/31/30 |
|
1,199
|
1,199,010
|
| Greystar
Real Estate Partners LLC, Term Loan, 7.05%, (SOFR + 2.75%), 8/21/30 |
|
591
|
592,152
|
| Homeserve
USA Holding Corp., Term Loan, 6.319%, (SOFR + 2.00%), 10/21/30 |
|
891
|
883,680
|
| |
|
|
$ 5,645,660
|
| Road
& Rail — 0.3% |
| Hertz
Corp.: |
|
|
|
| Term
Loan, 7.939%, (SOFR + 3.50%), 6/30/28 |
|
1,012
|
$
785,286 |
| Term
Loan, 7.939%, (SOFR + 3.50%), 6/30/28 |
|
198
|
153,762
|
| Term
Loan, 8.072%, (SOFR + 3.75%), 6/30/28 |
|
716
|
554,494
|
| Kenan
Advantage Group, Inc., Term Loan, 7.575%, (SOFR + 3.25%), 1/25/29 |
|
2,161
|
2,154,860
|
| |
|
|
$ 3,648,402
|
| Semiconductors
& Semiconductor Equipment — 0.3% |
| Altar
Bidco, Inc., Term Loan, 7.247%, (SOFR + 3.10%), 2/1/29 |
|
1,240
|
$
1,225,877 |
| Bright
Bidco BV, Term Loan, 12.291%, (SOFR + 8.00%), 10/31/27 |
|
354
|
145,292
|
| MaxLinear,
Inc., Term Loan, 6.686%, (SOFR + 2.25%), 6/23/28 |
|
286
|
270,000
|
| MKS
Instruments, Inc., Term Loan, 4.873%, (1 mo. EURIBOR + 2.50%), 8/17/29 |
EUR
|
1,467
|
1,593,165
|
| |
|
|
$ 3,234,334
|
| Software
— 5.2% |
| Applied
Systems, Inc., Term Loan, 7.049%, (SOFR + 2.75%), 2/24/31 |
|
5,066
|
$
5,070,460 |
| Astra
Acquisition Corp.: |
|
|
|
| Term
Loan, 9.549%, (SOFR + 5.25%), 10/25/28 |
|
853
|
21,333
|
| Term
Loan, 11.049%, (SOFR + 6.75%), 2/25/28 |
|
609
|
379,864
|
| Term
Loan, 17.619%, (SOFR + 13.32%), 10/25/29 |
|
1,269
|
44,420
|
34
See Notes to Financial Statements.
Eaton Vance
Limited Duration Income Fund
March 31, 2025
Portfolio of
Investments — continued
| Borrower/Description
|
Principal
Amount*
(000's omitted) |
Value
|
| Software
(continued) |
| Boxer
Parent Co., Inc.: |
|
|
|
| Term
Loan, 6.112%, (3 mo. EURIBOR + 3.50%), 7/30/31 |
EUR
|
481
|
$ 519,028
|
| Term
Loan, 7.291%, (SOFR + 3.00%), 7/30/31 |
|
2,967
|
2,919,202
|
| Cegid
Group SAS, Term Loan, 5.862%, (3 mo. EURIBOR + 3.25%), 7/10/28 |
EUR
|
1,000
|
1,079,613
|
| Central
Parent, Inc., Term Loan, 7.549%, (SOFR + 3.25%), 7/6/29 |
|
2,247
|
1,934,925
|
| Cloud
Software Group, Inc., Term Loan, 7.799%, (SOFR + 3.50%), 3/30/29 |
|
1,098
|
1,088,882
|
| Cloudera,
Inc.: |
|
|
|
| Term
Loan, 8.175%, (SOFR + 3.75%), 10/8/28 |
|
3,780
|
3,735,299
|
| Term
Loan - Second Lien, 10.425%, (SOFR + 6.00%), 10/8/29 |
|
775
|
740,450
|
| Clover
Holdings SPV III LLC, Term Loan, 15.00%, 12/9/27(23) |
|
256
|
261,269
|
| Constant
Contact, Inc., Term Loan, 8.564%, (SOFR + 4.00%), 2/10/28 |
|
1,697
|
1,589,550
|
| Cornerstone
OnDemand, Inc., Term Loan, 8.189%, (SOFR + 3.75%), 10/16/28 |
|
1,310
|
1,140,902
|
| Dragon
Buyer, Inc., Term Loan, 7.299%, (SOFR + 3.00%), 9/30/31 |
|
1,421
|
1,412,554
|
| Drake
Software LLC, Term Loan, 8.549%, (SOFR + 4.25%), 6/26/31 |
|
2,040
|
1,970,836
|
| ECI
Macola Max Holding LLC, Term Loan, 7.549%, (SOFR + 3.25%), 5/9/30 |
|
1,395
|
1,397,001
|
| Ellucian
Holdings, Inc., Term Loan, 7.325%, (SOFR + 3.00%), 10/9/29 |
|
312
|
312,297
|
| Epicor
Software Corp., Term Loan, 7.075%, (SOFR + 2.75%), 5/30/31 |
|
2,314
|
2,310,767
|
| Fiserv
Investment Solutions, Inc., Term Loan, 8.322%, (SOFR + 4.00%), 2/18/27 |
|
500
|
498,187
|
| GoTo
Group, Inc.: |
|
|
|
| Term
Loan, 9.189%, (SOFR + 4.75%), 4/28/28 |
|
940
|
875,324
|
| Term
Loan - Second Lien, 9.189%, (SOFR + 4.75%), 4/28/28 |
|
591
|
277,604
|
| IGT
Holding IV AB, Term Loan, 5.505%, (3 mo. EURIBOR + 3.15%), 3/31/28 |
EUR
|
1,000
|
1,079,656
|
| iSolved,
Inc., Term Loan, 7.575%, (SOFR + 3.25%), 10/15/30 |
|
495
|
496,261
|
| Ivanti
Software, Inc., Term Loan, 8.817%, (SOFR + 4.25%), 12/1/27 |
|
1,423
|
1,028,839
|
| Marcel
LUX IV SARL: |
|
|
|
| Term
Loan, 6.356%, (3 mo. EURIBOR + 3.75%), 11/9/30 |
EUR
|
1,500
|
1,629,767
|
| Term
Loan, 7.84%, (SOFR + 3.50%), 11/9/30 |
|
1,219
|
1,223,453
|
| McAfee
LLC: |
|
|
|
| Term
Loan, 6.112%, (3 mo. EURIBOR + 3.50%), 3/1/29 |
EUR
|
975
|
1,032,599
|
| Term
Loan, 7.323%, (SOFR + 3.00%), 3/1/29 |
|
2,737
|
2,619,560
|
| Mosel
Bidco SE, Term Loan, 6.105%, (3 mo. EURIBOR + 3.75%), 9/16/30 |
EUR
|
750
|
812,556
|
| OceanKey
(U.S.) II Corp., Term Loan, 7.925%, (SOFR + 3.50%), 12/15/28 |
|
1,579
|
1,577,441
|
| Open
Text Corp., Term Loan, 6.075%, (SOFR + 1.75%), 1/31/30 |
|
842
|
840,616
|
| Polaris
Newco LLC: |
|
|
|
| Term
Loan, 6.113%, (1 mo. EURIBOR + 3.75%), 6/2/28 |
EUR
|
965
|
982,438
|
| Borrower/Description
|
Principal
Amount*
(000's omitted) |
Value
|
| Software
(continued) |
| Polaris
Newco LLC: (continued) |
|
|
|
| Term
Loan, 8.302%, (SOFR + 3.75%), 6/2/28 |
|
2,751
|
$
2,640,209 |
| Project
Boost Purchaser LLC: |
|
|
|
| Term
Loan, 7.299%, (SOFR + 3.00%), 7/16/31 |
|
848
|
844,098
|
| Term
Loan - Second Lien, 9.549%, (SOFR + 5.25%), 7/16/32 |
|
375
|
375,937
|
| Proofpoint,
Inc., Term Loan, 7.325%, (SOFR + 3.00%), 8/31/28 |
|
2,419
|
2,414,401
|
| Quartz
Acquireco LLC, Term Loan, 6.549%, (SOFR + 2.25%), 6/28/30 |
|
739
|
735,056
|
| Quest
Software U.S. Holdings, Inc., Term Loan, 8.691%, (SOFR + 4.25%), 2/1/29 |
|
982
|
589,421
|
| Questel
Unite SAS, Term Loan, 6.355%, (3 mo. EURIBOR + 4.00%), 3/5/32 |
EUR
|
500
|
541,158
|
| RealPage,
Inc.: |
|
|
|
| Term
Loan, 7.561%, (SOFR + 3.00%), 4/24/28 |
|
2,774
|
2,741,263
|
| Term
Loan, 8.049%, (SOFR + 3.75%), 4/24/28 |
|
450
|
450,844
|
| Sabre
GLBL, Inc.: |
|
|
|
| Term
Loan, 8.675%, (SOFR + 4.25%), 6/30/28 |
|
166
|
161,683
|
| Term
Loan, 10.425%, (SOFR + 6.00%), 11/15/29 |
|
931
|
914,264
|
| SolarWinds
Holdings, Inc., Term Loan, 7.075%, (SOFR + 2.75%), 2/5/30 |
|
1,808
|
1,809,988
|
| Twitter,
Inc., Term Loan, 10/26/29(21) |
|
500
|
497,500
|
| UKG,
Inc., Term Loan, 7.30%, (SOFR + 3.00%), 2/10/31 |
|
4,203
|
4,198,385
|
| Veritas
U.S., Inc., Term Loan, 16.799%, (SOFR + 12.50%), 12/9/29 |
|
773
|
776,718
|
| Vision
Solutions, Inc., Term Loan, 8.552%, (SOFR + 4.00%), 4/24/28 |
|
411
|
397,605
|
| |
|
|
$ 62,991,483
|
| Specialty
Retail — 1.3% |
| Applegreen
Ireland, Term Loan, 7.363%, (1 mo. EURIBOR + 5.00%), 1/30/32 |
EUR
|
500
|
$
544,705 |
| Apro
LLC, Term Loan, 8.049%, (SOFR + 3.75%), 7/9/31 |
|
597
|
595,884
|
| Boels
Topholding BV, Term Loan, 5.196%, (1 mo. EURIBOR + 2.75%), 5/23/31 |
EUR
|
862
|
931,735
|
| EG
Group Ltd., Term Loan, 6.855%, (3 mo. EURIBOR + 4.50%), 2/7/28 |
EUR
|
438
|
474,786
|
| Etraveli
Holding AB, Term Loan, 6.355%, (3 mo. EURIBOR + 4.00%), 11/2/28 |
EUR
|
937
|
1,018,615
|
| Great
Outdoors Group LLC, Term Loan, 7.575%, (SOFR + 3.25%), 1/23/32 |
|
2,347
|
2,344,662
|
| Harbor
Freight Tools USA, Inc., Term Loan, 6.825%, (SOFR + 2.50%), 6/11/31 |
|
2,338
|
2,284,049
|
| Hoya
Midco LLC, Term Loan, 6.553%, (SOFR + 2.25%), 2/3/29 |
|
973
|
961,076
|
| Les
Schwab Tire Centers, Term Loan, 6.814%, (SOFR + 2.50%), 4/23/31(22) |
|
3,292
|
3,273,238
|
| PetSmart,
Inc., Term Loan, 8.175%, (SOFR + 3.75%), 2/11/28 |
|
1,279
|
1,261,306
|
| Speedster
Bidco GmbH: |
|
|
|
| Term
Loan, 6.129%, (6 mo. EURIBOR + 3.75%), 12/10/31 |
EUR
|
1,000
|
1,084,208
|
| Term
Loan, 7.549%, (SOFR + 3.25%), 12/10/31 |
|
850
|
849,868
|
| |
|
|
$ 15,624,132
|
35
See Notes to Financial Statements.
Eaton Vance
Limited Duration Income Fund
March 31, 2025
Portfolio of
Investments — continued
| Borrower/Description
|
Principal
Amount*
(000's omitted) |
Value
|
| Technology
Hardware, Storage & Peripherals — 0.0%† |
| Poseidon
Bidco SASU, Term Loan, 7.355%, (3 mo. EURIBOR + 5.00%), 3/13/30 |
EUR
|
750
|
$
573,396 |
| |
|
|
$ 573,396
|
| Trading
Companies & Distributors — 1.5% |
| American
Builders & Contractors Supply Co., Inc., Term Loan, 6.075%, (SOFR + 1.75%), 1/31/31 |
|
2,322
|
$
2,322,288 |
| Beacon
Roofing Supply, Inc., Term Loan, 6.325%, (SOFR + 2.00%), 5/19/28 |
|
543
|
543,147
|
| Core
& Main LP, Term Loan, 6.27%, (SOFR + 2.00%), 2/9/31 |
|
371
|
370,910
|
| DXP
Enterprises, Inc., Term Loan, 8.075%, (SOFR + 3.75%), 10/11/30 |
|
665
|
664,699
|
| Foundation
Building Materials Holding Co. LLC, Term Loan, 8.552%, (SOFR + 4.00%), 1/29/31 |
|
1,238
|
1,132,572
|
| Patagonia
Bidco Ltd., Term Loan, 9.954%, (SONIA + 5.25%), 11/1/28 |
GBP
|
1,000
|
1,171,319
|
| PEARLS
(Netherlands) Bidco BV, Term Loan, 6.025%, (3 mo. EURIBOR + 3.50%), 2/26/29 |
EUR
|
1,000
|
1,075,812
|
| Quimper
AB, Term Loan, 6.428%, (3 mo. EURIBOR + 3.75%), 3/15/30 |
EUR
|
1,875
|
2,035,192
|
| Ramudden
Global Group GmbH, Term Loan, 6.891%, (1 mo. EURIBOR + 4.25%), 12/10/29 |
EUR
|
1,000
|
1,075,590
|
| Spin
Holdco, Inc., Term Loan, 8.562%, (SOFR + 4.00%), 3/4/28 |
|
3,744
|
3,180,079
|
| White
Cap Buyer LLC, Term Loan, 7.575%, (SOFR + 3.25%), 10/19/29 |
|
3,419
|
3,322,685
|
| Windsor
Holdings III LLC: |
|
|
|
| Term
Loan, 5.123%, (1 mo. EURIBOR + 2.75%), 8/1/30 |
EUR
|
500
|
536,306
|
| Term
Loan, 7.069%, (SOFR + 2.75%), 8/1/30 |
|
1,133
|
1,123,475
|
| |
|
|
$ 18,554,074
|
| Transportation
Infrastructure — 0.0%† |
| Brown
Group Holding LLC: |
|
|
|
| Term
Loan, 6.806%, (SOFR + 2.50%), 7/1/31(22) |
|
245
|
$
243,841 |
| Term
Loan, 6.825%, (SOFR + 2.50%), 7/1/31 |
|
217
|
216,328
|
| KKR
Apple Bidco LLC, Term Loan, 6.825%, (SOFR + 2.50%), 9/23/31 |
|
169
|
168,293
|
| |
|
|
$ 628,462
|
| Wireless
Telecommunication Services — 0.4% |
| CCI
Buyer, Inc., Term Loan, 8.299%, (SOFR + 4.00%), 12/17/27 |
|
444
|
$
445,018 |
| Digicel
International Finance Ltd., Term Loan, 11.791%, (SOFR + 7.50%), 5/25/27 |
|
5,045
|
4,975,224
|
| |
|
|
$ 5,420,242
|
Total
Senior Floating-Rate Loans
(identified cost $569,608,475) |
|
|
$ 550,900,389
|
| Sovereign
Government Bonds — 4.1% |
| Security
|
Principal
Amount*
(000's omitted) |
Value
|
| Albania
— 0.0%† |
| Albania
Government International Bonds: |
|
|
|
| 3.50%,
11/23/31(14) |
EUR
|
300
|
$
307,298 |
| 4.75%,
2/14/35(14) |
EUR
|
221
|
231,036
|
| |
|
|
$ 538,334
|
| Angola
— 0.0%† |
| Angola
Government International Bonds: |
|
|
|
| 8.75%,
4/14/32(14) |
|
250
|
$
215,594 |
| 9.125%,
11/26/49(14) |
|
200
|
154,740
|
| |
|
|
$ 370,334
|
| Argentina
— 0.1% |
| Argentina
Republic Government International Bonds: |
|
|
|
| 0.75%
to 7/9/27, 7/9/30(3) |
|
387
|
$
283,624 |
| 1.00%,
7/9/29 |
|
90
|
69,975
|
| 3.50%
to 7/9/29, 7/9/41(3) |
|
200
|
116,007
|
| 4.125%
to 7/9/27, 7/9/35(3) |
|
600
|
376,396
|
| 5.00%,
1/9/38 |
|
500
|
330,042
|
| |
|
|
$ 1,176,044
|
| Armenia
— 0.0%† |
| Republic
of Armenia International Bonds, 6.75%, 3/12/35(14) |
|
306
|
$
294,958 |
| |
|
|
$ 294,958
|
| Azerbaijan
— 0.0%† |
| Republic
of Azerbaijan International Bonds, 3.50%, 9/1/32(14) |
|
240
|
$
210,814 |
| |
|
|
$ 210,814
|
| Bahamas
— 0.0%† |
| Bahamas
Government International Bonds: |
|
|
|
| 6.95%,
11/20/29(14) |
|
8
|
$
7,720 |
| 8.95%,
10/15/32(14) |
|
200
|
207,250
|
| |
|
|
$ 214,970
|
| Barbados
— 0.0%† |
| Barbados
Government International Bonds, 6.50%, 10/1/29(1)(14) |
|
400
|
$
386,231 |
| |
|
|
$ 386,231
|
| Benin
— 0.1% |
| Benin
Government International Bonds: |
|
|
|
| 4.875%,
1/19/32(14) |
EUR
|
152
|
$
146,350 |
| 4.95%,
1/22/35(14) |
EUR
|
430
|
383,589
|
| 6.875%,
1/19/52(14) |
EUR
|
500
|
435,183
|
| 7.96%,
2/13/38(14) |
|
200
|
187,271
|
| 8.375%,
1/23/41(14) |
|
200
|
190,362
|
| |
|
|
$ 1,342,755
|
36
See Notes to Financial Statements.
Eaton Vance
Limited Duration Income Fund
March 31, 2025
Portfolio of
Investments — continued
| Security
|
Principal
Amount*
(000's omitted) |
Value
|
| Brazil
— 0.1% |
| Brazil
Government International Bonds: |
|
|
|
| 3.875%,
6/12/30 |
|
371
|
$
343,639 |
| 4.625%,
1/13/28 |
|
500
|
493,727
|
| 5.00%,
1/27/45 |
|
600
|
455,880
|
| |
|
|
$ 1,293,246
|
| Bulgaria
— 0.0%† |
| Bulgaria
Government International Bonds, 5.00%, 3/5/37(14) |
|
120
|
$
116,192 |
| |
|
|
$ 116,192
|
| Cameroon
— 0.2% |
| Republic
of Cameroon International Bonds: |
|
|
|
| 5.95%,
7/7/32(14) |
EUR
|
500
|
$
426,686 |
| 9.50%,
7/31/31(14) |
|
1,477
|
1,389,063
|
| |
|
|
$ 1,815,749
|
| Chile
— 0.1% |
| Chile
Government International Bonds: |
|
|
|
| 2.45%,
1/31/31 |
|
200
|
$
175,720 |
| 2.55%,
7/27/33 |
|
1,000
|
830,200
|
| 3.50%,
1/25/50 |
|
500
|
354,425
|
| |
|
|
$ 1,360,345
|
| Colombia
— 0.1% |
| Colombia
Government International Bonds: |
|
|
|
| 3.25%,
4/22/32 |
|
600
|
$
467,610 |
| 4.125%,
5/15/51 |
|
430
|
244,939
|
| |
|
|
$ 712,549
|
| Costa
Rica — 0.1% |
| Costa
Rica Government International Bonds, 6.55%, 4/3/34(14) |
|
660
|
$
677,902 |
| |
|
|
$ 677,902
|
| Dominican
Republic — 0.1% |
| Dominican
Republic International Bonds: |
|
|
|
| 4.50%,
1/30/30(14) |
|
450
|
$
421,987 |
| 4.875%,
9/23/32(14) |
|
530
|
482,406
|
| 5.30%,
1/21/41(14) |
|
150
|
126,548
|
| 5.95%,
1/25/27(14) |
|
100
|
100,570
|
| 6.85%,
1/27/45(14) |
|
250
|
246,575
|
| 7.45%,
4/30/44(14) |
|
300
|
314,940
|
| |
|
|
$ 1,693,026
|
| Ecuador
— 0.1% |
| Ecuador
Government International Bonds: |
|
|
|
| 0.00%,
7/31/30(14) |
|
400
|
$
193,034 |
| 5.00%,
7/31/40(14) |
|
383
|
142,764
|
| 6.90%,
7/31/30(14) |
|
530
|
316,032
|
| |
|
|
$ 651,830
|
| Egypt
— 0.2% |
| Egypt
Government International Bonds: |
|
|
|
| 5.625%,
4/16/30(14) |
EUR
|
200
|
$
183,491 |
| 6.375%,
4/11/31(14) |
EUR
|
400
|
368,083
|
| Security
|
Principal
Amount*
(000's omitted) |
Value
|
| Egypt
(continued) |
| Egypt
Government International Bonds: (continued) |
|
|
|
| 7.053%,
1/15/32(14) |
|
442
|
$
373,521 |
| 7.625%,
5/29/32(14) |
|
200
|
173,080
|
| 7.903%,
2/21/48(14) |
|
372
|
266,809
|
| 8.50%,
1/31/47(14) |
|
278
|
211,213
|
| 8.625%,
2/4/30(14) |
|
314
|
304,374
|
| 8.875%,
5/29/50(14) |
|
780
|
606,758
|
| |
|
|
$ 2,487,329
|
| El
Salvador — 0.0%† |
| El
Salvador Government International Bonds: |
|
|
|
| 8.25%,
4/10/32(14) |
|
230
|
$
226,277 |
| 9.65%,
11/21/54(1) |
|
252
|
253,064
|
| |
|
|
$ 479,341
|
| Ethiopia
— 0.1% |
| Ethiopia
International Bonds, 6.625%, 12/11/24(14)(18) |
|
1,854
|
$
1,594,440 |
| |
|
|
$ 1,594,440
|
| Gabon
— 0.0%† |
| Gabon
Government International Bonds, 6.625%, 2/6/31(14) |
|
200
|
$
156,860 |
| |
|
|
$ 156,860
|
| Ghana
— 0.1% |
| Ghana
Government International Bonds: |
|
|
|
| 0.00%,
1/3/30(14) |
|
58
|
$
44,890 |
| 1.50%,
1/3/37(14) |
|
88
|
36,787
|
| 5.00%
to 7/3/28, 7/3/29(3)(14) |
|
390
|
341,125
|
| 5.00%
to 7/3/28, 7/3/35(3)(14) |
|
1,120
|
798,365
|
| |
|
|
$ 1,221,167
|
| Guatemala
— 0.1% |
| Guatemala
Government Bonds: |
|
|
|
| 5.375%,
4/24/32(14) |
|
538
|
$
518,363 |
| 6.55%,
2/6/37(14) |
|
200
|
199,202
|
| |
|
|
$ 717,565
|
| Honduras
— 0.0%† |
| Honduras
Government International Bonds, 8.625%, 11/27/34(1)(14) |
|
300
|
$
297,825 |
| |
|
|
$ 297,825
|
| Hungary
— 0.1% |
| Hungary
Government International Bonds: |
|
|
|
| 2.125%,
9/22/31(14) |
|
400
|
$
325,531 |
| 5.50%,
3/26/36(14) |
|
200
|
191,552
|
| 6.25%,
9/22/32(1)(14) |
|
1,100
|
1,135,274
|
| |
|
|
$ 1,652,357
|
| India
— 0.1% |
| Export-Import
Bank of India: |
|
|
|
| 2.25%,
1/13/31(14) |
|
600
|
$
516,559 |
| 5.50%,
1/18/33(1) |
|
230
|
234,082
|
| |
|
|
$ 750,641
|
37
See Notes to Financial Statements.
Eaton Vance
Limited Duration Income Fund
March 31, 2025
Portfolio of
Investments — continued
| Security
|
Principal
Amount*
(000's omitted) |
Value
|
| Iraq
— 0.0%† |
| Iraq
International Bonds, 5.80%, 1/15/28(14) |
|
94
|
$
92,096 |
| |
|
|
$ 92,096
|
| Ivory
Coast — 0.1% |
| Ivory
Coast Government International Bonds: |
|
|
|
| 6.625%,
3/22/48(14) |
EUR
|
662
|
$
560,033 |
| 8.075%,
4/1/36(6)(14) |
|
725
|
694,740
|
| |
|
|
$ 1,254,773
|
| Kenya
— 0.0%† |
| Republic
of Kenya Government International Bonds: |
|
|
|
| 8.00%,
5/22/32(14) |
|
200
|
$
179,958 |
| 8.25%,
2/28/48(14) |
|
200
|
158,620
|
| |
|
|
$ 338,578
|
| Kuwait
— 0.0%† |
| Kuwait
International Government Bonds, 3.50%, 3/20/27(14) |
|
247
|
$
242,446 |
| |
|
|
$ 242,446
|
| Lebanon
— 0.1% |
| Lebanon
Government International Bonds: |
|
|
|
| 5.80%,
4/14/49(14)(18) |
|
64
|
$
10,270 |
| 6.00%,
1/27/23(14)(18) |
|
231
|
37,003
|
| 6.10%,
10/4/22(14)(18) |
|
752
|
121,053
|
| 6.15%,
6/19/49(14)(18) |
|
647
|
101,818
|
| 6.20%,
2/26/25(14)(18) |
|
16
|
2,629
|
| 6.25%,
5/27/22(14)(18) |
|
31
|
4,983
|
| 6.25%,
11/4/24(14)(18) |
|
32
|
5,084
|
| 6.25%,
6/12/25(14)(18) |
|
64
|
10,352
|
| 6.375%,
3/9/20(14)(18) |
|
1,360
|
215,883
|
| 6.40%,
5/26/23(14)(18) |
|
817
|
153,698
|
| 6.65%,
4/22/24(14)(18) |
|
154
|
24,987
|
| 6.65%,
2/26/30(14)(18) |
|
17
|
2,731
|
| 6.75%,
11/29/27(14)(18) |
|
18
|
2,895
|
| 6.85%,
3/23/27(14)(18) |
|
18
|
2,898
|
| 6.85%,
5/25/29(14)(18) |
|
243
|
38,960
|
| 7.00%,
3/20/28(14)(18) |
|
31
|
5,000
|
| 7.00%,
4/22/31(14)(18) |
|
283
|
45,391
|
| 7.00%,
3/23/32(14)(18) |
|
46
|
7,432
|
| 7.25%,
3/23/37(14)(18) |
|
60
|
9,670
|
| 8.25%,
4/12/21(14)(18) |
|
617
|
99,993
|
| |
|
|
$ 902,730
|
| Mexico
— 0.1% |
| Mexico
Government International Bonds: |
|
|
|
| 4.875%,
5/19/33 |
|
600
|
$
551,676 |
| 5.00%,
4/27/51 |
|
300
|
230,722
|
| |
|
|
$ 782,398
|
| Montenegro
— 0.1% |
| Montenegro
Government International Bonds: |
|
|
|
| 2.875%,
12/16/27(14) |
EUR
|
100
|
$
104,422 |
| 4.875%,
4/1/32(6)(14) |
EUR
|
829
|
878,982
|
| 7.25%,
3/12/31(14) |
|
515
|
528,541
|
| |
|
|
$ 1,511,945
|
| Security
|
Principal
Amount*
(000's omitted) |
Value
|
| Morocco
— 0.0%† |
| Morocco
Government International Bonds, 3.00%, 12/15/32(14) |
|
365
|
$
303,160 |
| |
|
|
$ 303,160
|
| Nigeria
— 0.1% |
| Nigeria
Government International Bonds: |
|
|
|
| 7.696%,
2/23/38(14) |
|
300
|
$
243,188 |
| 10.375%,
12/9/34(14) |
|
520
|
522,844
|
| |
|
|
$ 766,032
|
| Oman
— 0.2% |
| Oman
Government International Bonds: |
|
|
|
| 5.375%,
3/8/27(14) |
|
200
|
$
201,106 |
| 6.00%,
8/1/29(14) |
|
200
|
205,564
|
| 6.25%,
1/25/31(14) |
|
483
|
502,595
|
| 6.75%,
1/17/48(14) |
|
230
|
238,090
|
| 7.375%,
10/28/32(14) |
|
650
|
722,082
|
| |
|
|
$ 1,869,437
|
| Pakistan
— 0.0%† |
| Pakistan
Government International Bonds: |
|
|
|
| 6.875%,
12/5/27(14) |
|
200
|
$
182,741 |
| 7.375%,
4/8/31(14) |
|
200
|
170,707
|
| |
|
|
$ 353,448
|
| Paraguay
— 0.1% |
| Paraguay
Government International Bonds, 4.95%, 4/28/31(14) |
|
577
|
$
560,394 |
| |
|
|
$ 560,394
|
| Peru
— 0.1% |
| Peru
Government International Bonds: |
|
|
|
| 2.783%,
1/23/31 |
|
700
|
$
615,405 |
| 3.00%,
1/15/34 |
|
450
|
374,386
|
| 3.30%,
3/11/41 |
|
447
|
328,545
|
| |
|
|
$ 1,318,336
|
| Philippines
— 0.1% |
| Philippines
Government International Bonds: |
|
|
|
| 4.75%,
3/5/35 |
|
400
|
$
388,674 |
| 5.00%,
7/17/33 |
|
1,100
|
1,092,864
|
| 5.50%,
1/17/48 |
|
290
|
285,235
|
| |
|
|
$ 1,766,773
|
| Serbia
— 0.0%† |
| Serbia
International Bonds, 2.125%, 12/1/30(14) |
|
450
|
$
371,420 |
| |
|
|
$ 371,420
|
| Sri
Lanka — 0.2% |
| Sri
Lanka Government International Bonds: |
|
|
|
| 3.10%
to 7/15/27, 1/15/30(1)(3) |
|
359
|
$
318,913 |
| 3.35%
to 9/15/27, 3/15/33(1)(3) |
|
704
|
556,039
|
| 3.60%
to 12/15/27, 6/15/35(1)(3) |
|
475
|
324,364
|
| 3.60%
to 11/15/27, 5/15/36(1)(3) |
|
330
|
258,512
|
| 3.60%
to 8/15/27, 2/15/38(1)(3) |
|
660
|
522,193
|
38
See Notes to Financial Statements.
Eaton Vance
Limited Duration Income Fund
March 31, 2025
Portfolio of
Investments — continued
| Security
|
Principal
Amount*
(000's omitted) |
Value
|
| Sri
Lanka (continued) |
Sri
Lanka Government International Bonds:
(continued) |
|
|
|
| 4.00%,
4/15/28(1) |
|
430
|
$
405,785 |
| |
|
|
$ 2,385,806
|
| Suriname
— 0.2% |
| Suriname
Government International Bonds: |
|
|
|
| 0.00%,
Oil-Linked, 12/31/50(1) |
|
894
|
$
948,534 |
| 7.95%,
(4.95% cash and 3.00% PIK), 7/15/33(1) |
|
1,302
|
1,243,305
|
| |
|
|
$ 2,191,839
|
| Trinidad
and Tobago — 0.0%† |
| Trinidad
& Tobago Government International Bonds, 5.95%, 1/14/31(14) |
|
300
|
$
293,475 |
| |
|
|
$ 293,475
|
| Tunisia
— 0.1% |
| Tunisian
Republic, 6.375%, 7/15/26(14) |
EUR
|
556
|
$
579,348 |
| |
|
|
$ 579,348
|
| Turkey
— 0.2% |
| Turkiye
Government International Bonds: |
|
|
|
| 4.25%,
4/14/26 |
|
200
|
$
197,580 |
| 4.875%,
4/16/43 |
|
200
|
139,691
|
| 5.25%,
3/13/30 |
|
230
|
214,225
|
| 5.75%,
5/11/47 |
|
200
|
149,888
|
| 6.125%,
10/24/28 |
|
370
|
366,698
|
| 6.50%,
1/3/35 |
|
380
|
353,961
|
| 7.625%,
5/15/34 |
|
360
|
363,254
|
| |
|
|
$ 1,785,297
|
| Ukraine
— 0.2% |
| Ukraine
Government International Bonds: |
|
|
|
| 0.00%,
GDP-Linked, 8/1/41(14)(24) |
|
1,970
|
$
1,429,899 |
| 0.00%
to 2/1/27, 2/1/30(3)(14) |
|
17
|
8,735
|
| 0.00%
to 2/1/27, 2/1/34(3)(14) |
|
250
|
99,141
|
| 0.00%
to 2/1/27, 2/1/35(3)(14) |
|
490
|
271,276
|
| 0.00%
to 2/1/27, 2/1/36(3)(14) |
|
614
|
351,473
|
| 1.75%
to 8/1/25, 2/1/29(3)(14) |
|
157
|
102,219
|
| 1.75%
to 8/1/25, 2/1/34(3)(14) |
|
448
|
239,870
|
| 1.75%
to 8/1/25, 2/1/35(3)(14) |
|
283
|
148,844
|
| 1.75%
to 8/1/25, 2/1/36(3)(14) |
|
250
|
130,692
|
| |
|
|
$ 2,782,149
|
| United
Arab Emirates — 0.2% |
| Abu
Dhabi Government International Bonds: |
|
|
|
| 3.125%,
4/16/30(14) |
|
570
|
$
540,205 |
| 3.875%,
4/16/50(14) |
|
910
|
710,914
|
| 5.00%,
4/30/34(14) |
|
700
|
718,640
|
| |
|
|
$ 1,969,759
|
| Uruguay
— 0.1% |
| Uruguay
Government International Bonds: |
|
|
|
| 5.10%,
6/18/50 |
|
300
|
$
278,625 |
| 5.442%,
2/14/37 |
|
700
|
708,120
|
| Security
|
Principal
Amount*
(000's omitted) |
Value
|
| Uruguay
(continued) |
Uruguay
Government International Bonds:
(continued) |
|
|
|
| 5.75%,
10/28/34 |
|
250
|
$
260,625 |
| |
|
|
$ 1,247,370
|
| Uzbekistan
— 0.1% |
| National
Bank of Uzbekistan, 8.50%, 7/5/29(14) |
|
490
|
$
507,154 |
| Republic
of Uzbekistan International Bonds, 5.375%, 2/20/29(14) |
|
300
|
286,918
|
| |
|
|
$ 794,072
|
| Venezuela
— 0.1% |
| Venezuela
Government International Bonds: |
|
|
|
| 6.00%,
12/9/20(14)(18) |
|
387
|
$
60,256 |
| 7.00%,
12/1/18(14)(18) |
|
108
|
17,253
|
| 7.00%,
3/31/38(14)(18) |
|
174
|
32,599
|
| 7.65%,
4/21/25(14)(18) |
|
493
|
88,324
|
| 7.75%,
10/13/19(14)(18) |
|
452
|
75,377
|
| 8.25%,
10/13/24(14)(18) |
|
748
|
134,712
|
| 9.00%,
5/7/23(14)(18) |
|
260
|
46,913
|
| 9.25%,
9/15/27(18) |
|
699
|
146,781
|
| 9.25%,
5/7/28(14)(18) |
|
535
|
103,094
|
| 9.375%,
1/13/34(18) |
|
81
|
18,630
|
| 11.75%,
10/21/26(14)(18) |
|
206
|
43,470
|
| 11.95%,
8/5/31(14)(18) |
|
214
|
43,894
|
| 12.75%,
8/23/22(14)(18) |
|
398
|
80,589
|
| |
|
|
$ 891,892
|
| Zambia
— 0.0%† |
| Zambia
Government International Bonds: |
|
|
|
| 0.50%,
12/31/53(14) |
|
67
|
$
41,028 |
| 5.75%
to 6/30/31, 6/30/33(3)(14) |
|
113
|
99,408
|
| |
|
|
$ 140,436
|
Total
Sovereign Government Bonds
(identified cost $49,606,499) |
|
|
$ 49,708,213
|
| Borrower/Description
|
Principal
Amount*
(000's omitted) |
Value
|
| Argentina
— 0.0%† |
| Provincia
De Neuquen, Term Loan, 11.742%, (SOFR + 7.30%), 5/28/27 |
|
164
|
$
165,954 |
| |
|
|
$ 165,954
|
| Bahamas
— 0.1% |
| Commonwealth
of Bahamas, Term Loan, 9.447%, (3 mo. EURIBOR + 6.85%), 11/24/28(2) |
EUR
|
660
|
$
728,859 |
| |
|
|
$ 728,859
|
39
See Notes to Financial Statements.
Eaton Vance
Limited Duration Income Fund
March 31, 2025
Portfolio of
Investments — continued
| Borrower/Description
|
Principal
Amount*
(000's omitted) |
Value
|
| Kenya
— 0.0%† |
| Government
of Kenya, Term Loan, 11.163%, (6 mo. SOFR + 6.45%), 6/29/25(2) |
|
312
|
$
316,425 |
| |
|
|
$ 316,425
|
| Tanzania
— 0.2% |
| Government
of the United Republic of Tanzania, Term Loan, 11.176%, (6 mo. SOFR + 6.30%), 4/28/31(2) |
|
2,531
|
$
2,543,481 |
| |
|
|
$ 2,543,481
|
Total
Sovereign Loans
(identified cost $3,730,510) |
|
|
$ 3,754,719
|
| U.S.
Government Agency Mortgage-Backed Securities — 19.2% |
| Security
|
Principal
Amount
(000's omitted) |
Value
|
| Federal
Home Loan Mortgage Corp.: |
|
|
|
| 5.00%,
8/1/52 |
$
|
37,517
|
$ 37,019,148
|
| 5.50%,
5/1/32 |
|
183
|
187,661
|
| 6.50%,
6/17/28 |
|
4
|
4,114
|
| 7.00%,
10/17/27 |
|
3
|
3,077
|
| 7.50%,
with various maturities to 2035 |
|
278
|
291,700
|
| 8.00%,
with various maturities to 2030 |
|
7
|
7,357
|
| 9.00%,
with various maturities to 2031 |
|
8
|
7,675
|
| Federal
National Mortgage Association: |
|
|
|
| 4.50%,
7/1/42 |
|
2,227
|
2,200,721
|
| 4.55%,
(COF + 1.318%), 10/1/36(25) |
|
274
|
266,901
|
| 5.00%,
with various maturities to 2040 |
|
2,296
|
2,324,100
|
| 5.50%,
with various maturities to 2033 |
|
234
|
241,048
|
| 6.00%,
5/1/29 |
|
46
|
46,644
|
| 6.353%,
(COF + 2.004%), 7/1/32(25) |
|
286
|
291,978
|
| 6.50%,
with various maturities to 2031 |
|
10
|
10,414
|
| 6.572%,
(6 mo. RFUCCT + 1.541%), 9/1/37(25) |
|
427
|
437,443
|
| 6.997%,
(1 yr. CMT + 2.287), 8/1/36(25) |
|
1,638
|
1,674,657
|
| 7.00%,
with various maturities to 2029 |
|
91
|
92,676
|
| 7.50%,
with various maturities to 2035 |
|
411
|
435,724
|
| 8.00%,
with various maturities to 2027 |
|
3
|
3,382
|
| 8.014%,
9/15/27(4) |
|
4
|
3,563
|
| 8.225%,
6/15/27(4) |
|
0
(26) |
264
|
| 8.262%,
9/20/28(4) |
|
2
|
1,701
|
| 8.50%,
12/1/37 |
|
68
|
70,971
|
| 8.537%,
10/15/29(4) |
|
0
(26) |
316
|
| 9.00%,
2/1/32 |
|
38
|
38,893
|
| 9.50%,
with various maturities to 2030 |
|
3
|
3,175
|
| Government
National Mortgage Association: |
|
|
|
| 4.00%,
9/20/49 |
|
212
|
199,479
|
| 4.50%,
with various maturities to 2052 |
|
2,244
|
2,167,402
|
| 5.00%,
6/20/52 |
|
13,485
|
13,348,216
|
| 5.50%,
30-Year, TBA(27) |
|
10,950
|
10,975,717
|
| 5.50%,
with various maturities to 2054 |
|
18,447
|
18,645,570
|
| 6.00%,
30-Year, TBA(27) |
|
5,300
|
5,379,914
|
| 6.00%,
with various maturities to 2054 |
|
14,853
|
15,272,100
|
| 6.50%,
with various maturities to 2054 |
|
20,795
|
21,401,677
|
| 7.00%,
with various maturities to 2054 |
|
438
|
447,369
|
| 7.50%,
with various maturities to 2054 |
|
1,030
|
1,056,506
|
| Security
|
Principal
Amount
(000's omitted) |
Value
|
Government
National Mortgage Association:
(continued) |
|
|
|
| 8.00%,
with various maturities to 2054 |
$
|
901
|
$
925,935 |
| 9.00%,
12/15/25 |
|
2
|
1,698
|
| Uniform
Mortgage-Backed Security: |
|
|
|
| 5.00%,
30-Year, TBA(27) |
|
9,737
|
9,544,923
|
| 5.50%,
30-Year, TBA(27) |
|
25,350
|
25,321,282
|
| 6.00%,
30-Year, TBA(27) |
|
60,700
|
61,657,922
|
Total
U.S. Government Agency Mortgage-Backed Securities
(identified cost $233,934,775) |
|
|
$ 232,011,013
|
| Security
|
Shares
|
Value
|
| Consumer
Staples Distribution & Retail — 0.0%† |
| Casino
Guichard Perrachon SA, Exp. 4/27/29(11) |
|
32,288
|
$
17 |
Total
Warrants
(identified cost $0) |
|
|
$ 17
|
| Security
|
Principal
Amount/
Shares |
Value
|
| Cable
and Satellite Television — 0.0% |
| ACC
Claims Holdings LLC(10)(11) |
|
2,257,600
|
$
0 |
| |
|
|
$ 0
|
| Energy
— 0.0%† |
| Enviva
LLC, Escrow Certificates(11) |
$
|
1,391,000
|
$
487 |
| |
|
|
$ 487
|
| Engineering
& Construction — 0.0% |
| Abengoa
Abenewco 2 SA, Escrow Certificates(10)(11) |
$
|
377,752
|
$
0 |
| Abengoa
Abenewco 2 SA, Escrow Certificates(10)(11) |
|
377,752
|
0
|
| |
|
|
$ 0
|
| Entertainment
— 0.0% |
| National
CineMedia, Inc., Escrow Certificates(10)(11) |
$
|
1,186,000
|
$
0 |
| |
|
|
$ 0
|
| Pharmaceuticals
— 0.0% |
| Endo
Design LLC, Escrow Certificates(10)(11) |
$
|
649,000
|
$
0 |
| Endo
Luxembourg Finance SARL, Escrow Certificates(10)(11) |
|
1,550,000
|
0
|
| |
|
|
$ 0
|
40
See Notes to Financial Statements.
Eaton Vance
Limited Duration Income Fund
March 31, 2025
Portfolio of
Investments — continued
| Security
|
Principal
Amount/
Shares |
Value
|
| Surface
Transport — 0.0%† |
| Hertz
Corp., Escrow Certificates(11) |
$
|
364,000
|
$
69,615 |
| |
|
|
$ 69,615
|
Total
Miscellaneous
(identified cost $0) |
|
|
$ 70,102
|
| Short-Term
Investments — 2.4% |
| Security
|
Shares
|
Value
|
| Morgan
Stanley Institutional Liquidity Funds - Government Portfolio, Institutional Class, 4.27%(28) |
|
24,737,696
|
$
24,737,696 |
Total
Affiliated Fund
(identified cost $24,737,696) |
|
|
$ 24,737,696
|
| U.S.
Treasury Obligations — 0.3% |
| Security
|
Principal
Amount
(000's omitted) |
Value
|
| U.S.
Treasury Bills: |
|
|
|
| 0.00%,
4/1/25(29) |
$
|
1,517
|
$
1,517,000 |
| 0.00%,
4/10/25(29) |
|
164
|
163,826
|
| 0.00%,
4/24/25(29) |
|
169
|
168,543
|
| 0.00%,
5/15/25(29) |
|
167
|
166,137
|
| 0.00%,
7/15/25(29) |
|
1,990
|
1,965,768
|
Total
U.S. Treasury Obligations
(identified cost $3,981,248) |
|
|
$ 3,981,274
|
Total
Short-Term Investments
(identified cost $28,718,944) |
|
|
$ 28,718,970
|
Total
Investments — 172.7%
(identified cost $2,152,396,351) |
|
|
$ 2,085,886,684
|
| Less
Unfunded Loan Commitments — (0.1)% |
|
|
$
(939,075) |
Net
Investments — 172.6%
(identified cost $2,151,457,276) |
|
|
$ 2,084,947,609
|
| TBA
Sale Commitments — (1.3)% |
| U.S.
Government Agency Mortgage-Backed Securities — (1.3)% |
| Security
|
Principal
Amount
(000's omitted) |
Value
|
| Government
National Mortgage Association, 6.50%, 30-Year, TBA(27) |
$
|
(15,000)
|
$
(15,357,797) |
Total
U.S. Government Agency Mortgage-Backed Securities
(proceeds $15,316,406) |
|
|
$
(15,357,797) |
Total
TBA Sale Commitments
(proceeds $15,316,406) |
|
|
$
(15,357,797) |
| Other
Assets, Less Liabilities — (89.2)% |
|
|
$
(1,077,960,823) |
| Auction
Preferred Shares Plus Cumulative Unpaid Dividends — 17.9% |
|
|
$ 216,191,509
|
| Net
Assets Applicable to Common Shares — 100.0% |
|
|
$ 1,207,820,498
|
| The
percentage shown for each investment category in the Portfolio of Investments is based on net assets applicable to common shares. |
|
† |
Amount
is less than 0.05% or (0.05)%, as applicable. |
| *
|
In
U.S. dollars unless otherwise indicated. |
|
(1) |
Security
exempt from registration under Rule 144A of the Securities Act of 1933, as amended. These securities may be sold in certain transactions in reliance on an exemption from registration (normally to qualified institutional buyers). At March 31, 2025,
the aggregate value of these securities is $713,036,373 or 59.0% of the Fund's net assets applicable to common shares. |
|
(2) |
Variable
rate security. The stated interest rate represents the rate in effect at March 31, 2025. |
|
(3) |
Step
coupon security. Interest rate represents the rate in effect at March 31, 2025. |
|
(4) |
Weighted
average fixed-rate coupon that changes/updates monthly. Rate shown is the rate at March 31, 2025. |
|
(5) |
Inverse
floating-rate security whose coupon varies inversely with changes in the interest rate index. The stated interest rate represents the coupon rate in effect at March 31, 2025. |
|
(6) |
When-issued,
variable rate security whose interest rate will be determined after March 31, 2025. |
|
(7) |
Interest
only security that entitles the holder to receive only interest payments on the underlying mortgages. Principal amount shown is the notional amount of the underlying mortgages on which coupon interest is calculated. |
|
(8) |
Principal
only security that entitles the holder to receive only principal payments on the underlying mortgages. |
|
(9) |
Represents
an investment in an issuer that may be deemed to be an affiliate (see Note 10). |
|
(10) |
Security
is valued using significant unobservable inputs and is categorized as Level 3 in the fair value hierarchy. |
|
(11) |
Non-income
producing security. |
|
(12) |
Security
was acquired in connection with a restructuring of a Senior Loan and may be subject to restrictions on resale. |
41
See Notes to Financial Statements.
Eaton Vance
Limited Duration Income Fund
March 31, 2025
Portfolio of
Investments — continued
|
(13) |
Restricted
security (see Note 7). |
|
(14) |
Security
exempt from registration under Regulation S of the Securities Act of 1933, as amended, which exempts from registration securities offered and sold outside the United States. Security may not be offered or sold in the United States except pursuant
to an exemption from, or in a transaction not subject to, the registration requirements of the Securities Act of 1933, as amended. At March 31, 2025, the aggregate value of these securities is $78,300,741 or 6.5% of the Fund's net assets applicable
to common shares. |
|
(15) |
Security
converts to variable rate after the indicated fixed-rate coupon period. |
|
(16) |
Represents
a payment-in-kind security which may pay interest in additional principal at the issuer’s discretion. |
|
(17) |
Perpetual
security with no stated maturity date but may be subject to calls by the issuer. |
|
(18) |
Issuer
is in default with respect to interest and/or principal payments or has declared bankruptcy and is non-income producing. For a variable rate security, interest rate has been adjusted to reflect non-accrual status. |
|
(19) |
Senior
floating-rate loans (Senior Loans) often require prepayments from excess cash flows or permit the borrowers to repay at their election. The degree to which borrowers repay, whether as a contractual requirement or at their election, cannot be
predicted with accuracy. As a result, the actual remaining maturity may be substantially less than the stated maturities shown. However, Senior Loans will typically have an expected average life of approximately two to four years. Senior Loans
typically have rates of interest which are redetermined periodically by reference to a base lending rate, plus a spread. These base lending rates are primarily the Secured Overnight Financing Rate (“SOFR”) and secondarily, the prime rate
offered by one or more major United States banks (the “Prime Rate”). Base lending rates may be subject to a floor, or minimum rate. Rates for SOFR are generally 1 or 3-month tenors and may also be subject to a credit spread adjustment.
Senior Loans are generally subject to contractual restrictions that must be satisfied before they can be bought or sold. |
|
(20) |
Unfunded
or partially unfunded loan commitments. The stated interest rate reflects the weighted average of the reference rate and spread for the funded portion, if any, and the commitment fees on the portion of the loan that is unfunded. At March 31, 2025,
the total value of unfunded loan commitments is $882,893. See Note 1F for description. |
|
(21) |
This
Senior Loan will settle after March 31, 2025, at which time the interest rate will be determined. |
|
(22) |
The stated
interest rate represents the weighted average interest rate at March 31, 2025 of contracts within the senior loan facility. Interest rates on contracts are primarily redetermined either monthly or quarterly by reference to the indicated base
lending rate and spread and the reset period. |
|
(23) |
Fixed-rate
loan. |
|
(24) |
Amounts
payable in respect of the security are contingent upon and determined by reference to Ukraine’s GDP and Real GDP Growth Rate. Principal amount represents the notional amount used to calculate payments due to the security holder and does not
represent an entitlement for payment. |
|
(25) |
Adjustable
rate mortgage security whose interest rate generally adjusts monthly based on a weighted average of interest rates on the underlying mortgages. The coupon rate may not reflect the applicable index value as interest rates on the underlying mortgages
may adjust on various dates and at various intervals and may be subject to lifetime ceilings and lifetime floors and lookback periods. Rate shown is the coupon rate at March 31, 2025. |
|
(26) |
Principal
amount is less than $500. |
|
(27) |
TBA (To
Be Announced) securities are purchased or sold on a forward commitment basis with an approximate principal amount and maturity date. The actual principal amount, which is not expected to differ significantly from the commitment
amount, and maturity date are determined upon settlement. |
|
(28) |
May be
deemed to be an affiliated investment company (see Note 10). The rate shown is the annualized seven-day yield as of March 31, 2025. |
|
(29) |
Security
(or a portion thereof) has been pledged to cover margin requirements on open derivative contracts. |
| Forward
Foreign Currency Exchange Contracts (Centrally Cleared) |
| Currency
Purchased |
Currency
Sold |
Settlement
Date |
Value/Unrealized
Appreciation
(Depreciation) |
| EUR
|
900,000
|
USD
|
970,101
|
6/18/25
|
$ 7,274
|
| EUR
|
804,641
|
USD
|
867,314
|
6/18/25
|
6,503
|
| EUR
|
739,503
|
USD
|
797,103
|
6/18/25
|
5,977
|
| EUR
|
390,000
|
USD
|
420,377
|
6/18/25
|
3,152
|
| EUR
|
176,162
|
USD
|
192,234
|
6/18/25
|
(927)
|
| USD
|
2,448,499
|
EUR
|
2,243,791
|
6/18/25
|
11,805
|
| USD
|
1,171,210
|
EUR
|
1,073,291
|
6/18/25
|
5,647
|
| USD
|
1,149,360
|
EUR
|
1,053,268
|
6/18/25
|
5,541
|
| USD
|
1,058,236
|
EUR
|
969,762
|
6/18/25
|
5,102
|
42
See Notes to Financial Statements.
Eaton Vance
Limited Duration Income Fund
March 31, 2025
Portfolio of
Investments — continued
| Forward
Foreign Currency Exchange Contracts (Centrally Cleared) (continued) |
| Currency
Purchased |
Currency
Sold |
Settlement
Date |
Value/Unrealized
Appreciation
(Depreciation) |
| USD
|
720,214
|
EUR
|
660,000
|
6/18/25
|
$
3,472 |
| USD
|
695,940
|
EUR
|
637,756
|
6/18/25
|
3,355
|
| USD
|
608,240
|
EUR
|
557,387
|
6/18/25
|
2,933
|
| USD
|
349,177
|
EUR
|
319,984
|
6/18/25
|
1,683
|
| USD
|
272,538
|
EUR
|
249,752
|
6/18/25
|
1,314
|
| USD
|
97,966
|
EUR
|
89,776
|
6/18/25
|
472
|
| USD
|
233,616
|
EUR
|
216,735
|
6/18/25
|
(1,752)
|
| |
|
|
|
|
$61,551
|
| Forward
Foreign Currency Exchange Contracts (OTC) |
| Currency
Purchased |
Currency
Sold |
Counterparty
|
Settlement
Date |
Unrealized
Appreciation |
Unrealized
(Depreciation) |
| EUR
|
817,062
|
USD
|
882,165
|
Goldman
Sachs International |
4/1/25
|
$
1,324 |
$
— |
| USD
|
43,911,630
|
EUR
|
42,161,465
|
Standard
Chartered Bank |
4/2/25
|
—
|
(1,677,549)
|
| EUR
|
500,000
|
USD
|
543,388
|
State
Street Bank and Trust Company |
4/4/25
|
—
|
(2,682)
|
| USD
|
882,304
|
EUR
|
817,062
|
Goldman
Sachs International |
4/4/25
|
—
|
(1,277)
|
| EUR
|
119,715
|
USD
|
125,216
|
Goldman
Sachs International |
4/30/25
|
4,428
|
—
|
| EUR
|
150,000
|
USD
|
156,431
|
HSBC
Bank USA, N.A. |
4/30/25
|
6,008
|
—
|
| EUR
|
282,334
|
USD
|
305,693
|
State
Street Bank and Trust Company |
4/30/25
|
56
|
—
|
| EUR
|
25,373
|
USD
|
27,569
|
State
Street Bank and Trust Company |
4/30/25
|
—
|
(92)
|
| EUR
|
238,128
|
USD
|
258,809
|
State
Street Bank and Trust Company |
4/30/25
|
—
|
(933)
|
| EUR
|
669,876
|
USD
|
734,772
|
State
Street Bank and Trust Company |
4/30/25
|
—
|
(9,343)
|
| EUR
|
234,593
|
USD
|
246,675
|
The
Royal Bank of Scotland PLC |
4/30/25
|
7,374
|
—
|
| EUR
|
339,083
|
USD
|
355,331
|
UBS
AG |
4/30/25
|
11,873
|
—
|
| USD
|
134,019
|
EUR
|
127,384
|
Bank
of America, N.A. |
4/30/25
|
—
|
(3,929)
|
| USD
|
906,347
|
EUR
|
865,936
|
Goldman
Sachs International |
4/30/25
|
—
|
(31,402)
|
| USD
|
37,600,967
|
EUR
|
35,924,444
|
Goldman
Sachs International |
4/30/25
|
—
|
(1,302,754)
|
| USD
|
16,528
|
EUR
|
15,940
|
HSBC
Bank USA, N.A. |
4/30/25
|
—
|
(734)
|
| USD
|
38,850
|
EUR
|
37,120
|
State
Street Bank and Trust Company |
4/30/25
|
—
|
(1,348)
|
| USD
|
110,186
|
EUR
|
105,778
|
State
Street Bank and Trust Company |
4/30/25
|
—
|
(4,365)
|
| USD
|
207,960
|
EUR
|
200,208
|
State
Street Bank and Trust Company |
4/30/25
|
—
|
(8,852)
|
| USD
|
234,951
|
EUR
|
227,080
|
State
Street Bank and Trust Company |
4/30/25
|
—
|
(10,961)
|
| USD
|
370,935
|
EUR
|
353,485
|
State
Street Bank and Trust Company |
4/30/25
|
—
|
(11,865)
|
| USD
|
491,002
|
EUR
|
470,901
|
State
Street Bank and Trust Company |
4/30/25
|
—
|
(18,951)
|
| USD
|
409,741
|
EUR
|
397,017
|
State
Street Bank and Trust Company |
4/30/25
|
—
|
(20,201)
|
| USD
|
204,473
|
EUR
|
196,058
|
The
Royal Bank of Scotland PLC |
4/30/25
|
—
|
(7,844)
|
| USD
|
71,206
|
EUR
|
65,785
|
UBS
AG |
4/30/25
|
—
|
(34)
|
| USD
|
105,324
|
EUR
|
100,083
|
UBS
AG |
4/30/25
|
—
|
(3,059)
|
| USD
|
124,778
|
GBP
|
100,000
|
HSBC
Bank USA, N.A. |
4/30/25
|
—
|
(4,389)
|
| USD
|
76,914
|
GBP
|
62,082
|
Standard
Chartered Bank |
4/30/25
|
—
|
(3,276)
|
| USD
|
122,042
|
GBP
|
98,230
|
State
Street Bank and Trust Company |
4/30/25
|
—
|
(4,839)
|
43
See Notes to Financial Statements.
Eaton Vance
Limited Duration Income Fund
March 31, 2025
Portfolio of
Investments — continued
| Forward
Foreign Currency Exchange Contracts (OTC) (continued) |
| Currency
Purchased |
Currency
Sold |
Counterparty
|
Settlement
Date |
Unrealized
Appreciation |
Unrealized
(Depreciation) |
| USD
|
124,009
|
GBP
|
100,063
|
State
Street Bank and Trust Company |
4/30/25
|
$
— |
$
(5,239) |
| USD
|
6,507,244
|
GBP
|
5,234,595
|
State
Street Bank and Trust Company |
4/30/25
|
—
|
(254,115)
|
| USD
|
45,624,022
|
EUR
|
42,161,465
|
Standard
Chartered Bank |
5/5/25
|
—
|
(46,712)
|
| USD
|
8,674,271
|
EUR
|
8,251,625
|
Australia
and New Zealand Banking Group Limited |
5/30/25
|
—
|
(276,866)
|
| USD
|
8,496,291
|
EUR
|
8,071,600
|
Citibank,
N.A. |
5/30/25
|
—
|
(259,561)
|
| USD
|
8,495,226
|
EUR
|
8,071,600
|
State
Street Bank and Trust Company |
5/30/25
|
—
|
(260,626)
|
| USD
|
8,486,013
|
EUR
|
8,071,600
|
State
Street Bank and Trust Company |
5/30/25
|
—
|
(269,839)
|
| USD
|
79,425
|
GBP
|
61,290
|
Goldman
Sachs International |
5/30/25
|
259
|
—
|
| USD
|
2,564,852
|
GBP
|
2,024,684
|
Standard
Chartered Bank |
5/30/25
|
—
|
(50,358)
|
| USD
|
14,180,633
|
EUR
|
13,072,278
|
Bank
of America, N.A. |
6/30/25
|
—
|
(25,450)
|
| USD
|
12,919,114
|
EUR
|
11,904,740
|
State
Street Bank and Trust Company |
6/30/25
|
—
|
(18,167)
|
| USD
|
12,916,376
|
EUR
|
11,904,740
|
State
Street Bank and Trust Company |
6/30/25
|
—
|
(20,905)
|
| |
|
|
|
|
|
$31,322
|
$(4,618,517)
|
| Futures
Contracts |
| Description
|
Number
of
Contracts |
Position
|
Expiration
Date |
Notional
Amount |
Value/Unrealized
Appreciation
(Depreciation) |
| Interest
Rate Futures |
|
|
|
|
|
| U.S.
5-Year Treasury Note |
1,796
|
Long
|
6/30/25
|
$194,248,626
|
$
1,251,237 |
| U.S.
Ultra 10-Year Treasury Note |
15
|
Long
|
6/18/25
|
1,711,875
|
7,031
|
| Euro-Bobl
|
(16)
|
Short
|
6/6/25
|
(2,037,861)
|
2,265
|
| Euro-Bund
|
(6)
|
Short
|
6/6/25
|
(835,823)
|
18,490
|
| Euro-Buxl
|
(4)
|
Short
|
6/6/25
|
(515,823)
|
33,218
|
| Euro-Schatz
|
(7)
|
Short
|
6/6/25
|
(809,553)
|
454
|
| U.S.
2-Year Treasury Note |
(1)
|
Short
|
6/30/25
|
(207,172)
|
(649)
|
| U.S.
5-Year Treasury Note |
(81)
|
Short
|
6/30/25
|
(8,760,656)
|
(49,462)
|
| U.S.
10-Year Treasury Note |
(67)
|
Short
|
6/18/25
|
(7,451,656)
|
(37,461)
|
| U.S.
Long Treasury Bond |
(434)
|
Short
|
6/18/25
|
(50,900,063)
|
65,576
|
| U.S.
Ultra-Long Treasury Bond |
(94)
|
Short
|
6/18/25
|
(11,491,500)
|
93,315
|
| |
|
|
|
|
$1,384,014
|
44
See Notes to Financial Statements.
Eaton Vance
Limited Duration Income Fund
March 31, 2025
Portfolio of
Investments — continued
| Credit
Default Swaps - Sell Protection (Centrally Cleared) |
| Reference
Entity |
Notional
Amount*
(000's omitted) |
Contract
Annual
Fixed Rate** |
Current
Market Annual
Fixed Rate*** |
Termination
Date |
Value
|
Unamortized
Upfront
Receipts
(Payments) |
Unrealized
Appreciation
(Depreciation) |
| Egypt
|
$
158 |
1.00%
(pays quarterly)(1) |
5.48%
|
12/20/28
|
$
(22,050) |
$
35,754 |
$
13,704 |
| Total
|
$158
|
|
|
|
$(22,050)
|
$35,754
|
$13,704
|
| Credit
Default Swaps - Buy Protection (Centrally Cleared) |
|
| Reference
Entity |
Notional
Amount
(000's omitted) |
Contract
Annual
Fixed Rate** |
Termination
Date |
Value
|
Unamortized
Upfront
Receipts
(Payments) |
Unrealized
Appreciation
(Depreciation) |
| Markit
CDX Emerging Markets Index (CDX.EM.43.V1) |
|
$50
|
1.00%
(pays quarterly)(1) |
6/20/30
|
$
1,896 |
$
(1,823) |
$
73 |
| Total
|
|
|
|
|
$1,896
|
$(1,823)
|
$73
|
| Credit
Default Swaps - Sell Protection (OTC) |
| Reference
Entity |
Counterparty
|
Notional
Amount*
(000's omitted) |
Contract
Annual
Fixed Rate** |
Current
Market
Annual
Fixed Rate*** |
Termination
Date |
Value
|
Unamortized
Upfront
Receipts
(Payments) |
Unrealized
Appreciation
(Depreciation) |
| Ivory
Coast |
Deutsche
Bank AG |
$
271 |
1.00%
(pays quarterly)(1) |
2.5%
|
6/20/27
|
$
(8,359) |
$
15,606 |
$
7,247 |
| Ivory
Coast |
Deutsche
Bank AG |
312
|
1.00%
(pays quarterly)(1) |
2.5
|
6/20/27
|
(9,625)
|
17,992
|
8,367
|
| Mexico
|
Citibank,
N.A. |
2,041
|
1.00%
(pays quarterly)(1) |
1.66
|
12/20/31
|
(75,651)
|
61,303
|
(14,348)
|
| U.S.
Single Family Rental |
Goldman
Sachs International |
2,613
|
7.85%
(pays annually)(1) |
8.17
|
3/18/28
|
7,778
|
4,954
|
12,732
|
| Total
|
|
$5,237
|
|
|
|
$
(85,857) |
$99,855
|
$
13,998 |
| *
|
If the Fund
is the seller of credit protection, the notional amount is the maximum potential amount of future payments the Fund could be required to make if a credit event, as defined in the credit default swap agreement, were to occur. At March 31, 2025, such
maximum potential amount for all open credit default swaps in which the Fund is the seller was $5,395,000. |
| **
|
The
contract annual fixed rate represents the fixed rate of interest received by the Fund (as a seller of protection) or paid by the Fund (as a buyer of protection) on the notional amount of the credit default swap contract. |
| ***
|
Current
market annual fixed rates, utilized in determining the net unrealized appreciation or depreciation as of period end, serve as an indicator of the market’s perception of the current status of the payment/performance risk associated with the
credit derivative. The current market annual fixed rate of a particular reference entity reflects the cost, as quoted by the pricing vendor, of selling protection against default of that entity as of period end and may include upfront payments
required to be made to enter into the agreement. The higher the fixed rate, the greater the market perceived risk of a credit event involving the reference entity. A rate identified as “Defaulted” indicates a credit event has occurred
for the reference entity. |
|
(1) |
Upfront
payment is exchanged with the counterparty as a result of the standardized trading coupon. |
45
See Notes to Financial Statements.
Eaton Vance
Limited Duration Income Fund
March 31, 2025
Portfolio of
Investments — continued
| Abbreviations:
|
| CMT
|
– Constant
Maturity Treasury |
| COF
|
– Cost
of Funds 11th District |
| EURIBOR
|
– Euro
Interbank Offered Rate |
| GDP
|
– Gross
Domestic Product |
| OTC
|
– Over-the-counter
|
| PCL
|
– Public
Company Limited |
| PIK
|
– Payment
In Kind |
| RFUCCT
|
– FTSE
USD IBOR Consumer Cash Fallbacks Term |
| SOFR
|
– Secured
Overnight Financing Rate |
| SONIA
|
– Sterling
Overnight Interbank Average |
| TBA
|
– To
Be Announced |
| Currency
Abbreviations: |
| EUR
|
– Euro
|
| GBP
|
– British
Pound Sterling |
| USD
|
– United
States Dollar |
46
See Notes to Financial Statements.
Eaton Vance
Limited Duration Income Fund
March 31, 2025
Statement of Assets
and Liabilities
| |
March
31, 2025 |
| Assets
|
|
| Unaffiliated
investments, at value (identified cost $2,116,429,663) |
$
2,050,889,304 |
| Affiliated
investments, at value (identified cost $35,027,613) |
34,058,305
|
| Cash
|
3,659,182
|
| Deposits
for derivatives collateral: |
|
| Futures
contracts |
1,444,451
|
| Centrally
cleared derivatives |
440,868
|
| OTC
derivatives |
5,384,000
|
| Foreign
currency, at value (identified cost $4,343,262) |
4,384,858
|
| Interest
and dividends receivable |
19,758,300
|
| Interest
and dividends receivable from affiliated investments |
98,103
|
| Receivable
for investments sold |
1,013,809
|
| Receivable
for TBA sale commitments |
15,316,406
|
| Receivable
for variation margin on open centrally cleared derivatives |
12,265
|
| Receivable
for open forward foreign currency exchange contracts |
31,322
|
| Receivable
for open swap contracts |
28,346
|
| Tax
reclaims receivable |
8,245
|
| Trustees'
deferred compensation plan |
279,201
|
| Prepaid
upfront fees on notes payable |
479,782
|
| Prepaid
expenses |
1,293
|
| Total
assets |
$2,137,288,040
|
| Liabilities
|
|
| Notes
payable |
$
553,000,000 |
| Payable
for investments purchased |
11,732,296
|
| Payable
for when-issued/delayed delivery/forward commitment securities |
123,025,446
|
| TBA
sale commitments, at value (proceeds receivable $15,316,406) |
15,357,797
|
| Payable
for variation margin on open futures contracts |
177,856
|
| Payable
for open forward foreign currency exchange contracts |
4,618,517
|
| Payable
for open swap contracts |
14,348
|
| Upfront
receipts on open OTC swap contracts |
99,855
|
| Payable
to affiliates: |
|
| Investment
adviser fee |
1,255,473
|
| Trustees'
deferred compensation plan |
279,201
|
| Accrued
expenses |
3,715,244
|
| Total
liabilities |
$
713,276,033 |
| Auction
preferred shares (8,640 shares outstanding) at liquidation value plus cumulative unpaid dividends |
$
216,191,509 |
| Commitments
and contingencies (see Note 13) |
|
| Net
assets applicable to common shares |
$1,207,820,498
|
| Sources
of Net Assets |
|
| Common
shares, $0.01 par value, unlimited number of shares authorized |
$
1,162,035 |
| Additional
paid-in capital |
1,567,961,459
|
| Accumulated
loss |
(361,302,996)
|
| Net
assets applicable to common shares |
$1,207,820,498
|
| Common
Shares Issued and Outstanding |
116,203,460
|
| Net
Asset Value Per Common Share |
|
| Net
assets ÷ common shares issued and outstanding |
$
10.39 |
47
See Notes to Financial Statements.
Eaton Vance
Limited Duration Income Fund
March 31, 2025
| |
Year
Ended |
| |
March
31, 2025 |
| Investment
Income |
|
| Dividend
income |
$
2,045,907 |
| Dividend
income from affiliated investments |
1,511,427
|
| Interest
income |
135,903,561
|
| Interest
income from affiliated investments |
533,087
|
| Other
income |
449,409
|
| Total
investment income |
$140,443,391
|
| Expenses
|
|
| Investment
adviser fee |
$
14,539,364 |
| Trustees’
fees and expenses |
108,500
|
| Custodian
fee |
699,665
|
| Transfer
and dividend disbursing agent fees |
20,110
|
| Legal
and accounting services |
270,280
|
| Printing
and postage |
438,247
|
| Interest
expense and fees |
32,248,397
|
| Preferred
shares service fee |
226,603
|
| Miscellaneous
|
201,427
|
| Total
expenses |
$
48,752,593 |
| Deduct:
|
|
| Waiver
and/or reimbursement of expenses by affiliates |
$
44,307 |
| Total
expense reductions |
$
44,307 |
| Net
expenses |
$
48,708,286 |
| Net
investment income |
$
91,735,105 |
| Realized
and Unrealized Gain (Loss) |
|
| Net
realized gain (loss): |
|
| Investment
transactions |
$
(20,964,454) |
| Futures
contracts |
(5,153,671)
|
| Swap
contracts |
102,395
|
| Foreign
currency transactions |
(2,823)
|
| Forward
foreign currency exchange contracts |
7,299,689
|
| Net
realized loss |
$
(18,718,864) |
| Change
in unrealized appreciation (depreciation): |
|
| Investments
|
$
29,984,030 |
| Investments
- affiliated investments |
633,259
|
| TBA
sale commitments |
(41,391)
|
| Futures
contracts |
1,560,023
|
| Swap
contracts |
(36,038)
|
| Foreign
currency |
143,685
|
| Forward
foreign currency exchange contracts |
(5,399,806)
|
| Net
change in unrealized appreciation (depreciation) |
$
26,843,762 |
| Net
realized and unrealized gain |
$
8,124,898 |
| Distributions
to preferred shareholders |
$
(17,245,882) |
| Net
increase in net assets from operations |
$
82,614,121 |
48
See Notes to Financial Statements.
Eaton Vance
Limited Duration Income Fund
March 31, 2025
Statements of Changes
in Net Assets
| |
Year
Ended March 31, |
| |
2025
|
2024
|
| Increase
(Decrease) in Net Assets |
|
|
| From
operations: |
|
|
| Net
investment income |
$
91,735,105 |
$
92,614,913 |
| Net
realized loss |
(18,718,864)
|
(45,834,953)
|
| Net
change in unrealized appreciation (depreciation) |
26,843,762
|
93,594,530
|
| Distributions
to preferred shareholders |
(17,245,882)
|
(18,534,628)
|
| Net
increase in net assets from operations |
$
82,614,121 |
$
121,839,862 |
| Distributions
to common shareholders |
$
(79,136,710) |
$
(80,819,287) |
| Tax
return of capital to common shareholders |
$
(29,606,488) |
$
(28,249,281) |
| Net
increase (decrease) in net assets |
$
(26,129,077) |
$
12,771,294 |
| Net
Assets Applicable to Common Shares |
|
|
| At
beginning of year |
$
1,233,949,575 |
$
1,221,178,281 |
| At
end of year |
$1,207,820,498
|
$1,233,949,575
|
49
See Notes to Financial Statements.
Eaton Vance
Limited Duration Income Fund
March 31, 2025
| |
Year
Ended |
| |
March
31, 2025 |
| Cash
Flows From Operating Activities |
|
| Net
increase in net assets from operations |
$
82,614,121 |
| Distributions
to preferred shareholders |
17,245,882
|
| Net
increase in net assets from operations excluding distributions to preferred shareholders |
$
99,860,003 |
| Adjustments
to reconcile net increase in net assets from operations to net cash provided by operating activities: |
|
| Investments
purchased |
(2,762,149,100)
|
| Investments
sold and principal repayments |
2,681,170,740
|
| Increase
in short-term investments, net |
(6,512,489)
|
| Net
amortization/accretion of premium (discount) |
(1,225,935)
|
| Amortization
of prepaid upfront fees on notes payable |
703,058
|
| Decrease
in interest and dividends receivable |
2,296,560
|
| Decrease
in interest and dividends receivable from affiliated investments |
51,194
|
| Decrease
in receivable for variation margin on open centrally cleared derivatives |
23,564
|
| Decrease
in receivable for open swap contracts |
16,357
|
| Increase
in tax reclaims receivable |
(3,976)
|
| Increase
in Trustees’ deferred compensation plan |
(23,081)
|
| Decrease
in prepaid expenses |
7,597
|
| Decrease
in cash collateral due to broker |
(270,000)
|
| Decrease
in payable for variation margin on open futures contracts |
(94,091)
|
| Increase
in payable for open swap contracts |
12,153
|
| Decrease
in upfront receipts on open OTC swap contracts |
(42,619)
|
| Increase
in payable to affiliates for investment adviser fee |
61,562
|
| Increase
in payable to affiliates for Trustees' deferred compensation plan |
23,081
|
| Decrease
in accrued expenses |
(71,497)
|
| Increase
in unfunded loan commitments |
753,711
|
| Net
change in unrealized (appreciation) depreciation from investments, including TBA sale commitments |
(30,575,898)
|
| Net
change in unrealized (appreciation) depreciation from forward foreign currency exchange contracts (OTC) |
5,371,324
|
| Net
realized loss from investments |
20,964,454
|
| Net
cash provided by operating activities |
$
10,346,672 |
| Cash
Flows From Financing Activities |
|
| Cash distributions paid to common shareholders
|
$
(108,743,198) |
| Cash
distributions paid to preferred shareholders |
(17,382,022)
|
| Proceeds
from notes payable |
165,000,000
|
| Repayments
of notes payable |
(51,000,000)
|
| Net
cash used in financing activities |
$
(12,125,220) |
| Net
decrease in cash and restricted cash* |
$
(1,778,548) |
| Cash
and restricted cash at beginning of year (including foreign currency) |
$
17,091,907 |
| Cash
and restricted cash at end of year (including foreign currency) |
$
15,313,359 |
| Supplemental
disclosure of cash flow information: |
|
| Cash
paid for interest and fees on borrowings |
$
31,592,946 |
| *
|
Includes
net change in unrealized appreciation (depreciation) on foreign currency of $56,295. |
50
See Notes to Financial Statements.
Eaton Vance
Limited Duration Income Fund
March 31, 2025
Statement of Cash
Flows — continued
The
following table provides a reconciliation of cash and restricted cash reported within the Statement of Assets and Liabilities that sum to the total of such amounts shown on the Statement of Cash Flows.
| |
|
| |
March
31, 2025 |
| Cash
|
$
3,659,182 |
| Deposits
for derivatives collateral: |
|
| Futures
contracts |
1,444,451
|
| Centrally
cleared derivatives |
440,868
|
| OTC
derivatives |
5,384,000
|
| Foreign
currency |
4,384,858
|
| Total
cash and restricted cash as shown on the Statement of Cash Flows |
$15,313,359
|
51
See Notes to Financial Statements.
Eaton Vance
Limited Duration Income Fund
March 31, 2025
Selected data for a
common share outstanding during the periods stated
| |
Year
Ended March 31, |
| |
2025
|
2024
|
2023
|
2022
|
2021
|
| Net
asset value — Beginning of year (Common shares) |
$
10.62 |
$
10.51 |
$
12.30 |
$
13.57 |
$
11.75 |
| Income
(Loss) From Operations |
|
|
|
|
|
| Net
investment income(1) |
$
0.79 |
$
0.80 |
$
0.71 |
$
0.64 |
$
0.76 |
| Net
realized and unrealized gain (loss) |
0.07
|
0.41
|
(1.21)
|
(0.71)
|
2.27
|
Distributions
to preferred shareholders:
From net investment income(1) |
(0.15)
|
(0.16)
|
(0.09)
|
(0.00)
(2) |
(0.01)
|
| Total
income (loss) from operations |
$
0.71 |
$
1.05 |
$
(0.59) |
$
(0.07) |
$
3.02 |
| Less
Distributions to Common Shareholders |
|
|
|
|
|
| From
net investment income |
$
(0.69) |
$
(0.70) |
$
(0.72) |
$
(0.68) |
$
(0.79) |
| Tax
return of capital |
(0.25)
|
(0.24)
|
(0.48)
|
(0.52)
|
(0.41)
|
| Total
distributions to common shareholders |
$
(0.94) |
$
(0.94) |
$
(1.20) |
$
(1.20) |
$
(1.20) |
| Net
asset value — End of year (Common shares) |
$10.39
|
$10.62
|
$10.51
|
$12.30
|
$13.57
|
| Market
value — End of year (Common shares) |
$
9.98 |
$
9.75 |
$
9.85 |
$11.70
|
$12.63
|
| Total
Investment Return on Net Asset Value(3) |
7.37%
|
11.73%
|
(3.98)%
|
(0.42)%
|
27.62%
|
| Total
Investment Return on Market Value(3) |
12.33%
|
9.35%
|
(5.30)%
|
1.70%
|
32.25%
|
52
See Notes to Financial Statements.
Eaton Vance
Limited Duration Income Fund
March 31, 2025
Financial
Highlights — continued
Selected data for a
common share outstanding during the periods stated
| |
Year
Ended March 31, |
| |
2025
|
2024
|
2023
|
2022
|
2021
|
| Ratios/Supplemental
Data |
|
|
|
|
|
| Net
assets applicable to common shares, end of year (000’s omitted) |
$1,207,820
|
$1,233,950
|
$1,221,178
|
$1,429,150
|
$1,575,692
|
| Ratios
(as a percentage of average daily net assets applicable to common shares):(4)(5)† |
|
|
|
|
|
| Expenses
excluding interest and fees |
1.34%
|
1.27%
|
1.29%
|
1.24%
|
1.33%
|
| Interest
and fee expense(6) |
2.63%
|
2.09%
|
1.43%
|
0.53%
|
0.58%
|
| Total
expenses |
3.97%
|
3.36%
|
2.72%
|
1.77%
|
1.91%
|
| Net
expenses |
3.97%
(7) |
3.36%
(7) |
2.72%
(7) |
1.77%
|
1.91%
|
| Net
investment income |
7.48%
|
7.66%
|
6.47%
|
4.83%
|
5.73%
|
| Portfolio
Turnover |
135%
|
199%
|
201%
|
137%
|
57%
(8) |
| Senior
Securities: |
|
|
|
|
|
| Total
notes payable outstanding (in 000’s) |
$
553,000 |
$
439,000 |
$
314,000 |
$
578,000 |
$
570,000 |
| Asset
coverage per $1,000 of notes payable(9) |
$
3,575 |
$
4,304 |
$
5,577 |
$
3,846 |
$
4,143 |
| Total
preferred shares outstanding |
8,640
|
8,640
|
8,640
|
8,640
|
8,640
|
| Asset
coverage per preferred share(10) |
$
64,272 |
$
72,110 |
$
82,609 |
$
69,999 |
$
75,118 |
| Involuntary
liquidation preference per preferred share(11) |
$
25,000 |
$
25,000 |
$
25,000 |
$
25,000 |
$
25,000 |
| Approximate
market value per preferred share(11) |
$
25,000 |
$
25,000 |
$
25,000 |
$
25,000 |
$
25,000 |
|
(1) |
Computed
using average common shares outstanding. |
|
(2) |
Amount
is less than $(0.005). |
|
(3) |
Returns
are historical and are calculated by determining the percentage change in net asset value or market value with all distributions reinvested. Distributions are assumed to be reinvested at prices obtained under the Fund's dividend reinvestment plan.
|
|
(4) |
Total
expenses do not reflect amounts reimbursed and/or waived by the adviser and certain of its affiliates, if applicable. Net expenses are net of all reductions and represent the net expenses paid by the Fund. |
|
(5) |
Ratios
do not reflect the effect of dividend payments to preferred shareholders. |
|
(6) |
Interest
and fee expense relates to the notes payable, a portion of which was incurred to partially redeem the Fund’s Auction Preferred Shares (see Note 2). |
|
(7) |
Includes
a reduction by the investment adviser of a portion of its adviser fee due to the Fund’s investment in the Liquidity Fund (equal to less than 0.005% of average daily net assets for the year ended March 31, 2025 and less than 0.01% of average
daily net assets for the years ended March 31, 2024 and 2023). |
|
(8) |
Includes
the effect of To-Be-Announced (TBA) transactions. |
|
(9) |
Calculated
by subtracting the Fund’s total liabilities (not including the notes payable and preferred shares) from the Fund’s total assets, and dividing the result by the notes payable balance in thousands. |
|
(10) |
Calculated
by subtracting the Fund’s total liabilities (not including the notes payable and preferred shares) from the Fund’s total assets, dividing the result by the sum of the value of the notes payable and liquidation value of the preferred
shares, and multiplying the result by the liquidation value of one preferred share. Such amount equates to 257%, 288%, 330%, 280% and 300% at March 31, 2025, 2024, 2023, 2022 and 2021, respectively. |
|
(11) |
Plus
accumulated and unpaid dividends. |
|
† |
Ratios
based on net assets applicable to common shares plus preferred shares and borrowings are presented below. Ratios do not reflect the effect of dividend payments to preferred shareholders. |
| |
Year
Ended March 31, |
| |
2025
|
2024
|
2023
|
2022
|
2021
|
| Expenses
excluding interest and fees |
0.85%
|
0.87%
|
0.85%
|
0.83%
|
0.88%
|
| Interest
and fee expense |
1.66%
|
1.43%
|
0.94%
|
0.36%
|
0.38%
|
| Total
expenses |
2.51%
|
2.30%
|
1.79%
|
1.19%
|
1.26%
|
| Net
investment income |
4.73%
|
5.23%
|
4.24%
|
3.25%
|
3.79%
|
53
See Notes to Financial Statements.
Eaton Vance
Limited Duration Income Fund
March 31, 2025
Notes to Financial
Statements
1 Significant Accounting Policies
Eaton Vance Limited Duration Income Fund (the Fund) is a
Massachusetts business trust registered under the Investment Company Act of 1940, as amended (the 1940 Act), as a diversified, closed-end management investment company. The Fund's primary investment objective is to provide a high level of
current income. The Fund may, as a secondary objective, also seek capital appreciation to the extent it is consistent with its primary objective.
The following is a summary of significant accounting policies
of the Fund. The policies are in conformity with accounting principles generally accepted in the United States of America (U.S. GAAP). The Fund is an investment company and follows accounting and reporting guidance in the Financial Accounting
Standards Board (FASB) Accounting Standards Codification Topic 946.
A Investment
Valuation—The following methodologies are used to determine the market value or fair value of
investments.
Senior Floating-Rate Loans. Interests in senior floating-rate loans (Senior Loans) are valued generally at the average mean of bid and ask quotations obtained from a third party pricing service. Senior Loans, for which a valuation is not available
or deemed unreliable, are fair valued by the investment adviser utilizing one or more of the valuation techniques described below to assess the likelihood that the borrower will make a full repayment of the loan underlying such Senior Loan. If the
investment adviser believes that there is a reasonable likelihood of full repayment, the investment adviser will determine fair value using a matrix pricing approach that considers the yield on the Senior Loan relative to yields on other Senior
Loans issued by companies of comparable credit quality. If the investment adviser believes there is not a reasonable likelihood of full repayment, the investment adviser will determine fair value using analyses that include, but are not limited to:
(i) a comparison of the value of the borrower’s outstanding equity and debt to that of comparable public companies; (ii) a discounted cash flow analysis; or (iii) when the investment adviser believes it is likely that a borrower will be
liquidated or sold, an analysis of the terms of such liquidation or sale. In certain cases, the investment adviser will use a combination of analytical methods to determine fair value, such as when only a portion of a borrower’s assets are
likely to be sold. In conducting its assessment and analyses for purposes of determining fair value of a Senior Loan, the investment adviser will use its discretion and judgment in considering and appraising relevant factors. Junior Loans (i.e.,
subordinated loans and second lien loans) are valued in the same manner as Senior Loans.
Debt Obligations. Debt
obligations are generally valued on the basis of valuations provided by third party pricing services, as derived from such services’ pricing models. Inputs to the models may include, but are not limited to, reported trades, executable bid and
ask prices, broker/dealer quotations, prices or yields of securities with similar characteristics, interest rates, anticipated prepayments, benchmark curves or information pertaining to the issuer, as well as industry and economic events. The
pricing services may use a matrix approach, which considers information regarding securities with similar characteristics to determine the valuation for a security. Short-term debt obligations purchased with a remaining maturity of sixty days or
less for which a valuation from a third party pricing service is not readily available may be valued at amortized cost, which approximates fair value.
Equity Securities. Equity
securities listed on a U.S. securities exchange generally are valued at the last sale or closing price on the day of valuation or, if no sales took place on such date, at the mean between the closing bid and ask prices on the exchange where such
securities are principally traded. Equity securities listed on the NASDAQ National Market System are valued at the NASDAQ official closing price. Unlisted or listed securities for which closing sales prices or closing quotations are not available
are valued at the mean between the latest available bid and ask prices or, in the case of preferred equity securities that are not listed or traded in the over-the-counter market, by a third party pricing service that uses various techniques that
consider factors including, but not limited to, prices or yields of securities with similar characteristics, benchmark yields, broker/dealer quotes, quotes of underlying common stock, issuer spreads, as well as industry and economic
events.
Derivatives. Futures contracts are valued at the closing settlement price established by the board of trade or exchange on which they are traded. Forward foreign currency exchange contracts are generally valued at the mean of the
average bid and average ask prices that are reported by currency dealers to a third party pricing service at the valuation time. Such third party pricing service valuations are supplied for specific settlement periods and the Fund’s forward
foreign currency exchange contracts are valued at an interpolated rate between the closest preceding and subsequent settlement period reported by the third party pricing service. Swaps are normally valued using valuations provided by a third party
pricing service. Such pricing service valuations are based on the present value of fixed and projected floating rate cash flows over the term of the swap contract, and in the case of credit default swaps, based on credit spread quotations obtained
from broker/dealers and expected default recovery rates determined by the pricing service using proprietary models. Future cash flows on swaps are discounted to their present value using swap rates provided by electronic data services or by
broker/dealers.
Foreign Securities and Currencies. Foreign securities and currencies are valued in U.S. dollars, based on foreign currency exchange rate quotations supplied by a third party pricing service. The pricing service uses a proprietary model to determine
the exchange rate. Inputs to the model include reported trades and implied bid/ask spreads. The daily valuation of exchange-traded foreign securities generally is determined as of the close of trading on the principal exchange on which such
securities trade. Events occurring after the close of trading on foreign exchanges may result in adjustments to the valuation of foreign securities to more accurately reflect their fair value as of the close of regular trading on the New York Stock
Exchange. When valuing foreign equity securities that meet certain criteria, the Fund's Trustees have approved the use of a fair value service that values such securities to reflect market trading that occurs after the close of the applicable
foreign markets of comparable securities or other instruments that have a strong correlation to the fair-valued securities.
Other. Investments in
management investment companies (including money market funds) that do not trade on an exchange are valued at the net asset value as of the close of each business day.
Eaton Vance
Limited Duration Income Fund
March 31, 2025
Notes to Financial
Statements — continued
Fair
Valuation. In connection with Rule 2a-5 of the 1940 Act, the Trustees have designated the Fund’s investment adviser as its valuation designee. Investments for which valuations or market quotations are not
readily available or are deemed unreliable are valued by the investment adviser, as valuation designee, at fair value using methods that most fairly reflect the security’s “fair value”, which is the amount that the Fund might
reasonably expect to receive for the security upon its current sale in the ordinary course. Each such determination is based on a consideration of relevant factors, which are likely to vary from one pricing context to another. These factors may
include, but are not limited to, the type of security, the existence of any contractual restrictions on the security’s disposition, the price and extent of public trading in similar securities of the issuer or of comparable companies or
entities, quotations or relevant information obtained from broker/dealers or other market participants, information obtained from the issuer, analysts, and/or the appropriate stock exchange (for exchange-traded securities), an analysis of the
company’s or entity’s financial statements, and an evaluation of the forces that influence the issuer and the market(s) in which the security is purchased and sold.
B Investment Transactions—Investment transactions for financial statement purposes are accounted for on a trade date basis. Realized
gains and losses on investments sold are determined on the basis of identified cost.
C Income—Interest income is recorded on the basis of interest accrued, adjusted for amortization of premium or accretion of discount. Fees in connection
with investments in senior floating-rate loans may include amendment fees, consent fees and prepayment fees, which are recorded to income as earned and included in Other income on the Statement of Operations. Dividend income is recorded on the
ex-dividend date for dividends received in cash and/or securities. Distributions from investment companies are recorded as dividend income, capital gains or return of capital based on the nature of the distribution.
D Federal
Taxes—The Fund's policy is to comply with the provisions of the Internal Revenue Code applicable
to regulated investment companies and to distribute to shareholders each year substantially all of its net investment income, and all or substantially all of its net realized capital gains. Accordingly, no provision for federal income or excise tax
is necessary.
As of March 31, 2025, the Fund had
no uncertain tax positions that would require financial statement recognition, de-recognition, or disclosure. The Fund files a U.S. federal income tax return annually after its fiscal year-end, which is subject to examination by the Internal
Revenue Service for a period of three years from the date of filing.
E Foreign Currency Translation—Investment valuations, other assets, and liabilities initially expressed in foreign currencies are
translated each business day into U.S. dollars based upon current exchange rates. Purchases and sales of foreign investment securities and income and expenses denominated in foreign currencies are translated into U.S. dollars based upon currency
exchange rates in effect on the respective dates of such transactions. Recognized gains or losses on investment transactions attributable to changes in foreign currency exchange rates are recorded for financial statement purposes as net realized
gains and losses on investments. That portion of unrealized gains and losses on investments that results from fluctuations in foreign currency exchange rates is not separately disclosed.
F Unfunded Loan Commitments—The Fund may enter into certain loan agreements all or a portion of which may be unfunded. The Fund is
obligated to fund these commitments at the borrower's discretion. These commitments, if any, are disclosed in the accompanying Portfolio of Investments. At March 31, 2025, the Fund had sufficient cash and/or securities to cover these
commitments.
G Use of Estimates—The preparation of the financial statements in conformity with U.S. GAAP requires management to make
estimates and assumptions that affect the reported amounts of assets and liabilities at the date of the financial statements and the reported amounts of income and expense during the reporting period. Actual results could differ from those
estimates.
H Indemnifications—Under the Fund’s organizational documents, its officers and Trustees may be indemnified against
certain liabilities and expenses arising out of the performance of their duties to the Fund. Under Massachusetts law, if certain conditions prevail, shareholders of a Massachusetts business trust (such as the Fund) could be deemed to have
personal liability for the obligations of the Fund. However, the Fund’s Declaration of Trust contains an express disclaimer of liability on the part of Fund shareholders and the By-laws provide that the Fund shall assume, upon
request by the shareholder, the defense on behalf of any Fund shareholders. Moreover, the By-laws also provide for indemnification out of Fund property of any shareholder held personally liable solely by reason of being or having been a shareholder
for all loss or expense arising from such liability. Additionally, in the normal course of business, the Fund enters into agreements with service providers that may contain indemnification clauses. The Fund’s maximum exposure under
these arrangements is unknown as this would involve future claims that may be made against the Fund that have not yet occurred.
I Futures
Contracts—Upon entering into a futures contract, the Fund is required to deposit with the broker,
either in cash or securities, an amount equal to a certain percentage of the contract amount (initial margin). Subsequent payments, known as variation margin, are made or received by the Fund each business day, depending on the daily
fluctuations in the value of the underlying security, and are recorded as unrealized gains or losses by the Fund. Gains (losses) are realized upon the expiration or closing of the futures contracts. Should market conditions change unexpectedly, the
Fund may not achieve the anticipated benefits of the futures contracts and may realize a loss. Futures contracts have minimal counterparty risk as they are exchange traded and the clearinghouse for the exchange is substituted as the counterparty,
guaranteeing counterparty performance.
J Forward Foreign Currency Exchange Contracts—The Fund may enter into forward foreign currency exchange contracts for the purchase or sale of a
specific foreign currency at a fixed price on a future date. The forward foreign currency exchange contracts are adjusted by the daily exchange rate of the
Eaton Vance
Limited Duration Income Fund
March 31, 2025
Notes to Financial
Statements — continued
underlying currency
and any gains or losses are recorded as unrealized until such time as the contracts have been closed. While forward foreign currency exchange contracts are privately negotiated agreements between the Fund and a counterparty, certain contracts
may be “centrally cleared”, whereby all payments made or received by the Fund pursuant to the contract are with a central clearing party (CCP) rather than the original counterparty. The CCP guarantees the performance of the original
parties to the contract. Upon entering into centrally cleared contracts, the Fund is required to deposit with the CCP, either in cash or securities, an amount of initial margin determined by the CCP, which is subject to adjustment. For
centrally cleared contracts, the daily change in valuation is recorded as a receivable or payable for variation margin and settled in cash with the CCP daily. Risks may arise upon entering these contracts from the potential inability of
counterparties to meet the terms of their contracts and from movements in the value of a foreign currency relative to the U.S. dollar. In the case of centrally cleared contracts, counterparty risk is minimal due to protections provided by the
CCP.
K Credit Default Swaps—When the Fund is the buyer of a credit default swap contract, the Fund is entitled to receive the par (or
other agreed-upon) value of a referenced debt obligation (or basket of debt obligations) from the counterparty (or CCP in the case of a centrally cleared swap) to the contract if a credit event by a third party, such as a U.S. or foreign corporate
issuer or sovereign issuer, on the debt obligation occurs. In return, the Fund pays the counterparty a periodic stream of payments over the term of the contract provided that no credit event has occurred. If no credit event occurs, the Fund
would have spent the stream of payments and received no proceeds from the contract. When the Fund is the seller of a credit default swap contract, it receives the stream of payments, but is obligated to pay to the buyer of the protection an amount
up to the notional amount of the swap and in certain instances take delivery of securities of the reference entity upon the occurrence of a credit event, as defined under the terms of that particular swap agreement. Credit events are contract
specific but may include bankruptcy, failure to pay, restructuring, obligation acceleration and repudiation/moratorium. If the Fund is a seller of protection and a credit event occurs, the maximum potential amount of future payments that the Fund
could be required to make would be an amount equal to the notional amount of the agreement. This potential amount would be partially offset by any recovery value of the respective referenced obligation, or net amount received from the settlement of
a buy protection credit default swap agreement entered into by the Fund for the same referenced obligation. As the seller, the Fund may create economic leverage to its portfolio because, in addition to its total net assets, the Fund is subject to
investment exposure on the notional amount of the swap. The interest fee paid or received on the swap contract, which is based on a specified interest rate on a fixed notional amount, is accrued daily as a component of unrealized appreciation
(depreciation) and is recorded as realized gain upon receipt or realized loss upon payment. The Fund also records an increase or decrease to unrealized appreciation (depreciation) in an amount equal to the daily valuation. For centrally cleared
swaps, the daily change in valuation is recorded as a receivable or payable for variation margin and settled in cash with the CCP daily. All upfront payments and receipts, if any, are amortized over the life of the swap contract as realized gains or
losses. Those upfront payments or receipts for non-centrally cleared swaps are recorded as other assets or other liabilities, respectively, net of amortization. For financial reporting purposes, unamortized
upfront payments or receipts, if any, are netted with unrealized appreciation or depreciation on swap contracts to determine the market value of swaps as presented in Notes 8 and 11. These transactions involve
certain risks, including the risk that the seller may be unable to fulfill the transaction.
In the case of centrally cleared swaps, counterparty risk is minimal due to
protections provided by the CCP.
L When-Issued
Securities and Delayed Delivery Transactions—The Fund may purchase securities on a delayed delivery,
when-issued or forward commitment basis, including TBA (To Be Announced) securities. Payment and delivery may take place after the customary settlement period for that security. At the time the transaction is negotiated, the price of the security
that will be delivered is fixed. Securities purchased on a delayed delivery, when-issued or forward commitment basis are marked-to-market daily and begin earning interest on settlement date. Such security purchases are subject to the risk that when
delivered they will be worth less than the agreed upon payment price. Losses may also arise if the counterparty does not perform under the contract. A forward purchase commitment may be closed by entering into an offsetting commitment. If an
offsetting commitment is entered into, the Fund will realize a gain or loss on investments based on the price established when the Fund entered into the commitment.
M Forward Sale Commitments—The Fund may enter into forward sale commitments to sell generic U.S. government agency mortgage-backed
securities to hedge its portfolio positions and/or to enhance return. The proceeds to be received from the forward sale commitment are recorded as an asset and a corresponding liability, which is subsequently valued at approximately the current
market value of the underlying security in accordance with the Fund's policies on investment valuations discussed above. The Fund records an unrealized gain or loss on investments to the extent of the difference between the proceeds to be received
and the value of the open forward sale commitment on the day of determination. If the forward sale commitment is closed through the acquisition of an offsetting purchase commitment or the delivery of securities, the Fund realizes a gain or loss on
investments based on the price established when the Fund entered into the commitment. If the Fund enters into a forward sale commitment for the delivery of a security that it does not own or has the right to obtain, it is subject to the risk of loss
if the purchase price to settle the commitment is higher than the price at which it was sold.
N Stripped Mortgage-Backed Securities—The Fund may invest in Interest Only (IO) and Principal Only (PO) securities, a form of stripped
mortgage-
backed securities, whereby the IO security receives all the interest and the PO security receives all the principal on a pool of mortgage assets. The yield to maturity on an IO security is extremely sensitive to the rate of principal
payments (including prepayments) on the related underlying mortgage assets, and a rapid rate of principal payments may have a material adverse effect on the yield to maturity from these securities. If the underlying mortgages experience greater than
anticipated prepayments of principal, the Fund may fail to recoup its initial investment in an IO security. The market value of IO and PO securities can be unusually volatile due to changes in interest rates.
O Segment
Reporting—During this reporting period, the Fund adopted FASB Accounting Standards Update No. 2023-07,
Segment Reporting (Topic 280): Improvements to Reportable Segment Disclosures (ASU 2023-07), which requires incremental disclosures related to a public
entity’s reportable segments. The Fund operates as a single reportable segment, an investment company whose investment objective is included in Note 1. In connection with
Eaton Vance
Limited Duration Income Fund
March 31, 2025
Notes to Financial
Statements — continued
the adoption of ASU
2023-07, the Fund’s President acts as the Fund's Chief Operating Decision Maker (CODM), who is responsible for assessing the performance of the Fund's single segment and deciding how to allocate the segment’s resources. To perform this
function, the CODM reviews the information in the Fund’s financial statements.
2 Auction Preferred Shares
The Fund issued Auction Preferred Shares (APS) on July 25, 2003
in a public offering. Dividends on the APS, which accrue daily, are cumulative at rates which are reset every seven days by an auction, unless a special dividend period has been set. Series of APS are identical in all respects except for the reset
dates of the dividend rates. If the APS auctions do not successfully clear, the dividend payment rate over the next period for the APS holders is set at a specified maximum applicable rate until such time as the APS auctions are successful. Auctions
have not cleared since February 13, 2008 and the rate since that date has been the maximum applicable rate (see Note 3). The maximum applicable rate on the APS is 160% of the “AA” Financial Composite Commercial Paper Rate at the date of
the auction. The stated spread over the reference benchmark rate is determined based on the credit rating of the APS.
The number of APS issued and outstanding at March 31, 2025 are
as follows:
| |
APS
Issued and
Outstanding |
| Series
A |
1,728
|
| Series
B |
1,728
|
| Series
C |
1,728
|
| Series
D |
1,728
|
| Series
E |
1,728
|
The APS are redeemable at the option
of the Fund at a redemption price equal to $25,000 per share, plus accumulated and unpaid dividends, on any dividend payment date. The APS are also subject to mandatory redemption at a redemption price equal to $25,000 per share, plus accumulated
and unpaid dividends, if the Fund is in default for an extended period on its asset maintenance requirements with respect to the APS. If the dividends on the APS remain unpaid in an amount equal to two full years’ dividends, the holders of the
APS as a class have the right to elect a majority of the Board of Trustees. In general, the holders of the APS and the common shares have equal voting rights of one vote per share, except that the holders of the APS, as a separate class, have the
right to elect at least two members of the Board of Trustees. The APS have a liquidation preference of $25,000 per share, plus accumulated and unpaid dividends. The Fund is required to maintain certain asset coverage with respect to the APS as
defined in the Fund's By-Laws and the 1940 Act. The Fund pays an annual fee up to 0.15% of the liquidation value of the APS to broker/dealers as a service fee if the auctions are unsuccessful; otherwise, the annual fee is 0.25%.
3 Distributions to Shareholders and Income Tax
Information
The Fund intends to make monthly
distributions of net investment income to common shareholders, after payment of any dividends on any outstanding APS. In addition, at least annually, the Fund intends to distribute all or substantially all of its net realized capital gains.
Distributions to common shareholders are recorded on the ex-dividend date. Distributions to preferred shareholders are recorded daily and are payable at the end of each dividend period. The dividend rates for the APS at March 31, 2025, and the
amount of dividends accrued (including capital gains, if any) to APS shareholders, average APS dividend rates, and dividend rate ranges for the year then ended were as follows:
| |
APS
Dividend
Rates at
March 31, 2025 |
Dividends
Accrued to
APS
Shareholders |
Average
APS
Dividend
Rates |
Dividend
Rate
Ranges
(%) |
| Series
A |
6.94%
|
$3,451,102
|
7.99%
|
6.91-8.68
|
| Series
B |
6.94
|
3,450,554
|
7.99
|
6.91-8.68
|
| Series
C |
6.94
|
3,450,174
|
7.99
|
6.91-8.68
|
| Series
D |
6.94
|
3,445,398
|
7.98
|
6.91-8.68
|
| Series
E |
6.94
|
3,448,654
|
7.98
|
6.91-8.68
|
Eaton Vance
Limited Duration Income Fund
March 31, 2025
Notes to Financial
Statements — continued
Beginning February 13, 2008 and consistent with the patterns in
the broader market for auction-rate securities, the Fund's APS auctions were unsuccessful in clearing due to an imbalance of sell orders over bids to buy the APS. As a result, the dividend rates of the APS were reset to the maximum applicable rates.
The table above reflects such maximum dividend rate for each series as of March 31, 2025.
Distributions to shareholders are determined in accordance with
income tax regulations, which may differ from U.S. GAAP. As required by U.S. GAAP, only distributions in excess of tax basis earnings and profits are reported in the financial statements as a return of capital. Permanent differences between book and
tax accounting relating to distributions are reclassified to paid-in capital. For tax purposes, distributions from short-term capital gains are considered to be from ordinary income.
The tax character of distributions declared for the years ended
March 31, 2025 and March 31, 2024 was as follows:
| |
Year
Ended March 31, |
| |
2025
|
2024
|
| Ordinary
income |
$96,382,592
|
$99,353,915
|
| Tax
return of capital |
$29,606,488
|
$28,249,281
|
During the year ended March 31,
2025, accumulated loss was decreased by $1,430,952 and paid-in capital was decreased by $1,430,952 due to differences between book and tax accounting for investments in passive foreign investment companies (PFICs). These reclassifications had no
effect on the net assets or net asset value per share of the Fund.
As of March 31, 2025, the components of distributable earnings
(accumulated loss) on a tax basis were as follows:
| Deferred
capital losses |
$
(294,270,770) |
| Net
unrealized depreciation |
(67,052,839)
|
| Other
temporary differences |
20,613
|
| Accumulated
loss |
$(361,302,996)
|
At March 31, 2025, the Fund, for
federal income tax purposes, had deferred capital losses of $294,270,770 which would reduce its taxable income arising from future net realized gains on investment transactions, if any, to the extent permitted by the Internal Revenue Code, and thus
would reduce the amount of distributions to shareholders, which would otherwise be necessary to relieve the Fund of any liability for federal income or excise tax. The deferred capital losses are treated as arising on the first day of the
Fund’s next taxable year and retain the same short-term or long-term character as when originally deferred. Of the deferred capital losses at March 31, 2025, $47,880,122 are short-term and $246,390,648 are long-term.
The cost and unrealized appreciation (depreciation) of
investments, including open derivative contracts and TBA sale commitments, of the Fund at March 31, 2025, as determined on a federal income tax basis, were as follows:
| Aggregate
cost |
$2,151,881,641
|
| Gross
unrealized appreciation |
$
33,800,506 |
| Gross
unrealized depreciation |
(100,806,832)
|
| Net
unrealized depreciation |
$
(67,006,326) |
4 Investment Adviser Fee and Other Transactions
with Affiliates
The investment adviser fee is earned by
Eaton Vance Management (EVM), an indirect, wholly-owned subsidiary of Morgan Stanley, as compensation for investment advisory services rendered to the Fund. The fee is computed at an annual rate of 0.75% of the Fund’s average weekly gross
assets and is payable monthly. Gross assets are calculated by deducting accrued liabilities of the Fund except the principal amount of any indebtedness for money borrowed, including debt securities issued by the Fund, and the amount of any
outstanding preferred shares issued by the Fund. Accrued liabilities are expenses incurred in the normal course of operations. For the year ended March 31, 2025, the investment adviser fee amounted to $14,539,364. EVM also serves as administrator of
the Fund, but receives no compensation.
Eaton Vance
Limited Duration Income Fund
March 31, 2025
Notes to Financial
Statements — continued
Effective April 18, 2024, pursuant to an investment
sub-advisory agreement between EVM and Morgan Stanley Investment Management Limited (“MSIM Ltd.”), an affiliate of EVM and an indirect wholly-owned subsidiary of Morgan Stanley, EVM delegated a portion of the investment management of the
Fund to MSIM Ltd. EVM paid MSIM Ltd. a portion of its investment adviser fee for sub-advisory services provided to the Fund. Effective March 1, 2025, the sub-advisory agreement between EVM and MSIM Ltd. was terminated.
The Fund may invest in a money market fund, the Institutional
Class of the Morgan Stanley Institutional Liquidity Funds - Government Portfolio (the “Liquidity Fund”), an open-end management investment company managed by Morgan Stanley Investment Management Inc., a wholly-owned subsidiary of Morgan
Stanley. The investment adviser fee paid by the Fund is reduced by an amount equal to its pro rata share of the advisory and administration fees paid by the Fund due to its investment in the Liquidity Fund. For the year ended March 31, 2025, the
investment adviser fee paid was reduced by $44,307 relating to the Fund’s investment in the Liquidity Fund.
Trustees and officers of the Fund who are members of
EVM’s organization receive remuneration for their services to the Fund out of the investment adviser fee. Trustees of the Fund who are not affiliated with EVM may elect to defer receipt of all or a percentage of their annual fees in accordance
with the terms of the Trustees Deferred Compensation Plan. Certain officers and Trustees of the Fund are officers of EVM.
5 Purchases and Sales of Investments
Purchases and sales of investments, other than short-term
obligations and including maturities, paydowns, principal repayments on Senior Loans and TBA transactions, for the year ended March 31, 2025 were as follows:
| |
Purchases
|
Sales
|
| Investments
(non-U.S. Government) |
$
480,559,253 |
$
547,050,248 |
| U.S.
Government and Agency Securities |
2,262,038,831
|
2,145,268,984
|
| |
$2,742,598,084
|
$2,692,319,232
|
6 Common Shares of
Beneficial Interest
The Fund may issue common shares
pursuant to its dividend reinvestment plan. There were no common shares issued by the Fund for the years ended March 31, 2025 and March 31, 2024.
In November 2013, the Board of Trustees initially approved a
share repurchase program for the Fund. Pursuant to the reauthorization of the share repurchase program by the Board of Trustees in March 2019, the Fund is authorized to repurchase up to 10% of its common shares outstanding as of the last day of the
prior calendar year at market prices when shares are trading at a discount to net asset value. The share repurchase program does not obligate the Fund to purchase a specific amount of shares. There were no repurchases of common shares by the Fund
for the years ended March 31, 2025 and March 31, 2024.
7 Restricted Securities
At March 31, 2025, the Fund owned the following security
(representing 0.1% of net assets applicable to common shares) which was restricted as to public resale and not registered under the Securities Act of 1933 (excluding Rule 144A securities). The value of restricted securities is determined based on
valuations provided by brokers when available, or if not available, they are valued by the investment adviser as the Trustees' valuation designee.
| Description
|
Date(s)
of
Acquisition |
Shares
|
Cost
|
Value
|
| Common
Stocks |
|
|
|
|
| Enviva
LLC |
12/6/24
|
58,260
|
$
364,607 |
$
917,595 |
| Total
Restricted Securities |
|
|
$364,607
|
$917,595
|
8 Financial
Instruments
The Fund may trade in financial instruments
with off-balance sheet risk in the normal course of its investing activities. These financial instruments may include forward foreign currency exchange contracts, futures contracts and swap contracts and may involve, to a varying degree, elements of
risk in excess
Eaton Vance
Limited Duration Income Fund
March 31, 2025
Notes to Financial
Statements — continued
of the amounts
recognized for financial statement purposes. The notional or contractual amounts of these instruments represent the investment the Fund has in particular classes of financial instruments and do not necessarily represent the amounts
potentially subject to risk. The measurement of the risks associated with these instruments is meaningful only when all related and offsetting transactions are considered. A summary of obligations under these financial instruments at March 31,
2025 is included in the Portfolio of Investments. At March 31, 2025, the Fund had sufficient cash and/or securities to cover commitments under these contracts.
In the normal course of pursuing its investment objectives, the
Fund is subject to the following risks:
Credit Risk: The
Fund enters into credit default swap contracts to enhance total return and/or as a substitute for the purchase of securities.
Foreign Exchange Risk: The Fund holds foreign currency
denominated investments. The value of these investments and related receivables and payables may change due to future changes in foreign currency exchange rates. To hedge against this risk, the Fund enters into forward foreign currency exchange
contracts.
Interest Rate Risk: The Fund enters into
interest rate futures contracts to manage the duration of its portfolio and to hedge against fluctuations in securities prices due to interest rates.
The Fund enters into over-the-counter (OTC) derivatives that
may contain provisions whereby the counterparty may terminate the contract under certain conditions, including but not limited to a decline in the Fund's net assets below a certain level over a certain period of time, which would trigger a payment
by the Fund for those derivatives in a liability position. At March 31, 2025, the fair value of derivatives with credit-related contingent features in a net liability position was $4,712,152. The aggregate fair value of assets pledged as collateral
by the Fund for such liability was $7,547,605 at March 31, 2025.
The OTC derivatives in which the Fund invests are subject to
the risk that the counterparty to the contract fails to perform its obligations under the contract. To mitigate this risk, the Fund has entered into an International Swaps and Derivatives Association, Inc. Master Agreement (“ISDA Master
Agreement”) or similar agreement with substantially all its derivative counterparties. An ISDA Master Agreement is a bilateral agreement between the Fund and a counterparty that governs certain OTC derivatives and typically contains, among
other things, set-off provisions in the event of a default and/or termination event as defined under the relevant ISDA Master Agreement. Under an ISDA Master Agreement, the Fund may, under certain circumstances, offset with the counterparty certain
derivative financial instruments’ payables and/or receivables with collateral held and/or posted and create one single net payment. The provisions of the ISDA Master Agreement typically permit a single net payment in the event of default
including the bankruptcy or insolvency of the counterparty. However, bankruptcy or insolvency laws of a particular jurisdiction may impose restrictions on or prohibitions against the right of offset in bankruptcy or insolvency. Certain ISDA Master
Agreements allow counterparties to OTC derivatives to terminate derivative contracts prior to maturity in the event the Fund’s net assets decline by a stated percentage or the Fund fails to meet the terms of its ISDA Master Agreements, which
would cause the counterparty to accelerate payment by the Fund of any net liability owed to it.
The collateral requirements for derivatives traded under an
ISDA Master Agreement are governed by a Credit Support Annex to the ISDA Master Agreement. Collateral requirements are determined at the close of business each day and are typically based on changes in market values for each transaction under an
ISDA Master Agreement and netted into one amount for such agreement. Generally, the amount of collateral due from or to a counterparty is subject to a minimum transfer threshold amount before a transfer is required, which may vary by counterparty.
Collateral pledged for the benefit of the Fund and/or counterparty is held in segregated accounts by the Fund’s custodian and cannot be sold, re-pledged, assigned or otherwise used while pledged. The portion of such collateral representing
cash, if any, is reflected as deposits for derivatives collateral and, in the case of cash pledged by a counterparty for the benefit of the Fund, a corresponding liability on the Statement of Assets and Liabilities. Securities pledged by the Fund as
collateral, if any, are identified as such in the Portfolio of Investments. The carrying amount of the liability for cash collateral due to brokers at March 31, 2025 approximated its fair value. If measured at fair value, such liability would have
been considered as Level 2 in the fair value hierarchy (see Note 11) at March 31, 2025.
Eaton Vance
Limited Duration Income Fund
March 31, 2025
Notes to Financial
Statements — continued
The
fair value of open derivative instruments (not considered to be hedging instruments for accounting disclosure purposes) by risk exposure at March 31, 2025 was as follows:
| |
Fair
Value |
| Statement
of Assets and Liabilities Caption |
Credit
|
Foreign
Exchange |
Interest
Rate |
Total
|
| Accumulated
loss |
$
1,896* |
$
64,230* |
$
1,471,586* |
$
1,537,712 |
| Receivable
for open forward foreign currency exchange contracts |
—
|
31,322
|
—
|
31,322
|
| Receivable
for open swap contracts |
7,778
|
—
|
—
|
7,778
|
| Total
Asset Derivatives |
$
9,674 |
$
95,552 |
$1,471,586
|
$
1,576,812 |
| Derivatives
not subject to master netting or similar agreements |
$
1,896 |
$
64,230 |
$1,471,586
|
$
1,537,712 |
| Total
Asset Derivatives subject to master netting or similar agreements |
$
7,778 |
$
31,322 |
$
— |
$
39,100 |
| Accumulated
loss |
$
(22,050)* |
$
(2,679)* |
$
(87,572)* |
$
(112,301) |
| Payable
for open forward foreign currency exchange contracts |
—
|
(4,618,517)
|
—
|
(4,618,517)
|
| Payable
for open swap contracts; Upfront receipts on open OTC swap contracts |
(93,635)
|
—
|
—
|
(93,635)
|
| Total
Liability Derivatives |
$(115,685)
|
$(4,621,196)
|
$
(87,572) |
$(4,824,453)
|
| Derivatives
not subject to master netting or similar agreements |
$
(22,050) |
$
(2,679) |
$
(87,572) |
$
(112,301) |
| Total
Liability Derivatives subject to master netting or similar agreements |
$
(93,635) |
$(4,618,517)
|
$
— |
$(4,712,152)
|
| *
|
For
futures contracts and centrally cleared derivatives, amount represents value as shown in the Portfolio of Investments. Only the current day’s variation margin on open futures contracts and centrally cleared derivatives is reported within the
Statement of Assets and Liabilities as Receivable or Payable for variation margin on open futures contracts and centrally cleared derivatives, as applicable. |
The Fund's derivative assets and liabilities at fair value by
risk, which are reported gross in the Statement of Assets and Liabilities, are presented in the table above. The following tables present the Fund's derivative assets and liabilities by counterparty, net of amounts available for offset under a
master netting agreement and net of the related collateral received by the Fund for such assets and pledged by the Fund for such liabilities as of March 31, 2025.
| Counterparty
|
Derivative
Assets Subject to
Master Netting
Agreement |
Derivatives
Available
for Offset |
Non-cash
Collateral
Received(a) |
Cash
Collateral
Received(a) |
Net
Amount
of Derivative
Assets(b) |
Total
Cash
Collateral
Received |
| Goldman
Sachs International |
$
13,789 |
$
(13,789) |
$
— |
$
— |
$
— |
$
— |
| HSBC
Bank USA, N.A. |
6,008
|
(5,123)
|
—
|
—
|
885
|
—
|
| State
Street Bank and Trust Company |
56
|
(56)
|
—
|
—
|
—
|
—
|
| The
Royal Bank of Scotland PLC |
7,374
|
(7,374)
|
—
|
—
|
—
|
—
|
| UBS
AG |
11,873
|
(3,093)
|
—
|
—
|
8,780
|
—
|
| |
$39,100
|
$(29,435)
|
$
— |
$
— |
$9,665
|
$
— |
Eaton Vance
Limited Duration Income Fund
March 31, 2025
Notes to Financial
Statements — continued
| Counterparty
|
Derivative
Liabilities Subject to
Master Netting
Agreement |
Derivatives
Available
for Offset |
Non-cash
Collateral
Pledged(a) |
Cash
Collateral
Pledged(a) |
Net
Amount
of Derivative
Liabilities(c) |
Total
Cash
Collateral
Pledged |
| Australia
and New Zealand Banking Group Limited |
$
(276,866) |
$
— |
$
— |
$
270,000 |
$
(6,866) |
$
270,000 |
| Bank
of America, N.A. |
(29,379)
|
—
|
—
|
—
|
(29,379)
|
—
|
| Citibank,
N.A. |
(335,212)
|
—
|
—
|
321,000
|
(14,212)
|
321,000
|
| Deutsche
Bank AG |
(17,984)
|
—
|
—
|
—
|
(17,984)
|
—
|
| Goldman
Sachs International |
(1,335,433)
|
13,789
|
1,321,644
|
—
|
—
|
1,590,000
|
| HSBC
Bank USA, N.A. |
(5,123)
|
5,123
|
—
|
—
|
—
|
—
|
| Standard
Chartered Bank |
(1,777,895)
|
—
|
86,899
|
1,523,000
|
(167,996)
|
1,523,000
|
| State
Street Bank and Trust Company |
(923,323)
|
56
|
—
|
923,267
|
—
|
1,680,000
|
| The
Royal Bank of Scotland PLC |
(7,844)
|
7,374
|
—
|
—
|
(470)
|
—
|
| UBS
AG |
(3,093)
|
3,093
|
—
|
—
|
—
|
—
|
| |
$(4,712,152)
|
$29,435
|
$1,408,543
|
$3,037,267
|
$(236,907)
|
$5,384,000
|
| Total
— Deposits for derivatives collateral — OTC derivatives |
|
|
|
$5,384,000
|
|
(a) |
In some
instances, the total collateral received and/or pledged may be more than the amount shown due to overcollateralization. |
|
(b) |
Net
amount represents the net amount due from the counterparty in the event of default. |
|
(c) |
Net
amount represents the net amount payable to the counterparty in the event of default. |
The effect of derivative instruments (not considered to be
hedging instruments for accounting disclosure purposes) on the Statement of Operations by risk exposure for the year ended March 31, 2025 was as follows:
| Statement
of Operations Caption |
Credit
|
Foreign
Exchange |
Interest
Rate |
Total
|
| Net
realized gain (loss): |
|
|
|
|
| Futures
contracts |
$
— |
$
— |
$
(5,153,671) |
$
(5,153,671) |
| Swap
contracts |
102,395
|
—
|
—
|
102,395
|
| Forward
foreign currency exchange contracts |
—
|
7,299,689
|
—
|
7,299,689
|
| Total
|
$102,395
|
$
7,299,689 |
$(5,153,671)
|
$
2,248,413 |
| Change
in unrealized appreciation (depreciation): |
|
|
|
|
| Futures
contracts |
$
— |
$
— |
$
1,560,023 |
$
1,560,023 |
| Swap
contracts |
(36,038)
|
—
|
—
|
(36,038)
|
| Forward
foreign currency exchange contracts |
—
|
(5,399,806)
|
—
|
(5,399,806)
|
| Total
|
$
(36,038) |
$(5,399,806)
|
$
1,560,023 |
$(3,875,821)
|
Eaton Vance
Limited Duration Income Fund
March 31, 2025
Notes to Financial
Statements — continued
The
average notional cost of futures contracts and average notional amounts of other derivative contracts outstanding during the year ended March 31, 2025, which are indicative of the volume of these derivative types, were approximately as
follows:
Futures
Contracts — Long |
Futures
Contracts — Short |
Forward
Foreign Currency
Exchange Contracts* |
Swap
Contracts |
| $363,090,000
|
$88,217,000
|
$232,661,000
|
$5,469,000
|
| *
|
The
average notional amount for forward foreign currency exchange contracts is based on the absolute value of notional amounts of currency purchased and currency sold. |
9 Credit Agreement
The Fund has entered into a Credit Agreement, as amended (the
Agreement) with major financial institutions to borrow up to $625 million. Borrowings under the Agreement are secured by the assets of the Fund. Interest is charged at a rate above either the Secured Overnight Financing Rate (SOFR) or the Federal
Funds rate and is payable monthly. Under the terms of the Agreement, in effect through December 11, 2025, the Fund pays a facility fee of 0.25% per annum on the borrowing limit. In connection with the renewal of the Agreement on December 14, 2023,
the Fund paid an upfront fee of $1,375,000 which is being amortized to interest expense over a period of two years through December 2025. The unamortized balance at March 31, 2025 is approximately $480,000 and is included in prepaid upfront fees on
notes payable on the Statement of Assets and Liabilities. The Fund is required to maintain certain net asset levels during the term of the Agreement. At March 31, 2025, the Fund had borrowings outstanding under the Agreement of $553,000,000 at an
annual interest rate of 5.37%. Based on the short-term nature of the borrowings under the Agreement and the variable interest rate, the carrying amount of the borrowings at March 31, 2025 approximated its fair value. If measured at fair value,
borrowings under the Agreement would have been considered as Level 2 in the fair value hierarchy (see Note 11) at March 31, 2025. Facility fees for the year ended March 31, 2025 totaled $1,451,732 and are included in interest expense and fees on the
Statement of Operations. For the year ended March 31, 2025, the average borrowings under the Agreement and the average annual interest rate (excluding fees) were $496,106,849 and 5.99%, respectively.
10 Affiliated Investments
At March 31, 2025, the value of the Fund's investment in
issuers and funds that may be deemed to be affiliated was $34,058,305, which represents 2.8% of the Fund's net assets applicable to common shares. Transactions in such investments by the Fund for the year ended March 31, 2025 were as
follows:
| Name
|
Value,
beginning
of period |
Purchases
|
Sales
proceeds |
Net
realized
gain (loss) |
Change
in
unrealized
appreciation
(depreciation) |
Value,
end
of period |
Interest/
Dividend
income |
Principal
amount/
Shares, end
of period |
| Commercial
Mortgage-Backed Securities |
|
|
|
|
|
|
|
|
| Morgan
Stanley Bank of America Merrill Lynch Trust: |
|
|
|
|
|
|
|
|
| Series
2014-C16, Class B, 4.225%, 6/15/47 |
$ 342,235
|
$
— |
$
(324,108) |
$
— |
$
(7,261) |
$
38,658 |
$
34,361 |
$ 38,892
|
| Series
2015-C23, Class D, 4.137%, 7/15/50 |
2,332,746
|
—
|
—
|
—
|
225,522
|
2,572,543
|
126,260
|
2,670,000
|
| Series
2016-C29, Class D, 3.00%, 5/15/49 |
2,924,627
|
—
|
—
|
—
|
(22,626)
|
2,922,877
|
128,197
|
3,577,365
|
| Series
2016-C32, Class D, 3.396%, 12/15/49 |
1,040,095
|
—
|
—
|
—
|
166,172
|
1,221,020
|
69,090
|
1,600,000
|
| Morgan
Stanley Capital I Trust: |
|
|
|
|
|
|
|
|
| Series
2016-UBS12, Class D, 3.312%, 12/15/49 |
2,306,494
|
—
|
—
|
—
|
224,557
|
2,565,511
|
154,952
|
4,488,667
|
| Series
2019-BPR, Class C, 8.968%, (1 mo. SOFR + 3.642%), 5/15/36 |
1,798,105 |
—
|
(1,845,000)
|
—
|
46,895
|
—
|
20,227 |
—
|
Eaton Vance
Limited Duration Income Fund
March 31, 2025
Notes to Financial
Statements — continued
| Name
|
Value,
beginning
of period |
Purchases
|
Sales
proceeds |
Net
realized
gain (loss) |
Change
in
unrealized
appreciation
(depreciation) |
Value,
end
of period |
Interest/
Dividend
income |
Principal
amount/
Shares, end
of period |
| Short-Term
Investments |
| Liquidity
Fund |
$21,711,062
|
$852,019,968
|
$(848,993,334)
|
$
— |
$
— |
$
24,737,696 |
$
1,511,427 |
24,737,696
|
| Total
|
|
|
|
$ —
|
$633,259
|
$34,058,305
|
$2,044,514
|
|
11 Fair Value Measurements
Under generally accepted accounting principles for fair value
measurements, a three-tier hierarchy to prioritize the assumptions, referred to as inputs, is used in valuation techniques to measure fair value. The three-tier hierarchy of inputs is summarized in the three broad levels listed below.
| •
|
Level 1 – quoted prices
in active markets for identical investments |
| •
|
Level 2 – other
significant observable inputs (including quoted prices for similar investments, interest rates, prepayment speeds, credit risk, etc.) |
| •
|
Level 3
– significant unobservable inputs (including a fund's own assumptions in determining the fair value of investments) |
In cases where the inputs used to measure fair value fall in
different levels of the fair value hierarchy, the level disclosed is determined based on the lowest level input that is significant to the fair value measurement in its entirety. The inputs or methodology used for valuing securities are not
necessarily an indication of the risk associated with investing in those securities.
At March 31, 2025, the hierarchy of inputs used in valuing the
Fund's investments and open derivative instruments, which are carried at fair value, were as follows:
| Asset
Description |
Level
1 |
Level
2 |
Level
3* |
Total
|
| Asset-Backed
Securities |
$
— |
$
147,570,105 |
$
— |
$
147,570,105 |
| Closed-End
Funds |
20,966,587
|
—
|
—
|
20,966,587
|
| Collateralized
Mortgage Obligations |
—
|
409,960,396
|
—
|
409,960,396
|
| Commercial
Mortgage-Backed Securities |
—
|
55,723,011
|
—
|
55,723,011
|
| Common
Stocks |
140,585
|
9,680,822
|
1,152,847
|
10,974,254
|
| Convertible
Bonds |
—
|
2,287,736
|
—
|
2,287,736
|
| Corporate
Bonds |
—
|
572,826,828
|
0
|
572,826,828
|
| Preferred
Stocks |
—
|
414,344
|
—
|
414,344
|
| Senior
Floating-Rate Loans (Less Unfunded Loan Commitments) |
—
|
548,783,126
|
1,178,188
|
549,961,314
|
| Sovereign
Government Bonds |
—
|
49,708,213
|
—
|
49,708,213
|
| Sovereign
Loans |
—
|
3,754,719
|
—
|
3,754,719
|
| U.S.
Government Agency Mortgage-Backed Securities |
—
|
232,011,013
|
—
|
232,011,013
|
| Warrants
|
17
|
—
|
—
|
17
|
| Miscellaneous
|
—
|
70,102
|
0
|
70,102
|
| Short-Term
Investments: |
|
|
|
|
| Affiliated
Fund |
24,737,696
|
—
|
—
|
24,737,696
|
| U.S.
Treasury Obligations |
—
|
3,981,274
|
—
|
3,981,274
|
| Total
Investments |
$
45,844,885 |
$
2,036,771,689 |
$
2,331,035 |
$
2,084,947,609 |
| Forward
Foreign Currency Exchange Contracts |
$
— |
$
95,552 |
$
— |
$
95,552 |
| Futures
Contracts |
1,471,586
|
—
|
—
|
1,471,586
|
| Swap
Contracts |
—
|
9,674
|
—
|
9,674
|
| Total
|
$
47,316,471 |
$
2,036,876,915 |
$
2,331,035 |
$
2,086,524,421 |
Eaton Vance
Limited Duration Income Fund
March 31, 2025
Notes to Financial
Statements — continued
| Liability
Description |
Level
1 |
Level
2 |
Level
3 |
Total
|
| TBA
Sale Commitments |
$
— |
$
(15,357,797) |
$
— |
$
(15,357,797) |
| Forward
Foreign Currency Exchange Contracts |
—
|
(4,621,196)
|
—
|
(4,621,196)
|
| Futures
Contracts |
(87,572)
|
—
|
—
|
(87,572)
|
| Swap
Contracts |
—
|
(115,685)
|
—
|
(115,685)
|
| Total
|
$
(87,572) |
$
(20,094,678) |
$ —
|
$
(20,182,250) |
| *
|
None
of the unobservable inputs for Level 3 assets, individually or collectively, had a material impact on the Fund. |
Level 3 investments at the beginning and/or end of the period
in relation to net assets were not significant and accordingly, a reconciliation of Level 3 assets for the year ended March 31, 2025 is not presented.
12 Risks and Uncertainties
Risks Associated with Foreign Investments
Foreign investments can be adversely affected by political,
economic and market developments abroad, including the imposition of economic and other sanctions by the United States or another country, and by acts of terrorism and war. There may be less publicly available information about foreign issuers
because they may not be subject to reporting practices, requirements or regulations comparable to those to which United States companies are subject. Foreign markets may be smaller, less liquid and more volatile than the major markets in the United
States. Trading in foreign markets typically involves higher expense than trading in the United States. The Fund may have difficulties enforcing its legal or contractual rights in a foreign country. Securities that trade or are denominated in
currencies other than the U.S. dollar may be adversely affected by fluctuations in currency exchange rates.
13 Commitments and Contingencies
In connection with the Serta Chapter 11 bankruptcy proceeding,
on December 31, 2024, the U.S. Fifth Circuit Court of Appeals reversed a bankruptcy court’s ruling that held permissible an “uptier” agreement (the “2020 Agreement”) entered into by Serta with certain participating
lenders, including the Fund. The 2020 Agreement had the effect of subordinating the existing debt of certain non-participating lenders to that of the participating lenders. The non-participating lenders brought claims for breach of contract, arguing
that the participating lenders had breached an earlier agreement by entering into the 2020 Agreement. The appellate court found that the bankruptcy court had erred in determining that the 2020 Agreement was permitted by the terms of the earlier
agreement and remanded the breach of contract claims for further consideration by the bankruptcy court. The appellate court further held that indemnification of the participating lenders in the 2020 Agreement was impermissible under the U.S.
Bankruptcy Code.
A request by the Fund and the other
participating lenders for a rehearing of this matter before the Fifth Circuit en banc was denied. The matter has been remanded to the bankruptcy court to determine whether the participating lenders are liable for the breach of contract claims. At
this time, the Fund cannot reliably predict the outcome of these proceedings or the effect, if any, on the Fund's net asset value.
14 Additional Information
On August 27, 2020, the Fund’s Board of Trustees (the
“Board”) received a shareholder demand letter from counsel to Saba Capital Master Fund, Ltd., a hedge fund (“Saba”). Saba also filed claims against the Fund in a lawsuit in Suffolk County Superior Court in Massachusetts
asserting breach of contract and fiduciary duty by the Fund and certain of its affiliates, the Fund’s adviser, and the Board, following the implementation by the Fund of a by-law amendment that requires trustee nominees in contested elections
to obtain affirmative votes of a majority of eligible shares in order to be elected. With respect to the Fund, Saba sought rescission of this by-law provision and certain related relief. On March 31, 2021, the court allowed in part and denied in
part a motion to dismiss Saba’s claims. On January 23, 2023, in ruling on the parties’ cross-motions for partial summary judgment, the court dismissed Saba’s claims for breach of fiduciary duty against the Board. Following a bench
trial that took place September 9-17, 2024, the court ruled in the Fund's favor on October 21, 2024 on Saba's remaining claims, finding that the majority voting standard by-law did not violate the 1940 Act or breach the Fund's declaration of trust
as Saba alleged. The trial court proceedings are now complete, as Saba has indicated it will not seek appeal of the court’s decision.
Eaton Vance
Limited Duration Income Fund
March 31, 2025
Report of Independent
Registered Public Accounting Firm
To the
Trustees and Shareholders of Eaton Vance Limited Duration Income Fund:
Opinion on the Financial Statements and Financial
Highlights
We have audited the accompanying
statement of assets and liabilities of Eaton Vance Limited Duration Income Fund (the “Fund”), including the portfolio of investments, as of March 31, 2025, the related statements of operations and cash flows for the year then ended, the
statements of changes in net assets for each of the two years in the period then ended, the financial highlights for each of the five years in the period then ended, and the related notes. In our opinion, the financial statements and financial
highlights present fairly, in all material respects, the financial position of the Fund as of March 31, 2025, and the results of its operations and its cash flows for the year then ended, the changes in its net assets for each of the two years in
the period then ended, and the financial highlights for each of the five years in the period then ended, in conformity with accounting principles generally accepted in the United States of America.
Basis for Opinion
These financial statements and financial highlights are the
responsibility of the Fund’s management. Our responsibility is to express an opinion on the Fund's financial statements and financial highlights based on our audits. We are a public accounting firm registered with the Public Company Accounting
Oversight Board (United States) (PCAOB) and are required to be independent with respect to the Fund in accordance with the U.S. federal securities laws and the applicable rules and regulations of the Securities and Exchange Commission and the
PCAOB.
We conducted our audits in accordance with
the standards of the PCAOB. Those standards require that we plan and perform the audit to obtain reasonable assurance about whether the financial statements and financial highlights are free of material misstatement, whether due to error or fraud.
The Fund is not required to have, nor were we engaged to perform, an audit of its internal control over financial reporting. As part of our audits, we are required to obtain an understanding of internal control over financial reporting but not for
the purpose of expressing an opinion on the effectiveness of the Fund’s internal control over financial reporting. Accordingly, we express no such opinion.
Our audits included performing procedures to assess the risks
of material misstatement of the financial statements and financial highlights, whether due to error or fraud, and performing procedures that respond to those risks. Such procedures included examining, on a test basis, evidence regarding the amounts
and disclosures in the financial statements and financial highlights. Our audits also included evaluating the accounting principles used and significant estimates made by management, as well as evaluating the overall presentation of the financial
statements and financial highlights. Our procedures included confirmation of securities and senior loans owned as of March 31, 2025, by correspondence with the custodian, brokers and agent banks; when replies were not received from brokers and agent
banks, we performed other auditing procedures. We believe that our audits provide a reasonable basis for our opinion.
/s/ Deloitte & Touche LLP
Boston, Massachusetts
May 21, 2025
We have served as the auditor of one or
more Eaton Vance investment companies since 1959.
Eaton Vance
Limited Duration Income Fund
March 31, 2025
Federal Tax
Information (Unaudited)
The
Form 1099-DIV you receive in February 2026 will show the tax status of all distributions paid to your account in calendar year 2025. Shareholders are advised to consult their own tax adviser with respect to the tax consequences of their
investment in the Fund. As required by the Internal Revenue Code and/or regulations, shareholders must be notified regarding the status of qualified dividend income for individuals and 163(j) interest dividends.
Qualified Dividend Income. For
the fiscal year ended March 31, 2025, the Fund designates approximately $37,684, or up to the maximum amount of such dividends allowable pursuant to the Internal Revenue Code, as qualified dividend income eligible for the reduced tax rate of
15%.
163(j) Interest Dividends. For the fiscal year ended March 31, 2025, the Fund designates 51.08% of distributions from net investment income as a 163(j) interest dividend.
Eaton Vance
Limited Duration Income Fund
March 31, 2025
Annual Meeting of
Shareholders (Unaudited)
The
Fund held its Annual Meeting of Shareholders on January 8, 2025. The following action was taken by the shareholders:
Proposal 1(a): The election of
Cynthia E. Frost, Valerie A. Mosley and Scott E. Wennerholm as Class I Trustees of the Fund for a three-year term expiring in 2028.
The following votes were cast by the Fund’s common and
APS shareholders, voting together as a single class:
| |
|
|
Number
of Shares |
| Nominees
for Trustee |
|
|
For
|
Withheld
|
| Cynthia
E. Frost |
|
|
83,201,549
|
1,579,142
|
| Valerie
A. Mosley |
|
|
82,368,378
|
2,412,313
|
| Scott
E. Wennerholm |
|
|
83,155,655
|
1,625,036
|
Eaton Vance
Limited Duration Income Fund
March 31, 2025
Dividend Reinvestment
Plan
The Fund offers a dividend reinvestment plan (Plan) pursuant to
which shareholders may elect to have distributions automatically reinvested in common shares (Shares) of the Fund. You may elect to participate in the Plan by completing the Dividend Reinvestment Plan Application Form. If you do not participate, you
will receive all distributions in cash paid by check mailed directly to you by Equiniti Trust Company, LLC (“EQ”) as dividend paying agent. On the distribution payment date, if the NAV per Share is equal to or less than the market price
per Share plus estimated brokerage commissions, then new Shares will be issued. The number of Shares shall be determined by the greater of the NAV per Share or 95% of the market price. Otherwise, Shares generally will be purchased on the open market
by EQ, the Plan agent (Agent). Distributions subject to income tax (if any) are taxable whether or not Shares are reinvested.
If your Shares are in the name of a brokerage firm, bank, or
other nominee, you can ask the firm or nominee to participate in the Plan on your behalf. If the nominee does not offer the Plan, you will need to request that the Fund’s transfer agent re-register your Shares in your name or you will not be
able to participate.
The Agent’s service fee for
handling distributions will be paid by the Fund. Plan participants will be charged their pro rata share of brokerage commissions on all open-market purchases.
Plan participants may withdraw from the Plan at any time by
writing to the Agent at the address noted on the following page. If you withdraw, you will receive Shares in your name for all Shares credited to your account under the Plan. If a participant elects by written notice to the Agent to sell part or all
of his or her Shares and remit the proceeds, the Agent is authorized to deduct a $5.00 fee plus brokerage commissions from the proceeds.
If you wish to participate in the Plan and your Shares are held
in your own name, you may complete the form on the following page and deliver it to the Agent. Any inquiries regarding the Plan can be directed to the Agent at 1-866-439-6787.
Eaton Vance
Limited Duration Income Fund
March 31, 2025
Application for
Participation in Dividend Reinvestment Plan
This form is for shareholders who hold
their common shares in their own names. If your common shares are held in the name of a brokerage firm, bank, or other nominee, you should contact your nominee to see if it will participate in the Plan on your behalf. If you wish to participate in
the Plan, but your brokerage firm, bank, or nominee is unable to participate on your behalf, you should request that your common shares be re-registered in your own name which will enable your participation in the Plan.
The following authorization and appointment
is given with the understanding that I may terminate it at any time by terminating my participation in the Plan as provided in the terms and conditions of the Plan.
| |
| Please
print exact name on account |
|
| |
| Shareholder
signature |
Date
|
| |
| Shareholder
signature |
Date
|
| Please
sign exactly as your common shares are registered. All persons whose names appear on the share certificate must sign. |
YOU SHOULD NOT RETURN THIS FORM IF YOU WISH TO
RECEIVE YOUR DISTRIBUTIONS IN CASH. THIS IS NOT A PROXY.
This authorization form, when signed, should
be mailed to the following address:
Eaton Vance Limited Duration Income
Fund
c/o Equiniti Trust Company, LLC (“EQ”)
P.O. Box 10027
Newark, NJ 07101
Eaton Vance
Limited Duration Income Fund
March 31, 2025
Management and
Organization
Fund
Management. The Board of Trustees of the Fund (the “Board”) is responsible for the overall management and supervision of the affairs of the Fund. The Board members and officers of the Fund are listed
below. Except as indicated, each individual has held the office shown or other offices in the same company for the last five years. Each Trustee holds office until the annual meeting for the year in which his or her term expires and until his or her
successor is elected and qualified, subject to a prior death, resignation, retirement, disqualification or removal. Under the terms of the Fund’s current Trustee retirement policy, an Independent Trustee must retire and resign as a Trustee on
the earlier of: (i) the first day of July following his or her 76th birthday; or (ii), with limited exception, December 31st of the 20th year in which he or she has served as a Trustee. However, if such retirement and resignation would cause the
Fund to be out of compliance with Section 16 of the 1940 Act or any other regulations or guidance of the Securities and Exchange Commission, then such retirement and resignation will not become effective until such time as action has been taken for
the Fund to be in compliance therewith. The “noninterested Trustees” consist of those Trustees who are not “interested persons” of the Fund, as that term is defined under the 1940 Act. The business address of each Board
member and officer is One Post Office Square, Boston, Massachusetts 02109. As used below, “BMR” refers to Boston Management and Research, “EV” refers to EV LLC, “EVM” refers to Eaton Vance Management,
“MSIM” refers to Morgan Stanley Investment Management Inc. and “EVD” refers to Eaton Vance Distributors, Inc. EV is the trustee of each of EVM and BMR. Each of EVM, BMR, EVD and EV are indirect, wholly owned subsidiaries of
Morgan Stanley. Each officer affiliated with EVM may hold a position with other EVM affiliates that is comparable to his or her position with EVM listed below. Each Trustee oversees 123 funds in the Eaton Vance fund complex (including both funds and
portfolios in a hub and spoke structure).
| Name
and Year of Birth |
Fund
Position(s) |
Length
of Service |
Principal
Occupation(s) and Other Directorships
During Past Five Years and Other Relevant Experience |
| Noninterested Trustees
|
Alan
C. Bowser
1962 |
Class
III
Trustee |
Until
2027.
3 years.
Since 2023. |
Private investor.
Formerly, Co-Head of the Americas Region, Chief Diversity Officer, Partner and a Member of the Operating Committee, at Bridgewater Associates, an asset management firm (2011-2023). Formerly, Managing Director and Head of Investment Services at UBS
Wealth Management Americas (2007-2010). Formerly, Managing Director and Head of Client Solutions, Citibank Private Bank (1999 - 2007).
Other Directorships. Independent Director of Stout Risius Ross (a
middle market professional services advisory firm) (since 2021). |
Mark
R. Fetting
1954 |
Class
II
Trustee |
Until
2026.
3 years.
Since 2016. |
Private investor.
Formerly held various positions at Legg Mason, Inc. (investment management firm) (2000-2012), including President, Chief Executive Officer, Director and Chairman (2008-2012), Senior Executive Vice President (2004-2008) and Executive Vice President
(2001-2004). Formerly, President of Legg Mason family of funds (2001-2008). Formerly, Division President and Senior Officer of Prudential Financial Group, Inc. and related companies (investment management firm) (1991-2000).
Other Directorships. None. |
Cynthia
E. Frost
1961 |
Class
I
Trustee |
Until
2028.
3 years.
Since 2014. |
Private investor.
Formerly, Chief Investment Officer of Brown University (university endowment) (2000-2012). Formerly, Portfolio Strategist for Duke Management Company (university endowment manager) (1995-2000). Formerly, Managing Director, Cambridge Associates
(investment consulting company) (1989-1995). Formerly, Consultant, Bain and Company (management consulting firm) (1987-1989). Formerly, Senior Equity Analyst, BA Investment Management Company (1983-1985).
Other
Directorships. None. |
George
J. Gorman(1)
1952 |
Chairperson
of the Board
and Class III
Trustee |
Until
2027.
3 years.
Chairperson of the Board since 2021 and Trustee since 2014. |
Principal
at George J. Gorman LLC (consulting firm). Formerly, Senior Partner at Ernst & Young LLP (a registered public accounting firm) (1974-2009).
Other Directorships. None. |
Valerie
A. Mosley
1960 |
Class
I
Trustee |
Until
2028.
3 years.
Since 2014. |
Chairwoman
and Chief Executive Officer of Valmo Ventures (a consulting and investment firm). Founder of Upward Wealth, Inc., dba BrightUp, a fintech platform. Formerly, Partner and Senior Vice President, Portfolio Manager and Investment Strategist at
Wellington Management Company, LLP (investment management firm) (1992-2012). Formerly, Chief Investment Officer, PG Corbin Asset Management (1990-1992). Formerly worked in institutional corporate bond sales at Kidder Peabody (1986-1990).
Other Directorships. Director of DraftKings, Inc. (digital sports entertainment and gaming company) (since September 2020). Director of Envestnet, Inc. (provider of intelligent systems for wealth management and
financial wellness) (since 2018). Formerly, Director of Dynex Capital, Inc. (mortgage REIT) (2013-2020) and Director of Groupon, Inc. (e-commerce provider) (2020-2022). |
Eaton Vance
Limited Duration Income Fund
March 31, 2025
Management and
Organization — continued
| Name
and Year of Birth |
Fund
Position(s) |
Length
of Service |
Principal
Occupation(s) and Other Directorships
During Past Five Years and Other Relevant Experience |
| Noninterested Trustees
(continued) |
Keith
Quinton
1958 |
Class
II
Trustee |
Until
2026.
3 years.
Since 2018. |
Private investor,
researcher and lecturer. Formerly, Independent Investment Committee Member at New Hampshire Retirement System (2017-2021). Formerly, Portfolio Manager and Senior Quantitative Analyst at Fidelity Investments (investment management firm)
(2001-2014).
Other Directorships. Formerly, Director (2016-2021) and Chairman (2019-2021) of New Hampshire Municipal Bond Bank. |
Marcus
L. Smith
1966 |
Class
III
Trustee |
Until
2027.
3 years.
Since 2018. |
Private investor
and independent corporate director. Formerly, Chief Investment Officer, Canada (2012-2017), Chief Investment Officer, Asia (2010-2012), Director of Asian Research (2004-2010) and portfolio manager (2001-2017) at MFS Investment Management
(investment management firm).
Other Directorships. Director of First Industrial Realty Trust, Inc. (an industrial REIT) (since 2021). Director of MSCI Inc. (global provider of investment decision support
tools) (since 2017). Formerly, Director of DCT Industrial Trust Inc. (logistics real estate company) (2017-2018). |
Nancy
Wiser Stefani(1)
1967 |
Class
II
Trustee |
Until
2026.
3 years.
Since 2022. |
Formerly,
Executive Vice President and the Global Head of Operations at Wells Fargo Asset Management (2011-2021).
Other Directorships. None. |
Susan
J. Sutherland
1957 |
Class
III
Trustee |
Until
2027.
3 years.
Since 2015. |
Private investor.
Director of Ascot Group Limited and certain of its subsidiaries (insurance and reinsurance) (since 2017). Formerly, Director of Hagerty Holding Corp. (insurance) (2015-2018) and Montpelier Re Holdings Ltd. (insurance and reinsurance) (2013-2015).
Formerly, Associate, Counsel and Partner at Skadden, Arps, Slate, Meagher & Flom LLP (law firm) (1982-2013).
Other Directorships. Formerly, Director of Kairos Acquisition Corp. (insurance/InsurTech
acquisition company) (2021-2023). |
Scott
E. Wennerholm
1959 |
Class
I
Trustee |
Until
2028.
3 years.
Since 2016. |
Private
investor. Formerly, Trustee at Wheelock College (postsecondary institution) (2012-2018). Formerly, Consultant at GF Parish Group (executive recruiting firm) (2016-2017). Formerly, Chief Operating Officer and Executive Vice President at BNY Mellon
Asset Management (investment management firm) (2005-2011). Formerly, Chief Operating Officer and Chief Financial Officer at Natixis Global Asset Management (investment management firm) (1997-2004). Formerly, Vice President at Fidelity Investments
Institutional Services (investment management firm) (1994-1997).
Other Directorships. None. |
| Name
and Year of Birth |
Fund
Position(s) |
Length
of Service |
Principal
Occupation(s)
During Past Five Years |
| Principal
Officers who are not Trustees |
Kenneth
A. Topping
1966 |
President
|
Since
2023 |
Vice
President and Chief Administrative Officer of EVM and BMR and Chief Operating Officer for Public Markets at MSIM. Also Vice President of Calvert Research and Management (“CRM”) since 2021. Formerly, Chief Operating Officer for Goldman
Sachs Asset Management 'Classic’ (2009-2020). |
Deidre
E. Walsh
1971 |
Vice
President and
Chief
Legal Officer |
Since
2009 |
Vice
President of EVM and BMR. Also Vice President of CRM. |
James
F. Kirchner
1967 |
Treasurer
|
Since
2007 |
Vice
President of EVM and BMR. Also Vice President of CRM. |
Nicholas
S. Di Lorenzo
1987 |
Secretary
|
Since
2022 |
Formerly,
associate (2012-2021) and counsel (2022) at Dechert LLP. |
Laura
T. Donovan
1976 |
Chief
Compliance
Officer |
Since
2024 |
Vice
President of EVM and BMR. |
(1) Preferred shares Trustee.
| U.S.
Customer Privacy Notice |
March 2024
|
| FACTS
|
WHAT
DOES EATON VANCE DO WITH YOUR PERSONAL INFORMATION? |
| Why?
|
Financial
companies choose how they share your personal information. Federal law gives consumers the right to limit some but not all sharing. Federal law also requires us to tell you how we collect, share, and protect your personal information. Please read
this notice carefully to understand what we do. |
| |
|
| What?
|
The
types of personal information we collect and share depend on the product or service you have with us. This information can include:■ Social Security number and income
■ investment
experience and risk tolerance
■ checking account information and wire transfer instructions |
| |
|
| How?
|
All
financial companies need to share customers’ personal information to run their everyday business. In the section below, we list the reasons financial companies can share their customers’ personal information; the reasons Eaton Vance
chooses to share; and whether you can limit this sharing. |
| Reasons
we can share your personal information |
Does
Eaton Vance
share? |
Can
you limit
this sharing? |
| For
our everyday business purposes — such as to process your transactions, maintain your account(s), respond to court orders and legal investigations, or report to credit bureaus |
Yes
|
No
|
| For
our marketing purposes — to offer our products and services to you |
Yes
|
No
|
| For
joint marketing with other financial companies |
No
|
We
don’t share |
| For
our affiliates’ everyday business purposes — information about your transactions and experiences |
Yes
|
No*
|
| For
our affiliates’ everyday business purposes — information about your creditworthiness |
Yes
|
Yes*
|
| For
our affiliates to market to you |
Yes
|
Yes*
|
| For
nonaffiliates to market to you |
No
|
We
don’t share |
To
limit our
sharing |
Call
toll-free 1-800-262-1122 or email: EVPrivacy@eatonvance.comPlease note:If you
are a new customer, we can begin sharing your information 30 days from the date we sent this notice. When you are no longer our customer, we continue to share your
information as described in this notice. However, you can contact us at any time to limit our sharing. |
| Questions?
|
Call
toll-free 1-800-262-1122 or email: EVPrivacy@eatonvance.com |
| U.S.
Customer Privacy Notice — continued |
March 2024
|
| Who
we are |
| Who
is providing this notice? |
Eaton
Vance Management and our investment management affiliates (“Eaton Vance”) (see Affiliates definition below.) |
| What
we do |
How
does Eaton Vance
protect my personal
information? |
To
protect your personal information from unauthorized access and use, we use security measures that comply with federal law. These measures include computer safeguards and secured files and buildings. We have policies governing the proper handling of
customer information by personnel and requiring third parties that provide support to adhere to appropriate security standards with respect to such information. |
How
does Eaton Vance
collect my personal
information? |
We
collect your personal information, for example, when you■ open an account or make deposits or withdrawals from your account
■ buy securities from us or make a wire transfer
■ give us your contact informationWe also collect your personal information from others, such as credit bureaus, affiliates, or other companies. |
| Why
can’t I limit all sharing? |
Federal
law gives you the right to limit only■ sharing for affiliates’ everyday business purposes — information about your creditworthiness
■ affiliates from using your information
to market to you
■ sharing for nonaffiliates to market to youState laws and individual companies may give you additional rights to limit sharing. (See below for more on your rights under state law.)
|
What
happens when I limit
sharing for an account I hold
jointly with someone else? |
Your
choices will apply to everyone on your account. |
| Definitions
|
| Affiliates
|
Companies
related by common ownership or control. They can be financial and nonfinancial companies.■ Our affiliates include registered investment advisers such as Eaton Vance
Management, Eaton Vance Advisers International Ltd., Boston Management and Research, Calvert Research and Management, Parametric Portfolio Associates LLC, Atlanta Capital Management Company LLC, Morgan Stanley Investment Management Inc., Morgan
Stanley Investment Management Co.; registered broker-dealers such as Morgan Stanley Distributors Inc. and Eaton Vance Distributors, Inc. (together, the “Investment Management Affiliates”); and companies with a Morgan Stanley name and
financial companies such as Morgan Stanley Smith Barney LLC and Morgan Stanley & Co. (the “Morgan Stanley Affiliates”). |
| Nonaffiliates
|
Companies
not related by common ownership or control. They can be financial and nonfinancial companies.■ Eaton Vance does not share with nonaffiliates so they can market to
you. |
| Joint
marketing |
A
formal agreement between nonaffiliated financial companies that together market financial products or services to you.■ Eaton Vance does not jointly market.
|
| Other
important information |
| U.S.
Customer Privacy Notice — continued |
March 2024
|
| *PLEASE
NOTE: Eaton Vance does not share your creditworthiness information or your transactions and experiences information with the Morgan Stanley Affiliates, nor does Eaton Vance enable the Morgan Stanley Affiliates to market to you. Your opt outs will
prevent Eaton Vance from sharing your creditworthiness information with the Investment Management Affiliates and will prevent the Investment Management Affiliates from marketing their products to you.Vermont: Except as permitted by law, we will not share personal information we collect about Vermont residents with Nonaffiliates unless you provide us with your written consent to share such
information.California: Except as permitted by law, we will not share personal information we collect about California residents with Nonaffiliates and we will limit sharing
such personal information with our Affiliates to comply with California privacy laws that apply to us. |
Eaton Vance
Limited Duration Income Fund
March 31, 2025
Potential Conflicts of
Interest
As a
diversified global financial services firm, Morgan Stanley, the parent company of the Fund’s investment adviser, engages in a broad spectrum of activities, including financial advisory services, investment management activities, lending,
commercial banking, sponsoring and managing private investment funds, engaging in broker-dealer transactions and principal securities, commodities and foreign exchange transactions, research publication and other activities. In the ordinary course
of its business, Morgan Stanley is a full-service investment banking and financial services firm and therefore engages in activities where Morgan Stanley’s interests or the interests of its clients may conflict with the interests of a Fund or
Portfolio, if applicable, (collectively for the purposes of this section, “Fund” or “Funds”). Morgan Stanley advises clients and sponsors, manages or advises other investment funds and investment programs, accounts and
businesses (collectively, together with any new or successor funds, programs, accounts or businesses sponsored, managed, or advised by the investment adviser or one of its investment adviser affiliates, the “Affiliated Investment
Accounts”) with a wide variety of investment objectives that in some instances may overlap or conflict with a Fund’s investment objectives and present conflicts of interest. In addition, Morgan Stanley, the investment adviser and/or the
investment adviser’s investment adviser affiliates may also from time to time create new or successor Affiliated Investment Accounts that may compete with a Fund and present similar conflicts of interest. The discussion below enumerates
certain actual, apparent and potential conflicts of interest. There is no assurance that conflicts of interest will be resolved in favor of Fund shareholders and, in fact, they may not be. The conflicts herein do not purport to be a complete list or
explanation of the conflicts associated with the financial or other interests the investment adviser or its affiliates may have now or in the future. Conflicts of interest not described below may also exist. References to the investment adviser in
this section include a Fund’s affiliated sub-adviser (if any) unless otherwise noted.
The discussions below with respect to actual, apparent and
potential conflicts of interest may be applicable to or arise from the Affiliated Investment Accounts managed by the investment adviser’s investment adviser affiliates whether or not specifically identified.
Material Non-Public and Other Information. It is expected that confidential or material non-public information regarding an investment or potential investment opportunity may become available to the investment adviser. If such information becomes available, the
investment adviser may be precluded (including by applicable law or internal policies or procedures) from pursuing an investment or disposition opportunity with respect to such investment or disposition opportunity including for an extended period
of time. The investment adviser may also from time to time be subject to contractual “stand-still” obligations and/or confidentiality obligations that may restrict its ability to transact in certain investments on the Fund’s
behalf. In addition, the investment adviser may be precluded from disclosing such information to an investment team, even in circumstances in which the information would be beneficial if disclosed. Therefore, the investment team may not be provided
access to material non-public information in the possession of Morgan Stanley that might be relevant to an investment decision to be made on behalf of the Fund, and the investment team may initiate a transaction or sell an investment that, if such
information had been known to it, may not have been undertaken. In addition, certain members of the investment team may be recused from certain investment-related discussions so that such members do not receive information that would limit their
ability to perform functions of their employment with the investment adviser or its affiliates unrelated to that of the Fund. Furthermore, access to information held by certain parts of Morgan Stanley may be subject to third party confidentiality
obligations and to information barriers established by Morgan Stanley designed to manage potential conflicts of interest and regulatory restrictions, including, without limitation, joint transaction restrictions pursuant to the 1940 Act.
Accordingly, the investment adviser’s ability to source investments from, or invest alongside, other business units within Morgan Stanley may be limited and there can be no assurance that the investment adviser will be able to source any
investments from any one or more parts of the Morgan Stanley network.
The investment adviser may restrict its investment decisions
and activities on behalf of the Fund in various circumstances, including because of applicable regulatory requirements or information held by the investment adviser, the investment adviser affiliates of the investment adviser or Morgan Stanley. The
investment adviser might not engage in transactions or other activities for, or enforce certain rights in favor of, the Fund due to Morgan Stanley’s activities outside the Fund. Furthermore, Morgan Stanley could have an interest that is
different from, and potentially adverse to, that of the Fund, which may impede the Fund from participating in certain opportunities. In instances where trading of an investment is restricted, the investment adviser may not be able to purchase or
sell such investment on behalf of the Fund including for an extended period of time, resulting in the Fund’s inability to participate in certain desirable transactions. This inability to buy or sell an investment could have an adverse effect
on the Fund’s portfolio due to, among other things, changes in an investment’s value during the period its trading is restricted.
Morgan Stanley has established certain information barriers and
other policies designed to address the sharing of information between different businesses within Morgan Stanley. As a result of information barriers, the investment adviser, in certain instances, will not have access, or will have limited access,
to certain information and personnel in other areas of Morgan Stanley and, in such instances, will not manage the Fund with the benefit of the information held by such other areas. Morgan Stanley, due to its access to and knowledge of funds, markets
and securities based on its various businesses, may make decisions based on information or take (or refrain from taking) actions with respect to interests in investments of the kind held (directly or indirectly) by the Fund in a manner that may be
adverse to the Fund, and will not have any obligation or other duty to share information with the investment adviser.
In other instances, Morgan Stanley personnel, including
personnel of the investment adviser, will have access to information and personnel of its affiliates. For example, the investment adviser may, in certain instances, share information with its affiliates regarding due diligence of companies and other
investment-related due diligence. The investment adviser may face conflicts of interest in determining whether to engage in the sharing of information with its affiliates. Information sharing may limit or restrict the ability of the investment
adviser to engage in or otherwise effect transactions on behalf of the Fund (including purchasing or selling securities that the investment adviser may otherwise have purchased or sold for the Fund in the absence of the sharing of information).
Also, it may adversely affect the Fund's investments, ability to invest in, or divest from, a company or engage in transactions or otherwise disadvantage the Fund. In managing conflicts of interest that arise because of the foregoing, the investment
adviser generally will be subject to fiduciary requirements. The investment adviser may also implement internal information barriers or ethical walls or other internal information sharing protocols, and the conflicts described herein with respect to
information barriers and otherwise with respect to Morgan Stanley and the investment adviser will also apply
Eaton Vance
Limited Duration Income Fund
March 31, 2025
Potential Conflicts of
Interest — continued
internally within the
investment adviser. As a result, the Fund may not be permitted to transact in (e.g., dispose of a security in whole or in part) during periods when it otherwise would have been desirable and able to do so, which could adversely affect the Fund.
Other investors in the security that are not subject to such restrictions may be able to transact in the security during such periods. There may also be circumstances in which, as a result of information held by certain portfolio management teams in
the investment adviser, the investment adviser limits an activity or transaction for the Fund, including if the Fund is managed by a portfolio management team other than the team holding such information.
Morgan Stanley and its personnel will not be under any
obligation or other duty to share certain information with the investment adviser or personnel involved in decision-making for Affiliated Investment Accounts (including the Fund), as applicable, and the investment adviser may make investment
decisions for the Fund that differ from those the investment adviser would have made if Morgan Stanley, or other parts, of the investment adviser had provided such information, and the Fund be disadvantaged as a result thereof. Additionally,
different portfolio management teams within the investment adviser may make decisions based on information or take (or refrain from taking) actions with respect to Affiliated Investment Accounts they advise in a manner different than or adverse to
the Fund.
Investments by Morgan Stanley and its Affiliated
Investment Accounts. In serving in multiple capacities to Affiliated Investment Accounts, Morgan Stanley, including the investment adviser and its investment teams, may have obligations to other clients or investors
in Affiliated Investment Accounts, the fulfillment of which may not be in the best interests of the Fund or its shareholders. An investment team may have obligations to Affiliated Investment Accounts managed by both the investment adviser and one or
more of the investment adviser’s investment adviser affiliates. The Fund’s investment objectives may overlap with the investment objectives of certain Affiliated Investment Accounts. As a result, the members of an investment team may
face conflicts in the allocation of investment opportunities among the Fund and other investment funds, programs, accounts and businesses advised by or affiliated with the investment adviser or its investment adviser affiliates. Certain Affiliated
Investment Accounts may provide for higher management or incentive fees or greater expense reimbursements or overhead allocations, all of which may contribute to this conflict of interest and create an incentive for the investment adviser to favor
such other accounts.
Morgan Stanley currently
invests and plans to continue to invest on its own behalf and on behalf of its Affiliated Investment Accounts in a wide variety of investment opportunities globally. Morgan Stanley and its Affiliated Investment Accounts, to the extent consistent
with applicable law and policies and procedures, will be permitted to invest in investment opportunities without making such opportunities available to the Fund. Subject to the foregoing, Morgan Stanley may offer investments that fall into the
investment objectives of an Affiliated Investment Account to such account or make such investment on its own behalf, even though such investment also falls within the Fund’s investment objectives. The Fund may invest in opportunities that
Morgan Stanley and/or one or more Affiliated Investment Accounts has declined, and vice versa. All of the foregoing may reduce the number of investment opportunities available to the Fund and may create conflicts of interest in allocating investment
opportunities. Investors should note that the conflicts inherent in making such allocation decisions may not always be resolved to the Fund’s advantage. There can be no assurance that the Fund will have an opportunity to participate in certain
opportunities that fall within their investment objectives. The interests of Morgan Stanley in an investment or a company may present certain conflicts of interest with respect to an investment by the Fund in the same investment or the Fund's
participation in a transaction with such company.
To the
extent the investment adviser utilizes quantitative models or risk management or optimization investment techniques, the decision on when to initiate a purchase or sale transaction may differ, and be done for different reasons, than the investment
adviser or its affiliates may take for Affiliated Investment Accounts when not utilizing such techniques. This could create conflicts of interest, and it is possible that one or more accounts managed by the investment adviser will achieve investment
results that are substantially more or less favorable than those results achieved by the Fund.
To seek to reduce potential conflicts of interest and to
attempt to allocate such investment opportunities in a fair and equitable manner, the investment adviser has implemented allocation policies and procedures. These policies and procedures are intended to give all clients of the investment adviser,
including the Fund, fair access to investment opportunities consistent with the requirements of organizational documents, investment strategies, applicable laws and regulations, and the fiduciary duties of the investment adviser. Each client of the
investment adviser that is subject to the allocation policies and procedures, including the Fund, is assigned an investment team and portfolio manager(s) by the investment adviser. The investment team and portfolio managers review investment
opportunities and will decide with respect to the allocation of each opportunity considering various factors and in accordance with the allocation policies and procedures. The allocation policies and procedures are subject to change. Investors
should note that the conflicts inherent in making such allocation decisions may not always be resolved to the advantage of the Fund.
It is possible that Morgan Stanley or an Affiliated Investment
Account, including another Morgan Stanley Fund, will invest in or advise (in the case of Morgan Stanley) a company that is or becomes a competitor of a company of which the Fund holds an investment. Such investment could create a conflict between
the Fund, on the one hand, and Morgan Stanley or the Affiliated Investment Account, on the other hand. In such a situation, Morgan Stanley may also have a conflict in the allocation of its own resources to the portfolio investment. Furthermore,
certain Affiliated Investment Accounts will be focused primarily on investing in other funds which may have strategies that overlap and/or directly conflict and compete with the Fund.
In addition, certain investment professionals who are involved
in the Fund’s activities remain responsible for the investment activities of other Affiliated Investment Accounts managed by the investment adviser and its affiliates, and they will devote time to the management of such investments and other
newly created Affiliated Investment Accounts (whether in the form of funds, separate accounts or other vehicles), as well as their own investments. In
Eaton Vance
Limited Duration Income Fund
March 31, 2025
Potential Conflicts of
Interest — continued
addition, in
connection with the management of investments for other Affiliated Investment Accounts, members of Morgan Stanley and its affiliates may serve on the boards of directors of or advise companies which may compete with the Fund’s portfolio
investments. Moreover, these Affiliated Investment Accounts managed by Morgan Stanley and its affiliates may pursue investment opportunities that may also be suitable for the Fund.
It should be noted that Morgan Stanley may, directly or
indirectly, make large investments in certain of its Affiliated Investment Accounts, and accordingly Morgan Stanley’s investment in the Fund may not be a determining factor in the outcome of any of the foregoing conflicts. Nothing herein
restricts or in any way limits the activities of Morgan Stanley, including its ability to buy or sell interests in, or provide financing to, equity and/or debt instruments, funds or portfolio companies, for its own accounts or for the accounts of
Affiliated Investment Accounts or other investment funds or clients in accordance with applicable law.
Different clients of the investment adviser and its affiliates,
including the Fund, may invest in (1) different classes of securities of the same issuer (including, without limitation, different parts of an issuer's capital structure), depending on the respective clients’ investment objectives and policies
and/or (2) the same class of securities of the same issuer while seeking different investment objectives or executing different investment strategies (such as long-term v. short-term investment horizons), and the investment adviser may face
conflicts with respect to the interests involved. As a result, the investment adviser and its affiliates, at times, will seek to satisfy fiduciary obligations to certain clients owning one / the same class of securities of a particular issuer by
pursuing or enforcing rights on behalf of those clients with respect to such (class of) securities, and those activities may have an adverse effect on another client which owns a different class of securities of such issuer. For example, if one
client holds debt securities of an issuer and another client holds equity securities of the same issuer, if the issuer experiences financial or operational challenges, the investment adviser and its affiliates may seek a liquidation of the issuer on
behalf of the client that holds the debt securities, whereas the client holding the equity securities may benefit from a reorganization of the issuer. Thus, in such situations, the actions taken by the investment adviser or its affiliates on behalf
of one client can negatively impact securities held by another client. Alternatively, for example, if a client owns a security while seeking short-term capital appreciation that the investment adviser may vote proxies or engage with the issuer (as
applicable) in pursuit of that goal – which could negatively impact clients who hold the same security but are seeking long-term capital appreciation. These conflicts also exist as between the investment adviser’s clients, including the
Fund, and the Affiliated Investment Accounts managed by the investment adviser affiliates of the investment adviser.
In addition, in certain circumstances, the investment adviser
restricts, limits or reduces the amount of the Fund’s investment, or restricts the type of governance or voting rights it acquires or exercises, where the Fund (potentially together with Morgan Stanley) exceeds a certain ownership interest, or
possesses certain degrees of voting or control or has other interests.
The investment adviser and its affiliates may give advice and
recommend securities to other clients which may differ from advice given to, or securities recommended or bought for, the Fund even though such other clients’ investment objectives may be similar to those of the Fund and the investment adviser
may make decisions for the Fund that may be more beneficial to one type of shareholder than another.
The investment adviser and its affiliates manage long and short
portfolios. The simultaneous management of long and short portfolios creates conflicts of interest in portfolio management and trading in that opposite directional positions may be taken in client accounts, including client accounts managed by the
same investment team, and creates risks such as: (i) the risk that short sale activity could adversely affect the market value of long positions in one or more portfolios (and vice versa) and (ii) the risks associated with the trading desk receiving
opposing orders in the same security simultaneously. The investment adviser and its affiliates have adopted policies and procedures that are reasonably designed to mitigate these conflicts. In certain circumstances, the investment adviser invests on
behalf of itself in securities and other instruments that would be appropriate for, held by, or may fall within the investment guidelines of its clients, including the Fund. At times, the investment adviser may give advice or take action for its own
accounts that differs from, conflicts with, or is adverse to advice given or action taken for any client.
From time to time, conflicts also arise due to the fact that
certain securities or instruments may be held in some client accounts, including the Fund, but not in others, or that client accounts may have different amounts of holdings in certain securities or instruments. In addition, due to differences in the
investment strategies or restrictions among client accounts, the investment adviser may take action with respect to one account that differs from the action taken with respect to another account. In some cases, a client account may compensate the
investment adviser based on the performance of the securities held by that account or pay a higher overall fee rate. The existence of such a performance based fee or higher fee rates may create additional conflicts of interest for the investment
adviser in the allocation of management time, resources and investment opportunities. The investment adviser has adopted several policies and procedures designed to address these potential conflicts including a code of ethics and policies that
govern the investment adviser’s trading practices, including, among other things, the aggregation and allocation of trades among clients, brokerage allocations, cross trades and best execution.
In addition, at times an investment team will give advice or
take action with respect to the investments of one or more clients that is not given or taken with respect to other clients with similar investment programs, objectives, and strategies. Accordingly, clients with similar strategies will not always
hold the same securities or instruments or achieve the same performance. The investment adviser’s investment teams also advise clients with conflicting programs, objectives or strategies. These conflicts also exist as between the investment
adviser’s clients, including the Fund, and the Affiliated Investment Accounts managed by the investment adviser affiliates of the investment adviser.
Eaton Vance
Limited Duration Income Fund
March 31, 2025
Potential Conflicts of
Interest — continued
From
time to time, the investment adviser or its affiliates may provide opportunities to Affiliated Investment Accounts (including potentially the Fund) or other clients to make investments in companies (such as in equity, debt or other securities issued
by companies) or to engage in transactions involving companies (such as refinancing, restructuring or other transactions) in which certain Affiliated Investment Accounts (including potentially the Fund) or other clients have already invested. These
investments can create conflicts of interest, including those associated with the assets of the Fund potentially providing value to, or otherwise supporting the investments of, other Affiliated Investment Accounts or other clients and potentially
diluting or otherwise adversely affecting the Fund previously invested in the company.
Morgan Stanley and its affiliates maintain separate trading
desks that operate independently of each other and do not share information with the investment adviser. The Morgan Stanley and affiliate trading desks may compete against the investment adviser trading desks when implementing buy and sell
transactions, possibly causing certain Affiliated Investment Accounts to pay more or receive less for a security than other Affiliated Investment Accounts.
Investments by Separate Investment Departments. For the investment adviser and certain of its investment adviser affiliates, the entities and individuals that provide investment-related services can differ by client, investment function, or business line (each, an
“Investment Department” and collectively, the “Investment Departments”). Nonetheless, Investment Departments (with certain exceptions) can engage in discussions and share information and resources with another Investment
Department (or a team within the other Investment Department) regarding investment-related matters. The sharing of information and resources between the Investment Departments is designed to further increase the knowledge and effectiveness of each
Investment Department. However, an investment team’s decisions as to the use of shared research and participation in discussions with another Investment Department could adversely impact a client. Certain investment teams within one Investment
Department could make investment decisions and execute trades together with investment teams within other Investment Departments. Other investment teams make investment decisions and execute trades independently. This could cause the quality and
price of execution, and the performance of investments and accounts, to vary. Internal policies and procedures set forth the guidelines under which securities and securities trades can be crossed, aggregated, and coordinated between accounts
serviced by different Investment Departments. Internal policies and procedures take into consideration a variety of factors, including the primary market in which such security trades. If a security or securities trade is ineligible for crossing,
aggregation, or other coordinated trading, then each Investment Department will execute such trades independently of the other.
Payments to Broker-Dealers and Other Financial Intermediaries. The investment adviser, Eaton Vance Distributors, Inc. (the “Distributor”) and/or their affiliates may pay compensation, out of their own funds and not as an expense of the Fund, to certain Financial
Intermediaries (which may include affiliates of the investment adviser and the Distributor), including recordkeepers and administrators of various deferred compensation plans, in connection with the sale, distribution, marketing and retention of
shares of the Fund and/or shareholder servicing. For example, the investment adviser or the Distributor may pay additional compensation to a Financial Intermediary for, among other things, promoting the sale and distribution of Fund shares,
providing access to various programs, mutual fund platforms or preferred or recommended mutual fund lists that may be offered by a Financial Intermediary, granting the Distributor access to a Financial Intermediary’s financial advisors and
consultants, providing assistance in the ongoing education and training of a Financial Intermediary’s financial personnel, furnishing marketing support, maintaining share balances and/or for sub-accounting, recordkeeping, administrative,
shareholder or transaction processing services. Such payments are in addition to any distribution fees, shareholder servicing fees and/or transfer agency fees that may be payable by the Fund. The additional payments may be based on various factors,
including level of sales (based on gross or net sales or some specified minimum sales or some other similar criteria related to sales of the Fund and/or some or all other Morgan Stanley Funds), amount of assets invested by the Financial
Intermediary’s customers (which could include current or aged assets of the Fund and/or some or all other Morgan Stanley Funds), the Fund’s advisory fee, some other agreed upon amount or other measures as determined from time to time by
the investment adviser and/or the Distributor. The amount of these payments may be different for different Financial Intermediaries. In certain cases, payments to broker-dealers and other Financial Intermediaries may be shared by and among the
investment adviser, the Distributor and their affiliates.
The prospect of receiving, or the receipt of, additional
compensation, as described above, by Financial Intermediaries may provide such Financial Intermediaries and their financial advisors and other salespersons with an incentive to favor sales of shares of the Fund over other investment options with
respect to which these Financial Intermediaries do not receive additional compensation (or receives lower levels of additional compensation). These payment arrangements, however, will not change the price that an investor pays for shares of the Fund
or the amount that the Fund receives to invest on behalf of an investor. Investors may wish to take such payment arrangements into account when considering and evaluating any recommendations relating to Fund shares and should review carefully any
disclosures provided by Financial Intermediaries as to their compensation.
The additional compensation received by a given Financial
Intermediary from the investment adviser and/or the Distributor may vary from the additional compensation received by the Financial Intermediary in respect of an Affiliated Investment Account managed by an affiliate of the investment adviser or
principally underwritten by an affiliate of the Distributor. In such circumstances, differences in the prospect of receiving, or the receipt of, additional compensation, as described above, by Financial Intermediaries may provide such Financial
Intermediaries and their financial advisors and other salespersons with an incentive to favor sales of shares of one Affiliated Investment Account over other investment options with respect to which these Financial Intermediaries do not receive
additional compensation (or receives lower levels of additional compensation).
Morgan Stanley Trading and Principal Investing Activities. Notwithstanding anything to the contrary herein, Morgan Stanley will generally conduct its sales and trading businesses, publish research and analysis, and render investment advice without regard for the Fund’s
holdings, although these activities could have an adverse impact on the value of one or more of the Fund’s investments, or could cause Morgan Stanley to have an interest in one or more portfolio investments that is different from and
potentially adverse to that of the Fund. Furthermore, from time to time, the investment adviser or its affiliates may
Eaton Vance
Limited Duration Income Fund
March 31, 2025
Potential Conflicts of
Interest — continued
invest
“seed” capital in a Fund, typically to enable such Fund to commence investment operations and/or achieve sufficient scale, as further described below. The investment adviser and its affiliates may hedge such seed capital exposure by
investing in derivatives or other instruments expected to produce offsetting exposure. Such hedging transactions, if any, would occur outside of such Fund.
Morgan Stanley’s sales and trading, financing and
principal investing businesses (whether or not specifically identified as such, and including Morgan Stanley’s trading and principal investing businesses) will not be required to offer any investment opportunities to the Fund. These businesses
may encompass, among other things, principal trading activities as well as principal investing.
Morgan Stanley’s sales and trading, financing and
principal investing businesses have acquired or invested in, and in the future may acquire or invest in, minority and/or majority control positions in equity or debt instruments of diverse public and/or private companies. Such activities may put
Morgan Stanley in a position to exercise contractual, voting or creditor rights, or management or other control with respect to securities or loans of portfolio investments or other issuers, and in these instances Morgan Stanley may, in its
discretion and subject to applicable law, act to protect its own interests or interests of clients, and not the Fund’s interests.
Subject to the limitations of applicable law, the Fund may
purchase from or sell assets to, or make investments in, companies in which Morgan Stanley has or may acquire an interest, including as an owner, creditor or counterparty.
Morgan Stanley’s Investment Banking and Other Commercial
Activities. Morgan Stanley advises clients on a variety of mergers, acquisitions, restructuring, bankruptcy and financing transactions. Morgan Stanley may act as an advisor to clients, including other investment
funds that may compete with the Fund and with respect to investments that the Fund may hold. Morgan Stanley may give advice and take action with respect to any of its clients or proprietary accounts that may differ from the advice given, or may
involve an action of a different timing or nature than the action taken, by the Fund. Morgan Stanley may give advice and provide recommendations to persons competing with the Fund and/or any of the Fund’s investments that are contrary to the
Fund’s best interests and/or the best interests of any of its investments.
Morgan Stanley could be engaged in financial advising, whether
on the buy-side or sell-side, or in financing or lending assignments that could result in Morgan Stanley’s determining in its discretion or being required to act exclusively on behalf of one or more third parties, which could limit the
Fund’s ability to transact with respect to one or more existing or potential investments. Morgan Stanley may have relationships with third-party funds, companies or investors who may have invested in or may look to invest in portfolio
companies, and there could be conflicts between the Fund’s best interests, on the one hand, and the interests of a Morgan Stanley client or counterparty, on the other hand.
To the extent that Morgan Stanley advises companies in
financial restructurings outside of, prior to or after filing for protection under Chapter 11 of the U.S. Bankruptcy Code or similar laws in other jurisdictions, the investment adviser’s flexibility in making investments in such restructurings
on the Fund’s behalf, or participating on steering committees and other committees in connection with existing investments, may be limited.
Morgan Stanley could provide investment banking services to
competitors of portfolio companies, as well as to private equity and/or private credit funds; such activities may present Morgan Stanley with a conflict of interest vis-a-vis the Fund’s investment and may also result in a conflict in respect
of the allocation of investment banking resources to portfolio companies.
To the extent permitted by applicable law, Morgan Stanley may
provide a broad range of financial services to companies in which the Fund invests, including strategic and financial advisory services, interim acquisition financing and other lending and underwriting or placement of securities, and Morgan Stanley
generally will be paid fees (that may include warrants or other securities) for such services. Morgan Stanley will not share any of the foregoing interest, fees and other compensation received by it (including, for the avoidance of doubt, amounts
received by the investment adviser) with the Fund, and any advisory fees payable will not be reduced thereby.
Morgan Stanley may be engaged to act as a financial advisor to
a company in connection with the sale of such company, or subsidiaries or divisions thereof, may represent potential buyers of businesses through its mergers and acquisition activities and may provide lending and other related financing services in
connection with such transactions. Morgan Stanley’s compensation for such activities is usually based upon realized consideration and is usually contingent, in substantial part, upon the closing of the transaction. Under these circumstances,
the Fund may be precluded from participating in a transaction with or relating to the company being sold or participating in any financing activity related to merger or acquisition.
The involvement or presence of Morgan Stanley in the investment
banking and other commercial activities described above (or the financial markets more broadly) may restrict or otherwise limit investment opportunities that may otherwise be available to the Fund. For example, issuers may hire and compensate Morgan
Stanley to provide underwriting, financial advisory, placement agency, brokerage services or other services and, because of limitations imposed by applicable law and regulation, the Fund may be prohibited from buying or selling securities issued by
those issuers or participating in related transactions or otherwise limited in its ability to engage in such investments.
Eaton Vance
Limited Duration Income Fund
March 31, 2025
Potential Conflicts of
Interest — continued
In
addition, in situations where the investment adviser is required to aggregate its positions with those of other Morgan Stanley business units for position limit calculations, the investment adviser may have to refrain from making investments due to
the positions held by other Morgan Stanley business units or their clients. There may be other situations where the investment adviser refrains from making an investment or refrains from taking certain actions related to the management of such
investment due to, among other reasons, additional disclosure obligations, regulatory requirements, policies, and reputational risk, or the investment adviser may limit purchases or sales of securities in respect of which Morgan Stanley is engaged
in an underwriting or other distribution capacity.
Morgan
Stanley’s Marketing Activities. Morgan Stanley is engaged in the business of underwriting, syndicating, brokering, administering, servicing, arranging and advising on the distribution of a wide variety of
securities and other investments in which the Fund may invest. Subject to the restrictions of the 1940 Act, including Sections 10(f) and 17(e) thereof, the Fund may invest in transactions in which Morgan Stanley acts as underwriter, placement agent,
syndicator, broker, administrative agent, servicer, advisor, arranger or structuring agent and receives fees or other compensation from the sponsors of such products or securities. Any fees earned by Morgan Stanley in such capacity will not be
shared with the investment adviser or the Fund. Certain conflicts of interest, in addition to the receipt of fees or other compensation, would be inherent in these transactions. Moreover, the interests of one of Morgan Stanley’s clients with
respect to an issuer of securities in which the Fund has an investment may be adverse to the investment adviser’s or the Fund’s best interests. In conducting the foregoing activities, Morgan Stanley will be acting for its other clients
and will have no obligation to act in the investment adviser’s or the Fund’s best interests. Due to the restrictions of the 1940 Act, the Fund may be restricted from participating in certain transactions in which Morgan Stanley acts as
underwriter, placement agent, syndicator, broker, administrative agent, servicer, advisor, arranger or structuring agent, including transactions that would otherwise be beneficial to the Fund.
Client Relationships. Morgan
Stanley has existing and potential relationships with a significant number of corporations, institutions and individuals. In providing services to its clients, Morgan Stanley may face conflicts of interest with respect to activities recommended to
or performed for such clients, on the one hand, and the Fund, its shareholders or the entities in which the Fund invests, on the other hand. In addition, these client relationships may present conflicts of interest in determining whether to offer
certain investment opportunities to the Fund.
In
acting as principal or in providing advisory and other services to its other clients, Morgan Stanley may engage in or recommend activities with respect to a particular matter that conflict with or are different from activities engaged in or
recommended by the investment adviser on the Fund’s behalf.
Principal Investments. There
may be situations in which the Fund’s interests may conflict with the interests of one or more general accounts of Morgan Stanley and its affiliates or accounts managed by Morgan Stanley or its affiliates. This may occur because these accounts
hold public and private debt and equity securities of many issuers which may be or become portfolio companies, or from whom portfolio companies may be acquired.
Transactions with Portfolio Companies of Affiliated Investment
Accounts. The companies in which the Fund may invest may be counterparties to or participants in agreements, transactions or other arrangements with portfolio companies or other entities of portfolio investments of
Affiliated Investment Accounts (for example, a company in which the Fund invests may retain a company in which an Affiliated Investment Account invests to provide services or may acquire an asset from such company or vice versa). Certain of these
agreements, transactions and arrangements involve fees, servicing payments, rebates and/or other benefits to Morgan Stanley or its affiliates. For example, portfolio entities may, including at the encouragement of Morgan Stanley, enter into
agreements regarding group procurement and/or vendor discounts. Morgan Stanley and its affiliates may also participate in these agreements and may realize better pricing or discounts as a result of the participation of portfolio entities. To the
extent permitted by applicable law, certain of these agreements may provide for commissions or similar payments and/or discounts or rebates to be paid to a portfolio entity of an Affiliated Investment Account, and such payments or discounts or
rebates may also be made directly to Morgan Stanley or its affiliates. Under these arrangements, a particular portfolio company or other entity may benefit to a greater degree than the other participants, and the Morgan Stanley Funds, investment
vehicles and accounts (which may or may not include the Fund) that own an interest in such entity will receive a greater relative benefit from the arrangements than the Morgan Stanley Funds, investment vehicles or accounts that do not own an
interest therein. Fees and compensation received by portfolio companies of Affiliated Investment Accounts in relation to the foregoing will not be shared with a Fund or offset advisory fees payable.
Investments in Portfolio Investments of Other Funds. To the extent permitted by applicable law, when the Fund invests in certain companies or other entities, other funds affiliated with the investment adviser may have made or may be making an investment in such companies
or other entities. Other funds that have been or may be managed by the investment adviser may invest in the companies or other entities in which the Fund has made an investment. Under such circumstances, the Fund and such other funds may have
conflicts of interest (e.g., over the terms, exit strategies and related matters, including the exercise of remedies of their respective investments). If the interests held by the Fund are different from (or take priority over) those held by such
other funds, the investment adviser may be required to make a selection at the time of conflicts between the interests held by such other funds and the interests held by the Fund.
Investments in Morgan Stanley Funds and Other Funds. To the extent permitted by applicable law, the Fund may invest in a fund affiliated with the investment adviser or its affiliates or a fund advised by the investment adviser or its affiliates. In connection with any
such investments, an investing Fund, to the extent permitted by the 1940 Act, will pay all advisory, administrative and/or Rule 12b-1 fees applicable to the investment. To the extent consistent with applicable law, certain Funds that invest in other
funds managed by the investment adviser or its affiliates may pay advisory fees to the investment adviser or its affiliates that are not reduced by any fees payable by such other funds to the investment adviser or its affiliates as manager of such
other
Eaton Vance
Limited Duration Income Fund
March 31, 2025
Potential Conflicts of
Interest — continued
funds (i.e., there
may be fees and expenses involved in making any such investment, which would not arise in connection with the direct allocation of assets by investors in the Funds to such other funds). In such circumstances, as well as in all other circumstances in
which the investment adviser receives any fees or other compensation in any form relating to the provision of services, no accounting or repayment to the Funds will be required.
The Affiliated Investment Accounts (including the Funds) may,
individually or in the aggregate, own a substantial percentage of a Fund. Further, the Adviser, its affiliates, or another entity (i.e., a seed investor) may invest in the Funds at or near the establishment of such Funds, which may facilitate the
Funds achieving a specified size or scale. The Adviser and/or its affiliates may make payments to an investor that contributes seed capital to a Fund. Such payments may continue for a specified period of time and/or until a specified dollar amount
is reached, and will be made from the assets of the Adviser and/or such affiliates (and not the applicable Fund). Seed investors may contribute all or a majority of the assets in a Fund. There is a risk that such seed investors may redeem their
investments in the Fund, particularly after payments from the Adviser and/or its affiliates have ceased. Such redemptions could negatively impact a Fund’s liquidity, expenses and market price of its shares, as applicable.
Allocation of Expenses.
Expenses may be incurred that are attributable to the Fund and one or more other Affiliated Investment Accounts (including in connection with issuers in which the Fund and such other Affiliated Investment Accounts have overlapping investments). The
allocation of such expenses among such entities raises potential conflicts of interest. The investment adviser and its affiliates intend to allocate such common expenses among the Fund and any such other Affiliated Investment Accounts on a pro rata
basis or in such other manner as the investment adviser deems to be fair and equitable or in such other manner as may be required by applicable law.
Temporary Investments. To more
efficiently invest short-term cash balances held by the Fund, the investment adviser may invest such balances on an overnight “sweep” basis in shares of one or more money market funds or other short-term vehicles. It is anticipated that
the investment adviser to these money market funds or other short-term vehicles may be the investment adviser (or an affiliate) to the extent permitted by applicable law, including Rule 12d1-1 under the 1940 Act. In such a case, the affiliated
investment adviser may receive asset-based fees in respect of the Fund’s investment (which will reduce the net return realized by the Fund).
Transactions with Affiliates.
The investment adviser and any investment sub-adviser might purchase securities from underwriters or placement agents in which a Morgan Stanley affiliate is a member of a syndicate or selling group, as a result of which an affiliate might benefit
from the purchase through receipt of a fee or otherwise. Neither the investment adviser nor any investment sub-adviser will purchase securities on behalf of the Fund from an affiliate that is acting as a manager of a syndicate or selling group.
Purchases by the investment adviser on behalf of the Fund from an affiliate acting as a placement agent must meet the requirements of applicable law. Furthermore, Morgan Stanley may face conflicts of interest when a Fund uses service providers
affiliated with Morgan Stanley because Morgan Stanley receives greater overall fees when they are used.
Affiliated Indexes. Affiliates
of the investment adviser develop, own and operate indexes (“Indexes”), and may continue to do so in the future, based on investment and trading strategies and concepts developed by the investment adviser or its affiliates
(“Adviser Strategies”). Some of the Funds seek to track the performance of the Indexes. The investment adviser manages Accounts which track the same Indexes used by the Funds or which are based on the same, or substantially similar,
Adviser Strategies that are used in the operation of the Indexes and the Funds. The operation of the Indexes, the Funds and the Accounts in this manner gives rise to potential conflicts of interest. For example, Accounts that track the same Indexes
used by the Funds may engage in purchases and sales of securities prior to when the Index and the Funds engage in similar transactions because such Accounts may be managed and rebalanced on an ongoing basis, whereas the Funds’ portfolios are
only rebalanced on a periodic or other basis subsequent to the rebalancing of the Index.
The investment adviser has adopted policies and procedures that
are designed to address potential conflicts that arise in connection with the operation of the Indexes, the Funds and the Accounts. The investment adviser has established certain information barriers and other policies designed to address the
sharing of information between different businesses within the investment adviser, including with respect to personnel responsible for constructing and maintaining the Indexes and those involved in decision-making for the Funds.
Valuation of the Fund’s Investments. The investment adviser performs certain valuation services related to securities and other assets held by the Fund and performs such services in accordance with its valuation policies. The investment adviser will face a
conflict with respect to valuation of the Fund’s investments generally because of the effect of such valuations on the investment adviser’s fees and other compensation and performance of the Fund.
Proxy Voting by the Adviser.
The investment adviser has implemented processes designed to prevent conflicts of interest from influencing proxy voting decisions that it makes on behalf of advisory clients, including the Funds, and to help ensure that such decisions are made in
accordance with its fiduciary obligations to its clients. Notwithstanding such proxy voting processes, proxy voting decisions made by the investment adviser in respect of securities held by the Fund may benefit the interests of Morgan Stanley and/or
accounts other than the Fund. Further, the investment adviser may make different proxy voting decisions in respect of the same security held by clients with different investment objectives or strategies.
Potential Conflict of Interest Related to Use of Sub-Adviser(s). To the extent the Fund’s investment adviser engages affiliated and/or unaffiliated sub-advisers, the investment adviser generally expects to compensate the sub-adviser out of the advisory fee it receives from the
Fund, which creates an incentive for the investment adviser to select sub-adviser(s) with lower fee rates or to select affiliated sub-adviser(s). In addition, a sub-adviser may have interests and relationships that create actual or potential
conflicts of interest related to their management of Fund assets allocated to or managed by the sub-adviser. These conflicts may be similar to or different from the conflicts described herein related to Morgan Stanley and its investment advisory
affiliates. For additional information about potential conflicts of interest for each sub-adviser(s) can be found in the relevant sub-adviser’s Form ADV. A copy of Part 1 and Part 2 of a sub-adviser’s Form ADV is available on the
SEC’s website (www.adviserinfo.sec.gov).
Eaton Vance
Limited Duration Income Fund
March 31, 2025
Potential Conflicts of
Interest — continued
Electronic Communication Networks and Alternative Trading
Systems. The investment adviser’s affiliate(s) have ownership interests in and/or board seats on electronic communication networks (“ECNs”) or other alternative trading systems
(“ATSs”). In certain instances the investment adviser’s affiliate(s) could be deemed to control one or more of such ECNs or ATSs based on the level of such ownership interests and whether such affiliates are represented on the
board of such ECNs or ATSs. Consistent with its fiduciary obligation to seek best execution, the Adviser may, from time to time, directly or indirectly, effect client trades through ECNs or other ATSs in which the Firm’s affiliates have or
could acquire an interest or board seat. These affiliates might receive an indirect economic benefit based upon their ownership in the ECNs or other ATSs. The investment adviser will, directly or indirectly, execute through an ECN or other ATSs in
which an affiliate has an interest only in situations where the Firm or the broker dealer through whom it is accessing the ECN or ATS reasonably believes such transaction will be in the best interest of its clients and the requirements of applicable
law have been satisfied.
General Process for
Potential Conflicts. All of the transactions described above involve the potential for conflicts of interest between the investment adviser, related persons of the investment adviser and/or their clients. The
Advisers Act, the 1940 Act and ERISA impose certain requirements designed to decrease the possibility of conflicts of interest between an investment adviser and its clients. In some cases, transactions may be permitted subject to fulfillment of
certain conditions. Certain other transactions may be prohibited. In addition, the investment adviser has instituted policies and procedures designed to prevent conflicts of interest from arising and, when they do arise, to ensure that it effects
transactions for clients in a manner that is consistent with its fiduciary duty to its clients and in accordance with applicable law. The investment adviser seeks to ensure that potential or actual conflicts of interest are appropriately resolved
taking into consideration the overriding best interests of the client.
Delivery of Shareholder Documents. The Securities and Exchange Commission (SEC) permits funds to deliver only one copy of shareholder documents, including prospectuses, proxy statements and
shareholder reports, to fund investors with multiple accounts at the same residential or post office box address. This practice is often called “householding” and it helps eliminate duplicate mailings to shareholders. Equiniti Trust Company, LLC (“EQ”), the closed-end funds transfer agent, or your financial intermediary, may household the mailing of your documents
indefinitely unless you instruct EQ, or your financial intermediary, otherwise. If you would prefer that your Eaton Vance documents not be householded, please contact EQ or your financial
intermediary. Your instructions that householding not apply to delivery of your Eaton Vance documents will typically be effective within 30 days of receipt by EQ or your financial intermediary.
Portfolio
Holdings. Each Eaton Vance Fund and its underlying Portfolio(s) (if applicable) files a schedule of portfolio holdings on Part F to Form N-PORT with the
SEC. Certain information filed on Form N-PORT may be viewed on the Eaton Vance website at www.eatonvance.com, by calling Eaton Vance at 1-800-262-1122 or in the EDGAR database on the SEC’s website at www.sec.gov.
Proxy
Voting. From time to time, funds are required to vote proxies related to the securities held by the funds. The Eaton Vance Funds or their underlying
Portfolios (if applicable) vote proxies according to a set of policies and procedures approved by the Funds’ and Portfolios’ Boards. You may obtain a description of these policies and procedures and information on how the Funds or
Portfolios voted proxies relating to portfolio securities during the most recent 12-month period ended June 30, without charge, upon request, by calling 1-800-262-1122 and by accessing the SEC’s website at www.sec.gov. You may also access
proxy voting information for the Eaton Vance Funds or their underlying Portfolios at www.eatonvance.com/
proxyvoting.
Share Repurchase
Program. The Fund’s Board of Trustees has approved a share repurchase program authorizing the Fund to repurchase up to 10% of its common shares
outstanding as of the last day of the prior calendar year in open-market transactions at a discount to net asset value. The repurchase program does not obligate the Fund to purchase a specific amount of shares. The Fund’s repurchase activity,
including the number of shares purchased, average price and average discount to net asset value, is disclosed in the Fund’s annual and semi-annual reports to shareholders.
Additional Notice to Shareholders. If applicable, a Fund may also redeem or purchase its outstanding preferred shares in order to maintain compliance with regulatory requirements, borrowing or
rating agency requirements or for other purposes as it deems appropriate or necessary.
Closed-End Fund Information. Eaton Vance closed-end funds make fund performance data and certain information about portfolio characteristics available on the Eaton Vance website shortly
after the end of each month. Other information about the funds is available on the website. The funds’ net asset value per share is readily accessible on the Eaton Vance website. Portfolio holdings for the most recent month-end are also posted
to the website approximately 30 days following the end of the month. This information is available at www.eatonvance.com on the fund information pages under “Closed-End Funds & Term Trusts.”
Investment Adviser and Administrator
Eaton Vance Management
One Post Office Square
Boston, MA 02109
Custodian
State Street Bank and Trust Company
One Congress Street, Suite 1
Boston, MA 02114-2016
Transfer Agent
Equiniti Trust Company, LLC (“EQ”)
P.O. Box 500
Newark, NJ 07101
Independent Registered
Public Accounting Firm
Deloitte & Touche
LLP
115 Federal Street, Suite 15
Boston, MA 02110-1894
Fund Offices
One Post Office Square
Boston, MA 02109
Item 2. Code of Ethics
The registrant (sometimes
referred to as the “Fund”) has adopted a code of ethics applicable to its Principal Executive Officer, Principal Financial Officer and Principal Accounting Officer. The registrant undertakes to provide a copy of such code of ethics to any
person upon request, without charge, by calling 1-800-262-1122. The registrant has not amended the code of ethics as described in
Form N-CSR during the period covered by this report. The registrant has not granted any waiver, including an implicit waiver, from a provision of the code of ethics as described in Form N-CSR during the period covered by this report.
Item 3. Audit Committee Financial Expert
The registrant’s Board of Trustees (the “Board”) has designated George J. Gorman and Scott E. Wennerholm, each an independent trustee, as audit
committee financial experts. Mr. Gorman is a certified public accountant who is the Principal at George J. Gorman LLC (a consulting firm). Previously, Mr. Gorman served in various capacities at Ernst & Young LLP (a registered
public accounting firm), including as Senior Partner. Mr. Gorman also has experience serving as an independent trustee and audit committee financial expert of other mutual fund complexes. Mr. Wennerholm is a private investor. Previously,
Mr. Wennerholm served as a Trustee at Wheelock College (postsecondary institution), as a Consultant at GF Parish Group (executive recruiting firm), Chief Operating Officer and Executive Vice President at BNY Mellon Asset Management (investment
management firm), Chief Operating Officer and Chief Financial Officer at Natixis Global Asset Management (investment management firm), and Vice President at Fidelity Investments Institutional Services (investment management firm).
Item 4. Principal Accountant Fees and Services
(a) –(d)
The following table presents the aggregate
fees billed to the registrant for the registrant’s fiscal years ended March 31, 2024 and March 31, 2025 by the registrant’s principal accountant, Deloitte & Touche LLP (“D&T”), for professional services
rendered for the audit of the registrant’s annual financial statements and fees billed for other services rendered by D&T during such periods.
|
|
|
|
|
|
|
|
|
| Fiscal Years Ended |
|
3/31/24 |
|
|
3/31/25 |
|
| Audit Fees |
|
$ |
129,600 |
|
|
$ |
130,400 |
|
| Audit-Related Fees(1) |
|
$ |
0 |
|
|
$ |
0 |
|
| Tax Fees(2) |
|
$ |
0 |
|
|
$ |
0 |
|
| All Other Fees(3) |
|
$ |
0 |
|
|
$ |
0 |
|
|
|
|
|
|
|
|
|
|
| Total |
|
$ |
129,600 |
|
|
$ |
130,400 |
|
|
|
|
|
|
|
|
|
|
| (1) |
Audit-related fees consist of the aggregate fees billed for assurance and related services that are reasonably
related to the performance of the audit of financial statements and are not reported under the category of audit fees. |
| (2) |
Tax fees consist of the aggregate fees billed for professional services rendered by the principal accountant
relating to tax compliance, tax advice, and tax planning and specifically include fees for tax return preparation and other related tax compliance/planning matters. |
| (3) |
All other fees consist of the aggregate fees billed for products and services provided by the principal
accountant other than audit, audit-related, and tax services. |
(e)(1) The registrant’s audit committee has adopted policies and
procedures relating to the pre-approval of services provided by the registrant’s principal accountant (the “Pre-Approval Policies”). The Pre-Approval Policies establish a framework intended to assist the audit committee in the proper discharge of its pre-approval responsibilities. As a general matter, the Pre-Approval Policies (i) specify certain types of audit, audit-related, tax, and other services determined to be pre-approved by the audit committee; and
(ii) delineate specific procedures governing the mechanics of the pre-approval process, including the approval and monitoring of audit and non-audit service fees.
Unless a service is specifically pre-approved under the Pre-Approval Policies, it must be separately pre-approved by the audit
committee.
The Pre-Approval Policies and the types of audit and non-audit services pre-approved therein must be reviewed and ratified by the registrant’s audit committee at least annually. The registrant’s audit committee
maintains full responsibility for the appointment, compensation, and oversight of the work of the registrant’s principal accountant.
(e)(2) No
services described in paragraphs (b)-(d) above were approved by the registrant’s audit committee pursuant to the “de minimis exception” set forth in Rule 2-01(c)(7)(i)(C) of Regulation S-X.
(f) Not applicable.
(g) The following table presents (i) the aggregate non-audit fees (i.e., fees for audit-related, tax, and
other services) billed to the registrant by D&T for the registrant’s fiscal years ended March 31, 2024 and March 31, 2025; and (ii) the aggregate non-audit fees (i.e., fees for
audit-related, tax, and other services) billed to the Eaton Vance organization by D&T for the same time periods.
|
|
|
|
|
|
|
|
|
| Fiscal Years Ended |
|
3/31/24 |
|
|
3/31/25 |
|
| Registrant |
|
$ |
0 |
|
|
$ |
0 |
|
| Eaton Vance(1) |
|
$ |
52,836 |
|
|
$ |
18,490 |
|
| (1) |
Eaton Vance Management, a subsidiary of Morgan Stanley, acts as the registrant’s investment adviser and
administrator. |
(h) The registrant’s audit committee has considered whether the provision by the registrant’s principal
accountant of non-audit services to the registrant’s investment adviser and any entity controlling, controlled by, or under common control with the adviser that provides ongoing services to the registrant
that were not pre-approved pursuant to Rule 2-01(c)(7)(ii) of Regulation S-X is compatible with maintaining the principal
accountant’s independence.
(i) Not applicable.
(j) Not
applicable.
Item 5. Audit Committee of Listed Registrants
The registrant has a separately-designated standing audit committee established in accordance with Section 3(a)(58)(A) of the Securities and Exchange Act
of 1934, as amended. George J. Gorman, Keith Quinton, Scott E. Wennerholm (Chair), and Nancy Wiser Stefani are the members of the registrant’s audit committee.
Item 6. Schedule of Investments
(a) Please see
schedule of investments contained in the Report to Stockholders included under Item 1 of this Form N-CSR.
(b) Not
applicable.
Item 7. Financial Statements and Financial Highlights for Open-End Management Investment
Companies
Not applicable.
Item 8. Changes in and Disagreements with Accountants for
Open-End Management Investment Companies
Not applicable.
Item 9. Proxy Disclosures for Open-End Management Investment Companies
Not applicable.
Item 10. Remuneration Paid to
Directors, Officers, and Others of Open-End Management Investment Companies
Not applicable.
Item 11. Statement Regarding Basis for Approval of Investment Advisory Contract
Not applicable.
Item 12. Disclosure of Proxy Voting
Policies and Procedures for Closed-End Management Investment Companies
The Board of the Fund has adopted a
proxy voting policy and procedure (the “Fund Policy”), pursuant to which the trustees have delegated proxy voting responsibility to the Fund’s investment adviser and adopted the investment adviser’s proxy voting policies and
procedures (the “Policies”) which are described below. The trustees will review the Policies annually. In the event that a conflict of interest arises between the Fund’s shareholders and the investment adviser, the administrator, or
any of their affiliates or any affiliate of the Fund, the investment adviser will generally refrain from voting the proxies related to the companies giving rise to such conflict until it consults with the Board, or any committee, sub-committee or group of independent trustees identified by the Board, which will instruct the investment adviser on the appropriate course of action. If the Board Members are unable to meet and the failure to vote
a proxy would have a material adverse impact on the Fund, the investment adviser may vote such proxy, provided that it discloses the existence of the material conflict to the Chairperson of the Fund’s Board as soon as practicable and to the
Board at its next meeting.
The Policies are designed to promote accountability of a company’s management to its shareholders and to align the
interests of management with those shareholders. An independent proxy voting service (“Agent”), currently Institutional Shareholder Services, Inc., has been retained to assist in the voting of proxies through the provision of vote
analysis, implementation and recordkeeping and disclosure services. The investment adviser will generally vote proxies through the Agent. The Agent is required to vote all proxies in accordance with customized proxy voting guidelines (the
“Guidelines”) and/or refer them back to the investment adviser pursuant to the Policies.
The Agent is required to establish and maintain
adequate internal controls and policies in connection with the provision of proxy voting services, including methods to reasonably ensure that its analysis and recommendations are not influenced by a conflict of interest. The Guidelines include
voting guidelines for matters relating to, among other things, the election of directors, approval of independent auditors, executive compensation, corporate structure and anti-takeover defenses. The investment adviser may cause the Fund to abstain
from voting from time to time where it determines that the costs associated with voting a proxy outweigh the benefits derived from exercising the right to vote or it is unable to access or access timely ballots or other proxy information, among
other stated reasons. The Agent will refer Fund proxies to the investment adviser for instructions under circumstances where, among others: (1) the application of the Guidelines is unclear; (2) a particular proxy question is not covered by
the Guidelines; or (3) the Guidelines require input from the investment adviser. When a proxy voting issue has been referred to the investment adviser, the analyst
(or portfolio manager if applicable) covering the company subject to the proxy proposal determines the final vote (or decision not to vote) and the investment adviser’s Proxy Administrator
(described below) instructs the Agent to vote accordingly for securities held by the Fund. Where more than one analyst covers a particular company and the recommendations of such analysts voting a proposal conflict, the investment adviser’s
Global Proxy Group (described below) will review such recommendations and any other available information related to the proposal and determine the manner in which it should be voted, which may result in different recommendations for the Fund that
may differ from other clients of the investment adviser.
The investment adviser has appointed a Proxy Administrator to assist in the coordination of the
voting of client proxies (including the Fund’s) in accordance with the Guidelines and the Policies. The investment adviser and its affiliates have also established a Global Proxy Group. The Global Proxy Group develops the investment
adviser’s positions on all major corporate issues, creates the Guidelines and oversees the proxy voting process. The Proxy Administrator maintains a record of all proxy questions that have been referred by the Agent, all applicable
recommendations, analysis and research received and any resolution of the matter. Before instructing the Agent to vote contrary to the Guidelines or the recommendation of the Agent, the Proxy Administrator will provide the Global Proxy Group with
the Agent’s recommendation for the proposal along with any other relevant materials, including the basis for the analyst’s recommendation. The Proxy Administrator will then instruct the Agent to vote the proxy in the manner determined by
the Global Proxy Group. A similar process will be followed if the Agent has a conflict of interest with respect to a proxy. The investment adviser will report to the Fund’s Board any votes cast contrary to the Guidelines or Agent
recommendations, as applicable, no less than annually.
The investment adviser’s Global Proxy Group is responsible for monitoring and resolving
possible material conflicts with respect to proxy voting. Because the Guidelines are predetermined and designed to be in the best interests of shareholders, application of the Guidelines to vote client proxies should, in most cases, adequately
address any possible conflict of interest. The investment adviser will monitor situations that may result in a conflict of interest between any of its clients and the investment adviser or any of its affiliates by maintaining a list of significant
existing and prospective corporate clients. The Proxy Administrator will compare such list with the names of companies of which he or she has been referred a proxy statement (the “Proxy Companies”). If a company on the list is also a Proxy
Company, the Proxy Administrator will report that fact to the Global Proxy Group. If the Proxy Administrator intends to instruct the Agent to vote in a manner inconsistent with the Guidelines, the Global Proxy Group will first determine, in
consultation with legal counsel if necessary, whether a material conflict exists. If it is determined that a material conflict exists, the investment adviser will seek instruction on how the proxy should be voted from the Fund’s Board, or any
committee or subcommittee identified by the Board. If a matter is referred to the Global Proxy Group, the decision made and basis for the decision will be documented by the Proxy Administrator and/or Global Proxy Group.
Information on how the Fund voted proxies relating to portfolio securities during the most recent 12 month period ended June 30 is available
(1) without charge, upon request, by calling 1-800-262-1122, and (2) on the Securities and Exchange Commission’s
website at http://www.sec.gov.
Item 13. Portfolio Managers of Closed-End Management Investment
Companies
Eaton Vance Management (“EVM” or “Eaton Vance”) is the investment adviser of the Fund. Catherine C. McDermott, Kelley
Gerrity, Andrew Szczurowski, Tara O’Brien, Bo Hunt and Justin H. Bourgette comprise the investment team responsible for the overall management of the Fund’s investments.
Ms. McDermott is a Vice President of EVM and has been a portfolio manager of the Fund since January 2008. Ms. Gerrity is a Vice President of EVM and
has been a portfolio manager of the Fund since March 2019. Ms. O’Brien has been a Vice President of EVM since 2007 and has been a portfolio manager of the Fund since June 2023. Mr. Szczurowski is a Vice President of EVM and has been a
portfolio manager of the Fund since November 2011. Mr. Hunt is a Vice President of EVM and has been a portfolio manager of the Fund since April 2024. Mr. Bourgette is a Vice President of EVM and has been a portfolio manager of the Fund
since March 2025. All of the portfolio managers of the Fund have been employed by the Morgan Stanley organization for more than five years. This information is provided as of the date of filing this report.
The following table shows, as of the Fund’s most recent fiscal year end, the number of accounts each
portfolio manager managed in each of the listed categories and the total assets (in millions of dollars) in the accounts managed within each category. The table also shows the number of accounts with respect to which the advisory fee is based on the
performance of the account, if any, and the total assets (in millions of dollars) in those accounts.
|
|
|
|
|
|
|
|
|
|
|
|
|
|
|
|
|
| |
|
Number of All
Accounts |
|
|
Total Assets of All
Accounts |
|
|
Number of
Accounts
Paying a
Performance Fee |
|
|
Total Assets
of Accounts Paying
a Performance Fee |
|
| Kelley Gerrity(1) |
|
|
|
|
|
|
|
|
|
|
|
|
|
|
|
|
| Registered Investment Companies |
|
|
9 |
|
|
$ |
12,785.3 |
|
|
|
0 |
|
|
$ |
0 |
|
| Other Pooled Investment Vehicles |
|
|
5 |
|
|
$ |
964.9 |
|
|
|
0 |
|
|
$ |
0 |
|
| Other Accounts |
|
|
21 |
|
|
$ |
5,722.4 |
|
|
|
0 |
|
|
$ |
0 |
|
| Catherine C. McDermott |
|
|
|
|
|
|
|
|
|
|
|
|
|
|
|
|
| Registered Investment Companies |
|
|
6 |
|
|
$ |
3,803.9 |
|
|
|
0 |
|
|
$ |
0 |
|
| Other Pooled Investment Vehicles |
|
|
0 |
|
|
$ |
0 |
|
|
|
0 |
|
|
$ |
0 |
|
| Other Accounts |
|
|
0 |
|
|
$ |
0 |
|
|
|
0 |
|
|
$ |
0 |
|
| Andrew Szczurowski, CFA(1) |
|
|
|
|
|
|
|
|
|
|
|
|
|
|
|
|
| Registered Investment Companies |
|
|
7 |
|
|
$ |
23,090.6 |
|
|
|
0 |
|
|
$ |
0 |
|
| Other Pooled Investment Vehicles |
|
|
3 |
|
|
$ |
902.3 |
|
|
|
0 |
|
|
$ |
0 |
|
| Other Accounts |
|
|
0 |
|
|
$ |
0 |
|
|
|
0 |
|
|
$ |
0 |
|
| Tara O’Brien |
|
|
|
|
|
|
|
|
|
|
|
|
|
|
|
|
| Registered Investment Companies |
|
|
1 |
|
|
$ |
2,163.7 |
|
|
|
0 |
|
|
$ |
0 |
|
| Other Pooled Investment Vehicles |
|
|
0 |
|
|
$ |
0 |
|
|
|
0 |
|
|
$ |
0 |
|
| Other Accounts |
|
|
0 |
|
|
$ |
0 |
|
|
|
0 |
|
|
$ |
0 |
|
| Bo Hunt |
|
|
|
|
|
|
|
|
|
|
|
|
|
|
|
|
| Registered Investment Companies |
|
|
6 |
|
|
$ |
11,433.7 |
|
|
|
0 |
|
|
$ |
0 |
|
| Other Pooled Investment Vehicles |
|
|
9 |
|
|
$ |
2,808.0 |
|
|
|
0 |
|
|
$ |
0 |
|
| Other Accounts |
|
|
4 |
|
|
$ |
5,441.2 |
|
|
|
0 |
|
|
$ |
0 |
|
| Justin H. Bourgette, CFA |
|
|
|
|
|
|
|
|
|
|
|
|
|
|
|
|
| Registered Investment Companies |
|
|
9 |
|
|
$ |
35,362.4 |
|
|
|
0 |
|
|
$ |
0 |
|
| Other Pooled Investment Vehicles |
|
|
14 |
|
|
$ |
2,280.5 |
|
|
|
0 |
|
|
$ |
0 |
|
| Other Accounts |
|
|
3 |
|
|
$ |
799.1 |
|
|
|
0 |
|
|
$ |
0 |
|
| (1) |
This portfolio manager serves as portfolio manager of one or more registered investment companies and/or pooled
investment vehicles that invest or may invest in one or more underlying registered investment companies and/or separate pooled investment vehicles in the Eaton Vance family of funds. The underlying investment companies may be managed by this
portfolio manager or another portfolio manager. |
The following table shows the dollar range of Fund shares beneficially owned by each portfolio manager as of the
Fund’s most recent fiscal year end.
|
|
|
| Portfolio Manager |
|
Dollar Range of Equity Securities
Beneficially Owned in the Fund |
| Kelley Gerrity |
|
None |
| Catherine C. McDermott |
|
None |
| Andrew Szczurowski, CFA |
|
$10,001 - $50,000 |
| Tara O’Brien |
|
None |
| Bo Hunt |
|
None |
| Justin H. Bourgette, CFA |
|
None |
Potential for Conflicts of Interest. It is possible that conflicts of interest may arise in connection with a portfolio
manager’s management of the Fund’s investments on the one hand and the investments of other accounts for which a portfolio manager is responsible on the other. For example, a portfolio manager may have conflicts of interest in allocating
management time, resources and investment opportunities among the Fund and other accounts he or she advises. In addition, due to differences in the investment strategies or restrictions between the Fund and the other accounts, the portfolio manager
may take action with respect to another account that differs from the action taken with respect to the Fund. In some cases, another account managed by a portfolio manager may compensate the investment adviser based on the performance of the
securities held by that account. The existence of such a performance based fee may create additional conflicts of interest for the portfolio manager in the allocation of management time, resources and investment opportunities. Whenever conflicts of
interest arise, the portfolio manager will endeavor to exercise his or her discretion in a manner that he or she believes is equitable to all interested persons. EVM has adopted several policies and procedures designed to address these potential
conflicts including a code of ethics and policies that govern the investment adviser’s trading practices, including among other things the aggregation and allocation of trades among clients, brokerage allocations, cross trades and best
execution.
Compensation Structure for EVM
The
compensation structure of Eaton Vance and its affiliates that are investment advisers (for purposes of this section “Eaton Vance”) is based on a total reward system of base salary and incentive compensation, which is paid either in the
form of cash bonus, or for employees meeting the specified deferred compensation eligibility threshold, partially as a cash bonus and partially as mandatory deferred compensation. Deferred compensation granted to Eaton Vance employees is generally
granted as a mix of deferred cash awards under the Investment Management Alignment Plan (IMAP) and equity-based awards in the form of stock units. The portion of incentive compensation granted in the form of a deferred compensation award and the
terms of such awards are determined annually by the Compensation, Management Development and Succession Committee of the Board of Directors of Eaton Vance’s parent company, Morgan Stanley.
Base salary compensation. Generally, portfolio managers and research analysts receive base salary compensation based on the level of their position
with the adviser.
Incentive compensation. In addition to base compensation, portfolio managers and research analysts may receive discretionary year-end compensation. Incentive compensation may include:
| |
• |
|
A mandatory program that defers a portion of incentive compensation into restricted stock units or other awards
based on Morgan Stanley common stock or other plans that are subject to vesting and other conditions. |
| |
• |
|
IMAP is a cash-based deferred compensation plan designed to increase the alignment of participants’
interests with the interests of clients. For eligible employees, a portion of their deferred compensation is mandatorily deferred into IMAP on an annual basis. Awards granted under IMAP are notionally invested in referenced funds available pursuant
to the plan, which are funds advised by MSIM and its affiliates including Eaton Vance. Portfolio managers are required to notionally invest a minimum of 40% of their account balance in the designated funds that they manage and are included in the
IMAP notional investment fund menu. |
| |
• |
|
Deferred compensation awards are typically subject to vesting over a multi-year period and are subject to
cancellation through the payment date for competition, cause (i.e., any act or omission that constitutes a breach of obligation to the Funds, including failure to comply with internal compliance, ethics or risk management standards, and failure or
refusal to perform duties satisfactorily, including supervisory and management duties), disclosure of proprietary information, and solicitation of employees or clients. Awards are also subject to clawback through the payment date if an
employee’s act or omission (including with respect to direct supervisory responsibilities) causes a restatement of the firm’s consolidated financial results, constitutes a violation of the firm’s global risk management principles,
policies and standards, or causes a loss of revenue associated with a position on which the employee was paid and the employee operated outside of internal control policies. |
Eaton Vance compensates employees based on principles of pay-for-performance,
market competitiveness and risk management. Eligibility for, and the amount of any, discretionary compensation is subject to a multi-dimensional process. Specifically, consideration is given to one or more of the following factors, which can vary by
portfolio management team and circumstances:
| |
• |
|
Revenue and profitability of the business and/or each fund/account managed by the portfolio manager
|
| |
• |
|
Individual contribution and performance |
| |
• |
|
Contribution to client objectives |
| |
• |
|
Revenue and profitability of the firm |
| |
• |
|
Return on equity and risk factors of both the business units and Morgan Stanley |
| |
• |
|
Assets managed by the portfolio manager |
| |
• |
|
External market conditions |
| |
• |
|
New business development and business sustainability |
| |
• |
|
Team, product and/or Eaton Vance performance |
| |
• |
|
The pre-tax investment performance of the funds/accounts managed by the
portfolio manager(1) (which may, in certain cases, be measured against the applicable benchmark(s) and/or peer group(s) over one, three and five-year periods),(2) provided that for funds that are tax-managed or otherwise have an objective of after-tax returns, performance net of
taxes will be considered |
Further, the firm’s Global Incentive Compensation Discretion Policy requires compensation managers to
consider only legitimate, business related factors when exercising discretion in determining variable incentive compensation, including adherence to Morgan Stanley’s core values, conduct, disciplinary actions in the current performance year,
risk management and risk outcomes.
| (1) |
Generally, this is total return performance, provided that consideration may also be given to relative
risk-adjusted performance. |
| (2) |
When a fund’s peer group as determined by Lipper or Morningstar is deemed by the relevant Eaton Vance
Chief Investment Officer, or in the case of the sub-advised Funds, the Director of Product Development and Sub-Advised Funds, not to provide a fair comparison,
performance may instead be evaluated primarily against a custom peer group or market index. |
Item 14. Purchases of Equity
Securities by Closed-End Management Investment Company and Affiliated Purchasers
No such purchases this
period.
Item 15. Submission of Matters to a Vote of Security Holders
There have been no material changes to the procedures by which shareholders may recommend nominee to the Fund’s Board of Trustees since the Fund last
provided disclosure in response to this item.
Item 16. Controls and Procedures
(a) It is the conclusion of the registrant’s principal executive officer and principal financial officer that the effectiveness of the registrant’s
current disclosure controls and procedures (such disclosure controls and procedures having been evaluated within 90 days of the date of this filing) provide reasonable assurance that the information required to be disclosed by the registrant has
been recorded, processed, summarized and reported within the time period specified in the Commission’s rules and forms and that the information required to be disclosed by the registrant has been accumulated and communicated to the
registrant’s principal executive officer and principal financial officer in order to allow timely decisions regarding required disclosure.
(b) There
have been no changes in the registrant’s internal controls over financial reporting during the period covered by this report that has materially affected, or is reasonably likely to materially affect, the registrant’s internal control over
financial reporting.
Item 17. Disclosure of Securities Lending Activities for Closed-End Management
Investment Companies
No activity to report for the registrant’s most recent fiscal year end.
Item 18. Recovery of Erroneously Awarded Compensation
Not applicable.
Item 19. Exhibits
Signatures
Pursuant to the requirements of the Securities Exchange Act of 1934 and the Investment Company Act of 1940, the registrant has duly caused this report to be
signed on its behalf by the undersigned, thereunto duly authorized.
Eaton Vance Limited Duration Income Fund
|
|
|
| By: |
|
/s/ Kenneth A. Topping |
|
|
Kenneth A. Topping |
|
|
Principal Executive Officer |
|
|
| Date: |
|
May 22, 2025 |
Pursuant to the requirements of the Securities Exchange Act of 1934 and the Investment Company Act of 1940, this report has
been signed below by the following persons on behalf of the registrant and in the capacities and on the dates indicated.
|
|
|
| By: |
|
/s/ James F. Kirchner |
|
|
James F. Kirchner |
|
|
Principal Financial Officer |
|
|
| Date: |
|
May 22, 2025 |
|
|
| By: |
|
/s/ Kenneth A. Topping |
|
|
Kenneth A. Topping |
|
|
Principal Executive Officer |
|
|
| Date: |
|
May 22, 2025 |