
July 31, 2025
| 2025 Annual Report |
| BlackRock Municipal Credit Alpha Portfolio, Inc. |
| Not FDIC Insured • May Lose Value • No Bank Guarantee |
UNITED STATES
SECURITIES AND EXCHANGE COMMISSION
Washington, D.C. 20549
FORM N-CSR
CERTIFIED SHAREHOLDER REPORT OF REGISTERED MANAGEMENT
INVESTMENT COMPANIES
Investment Company Act file number: 811-21348
Name of Fund: BlackRock Municipal Credit Alpha Portfolio, Inc. (formerly, BlackRock Municipal Income Fund, Inc.)
Fund Address: 100 Bellevue Parkway, Wilmington, DE 19809
Name and address of agent for service: John M. Perlowski, Chief Executive Officer, BlackRock Municipal Credit Alpha Portfolio, Inc. (formerly, BlackRock Municipal Income Fund, Inc.), 50 Hudson Yards, New York, NY 10001
Registrant’s telephone number, including area code: (800) 882-0052, Option 4
Date of fiscal year end: 07/31/2025
Date of reporting period: 07/31/2025
| Item 1 – | Reports to Stockholders |
(a) The Reports to Shareholders are attached herewith.
| 2025 Annual Report |
| BlackRock Municipal Credit Alpha Portfolio, Inc. |
| Not FDIC Insured • May Lose Value • No Bank Guarantee |
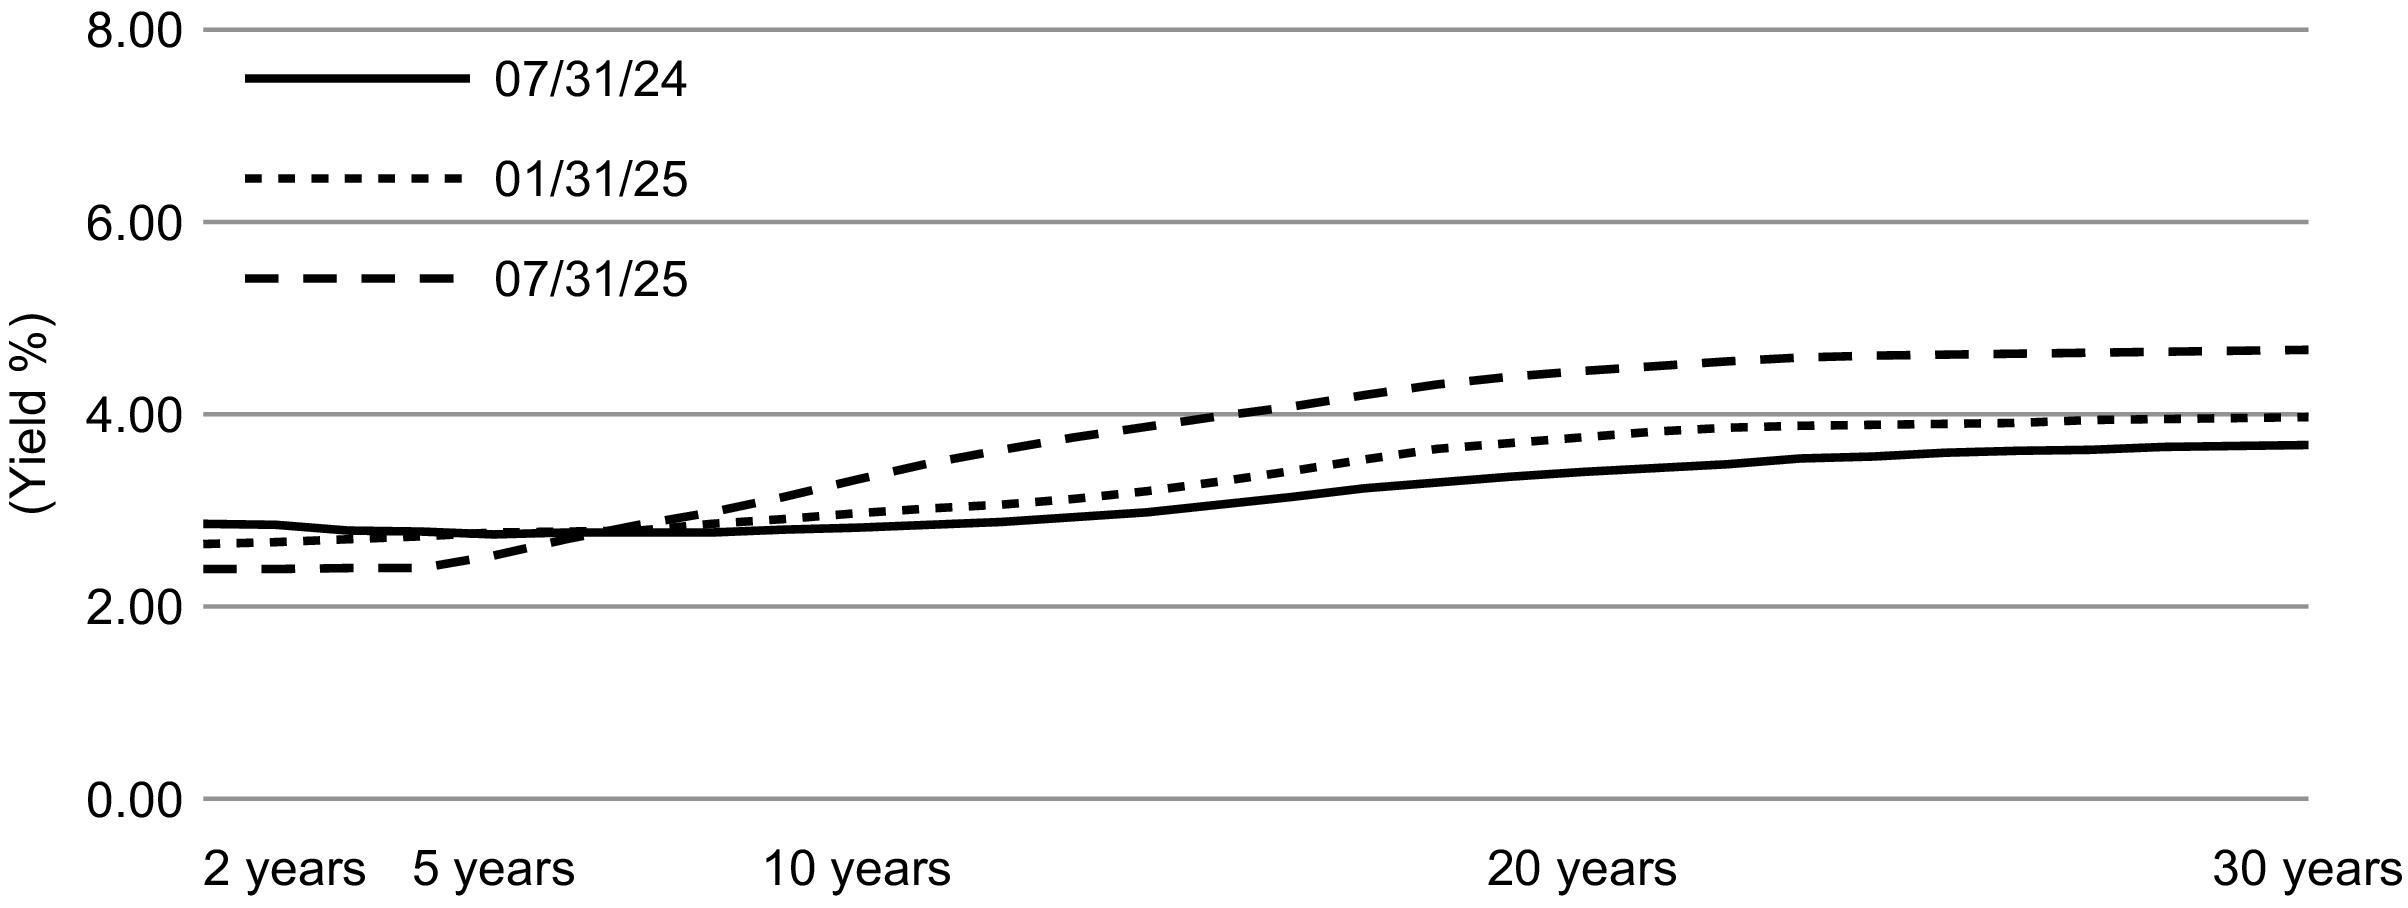
| Bloomberg Municipal Bond Index(a)
| ||
| Total Returns as of July 31, 2025 | ||
| 6 |
months: |
(1.04)% |
| 12 |
months: |
0.00% |
| |
07/31/25 |
03/26/25(a)
|
07/31/24 |
Change |
High |
Low |
| Net Asset Value — Institutional |
$ 12.47
|
$ —
|
$ 13.19
|
(5.46 )% |
$ 13.51
|
$ 12.07
|
| Net Asset Value — Class A |
12.47 |
13.05 |
— |
(4.44 ) |
13.23 |
12.37 |
| Net Asset Value — Class U |
12.47 |
13.05 |
— |
(4.44 ) |
13.23 |
12.37 |
| (a) |
Commencement of operations. |
| |
|
|
Average Annual Total
Returns(a) | |||||
| |
|
|
1 Year |
5 Years |
10 Years | |||
| |
Standardized 30-Day Yields |
Unsubsidized 30-Day Yields |
Without Sales Charge |
With Sales Charge |
Without Sales Charge |
With Sales Charge |
Without Sales Charge |
With Sales Charge |
| Institutional(b) |
5.05 % |
5.00 % |
(0.13 )% |
N/A |
(0.23 )% |
N/A |
2.51 % |
N/A |
| Class A(b) |
4.19 |
4.14 |
(0.90 ) |
(3.38 )% |
(0.98 ) |
(1.48 )% |
1.75 |
1.49 % |
| Class U(b) |
4.30 |
4.25 |
(0.90 ) |
N/A |
(0.98 ) |
N/A |
1.75 |
N/A |
| Bloomberg Custom Blend Benchmark(c)(d) |
— |
— |
(0.75 ) |
N/A |
2.01 |
N/A |
N/A |
N/A |
| National Customized Reference Benchmark(e) |
— |
— |
(0.09 ) |
N/A |
0.35 |
N/A |
N/A |
N/A |
| Bloomberg Municipal Bond Index |
— |
— |
0.00 |
N/A |
0.13 |
N/A |
2.11 |
N/A |
| (a) |
Assuming maximum sales charges, if any. Average annual total returns with and without sales charges reflect reductions for distribution and service fees. See “About Fund
Performance” for a detailed description of share classes, including any related sales
charges and fees, and how performance was calculated for certain share classes. |
| (b) |
Effective March 24, 2025, all returns reflect reinvestment of dividends and/or distributions at NAV on the payable date. Prior to March 24, 2025, all returns reflect
reinvestment of dividends and/or distributions at actual reinvestment prices.
Performance results reflect the Fund’s use of leverage, if any. |
| (c) |
Effective March 24, 2025, the Fund has changed the benchmark against which it measures its performance from National Customized Reference Benchmark to Bloomberg Custom
Blend Benchmark. The Bloomberg Custom Blend Benchmark is relevant
to the Fund because it has characteristics similar to the Fund’s investment strategies. The Fund’s returns shown prior to March 24, 2025 are the returns of the Fund when it followed different investment strategies under the name BlackRock Municipal Income Fund,
Inc. |
| (d) |
The Bloomberg Custom Blend Benchmark is comprised of the Bloomberg Municipal High Yield Index (80%), the Bloomberg BBB Index (10%) and the Bloomberg Single A Index
(10%). The Bloomberg Custom Blend Benchmark commenced on April 20,
2020. |
| (e) |
The National Customized Reference Benchmark is comprised of the Bloomberg Municipal Bond Index Total Return Index Value Unhedged (90%) and the Bloomberg
Municipal Bond: High Yield (non-Investment Grade) Total Return Index (10%). The National
Customized Reference Benchmark commenced on September 30, 2016. |
| SECTOR ALLOCATION | |
| Sector(a)
|
Percent of Total Investments(b)
|
| Transportation |
22.4 % |
| County/City/Special District/School District |
16.6 |
| Corporate |
15.9 |
| Health |
11.6 |
| Education |
11.3 |
| Housing |
6.1 |
| State |
6.0 |
| Tobacco |
5.0 |
| Utilities |
4.2 |
| Other* |
0.9 |
| CREDIT QUALITY ALLOCATION | |
| Credit
Rating(c) |
Percent of Total Investments(b)
|
| AAA/Aaa |
2.1 % |
| AA/Aa |
21.1 |
| A |
14.8 |
| BBB/Baa |
8.3 |
| BB/Ba |
1.1 |
| B |
0.7 |
| CCC/Caa |
0.7 |
| N/R |
51.2 |
| (a) |
For purposes of this report, sector sub-classifications may differ from those utilized by the Fund for compliance purposes. |
| (b) |
Excludes short-term securities. |
| (c) |
For purposes of this report, credit quality ratings shown above reflect the highest rating assigned by either S&P Global Ratings or Moody’s Investors Service,
Inc. if ratings differ. These rating agencies are independent, nationally
recognized statistical rating organizations and are widely used. Investment grade ratings are credit ratings of BBB/Baa or higher. Below investment grade ratings are credit ratings of BB/Ba or lower. Investments designated N/R are not rated by either rating agency. Unrated investments do not necessarily indicate low
credit quality. Credit quality ratings are subject to change. |
| * |
Includes one or more investment categories that individually represents less than 1.0% of the Fund’s total investments. Please refer to the Schedule of Investments for
details. |
| |
Actual |
Hypothetical 5% Return |
|
| |||||||
| |
|
|
Expenses Paid During the Period |
|
Including Interest Expense and Fees |
Excluding Interest Expense and Fees |
Annualized Expense Ratio
| ||||
| |
Beginning Account Value (02/01/25) |
Ending Account Value (07/31/25) |
Including Interest Expense and Fees(a) |
Excluding Interest Expense and Fees(a) |
Beginning Account Value (02/01/25) |
Ending Account Value (07/31/25) |
Expenses Paid During the Period(a) |
Ending Account Value (07/31/25) |
Expenses Paid During the Period(a) |
Including Interest Expense and Fees |
Excluding Interest Expense and Fees |
| Institutional |
$ 1,000.00
|
$ 967.50
|
$ 9.17
|
$ 4.81
|
$ 1,000.00
|
$ 1,015.48
|
$ 9.39
|
$ 1,019.90
|
$ 4.93
|
1.88 % |
0.99 % |
| Class A |
1,000.00 (b) |
972.70 |
11.39 |
5.88 |
1,000.00 (b) |
1,008.46 |
16.40 |
1,016.36 |
8.47 |
3.29 |
1.70 |
| Class U |
1,000.00 (b) |
972.70 |
10.56 |
5.90 |
1,000.00 (b) |
1,009.65 |
15.22 |
1,016.34 |
8.49 |
3.05 |
1.70 |
| (a) |
For each class of the Fund, except for Class A and Class U Shares, expenses are equal to the annualized expense ratio for the class, multiplied by the average account
value over the period, multiplied by 181/365 (to reflect the one-half year
period shown). For Class A and Class U Shares of the Fund, expenses are equal to the annualized expense ratio for the class, multiplied by the
average account value over the period, multiplied by 128/365 for actual expenses and 181/365 for
hypothetical expenses (to reflect the six month period shown). |
| (b) |
Commenced operations on March 26, 2025. |
| Security |
|
Par (000) |
Value |
| Corporate Bonds | |||
| Ground Transportation — 0.3% | |||
| Brightline East LLC, 11.00%,
01/31/30(a) |
$ |
1,660 |
$ 1,079,000 |
| Total Corporate Bonds — 0.3% (Cost: $1,205,440) |
1,079,000 | ||
| |
|
Shares |
|
| Investment Companies | |||
| Fixed Income Funds — 0.5% |
| ||
| Nuveen AMT-Free Quality Municipal Income Fund, Class EB |
|
200,000 |
2,148,000 |
| Total Investment Companies — 0.5% (Cost: $2,382,240) |
2,148,000 | ||
| |
|
Par (000) |
|
| Municipal Bonds | |||
| Alabama — 2.0% |
| ||
| Baldwin County Industrial Development Authority, RB, Series A, AMT, 5.00%,
06/01/55(a)(b) |
$ |
2,500 |
2,496,172 |
| Mobile County Industrial Development Authority, RB |
|
|
|
| Series A, AMT, 5.00%, 06/01/54 |
|
1,500 |
1,357,747 |
| Series B, AMT, 4.75%, 12/01/54 |
|
4,250 |
3,709,703 |
| |
|
|
7,563,622 |
| Arizona(a)
— 1.2% |
| ||
| Arizona Industrial Development Authority, RB |
|
|
|
| 4.38%, 07/01/39 |
|
815 |
710,242 |
| Series A, 5.00%, 07/01/49 |
|
965 |
841,016 |
| Series A, 5.00%, 07/01/54 |
|
745 |
630,536 |
| Series B, 4.25%, 07/01/27 |
|
140 |
140,369 |
| Industrial Development Authority of the County of Pima,
RB, 5.00%, 07/01/29 |
|
245 |
246,854 |
| Industrial Development Authority of the County of Pima, Refunding RB, 5.00%, 06/15/49 |
|
950 |
828,648 |
| Maricopa County Industrial Development Authority, RB,
6.38%, 07/01/58 |
|
1,050 |
973,519 |
| |
|
|
4,371,184 |
| Arkansas — 0.3% |
| ||
| Arkansas Development Finance Authority, RB, Series A, AMT, Sustainability Bonds, 6.88%,
07/01/48(a) |
|
1,000 |
1,061,649 |
| California — 10.1% |
| ||
| California Community Choice Financing Authority, RB, Sustainability Bonds, 5.50%,
10/01/54(b) |
|
2,600 |
2,794,526 |
| California Enterprise Development Authority, RB, 8.00%,
11/15/62(a) |
|
1,450 |
1,375,002 |
| California Housing Finance Agency, RB, M/F Housing, Series P-S, 8.00%, 07/01/67(a)(b)
|
|
1,540 |
1,499,890 |
| California Infrastructure & Economic Development Bank,
Refunding RB, Series A, Class B, AMT, Sustainability
Bonds, 9.50%, 01/01/65(a)(b) |
|
25,030 |
22,276,700 |
| California Municipal Finance Authority, RB, M/F Housing, Series A-S, 8.00%, 09/01/55(a)(b)
|
|
580 |
572,809 |
| California Public Finance Authority, RB, Series A, 6.38%,
06/01/59(a) |
|
4,765 |
4,187,392 |
| Security |
|
Par (000) |
Value |
| California (continued) |
| ||
| CSCDA Community Improvement Authority, RB, M/F
Housing, Sustainability Bonds, 5.00%, 09/01/37(a) |
$ |
150 |
$ 147,653
|
| Golden State Tobacco Securitization Corp., Refunding RB, CAB, Series B-2, Subordinate, 0.00%, 06/01/66(c) |
|
47,735 |
4,572,447 |
| Inland Empire Tobacco Securitization Corp., RB,
Series C-1, 0.00%, 06/01/36(c) |
|
2,500 |
1,125,674 |
| State of California, GO, 5.50%, 04/01/28 |
|
15 |
15,029 |
| |
|
|
38,567,122 |
| Colorado — 6.0% |
| ||
| Colorado Educational & Cultural Facilities Authority, RB,
Series B, Subordinate Lien, 8.50%, 02/01/59(a) |
|
4,020 |
4,025,579 |
| Colorado Health Facilities Authority, RB |
|
|
|
| 5.25%, 11/01/39 |
|
1,000 |
1,044,513 |
| 5.50%, 11/01/47 |
|
620 |
630,612 |
| Creekwalk Marketplace Business Improvement District,
Refunding RB, Series B, 8.00%, 12/15/54 |
|
2,622 |
2,627,506 |
| Gold Hill North Business Improvement District, GOL, Series A, 5.60%, 12/01/54(a) |
|
500 |
458,497 |
| Granary Metropolitan District No. 9 Special Assessment
District No. 1, SAB, 5.45%, 12/01/44(a) |
|
2,280 |
2,138,416 |
| Independence Metropolitan District No. 3, GOL, Series B, 7.13%, 12/15/54 |
|
2,000 |
1,993,248 |
| Mayfield Metropolitan District, GOL, Series A, 5.75%,
12/01/50 |
|
1,178 |
1,158,161 |
| Orchard Park Place South Metropolitan District, GOL, 6.00%, 12/01/54(a) |
|
1,060 |
1,066,146 |
| Palisade Metropolitan District No. 2, RB, Series C,
8.00%, 12/15/37(a) |
|
2,575 |
2,601,427 |
| Palisade Metropolitan District No. 2, Refunding RB, CAB, Series B, Convertible, 0.00%,
12/15/54(a)(d) |
|
1,605 |
1,425,695 |
| Parterre Metropolitan District No. 5, GOL, 8.38%,
12/15/55 |
|
1,450 |
1,451,751 |
| Sojourn at Idlewild Metropolitan District, GOL, Series A, 6.13%, 12/01/55(a) |
|
500 |
483,358 |
| St. Vrain Lakes Metropolitan District No. 2, Refunding
GOL, Series B, 6.38%, 11/15/54 |
|
2,000 |
1,996,010 |
| |
|
|
23,100,919 |
| Florida — 4.0% |
| ||
| Alachua County Housing Finance Authority, RB, M/F Housing, Series A, 6.30%,
07/01/55(a)(b) |
|
1,000 |
986,267 |
| Arbor Park Phase 1 Community Development District,
SAB |
|
|
|
| Series A-1, 5.88%, 05/01/45 |
|
380 |
384,851 |
| Series A-1, 6.10%, 05/01/55 |
|
580 |
582,496 |
| Capital Projects Finance Authority,
RB(a) |
|
|
|
| Series A-1, 7.50%, 06/15/65 |
|
1,015 |
998,991 |
| Series B-1, 9.00%, 06/15/42 |
|
125 |
124,899 |
| Capital Region Community Development District,
Refunding SAB, Series A-1, 4.63%, 05/01/28 |
|
300 |
301,171 |
| Capital Trust Agency, Inc., RB(a)
|
|
|
|
| 5.00%, 01/01/55 |
|
945 |
767,394 |
| Series A, 4.00%, 06/15/29 |
|
375 |
369,566 |
| Series A, 5.00%, 06/01/45 |
|
850 |
709,650 |
| Series A, 5.50%, 06/01/57 |
|
305 |
249,602 |
| Coastal Ridge Community Development District, SAB,
6.00%, 05/01/55 |
|
1,000 |
978,298 |
| Curiosity Creek Community Development District, SAB(a) |
|
|
|
| 5.40%, 05/01/44 |
|
230 |
222,600 |
| 5.70%, 05/01/55 |
|
380 |
356,928 |
| Security |
|
Par (000) |
Value |
| Florida (continued) |
| ||
| Esplanade Lake Club Community Development District,
SAB, Series A-2, 3.63%, 11/01/30 |
$ |
50 |
$ 48,209
|
| Florida Development Finance Corp.,
RB(a) |
|
|
|
| AMT, 5.00%, 05/01/29 |
|
2,380 |
2,398,080 |
| Series A, AMT, 12.00%,
07/15/59(b)(e)(f) |
|
2,480 |
1,537,600 |
| Gas Worx Community Development District, SAB,
6.00%, 05/01/57(a) |
|
600 |
576,766 |
| Seminole Improvement District, RB |
|
|
|
| 5.00%, 10/01/32 |
|
265 |
263,639 |
| 5.30%, 10/01/37 |
|
300 |
292,689 |
| Sterling Hill Community Development District, Refunding
SAB, Series B, 5.50%, 11/01/10(e)(f) |
|
142 |
64,103 |
| Tolomato Community Development District, Refunding SAB, Sub-Series A-2, 3.85%, 05/01/29 |
|
140 |
138,130 |
| Viera Stewardship District, SAB, Series 2023, 5.50%,
05/01/54 |
|
910 |
860,781 |
| Village Community Development District No. 14, SAB, 5.50%, 05/01/53 |
|
1,920 |
1,947,016 |
| |
|
|
15,159,726 |
| Georgia — 0.1% |
| ||
| East Point Business & Industrial Development Authority,
RB, Series A, 5.25%, 06/15/62(a) |
|
740 |
499,500 |
| Illinois — 2.0% |
| ||
| City of Chicago Minnesota, GO, Series A, 6.00%,
01/01/50 |
|
2,710 |
2,774,130 |
| City of Marion Illinois Sales Tax Revenue, Refunding RB |
|
|
|
| 6.38%, 06/01/45 |
|
645 |
615,572 |
| 6.63%, 06/01/55 |
|
1,190 |
1,120,909 |
| County of Cook Illinois, RB, M/F Housing, 6.50%,
01/01/45 |
|
3,000 |
2,906,303 |
| State of Illinois, GO, Series D, 5.00%, 11/01/28 |
|
350 |
364,677 |
| |
|
|
7,781,591 |
| Indiana — 0.2% |
| ||
| Indiana Finance Authority, RB |
|
|
|
| 5.00%, 06/01/51 |
|
405 |
334,386 |
| 5.00%, 06/01/56 |
|
360 |
290,140 |
| |
|
|
624,526 |
| Kentucky — 0.6% |
| ||
| City of Henderson Kentucky, RB, Series A, AMT, 4.70%, 01/01/52(a) |
|
1,885 |
1,648,590 |
| County of Boyle Kentucky, Refunding RB, Series A,
4.25%, 06/01/46 |
|
810 |
702,623 |
| |
|
|
2,351,213 |
| Louisiana — 1.8% |
| ||
| Louisiana Public Facilities Authority, RB, 6.15%, 06/15/55(a) |
|
7,000 |
6,880,688 |
| Maryland — 0.6% |
| ||
| City of Baltimore Maryland, RB, 5.00%, 06/01/51 |
|
820 |
784,761 |
| Maryland Health & Higher Educational Facilities
Authority, RB, 6.25%, 07/01/63(a) |
|
1,655 |
1,543,145 |
| |
|
|
2,327,906 |
| Michigan — 0.0% |
| ||
| City of Detroit Michigan Water Supply System Revenue, RB, Series B, 2nd Lien, 6.25%, 07/01/36 |
|
10 |
10,016 |
| Security |
|
Par (000) |
Value |
| Minnesota(a)
— 0.4% |
| ||
| City of Eagan Minnesota, RB |
|
|
|
| Series A, 6.38%, 02/01/55 |
$ |
250 |
$ 223,764
|
| Series A, 6.50%, 02/01/65 |
|
1,250 |
1,113,190 |
| Housing & Redevelopment Authority of The City of St. Paul Minnesota, RB, Series A, 4.75%, 07/01/29 |
|
100 |
101,142 |
| |
|
|
1,438,096 |
| New Hampshire — 1.2% |
| ||
| New Hampshire Business Finance Authority, RB, 5.88%,
12/15/33(a) |
|
1,945 |
1,956,347 |
| New Hampshire Business Finance Authority, RB, CAB, 0.00%, 04/01/32(a)(c) |
|
1,250 |
837,167 |
| New Hampshire Business Finance Authority, RB, M/F
Housing, 1st Series, Class B, 5.75%, 04/28/42 |
|
860 |
864,224 |
| New Hampshire Health and Education Facilities Authority Act, Refunding RB, 4.00%,
07/01/37(a) |
|
1,000 |
823,767 |
| |
|
|
4,481,505 |
| New Jersey — 0.8% |
| ||
| Camden County Improvement Authority, RB,
Sustainability Bonds, 6.00%, 06/15/47 |
|
940 |
978,583 |
| New Jersey Economic Development Authority, ARB, AMT, 6.38%, 01/01/35(a) |
|
1,460 |
1,472,510 |
| Newark Housing Authority, RB, M/F Housing, Series A,
5.00%, 12/01/25 |
|
690 |
690,729 |
| |
|
|
3,141,822 |
| New Mexico — 0.2% |
| ||
| City of Santa Fe New Mexico, RB, Series A, 5.00%, 05/15/44 |
|
820 |
770,502 |
| New York — 2.3% |
| ||
| Buffalo & Erie County Industrial Land Development Corp., Refunding RB, Series A, 5.00%, 06/01/35 |
|
415 |
423,724 |
| Build NYC Resource Corp., RB, Series A, 4.88%,
05/01/31(a) |
|
330 |
335,195 |
| Huntington Local Development Corp., RB, Series A, 5.00%, 07/01/36 |
|
940 |
871,319 |
| New York Liberty Development Corp., Refunding RB,
Class 1, 5.00%, 11/15/44(a) |
|
1,730 |
1,660,999 |
| New York Transportation Development Corp., ARB |
|
|
|
| AMT, 5.63%, 04/01/40 |
|
1,810 |
1,856,215 |
| AMT, 5.00%, 12/01/40 |
|
1,865 |
1,865,764 |
| TSASC, Inc., Refunding RB, Series B, 5.00%, 06/01/48 |
|
1,810 |
1,576,770 |
| |
|
|
8,589,986 |
| North Carolina — 0.6% |
| ||
| North Carolina Housing Finance Agency, RB, S/F Housing, Sustainability Bonds, (FHLMC, FNMA, GNMA), 5.00%, 07/01/47 |
|
1,645 |
1,626,497 |
| University of North Carolina at Chapel Hill, RB, 5.00%,
02/01/49 |
|
620 |
646,159 |
| |
|
|
2,272,656 |
| Ohio — 2.7% |
| ||
| Buckeye Tobacco Settlement Financing Authority, Refunding RB, Series B-2, Class 2, 5.00%, 06/01/55 |
|
10,265 |
8,333,755 |
| Buckeye Tobacco Settlement Financing Authority,
Refunding RB, CAB, Series B-3, Class 2, 0.00%,
06/01/57(c) |
|
24,530 |
2,150,721 |
| |
|
|
10,484,476 |
| Security |
|
Par (000) |
Value |
| Oklahoma — 0.6% |
| ||
| Tulsa Municipal Airport Trust Trustees, Refunding ARB,
AMT, 6.25%, 12/01/40 |
$ |
1,830 |
$ 1,966,901
|
| Tulsa Municipal Airport Trust Trustees, Refunding RB, Series C, AMT, 5.50%, 12/01/35 |
|
390 |
385,048 |
| |
|
|
2,351,949 |
| Pennsylvania — 1.8% |
| ||
| Pennsylvania Economic Development Financing
Authority, RB |
|
|
|
| AMT, 5.75%, 06/30/48 |
|
2,365 |
2,364,534 |
| AMT, 5.25%, 06/30/53 |
|
3,910 |
3,673,893 |
| Philadelphia Authority for Industrial Development, RB, 5.25%, 11/01/52 |
|
745 |
741,038 |
| |
|
|
6,779,465 |
| Puerto Rico — 3.7% |
| ||
| Commonwealth of Puerto Rico, RB, 0.00%,
11/01/51(b)(e)(f) |
|
13,163 |
7,187,331 |
| Puerto Rico Sales Tax Financing Corp. Sales Tax Revenue, RB |
|
|
|
| Series A-1, Restructured, 4.75%, 07/01/53 |
|
3,066 |
2,740,352 |
| Series A-1, Restructured, 5.00%, 07/01/58 |
|
2,099 |
1,910,949 |
| Series A-2, Restructured, 4.78%, 07/01/58 |
|
2,500 |
2,213,295 |
| |
|
|
14,051,927 |
| Rhode Island — 0.1% |
| ||
| Tobacco Settlement Financing Corp., RB, CAB, Series A, 0.00%, 06/01/52(c) |
|
1,910 |
320,566 |
| South Carolina — 0.3% |
| ||
| South Carolina Jobs-Economic Development Authority, RB, M/F Housing, Series A, 6.75%,
12/01/60(a) |
|
935 |
920,041 |
| South Carolina State Housing Finance & Development
Authority, Refunding RB, S/F Housing, Series A,
4.95%, 07/01/53 |
|
295 |
286,157 |
| |
|
|
1,206,198 |
| Tennessee — 1.7% |
| ||
| Metropolitan Government Nashville & Davidson County Health & Educational cilities Board, RB, 5.25%, 05/01/48 |
|
820 |
817,783 |
| Tennergy Corp., RB, Series A, 5.50%, 10/01/53(b) |
|
5,395 |
5,772,458 |
| |
|
|
6,590,241 |
| Texas — 5.7% |
| ||
| Arlington Higher Education Finance Corp.,
RB(a) |
|
|
|
| 7.50%, 04/01/62 |
|
1,630 |
1,545,501 |
| 7.88%, 11/01/62 |
|
1,410 |
1,415,779 |
| Beaumont Housing Authority, RB, M/F Housing, Series A,
6.50%, 07/01/55(a) |
|
385 |
366,181 |
| City of Houston Texas Airport System Revenue, ARB, Series A, AMT, 6.63%, 07/15/38 |
|
700 |
700,245 |
| City of Pilot Point Texas, SAB(a) |
|
|
|
| 6.38%, 09/15/55 |
|
2,000 |
1,957,261 |
| 7.13%, 09/15/55 |
|
1,000 |
990,912 |
| County of Denton Texas, SAB(a)
|
|
|
|
| 6.13%, 12/31/55 |
|
1,145 |
1,129,004 |
| Series A, Senior Lien, 5.63%, 12/31/54 |
|
2,000 |
1,945,394 |
| Love Field Airport Modernization Corp., ARB, 5.00%,
11/01/28 |
|
700 |
700,282 |
| New Hope Cultural Education Facilities Finance Corp., RB, Series A, 5.00%, 08/15/50(a)
|
|
800 |
603,470 |
| Security |
|
Par (000) |
Value |
| Texas (continued) |
| ||
| Texas City Industrial Development Corp., RB,
Series 2012, 4.13%, 12/01/45 |
$ |
445 |
$ 353,117
|
| Texas Community Housing & Economic Development Corp., RB, M/F Housing, Series A1, Senior Lien, 6.25%, 01/01/65(a) |
|
1,510 |
1,367,180 |
| Texas Municipal Gas Acquisition & Supply Corp. III,
Refunding RB |
|
|
|
| 5.00%, 12/15/30 |
|
1,720 |
1,828,410 |
| 5.00%, 12/15/32 |
|
6,585 |
7,017,216 |
| |
|
|
21,919,952 |
| Utah — 2.1% |
| ||
| Mida Mountain Village Public Infrastructure District, TA(a) |
|
|
|
| Series 1, 5.13%, 06/15/54 |
|
795 |
727,913 |
| Series 2, 6.00%, 06/15/54 |
|
5,000 |
4,955,411 |
| Utah Charter School Finance Authority, Refunding RB,
4.50%, 06/15/27(a) |
|
505 |
504,276 |
| Wolf Creek Infrastructure Financing District No. 1, SAB, 5.75%, 12/01/44 |
|
2,000 |
1,924,307 |
| |
|
|
8,111,907 |
| Virginia — 0.5% |
| ||
| Virginia Housing Development Authority, RB, M/F
Housing, Series G, 5.15%, 11/01/52 |
|
2,065 |
2,067,575 |
| Wisconsin — 6.7% |
| ||
| Public Finance Authority, RB |
|
|
|
| 0.00%, 12/15/36(a)(c) |
|
9,500 |
4,473,931 |
| 5.75%, 12/01/54(a) |
|
3,000 |
2,898,494 |
| Class A, 5.00%, 06/15/56(a) |
|
1,000 |
727,214 |
| Class A, 6.45%, 04/01/60(a) |
|
1,000 |
912,545 |
| Class B, 5.65%, 07/01/62(a)(b)
|
|
15,000 |
10,800,000 |
| Series A, 7.25%, 01/01/61(a) |
|
1,000 |
1,024,290 |
| AMT, Sustainability Bonds, 4.00%, 09/30/51 |
|
1,595 |
1,223,790 |
| AMT, Sustainability Bonds, 4.00%, 03/31/56 |
|
1,520 |
1,135,518 |
| Public Finance Authority, RB, CAB(a)(c)
|
|
|
|
| 0.00%, 12/15/32 |
|
1,067 |
671,059 |
| 0.00%, 12/15/38 |
|
1,805 |
808,073 |
| Public Finance Authority, RB, M/F Housing, Series A,
7.13%, 07/01/65(a)(b) |
|
660 |
640,263 |
| Public Finance Authority, Refunding RB, 5.00%, 09/01/49(a) |
|
520 |
455,095 |
| |
|
|
25,770,272 |
| Total Municipal Bonds — 60.3% (Cost: $239,092,656) |
230,648,757 | ||
| Municipal Bonds Transferred to Tender Option Bond Trusts(g) | |||
| Alabama — 5.5% |
| ||
| Black Belt Energy Gas District, RB, Series C-1, 5.25%,
02/01/53(b) |
|
20,000 |
20,982,318 |
| California — 1.3% |
| ||
| City of Los Angeles Department of Airports, ARB,
Series C, AMT, 5.00%, 05/15/45 |
|
5,000 |
4,980,238 |
| Colorado — 1.9% |
| ||
| City & County of Denver Colorado Airport System
Revenue, Refunding ARB, Series A, AMT, 5.50%,
11/15/53 |
|
7,310 |
7,401,548 |
| Security |
|
Par (000) |
Value |
| Idaho — 1.8% |
| ||
| Idaho Housing & Finance Association, RB, Series A,
5.25%, 08/15/48(h) |
$ |
6,880 |
$ 7,099,831 |
| Illinois — 3.1% |
| ||
| Illinois State Toll Highway Authority, RB, Series A, 5.00%,
01/01/46 |
|
11,860 |
11,810,775 |
| Michigan — 6.7% |
| ||
| Michigan Finance Authority, Refunding RB, 5.00%,
12/01/45 |
|
15,520 |
15,190,303 |
| Michigan State Hospital Finance Authority, Refunding RB, 5.00%, 11/15/47 |
|
10,000 |
10,318,398 |
| |
|
|
25,508,701 |
| Mississippi — 3.3% |
| ||
| Mississippi Development Bank, RB |
|
|
|
| 6.75%, 12/01/31 |
|
3,775 |
3,805,050 |
| 6.75%, 12/01/33 |
|
2,350 |
2,368,707 |
| (AGM), 6.88%, 12/01/40 |
|
6,405 |
6,455,986 |
| |
|
|
12,629,743 |
| Pennsylvania — 7.6% |
| ||
| Pennsylvania Housing Finance Agency, RB, S/F
Housing, Series 149 A, 5.15%, 10/01/50 |
|
10,000 |
9,974,461 |
| Pennsylvania Turnpike Commission, RB, Series B-1, 5.25%, 06/01/47 |
|
18,910 |
18,954,510 |
| |
|
|
28,928,971 |
| Washington — 1.5% |
| ||
| Port of Seattle Washington, Refunding ARB, Series C,
AMT, 5.00%, 08/01/46 |
|
5,755 |
5,632,450 |
| Total Municipal Bonds Transferred to Tender Option Bond Trusts — 32.7% (Cost: $124,971,876) |
124,974,575 | ||
| Total Long-Term Investments — 93.8% (Cost: $367,652,212) |
358,850,332 | ||
| |
|
Shares |
|
| Short-Term Securities | |||
| Money Market Funds — 19.4% |
| ||
| BlackRock Liquidity Funds, MuniCash, Institutional Shares, 2.51%(i)(j) |
|
74,117,057 |
74,124,469 |
| Security |
|
Par (000) |
Value |
| U.S. Treasury Obligations — 6.5% |
| ||
| U.S. Treasury Bills(k) |
|
|
|
| 4.37%, 09/11/25 |
$ |
15,000 |
$ 14,926,755
|
| 4.30%, 09/25/25 |
|
10,000 |
9,934,313 |
| |
24,861,068 | ||
| Total Short-Term Securities — 25.9% (Cost: $98,987,548) |
98,985,537 | ||
| Total Investments — 119.7% (Cost: $466,639,760) |
457,835,869 | ||
| Other Assets Less Liabilities — 0.4% |
1,519,862 | ||
| Liability for
TOB Trust
Certificates, Including Interest Expense and Fees Payable —
(20.1)% |
(76,779,222 ) | ||
| Net Assets — 100.0% |
$ 382,576,509 | ||
| (a) |
Security exempt from registration pursuant to Rule 144A under the Securities Act of 1933,
as amended. These securities may be resold in transactions exempt from registration to
qualified institutional investors. |
| (b) |
Variable rate security. Interest rate resets periodically. The rate shown is the effective
interest rate as of period end. Security description also includes the reference rate and
spread if published and available. |
| (c) |
Zero-coupon bond. |
| (d) |
Step coupon security. Coupon rate will either increase (step-up bond) or decrease (step-
down bond) at regular intervals until maturity. Interest rate shown reflects the rate
currently in effect. |
| (e) |
Issuer filed for bankruptcy and/or is in default. |
| (f) |
Non-income producing security. |
| (g) |
Represent bonds transferred to a TOB Trust in exchange of cash and residual certificates
received by the Fund. These bonds serve as collateral in a secured borrowing. See Note 4
of the Notes to Financial Statements for details. |
| (h) |
All or a portion of the security is subject to a recourse agreement. The aggregate
maximum potential amount the Fund could ultimately be required to pay under the
agreement, which expires on August 15, 2031, is $3,625,617. See Note 4 of
the Notes to Financial Statements for details. |
| (i) |
Affiliate of the Fund. |
| (j) |
Annualized 7-day yield as of period end. |
| (k) |
Rates are discount rates or a range of discount rates as of period end. |
| Affiliated Issuer |
Value at 07/31/24 |
Purchases at Cost |
Proceeds from Sales |
Net Realized Gain (Loss) |
Change in Unrealized Appreciation (Depreciation) |
Value at 07/31/25 |
Shares Held at 07/31/25 |
Income |
Capital Gain Distributions from Underlying Funds |
| BlackRock Liquidity Funds, MuniCash, Institutional Shares |
$ 375,440,715 |
$ — |
$ (301,316,246 )(a) |
$ 2,013 |
$ (2,013 ) |
$ 74,124,469 |
74,117,057 |
$ 1,613,153 |
$ — |
| (a) |
Represents net amount purchased (sold). |
| |
Level 1 |
Level 2 |
Level 3 |
Total |
| Assets |
|
|
|
|
| Investments |
|
|
|
|
| Long-Term Investments |
|
|
|
|
| Corporate Bonds |
$ —
|
$ 1,079,000
|
$ —
|
$ 1,079,000
|
| Investment Companies |
2,148,000 |
— |
— |
2,148,000 |
| Municipal Bonds |
— |
230,648,757 |
— |
230,648,757 |
| Municipal Bonds Transferred to Tender Option Bond Trusts |
— |
124,974,575 |
— |
124,974,575 |
| Short-Term Securities |
|
|
|
|
| Money Market Funds |
74,124,469 |
— |
— |
74,124,469 |
| U.S. Treasury Obligations |
— |
24,861,068 |
— |
24,861,068 |
| |
$76,272,469 |
$381,563,400 |
$— |
$457,835,869 |
| |
BlackRock Municipal Credit
Alpha Portfolio, Inc. |
| ASSETS |
|
| Investments, at value —
unaffiliated(a) |
$ 383,711,400 |
| Investments, at value —
affiliated(b) |
74,124,469 |
| Receivables: |
|
| Investments sold |
153,394 |
| Capital shares sold |
170,627 |
| Dividends — unaffiliated |
14,601 |
| Dividends — affiliated |
59,805 |
| Interest — unaffiliated |
3,535,115 |
| Prepaid expenses |
91,635 |
| Total assets |
461,861,046 |
| ACCRUED LIABILITIES |
|
| Bank overdraft |
8,266 |
| Payables: |
|
| Accounting services fees |
58,869 |
| Custodian fees |
9,744 |
| Income dividend distributions |
1,496,461 |
| Interest expense and fees |
329,349 |
| Investment advisory fees |
291,475 |
| Directors’ and Officer’s fees |
581,650 |
| Other accrued expenses |
31,144 |
| Professional fees |
23,047 |
| Service and distribution fees |
4,659 |
| Total accrued liabilities |
2,834,664 |
| OTHER LIABILITIES |
|
| TOB Trust Certificates |
76,449,873 |
| Total liabilities |
79,284,537 |
| Commitments and contingent liabilities |
|
| NET ASSETS |
$ 382,576,509 |
| NET ASSETS CONSIST OF |
|
| Paid-in capital |
$ 489,467,989 |
| Accumulated loss |
(106,891,480) |
| NET ASSETS |
$ 382,576,509 |
| (a) Investments, at cost—unaffiliated |
$392,515,291 |
| (b) Investments, at cost—affiliated |
$74,124,469 |
| |
BlackRock Municipal Credit
Alpha Portfolio, Inc. |
| NET ASSET VALUE |
|
| Institutional |
|
| Net assets |
$ 378,103,158 |
| Shares outstanding |
30,331,204 |
| Net asset value |
$ 12.47 |
| Shares authorized |
140,000,000 |
| Par value |
$0.10 |
| Class A |
|
| Net assets |
$ 477,708 |
| Shares outstanding |
38,314 |
| Net asset value |
$ 12.47 |
| Shares authorized |
30,000,000 |
| Par value |
$0.10 |
| Class U |
|
| Net assets |
$ 3,995,643 |
| Shares outstanding |
320,473 |
| Net asset value |
$ 12.47 |
| Shares authorized |
30,000,000 |
| Par value |
$0.10 |
| |
BlackRock Municipal Credit
Alpha Portfolio, Inc. |
| INVESTMENT INCOME |
|
| Dividends — unaffiliated |
$116,800
|
| Dividends — affiliated |
1,613,153 |
| Interest — unaffiliated |
34,052,381 |
| Total investment income |
35,782,334 |
| EXPENSES |
|
| Investment advisory |
4,340,482 |
| Transfer agent |
228,383 |
| Reorganization |
198,824 |
| Accounting services |
140,965 |
| Professional |
125,199 |
| Directors and Officer |
85,223 |
| Registration |
16,899 |
| Service and distribution — class specific |
8,548 |
| Custodian |
7,301 |
| Printing and postage |
5,160 |
| Liquidity fees |
3,592 |
| Remarketing fees on Preferred Shares |
3,527 |
| Transfer agent — class specific |
3,075 |
| Miscellaneous |
119,795 |
| Total expenses excluding interest expense and fees |
5,286,973 |
| Interest expense and fees — unaffiliated(a) |
4,933,374 |
| Total expenses |
10,220,347 |
| Less: Fees waived and/or reimbursed by the Manager |
(200,424 ) |
| Total expenses after fees waived and/or reimbursed |
10,019,923 |
| Net investment income |
25,762,411 |
| REALIZED AND UNREALIZED GAIN (LOSS) |
|
| Net realized gain from: |
|
| Investments — unaffiliated |
18,562,023 |
| Investments — affiliated |
2,013 |
| |
18,564,036 |
| Net change in unrealized appreciation (depreciation) on: |
|
| Investments — unaffiliated |
(50,801,465 ) |
| Investments — affiliated |
(2,013 ) |
| |
(50,803,478 ) |
| Net realized and unrealized loss |
(32,239,442 ) |
| NET DECREASE IN NET ASSETS RESULTING FROM OPERATIONS |
$(6,477,031 ) |
| (a) Related to TOB Trusts and VRDP
Shares. | |
| |
BlackRock Municipal Credit Alpha Portfolio, Inc. | |
| |
Year Ended
07/31/25 |
Year Ended 07/31/24
|
| | ||
| INCREASE (DECREASE) IN NET ASSETS
APPLICABLE TO COMMON SHAREHOLDERS |
|
|
| OPERATIONS |
|
|
| Net investment income |
$25,762,411
|
$31,796,675
|
| Net realized gain (loss) |
18,564,036 |
(22,941,762 ) |
| Net change in unrealized appreciation (depreciation) |
(50,803,478 ) |
27,518,665 |
| Net increase (decrease) in net assets applicable to Common Shareholders resulting from operations |
(6,477,031 ) |
36,373,578 |
| DISTRIBUTIONS TO COMMON
SHAREHOLDERS(a) |
|
|
| From net investment income |
|
|
| Institutional |
(22,707,025 ) |
(35,379,822 ) |
| Class A |
(1,435 ) |
— |
| Class U |
(7,978 ) |
— |
| Return of capital |
|
|
| Institutional |
(9,558,613 ) |
(6,174,248 ) |
| Class A |
(7,263 ) |
— |
| Class U |
(41,871 ) |
— |
| Decrease in net assets resulting from distributions to Common Shareholders |
(32,324,185 ) |
(41,554,070 ) |
| CAPITAL SHARE TRANSACTIONS |
|
|
| Shares sold and issued |
6,261,195 |
— |
| Reinvestment of distributions |
2,314,578 |
— |
| Redemption of shares resulting from share repurchase program (including transaction costs) |
(76,302,170 ) |
(9,262,292 ) |
| Repurchase of shares resulting from tender offers |
(460,353,765 ) |
— |
| Net decrease in net assets derived from capital share transactions |
(528,080,162 ) |
(9,262,292 ) |
| NET ASSETS APPLICABLE TO COMMON
SHAREHOLDERS |
|
|
| Total decrease in net assets applicable to Common Shareholders |
(566,881,378 ) |
(14,442,784 ) |
| Beginning of year |
949,457,887 |
963,900,671 |
| End of year |
$382,576,509 |
$949,457,887 |
| (a) |
Distributions for annual periods determined in accordance with U.S. federal income tax
regulations. |
| |
BlackRock Municipal Credit
Alpha Portfolio, Inc. |
| CASH PROVIDED BY (USED FOR) OPERATING ACTIVITIES |
|
| Net decrease in net assets resulting from operations |
$(6,477,031
) |
| Adjustments to reconcile net decrease in net assets resulting from operations to net cash provided by operating activities: |
|
| Proceeds from sales of long-term investments and principal paydowns/payups |
1,037,191,913 |
| Purchases of long-term investments |
(248,637,239 ) |
| Net proceeds from sales of short-term securities |
276,578,083 |
| Amortization of premium and accretion of discount on investments and other fees |
(345,126 ) |
| Net realized gain on investments |
(18,564,036 ) |
| Net unrealized depreciation on investments |
50,803,478 |
| (Increase) Decrease in Assets |
|
| Receivables |
|
| Dividends — affiliated |
138,244 |
| Dividends — unaffiliated |
(14,601 ) |
| Interest — unaffiliated |
8,850,184 |
| Prepaid expenses |
(68,756 ) |
| Increase (Decrease) in Liabilities |
|
| Payables |
|
| Accounting services fees |
12,148 |
| Custodian fees |
5,417 |
| Interest expense and fees |
4,060 |
| Investment advisory fees |
(427,867 ) |
| Directors’ and Officer’s fees |
(6,776 ) |
| Other accrued expenses |
7,022 |
| Professional fees |
(31,713 ) |
| Proxy fees |
(217,205 ) |
| Reorganization costs |
(280,380 ) |
| Service and distribution fees |
4,659 |
| Transfer agent fees |
(20,185 ) |
| Variation margin on futures contracts |
(137,913 ) |
| Net cash provided by operating activities |
1,098,366,380 |
| CASH PROVIDED BY (USED FOR) FINANCING ACTIVITIES |
|
| Cash dividends paid to Common Shareholders |
(32,472,714 ) |
| Repayments of TOB Trust Certificates |
(44,929,992 ) |
| Payments on redemption of VRDP Shares |
(561,700,000 ) |
| Net payments on redemption of capital shares |
(536,655,935 ) |
| Proceeds from TOB Trust Certificates |
69,889,990 |
| Decrease in bank overdraft |
(12,240 ) |
| Amortization of deferred offering costs |
479,943 |
| Proceeds from issuance of capital shares |
6,090,568 |
| Net cash used for financing activities |
(1,099,310,380 ) |
| CASH |
|
| Net decrease in restricted and unrestricted cash |
(944,000 ) |
| Restricted and unrestricted cash at beginning of year |
944,000 |
| Restricted and unrestricted cash at end of year |
$— |
| SUPPLEMENTAL DISCLOSURE OF CASH FLOW INFORMATION |
|
| Cash paid during the year for interest expense |
$4,449,371 |
| NON-CASH FINANCING ACTIVITIES |
|
| Reinvestment of distributions |
$2,314,578 |
| |
BlackRock Municipal Credit Alpha Portfolio, Inc. | |||||
| |
Institutional | |||||
| |
Year Ended July 31, |
Period from
05/01/22
to 07/31/22 |
Year Ended April 30, | |||
| |
2025 |
2024 |
2023 |
2022 |
2021 | |
| Net asset value, beginning of period |
$13.19 |
$13.23 |
$13.64 |
$13.45 |
$16.11 |
$14.62 |
| Net investment income(a) |
0.56 |
0.44 |
0.46 |
0.14 |
0.56 |
0.64 |
| Net realized and unrealized gain (loss) |
(0.58 ) |
0.10 |
(0.40 ) |
0.21 |
(2.57 ) |
1.48 |
| Net increase (decrease) from investment operations |
(0.02 ) |
0.54 |
0.06 |
0.35 |
(2.01 ) |
2.12 |
| Distribution to Common Shareholders(b) |
|
|
|
|
|
|
| From net investment income |
(0.49 ) |
(0.49 ) |
(0.45 ) |
(0.16 ) |
(0.65 ) |
(0.63 ) |
| Return of capital |
(0.21 ) |
(0.09 ) |
(0.02 ) |
— |
— |
— |
| Total distributions to Common Shareholders |
(0.70 ) |
(0.58 ) |
(0.47 ) |
(0.16 ) |
(0.65 ) |
(0.63 ) |
| Net asset value, end of period |
$12.47 |
$13.19 |
$13.23 |
$13.64 |
$13.45 |
$16.11 |
| Market price, end of period |
N/A |
$12.35 |
$11.47 |
$12.44 |
$12.26 |
$15.09 |
| Total Return Applicable to Common Shareholders |
|
|
|
|
|
|
| Based on net asset value |
(0.13
)%(c)
|
4.76
%(d)
|
1.05
%(d)
|
2.73
%(d)(e)
|
(12.79
)%(d)
|
15.08
%(d)
|
| Based on market price |
N/A |
13.13
%(d)
|
(3.95
)%(d)
|
2.79
%(d)(e)
|
(15.13
)%(d)
|
20.02
%(d)
|
| Ratios to Average Net Assets Applicable to Common Shareholders(f) |
|
|
|
|
|
|
| Total expenses |
1.60
%(g)
|
3.97
%(h)
|
3.46
%(i)
|
2.25
%(j)(k)
|
1.67
%(l)
|
1.58 % |
| Total expenses after fees waived and/or reimbursed |
1.57
%(g)
|
3.94
%(h)
|
3.45
%(i)
|
2.25
%(j)(k)
|
1.67
%(l)
|
1.58 % |
| Total expenses after fees waived and/or reimbursed and excluding interest expense and
fees, amortization of offering costs and reorganization costs(m)(n) |
0.76 % |
0.98 % |
1.00 % |
1.07
%(j)(k)
|
0.96 % |
0.98 % |
| Net investment income to Common Shareholders |
4.03 % |
3.40 % |
3.54 % |
4.06 % |
3.63 % |
4.05 % |
| Supplemental Data |
|
|
|
|
|
|
| Net assets, end of period (000) |
$378,103 |
$949,458 |
$963,901 |
$1,007,256 |
$993,657 |
$617,032 |
| VMTP Shares outstanding at $100,000 liquidation value, end of period (000) |
$— |
$— |
$— |
$— |
$— |
$287,100 |
| VRDP Shares outstanding at $100,000 liquidation value, end of period (000) |
$— |
$561,700 |
$561,700 |
$561,700 |
$561,700 |
$— |
| Asset coverage per VMTP Shares at $100,000 liquidation value, end of period |
$— |
$— |
$— |
$— |
$— |
$314,919 (o) |
| Asset coverage per VRDP Shares at $100,000 liquidation value, end of period |
$— |
$254,839 (p) |
$249,597 (p) |
$237,229 (p) |
$276,902 (o) |
$— |
| TOB Trust Certificates, end of period (000) |
$76,450 |
$51,490 |
$82,631 |
$172,298 |
$180,858 |
$93,069 |
| Asset coverage per $1,000 of TOB Trust Certificates, end of period(q) |
6,004 |
30,343 |
19,459 |
10,104 |
N/A |
N/A |
| Portfolio turnover rate |
37 % |
40 % |
47 % |
14 % |
25 % |
13 % |
| (a) |
Based on average shares outstanding. |
| (b) |
Distributions for annual periods determined in accordance with U.S. federal income tax regulations. |
| (c) |
Where applicable, assumes the reinvestment of distributions. The Fund is a continuously offered closed-end fund, the Shares of which are offered at net asset value. No
secondary market for the Fund’s Shares exists. |
| (d) |
Total returns based on market price, which can be significantly greater or less than the net asset value, may result in substantially different returns. Where
applicable, excludes the effects of any sales charges and assumes the
reinvestment of distributions at actual reinvestment prices. |
| (e) |
Not annualized. |
| (f) |
Excludes fees and expenses incurred indirectly as a result of investments in underlying funds. |
| (g) |
Includes non-recurring expenses of reorganization costs. Without these costs, total expenses and total expenses after fees waived and/or reimbursed would have been 1.57%
and 1.54%, respectively. |
| (h) |
Includes non-recurring expenses of offering and proxy costs. Without these costs, total expenses and total expenses after fees waived and/or reimbursed would have been
3.88% and 3.85%, respectively. |
| (i) |
Includes non-recurring expenses of proxy costs. Without these costs, total expenses and total expenses after fees waived and/or reimbursed would have been 3.43% and
3.42%, respectively. |
| (j) |
Audit and printing costs were not annualized in the calculation of the expense ratios. If these expenses were annualized, the total expenses, total expenses after fees
waived and/or reimbursed and total expenses after fees waived and/or
reimbursed and excluding interest expense, fees and amortization of offering costs would have been 2.27%, 2.27% and 1.08%, respectively. |
| (k) |
Annualized. |
| (l) |
Includes non-recurring expenses of reorganization costs. Without these costs, total expenses and total expenses after fees waived and/or reimbursed would have been 1.62%
and 1.61%, respectively. |
| (m) |
Interest expense and fees and amortization of offering costs related to TOB Trusts and/or VRDP Shares. See Note 4 and Note 9 of the Notes to Financial Statements for
details. |
| (n) |
The total expense ratio after fees waived and/or reimbursed and excluding interest expense and fees, amortization of offering costs, reorganization cost, liquidity and
remarketing fees as follows: |
| |
Year Ended
07/31/25 |
Year Ended
07/31/24 |
Year Ended
07/31/23 |
Period from
05/01/22
to 07/31/22 |
Year Ended
04/30/22 |
Year Ended
04/30/21 |
| | ||||||
| Expense ratios |
0.76 % |
1.06 % |
1.02 % |
1.07 % |
1.02 % |
0.98 % |
| (o) |
Calculated by subtracting the Fund’s total liabilities (not including VRDP/VMTP Shares) from the Fund’s total assets and dividing this by the liquidation
value of the VRDP/VMTP Shares, and by multiplying the results by
100,000. |
| (p) |
Calculated by subtracting the Fund’s total liabilities (not including VRDP Shares and TOBs) from the Fund’s total assets and dividing this by the sum of the
amount of TOBs and liquidation value of the VRDP Shares, and by multiplying the
results by 100,000. |
| (q) |
Effective July 18, 2022, TOB Trust Certificates are treated as senior securities pursuant to Rule 18f-4 of the 1940 Act. Calculated by subtracting the Fund’s total
liabilities (not including VRDP Shares and TOBs) from the Fund’s total
assets and dividing this by the amount of TOBs, and by multiplying the results by 1,000. |
| |
BlackRock Municipal Credit Alpha Portfolio, Inc. (continued) |
| |
Class A |
| |
Period from
03/26/25(a) |
| |
to 07/31/25 |
| Net asset value, beginning of period |
$13.05 |
| Net investment income(b) |
0.17 |
| Net realized and unrealized gain (loss) |
(0.52 ) |
| Net decrease from investment operations |
(0.35 ) |
| Distribution to Common Shareholders(c) |
|
| From net investment income |
(0.04
) |
| Return of capital |
(0.19 ) |
| Total distributions |
(0.23 ) |
| Net asset value, end of period |
$12.47 |
| Total Return |
|
| Based on net asset value |
(2.73
)%(d)(e)
|
| Ratios to Average Net Assets(f) |
|
| Total expenses |
3.34
%(g)(h)
|
| Total expenses after fees waived and/or reimbursed |
3.29
%(g)(h) |
| Total expenses after fees waived and/or reimbursed and excluding interest expense and fees and reorganization costs (i) |
1.70
%(g)
|
| Net investment income |
3.89
%(g) |
| Supplemental Data |
|
| Net assets, end of period (000) |
$478 |
| TOB Trust Certificates, end of period (000) |
$76,450 |
| Asset coverage per $1,000 of TOB Trust Certificates, end of period |
$6,004 |
| Portfolio turnover rate |
37
%(j)
|
| (a) |
Commencement of operations. |
| (b) |
Based on average shares outstanding. |
| (c) |
Distributions for annual periods determined in accordance with U.S. federal income tax regulations. |
| (d) |
Where applicable, excludes the effects of any sales charges and assumes the reinvestment of distributions. The Fund is a continuously offered closed-end fund, the Shares
of which are offered at net asset value. No secondary market for the Fund’s
Shares exists. |
| (e) |
Not annualized. |
| (f) |
Excludes fees and expenses incurred indirectly as a result of investments in underlying funds. |
| (g) |
Annualized. |
| (h) |
Includes non-recurring expenses of reorganization costs. Without these costs, total expenses and total expenses after fees waived and/or reimbursed would have been 3.31%
and 3.26%, respectively. |
| (i) |
Interest expense and fees and amortization of offering costs related to TOB Trusts. See Note 4 of the Notes to Financial Statements for details. |
| (j) |
Portfolio turnover rate is representative of the Fund for the entire year. |
| |
BlackRock Municipal Credit Alpha Portfolio, Inc. (continued) |
| |
Class U |
| |
Period from
03/26/25(a) |
| |
to 07/31/25 |
| Net asset value, beginning of period |
$13.05 |
| Net investment income(b) |
0.18 |
| Net realized and unrealized gain (loss) |
(0.53 ) |
| Net decrease from investment operations |
(0.35 ) |
| Distribution to Common Shareholders(c) |
|
| From net investment income |
(0.04
) |
| Return of capital |
(0.19 ) |
| Total distributions |
(0.23 ) |
| Net asset value, end of period |
$12.47 |
| Total Return |
|
| Based on net asset value |
(2.73
)%(d)(e)
|
| Ratios to Average Net Assets(f) |
|
| Total expenses |
3.10
%(g)(h)
|
| Total expenses after fees waived and/or reimbursed |
3.05
%(g)(h) |
| Total expenses after fees waived and/or reimbursed and excluding interest expense and fees and reorganization costs (i) |
1.70
%(g)
|
| Net investment income |
3.94
%(g) |
| Supplemental Data |
|
| Net assets, end of period (000) |
$3,996 |
| TOB Trust Certificates, end of period (000) |
$76,450 |
| Asset coverage per $1,000 of TOB Trust Certificates, end of period |
$6,004 |
| Portfolio turnover rate |
37
%(j)
|
| (a) |
Commencement of operations. |
| (b) |
Based on average shares outstanding. |
| (c) |
Distributions for annual periods determined in accordance with U.S. federal income tax regulations. |
| (d) |
Where applicable, assumes the reinvestment of distributions. The Fund is a continuously offered closed-end fund, the Shares of which are offered at net asset value. No
secondary market for the Fund’s Shares exists. |
| (e) |
Not annualized. |
| (f) |
Excludes fees and expenses incurred indirectly as a result of investments in underlying funds. |
| (g) |
Annualized. |
| (h) |
Includes non-recurring expenses of reorganization costs. Without these costs, total expenses and total expenses after fees waived and/or reimbursed would have been 3.07
and 3.02%, respectively. |
| (i) |
Interest expense and fees and amortization of offering costs related to TOB Trusts. See Note 4 of the Notes to Financial Statements for details. |
| (j) |
Portfolio turnover rate is representative of the Fund for the entire year. |
| Fund Name |
Interest Expense |
Liquidity Fees |
Other Expenses |
Total |
| BlackRock Municipal Credit Alpha Portfolio, Inc. |
$ 2,488,800
|
$ 302,546
|
$ 104,575
|
$ 2,895,921
|
| Fund Name |
Underlying Municipal Bonds Transferred to TOB Trusts(a)
|
Liability for TOB Trust Certificates(b)
|
Range of Interest Rates on TOB Trust Certificates at Period End |
Average TOB Trust Certificates Outstanding |
Daily Weighted Average Rate of Interest and Other Expenses on TOB Trusts |
| BlackRock Municipal Credit Alpha Portfolio, Inc. |
$ 124,974,575
|
$ 76,449,873
|
2.32% — 2.59
% |
$ 84,791,226
|
3.41 % |
| (a) |
The municipal bonds transferred to a TOB Trust are generally high grade municipal bonds. In certain cases, when municipal bonds transferred are lower grade municipal
bonds, the TOB Trust transaction may include a credit enhancement feature
that provides for the timely payment of principal and interest on the bonds to the TOB Trust by a credit enhancement provider in the event of default of the municipal bond. The TOB Trust would be responsible for the payment of the credit enhancement fee and the Fund, as TOB Residuals holders,
would be responsible for reimbursement of any payments of principal and
interest made by the credit enhancement provider. The maximum potential amounts owed by the Fund, for such reimbursements, as applicable, are included in the maximum potential amounts disclosed for recourse TOB Trusts in the Schedule of Investments. |
| (b) |
TOB Trusts may be structured on a non-recourse or recourse basis. When a Fund invests in TOB Trusts on a non-recourse basis, the Liquidity Provider may be required to
make a payment under the liquidity facility to allow the TOB Trust to
repurchase TOB Trust Certificates. The Liquidity Provider will be reimbursed from the liquidation of bonds held in the TOB Trust. If the Fund invests in a TOB Trust on a recourse basis,
the Fund enters into a reimbursement
agreement with the Liquidity Provider where the Fund is required to reimburse the Liquidity Provider for any shortfall between the amount paid by the Liquidity Provider and proceeds received from liquidation of municipal bonds held in the TOB Trust
(the “Liquidation Shortfall”). As a result, if the Fund invests in a recourse TOB Trust, the Fund will bear the risk of loss with respect to any
Liquidation Shortfall. If multiple funds participate in any such TOB Trust,
these losses will be shared ratably, including the maximum potential amounts owed by the Fund at July 31, 2025, in proportion to their participation in the TOB Trust. The recourse
TOB Trusts are identified in the Schedule of Investments including the maximum potential amounts
owed by the Fund at July 31,
2025. |
| |
Class A |
Class U |
Total |
| Service and distribution fees — class specific |
$ 1,274
|
$ 7,274
|
$ 8,548
|
| |
Institutional |
Total |
| Transfer agent fees — class specific |
$ 3,075
|
$ 3,075
|
| Fund Name |
Paid-in Capital |
Accumulated Earnings (Loss) |
| BlackRock Municipal Credit Alpha Portfolio, Inc. |
$ (676,593
) |
$ 676,593
|
| Fund Name |
Year Ended 07/31/25 |
Year Ended 07/31/24 |
| BlackRock Municipal Credit Alpha Portfolio, Inc. |
|
|
| Tax-exempt income |
$ 23,510,449
|
$ 59,781,619
|
| Ordinary income |
763,499 |
143,075 |
| Return of capital |
9,607,747 |
6,174,248 |
| |
$ 33,881,695 |
$ 66,098,942 |
| Fund Name |
Non-Expiring Capital Loss Carryforwards(a)
|
Net Unrealized Gains (Losses)(b)
|
Total |
| BlackRock Municipal Credit Alpha Portfolio, Inc. |
$ (96,871,190
) |
$ (10,020,290
) |
$ (106,891,480
) |
| (a) |
Subject to limitations, amounts available to offset future realized capital gains. |
| (b) |
The difference between book-basis and tax-basis net unrealized gains (losses) was attributable primarily to tax deferral of losses on wash sales, amortization methods
for premiums on fixed income securities, treatment of residual interests in tender
option bond trusts, the accrual of income on securities in default and the deferral of compensation to trustees. |
| Fund Name |
Utilized |
| BlackRock Municipal Credit Alpha Portfolio, Inc. |
$ 18,124,490 |
| Fund Name |
Tax Cost |
Gross Unrealized Appreciation |
Gross Unrealized Depreciation |
Net Unrealized Appreciation (Depreciation) |
| BlackRock Municipal Credit Alpha Portfolio, Inc. |
$ 390,826,464 |
$ 3,301,107 |
$ (12,741,575) |
$ (9,440,468) |
| |
Year Ended 07/31/25 |
Year Ended 07/31/24 | ||
| Fund Name / Share
Class |
Shares |
Amounts |
Shares |
Amounts |
| BlackRock Municipal Credit Alpha Portfolio, Inc. |
|
|
|
|
| Institutional |
|
|
|
|
| Shares sold |
131,676 |
$ 1,681,195
|
— |
$ —
|
| Reinvestment of distributions |
178,566 |
2,275,741 |
— |
— |
| Redemption of shares resulting from share repurchase program (including transaction costs) |
(5,975,111) |
(76,302,170) |
(875,847) |
(9,262,292) |
| Repurchase of shares resulting from tender offers |
(35,996,072) |
(460,353,765) |
— |
— |
| |
(41,660,941) |
$ (532,698,999) |
(875,847) |
$ (9,262,292) |
| Class A(a) |
|
|
|
|
| Shares sold |
38,314 |
$ 500,000
|
— |
$ —
|
| Class U(a) |
|
|
|
|
| Shares sold |
317,406 |
$ 4,080,000
|
— |
$ —
|
| Reinvestment of distributions |
3,067 |
38,837 |
— |
— |
| |
320,473 |
$ 4,118,837
|
— |
$ —
|
| |
(41,302,154) |
$ (528,080,162) |
(875,847) |
$ (9,262,292) |
| (a) |
The
share class commenced operations on March 26 2025. |
| Commencement Date of Tender Offer
Period(a) |
Valuation Date |
Number of Shares Tendered |
Tendered Shares as a Percentage of Outstanding Shares |
Number of Tendered Shares Purchased |
Tendered Shares Purchased as a Percentage of Outstanding Shares |
Purchase Price |
Total Amount of Purchases |
| 10/15/24 |
11/18/24 |
44,715,010 |
62.1 % |
35,996,072 |
50.0 % |
$12.7890 |
$460,353,765 |
| (a) |
Date
the repurchase offer period began. |
| |
Commencement Date of Tender Offer Period(a)
|
Valuation Date |
Number of Shares Tendered |
Tendered Shares as a Percentage of Outstanding Shares |
Number of Tendered Shares Purchased |
Tendered Shares Purchased as a Percentage of Outstanding Shares |
Purchase Price |
Total Amount of Purchases |
| Institutional |
04/30/25 |
05/30/25 |
5,975,111 |
16.50 % |
5,975,111 |
16.50 % |
$ 12.7700
|
$ 76,302,170
|
| Class A |
04/30/25 |
05/30/25 |
— |
— |
— |
— |
— |
— |
| Class U |
04/30/25 |
05/30/25 |
— |
— |
— |
— |
— |
— |
| (a) |
Date
the repurchase offer period began. |
| Fund Name |
Commencement Date |
Termination Date |
| BlackRock Municipal Credit Alpha Portfolio, Inc. |
04/07/22 |
11/15/24 |
| Fund Name |
Dividends |
Deferred Offering Costs Amortization |
| BlackRock Municipal Credit Alpha Portfolio, Inc. |
$ 1,557,510
|
$ 479,943
|
| Fund Name |
Class A |
Class U |
| BlackRock Municipal Credit Alpha Portfolio, Inc. |
38,314 |
38,314 |
| |
Commencement Date |
Valuation Date |
Number of Shares Tendered |
Tendered Shares as a Percentage of Outstanding Shares |
Number of Tendered Shares Purchased |
Tendered Shares Purchased as a Percentage of Outstanding Shares |
Purchase Price |
Total Amount of Purchases |
| Institutional |
07/08/25 |
08/07/25 |
8,084,988 |
26.66 % |
8,084,988 |
26.66 % |
$ 12.5000
|
$ 101,062,346
|
| Class A |
07/08/25 |
08/07/25 |
— |
— |
— |
— |
— |
— |
| Class U |
07/08/25 |
08/07/25 |
— |
— |
— |
— |
— |
— |
| |
Commencement Date |
Valuation Date |
Number of Shares Tendered |
Tendered Shares as a Percentage of Outstanding Shares |
Number of Tendered Shares Purchased |
Tendered Shares Purchased as a Percentage of Outstanding Shares |
Purchase Price |
Total Amount of Purchases |
| Institutional |
08/20/25 |
09/19/25 |
9,932,340 |
44.58 % |
9,932,340 |
44.58 % |
$ 12.6800
|
$ 125,942,065
|
| Class A |
08/20/25 |
09/19/25 |
— |
— |
— |
— |
— |
— |
| Class U |
08/20/25 |
09/19/25 |
— |
— |
— |
— |
— |
— |
| Fund |
Financial Highlights |
| BlackRock Municipal Credit Alpha Portfolio, Inc. |
For each of the three years in the period ended July 31, 2025, for the period from May 1, 2022 through July 31, 2022, and for each of the two years in the period ended April 30, 2022 |
| Fund Name |
Exempt-Interest Dividends |
| BlackRock Municipal Credit Alpha Portfolio, Inc. |
$ 27,470,017
|
| Fund Name |
Federal Obligation Interest |
| BlackRock Municipal Credit Alpha Portfolio, Inc. |
$ 103,275
|
| Fund Name |
Interest Dividends |
| BlackRock Municipal Credit Alpha Portfolio, Inc. |
$ 763,499
|
| Fund Name |
Interest- Related Dividends |
| BlackRock Municipal Credit Alpha Portfolio, Inc. |
$ 763,499
|
| Independent Directors(a) | ||||
| Name Year of Birth(b)
|
Position(s) Held
(Length of Service)(c) |
Principal Occupation(s) During Past 5 Years |
Number of BlackRock-Advised
Registered Investment Companies
(“RICs”) Consisting of Investment
Portfolios (“Portfolios”) Overseen |
Public Company and Other Investment Company Directorships Held During Past 5 Years |
| R. Glenn Hubbard 1958 |
Chair of the Board (Since
2022)
Director
(Since 2007) |
Dean, Columbia Business School from 2004 to 2019;
Faculty member, Columbia Business School since 1988. |
66 RICs consisting of 103 Portfolios |
ADP (data and information services) from 2004 to 2020; Metropolitan Life Insurance Company (insurance); TotalEnergies SE (multi-energy) |
| W. Carl
Kester(d)
1951 |
Vice Chair of the Board
(Since 2022)
Director
(Since 2007) |
Baker Foundation Professor and George Fisher Baker Jr.
Professor of Business Administration, Emeritus, Harvard
Business School since 2022; George Fisher Baker Jr.
Professor of Business Administration, Harvard Business
School from 2008 to 2022; Deputy Dean for Academic
Affairs from 2006 to 2010; Chairman of the Finance Unit,
from 2005 to 2006; Senior Associate Dean and Chairman
of the MBA Program from 1999 to 2005; Member of the
faculty of Harvard Business School since 1981. |
68 RICs consisting of 105 Portfolios |
None |
| Cynthia L.
Egan(d)
1955 |
Director
(Since 2016) |
Advisor, U.S. Department of the Treasury from 2014 to
2015; President, Retirement Plan Services, for T. Rowe
Price Group, Inc. from 2007 to 2012; executive positions
within Fidelity Investments from 1989 to 2007. |
68 RICs consisting of 105 Portfolios |
Unum (insurance); The Hanover Insurance Group (Board Chair); Huntsman Corporation (Lead Independent Director and non-Executive Vice Chair of the Board) (chemical products) |
| Lorenzo A. Flores 1964 |
Director
(Since 2021) |
Chief Financial Officer, Lattice Semiconductor Corporation
(LSCC) since 2025; Chief Financial Officer, Intel Foundry
from 2024 to 2025; Vice Chairman, Kioxia, Inc. from
2019 to 2024; Chief Financial Officer, Xilinx, Inc. from
2016 to 2019; Corporate Controller, Xilinx, Inc. from
2008 to 2016. |
66 RICs consisting of 103 Portfolios |
None |
| Stayce D. Harris 1959 |
Director
(Since 2021) |
Lieutenant General, Inspector General of the United States
Air Force from 2017 to 2019; Lieutenant General, Assistant
Vice Chief of Staff and Director, Air Staff, United States Air
Force from 2016 to 2017; Major General, Commander,
22nd Air Force, AFRC, Dobbins Air Reserve Base, Georgia
from 2014 to 2016; Pilot, United Airlines from 1990 to
2020. |
66 RICs consisting of 103 Portfolios |
KULR Technology Group, Inc. in 2021; The Boeing Company (airplane manufacturer) |
| J. Phillip Holloman 1955 |
Director
(Since 2021) |
Interim Executive Chairman, President and Chief
Executive Officer of Vestis Corporation since 2025;
President and Chief Operating Officer, Cintas Corporation
from 2008 to 2018. |
66 RICs consisting of 103 Portfolios |
Vestis Corporation (uniforms and facilities services) |
| Catherine A. Lynch(d)
1961 |
Director
(Since 2016) |
Chief Executive Officer, Chief Investment Officer and
various other positions, National Railroad Retirement
Investment Trust from 2003 to 2016; Associate Vice
President for Treasury Management, The George
Washington University from 1999 to 2003; Assistant
Treasurer, Episcopal Church of America from 1995 to
1999. |
68 RICs consisting of 105 Portfolios |
PennyMac Mortgage Investment Trust |
| Independent Directors(a) (continued) | ||||
| Name
Year of Birth(b) |
Position(s) Held
(Length of Service)(c) |
Principal Occupation(s) During Past 5 Years |
Number of BlackRock-Advised
Registered Investment Companies
(“RICs”) Consisting of Investment
Portfolios (“Portfolios”) Overseen |
Public Company and Other Investment Company
Directorships Held
During Past 5 Years |
| Arthur P. Steinmetz(d)
1958 |
Director
(Since 2023) |
Trustee of Denison University since 2020; Consultant,
Posit PBC (enterprise data science) since 2020; Director,
ScotiaBank (U.S.) from 2020 to 2023; Chairman, Chief
Executive Officer and President of OppenheimerFunds,
Inc. from 2015, 2014 and 2013, respectively to 2019;
Trustee, President and Principal Executive Officer of
104 OppenheimerFunds funds from 2014 to 2019;
Portfolio manager of various OppenheimerFunds fixed
income mutual funds from 1986 to 2014. |
68 RICs consisting of 105 Portfolios |
Trustee of 104 OppenheimerFunds funds from 2014 to 2019 |
| Interested Directors(a)(e) | ||||
| Name Year of Birth(b)
|
Position(s) Held
(Length of Service)(c) |
Principal Occupation(s) During Past 5 Years |
Number of BlackRock-Advised
Registered Investment Companies
(“RICs”) Consisting of Investment
Portfolios (“Portfolios”) Overseen |
Public Company and Other Investment Company Directorships Held During Past 5 Years |
| Robert Fairbairn 1965 |
Director
(Since 2018) |
Vice Chairman of BlackRock, Inc. since 2019; Member of
BlackRock’s Global Executive and Global Operating
Committees; Co-Chair of BlackRock’s Human Capital
Committee; Senior Managing Director of BlackRock, Inc.
from 2010 to 2019; oversaw BlackRock’s Strategic Partner
Program and Strategic Product Management Group from
2012 to 2019; Member of the Board of Managers of
BlackRock Investments, LLC from 2011 to 2018; Global
Head of BlackRock’s Retail and iShares® businesses from
2012 to 2016. |
94 RICs consisting of 271 Portfolios |
None |
| John M. Perlowski(d)
1964 |
Director
(Since 2015)
President and Chief
Executive Officer
(Since 2010) |
Managing Director of BlackRock, Inc. since 2009; Head of
BlackRock Global Accounting and Product Services since
2009; Advisory Director of Family Resource Network
(charitable foundation) since 2009. |
96 RICs consisting of 273 Portfolios |
None |
| (a) |
The address of each Director is c/o BlackRock, Inc., 50 Hudson Yards, New York, New York 10001. |
| (b) |
Each Independent Director holds office until his or her successor is duly elected and qualifies or until his or her earlier death, resignation, retirement or removal as
provided by the Fund’s by-laws or charter or statute, or until
December 31 of the year in which he or she turns 75. Directors who are “interested persons,” as defined in the Investment Company Act serve until their successor
is duly elected and qualifies or until their earlier death, resignation, retirement or
removal as provided by the Fund’s by-laws or statute, or until December 31 of the year in which they turn 72. The Board may determine to extend the terms of Independent Directors on a case-by-case basis, as appropriate. |
| (c) |
Following the combination of Merrill Lynch Investment Managers, L.P. (“MLIM”) and BlackRock, Inc. in September 2006, the various legacy MLIM and legacy
BlackRock fund boards were realigned and consolidated into three new fund
boards in 2007. Certain Independent Directors first became members of the boards of other legacy MLIM or legacy BlackRock funds as follows: R. Glenn Hubbard, 2004 and W. Carl Kester, 1995. |
| (d) |
Ms. Egan, Dr. Kester, Ms. Lynch, Mr. Steinmetz and Mr. Perlowski are also trustees of the BlackRock Credit Strategies Fund and BlackRock Private Investments
Fund. |
| (e) |
Mr. Fairbairn and Mr. Perlowski are both “interested persons,” as defined in the 1940 Act, of the Fund based on their positions with BlackRock, Inc. and its
affiliates. Mr. Fairbairn and Mr. Perlowski are also board members of the BlackRock
Multi-Asset Complex. |
| Officers Who Are Not Directors(a) | ||
| Name Year of Birth(b)
|
Position(s) Held
(Length of Service) |
Principal Occupation(s) During Past 5 Years |
| Stephen Minar 1984 |
Vice President
(Since 2025) |
Managing Director of BlackRock, Inc. since 2023; Director of BlackRock, Inc. since 2018. |
| Trent Walker 1974 |
Chief Financial Officer
(Since 2021) |
Managing Director of BlackRock, Inc. since 2019; Executive Vice President of PIMCO from 2016 to 2019. |
| Jay M. Fife 1970 |
Treasurer
(Since 2007) |
Managing Director of BlackRock, Inc. since 2007. |
| Aaron Wasserman 1974 |
Chief Compliance Officer
(Since 2023) |
Managing Director of BlackRock, Inc. since 2018; Chief Compliance Officer of the BlackRock-advised funds in the
BlackRock Multi-Asset Complex, the BlackRock Fixed-Income Complex and the iShares Complex since
2023; Deputy Chief Compliance Officer for the BlackRock-advised funds in the
BlackRock Multi-Asset Complex, the BlackRock Fixed- Income Complex and the iShares
Complex from 2014 to 2023. |
| Janey Ahn 1975 |
Secretary
(Since 2012) |
Managing Director of BlackRock, Inc. since 2018. |
| (a) |
The address of each Officer is c/o BlackRock, Inc., 50 Hudson Yards, New York, New York 10001. |
| (b) |
Officers of the Fund serve at the pleasure of the Board. |
| Effective March 24,2025, Michael Kalinoski, Christian Romaglino, Kristi Manidis are no longer a portfolio manager of the Fund. Effective March 24, 2025, Patrick Haskell
and Ryan McDonald became portfolio managers of the Fund. Mr.
Haskell joined Blackrock in September 2023, prior to Blackrock he was the Head of the Municipal Securities group and Co-Head of Retail Capital Markets at Morgan Stanley and Mr. McDonald has been employed by BlackRock since 2014. |
| Number of Repurchase Offers |
Number of
Shares Repurchased |
Number of Shares Tendered |
| 2 |
14,060,099 |
14,060,099 |
| Portfolio Abbreviation | |
| AGM |
Assured Guaranty Municipal Corp.
|
| AMT |
Alternative Minimum Tax |
| ARB |
Airport Revenue Bonds |
| CAB |
Capital Appreciation Bonds |
| FHLMC |
Federal Home Loan Mortgage Corp.
|
| FNMA |
Federal National Mortgage
Association |
| GNMA |
Government National Mortgage
Association |
| GO |
General Obligation Bonds |
| GOL |
General Obligation Ltd. |
| M/F |
Multi-Family |
| RB |
Revenue Bonds |
| S/F |
Single-Family |
| SAB |
Special Assessment Bonds |
| TA |
Tax Allocation |

(b) Not Applicable
| Item 3 – | Audit Committee Financial Expert – The registrant’s board of directors (the “board of directors”) has determined that (i) the registrant has the following audit committee financial experts serving on its audit committee and (ii) each audit committee financial expert is independent: |
Lorenzo A. Flores
Catherine A. Lynch
Arthur P. Steinmetz
Under applicable securities laws, a person determined to be an audit committee financial expert will not be deemed an “expert” for any purpose, including without limitation for the purposes of Section 11 of the Securities Act of 1933, as a result of being designated or identified as an audit committee financial expert. The designation or identification of a person as an audit committee financial expert does not impose on such person any duties, obligations, or liabilities greater than the duties, obligations, and liabilities imposed on such person as a member of the audit committee and board of directors in the absence of such designation or identification. The designation or identification of a person as an audit committee financial expert does not affect the duties, obligations, or liability of any other member of the audit committee or board of directors.
| Item 4 – | Principal Accountant Fees and Services |
The following table presents fees billed by Deloitte & Touche LLP (“D&T”) in each of the last two fiscal years for the services rendered to the Fund:
| (a) Audit Fees |
(b) Audit-Related Fees1 |
(c) Tax Fees2 | (d) All Other Fees | |||||||||||||
| Entity Name |
Current Fiscal Year End |
Previous Fiscal Year End |
Current Fiscal Year End |
Previous Fiscal Year End |
Current Fiscal Year End |
Previous Fiscal Year End |
Current Fiscal Year End |
Previous Fiscal Year End | ||||||||
| BlackRock Municipal Credit Alpha Portfolio, Inc. (formerly, BlackRock Municipal Income Fund, Inc.) | $32,698 | $32,538 | $0 | $0 | $20,700 | $20,696 | $388 | $0 | ||||||||
The following table presents fees billed by D&T that were required to be approved by the registrant’s audit committee (the “Committee”) for services that relate directly to the operations or financial reporting of the Fund and that are rendered on behalf of BlackRock Advisors, LLC (the “Investment Adviser” or “BlackRock”) and entities controlling, controlled by, or under common control with BlackRock (not including any sub-adviser whose role is primarily portfolio management and is subcontracted with or overseen by another investment adviser) that provide ongoing services to the Fund (“Affiliated Service Providers”):
| Current Fiscal Year End | Previous Fiscal Year End | |||
| (b) Audit-Related Fees1 |
$0 | $0 | ||
| (c) Tax Fees2 |
$0 | $0 | ||
| (d) All Other Fees3 |
$2,149,000 | $2,149,000 |
1 The nature of the services includes assurance and related services reasonably related to the performance of the audit or review of financial statements not included in Audit Fees, including accounting consultations, agreed-upon procedure reports, attestation reports, comfort letters, out-of-pocket expenses and internal control reviews not required by regulators.
2 The nature of the services includes tax compliance and/or tax preparation, including services relating to the filing or amendment of federal, state or local income tax returns, regulated investment company qualification reviews, taxable income and tax distribution calculations.
3 Non-audit fees of $2,149,000 and $2,149,000 for the current fiscal year and previous fiscal year, respectively, were paid to the Fund’s principal accountant in their entirety by BlackRock, in connection with services provided to the Affiliated Service Providers of the Fund and of certain other funds sponsored or advised by BlackRock or its affiliates for a service organization review and an accounting research tool subscription. These amounts represent aggregate fees paid by BlackRock and were not allocated on a per fund basis.
(e)(1) Audit Committee Pre-Approval Policies and Procedures:
The Committee has adopted policies and procedures with regard to the pre-approval of services. Audit, audit-related and tax compliance services provided to the registrant on an annual basis require specific pre-approval by the Committee. The Committee also must approve other non-audit services provided to the registrant and those non-audit services provided to the Investment Adviser and Affiliated Service Providers that relate directly to the operations and the financial reporting of the registrant. Certain of these non-audit services that the Committee believes are (a) consistent with the SEC’s auditor independence rules and (b) routine and recurring services that will not impair the independence of the independent accountants may be approved by the Committee without consideration on a specific case-by-case basis (“general pre-approval”). The term of any general pre-approval is 12 months from the date of the pre-approval, unless the Committee provides for a different period. Tax or other non-audit services provided to the registrant which have a direct impact on the operations or financial reporting of the registrant will only be deemed pre-approved provided that any individual project does not exceed $10,000 attributable to the registrant or $50,000 per project. For this purpose, multiple projects will be aggregated to determine if they exceed the previously mentioned cost levels.
Any proposed services exceeding the pre-approved cost levels will require specific pre-approval by the Committee, as will any other services not subject to general pre-approval (e.g., unanticipated but permissible services). The Committee is informed of each service approved subject to general pre-approval at the next regularly scheduled in-person board meeting. At this meeting, an analysis of such services is presented to the Committee for ratification. The Committee may delegate to the Committee Chairman the authority to approve the provision of
and fees for any specific engagement of permitted non-audit services, including services exceeding pre-approved cost levels.
(e)(2) None of the services described in each of Items 4(b) through (d) were approved by the Committee pursuant to the de minimis exception in paragraph (c)(7)(i)(C) of Rule 2-01 of Regulation S-X.
(f) Not Applicable
(g) The aggregate non-audit fees, defined as the sum of the fees shown under “Audit-Related Fees,” “Tax Fees” and “All Other Fees,” paid to the accountant for services rendered by the accountant to the registrant, the Investment Adviser and the Affiliated Service Providers were:
| Entity Name | Current Fiscal Year End | Previous Fiscal Year End | ||
| BlackRock Municipal Credit Alpha Portfolio, Inc. (formerly, BlackRock Municipal Income Fund, Inc.) |
$21,088 | $20,696 |
Additionally, the amounts billed by D&T in connection with services provided to the Affiliated Service Providers of the Fund and of other funds sponsored or advised by BlackRock or its affiliates during the current and previous fiscal years for a service organization review and an accounting research tool subscription were:
| Current Fiscal Year End | Previous Fiscal Year End | |
|
$2,149,000 |
$2,149,000 |
These amounts represent aggregate fees paid by BlackRock and were not allocated on a per fund basis.
(h) The Committee has considered and determined that the provision of non-audit services that were rendered to the Investment Adviser and the Affiliated Service Providers that were not pre-approved pursuant to paragraph (c)(7)(ii) of Rule 2-01 of Regulation S-X is compatible with maintaining the principal accountant’s independence.
(i) Not Applicable
(j) Not Applicable
| Item 5 – | Audit Committee of Listed Registrant |
(a) The following individuals are members of the registrant’s separately designated standing audit committee established in accordance with Section 3(a)(58)(A) of the Securities Exchange Act of 1934 (15 U.S.C. 78c(a)(58)(A)):
Lorenzo A. Flores
J. Phillip Holloman
Catherine A. Lynch
Arthur P. Steinmetz
(b) Not Applicable
| Item 6 – | Investments |
(a) The registrant’s Schedule of Investments is included as part of the Report to Stockholders filed under Item 1(a) of this Form.
(b) Not Applicable due to no such divestments during the semi-annual period covered since the previous Form N-CSR filing.
| Item 7 – | Financial Statements and Financial Highlights for Open-End Management Investment Companies – Not Applicable |
| Item 8 – | Changes in and Disagreements with Accountants for Open-End Management Investment Companies – Not Applicable |
| Item 9 – | Proxy Disclosures for Open-End Management Investment Companies – Not Applicable |
| Item 10 – | Remuneration Paid to Directors, Officers, and Others of Open-End Management Investment Companies – Not Applicable |
| Item 11 – | Statement Regarding Basis for Approval of Investment Advisory Contract – The registrant’s statement regarding the basis for approval of the investment advisory contract is included as part of the Report to Stockholders filed under Item 1(a) of this Form. |
| Item 12 – | Disclosure of Proxy Voting Policies and Procedures for Closed-End Management Investment Companies – The board of directors has delegated the voting of proxies for the Fund’s portfolio securities to the Investment Adviser pursuant to the Closed-End Fund Proxy Voting Policy. The Investment Adviser has adopted the BlackRock Active Investment Stewardship - Global Engagement and Voting Guidelines (the “BAIS Guidelines”) with respect to certain funds, including the Fund. Copies of the Closed-End Fund Proxy Voting Policy and the BAIS Guidelines are attached as Exhibit 99.PROXYPOL. Information on how the Fund voted proxies relating to portfolio securities during the most recent 12-month period ended June 30 is available (i) without charge, upon request, by calling (800) 882-0052, (ii) at www.blackrock.com and (iii) on the SEC’s website at http://www.sec.gov. |
| Item 13 – | Portfolio Managers of Closed-End Management Investment Companies |
(a)(1) As of the date of filing this Report:
The registrant is managed by a team of investment professionals comprised of Walter O’Connor, CFA, Managing Director at BlackRock, Kevin Maloney, CFA, Managing Director at BlackRock, Phillip Soccio, CFA, Director at BlackRock, Patrick Haskell, Managing Director at BlackRock and Ryan McDonald, CFA, Managing Director at BlackRock. Each is a member of BlackRock’s municipal tax-exempt management group. Each is jointly responsible for the day-to-day management of the registrant’s portfolio, which includes setting the registrant’s overall investment strategy, overseeing the management of the registrant and selection of its investments. Messrs. O’Connor, Maloney and Soccio have been members of the registrant’s portfolio management team since 2023. Messrs. Haskell and McDonald have been members of the registrant’s portfolio management team since 2025.
| Portfolio Manager | Biography | |
| Walter O’Connor, CFA | Managing Director of BlackRock since 2006. | |
| Kevin Maloney, CFA | Managing Director of BlackRock since 2025, Director of BlackRock from 2021 to 2024; Vice President of BlackRock from 2018 to 2020. | |
| Phillip Soccio, CFA | Director of BlackRock since 2009. | |
| Patrick Haskell | Managing Director of BlackRock since 2023; Head of the Municipal Securities group and Co-Head of Retail Capital Markets at Morgan Stanley from 2009 to 2022. | |
| Ryan McDonald, CFA | Managing Director of BlackRock, Inc. since 2023; Director of BlackRock, Inc. from 2017 to 2022. |
(a)(2) As of July 31, 2025 :
|
(ii) Number of Other Accounts Managed and Assets by Account Type |
(iii) Number of Other Accounts and Assets for Which Advisory Fee is Performance-Based | |||||||||||
| (i) Name of Portfolio Manager |
Other Registered Investment Companies |
Other Pooled Investment Vehicles |
Other Accounts |
Other Registered Investment Companies |
Other Pooled Investment Vehicles |
Other Accounts | ||||||
|
Walter O’Connor, CFA |
33 | 0 | 0 | 0 | 0 | 0 | ||||||
| $28.30 Billion | $0 | $0 | $0 | $0 | $0 | |||||||
| Kevin Maloney, CFA |
42 | 0 | 0 | 0 | 0 | 0 | ||||||
| $39.14 Billion | $0 | $0 | $0 | $0 | $0 | |||||||
| Phillip Soccio, CFA |
34 | 0 | 0 | 0 | 0 | 0 | ||||||
| $24.81 Billion | $0 | $0 | $0 | $0 | $0 | |||||||
| Patrick Haskell |
2 | 0 | 0 | 0 | 0 | 0 | ||||||
| $2.18 Billion | $0 | $0 | $0 | $0 | $0 | |||||||
| Ryan McDonald, CFA |
6 | 0 | 0 | 0 | 0 | 0 | ||||||
| $9.37 Billion | $0 | $0 | $0 | $0 | $0 | |||||||
(iv) Portfolio Manager Potential Material Conflicts of Interest
BlackRock has built a professional working environment, firm-wide compliance culture and compliance procedures and systems designed to protect against potential incentives that may favor one account over another. BlackRock has adopted policies and procedures that address the allocation of investment opportunities, execution of portfolio transactions, personal trading by employees and other potential conflicts of interest that are designed to ensure that all client accounts are treated equitably over time. Nevertheless, BlackRock furnishes investment management and advisory services to numerous clients in addition to the Fund, and BlackRock may, consistent with applicable law, make investment recommendations to other clients or accounts (including accounts which are hedge funds or have performance or higher fees paid to BlackRock, or in which portfolio managers have a personal interest in the receipt of such fees), which may be the same as or different from those made to the Fund. In addition, BlackRock, Inc., its affiliates and significant shareholders and any officer, director, shareholder or employee may or may not have an interest in the securities whose purchase and sale BlackRock recommends to the Fund. BlackRock, Inc. or any of its affiliates or significant shareholders, or any officer, director, shareholder, employee or any member of their families may take different actions than those recommended to the Fund by BlackRock with respect to the same securities. Moreover, BlackRock may refrain from rendering any advice or services concerning securities of companies of which any of BlackRock, Inc.’s (or its affiliates’ or significant shareholders’) officers, directors or employees are directors or officers, or companies as to which BlackRock, Inc. or any of its affiliates or significant shareholders or the officers, directors and employees of any of them has any substantial economic interest
or possesses material non-public information. Certain portfolio managers also may manage accounts whose investment strategies may at times be opposed to the strategy utilized for a fund. It should also be noted that a portfolio manager may be managing hedge fund and/or long only accounts, or may be part of a team managing hedge fund and/or long only accounts, subject to incentive fees. Such portfolio managers may therefore be entitled to receive a portion of any incentive fees earned on such accounts. Currently, the portfolio managers of this Fund are not entitled to receive a portion of incentive fees of other accounts.
As a fiduciary, BlackRock owes a duty of loyalty to its clients and must treat each client fairly. When BlackRock purchases or sells securities for more than one account, the trades must be allocated in a manner consistent with its fiduciary duties. BlackRock attempts to allocate investments in a fair and equitable manner among client accounts, with no account receiving preferential treatment. To this end, BlackRock, Inc. has adopted policies that are intended to ensure reasonable efficiency in client transactions and provide BlackRock with sufficient flexibility to allocate investments in a manner that is consistent with the particular investment discipline and client base, as appropriate.
(a)(3) As of July 31, 2025:
Portfolio Manager Compensation Overview
The discussion below describes the portfolio managers’ compensation as of July 31, 2025.
BlackRock’s financial arrangements with its portfolio managers, its competitive compensation and its career path emphasis at all levels reflect the value senior management places on key resources. Compensation may include a variety of components and may vary from year to year based on a number of factors. The principal components of compensation include a base salary, a performance-based discretionary bonus, participation in various benefits programs and one or more of the incentive compensation programs established by BlackRock.
Base Compensation. Generally, portfolio managers receive base compensation based on their position with the firm.
Discretionary Incentive Compensation. Discretionary incentive compensation is a function of several components: the performance of BlackRock, Inc., the performance of the portfolio manager’s group within BlackRock, the investment performance, including risk-adjusted returns, of the firm’s assets under management or supervision by that portfolio manager relative to predetermined benchmarks, and the individual’s performance and contribution to the overall performance of these portfolios and BlackRock. In most cases, these benchmarks are the same as the benchmark or benchmarks against which the performance of the funds or other accounts managed by the portfolio managers are measured. Among other things, BlackRock’s Chief Investment Officers make a subjective determination with respect to each portfolio manager’s compensation based on the performance of the funds and other accounts managed by each portfolio manager relative to the various benchmarks. Performance of fixed income funds is measured on a pre-tax and/or after-tax basis over various time periods including 1-, 3- and 5- year periods, as applicable. With respect to these portfolio managers, such benchmarks for the Fund and other accounts are: A combination of
market-based indices (e.g., Bloomberg Municipal Bond Index), certain customized indices and certain fund industry peer groups.
Distribution of Discretionary Incentive Compensation. Discretionary incentive compensation is distributed to portfolio managers in a combination of cash, deferred BlackRock, Inc. stock awards, and/or deferred cash awards that notionally track the return of certain BlackRock investment products.
Portfolio managers receive their annual discretionary incentive compensation in the form of cash. Portfolio managers whose total compensation is above a specified threshold also receive deferred BlackRock, Inc. stock awards annually as part of their discretionary incentive compensation. Paying a portion of discretionary incentive compensation in the form of deferred BlackRock, Inc. stock puts compensation earned by a portfolio manager for a given year “at risk” based on BlackRock’s ability to sustain and improve its performance over future periods. In some cases, additional deferred BlackRock, Inc. stock may be granted to certain key employees as part of a long-term incentive award to aid in retention, align interests with long-term shareholders and motivate performance. Deferred BlackRock, Inc. stock awards are generally granted in the form of BlackRock, Inc. restricted stock units that vest pursuant to the terms of the applicable plan and, once vested, settle in BlackRock, Inc. common stock. The portfolio managers of this Fund have deferred BlackRock, Inc. stock awards.
For certain portfolio managers, a portion of the discretionary incentive compensation is also distributed in the form of deferred cash awards that notionally track the returns of select BlackRock investment products they manage, which provides direct alignment of portfolio manager discretionary incentive compensation with investment product results. Deferred cash awards vest ratably over a number of years and, once vested, settle in the form of cash. Only portfolio managers who manage specified products and whose total compensation is above a specified threshold are eligible to participate in the deferred cash award program.
Other Compensation Benefits. In addition to base salary and discretionary incentive compensation, portfolio managers may be eligible to receive or participate in one or more of the following:
Incentive Savings Plans — BlackRock, Inc. has created a variety of incentive savings plans in which BlackRock, Inc. employees are eligible to participate, including a 401(k) plan, the BlackRock Retirement Savings Plan (RSP), and the BlackRock Employee Stock Purchase Plan (ESPP). The employer contribution components of the RSP include a company match equal to 50% of the first 8% of eligible pay contributed to the plan capped at $5,000 per year, and a company retirement contribution equal to 3-5% of eligible compensation up to the Internal Revenue Service limit ($350,000 for 2025). The RSP offers a range of investment options, including registered investment companies and collective investment funds managed by the firm. BlackRock, Inc. contributions follow the investment direction set by participants for their own contributions or, absent participant investment direction, are invested into a target date fund that corresponds to, or is closest to, the year in which the participant attains age 65. The ESPP allows for investment in BlackRock, Inc. common stock at a 5% discount on the fair market value of the stock on the purchase date. Annual participation in the ESPP is limited to the purchase of 1,000 shares of common stock or a dollar value of $25,000 based on its fair
market value on the purchase date. All of the eligible portfolio managers are eligible to participate in these plans.
(a)(4) Beneficial Ownership of Securities – As of July 31, 2025.
| Portfolio Manager | Dollar Range of Equity Securities of the Fund Beneficially Owned | |||
| Walter O’Connor, CFA | None | |||
| Kevin Maloney, CFA | None | |||
| Phillip Soccio, CFA | None | |||
| Patrick Haskell | None | |||
| Ryan McDonald, CFA | None |
(b) Not Applicable
| Item 14 – | Purchases of Equity Securities by Closed-End Management Investment Company and Affiliated Purchasers – Not Applicable due to no such purchases during the period covered by this report. |
| Item 15 – | Submission of Matters to a Vote of Security Holders – There have been no material changes to these procedures. |
| Item 16 – | Controls and Procedures |
(a) The registrant’s principal executive and principal financial officers, or persons performing similar functions, have concluded that the registrant’s disclosure controls and procedures (as defined in Rule 30a-3(c) under the Investment Company Act of 1940, as amended (the “1940 Act”)) are effective as of a date within 90 days of the filing date of this report based on the evaluation of these controls and procedures required by Rule 30a-3(b) under the 1940 Act and Rule 13a-15(b) or 15d-15(b) under the Securities Exchange Act of 1934, as amended.
(b) There were no changes in the registrant’s internal control over financial reporting (as defined in Rule 30a-3(d) under the 1940 Act) that occurred during the period covered by this report that have materially affected, or are reasonably likely to materially affect, the registrant’s internal control over financial reporting.
| Item 17 – | Disclosure of Securities Lending Activities for Closed-End Management Investment Companies – Not Applicable |
| Item 18 – | Recovery of Erroneously Awarded Compensation – Not Applicable |
| Item 19 – | Exhibits attached hereto |
(a)(1) Code of Ethics – See Item 2
(a)(2) Any policy required by the listing standards adopted pursuant to Rule 10D-1 under the Exchange Act (17 CFR 240.10D-1) by the registered national securities exchange or registered national securities association upon which the registrant’s securities are listed – Not Applicable
(a)(4) Any written solicitation to purchase securities under Rule 23c-1 – Not Applicable
(a)(5) Change in Registrant’s independent public accountant – Not Applicable
(b) Section 906 Certifications are attached
Pursuant to the requirements of the Securities Exchange Act of 1934 and the Investment Company Act of 1940, the registrant has duly caused this report to be signed on its behalf by the undersigned, thereunto duly authorized.
BlackRock Municipal Credit Alpha Portfolio, Inc. (formerly, BlackRock Municipal Income Fund, Inc.)
| By: | /s/ John M. Perlowski | |
| John M. Perlowski | ||
| Chief Executive Officer (principal executive officer) of | ||
| BlackRock Municipal Credit Alpha Portfolio, Inc. (formerly, BlackRock Municipal Income Fund, Inc.) |
Date: September 23, 2025
Pursuant to the requirements of the Securities Exchange Act of 1934 and the Investment Company Act of 1940, this report has been signed below by the following persons on behalf of the registrant and in the capacities and on the dates indicated.
| By: | /s/ John M. Perlowski | |
| John M. Perlowski | ||
| Chief Executive Officer (principal executive officer) of | ||
| BlackRock Municipal Credit Alpha Portfolio, Inc. (formerly, BlackRock Municipal Income Fund, Inc.) |
Date: September 23, 2025
| By: | /s/ Trent Walker | |
| Trent Walker | ||
| Chief Financial Officer (principal financial officer) of | ||
| BlackRock Municipal Credit Alpha Portfolio, Inc. (formerly, BlackRock Municipal Income Fund, Inc.) |
Date: September 23, 2025