Please wait
UNITED STATES
SECURITIES AND EXCHANGE COMMISSION
Washington, D.C. 20549
FORM N-CSR
CERTIFIED
SHAREHOLDER REPORT OF REGISTERED
MANAGEMENT INVESTMENT COMPANIES
Investment Company Act file number 811-21417
Virtus Dividend, Interest & Premium Strategy Fund
(Exact name of registrant as specified in charter)
101 Munson
Street
Greenfield, MA 01301-9683
(Address of principal executive offices) (Zip code)
Kathryn
Santoro, Esq.
Vice President, Chief Legal Officer, Counsel and Secretary for Registrant
One Financial Plaza
Hartford, CT 06103-2608
(Name and address of agent for service)
Registrant’s telephone number, including area code: 1-866-270-7788
Date of fiscal year end: January 31
Date of reporting period: January 31, 2025
Form N-CSR is to be used by management investment companies to file reports with the Commission not later than 10 days after the transmission to stockholders of any report that is required to be transmitted to
stockholders under Rule 30e-1 under the Investment Company Act of 1940 (17 CFR 270.30e-1). The Commission may use the information provided on Form N-CSR in its regulatory, disclosure review, inspection, and policymaking roles.
A registrant is required to disclose
the information specified by Form N-CSR, and the Commission will make this information public. A registrant is not required to respond to the collection of information contained in Form N-CSR unless the Form displays a currently valid Office of Management and Budget (“OMB”) control number. Please direct comments concerning the accuracy of the information collection burden estimate and any
suggestions for reducing the burden to Secretary, Securities and Exchange Commission, 100 Fifth Street, NE, Washington, DC 20549-1090. The OMB has reviewed this collection of information under the clearance requirements of 44 U.S.C. § 3507.
| Item 1. |
Reports to Stockholders. |
| |
(a) |
The Report to Shareholders is attached herewith. |
| Virtus
Artificial Intelligence & Technology Opportunities Fund (AIO) |
| Virtus
Convertible & Income Fund (NCV) |
| Virtus
Convertible & Income Fund II (NCZ) |
| Virtus
Diversified Income & Convertible Fund (ACV) |
| Virtus
Dividend, Interest & Premium Strategy Fund (NFJ) |
| Virtus
Equity & Convertible Income Fund (NIE) |
Not
FDIC Insured • No Bank Guarantee • May Lose Value
FUND DISTRIBUTIONS AND MANAGED DISTRIBUTION PLAN
The Board of Trustees (the
“Board,” or the “Trustees”) of the Virtus Artificial Intelligence & Technology Opportunities Fund (“AIO”), Virtus Diversified Income & Convertible Fund (“ACV”), Virtus Dividend, Interest &
Premium Strategy Fund (“NFJ”), and Virtus Equity & Convertible Income Fund (“NIE”) (each individually a “Fund” or collectively “Funds”) have adopted a Managed Distribution Plan (the
“Plan”). The Plan currently provides for AIO and ACV to make a monthly distribution at a rate of $0.15 per share and $0.18 per share, respectively, and for NIE to make a quarterly distribution at a rate of $0.50 per share. In addition,
the Plan currently provides for NFJ to make a quarterly distribution at a rate of $0.305 per share for distributions starting with a September 26, 2024 pay date; prior to this date, the rate for NFJ was $0.280 per share. Under the terms of the Plan,
the Funds seek to maintain a consistent distribution level that may be paid in part or in full from net investment income, realized capital gains, and a return of capital, or a combination thereof.
If a Fund estimates that it has distributed
more than its income and capital gains in a particular period, a portion of your distribution may be a return of capital. A return of capital may occur, for example, when some or all of the money that you invested in the Fund is paid back to you. A
return of capital distribution does not necessarily reflect the Fund’s investment performance and should not be confused with “yield” or “income.”
You should not draw any conclusions about a
Fund’s investment performance from the amount of the Fund’s distributions or from the terms of the Fund’s Plan.
The amounts and sources of distributions
reported in a Fund’s notices issued pursuant to Section 19(a) of the Investment Company Act of 1940, as amended, are only estimates and are not being provided for tax reporting purposes. The actual amounts and sources of the amounts for tax
reporting purposes will depend upon the Fund’s investment results during its fiscal year and may be subject to changes based on tax regulations. The Funds will send shareholders a Form 1099-DIV for the calendar year that will tell you how to
report distributions for federal income tax purposes.
The Board may amend, suspend or terminate
the Plan at any time, without prior notice to shareholders, if it deems such action to be in the best interest of the Fund and its shareholders.
Information on each Fund is available
through the closed-end fund section on the web at www.Virtus.com. Section 19(a) notices are posted on the website at:
https://www.virtus.com/AIO
https://www.virtus.com/ACV
https://www.virtus.com/NFJ
https://www.virtus.com/NIE
To Virtus Closed-End Fund Shareholders:
I am pleased to present this annual report,
which reviews the performance of your Fund for the 12 months ended January 31, 2025.
Higher-volatility areas of the market
outperformed during the 12-month period, driving equities, convertible securities, and high yield bonds higher. The U.S. economy showed strength while inflation eased somewhat. The Federal Reserve (the “Fed”) began its anticipated
interest rate cuts in September, adding to market optimism. Strong corporate earnings were fueled by developments in artificial intelligence (“AI”), as well as the outcome of the U.S. presidential election, which was deemed positive for
the markets.
Domestic and international equity indexes
posted strong returns for the 12 months ended January 31, 2025. U.S. large-capitalization stocks returned 26.38%, as measured by the S&P 500® Index, while small-cap
stocks returned 19.09%, as measured by the Russell 2000® Index. Convertible securities, as measured by the ICE BofA U.S. Convertibles Index, returned 15.43%. Within
international equities, developed markets, as measured by the MSCI EAFE® Index (net), returned 8.65%, while emerging markets, as measured by the MSCI Emerging Markets Index
(net), were up 14.75%.
In fixed income markets, the
yield on the 10-year Treasury rose to 4.58% on January 31, 2025, from 3.99% on January 31, 2024. The broader U.S. fixed income market, as represented by the Bloomberg U.S. Aggregate Bond Index, was up 2.07% for the 12-month period, while
non-investment grade bonds, as measured by the Bloomberg U.S. Corporate High Yield Bond Index, were up 9.68%.
If you have any questions about your Fund or require
assistance, please call our shareholder service team at 1-866-270-7788. We appreciate your business and remain committed to your long-term financial success.
Sincerely,
George R.
Aylward
President and Chief Executive Officer, Virtus Closed-End Funds
March 2025
Refer to the Manager’s Discussion section for your
Fund’s performance. Performance data quoted represents past results. Past performance is no guarantee of future results, and current performance may be higher or lower than the performance shown above.
Artificial Intelligence
& Technology Opportunities Fund (AIO)
MANAGER’S DISCUSSION OF
FUND PERFORMANCE (Unaudited)
January 31, 2025
About
the Fund:
Artificial Intelligence &
Technology Opportunities Fund’s (NYSE: AIO) (the “Fund”) investment objective is to provide total return through a combination of current income, current gains and long-term capital appreciation.
There is no guarantee that the Fund will achieve its investment objective.
The use of leverage currently enables the
Fund to borrow at short-term rates and seek to invest at higher yields on its investments. As of January 31, 2025, the Fund’s leverage consisted of $130.0 million of borrowings made pursuant to margin financing and/or securities lending, which
represented approximately 14% of the Fund’s total assets.
Manager Comments - Voya Investment Management Co. LLC
(“Voya IM”)
Voya IM manages
the Fund. As the asset management business of Voya Financial (NYSE: VOYA), Voya IM seeks to understand and anticipate client needs, delivering differentiated solutions across public and private fixed income, equity, and multi-asset platforms,
including private markets and alternatives. The following commentary is provided by the portfolio team at Voya IM.
How did the markets perform during the Fund’s fiscal year
ended January 31, 2025?
Global equities
rallied during the reporting period. Many markets hit new highs as a U.S. recession failed to materialize and most major central banks started to cut interest rates. Sentiment across U.S. equities improved following the U.S. elections. At a sector
level, artificial intelligence (“AI”)-related companies in the communication services and information technology sectors outperformed, with consumer discretionary and financials stocks also trading higher. In contrast, materials and
health care were the weakest sectors in the MSCI All Country World Index (net).
It was a choppy period for U.S. fixed income.
In April of 2024, the yield on the 10-year U.S. Treasury bond reached a six-month high of 4.7% as persistent inflation caused investors to rein in hopes for multiple rate cuts in 2024. However, in late summer, signs of a weakening labor market
sparked fears of a potential recession, which caused 10-year Treasury yields to slide to a year-to-date low of 3.6% in September. Yields subsequently rose again as the Trump administration’s victory raised fears that higher tariffs could
reignite inflation and tax cuts would further swell the fiscal deficit.
What factors affected the Fund’s performance during its
fiscal year?
For the 12 months ended
January 31, 2025, the Fund’s net asset value (“NAV”) returned 23.83%, while its market price returned 45.60%. For the same period, the Fund’s composite benchmark, which consists of 50% MSCI All Country World Index (net)
(representing equities) and 50% ICE BofA U.S. Convertibles Index (representing convertible securities), returned 18.10%. The underlying indexes returned 20.72% for equities and 15.43% for convertible securities.
The Fund’s equity portfolio was a
strong relative contributor over the period. The information technology, financials, and communication services sectors contributed the most to performance on an absolute basis. On balance, the energy sector detracted from returns.
Convertible securities were positively
impacted by credit spread tightening and rising stock prices. Spread refers to the additional yield over the yield of a risk-free government bond. Within the Fund’s convertible securities allocation, the information technology, communication
services, and consumer discretionary sectors contributed the most to performance. Conversely, the Fund’s health care and industrials holdings detracted from performance.
With respect to credit, the Fund’s
allocation to high yield corporate bonds contributed to returns. Information technology, industrials, and consumer discretionary issues contributed to performance. On balance, the consumer staples sector was the only detractor during the 12-month
period.
Managed Distribution Plan
As discussed on the inside cover of this
Report, the Fund currently operates under a Managed Distribution Plan (the “Plan”) pursuant to which the Fund makes a monthly distribution at a rate of $0.15 per share. As a result of execution on the Plan, the Fund may pay distributions
in excess of the Fund’s taxable net investment income and net realized gains. During the most recent fiscal year, the Plan did not have a material impact on the Fund’s investment strategy. Please refer to the financial highlights and
federal income tax information note in this report for further information about the Fund’s distributions and its effect on net asset value.
The preceding information is the opinion of
portfolio management only through the end of the period of the report as stated on the cover. Any such opinions are subject to change at any time based upon market conditions and should not be relied upon as investment advice.
The Fund’s portfolio holdings are
subject to change and may not be representative of the portfolio managers’ current or future investment decisions. The mention of individual securities held by the Fund is for informational purposes only and should not be construed as a
recommendation to purchase or sell any securities. Investors seeking financial advice regarding the appropriateness of investing in any securities or investment strategies discussed should consult their financial professional.
For
information regarding the indexes and certain key investment terms, see Key Investment Terms starting on page 18.
Artificial Intelligence
& Technology Opportunities Fund (AIO)
MANAGER’S DISCUSSION OF
FUND PERFORMANCE (Unaudited) (Continued)
January 31,
2025
Average Annual Total Returns1 for periods ended 1/31/25
| |
1
Year |
5
Years |
Since
Inception
10/31/19 |
| Market
Value1,2 |
45.60%
|
17.55%
|
16.53%
|
| Net
Asset Value1,2 |
23.83%
|
14.02%
|
14.41%
|
| Composite:
50% MSCI All Country World Index (net)/ 50% ICE BofA U.S. Convertibles Index1,3 |
18.10%
|
10.43%
|
11.27%
4 |
| MSCI
All Country World Index (net)1,3 |
20.72%
|
11.04%
|
11.48%
4 |
| ICE
BofA U.S. Convertibles Index1,3 |
15.43%
|
9.63%
|
10.88%
4 |
All returns represent past performance which
is no guarantee of future results. Current performance may be higher or lower than the performance shown. Please visit Virtus.com for performance data current to the most recent month-end.
Growth of $10,000 for periods ended 1/31
This graph shows the change in value of a hypothetical
investment of $10,000 in the Fund made on October 31, 2019 (inception date of the Fund) for the years indicated. For comparison, the same investment is shown in the indicated index.
|
1 |
Past
performance is not indicative of future results. Current performance may be lower or higher than performance in historical periods. |
|
2 |
Total
return on market value is calculated assuming a purchase of common shares on the opening of the first day and sale on the closing of the last day of each period reported. Dividends and distributions are assumed, for purposes of this calculation, to
be reinvested at prices obtained under the Fund’s Automatic Reinvestment and Cash Purchase Plan. Total return on market value is not annualized for periods of less than one year. Brokerage commissions that a shareholder may pay are not
reflected. Total return on market value does not reflect the deduction of taxes that a shareholder may pay on Fund distributions or the sale of Fund shares. Total return on net asset value uses the same methodology, but with use of net asset value
for the beginning, ending and reinvestment values. |
|
3 |
The
index is unmanaged and not available for direct investment; therefore, its performance does not reflect the expenses associated with active management of an actual portfolio. |
|
4 |
The
since inception index return is from the Fund’s inception date. |
For information regarding the indexes and certain key investment terms, see
Key Investment Terms starting on page 18.
Convertible & Income
Fund (NCV)
MANAGER’S DISCUSSION OF FUND PERFORMANCE
(Unaudited)
January 31, 2025
About
the Fund:
Virtus Convertible &
Income Fund’s (NYSE: NCV) (the “Fund”) investment objective is to provide total return through a combination of capital appreciation and high current income. There is no guarantee that the Fund will
achieve its investment objective.
The use of leverage currently enables the
Fund to have a blended capital structure combining long-term fixed rates and short-term variable rates which allows the Fund to seek to enhance the yields on its investments. As of January 31, 2025, the Fund’s leverage consisted of $200.0
million of borrowings made pursuant to a combination of cumulative preferred shares, mandatory redeemable preferred shares, margin financing and/or securities lending, which represented approximately 35% of the Fund’s total assets.
Manager Comments - Voya Investment Management Co. LLC
(“Voya IM”)
Voya IM manages
the Fund. As the asset management business of Voya Financial (NYSE: VOYA), Voya IM seeks to understand and anticipate client needs, delivering differentiated solutions across public and private fixed income, equity, and multi-asset platforms,
including private markets and alternatives. The following commentary is provided by the portfolio team at Voya IM.
How did the markets perform during the Fund’s fiscal year
ended January 31, 2025?
Risk assets
advanced during the reporting period, with the convertible securities and high yield bond markets finishing higher for the 12 months ended January 31, 2025. The ICE BofA U.S. Convertibles Index returned 15.43% and the ICE BofA U.S. High Yield Index
returned 9.67%.
Convertible securities
were positively impacted by underlying stock price strength and credit spread tightening. Spread refers to the additional yield over the yield of a risk-free government bond. Sector performance was mostly positive, and primary market activity
increased.
Regarding high yield bonds,
industry gains were also widespread. Lower quality bonds outperformed higher quality bonds, new issuance was strong, and the trailing 12-month default rate remained low.
Against this backdrop, corporate earnings
results were generally better than expected, with most companies beating top- and bottom-line forecasts. The U.S. economy expanded, inflation continued to normalize, the unemployment rate remained low, the manufacturing sector began to stabilize,
and the U.S. Federal Reserve (the “Fed”) cut interest rates by a total of 1.00% during the 12-month period.
What factors affected the Fund’s performance during its
fiscal year?
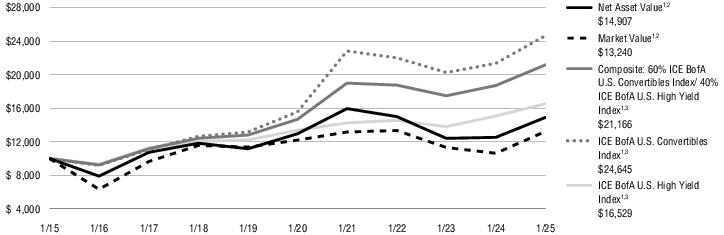
For the fiscal year ended
January 31, 2025, the Fund’s net asset value (“NAV”) returned 19.01%, while its market price returned 24.58%. For the same period, the Fund’s composite benchmark, which consists of 60% ICE BofA U.S. Convertibles Index
(representing convertible securities) and 40% ICE BofA U.S. High Yield Index (representing high yield bonds), returned 13.17%. The underlying indexes returned 15.43% for convertible securities and 9.67% for high yield bonds.
The Fund delivered consistent income and a
positive total return for the 12-month period. The portfolio benefited from strength across risk assets including convertible securities and high yield bonds.
Among convertible securities, most sectors
finished higher, led by technology, financials, and consumer discretionary. Software and semiconductor positioning was the primary source of the Fund’s strength in technology. Financials were aided by gains in a health care real estate
investment trust (“REIT”), an alternative asset manager, and a consumer finance issuer. Cruise line exposure was the largest driver of performance in consumer discretionary, with additional gains from issues in e-commerce and
entertainment services. Conversely, two sectors—media and telecom—detracted from performance due to weakness in advertising and wired telecommunications, respectively.
With respect to the high yield allocation,
all industries finished higher and contributed to performance for the period. Financial services, energy, and technology had the greatest impact on the Fund. In financial services, consumer lending holdings were the primary drivers of performance.
Gains in energy were broad, with every position closing higher for the fiscal year. Technology was led by cybersecurity and data storage holdings. There were no industries that detracted from performance for the 12-month period.
Level Distribution Practice
The Fund has a practice of seeking to
maintain a specified level of monthly distributions to holders of common shares, which may be changed at any time. As a result of this practice, the Fund may pay distributions in excess of the Fund’s taxable net investment income and net
realized gains. During the most recent fiscal year, the practice did not have a material impact on the Fund’s investment strategy. Please refer to the financial highlights and federal income tax information note in this report for further
information about the Fund’s distributions and its effect on net asset value.
The preceding information is the opinion of
portfolio management only through the end of the period of the report as stated on the cover. Any such opinions are subject to change at any time based upon market conditions and should not be relied upon as investment advice.
The Fund’s portfolio holdings are
subject to change and may not be representative of the portfolio managers’ current or future investment decisions. The mention of individual securities held by the Fund is for informational purposes only and should not be construed as a
recommendation to purchase or sell any securities. Investors seeking financial advice regarding the appropriateness of investing in any securities or investment strategies discussed should consult their financial professional.
For
information regarding the indexes and certain key investment terms, see Key Investment Terms starting on page 18.
Convertible & Income
Fund (NCV)
MANAGER’S DISCUSSION OF FUND PERFORMANCE
(Unaudited) (Continued)
January 31, 2025
Average Annual Total Returns1 for periods ended 1/31/25
| |
1
Year |
5
Years |
10
Years |
| Market
Value1,2 |
24.58%
|
1.65%
|
2.85%
|
| Net
Asset Value1,2 |
19.01%
|
2.84%
|
4.07%
|
| Composite:
60% ICE BofA U.S. Convertibles Index/ 40% ICE BofA U.S. High Yield Index1,3 |
13.17%
|
7.59%
|
7.79%
|
| ICE
BofA U.S. Convertibles Index1,3 |
15.43%
|
9.63%
|
9.44%
|
| ICE
BofA U.S. High Yield Index1,3 |
9.67%
|
4.33%
|
5.15%
|
All returns
represent past performance which is no guarantee of future results. Current performance may be higher or lower than the performance shown. Please visit Virtus.com for performance data current to the most recent month-end.
Growth of $10,000 for periods ended 1/31
This graph shows the change in value of a hypothetical
investment of $10,000 in the Fund for the years indicated. For comparison, the same investment is shown in the indicated index.
|
1 |
Past
performance is not indicative of future results. Current performance may be lower or higher than performance in historical periods. |
|
2 |
Total
return on market value is calculated assuming a purchase of common shares on the opening of the first day and sale on the closing of the last day of each period reported. Dividends and distributions are assumed, for purposes of this calculation, to
be reinvested at prices obtained under the Fund’s Automatic Reinvestment and Cash Purchase Plan. Total return on market value is not annualized for periods of less than one year. Brokerage commissions that a shareholder may pay are not
reflected. Total return on market value does not reflect the deduction of taxes that a shareholder may pay on Fund distributions or the sale of Fund shares. Total return on net asset value uses the same methodology, but with use of net asset value
for the beginning, ending and reinvestment values. |
|
3 |
The
index is unmanaged and not available for direct investment; therefore, its performance does not reflect the expenses associated with active management of an actual portfolio. |
For information
regarding the indexes and certain key investment terms, see Key Investment Terms starting on page 18.
Convertible & Income
Fund II (NCZ)
MANAGER’S DISCUSSION OF FUND PERFORMANCE
(Unaudited)
January 31, 2025
About
the Fund:
Convertible & Income Fund
II’s (NYSE: NCZ) (the “Fund”) investment objective is to provide total return through a combination of capital appreciation and high current income. There is no guarantee that the Fund will achieve
its investment objective.
The
use of leverage currently enables the Fund to have a blended capital structure combining long-term fixed rates and short-term variable rates which allows the Fund to seek to enhance the yields on its investments. As of January 31, 2025, the
Fund’s leverage consisted of $156.0 million of borrowings made pursuant to a combination of cumulative preferred shares, mandatory redeemable preferred shares, margin financing and/or securities lending, which represented approximately 36% of
the Fund’s total assets.
Manager Comments - Voya
Investment Management Co. LLC (“Voya IM”)
Voya IM manages the Fund. As the asset
management business of Voya Financial (NYSE: VOYA), Voya IM seeks to understand and anticipate client needs, delivering differentiated solutions across public and private fixed income, equity, and multi-asset platforms, including private markets and
alternatives. The following commentary is provided by the portfolio team at Voya IM.
How did the markets perform during the Fund’s fiscal year
ended January 31, 2025?
Risk assets advanced during the reporting
period, with the convertible securities and high yield bond markets finishing higher for the 12 months ended January 31, 2025. The ICE BofA U.S. Convertibles Index returned 15.43% and the ICE BofA U.S. High Yield Index returned 9.67%.
Convertible securities were positively
impacted by underlying stock price strength and credit spread tightening. Spread refers to the additional yield over the yield of a risk-free government bond. Sector performance was mostly positive, and primary market activity increased.
Regarding high yield bonds, industry gains
were also widespread. Lower quality bonds outperformed higher quality bonds, new issuance was strong, and the trailing 12-month default rate remained low.
Against this backdrop, corporate earnings
results were generally better than expected, with most companies beating top- and bottom-line forecasts. The U.S. economy expanded, inflation continued to normalize, the unemployment rate remained low, the manufacturing sector began to stabilize,
and the U.S. Federal Reserve (the “Fed”) cut interest rates by a total of 1.00% during the 12-month period.
What factors affected the Fund’s performance during its
fiscal year?
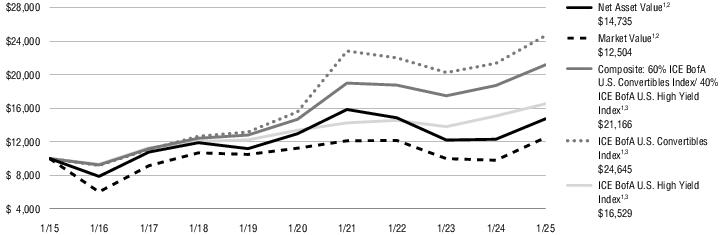
For the fiscal year ended
January 31, 2025, the Fund’s net asset value (“NAV”) returned 19.83%, while its market price returned 27.69%. For the same period, the Fund’s composite benchmark, which consists of 60% ICE BofA U.S. Convertibles Index
(representing convertible securities) and 40% ICE BofA U.S. High Yield Index (representing high yield bonds), returned 13.17%. The underlying indexes returned 15.43% for convertible securities and 9.67% for high yield bonds.
The Fund delivered consistent income and a
positive total return for the 12-month period. The portfolio benefited from strength across risk assets including convertible securities and high yield bonds.
Among convertible securities, most sectors
finished higher, led by technology, financials, and consumer discretionary. Software and semiconductor positioning was the primary source of the Fund’s strength in technology. Financials were aided by gains in a health care real estate
investment trust (“REIT”), an alternative asset manager, and a consumer finance issuer. Cruise line exposure was the largest driver of performance in consumer discretionary, with additional gains from issues in e-commerce and
entertainment services. Conversely, two sectors—media and telecom—detracted from performance due to weakness in advertising and wired telecommunications, respectively.
With respect to the high yield allocation,
all industries finished higher and contributed to performance for the period. Financial services, energy, and technology had the greatest impact on the Fund. In financial services, consumer lending holdings were the primary drivers of performance.
Gains in energy were broad, with every position closing higher for the fiscal year. Technology was led by cybersecurity and data storage holdings. There were no industries that detracted from performance for the 12-month period.
Level Distribution Practice
The Fund has a practice of seeking to
maintain a specified level of monthly distributions to holders of common shares, which may be changed at any time. As a result of this practice, the Fund may pay distributions in excess of the Fund’s taxable net investment income and net
realized gains. During the most recent fiscal year, the practice did not have a material impact on the Fund’s investment strategy. Please refer to the financial highlights and federal income tax information note in this report for further
information about the Fund’s distributions and its effect on net asset value.
The preceding information is the opinion of
portfolio management only through the end of the period of the report as stated on the cover. Any such opinions are subject to change at any time based upon market conditions and should not be relied upon as investment advice.
The Fund’s portfolio holdings are
subject to change and may not be representative of the portfolio managers’ current or future investment decisions. The mention of individual securities held by the Fund is for informational purposes only and should not be construed as a
recommendation to purchase or sell any securities. Investors seeking financial advice regarding the appropriateness of investing in any securities or investment strategies discussed should consult their financial professional.
For
information regarding the indexes and certain key investment terms, see Key Investment Terms starting on page 18.
Convertible & Income
Fund II (NCZ)
MANAGER’S DISCUSSION OF FUND PERFORMANCE
(Unaudited) (Continued)
January 31, 2025
Average Annual Total Returns1 for periods ended 1/31/25
| |
1
Year |
5
Years |
10
Years |
| Market
Value1,2 |
27.69%
|
2.17%
|
2.26%
|
| Net
Asset Value1,2 |
19.83%
|
2.60%
|
3.95%
|
| Composite:
60% ICE BofA U.S. Convertibles Index/ 40% ICE BofA U.S. High Yield Index1,3 |
13.17%
|
7.59%
|
7.79%
|
| ICE
BofA U.S. Convertibles Index1,3 |
15.43%
|
9.63%
|
9.44%
|
| ICE
BofA U.S. High Yield Index1,3 |
9.67%
|
4.33%
|
5.15%
|
All returns
represent past performance which is no guarantee of future results. Current performance may be higher or lower than the performance shown. Please visit Virtus.com for performance data current to the most recent month-end.
Growth of $10,000 for periods ended 1/31
This graph shows the change in value of a hypothetical
investment of $10,000 in the Fund for the years indicated. For comparison, the same investment is shown in the indicated index.
|
1 |
Past
performance is not indicative of future results. Current performance may be lower or higher than performance in historical periods. |
|
2 |
Total
return on market value is calculated assuming a purchase of common shares on the opening of the first day and sale on the closing of the last day of each period reported. Dividends and distributions are assumed, for purposes of this calculation, to
be reinvested at prices obtained under the Fund’s Automatic Reinvestment and Cash Purchase Plan. Total return on market value is not annualized for periods of less than one year. Brokerage commissions that a shareholder may pay are not
reflected. Total return on market value does not reflect the deduction of taxes that a shareholder may pay on Fund distributions or the sale of Fund shares. Total return on net asset value uses the same methodology, but with use of net asset value
for the beginning, ending and reinvestment values. |
|
3 |
The
index is unmanaged and not available for direct investment; therefore, its performance does not reflect the expenses associated with active management of an actual portfolio. |
For information
regarding the indexes and certain key investment terms, see Key Investment Terms starting on page 18.
Diversified Income &
Convertible Fund (ACV)
MANAGER’S DISCUSSION OF FUND PERFORMANCE
(Unaudited)
January 31, 2025
About
the Fund:
Diversified Income &
Convertible Fund’s (NYSE: ACV) (the “Fund”) investment objective is to provide total return through a combination of current income and capital appreciation, while seeking to provide downside protection against capital loss. There is no guarantee that the Fund will achieve its investment objective.
The Fund has a blended capital structure
combining long-term fixed rates and short-term variable rates which enable the Fund to seek to enhance the returns and yields on its investments. As of January 31, 2025, the Fund’s leverage consisted of $105.0 million of borrowings made
pursuant to long-term senior notes, margin loan financing, and mandatory redeemable preferred shares, which represented approximately 30% of the Fund’s total assets.
Manager Comments - Voya Investment Management Co. LLC
(“Voya IM”)
Voya IM manages
the Fund. As the asset management business of Voya Financial (NYSE: VOYA), Voya IM seeks to understand and anticipate client needs, delivering differentiated solutions across public and private fixed income, equity, and multi-asset platforms,
including private markets and alternatives. The following commentary is provided by the portfolio team at Voya IM.
How did the markets perform during the Fund’s fiscal year
ended January 31, 2025?
Risk assets
advanced during the reporting period, with the equity, convertible securities, and high yield bond markets finishing higher for the 12 months ended January 31, 2025. The S&P
500® Index returned 26.38%, the ICE BofA U.S. Convertibles Index returned 15.43%, and the ICE BofA U.S. High Yield Index returned 9.67%.
Equities made multiple new all-time highs
during the reporting period, helped by strong corporate profitability, rising earnings estimates, and broad-based sector gains.
Convertible securities were positively
impacted by underlying stock price strength and credit spread tightening. Spread refers to the additional yield over the yield of a risk-free government bond. Sector performance was mostly positive, and primary market activity increased.
Regarding high yield bonds, industry gains
were also widespread. Lower quality bonds outperformed higher quality bonds, new issuance was strong, and the trailing 12-month default rate remained low.
Against this backdrop, corporate earnings
results were generally better than expected, with most companies beating top- and bottom-line forecasts. The U.S. economy expanded, inflation continued to normalize, the unemployment rate remained low, the manufacturing sector began to stabilize,
and the U.S. Federal Reserve (the “Fed”) cut interest rates by a total of 1.00% during the 12-month period.
What factors affected the Fund’s performance during its
fiscal year?
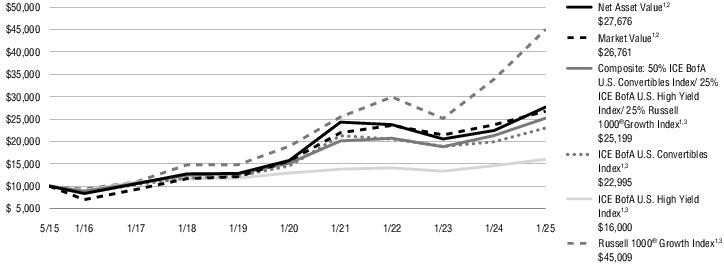
For the fiscal year ended
January 31, 2025, the Fund’s net asset value (“NAV”) returned 23.29%, while its market price returned 12.80%. For the same period, the Fund’s composite benchmark, which consists of 50% ICE BofA U.S. Convertibles Index
(representing convertible securities), 25% ICE BofA U.S. High Yield Index (representing high yield bonds), and 25% Russell 1000® Growth Index (representing equities),
returned 18.19%. The underlying indexes returned 15.43% for convertible securities, 9.67% for high yield bonds, and 32.68% for equities.
The Fund delivered consistent income and a
positive total return for the 12-month period. The portfolio benefited from strength across risk assets including equities, convertible securities, and high yield bonds.
Top contributors to performance were led by a
software company with bitcoin exposure, and a semiconductor company that consistently exceeded expectations due to strong demand for its chips, which train and deploy generative artificial intelligence (“AI”) applications. Other
outperformers included an e-commerce company capitalizing on secular trends around AI and cloud migration, a cruise line operator benefiting from increased travel demand, and a security device manufacturer exhibiting core business strength and a
sizeable order backlog.
Top detractors
included a cybersecurity provider that experienced softer-than-expected subscription trends and a cloud services company that saw slower than expected volume growth for a key segment. Other detractors included a medical device company that
experienced sales weakness stemming from a reorganization, a residential solar provider due to regulatory uncertainty, and a semiconductor company with exposure to electric vehicle manufacturing.
Many written options positions expired below
the strike price, and the portfolio was able to retain the set premiums.
Managed Distribution Plan
As discussed on the inside cover of this
Report, the Fund currently operates under a Managed Distribution Plan (the “Plan”) pursuant to which the Fund makes a monthly distribution at a rate of $0.18 per common share. As a result of execution on the Plan, the Fund may pay
distributions in excess of the Fund’s taxable net investment income and net realized gains. During the most recent fiscal year, the Plan did not have a material impact on the Fund’s investment strategy. Please refer to the financial
highlights and federal income tax information note in this report for further information about the Fund’s distributions and its effect on net asset value.
The preceding information is the opinion of
portfolio management only through the end of the period of the report as stated on the cover. Any such opinions are subject to change at any time based upon market conditions and should not be relied upon as investment advice.
For information
regarding the indexes and certain key investment terms, see Key Investment Terms starting on page 18.
Diversified Income &
Convertible Fund (ACV)
MANAGER’S DISCUSSION OF FUND PERFORMANCE
(Unaudited) (Continued)
January 31, 2025
The Fund’s portfolio holdings are
subject to change and may not be representative of the portfolio managers’ current or future investment decisions. The mention of individual securities held by the Fund is for informational purposes only and should not be construed as a
recommendation to purchase or sell any securities. Investors seeking financial advice regarding the appropriateness of investing in any securities or investment strategies discussed should consult their financial professional.
For
information regarding the indexes and certain key investment terms, see Key Investment Terms starting on page 18.
Diversified Income &
Convertible Fund (ACV)
MANAGER’S DISCUSSION OF FUND PERFORMANCE
(Unaudited) (Continued)
January 31, 2025
Average Annual Total Returns1 for periods ended 1/31/25
| |
1
Year |
5
Years |
Since
Inception
5/26/15 |
| Market
Value1,2 |
12.80%
|
11.31%
|
10.69%
|
| Net
Asset Value1,2 |
23.29%
3 |
11.92%
|
11.07%
|
| Composite:
50% ICE BofA U.S. Convertibles Index/ 25% ICE BofA U.S. High Yield Index/ 25%Russell 1000® Growth
Index1,4 |
18.19%
|
10.73%
|
10.00%
|
| ICE
BofA U.S. Convertibles Index1,4 |
15.43%
|
9.63%
|
8.97%
5 |
| ICE
BofA U.S. High Yield Index1,4 |
9.67%
|
4.33%
|
4.97%
5 |
| Russell
1000® Growth Index1,4 |
32.68%
|
18.90%
|
16.79%
5 |
All returns represent past performance which
is no guarantee of future results. Current performance may be higher or lower than the performance shown. Please visit Virtus.com for performance data current to the most recent month-end.
Growth of $10,000 for periods ended 1/31
This graph shows the change in value of a hypothetical
investment of $10,000 in the Fund made on May 26, 2015 (inception date of the Fund) for the years indicated. For comparison, the same investment is shown in the indicated index.
|
1 |
Past
performance is not indicative of future results. Current performance may be lower or higher than performance in historical periods. |
|
2 |
Total
return on market value is calculated assuming a purchase of common shares on the opening of the first day and sale on the closing of the last day of each period reported. Dividends and distributions are assumed, for purposes of this calculation, to
be reinvested at prices obtained under the Fund’s Automatic Reinvestment and Cash Purchase Plan. Total return on market value is not annualized for periods of less than one year. Brokerage commissions that a shareholder may pay are not
reflected. Total return on market value does not reflect the deduction of taxes that a shareholder may pay on Fund distributions or the sale of Fund shares. Total return on net asset value uses the same methodology, but with use of net asset value
for the beginning, ending and reinvestment values. |
|
3 |
Total
Return for the report period presented in the table differs from the return in the Financial Highlights. The total return presented in the above table is calculated based on the NAV calculated on that business day. The total return presented in the
Financial Highlights section of the report is calculated in the same manner, but also takes into account certain adjustments that are necessary under generally accepted accounting principles required in the annual report and semiannual report.
|
|
4 |
The
index is unmanaged and not available for direct investment; therefore, its performance does not reflect the expenses associated with active management of an actual portfolio. |
|
5 |
The
since inception index return is from the Fund’s inception date. |
For information regarding the indexes and certain key investment terms, see
Key Investment Terms starting on page 18.
Dividend, Interest &
Premium Strategy Fund (NFJ)
MANAGER’S DISCUSSION OF FUND
PERFORMANCE (Unaudited)
January 31, 2025
About
the Fund:
Dividend, Interest &
Premium Strategy Fund’s (NYSE: NFJ) (the “Fund”) investment objective is to seek current income and gains, with a secondary objective of long-term capital appreciation. There is no guarantee that
the Fund will achieve its investment objective.
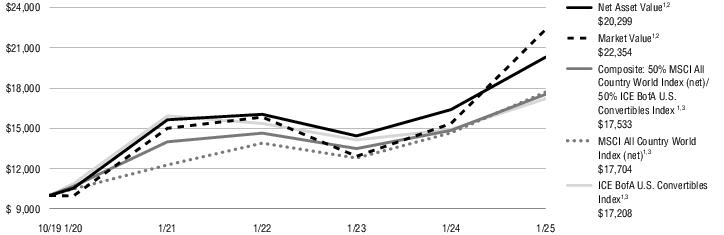
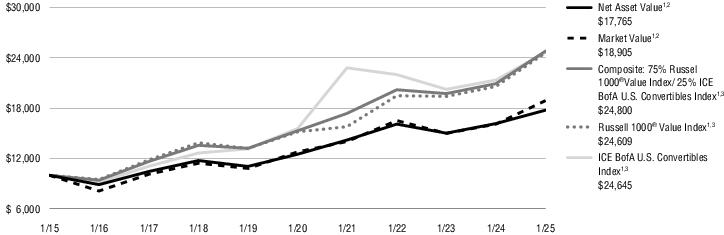
For the fiscal year ended January 31, 2025,
the Fund’s net asset value returned 9.90%, and its market price returned 17.41%. For the same period, the Fund’s composite benchmark, which consists of 75% Russell
1000® Value and 25% ICE BofA U.S. Convertibles Index returned 18.55%.
As announced on August 29, 2024, NFJ
increased its quarterly distribution rate by 9% from $0.28 per share to $0.305 per share, effective with its September 2024 distribution, as part of an ongoing effort to enhance shareholder value by both seeking to provide a more attractive
distribution rate and furthering its efforts to reduce the current discount to net asset value at which its shares currently trade.
On February 18, 2025, the Fund announced that
the Board of Trustees has adopted a share purchase program to repurchase, at a discount to net asset value (“NAV”), up to 5% of its outstanding common shares in open market transactions. The share repurchase program is intended to
enhance shareholder value, as repurchases made at a discount may have the effect of increasing NAV per share of the Fund’s remaining shares.
Manager Comments – Voya Investment Management Co. LLC
(“Voya IM”) and NFJ Investment Group, LLC (“NFJ Investment Group”)
Voya IM manages the Fund’s convertible
securities portfolio, while NFJ Investment Group manages the Fund’s equity and options portfolios. The Voya IM team and NFJ Investment Group have been working together for more than 15 years. As the asset management business of Voya Financial
(NYSE: VOYA), Voya IM seeks to understand and anticipate client needs, delivering differentiated solutions across public and private fixed income, equity and multi-asset platforms, including private markets and alternatives. The NFJ Investment Group
investment team has been managing value equities for clients for over 30 years. They seek to invest in companies with low market expectations and the strongest prospects for returning capital to shareholders. The following commentary is provided by
the portfolio teams at NFJ Investment Group and Voya IM and cover the Fund’s portfolio for the year ended January 31, 2025.
NFJ Investment Group, LLC
How did the equity markets perform during the Fund’s
fiscal year ended January 31, 2025?
The
value of U.S. equities generally appreciated during the 12-month period, lifted in part by robust gains from the highest momentum names in the first half of 2024. While stubborn inflation remained a concern, the Federal Reserve (the
“Fed”) initiated an interest rate cutting cycle in the third quarter, which benefited more rate-sensitive areas of the market. In the Russell 1000® Value Index,
financials climbed 38%, followed by 20%+ gains from the utilities and industrials sectors. Conversely, the health care, energy, and materials sectors posted the weakest returns. The Cboe Volatility Index® (VIX®) rose during the second half of 2024, spiking to over 38 in August and over 27 in
December.
What factors affected the performance of the
Fund’s equity portfolio during the fiscal year?
For the 12 months ended January 31, 2025, the
Fund’s equity portfolio returned 8.76% (gross of fees and expenses). For the same period, the Fund’s benchmark, the Russell 1000® Value Index, returned
19.54%.
In the equity sleeve, relative
underperformance versus the Russell 1000® Value Index was due to negative stock selection. Sector allocation somewhat contributed over the reporting period. Stock selection
was positive across the communication services and energy sectors. However, these gains were offset by negative selection across the real estate and consumer discretionary sectors. Underweight positions in the health care and communication services
sectors contributed to performance. Conversely, an overweight in real estate and an underweight in industrials detracted for the 12-month period.
The Fund employs an options overlay strategy
in which calls are written on a portion of the portfolio’s equity holdings. In the options sleeve, many written options positions expired below the strike price, and the portfolio was able to retain the set premiums.
Voya Investment Management (Voya IM)
How did the convertible securities markets perform during the
Funds’ fiscal year?
Risk assets
advanced during the reporting period, with the ICE BofA U.S. Convertibles Index returning 15.43% for the 12 months ended January 31, 2025. Convertible securities were positively impacted by underlying stock price strength and credit spread
tightening. Spread refers to the additional yield over the yield of a risk-free government bond. Sector performance was mostly positive, and primary market activity increased.
Against this backdrop, corporate earnings
results were generally better than expected, with most companies beating top- and bottom-line forecasts. The U.S. economy expanded, inflation continued to normalize, the unemployment rate remained low, and the manufacturing sector began to
stabilize. The U.S. Federal Reserve (the “Fed”) cut interest rates by a total of 1.00% during the 12-month period.
For information regarding the indexes and certain key investment terms, see
Key Investment Terms starting on page 18.
Dividend, Interest &
Premium Strategy Fund (NFJ)
MANAGER’S DISCUSSION OF FUND
PERFORMANCE (Unaudited) (Continued)
January 31, 2025
What factors affected the performance of the Fund’s
convertible securities portfolio during the fiscal year?
For the 12 months ended January 31, 2025, the
Fund’s convertible securities portfolio returned 19.50% (gross of fees and expenses). For the same period, the ICE BofA U.S. Convertibles Index returned 15.43%.
Top contributors to performance were led by a
software company with bitcoin exposure and a semiconductor company that consistently exceeded expectations due to strong demand for its chips, which train and deploy generative artificial intelligence (“AI”) applications. Other
outperformers included an e-commerce company capitalizing on secular trends around AI and cloud migration, a cruise line operator benefiting from increased travel demand, and a security device manufacturer exhibiting core business strength and a
sizeable order backlog.
Top detractors
included a cybersecurity provider that experienced softer-than-expected subscription trends and a cloud services holding that saw slower volume growth for a key segment. Other detractors included a medical device company that experienced sales
weakness stemming from a reorganization, a residential solar provider due to regulatory uncertainty, and a semiconductor company that has exposure to electric vehicle manufacturing.
Managed Distribution Plan
As discussed on the inside cover of this
Report, the Fund currently operates under a Managed Distribution Plan (the “Plan”) pursuant to which the Fund makes a quarterly distribution at a current rate of $0.305 per share. As a result of execution on the Plan, the Fund may pay
distributions in excess of the Fund’s taxable net investment income and net realized gains. During the most recent fiscal year, the Plan did not have a material impact on the Fund’s investment strategy. Please refer to the financial
highlights and federal income tax information note in this report for further information about the Fund’s distributions and its effect on net asset value.
The preceding information is the opinion of
portfolio management only through the end of the period of the report as stated on the cover. Any such opinions are subject to change at any time based upon market conditions and should not be relied upon as investment advice.
The Fund’s portfolio holdings are
subject to change and may not be representative of the portfolio managers’ current or future investment decisions. The mention of individual securities held by the Fund is for informational purposes only and should not be construed as a
recommendation to purchase or sell any securities. Investors seeking financial advice regarding the appropriateness of investing in any securities or investment strategies discussed should consult their financial professional.
For
information regarding the indexes and certain key investment terms, see Key Investment Terms starting on page 18.
Dividend, Interest &
Premium Strategy Fund (NFJ)
MANAGER’S DISCUSSION OF FUND
PERFORMANCE (Unaudited) (Continued)
January 31, 2025
Average Annual Total Returns1 for periods ended 1/31/25
| |
1
Year |
5
Years |
10
Years |
| Market
Value1,2 |
17.41%
|
8.13%
|
6.58%
|
| Net
Asset Value1,2 |
9.90%
|
7.26%
|
5.91%
|
| Composite:
75% Russell 1000® Value Index/ 25% ICE BofA U.S. Convertibles Index1,3 |
18.55%
|
10.14%
|
9.51%
|
| Russell
1000® Value Index1,3 |
19.54%
|
10.15%
|
9.42%
|
| ICE
BofA U.S. Convertibles Index1,3 |
15.43%
|
9.63%
|
9.44%
|
All returns
represent past performance which is no guarantee of future results. Current performance may be higher or lower than the performance shown. Please visit Virtus.com for performance data current to the most recent month-end.
Growth of $10,000 for periods ended 1/31
This graph shows the change in value of a hypothetical
investment of $10,000 in the Fund for the years indicated. For comparison, the same investment is shown in the indicated index.
|
1 |
Past
performance is not indicative of future results. Current performance may be lower or higher than performance in historical periods. |
|
2 |
Total
return on market value is calculated assuming a purchase of common shares on the opening of the first day and sale on the closing of the last day of each period reported. Dividends and distributions are assumed, for purposes of this calculation, to
be reinvested at prices obtained under the Fund’s Automatic Reinvestment and Cash Purchase Plan. Total return on market value is not annualized for periods of less than one year. Brokerage commissions that a shareholder may pay are not
reflected. Total return on market value does not reflect the deduction of taxes that a shareholder may pay on Fund distributions or the sale of Fund shares. Total return on net asset value uses the same methodology, but with use of net asset value
for the beginning, ending and reinvestment values. |
|
3 |
The
index is unmanaged and not available for direct investment; therefore, its performance does not reflect the expenses associated with active management of an actual portfolio. |
For information
regarding the indexes and certain key investment terms, see Key Investment Terms starting on page 18.
Equity & Convertible
Income Fund (NIE)
MANAGER’S DISCUSSION OF FUND PERFORMANCE
(Unaudited)
January 31, 2025
About
the Fund:
Equity & Convertible
Income Fund’s (NYSE: NIE) (the “Fund”) investment objective is to seek total return comprised of capital appreciation, current income and gains. There is no guarantee that the Fund will achieve its
investment objective.
Manager Comments - Voya
Investment Management Co. LLC (“Voya IM”)
Voya IM manages the Fund. As the asset
management business of Voya Financial (NYSE: VOYA), Voya IM seeks to understand and anticipate client needs, delivering differentiated solutions across public and private fixed income, equity, and multi-asset platforms, including private markets and
alternatives. The following commentary is provided by the portfolio team at Voya IM.
How did the markets perform during the Fund’s fiscal year
period ended January 31, 2025?
Risk
assets advanced during the reporting period, with the equity and convertible securities markets finishing higher for the 12 months ended January 31, 2025. The S&P 500®
Index returned 26.38% and the ICE BofA U.S. Convertibles Index returned 15.43%.
Equities made multiple new all-time highs
during the reporting period, helped by strong corporate profitability, rising earnings estimates, and broad-based sector gains.
Convertible securities were positively
impacted by underlying stock price strength and credit spread tightening. Spread refers to the additional yield over the yield of a risk-free government bond. Sector performance was mostly positive, and primary market activity increased.
Against this backdrop, corporate earnings
results were generally better than expected, with most companies beating top- and bottom-line forecasts. The U.S. economy expanded, inflation continued to normalize, the unemployment rate remained low, the manufacturing sector began to stabilize,
and the U.S. Federal Reserve (the “Fed”) cut interest rates by a total of 1.00% during the 12-month period.
What factors affected the Fund’s performance during its
fiscal year?
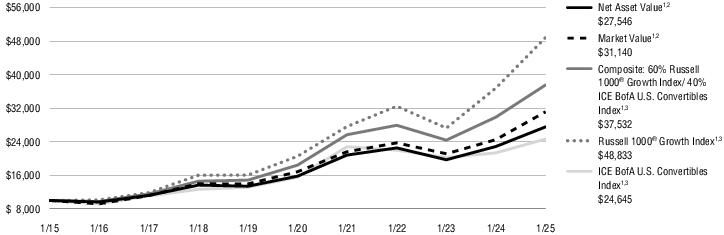
For the fiscal year ended
January 31, 2025, the Fund’s net asset value (“NAV”) returned 20.45%, while its market price returned 27.08%. For the same period, the Fund’s composite benchmark, which consists of 60% Russell 1000® Growth Index (representing equities) and 40% ICE BofA U.S. Convertibles Index (representing convertible securities), returned 25.67%. The underlying indexes returned 32.68%
for equities and 15.43% for convertible securities.
The Fund delivered consistent income and a
positive total return for the 12-month period. The portfolio benefited from strength across risk assets including equities and convertible securities.
Top contributors to performance were led by a
semiconductor company that consistently exceeded expectations due to strong demand for its chips, which train and deploy generative artificial intelligence (“AI”) applications. Several holdings in e-commerce and social media that are
seeking to capitalize on secular trends around AI and cloud migration contributed to Fund returns. Other outperformers included a technology hardware company that benefited from several successful product launches and advancements, and an aerospace
manufacturer that saw significant earnings growth and profit margin expansion during the period.
Top detractors were led by a medical
technology company that declined due to lower procedure volumes. A pharmaceutical holding was hurt by an unfavorable regulatory ruling, and a software provider was negatively impacted by competitive concerns and weaker-than-expected monetization.
Other detractors included a holding in information technology (“IT”) infrastructure that saw inconsistent demand in its AI segment, as well as a real estate platform operator that faced adverse effects from higher interest rates.
Many written options positions expired below
the strike price, and the portfolio was able to retain the set premiums.
Managed Distribution Plan
As discussed on the inside cover of this
Report, the Fund currently operates under a Managed Distribution Plan (the “Plan”) pursuant to which the Fund makes a quarterly distribution at a rate of $0.50 per share. As a result of execution on the Plan, the Fund may pay
distributions in excess of the Fund’s taxable net investment income and net realized gains. During the most recent fiscal year, the Plan did not have a material impact on the Fund’s investment strategy. Please refer to the financial
highlights and federal income tax information note in this report for further information about the Fund’s distributions and its effect on net asset value.
The preceding information is the opinion of
portfolio management only through the end of the period of the report as stated on the cover. Any such opinions are subject to change at any time based upon market conditions and should not be relied upon as investment advice.
The Fund’s portfolio holdings are
subject to change and may not be representative of the portfolio managers’ current or future investment decisions. The mention of individual securities held by the Fund is for informational purposes only and should not be construed as a
recommendation to purchase or sell any securities. Investors seeking financial advice regarding the appropriateness of investing in any securities or investment strategies discussed should consult their financial professional.
For
information regarding the indexes and certain key investment terms, see Key Investment Terms starting on page 18.
Equity & Convertible
Income Fund (NIE)
MANAGER’S DISCUSSION OF FUND PERFORMANCE
(Unaudited) (Continued)
January 31, 2025
Average Annual Total Returns1 for periods ended 1/31/25
| |
1
Year |
5
Years |
10
Years |
| Market
Value1,2 |
27.08%
|
13.06%
|
12.03%
|
| Net
Asset Value1,2 |
20.45%
|
11.76%
|
10.66%
|
| Composite:
60% Russell 1000® Growth Index/ 40% ICE BofA U.S. Convertibles Index1,3 |
25.67%
|
15.29%
|
14.14%
|
| Russell
1000® Growth Index1,3 |
32.68%
|
18.90%
|
17.18%
|
| ICE
BofA U.S. Convertibles Index1,3 |
15.43%
|
9.63%
|
9.44%
|
All returns
represent past performance which is no guarantee of future results. Current performance may be higher or lower than the performance shown. Please visit Virtus.com for performance data current to the most recent month-end.
Growth of $10,000 for periods ended 1/31
This graph shows the change in value of a hypothetical
investment of $10,000 in the Fund for the years indicated. For comparison, the same investment is shown in the indicated index.
|
1 |
Past
performance is not indicative of future results. Current performance may be lower or higher than performance in historical periods. |
|
2 |
Total
return on market value is calculated assuming a purchase of common shares on the opening of the first day and sale on the closing of the last day of each period reported. Dividends and distributions are assumed, for purposes of this calculation, to
be reinvested at prices obtained under the Fund’s Automatic Reinvestment and Cash Purchase Plan. Total return on market value is not annualized for periods of less than one year. Brokerage commissions that a shareholder may pay are not
reflected. Total return on market value does not reflect the deduction of taxes that a shareholder may pay on Fund distributions or the sale of Fund shares. Total return on net asset value uses the same methodology, but with use of net asset value
for the beginning, ending and reinvestment values. |
|
3 |
The
index is unmanaged and not available for direct investment; therefore, its performance does not reflect the expenses associated with active management of an actual portfolio. |
For information
regarding the indexes and certain key investment terms, see Key Investment Terms starting on page 18.
PORTFOLIO HOLDINGS SUMMARY
WEIGHTINGS (Unaudited)
January 31, 2025
The
following tables present the portfolio holdings within certain industries as a percentage of total investments at January 31, 2025.
AIO
| Common
Stocks |
|
53%
|
| Semiconductors
& Semiconductor Equipment |
8%
|
|
| Software
|
7
|
|
| Banks
|
6
|
|
| All
other Common Stocks |
32
|
|
| Convertible
Bonds and Notes |
|
28
|
| Software
|
5
|
|
| Internet
|
5
|
|
| Semiconductors
|
3
|
|
| All
other Convertible Bonds and Notes |
15
|
|
| Corporate
Bonds and Notes |
|
15
|
| Semiconductors
|
2
|
|
| Computers
|
2
|
|
| Diversified
REITS |
1
|
|
| All
other Corporate Bonds and Notes |
10
|
|
| Convertible
Preferred Stocks |
|
3
|
| Equity-Linked
Note |
|
1
|
| Total
|
|
100%
|
NCV
| Convertible
Bonds and Notes |
|
51%
|
| Software
|
9%
|
|
| Internet
|
5
|
|
| Healthcare-Products
|
4
|
|
| All
other Convertible Bonds and Notes |
33
|
|
| Corporate
Bonds and Notes |
|
38
|
| Oil,
Gas & Consumable Fuels |
4
|
|
| Media
|
3
|
|
| Financial
Services |
3
|
|
| All
other Corporate Bonds and Notes |
28
|
|
| Convertible
Preferred Stocks |
|
6
|
| Short-Term
Investment |
|
3
|
| Securities
Lending Collateral |
|
2
|
| Total
|
|
100%
|
NCZ
| Convertible
Bonds and Notes |
|
53%
|
| Software
|
9%
|
|
| Internet
|
6
|
|
| Healthcare-Products
|
4
|
|
| All
other Convertible Bonds and Notes |
34
|
|
| Corporate
Bonds and Notes |
|
36
|
| Oil,
Gas & Consumable Fuels |
4
|
|
| Media
|
3
|
|
| Financial
Services |
3
|
|
| All
other Corporate Bonds and Notes |
26
|
|
| Convertible
Preferred Stocks |
|
7
|
| Short-Term
Investment |
|
3
|
| Securities
Lending Collateral |
|
1
|
| Total
|
|
100%
|
ACV
| Convertible
Bonds and Notes |
|
50%
|
| Software
|
8%
|
|
| Internet
|
5
|
|
| Healthcare-Products
|
3
|
|
| All
other Convertible Bonds and Notes |
34
|
|
| Common
Stocks |
|
25
|
| Software
|
3
|
|
| Interactive
Media & Services |
2
|
|
| Semiconductors
& Semiconductor Equipment |
2
|
|
| All
other Common Stocks |
18
|
|
| Corporate
Bonds and Notes |
|
16
|
| Oil,
Gas & Consumable Fuels |
2
|
|
| Financial
Services |
1
|
|
| Media
|
1
|
|
| All
other Corporate Bonds and Notes |
12
|
|
| Convertible
Preferred Stocks |
|
6
|
| Short-Term
Investment |
|
3
|
| Total
|
|
100%
|
PORTFOLIO HOLDINGS SUMMARY
WEIGHTINGS (Unaudited) (Continued)
January 31, 2025
NFJ
| Common
Stocks |
|
77%
|
| Banks
|
11%
|
|
| Oil,
Gas & Consumable Fuels |
5
|
|
| Capital
Markets |
5
|
|
| All
other Common Stocks |
56
|
|
| Convertible
Bonds and Notes |
|
18
|
| Software
|
3
|
|
| Internet
|
2
|
|
| Healthcare-Products
|
1
|
|
| All
other Convertible Bonds and Notes |
12
|
|
| Short-Term
Investment |
|
3
|
| Convertible
Preferred Stocks |
|
2
|
| Total
|
|
100%
|
NIE
| Common
Stocks |
|
62%
|
| Software
|
8%
|
|
| Interactive
Media & Services |
5
|
|
| Semiconductors
& Semiconductor Equipment |
5
|
|
| All
other Common Stocks |
44
|
|
| Convertible
Bonds and Notes |
|
31
|
| Software
|
5
|
|
| Internet
|
3
|
|
| Healthcare-Products
|
2
|
|
| All
other Convertible Bonds and Notes |
21
|
|
| Convertible
Preferred Stocks |
|
4
|
| Short-Term
Investment |
|
3
|
| Total
|
|
100%
|
KEY INVESTMENT TERMS
(Unaudited)
January 31, 2025
American Depositary Receipt (“ADR”)
Represents shares of foreign companies traded in U.S. dollars
on U.S. exchanges that are held by a U.S. bank or a trust. Foreign companies use ADRs in order to make it easier for Americans to buy their shares.
Bloomberg U.S. Aggregate Bond Index
The Bloomberg U.S. Aggregate Bond Index measures the U.S.
investment-grade fixed-rate bond market. The index is calculated on a total return basis. The index is unmanaged, its returns do not reflect any fees, expenses, or sales charges, and it is not available for direct investment.
Bloomberg U.S. Corporate High Yield Bond Index
The Bloomberg U.S. Corporate High Yield Bond Index measures the
U.S. dollar-denominated, high yield, fixed-rate corporate bond market. The index is calculated on a total return basis. The index is unmanaged, its returns do not reflect any fees, expenses, or sales charges, and it is not available for direct
investment.
Cboe Volatility Index® (“VIX®”)
The Cboe VIX® shows the market’s expectation of 30-day volatility. It is constructed using the implied volatilities of a wide range of S&P 500® Index options. This volatility is meant to be forward looking and is calculated from both calls and puts. The Cboe VIX® is a widely used measure of market risk and is often referred to as the “investor fear gauge.” The index is unmanaged, its returns do not reflect any fees,
expenses, or sales charges, and it is not available for direct investment.
Composite Index (ACV): 50% ICE BofA U.S. Convertibles Index /
25% ICE BofA U.S. High Yield Index / 25% Russell 1000® Growth Index
The composite index consists of 50% ICE BofA U.S. Convertibles
Index, 25% ICE BofA U.S. High Yield Index, and 25% Russell 1000® Growth Index. The index is unmanaged, its returns
do not reflect any fees, expenses, or sales charges, and it is not available for direct investment.
Composite Index (AIO): 50% MSCI All Country World Index (net)
/ 50% ICE BofA U.S. Convertibles Index
The composite
index consists of 50% MSCI All Country World Index (net) and 50% ICE BofA U.S. Convertibles Index. The index is unmanaged, its returns do not reflect any fees, expenses, or sales charges, and it is not available for direct investment.
Composite Index (NCV): 60% ICE BofA U.S. Convertibles Index /
40% ICE BofA U.S. High Yield Index
The composite index
consists of 60% ICE BofA U.S. Convertibles Index and 40% ICE BofA U.S. High Yield Index. The index is unmanaged, its returns do not reflect any fees, expenses, or sales charges, and it is not available for direct investment.
Composite Index (NCZ): 60% ICE BofA U.S. Convertibles Index / 40%
ICE BofA U.S. High Yield Index
The composite index
consists of 60% ICE BofA U.S. Convertibles Index and 40% ICE BofA U.S. High Yield Index. The index is unmanaged, its returns do not reflect any fees, expenses, or sales charges, and it is not available for direct investment.
Composite Index (NFJ): 75% Russell 1000® Value Index / 25% ICE BofA U.S. Convertibles Index
The composite index consists of 75% Russell 1000® Value Index and 25% ICE BofA U.S. Convertibles Index. The index is unmanaged, its returns do not reflect any fees, expenses, or sales charges, and it is not available
for direct investment.
Composite Index (NIE): 60%
Russell 1000® Growth Index / 40% ICE BofA U.S. Convertibles Index
The composite index consists of 60% Russell 1000® Growth Index and 40% ICE BofA U.S. Convertibles Index. The index is unmanaged, its returns do not reflect any fees, expenses, or sales charges, and it is not available
for direct investment.
Credit Suisse Leveraged Loan
Index
The Credit Suisse Leveraged Loan Index is a
market-weighted index that tracks the investable universe of the U.S. dollar denominated leveraged loans. The index is calculated on a total return basis. The index is unmanaged, its returns do not reflect any fees, expenses, or sales charges, and
it is not available for direct investment.
Enterprise
value (“EV”)
EV is a measure of a
company’s total value, often used as a comprehensive alternative to equity market capitalization that includes debt.
Exchange-Traded Funds (“ETFs”)
An open-end fund that is traded on a stock exchange. Most ETFs
have a portfolio of stocks or bonds that track a specific market index.
Federal Reserve (the “Fed”)
The central bank of the United States, responsible for
controlling the money supply, interest rates and credit with the goal of keeping the U.S. economy and currency stable. Governed by a seven-member board, the system includes 12 regional Federal Reserve Banks, 25 branches and all national and state
banks that are part of the system.
ICE BofA BB-B U.S.
High Yield Constrained Index
The ICE BofA BB-B U.S. High
Yield Constrained Index measures performance of BB/B U.S. dollar denominated corporate bonds publicly issued in the U.S. domestic market, and is restricted to a maximum of 2% per issuer. The index is calculated on a total return basis. The index is
unmanaged, its returns do not reflect any fees, expenses, or sales charges, and it is not available for direct investment.
KEY INVESTMENT TERMS
(Unaudited) (Continued)
January 31, 2025
ICE BofA U.S. Convertibles Index
The ICE BofA U.S. Convertibles Index tracks the performance of
publicly issued U.S. dollar denominated convertible securities of U.S. companies. The index is calculated on a total return basis. The index is unmanaged, its returns do not reflect any fees, expenses, or sales charges, and it is not available for
direct investment.
ICE BofA U.S. High Yield Index
The ICE BofA U.S. High Yield Index tracks the performance of
below investment grade U.S. dollar denominated corporate bonds publicly issued in the U.S. domestic market and includes issues with a credit rating of BBB or below. The index is calculated on a total return basis. The index is unmanaged, its returns
do not reflect any fees, expenses, or sales charges, and it is not available for direct investment.
Leveraged Loan
Leveraged loans (also known as bank, senior or floating-rate
loans) consists of below investment-grade credit quality loans that are arranged by banks and other financial institutions to help companies finance acquisitions, recapitalizations, or other highly leveraged transactions. Such loans may be
especially vulnerable to adverse changes in economic or market conditions, although they are senior in the capital structure which typically provides investors/lenders a degree of potential credit risk protection.
Master Limited Partnerships (“MLPs”)
An investment in MLP units involves some risks that differ from
an investment in the common stock of a corporation. Holders of MLP units have limited control on matters affecting the partnership.
MSCI All Country World Index (net)
The MSCI All Country World Index (net) is a free float-adjusted
market capitalization-weighted index that measures equity performance of developed and emerging markets. The index is calculated on a total return basis with net dividends reinvested. The index is unmanaged, its returns do not reflect any fees,
expenses, or sales charges, and it is not available for direct investment.
MSCI EAFE® Index (net)
The MSCI EAFE® (Europe, Australasia, Far East) Index (net) is a free float-adjusted market capitalization-weighted index that measures developed foreign market equity performance, excluding
the U.S. and Canada. The index is calculated on a total return basis with net dividends reinvested. The index is unmanaged, its returns do not reflect any fees, expenses, or sales charges, and it is not available for direct investment.
MSCI Emerging Markets Index (net)
The MSCI Emerging Markets Index (net) is a free float-adjusted
market capitalization-weighted index designed to measure equity market performance in the global emerging markets. The index is calculated on a total return basis with net dividends reinvested. The index is unmanaged, its returns do not reflect any
fees, expenses, or sales charges, and it is not available for direct investment.
Real Estate Investment Trust (“REIT”)
A publicly traded company that owns, develops and operates
income-producing real estate such as apartments, office buildings, hotels, shopping centers and other commercial properties.
Risk Assets
Risk assets are those that tend to demonstrate price
volatility, such as equities, high-yield bonds, currencies and commodities.
Russell 1000® Growth Index
The Russell 1000® Growth Index is a market capitalization-weighted index of growth-oriented stocks of the 1,000 largest companies in the Russell Universe, which comprises the 3,000 largest
U.S. companies. The index is calculated on a total return basis with dividends reinvested. The index is unmanaged, its returns do not reflect any fees, expenses, or sales charges, and it is not available for direct investment.
Russell 1000® Value Index
The Russell 1000® Value Index is a market capitalization-weighted index of value-oriented stocks of the 1,000 largest companies in the Russell Universe, which comprises the 3,000 largest U.S.
companies. The index is calculated on a total return basis with dividends reinvested. The index is unmanaged, its returns do not reflect any fees, expenses, or sales charges, and it is not available for direct investment.
Russell 2000® Index
The Russell 2000® Index is a market capitalization-weighted index of the 2,000 smallest companies in the Russell Universe, which comprises the 3,000 largest U.S. companies. The index is
calculated on a total return basis with dividends reinvested. The index is unmanaged, its returns do not reflect any fees, expenses, or sales charges, and it is not available for direct investment.
Secured Overnight Financing Rate (“SOFR”)
A broad measure of the cost of borrowing cash overnight
collateralized by U.S. Treasury securities.
S&P 500® Index
The S&P 500® Index is a free-float market capitalization-weighted index of 500 of the largest U.S. companies. The index is calculated on a total return basis with dividends reinvested.
The index is unmanaged, its returns do not reflect any fees, expenses, or sales charges, and it is not available for direct investment.
KEY INVESTMENT TERMS
(Unaudited) (Continued)
January 31, 2025
Yield Curve
A yield curve is a line on a graph plotting the interest rates,
at a set point in time, of bonds having equal credit quality but different maturity dates.
Artificial Intelligence
& Technology Opportunities Fund (AIO)
SCHEDULE OF INVESTMENTS
January 31, 2025
($ reported in thousands)
| |
Par
Value |
|
Value
|
| Convertible
Bonds and Notes—31.2% |
| Auto
Manufacturers—1.2% |
|
|
Rivian
Automotive, Inc.
4.625%, 3/15/29(1) |
$ 9,575
|
|
$ 9,501
|
| Commercial
Services—3.3% |
|
|
Affirm
Holdings, Inc. 144A
0.750%, 12/15/29(2) |
5,550
|
|
5,425
|
Global
Payments, Inc. 144A
1.500%, 3/1/31(1)(2) |
9,200
|
|
9,007
|
Shift4
Payments, Inc.
0.500%, 8/1/27(1)(3) |
10,575
|
|
12,383
|
| |
|
|
26,815
|
| |
|
|
|
| |
| Computers—2.5%
|
|
|
Lumentum
Holdings, Inc.
0.500%, 12/15/26(1) |
10,120
|
|
11,342
|
Western
Digital Corp.
3.000%, 11/15/28 |
6,315
|
|
8,887
|
| |
|
|
20,229
|
| |
|
|
|
| |
| Diversified
REITS—1.2% |
|
|
Digital
Realty Trust LP 144A
1.875%, 11/15/29(2) |
9,890
|
|
9,984
|
| Electronics—0.5%
|
|
|
Itron,
Inc. 144A
1.375%, 7/15/30(2) |
4,150
|
|
4,324
|
| Entertainment—1.4%
|
|
|
Live
Nation Entertainment, Inc. 144A
2.875%, 1/15/30(2) |
10,525
|
|
10,957
|
| Financial
Services—0.7% |
|
|
Galaxy
Digital Holdings LP 144A
2.500%, 12/1/29(2) |
5,165
|
|
5,633
|
| Health
Care REITs—1.3% |
|
|
Welltower
OP LLC 144A
3.125%, 7/15/29(2) |
9,105
|
|
10,867
|
| Healthcare-Products—0.7%
|
|
|
iRhythm
Technologies, Inc. 144A
1.500%, 9/1/29(2)(3) |
5,600
|
|
5,891
|
| Internet—5.5%
|
|
|
Sea
Ltd.
2.375%, 12/1/25 |
5,825
|
|
8,132
|
Shopify,
Inc.
0.125%, 11/1/25(1) |
5,725
|
|
5,991
|
Trip.com
Group Ltd. 144A
0.750%, 6/15/29(2) |
9,320
|
|
11,683
|
Uber
Technologies, Inc.
0.000%, 12/15/25 |
10,195
|
|
10,606
|
Zillow
Group, Inc.
2.750%, 5/15/25 |
6,425
|
|
8,018
|
| |
|
|
44,430
|
| |
|
|
|
| |
| |
Par
Value |
|
Value
|
| |
|
|
|
| Leisure
Time—1.5% |
|
|
NCL
Corp., Ltd.
2.500%, 2/15/27(1)(3) |
$ 11,185
|
|
$
12,253 |
| Media—1.1%
|
|
|
Liberty
Media Corp.-Liberty Formula One
2.250%, 8/15/27 |
7,210
|
|
9,089
|
| Semiconductors—3.8%
|
|
|
MACOM
Technology Solutions Holdings, Inc. 144A
0.000%, 12/15/29(2)(4) |
9,705
|
|
9,812
|
ON
Semiconductor Corp.
0.500%, 3/1/29(1) |
8,795
|
|
7,901
|
Semtech
Corp.
1.625%, 11/1/27(1)(3) |
6,710
|
|
12,697
|
| |
|
|
30,410
|
| |
|
|
|
| |
| Software—5.9%
|
|
|
Bentley
Systems, Inc.
0.125%, 1/15/26 |
3,915
|
|
3,833
|
BILL
Holdings, Inc. 144A
0.000%, 4/1/30(2) |
5,795
|
|
6,186
|
Cloudflare,
Inc.
0.000%, 8/15/26(4) |
8,475
|
|
8,726
|
Datadog,
Inc. 144A
0.000%, 12/1/29(2)(4) |
7,725
|
|
7,563
|
Guidewire
Software, Inc. 144A
1.250%, 11/1/29(2) |
7,000
|
|
7,577
|
Snowflake,
Inc. 144A
0.000%, 10/1/29(2) |
4,715
|
|
6,254
|
Tyler
Technologies, Inc.
0.250%, 3/15/26(1) |
5,835
|
|
7,300
|
| |
|
|
47,439
|
| |
|
|
|
| |
| Telecommunications—0.6%
|
|
|
Applied
Digital Corp. 144A
2.750%, 6/1/30(2)(3) |
4,470
|
|
4,478
|
Total
Convertible Bonds and Notes
(Identified Cost $231,376) |
|
252,300
|
| |
|
|
|
| |
| |
|
|
|
| |
| Corporate
Bonds and Notes—17.3% |
| Computers—1.9%
|
|
|
NCR
Voyix Corp. 144A
5.125%, 4/15/29(1)(2) |
6,225
|
|
5,937
|
Seagate
HDD Cayman
8.500%, 7/15/31(1) |
9,175
|
|
9,822
|
| |
|
|
15,759
|
| |
|
|
|
| |
| Diversified
REITS—1.4% |
|
|
Iron
Mountain, Inc. 144A
7.000%, 2/15/29(1)(2) |
11,005
|
|
11,319
|
| Electronic
Equipment, Instruments & Components—1.2% |
|
|
WESCO
Distribution, Inc. 144A
7.250%, 6/15/28(1)(2) |
9,885
|
|
10,072
|
See Notes to Financial Statements
Artificial Intelligence
& Technology Opportunities Fund (AIO)
SCHEDULE OF INVESTMENTS
(Continued)
January 31, 2025
($ reported in
thousands)
| |
Par
Value |
|
Value
|
| |
|
|
|
| Electronics—0.9%
|
|
|
Coherent
Corp. 144A
5.000%, 12/15/29(1)(2) |
$ 8,000
|
|
$
7,699 |
| Entertainment—1.0%
|
|
|
Caesars
Entertainment, Inc. 144A
6.000%, 10/15/32(1)(2)(3) |
8,000
|
|
7,781
|
| Food
& Beverage—1.1% |
|
|
Performance
Food Group, Inc. 144A
6.125%, 9/15/32(1)(2) |
8,800
|
|
8,819
|
| Healthcare-Services—1.2%
|
|
|
Tenet
Healthcare Corp.
6.125%, 10/1/28(1) |
9,845
|
|
9,850
|
| Internet—1.2%
|
|
|
Gen
Digital, Inc. 144A
7.125%, 9/30/30(1)(2)(3) |
9,250
|
|
9,517
|
| Lodging—1.3%
|
|
|
Hilton
Grand Vacations Borrower LLC 144A
5.000%, 6/1/29(1)(2) |
10,815
|
|
10,303
|
| Machinery-Diversified—1.2%
|
|
|
Chart
Industries, Inc. 144A
9.500%, 1/1/31(1)(2) |
8,700
|
|
9,380
|
| Semiconductors—2.6%
|
|
|
Amkor
Technology, Inc. 144A
6.625%, 9/15/27(1)(2) |
7,550
|
|
7,566
|
Entegris,
Inc. 144A
5.950%, 6/15/30(1)(2) |
9,850
|
|
9,818
|
Qorvo,
Inc.
4.375%, 10/15/29 |
3,775
|
|
3,569
|
| |
|
|
20,953
|
| |
|
|
|
| |
| Software—1.1%
|
|
|
UKG,
Inc. 144A
6.875%, 2/1/31(1)(2) |
8,560
|
|
8,739
|
| Transportation—1.2%
|
|
|
XPO,
Inc. 144A
7.125%, 6/1/31(1)(2) |
9,550
|
|
9,868
|
Total
Corporate Bonds and Notes
(Identified Cost $138,105) |
|
140,059
|
| |
Shares
|
|
| Convertible
Preferred Stocks—3.1% |
| Aerospace
& Defense—1.7% |
|
| Boeing
Co. (The), 6.000% |
220,670
|
13,238
|
| Technology
Hardware, Storage & Peripherals—1.4% |
|
| Hewlett
Packard Enterprise Co., 7.625% |
189,895
|
11,608
|
Total
Convertible Preferred Stocks
(Identified Cost $22,818) |
24,846
|
| |
|
|
| |
| |
|
|
| |
| |
Shares
|
|
Value
|
| |
|
|
|
| |
|
|
|
| Common
Stocks—60.4% |
| Banks—7.2%
|
|
|
| Bank
of America Corp.(1) |
350,995
|
|
$ 16,251
|
| Citigroup,
Inc. |
157,312
|
|
12,810
|
| JPMorgan
Chase & Co.(1) |
65,190
|
|
17,425
|
| Wells
Fargo & Co. |
147,090
|
|
11,591
|
| |
|
|
58,077
|
| |
|
|
|
| |
| Biotechnology—0.3%
|
|
|
| Natera,
Inc.(5) |
14,540
|
|
2,572
|
| Broadline
Retail—0.8% |
|
|
| Amazon.com,
Inc.(1)(5) |
26,645
|
|
6,333
|
| Capital
Markets—1.9% |
|
|
| Goldman
Sachs Group, Inc. (The) |
8,030
|
|
5,143
|
| Morgan
Stanley |
75,080
|
|
10,393
|
| |
|
|
15,536
|
| |
|
|
|
| |
| Communications
Equipment—3.6% |
|
|
| Arista
Networks, Inc.(1)(5) |
169,850
|
|
19,572
|
| Motorola
Solutions, Inc. |
20,605
|
|
9,669
|
| |
|
|
29,241
|
| |
|
|
|
| |
| Electric
Utilities—1.1% |
|
|
| Constellation
Energy Corp. |
28,440
|
|
8,531
|
| Electrical
Equipment—0.4% |
|
|
| Emerson
Electric Co. |
22,490
|
|
2,923
|
| Electronic
Equipment, Instruments & Components—3.9% |
|
|
| Amphenol
Corp. Class A |
138,715
|
|
9,818
|
| Celestica,
Inc.(5) |
42,260
|
|
5,218
|
| Flex
Ltd.(5) |
389,785
|
|
16,235
|
| |
|
|
31,271
|
| |
|
|
|
| |
| Energy
Equipment & Services—0.6% |
|
|
| Baker
Hughes Co. Class A |
103,805
|
|
4,794
|
| Entertainment—1.5%
|
|
|
| Netflix,
Inc.(5) |
3,795
|
|
3,707
|
| Walt
Disney Co. (The) |
74,795
|
|
8,456
|
| |
|
|
12,163
|
| |
|
|
|
| |
| Healthcare
Equipment & Supplies—3.5% |
|
|
| Boston
Scientific Corp.(1)(5) |
156,365
|
|
16,005
|
| Intuitive
Surgical, Inc.(5) |
8,515
|
|
4,870
|
| Stryker
Corp. |
19,355
|
|
7,573
|
| |
|
|
28,448
|
| |
|
|
|
| |
| Healthcare
Providers & Services—1.8% |
|
|
| McKesson
Corp. |
16,205
|
|
9,638
|
| UnitedHealth
Group, Inc. |
9,640
|
|
5,230
|
| |
|
|
14,868
|
| |
|
|
|
| |
See
Notes to Financial Statements
Artificial Intelligence
& Technology Opportunities Fund (AIO)
SCHEDULE OF INVESTMENTS
(Continued)
January 31, 2025
($ reported in
thousands)
| |
Shares
|
|
Value
|
| |
|
|
|
| Hotels,
Restaurants & Leisure—4.2% |
|
|
| Chipotle
Mexican Grill, Inc. Class A(1)(5) |
145,840
|
|
$
8,510 |
| Hilton
Worldwide Holdings, Inc.(1) |
49,525
|
|
12,682
|
| Marriott
International, Inc. Class A |
26,355
|
|
7,658
|
| Royal
Caribbean Cruises Ltd. |
18,275
|
|
4,872
|
| |
|
|
33,722
|
| |
|
|
|
| |
| Insurance—1.6%
|
|
|
| Progressive
Corp. (The)(1) |
51,405
|
|
12,668
|
| Interactive
Media & Services—4.3% |
|
|
| Alphabet,
Inc. Class A |
51,555
|
|
10,518
|
| Meta
Platforms, Inc. Class A(1) |
35,365
|
|
24,373
|
| |
|
|
34,891
|
| |
|
|
|
| |
| Machinery—0.7%
|
|
|
| Parker-Hannifin
Corp. |
7,760
|
|
5,487
|
| Multi-Utilities—0.4%
|
|
|
| Public
Service Enterprise Group, Inc. |
36,825
|
|
3,076
|
| Pharmaceuticals—3.1%
|
|
|
| AstraZeneca
plc Sponsored ADR |
37,455
|
|
2,650
|
| Eli
Lilly & Co.(1) |
28,020
|
|
22,727
|
| |
|
|
25,377
|
| |
|
|
|
| |
| Semiconductors
& Semiconductor Equipment—8.6% |
|
|
| Broadcom,
Inc.(1) |
97,530
|
|
21,580
|
| NVIDIA
Corp.(1) |
263,420
|
|
31,629
|
| NXP
Semiconductors N.V.(3) |
17,975
|
|
3,749
|
| Taiwan
Semiconductor Manufacturing Co., Ltd. Sponsored ADR |
59,435
|
|
12,441
|
| |
|
|
69,399
|
| |
|
|
|
| |
| Software—8.5%
|
|
|
| Atlassian
Corp. Class A(5) |
30,230
|
|
9,274
|
| Cadence
Design Systems, Inc.(5) |
17,325
|
|
5,156
|
| Microsoft
Corp.(1) |
36,550
|
|
15,170
|
| Oracle
Corp. |
110,405
|
|
18,775
|
| Salesforce,
Inc. |
26,420
|
|
9,028
|
| ServiceNow,
Inc.(1)(5) |
10,855
|
|
11,055
|
| |
|
|
68,458
|
| |
|
|
|
| |
| Specialized
REITs—0.6% |
|
|
| Equinix,
Inc. |
5,480
|
|
5,007
|
| Specialty
Retail—0.6% |
|
|
| Home
Depot, Inc. (The) |
12,275
|
|
5,057
|
| Technology
Hardware, Storage & Peripherals—0.6% |
|
|
| Apple,
Inc. |
21,570
|
|
5,090
|
| Trading
Companies & Distributors—0.6% |
|
|
| United
Rentals, Inc. |
6,515
|
|
4,939
|
Total
Common Stocks
(Identified Cost $367,813) |
|
487,928
|
| |
|
|
|
| |
| |
|
|
|
| |
| |
Shares
|
|
Value
|
| |
|
|
|
| |
|
|
|
| Equity-Linked
Note—1.0% |
| Financial
Services—1.0% |
|
|
Goldman
Sachs Finance Corp.
4.000%, 9/28/26(6) |
6,380,000
|
|
$
8,443 |
Total
Equity-Linked Note
(Identified Cost $7,464) |
|
8,443
|
| |
|
|
|
| |
| |
|
|
|
| |
Total
Long-Term Investments—113.0%
(Identified Cost $767,576) |
|
913,576 |
| |
|
|
|
| |
| |
|
|
|
| |
| Short-Term
Investment—0.3% |
| Money
Market Mutual Fund—0.3% |
| BlackRock
Liquidity FedFund - Institutional Shares (seven-day effective yield 4.262%)(7) |
2,505,372
|
|
2,505
|
Total
Short-Term Investment
(Identified Cost $2,505) |
|
2,505
|
| |
|
|
|
| |
| |
|
|
|
| |
| Securities
Lending Collateral—0.3% |
| Dreyfus
Government Cash Management Fund - Institutional Shares (seven-day effective yield 4.264%)(7)(8) |
2,282,366
|
|
2,282
|
Total
Securities Lending Collateral
(Identified Cost $2,282) |
|
2,282
|
| |
|
|
|
| |
| |
|
|
|
| |
TOTAL
INVESTMENTS—113.6%
(Identified Cost $772,363) |
|
$
918,363 |
| Other
assets and liabilities, net—(13.6)% |
|
(109,979)
|
| NET
ASSETS—100.0% |
|
$
808,384 |
| Abbreviations:
|
| ADR
|
American
Depositary Receipt |
| LLC
|
Limited
Liability Company |
| LP
|
Limited
Partnership |
| OP
|
Operating
Partnership |
| plc
|
Public
Limited Company |
| REIT
|
Real
Estate Investment Trust |
| Footnote
Legend: |
|
(1) |
All
or a portion of securities is segregated as collateral for the Liquidity Facility. The value of securities segregated as collateral is $189,429. |
|
(2) |
Security
exempt from registration under Rule 144A of the Securities Act of 1933. These securities may be resold in transactions exempt from registration, normally to qualified institutional buyers. At January 31, 2025, these securities amounted to a value
of $232,459 or 28.8% of net assets. |
|
(3) |
All
or a portion of security is on loan pursuant to the Liquidity Facility and/or securities lending. |
|
(4) |
Issued
with a zero coupon. Income is recognized through the accretion of discount. |
|
(5) |
Non-income
producing. |
|
(6) |
The
value of this security was determined using significant unobservable inputs and is reported as a Level 3 security in the Fair Value Hierarchy table located after the Schedule of Investments. |
|
(7) |
Shares
of this fund are publicly offered, and its prospectus and annual report are publicly available. |
|
(8) |
Represents
security purchased with cash collateral received for securities on loan. |
For information regarding the abbreviations, see the Key
Investment Terms starting on page 16.
See Notes to Financial Statements
Artificial Intelligence
& Technology Opportunities Fund (AIO)
SCHEDULE OF INVESTMENTS
(Continued)
January 31, 2025
($ reported in
thousands)
| Country
Weightings (Unaudited)† |
| United
States |
90%
|
| Cayman
Islands |
4
|
| Singapore
|
2
|
| Taiwan
|
1
|
| Bermuda
|
1
|
| Canada
|
1
|
| Netherlands
|
1
|
| Total
|
100%
|
|
† % of total investments as of January 31, 2025. |
The following table summarizes the value of the
Fund’s investments as of January 31, 2025, based on the inputs used to value them (See Security Valuation Note 2A in the Notes to Financial Statements):
| |
Total
Value at
January 31, 2025 |
|
Level
1
Quoted Prices |
|
Level
2
Significant
Observable
Inputs |
|
Level
3
Significant
Unobservable
Inputs |
| Assets:
|
|
|
|
|
|
|
|
| Debt
Instruments: |
|
|
|
|
|
|
|
| Convertible
Bonds and Notes |
$252,300
|
|
$
— |
|
$252,300
|
|
$
— |
| Corporate
Bonds and Notes |
140,059
|
|
—
|
|
140,059
|
|
—
|
| Equity
Securities: |
|
|
|
|
|
|
|
| Convertible
Preferred Stocks |
24,846
|
|
24,846
|
|
—
|
|
—
|
| Common
Stocks |
487,928
|
|
487,928
|
|
—
|
|
—
|
| Equity-Linked
Note |
8,443
|
|
—
|
|
—
|
|
8,443
|
| Money
Market Mutual Fund |
2,505
|
|
2,505
|
|
—
|
|
—
|
| Securities
Lending Collateral |
2,282
|
|
2,282
|
|
—
|
|
—
|
| Total
Investments |
$918,363
|
|
$517,561
|
|
$392,359
|
|
$8,443
|
There were no transfers into
or out of Level 3 related to securities held at January 31, 2025.
Some of the Fund’s investments that were
categorized as Level 3 may have been valued utilizing third party pricing information without adjustment. If applicable, such valuations
are based on unobservable inputs. A significant change in third party information could result in a
significantly lower or higher value of Level 3 investments.
The following is a reconciliation of assets of the Fund
for Level 3 investments for which significant unobservable inputs were used to determine fair value.
| |
Total
|
|
Convertible
Bonds
And Notes |
|
Equity-Linked
Notes |
| Investments
in Securities |
|
|
|
|
|
| Balance
as of January 31, 2024: |
$
26,504 |
|
$
10,555 |
|
$
15,949 |
| Net
realized gain (loss) |
(1,204)
|
|
(456)
|
|
(748)
|
| Net
change in unrealized appreciation (depreciation)(a) |
630
|
|
223
|
|
407
|
| Purchases
|
3,824
|
|
—
|
|
3,824
|
| Sales
(b) |
(21,311)
|
|
(10,322)
|
|
(10,989)
|
| Balance
as of January 31, 2025 |
$
8,443 |
|
$
— |
|
$
8,443 |
(a) The net change in unrealized appreciation (depreciation) on investments still held at January 31, 2025, was $(312).
(b) Includes paydowns on securities.
See Notes to
Financial Statements
Convertible & Income
Fund (NCV)
SCHEDULE OF INVESTMENTS
January 31, 2025
($ reported in thousands)
| |
Par
Value |
|
Value
|
| Convertible
Bonds and Notes—79.4% |
| Aerospace
& Defense—0.6% |
|
|
Rocket
Lab USA, Inc. 144A
4.250%, 2/1/29(1) |
$ 360
|
|
$ 2,062
|
| Auto
Manufacturers—1.5% |
|
|
| Rivian
Automotive, Inc. |
|
|
|
| 4.625%,
3/15/29 |
2,545
|
|
2,525
|
| 3.625%,
10/15/30 |
3,045
|
|
2,712
|
| |
|
|
5,237
|
| |
|
|
|
| |
| Biotechnology—4.9%
|
|
|
Alnylam
Pharmaceuticals, Inc.
1.000%, 9/15/27 |
3,595
|
|
4,120
|
Bridgebio
Pharma, Inc.
2.500%, 3/15/27 |
1,910
|
|
2,169
|
Halozyme
Therapeutics, Inc.
0.250%, 3/1/27 |
3,370
|
|
3,389
|
Insmed,
Inc.
0.750%, 6/1/28 |
1,215
|
|
2,911
|
PTC
Therapeutics, Inc.
1.500%, 9/15/26 |
1,485
|
|
1,671
|
Sarepta
Therapeutics, Inc.
1.250%, 9/15/27 |
1,465
|
|
1,569
|
Travere
Therapeutics, Inc.
2.250%, 3/1/29 |
1,670
|
|
1,693
|
| |
|
|
17,522
|
| |
|
|
|
| |
| Commercial
Services—2.8% |
|
|
Affirm
Holdings, Inc. 144A
0.750%, 12/15/29(1) |
2,905
|
|
2,839
|
Global
Payments, Inc. 144A
1.500%, 3/1/31(1)(2) |
3,190
|
|
3,123
|
Shift4
Payments, Inc.
0.500%, 8/1/27 |
3,355
|
|
3,929
|
| |
|
|
9,891
|
| |
|
|
|
| |
| Computers—4.0%
|
|
|
Lumentum
Holdings, Inc.
0.500%, 12/15/26 |
4,240
|
|
4,752
|
PAR
Technology Corp.
1.500%, 10/15/27 |
2,345
|
|
2,732
|
Seagate
HDD Cayman
3.500%, 6/1/28 |
2,080
|
|
2,684
|
Western
Digital Corp.
3.000%, 11/15/28 |
1,805
|
|
2,540
|
Zscaler,
Inc.
0.125%, 7/1/25 |
1,025
|
|
1,399
|
| |
|
|
14,107
|
| |
|
|
|
| |
| Diversified
REITS—1.0% |
|
|
Digital
Realty Trust LP 144A
1.875%, 11/15/29(1) |
3,600
|
|
3,634
|
| Electric
Utilities—5.3% |
|
|
NextEra
Energy Capital Holdings, Inc. 144A
3.000%, 3/1/27(1) |
4,105
|
|
4,735
|
NRG
Energy, Inc.
2.750%, 6/1/48 |
485
|
|
1,209
|
| |
Par
Value |
|
Value
|
| |
|
|
|
| Electric
Utilities—continued |
|
|
PG&E
Corp.
4.250%, 12/1/27 |
$ 7,150
|
|
$ 7,275
|
Southern
Co. (The)
3.875%, 12/15/25 |
5,205
|
|
5,491
|
| |
|
|
18,710
|
| |
|
|
|
| |
| Electronics—1.9%
|
|
|
Advanced
Energy Industries, Inc.
2.500%, 9/15/28 |
2,115
|
|
2,319
|
Itron,
Inc. 144A
1.375%, 7/15/30(1) |
725
|
|
755
|
OSI
Systems, Inc. 144A
2.250%, 8/1/29(1) |
3,120
|
|
3,732
|
| |
|
|
6,806
|
| |
|
|
|
| |
| Energy-Alternate
Sources—0.1% |
|
|
Sunrun,
Inc. 144A
4.000%, 3/1/30(1) |
510
|
|
443
|
| Engineering
& Construction—1.5% |
|
|
Fluor
Corp.
1.125%, 8/15/29(2) |
1,375
|
|
1,709
|
Granite
Construction, Inc. 144A
3.250%, 6/15/30(1)(2) |
2,685
|
|
3,532
|
| |
|
|
5,241
|
| |
|
|
|
| |
| Entertainment—3.1%
|
|
|
Cinemark
Holdings, Inc.
4.500%, 8/15/25 |
515
|
|
1,034
|
IMAX
Corp.
0.500%, 4/1/26 |
2,400
|
|
2,490
|
Live
Nation Entertainment, Inc. 144A
2.875%, 1/15/30(1) |
7,160
|
|
7,453
|
| |
|
|
10,977
|
| |
|
|
|
| |
| Financial
Services—4.4% |
|
|
Coinbase
Global, Inc.
0.500%, 6/1/26 |
4,295
|
|
4,767
|
Encore
Capital Group, Inc.
4.000%, 3/15/29 |
1,915
|
|
1,981
|
Galaxy
Digital Holdings LP 144A
2.500%, 12/1/29(1) |
2,875
|
|
3,136
|
SoFi
Technologies, Inc. 144A
0.000%, 10/15/26(1) |
3,120
|
|
3,313
|
Upstart
Holdings, Inc. 144A
1.000%, 11/15/30(1)(2) |
2,660
|
|
2,635
|
| |
|
|
15,832
|
| |
|
|
|
| |
| Health
Care REITs—2.3% |
|
|
Welltower
OP LLC 144A
3.125%, 7/15/29(1) |
6,815
|
|
8,134
|
| Healthcare-Products—5.4%
|
|
|
Alphatec
Holdings, Inc.
0.750%, 8/1/26 |
1,755
|
|
1,782
|
Envista
Holdings Corp.
2.375%, 6/1/25 |
1,600
|
|
1,728
|
See Notes to Financial Statements
Convertible & Income
Fund (NCV)
SCHEDULE OF INVESTMENTS (Continued)
January 31, 2025
($ reported in
thousands)
| |
Par
Value |
|
Value
|
| |
|
|
|
| Healthcare-Products—continued
|
|
|
Exact
Sciences Corp. 144A
1.750%, 4/15/31(1) |
$ 2,925
|
|
$ 2,739
|
Insulet
Corp.
0.375%, 9/1/26 |
2,425
|
|
3,212
|
iRhythm
Technologies, Inc. 144A
1.500%, 9/1/29(1)(2) |
2,630
|
|
2,766
|
Lantheus
Holdings, Inc.
2.625%, 12/15/27(2) |
330
|
|
448
|
LeMaitre
Vascular, Inc. 144A
2.500%, 2/1/30(1) |
1,700
|
|
1,803
|
Merit
Medical Systems, Inc. 144A
3.000%, 2/1/29(1) |
1,940
|
|
2,685
|
Repligen
Corp.
1.000%, 12/15/28 |
1,300
|
|
1,405
|
Tandem
Diabetes Care, Inc. 144A
1.500%, 3/15/29(1)(2) |
510
|
|
672
|
| |
|
|
19,240
|
| |
|
|
|
| |
| Industrial
REITs—0.4% |
|
|
Rexford
Industrial Realty LP 144A
4.375%, 3/15/27(1) |
1,500
|
|
1,489
|
| Internet—8.5%
|
|
|
Alibaba
Group Holding Ltd. 144A
0.500%, 6/1/31(1) |
1,155
|
|
1,350
|
Booking
Holdings, Inc.
0.750%, 5/1/25 |
1,000
|
|
2,519
|
Magnite,
Inc.
0.250%, 3/15/26 |
1,735
|
|
1,622
|
Palo
Alto Networks, Inc.
0.375%, 6/1/25 |
450
|
|
1,668
|
Q2
Holdings, Inc.
0.750%, 6/1/26 |
2,195
|
|
2,619
|
Sea
Ltd.
2.375%, 12/1/25 |
1,800
|
|
2,513
|
Shopify,
Inc.
0.125%, 11/1/25(2) |
2,510
|
|
2,627
|
Snap,
Inc.
0.750%, 8/1/26(2) |
2,055
|
|
2,020
|
Trip.com
Group Ltd. 144A
0.750%, 6/15/29(1) |
2,670
|
|
3,347
|
Uber
Technologies, Inc.
0.000%, 12/15/25(3) |
4,835
|
|
5,030
|
| Wayfair,
Inc. |
|
|
|
| 1.000%,
8/15/26 |
1,660
|
|
1,529
|
| 3.250%,
9/15/27(2) |
1,415
|
|
1,575
|
Zillow
Group, Inc.
2.750%, 5/15/25(2) |
1,465
|
|
1,828
|
| |
|
|
30,247
|
| |
|
|
|
| |
| Investment
Companies—1.0% |
|
|
IREN
Ltd. 144A
3.250%, 6/15/30(1)(2) |
1,820
|
|
1,716
|
MARA
Holdings, Inc. 144A
0.000%, 6/1/31(1) |
2,115
|
|
1,792
|
| |
|
|
3,508
|
| |
|
|
|
| |
| |
Par
Value |
|
Value
|
| |
|
|
|
| Iron
& Steel—0.4% |
|
|
United
States Steel Corp.
5.000%, 11/1/26 |
$ 585
|
|
$ 1,621
|
| Leisure
Time—3.3% |
|
|
Carnival
Corp.
5.750%, 12/1/27 |
850
|
|
1,867
|
| NCL
Corp., Ltd. |
|
|
|
| 5.375%,
8/1/25 |
710
|
|
1,100
|
| 1.125%,
2/15/27 |
3,615
|
|
3,929
|
Peloton
Interactive, Inc. 144A
5.500%, 12/1/29(1) |
490
|
|
963
|
Royal
Caribbean Cruises Ltd.
6.000%, 8/15/25 |
720
|
|
3,849
|
| |
|
|
11,708
|
| |
|
|
|
| |
| Machinery-Construction
& Mining—0.5% |
|
|
Bloom
Energy Corp. 144A
3.000%, 6/1/29(1)(2) |
1,355
|
|
1,864
|
| Machinery-Diversified—0.5%
|
|
|
Middleby
Corp. (The)
1.000%, 9/1/25 |
1,255
|
|
1,686
|
| Media—1.6%
|
|
|
| Liberty
Broadband Corp. |
|
|
|
| 144A
3.125%, 3/31/53(1) |
1,645
|
|
1,628
|
| 144A
3.125%, 6/30/54(1)(2) |
1,745
|
|
1,927
|
Liberty
Media Corp.-Liberty Formula One
2.250%, 8/15/27 |
1,590
|
|
2,004
|
| |
|
|
5,559
|
| |
|
|
|
| |
| Metal
Fabricate/Hardware—0.8% |
|
|
Xometry,
Inc.
1.000%, 2/1/27(2) |
2,925
|
|
2,906
|
| Mining—1.0%
|
|
|
MP
Materials Corp. 144A
3.000%, 3/1/30(1) |
2,670
|
|
3,406
|
| Miscellaneous
Manufacturing—0.7% |
|
|
Axon
Enterprise, Inc.
0.500%, 12/15/27 |
825
|
|
2,356
|
| Oil,
Gas & Consumable Fuels—0.5% |
|
|
UGI
Corp. 144A
5.000%, 6/1/28(1) |
1,505
|
|
1,817
|
| Passenger
Airlines—1.5% |
|
|
American
Airlines Group, Inc.
6.500%, 7/1/25 |
3,965
|
|
4,514
|
JetBlue
Airways Corp. 144A
2.500%, 9/1/29(1)(2) |
630
|
|
802
|
| |
|
|
5,316
|
| |
|
|
|
| |
| Retail—2.5%
|
|
|
Burlington
Stores, Inc.
1.250%, 12/15/27(2) |
2,465
|
|
3,678
|
See Notes to Financial Statements
Convertible & Income
Fund (NCV)
SCHEDULE OF INVESTMENTS (Continued)
January 31, 2025
($ reported in
thousands)
| |
Par
Value |
|
Value
|
| |
|
|
|
| Retail—continued
|
|
|
Freshpet,
Inc.
3.000%, 4/1/28 |
$ 1,170
|
|
$ 2,776
|
Shake
Shack, Inc.
0.000%, 3/1/28 |
2,330
|
|
2,308
|
| |
|
|
8,762
|
| |
|
|
|
| |
| Retail
REIT—0.4% |
|
|
Federal
Realty OP LP 144A
3.250%, 1/15/29(1) |
1,595
|
|
1,620
|
| Semiconductors—2.6%
|
|
|
MACOM
Technology Solutions Holdings, Inc. 144A
0.000%, 12/15/29(1)(3) |
1,970
|
|
1,992
|
ON
Semiconductor Corp.
0.500%, 3/1/29 |
2,395
|
|
2,152
|
Semtech
Corp.
1.625%, 11/1/27 |
970
|
|
1,835
|
Synaptics,
Inc. 144A
0.750%, 12/1/31(1)(2) |
1,960
|
|
2,123
|
Wolfspeed,
Inc.
0.250%, 2/15/28 |
2,520
|
|
1,161
|
| |
|
|
9,263
|
| |
|
|
|
| |
| Software—13.4%
|
|
|
Akamai
Technologies, Inc.
0.125%, 5/1/25 |
1,920
|
|
2,083
|
Alignment
Healthcare, Inc. 144A
4.250%, 11/15/29(1)(2) |
2,620
|
|
3,365
|
BILL
Holdings, Inc. 144A
0.000%, 4/1/30(1) |
3,765
|
|
4,019
|
Cloudflare,
Inc.
0.000%, 8/15/26(3) |
3,700
|
|
3,810
|
Datadog,
Inc. 144A
0.000%, 12/1/29(1)(3) |
5,240
|
|
5,130
|
Guidewire
Software, Inc. 144A
1.250%, 11/1/29(1) |
3,640
|
|
3,940
|
HubSpot,
Inc.
0.375%, 6/1/25 |
1,080
|
|
2,969
|
| MicroStrategy,
Inc. |
|
|
|
| 144A
0.000%, 12/1/29(1)(3) |
7,005
|
|
6,081
|
| 144A
0.875%, 3/15/31(1) |
1,525
|
|
2,482
|
Nutanix,
Inc. 144A
0.500%, 12/15/29(1) |
3,690
|
|
3,834
|
Snowflake,
Inc. 144A
0.000%, 10/1/29(1) |
4,350
|
|
5,770
|
Tyler
Technologies, Inc.
0.250%, 3/15/26 |
1,290
|
|
1,614
|
Vertex,
Inc. 144A
0.750%, 5/1/29(1) |
1,490
|
|
2,511
|
| |
|
|
47,608
|
| |
|
|
|
| |
| Telecommunications—0.6%
|
|
|
Applied
Digital Corp. 144A
2.750%, 6/1/30(1)(2) |
770
|
|
772
|
Viavi
Solutions, Inc.
1.625%, 3/15/26 |
1,315
|
|
1,443
|
| |
|
|
2,215
|
| |
|
|
|
| |
| |
Par
Value |
|
Value
|
| |
|
|
|
| Transportation—0.4%
|
|
|
World
Kinect Corp.
3.250%, 7/1/28 |
$ 1,350
|
|
$
1,545 |
Total
Convertible Bonds and Notes
(Identified Cost $254,978) |
|
282,332
|
| |
|
|
|
| |
| |
|
|
|
| |
| Corporate
Bonds and Notes—58.8% |
| Aerospace
& Defense—3.5% |
|
|
AAR
Escrow Issuer LLC 144A
6.750%, 3/15/29(1) |
2,185
|
|
2,234
|
Bombardier,
Inc. 144A
7.500%, 2/1/29(1)(2) |
2,865
|
|
2,982
|
TransDigm,
Inc. 144A
7.125%, 12/1/31(1) |
4,770
|
|
4,925
|
Triumph
Group, Inc. 144A
9.000%, 3/15/28(1) |
2,114
|
|
2,216
|
| |
|
|
12,357
|
| |
|
|
|
| |
| Auto
Components—0.3% |
|
|
Goodyear
Tire & Rubber Co. (The)
5.250%, 7/15/31(2) |
1,295
|
|
1,187
|
| Automotive
Parts & Equipment—1.9% |
|
|
Adient
Global Holdings Ltd. 144A
8.250%, 4/15/31(1)(2) |
1,605
|
|
1,665
|
American
Axle & Manufacturing, Inc.
6.875%, 7/1/28(2) |
1,155
|
|
1,148
|
Clarios
Global LP 144A
8.500%, 5/15/27(1) |
2,460
|
|
2,472
|
Tenneco,
Inc. 144A
8.000%, 11/17/28(1) |
1,595
|
|
1,523
|
| |
|
|
6,808
|
| |
|
|
|
| |
| Building
Materials—2.0% |
|
|
Builders
FirstSource, Inc. 144A
6.375%, 6/15/32(1)(2) |
2,820
|
|
2,856
|
Quikrete
Holdings, Inc. 144A
6.750%, 3/1/33(1) |
2,020
|
|
2,025
|
Summit
Materials LLC 144A
7.250%, 1/15/31(1) |
2,140
|
|
2,309
|
| |
|
|
7,190
|
| |
|
|
|
| |
| Chemicals—1.0%
|
|
|
Chemours
Co. (The) 144A
8.000%, 1/15/33(1) |
1,705
|
|
1,691
|
Tronox,
Inc. 144A
4.625%, 3/15/29(1)(2) |
1,900
|
|
1,721
|
| |
|
|
3,412
|
| |
|
|
|
| |
| Commercial
Services—2.7% |
|
|
Avis
Budget Car Rental LLC 144A
8.000%, 2/15/31(1)(2) |
2,875
|
|
2,973
|
EquipmentShare.com,
Inc. 144A
8.625%, 5/15/32(1) |
2,995
|
|
3,192
|
See Notes to Financial Statements
Convertible & Income
Fund (NCV)
SCHEDULE OF INVESTMENTS (Continued)
January 31, 2025
($ reported in
thousands)
| |
Par
Value |
|
Value
|
| |
|
|
|
| Commercial
Services—continued |
|
|
Shift4
Payments LLC 144A
6.750%, 8/15/32(1) |
$ 3,380
|
|
$ 3,471
|
| |
|
|
9,636
|
| |
|
|
|
| |
| Computers—1.7%
|
|
|
McAfee
Corp. 144A
7.375%, 2/15/30(1) |
2,530
|
|
2,492
|
Seagate
HDD Cayman
8.500%, 7/15/31 |
3,145
|
|
3,367
|
| |
|
|
5,859
|
| |
|
|
|
| |
| Containers
& Packaging—0.9% |
|
|
Mauser
Packaging Solutions Holding Co. 144A
7.875%, 4/15/27(1) |
1,810
|
|
1,844
|
Trivium
Packaging Finance B.V. 144A
8.500%, 8/15/27(1) |
1,165
|
|
1,166
|
| |
|
|
3,010
|
| |
|
|
|
| |
| Diversified
REITS—1.3% |
|
|
| Iron
Mountain, Inc. |
|
|
|
| 144A
7.000%, 2/15/29(1) |
2,840
|
|
2,921
|
| 144A
6.250%, 1/15/33(1) |
1,725
|
|
1,728
|
| |
|
|
4,649
|
| |
|
|
|
| |
| Electronic
Equipment, Instruments & Components—0.8% |
|
|
WESCO
Distribution, Inc. 144A
7.250%, 6/15/28(1) |
2,785
|
|
2,838
|
| Electronics—0.5%
|
|
|
Coherent
Corp. 144A
5.000%, 12/15/29(1) |
1,780
|
|
1,713
|
| Entertainment—3.3%
|
|
|
Caesars
Entertainment, Inc. 144A
6.000%, 10/15/32(1)(2) |
3,600
|
|
3,501
|
Churchill
Downs, Inc. 144A
6.750%, 5/1/31(1) |
2,230
|
|
2,268
|
Light
& Wonder International, Inc. 144A
7.000%, 5/15/28(1) |
2,800
|
|
2,812
|
Lions
Gate Capital Holdings 1, Inc. 144A
5.500%, 4/15/29(1) |
1,455
|
|
1,299
|
SeaWorld
Parks & Entertainment, Inc. 144A
5.250%, 8/15/29(1) |
1,765
|
|
1,706
|
| |
|
|
11,586
|
| |
|
|
|
| |
| Environmental
Services—1.3% |
|
|
GFL
Environmental, Inc. 144A
6.750%, 1/15/31(1) |
2,630
|
|
2,729
|
Waste
Pro USA, Inc. 144A
7.000%, 2/1/33(1) |
1,735
|
|
1,754
|
| |
|
|
4,483
|
| |
|
|
|
| |
| Financial
Services—4.3% |
|
|
| Nationstar
Mortgage Holdings, Inc. |
|
|
|
| 144A
5.500%, 8/15/28(1) |
1,160
|
|
1,139
|
| 144A
7.125%, 2/1/32(1) |
4,520
|
|
4,659
|
| |
Par
Value |
|
Value
|
| |
|
|
|
| Financial
Services—continued |
|
|
Navient
Corp.
9.375%, 7/25/30 |
$ 1,475
|
|
$ 1,606
|
OneMain
Finance Corp.
9.000%, 1/15/29 |
3,190
|
|
3,388
|
PennyMac
Financial Services, Inc. 144A
7.875%, 12/15/29(1) |
2,330
|
|
2,440
|
PRA
Group, Inc. 144A
8.375%, 2/1/28(1) |
1,545
|
|
1,592
|
Synchrony
Financial
7.250%, 2/2/33 |
525
|
|
549
|
| |
|
|
15,373
|
| |
|
|
|
| |
| Food
& Beverage—1.5% |
|
|
Performance
Food Group, Inc. 144A
6.125%, 9/15/32(1) |
2,320
|
|
2,325
|
Post
Holdings, Inc. 144A
6.375%, 3/1/33(1) |
2,870
|
|
2,827
|
| |
|
|
5,152
|
| |
|
|
|
| |
| Healthcare-Products—0.9%
|
|
|
Medline
Borrower LP 144A
5.250%, 10/1/29(1) |
3,285
|
|
3,183
|
| Healthcare-Services—1.9%
|
|
|
Concentra
Escrow Issuer Corp. 144A
6.875%, 7/15/32(1) |
2,195
|
|
2,270
|
Tenet
Healthcare Corp.
6.125%, 10/1/28 |
4,550
|
|
4,552
|
| |
|
|
6,822
|
| |
|
|
|
| |
| Hotel
& Resort REITs—0.3% |
|
|
Park
Intermediate Holdings LLC 144A
5.875%, 10/1/28(1) |
1,165
|
|
1,152
|
| Insurance—0.8%
|
|
|
Panther
Escrow Issuer LLC 144A
7.125%, 6/1/31(1) |
2,930
|
|
3,000
|
| Internet—1.0%
|
|
|
Gen
Digital, Inc. 144A
7.125%, 9/30/30(1)(2) |
3,330
|
|
3,426
|
| Investment
Companies—0.8% |
|
|
Compass
Group Diversified Holdings LLC 144A
5.250%, 4/15/29(1) |
3,085
|
|
2,986
|
| Iron
& Steel—0.6% |
|
|
Cleveland-Cliffs,
Inc. 144A
7.000%, 3/15/32(1)(2) |
2,280
|
|
2,274
|
| Leisure
Time—2.6% |
|
|
Amer
Sports Co. 144A
6.750%, 2/16/31(1) |
2,220
|
|
2,280
|
Carnival
Corp. 144A
10.500%, 6/1/30(1) |
2,180
|
|
2,329
|
NCL
Corp., Ltd. 144A
6.750%, 2/1/32(1) |
2,220
|
|
2,255
|
See Notes to Financial Statements
Convertible & Income
Fund (NCV)
SCHEDULE OF INVESTMENTS (Continued)
January 31, 2025
($ reported in
thousands)
| |
Par
Value |
|
Value
|
| |
|
|
|
| Leisure
Time—continued |
|
|
Royal
Caribbean Cruises Ltd. 144A
6.250%, 3/15/32(1) |
$ 2,235
|
|
$ 2,274
|
| |
|
|
9,138
|
| |
|
|
|
| |
| Lodging—0.8%
|
|
|
Hilton
Grand Vacations Borrower LLC 144A
5.000%, 6/1/29(1) |
1,250
|
|
1,191
|
Station
Casinos LLC 144A
6.625%, 3/15/32(1) |
1,655
|
|
1,664
|
| |
|
|
2,855
|
| |
|
|
|
| |
| Machinery-Diversified—0.9%
|
|
|
Chart
Industries, Inc. 144A
7.500%, 1/1/30(1) |
3,200
|
|
3,343
|
| Media—4.8%
|
|
|
| CCO
Holdings LLC |
|
|
|
| 144A
6.375%, 9/1/29(1) |
1,700
|
|
1,701
|
| 144A
7.375%, 3/1/31(1)(2) |
2,295
|
|
2,350
|
Gray
Media, Inc. 144A
7.000%, 5/15/27(1) |
3,100
|
|
3,035
|
Nexstar
Media, Inc. 144A
5.625%, 7/15/27(1) |
2,120
|
|
2,091
|
Sirius
XM Radio LLC 144A
5.500%, 7/1/29(1) |
3,480
|
|
3,389
|
TEGNA,
Inc.
5.000%, 9/15/29 |
2,435
|
|
2,288
|
Virgin
Media Secured Finance plc 144A
5.500%, 5/15/29(1) |
2,425
|
|
2,322
|
| |
|
|
17,176
|
| |
|
|
|
| |
| Mining—1.0%
|
|
|
Arsenal
AIC Parent LLC 144A
8.000%, 10/1/30(1) |
1,620
|
|
1,684
|
Hudbay
Minerals, Inc. 144A
6.125%, 4/1/29(1) |
1,720
|
|
1,724
|
| |
|
|
3,408
|
| |
|
|
|
| |
| Oil,
Gas & Consumable Fuels—5.9% |
|
|
CITGO
Petroleum Corp. 144A
8.375%, 1/15/29(1) |
1,715
|
|
1,772
|
Civitas
Resources, Inc. 144A
8.750%, 7/1/31(1) |
2,825
|
|
2,979
|
CNX
Resources Corp. 144A
7.375%, 1/15/31(1)(2) |
2,335
|
|
2,396
|
Northern
Oil & Gas, Inc. 144A
8.750%, 6/15/31(1) |
1,650
|
|
1,730
|
Permian
Resources Operating LLC 144A
6.250%, 2/1/33(1) |
2,310
|
|
2,316
|
SM
Energy Co. 144A
7.000%, 8/1/32(1) |
2,275
|
|
2,272
|
Transocean
Titan Financing Ltd. 144A
8.375%, 2/1/28(1) |
2,390
|
|
2,449
|
USA
Compression Partners LP
6.875%, 9/1/27 |
2,285
|
|
2,299
|
| |
Par
Value |
|
Value
|
| |
|
|
|
| Oil,
Gas & Consumable Fuels—continued |
|
|
Weatherford
International Ltd. 144A
8.625%, 4/30/30(1) |
$ 2,710
|
|
$
2,811 |
| |
|
|
21,024
|
| |
|
|
|
| |
| Paper
& Forest Products—0.4% |
|
|
Mercer
International, Inc. 144A
5.125%, 2/1/29(1) |
1,470
|
|
1,304
|
| Pharmaceuticals—0.9%
|
|
|
Organon
& Co. 144A
7.875%, 5/15/34(1)(2) |
3,210
|
|
3,273
|
| Pipelines—0.5%
|
|
|
NGL
Energy Operating LLC 144A
8.375%, 2/15/32(1) |
1,745
|
|
1,795
|
| Retail—2.9%
|
|
|
Bath
& Body Works, Inc. 144A
6.625%, 10/1/30(1) |
1,175
|
|
1,196
|
Beacon
Roofing Supply, Inc. 144A
6.500%, 8/1/30(1) |
1,975
|
|
2,037
|
Group
1 Automotive, Inc. 144A
6.375%, 1/15/30(1) |
2,330
|
|
2,368
|
New
Red Finance, Inc. 144A
6.125%, 6/15/29(1) |
2,265
|
|
2,296
|
Patrick
Industries, Inc. 144A
6.375%, 11/1/32(1) |
2,300
|
|
2,268
|
| |
|
|
10,165
|
| |
|
|
|
| |
| Semiconductors—1.0%
|
|
|
Amkor
Technology, Inc. 144A
6.625%, 9/15/27(1) |
1,695
|
|
1,698
|
Entegris,
Inc. 144A
5.950%, 6/15/30(1) |
1,875
|
|
1,869
|
| |
|
|
3,567
|
| |
|
|
|
| |
| Software—1.0%
|
|
|
Central
Parent LLC 144A
8.000%, 6/15/29(1) |
1,690
|
|
1,637
|
UKG,
Inc. 144A
6.875%, 2/1/31(1) |
1,990
|
|
2,032
|
| |
|
|
3,669
|
| |
|
|
|
| |
| Telecommunications—0.8%
|
|
|
Frontier
Communications Holdings LLC 144A
8.750%, 5/15/30(1) |
2,845
|
|
3,006
|
| Transportation—2.0%
|
|
|
Fortress
Transportation & Infrastructure Investors LLC 144A
7.875%, 12/1/30(1) |
3,705
|
|
3,865
|
XPO,
Inc. 144A
7.125%, 6/1/31(1) |
3,150
|
|
3,255
|
| |
|
|
7,120
|
Total
Corporate Bonds and Notes
(Identified Cost $204,871) |
|
208,939
|
See Notes to Financial Statements
Convertible & Income
Fund (NCV)
SCHEDULE OF INVESTMENTS (Continued)
January 31, 2025
($ reported in
thousands)
| |
Shares
|
|
Value
|
| Convertible
Preferred Stocks—10.2% |
| Aerospace
& Defense—2.6% |
|
|
| Boeing
Co. (The), 6.000% |
156,900
|
|
$
9,412 |
| Banks—2.7%
|
|
|
| Wells
Fargo & Co. Series L, 7.500% |
8,130
|
|
9,666
|
| Capital
Markets—0.9% |
|
|
| Ares
Management Corp. Series B, 6.750% |
51,690
|
|
3,137
|
| Chemicals—0.4%
|
|
|
| Albemarle
Corp., 7.250% |
36,800
|
|
1,491
|
| Electric
Utilities—0.7% |
|
|
| NextEra
Energy, Inc., 6.926%(2) |
58,210
|
|
2,415
|
| Financial
Services—0.8% |
|
|
| Apollo
Global Management, Inc., 6.750% |
29,945
|
|
2,667
|
| Healthcare
Providers & Services—0.7% |
|
|
| BrightSpring
Health Services, Inc., 6.750% |
29,210
|
|
2,423
|
| Machinery—0.3%
|
|
|
| Chart
Industries, Inc. Series B, 6.750% |
15,765
|
|
1,226
|
| Software—0.2%
|
|
|
| MicroStrategy,
Inc., 8.000% |
9,075
|
|
735
|
| Technology
Hardware, Storage & Peripherals—0.9% |
|
|
| Hewlett
Packard Enterprise Co., 7.625% |
52,880
|
|
3,233
|
Total
Convertible Preferred Stocks
(Identified Cost $27,569) |
|
36,405
|
| |
|
|
|
| |
| |
|
|
|
| |
| Preferred
Stock—0.1% |
| Entertainment—0.1%
|
|
|
| LiveStyle,
Inc. Series B(4)(5)(6) |
4,196
|
|
419
|
Total
Preferred Stock
(Identified Cost $411) |
|
419
|
| |
|
|
|
| |
| |
|
|
|
| |
| Common
Stocks—0.1% |
| Banks—0.1%
|
|
|
| CCF
Holdings LLC(4)(5) |
7,808,320
|
|
391
|
| CCF
Holdings LLC Class M(4)(5) |
879,959
|
|
44
|
| |
|
|
435
|
| |
|
|
|
| |
| Consumer
Finance—0.0% |
|
|
| Erickson,
Inc.(4)(5) |
8,295
|
|
—
|
| Entertainment—0.0%
|
|
|
| LiveStyle,
Inc. (4)(5)(6) |
90,407
|
|
—
|
Total
Common Stocks
(Identified Cost $30,173) |
|
435
|
| |
|
|
|
| |
| |
|
|
|
| |
| |
Shares
|
|
Value
|
| |
|
|
|
| |
|
|
|
| Warrant—0.0%
|
| Banks—0.0%
|
|
|
| CCF
Holdings LLC, 3/25/26(4)(5) |
1,455,681
|
|
$
29 |
Total
Warrant
(Identified Cost $—) |
|
29
|
| |
|
|
|
| |
| |
|
|
|
| |
Total
Long-Term Investments—148.6%
(Identified Cost $518,002) |
|
528,559 |
| |
|
|
|
| |
| |
|
|
|
| |
| Short-Term
Investment—4.4% |
| Money
Market Mutual Fund—4.4% |
| BlackRock
Liquidity FedFund - Institutional Shares (seven-day effective yield 4.262%)(7) |
15,542,625
|
|
15,543
|
Total
Short-Term Investment
(Identified Cost $15,543) |
|
15,543
|
| |
|
|
|
| |
| |
|
|
|
| |
| Securities
Lending Collateral—2.8% |
| Dreyfus
Government Cash Management Fund - Institutional Shares (seven-day effective yield 4.264%)(7)(8) |
9,998,987
|
|
9,999
|
Total
Securities Lending Collateral
(Identified Cost $9,999) |
|
9,999
|
| |
|
|
|
| |
| |
|
|
|
| |
TOTAL
INVESTMENTS—155.8%
(Identified Cost $543,544) |
|
$
554,101 |
| Other
assets and liabilities, net—(27.7)% |
|
(98,565)
|
| Cumulative
Preferred Shares—(28.1)% |
|
(100,000)
|
| NET
ASSETS—100.0% |
|
$
355,536 |
| Abbreviations:
|
| LLC
|
Limited
Liability Company |
| LP
|
Limited
Partnership |
| OP
|
Operating
Partnership |
| OPM
|
Option
Pricing Model |
| plc
|
Public
Limited Company |
| REIT
|
Real
Estate Investment Trust |
| Footnote
Legend: |
|
(1) |
Security
exempt from registration under Rule 144A of the Securities Act of 1933. These securities may be resold in transactions exempt from registration, normally to qualified institutional buyers. At January 31, 2025, these securities amounted to a value
of $314,486 or 88.5% of net assets. |
|
(2) |
All
or a portion of security is on loan pursuant to the Liquidity Facility and/or securities lending. |
|
(3) |
Issued
with a zero coupon. Income is recognized through the accretion of discount. |
|
(4) |
The
value of this security was determined using significant unobservable inputs and is reported as a Level 3 security in the Fair Value Hierarchy table located after the Schedule of Investments. |
|
(5) |
Non-income
producing. |
|
(6) |
Security
is restricted from resale. |
|
(7) |
Shares
of this fund are publicly offered, and its prospectus and annual report are publicly available. |
|
(8) |
Represents
security purchased with cash collateral received for securities on loan. |
For information regarding the abbreviations, see the Key
Investment Terms starting on page 16.
See Notes to Financial Statements
Convertible & Income
Fund (NCV)
SCHEDULE OF INVESTMENTS (Continued)
January 31, 2025
($ reported in
thousands)
| Country
Weightings (Unaudited)† |
| United
States |
89%
|
| Cayman
Islands |
3
|
| Canada
|
3
|
| Bermuda
|
2
|
| Liberia
|
1
|
| Panama
|
1
|
| United
Kingdom |
1
|
| Total
|
100%
|
|
† % of total investments as of January 31, 2025. |
The following table summarizes the value of the
Fund’s investments as of January 31, 2025, based on the inputs used to value them (See Security Valuation Note 2A in the Notes to Financial Statements):
| |
Total
Value at
January 31, 2025 |
|
Level
1
Quoted Prices |
|
Level
2
Significant
Observable
Inputs |
|
Level
3
Significant
Unobservable
Inputs |
| Assets:
|
|
|
|
|
|
|
|
| Debt
Instruments: |
|
|
|
|
|
|
|
| Convertible
Bonds and Notes |
$282,332
|
|
$
— |
|
$282,332
|
|
$
— |
| Corporate
Bonds and Notes |
208,939
|
|
—
|
|
208,939
|
|
—
|
| Equity
Securities: |
|
|
|
|
|
|
|
| Convertible
Preferred Stocks |
36,405
|
|
36,405
|
|
—
|
|
—
|
| Preferred
Stock |
419
|
|
—
|
|
—
|
|
419
|
| Common
Stocks |
435
|
|
—
|
|
—
|
|
435
(1) |
| Warrant
|
29
|
|
—
|
|
—
|
|
29
|
| Money
Market Mutual Fund |
15,543
|
|
15,543
|
|
—
|
|
—
|
| Securities
Lending Collateral |
9,999
|
|
9,999
|
|
—
|
|
—
|
| Total
Investments |
$554,101
|
|
$61,947
|
|
$491,271
|
|
$883
|
|
(1) |
Includes
internally fair valued securities currently priced at zero ($0). |
There were no transfers into or out of Level 3 related
to securities held at January 31, 2025.
Some of
the Fund’s investments that were categorized as Level 3 may have been valued utilizing third party pricing information without adjustment. If applicable, such valuations are based on unobservable inputs. A significant change in third party
information could result in a significantly lower or higher value of Level 3 investments.
The following is a reconciliation of assets of the Fund
for Level 3 investments for which significant unobservable inputs were used to determine fair value.
| |
Total
|
|
Preferred
Stock |
|
Common
stocks |
|
Warrant
|
|
Convertible
Bonds
and Notes |
| Investments
in Securities |
|
|
|
|
|
|
|
|
|
| Balance
as of January 31, 2024: |
$
3,570 |
|
$ 419
|
|
$ 127
(a) |
|
$
—(a) |
|
$
3,024 |
| Net
realized gain (loss) |
(3,169)
|
|
—
|
|
—
|
|
(3,080)
|
|
(89)
|
| Net
change in unrealized appreciation (depreciation)(b) |
3,481
|
|
—
|
|
308
|
|
3,109
|
|
64
|
| Purchases
|
242
|
|
—
|
|
—
|
|
—
|
|
242
|
| Sales
(c) |
(3,241)
|
|
—
|
|
—
|
|
—
(d) |
|
(3,241)
|
| Balance
as of January 31, 2025 |
$
883 |
|
$ 419
|
|
$ 435
(a) |
|
$
29 |
|
$
— |
(a) Includes internally fair valued security currently priced at zero ($0).
(b) The net change in unrealized appreciation (depreciation) on investments still held at January 31, 2025, was $336.
(c) Includes paydowns on securities.
(d) Amount is less than $500 (not in thousands).
See
Notes to Financial Statements
Convertible & Income
Fund (NCV)
SCHEDULE OF INVESTMENTS (Continued)
January 31, 2025
($ reported in
thousands)
The following table presents additional information
about valuation techniques and inputs used for investments that are measured at fair value and categorized within Level 3 at January 31, 2025:
Investments
in
Securities – Assets |
|
Ending
Balance
at January 31, 2025 |
|
Valuation
Technique
Used |
|
Unobservable
Inputs |
|
Input
Values |
|
Impact
to Valuation
from an Increase in
Unobservable Inputs(a) |
| Preferred
Stock: |
|
|
|
|
|
|
|
|
|
|
| LiveStyle,
Inc.Series B |
|
$419
|
|
Discounted
cash flows
liquidation approach |
|
Discount rate |
|
21.61%
(21.34% - 21.85%) |
|
Decrease
|
| |
|
|
|
|
|
|
|
|
|
|
| |
|
|
|
|
|
|
|
|
|
|
| Common
Stocks: |
|
|
|
|
|
|
|
|
|
|
| CCF
Holdings LLC |
|
$391
|
|
OPM
and Last transaction |
|
Volatility |
|
42.94%
(39.10% - 55.90%) |
|
Increase
|
| |
|
|
|
|
|
|
|
|
|
|
| CCF
Holdings LLCClass M |
|
$
44 |
|
OPM
and Last transaction |
|
Volatility |
|
42.94%
(39.10% - 55.90%) |
|
Increase
|
| |
|
|
|
|
|
|
|
|
|
|
| |
|
|
|
|
|
|
|
|
|
|
| Warrant:
|
|
|
|
|
|
|
|
|
|
|
| CCF
Holdings LLC |
|
$
29 |
|
Black-Scholes
Model |
|
Volatility |
|
42.94%
(39.10% - 55.90%) |
|
Increase
|
| |
|
|
|
|
|
|
|
|
|
|
| |
|
|
|
|
|
|
|
|
|
|
(a) A significant change in unobservable inputs could result in a significantly higher or lower fair value.
See Notes to Financial Statements
Convertible & Income
Fund II (NCZ)
SCHEDULE OF INVESTMENTS
January 31, 2025
($ reported in thousands)
| |
Par
Value |
|
Value
|
| Convertible
Bonds and Notes—83.6% |
| Aerospace
& Defense—0.6% |
|
|
Rocket
Lab USA, Inc. 144A
4.250%, 2/1/29(1) |
$ 285
|
|
$ 1,633
|
| Auto
Manufacturers—1.6% |
|
|
| Rivian
Automotive, Inc. |
|
|
|
| 4.625%,
3/15/29 |
2,020
|
|
2,005
|
| 3.625%,
10/15/30 |
2,420
|
|
2,155
|
| |
|
|
4,160
|
| |
|
|
|
| |
| Biotechnology—5.2%
|
|
|
Alnylam
Pharmaceuticals, Inc.
1.000%, 9/15/27 |
2,850
|
|
3,266
|
Bridgebio
Pharma, Inc.
2.500%, 3/15/27 |
1,520
|
|
1,726
|
Halozyme
Therapeutics, Inc.
0.250%, 3/1/27 |
2,675
|
|
2,690
|
Insmed,
Inc.
0.750%, 6/1/28 |
965
|
|
2,312
|
PTC
Therapeutics, Inc.
1.500%, 9/15/26 |
1,175
|
|
1,322
|
Sarepta
Therapeutics, Inc.
1.250%, 9/15/27 |
1,160
|
|
1,242
|
Travere
Therapeutics, Inc.
2.250%, 3/1/29 |
1,325
|
|
1,344
|
| |
|
|
13,902
|
| |
|
|
|
| |
| Commercial
Services—2.9% |
|
|
Affirm
Holdings, Inc. 144A
0.750%, 12/15/29(1)(2) |
2,305
|
|
2,253
|
Global
Payments, Inc. 144A
1.500%, 3/1/31(1) |
2,530
|
|
2,477
|
Shift4
Payments, Inc.
0.500%, 8/1/27 |
2,665
|
|
3,121
|
| |
|
|
7,851
|
| |
|
|
|
| |
| Computers—4.2%
|
|
|
Lumentum
Holdings, Inc.
0.500%, 12/15/26 |
3,365
|
|
3,771
|
PAR
Technology Corp.
1.500%, 10/15/27 |
1,860
|
|
2,167
|
Seagate
HDD Cayman
3.500%, 6/1/28 |
1,650
|
|
2,129
|
Western
Digital Corp.
3.000%, 11/15/28 |
1,430
|
|
2,013
|
Zscaler,
Inc.
0.125%, 7/1/25 |
815
|
|
1,112
|
| |
|
|
11,192
|
| |
|
|
|
| |
| Diversified
REITS—1.1% |
|
|
Digital
Realty Trust LP 144A
1.875%, 11/15/29(1) |
2,855
|
|
2,882
|
| Electric
Utilities—5.5% |
|
|
NextEra
Energy Capital Holdings, Inc. 144A
3.000%, 3/1/27(1) |
3,250
|
|
3,749
|
NRG
Energy, Inc.
2.750%, 6/1/48 |
385
|
|
960
|
| |
Par
Value |
|
Value
|
| |
|
|
|
| Electric
Utilities—continued |
|
|
PG&E
Corp.
4.250%, 12/1/27 |
$ 5,675
|
|
$ 5,774
|
Southern
Co. (The)
3.875%, 12/15/25 |
4,130
|
|
4,357
|
| |
|
|
14,840
|
| |
|
|
|
| |
| Electronics—2.0%
|
|
|
Advanced
Energy Industries, Inc.
2.500%, 9/15/28 |
1,680
|
|
1,842
|
Itron,
Inc. 144A
1.375%, 7/15/30(1) |
575
|
|
599
|
OSI
Systems, Inc. 144A
2.250%, 8/1/29(1) |
2,475
|
|
2,960
|
| |
|
|
5,401
|
| |
|
|
|
| |
| Energy-Alternate
Sources—0.1% |
|
|
Sunrun,
Inc. 144A
4.000%, 3/1/30(1) |
405
|
|
352
|
| Engineering
& Construction—1.5% |
|
|
Fluor
Corp.
1.125%, 8/15/29(2) |
1,090
|
|
1,355
|
Granite
Construction, Inc. 144A
3.250%, 6/15/30(1)(2) |
2,125
|
|
2,795
|
| |
|
|
4,150
|
| |
|
|
|
| |
| Entertainment—3.2%
|
|
|
Cinemark
Holdings, Inc.
4.500%, 8/15/25 |
410
|
|
823
|
IMAX
Corp.
0.500%, 4/1/26 |
1,905
|
|
1,976
|
Live
Nation Entertainment, Inc. 144A
2.875%, 1/15/30(1) |
5,680
|
|
5,913
|
| |
|
|
8,712
|
| |
|
|
|
| |
| Financial
Services—4.7% |
|
|
Coinbase
Global, Inc.
0.500%, 6/1/26 |
3,405
|
|
3,780
|
Encore
Capital Group, Inc.
4.000%, 3/15/29 |
1,520
|
|
1,572
|
Galaxy
Digital Holdings LP 144A
2.500%, 12/1/29(1) |
2,280
|
|
2,487
|
SoFi
Technologies, Inc. 144A
0.000%, 10/15/26(1) |
2,475
|
|
2,628
|
Upstart
Holdings, Inc. 144A
1.000%, 11/15/30(1) |
2,110
|
|
2,090
|
| |
|
|
12,557
|
| |
|
|
|
| |
| Health
Care REITs—2.4% |
|
|
Welltower
OP LLC 144A
3.125%, 7/15/29(1) |
5,405
|
|
6,451
|
| Healthcare-Products—5.7%
|
|
|
Alphatec
Holdings, Inc.
0.750%, 8/1/26 |
1,390
|
|
1,412
|
Envista
Holdings Corp.
2.375%, 6/1/25 |
1,270
|
|
1,372
|
See Notes to Financial Statements
Convertible & Income
Fund II (NCZ)
SCHEDULE OF INVESTMENTS (Continued)
January 31, 2025
($ reported in
thousands)
| |
Par
Value |
|
Value
|
| |
|
|
|
| Healthcare-Products—continued
|
|
|
Exact
Sciences Corp. 144A
1.750%, 4/15/31(1) |
$ 2,320
|
|
$ 2,172
|
Insulet
Corp.
0.375%, 9/1/26 |
1,920
|
|
2,543
|
iRhythm
Technologies, Inc. 144A
1.500%, 9/1/29(1)(2) |
2,090
|
|
2,198
|
Lantheus
Holdings, Inc.
2.625%, 12/15/27 |
270
|
|
366
|
LeMaitre
Vascular, Inc. 144A
2.500%, 2/1/30(1) |
1,355
|
|
1,437
|
Merit
Medical Systems, Inc. 144A
3.000%, 2/1/29(1) |
1,540
|
|
2,131
|
Repligen
Corp.
1.000%, 12/15/28 |
1,025
|
|
1,108
|
Tandem
Diabetes Care, Inc. 144A
1.500%, 3/15/29(1) |
405
|
|
534
|
| |
|
|
15,273
|
| |
|
|
|
| |
| Industrial
REITs—0.4% |
|
|
Rexford
Industrial Realty LP 144A
4.375%, 3/15/27(1) |
1,190
|
|
1,181
|
| Internet—9.0%
|
|
|
Alibaba
Group Holding Ltd. 144A
0.500%, 6/1/31(1) |
915
|
|
1,069
|
Booking
Holdings, Inc.
0.750%, 5/1/25 |
795
|
|
2,003
|
Magnite,
Inc.
0.250%, 3/15/26 |
1,375
|
|
1,286
|
Palo
Alto Networks, Inc.
0.375%, 6/1/25(2) |
355
|
|
1,316
|
Q2
Holdings, Inc.
0.750%, 6/1/26 |
1,740
|
|
2,076
|
Sea
Ltd.
2.375%, 12/1/25 |
1,430
|
|
1,996
|
Shopify,
Inc.
0.125%, 11/1/25 |
1,990
|
|
2,082
|
Snap,
Inc.
0.750%, 8/1/26 |
1,625
|
|
1,598
|
Trip.com
Group Ltd. 144A
0.750%, 6/15/29(1) |
2,120
|
|
2,657
|
Uber
Technologies, Inc.
0.000%, 12/15/25(3) |
3,835
|
|
3,990
|
| Wayfair,
Inc. |
|
|
|
| 1.000%,
8/15/26 |
1,315
|
|
1,211
|
| 3.250%,
9/15/27 |
1,120
|
|
1,247
|
Zillow
Group, Inc.
2.750%, 5/15/25(2) |
1,165
|
|
1,454
|
| |
|
|
23,985
|
| |
|
|
|
| |
| Investment
Companies—1.0% |
|
|
IREN
Ltd. 144A
3.250%, 6/15/30(1)(2) |
1,445
|
|
1,362
|
MARA
Holdings, Inc. 144A
0.000%, 6/1/31(1) |
1,680
|
|
1,423
|
| |
|
|
2,785
|
| |
|
|
|
| |
| |
Par
Value |
|
Value
|
| |
|
|
|
| Iron
& Steel—0.5% |
|
|
United
States Steel Corp.
5.000%, 11/1/26 |
$ 465
|
|
$ 1,288
|
| Leisure
Time—3.5% |
|
|
Carnival
Corp.
5.750%, 12/1/27 |
670
|
|
1,471
|
| NCL
Corp., Ltd. |
|
|
|
| 5.375%,
8/1/25 |
560
|
|
868
|
| 1.125%,
2/15/27 |
2,865
|
|
3,114
|
Peloton
Interactive, Inc. 144A
5.500%, 12/1/29(1) |
395
|
|
777
|
Royal
Caribbean Cruises Ltd.
6.000%, 8/15/25 |
570
|
|
3,047
|
| |
|
|
9,277
|
| |
|
|
|
| |
| Machinery-Construction
& Mining—0.6% |
|
|
Bloom
Energy Corp. 144A
3.000%, 6/1/29(1)(2) |
1,075
|
|
1,479
|
| Machinery-Diversified—0.5%
|
|
|
Middleby
Corp. (The)
1.000%, 9/1/25 |
990
|
|
1,330
|
| Media—1.6%
|
|
|
| Liberty
Broadband Corp. |
|
|
|
| 144A
3.125%, 3/31/53(1) |
1,300
|
|
1,286
|
| 144A
3.125%, 6/30/54(1) |
1,385
|
|
1,530
|
Liberty
Media Corp.-Liberty Formula One
2.250%, 8/15/27 |
1,260
|
|
1,588
|
| |
|
|
4,404
|
| |
|
|
|
| |
| Metal
Fabricate/Hardware—0.9% |
|
|
Xometry,
Inc.
1.000%, 2/1/27(2) |
2,320
|
|
2,305
|
| Mining—1.0%
|
|
|
MP
Materials Corp. 144A
3.000%, 3/1/30(1) |
2,115
|
|
2,698
|
| Miscellaneous
Manufacturing—0.7% |
|
|
Axon
Enterprise, Inc.
0.500%, 12/15/27 |
655
|
|
1,870
|
| Oil,
Gas & Consumable Fuels—0.5% |
|
|
UGI
Corp. 144A
5.000%, 6/1/28(1) |
1,190
|
|
1,437
|
| Passenger
Airlines—1.6% |
|
|
American
Airlines Group, Inc.
6.500%, 7/1/25 |
3,145
|
|
3,581
|
JetBlue
Airways Corp. 144A
2.500%, 9/1/29(1) |
500
|
|
636
|
| |
|
|
4,217
|
| |
|
|
|
| |
| Retail—2.6%
|
|
|
Burlington
Stores, Inc.
1.250%, 12/15/27 |
1,955
|
|
2,917
|
See Notes to Financial Statements
Convertible & Income
Fund II (NCZ)
SCHEDULE OF INVESTMENTS (Continued)
January 31, 2025
($ reported in
thousands)
| |
Par
Value |
|
Value
|
| |
|
|
|
| Retail—continued
|
|
|
Freshpet,
Inc.
3.000%, 4/1/28 |
$ 930
|
|
$ 2,206
|
Shake
Shack, Inc.
0.000%, 3/1/28 |
1,850
|
|
1,833
|
| |
|
|
6,956
|
| |
|
|
|
| |
| Retail
REIT—0.5% |
|
|
Federal
Realty OP LP 144A
3.250%, 1/15/29(1) |
1,265
|
|
1,285
|
| Semiconductors—2.7%
|
|
|
MACOM
Technology Solutions Holdings, Inc. 144A
0.000%, 12/15/29(1)(3) |
1,560
|
|
1,577
|
ON
Semiconductor Corp.
0.500%, 3/1/29 |
1,895
|
|
1,702
|
Semtech
Corp.
1.625%, 11/1/27 |
765
|
|
1,448
|
Synaptics,
Inc. 144A
0.750%, 12/1/31(1) |
1,555
|
|
1,684
|
Wolfspeed,
Inc.
0.250%, 2/15/28 |
2,000
|
|
922
|
| |
|
|
7,333
|
| |
|
|
|
| |
| Software—14.1%
|
|
|
Akamai
Technologies, Inc.
0.125%, 5/1/25 |
1,520
|
|
1,649
|
Alignment
Healthcare, Inc. 144A
4.250%, 11/15/29(1)(2) |
2,080
|
|
2,672
|
BILL
Holdings, Inc. 144A
0.000%, 4/1/30(1) |
2,985
|
|
3,186
|
Cloudflare,
Inc.
0.000%, 8/15/26(3) |
2,935
|
|
3,022
|
Datadog,
Inc. 144A
0.000%, 12/1/29(1)(3) |
4,155
|
|
4,068
|
Guidewire
Software, Inc. 144A
1.250%, 11/1/29(1) |
2,885
|
|
3,123
|
HubSpot,
Inc.
0.375%, 6/1/25 |
855
|
|
2,351
|
| MicroStrategy,
Inc. |
|
|
|
| 144A
0.000%, 12/1/29(1)(3) |
5,555
|
|
4,822
|
| 144A
0.875%, 3/15/31(1) |
1,215
|
|
1,977
|
Nutanix,
Inc. 144A
0.500%, 12/15/29(1) |
2,925
|
|
3,039
|
Snowflake,
Inc. 144A
0.000%, 10/1/29(1) |
3,450
|
|
4,576
|
Tyler
Technologies, Inc.
0.250%, 3/15/26 |
1,020
|
|
1,276
|
Vertex,
Inc. 144A
0.750%, 5/1/29(1) |
1,180
|
|
1,989
|
| |
|
|
37,750
|
| |
|
|
|
| |
| Telecommunications—0.7%
|
|
|
Applied
Digital Corp. 144A
2.750%, 6/1/30(1) |
615
|
|
616
|
EchoStar
Corp.
3.875%, 11/30/30 |
—
(4) |
|
—
(4) |
| |
Par
Value |
|
Value
|
| |
|
|
|
| Telecommunications—continued
|
|
|
Viavi
Solutions, Inc.
1.625%, 3/15/26 |
$ 1,040
|
|
$
1,141 |
| |
|
|
1,757
|
| |
|
|
|
| |
| Transportation—0.5%
|
|
|
World
Kinect Corp.
3.250%, 7/1/28 |
1,070
|
|
1,225
|
Total
Convertible Bonds and Notes
(Identified Cost $202,239) |
|
223,918
|
| |
|
|
|
| |
| |
|
|
|
| |
| Corporate
Bonds and Notes—56.3% |
| Aerospace
& Defense—3.3% |
|
|
AAR
Escrow Issuer LLC 144A
6.750%, 3/15/29(1) |
1,585
|
|
1,620
|
Bombardier,
Inc. 144A
7.500%, 2/1/29(1)(2) |
2,070
|
|
2,154
|
TransDigm,
Inc. 144A
7.125%, 12/1/31(1) |
3,450
|
|
3,563
|
Triumph
Group, Inc. 144A
9.000%, 3/15/28(1) |
1,530
|
|
1,604
|
| |
|
|
8,941
|
| |
|
|
|
| |
| Auto
Components—0.3% |
|
|
Goodyear
Tire & Rubber Co. (The)
5.250%, 7/15/31(2) |
935
|
|
857
|
| Automotive
Parts & Equipment—1.8% |
|
|
Adient
Global Holdings Ltd. 144A
8.250%, 4/15/31(1)(2) |
1,160
|
|
1,203
|
American
Axle & Manufacturing, Inc.
6.875%, 7/1/28(2) |
835
|
|
830
|
Clarios
Global LP 144A
8.500%, 5/15/27(1) |
1,725
|
|
1,734
|
Tenneco,
Inc. 144A
8.000%, 11/17/28(1) |
1,155
|
|
1,102
|
| |
|
|
4,869
|
| |
|
|
|
| |
| Building
Materials—1.9% |
|
|
Builders
FirstSource, Inc. 144A
6.375%, 6/15/32(1)(2) |
2,040
|
|
2,066
|
Quikrete
Holdings, Inc. 144A
6.750%, 3/1/33(1) |
1,460
|
|
1,464
|
Summit
Materials LLC 144A
7.250%, 1/15/31(1) |
1,525
|
|
1,645
|
| |
|
|
5,175
|
| |
|
|
|
| |
| Chemicals—0.9%
|
|
|
Chemours
Co. (The) 144A
8.000%, 1/15/33(1) |
1,230
|
|
1,220
|
Tronox,
Inc. 144A
4.625%, 3/15/29(1)(2) |
1,370
|
|
1,241
|
| |
|
|
2,461
|
| |
|
|
|
| |
| Commercial
Services—2.6% |
|
|
Avis
Budget Car Rental LLC 144A
8.000%, 2/15/31(1)(2) |
2,075
|
|
2,145
|
See Notes to Financial Statements
Convertible & Income
Fund II (NCZ)
SCHEDULE OF INVESTMENTS (Continued)
January 31, 2025
($ reported in
thousands)
| |
Par
Value |
|
Value
|
| |
|
|
|
| Commercial
Services—continued |
|
|
EquipmentShare.com,
Inc. 144A
8.625%, 5/15/32(1) |
$ 2,155
|
|
$ 2,297
|
Shift4
Payments LLC 144A
6.750%, 8/15/32(1) |
2,445
|
|
2,511
|
| |
|
|
6,953
|
| |
|
|
|
| |
| Computers—1.6%
|
|
|
McAfee
Corp. 144A
7.375%, 2/15/30(1) |
1,835
|
|
1,808
|
Seagate
HDD Cayman
8.500%, 7/15/31 |
2,275
|
|
2,435
|
| |
|
|
4,243
|
| |
|
|
|
| |
| Containers
& Packaging—0.8% |
|
|
Mauser
Packaging Solutions Holding Co. 144A
7.875%, 4/15/27(1) |
1,310
|
|
1,335
|
Trivium
Packaging Finance B.V. 144A
8.500%, 8/15/27(1) |
840
|
|
841
|
| |
|
|
2,176
|
| |
|
|
|
| |
| Diversified
REITS—1.3% |
|
|
| Iron
Mountain, Inc. |
|
|
|
| 144A
7.000%, 2/15/29(1) |
2,055
|
|
2,114
|
| 144A
6.250%, 1/15/33(1) |
1,250
|
|
1,252
|
| |
|
|
3,366
|
| |
|
|
|
| |
| Electronic
Equipment, Instruments & Components—0.8% |
|
|
WESCO
Distribution, Inc. 144A
7.250%, 6/15/28(1) |
2,015
|
|
2,053
|
| Electronics—0.4%
|
|
|
Coherent
Corp. 144A
5.000%, 12/15/29(1) |
975
|
|
938
|
| Entertainment—3.1%
|
|
|
Caesars
Entertainment, Inc. 144A
6.000%, 10/15/32(1)(2) |
2,595
|
|
2,524
|
Churchill
Downs, Inc. 144A
6.750%, 5/1/31(1) |
1,610
|
|
1,637
|
Light
& Wonder International, Inc. 144A
7.000%, 5/15/28(1) |
2,025
|
|
2,034
|
Lions
Gate Capital Holdings 1, Inc. 144A
5.500%, 4/15/29(1) |
1,050
|
|
938
|
SeaWorld
Parks & Entertainment, Inc. 144A
5.250%, 8/15/29(1) |
1,280
|
|
1,237
|
| |
|
|
8,370
|
| |
|
|
|
| |
| Environmental
Services—1.2% |
|
|
GFL
Environmental, Inc. 144A
6.750%, 1/15/31(1) |
1,920
|
|
1,992
|
Waste
Pro USA, Inc. 144A
7.000%, 2/1/33(1) |
1,260
|
|
1,274
|
| |
|
|
3,266
|
| |
|
|
|
| |
| Financial
Services—4.2% |
|
|
| Nationstar
Mortgage Holdings, Inc. |
|
|
|
| 144A
5.500%, 8/15/28(1) |
840
|
|
825
|
| |
Par
Value |
|
Value
|
| |
|
|
|
| Financial
Services—continued |
|
|
| 144A
7.125%, 2/1/32(1) |
$ 3,270
|
|
$ 3,371
|
Navient
Corp.
9.375%, 7/25/30 |
1,045
|
|
1,138
|
OneMain
Finance Corp.
9.000%, 1/15/29 |
2,305
|
|
2,448
|
PennyMac
Financial Services, Inc. 144A
7.875%, 12/15/29(1) |
1,685
|
|
1,764
|
PRA
Group, Inc. 144A
8.375%, 2/1/28(1) |
1,120
|
|
1,154
|
Synchrony
Financial
7.250%, 2/2/33 |
385
|
|
403
|
| |
|
|
11,103
|
| |
|
|
|
| |
| Food
& Beverage—1.4% |
|
|
Performance
Food Group, Inc. 144A
6.125%, 9/15/32(1) |
1,690
|
|
1,693
|
Post
Holdings, Inc. 144A
6.375%, 3/1/33(1) |
2,075
|
|
2,044
|
| |
|
|
3,737
|
| |
|
|
|
| |
| Healthcare-Products—0.9%
|
|
|
Medline
Borrower LP 144A
5.250%, 10/1/29(1) |
2,375
|
|
2,301
|
| Healthcare-Services—1.8%
|
|
|
Concentra
Escrow Issuer Corp. 144A
6.875%, 7/15/32(1) |
1,585
|
|
1,639
|
Tenet
Healthcare Corp.
6.125%, 10/1/28 |
3,290
|
|
3,292
|
| |
|
|
4,931
|
| |
|
|
|
| |
| Hotel
& Resort REITs—0.3% |
|
|
Park
Intermediate Holdings LLC 144A
5.875%, 10/1/28(1) |
850
|
|
840
|
| Insurance—0.8%
|
|
|
Panther
Escrow Issuer LLC 144A
7.125%, 6/1/31(1) |
2,120
|
|
2,171
|
| Internet—0.9%
|
|
|
Gen
Digital, Inc. 144A
7.125%, 9/30/30(1)(2) |
2,400
|
|
2,469
|
| Investment
Companies—0.8% |
|
|
Compass
Group Diversified Holdings LLC 144A
5.250%, 4/15/29(1) |
2,230
|
|
2,158
|
| Iron
& Steel—0.6% |
|
|
Cleveland-Cliffs,
Inc. 144A
7.000%, 3/15/32(1)(2) |
1,650
|
|
1,646
|
| Leisure
Time—2.5% |
|
|
Amer
Sports Co. 144A
6.750%, 2/16/31(1) |
1,595
|
|
1,638
|
Carnival
Corp. 144A
10.500%, 6/1/30(1) |
1,580
|
|
1,688
|
NCL
Corp., Ltd. 144A
6.750%, 2/1/32(1) |
1,595
|
|
1,620
|
See Notes to Financial Statements
Convertible & Income
Fund II (NCZ)
SCHEDULE OF INVESTMENTS (Continued)
January 31, 2025
($ reported in
thousands)
| |
Par
Value |
|
Value
|
| |
|
|
|
| Leisure
Time—continued |
|
|
Royal
Caribbean Cruises Ltd. 144A
6.250%, 3/15/32(1) |
$ 1,615
|
|
$ 1,643
|
| |
|
|
6,589
|
| |
|
|
|
| |
| Lodging—0.8%
|
|
|
Hilton
Grand Vacations Borrower LLC 144A
5.000%, 6/1/29(1) |
905
|
|
862
|
Station
Casinos LLC 144A
6.625%, 3/15/32(1) |
1,195
|
|
1,202
|
| |
|
|
2,064
|
| |
|
|
|
| |
| Machinery-Diversified—0.9%
|
|
|
Chart
Industries, Inc. 144A
7.500%, 1/1/30(1) |
2,325
|
|
2,429
|
| Media—4.7%
|
|
|
| CCO
Holdings LLC |
|
|
|
| 144A
6.375%, 9/1/29(1) |
1,245
|
|
1,246
|
| 144A
7.375%, 3/1/31(1)(2) |
1,635
|
|
1,674
|
Gray
Media, Inc. 144A
7.000%, 5/15/27(1) |
2,245
|
|
2,198
|
Nexstar
Media, Inc. 144A
5.625%, 7/15/27(1) |
1,640
|
|
1,618
|
Sirius
XM Radio LLC 144A
5.500%, 7/1/29(1) |
2,515
|
|
2,449
|
TEGNA,
Inc.
5.000%, 9/15/29 |
1,765
|
|
1,658
|
Virgin
Media Secured Finance plc 144A
5.500%, 5/15/29(1) |
1,725
|
|
1,652
|
| |
|
|
12,495
|
| |
|
|
|
| |
| Mining—0.9%
|
|
|
Arsenal
AIC Parent LLC 144A
8.000%, 10/1/30(1) |
1,170
|
|
1,216
|
Hudbay
Minerals, Inc. 144A
6.125%, 4/1/29(1) |
1,235
|
|
1,238
|
| |
|
|
2,454
|
| |
|
|
|
| |
| Oil,
Gas & Consumable Fuels—5.7% |
|
|
CITGO
Petroleum Corp. 144A
8.375%, 1/15/29(1) |
1,240
|
|
1,281
|
Civitas
Resources, Inc. 144A
8.750%, 7/1/31(1) |
2,050
|
|
2,162
|
CNX
Resources Corp. 144A
7.375%, 1/15/31(1)(2) |
1,715
|
|
1,760
|
Northern
Oil & Gas, Inc. 144A
8.750%, 6/15/31(1) |
1,195
|
|
1,253
|
Permian
Resources Operating LLC 144A
6.250%, 2/1/33(1) |
1,670
|
|
1,674
|
SM
Energy Co. 144A
7.000%, 8/1/32(1) |
1,645
|
|
1,643
|
Transocean
Titan Financing Ltd. 144A
8.375%, 2/1/28(1) |
1,725
|
|
1,768
|
USA
Compression Partners LP
6.875%, 9/1/27 |
1,750
|
|
1,761
|
| |
Par
Value |
|
Value
|
| |
|
|
|
| Oil,
Gas & Consumable Fuels—continued |
|
|
Weatherford
International Ltd. 144A
8.625%, 4/30/30(1) |
$ 1,950
|
|
$ 2,022
|
| |
|
|
15,324
|
| |
|
|
|
| |
| Paper
& Forest Products—0.4% |
|
|
Mercer
International, Inc. 144A
5.125%, 2/1/29(1) |
1,135
|
|
1,007
|
| Pharmaceuticals—0.9%
|
|
|
Organon
& Co. 144A
7.875%, 5/15/34(1)(2) |
2,320
|
|
2,365
|
| Pipelines—0.5%
|
|
|
NGL
Energy Operating LLC 144A
8.375%, 2/15/32(1) |
1,260
|
|
1,296
|
| Retail—2.7%
|
|
|
Bath
& Body Works, Inc. 144A
6.625%, 10/1/30(1)(2) |
855
|
|
871
|
Beacon
Roofing Supply, Inc. 144A
6.500%, 8/1/30(1) |
1,430
|
|
1,475
|
Group
1 Automotive, Inc. 144A
6.375%, 1/15/30(1) |
1,675
|
|
1,702
|
New
Red Finance, Inc. 144A
6.125%, 6/15/29(1) |
1,635
|
|
1,657
|
Patrick
Industries, Inc. 144A
6.375%, 11/1/32(1) |
1,650
|
|
1,627
|
| |
|
|
7,332
|
| |
|
|
|
| |
| Semiconductors—0.9%
|
|
|
Amkor
Technology, Inc. 144A
6.625%, 9/15/27(1) |
1,225
|
|
1,228
|
Entegris,
Inc. 144A
5.950%, 6/15/30(1) |
1,230
|
|
1,226
|
| |
|
|
2,454
|
| |
|
|
|
| |
| Software—1.0%
|
|
|
Central
Parent LLC 144A
8.000%, 6/15/29(1) |
1,220
|
|
1,182
|
UKG,
Inc. 144A
6.875%, 2/1/31(1) |
1,430
|
|
1,460
|
| |
|
|
2,642
|
| |
|
|
|
| |
| Telecommunications—0.8%
|
|
|
EchoStar
Corp.
6.750%, 11/30/30 |
—
(4) |
|
—
(4) |
Frontier
Communications Holdings LLC 144A
8.750%, 5/15/30(1) |
2,050
|
|
2,166
|
| |
|
|
2,166
|
| |
|
|
|
| |
| Transportation—1.9%
|
|
|
Fortress
Transportation & Infrastructure Investors LLC 144A
7.875%, 12/1/30(1) |
2,680
|
|
2,796
|
See Notes to Financial Statements
Convertible & Income
Fund II (NCZ)
SCHEDULE OF INVESTMENTS (Continued)
January 31, 2025
($ reported in
thousands)
| |
Par
Value |
|
Value
|
| |
|
|
|
| Transportation—continued
|
|
|
XPO,
Inc. 144A
7.125%, 6/1/31(1) |
$ 2,280
|
|
$
2,356 |
| |
|
|
5,152
|
Total
Corporate Bonds and Notes
(Identified Cost $147,926) |
|
150,793
|
| |
Shares
|
|
| Convertible
Preferred Stocks—10.8% |
| Aerospace
& Defense—2.8% |
|
| Boeing
Co. (The), 6.000% |
124,415
|
7,464
|
| Banks—2.9%
|
|
| Wells
Fargo & Co. Series L, 7.500% |
6,440
|
7,656
|
| Capital
Markets—0.9% |
|
| Ares
Management Corp. Series B, 6.750% |
40,990
|
2,488
|
| Chemicals—0.4%
|
|
| Albemarle
Corp., 7.250% |
29,150
|
1,181
|
| Electric
Utilities—0.7% |
|
| NextEra
Energy, Inc., 6.926%(2) |
46,115
|
1,913
|
| Financial
Services—0.8% |
|
| Apollo
Global Management, Inc., 6.750% |
23,755
|
2,116
|
| Healthcare
Providers & Services—0.7% |
|
| BrightSpring
Health Services, Inc., 6.750% |
23,150
|
1,920
|
| Machinery—0.4%
|
|
| Chart
Industries, Inc. Series B, 6.750% |
12,500
|
972
|
| Software—0.2%
|
|
| MicroStrategy,
Inc., 8.000% |
7,200
|
583
|
| Technology
Hardware, Storage & Peripherals—1.0% |
|
| Hewlett
Packard Enterprise Co., 7.625% |
41,955
|
2,565
|
Total
Convertible Preferred Stocks
(Identified Cost $21,862) |
28,858
|
| |
|
|
| |
| |
|
|
| |
| Preferred
Stock—0.1% |
| Entertainment—0.1%
|
|
| LiveStyle,
Inc. Series B(5)(6)(7) |
4,196
|
420
|
Total
Preferred Stock
(Identified Cost $411) |
420
|
| |
|
|
| |
| |
|
|
| |
| Common
Stocks—0.1% |
| Banks—0.1%
|
|
| CCF
Holdings LLC(5)(6) |
6,367,079
|
318
|
| CCF
Holdings LLC Class M(5)(6) |
879,959
|
44
|
| |
|
362
|
| |
|
|
| |
| |
Shares
|
|
Value
|
| |
|
|
|
| Consumer
Finance—0.0% |
|
|
| Erickson,
Inc.(5)(6) |
6,354
|
|
$
— |
| Entertainment—0.0%
|
|
|
| LiveStyle,
Inc. (5)(6)(7) |
90,407
|
|
—
|
Total
Common Stocks
(Identified Cost $22,668) |
|
362
|
| |
|
|
|
| |
| |
|
|
|
| |
| Warrant—0.0%
|
| Banks—0.0%
|
|
|
| CCF
Holdings LLC, 3/25/26(5)(6) |
1,455,681
|
|
29
|
Total
Warrant
(Identified Cost $—) |
|
29
|
| |
|
|
|
| |
| |
|
|
|
| |
Total
Long-Term Investments—150.9%
(Identified Cost $395,106) |
|
404,380 |
| |
|
|
|
| |
| |
|
|
|
| |
| Short-Term
Investment—4.2% |
| Money
Market Mutual Fund—4.2% |
| BlackRock
Liquidity FedFund - Institutional Shares (seven-day effective yield 4.262%)(8) |
11,242,627
|
|
11,243
|
Total
Short-Term Investment
(Identified Cost $11,243) |
|
11,243
|
| |
|
|
|
| |
| |
|
|
|
| |
| Securities
Lending Collateral—1.5% |
| Dreyfus
Government Cash Management Fund - Institutional Shares (seven-day effective yield 4.264%)(8)(9) |
3,897,729
|
|
3,898
|
Total
Securities Lending Collateral
(Identified Cost $3,898) |
|
3,898
|
| |
|
|
|
| |
| |
|
|
|
| |
TOTAL
INVESTMENTS—156.6%
(Identified Cost $410,247) |
|
$
419,521 |
| Other
assets and liabilities, net—(15.9)% |
|
(42,617)
|
| Cumulative
Preferred Shares—(40.7)% |
|
(109,000)
|
| NET
ASSETS—100.0% |
|
$
267,904 |
| Abbreviations:
|
| LLC
|
Limited
Liability Company |
| LP
|
Limited
Partnership |
| OP
|
Operating
Partnership |
| OPM
|
Option
Pricing Model |
| plc
|
Public
Limited Company |
| REIT
|
Real
Estate Investment Trust |
| Footnote
Legend: |
|
(1) |
Security
exempt from registration under Rule 144A of the Securities Act of 1933. These securities may be resold in transactions exempt from registration, normally to qualified institutional buyers. At January 31, 2025, these securities amounted to a value
of $235,861 or 88.0% of net assets. |
|
(2) |
All
or a portion of security is on loan pursuant to the Liquidity Facility and/or securities lending. |
|
(3) |
Issued
with a zero coupon. Income is recognized through the accretion of discount. |
|
(4) |
Amount
is less than $500 (not in thousands). |
For information regarding the abbreviations, see the Key
Investment Terms starting on page 16.
See Notes to Financial Statements
Convertible & Income
Fund II (NCZ)
SCHEDULE OF INVESTMENTS (Continued)
January 31, 2025
($ reported in
thousands)
| (5) |
The value of this
security was determined using significant unobservable inputs and is reported as a Level 3 security in the Fair Value Hierarchy table located after the Schedule of Investments. |
|
(6) |
Non-income
producing. |
|
(7) |
Security
is restricted from resale. |
|
(8) |
Shares
of this fund are publicly offered, and its prospectus and annual report are publicly available. |
|
(9) |
Represents
security purchased with cash collateral received for securities on loan. |
| Country
Weightings (Unaudited)† |
| United
States |
89%
|
| Cayman
Islands |
4
|
| Canada
|
3
|
| Bermuda
|
2
|
| Liberia
|
1
|
| Panama
|
1
|
| Total
|
100%
|
|
† % of total investments as of January 31, 2025. |
The following table summarizes the value of the
Fund’s investments as of January 31, 2025, based on the inputs used to value them (See Security Valuation Note 2A in the Notes to Financial Statements):
| |
Total
Value at
January 31, 2025 |
|
Level
1
Quoted Prices |
|
Level
2
Significant
Observable
Inputs |
|
Level
3
Significant
Unobservable
Inputs |
| Assets:
|
|
|
|
|
|
|
|
| Debt
Instruments: |
|
|
|
|
|
|
|
| Convertible
Bonds and Notes |
$223,918
|
|
$
— |
|
$223,918
|
|
$
— |
| Corporate
Bonds and Notes |
150,793
|
|
—
|
|
150,793
|
|
—
|
| Equity
Securities: |
|
|
|
|
|
|
|
| Convertible
Preferred Stocks |
28,858
|
|
28,858
|
|
—
|
|
—
|
| Preferred
Stock |
420
|
|
—
|
|
—
|
|
420
|
| Common
Stocks |
362
|
|
—
|
|
—
|
|
362
(1) |
| Warrant
|
29
|
|
—
|
|
—
|
|
29
|
| Money
Market Mutual Fund |
11,243
|
|
11,243
|
|
—
|
|
—
|
| Securities
Lending Collateral |
3,898
|
|
3,898
|
|
—
|
|
—
|
| Total
Investments |
$419,521
|
|
$43,999
|
|
$374,711
|
|
$811
|
|
(1) |
Includes
internally fair valued securities currently priced at zero ($0). |
There were no transfers into or out of Level 3 related
to securities held at January 31, 2025.
Some of
the Fund’s investments that were categorized as Level 3 may have been valued utilizing third party pricing information without adjustment. If applicable, such valuations are based on unobservable inputs. A significant change in third party
information could result in a significantly lower or higher value of Level 3 investments.
See Notes to Financial Statements
Convertible & Income
Fund II (NCZ)
SCHEDULE OF INVESTMENTS (Continued)
January 31, 2025
($ reported in
thousands)
The following is a reconciliation of assets of the Fund
for Level 3 investments for which significant unobservable inputs were used to determine fair value.
| |
Total
|
|
Convertible
Bonds and
Notes |
|
Preferred
Stock |
|
Common
Stocks |
|
Warrant
|
| Investments
in Securities |
|
|
|
|
|
|
|
|
|
| Balance
as of January 31, 2024: |
$
2,907 |
|
$
2,390 |
|
$ 420
|
|
$
97(a) |
|
$
—(a) |
| Net
realized gain (loss) |
(2,441)
|
|
(70)
|
|
—
|
|
—
|
|
(2,371)
|
| Net
change in unrealized appreciation (depreciation)(b) |
2,715
|
|
50
|
|
—
|
|
265
|
|
2,400
|
| Purchases
|
190
|
|
190
|
|
—
|
|
—
|
|
—
|
| Sales
(c) |
(2,560)
|
|
(2,560)
|
|
—
|
|
—
|
|
—
(d) |
| Balance
as of January 31, 2025 |
$
811 |
|
$
— |
|
$ 420
|
|
$ 362
(a) |
|
$
29 |
(a) Includes internally fair valued security currently priced at zero ($0).
(b) The net change in unrealized appreciation (depreciation) on investments still held at January 31, 2025, was $294.
(c) Includes paydowns on securities.
(d) Amount is less than $500 (not in thousands).
The following table presents additional information
about valuation techniques and inputs used for investments that are measured at fair value and categorized within Level 3 at January 31, 2025.
Investments
in
Securities – Assets |
|
Ending
Balance
at January 31, 2025 |
|
Valuation
Technique
Used |
|
Unobservable
Inputs |
|
Input
Values |
|
Impact
to Valuation
from an Increase in
Unobservable Inputs(a) |
| Preferred
Stock: |
|
|
|
|
|
|
|
|
|
|
| LiveStyle,
Inc.Series B |
|
$420
|
|
Discounted
cash flows
liquidation approach |
|
Discount rate |
|
21.61%
(21.34% - 21.85%) |
|
Decrease
|
| |
|
|
|
|
|
|
|
|
|
|
| |
|
|
|
|
|
|
|
|
|
|
| Common
Stocks: |
|
|
|
|
|
|
|
|
|
|
| CCF
Holdings LLC |
|
$318
|
|
OPM
and Last transaction |
|
Volatility |
|
42.94%
(39.10% - 55.90%) |
|
Increase
|
| |
|
|
|
|
|
|
|
|
|
|
CCF
Holdings LLC
Class M |
|
$
44 |
|
OPM
and Last transaction |
|
Volatility |
|
42.94%
(39.10% - 55.90%) |
|
Increase
|
| |
|
|
|
|
|
|
|
|
|
|
| |
|
|
|
|
|
|
|
|
|
|
| Warrant:
|
|
|
|
|
|
|
|
|
|
|
| CCF
Holdings LLC |
|
$
29 |
|
Black-Scholes
Model |
|
Volatility |
|
42.94%
(39.10% - 55.90%) |
|
Increase
|
| |
|
|
|
|
|
|
|
|
|
|
| |
|
|
|
|
|
|
|
|
|
|
(a) A significant change in unobservable inputs could result in a significantly higher or lower fair value.
See Notes to Financial Statements
Diversified Income &
Convertible Fund (ACV)
SCHEDULE OF INVESTMENTS
January 31, 2025
($ reported in thousands)
| |
Par
Value |
|
Value
|
| Convertible
Bonds and Notes—69.9% |
| Aerospace
& Defense—0.5% |
|
|
Rocket
Lab USA, Inc. 144A
4.250%, 2/1/29(1)(2) |
$ 215
|
|
$ 1,232
|
| Auto
Manufacturers—1.3% |
|
|
| Rivian
Automotive, Inc. |
|
|
|
| 4.625%,
3/15/29(2) |
1,520
|
|
1,509
|
| 3.625%,
10/15/30(2) |
1,825
|
|
1,625
|
| |
|
|
3,134
|
| |
|
|
|
| |
| Biotechnology—4.3%
|
|
|
Alnylam
Pharmaceuticals, Inc.
1.000%, 9/15/27(2) |
2,155
|
|
2,470
|
Bridgebio
Pharma, Inc.
2.500%, 3/15/27 |
1,145
|
|
1,300
|
Halozyme
Therapeutics, Inc.
0.250%, 3/1/27(2) |
2,010
|
|
2,022
|
Insmed,
Inc.
0.750%, 6/1/28(2) |
730
|
|
1,749
|
PTC
Therapeutics, Inc.
1.500%, 9/15/26(2) |
880
|
|
990
|
Sarepta
Therapeutics, Inc.
1.250%, 9/15/27 |
875
|
|
937
|
Travere
Therapeutics, Inc.
2.250%, 3/1/29 |
1,000
|
|
1,014
|
| |
|
|
10,482
|
| |
|
|
|
| |
| Commercial
Services—2.4% |
|
|
Affirm
Holdings, Inc. 144A
0.750%, 12/15/29(1)(2) |
1,735
|
|
1,696
|
Global
Payments, Inc. 144A
1.500%, 3/1/31(1)(2) |
1,915
|
|
1,875
|
Shift4
Payments, Inc.
0.500%, 8/1/27(2) |
2,005
|
|
2,348
|
| |
|
|
5,919
|
| |
|
|
|
| |
| Computers—3.5%
|
|
|
Lumentum
Holdings, Inc.
0.500%, 12/15/26(2) |
2,540
|
|
2,846
|
PAR
Technology Corp.
1.500%, 10/15/27(2) |
1,405
|
|
1,637
|
Seagate
HDD Cayman
3.500%, 6/1/28 |
1,245
|
|
1,607
|
Western
Digital Corp.
3.000%, 11/15/28 |
1,075
|
|
1,513
|
Zscaler,
Inc.
0.125%, 7/1/25 |
615
|
|
839
|
| |
|
|
8,442
|
| |
|
|
|
| |
| Diversified
REITS—0.9% |
|
|
Digital
Realty Trust LP 144A
1.875%, 11/15/29(1)(2) |
2,155
|
|
2,175
|
| Electric
Utilities—4.6% |
|
|
NextEra
Energy Capital Holdings, Inc. 144A
3.000%, 3/1/27(1)(2) |
2,455
|
|
2,832
|
NRG
Energy, Inc.
2.750%, 6/1/48(2) |
290
|
|
723
|
| |
Par
Value |
|
Value
|
| |
|
|
|
| Electric
Utilities—continued |
|
|
PG&E
Corp.
4.250%, 12/1/27(2) |
$ 4,285
|
|
$ 4,360
|
Southern
Co. (The)
3.875%, 12/15/25(2) |
3,120
|
|
3,291
|
| |
|
|
11,206
|
| |
|
|
|
| |
| Electronics—1.7%
|
|
|
Advanced
Energy Industries, Inc.
2.500%, 9/15/28(2) |
1,265
|
|
1,387
|
Itron,
Inc. 144A
1.375%, 7/15/30(1)(2) |
435
|
|
453
|
OSI
Systems, Inc. 144A
2.250%, 8/1/29(1)(2) |
1,870
|
|
2,237
|
| |
|
|
4,077
|
| |
|
|
|
| |
| Energy-Alternate
Sources—0.1% |
|
|
Sunrun,
Inc. 144A
4.000%, 3/1/30(1) |
305
|
|
265
|
| Engineering
& Construction—1.3% |
|
|
Fluor
Corp.
1.125%, 8/15/29(2) |
820
|
|
1,019
|
Granite
Construction, Inc. 144A
3.250%, 6/15/30(1)(2) |
1,600
|
|
2,105
|
| |
|
|
3,124
|
| |
|
|
|
| |
| Entertainment—2.7%
|
|
|
Cinemark
Holdings, Inc.
4.500%, 8/15/25(2) |
310
|
|
622
|
IMAX
Corp.
0.500%, 4/1/26(2) |
1,435
|
|
1,489
|
Live
Nation Entertainment, Inc. 144A
2.875%, 1/15/30(1)(2) |
4,275
|
|
4,450
|
| |
|
|
6,561
|
| |
|
|
|
| |
| Financial
Services—3.9% |
|
|
Coinbase
Global, Inc.
0.500%, 6/1/26(2) |
2,565
|
|
2,847
|
Encore
Capital Group, Inc.
4.000%, 3/15/29(2) |
1,155
|
|
1,195
|
Galaxy
Digital Holdings LP 144A
2.500%, 12/1/29(1)(2) |
1,725
|
|
1,881
|
SoFi
Technologies, Inc. 144A
0.000%, 10/15/26(1) |
1,880
|
|
1,997
|
Upstart
Holdings, Inc. 144A
1.000%, 11/15/30(1) |
1,595
|
|
1,580
|
| |
|
|
9,500
|
| |
|
|
|
| |
| Health
Care REITs—2.0% |
|
|
Welltower
OP LLC 144A
3.125%, 7/15/29(1)(2) |
4,080
|
|
4,869
|
| Healthcare-Products—4.8%
|
|
|
Alphatec
Holdings, Inc.
0.750%, 8/1/26 |
1,050
|
|
1,066
|
Envista
Holdings Corp.
2.375%, 6/1/25(2) |
960
|
|
1,037
|
See Notes to Financial Statements
Diversified Income &
Convertible Fund (ACV)
SCHEDULE OF INVESTMENTS (Continued)
January 31, 2025
($ reported in
thousands)
| |
Par
Value |
|
Value
|
| |
|
|
|
| Healthcare-Products—continued
|
|
|
Exact
Sciences Corp. 144A
1.750%, 4/15/31(1)(2) |
$ 1,745
|
|
$ 1,634
|
Insulet
Corp.
0.375%, 9/1/26(2) |
1,450
|
|
1,921
|
iRhythm
Technologies, Inc. 144A
1.500%, 9/1/29(1)(2) |
1,570
|
|
1,651
|
Lantheus
Holdings, Inc.
2.625%, 12/15/27 |
195
|
|
264
|
LeMaitre
Vascular, Inc. 144A
2.500%, 2/1/30(1)(2) |
1,020
|
|
1,082
|
Merit
Medical Systems, Inc. 144A
3.000%, 2/1/29(1)(2) |
1,160
|
|
1,606
|
Repligen
Corp.
1.000%, 12/15/28 |
780
|
|
843
|
Tandem
Diabetes Care, Inc. 144A
1.500%, 3/15/29(1) |
305
|
|
402
|
| |
|
|
11,506
|
| |
|
|
|
| |
| Industrial
REITs—0.4% |
|
|
Rexford
Industrial Realty LP 144A
4.375%, 3/15/27(1) |
895
|
|
888
|
| Internet—7.5%
|
|
|
Alibaba
Group Holding Ltd. 144A
0.500%, 6/1/31(1)(2) |
690
|
|
806
|
Booking
Holdings, Inc.
0.750%, 5/1/25(2) |
595
|
|
1,499
|
Magnite,
Inc.
0.250%, 3/15/26(2) |
1,040
|
|
972
|
Palo
Alto Networks, Inc.
0.375%, 6/1/25(2) |
270
|
|
1,001
|
Q2
Holdings, Inc.
0.750%, 6/1/26(2) |
1,315
|
|
1,569
|
Sea
Ltd.
2.375%, 12/1/25(2) |
1,075
|
|
1,501
|
Shopify,
Inc.
0.125%, 11/1/25 |
1,500
|
|
1,570
|
Snap,
Inc.
0.750%, 8/1/26(2) |
1,225
|
|
1,204
|
Trip.com
Group Ltd. 144A
0.750%, 6/15/29(1) |
1,590
|
|
1,993
|
Uber
Technologies, Inc.
0.000%, 12/15/25(2) |
2,910
|
|
3,027
|
| Wayfair,
Inc. |
|
|
|
| 1.000%,
8/15/26(2) |
990
|
|
912
|
| 3.250%,
9/15/27(2) |
845
|
|
941
|
Zillow
Group, Inc.
2.750%, 5/15/25(2) |
880
|
|
1,098
|
| |
|
|
18,093
|
| |
|
|
|
| |
| Investment
Companies—0.9% |
|
|
IREN
Ltd. 144A
3.250%, 6/15/30(1)(2) |
1,090
|
|
1,027
|
MARA
Holdings, Inc. 144A
0.000%, 6/1/31(1)(2) |
1,265
|
|
1,072
|
| |
|
|
2,099
|
| |
|
|
|
| |
| |
Par
Value |
|
Value
|
| |
|
|
|
| Iron
& Steel—0.4% |
|
|
United
States Steel Corp.
5.000%, 11/1/26 |
$ 350
|
|
$ 970
|
| Leisure
Time—2.9% |
|
|
Carnival
Corp.
5.750%, 12/1/27(2) |
510
|
|
1,120
|
| NCL
Corp., Ltd. |
|
|
|
| 5.375%,
8/1/25(2) |
425
|
|
658
|
| 1.125%,
2/15/27(2) |
2,160
|
|
2,348
|
Peloton
Interactive, Inc. 144A
5.500%, 12/1/29(1)(2) |
295
|
|
580
|
Royal
Caribbean Cruises Ltd.
6.000%, 8/15/25(2) |
430
|
|
2,299
|
| |
|
|
7,005
|
| |
|
|
|
| |
| Machinery-Construction
& Mining—0.5% |
|
|
Bloom
Energy Corp. 144A
3.000%, 6/1/29(1)(2) |
810
|
|
1,114
|
| Machinery-Diversified—0.4%
|
|
|
Middleby
Corp. (The)
1.000%, 9/1/25 |
755
|
|
1,014
|
| Media—1.4%
|
|
|
| Liberty
Broadband Corp. |
|
|
|
| 144A
3.125%, 3/31/53(1)(2) |
990
|
|
980
|
| 144A
3.125%, 6/30/54(1)(2) |
1,050
|
|
1,160
|
Liberty
Media Corp.-Liberty Formula One
2.250%, 8/15/27(2) |
950
|
|
1,197
|
| |
|
|
3,337
|
| |
|
|
|
| |
| Metal
Fabricate/Hardware—0.7% |
|
|
Xometry,
Inc.
1.000%, 2/1/27 |
1,760
|
|
1,749
|
| Mining—0.8%
|
|
|
MP
Materials Corp. 144A
3.000%, 3/1/30(1)(2) |
1,595
|
|
2,035
|
| Miscellaneous
Manufacturing—0.6% |
|
|
Axon
Enterprise, Inc.
0.500%, 12/15/27(2) |
495
|
|
1,413
|
| Oil,
Gas & Consumable Fuels—0.4% |
|
|
UGI
Corp. 144A
5.000%, 6/1/28(1) |
895
|
|
1,081
|
| Passenger
Airlines—1.3% |
|
|
American
Airlines Group, Inc.
6.500%, 7/1/25(2) |
2,375
|
|
2,704
|
JetBlue
Airways Corp. 144A
2.500%, 9/1/29(1)(2) |
380
|
|
483
|
| |
|
|
3,187
|
| |
|
|
|
| |
| Retail—2.2%
|
|
|
Burlington
Stores, Inc.
1.250%, 12/15/27(2) |
1,470
|
|
2,193
|
See Notes to Financial Statements
Diversified Income &
Convertible Fund (ACV)
SCHEDULE OF INVESTMENTS (Continued)
January 31, 2025
($ reported in
thousands)
| |
Par
Value |
|
Value
|
| |
|
|
|
| Retail—continued
|
|
|
Freshpet,
Inc.
3.000%, 4/1/28(2) |
$ 700
|
|
$ 1,661
|
Shake
Shack, Inc.
0.000%, 3/1/28 |
1,395
|
|
1,382
|
| |
|
|
5,236
|
| |
|
|
|
| |
| Retail
REIT—0.4% |
|
|
Federal
Realty OP LP 144A
3.250%, 1/15/29(1)(2) |
955
|
|
970
|
| Semiconductors—2.3%
|
|
|
MACOM
Technology Solutions Holdings, Inc. 144A
0.000%, 12/15/29(1)(3) |
1,180
|
|
1,193
|
ON
Semiconductor Corp.
0.500%, 3/1/29(2) |
1,430
|
|
1,285
|
Semtech
Corp.
1.625%, 11/1/27(2) |
580
|
|
1,097
|
Synaptics,
Inc. 144A
0.750%, 12/1/31(1) |
1,175
|
|
1,273
|
Wolfspeed,
Inc.
0.250%, 2/15/28 |
1,505
|
|
693
|
| |
|
|
5,541
|
| |
|
|
|
| |
| Software—11.8%
|
|
|
Akamai
Technologies, Inc.
0.125%, 5/1/25(2) |
1,145
|
|
1,242
|
Alignment
Healthcare, Inc. 144A
4.250%, 11/15/29(1)(2) |
1,575
|
|
2,023
|
BILL
Holdings, Inc. 144A
0.000%, 4/1/30(1)(2) |
2,255
|
|
2,407
|
Cloudflare,
Inc.
0.000%, 8/15/26(3) |
2,215
|
|
2,281
|
Datadog,
Inc. 144A
0.000%, 12/1/29(1)(2)(3) |
3,125
|
|
3,059
|
Guidewire
Software, Inc. 144A
1.250%, 11/1/29(1)(2) |
2,180
|
|
2,360
|
HubSpot,
Inc.
0.375%, 6/1/25(2) |
645
|
|
1,773
|
| MicroStrategy,
Inc. |
|
|
|
| 144A
0.000%, 12/1/29(1)(2)(3) |
4,180
|
|
3,629
|
| 144A
0.875%, 3/15/31(1)(2) |
915
|
|
1,489
|
Nutanix,
Inc. 144A
0.500%, 12/15/29(1)(2) |
2,210
|
|
2,296
|
Snowflake,
Inc. 144A
0.000%, 10/1/29(1) |
2,605
|
|
3,456
|
Tyler
Technologies, Inc.
0.250%, 3/15/26(2) |
765
|
|
957
|
Vertex,
Inc. 144A
0.750%, 5/1/29(1) |
890
|
|
1,500
|
| |
|
|
28,472
|
| |
|
|
|
| |
| Telecommunications—0.6%
|
|
|
Applied
Digital Corp. 144A
2.750%, 6/1/30(1)(2) |
460
|
|
461
|
Viavi
Solutions, Inc.
1.625%, 3/15/26 |
790
|
|
867
|
| |
|
|
1,328
|
| |
|
|
|
| |
| |
Par
Value |
|
Value
|
| |
|
|
|
| Transportation—0.4%
|
|
|
World
Kinect Corp.
3.250%, 7/1/28 |
$ 810
|
|
$
927 |
Total
Convertible Bonds and Notes
(Identified Cost $159,622) |
|
168,951
|
| |
|
|
|
| |
| |
|
|
|
| |
| Corporate
Bonds and Notes—23.1% |
| Aerospace
& Defense—1.4% |
|
|
AAR
Escrow Issuer LLC 144A
6.750%, 3/15/29(1)(2) |
870
|
|
889
|
Bombardier,
Inc. 144A
7.500%, 2/1/29(1)(2) |
885
|
|
921
|
| TransDigm,
Inc. |
|
|
|
| 144A
7.125%, 12/1/31(1)(2) |
875
|
|
904
|
| 144A
6.000%, 1/15/33(1) |
15
|
|
15
|
Triumph
Group, Inc. 144A
9.000%, 3/15/28(1)(2) |
571
|
|
598
|
| |
|
|
3,327
|
| |
|
|
|
| |
| Auto
Components—0.4% |
|
|
| Goodyear
Tire & Rubber Co. (The) |
|
|
|
| 5.250%,
4/30/31(2) |
265
|
|
242
|
| 5.250%,
7/15/31(2) |
675
|
|
619
|
| |
|
|
861
|
| |
|
|
|
| |
| Automotive
Parts & Equipment—0.9% |
|
|
Adient
Global Holdings Ltd. 144A
8.250%, 4/15/31(1)(2) |
425
|
|
441
|
American
Axle & Manufacturing, Inc.
6.875%, 7/1/28(2) |
760
|
|
756
|
Clarios
Global LP 144A
8.500%, 5/15/27(1)(2) |
645
|
|
648
|
Tenneco,
Inc. 144A
8.000%, 11/17/28(1)(2) |
320
|
|
305
|
| |
|
|
2,150
|
| |
|
|
|
| |
| Building
Materials—1.0% |
|
|
Builders
FirstSource, Inc. 144A
6.375%, 6/15/32(1)(2) |
1,195
|
|
1,210
|
Quikrete
Holdings, Inc. 144A
6.750%, 3/1/33(1) |
535
|
|
537
|
Summit
Materials LLC 144A
7.250%, 1/15/31(1)(2) |
550
|
|
593
|
| |
|
|
2,340
|
| |
|
|
|
| |
| Chemicals—0.4%
|
|
|
Chemours
Co. (The) 144A
8.000%, 1/15/33(1)(2) |
455
|
|
451
|
Tronox,
Inc. 144A
4.625%, 3/15/29(1)(2) |
665
|
|
602
|
| |
|
|
1,053
|
| |
|
|
|
| |
| Commercial
Services—1.1% |
|
|
Avis
Budget Car Rental LLC 144A
8.000%, 2/15/31(1)(2) |
910
|
|
941
|
EquipmentShare.com,
Inc. 144A
8.625%, 5/15/32(1)(2) |
720
|
|
767
|
See Notes to Financial Statements
Diversified Income &
Convertible Fund (ACV)
SCHEDULE OF INVESTMENTS (Continued)
January 31, 2025
($ reported in
thousands)
| |
Par
Value |
|
Value
|
| |
|
|
|
| Commercial
Services—continued |
|
|
Shift4
Payments LLC 144A
6.750%, 8/15/32(1) |
$ 900
|
|
$ 924
|
| |
|
|
2,632
|
| |
|
|
|
| |
| Computers—0.7%
|
|
|
McAfee
Corp. 144A
7.375%, 2/15/30(1)(2) |
840
|
|
828
|
Seagate
HDD Cayman
8.500%, 7/15/31(2) |
845
|
|
904
|
| |
|
|
1,732
|
| |
|
|
|
| |
| Containers
& Packaging—0.2% |
|
|
Mauser
Packaging Solutions Holding Co. 144A
7.875%, 4/15/27(1)(2) |
340
|
|
347
|
Trivium
Packaging Finance B.V. 144A
8.500%, 8/15/27(1)(2) |
215
|
|
215
|
| |
|
|
562
|
| |
|
|
|
| |
| Diversified
REITS—0.4% |
|
|
| Iron
Mountain, Inc. |
|
|
|
| 144A
7.000%, 2/15/29(1)(2) |
585
|
|
601
|
| 144A
6.250%, 1/15/33(1)(2) |
450
|
|
451
|
| |
|
|
1,052
|
| |
|
|
|
| |
| Electronic
Equipment, Instruments & Components—0.4% |
|
|
WESCO
Distribution, Inc. 144A
7.250%, 6/15/28(1)(2) |
910
|
|
927
|
| Electronics—0.2%
|
|
|
Coherent
Corp. 144A
5.000%, 12/15/29(1)(2) |
400
|
|
385
|
| Entertainment—1.2%
|
|
|
Caesars
Entertainment, Inc. 144A
6.000%, 10/15/32(1)(2) |
950
|
|
924
|
Churchill
Downs, Inc. 144A
6.750%, 5/1/31(1)(2) |
595
|
|
605
|
Light
& Wonder International, Inc. 144A
7.000%, 5/15/28(1)(2) |
600
|
|
603
|
Lions
Gate Capital Holdings 1, Inc. 144A
5.500%, 4/15/29(1)(2) |
385
|
|
344
|
SeaWorld
Parks & Entertainment, Inc. 144A
5.250%, 8/15/29(1)(2) |
470
|
|
454
|
| |
|
|
2,930
|
| |
|
|
|
| |
| Environmental
Services—0.4% |
|
|
GFL
Environmental, Inc. 144A
6.750%, 1/15/31(1)(2) |
535
|
|
555
|
Waste
Pro USA, Inc. 144A
7.000%, 2/1/33(1) |
460
|
|
465
|
| |
|
|
1,020
|
| |
|
|
|
| |
| Financial
Services—1.8% |
|
|
| Nationstar
Mortgage Holdings, Inc. |
|
|
|
| 144A
5.500%, 8/15/28(1)(2) |
290
|
|
285
|
| 144A
7.125%, 2/1/32(1)(2) |
1,100
|
|
1,134
|
| |
Par
Value |
|
Value
|
| |
|
|
|
| Financial
Services—continued |
|
|
Navient
Corp.
9.375%, 7/25/30(2) |
$ 220
|
|
$ 239
|
OneMain
Finance Corp.
9.000%, 1/15/29(2) |
860
|
|
914
|
PennyMac
Financial Services, Inc. 144A
7.875%, 12/15/29(1)(2) |
885
|
|
927
|
PRA
Group, Inc. 144A
8.375%, 2/1/28(1)(2) |
765
|
|
788
|
Synchrony
Financial
7.250%, 2/2/33 |
140
|
|
146
|
| |
|
|
4,433
|
| |
|
|
|
| |
| Food
& Beverage—0.6% |
|
|
Performance
Food Group, Inc. 144A
6.125%, 9/15/32(1)(2) |
610
|
|
611
|
Post
Holdings, Inc. 144A
6.375%, 3/1/33(1)(2) |
760
|
|
749
|
| |
|
|
1,360
|
| |
|
|
|
| |
| Healthcare-Products—0.3%
|
|
|
Medline
Borrower LP 144A
5.250%, 10/1/29(1)(2) |
625
|
|
606
|
| Healthcare-Services—0.7%
|
|
|
Concentra
Escrow Issuer Corp. 144A
6.875%, 7/15/32(1)(2) |
575
|
|
594
|
Tenet
Healthcare Corp.
6.125%, 10/1/28(2) |
1,195
|
|
1,196
|
| |
|
|
1,790
|
| |
|
|
|
| |
| Hotel
& Resort REITs—0.2% |
|
|
Park
Intermediate Holdings LLC 144A
5.875%, 10/1/28(1)(2) |
510
|
|
504
|
| Insurance—0.4%
|
|
|
Panther
Escrow Issuer LLC 144A
7.125%, 6/1/31(1)(2) |
915
|
|
937
|
| Internet—0.2%
|
|
|
Gen
Digital, Inc. 144A
7.125%, 9/30/30(1)(2) |
550
|
|
566
|
| Investment
Companies—0.2% |
|
|
Compass
Group Diversified Holdings LLC 144A
5.250%, 4/15/29(1)(2) |
565
|
|
547
|
| Iron
& Steel—0.3% |
|
|
Cleveland-Cliffs,
Inc. 144A
7.000%, 3/15/32(1)(2) |
600
|
|
599
|
| Leisure
Time—0.8% |
|
|
Amer
Sports Co. 144A
6.750%, 2/16/31(1)(2) |
455
|
|
467
|
Carnival
Corp. 144A
10.500%, 6/1/30(1)(2) |
405
|
|
433
|
NCL
Corp., Ltd. 144A
6.750%, 2/1/32(1) |
590
|
|
599
|
See Notes to Financial Statements
Diversified Income &
Convertible Fund (ACV)
SCHEDULE OF INVESTMENTS (Continued)
January 31, 2025
($ reported in
thousands)
| |
Par
Value |
|
Value
|
| |
|
|
|
| Leisure
Time—continued |
|
|
Royal
Caribbean Cruises Ltd. 144A
6.250%, 3/15/32(1)(2) |
$ 385
|
|
$ 392
|
| |
|
|
1,891
|
| |
|
|
|
| |
| Lodging—0.5%
|
|
|
Hilton
Grand Vacations Borrower LLC 144A
5.000%, 6/1/29(1)(2) |
480
|
|
457
|
Station
Casinos LLC 144A
6.625%, 3/15/32(1)(2) |
765
|
|
770
|
| |
|
|
1,227
|
| |
|
|
|
| |
| Machinery-Diversified—0.3%
|
|
|
Chart
Industries, Inc. 144A
7.500%, 1/1/30(1)(2) |
735
|
|
768
|
| Media—1.7%
|
|
|
| CCO
Holdings LLC |
|
|
|
| 144A
6.375%, 9/1/29(1)(2) |
215
|
|
215
|
| 144A
7.375%, 3/1/31(1)(2) |
575
|
|
589
|
| Gray
Media, Inc. |
|
|
|
| 144A
7.000%, 5/15/27(1)(2) |
570
|
|
558
|
| 144A
4.750%, 10/15/30(1)(2) |
295
|
|
179
|
Nexstar
Media, Inc. 144A
5.625%, 7/15/27(1)(2) |
640
|
|
631
|
Sirius
XM Radio LLC 144A
5.500%, 7/1/29(1) |
915
|
|
891
|
TEGNA,
Inc.
5.000%, 9/15/29(2) |
640
|
|
602
|
Virgin
Media Secured Finance plc 144A
5.500%, 5/15/29(1)(2) |
565
|
|
541
|
| |
|
|
4,206
|
| |
|
|
|
| |
| Mining—0.5%
|
|
|
Arsenal
AIC Parent LLC 144A
8.000%, 10/1/30(1)(2) |
720
|
|
749
|
Hudbay
Minerals, Inc. 144A
6.125%, 4/1/29(1)(2) |
465
|
|
466
|
| |
|
|
1,215
|
| |
|
|
|
| |
| Oil,
Gas & Consumable Fuels—2.4% |
|
|
CITGO
Petroleum Corp. 144A
8.375%, 1/15/29(1)(2) |
430
|
|
444
|
Civitas
Resources, Inc. 144A
8.750%, 7/1/31(1)(2) |
850
|
|
896
|
CNX
Resources Corp. 144A
7.375%, 1/15/31(1)(2) |
750
|
|
770
|
Northern
Oil & Gas, Inc. 144A
8.750%, 6/15/31(1)(2) |
305
|
|
320
|
Permian
Resources Operating LLC 144A
6.250%, 2/1/33(1)(2) |
615
|
|
616
|
SM
Energy Co. 144A
7.000%, 8/1/32(1)(2) |
605
|
|
604
|
Transocean
Titan Financing Ltd. 144A
8.375%, 2/1/28(1)(2) |
600
|
|
615
|
USA
Compression Partners LP
6.875%, 9/1/27(2) |
755
|
|
760
|
| |
Par
Value |
|
Value
|
| |
|
|
|
| Oil,
Gas & Consumable Fuels—continued |
|
|
Weatherford
International Ltd. 144A
8.625%, 4/30/30(1)(2) |
$ 725
|
|
$
752 |
| |
|
|
5,777
|
| |
|
|
|
| |
| Paper
& Forest Products—0.1% |
|
|
Mercer
International, Inc. 144A
5.125%, 2/1/29(1)(2) |
300
|
|
266
|
| Pharmaceuticals—0.4%
|
|
|
Organon
& Co. 144A
7.875%, 5/15/34(1)(2) |
845
|
|
862
|
| Pipelines—0.3%
|
|
|
NGL
Energy Operating LLC 144A
8.375%, 2/15/32(1)(2) |
740
|
|
761
|
| Retail—1.0%
|
|
|
Bath
& Body Works, Inc. 144A
6.625%, 10/1/30(1)(2) |
330
|
|
336
|
Beacon
Roofing Supply, Inc. 144A
6.500%, 8/1/30(1)(2) |
210
|
|
217
|
Group
1 Automotive, Inc. 144A
6.375%, 1/15/30(1)(2) |
590
|
|
600
|
New
Red Finance, Inc. 144A
6.125%, 6/15/29(1)(2) |
605
|
|
613
|
Patrick
Industries, Inc. 144A
6.375%, 11/1/32(1)(2) |
610
|
|
601
|
| |
|
|
2,367
|
| |
|
|
|
| |
| Semiconductors—0.1%
|
|
|
Amkor
Technology, Inc. 144A
6.625%, 9/15/27(1)(2) |
225
|
|
225
|
| Software—0.4%
|
|
|
Central
Parent LLC 144A
8.000%, 6/15/29(1)(2) |
310
|
|
300
|
UKG,
Inc. 144A
6.875%, 2/1/31(1)(2) |
750
|
|
766
|
| |
|
|
1,066
|
| |
|
|
|
| |
| Telecommunications—0.4%
|
|
|
Frontier
Communications Holdings LLC 144A
8.750%, 5/15/30(1)(2) |
885
|
|
935
|
| Transportation—0.8%
|
|
|
Fortress
Transportation & Infrastructure Investors LLC 144A
7.875%, 12/1/30(1)(2) |
870
|
|
908
|
XPO,
Inc. 144A
7.125%, 6/1/31(1)(2) |
890
|
|
919
|
| |
|
|
1,827
|
Total
Corporate Bonds and Notes
(Identified Cost $55,018) |
|
55,706
|
See Notes to Financial Statements
Diversified Income &
Convertible Fund (ACV)
SCHEDULE OF INVESTMENTS (Continued)
January 31, 2025
($ reported in
thousands)
| |
Shares
|
|
Value
|
| Convertible
Preferred Stocks—9.0% |
| Aerospace
& Defense—2.3% |
|
|
| Boeing
Co. (The), 6.000%(2) |
93,705
|
|
$
5,621 |
| Banks—2.4%
|
|
|
| Wells
Fargo & Co. Series L, 7.500%(2) |
4,850
|
|
5,766
|
| Capital
Markets—0.8% |
|
|
| Ares
Management Corp. Series B, 6.750%(2) |
30,855
|
|
1,873
|
| Chemicals—0.4%
|
|
|
| Albemarle
Corp., 7.250%(2) |
21,890
|
|
887
|
| Electric
Utilities—0.6% |
|
|
| NextEra
Energy, Inc., 6.926%(2) |
34,875
|
|
1,447
|
| Financial
Services—0.6% |
|
|
| Apollo
Global Management, Inc., 6.750%(2) |
17,940
|
|
1,598
|
| Healthcare
Providers & Services—0.6% |
|
|
| BrightSpring
Health Services, Inc., 6.750%(2) |
17,455
|
|
1,448
|
| Machinery—0.3%
|
|
|
| Chart
Industries, Inc. Series B, 6.750%(2) |
9,415
|
|
732
|
| Software—0.2%
|
|
|
| MicroStrategy,
Inc., 8.000% |
5,460
|
|
442
|
| Technology
Hardware, Storage & Peripherals—0.8% |
|
|
| Hewlett
Packard Enterprise Co., 7.625%(2) |
31,670
|
|
1,936
|
Total
Convertible Preferred Stocks
(Identified Cost $19,802) |
|
21,750
|
| |
|
|
|
| |
| |
|
|
|
| |
| Preferred
Stock—0.0% |
| Entertainment—0.0%
|
|
|
| LiveStyle,
Inc. Series B(4)(5)(6) |
630
|
|
63
|
Total
Preferred Stock
(Identified Cost $62) |
|
63
|
| |
|
|
|
| |
| |
|
|
|
| |
| Common
Stocks—34.6% |
| Air
Freight & Logistics—0.1% |
|
|
| FedEx
Corp. |
1,195
|
|
316
|
| Automobiles—0.7%
|
|
|
| Tesla,
Inc.(5)(7) |
4,015
|
|
1,624
|
| Banks—2.2%
|
|
|
| Bank
of America Corp. |
30,435
|
|
1,409
|
| CCF
Holdings LLC(4)(5) |
1,026,972
|
|
52
|
| CCF
Holdings LLC Class M(4)(5) |
219,990
|
|
11
|
| Citigroup,
Inc. |
20,130
|
|
1,639
|
| JPMorgan
Chase & Co.(7) |
7,910
|
|
2,114
|
| |
|
|
5,225
|
| |
|
|
|
| |
| Beverages—0.2%
|
|
|
| Coca-Cola
Co. (The) |
7,035
|
|
447
|
| |
Shares
|
|
Value
|
| |
|
|
|
| Biotechnology—0.7%
|
|
|
| AbbVie,
Inc. |
4,080
|
|
$ 751
|
| Regeneron
Pharmaceuticals, Inc.(5) |
630
|
|
424
|
| Vertex
Pharmaceuticals, Inc.(5) |
1,010
|
|
466
|
| |
|
|
1,641
|
| |
|
|
|
| |
| Broadline
Retail—1.8% |
|
|
| Amazon.com,
Inc.(5) |
18,585
|
|
4,417
|
| Capital
Markets—1.3% |
|
|
| Intercontinental
Exchange, Inc. |
1,375
|
|
220
|
| KKR
& Co., Inc. |
6,910
|
|
1,154
|
| Moody’s
Corp. |
1,780
|
|
889
|
| Morgan
Stanley |
6,205
|
|
859
|
| |
|
|
3,122
|
| |
|
|
|
| |
| Chemicals—0.9%
|
|
|
| Air
Products & Chemicals, Inc. |
2,120
|
|
711
|
| DuPont
de Nemours, Inc. |
5,514
|
|
424
|
| Ecolab,
Inc. |
2,500
|
|
625
|
| Linde
plc |
1,235
|
|
551
|
| |
|
|
2,311
|
| |
|
|
|
| |
| Commercial
Services & Supplies—0.4% |
|
|
| Cintas
Corp. |
2,265
|
|
454
|
| Waste
Management, Inc. |
2,555
|
|
563
|
| |
|
|
1,017
|
| |
|
|
|
| |
| Communications
Equipment—0.3% |
|
|
| Motorola
Solutions, Inc. |
1,355
|
|
636
|
| Construction
& Engineering—0.2% |
|
|
| Quanta
Services, Inc. |
1,990
|
|
612
|
| Consumer
Finance—0.5% |
|
|
| Capital
One Financial Corp. |
2,735
|
|
557
|
| Discover
Financial Services |
3,140
|
|
632
|
| |
|
|
1,189
|
| |
|
|
|
| |
| Consumer
Staples Distribution & Retail—1.2% |
|
|
| Costco
Wholesale Corp. |
965
|
|
946
|
| Target
Corp. |
4,975
|
|
686
|
| Walmart,
Inc. |
13,265
|
|
1,302
|
| |
|
|
2,934
|
| |
|
|
|
| |
| Diversified
Telecommunication Services—0.2% |
|
|
| AT&T,
Inc. |
23,755
|
|
564
|
| Electric
Utilities—0.5% |
|
|
| Constellation
Energy Corp. |
1,005
|
|
302
|
| Exelon
Corp. |
23,505
|
|
940
|
| |
|
|
1,242
|
| |
|
|
|
| |
| Electrical
Equipment—0.6% |
|
|
| Eaton
Corp. plc |
1,470
|
|
480
|
| Emerson
Electric Co. |
4,440
|
|
577
|
See Notes to Financial Statements
Diversified Income &
Convertible Fund (ACV)
SCHEDULE OF INVESTMENTS (Continued)
January 31, 2025
($ reported in
thousands)
| |
Shares
|
|
Value
|
| |
|
|
|
| Electrical
Equipment—continued |
|
|
| Rockwell
Automation, Inc. |
1,920
|
|
$ 534
|
| |
|
|
1,591
|
| |
|
|
|
| |
| Entertainment—0.5%
|
|
|
| LiveStyle,
Inc. (4)(5)(6) |
13,574
|
|
—
|
| Netflix,
Inc.(5) |
970
|
|
947
|
| Take-Two
Interactive Software, Inc.(5) |
1,190
|
|
221
|
| |
|
|
1,168
|
| |
|
|
|
| |
| Financial
Services—1.3% |
|
|
| Fiserv,
Inc.(5) |
2,345
|
|
506
|
| Mastercard,
Inc. Class A(7) |
4,245
|
|
2,358
|
| PayPal
Holdings, Inc.(5) |
2,955
|
|
262
|
| |
|
|
3,126
|
| |
|
|
|
| |
| Healthcare
Equipment & Supplies—1.0% |
|
|
| Boston
Scientific Corp.(5) |
10,800
|
|
1,106
|
| Intuitive
Surgical, Inc.(5)(7) |
2,225
|
|
1,272
|
| |
|
|
2,378
|
| |
|
|
|
| |
| Healthcare
Providers & Services—1.1% |
|
|
| CVS
Health Corp. |
7,965
|
|
450
|
| McKesson
Corp. |
1,325
|
|
788
|
| UnitedHealth
Group, Inc. |
2,455
|
|
1,332
|
| |
|
|
2,570
|
| |
|
|
|
| |
| Hotels,
Restaurants & Leisure—0.8% |
|
|
| Chipotle
Mexican Grill, Inc. Class A(5) |
12,735
|
|
743
|
| McDonald’s
Corp. |
1,835
|
|
530
|
| Starbucks
Corp. |
6,230
|
|
671
|
| |
|
|
1,944
|
| |
|
|
|
| |
| Industrial
Conglomerates—1.0% |
|
|
| 3M
Co. |
6,795
|
|
1,034
|
| General
Electric Co.(7) |
6,680
|
|
1,360
|
| |
|
|
2,394
|
| |
|
|
|
| |
| Insurance—0.7%
|
|
|
| Allstate
Corp. (The) |
4,290
|
|
825
|
| Aon
plc Class A |
2,405
|
|
892
|
| |
|
|
1,717
|
| |
|
|
|
| |
| Interactive
Media & Services—2.9% |
|
|
| Alphabet,
Inc. Class A |
12,680
|
|
2,587
|
| Alphabet,
Inc. Class C |
6,120
|
|
1,258
|
| Meta
Platforms, Inc. Class A(7) |
4,695
|
|
3,236
|
| |
|
|
7,081
|
| |
|
|
|
| |
| IT
Services—0.6% |
|
|
| Accenture
plc Class A |
1,510
|
|
581
|
| Cloudflare,
Inc. Class A(5) |
2,955
|
|
409
|
| GoDaddy,
Inc. Class A(5) |
1,710
|
|
364
|
| |
|
|
1,354
|
| |
|
|
|
| |
| |
Shares
|
|
Value
|
| |
|
|
|
| Life
Sciences Tools & Services—0.3% |
|
|
| Danaher
Corp. |
2,815
|
|
$ 627
|
| Machinery—0.6%
|
|
|
| Deere
& Co. |
1,255
|
|
598
|
| Parker-Hannifin
Corp. |
1,080
|
|
764
|
| |
|
|
1,362
|
| |
|
|
|
| |
| Oil,
Gas & Consumable Fuels—0.2% |
|
|
| Williams
Cos., Inc. (The) |
7,845
|
|
435
|
| Pharmaceuticals—0.2%
|
|
|
| Eli
Lilly & Co. |
660
|
|
535
|
| Real
Estate Management & Development—0.4% |
|
|
| CBRE
Group, Inc. Class A(5) |
3,330
|
|
482
|
| CoStar
Group, Inc.(5) |
5,825
|
|
446
|
| |
|
|
928
|
| |
|
|
|
| |
| Semiconductors
& Semiconductor Equipment—2.7% |
|
|
| Broadcom,
Inc. |
2,135
|
|
473
|
| KLA
Corp. |
465
|
|
343
|
| Marvell
Technology, Inc. |
2,713
|
|
306
|
| Micron
Technology, Inc. |
2,410
|
|
220
|
| NVIDIA
Corp. |
38,770
|
|
4,655
|
| Texas
Instruments, Inc. |
2,995
|
|
553
|
| |
|
|
6,550
|
| |
|
|
|
| |
| Software—4.5%
|
|
|
| Atlassian
Corp. Class A(5) |
1,900
|
|
583
|
| Autodesk,
Inc.(5) |
2,145
|
|
668
|
| Cadence
Design Systems, Inc.(5) |
1,784
|
|
531
|
| Crowdstrike
Holdings, Inc. Class A(5) |
2,340
|
|
931
|
| Microsoft
Corp.(7) |
12,114
|
|
5,028
|
| Oracle
Corp. |
3,385
|
|
576
|
| Salesforce,
Inc.(7) |
4,300
|
|
1,469
|
| ServiceNow,
Inc.(5) |
1,015
|
|
1,034
|
| |
|
|
10,820
|
| |
|
|
|
| |
| Specialized
REITs—0.5% |
|
|
| American
Tower Corp. |
2,170
|
|
401
|
| Equinix,
Inc. |
815
|
|
745
|
| |
|
|
1,146
|
| |
|
|
|
| |
| Specialty
Retail—1.5% |
|
|
| Chewy,
Inc. Class A(5) |
12,050
|
|
470
|
| Home
Depot, Inc. (The) |
3,505
|
|
1,444
|
| O’Reilly
Automotive, Inc.(5) |
355
|
|
459
|
| TJX
Cos., Inc. (The)(7) |
8,040
|
|
1,003
|
| Ulta
Beauty, Inc.(5)(7) |
575
|
|
237
|
| |
|
|
3,613
|
| |
|
|
|
| |
| Technology
Hardware, Storage & Peripherals—1.9% |
|
|
| Apple,
Inc. |
20,060
|
|
4,734
|
See Notes to Financial Statements
Diversified Income &
Convertible Fund (ACV)
SCHEDULE OF INVESTMENTS (Continued)
January 31, 2025
($ reported in
thousands)
| |
Shares
|
|
Value
|
| |
|
|
|
| Wireless
Telecommunication Services—0.1% |
|
|
| T-Mobile
US, Inc. |
1,585
|
|
$
369 |
Total
Common Stocks
(Identified Cost $75,620) |
|
83,739
|
| |
|
|
|
| |
| |
|
|
|
| |
| Warrant—0.0%
|
| Banks—0.0%
|
|
|
| CCF
Holdings LLC, 3/25/26(4)(5) |
363,920
|
|
7
|
Total
Warrant
(Identified Cost $—) |
|
7
|
| |
|
|
|
| |
| |
|
|
|
| |
Total
Long-Term Investments—136.6%
(Identified Cost $310,124) |
|
330,216
|
| |
|
|
|
| |
| |
|
|
|
| |
| Short-Term
Investment—4.5% |
| Money
Market Mutual Fund—4.5% |
| BlackRock
Liquidity FedFund - Institutional Shares (seven-day effective yield 4.262%)(8) |
10,876,169
|
|
10,876
|
Total
Short-Term Investment
(Identified Cost $10,876) |
|
10,876
|
| |
|
|
|
| |
| |
|
|
|
| |
TOTAL
INVESTMENTS, BEFORE WRITTEN OPTIONS—141.1%
(Identified Cost $321,000) |
|
341,092
|
| |
|
|
| Written
Options—(0.0)% |
| (See
open written options schedule) |
|
|
Total
Written Options
(Premiums Received $15) |
(19)
|
| |
|
|
| |
| |
|
|
| |
TOTAL
INVESTMENTS, NET OF WRITTEN OPTIONS—141.1%
(Identified Cost $320,985) |
$341,073
|
| Other
assets and liabilities, net—(41.1)% |
(99,282)
|
| NET
ASSETS—100.0% |
$241,791
|
| Abbreviations:
|
| LLC
|
Limited
Liability Company |
| LP
|
Limited
Partnership |
| OP
|
Operating
Partnership |
| plc
|
Public
Limited Company |
| REIT
|
Real
Estate Investment Trust |
| Footnote
Legend: |
|
(1) |
Security
exempt from registration under Rule 144A of the Securities Act of 1933. These securities may be resold in transactions exempt from registration, normally to qualified institutional buyers. At January 31, 2025, these securities amounted to a value
of $124,685 or 51.6% of net assets. |
|
(2) |
All
or a portion of the security is segregated as collateral for margin loan financing. The value of securities segregated as collateral is $194,366. |
|
(3) |
Issued
with a zero coupon. Income is recognized through the accretion of discount. |
|
(4) |
The
value of this security was determined using significant unobservable inputs and is reported as a Level 3 security in the Fair Value Hierarchy table located after the Schedule of Investments. |
|
(5) |
Non-income
producing. |
|
(6) |
Security
is restricted from resale. |
|
(7) |
All
or a portion of the security is segregated as collateral for written options. The value of securities segregated as collateral is $9,161. |
|
(8) |
Shares
of this fund are publicly offered, and its prospectus and annual report are publicly available. |
| Country
Weightings (Unaudited)† |
| United
States |
92%
|
| Cayman
Islands |
3
|
| Canada
|
2
|
| Bermuda
|
1
|
| Liberia
|
1
|
| Ireland
|
1
|
| Total
|
100%
|
|
† % of total investments, net of written options, as of January 31, 2025. |
For information regarding the abbreviations, see the Key
Investment Terms starting on page 16.
See Notes to Financial Statements
Diversified Income &
Convertible Fund (ACV)
SCHEDULE OF INVESTMENTS (Continued)
January 31, 2025
($ reported in
thousands)
| Open
written options contracts as of January 31, 2025 were as follows: |
| Description
of Options |
Number
of
Contracts |
Contract
Notional
Amount |
Strike
Price(1) |
Expiration
Date |
Value
|
| Call
Options(2) |
|
|
|
|
|
| Apple,
Inc. |
(100)
|
$(2,650)
|
$265.00
|
02/21/25
|
$
(2) |
| Atlassian
Corp. |
(10)
|
(360)
|
360.00
|
02/21/25
|
(1)
|
| General
Electric Co. |
(33)
|
(726)
|
220.00
|
02/21/25
|
(2)
|
| Intuitive
Surgical, Inc. |
(15)
|
(960)
|
640.00
|
02/21/25
|
(—)
(3) |
| JPMorgan
Chase & Co. |
(20)
|
(550)
|
275.00
|
02/21/25
|
(4)
|
| Mastercard,
Inc. |
(15)
|
(930)
|
620.00
|
02/21/25
|
(—)
(3) |
| Meta
Platforms, Inc. |
(23)
|
(1,783)
|
775.00
|
02/21/25
|
(3)
|
| Microsoft
Corp. |
(64)
|
(3,008)
|
470.00
|
02/21/25
|
(1)
|
| Salesforce,
Inc. |
(22)
|
(814)
|
370.00
|
02/21/25
|
(3)
|
| Tesla,
Inc. |
(16)
|
(816)
|
510.00
|
02/21/25
|
(2)
|
| TJX
Cos., Inc. (The) |
(40)
|
(520)
|
130.00
|
02/21/25
|
(1)
|
| Ulta
Beauty, Inc. |
(3)
|
(138)
|
460.00
|
02/21/25
|
(—)
(3) |
| Total
Written Options |
|
$19)
|
|
Footnote Legend: |
|
(1) |
Strike
price not reported in thousands. |
|
(2) |
Exchange-traded
options. |
|
(3) |
Amount
is less than $500 (not in thousands). |
The following table summarizes the value of the
Fund’s investments as of January 31, 2025, based on the inputs used to value them (See Security Valuation Note 2A in the Notes to Financial Statements):
| |
Total
Value at
January 31, 2025 |
|
Level
1
Quoted Prices |
|
Level
2
Significant
Observable
Inputs |
|
Level
3
Significant
Unobservable
Inputs |
| Assets:
|
|
|
|
|
|
|
|
| Debt
Instruments: |
|
|
|
|
|
|
|
| Convertible
Bonds and Notes |
$168,951
|
|
$
— |
|
$168,951
|
|
$
— |
| Corporate
Bonds and Notes |
55,706
|
|
—
|
|
55,706
|
|
—
|
| Equity
Securities: |
|
|
|
|
|
|
|
| Convertible
Preferred Stocks |
21,750
|
|
21,750
|
|
—
|
|
—
|
| Preferred
Stock |
63
|
|
—
|
|
—
|
|
63
|
| Common
Stocks |
83,739
|
|
83,676
|
|
—
|
|
63
(1) |
| Warrant
|
7
|
|
—
|
|
—
|
|
7
|
| Money
Market Mutual Fund |
10,876
|
|
10,876
|
|
—
|
|
—
|
| Total
Assets |
341,092
|
|
116,302
|
|
224,657
|
|
133
|
| Liabilities:
|
|
|
|
|
|
|
|
| Other
Financial Instruments: |
|
|
|
|
|
|
|
| Written
Options |
(19)
|
|
(18)
|
|
(1)
|
|
—
|
| Total
Liabilities |
(19)
|
|
(18)
|
|
(1)
|
|
—
|
| Total
Investments, Net of Written Options |
$341,073
|
|
$116,284
|
|
$224,656
|
|
$133
|
|
(1) |
Includes
internally fair valued securities currently priced at zero ($0). |
There were no transfers into or out of Level 3 related
to securities held at January 31, 2025.
Some of
the Fund’s investments that were categorized as Level 3 may have been valued utilizing third party pricing information without adjustment. If applicable, such valuations are based on unobservable inputs. A significant change in third party
information could result in a significantly lower or higher value of Level 3 investments.
See Notes to Financial Statements
Diversified Income &
Convertible Fund (ACV)
SCHEDULE OF INVESTMENTS (Continued)
January 31, 2025
($ reported in
thousands)
The following is a reconciliation of assets of the Fund
for Level 3 investments for which significant unobservable inputs were used to determine fair value.
| |
Total
|
|
Preferred
Stock |
|
Common
stocks |
|
Warrant
|
|
Convertible
Bonds
and Notes |
| Investments
in Securities |
|
|
|
|
|
|
|
|
|
| Balance
as of January 31, 2024: |
$
1,988 |
|
$ 63
|
|
$ —
(a) |
|
$ —
(a) |
|
$
1,925 |
| Net
realized gain (loss) |
(110)
|
|
—
|
|
—
|
|
—
|
|
(110)
|
| Net
change in unrealized appreciation (depreciation)(b) |
111
|
|
—
|
|
63
|
|
7
|
|
41
|
| Purchases
|
155
|
|
—
|
|
—
|
|
—
|
|
155
|
| Sales
(c) |
(2,011)
|
|
—
|
|
—
|
|
—
|
|
(2,011)
|
| Balance
as of January 31, 2025 |
$
133 |
|
$ 63
|
|
$ 63
(a) |
|
$
7 |
|
$
— |
(a) Includes internally fair valued securities currently priced at zero ($0).
(b) The net change in unrealized appreciation (depreciation) on investments still held at January 31, 2025, was $70.
(c) Includes paydowns on securities.
The following table presents additional information
about valuation techniques and inputs used for investments that are measured at fair value and categorized within Level 3 at January 31, 2025:
Investments
in
Securities – Assets |
|
Ending
Balance
at January 31, 2025 |
|
Valuation
Technique
Used |
|
Unobservable
Inputs |
|
Input
Values |
|
Impact
to Valuation
from an Increase in
Unobservable Inputs(a) |
| Preferred
Stock: |
|
|
|
|
|
|
|
|
|
|
LiveStyle,
Inc.
Series B |
|
$63
|
|
Discounted
cash flows
liquidation approach |
|
Discount rate |
|
21.61%
(21.34% - 21.85%) |
|
Decrease
|
| |
|
|
|
|
|
|
|
|
|
|
| |
|
|
|
|
|
|
|
|
|
|
| Common
Stocks: |
|
|
|
|
|
|
|
|
|
|
| CCF
Holdings LLC |
|
$52
|
|
OPM
and Last transaction |
|
Volatility |
|
42.94%
(39.1% - 55.9%) |
|
Increase
|
| |
|
|
|
|
|
|
|
|
|
|
CCF
Holdings LLC
Class M |
|
$11
|
|
OPM
and Last transaction |
|
Volatility |
|
42.94%
(39.1% - 55.9%) |
|
Increase
|
| |
|
|
|
|
|
|
|
|
|
|
| |
|
|
|
|
|
|
|
|
|
|
| Warrant:
|
|
|
|
|
|
|
|
|
|
|
| CCF
Holdings LLC |
|
$
7 |
|
Black-Scholes
Model |
|
Volatility |
|
42.94%
(39.1% - 55.9%) |
|
Increase
|
| |
|
|
|
|
|
|
|
|
|
|
| |
|
|
|
|
|
|
|
|
|
|
(a) A significant change in unobservable inputs could result in a significantly higher or lower fair value.
See Notes to Financial Statements
Dividend, Interest &
Premium Strategy Fund (NFJ)
SCHEDULE OF INVESTMENTS
January 31, 2025
($ reported in thousands)
| |
Par
Value |
|
Value
|
| Convertible
Bonds and Notes—17.4% |
| Aerospace
& Defense—0.1% |
|
|
Rocket
Lab USA, Inc. 144A
4.250%, 2/1/29(1) |
$ 305
|
|
$ 1,747
|
| Auto
Manufacturers—0.3% |
|
|
| Rivian
Automotive, Inc. |
|
|
|
| 4.625%,
3/15/29 |
2,165
|
|
2,148
|
| 3.625%,
10/15/30 |
2,555
|
|
2,276
|
| |
|
|
4,424
|
| |
|
|
|
| |
| Biotechnology—1.1%
|
|
|
Alnylam
Pharmaceuticals, Inc.
1.000%, 9/15/27 |
3,015
|
|
3,456
|
Bridgebio
Pharma, Inc.
2.500%, 3/15/27 |
1,600
|
|
1,817
|
Halozyme
Therapeutics, Inc.
0.250%, 3/1/27 |
2,860
|
|
2,876
|
Insmed,
Inc.
0.750%, 6/1/28 |
1,020
|
|
2,444
|
PTC
Therapeutics, Inc.
1.500%, 9/15/26 |
1,265
|
|
1,423
|
Sarepta
Therapeutics, Inc.
1.250%, 9/15/27 |
1,230
|
|
1,317
|
Travere
Therapeutics, Inc.
2.250%, 3/1/29 |
1,400
|
|
1,420
|
| |
|
|
14,753
|
| |
|
|
|
| |
| Commercial
Services—0.6% |
|
|
Affirm
Holdings, Inc. 144A
0.750%, 12/15/29(1) |
2,480
|
|
2,424
|
Global
Payments, Inc. 144A
1.500%, 3/1/31(1) |
2,680
|
|
2,624
|
Shift4
Payments, Inc.
0.500%, 8/1/27 |
2,865
|
|
3,355
|
| |
|
|
8,403
|
| |
|
|
|
| |
| Computers—0.9%
|
|
|
Lumentum
Holdings, Inc.
0.500%, 12/15/26 |
3,555
|
|
3,984
|
PAR
Technology Corp.
1.500%, 10/15/27 |
1,965
|
|
2,289
|
Seagate
HDD Cayman
3.500%, 6/1/28 |
1,745
|
|
2,252
|
Western
Digital Corp.
3.000%, 11/15/28 |
1,535
|
|
2,161
|
Zscaler,
Inc.
0.125%, 7/1/25 |
870
|
|
1,187
|
| |
|
|
11,873
|
| |
|
|
|
| |
| Diversified
REITS—0.2% |
|
|
Digital
Realty Trust LP 144A
1.875%, 11/15/29(1) |
3,015
|
|
3,044
|
| Electric
Utilities—1.2% |
|
|
NextEra
Energy Capital Holdings, Inc. 144A
3.000%, 3/1/27(1) |
3,520
|
|
4,060
|
NRG
Energy, Inc.
2.750%, 6/1/48 |
405
|
|
1,010
|
| |
Par
Value |
|
Value
|
| |
|
|
|
| Electric
Utilities—continued |
|
|
PG&E
Corp.
4.250%, 12/1/27 |
$ 6,000
|
|
$ 6,105
|
Southern
Co. (The)
3.875%, 12/15/25 |
4,365
|
|
4,605
|
| |
|
|
15,780
|
| |
|
|
|
| |
| Electronics—0.4%
|
|
|
Advanced
Energy Industries, Inc.
2.500%, 9/15/28 |
1,775
|
|
1,946
|
Itron,
Inc. 144A
1.375%, 7/15/30(1) |
620
|
|
646
|
OSI
Systems, Inc. 144A
2.250%, 8/1/29(1) |
2,615
|
|
3,128
|
| |
|
|
5,720
|
| |
|
|
|
| |
| Energy-Alternate
Sources—0.0% |
|
|
Sunrun,
Inc. 144A
4.000%, 3/1/30(1) |
440
|
|
382
|
| Engineering
& Construction—0.3% |
|
|
Fluor
Corp.
1.125%, 8/15/29 |
1,150
|
|
1,429
|
Granite
Construction, Inc. 144A
3.250%, 6/15/30(1) |
2,280
|
|
3,000
|
| |
|
|
4,429
|
| |
|
|
|
| |
| Entertainment—0.7%
|
|
|
Cinemark
Holdings, Inc.
4.500%, 8/15/25 |
430
|
|
863
|
IMAX
Corp.
0.500%, 4/1/26 |
2,035
|
|
2,112
|
Live
Nation Entertainment, Inc. 144A
2.875%, 1/15/30(1) |
6,105
|
|
6,355
|
| |
|
|
9,330
|
| |
|
|
|
| |
| Financial
Services—1.0% |
|
|
Coinbase
Global, Inc.
0.500%, 6/1/26 |
3,630
|
|
4,029
|
Encore
Capital Group, Inc.
4.000%, 3/15/29 |
1,625
|
|
1,681
|
Galaxy
Digital Holdings LP 144A
2.500%, 12/1/29(1) |
2,410
|
|
2,628
|
SoFi
Technologies, Inc. 144A
0.000%, 10/15/26(1) |
2,630
|
|
2,793
|
Upstart
Holdings, Inc. 144A
1.000%, 11/15/30(1) |
2,235
|
|
2,214
|
| |
|
|
13,345
|
| |
|
|
|
| |
| Health
Care REITs—0.5% |
|
|
Welltower
OP LLC 144A
3.125%, 7/15/29(1) |
5,715
|
|
6,821
|
| Healthcare-Products—1.2%
|
|
|
Alphatec
Holdings, Inc.
0.750%, 8/1/26 |
1,470
|
|
1,493
|
Envista
Holdings Corp.
2.375%, 6/1/25 |
1,340
|
|
1,447
|
See Notes to Financial Statements
Dividend, Interest &
Premium Strategy Fund (NFJ)
SCHEDULE OF INVESTMENTS (Continued)
January 31, 2025
($ reported in
thousands)
| |
Par
Value |
|
Value
|
| |
|
|
|
| Healthcare-Products—continued
|
|
|
Exact
Sciences Corp. 144A
1.750%, 4/15/31(1) |
$ 2,455
|
|
$ 2,299
|
Insulet
Corp.
0.375%, 9/1/26 |
2,060
|
|
2,728
|
iRhythm
Technologies, Inc. 144A
1.500%, 9/1/29(1) |
2,245
|
|
2,361
|
Lantheus
Holdings, Inc.
2.625%, 12/15/27 |
290
|
|
393
|
LeMaitre
Vascular, Inc. 144A
2.500%, 2/1/30(1) |
1,455
|
|
1,543
|
Merit
Medical Systems, Inc. 144A
3.000%, 2/1/29(1) |
1,645
|
|
2,277
|
Repligen
Corp.
1.000%, 12/15/28 |
1,095
|
|
1,184
|
Tandem
Diabetes Care, Inc. 144A
1.500%, 3/15/29(1) |
430
|
|
567
|
| |
|
|
16,292
|
| |
|
|
|
| |
| Industrial
REITs—0.1% |
|
|
Rexford
Industrial Realty LP 144A
4.375%, 3/15/27(1) |
1,260
|
|
1,250
|
| Internet—1.9%
|
|
|
Alibaba
Group Holding Ltd. 144A
0.500%, 6/1/31(1) |
965
|
|
1,128
|
Booking
Holdings, Inc.
0.750%, 5/1/25 |
850
|
|
2,141
|
Magnite,
Inc.
0.250%, 3/15/26 |
1,470
|
|
1,374
|
Palo
Alto Networks, Inc.
0.375%, 6/1/25 |
375
|
|
1,390
|
Q2
Holdings, Inc.
0.750%, 6/1/26 |
1,840
|
|
2,195
|
Sea
Ltd.
2.375%, 12/1/25 |
1,505
|
|
2,101
|
Shopify,
Inc.
0.125%, 11/1/25 |
2,145
|
|
2,245
|
Snap,
Inc.
0.750%, 8/1/26 |
1,735
|
|
1,706
|
Trip.com
Group Ltd. 144A
0.750%, 6/15/29(1) |
2,260
|
|
2,833
|
Uber
Technologies, Inc.
0.000%, 12/15/25 |
4,075
|
|
4,239
|
| Wayfair,
Inc. |
|
|
|
| 1.000%,
8/15/26 |
1,410
|
|
1,299
|
| 3.250%,
9/15/27 |
1,195
|
|
1,330
|
Zillow
Group, Inc.
2.750%, 5/15/25 |
1,230
|
|
1,535
|
| |
|
|
25,516
|
| |
|
|
|
| |
| Investment
Companies—0.2% |
|
|
IREN
Ltd. 144A
3.250%, 6/15/30(1) |
1,525
|
|
1,437
|
MARA
Holdings, Inc. 144A
0.000%, 6/1/31(1) |
1,820
|
|
1,542
|
| |
|
|
2,979
|
| |
|
|
|
| |
| |
Par
Value |
|
Value
|
| |
|
|
|
| Iron
& Steel—0.1% |
|
|
United
States Steel Corp.
5.000%, 11/1/26 |
$ 490
|
|
$ 1,357
|
| Leisure
Time—0.7% |
|
|
Carnival
Corp.
5.750%, 12/1/27 |
710
|
|
1,559
|
| NCL
Corp., Ltd. |
|
|
|
| 5.375%,
8/1/25 |
600
|
|
930
|
| 1.125%,
2/15/27 |
3,055
|
|
3,321
|
Peloton
Interactive, Inc. 144A
5.500%, 12/1/29(1) |
425
|
|
835
|
Royal
Caribbean Cruises Ltd.
6.000%, 8/15/25 |
615
|
|
3,287
|
| |
|
|
9,932
|
| |
|
|
|
| |
| Machinery-Construction
& Mining—0.1% |
|
|
Bloom
Energy Corp. 144A
3.000%, 6/1/29(1) |
1,135
|
|
1,561
|
| Machinery-Diversified—0.1%
|
|
|
Middleby
Corp. (The)
1.000%, 9/1/25 |
1,050
|
|
1,411
|
| Media—0.4%
|
|
|
| Liberty
Broadband Corp. |
|
|
|
| 144A
3.125%, 3/31/53(1) |
1,385
|
|
1,370
|
| 144A
3.125%, 6/30/54(1) |
1,470
|
|
1,624
|
Liberty
Media Corp.-Liberty Formula One
2.250%, 8/15/27 |
1,355
|
|
1,708
|
| |
|
|
4,702
|
| |
|
|
|
| |
| Metal
Fabricate/Hardware—0.2% |
|
|
Xometry,
Inc.
1.000%, 2/1/27 |
2,465
|
|
2,449
|
| Mining—0.2%
|
|
|
MP
Materials Corp. 144A
3.000%, 3/1/30(1) |
2,235
|
|
2,851
|
| Miscellaneous
Manufacturing—0.2% |
|
|
Axon
Enterprise, Inc.
0.500%, 12/15/27 |
695
|
|
1,985
|
| Oil,
Gas & Consumable Fuels—0.1% |
|
|
UGI
Corp. 144A
5.000%, 6/1/28(1) |
1,275
|
|
1,540
|
| Passenger
Airlines—0.3% |
|
|
American
Airlines Group, Inc.
6.500%, 7/1/25 |
3,325
|
|
3,785
|
JetBlue
Airways Corp. 144A
2.500%, 9/1/29(1) |
540
|
|
687
|
| |
|
|
4,472
|
| |
|
|
|
| |
| Retail—0.5%
|
|
|
Burlington
Stores, Inc.
1.250%, 12/15/27 |
2,095
|
|
3,126
|
See Notes to Financial Statements
Dividend, Interest &
Premium Strategy Fund (NFJ)
SCHEDULE OF INVESTMENTS (Continued)
January 31, 2025
($ reported in
thousands)
| |
Par
Value |
|
Value
|
| |
|
|
|
| Retail—continued
|
|
|
Freshpet,
Inc.
3.000%, 4/1/28 |
$ 990
|
|
$ 2,349
|
Shake
Shack, Inc.
0.000%, 3/1/28 |
1,955
|
|
1,936
|
| |
|
|
7,411
|
| |
|
|
|
| |
| Retail
REIT—0.1% |
|
|
Federal
Realty OP LP 144A
3.250%, 1/15/29(1) |
1,335
|
|
1,356
|
| Semiconductors—0.6%
|
|
|
MACOM
Technology Solutions Holdings, Inc. 144A
0.000%, 12/15/29(1)(2) |
1,685
|
|
1,703
|
ON
Semiconductor Corp.
0.500%, 3/1/29 |
2,015
|
|
1,810
|
Semtech
Corp.
1.625%, 11/1/27 |
810
|
|
1,533
|
Synaptics,
Inc. 144A
0.750%, 12/1/31(1) |
1,645
|
|
1,782
|
Wolfspeed,
Inc.
0.250%, 2/15/28 |
2,135
|
|
984
|
| |
|
|
7,812
|
| |
|
|
|
| |
| Software—2.9%
|
|
|
Akamai
Technologies, Inc.
0.125%, 5/1/25 |
1,635
|
|
1,774
|
Alignment
Healthcare, Inc. 144A
4.250%, 11/15/29(1) |
2,210
|
|
2,839
|
BILL
Holdings, Inc. 144A
0.000%, 4/1/30(1) |
3,155
|
|
3,368
|
Cloudflare,
Inc.
0.000%, 8/15/26(2) |
3,105
|
|
3,197
|
Datadog,
Inc. 144A
0.000%, 12/1/29(1)(2) |
4,465
|
|
4,371
|
Guidewire
Software, Inc. 144A
1.250%, 11/1/29(1) |
3,055
|
|
3,307
|
HubSpot,
Inc.
0.375%, 6/1/25 |
920
|
|
2,529
|
| MicroStrategy,
Inc. |
|
|
|
| 144A
0.000%, 12/1/29(1)(2) |
5,950
|
|
5,165
|
| 144A
0.875%, 3/15/31(1) |
1,280
|
|
2,083
|
Nutanix,
Inc. 144A
0.500%, 12/15/29(1) |
3,090
|
|
3,210
|
Snowflake,
Inc. 144A
0.000%, 10/1/29(1) |
3,645
|
|
4,835
|
Tyler
Technologies, Inc.
0.250%, 3/15/26 |
1,090
|
|
1,364
|
Vertex,
Inc. 144A
0.750%, 5/1/29(1) |
1,250
|
|
2,107
|
| |
|
|
40,149
|
| |
|
|
|
| |
| Telecommunications—0.1%
|
|
|
Applied
Digital Corp. 144A
2.750%, 6/1/30(1) |
650
|
|
651
|
Viavi
Solutions, Inc.
1.625%, 3/15/26 |
1,105
|
|
1,213
|
| |
|
|
1,864
|
| |
|
|
|
| |
| |
Par
Value |
|
Value
|
| |
|
|
|
| Transportation—0.1%
|
|
|
World
Kinect Corp.
3.250%, 7/1/28 |
$ 1,140
|
|
$
1,305 |
Total
Convertible Bonds and Notes
(Identified Cost $224,994) |
|
238,245
|
| |
Shares
|
|
| Convertible
Preferred Stocks—2.3% |
| Aerospace
& Defense—0.6% |
|
| Boeing
Co. (The), 6.000% |
131,185
|
7,870
|
| Banks—0.6%
|
|
| Wells
Fargo & Co. Series L, 7.500% |
6,990
|
8,310
|
| Capital
Markets—0.2% |
|
| Ares
Management Corp. Series B, 6.750% |
44,105
|
2,677
|
| Chemicals—0.1%
|
|
| Albemarle
Corp., 7.250% |
31,705
|
1,285
|
| Electric
Utilities—0.2% |
|
| NextEra
Energy, Inc., 6.926% |
50,110
|
2,079
|
| Financial
Services—0.2% |
|
| Apollo
Global Management, Inc., 6.750% |
25,115
|
2,237
|
| Healthcare
Providers & Services—0.1% |
|
| BrightSpring
Health Services, Inc., 6.750% |
24,980
|
2,072
|
| Machinery—0.1%
|
|
| Chart
Industries, Inc. Series B, 6.750% |
13,390
|
1,041
|
| Software—0.0%
|
|
| MicroStrategy,
Inc., 8.000% |
7,645
|
619
|
| Technology
Hardware, Storage & Peripherals—0.2% |
|
| Hewlett
Packard Enterprise Co., 7.625% |
44,350
|
2,711
|
Total
Convertible Preferred Stocks
(Identified Cost $28,701) |
30,901
|
| |
|
|
| |
| |
|
|
| |
| Common
Stocks—74.4% |
| Aerospace
& Defense—0.8% |
|
| L3Harris
Technologies, Inc. |
55,293
|
11,723
|
| Automobile
Components—0.6% |
|
| Aptiv
plc(3) |
133,904
|
8,358
|
| Banks—10.4%
|
|
| Bank
of America Corp.(4) |
915,573
|
42,391
|
| Commerce
Bancshares, Inc. |
253,386
|
16,926
|
| JPMorgan
Chase & Co.(4) |
68,241
|
18,241
|
| PNC
Financial Services Group, Inc. (The) |
159,367
|
32,025
|
| Truist
Financial Corp. |
454,432
|
21,640
|
| U.S.
Bancorp |
217,814
|
10,407
|
| |
|
141,630
|
| |
|
|
| |
See Notes to
Financial Statements
Dividend, Interest &
Premium Strategy Fund (NFJ)
SCHEDULE OF INVESTMENTS (Continued)
January 31, 2025
($ reported in
thousands)
| |
Shares
|
|
Value
|
| |
|
|
|
| Beverages—0.7%
|
|
|
| Keurig
Dr Pepper, Inc. |
319,157
|
|
$ 10,245
|
| Building
Products—0.8% |
|
|
| Allegion
plc |
79,672
|
|
10,575
|
| Capital
Markets—4.6% |
|
|
| Blackrock,
Inc. |
10,160
|
|
10,927
|
| Charles
Schwab Corp. (The) |
65,996
|
|
5,459
|
| Goldman
Sachs Group, Inc. (The) |
8,563
|
|
5,484
|
| Intercontinental
Exchange, Inc. |
36,969
|
|
5,909
|
| MarketAxess
Holdings, Inc. |
37,590
|
|
8,294
|
| Morgan
Stanley |
80,223
|
|
11,105
|
| MSCI,
Inc. Class A |
27,063
|
|
16,150
|
| |
|
|
63,328
|
| |
|
|
|
| |
| Chemicals—0.7%
|
|
|
| FMC
Corp. |
176,691
|
|
9,856
|
| Commercial
Services & Supplies—0.8% |
|
|
| RB
Global, Inc. |
118,518
|
|
10,605
|
| Consumer
Staples Distribution & Retail—0.8% |
|
|
| Costco
Wholesale Corp. |
11,328
|
|
11,100
|
| Containers
& Packaging—0.7% |
|
|
| Ball
Corp. |
165,307
|
|
9,208
|
| Electric
Utilities—4.2% |
|
|
| Eversource
Energy |
341,863
|
|
19,719
|
| NextEra
Energy, Inc.(4) |
527,221
|
|
37,728
|
| |
|
|
57,447
|
| |
|
|
|
| |
| Energy
Equipment & Services—0.4% |
|
|
| Schlumberger
N.V. |
141,255
|
|
5,690
|
| Entertainment—1.2%
|
|
|
| Walt
Disney Co. (The) |
144,483
|
|
16,335
|
| Financial
Services—3.7% |
|
|
| Berkshire
Hathaway, Inc. Class B(3) |
35,837
|
|
16,796
|
| Jack
Henry & Associates, Inc. |
61,273
|
|
10,667
|
| Mastercard,
Inc. Class A |
20,502
|
|
11,387
|
| Visa,
Inc. Class A |
34,202
|
|
11,690
|
| |
|
|
50,540
|
| |
|
|
|
| |
| Food
Products—0.8% |
|
|
| Tyson
Foods, Inc. Class A |
189,905
|
|
10,728
|
| Health
Care REITs—0.8% |
|
|
| Alexandria
Real Estate Equities, Inc. |
111,352
|
|
10,840
|
| Healthcare
Equipment & Supplies—2.1% |
|
|
| Abbott
Laboratories |
96,093
|
|
12,293
|
| Medtronic
plc |
116,256
|
|
10,559
|
| Teleflex,
Inc. |
30,671
|
|
5,528
|
| |
|
|
28,380
|
| |
|
|
|
| |
| |
Shares
|
|
Value
|
| |
|
|
|
| Healthcare
Providers & Services—1.9% |
|
|
| HCA
Healthcare, Inc. |
16,524
|
|
$ 5,451
|
| UnitedHealth
Group, Inc. |
38,179
|
|
20,712
|
| |
|
|
26,163
|
| |
|
|
|
| |
| Healthcare
Technology—0.8% |
|
|
| Veeva
Systems, Inc. Class A(3) |
48,154
|
|
11,232
|
| Hotels,
Restaurants & Leisure—2.0% |
|
|
| Domino’s
Pizza, Inc. |
48,299
|
|
21,692
|
| Starbucks
Corp. |
49,802
|
|
5,363
|
| |
|
|
27,055
|
| |
|
|
|
| |
| Industrial
Conglomerates—1.5% |
|
|
| Honeywell
International, Inc. |
94,237
|
|
21,083
|
| Industrial
REITs—4.1% |
|
|
| Prologis,
Inc. |
180,822
|
|
21,563
|
| Rexford
Industrial Realty, Inc. |
858,754
|
|
34,917
|
| |
|
|
56,480
|
| |
|
|
|
| |
| Insurance—0.8%
|
|
|
| Willis
Towers Watson plc |
34,047
|
|
11,221
|
| Interactive
Media & Services—1.6% |
|
|
| Alphabet,
Inc. Class A |
110,349
|
|
22,513
|
| Life
Sciences Tools & Services—1.6% |
|
|
| Thermo
Fisher Scientific, Inc.(4) |
36,794
|
|
21,994
|
| Machinery—2.1%
|
|
|
| Stanley
Black & Decker, Inc. |
213,188
|
|
18,776
|
| Toro
Co. (The) |
113,358
|
|
9,439
|
| |
|
|
28,215
|
| |
|
|
|
| |
| Oil,
Gas & Consumable Fuels—5.1% |
|
|
| Chevron
Corp. |
140,145
|
|
20,908
|
| EOG
Resources, Inc. |
95,214
|
|
11,977
|
| Exxon
Mobil Corp. |
150,993
|
|
16,131
|
| Ovintiv,
Inc. |
231,533
|
|
9,775
|
| TC
Energy Corp. |
236,301
|
|
10,645
|
| |
|
|
69,436
|
| |
|
|
|
| |
| Pharmaceuticals—3.7%
|
|
|
| Bristol-Myers
Squibb Co. |
95,758
|
|
5,645
|
| Eli
Lilly & Co. |
14,023
|
|
11,374
|
| Johnson
& Johnson |
74,499
|
|
11,335
|
| Pfizer,
Inc. |
623,628
|
|
16,538
|
| Zoetis,
Inc. Class A |
32,123
|
|
5,490
|
| |
|
|
50,382
|
| |
|
|
|
| |
| Real
Estate Management & Development—0.4% |
|
|
| CoStar
Group, Inc.(3) |
72,304
|
|
5,538
|
| Residential
REITs—1.4% |
|
|
| Invitation
Homes, Inc. |
300,613
|
|
9,364
|
See Notes to Financial Statements
Dividend, Interest &
Premium Strategy Fund (NFJ)
SCHEDULE OF INVESTMENTS (Continued)
January 31, 2025
($ reported in
thousands)
| |
Shares
|
|
Value
|
| |
|
|
|
| Residential
REITs—continued |
|
|
| Sun
Communities, Inc. |
79,632
|
|
$
10,073 |
| |
|
|
19,437
|
| |
|
|
|
| |
| Semiconductors
& Semiconductor Equipment—1.1% |
|
|
| Advanced
Micro Devices, Inc.(3) |
128,266
|
|
14,873
|
| Software—4.3%
|
|
|
| ANSYS,
Inc.(3) |
16,207
|
|
5,681
|
| Intuit,
Inc. |
44,247
|
|
26,615
|
| Microsoft
Corp.(4) |
37,157
|
|
15,422
|
| Salesforce,
Inc. |
31,122
|
|
10,634
|
| |
|
|
58,352
|
| |
|
|
|
| |
| Specialized
REITs—2.5% |
|
|
| American
Tower Corp. |
53,278
|
|
9,854
|
| Crown
Castle, Inc. |
84,147
|
|
7,513
|
| Equinix,
Inc. |
7,199
|
|
6,577
|
| SBA
Communications Corp. Class A |
52,296
|
|
10,331
|
| |
|
|
34,275
|
| |
|
|
|
| |
| Specialty
Retail—1.5% |
|
|
| Best
Buy Co., Inc. |
74,890
|
|
6,430
|
| Home
Depot, Inc. (The)(4) |
33,028
|
|
13,607
|
| |
|
|
20,037
|
| |
|
|
|
| |
| Technology
Hardware, Storage & Peripherals—1.0% |
|
|
| Apple,
Inc.(4) |
59,478
|
|
14,037
|
| Textiles,
Apparel & Luxury Goods—0.7% |
|
|
| Lululemon
Athletica, Inc.(3) |
22,293
|
|
9,234
|
| Trading
Companies & Distributors—0.8% |
|
|
| MonotaRO
Co., Ltd. Unsponsored ADR |
639,320
|
|
11,060
|
| Water
Utilities—1.4% |
|
|
| American
Water Works Co., Inc. |
152,043
|
|
18,951
|
Total
Common Stocks
(Identified Cost $942,289) |
|
1,018,156
|
| |
|
|
|
| |
| |
|
|
|
| |
| Warrant—0.0%
|
| Energy
Equipment & Services—0.0% |
|
|
| Nabors
Industries Ltd., 6/11/26(3) |
876
|
|
4
|
Total
Warrant
(Identified Cost $—) |
|
4
|
| |
|
|
|
| |
| |
|
|
|
| |
Total
Long-Term Investments—94.1%
(Identified Cost $1,195,984) |
|
1,287,306
|
| |
|
|
|
| |
| |
|
|
|
| |
| |
Shares
|
|
Value
|
| |
|
|
|
| |
|
|
|
| Short-Term
Investment—2.7% |
| Money
Market Mutual Fund—2.7% |
| BlackRock
Liquidity FedFund - Institutional Shares (seven-day effective yield 4.262%)(5) |
36,472,425
|
|
$
36,472 |
Total
Short-Term Investment
(Identified Cost $36,472) |
|
36,472
|
| |
|
|
|
| |
| |
|
|
|
| |
TOTAL
INVESTMENTS, BEFORE WRITTEN OPTIONS—96.8%
(Identified Cost $1,232,456) |
|
1,323,778
|
| |
|
|
| Written
Options—(0.1)% |
| (See
open written options schedule) |
|
|
Total
Written Options
(Premiums Received $901) |
(1,329)
|
| |
|
|
| |
| |
|
|
| |
TOTAL
INVESTMENTS, NET OF WRITTEN OPTIONS—96.7%
(Identified Cost $1,231,555) |
$1,322,449
|
| Other
assets and liabilities, net—3.3% |
44,949
|
| NET
ASSETS—100.0% |
$1,367,398
|
| Abbreviations:
|
| ADR
|
American
Depositary Receipt |
| LLC
|
Limited
Liability Company |
| LP
|
Limited
Partnership |
| MSCI
|
Morgan
Stanley Capital International |
| OP
|
Operating
Partnership |
| plc
|
Public
Limited Company |
| REIT
|
Real
Estate Investment Trust |
| Footnote
Legend: |
|
(1) |
Security
exempt from registration under Rule 144A of the Securities Act of 1933. These securities may be resold in transactions exempt from registration, normally to qualified institutional buyers. At January 31, 2025, these securities amounted to a value
of $106,348 or 7.8% of net assets. |
|
(2) |
Issued
with a zero coupon. Income is recognized through the accretion of discount. |
|
(3) |
Non-income
producing. |
|
(4) |
All
or a portion of the security is segregated as collateral for written options. The value of securities segregated as collateral is $93,789. |
|
(5) |
Shares
of this fund are publicly offered, and its prospectus and annual report are publicly available. |
| Country
Weightings (Unaudited)† |
| United
States |
92%
|
| Canada
|
3
|
| Ireland
|
2
|
| Japan
|
1
|
| Cayman
Islands |
1
|
| Jersey
|
1
|
| Total
|
100%
|
|
† % of total investments, net of written options, as of January 31, 2025. |
For information regarding the abbreviations, see the Key Investment Terms
starting on page 16.
See Notes to Financial Statements
Dividend, Interest &
Premium Strategy Fund (NFJ)
SCHEDULE OF INVESTMENTS (Continued)
January 31, 2025
($ reported in
thousands)
| Open
written options contracts as of January 31, 2025 were as follows: |
| Description
of Options |
Number
of
Contracts |
Contract
Notional
Amount |
Strike
Price(1) |
Expiration
Date |
Value
|
| Call
Options(2) |
|
|
|
|
|
| Advanced
Micro Devices, Inc. |
(384)
|
$
(5,184) |
$
135.00 |
02/21/25
|
$
(50) |
| Alexandria
Real Estate Equities, Inc. |
(390)
|
(4,290)
|
110.00
|
02/21/25
|
(4)
|
| Alphabet,
Inc. |
(389)
|
(8,558)
|
220.00
|
02/21/25
|
(93)
|
| American
Tower Corp. |
(106)
|
(2,226)
|
210.00
|
02/21/25
|
(1)
|
| American
Water Works Co., Inc. |
(228)
|
(3,078)
|
135.00
|
02/21/25
|
(4)
|
| Apple,
Inc. |
(208)
|
(5,200)
|
250.00
|
02/21/25
|
(21)
|
| Aptiv
plc |
(400)
|
(2,800)
|
70.00
|
02/21/25
|
(28)
|
| Bank
of America Corp. |
(1,830)
|
(9,607)
|
52.50
|
02/21/25
|
(5)
|
| Bank
of America Corp. |
(915)
|
(5,032)
|
55.00
|
03/21/25
|
(4)
|
| Chevron
Corp. |
(490)
|
(8,575)
|
175.00
|
02/21/25
|
(2)
|
| Costco
Wholesale Corp. |
(39)
|
(3,900)
|
1,000.00
|
02/21/25
|
(41)
|
| Domino’s
Pizza, Inc. |
(129)
|
(5,934)
|
460.00
|
02/21/25
|
(114)
|
| Eli
Lilly & Co. |
(42)
|
(3,402)
|
810.00
|
02/21/25
|
(131)
|
| EOG
Resources, Inc. |
(285)
|
(4,275)
|
150.00
|
02/21/25
|
(1)
|
| Exxon
Mobil Corp. |
(528)
|
(6,600)
|
125.00
|
02/21/25
|
(1)
|
| FMC
Corp. |
(618)
|
(3,863)
|
62.50
|
02/21/25
|
(34)
|
| Home
Depot, Inc. (The) |
(115)
|
(5,060)
|
440.00
|
02/21/25
|
(7)
|
| Honeywell
International, Inc. |
(329)
|
(8,225)
|
250.00
|
02/21/25
|
(24)
|
| Intuit,
Inc. |
(154)
|
(10,318)
|
670.00
|
02/21/25
|
(19)
|
| JPMorgan
Chase & Co. |
(238)
|
(6,664)
|
280.00
|
02/21/25
|
(18)
|
| L3Harris
Technologies, Inc. |
(165)
|
(3,960)
|
240.00
|
02/21/25
|
(1)
|
| Lululemon
Athletica, Inc. |
(78)
|
(3,276)
|
420.00
|
02/21/25
|
(76)
|
| Mastercard,
Inc. |
(71)
|
(4,082)
|
575.00
|
02/21/25
|
(16)
|
| Microsoft
Corp. |
(96)
|
(4,560)
|
475.00
|
02/21/25
|
(1)
|
| Morgan
Stanley |
(339)
|
(5,085)
|
150.00
|
02/21/25
|
(7)
|
| NextEra
Energy, Inc. |
(1,581)
|
(12,253)
|
77.50
|
02/21/25
|
(38)
|
| Ovintiv,
Inc. |
(694)
|
(3,470)
|
50.00
|
02/21/25
|
(4)
|
| Pfizer,
Inc. |
(1,247)
|
(3,492)
|
28.00
|
02/21/25
|
(27)
|
| PNC
Financial Services Group, Inc. (The) |
(478)
|
(10,516)
|
220.00
|
02/21/25
|
(5)
|
| Rexford
Industrial Realty, Inc. |
(858)
|
(3,861)
|
45.00
|
02/21/25
|
(21)
|
| Salesforce,
Inc. |
(108)
|
(3,888)
|
360.00
|
02/21/25
|
(30)
|
| Stanley
Black & Decker, Inc. |
(639)
|
(5,911)
|
92.50
|
02/21/25
|
(117)
|
| Starbucks
Corp. |
(242)
|
(2,541)
|
105.00
|
02/21/25
|
(92)
|
| Truist
Financial Corp. |
(750)
|
(3,750)
|
50.00
|
02/21/25
|
(16)
|
| Tyson
Foods, Inc. |
(474)
|
(2,963)
|
62.50
|
02/21/25
|
(16)
|
| UnitedHealth
Group, Inc. |
(133)
|
(7,448)
|
560.00
|
02/21/25
|
(61)
|
| Veeva
Systems, Inc. |
(120)
|
(2,880)
|
240.00
|
02/21/25
|
(46)
|
| Visa,
Inc. |
(119)
|
(4,105)
|
345.00
|
02/21/25
|
(52)
|
| Walt
Disney Co. (The) |
(505)
|
(6,060)
|
120.00
|
02/21/25
|
(101)
|
| Total
Written Options |
|
$(1,329)
|
|
Footnote Legend: |
|
(1) |
Strike
price not reported in thousands. |
|
(2) |
Exchange-traded
options. |
See Notes to Financial Statements
Dividend, Interest &
Premium Strategy Fund (NFJ)
SCHEDULE OF INVESTMENTS (Continued)
January 31, 2025
($ reported in
thousands)
The following table summarizes the value of the
Fund’s investments as of January 31, 2025, based on the inputs used to value them (See Security Valuation Note 2A in the Notes to Financial Statements):
| |
Total
Value at
January 31, 2025 |
|
Level
1
Quoted Prices |
|
Level
2
Significant
Observable
Inputs |
| Assets:
|
|
|
|
|
|
| Debt
Instruments: |
|
|
|
|
|
| Convertible
Bonds and Notes |
$
238,245 |
|
$
— |
|
$238,245
|
| Equity
Securities: |
|
|
|
|
|
| Convertible
Preferred Stocks |
30,901
|
|
30,901
|
|
—
|
| Common
Stocks |
1,018,156
|
|
1,018,156
|
|
—
|
| Warrant
|
4
|
|
4
|
|
—
|
| Money
Market Mutual Fund |
36,472
|
|
36,472
|
|
—
|
| Total
Assets |
1,323,778
|
|
1,085,533
|
|
238,245
|
| Liabilities:
|
|
|
|
|
|
| Other
Financial Instruments: |
|
|
|
|
|
| Written
Options |
(1,329)
|
|
(1,320)
|
|
(9)
|
| Total
Investments, Net of Written Options |
$1,322,449
|
|
$1,084,213
|
|
$238,236
|
There were no securities
valued using significant unobservable inputs (Level 3) at January 31, 2025.
There were no transfers into or out of Level 3 related
to securities held at January 31, 2025.
See Notes to Financial Statements
Equity & Convertible
Income Fund (NIE)
SCHEDULE OF INVESTMENTS
January 31, 2025
($ reported in thousands)
| |
Par
Value |
|
Value
|
| Convertible
Bonds and Notes—29.7% |
| Aerospace
& Defense—0.2% |
|
|
Rocket
Lab USA, Inc. 144A
4.250%, 2/1/29(1) |
$ 275
|
|
$ 1,575
|
| Auto
Manufacturers—0.5% |
|
|
| Rivian
Automotive, Inc. |
|
|
|
| 4.625%,
3/15/29 |
1,955
|
|
1,940
|
| 3.625%,
10/15/30 |
2,370
|
|
2,110
|
| |
|
|
4,050
|
| |
|
|
|
| |
| Biotechnology—1.8%
|
|
|
Alnylam
Pharmaceuticals, Inc.
1.000%, 9/15/27 |
2,795
|
|
3,203
|
Bridgebio
Pharma, Inc.
2.500%, 3/15/27 |
1,485
|
|
1,686
|
Halozyme
Therapeutics, Inc.
0.250%, 3/1/27 |
2,595
|
|
2,610
|
Insmed,
Inc.
0.750%, 6/1/28 |
945
|
|
2,264
|
PTC
Therapeutics, Inc.
1.500%, 9/15/26 |
1,140
|
|
1,283
|
Sarepta
Therapeutics, Inc.
1.250%, 9/15/27 |
1,120
|
|
1,200
|
Travere
Therapeutics, Inc.
2.250%, 3/1/29 |
1,295
|
|
1,313
|
| |
|
|
13,559
|
| |
|
|
|
| |
| Commercial
Services—1.0% |
|
|
Affirm
Holdings, Inc. 144A
0.750%, 12/15/29(1) |
2,240
|
|
2,189
|
Global
Payments, Inc. 144A
1.500%, 3/1/31(1) |
2,485
|
|
2,433
|
Shift4
Payments, Inc.
0.500%, 8/1/27 |
2,590
|
|
3,033
|
| |
|
|
7,655
|
| |
|
|
|
| |
| Computers—1.5%
|
|
|
Lumentum
Holdings, Inc.
0.500%, 12/15/26 |
3,300
|
|
3,699
|
PAR
Technology Corp.
1.500%, 10/15/27 |
1,820
|
|
2,120
|
Seagate
HDD Cayman
3.500%, 6/1/28 |
1,615
|
|
2,084
|
Western
Digital Corp.
3.000%, 11/15/28 |
1,390
|
|
1,956
|
Zscaler,
Inc.
0.125%, 7/1/25 |
785
|
|
1,071
|
| |
|
|
10,930
|
| |
|
|
|
| |
| Diversified
REITS—0.4% |
|
|
Digital
Realty Trust LP 144A
1.875%, 11/15/29(1) |
2,800
|
|
2,827
|
| Electric
Utilities—2.0% |
|
|
NextEra
Energy Capital Holdings, Inc. 144A
3.000%, 3/1/27(1) |
3,100
|
|
3,576
|
NRG
Energy, Inc.
2.750%, 6/1/48 |
375
|
|
935
|
| |
Par
Value |
|
Value
|
| |
|
|
|
| Electric
Utilities—continued |
|
|
PG&E
Corp.
4.250%, 12/1/27 |
$ 5,560
|
|
$ 5,657
|
Southern
Co. (The)
3.875%, 12/15/25 |
4,050
|
|
4,273
|
| |
|
|
14,441
|
| |
|
|
|
| |
| Electronics—0.7%
|
|
|
Advanced
Energy Industries, Inc.
2.500%, 9/15/28 |
1,645
|
|
1,803
|
Itron,
Inc. 144A
1.375%, 7/15/30(1) |
560
|
|
584
|
OSI
Systems, Inc. 144A
2.250%, 8/1/29(1) |
2,425
|
|
2,901
|
| |
|
|
5,288
|
| |
|
|
|
| |
| Energy-Alternate
Sources—0.0% |
|
|
Sunrun,
Inc. 144A
4.000%, 3/1/30(1) |
390
|
|
339
|
| Engineering
& Construction—0.5% |
|
|
Fluor
Corp.
1.125%, 8/15/29 |
1,035
|
|
1,286
|
Granite
Construction, Inc. 144A
3.250%, 6/15/30(1) |
2,060
|
|
2,710
|
| |
|
|
3,996
|
| |
|
|
|
| |
| Entertainment—1.1%
|
|
|
Cinemark
Holdings, Inc.
4.500%, 8/15/25 |
400
|
|
803
|
IMAX
Corp.
0.500%, 4/1/26 |
1,840
|
|
1,909
|
Live
Nation Entertainment, Inc. 144A
2.875%, 1/15/30(1) |
5,520
|
|
5,746
|
| |
|
|
8,458
|
| |
|
|
|
| |
| Financial
Services—1.7% |
|
|
Coinbase
Global, Inc.
0.500%, 6/1/26 |
3,285
|
|
3,646
|
Encore
Capital Group, Inc.
4.000%, 3/15/29 |
1,480
|
|
1,531
|
Galaxy
Digital Holdings LP 144A
2.500%, 12/1/29(1) |
2,235
|
|
2,438
|
SoFi
Technologies, Inc. 144A
0.000%, 10/15/26(1) |
2,440
|
|
2,591
|
Upstart
Holdings, Inc. 144A
1.000%, 11/15/30(1) |
2,065
|
|
2,046
|
| |
|
|
12,252
|
| |
|
|
|
| |
| Health
Care REITs—0.9% |
|
|
Welltower
OP LLC 144A
3.125%, 7/15/29(1) |
5,300
|
|
6,325
|
| Healthcare-Products—2.0%
|
|
|
Alphatec
Holdings, Inc.
0.750%, 8/1/26 |
1,365
|
|
1,386
|
Envista
Holdings Corp.
2.375%, 6/1/25 |
1,245
|
|
1,345
|
See Notes to Financial Statements
Equity & Convertible
Income Fund (NIE)
SCHEDULE OF INVESTMENTS (Continued)
January 31, 2025
($ reported in
thousands)
| |
Par
Value |
|
Value
|
| |
|
|
|
| Healthcare-Products—continued
|
|
|
Exact
Sciences Corp. 144A
1.750%, 4/15/31(1) |
$ 2,260
|
|
$ 2,116
|
Insulet
Corp.
0.375%, 9/1/26 |
1,865
|
|
2,470
|
iRhythm
Technologies, Inc. 144A
1.500%, 9/1/29(1) |
2,030
|
|
2,135
|
Lantheus
Holdings, Inc.
2.625%, 12/15/27 |
250
|
|
339
|
LeMaitre
Vascular, Inc. 144A
2.500%, 2/1/30(1) |
1,315
|
|
1,395
|
Merit
Medical Systems, Inc. 144A
3.000%, 2/1/29(1) |
1,480
|
|
2,049
|
Repligen
Corp.
1.000%, 12/15/28 |
1,015
|
|
1,097
|
Tandem
Diabetes Care, Inc. 144A
1.500%, 3/15/29(1) |
390
|
|
514
|
| |
|
|
14,846
|
| |
|
|
|
| |
| Industrial
REITs—0.2% |
|
|
Rexford
Industrial Realty LP 144A
4.375%, 3/15/27(1) |
1,170
|
|
1,161
|
| Internet—3.2%
|
|
|
Alibaba
Group Holding Ltd. 144A
0.500%, 6/1/31(1) |
895
|
|
1,046
|
Booking
Holdings, Inc.
0.750%, 5/1/25 |
760
|
|
1,915
|
Magnite,
Inc.
0.250%, 3/15/26 |
1,330
|
|
1,244
|
Palo
Alto Networks, Inc.
0.375%, 6/1/25 |
350
|
|
1,297
|
Q2
Holdings, Inc.
0.750%, 6/1/26 |
1,705
|
|
2,034
|
Sea
Ltd.
2.375%, 12/1/25 |
1,395
|
|
1,947
|
Shopify,
Inc.
0.125%, 11/1/25 |
1,940
|
|
2,030
|
Snap,
Inc.
0.750%, 8/1/26 |
1,555
|
|
1,529
|
Trip.com
Group Ltd. 144A
0.750%, 6/15/29(1) |
2,015
|
|
2,526
|
Uber
Technologies, Inc.
0.000%, 12/15/25 |
3,775
|
|
3,927
|
| Wayfair,
Inc. |
|
|
|
| 1.000%,
8/15/26 |
1,275
|
|
1,174
|
| 3.250%,
9/15/27 |
1,085
|
|
1,208
|
Zillow
Group, Inc.
2.750%, 5/15/25 |
1,140
|
|
1,423
|
| |
|
|
23,300
|
| |
|
|
|
| |
| Investment
Companies—0.4% |
|
|
IREN
Ltd. 144A
3.250%, 6/15/30(1) |
1,415
|
|
1,334
|
MARA
Holdings, Inc. 144A
0.000%, 6/1/31(1) |
1,625
|
|
1,377
|
| |
|
|
2,711
|
| |
|
|
|
| |
| |
Par
Value |
|
Value
|
| |
|
|
|
| Iron
& Steel—0.2% |
|
|
United
States Steel Corp.
5.000%, 11/1/26 |
$ 455
|
|
$ 1,261
|
| Leisure
Time—1.2% |
|
|
Carnival
Corp.
5.750%, 12/1/27 |
660
|
|
1,449
|
| NCL
Corp., Ltd. |
|
|
|
| 5.375%,
8/1/25 |
545
|
|
844
|
| 1.125%,
2/15/27 |
2,765
|
|
3,006
|
Peloton
Interactive, Inc. 144A
5.500%, 12/1/29(1) |
375
|
|
737
|
Royal
Caribbean Cruises Ltd.
6.000%, 8/15/25 |
555
|
|
2,967
|
| |
|
|
9,003
|
| |
|
|
|
| |
| Machinery-Construction
& Mining—0.2% |
|
|
Bloom
Energy Corp. 144A
3.000%, 6/1/29(1) |
1,055
|
|
1,451
|
| Machinery-Diversified—0.2%
|
|
|
Middleby
Corp. (The)
1.000%, 9/1/25 |
975
|
|
1,310
|
| Media—0.6%
|
|
|
| Liberty
Broadband Corp. |
|
|
|
| 144A
3.125%, 3/31/53(1) |
1,275
|
|
1,262
|
| 144A
3.125%, 6/30/54(1) |
1,360
|
|
1,502
|
Liberty
Media Corp.-Liberty Formula One
2.250%, 8/15/27 |
1,225
|
|
1,544
|
| |
|
|
4,308
|
| |
|
|
|
| |
| Metal
Fabricate/Hardware—0.3% |
|
|
Xometry,
Inc.
1.000%, 2/1/27 |
2,285
|
|
2,270
|
| Mining—0.4%
|
|
|
MP
Materials Corp. 144A
3.000%, 3/1/30(1) |
2,060
|
|
2,628
|
| Miscellaneous
Manufacturing—0.2% |
|
|
Axon
Enterprise, Inc.
0.500%, 12/15/27 |
645
|
|
1,842
|
| Oil,
Gas & Consumable Fuels—0.2% |
|
|
UGI
Corp. 144A
5.000%, 6/1/28(1) |
1,155
|
|
1,395
|
| Passenger
Airlines—0.6% |
|
|
American
Airlines Group, Inc.
6.500%, 7/1/25 |
3,080
|
|
3,506
|
JetBlue
Airways Corp. 144A
2.500%, 9/1/29(1) |
480
|
|
611
|
| |
|
|
4,117
|
| |
|
|
|
| |
| Retail—0.9%
|
|
|
Burlington
Stores, Inc.
1.250%, 12/15/27 |
1,895
|
|
2,827
|
See Notes to Financial Statements
Equity & Convertible
Income Fund (NIE)
SCHEDULE OF INVESTMENTS (Continued)
January 31, 2025
($ reported in
thousands)
| |
Par
Value |
|
Value
|
| |
|
|
|
| Retail—continued
|
|
|
Freshpet,
Inc.
3.000%, 4/1/28 |
$ 895
|
|
$ 2,124
|
Shake
Shack, Inc.
0.000%, 3/1/28 |
1,815
|
|
1,798
|
| |
|
|
6,749
|
| |
|
|
|
| |
| Retail
REIT—0.2% |
|
|
Federal
Realty OP LP 144A
3.250%, 1/15/29(1) |
1,240
|
|
1,259
|
| Semiconductors—1.0%
|
|
|
MACOM
Technology Solutions Holdings, Inc. 144A
0.000%, 12/15/29(1)(2) |
1,520
|
|
1,537
|
ON
Semiconductor Corp.
0.500%, 3/1/29 |
1,825
|
|
1,639
|
Semtech
Corp.
1.625%, 11/1/27 |
750
|
|
1,419
|
Synaptics,
Inc. 144A
0.750%, 12/1/31(1) |
1,525
|
|
1,652
|
Wolfspeed,
Inc.
0.250%, 2/15/28 |
1,925
|
|
887
|
| |
|
|
7,134
|
| |
|
|
|
| |
| Software—5.0%
|
|
|
Akamai
Technologies, Inc.
0.125%, 5/1/25 |
1,470
|
|
1,595
|
Alignment
Healthcare, Inc. 144A
4.250%, 11/15/29(1) |
2,045
|
|
2,627
|
BILL
Holdings, Inc. 144A
0.000%, 4/1/30(1) |
2,925
|
|
3,122
|
Cloudflare,
Inc.
0.000%, 8/15/26(2) |
2,880
|
|
2,965
|
Datadog,
Inc. 144A
0.000%, 12/1/29(1)(2) |
4,040
|
|
3,955
|
Guidewire
Software, Inc. 144A
1.250%, 11/1/29(1) |
2,830
|
|
3,063
|
HubSpot,
Inc.
0.375%, 6/1/25 |
830
|
|
2,282
|
| MicroStrategy,
Inc. |
|
|
|
| 144A
0.000%, 12/1/29(1)(2) |
5,420
|
|
4,705
|
| 144A
0.875%, 3/15/31(1) |
1,185
|
|
1,928
|
Nutanix,
Inc. 144A
0.500%, 12/15/29(1) |
2,870
|
|
2,982
|
Snowflake,
Inc. 144A
0.000%, 10/1/29(1) |
3,380
|
|
4,484
|
Tyler
Technologies, Inc.
0.250%, 3/15/26 |
985
|
|
1,232
|
Vertex,
Inc. 144A
0.750%, 5/1/29(1) |
1,155
|
|
1,947
|
| |
|
|
36,887
|
| |
|
|
|
| |
| Telecommunications—0.2%
|
|
|
Applied
Digital Corp. 144A
2.750%, 6/1/30(1) |
600
|
|
601
|
Viavi
Solutions, Inc.
1.625%, 3/15/26 |
1,025
|
|
1,125
|
| |
|
|
1,726
|
| |
|
|
|
| |
| |
Par
Value |
|
Value
|
| |
|
|
|
| Transportation—0.2%
|
|
|
World
Kinect Corp.
3.250%, 7/1/28 |
$ 1,035
|
|
$
1,184 |
Total
Convertible Bonds and Notes
(Identified Cost $206,584) |
|
218,237
|
| |
Shares
|
|
| Convertible
Preferred Stocks—3.8% |
| Aerospace
& Defense—1.0% |
|
| Boeing
Co. (The), 6.000% |
122,015
|
7,320
|
| Banks—1.0%
|
|
| Wells
Fargo & Co. Series L, 7.500% |
6,270
|
7,454
|
| Capital
Markets—0.3% |
|
| Ares
Management Corp. Series B, 6.750% |
39,855
|
2,419
|
| Chemicals—0.2%
|
|
| Albemarle
Corp., 7.250% |
27,860
|
1,129
|
| Electric
Utilities—0.2% |
|
| NextEra
Energy, Inc., 6.926% |
44,255
|
1,836
|
| Financial
Services—0.3% |
|
| Apollo
Global Management, Inc., 6.750% |
23,300
|
2,076
|
| Healthcare
Providers & Services—0.3% |
|
| BrightSpring
Health Services, Inc., 6.750% |
22,285
|
1,849
|
| Machinery—0.1%
|
|
| Chart
Industries, Inc. Series B, 6.750% |
12,105
|
941
|
| Software—0.1%
|
|
| MicroStrategy,
Inc., 8.000% |
7,090
|
574
|
| Technology
Hardware, Storage & Peripherals—0.3% |
|
| Hewlett
Packard Enterprise Co., 7.625% |
41,115
|
2,513
|
Total
Convertible Preferred Stocks
(Identified Cost $25,631) |
28,111
|
| |
|
|
| |
| |
|
|
| |
| Common
Stocks—60.6% |
| Air
Freight & Logistics—0.2% |
|
| FedEx
Corp. |
6,415
|
1,699
|
| Automobiles—1.2%
|
|
| Tesla,
Inc.(3)(4) |
21,135
|
8,551
|
| Banks—3.7%
|
|
| Bank
of America Corp. |
160,175
|
7,416
|
| Citigroup,
Inc. |
105,925
|
8,625
|
| JPMorgan
Chase & Co.(4) |
43,055
|
11,509
|
| |
|
27,550
|
| |
|
|
| |
| Beverages—0.3%
|
|
| Coca-Cola
Co. (The) |
38,340
|
2,434
|
See Notes to Financial Statements
Equity & Convertible
Income Fund (NIE)
SCHEDULE OF INVESTMENTS (Continued)
January 31, 2025
($ reported in
thousands)
| |
Shares
|
|
Value
|
| |
|
|
|
| Biotechnology—1.2%
|
|
|
| AbbVie,
Inc. |
21,810
|
|
$ 4,011
|
| Regeneron
Pharmaceuticals, Inc.(3) |
3,445
|
|
2,318
|
| Vertex
Pharmaceuticals, Inc.(3) |
5,315
|
|
2,454
|
| |
|
|
8,783
|
| |
|
|
|
| |
| Broadline
Retail—3.2% |
|
|
| Amazon.com,
Inc.(3) |
97,470
|
|
23,167
|
| Capital
Markets—2.3% |
|
|
| Intercontinental
Exchange, Inc. |
7,365
|
|
1,177
|
| KKR
& Co., Inc. |
37,585
|
|
6,279
|
| Moody’s
Corp. |
9,455
|
|
4,722
|
| Morgan
Stanley |
33,415
|
|
4,626
|
| |
|
|
16,804
|
| |
|
|
|
| |
| Chemicals—1.7%
|
|
|
| Air
Products & Chemicals, Inc. |
11,150
|
|
3,738
|
| DuPont
de Nemours, Inc. |
29,682
|
|
2,280
|
| Ecolab,
Inc. |
13,445
|
|
3,364
|
| Linde
plc |
6,640
|
|
2,962
|
| |
|
|
12,344
|
| |
|
|
|
| |
| Commercial
Services & Supplies—0.7% |
|
|
| Cintas
Corp. |
11,935
|
|
2,394
|
| Waste
Management, Inc. |
13,455
|
|
2,963
|
| |
|
|
5,357
|
| |
|
|
|
| |
| Communications
Equipment—0.5% |
|
|
| Motorola
Solutions, Inc. |
7,310
|
|
3,430
|
| Construction
& Engineering—0.5% |
|
|
| Quanta
Services, Inc. |
10,730
|
|
3,301
|
| Consumer
Finance—0.8% |
|
|
| Capital
One Financial Corp. |
14,890
|
|
3,033
|
| Discover
Financial Services |
15,845
|
|
3,187
|
| |
|
|
6,220
|
| |
|
|
|
| |
| Consumer
Staples Distribution & Retail—2.2% |
|
|
| Costco
Wholesale Corp. |
5,260
|
|
5,154
|
| Target
Corp. |
26,430
|
|
3,645
|
| Walmart,
Inc. |
72,285
|
|
7,096
|
| |
|
|
15,895
|
| |
|
|
|
| |
| Diversified
Telecommunication Services—0.4% |
|
|
| AT&T,
Inc. |
125,060
|
|
2,968
|
| Electric
Utilities—0.9% |
|
|
| Constellation
Energy Corp. |
5,270
|
|
1,581
|
| Exelon
Corp. |
126,525
|
|
5,061
|
| |
|
|
6,642
|
| |
|
|
|
| |
| Electrical
Equipment—1.2% |
|
|
| Eaton
Corp. plc |
7,715
|
|
2,519
|
| Emerson
Electric Co. |
23,905
|
|
3,106
|
| |
Shares
|
|
Value
|
| |
|
|
|
| Electrical
Equipment—continued |
|
|
| Rockwell
Automation, Inc. |
10,350
|
|
$ 2,882
|
| |
|
|
8,507
|
| |
|
|
|
| |
| Entertainment—0.9%
|
|
|
| Netflix,
Inc.(3) |
5,300
|
|
5,177
|
| Take-Two
Interactive Software, Inc.(3) |
6,405
|
|
1,188
|
| |
|
|
6,365
|
| |
|
|
|
| |
| Financial
Services—2.2% |
|
|
| Fiserv,
Inc.(3) |
12,470
|
|
2,694
|
| Mastercard,
Inc. Class A(4) |
22,265
|
|
12,367
|
| PayPal
Holdings, Inc.(3) |
15,930
|
|
1,411
|
| |
|
|
16,472
|
| |
|
|
|
| |
| Healthcare
Equipment & Supplies—1.7% |
|
|
| Boston
Scientific Corp.(3) |
56,845
|
|
5,818
|
| Intuitive
Surgical, Inc.(3)(4) |
11,710
|
|
6,697
|
| |
|
|
12,515
|
| |
|
|
|
| |
| Healthcare
Providers & Services—1.8% |
|
|
| CVS
Health Corp. |
41,910
|
|
2,367
|
| McKesson
Corp. |
6,970
|
|
4,145
|
| UnitedHealth
Group, Inc. |
12,925
|
|
7,012
|
| |
|
|
13,524
|
| |
|
|
|
| |
| Hotels,
Restaurants & Leisure—1.4% |
|
|
| Chipotle
Mexican Grill, Inc. Class A(3) |
68,580
|
|
4,001
|
| McDonald’s
Corp. |
10,010
|
|
2,890
|
| Starbucks
Corp. |
33,950
|
|
3,656
|
| |
|
|
10,547
|
| |
|
|
|
| |
| Industrial
Conglomerates—1.7% |
|
|
| 3M
Co. |
35,755
|
|
5,442
|
| General
Electric Co.(4) |
35,945
|
|
7,317
|
| |
|
|
12,759
|
| |
|
|
|
| |
| Insurance—1.2%
|
|
|
| Allstate
Corp. (The) |
22,545
|
|
4,336
|
| Aon
plc Class A |
12,675
|
|
4,700
|
| |
|
|
9,036
|
| |
|
|
|
| |
| Interactive
Media & Services—5.1% |
|
|
| Alphabet,
Inc. Class A |
68,275
|
|
13,930
|
| Alphabet,
Inc. Class C |
33,085
|
|
6,802
|
| Meta
Platforms, Inc. Class A(4) |
24,715
|
|
17,033
|
| |
|
|
37,765
|
| |
|
|
|
| |
| IT
Services—1.0% |
|
|
| Accenture
plc Class A |
8,130
|
|
3,130
|
| Cloudflare,
Inc. Class A(3) |
15,570
|
|
2,155
|
| GoDaddy,
Inc. Class A(3) |
9,215
|
|
1,959
|
| |
|
|
7,244
|
| |
|
|
|
| |
See
Notes to Financial Statements
Equity & Convertible
Income Fund (NIE)
SCHEDULE OF INVESTMENTS (Continued)
January 31, 2025
($ reported in
thousands)
| |
Shares
|
|
Value
|
| |
|
|
|
| Life
Sciences Tools & Services—0.5% |
|
|
| Danaher
Corp. |
15,045
|
|
$ 3,351
|
| Machinery—1.0%
|
|
|
| Deere
& Co. |
6,620
|
|
3,155
|
| Parker-Hannifin
Corp. |
5,690
|
|
4,023
|
| |
|
|
7,178
|
| |
|
|
|
| |
| Oil,
Gas & Consumable Fuels—0.3% |
|
|
| Williams
Cos., Inc. (The) |
41,705
|
|
2,312
|
| Pharmaceuticals—0.4%
|
|
|
| Eli
Lilly & Co. |
3,470
|
|
2,814
|
| Real
Estate Management & Development—0.7% |
|
|
| CBRE
Group, Inc. Class A(3) |
17,680
|
|
2,559
|
| CoStar
Group, Inc.(3) |
31,350
|
|
2,401
|
| |
|
|
4,960
|
| |
|
|
|
| |
| Semiconductors
& Semiconductor Equipment—4.8% |
|
|
| Broadcom,
Inc. |
11,420
|
|
2,527
|
| KLA
Corp. |
2,465
|
|
1,820
|
| Marvell
Technology, Inc. |
14,599
|
|
1,648
|
| Micron
Technology, Inc. |
12,675
|
|
1,156
|
| NVIDIA
Corp. |
207,570
|
|
24,923
|
| Texas
Instruments, Inc. |
16,120
|
|
2,976
|
| |
|
|
35,050
|
| |
|
|
|
| |
| Software—7.8%
|
|
|
| Atlassian
Corp. Class A(3) |
10,010
|
|
3,071
|
| Autodesk,
Inc.(3) |
11,530
|
|
3,590
|
| Cadence
Design Systems, Inc.(3) |
9,640
|
|
2,869
|
| Crowdstrike
Holdings, Inc. Class A(3) |
12,555
|
|
4,998
|
| Microsoft
Corp.(4) |
63,749
|
|
26,460
|
| Oracle
Corp. |
17,820
|
|
3,030
|
| Salesforce,
Inc.(4) |
23,175
|
|
7,919
|
| ServiceNow,
Inc.(3) |
5,475
|
|
5,575
|
| |
|
|
57,512
|
| |
|
|
|
| |
| Specialized
REITs—0.8% |
|
|
| American
Tower Corp. |
11,660
|
|
2,156
|
| Equinix,
Inc. |
4,345
|
|
3,970
|
| |
|
|
6,126
|
| |
|
|
|
| |
| Specialty
Retail—2.6% |
|
|
| Chewy,
Inc. Class A(3) |
63,405
|
|
2,471
|
| Home
Depot, Inc. (The) |
18,750
|
|
7,725
|
| O’Reilly
Automotive, Inc.(3) |
1,895
|
|
2,453
|
| TJX
Cos., Inc. (The)(4) |
43,795
|
|
5,465
|
| Ulta
Beauty, Inc.(3)(4) |
3,035
|
|
1,251
|
| |
|
|
19,365
|
| |
|
|
|
| |
| Technology
Hardware, Storage & Peripherals—3.4% |
|
|
| Apple,
Inc. |
105,553
|
|
24,911
|
| |
Shares
|
|
Value
|
| |
|
|
|
| Wireless
Telecommunication Services—0.3% |
|
|
| T-Mobile
US, Inc. |
8,325
|
|
$
1,940 |
Total
Common Stocks
(Identified Cost $397,188) |
|
445,398
|
| |
|
|
|
| |
| |
|
|
|
| |
Total
Long-Term Investments—94.1%
(Identified Cost $629,403) |
|
691,746
|
| |
|
|
|
| |
| |
|
|
|
| |
| Short-Term
Investment—3.3% |
| Money
Market Mutual Fund—3.3% |
| BlackRock
Liquidity FedFund - Institutional Shares (seven-day effective yield 4.262%)(5) |
23,960,796
|
|
23,961
|
Total
Short-Term Investment
(Identified Cost $23,961) |
|
23,961
|
| |
|
|
|
| |
| |
|
|
|
| |
TOTAL
INVESTMENTS, BEFORE WRITTEN OPTIONS—97.4%
(Identified Cost $653,364) |
|
715,707
|
| |
|
|
| Written
Options—(0.0)% |
| (See
open written options schedule) |
|
|
Total
Written Options
(Premiums Received $80) |
(103)
|
| |
|
|
| |
| |
|
|
| |
TOTAL
INVESTMENTS, NET OF WRITTEN OPTIONS—97.4%
(Identified Cost $653,284) |
$715,604
|
| Other
assets and liabilities, net—2.6% |
19,275
|
| NET
ASSETS—100.0% |
$734,879
|
| Abbreviations:
|
| LLC
|
Limited
Liability Company |
| LP
|
Limited
Partnership |
| OP
|
Operating
Partnership |
| plc
|
Public
Limited Company |
| REIT
|
Real
Estate Investment Trust |
| Footnote
Legend: |
|
(1) |
Security
exempt from registration under Rule 144A of the Securities Act of 1933. These securities may be resold in transactions exempt from registration, normally to qualified institutional buyers. At January 31, 2025, these securities amounted to a value
of $97,381 or 13.3% of net assets. |
|
(2) |
Issued
with a zero coupon. Income is recognized through the accretion of discount. |
|
(3) |
Non-income
producing. |
|
(4) |
All
or a portion of the security is segregated as collateral for written options. The value of securities segregated as collateral is $48,722. |
|
(5) |
Shares
of this fund are publicly offered, and its prospectus and annual report are publicly available. |
| Country
Weightings (Unaudited)† |
| United
States |
95%
|
| Ireland
|
2
|
| Cayman
Islands |
1
|
| Canada
|
1
|
| Bermuda
|
1
|
| Total
|
100%
|
|
† % of total investments, net of written options, as of January 31, 2025. |
For information regarding the abbreviations, see the Key
Investment Terms starting on page 16.
See Notes to Financial Statements
Equity & Convertible
Income Fund (NIE)
SCHEDULE OF INVESTMENTS (Continued)
January 31, 2025
($ reported in
thousands)
| Open
written options contracts as of January 31, 2025 were as follows: |
| Description
of Options |
Number
of
Contracts |
Contract
Notional
Amount |
Strike
Price(1) |
Expiration
Date |
Value
|
| Call
Options(2) |
|
|
|
|
|
| Apple,
Inc. |
(528)
|
$(13,992)
|
$265.00
|
02/21/25
|
$
(10) |
| Atlassian
Corp. |
(50)
|
(1,800)
|
360.00
|
02/21/25
|
(5)
|
| General
Electric Co. |
(180)
|
(3,960)
|
220.00
|
02/21/25
|
(11)
|
| Intuitive
Surgical, Inc. |
(80)
|
(5,120)
|
640.00
|
02/21/25
|
(3)
|
| JPMorgan
Chase & Co. |
(108)
|
(2,970)
|
275.00
|
02/21/25
|
(20)
|
| Mastercard,
Inc. |
(80)
|
(4,960)
|
620.00
|
02/21/25
|
(—)
(3) |
| Meta
Platforms, Inc. |
(119)
|
(9,223)
|
775.00
|
02/21/25
|
(14)
|
| Microsoft
Corp. |
(344)
|
(16,168)
|
470.00
|
02/21/25
|
(5)
|
| Salesforce,
Inc. |
(116)
|
(4,292)
|
370.00
|
02/21/25
|
(16)
|
| Tesla,
Inc. |
(83)
|
(4,233)
|
510.00
|
02/21/25
|
(12)
|
| TJX
Cos., Inc. (The) |
(219)
|
(2,847)
|
130.00
|
02/21/25
|
(5)
|
| Ulta
Beauty, Inc. |
(15)
|
(690)
|
460.00
|
02/21/25
|
(2)
|
| Total
Written Options |
|
$(103)
|
|
Footnote Legend: |
|
(1) |
Strike
price not reported in thousands. |
|
(2) |
Exchange-traded
options. |
|
(3) |
Amount
is less than $500 (not in thousands). |
The following table summarizes the value of the
Fund’s investments as of January 31, 2025, based on the inputs used to value them (See Security Valuation Note 2A in the Notes to Financial Statements):
| |
Total
Value at
January 31, 2025 |
|
Level
1
Quoted Prices |
|
Level
2
Significant
Observable
Inputs |
| Assets:
|
|
|
|
|
|
| Debt
Instruments: |
|
|
|
|
|
| Convertible
Bonds and Notes |
$218,237
|
|
$
— |
|
$218,237
|
| Equity
Securities: |
|
|
|
|
|
| Convertible
Preferred Stocks |
28,111
|
|
28,111
|
|
—
|
| Common
Stocks |
445,398
|
|
445,398
|
|
—
|
| Money
Market Mutual Fund |
23,961
|
|
23,961
|
|
—
|
| Total
Assets |
715,707
|
|
497,470
|
|
218,237
|
| Liabilities:
|
|
|
|
|
|
| Other
Financial Instruments: |
|
|
|
|
|
| Written
Options |
(103)
|
|
(98)
|
|
(5)
|
| Total
Investments, Net of Written Options |
$715,604
|
|
$497,372
|
|
$218,232
|
There were no securities
valued using significant unobservable inputs (Level 3) at January 31, 2025.
There were no transfers into or out of Level 3 related
to securities held at January 31, 2025.
The
following is a reconciliation of assets of the Fund for Level 3 investments for which significant unobservable inputs were used to determine fair value.
| |
Total
|
|
Convertible
Bonds and
Notes |
| Investments
in Securities |
|
|
|
| Balance
as of January 31, 2024: |
$
2,209 |
|
$
2,209 |
| Net
realized gain (loss) |
(138)
|
|
(138)
|
| Net
change in unrealized appreciation (depreciation) |
47
|
|
47
|
| Purchases
|
190
|
|
190
|
| Sales
(a) |
(2,308)
|
|
(2,308)
|
| Balance
as of January 31, 2025 |
$
— |
|
$
— |
(a) Includes paydowns on securities.
See Notes to
Financial Statements
STATEMENTS OF ASSETS AND
LIABILITIES
January 31, 2025
(Reported in thousands except shares and per share amounts)
| |
AIO
|
|
NCV
|
|
NCZ
|
| Assets
|
|
|
|
|
|
|
Investment in securities at value(1)
(2)
|
$
918,363 |
|
$
554,101 |
|
$
419,521 |
|
Cash
|
20,776
|
|
10,740
|
|
8,130
|
| Receivables
|
|
|
|
|
|
|
Investment securities sold
|
2,365
|
|
1,499
|
|
1,154
|
|
Dividends and
interest
|
3,570
|
|
4,887
|
|
3,611
|
|
Tax reclaims
|
13
|
|
—
|
|
—
|
|
Securities lending
income
|
3
|
|
14
|
|
9
|
|
Prepaid Trustees’
retainer
|
17
|
|
8
|
|
6
|
|
Prepaid expenses and other assets (Note
4)
|
65
|
|
163
|
|
126
|
|
Total
assets
|
945,172
|
|
571,412
|
|
432,557
|
| Liabilities
|
|
|
|
|
|
|
Loan Payable (Note
8)
|
130,000
|
|
34,000
|
|
25,000
|
|
Mandatory redeemable preferred shares (Note
9A)
|
—
|
|
65,393
(a) |
|
21,772
(b) |
| Payables
|
|
|
|
|
|
|
Investment securities
purchased
|
2,753
|
|
4,899
|
|
3,741
|
|
Collateral on securities loaned (Note
8)
|
2,282
|
|
9,999
|
|
3,898
|
|
Investment advisory fees (Note
4)
|
902
|
|
293
|
|
224
|
|
Loan interest payable (Note
8)
|
575
|
|
145
|
|
108
|
|
Administration and accounting
fees
|
83
|
|
50
|
|
39
|
|
Trustee deferred compensation plan (Note
4)
|
68
|
|
156
|
|
118
|
|
Professional fees
|
61
|
|
115
|
|
115
|
|
Dividend distributions
|
—
|
|
481
|
|
509
|
|
Interest on mandatory redeemable preferred shares (Note
9A)
|
—
|
|
319
|
|
108
|
|
Other accrued
expenses
|
64
|
|
26
|
|
21
|
|
Total
liabilities
|
136,788
|
|
115,876
|
|
55,653
|
|
Cumulative Preferred Shares ($25.00 liquidation preference per share applicable to an aggregate of 4,000,000 and 4,360,000 shares issued and outstanding, respectively) (Note
12)
|
—
|
|
100,000
|
|
109,000
|
|
Commitments and contingencies (Note
4D)
|
—
|
|
—
|
|
—
|
|
Net Assets Applicable to Common
Shareholders
|
$
808,384 |
|
$
355,536 |
|
$
267,904 |
| Net
Assets Applicable to Common Shareholders Consist of: |
|
|
|
|
|
|
Common shares par value ($0.00001 per
share)
|
$
—(c) |
|
$
1 |
|
$
1 |
|
Capital paid in on shares of beneficial
interest
|
627,909
|
|
622,086
|
|
476,316
|
|
Total distributable earnings (accumulated
losses)
|
180,475
|
|
(266,551)
|
|
(208,413)
|
|
Net Assets Applicable to Common
Shareholders
|
$
808,384 |
|
$
355,536 |
|
$
267,904 |
|
Common Shares Issued and
Outstanding
|
34,375,354
|
|
22,593,392
(d) |
|
19,028,937
(d) |
|
Net Asset Value Per Common
Share(e)
|
$
23.52 |
|
$
15.74 |
|
$
14.08 |
|
(1) Investment in securities at
cost
|
$
772,363 |
|
$
543,544 |
|
$
410,247 |
|
(2) Market value of securities on
loan
|
$
26,261 |
|
$
42,392 |
|
$
27,801 |
|
(a) |
Liquidation
preference $66,000, net of deferred offering costs of $607. |
|
(b) |
Liquidation
preference $22,000, net of deferred offering costs of $228. |
|
(c) |
Amount
is less than $500 (not in thousands). |
|
(d) |
On February
10, 2025, the Funds declared a 1-for-4 reverse stock split. The shares outstanding have been restated to reflect the share conversion ratio of 0.25. |
|
(e) |
Net
Asset Value Per Common Share is calculated using unrounded net assets. |
See Notes to Financial Statements
STATEMENTS OF ASSETS AND
LIABILITIES (Continued)
January 31, 2025
(Reported in
thousands except shares and per share amounts)
| |
ACV
|
|
NFJ
|
|
NIE
|
| Assets
|
|
|
|
|
|
|
Investment in securities at value(1)
|
$
341,092 |
|
$
1,323,778 |
|
$
715,707 |
|
Cash
|
6,964
|
|
42,704
|
|
20,255
|
|
Deposits with broker for written
options
|
20
|
|
—
|
|
83
|
| Receivables
|
|
|
|
|
|
|
Investment securities sold
|
906
|
|
3,925
|
|
1,132
|
|
Dividends and
interest
|
1,723
|
|
1,980
|
|
1,113
|
|
Tax reclaims
|
—
|
|
59
|
|
—
|
|
Prepaid Trustees’
retainer
|
5
|
|
31
|
|
16
|
|
Prepaid expenses and other assets (Note
4)
|
68
|
|
299
|
|
147
|
|
Total
assets
|
350,778
|
|
1,372,776
|
|
738,453
|
| Liabilities
|
|
|
|
|
|
|
Loan Payable (Note 9B and
10)
|
75,000
|
|
—
|
|
—
|
|
Mandatory redeemable preferred shares (Note
9A)
|
30,000
|
|
—
|
|
—
|
|
Written options at value (Note
3)(2)
|
19
|
|
1,329
|
|
103
|
| Payables
|
|
|
|
|
|
|
Investment securities
purchased
|
2,472
|
|
2,581
|
|
2,600
|
|
Loan interest payable (Note 9B and
10)
|
942
|
|
—
|
|
—
|
|
Investment advisory fees (Note
4)
|
268
|
|
904
|
|
548
|
|
Interest on mandatory redeemable preferred shares (Note
9A)
|
110
|
|
—
|
|
—
|
|
Professional fees
|
58
|
|
63
|
|
60
|
|
Trustee deferred compensation plan (Note
4)
|
55
|
|
308
|
|
149
|
|
Administration and accounting
fees
|
32
|
|
120
|
|
66
|
|
Dividend distributions
|
—
(a) |
|
—
|
|
—
|
|
Other accrued
expenses
|
31
|
|
73
|
|
48
|
|
Total
liabilities
|
108,987
|
|
5,378
|
|
3,574
|
|
Commitments and contingencies (Note
4D)
|
—
|
|
—
|
|
—
|
|
Net Assets Applicable to Common
Shareholders
|
$
241,791 |
|
$
1,367,398 |
|
$
734,879 |
| Net
Assets Applicable to Common Shareholders Consist of: |
|
|
|
|
|
|
Common shares par value ($0.00001 per
share)
|
$
—(a) |
|
$
1 |
|
$
—(a) |
|
Capital paid in on shares of beneficial
interest
|
223,940
|
|
1,276,956
|
|
645,892
|
|
Total distributable earnings (accumulated
losses)
|
17,851
|
|
90,441
|
|
88,987
|
|
Net Assets Applicable to Common
Shareholders
|
$
241,791 |
|
$
1,367,398 |
|
$
734,879 |
|
Common Shares Issued and
Outstanding
|
10,374,036
|
|
94,801,581
|
|
27,708,965
|
|
Net Asset Value Per Common
Share(b)
|
$
23.31 |
|
$
14.42 |
|
$
26.52 |
|
(1) Investment in securities at
cost
|
$
321,000 |
|
$
1,232,456 |
|
$
653,364 |
|
(2) Written options premiums
received
|
$
15 |
|
$
901 |
|
$
80 |
|
(a) |
Amount
is less than $500 (not in thousands). |
|
(b) |
Net
Asset Value Per Common Share is calculated using unrounded net assets. |
See Notes to Financial Statements
STATEMENTS OF OPERATIONS YEAR
ENDED
January 31, 2025
($ reported in thousands)
| |
AIO
|
|
NCV
|
|
NCZ
|
| Investment
Income |
|
|
|
|
|
|
Interest
|
$
13,802 |
|
$
21,516 |
|
$
16,008 |
|
Dividends
|
5,720
|
|
2,361
|
|
1,781
|
|
Security lending, net of
fees
|
87
|
|
192
|
|
121
|
|
Foreign taxes withheld
|
(45)
|
|
—
|
|
—
|
|
Total investment
income
|
19,564
|
|
24,069
|
|
17,910
|
| Expenses
|
|
|
|
|
|
|
Investment advisory
fees
|
11,083
|
|
3,782
|
|
2,879
|
|
Administration and accounting
fees
|
945
|
|
572
|
|
438
|
|
Printing fees and expenses
|
284
|
|
50
|
|
38
|
|
Professional fees
|
76
|
|
121
|
|
118
|
|
Trustees’ fees and
expenses
|
56
|
|
26
|
|
21
|
|
Transfer agent fees and
expenses
|
12
|
|
23
|
|
20
|
|
Miscellaneous
expenses
|
70
|
|
180
|
|
163
|
|
Total expenses before interest
expense
|
12,526
|
|
4,754
|
|
3,677
|
|
Interest on mandatory redeemable preferred shares and amortization of deferred offering costs on preferred shares (Note
9A)
|
—
|
|
4,093
|
|
1,378
|
|
Loan interest (Note
8)
|
7,476
|
|
1,985
|
|
1,450
|
|
Total expenses after interest
expense
|
20,002
|
|
10,832
|
|
6,505
|
|
Less expenses reimbursed and/or waived by investment adviser (Note
4D)
|
(761)
|
|
(421)
|
|
(305)
|
|
Net
expenses
|
19,241
|
|
10,411
|
|
6,200
|
|
Net investment income
(loss)
|
323
|
|
13,658
|
|
11,710
|
| Net
Realized and Unrealized Gain (Loss) on Investments |
|
|
|
|
|
| Net
realized gain (loss) from: |
|
|
|
|
|
|
Investments
|
97,357
|
|
32,032
|
|
25,410
|
|
Payment by affiliate (Note
4G)
|
15
|
|
—
|
|
—
|
| Net
change in unrealized appreciation (depreciation) on: |
|
|
|
|
|
|
Investments
|
63,971
|
|
19,520
|
|
15,332
|
|
Net realized and unrealized gain (loss) on
investments
|
161,343
|
|
51,552
|
|
40,742
|
|
Dividends on cumulative preferred shares from net investment
income
|
—
|
|
(5,625)
|
|
(5,995)
|
|
Net increase (decrease) in net assets applicable to common shareholders resulting from
operations
|
$161,666
|
|
$59,585
|
|
$46,457
|
See Notes to Financial Statements
STATEMENTS OF OPERATIONS
(Continued)
YEAR ENDED January
31, 2025
($ reported in thousands)
| |
ACV
|
|
NFJ
|
|
NIE
|
| Investment
Income |
|
|
|
|
|
|
Interest
|
$
7,621 |
|
$
5,004 |
|
$
4,887 |
|
Dividends
|
2,513
|
|
27,356
|
|
8,522
|
|
Foreign taxes withheld
|
(3)
|
|
(156)
|
|
(16)
|
|
Total investment
income
|
10,131
|
|
32,204
|
|
13,393
|
| Expenses
|
|
|
|
|
|
|
Investment advisory
fees
|
3,327
|
|
12,336
|
|
6,991
|
|
Administration and accounting
fees
|
358
|
|
1,471
|
|
755
|
|
Printing fees and expenses
|
95
|
|
274
|
|
143
|
|
Professional fees
|
60
|
|
95
|
|
75
|
|
Transfer agent fees and
expenses
|
20
|
|
12
|
|
12
|
|
Trustees’ fees and
expenses
|
17
|
|
104
|
|
52
|
|
Miscellaneous
expenses
|
103
|
|
173
|
|
64
|
|
Total expenses before interest
expense
|
3,980
|
|
14,465
|
|
8,092
|
|
Interest on mandatory redeemable preferred shares (Note
9A)
|
1,302
|
|
—
|
|
—
|
|
Loan interest (Note 9B and
10)
|
3,527
|
|
—
|
|
—
|
|
Total expenses after interest
expense
|
8,809
|
|
14,465
|
|
8,092
|
|
Less expenses reimbursed and/or waived by investment adviser (Note
4D)
|
(224)
|
|
(1,307)
|
|
(605)
|
|
Net
expenses
|
8,585
|
|
13,158
|
|
7,487
|
|
Net investment income
(loss)
|
1,546
|
|
19,046
|
|
5,906
|
| Net
Realized and Unrealized Gain (Loss) on Investments |
|
|
|
|
|
| Net
realized gain (loss) from: |
|
|
|
|
|
|
Investments
|
30,780
|
|
53,975
|
|
80,622
|
|
Foreign currency
transactions
|
—
|
|
(10)
|
|
—
|
|
Written
options
|
42
|
|
1,700
|
|
242
|
| Net
change in unrealized appreciation (depreciation) on: |
|
|
|
|
|
|
Investments
|
15,530
|
|
56,055
|
|
43,587
|
|
Foreign currency
transactions
|
—
|
|
(—)
(a) |
|
—
|
|
Written
options
|
(7)
|
|
(341)
|
|
(37)
|
|
Net realized and unrealized gain (loss) on
investments
|
46,345
|
|
111,379
|
|
124,414
|
|
Net increase (decrease) in net assets applicable to common shareholders resulting from
operations
|
$47,891
|
|
$130,425
|
|
$130,320
|
|
(a) |
Amount
is less than $500 (not in thousands). |
See Notes to Financial Statements
STATEMENTS OF CHANGES IN NET
ASSETS
($ reported in thousands)
| |
AIO
|
|
NCV
|
| |
Year
Ended
January 31, 2025 |
|
Year
Ended
January 31, 2024 |
|
Year
Ended
January 31, 2025 |
|
Year
Ended
January 31, 2024 |
Increase
(Decrease) In Net Assets
From Operations |
|
|
|
|
|
|
|
|
Net investment income
(loss)
|
$
323 |
|
$
(1,145) |
|
$
13,658 |
|
$
13,007 |
|
Net realized gain
(loss)
|
97,357
|
|
30,207
|
|
32,032
|
|
(35,798)
|
|
Net increase from payment by
affiliate
|
15
|
|
—
|
|
—
|
|
—
|
|
Net change in unrealized appreciation
(depreciation)
|
63,971
|
|
56,367
|
|
19,520
|
|
31,239
|
|
Increase (decrease) in net assets resulting from
operations
|
161,666
|
|
85,429
|
|
65,210
|
|
8,448
|
|
Dividends on Cumulative Preferred Shares from Net Investment
Income
|
—
|
|
—
|
|
(5,625)
|
|
(5,625)
|
|
Net increase (decrease) in net assets applicable to common shareholders resulting from
operations
|
—
|
|
—
|
|
59,585
|
|
2,823
|
| From
Dividends and Distributions to Common Shareholders |
|
|
|
|
|
|
|
|
Net investment income and net realized
gains
|
(61,822)
|
|
(17,085)
|
|
(9,673)
|
|
(5,571)
|
|
Return of
capital
|
—
|
|
(44,729)
|
|
(27,199)
|
|
(32,838)
|
|
Dividends and Distributions to Common
Shareholders
|
(61,822)
|
|
(61,814)
|
|
(36,872)
|
|
(38,409)
|
|
Reinvestment of distributions resulting in the issuance of common stock (AIO: 34,382 and 0 shares, respectively; NCV: 0 and 0 shares,
respectively)
|
802
|
|
—
|
|
—
|
|
—
|
|
Increase (decrease) in net assets from capital
transactions
|
802
|
|
—
|
|
—
|
|
—
|
|
Net increase (decrease) in net
assets
|
100,646
|
|
23,615
|
|
22,713
|
|
(35,586)
|
| Net
Assets |
|
|
|
|
|
|
|
|
Beginning of
period
|
707,738
|
|
684,123
|
|
332,823
|
|
368,409
|
|
End of
period
|
$808,384
|
|
$707,738
|
|
$355,536
|
|
$332,823
|
See Notes to Financial Statements
STATEMENTS OF CHANGES IN NET
ASSETS (Continued)
($ reported in thousands)
| |
NCZ
|
|
ACV
|
| |
Year
Ended
January 31, 2025 |
|
Year
Ended
January 31, 2024 |
|
Year
Ended
January 31, 2025 |
|
Year
Ended
January 31, 2024 |
Increase
(Decrease) In Net Assets
From Operations |
|
|
|
|
|
|
|
|
Net investment income
(loss)
|
$
11,710 |
|
$
11,291 |
|
$
1,546 |
|
$
195 |
|
Net realized gain
(loss)
|
25,410
|
|
(27,826)
|
|
30,822
|
|
(8,499)
|
|
Net change in unrealized appreciation
(depreciation)
|
15,332
|
|
23,920
|
|
15,523
|
|
26,908
|
|
Increase (decrease) in net assets resulting from
operations
|
52,452
|
|
7,385
|
|
47,891
|
|
18,604
|
|
Dividends on Cumulative Preferred Shares from Net Investment
Income
|
(5,995)
|
|
(5,995)
|
|
—
|
|
—
|
|
Net increase (decrease) in net assets applicable to common shareholders resulting from
operations
|
46,457
|
|
1,390
|
|
—
|
|
—
|
| From
Dividends and Distributions to Common Shareholders |
|
|
|
|
|
|
|
|
Net investment income and net realized
gains
|
(6,939)
|
|
(3,798)
|
|
(16,572)
|
|
—
|
|
Return of
capital
|
(20,463)
|
|
(24,745)
|
|
(5,833)
|
|
(22,389)
|
|
Dividends and Distributions to Common
Shareholders
|
(27,402)
|
|
(28,543)
|
|
(22,405)
|
|
(22,389)
|
| From
Capital Share Transactions |
|
|
|
|
|
|
|
|
Reinvestment of distributions resulting in the issuance of common stock (NCZ: 0 and 0 shares, respectively; ACV: 6,844 and 4,238 shares,
respectively)
|
—
|
|
—
|
|
148
|
|
89
|
|
Increase (decrease) in net assets from capital
transactions
|
—
|
|
—
|
|
148
|
|
89
|
|
Net increase (decrease) in net
assets
|
19,055
|
|
(27,153)
|
|
25,634
|
|
(3,696)
|
| Net
Assets |
|
|
|
|
|
|
|
|
Beginning of
period
|
248,849
|
|
276,002
|
|
216,157
|
|
219,853
|
|
End of
period
|
$267,904
|
|
$248,849
|
|
$241,791
|
|
$216,157
|
See Notes to Financial Statements
STATEMENTS OF CHANGES IN NET
ASSETS (Continued)
($ reported in thousands)
| |
NFJ
|
|
NIE
|
| |
Year
Ended
January 31, 2025 |
|
Year
Ended
January 31, 2024 |
|
Year
Ended
January 31, 2025 |
|
Year
Ended
January 31, 2024 |
Increase
(Decrease) In Net Assets
From Operations |
|
|
|
|
|
|
|
|
Net investment income
(loss)
|
$
19,046 |
|
$
18,225 |
|
$
5,906 |
|
$
4,907 |
|
Net realized gain
(loss)
|
55,665
|
|
115,717
|
|
80,864
|
|
15,791
|
|
Net change in unrealized appreciation
(depreciation)
|
55,714
|
|
(38,456)
|
|
43,550
|
|
73,053
|
|
Increase (decrease) in net assets resulting from
operations
|
130,425
|
|
95,486
|
|
130,320
|
|
93,751
|
| From
Dividends and Distributions to Common Shareholders |
|
|
|
|
|
|
|
|
Net investment income and net realized
gains
|
(110,918)
|
|
(92,906)
|
|
(55,418)
|
|
(30,712)
|
|
Return of
capital
|
—
|
|
—
|
|
—
|
|
(24,706)
|
|
Dividends and Distributions to Common
Shareholders
|
(110,918)
|
|
(92,906)
|
|
(55,418)
|
|
(55,418)
|
|
Net increase (decrease) in net
assets
|
19,507
|
|
2,580
|
|
74,902
|
|
38,333
|
| Net
Assets |
|
|
|
|
|
|
|
|
Beginning of
period
|
1,347,891
|
|
1,345,311
|
|
659,977
|
|
621,644
|
|
End of
period
|
$1,367,398
|
|
$1,347,891
|
|
$734,879
|
|
$659,977
|
See Notes to Financial Statements
STATEMENTS OF CASH FLOWS
YEAR ENDED January 31,
2025
($ reported in thousands)
| |
AIO
|
|
NCV
|
|
NCZ
|
|
ACV
|
| Increase
(Decrease) in cash |
|
|
|
|
|
|
|
| Cash
Flows provided by (Used for) Operating Activities: |
|
|
|
|
|
|
|
|
Net increase (decrease) in net assets resulting from operations
|
$
161,666 |
|
$
59,585 |
|
$
46,457 |
|
$
47,891 |
| Adjustments
to reconcile net increase (decrease) in net assets resulting from operations to net cash provided by (used for) operating activities: |
|
|
|
|
|
|
|
|
Proceeds from sales and paydowns of long-term investments
|
871,034
|
|
649,823
|
|
507,436
|
|
500,078
|
|
(Increase) Decrease in investment securities sold receivable
|
(2,365)
|
|
1,450
|
|
1,127
|
|
1,706
|
|
Purchases of long-term investments
|
(803,887)
|
|
(593,608)
|
|
(463,933)
|
|
(460,677)
|
|
Increase (Decrease) in investment securities purchased payable
|
591
|
|
(4,953)
|
|
(3,752)
|
|
(2,962)
|
|
Net (purchases) or sales of short-term
investments
|
(1,644)
|
|
(26,273)
|
|
(14,846)
|
|
(18,696)
|
|
Net purchases or (sales) in written options
|
—
|
|
—
|
|
—
|
|
31
|
|
Net change in unrealized (appreciation)/depreciation on long-term investments
|
(63,971)
|
|
(19,520)
|
|
(15,332)
|
|
(15,530)
|
|
Net change in unrealized (appreciation)/depreciation on written options
|
—
|
|
—
|
|
—
|
|
7
|
|
Net realized (gain)/loss on investments
|
(97,372)
|
|
(32,032)
|
|
(25,410)
|
|
(30,780)
|
|
Net realized (gain)/loss from written options
|
—
|
|
—
|
|
—
|
|
(42)
|
|
Amortization of premium and accretion of discounts on investments
|
(1,649)
|
|
(2,366)
|
|
(1,837)
|
|
(1,163)
|
|
Amortization of deferred offering costs on mandatory redeemable preferred
shares
|
—
|
|
166
|
|
69
|
|
—
|
|
(Increase) Decrease in dividends and interest receivable
|
(674)
|
|
34
|
|
50
|
|
(321)
|
|
(Increase) Decrease in security lending
receivable
|
22
|
|
(6)
|
|
(2)
|
|
—
|
|
(Increase) Decrease in prepaid expenses and other
assets
|
3
|
|
(7)
|
|
(8)
|
|
(13)
|
|
(Increase) Decrease in prepaid trustees’ retainer
|
(1)
|
|
—
|
|
(1)
|
|
—
|
|
Increase (Decrease) in loan interest
payable
|
(253)
|
|
(195)
|
|
(143)
|
|
(21)
|
|
Increase (Decrease) in payable for collateral securities on
loan
|
(198)
|
|
155
|
|
(4,806)
|
|
—
|
|
Increase (Decrease) in affiliated expenses
payable
|
74
|
|
(26)
|
|
(28)
|
|
(2)
|
|
Increase (Decrease) in non-affiliated expenses
payable
|
15
|
|
27
|
|
31
|
|
6
|
|
Cash provided by (used for) operating
activities
|
61,391
|
|
32,254
|
|
25,072
|
|
19,512
|
| Cash
provided (used for) financing activities: |
|
|
|
|
|
|
|
|
Cash distributions paid to shareholders
|
(61,020)
|
|
(36,872)
|
|
(27,402)
|
|
(22,257)
|
|
Cash provided (used for) financing
activities:
|
(61,020)
|
|
(36,872)
|
|
(27,402)
|
|
(22,257)
|
| Net
increase/decrease in cash |
|
|
|
|
|
|
|
|
Net increase (decrease) in
cash
|
371
|
|
(4,618)
|
|
(2,330)
|
|
(2,745)
|
|
Restricted and unrestricted cash at beginning of
period
|
20,405
|
|
15,358
|
|
10,460
|
|
9,729
|
|
Restricted and unrestricted cash at end of
period
|
$
20,776 |
|
$
10,740 |
|
$
8,130 |
|
$
6,984 |
| Supplemental
cash flow information: |
|
|
|
|
|
|
|
| Cash
paid during the period for interest expense on loan payable |
$
7,729 |
|
$
2,180 |
|
$
1,593 |
|
$
3,548 |
| Cash
paid during the period for dividends to mandatory redeemable preferred shares |
$
— |
|
$
4,093 |
|
$
1,378 |
|
$
1,302 |
| Reinvestment
of dividends and distributions |
$
802 |
|
$
— |
|
$
— |
|
$
148 |
| |
|
|
|
|
|
|
|
| Reconciliation
of restricted and unrestricted cash at the end of period to the statement of assets and liabilities |
|
|
|
|
|
|
|
| Cash
|
$
20,776 |
|
$
10,740 |
|
$
8,130 |
|
$
6,964 |
| Deposits
with broker for written options |
—
|
|
—
|
|
—
|
|
20
|
| |
$
20,776 |
|
$
10,740 |
|
$
8,130 |
|
$
6,984 |
See Notes to Financial Statements
ARTIFICIAL INTELLIGENCE
& TECHNOLOGY OPPORTUNITIES FUND (AIO)
FINANCIAL HIGHLIGHTS
SELECTED PER SHARE DATA AND RATIOS FOR A SHARE OUTSTANDING
THROUGHOUT EACH PERIOD
| |
Year
Ended January 31, |
|
Fiscal
Period
March 1, 2021
to January 31,
2022 (1) |
|
Year
Ended
February 28,
2021 |
|
From
Inception
October 31, 2019
to
February 29,
2020(2) |
| |
2025
|
|
2024
|
|
2023
|
|
|
|
|
| PER
SHARE DATA: |
|
|
|
|
|
|
|
|
|
|
|
|
Net asset value, beginning of
period
|
$
20.61 |
|
$
19.92 |
|
$
24.18 |
|
$
29.20 |
|
$
19.89 |
|
$
20.00 |
| Income
(loss) from investment operations: |
|
|
|
|
|
|
|
|
|
|
|
|
Net investment income
(loss)(3)
|
0.01
|
|
(0.03)
|
|
(0.01)
|
|
(0.18)
|
|
(0.08)
|
|
(0.01)
|
|
Net realized and unrealized gain
(loss)
|
4.70
|
|
2.52
|
|
(2.45)
|
|
0.01
|
|
11.88
|
|
0.23
|
|
Payment from
affiliate
|
—
(4) |
|
—
|
|
—
|
|
—
|
|
—
|
|
—
|
|
Total from investment
operations
|
4.71
|
|
2.49
|
|
(2.46)
|
|
(0.17)
|
|
11.80
|
|
0.22
|
| Dividends
and Distributions to Shareholders: |
|
|
|
|
|
|
|
|
|
|
|
|
Net investment
income
|
(1.07)
|
|
(0.50)
|
|
(1.39)
|
|
(1.40)
|
|
—
|
|
—
|
|
Net realized
gains
|
(0.73)
|
|
—
|
|
—
|
|
(3.45)
|
|
(2.49)
|
|
(0.33)
|
|
Return of
capital
|
—
|
|
(1.30)
|
|
(0.41)
|
|
—
|
|
—
|
|
—
|
|
Total dividends and distributions to
shareholders
|
(1.80)
|
|
(1.80)
|
|
(1.80)
|
|
(4.85)
|
|
(2.49)
|
|
(0.33)
|
|
Net asset value, end of
period
|
$
23.52 |
|
$
20.61 |
|
$
19.92 |
|
$
24.18 |
|
$
29.20 |
|
$
19.89 |
|
Market value, end of
period
|
$
25.02 |
|
$
18.68 |
|
$
17.42 |
|
$
23.58 |
|
$
27.41 |
|
$
17.72 |
|
Total return, net asset value(5),
(6)
|
23.83%
(7) |
|
13.56%
|
|
(10.03)%
|
|
(1.85)%
|
|
—%
(8) |
|
—%
(8) |
|
Total return, market value(5),
(6)
|
45.60%
(7) |
|
18.84%
|
|
(18.42)%
|
|
2.75%
|
|
71.09%
|
|
(9.92)%
|
| RATIOS/SUPPLEMENTAL
DATA: |
|
|
|
|
|
|
|
|
|
|
|
|
Ratio of net expenses after interest expense to average net assets(9),
(10)
|
2.54%
|
|
2.71%
|
|
2.04%
|
|
1.47%
(11), (12) |
|
1.42%
(11) |
|
1.34%
(12) |
|
Ratio of total expenses after interest expense to average net
assets(9)
|
2.64%
|
|
2.82%
|
|
2.17%
|
|
1.56%
(11), (12) |
|
1.43%
(11) |
|
1.34%
(12) |
|
Ratio of net investment income (loss) to average net
assets(9)
|
0.04%
|
|
(0.17)%
|
|
(0.04)%
|
|
(0.66)%
(11), (12) |
|
(0.33)%
(11) |
|
(0.15)%
(12) |
|
Portfolio turnover
rate(5)
|
94%
|
|
75%
|
|
53%
|
|
53%
|
|
103%
|
|
56%
|
|
Net assets, end of period
(000’s)
|
$808,384
|
|
$707,738
|
|
$684,123
|
|
$
830,479 |
|
$1,002,838
|
|
$682,816
|
|
Loan payable, end of period
(000’s)
|
$130,000
|
|
$130,000
|
|
$130,000
|
|
$
30,000 |
|
$
30,000 |
|
$
30,000 |
|
Asset coverage, per $1,000 principal amount of loan
payable
|
$
7,218 |
|
$
6,444 |
|
$
6,262 |
|
$
28,683 |
|
$
34,428 |
|
$
23,761 |
| |
|
|
(1) |
The
Fund had a fiscal year end change from February 28 to January 31. |
|
(2) |
Commencement
of operations. |
|
(3) |
Calculated
using average shares outstanding. |
|
(4) |
Amount
is less than $0.005 per share. |
|
(5) |
Not
annualized for periods less than one year. |
|
(6) |
Total
return on market value is calculated assuming a purchase of common shares on the opening of the first day and sale on the closing of the last day of each period reported. Dividends and distributions are assumed, for purposes of this calculation, to
be reinvested at prices obtained under the Fund’s Automatic Reinvestment and Cash Purchase Plan. Total return on market value is not annualized for periods of less than one year. Brokerage commissions that a shareholder may pay are not
reflected. Total return on market value does not reflect the deduction of taxes that a shareholder may pay on Fund distributions or the sale of Fund shares. Total return on net asset value uses the same methodology, but with use of net asset value
for the beginning, ending and reinvestment values. |
|
(7) |
Payment
from affiliate had no impact on total return. |
|
(8) |
Return
not disclosed. |
|
(9) |
Annualized
for periods less than one year. |
|
(10) |
Ratio
of net expenses, before interest expense, was 1.56%, 1.58%, 1.55%, 1.43%, 1.40% and 1.34% for the years ended January 31, 2025, 2024 and 2023, period ended January 31, 2022, year ended February 28, 2021 and period ended February 29, 2020,
respectively. |
|
(11) |
Inclusive
of excise tax expense of 0.06%(5) and 0.05% for the period ended January 31, 2022 and year ended February 28, 2021. |
|
(12) |
Certain
expenses incurred by the Fund were not annualized. |
See Notes to Financial Statements
CONVERTIBLE & INCOME
FUND (NCV)
FINANCIAL
HIGHLIGHTS
SELECTED PER SHARE DATA AND RATIOS FOR A COMMON SHARE
OUTSTANDING THROUGHOUT EACH PERIOD
| |
Year
Ended January 31, |
|
Fiscal
Period
March 1, 2021 to
January 31,
2022 (1), (2) |
|
Year
Ended February 28/29 |
| |
2025
(1) |
|
2024
(1) |
|
2023
(1) |
|
2021
(1) |
|
2020
(1) |
|
|
| PER
SHARE DATA: |
|
|
|
|
|
|
|
|
|
|
|
|
Net asset value, beginning of
period
|
$
14.72 |
|
$
16.32 |
|
$
22.20 |
|
$
25.84 |
|
$
21.32 |
|
$
22.44 |
| Income
(loss) from investment operations: |
|
|
|
|
|
|
|
|
|
|
|
|
Net investment income
(loss)(3)
|
0.60
|
|
0.56
|
|
0.76
|
|
0.84
|
|
1.48
|
|
2.08
|
|
Net realized and unrealized gain
(loss)
|
2.31
|
|
(0.20)
|
|
(4.36)
|
|
(2.36)
|
|
5.40
|
|
(0.08)
|
|
Total from investment
operations
|
2.91
|
|
0.36
|
|
(3.60)
|
|
(1.52)
|
|
6.88
|
|
2.00
|
| Dividends
on Preferred Shares from Net Investment Income: |
(0.25)
|
|
(0.24)
|
|
(0.44)
|
|
(0.24)
|
|
(0.28)
|
|
(0.56)
|
|
Net increase (decrease) in net assets applicable to common shareholders resulting from investment
operations
|
2.66
|
|
0.12
|
|
(4.04)
|
|
(1.76)
|
|
6.60
|
|
1.44
|
| Dividends
and Distributions to Shareholders: |
|
|
|
|
|
|
|
|
|
|
|
|
Net investment
income
|
(0.44)
|
|
(0.28)
|
|
(0.44)
|
|
(0.64)
|
|
(1.24)
|
|
(1.68)
|
|
Return of
capital
|
(1.20)
|
|
(1.44)
|
|
(1.60)
|
|
(1.24)
|
|
(0.84)
|
|
(0.88)
|
|
Total dividends and distributions to
shareholders
|
(1.64)
|
|
(1.72)
|
|
(2.04)
|
|
(1.88)
|
|
(2.08)
|
|
(2.56)
|
| Preferred
Shares Transactions: |
|
|
|
|
|
|
|
|
|
|
|
|
Accretion to net asset value, resulting from tender offer of Auction-Rate Preferred
shares
|
—
|
|
—
|
|
0.20
|
|
—
|
|
—
|
|
—
|
|
Net asset value, end of
period
|
$
15.74 |
|
$
14.72 |
|
$
16.32 |
|
$
22.20 |
|
$
25.84 |
|
$
21.32 |
|
Market value, end of
period
|
$
14.52 |
|
$
13.12 |
|
$
15.84 |
|
$
21.24 |
|
$
22.72 |
|
$
20.40 |
|
Total return, net asset value(4),
(5)
|
19.01%
|
|
0.98%
|
|
(17.30)%
|
|
(7.41)%
|
|
—%
(6) |
|
—%
(6) |
|
Total return, market value(4),
(5)
|
24.58%
|
|
(6.04)%
|
|
(15.20)%
|
|
1.14%
|
|
24.29%
|
|
(8.51)%
|
| RATIOS/SUPPLEMENTAL
DATA: |
|
|
|
|
|
|
|
|
|
|
|
|
Ratio of net expenses after interest expense to average net
assets(7), (8),
(9)
|
3.06%
|
|
3.41%
|
|
2.08%
(10) |
|
1.39%
|
|
1.45%
|
|
1.53%
|
|
Ratio of total expenses after interest expense to average net
assets(7),
(8)
|
3.18%
|
|
3.54%
|
|
2.27%
(10) |
|
1.55%
|
|
1.48%
|
|
1.53%
|
|
Ratio of net investment income (loss) to average net assets(7),
(8)
|
4.01%
|
|
3.83%
|
|
4.38%
|
|
3.69%
|
|
7.04%
|
|
9.30%
|
|
Portfolio turnover
rate(4)
|
116%
|
|
107%
|
|
71%
|
|
54%
|
|
73%
|
|
35%
|
|
Net assets, end of period
(000’s)
|
$355,536
|
|
$332,823
|
|
$368,409
|
|
$501,250
|
|
$583,944
|
|
$481,633
|
|
Loan payable, end of period
(000’s)
|
$
34,000 |
|
$
34,000 |
|
$170,000
|
|
$
28,852 |
|
$
28,852 |
|
$
28,852 |
|
Mandatory redeemable preferred shares, end of period
(000’s)
|
$
66,000 |
|
$
66,000 |
|
$
— |
|
$
— |
|
$
— |
|
$
— |
|
Asset coverage, per $1,000 principal amount of loan
payable(11)
|
$
16,339 |
|
$
15,671 |
|
$
3,755 |
|
$
29,578 |
|
$
32,444 |
|
$
28,898 |
|
Asset coverage, per $25 liquidation preference per share of cumulative preferred shares and mandatory redeemable preferred
shares(12)
|
$
69 |
|
$
67 |
|
$
59 |
|
$
61 |
|
$
70 |
|
$
62 |
|
Asset coverage per $25,000 liquidation preference per share of auction-rate preferred
shares
|
N/A
|
|
N/A
|
|
N/A
|
|
$
60,587 |
|
$
70,027 |
|
$
62,132 |
|
Cumulative Preferred shares average market
value(13)
|
$
22.21 |
|
$
21.46 |
|
$
23.64 |
|
$
24.23 |
|
$
25.91 |
|
$
25.81 |
| |
|
|
(1) |
The
Fund had a 1-for-4 reverse stock split effective February 10, 2025. Prior year net asset values and per share amounts have been restated to reflect the impact of the reverse stock split (see Note 13 in Notes to Financial Statements). The net asset
value and market price reported at the original dates prior to the reverse stock split were as follows: |
| |
Year
Ended January 31, |
|
Fiscal
Period
March 1, 2021 to
January 31,
2022 |
|
Year
Ended February 28/29 |
| |
2025
|
|
2024
|
|
2023
|
|
2021
|
|
2020
|
|
|
|
Net Asset Value (prior to reverse stock
split)
|
$3.93
|
|
$3.68
|
|
$4.08
|
|
$5.55
|
|
$6.46
|
|
$5.33
|
|
Market Price (prior to reverse stock
split)
|
3.63
|
|
3.28
|
|
3.96
|
|
5.31
|
|
5.68
|
|
5.10
|
| |
|
|
|
|
|
|
|
|
|
|
|
| The
above values represent end of period values for the years reported and for net asset value, the beginning of period values for the next fiscal year. |
|
|
(2) |
The
Fund had a fiscal year end change from February 28 to January 31. |
|
(3) |
Calculated
using average shares outstanding. |
|
(4) |
Not
annualized for periods less than one year. |
|
(5) |
Total
return on market value is calculated assuming a purchase of common shares on the opening of the first day and sale on the closing of the last day of each period reported. Dividends and distributions are assumed, for purposes of this calculation, to
be reinvested at prices obtained under the Fund’s Automatic Reinvestment and Cash Purchase Plan. Total return on market value is not annualized for periods of less than one year. Brokerage commissions that a shareholder may pay are not
reflected. Total return on market value does not reflect the deduction of taxes that a shareholder may pay on Fund distributions or the sale of Fund shares. Total return on net asset value uses the same methodology, but with use of net asset value
for the beginning, ending and reinvestment values. |
|
(6) |
Return
not disclosed. |
|
(7) |
Calculated
on the basis of income and expenses applicable to both common and preferred shares relative to average net assets of common shareholders. |
|
(8) |
Annualized
for periods less than one year. |
See Notes to Financial Statements
CONVERTIBLE & INCOME
FUND (NCV)
FINANCIAL
HIGHLIGHTS
SELECTED PER SHARE DATA AND RATIOS FOR A COMMON SHARE
OUTSTANDING THROUGHOUT EACH PERIOD
|
(9) |
Ratio of
net expenses, before interest expense and auction agent fees and commissions, was 1.31%, 1.30%, 1.46%, 1.31%, 1.35% and 1.33% for the years ended January 31, 2025, 2024 and 2023, period ended January 31, 2022, years ended February 28/29, 2021 and
2020, respectively. |
|
(10) |
Inclusive
of tender offer expenses of 0.03% for the year ended January 31, 2023. |
|
(11) |
Represents
value of net assets applicable to common stock plus the loan payable, cumulative preferred shares, and mandatory redeemable preferred shares (cumulatively, “total borrowings”) at the end of the period divided by the loan payable at the
end of the period multiplied by $1,000. |
|
(12) |
Represents
value of net assets applicable to common stock plus total borrowings at the end of the period divided by the total borrowings at the end of the period multiplied by $25. |
|
(13) |
Based
on daily closing market prices. |
See Notes to Financial Statements
CONVERTIBLE & INCOME
FUND II (NCZ)
FINANCIAL
HIGHLIGHTS
SELECTED PER SHARE DATA AND RATIOS FOR A COMMON SHARE
OUTSTANDING THROUGHOUT EACH PERIOD
| |
Year
Ended January 31, |
|
Fiscal
Period
March 1, 2021 to
January 31,
2022 (1), (2) |
|
Year
Ended February 28/29 |
| |
2025
(1) |
|
2024
(1) |
|
2023
(1) |
|
2021
(1) |
|
2020
(1) |
|
|
| PER
SHARE DATA: |
|
|
|
|
|
|
|
|
|
|
|
|
Net asset value, beginning of
period
|
$
13.08 |
|
$
14.52 |
|
$
19.84 |
|
$
23.16 |
|
$
19.16 |
|
$
20.12 |
| Income
(loss) from investment operations: |
|
|
|
|
|
|
|
|
|
|
|
|
Net investment income
(loss)(3)
|
0.62
|
|
0.60
|
|
0.72
|
|
0.76
|
|
1.36
|
|
1.92
|
|
Net realized and unrealized gain
(loss)
|
2.14
|
|
(0.20)
|
|
(3.92)
|
|
(2.16)
|
|
4.80
|
|
(0.12)
|
|
Total from investment
operations
|
2.76
|
|
0.40
|
|
(3.20)
|
|
(1.40)
|
|
6.16
|
|
1.80
|
| Dividends
on Preferred Shares from Net Investment Income: |
(0.32)
|
|
(0.32)
|
|
(0.48)
|
|
(0.28)
|
|
(0.32)
|
|
(0.56)
|
|
Net increase (decrease) in net assets applicable to common shareholders resulting from investment
operations
|
2.44
|
|
0.08
|
|
(3.68)
|
|
(1.68)
|
|
5.84
|
|
1.24
|
| Dividends
and Distributions to Shareholders: |
|
|
|
|
|
|
|
|
|
|
|
|
Net investment
income
|
(0.36)
|
|
(0.20)
|
|
(0.32)
|
|
(0.48)
|
|
(1.08)
|
|
(1.44)
|
|
Return of
capital
|
(1.08)
|
|
(1.32)
|
|
(1.48)
|
|
(1.16)
|
|
(0.76)
|
|
(0.76)
|
|
Total dividends and distributions to
shareholders
|
(1.44)
|
|
(1.52)
|
|
(1.80)
|
|
(1.64)
|
|
(1.84)
|
|
(2.20)
|
| Preferred
Shares Transactions: |
|
|
|
|
|
|
|
|
|
|
|
|
Accretion to net asset value, resulting from tender offer of Auction-Rate Preferred
shares
|
—
|
|
—
|
|
0.16
|
|
—
|
|
—
|
|
—
|
|
Net asset value, end of
period
|
$
14.08 |
|
$
13.08 |
|
$
14.52 |
|
$
19.84 |
|
$
23.16 |
|
$
19.16 |
|
Market value, end of
period
|
$
13.08 |
|
$
11.52 |
|
$
13.32 |
|
$
18.48 |
|
$
20.04 |
|
$
18.16 |
|
Total return, net asset value(4),
(5)
|
19.83%
|
|
0.76%
|
|
(17.84)%
|
|
(7.95)%
|
|
—%
(6) |
|
—%
(6) |
|
Total return, market value(4),
(5)
|
27.69%
|
|
(1.94)%
|
|
(17.85)%
|
|
(0.19)%
|
|
22.81%
|
|
(6.98)%
|
| RATIOS/SUPPLEMENTAL
DATA: |
|
|
|
|
|
|
|
|
|
|
|
|
Ratio of net expenses after interest expense to average net
assets(7), (8),
(9)
|
2.43%
|
|
2.74%
|
|
2.00%
(10) |
|
1.40%
|
|
1.44%
|
|
1.41%
|
|
Ratio of total expenses after interest expense to average net
assets(7),
(8)
|
2.55%
|
|
2.87%
|
|
2.18%
(10) |
|
1.55%
|
|
1.47%
|
|
1.41%
|
|
Ratio of net investment income (loss) to average net assets(7),
(8)
|
4.59%
|
|
4.44%
|
|
4.57%
|
|
3.73%
|
|
7.18%
|
|
9.48%
|
|
Portfolio turnover
rate(4)
|
118%
|
|
108%
|
|
72%
|
|
54%
|
|
73%
|
|
35%
|
|
Net assets, end of period
(000’s)
|
$267,904
|
|
$248,849
|
|
$276,002
|
|
$377,882
|
|
$440,994
|
|
$364,382
|
|
Loan payable, end of period
(000’s)
|
$
25,000 |
|
$
25,000 |
|
$
95,000 |
|
$
— |
|
$
— |
|
$
— |
|
Mandatory redeemable preferred shares, end of period
(000’s)
|
$
22,000 |
|
$
22,000 |
|
$
— |
|
$
— |
|
$
— |
|
$
— |
|
Asset coverage, per $1,000 principal amount of loan
payable(11)
|
$
16,956 |
|
$
16,194 |
|
$
5,053 |
|
$
— |
|
$
— |
|
$
— |
|
Asset coverage, per $25 liquidation preference per share of cumulative preferred shares and mandatory redeemable preferred
shares(12)
|
$
68 |
|
$
65 |
|
$
59 |
|
$
60 |
|
$
65 |
|
$
58 |
|
Asset coverage per $25,000 liquidation preference per share of auction-rate preferred
shares
|
N/A
|
|
N/A
|
|
N/A
|
|
$
59,793 |
|
$
65,454 |
|
$
58,421 |
|
Cumulative Preferred shares average market
value(13)
|
$
21.08 |
|
$
21.08 |
|
$
23.53 |
|
$
23.92 |
|
$
25.64 |
|
$
25.39 |
| |
|
|
(1) |
The
Fund had a 1-for-4 reverse stock split effective February 10, 2025. Prior year net asset values and per share amounts have been restated to reflect the impact of the reverse stock split (see Note 13 in Notes to Financial Statements). The net asset
value and market price reported at the original dates prior to the reverse stock split were as follows: |
| |
Year
Ended January 31, |
|
Fiscal
Period
March 1, 2021 to
January 31,
2022 |
|
Year
Ended February 28/29 |
| |
2025
|
|
2024
|
|
2023
|
|
2021
|
|
2020
|
|
|
|
Net Asset Value (prior to reverse stock
split)
|
$3.52
|
|
$3.27
|
|
$3.63
|
|
$4.96
|
|
$5.79
|
|
$4.79
|
|
Market Price (prior to reverse stock
split)
|
3.27
|
|
2.88
|
|
3.33
|
|
4.62
|
|
5.01
|
|
4.54
|
| |
|
|
|
|
|
|
|
|
|
|
|
| The
above values represent end of period values for the years reported and for net asset value, the beginning of period values for the next fiscal year. |
|
|
(2) |
The
Fund had a fiscal year end change from February 28 to January 31. |
|
(3) |
Calculated
using average shares outstanding. |
|
(4) |
Not
annualized for periods less than one year. |
|
(5) |
Total
return on market value is calculated assuming a purchase of common shares on the opening of the first day and sale on the closing of the last day of each period reported. Dividends and distributions are assumed, for purposes of this calculation, to
be reinvested at prices obtained under the Fund’s Automatic Reinvestment and Cash Purchase Plan. Total return on market value is not annualized for periods of less than one year. Brokerage commissions that a shareholder may pay are not
reflected. Total return on market value does not reflect the deduction of taxes that a shareholder may pay on Fund distributions or the sale of Fund shares. Total return on net asset value uses the same methodology, but with use of net asset value
for the beginning, ending and reinvestment values. |
|
(6) |
Return
not disclosed. |
|
(7) |
Calculated
on the basis of income and expenses applicable to both common and preferred shares relative to average net assets of common shareholders. |
|
(8) |
Annualized
for periods less than one year. |
See Notes to Financial Statements
CONVERTIBLE & INCOME
FUND II (NCZ)
FINANCIAL
HIGHLIGHTS
SELECTED PER SHARE DATA AND RATIOS FOR A COMMON SHARE
OUTSTANDING THROUGHOUT EACH PERIOD
|
(9) |
Ratio of
net expenses, before interest expense and auction agent fees and commissions, was 1.33%, 1.33%, 1.53%, 1.35%, 1.39% and 1.36% for the years ended January 31, 2025, 2024 and 2023, period ended January 31, 2022, years ended February 28/29, 2021 and
2020, respectively. |
|
(10) |
Inclusive
of tender offer expenses of 0.03% for the year ended January 31, 2023. |
|
(11) |
Represents
value of net assets applicable to common stock plus the loan payable, cumulative preferred shares, and mandatory redeemable preferred shares (cumulatively, “total borrowings”) at the end of the period divided by the loan payable at the
end of the period multiplied by $1,000. |
|
(12) |
Represents
value of net assets applicable to common stock plus total borrowings at the end of the period divided by the total borrowings at the end of the period multiplied by $25. |
|
(13) |
Based
on daily closing market prices. |
See Notes to Financial Statements
DIVERSIFIED INCOME &
CONVERTIBLE FUND (ACV)
FINANCIAL HIGHLIGHTS
SELECTED PER SHARE DATA AND RATIOS FOR A COMMON SHARE OUTSTANDING
THROUGHOUT EACH PERIOD
| |
Year
Ended January 31, |
| |
2025
|
|
2024
|
|
2023
|
|
2022
|
|
2021
|
| PER
SHARE DATA: |
|
|
|
|
|
|
|
|
|
|
Net asset value, beginning of
period
|
$
20.85 |
|
$
21.22 |
|
$
27.25 |
|
$
35.15 |
|
$
24.81 |
| Income
(loss) from investment operations: |
|
|
|
|
|
|
|
|
|
|
Net investment income
(loss)(1)
|
0.15
|
|
0.02
|
|
(0.02)
|
|
(0.17)
|
|
0.01
|
|
Net realized and unrealized gain
(loss)
|
4.47
|
|
1.77
|
|
(3.65)
|
|
0.09
|
|
12.71
|
|
Total from investment
operations
|
4.62
|
|
1.79
|
|
(3.67)
|
|
(0.08)
|
|
12.72
|
| Dividends
and Distributions to Common Shareholders: |
|
|
|
|
|
|
|
|
|
|
Net investment
income
|
(1.60)
|
|
—
|
|
(2.16)
|
|
(2.02)
|
|
(1.19)
|
|
Net realized
gains
|
—
|
|
—
|
|
(0.20)
|
|
(5.80)
|
|
(1.19)
|
|
Return of
capital
|
(0.56)
|
|
(2.16)
|
|
—
|
|
—
|
|
—
|
|
Total dividends and distributions to common
shareholders
|
(2.16)
|
|
(2.16)
|
|
(2.36)
|
|
(7.82)
|
|
(2.38)
|
|
Net asset value, end of
period
|
$
23.31 |
|
$
20.85 |
|
$
21.22 |
|
$
27.25 |
|
$
35.15 |
|
Market value, end of
period
|
$
22.92 |
|
$
22.44 |
|
$
22.62 |
|
$
27.75 |
|
$
32.25 |
|
Total return, net asset
value(2)
|
23.35%
|
|
9.20%
|
|
(13.45)%
|
|
(2.32)%
|
|
—%
(3) |
|
Total return, market
value(2)
|
12.80%
|
|
10.61%
|
|
(9.06)%
|
|
7.46%
|
|
40.11%
|
| RATIOS/SUPPLEMENTAL
DATA: |
|
|
|
|
|
|
|
|
|
|
Ratio of net expenses after interest expense to average net
assets(4)
|
3.77%
|
|
3.95%
|
|
3.36%
|
|
2.47%
(5) |
|
2.84%
(5) |
|
Ratio of total expenses after interest expense to average net
assets
|
3.87%
|
|
4.06%
|
|
3.49%
|
|
2.55%
(5) |
|
2.84%
(5) |
|
Ratio of net investment income (loss) to average net
assets
|
0.68%
|
|
0.09%
|
|
(0.07)%
|
|
(0.48)%
(5) |
|
0.05%
(5) |
|
Portfolio turnover
rate
|
148%
|
|
119%
|
|
94%
|
|
108%
|
|
128%
|
|
Net assets, end of period
(000’s)
|
$241,791
|
|
$216,157
|
|
$219,853
|
|
$282,348
|
|
$363,899
|
|
Loan payable, end of period
(000’s)
|
$
75,000 |
|
$
75,000 |
|
$
75,000 |
|
$
75,000 |
|
$
75,000 |
|
Mandatory redeemable preferred shares, end of period
(000’s)
|
$
30,000 |
|
$
30,000 |
|
$
30,000 |
|
$
30,000 |
|
$
30,000 |
|
Asset coverage, per $1,000 principal amount of loan
payable(6)
|
$
4,624 |
|
$
4,282 |
|
$
4,331 |
|
$
5,165 |
|
$
6,252 |
|
Asset coverage ratio on total leverage
(7)
|
330%
|
|
306%
|
|
309%
|
|
369%
|
|
447%
|
|
Asset coverage, per $25 liquidation preference per share of mandatory redeemable preferred
shares(8)
|
$
83 |
|
$
76 |
|
$
77 |
|
$
92 |
|
$
112 |
| |
|
|
(1) |
Calculated
using average shares outstanding. |
|
(2) |
Total
return on market value is calculated assuming a purchase of common shares on the opening of the first day and sale on the closing of the last day of each period reported. Dividends and distributions are assumed, for purposes of this calculation, to
be reinvested at prices obtained under the Fund’s Automatic Reinvestment and Cash Purchase Plan. Total return on market value is not annualized for periods of less than one year. Brokerage commissions that a shareholder may pay are not
reflected. Total return on market value does not reflect the deduction of taxes that a shareholder may pay on Fund distributions or the sale of Fund shares. Total return on net asset value uses the same methodology, but with use of net asset value
for the beginning, ending and reinvestment values. |
|
(3) |
Return
not disclosed. |
|
(4) |
Ratio
of net expenses, before interest expense to average net assets was 1.65%, 2.28%, 2.17%, 1.85%, and 2.03% for the years ended January 31, 2025, 2024, 2023, 2022 and 2021, respectively. |
|
(5) |
Inclusive
of excise tax expense of 0.04% and 0.05% for the years ended January 31, 2022 and 2021, respectively. |
|
(6) |
Represents
value of net assets applicable to common stock plus the loan payable and mandatory redeemable preferred shares at the end of the period divided by the borrowings at the end of the period multiplied by $1,000. |
|
(7) |
Represents
value of net assets applicable to common stock plus the loan payable and mandatory redeemable preferred shares at the end of the period divided by the loan payable and mandatory redeemable preferred shares at the end of the period. |
|
(8) |
Represents
value of net assets applicable to common stock plus the loan payable and mandatory redeemable preferred shares at the end of the period divided by the loan payable and mandatory redeemable preferred shares at the end of the period multiplied by
$25. |
See Notes to Financial Statements
DIVIDEND, INTEREST &
PREMIUM STRATEGY FUND (NFJ)
FINANCIAL HIGHLIGHTS
SELECTED PER SHARE DATA AND RATIOS FOR A SHARE OUTSTANDING
THROUGHOUT EACH PERIOD
| |
Year
Ended January 31, |
| |
2025
|
|
2024
|
|
2023
|
|
2022
|
|
2021
|
| PER
SHARE DATA: |
|
|
|
|
|
|
|
|
|
|
Net asset value, beginning of
period
|
$
14.22 |
|
$
14.19 |
|
$
16.33 |
|
$
15.21 |
|
$
14.34 |
| Income
(loss) from investment operations: |
|
|
|
|
|
|
|
|
|
|
Net investment income
(loss)(1)
|
0.20
|
|
0.19
|
|
0.08
|
|
0.05
|
|
0.13
|
|
Net realized and unrealized gain
(loss)
|
1.17
|
|
0.82
|
|
(1.22)
|
|
1.97
|
|
1.64
|
|
Total from investment
operations
|
1.37
|
|
1.01
|
|
(1.14)
|
|
2.02
|
|
1.77
|
| Dividends
and Distributions to Shareholders: |
|
|
|
|
|
|
|
|
|
|
Net investment
income
|
(0.44)
|
|
(0.98)
|
|
(0.98)
|
|
(0.90)
|
|
(0.13)
|
|
Net realized
gains
|
(0.73)
|
|
—
|
|
(0.02)
|
|
—
|
|
(0.48)
|
|
Return of
capital
|
—
|
|
—
|
|
—
|
|
—
|
|
(0.29)
|
|
Total dividends and distributions to
shareholders
|
(1.17)
|
|
(0.98)
|
|
(1.00)
|
|
(0.90)
|
|
(0.90)
|
|
Net asset value, end of
period
|
$
14.42 |
|
$
14.22 |
|
$
14.19 |
|
$
16.33 |
|
$
15.21 |
|
Market value, end of
period
|
$
13.05 |
|
$
12.18 |
|
$
12.31 |
|
$
14.73 |
|
$
13.28 |
|
Total return, net asset
value(2)
|
9.90%
|
|
7.60%
|
|
(6.71)%
|
|
13.39%
|
|
—%
(3) |
|
Total return, market
value(2)
|
17.41%
|
|
7.37%
|
|
(9.24)%
|
|
17.77%
|
|
9.71%
|
| RATIOS/SUPPLEMENTAL
DATA: |
|
|
|
|
|
|
|
|
|
|
Ratio of net expenses to average net
assets
|
0.96%
|
|
0.96%
|
|
0.96%
|
|
0.96%
|
|
0.96%
|
|
Ratio of total expenses to average net
assets
|
1.06%
|
|
1.06%
|
|
1.08%
|
|
1.06%
|
|
0.96%
|
|
Ratio of net investment income (loss) to average net
assets
|
1.39%
|
|
1.39%
|
|
0.58%
|
|
0.28%
|
|
0.94%
|
|
Portfolio turnover
rate
|
58%
|
|
102%
|
|
60%
|
|
63%
|
|
104%
|
|
Net assets, end of period
(000’s)
|
$1,367,398
|
|
$1,347,891
|
|
$1,345,311
|
|
$1,548,372
|
|
$1,441,666
|
| |
|
|
(1) |
Calculated
using average shares outstanding. |
|
(2) |
Total
return on market value is calculated assuming a purchase of common shares on the opening of the first day and sale on the closing of the last day of each period reported. Dividends and distributions are assumed, for purposes of this calculation, to
be reinvested at prices obtained under the Fund’s Automatic Reinvestment and Cash Purchase Plan. Total return on market value is not annualized for periods of less than one year. Brokerage commissions that a shareholder may pay are not
reflected. Total return on market value does not reflect the deduction of taxes that a shareholder may pay on Fund distributions or the sale of Fund shares. Total return on net asset value uses the same methodology, but with use of net asset value
for the beginning, ending and reinvestment values. |
|
(3) |
Return
not disclosed. |
See Notes to Financial Statements
EQUITY & CONVERTIBLE
INCOME FUND (NIE)
FINANCIAL HIGHLIGHTS
SELECTED PER SHARE DATA AND RATIOS FOR A SHARE OUTSTANDING
THROUGHOUT EACH PERIOD
| |
Year
Ended January 31, |
| |
2025
|
|
2024
|
|
2023
|
|
2022
|
|
2021
|
| PER
SHARE DATA: |
|
|
|
|
|
|
|
|
|
|
Net asset value, beginning of
period
|
$
23.82 |
|
$
22.43 |
|
$
30.32 |
|
$
30.91 |
|
$
24.89 |
| Income
(loss) from investment operations: |
|
|
|
|
|
|
|
|
|
|
Net investment income
(loss)(1)
|
0.21
|
|
0.18
|
|
0.11
|
|
(0.09)
|
|
0.06
|
|
Net realized and unrealized gain
(loss)
|
4.49
|
|
3.21
|
|
(4.02)
|
|
2.77
|
|
7.48
|
|
Total from investment
operations
|
4.70
|
|
3.39
|
|
(3.91)
|
|
2.68
|
|
7.54
|
| Dividends
and Distributions to Shareholders: |
|
|
|
|
|
|
|
|
|
|
Net investment
income
|
(1.97)
|
|
(1.11)
|
|
(2.00)
|
|
(1.52)
|
|
(0.09)
|
|
Net realized
gains
|
(0.03)
|
|
—
|
|
(1.98)
|
|
(1.75)
|
|
(1.43)
|
|
Return of
capital
|
—
|
|
(0.89)
|
|
—
|
|
—
|
|
—
|
|
Total dividends and distributions to
shareholders
|
(2.00)
|
|
(2.00)
|
|
(3.98)
|
|
(3.27)
|
|
(1.52)
|
|
Net asset value, end of
period
|
$
26.52 |
|
$
23.82 |
|
$
22.43 |
|
$
30.32 |
|
$
30.91 |
|
Market value, end of
period
|
$
24.91 |
|
$
21.33 |
|
$
20.28 |
|
$
27.33 |
|
$
27.78 |
|
Total return, net asset
value(2)
|
20.45%
|
|
16.05%
|
|
(12.54)%
|
|
8.22%
|
|
—%
(3) |
|
Total return, market
value(2)
|
27.08%
|
|
15.95%
|
|
(10.96)%
|
|
9.80%
|
|
28.21%
|
| RATIOS/SUPPLEMENTAL
DATA: |
|
|
|
|
|
|
|
|
|
|
Ratio of net expenses to average net
assets
|
1.07%
|
|
1.07%
|
|
1.07%
|
|
1.12%
(4) |
|
1.07%
|
|
Ratio of total expenses to average net
assets
|
1.16%
|
|
1.17%
|
|
1.18%
|
|
1.22%
(4) |
|
1.07%
|
|
Ratio of net investment income (loss) to average net
assets
|
0.84%
|
|
0.78%
|
|
0.41%
|
|
(0.28)%
(4) |
|
0.24%
|
|
Portfolio turnover
rate
|
152%
|
|
104%
|
|
76%
|
|
71%
|
|
85%
|
|
Net assets, end of period
(000’s)
|
$734,879
|
|
$659,977
|
|
$621,644
|
|
$840,257
|
|
$856,449
|
| |
|
|
(1) |
Calculated
using average shares outstanding. |
|
(2) |
Total
return on market value is calculated assuming a purchase of common shares on the opening of the first day and sale on the closing of the last day of each period reported. Dividends and distributions are assumed, for purposes of this calculation, to
be reinvested at prices obtained under the Fund’s Automatic Reinvestment and Cash Purchase Plan. Total return on market value is not annualized for periods of less than one year. Brokerage commissions that a shareholder may pay are not
reflected. Total return on market value does not reflect the deduction of taxes that a shareholder may pay on Fund distributions or the sale of Fund shares. Total return on net asset value uses the same methodology, but with use of net asset value
for the beginning, ending and reinvestment values. |
|
(3) |
Return
not disclosed. |
|
(4) |
Inclusive
of excise tax expense of 0.05% for the year ended January 31, 2022. |
See Notes to Financial Statements
NOTES TO FINANCIAL
STATEMENTS
January 31, 2025
Note 1. Organization
Artificial Intelligence & Technology
Opportunities Fund (AIO), Convertible & Income Fund (NCV), Convertible & Income Fund II (NCZ), Diversified Income & Convertible Fund (ACV), Dividend, Interest & Premium Strategy Fund (NFJ), and Equity & Convertible Income Fund
(NIE) (each, a “Fund” and, collectively, the “Funds”), were organized as Massachusetts business trusts on May 24, 2019, January 17, 2003, April 22, 2003, March 10, 2015, December 12, 2006, and August 20, 2003, respectively.
The Funds are each organized and registered as diversified, closed-end management investment companies under the Investment Company Act of 1940, as amended (the “1940 Act”), and the rules and regulations thereunder. The Funds’
investment objectives are outlined in the Manager’s Discussion of Fund Performance pages.
Note 2. Significant Accounting Policies
The Funds are investment companies that
follow the accounting and reporting guidance of the Financial Accounting Standards Board (“FASB”) Accounting Standards Codification Topic 946 Financial Services – Investment Companies. The following is a summary of significant
accounting policies consistently followed by the Funds in the preparation of their financial statements and for derivatives, included in Note 3 below. The preparation of financial statements in conformity with U.S. generally accepted accounting
principles (“U.S. GAAP”) requires management to make estimates and assumptions that affect the reported amounts of assets and liabilities, disclosure of contingent assets and liabilities at the date of the financial statements, and the
reported amounts of increases and decreases in net assets from operations during the reporting period. Actual results could differ from those estimates and those differences could be significant.
| A.
|
Security Valuation |
| |
The
Funds’ Board of Trustees has designated the investment adviser as the valuation designee to perform fair valuations pursuant to Rule 2a-5 under the 1940 Act. Each Fund utilizes a fair value hierarchy which prioritizes the inputs to valuation
techniques used to measure fair value into three broad levels. The Funds’ policy is to recognize transfers into or out of Level 3 at the end of the reporting period. |
| |
•
Level 1 – quoted prices in active markets for identical securities (security types generally include listed equities). |
| |
•
Level 2 – prices determined using other significant observable inputs (including quoted prices for similar securities, interest rates, prepayment speeds, credit risk, etc.). |
| |
•
Level 3 – prices determined using significant unobservable inputs (including the investment adviser’s Valuation Committee’s own assumptions in determining the fair value of investments). |
| |
A
description of the valuation techniques applied to a Fund’s major categories of assets and liabilities measured at fair value on a recurring basis is as follows: |
| |
Equity
securities are valued at the official closing price (typically last sale) on the exchange on which the securities are primarily traded or, if no closing price is available, at the last bid price and are categorized as Level 1 in the hierarchy.
Illiquid, restricted equity securities and illiquid private placements are internally fair valued by the investment adviser’s Valuation Committee, and are generally categorized as Level 3 in the hierarchy. |
| |
Certain
non-U.S. securities may be fair valued in cases where closing prices are not readily available or are deemed not reflective of readily available market prices. For example, significant events (such as movement in the U.S. securities market, or other
regional and local developments) may occur between the time that non-U.S. markets close (where the security is principally traded) and the time that a Fund calculates its net asset value (“NAV”) at the close of regular trading on the New
York Stock Exchange (“NYSE”) (generally 4 p.m. Eastern time) that may impact the value of securities traded in these non-U.S. markets. In such cases, the Funds fair value non-U.S. securities using an independent pricing service which
considers the correlation of the trading patterns of the non-U.S. security to the intraday trading in the U.S. markets for investments such as ADRs, financial futures, ETFs, and certain indexes, as well as prices for similar securities. Such fair
valuations are categorized as Level 2 in the hierarchy. Because the frequency of significant events is not predictable, fair valuation of certain non-U.S. common stocks may occur on a frequent basis. |
| |
Debt
instruments, including convertible bonds, restricted securities and leveraged loans are valued based on either evaluated or composite quotations received from independent pricing services or from dealers who make markets in such securities. For most
bond types, the pricing service utilizes matrix pricing that considers one or more of the following factors: yield or price of bonds of comparable quality, coupon, maturity, current cash flows, type, activity of the underlying equities, and current
day trade information, as well as dealer supplied prices. These valuations are generally categorized as Level 2 in the hierarchy. Structured debt instruments, such as mortgage-backed and asset-backed securities may also incorporate collateral
analysis and utilize cash flow models for valuation and are generally categorized as Level 2 in the hierarchy. Pricing services do not provide pricing for all securities and therefore indicative bids from dealers are utilized which are based on
pricing models used by market makers in the security and are generally categorized as Level 2 in the hierarchy. Debt instruments that are internally fair valued by the investment adviser’s Valuation Committee are generally categorized as Level
3 in the hierarchy. |
| |
Listed
derivatives, such as options, that are actively traded are valued at the last posted settlement price from the exchange where they are principally traded and are categorized as Level 1 in the hierarchy. Over-the-counter (“OTC”)
derivative contracts, which include forward currency contracts and equity-linked instruments, do not require material subjectivity as pricing inputs are observed from actively quoted markets and are categorized as Level 2 in the hierarchy. |
| |
Investments
in open-end mutual funds are valued at NAV. Investments in closed-end funds and ETFs are valued as of the close of regular trading on the NYSE each business day. Each is categorized as Level 1 in the hierarchy. |
NOTES TO FINANCIAL STATEMENTS
(Continued)
January 31, 2025
A summary of the inputs used to value a
Fund’s net assets by each major security type is disclosed at the end of the Schedule of Investments for each Fund. The inputs or methodologies used for valuing securities are not necessarily an indication of the risk associated with investing
in those securities.
| B.
|
Security Transactions and
Investment Income |
| |
Security transactions are
recorded on the trade date. Realized gains and losses from the sale of securities are determined on the identified cost basis. Dividend income and capital gain distributions are recognized on the ex-dividend date or, in the case of certain foreign
securities, as soon as a Fund is notified. Interest income is recorded on the accrual basis. Each Fund amortizes premiums and accretes discounts using the effective interest method. Premiums on callable debt instruments are amortized to interest
income to the earliest call date using the effective interest method. Conversion premium is not amortized. Any distributions from underlying funds are recorded in accordance with the character of the distributions as designated by the underlying
funds. |
| |
Dividend income from REITs
and MLPs investments is recorded using management’s estimate of the percentage of income included in distributions received from such investments based on historical information and other industry sources. The return of capital portion of the
estimate is a reduction to investment income and a reduction in the cost basis of each investment which increases net realized gain (loss) and net change in unrealized appreciation (depreciation). If the return of capital distributions exceed their
cost basis, the distributions are treated as realized gains. The actual amounts of income, return of capital, and capital gains are only determined by each REIT and MLP after its fiscal year-end, and may differ from the estimated amounts. |
| C.
|
Income Taxes |
| |
Each Fund is treated as a
separate taxable entity. It is the intention of each Fund to comply with the requirements of Subchapter M of the Internal Revenue Code of 1986, as amended (the “Code”) and to distribute substantially all of its taxable income to its
shareholders. Therefore, no provision for federal income taxes or excise taxes has been made. |
| |
Certain Funds may be subject
to foreign taxes on income, gains on investments or currency repatriation, a portion of which may be recoverable. Each Fund will accrue such taxes and recoveries as applicable based upon current interpretations of the tax rules and regulations that
exist in the markets in which it invests. |
| |
Management of the Funds has
concluded that there are no significant uncertain tax positions that would require recognition in the financial statements. Each Fund’s U.S. federal income tax return is generally subject to examination by the Internal Revenue Service for a
period of three years after it is filed. State, local and/or non-U.S. tax returns and/or other filings may be subject to examination for different periods, depending upon the tax rules of each applicable jurisdiction. |
| D.
|
Distributions to Shareholders
|
| |
AIO, NCV, NCZ and ACV declare
distributions on a monthly basis. NFJ and NIE declare distributions on a quarterly basis. Distributions are recorded by the Funds on the ex-dividend date. Income and capital gain distributions are determined in accordance with income tax regulations
which may differ from U.S. GAAP. |
| |
AIO and ACV have a Managed
Distribution Plan which currently provides for the Funds to make a monthly distribution of $0.15 per share and $0.18 per share, respectively. NIE and NFJ have a Managed Distribution Plan which currently provides for the Funds to make a quarterly
distribution of $0.50 per share and $0.305 per share, respectively. |
| E.
|
Expenses
|
| |
Expenses incurred together by
a Fund and other affiliated mutual funds are allocated in proportion to the net assets of each such fund, except where allocation of direct expenses to each Fund and each such other fund, or an alternative allocation method, can be more
appropriately used. |
| |
In addition to the net annual
operating expenses that a Fund bears directly, the shareholders of a Fund indirectly bear the pro-rata expenses of any underlying mutual funds in which the Fund invests. |
| F.
|
Foreign Currency Transactions
|
| |
Non-U.S. investment
securities and other assets and liabilities denominated in foreign currencies are translated into U.S. dollar amounts at the foreign currency exchange rate effective at the end of the reporting period. Cost of investments is translated at the
currency exchange rate effective at the trade date. The gain or loss resulting from a change in currency exchange rates between the trade and settlement date of a portfolio transaction is treated as a gain or loss on foreign currency. Likewise, the
gain or loss resulting from a change in currency exchange rates between the date income is accrued and the date it is paid is treated as a gain or loss on foreign currency. For fixed income instruments, the Funds bifurcate that portion of the
results of operations arising from changes in foreign exchange rates on investments from the fluctuations arising from changes in the market prices of securities held and such fluctuations are included with the net realized and unrealized gain or
loss on foreign currency transactions. For equity securities, the Funds do not isolate that portion of the results of operations arising from changes in foreign exchange rates on investments from the fluctuations arising from changes in the market
prices of securities held and such fluctuations are included with the net realized and unrealized gain or loss on investments. |
| G.
|
Convertible Securities
|
| |
The Funds
may invest a portion of their assets in convertible securities. Although convertible securities derive part of their value from that of the securities into which they are convertible, they are not considered derivative financial instruments.
However, certain of the Funds’ investments in convertible securities include features which render them sensitive to price changes in their underlying securities. The value of structured/synthetic convertible securities can be affected by
interest rate changes and credit risks of the issuer. Such securities may be structured in ways that limit |
NOTES TO FINANCIAL STATEMENTS
(Continued)
January 31, 2025
| |
their potential for capital
appreciation, and the entire value of the security may be at risk of loss depending on the performance of the underlying equity security. Consequently, the Funds are exposed to greater downside risk than traditional convertible securities, but
typically still less than that of the underlying stock. |
| H.
|
Payment-In-Kind Securities
|
| |
The Funds may invest in
payment-in-kind securities, which are debt or preferred stock securities that require or permit payment of interest in the form of additional securities. Payment-in-kind securities allow the issuer to avoid or delay the need to generate cash to meet
current interest payments and, as a result, may involve greater risk than securities that pay interest currently or in cash. |
| I.
|
When-Issued Purchases and
Forward Commitments (Delayed Delivery) |
| |
Certain Funds may engage in
when-issued or forward commitment transactions. Securities purchased on a when-issued or forward commitment basis are also known as delayed delivery transactions. Delayed delivery transactions involve a commitment by a Fund to purchase or sell a
security at a future date (ordinarily up to 90 days later). When-issued or forward commitments enable the Funds to lock in what is believed to be an attractive price or yield on a particular security for a period of time, regardless of future
changes in interest rates. Each Fund records when-issued and forward commitment securities on the trade date. Each Fund maintains collateral for the securities purchased. Securities purchased on a when-issued or forward commitment basis begin
earning interest on the settlement date. |
| J.
|
Leveraged Loans |
| |
Certain Funds may invest in
direct debt instruments which are interests in amounts owed by a corporate, governmental, or other borrower to lenders or lending syndicates. Leveraged loans are generally non-investment grade and often involve borrowers that are highly leveraged.
The Funds may invest in obligations of borrowers who are in bankruptcy proceedings. Leveraged loans are typically senior in the corporate capital structure of the borrower. A loan is often administered by a bank or other financial institution (the
“lender”) that acts as agent for all holders. The agent administers the terms of the loan, as specified in the leveraged loan. A Fund’s investments in loans may be in the form of participations in loans or assignments of all or a
portion of loans from third parties. When investing in loan participations, a Fund has the right to receive payments of principal, interest and any fees to which it is entitled only from the lender selling the loan participation and only upon
receipt by the lender of payments from the borrower. A Fund generally has no right to enforce compliance with the terms of the leveraged loan with the borrower. As a result, a Fund may be subject to the credit risk of both the borrower and the
lender that is selling the leveraged loan. When a Fund purchases assignments from lenders it acquires direct rights against the borrower on the loan. |
| |
A Fund may invest in multiple
series or tranches of a loan, which may have varying terms and carry different associated risks. Leveraged loans may involve foreign borrowers and investments may be denominated in foreign currencies. Direct indebtedness of emerging countries
involves a risk that the government entities responsible for the repayment of the debt may be unable, or unwilling, to pay the principal and interest when due. |
| |
The leveraged loans have
floating rate loan interests which generally pay interest at rates that are periodically determined by reference to a base lending rate plus a premium. The base lending rates are generally SOFR, the prime rate offered by one or more U.S. banks or
the certificate of deposit rate. When a leveraged loan is purchased a Fund may pay an assignment fee. On an ongoing basis, a Fund may receive a commitment fee based on the undrawn portion of the underlying line of credit portion of a leveraged loan.
Prepayment penalty fees are received upon the prepayment of a leveraged loan by a borrower. Prepayment penalty, facility, commitment, consent and amendment fees are recorded to income as earned or paid. |
| |
A Fund may invest in both
secured loans and “covenant lite” loans which have few or no financial maintenance covenants that would require a borrower to maintain certain financial metrics. The lack of financial maintenance covenants in covenant lite loans
increases the risk that the applicable Fund will experience difficulty or delays in enforcing its rights on its holdings of such loans, which may result in losses, especially during a downturn in the credit cycle. |
| K.
|
Warrants
|
| |
The Funds may receive
warrants. Warrants are securities that are usually issued together with a debt instrument or preferred stock and that give the holder the right to buy a proportionate amount of common stock at a specified price. Warrants may be freely transferable
and are often traded on major exchanges. Warrants normally have a life that is measured in years and entitle the holder to buy common stock of a company at a price that is usually higher than the market price at the time the warrant is issued.
Warrants may entail greater risks than certain other types of investments. Generally, warrants do not carry the right to receive dividends or exercise voting rights with respect to the underlying securities, and they do not represent any rights in
the assets of the issuer. In addition, their value does not necessarily change with the value of the underlying securities, and they cease to have value if they are not exercised on or before their expiration date. If the market price of the
underlying stock does not exceed the exercise price during the life of the warrant, the warrant will expire worthless. Warrants may increase the potential profit or loss to be realized from the investment as compared with investing the same amount
in the underlying securities. Similarly, the percentage increase or decrease in the value of an equity security warrant may be greater than the percentage increase or decrease in the value of the underlying common stock. Warrants may relate to the
purchase of equity or debt instruments. Debt obligations with warrants attached to purchase equity securities have many characteristics of convertible securities and their prices may, to some degree, reflect the performance of the underlying stock.
Debt obligations also may be issued with warrants attached to purchase additional debt instruments at the same coupon rate. A decline in interest rates would permit a Fund to sell such warrants at a profit. If interest rates rise, these warrants
would generally expire with no value. |
| L.
|
Cash and Cash Equivalents
|
| |
Cash and
cash equivalents include deposits held at financial institutions, and are inclusive of dollar denominated cash, foreign currency, and deposit with brokers for written options. |
NOTES TO FINANCIAL STATEMENTS
(Continued)
January 31, 2025
| M.
|
Segment Reporting |
| |
Accounting
Standards Codification (“ASC”) 280, Segment Reporting, established disclosure requirements relating to operating segments in financial statements. The Funds have adopted FASB Accounting Standards Update 2023-07, Segment Reporting (Topic
280): Improvements to Reportable Segment Disclosures (“ASU 2023-07”), which is intended to enhance reportable operating segment disclosure requirements. Operating segments are defined as components of a reporting entity about which
separate financial information, including disclosures about income and expenses, is available that is regularly evaluated by the chief operating decision maker (“CODM”) in deciding how to allocate resources and assess the Funds’
performance. Each Fund is structured as an investment company and represents a single operating segment. Subject to the oversight and, when applicable, approval of each Fund’s Board of Trustees, the Funds’ Investment Adviser acts as the
respective Fund’s CODM. The CODM monitors each Fund’s operating results as a whole, and each Fund’s long-term strategic asset allocation is determined in accordance with the terms of its prospectus based on its defined investment
objective. The financial information provided to and reviewed by the CODM is consistent with that presented in each Fund’s financial statements. Adoption of the new standard impacted each Funds’ financial statement note disclosures only
and did not affect any Fund’s financial position or the results of its operations. |
Note 3. Derivative Financial Instruments and
Transactions
($ reported in
thousands)
Disclosures about
derivative instruments and hedging activities are intended to enable investors to understand how and why a Fund uses derivatives, how derivatives are accounted for, and how derivative instruments affect a Fund’s results of operations and
financial position. Summarized below are such disclosures and accounting policies for each specific type of derivative instrument used by certain Funds.
| A.
|
Options Contracts |
| |
The Funds may write (sell)
put and call options on securities and indices to earn premiums, for hedging purposes, risk management purposes or otherwise as part of their investment strategies. An options contract provides the purchaser with the right, but not the obligation,
to buy (call option) or sell (put option) a financial instrument at an agreed upon price. |
| |
When a Fund writes an option,
it receives a premium and an amount equal to that premium is recorded as a liability. The liability is adjusted daily to reflect the current market value of the option. Holdings of the Fund designated to cover outstanding written options are noted
in the Schedules of Investments. Written options are reported as a liability within “Written options at value.” Changes in value of written options are included in “Net change in unrealized appreciation (depreciation) from written
options” in the Statements of Operations. |
| |
If an option expires
unexercised, the Fund realizes a gain to the extent of the premium received. If a written call option is exercised, the premium received is recorded as an adjustment to the proceeds from the sale. If a written put option is exercised, the premium
reduces the cost basis of the security. The difference between the premium and the amount paid on effecting a closing purchase transaction is also treated as a realized gain or loss. Gain or loss on written options is presented separately as
“Net realized gain (loss) from written options” in the Statements of Operations. |
| |
The risk in writing call
options is that the Fund gives up the opportunity for profit if the market price of the referenced security increases and the option is exercised. The risk in writing put options is that the Fund may incur a loss if the market price of the
referenced security decreases and the option is exercised. The risk in buying options is that the Fund pays a premium whether or not the option is exercised. The use of such instruments may involve certain additional risks as a result of
unanticipated movements in the market. Writers (sellers) of options are subject to unlimited risk of loss, as the seller will be obligated to deliver or take delivery of the security at a predetermined price which may, upon exercise of the option,
be significantly different from the then-market value. As the writer of a covered call option, the Fund forgoes, during the option’s life, the opportunity to profit from increases in the market value of the security covering the call option
above the sum of the premium and the strike price of the call, but retains the risk of loss should the price of the underlying security decline. |
| |
During the year ended January
31, 2025, ACV, NFJ and NIE invested in written covered call options contracts in an attempt to manage equity price risk and with the purpose of generating realized gains. |
| |
The
following is a summary of derivative instruments categorized by primary risk exposure, and location as presented in the Statements of Assets and Liabilities at January 31, 2025: |
| Statement
Line Description |
|
Primary
Risk |
ACV
|
NFJ
|
NIE
|
| Liability
Derivatives |
|
| Written
options at value |
|
Equity
contracts |
$
(19) |
$
(1,329) |
$
(103) |
| Total
Liabilities |
|
|
$
(19) |
$
(1,329) |
$
(103) |
NOTES TO FINANCIAL STATEMENTS
(Continued)
January 31, 2025
The following is a summary of derivative
instruments categorized by primary risk exposure, and location as presented in the Statements of Operations for the year ended January 31, 2025:
| Statement
Line Description |
|
Primary
Risk |
ACV
|
NFJ
|
NIE
|
| Net
Realized Gain (Loss) from |
| Written
options |
|
Equity
contracts |
$
42 |
$1,700
|
$
242 |
| Total
|
|
|
$
42 |
$1,700
|
$
242 |
| Net
Change in Unrealized Appreciation (Depreciation) on |
| Written
options |
|
Equity
contracts |
$
(7) |
$
(341) |
$
(37) |
| Total
|
|
|
$
(7) |
$
(341) |
$
(37) |
The table below shows the quarterly average
volume (unless otherwise specified) of the derivatives held by the applicable Funds for the year ended January 31, 2025.
|
|
ACV
|
|
NFJ
|
|
NIE
|
|
Written
Options(1)
|
$18
|
|
$945
|
|
$94
|
|
(1) Average premium amount. |
Note 4. Investment Advisory Fees and Related Party
Transactions
($ reported in
thousands)
| A.
|
Investment Adviser |
| |
Virtus Investment Advisers,
LLC. (“VIA” or the “Adviser”), an indirect, wholly-owned subsidiary of Virtus Investment Partners, Inc. (“Virtus”), is the investment adviser to the Funds. The Adviser manages the Funds’ investment programs
and general operations of the Funds, including oversight of the Funds’ subadviser. |
| |
As
compensation for its services to the Funds, the Adviser is entitled to a fee, which is calculated daily and paid monthly based upon the following annual rates as a percentage of the average daily total managed assets of each Fund: |
| Fund
|
|
Advisory
Fee |
|
|
AIO
|
|
1.25%
|
|
|
NCV
|
|
0.70
|
|
|
NCZ
|
|
0.70
|
|
ACV
|
|
1.00
|
|
NFJ
|
|
0.90
|
|
NIE
|
|
1.00
|
AIO defines total
managed assets as the total assets of the Fund (including assets attributable to any borrowings, issued debt securities or preferred shares that may be outstanding, reverse repurchase agreements and dollar rolls) minus accrued liabilities (other
than liabilities representing borrowings, issued debt securities, reverse repurchase agreements and dollar rolls). NCV and NCZ define total managed assets as the total assets of each Fund (including any assets attributable to any Preferred Shares or
other forms of leverage of the Fund that may be outstanding) minus accrued liabilities (other than liabilities representing leverage). ACV defines total managed assets as the total assets of the Fund (including assets attributable to any preferred
shares, borrowings, issued debt securities or other forms of leverage that may be outstanding) minus accrued liabilities (other than liabilities representing leverage). NFJ and NIE define total managed assets as the total assets of each Fund
(including assets attributable to any borrowing that may be outstanding) minus accrued liabilities (other than liabilities representing borrowings).
NOTES TO FINANCIAL STATEMENTS
(Continued)
January 31, 2025
| B.
|
Subadvisers
|
| |
The
subadvisers manage the investments of each Fund for which they are paid a fee by the Adviser. A list of the subadvisers and the Funds they serve as of the end of the year is as follows: |
| Fund
|
|
Subadviser
|
|
AIO
|
|
Voya
IM(1) |
|
NCV
|
|
Voya
IM(1) |
|
NCZ
|
|
Voya
IM(1) |
|
ACV
|
|
Voya
IM(1) |
|
NFJ (Equity and Options
Portfolios)
|
|
NFJ
Investment Group(2) |
|
NFJ (Fixed Income
Portfolio)
|
|
Voya
IM(1) |
|
NIE
|
|
Voya
IM(1) |
| |
|
|
(1) Voya Investment Management Co. LLC (“Voya IM”).
(2) NFJ Investment Group, LLC (“NFJ Investment Group”), which is an indirect, wholly-owned subsidiary of
Virtus.
| C.
|
Expense Limitations |
| |
The
Adviser has contractually agreed to limit each Fund’s annual total operating expenses, subject to the exclusions listed below, so that such expenses do not exceed, on an annualized basis, the following respective percentages of average daily
net assets through January 31, 2026. Following the contractual period, the Adviser may discontinue these expense limitation arrangements at any time. The reimbursements are accrued daily and received monthly. |
| Fund
|
|
Expense
Limitation |
|
AIO
|
|
0.09
% |
|
NCV
|
|
0.13
|
|
NCZ
|
|
0.15
|
|
ACV
|
|
0.17
|
|
NFJ
|
|
0.06
|
|
NIE
|
|
0.07
|
The exclusions
include investment advisory fees paid to VIA, interest, any other fees or expenses relating to financial leverage, preferred shares (such as dividends on preferred shares, auction agent fees and commissions and rating agency fees) or borrowing (such
as interest, commitment, amendment and renewal expenses on credit or redemption facilities), taxes, extraordinary, unusual or infrequently occurring expenses (such as litigation), costs related to share offerings, brokerage commissions, expenses
incurred in connection with any merger or reorganization, underlying fund expenses and dividend expenses, if any (each expressed as a percentage of average daily net assets attributable to common shares).
| D.
|
Expense Recapture |
| |
Under
certain conditions, the Adviser may recapture operating expenses reimbursed or fees waived under these arrangements within three years after the date on which such amounts were incurred or waived. A Fund must pay its ordinary operating expenses
before the Adviser is entitled to any reimbursement and must remain in compliance with any applicable expense limitations or, if none, the expense limitation in effect at the time of the waiver or reimbursement. All or a portion of the following
Adviser reimbursed expenses may be recaptured by the year ending January 31: |
| |
|
Expiration
|
|
|
| Fund
|
|
2026
|
|
2027
|
|
2028
|
|
Total
|
|
AIO
|
|
$
894 |
|
$
699 |
|
$
761 |
|
$
2,354 |
|
NCV
|
|
720
|
|
453
|
|
421
|
|
1,594
|
|
NCZ
|
|
535
|
|
334
|
|
305
|
|
1,174
|
|
ACV
|
|
302
|
|
225
|
|
224
|
|
751
|
|
NFJ
|
|
1,590
|
|
1,373
|
|
1,307
|
|
4,270
|
|
NIE
|
|
783
|
|
613
|
|
605
|
|
2,001
|
During the year
ended January 31, 2025, the Adviser did not recapture expenses.
| E.
|
Administration Services
|
| |
Virtus Fund Services, LLC
(“VFS”), an indirect, wholly-owned subsidiary of Virtus, serves as administrator to the Funds. For the services provided by the administrator under the Administration Agreement, the Funds pay the administrator an asset-based fee
calculated on each Fund’s average daily Managed Assets. This fee is calculated daily and paid monthly. |
| |
For the
year ended January 31, 2025, the Funds incurred administration fees totaling $4,241 which are included in the Statements of Operations within the line item “Administration and accounting fees”. |
NOTES TO FINANCIAL STATEMENTS
(Continued)
January 31, 2025
| F.
|
Trustees’ Fees |
| |
For the year ended January
31, 2025, the Funds incurred Trustees’ fees totaling $250 which are included in the Statements of Operations within the line item “Trustees’ fees and expenses”. |
| G.
|
Payment from Affiliate
|
| |
During the year ended January
31, 2025, the AIO Fund was reimbursed $15 by the Subadviser for losses incurred due to trade error during the period. There was no impact to the Fund’s total return. |
| H.
|
Investments with Affiliates
|
| |
The Funds are permitted to
purchase assets from or sell assets to certain affiliates under specified conditions outlined in procedures adopted by the Board. The procedures have been designed to ensure that any purchase or sale of assets by the Funds from or to another fund or
portfolio that is, or could be, considered an affiliate by virtue of having a common investment adviser (or affiliated investment advisers), common Trustees/Directors, and/or common officers comply with Rule 17a-7 under the 1940 Act. Further, as
defined under the procedures, each transaction is effected at the current market price. |
| |
During the year ended January
31, 2025, the Funds did not engage in any transactions pursuant to Rule 17a-7 under the 1940 Act. |
| I.
|
Trustee Deferred Compensation
Plan |
| |
The Trustees do not currently
receive any pension or retirement benefits from the Funds. In calendar year 2018 and certain prior periods, the Funds maintained a deferred compensation plan pursuant to which each Independent Trustee had the opportunity to elect not to receive all
or a portion of his or her fees from the respective Fund on a current basis, but instead to receive in a subsequent period chosen by the Independent Trustee an amount equal to the value of such compensation if such compensation had been invested in
one or more series of Virtus Investment Trust (formerly known as Allianz Funds) and Virtus Strategy Trust (formerly known as Allianz Funds Multi-Strategy Trust) selected by the Independent Trustees from and after the normal payment dates for such
compensation. The deferred compensation program was closed to new deferrals effective January 1, 2019, and all Trustee fees earned with respect to service in calendar years 2019 and 2020 were paid in cash, on a current basis. The Funds still have
obligations with respect to Independent Trustee fees deferred in 2018 and in prior periods, and will continue to have such obligations until all deferred Trustee fees are paid out pursuant to the terms of the deferred compensation plan. |
| |
Effective
March 2021, each Fund provides a new deferred compensation plan (“New Plan”) for its Trustees who receive compensation from the Funds. Under the New Plan, Trustees may elect to defer all or a portion of their compensation. Amounts
deferred are retained by the Funds, and then, to the extent permitted by the 1940 Act, in turn, may be invested in the shares of affiliated or unaffiliated mutual funds selected by the participating Trustees. Investments in such instruments are
included in “Prepaid expenses and other assets” in the Statements of Assets and Liabilities at January 31, 2025. |
Note 5. Purchases and Sales of Securities
($ reported in thousands)
Purchases and sales of securities (excluding
U.S. government and agency securities, short-term securities and written options) during the year ended January 31, 2025, were as follows:
| |
Purchases
|
|
Sales
|
|
AIO
|
$803,887
|
|
$
871,034 |
|
NCV
|
593,608
|
|
649,823
|
|
NCZ
|
463,933
|
|
507,436
|
|
ACV
|
460,677
|
|
500,078
|
|
NFJ
|
774,703
|
|
915,392
|
|
NIE
|
976,613
|
|
1,058,568
|
There were no
purchases or sales of long-term U.S. government and agency securities during the year ended January 31, 2025.
Note 6. Federal Income Tax Information
($ reported in thousands)
At January 31, 2025, the approximate
aggregate cost basis and unrealized appreciation (depreciation) of investments and other financial instruments for federal income tax purposes were as follows:
| Fund
|
|
Federal
Tax Cost |
|
Unrealized
Appreciation |
|
Unrealized
(Depreciation) |
|
Net
Unrealized
Appreciation
(Depreciation) |
|
AIO
|
|
$
773,397 |
|
$
152,810 |
|
$
(7,844) |
|
$
144,966 |
|
NCV
|
|
546,106
|
|
45,639
|
|
(37,644)
|
|
7,995
|
|
NCZ
|
|
412,078
|
|
35,821
|
|
(28,378)
|
|
7,443
|
NOTES TO FINANCIAL STATEMENTS
(Continued)
January 31, 2025
| Fund
|
|
Federal
Tax Cost |
|
Unrealized
Appreciation |
|
Unrealized
(Depreciation) |
|
Net
Unrealized
Appreciation
(Depreciation) |
|
ACV
|
|
$
323,181 |
|
$
27,964 |
|
$
(10,053) |
|
$
17,911 |
|
ACV (Written
options)
|
|
(15)
|
|
2
|
|
(6)
|
|
(4)
|
|
NFJ
|
|
1,233,880
|
|
164,394
|
|
(74,496)
|
|
89,898
|
|
NFJ (Written
options)
|
|
(901)
|
|
240
|
|
(668)
|
|
(428)
|
|
NIE
|
|
657,955
|
|
79,045
|
|
(21,293)
|
|
57,752
|
|
NIE (Written
options)
|
|
(80)
|
|
12
|
|
(35)
|
|
(23)
|
Certain Funds
have capital loss carryforwards available to offset future realized capital gains, if any, to the extent permitted by the Code. Net capital losses are carried forward without expiration and generally retain their short-term and/or long-term tax
character, as applicable. For the fiscal year ended January 31, 2025, the Funds’ capital loss carryovers were as follows:
| Fund
|
|
Short-Term
|
|
Long-Term
|
|
NCV
|
|
$78,716
|
|
$194,875
|
|
NCZ
|
|
59,810
|
|
155,310
|
The components of
distributable earnings on a tax basis and certain tax attributes for the Funds consist of the following:
| Fund
|
|
Undistributed
Long-Term
Capital Gains |
|
Capital
Loss
Deferred |
|
AIO
|
|
$35,576
|
|
$
— |
|
NCV
|
|
—
|
|
273,591
|
|
NCZ
|
|
—
|
|
215,120
|
|
NFJ
|
|
1,279
|
|
—
|
|
NIE
|
|
31,407
|
|
—
|
The differences
between the book and tax basis of distributable earnings relate principally to the timing of recognition of income and gains for federal income tax purposes. Short-term gain distributions, if any, are reported as ordinary income for federal tax
purposes. Distributions are determined on a tax basis and may differ from net investment income and realized capital gains for financial reporting purposes.
The tax character of dividends and
distributions paid during the fiscal years ended January 31, 2025 and 2024 was as follows:
| |
Ordinary
Income |
|
Long-Term
Capital Gains |
|
Return
of
Capital |
|
Total
|
|
AIO
|
|
|
|
|
|
|
|
|
1/31/25
|
$
36,654 |
|
$
25,168 |
|
$
— |
|
$
61,822 |
|
1/31/24
|
4,509
|
|
12,576
|
|
44,729
|
|
61,814
|
|
NCV
|
|
|
|
|
|
|
|
|
1/31/25
|
15,298
|
|
—
|
|
27,199
|
|
42,497
|
|
1/31/24
|
11,196
|
|
—
|
|
32,838
|
|
44,034
|
|
NCZ
|
|
|
|
|
|
|
|
|
1/31/25
|
12,934
|
|
—
|
|
20,463
|
|
33,397
|
|
1/31/24
|
9,793
|
|
—
|
|
24,745
|
|
34,538
|
|
ACV
|
|
|
|
|
|
|
|
|
1/31/25
|
16,572
|
|
—
|
|
5,833
|
|
22,405
|
|
1/31/24
|
—
|
|
—
|
|
22,389
|
|
22,389
|
|
NFJ
|
|
|
|
|
|
|
|
|
1/31/25
|
41,335
|
|
69,583
|
|
—
|
|
110,918
|
|
1/31/24
|
92,906
|
|
—
|
|
—
|
|
92,906
|
|
NIE
|
|
|
|
|
|
|
|
|
1/31/25
|
54,494
|
|
924
|
|
—
|
|
55,418
|
|
1/31/24
|
25,256
|
|
5,456
|
|
24,706
|
|
55,418
|
Certain capital
accounts in the financial statements are periodically adjusted for permanent differences in order to reflect their tax character. Permanent reclassifications can arise from differing treatment of certain income and gain transactions and
nondeductible current year net operating losses. These adjustments have no impact on net assets or net asset value per share of the Funds. Temporary differences that arise from recognizing certain items of income, expense, gain or loss in different
periods for financial statement and tax purposes will likely reverse at some time in the future.
NOTES TO FINANCIAL STATEMENTS
(Continued)
January 31, 2025
Note 7. Credit and Market Risk and Asset
Concentration
Local, regional or
global events such as war or military conflict, acts of terrorism, the spread of infectious illness or other public health issue, recessions, or other events could have a significant impact on a Fund and its investments, including hampering the
ability of each Fund’s portfolio manager(s) to invest each Fund’s assets as intended.
Certain Funds may invest a high percentage
of their assets in specific sectors of the market in the pursuit of their investment objectives. Fluctuations in these sectors of concentration may have a greater impact on a Fund, positive or negative, than if such Fund did not concentrate its
investments in such sectors.
Each of
AIO, NCV, NCZ and ACV leverages its portfolio through preferred shares, securities lending, senior secured notes and/or margin loan financing. While leverage presents opportunities for increasing each Fund’s total return, it also has the
effect of potentially increasing losses. Accordingly, any event which adversely affects the value of an investment held by each Fund would be magnified to the extent each Fund is leveraged.
High-yield/high-risk securities typically
entail greater price volatility and/or principal and interest rate risk. There is a greater chance that an issuer will not be able to make principal and interest payments on time. Analysis of the creditworthiness of issuers of high-yield/high-risk
securities may be complex, and as a result, it may be more difficult for the Adviser and/or subadviser to accurately predict risk.
Note 8. Liquidity Facility and Securities Lending
($ reported in thousands)
AIO, NCV and NCZ have a Master Margin Loan
Agreement (the “MMLA”) and a Securities Lending Authorization Agreement (the “SLAA” and together with the MMLA, the “BNY Facilities”) with The Bank of New York (“BNY”). Under the MMLA the Funds pledge
their assets as collateral to secure obligations but retain the risks and rewards of the ownership of assets pledged to secure such obligations.
Under the SLAA, the Funds may loan
securities to qualified brokers through a securities lending agency agreement with BNY. Under the securities lending policy, when lending securities a Fund is required to maintain collateral with a market value not less than 100% of the market value
of loaned securities. Collateral is adjusted daily in connection with changes in the market value of securities on loan. Collateral consists of cash which is invested in a short-term money market fund and/or released to each Fund to be used for
liquidity purposes in conjunction with the MMLA. Cash collateral received from securities lending is first credited against borrowings under the MMLA. Upon return of securities by the borrower, BNY returns the cash collateral to the borrower, as
applicable, which eliminates the credit against the borrowings and causes the drawdowns under the MMLA to increase by the amounts returned. The securities lending program is subject to the same limits and interest rate structure as the MMLA.
Dividends earned on the collateral and premiums paid by the broker are recorded as income by the Fund net of fees and rebates charged/paid by BNY for its services as securities lending agent and in connection with this securities lending program.
Lending portfolio securities involves a risk of delay in the recovery of the loaned securities or in the declining value of the collateral.
Securities lending transactions are entered
into by each Fund under the SLAA which permit the Fund, under certain circumstances including an event of default (such as bankruptcy or insolvency), to offset amounts payable by the Fund to the same counterparty against amounts to be received and
create one single net payment due to or from the Fund.
At January 31, 2025, the securities loaned
were subject to the SLAA on a net payment basis as follows:
| Fund
|
|
Value
of
Securities
on Loan |
|
Cash
Collateral Invested
in Short-Term
Money Market Fund(1) |
|
Cash
Collateral
used for borrowing(2) |
|
Net
Amount(3) |
|
AIO
|
|
$26,261
|
|
$2,282
|
|
$
23,979 |
|
$
— |
|
NCV
|
|
42,392
|
|
9,999
|
|
32,393
|
|
—
|
|
NCZ
|
|
27,801
|
|
3,898
|
|
23,903
|
|
—
|
|
(1) |
Amount
invested in a Money Market Mutual Fund with an Overnight and Continuous contractual maturity. |
|
(2) |
Collateral
received in excess of the value of securities on loan is not presented in this table. The cash collateral received in connection with securities lending transactions has been used for the purchase of securities as disclosed in the Fund’s
Schedule of Investments. |
|
(3) |
Net
amount represents the net amount receivable due from the counterparty in the event of default. |
At January 31, 2025, the maximum capital
commitment amounts under the MMLA were $130,000, $34,000 and $25,000, respectively, for AIO, NCV and NCZ. Interest on amounts drawn under each MMLA is charged at a daily rate, and a commitment fee is paid on the undrawn amounts as agreed to in
the MMLA. As of January 31, 2025, AIO, NCV and NCZ used cash collateral received from the SLAA to purchase long term investments and/or invest the amount in a short-term money market fund. These investments are included in the line item
“Investments in Securities, at value” on the Statements of Assets and Liabilities. The securities on loan under the SLAA and securities pledged as collateral under the MMLA are reflected on the Schedule of Investments. Any amounts
payable under the MMLA/SLAA are reflected in the Statements of Assets and Liabilities as “Loan Payable” and/or “Collateral on securities loaned.” The interest rate charged at January 31, 2025 was 4.68% for AIO, 4.68% for NCV
and 4.68% for NCZ. The expense is included in the Funds’ Statements of Operations under “Loan interest”.
NOTES TO FINANCIAL STATEMENTS
(Continued)
January 31, 2025
For the year ended January 31, 2025, the
outstanding borrowings, average borrowings, average interest rate and interest expense under the BNY Facilities were as follows:
| Fund
|
|
Outstanding
Borrowings |
|
Average
Borrowing |
|
Weighted
Average
Interest Rate |
|
Days
Outstanding |
|
Loan
Interest
Expense |
|
AIO
|
|
$130,000
(a) |
|
$130,000
|
|
5.66%
|
|
366
|
|
7,476
|
|
NCV
|
|
34,000
(b) |
|
34,000
|
|
5.74
|
|
366
|
|
1,985
|
|
NCZ
|
|
25,000
(b) |
|
25,000
|
|
5.70
|
|
366
|
|
1,450
|
|
(a) |
Represents
$30,000 received through the SLAA and $100,000 received through the MMLA |
|
(b) |
Full
amount received through the SLAA. |
Note 9. Long-Term Financing Arrangements
($ reported in thousands except per share
amounts)
A. Mandatory Redeemable
Preferred Shares
On October 2, 2015,
ACV completed a private placement with a single institutional investor, consisting of $30,000 in Series A Mandatory Redeemable Preferred Shares (“MRPS”) with a mandatory redemption date of October 2, 2025.
On May 26, 2023, NCV and NCZ each completed
a MRPS private placement with a single institutional investor. NCV issued $51,000 in Series A MRPS with a mandatory redemption date of May 26, 2028, and $15,000 in Series B MRPS with a mandatory redemption date of May 26, 2030. NCZ issued $22,000 in
Series A MRPS with a mandatory redemption date of May 26, 2028.
The estimated fair value of Series A and B
(as applicable) MRPS was calculated, for disclosure purposes, by discounting future cash flows by a rate equal to the current U.S. Treasury yield with a similar maturity date, plus the spread between the A-rated U.S. Corporate rate and the current
U.S. Treasury yield plus a market spread for the issuance of preferred shares. The MRPS are categorized as Level 2 within the fair value hierarchy.
The following table summarizes the key terms
of the MRPS and their estimated fair value at January 31, 2025:
| Fund
|
|
Mandatory
Redemption
Date |
|
Annual
Dividend
Rate |
|
Shares
|
|
Per
Share
Liquidation
Preference |
|
Aggregate
Liquidation
Preference |
|
Estimated
Fair Value |
| ACV Series A
|
|
October
2, 2025 |
|
4.34%
|
|
1,200,000
|
|
$25.00
|
|
$30,000
|
|
$29,798
|
| NCV Series A
|
|
May
26, 2028 |
|
5.95%
|
|
2,040,000
|
|
$25.00
|
|
$51,000
|
|
$51.941
|
| NCV Series B
|
|
May
26, 2030 |
|
5.95%
|
|
600,000
|
|
$25.00
|
|
$15,000
|
|
$15,189
|
| NCZ Series A
|
|
May
26, 2028 |
|
5.95%
|
|
880,000
|
|
$25.00
|
|
$22,000
|
|
$22,406
|
Holders of MRPS
are entitled to receive a quarterly dividend at an annual fixed dividend rate, subject to upward adjustment (by as much as 4.00%) during any period when the MRPS have a rating of below “A” from Fitch for ACV or below “A” from
KBRA for NCV and NCZ, or the equivalent from another rating agency (with the rate increasing at lower rating levels). Interest expense is accrued daily and paid quarterly and are presented in the applicable Fund’s Statement of Assets &
Liabilities as “Interest on mandatory redeemable preferred shares”. For the year ended January 31, 2025, ACV incurred $1,302, NCV incurred $3,927 and NCZ incurred $1,309 in interest expense on MRPS. The MRPS are senior, with priority in
all respects, to the respective Fund’s outstanding common shares as to payments of dividends and as to distribution of assets upon dissolution, liquidation or winding up of the affairs of the Fund. The MRPS rank pari passu with any and all
other preferred shares issued by the respective Fund, and rank junior to the Fund’s indebtedness, including any Notes, Margin Loan Financing, Liquidity Facility and any other senior secured indebtedness. Each of ACV, NCV and NCZ may redeem all
or any part of its MRPS at any time, subject to certain redemption premiums. With respect to the MRPS, each Fund is subject to periodic asset coverage testing. If a Fund’s asset coverage is insufficient, it may be required to redeem some or
all of its MRPS.
NCV and NCZ incurred
costs in connection with the issuance of the MRPS. These costs were recorded as a deferred offering cost and are being amortized over the respective life of each series of MRPS. Amortization of these deferred offering costs of $166 for NCV and $69
for NCZ are included under the caption “Interest on mandatory redeemable preferred shares and amortization of deferred offering costs on preferred shares” on the Statement of Operations, and the unamortized balance is deducted from the
carrying amount of the MRPS under the caption “Mandatory redeemable preferred shares” on the Statement of Assets and Liabilities.
B. Senior Secured Notes
On October 2, 2015, ACV completed a private
placement with a single institutional investor, consisting of $50,000 in Senior Secured Notes (“Notes”) due November 22, 2029.
At January 31, 2025, ACV had $50,000 in
aggregate principal amount of Notes outstanding. The Notes rank pari passu with all other senior debt of ACV, including the Margin Loan Financing, and are secured by a lien on all assets of the Fund of every kind, including all securities and all
other investment property, equal and ratable with the liens securing the Margin Loan Financing. The Notes are senior, with priority in all respects, to the MRPS and the outstanding common shares as to payments of dividends and as to distribution of
assets upon dissolution, liquidation or winding up of the affairs of the Fund. Holders of the Notes are entitled to receive cash interest payments semi-annually until maturity. The Notes accrue interest at an annual fixed rate of 3.94%. The Notes
will be subject to a penalty interest rate if ratings fall below A- from Fitch or the equivalent from another agency. The Notes are
NOTES TO FINANCIAL STATEMENTS
(Continued)
January 31, 2025
prepayable in whole or in part at any time, subject to a
prepayment premium, which may be adjusted under some circumstances based on asset coverage levels. Interest expense of $1,970 is included in the ACV’s Statement of Operations.
The estimated fair value of the Notes was
calculated, for disclosure purposes, by discounting future cash flows by a rate equal to the current U.S. Treasury yield with a similar maturity date, plus the spread between the A-rated U.S. Corporate rate and the current U.S. Treasury yield with a
similar maturity date, plus a market spread for the issuance of Notes. The senior secured notes are categorized as level 2 within the fair value hierarchy.
The following table shows the maturity date,
interest rate, notional/carrying amount and estimated fair value of the Notes outstanding at January 31, 2025:
| |
Maturity
Date |
|
Interest
Rate |
|
Notional/
Carrying
Amount |
|
Estimated
Fair Value |
| |
November
22, 2029 |
|
3.94%
|
|
$50,000
|
|
$47,328
|
With respect to
the Notes, the Fund is subject to monthly asset coverage tests that mirror those applicable to closed-end funds set forth in Section 18 of the 1940 Act, as well as periodic asset coverage tests that are tied to rating agency criteria, in each case
subject to various terms and conditions. A breach of any of these tests, after the passage of a cure period, would constitute an event of default under the Notes. The agreements governing the MRPS and Notes impose certain additional customary
covenants and restrictions on the Fund, including, among others, restrictions on distributions and a requirement that the Fund adhere to its stated investment policies.
Note 10. Margin Loan Financing
($ reported in thousands)
ACV has entered into a margin loan financing
agreement with a commercial bank (the “Bank”) that allows the Fund to borrow cash from the Bank. Cash borrowings are secured by assets of the ACV that are held with the Fund’s custodian in a separate account. Interest is charged at
the Secured Overnight Bank Funding Rate plus an additional percentage rate on the amount borrowed.
For the year ended January 31, 2025, the
weighted average daily balance outstanding was $25,000 at the weighted average interest rate of 6.13%. With respect to the margin loan financing, loan interest expense of $1,557 is included in the ACV’s Statement of Operations.
At January 31, 2025, the amount of
outstanding borrowings was as follows:
Outstanding
Borrowings |
|
Interest
Rate |
| $25,000
|
|
5.40%
|
Note 11. Cumulative
Preferred Shares
($ reported in
thousands except per share amounts)
In September 2018, NCV and NCZ each issued
fixed-rate Series A Cumulative Preferred Shares. The shares are perpetual. To the extent permitted by the 1940 Act and Massachusetts law, the Funds may at any time, upon notice of redemption, redeem the Series A Cumulative Preferred Shares in whole
or in part at the liquidation preference per share plus accumulated dividends through the date of redemption. Dividends are paid on a quarterly basis and commenced on October 1, 2018, with the first such payment pro-rated from the date of
issuance.
The following table shows
the details of the Cumulative Preferred Shares as of January 31, 2025:
| Fund
|
|
Issue
Date |
|
Annual
Dividend
Rate |
|
Shares
|
|
Per
Share
Liquidation
Preference |
|
Aggregate
Liquidation
Preference |
| NCV
|
|
09/20/2018
|
|
5.625%
|
|
4,000,000
|
|
$25.00
|
|
$100,000
|
| NCZ
|
|
09/11/2018
|
|
5.500
|
|
4,360,000
|
|
25.00
|
|
109,000
|
Note 12.
Indemnifications
Under the
Funds’ organizational documents, the Funds, Trustees and officers are indemnified against certain liabilities arising out of the performance of their duties to the Funds. In addition, in the normal course of business, the Funds enter into
contracts that provide a variety of indemnifications to other parties. The Funds’ maximum exposure under these arrangements is unknown as this would involve future claims that may be made against the Funds and that have not occurred. However,
the Funds have not had prior claims or losses pursuant to these arrangements and expect the risk of loss to be remote.
Note 13. Capital Shares
At January 31, 2025, each Fund has one class
of common stock with $0.00001 par value of which unlimited shares are authorized.
NOTES TO FINANCIAL STATEMENTS
(Continued)
January 31, 2025
Effective at the start of trading on Monday,
February 10, 2025, NCV and NCZ implemented a 1-for-4 reverse stock split. NCV and NCZ shares are now trading on a split-adjusted basis under new CUSIP numbers (NCV: 92838X805 and NCZ: 92838U801). The net effect of the Funds’ reverse stock
split was to decrease the number of the Funds’ outstanding common shares and increase the net asset value per common share by a proportionate amount. While the number of the Funds’ outstanding common shares declined, neither the
Funds’ holdings nor the total value of shareholders’ investments were affected. Immediately after the reverse stock split, each common shareholder held the same percentage of the Funds’ outstanding common shares that such
shareholder held immediately prior to the reverse stock split, subject to adjustments for fractional shares resulting from the split. Capital share activity referenced on the Statement of Changes in Net Assets and the per share data, including the
proportionate impact to market price, in the Financial Highlights table have been restated to reflect the reverse stock split.
Note 14. Restricted Securities
Restricted securities are not registered
under the Securities Act of 1933, as amended (the “1933 Act”). Generally, 144A securities are excluded from this category. Each Fund will bear any costs, including those involved in registration under the 1933 Act, in connection with the
disposition of such securities. The following Funds held securities that were considered to be restricted at January 31, 2025:
| Fund
|
|
Investment
|
|
Date
of
Acquisition |
|
Cost
|
|
Value
|
|
Percentage
of
Net Assets |
|
NCV
|
|
LiveStyle,
Inc. |
|
2/3/16-11/30/16
|
|
$
— |
|
$
— |
|
0.0%
|
| |
|
LiveStyle,
Inc. Series B |
|
2/3/16
|
|
411
|
|
419
|
|
0.1
|
|
NCZ
|
|
LiveStyle,
Inc. |
|
2/3/16-11/30/16
|
|
—
|
|
—
|
|
0.0
|
| |
|
LiveStyle,
Inc. Series B |
|
2/3/16
|
|
411
|
|
420
|
|
0.1
|
|
ACV
|
|
LiveStyle,
Inc. |
|
2/3/16-11/30/16
|
|
—
|
|
—
|
|
0.0
|
| |
|
LiveStyle,
Inc. Series B |
|
2/3/16-11/30/16
|
|
62
|
|
63
|
|
0.0
|
Note 15. Regulatory Matters
and Litigation
From time to time, the
Funds, the Adviser, the subadvisers, and/or their respective affiliates may be involved in litigation and arbitration as well as examinations and investigations by various regulatory bodies, including the SEC, involving compliance with, among other
things, securities laws, client investment guidelines, and laws and regulations affecting their activities. At this time, the Funds and the Adviser believe that the outcomes of such matters are not likely, either individually, or in aggregate, to be
material to these financial statements.
Note 16. Subsequent Events
Management has evaluated the impact of all
subsequent events on the Funds through the date the financial statements were available for issuance, and has determined that the following event requires recognition or disclosure in these financial statements.
On February 18, 2025, NFJ announced that the
Board of Trustees adopted a share purchase program to repurchase, at a discount to NAV, up to 5% of its outstanding common shares in open market transactions.
Report of Independent Registered Public Accounting Firm
To the Board of Trustees and Shareholders of Virtus Artificial
Intelligence & Technology Opportunities Fund, Virtus Convertible & Income Fund, Virtus Convertible & Income Fund II, Virtus Diversified Income & Convertible Fund, Virtus Dividend, Interest & Premium Strategy Fund, and Virtus
Equity & Convertible Income Fund
Opinions on the
Financial Statements
We have audited the accompanying
statements of assets and liabilities, including the schedules of investments, of Virtus Artificial Intelligence & Technology Opportunities Fund, Virtus Convertible & Income Fund, Virtus Convertible & Income Fund II, Virtus Diversified
Income & Convertible Fund, Virtus Dividend, Interest & Premium Strategy Fund, and Virtus Equity & Convertible Income Fund (hereafter collectively referred to as the “Funds”) as of January 31, 2025, the related statements of
operations and the statements of cash flows for Virtus Artificial Intelligence & Technology Opportunities Fund, Virtus Convertible & Income Fund, Virtus Convertible & Income Fund II, and Virtus Diversified Income & Convertible Fund
for the year ended January 31, 2025, the statements of changes in net assets for each of the two years in the period ended January 31, 2025, including the related notes, and the financial highlights for each of the periods indicated therein
(collectively referred to as the “financial statements”). In our opinion, the financial statements present fairly, in all material respects, the financial position of each of the Funds as of January 31, 2025, the results of each of their
operations and the cash flows for Virtus Artificial Intelligence & Technology Opportunities Fund, Virtus Convertible & Income Fund, Virtus Convertible & Income Fund II, and Virtus Diversified Income & Convertible Fund for the year
then ended, the changes in each of their net assets for each of the two years in the period ended January 31, 2025, and each of the financial highlights for each of the periods indicated therein, in conformity with accounting principles generally
accepted in the United States of America.
Basis for
Opinions
These financial statements are the
responsibility of the Funds’ management. Our responsibility is to express an opinion on the Funds’ financial statements based on our audits. We are a public accounting firm registered with the Public Company Accounting Oversight Board
(United States) (PCAOB) and are required to be independent with respect to the Funds in accordance with the U.S. federal securities laws and the applicable rules and regulations of the Securities and Exchange Commission and the PCAOB.
We conducted our audits of these financial statements in
accordance with the standards of the PCAOB. Those standards require that we plan and perform the audit to obtain reasonable assurance about whether the financial statements are free of material misstatement, whether due to error or fraud.
Our audits included performing procedures to assess the risks
of material misstatement of the financial statements, whether due to error or fraud, and performing procedures that respond to those risks. Such procedures included examining, on a test basis, evidence regarding the amounts and disclosures in the
financial statements. Our audits also included evaluating the accounting principles used and significant estimates made by management, as well as evaluating the overall presentation of the financial statements. Our procedures included confirmation
of securities owned as of January 31, 2025, by correspondence with the custodian, transfer agents, issuer, and brokers. When replies were not received from brokers, we performed other auditing procedures. We believe that our audits provide a
reasonable basis for our opinions.
/s/
PricewaterhouseCoopers LLP
Philadelphia, Pennsylvania
March 26, 2025
We have served as the auditor of one or more of the investment
companies in the Virtus group of investment companies since at least 1977. We have not been able to determine the specific year we began serving as auditor.
TAX INFORMATION NOTICE
(Unaudited)
January 31, 2025
The
following information ($ reported in thousands) is being provided in order to meet reporting requirements set forth by the Code and/or to meet state specific requirements. In early 2025, the Funds will notify applicable shareholders of amounts for
use in preparing 2024 U.S. federal income tax forms. Shareholders should consult their tax advisors.
With respect to distributions paid during the fiscal year ended
January 31, 2025, the Funds designate the following amounts (or, if subsequently determined to be different, the maximum amount allowable):
| Fund
|
|
Qualified
Dividend
Income %
(non-corporate
shareholder) |
|
Dividend
Received
Deduction %
(corporate
shareholders) |
|
Long-Term
Capital Gain
Distributions ($) |
|
AIO
|
|
10.96%
|
|
9.50
% |
|
$
60,743 |
|
NCV
|
|
6.36
|
|
6.36
|
|
—
|
|
NCZ
|
|
6.81
|
|
6.81
|
|
—
|
|
ACV
|
|
9.61
|
|
9.39
|
|
—
|
|
NFJ
|
|
53.93
|
|
49.69
|
|
35,981
|
|
NIE
|
|
10.48
|
|
10.10
|
|
32,332
|
CERTIFICATION
Each Fund files the required annual Chief
Executive Officer (“CEO”) certification regarding compliance with the NYSE’s listing standards no more than 30 days after each annual shareholder meeting for the Fund. Each Fund has included the certifications of the Fund’s
CEO and Principal Financial Officer required by Section 302 of the Sarbanes-Oxley Act in the Fund’s Form N-CSR filed with the SEC for the period of this report.
KEY INFORMATION
Shareholder Relations: 1-866-270-7788
For general information and literature, as
well as updates on net asset value, share price, major industry groups and other key information.
REINVESTMENT PLAN
The Automatic Reinvestment and Cash Purchase
Plan (the “Plan”) offers shareholders a convenient way to acquire additional shares of each Fund. Registered holders will be automatically placed in the Plan and may opt out by calling Shareholder Relations at the number listed above. If
shares are held at a brokerage firm, contact your broker about participation in the Plan.
REPURCHASE OF SECURITIES
Notice is hereby given in accordance with
Section 23(c) of the 1940 Act that each Fund may from time to time purchase its shares of common stock in the open market when Fund shares are trading at a discount from their net asset value.
PROXY VOTING INFORMATION (FORM N-PX)
The subadvisers vote proxies relating to
portfolio securities in accordance with procedures that have been approved by each Fund’s Board. You may obtain a description of these procedures, along with information regarding how each Fund voted proxies during the most recent 12-month
period ended June 30, free of charge, by calling toll-free 1-866-270-7788. This information is also available through the SEC’s website at https://www.sec.gov.
PORTFOLIO HOLDINGS INFORMATION
Each Fund files its complete schedule of
portfolio holdings with the SEC for the first and third quarters of each fiscal year as an exhibit to its reports on Form NPORT-P. Form NPORT-P is available on the SEC’s website at
https://www.sec.gov.
ADDITIONAL INFORMATION
Since January 31, 2024: (i) there have been
no material changes in the Funds’ investment objectives or policies that have not been approved by the shareholders; (ii) there have been no changes in the Funds’ charter or by-laws that would delay or prevent a change in control of the
Funds’ which have not been approved by the shareholders; (iii) there have been no material changes in the principal risk factors associated with an investment in the fund; and (iv) there have been no changes in the persons who are primarily
responsible for the day-to-day management of the Funds.
Additional information relating to the
Funds’ trustees and officers, and other information found elsewhere in this annual report, may be requested by contacting the Funds’ at the address provided on the back cover of this report.
ARTIFICIAL INTELLIGENCE &
TECHNOLOGY OPPORTUNITIES FUND (AIO)
INVESTMENT OBJECTIVE, PRINCIPAL
STRATEGIES AND PRINCIPAL RISKS (Unaudited)
Investment Objective: The
Fund’s investment objective is to provide total return through a combination of current income, current gains and long-term capital appreciation.
Principal Strategies: Under
normal market conditions, the Fund seeks to achieve its investment objective by investing across the capital structure in companies across a broad range of industries and technologies positioned to benefit from the evolution and disruptive power of
artificial intelligence and other new technologies. The Fund seeks to invest in companies, across a wide range of industries and market capitalizations, that produce, design or market artificial intelligence technologies or other new technologies,
use artificial intelligence or other new technologies in their product development or operations or are expected to benefit significantly from artificial intelligence or other new technologies and related developments.
Under normal market conditions, the Fund seeks to achieve its
investment objective by investing in a combination of convertible securities, equity securities, and debt and other income producing instruments. The Fund attempts to reduce the risk of capital loss through, among other things, independent credit
analysis focused on downgrade and default risks and the implementation of a clearly defined sell discipline strategy. The Fund normally does not invest more than 20% of its managed assets in income producing securities (such limit does not apply to
convertible securities).
The Fund normally invests at
least 80% of its net assets (plus any borrowings for investment purposes) in a combination of securities issued by artificial intelligence companies and in other companies that stand to benefit from artificial intelligence and other technology
opportunities. The Fund considers artificial intelligence to mean the use of systems or other technologies able to either perform tasks that normally involve human intelligence, such as visual perception, speech recognition and decision-making, or
leverage data-driven insights to deliver new solutions.
Under normal circumstances, at least 15% of the Fund’s
net assets (plus any borrowings for investment purposes) are invested in artificial intelligence companies. The Fund normally invests at least 30% of its managed assets in convertible securities. The Fund does not normally invest more than 20% of
its managed assets in high yield securities (such limit does not apply to convertible securities). The Fund normally invests at least 30% of its managed assets in equity securities. The Fund does not normally invest more than 30% of its managed
assets in securities of foreign issuers.
Leverage. The
Fund currently does, but is not required to, maintain leverage in the form of indebtedness.
Principal Risks:
Artificial Intelligence-Related Companies: Companies involved in, or exposed to, artificial intelligence-related businesses may have limited product lines, markets, financial resources and/or personnel. These companies typically face intense competition and
potentially rapid product obsolescence and depend significantly on consumer preference and demand. These companies are also heavily dependent on intellectual property rights and may be adversely impacted by the loss or impairment of such rights.
There can be no assurance that these companies will be able to successfully protect their intellectual property rights to prevent the misappropriation of their technology or that competitors will not develop technology that is substantially similar
or superior to their technology. Legal and regulatory changes, particularly those related to information privacy and data protection, may have a negative impact on an artificial intelligence company’s products or services. Artificial
intelligence companies often spend significant amounts of resources on research and development, and there is no guarantee that the products or services they produce will be successful. Artificial intelligence companies, especially smaller
companies, tend to be more volatile than companies that do not rely heavily on technology. The artificial intelligence companies in which the Fund may invest may not be identified by or widely known for any particular artificial intelligence product
or service, but rather use artificial intelligence in their product development or deployment or are expected to benefit substantially from artificial intelligence and related developments.
Technology-Related: Funds that
make significant investments in the technology sectors will be subject to risks particularly affecting technology or technology-related companies, such as the risks of short product cycles and rapid obsolescence of products and services, competition
from new and existing companies, significant losses and/or limited earnings, security price volatility, limited operating histories and management experience, and patent and other intellectual property considerations.
Convertible Securities: A
convertible security may be called for redemption at a time and price unfavorable to the Fund. The value of a convertible security may decline as interest rates rise and/or vary with fluctuations in the market value of the underlying securities.
Convertible securities have general characteristics similar to both debt securities and equity securities and may give rise to the associated risks.
Lower-rated securities:
Investments in lower-rated and non-rated securities present a greater risk of loss to principal than higher-rated securities. Such securities entail greater price volatility and credit and interest rate risk than higher-rated securities. In
addition, lower-rated securities may not trade as often and may be less liquid than higher-rated securities, especially during periods of economic uncertainty or change.
Credit: There is a risk that
the issuer of a security will fail to pay interest or principal in a timely manner, or that negative perceptions of the issuer’s ability to make such payments will cause the price of the security to decline. Debt instruments rated below
investment-grade are especially susceptible to this risk.
Interest Rate: The values of
debt instruments usually rise and fall in response to changes in interest rates. Declining interest rates generally increase the value of existing debt instruments, and rising interest rates generally decrease the value of existing debt instruments.
Changes in a debt instrument’s value usually will not affect the amount of interest income paid to the Fund, but will affect the value of the Fund’s shares. Interest rate risk is generally greater for investments with longer maturities.
Certain instruments pay interest at variable or floating rates. Variable rate instruments reset at specified intervals, while floating rate instruments reset whenever there is a change in a specified index rate. In most cases, these reset provisions
reduce the effect of changes in market interest rates on the value of the instrument. However, some instruments do not track the underlying index directly, but reset based on formulas that can produce an effect similar to leveraging; others may also
provide for interest payments that vary inversely with market rates. The market prices of these instruments may fluctuate significantly when interest rates change.
Some investments give the issuer the option to call or redeem
an investment before its maturity date. If an issuer calls or redeems an investment during a time of declining interest rates, the Fund might have to reinvest the proceeds in an investment offering a lower yield, and therefore it might not benefit
from any increase in value as a result of declining interest rates.
ARTIFICIAL INTELLIGENCE &
TECHNOLOGY OPPORTUNITIES FUND (AIO)
INVESTMENT OBJECTIVE, PRINCIPAL
STRATEGIES AND PRINCIPAL RISKS (Unaudited) (Continued)
Sector Focused Investing:
Events negatively affecting a particular market sector in which the portfolio focuses its investments may cause the value of the portfolio to decrease.
Leverage: When the Fund uses
leverage through activities such as borrowing, the Fund has the risk of magnified capital losses that occur when losses affect an asset base, enlarged by borrowings or the creation of liabilities that exceeds the net assets of the Fund. The value of
the shares of the Fund will be more volatile and sensitive to market movements as a result of its use of leverage. Leverage may also involve the creation of a liability that requires the Fund to pay interest.
Limited Term: The Fund will
terminate on or around October 29, 2031 absent Trustee and shareholder approval to amend the limited term provision of the Fund’s Amended and Restated Agreement and Declaration of Trust, as provided therein. As the assets of the Fund will be
liquidated in connection with its termination, the Fund may be required to sell portfolio securities when it otherwise would not, including at times when market conditions are not favorable, which may cause the Fund to lose money.
Equity Securities: Generally,
prices of equity securities are more volatile than those of fixed income securities. The prices of equity securities will rise and fall in response to a number of different factors. In particular, equity securities will respond to events that affect
entire financial markets or industries (such as changes in inflation or consumer demand) and to events that affect particular issuers (such as news about the success or failure of a new product). Equity securities also are subject to “stock
market risk,” meaning that stock prices in general may decline over short or extended periods of time. When the value of the stocks held by the Fund goes down, the net asset value of the Fund’s shares will be affected.
Market Volatility: The Fund
could lose money over short periods due to short-term market movements and over longer periods during more prolonged market downturns. The value of a security or other instrument may decline due to changes in general market conditions, economic
trends or events that are not specifically related to the issuer of the security or other instrument, or factors that affect a particular issuer or issuers, country, group of countries, region, market, industry, group of industries, sector or asset
class. During a general market downturn, multiple asset classes may be negatively affected. Changes in market conditions and interest rates generally do not have the same impact on all types of securities and instruments.
Closed-End Fund: Because the
Fund is a closed-end fund, its shares may trade at a discount or premium from their net asset values, which may affect whether an investor will realize gains or losses. The Fund may also employ leverage, which may increase volatility.
No Guarantee: There is no
guarantee that the Fund will meet its objective.
Managed Distribution Plan: The
Board of Directors has adopted a Managed Distribution Plan (the “Plan”) which currently provides for the Fund to make a monthly distribution at the rate of $0.15 per share. Under the terms of the Plan, the Fund seeks to maintain a
consistent distribution level that may be paid in part or in full from net investment income, realized capital gains, and a return of capital, or a combination thereof. The Board may amend, suspend or terminate the Plan at any time, without prior
notice to shareholders, if it deems such action to be in the best interests of the Fund and its shareholders.
CONVERTIBLE & INCOME FUND
(NCV)
INVESTMENT OBJECTIVE, PRINCIPAL STRATEGIES AND PRINCIPAL RISKS
(Unaudited)
Investment Objective: The
Fund’s investment objective is to provide total return through a combination of capital appreciation and high current income.
Principal Strategies: In
selecting investments for the Fund, Voya IM attempts to identify issuers that successfully adapt to change. Voya IM uses traditional credit analysis combined with a disciplined, fundamental bottom-up research process that facilitates the early
identification of issuers demonstrating an ability to improve their fundamental characteristics. Voya IM attempts to identify potential investments that it expects will exceed minimum credit statistics and exhibit the highest visibility of future
expected operating performance. Voya IM’s sell discipline is clearly defined and designed to drive the Fund’s portfolio continually toward strength, taking into account factors such as a change in credit fundamentals, a decline in
attractiveness relative to other securities and a decline in industry fundamentals.
Under normal circumstances, the Fund will invest at least 80%
of its total assets in a diversified portfolio of convertible securities and non-convertible income-producing securities. The portion of the Fund’s assets invested in convertible securities, on the one hand, and non-convertible
income-producing securities, on the other, will vary from time to time consistent with the Fund’s investment objective, although the Fund will normally invest at least 50% of its total assets in convertible securities.
The Fund may invest up to 20% of its total assets in securities
other than convertible securities and non-convertible income-producing securities.
The Fund may invest up to 20% of its total assets in U.S.
dollar-denominated securities of foreign issuers based in developed countries.
Leverage. The Fund currently does, but is not required to,
maintain leverage in the form of auction-rate preferred shares and cumulative preferred shares.
Principal Risks:
Convertible Securities: A
convertible security may be called for redemption at a time and price unfavorable to the Fund. The value of a convertible security may decline as interest rates rise and/or vary with fluctuations in the market value of the underlying securities.
Convertible securities have general characteristics similar to both debt securities and equity securities and may give rise to the associated risks.
Leverage: When the Fund uses
leverage through activities such as borrowing, the Fund has the risk of magnified capital losses that occur when losses affect an asset base, enlarged by borrowings or the creation of liabilities that exceeds the net assets of the Fund. The value of
the shares of the Fund will be more volatile and sensitive to market movements as a result of its use of leverage. Leverage may also involve the creation of a liability that requires the Fund to pay interest.
Preferred Stocks: Preferred
stocks may decline in price, fail to pay dividends, or be illiquid. Because they often lack a fixed maturity or redemption date, preferred stocks are likely to fluctuate substantially in price when interest rates change.
Lower-rated securities:
Investments in lower-rated and non-rated securities present a greater risk of loss to principal than higher-rated securities. Such securities entail greater price volatility and credit and interest rate risk than higher-rated securities. In
addition, lower-rated securities may not trade as often and may be less liquid than higher-rated securities, especially during periods of economic uncertainty or change.
Credit: There is a risk that
the issuer of a security will fail to pay interest or principal in a timely manner, or that negative perceptions of the issuer’s ability to make such payments will cause the price of the security to decline. Debt instruments rated below
investment-grade are especially susceptible to this risk.
Interest Rate: The values of
debt instruments usually rise and fall in response to changes in interest rates. Declining interest rates generally increase the value of existing debt instruments, and rising interest rates generally decrease the value of existing debt instruments.
Changes in a debt instrument’s value usually will not affect the amount of interest income paid to the Fund, but will affect the value of the Fund’s shares. Interest rate risk is generally greater for investments with longer maturities.
Certain instruments pay interest at variable or floating rates. Variable rate instruments reset at specified intervals, while floating rate instruments reset whenever there is a change in a specified index rate. In most cases, these reset provisions
reduce the effect of changes in market interest rates on the value of the instrument. However, some instruments do not track the underlying index directly, but reset based on formulas that can produce an effect similar to leveraging; others may also
provide for interest payments that vary inversely with market rates. The market prices of these instruments may fluctuate significantly when interest rates change.
Some investments give the issuer the option to call or redeem
an investment before its maturity date. If an issuer calls or redeems an investment during a time of declining interest rates, the Fund might have to reinvest the proceeds in an investment offering a lower yield, and therefore it might not benefit
from any increase in value as a result of declining interest rates.
High Yield Fixed Income Securities: Securities rated below the four highest rating categories of a nationally recognized statistical rating organization, may be known as “high-yield” securities and commonly referred to as “junk
bonds.” The highest of the ratings among these nationally recognized statistical rating organizations is used to determine the security’s classification. Such securities entail greater price volatility and credit and interest rate risk
than investment-grade securities. Analysis of the creditworthiness of high-yield/high-risk issuers is more complex than for higher-rated securities, making it more difficult for the Fund’s subadviser to accurately predict risk. There is a
greater risk with high-yield/high-risk fixed income securities that an issuer will not be able to make principal and interest payments when due. If the Fund pursues missed payments, there is a risk that the Fund’s expenses could increase. In
addition, lower-rated securities may not trade as often and may be less liquid than higher-rated securities, especially during periods of economic uncertainty or change. As a result of all of these factors, these bonds are generally considered to be
speculative.
Market Volatility: The Fund could lose money over short periods due to short-term market movements and over longer periods during more prolonged market downturns. The value of a security or other instrument may decline due to changes in
general market conditions, economic trends or events that are not specifically related to the issuer of the security or other instrument, or factors that affect a particular issuer or issuers, country, group of countries, region, market, industry,
group of industries, sector or asset class. During a general market downturn, multiple asset classes may be negatively affected. Changes in market conditions and interest rates generally do not have the same impact on all types of securities and
instruments.
CONVERTIBLE & INCOME FUND
(NCV)
INVESTMENT OBJECTIVE, PRINCIPAL STRATEGIES AND PRINCIPAL RISKS
(Unaudited) (Continued)
Closed-End Fund: Because the
Fund is a closed-end fund, its shares may trade at a discount or premium from their net asset values, which may affect whether an investor will realize gains or losses. The Fund may also employ leverage, which may increase volatility.
No Guarantee: There is no
guarantee that the Fund will meet its objective.
CONVERTIBLE & INCOME FUND
II (NCZ)
INVESTMENT OBJECTIVE, PRINCIPAL STRATEGIES AND PRINCIPAL RISKS
(Unaudited)
Investment Objective: The
Fund’s investment objective is to provide total return through a combination of capital appreciation and high current income.
Principal Strategies: In selecting investments for the Fund,
Voya IM attempts to identify issuers that successfully adapt to change. Voya IM uses traditional credit analysis combined with a disciplined, fundamental bottom-up research process that facilitates the early identification of issuers demonstrating
an ability to improve their fundamental characteristics. Voya IM attempts to identify potential investments that it expects will exceed minimum credit statistics and exhibit the highest visibility of future expected operating performance. Voya
IM’s sell discipline is clearly defined and designed to drive the Fund’s portfolio continually toward strength, taking into account factors such as a change in credit fundamentals, a decline in attractiveness relative to other securities
and a decline in industry fundamentals.
Under normal
circumstances, the Fund will invest at least 80% of its total assets in a diversified portfolio of convertible securities and non-convertible income-producing securities. The portion of the Fund’s assets invested in convertible securities, on
the one hand, and non-convertible income-producing securities, on the other, will vary from time to time consistent with the Fund’s investment objective, although the Fund will normally invest at least 50% of its total assets in convertible
securities.
The Fund may invest up to 20% of its total
assets in securities other than convertible securities and non-convertible income-producing securities.
The Fund may invest up to 20% of its total assets in U.S.
dollar-denominated securities of foreign issuers based in developed countries.
Leverage. The Fund currently does, but is not required to,
maintain leverage in the form of auction-rate preferred shares and cumulative preferred shares.
Principal Risks:
Convertible Securities: A
convertible security may be called for redemption at a time and price unfavorable to the Fund. The value of a convertible security may decline as interest rates rise and/or vary with fluctuations in the market value of the underlying securities.
Convertible securities have general characteristics similar to both debt securities and equity securities and may give rise to the associated risks.
Leverage: When the Fund uses
leverage through activities such as borrowing, the Fund has the risk of magnified capital losses that occur when losses affect an asset base, enlarged by borrowings or the creation of liabilities that exceeds the net assets of the Fund. The value of
the shares of the Fund will be more volatile and sensitive to market movements as a result of its use of leverage. Leverage may also involve the creation of a liability that requires the Fund to pay interest.
Preferred Stocks: Preferred
stocks may decline in price, fail to pay dividends, or be illiquid. Because they often lack a fixed maturity or redemption date, preferred stocks are likely to fluctuate substantially in price when interest rates change.
Lower-rated securities:
Investments in lower-rated and non-rated securities present a greater risk of loss to principal than higher-rated securities. Such securities entail greater price volatility and credit and interest rate risk than higher-rated securities. In
addition, lower-rated securities may not trade as often and may be less liquid than higher-rated securities, especially during periods of economic uncertainty or change.
Credit: There is a risk that
the issuer of a security will fail to pay interest or principal in a timely manner, or that negative perceptions of the issuer’s ability to make such payments will cause the price of the security to decline. Debt instruments rated below
investment-grade are especially susceptible to this risk.
Interest Rate: The values of
debt instruments usually rise and fall in response to changes in interest rates. Declining interest rates generally increase the value of existing debt instruments, and rising interest rates generally decrease the value of existing debt instruments.
Changes in a debt instrument’s value usually will not affect the amount of interest income paid to the Fund, but will affect the value of the Fund’s shares. Interest rate risk is generally greater for investments with longer maturities.
Certain instruments pay interest at variable or floating rates. Variable rate instruments reset at specified intervals, while floating rate instruments reset whenever there is a change in a specified index rate. In most cases, these reset provisions
reduce the effect of changes in market interest rates on the value of the instrument. However, some instruments do not track the underlying index directly, but reset based on formulas that can produce an effect similar to leveraging; others may also
provide for interest payments that vary inversely with market rates. The market prices of these instruments may fluctuate significantly when interest rates change.
Some investments give the issuer the option to call or redeem
an investment before its maturity date. If an issuer calls or redeems an investment during a time of declining interest rates, the Fund might have to reinvest the proceeds in an investment offering a lower yield, and therefore it might not benefit
from any increase in value as a result of declining interest rates.
High Yield Fixed Income Securities: Securities rated below the four highest rating categories of a nationally recognized statistical rating organization, may be known as “high-yield” securities and commonly referred to as “junk
bonds.” The highest of the ratings among these nationally recognized statistical rating organizations is used to determine the security’s classification. Such securities entail greater price volatility and credit and interest rate risk
than investment-grade securities. Analysis of the creditworthiness of high-yield/high-risk issuers is more complex than for higher-rated securities, making it more difficult for the Fund’s subadviser to accurately predict risk. There is a
greater risk with high-yield/high-risk fixed income securities that an issuer will not be able to make principal and interest payments when due. If the Fund pursues missed payments, there is a risk that the Fund’s expenses could increase. In
addition, lower-rated securities may not trade as often and may be less liquid than higher-rated securities, especially during periods of economic uncertainty or change. As a result of all of these factors, these bonds are generally considered to be
speculative.
Market Volatility: The Fund could lose money over short periods due to short-term market movements and over longer periods during more prolonged market downturns. The value of a security or other instrument may decline due to changes in
general market conditions, economic trends or events that are not specifically related to the issuer of the security or other instrument, or factors that affect a particular issuer or issuers, country, group of countries, region, market, industry,
group of industries, sector or asset class. During a general market downturn, multiple asset classes may be negatively affected. Changes in market conditions and interest rates generally do not have the same impact on all types of securities and
instruments.
CONVERTIBLE & INCOME FUND
II (NCZ)
INVESTMENT OBJECTIVE, PRINCIPAL STRATEGIES AND PRINCIPAL RISKS
(Unaudited) (Continued)
Closed-End Fund: Because the
Fund is a closed-end fund, its shares may trade at a discount or premium from their net asset values, which may affect whether an investor will realize gains or losses. The Fund may also employ leverage, which may increase volatility.
No Guarantee: There is no
guarantee that the Fund will meet its objective.
DIVERSIFIED INCOME &
CONVERTIBLE FUND (ACV)
INVESTMENT OBJECTIVE, PRINCIPAL STRATEGIES AND
PRINCIPAL RISKS (Unaudited)
Investment Objective: The
Fund’s investment objective is to provide total return through a combination of current income and capital appreciation, while seeking to provide downside protection against capital loss.
Principal Strategies:
Under normal market conditions, the Fund seeks to achieve its
investment objective by investing in a combination of convertible securities, debt and other income-producing instruments and common stocks and other equity securities. It is expected that substantially all of the Fund’s debt instruments
and a substantial portion of its convertible securities will consist of securities rated below investment grade or unrated but determined by Voya IM to be of comparable quality (sometimes referred to as “high yield securities” or
“junk bonds”). The allocation of the Fund’s investments across these asset classes will vary from time to time, based upon the portfolio managers’ assessment of economic conditions and market factors, including equity price
levels, interest rate levels and their anticipated direction, such that an asset class may be more heavily weighted in the Fund’s portfolio than the other classes at any time and from time to time, and sometimes to a substantial extent. The
Fund also expects to normally employ a strategy of writing (selling) covered call options on the stocks held in the equity portion of the portfolio. The Fund may write covered call options on approximately 30% to 80% of the Fund’s common
stocks from time to time, depending on market conditions, with respect to up to approximately 70% of the value of each position.
The Fund will normally invest at least 80% of its net assets
(plus any borrowings for investment purposes) in a diversified portfolio of convertible securities, income-producing equity securities and income-producing debt and other instruments of varying maturities. For purposes of this policy,
“income-producing equity securities” include, among other instruments, dividend-paying common and preferred stocks.
The Fund will normally invest at least 50% of its managed
assets in convertible securities.
The Fund currently
does, but is not required to, maintain leverage in the form of preferred shares, borrowed money and issued debt securities.
Principal Risks:
Convertible Securities: A
convertible security may be called for redemption at a time and price unfavorable to the Fund. The value of a convertible security may decline as interest rates rise and/or vary with fluctuations in the market value of the underlying securities.
Convertible securities have general characteristics similar to both debt securities and equity securities and may give rise to the associated risks.
Lower-rated securities:
Investments in lower-rated and non-rated securities present a greater risk of loss to principal than higher-rated securities. Such securities entail greater price volatility and credit and interest rate risk than higher-rated securities. In
addition, lower-rated securities may not trade as often and may be less liquid than higher-rated securities, especially during periods of economic uncertainty or change.
Credit: There is a risk that
the issuer of a security will fail to pay interest or principal in a timely manner, or that negative perceptions of the issuer’s ability to make such payments will cause the price of the security to decline. Debt instruments rated below
investment-grade are especially susceptible to this risk.
Interest Rate: The values of
debt instruments usually rise and fall in response to changes in interest rates. Declining interest rates generally increase the value of existing debt instruments, and rising interest rates generally decrease the value of existing debt instruments.
Changes in a debt instrument’s value usually will not affect the amount of interest income paid to the Fund, but will affect the value of the Fund’s shares. Interest rate risk is generally greater for investments with longer maturities.
Certain instruments pay interest at variable or floating rates. Variable rate instruments reset at specified intervals, while floating rate instruments reset whenever there is a change in a specified index rate. In most cases, these reset provisions
reduce the effect of changes in market interest rates on the value of the instrument. However, some instruments do not track the underlying index directly, but reset based on formulas that can produce an effect similar to leveraging; others may also
provide for interest payments that vary inversely with market rates. The market prices of these instruments may fluctuate significantly when interest rates change.
Some investments give the issuer the option to call or redeem
an investment before its maturity date. If an issuer calls or redeems an investment during a time of declining interest rates, the Fund might have to reinvest the proceeds in an investment offering a lower yield, and therefore it might not benefit
from any increase in value as a result of declining interest rates.
Leverage: When the Fund uses
leverage through activities such as borrowing, the Fund has the risk of magnified capital losses that occur when losses affect an asset base, enlarged by borrowings or the creation of liabilities, that exceeds the net assets of the Fund. The value
of the shares of the Fund will be more volatile and sensitive to market movements as a result of its use of leverage. Leverage may also involve the creation of a liability that requires the Fund to pay interest.
High Yield Fixed Income Securities: Securities rated below the four highest rating categories of a nationally recognized statistical rating organization, may be known as “high-yield” securities and commonly referred to as “junk
bonds.” The highest of the ratings among these nationally recognized statistical rating organizations is used to determine the security’s classification. Such securities entail greater price volatility and credit and interest rate risk
than investment-grade securities. Analysis of the creditworthiness of high-yield/high-risk issuers is more complex than for higher-rated securities, making it more difficult for the Fund’s subadviser to accurately predict risk. There is a
greater risk with high-yield/high-risk fixed income securities that an issuer will not be able to make principal and interest payments when due. If the Fund pursues missed payments, there is a risk that the Fund’s expenses could increase. In
addition, lower-rated securities may not trade as often and may be less liquid than higher-rated securities, especially during periods of economic uncertainty or change. As a result of all of these factors, these bonds are generally considered to be
speculative.
Equity Securities: Generally, prices of equity securities are more volatile than those of fixed income securities. The prices of equity securities will rise and fall in response to a number of different factors. In particular, equity
securities will respond to events that affect entire financial markets or industries (such as changes in inflation or consumer demand) and to events that affect particular issuers (such as news about the success or failure of a new product). Equity
securities also are subject to “stock market risk,” meaning that stock prices in general may decline over short or extended periods of time. When the value of the stocks held by the Fund goes down, the net asset value of the Fund’s
shares will be affected.
DIVERSIFIED INCOME &
CONVERTIBLE FUND (ACV)
INVESTMENT OBJECTIVE, PRINCIPAL STRATEGIES AND
PRINCIPAL RISKS (Unaudited) (Continued)
Preferred Stocks: Preferred
stocks may decline in price, fail to pay dividends, or be illiquid. Because they often lack a fixed maturity or redemption date, preferred stocks are likely to fluctuate substantially in price when interest rates change.
Limited Term: The Fund will
terminate on the first business day following the fifteenth anniversary of the effective date of its registration statement, May 22, 2030, absent Trustee and shareholder approval to amend the limited term provision of the Fund’s Amended and
Restated Agreement and Declaration of Trust, as provided therein. As the assets of the Fund will be liquidated in connection with its termination, the Fund may be required to sell portfolio securities when it otherwise would not, including at times
when market conditions are not favorable, which may cause the Fund to lose money.
Option Strategy: The ability of
the Fund to achieve current gains to support Fund dividends is partially dependent on the successful implementation of its strategy of writing covered call options on a portion of its portfolio securities. There are several risks associated with
transactions in options on securities. As the writer of a covered call option, the Fund forgoes, during the option’s life, the opportunity to profit from increases in the market value of the security covering the call option above the sum of
the premium and the strike price of the call, but has retained the risk of loss should the price of the underlying security decline.
Market Volatility: The Fund
could lose money over short periods due to short-term market movements and over longer periods during more prolonged market downturns. The value of a security or other instrument may decline due to changes in general market conditions, economic
trends or events that are not specifically related to the issuer of the security or other instrument, or factors that affect a particular issuer or issuers, country, group of countries, region, market, industry, group of industries, sector or asset
class. During a general market downturn, multiple asset classes may be negatively affected. Changes in market conditions and interest rates generally do not have the same impact on all types of securities and instruments.
Closed-End Fund: Because the
Fund is a closed-end fund, its shares may trade at a discount or premium from their net asset values, which may affect whether an investor will realize gains or losses. The Fund may also employ leverage, which may increase volatility.
No Guarantee: There is no
guarantee that the Fund will meet its objective.
Managed Distribution Plan: The
Board of Directors has adopted a Managed Distribution Plan (the “Plan”) which currently provides for the Fund to make a monthly distribution at the rate of $0.18 per share. Under the terms of the Plan, the Fund seeks to maintain a
consistent distribution level that may be paid in part or in full from net investment income, realized capital gains, and a return of capital, or a combination thereof. The Board may amend, suspend or terminate the Plan at any time, without prior
notice to shareholders, if it deems such action to be in the best interests of the Fund and its shareholders.
DIVIDEND, INTEREST &
PREMIUM STRATEGY FUND (NFJ)
INVESTMENT OBJECTIVE, PRINCIPAL STRATEGIES
AND PRINCIPAL RISKS (Unaudited)
Investment Objective: The
Fund’s primary investment objective is to seek current income and gains, with a secondary objective of long-term capital appreciation.
Principal Strategies: The Fund
pursues its investment objectives by investing in a diversified portfolio of dividend-paying common stocks (the “Equity Component”) and income-producing convertible securities (the “Convertible Component”). The Fund employs a
strategy of writing (selling) call options on equity indexes such that the underlying value of the indexes is within a range of approximately 75% to 100% of the net asset value of the Equity Component under normal market conditions, subject to
future fluctuations in the assets attributable to the Equity Component.
On an annual basis, if the allocation of the Fund’s
assets falls outside the ranges of 70% to 80% for the Equity Component and 20% to 30% for the Convertible Component, the Fund’s subadvisers will cause a rebalancing of the Fund’s portfolio such that each Component’s allocation is
adjusted back to a point within its range in relative percentages determined by the subadvisers. In addition, the subadvisers may, but are not required to, cause the Fund to rebalance the Components to any point within their respective ranges at any
time during the course of a year. The weighting of the Components may otherwise vary significantly from the enumerated ranges from time to time.
Under normal circumstances, the Fund will invest at least 80%
of its net assets (plus any borrowings for investment purposes) in securities and other instruments that provide dividends, interest or option premiums. The Equity Component will ordinarily consist principally of dividend-paying common stocks, but
may also include preferred stocks and dividend-paying real estate investment trusts. The Convertible Component will ordinarily consist of convertible securities, including synthetic convertible securities, and may include convertible securities that
are of below investment grade quality.
The Fund may
invest up to 10% of its total assets in securities issued by master limited partnerships (“MLPs”).
Principal Risks:
Equity Securities: Generally,
prices of equity securities are more volatile than those of fixed income securities. The prices of equity securities will rise and fall in response to a number of different factors. In particular, equity securities will respond to events that affect
entire financial markets or industries (such as changes in inflation or consumer demand) and to events that affect particular issuers (such as news about the success or failure of a new product). Equity securities also are subject to “stock
market risk,” meaning that stock prices in general may decline over short or extended periods of time. When the value of the stocks held by the Fund goes down, the net asset value of the Fund’s shares will be affected.
Convertible Securities: A
convertible security may be called for redemption at a time and price unfavorable to the Fund. The value of a convertible security may decline as interest rates rise and/or vary with fluctuations in the market value of the underlying securities.
Convertible securities have general characteristics similar to both debt securities and equity securities and may give rise to the associated risks.
Lower-rated securities:
Investments in lower-rated and non-rated securities present a greater risk of loss to principal than higher-rated securities. Such securities entail greater price volatility and credit and interest rate risk than
higher-rated securities. In addition, lower-rated securities may not trade as often and may be less liquid than higher-rated securities, especially during periods of economic uncertainty or change.
Credit: There is a risk that
the issuer of a security will fail to pay interest or principal in a timely manner, or that negative perceptions of the issuer’s ability to make such payments will cause the price of the security to decline. Debt instruments rated below
investment-grade are especially susceptible to this risk.
Interest Rate: The values of
debt instruments usually rise and fall in response to changes in interest rates. Declining interest rates generally increase the value of existing debt instruments, and rising interest rates generally decrease the value of existing debt instruments.
Changes in a debt instrument’s value usually will not affect the amount of interest income paid to the Fund, but will affect the value of the Fund’s shares. Interest rate risk is generally greater for investments with longer maturities.
Certain instruments pay interest at variable or floating rates. Variable rate instruments reset at specified intervals, while floating rate instruments reset whenever there is a change in a specified index rate. In most cases, these reset provisions
reduce the effect of changes in market interest rates on the value of the instrument. However, some instruments do not track the underlying index directly, but reset based on formulas that can produce an effect similar to leveraging; others may also
provide for interest payments that vary inversely with market rates. The market prices of these instruments may fluctuate significantly when interest rates change.
Some investments give the issuer the option to call or redeem
an investment before its maturity date. If an issuer calls or redeems an investment during a time of declining interest rates, the Fund might have to reinvest the proceeds in an investment offering a lower yield, and therefore it might not benefit
from any increase in value as a result of declining interest rates.
Option Strategy: The ability of
the Fund to achieve current gains to support Fund dividends is partially dependent on the successful implementation of its strategy of writing covered call options on equity indexes. There are several risks associated with transactions in options on
indexes. As the writer of a call option, the Fund retains the risk of loss should the price of the underlying index decline.
Market Volatility: The Fund
could lose money over short periods due to short-term market movements and over longer periods during more prolonged market downturns. The value of a security or other instrument may decline due to changes in general market conditions, economic
trends or events that are not specifically related to the issuer of the security or other instrument, or factors that affect a particular issuer or issuers, country, group of countries, region, market, industry, group of industries, sector or asset
class. During a general market downturn, multiple asset classes may be negatively affected. Changes in market conditions and interest rates generally do not have the same impact on all types of securities and instruments.
Preferred Stocks: Preferred
stocks may decline in price, fail to pay dividends, or be illiquid. Because they often lack a fixed maturity or redemption date, preferred stocks are likely to fluctuate substantially in price when interest rates change.
Closed-End Fund: Because the
Fund is a closed-end fund, its shares may trade at a discount or premium from their net asset values, which may affect whether an investor will realize gains or losses. The Fund may also employ leverage, which may increase volatility.
DIVIDEND, INTEREST &
PREMIUM STRATEGY FUND (NFJ)
INVESTMENT OBJECTIVE, PRINCIPAL STRATEGIES
AND PRINCIPAL RISKS (Unaudited) (Continued)
MLPs and MLP Affiliates: An
investment in MLP units involves some risks that differ from an investment in the common stock of a corporation. Holders of MLP units have limited control on matters affecting the partnership. MLPs holding credit-related investments are subject to
interest rate risk and the risk of default on payment obligations by debt issuers. MLPs that concentrate in a particular industry or a particular geographic region are subject to risks associated with such industry or region. The fees that MLPs
charge for transportation of oil and gas products through their pipelines are subject to government regulation, which could negatively impact the revenue stream. Investing in MLPs also involves certain risks related to investing in the underlying
assets of the MLPs and risks associated with pooled investment vehicles. These include the risk of environmental incidents, terrorist attacks, demand destruction from high commodity prices, proliferation of alternative energy sources, inadequate
supply of external capital and conflicts of interest with the general partner. The benefit derived from the Fund’s investment in MLPs is largely dependent on the MLPs being treated as partnerships for federal income tax purposes, so any change
to this status would adversely affect the price of the MLP units.
Certain MLPs in which the Fund may invest depend upon their
parent or sponsor entities for the majority of their revenues. If their parent or sponsor entities fail to make such payments or satisfy their obligations, the revenues and cash flows of such MLPs and ability of such MLPs to make distributions to
unit holders, such as the Fund, would be adversely affected.
The performance of securities issued by MLP affiliates,
including MLP I-Shares and common shares of corporations that own general partner interests, primarily depend on the performance of an MLP. As such, results of operations, financial condition, cash flows and distributions for MLP affiliates
primarily depend on an MLP’s results of operations, financial condition and cash flows. The risks and uncertainties that affect the MLP, its results of operations, financial condition, cash flows and distributions also affect the value of
securities held by the MLP affiliates. Securities of MLP I-Shares may trade at a market price below that of the MLP affiliate and may be less liquid than securities of their MLP affiliate.
No Guarantee: There is no
guarantee that the Fund will meet its objective.
Managed Distribution Plan: The
Board of Directors has adopted a Managed Distribution Plan (the “Plan”) which currently provides for the Fund to make a quarterly distribution at the rate of $0.28 per share for distributions after March 1, 2024; prior to March 1, 2024,
the rate for NFJ was $0.245 per share. Under the terms of the Plan, the Fund seeks to maintain a consistent distribution level that may be paid in part or in full from net investment income, realized capital gains, and a return of capital, or a
combination thereof. The Board may amend, suspend or terminate the Plan at any time, without prior notice to shareholders, if it deems such action to be in the best interests of the Fund and its shareholders.
EQUITY & CONVERTIBLE INCOME
FUND (NIE)
INVESTMENT OBJECTIVE, PRINCIPAL STRATEGIES AND PRINCIPAL
RISKS (Unaudited)
Investment Objective: The
Fund’s investment objective is to seek total return comprised of capital appreciation, current income and gains.
Principal Strategies: The Fund
pursues its investment objective by investing in a diversified portfolio of equity securities (the “Equity Component”) and income-producing convertible securities (the “Convertible Component”). The Fund also employs a
strategy of writing (selling) call options on the stocks held in the Equity Component as well as on equity indexes, generally with respect to up to approximately 70% of the value of the securities in the Equity Component. The extent of the
Fund’s use of this options strategy will vary depending on market conditions and other factors, and the Fund may determine from time to time to write call options on only a portion, or none, of the stocks in the Equity Component.
The percentage of the Fund’s total assets represented by
each Component is expected to vary based on relative investment performance and the subadviser’s views regarding market conditions and other factors. The Fund expects that each Component will generally vary within the following ranges: 40% to
80% for the Equity Component and 20% to 60% for the Convertible Component. The risk/return profile of the Fund (taken as a whole) will vary according to the level of total assets allocated to each Component. The subadviser will normally attempt to
maintain the portfolio of the Convertible Component with an average credit quality that is investment grade.
Under normal circumstances, the Fund will invest at least 80%
of its net assets (plus any borrowings for investment purposes) in a combination of equity securities and income-producing convertible securities.
The Fund may also invest up to 20% of its total assets in
non-convertible income-producing securities.
Principal
Risks:
Equity Securities:
Generally, prices of equity securities are more volatile than those of fixed income securities. The prices of equity securities will rise and fall in response to a number of different factors. In particular, equity securities will respond to events
that affect entire financial markets or industries (such as changes in inflation or consumer demand) and to events that affect particular issuers (such as news about the success or failure of a new product). Equity securities also are subject to
“stock market risk,” meaning that stock prices in general may decline over short or extended periods of time. When the value of the stocks held by the Fund goes down, the net asset value of the Fund’s shares will be
affected.
Convertible Securities: A convertible security may be called for redemption at a time and price unfavorable to the Fund. The value of a convertible security may decline as interest rates rise and/or vary with fluctuations in the market value
of the underlying securities. Convertible securities have general characteristics similar to both debt securities and equity securities and may give rise to the associated risks.
Lower-rated securities:
Investments in lower-rated and non-rated securities present a greater risk of loss to principal than higher-rated securities. Such securities entail greater price volatility and credit and interest rate risk than
higher-rated securities. In addition, lower-rated securities may not trade as often and may be less liquid than higher-rated securities, especially during periods of economic uncertainty or change.
Credit: There is a risk that
the issuer of a security will fail to pay interest or principal in a timely manner, or that negative perceptions of the issuer’s ability to make such payments will cause the price of the security to decline. Debt instruments rated below
investment-grade are especially susceptible to this risk.
Interest Rate: The values of
debt instruments usually rise and fall in response to changes in interest rates. Declining interest rates generally increase the value of existing debt instruments, and rising interest rates generally decrease the value of existing debt instruments.
Changes in a debt instrument’s value usually will not affect the amount of interest income paid to the Fund, but will affect the value of the Fund’s shares. Interest rate risk is generally greater for investments with longer maturities.
Certain instruments pay interest at variable or floating rates. Variable rate instruments reset at specified intervals, while floating rate instruments reset whenever there is a change in a specified index rate. In most cases, these reset provisions
reduce the effect of changes in market interest rates on the value of the instrument. However, some instruments do not track the underlying index directly, but reset based on formulas that can produce an effect similar to leveraging; others may also
provide for interest payments that vary inversely with market rates. The market prices of these instruments may fluctuate significantly when interest rates change.
Some investments give the issuer the option to call or redeem
an investment before its maturity date. If an issuer calls or redeems an investment during a time of declining interest rates, the Fund might have to reinvest the proceeds in an investment offering a lower yield, and therefore it might not benefit
from any increase in value as a result of declining interest rates.
Option Strategy: The ability of
the Fund to achieve current gains to support Fund dividends is partially dependent on the successful implementation of its strategy of writing covered call options on a portion of its portfolio securities. There are several risks associated with
transactions in options on securities. As the writer of a covered call option, the Fund forgoes, during the option’s life, the opportunity to profit from increases in the market value of the security covering the call option above the sum of
the premium and the strike price of the call, but has retained the risk of loss should the price of the underlying security decline.
Market Volatility: The Fund
could lose money over short periods due to short-term market movements and over longer periods during more prolonged market downturns. The value of a security or other instrument may decline due to changes in general market conditions, economic
trends or events that are not specifically related to the issuer of the security or other instrument, or factors that affect a particular issuer or issuers, country, group of countries, region, market, industry, group of industries, sector or asset
class. During a general market downturn, multiple asset classes may be negatively affected. Changes in market conditions and interest rates generally do not have the same impact on all types of securities and instruments.
Preferred Stocks: Preferred
stocks may decline in price, fail to pay dividends, or be illiquid. Because they often lack a fixed maturity or redemption date, preferred stocks are likely to fluctuate substantially in price when interest rates change.
Closed-End Fund: Because the
Fund is a closed-end fund, its shares may trade at a discount or premium from their net asset values, which may affect whether an investor will realize gains or losses. The Fund may also employ leverage, which may increase volatility.
No Guarantee: There is no
guarantee that the Fund will meet its objective.
EQUITY & CONVERTIBLE INCOME
FUND (NIE)
INVESTMENT OBJECTIVE, PRINCIPAL STRATEGIES AND PRINCIPAL
RISKS (Unaudited) (Continued)
Managed Distribution Plan: The
Board of Directors has adopted a Managed Distribution Plan (the “Plan”) which currently provides for the Fund to make a quarterly distribution at the rate of $0.50 per share. Under the terms of the Plan, the Fund seeks to maintain a
consistent distribution level that may be paid in part or in full from net investment income, realized capital gains, and a return of capital, or a combination thereof. The Board may amend, suspend or terminate the Plan at any time, without prior
notice to shareholders, if it deems such action to be in the best interests of the Fund and its shareholders.
VIRTUS CLOSED-END FUNDS
DIVIDEND REINVESTMENT PLAN (Unaudited)
Holders
of common shares of beneficial interest (the “Common Shares”) of each of the Virtus-sponsored closed-end investment companies listed on Appendix A [which covers all the funds included in this report] hereto, as it may be amended from
time to time (each a “Fund”), whose Common Shares are registered with the Agent (as defined below) (the “Registered Common Shareholders” or “Shareholders”), will automatically be enrolled (those so enrolled, the
“Participants”) in the Fund’s Dividend Reinvestment Plan (the “Plan”) and are advised as follows with respect to each such Fund:
1. THE PLAN AGENT. Computershare Trust Company, N.A. (the
“Agent”) will act as Agent for each Participant. The Agent will open an account for each Participant under the Plan with respect to the Fund in the same name in which his or her outstanding Common Shares of the Fund are registered with
the Agent.
2. AUTOMATIC REINVESTMENT FOR PARTICIPANTS /
CASH OPTION ELECTION. On behalf of each Participant, the Agent will automatically reinvest each Fund’s distributions of income, capital gains and returns of capital (together, “Distributions”) in Common Shares as described herein
as of the first record date for a Distribution by the Fund to shareholders following the date on which the Participant becomes a shareholder of record of the Fund. In accordance with the foregoing, each Registered Common Shareholder will have all
Distributions on his or her Common Shares automatically reinvested in additional Common Shares, unless such Shareholder elects to not be a Participant in the Plan and to receive such Distributions in cash. Registered Common Shareholders who wish to
receive Distributions in cash, whether following his or her initial purchase of Common Shares or after having been a Participant in the Plan for some period, should so notify the Agent online at www.computershare.com/investor, by writing to the
Agent at P.O. Box 43078, Providence, RI 02940-3078, by calling (866) 270-7788 or (413) 775-6091 or, as applicable, by completing and returning the transaction form attached to each Plan statement, as specified and in accordance with Section 13
hereof.
3. MARKET PREMIUM ISSUANCES. With respect to each
Participant, if on the payment date for a Distribution, the net asset value per Common Share of the Fund is equal to or less than the market price per Common Share plus estimated brokerage commissions, the Agent shall cause the Distribution to be
invested by receiving newly issued Common Shares (“Additional Common Shares”), including fractions, from the Fund for each Participant’s account. The number of Additional Common Shares to be credited shall be determined by dividing
the dollar amount of the Distribution by the greater of (i) the net asset value per Common Share on the payment date, or (ii) 95% of the market price per Common Share on the payment date.
4. MARKET DISCOUNT PURCHASES. With respect to each Participant,
and except as provided below, if the net asset value per Common Share of the Fund exceeds the market price per Common Share plus estimated per share fees (which include any applicable brokerage commissions the Agent is required to pay) on the
payment date for a Distribution, the Agent (or a broker-dealer selected by the Agent) shall endeavor to apply the amount of such Distribution on such Participant’s Common Shares to purchase Common Shares of the Fund on the open market. Such
market purchases will commence on or shortly after the payment date for such Distribution and the Agent shall complete such purchases not more than thirty (30) calendar days after such Distribution payment date, except where temporary curtailment or
suspension of purchase is necessary to comply with applicable provisions of federal securities laws. If the Agent is unable to invest the full amount of a Distribution through open market purchases pursuant to this Section 4, or, if before the Agent
has completed the open market purchases, the market price per Common Share of the Fund plus estimated per share fees exceeds the net asset value per Common Share as of the last business day immediately prior to the purchase date (the “prior
business day”), the Agent shall cause the remainder of the Distribution to be invested by receiving Additional Common Shares, including fractions, from the Fund for each Participant’s account, the number of which shall be determined by
dividing the dollar amount of the remainder (i.e., the uninvested portion) of the Distribution by the greater of
(i) the net asset value per Common Share on the prior business
day, or (ii) 95% of the market price per Common Share on the prior business day (which, in either case, may be a price greater or lesser than the net asset value per Common Share on the payment date for the applicable Distribution). Participants
should note that they will not be able to instruct the Agent to purchase Common Shares at a specific time or at a specific price. Open-market purchases may be made on any securities exchange where Common Shares are traded, in the over-the-counter
market or in negotiated transactions, and may be on such terms as to price, delivery and otherwise as the Agent shall determine.
The Agent may commingle all Participants’ amounts to be
used for open market purchases of the Fund’s Common Shares. The weighted average price of all Common Shares purchased on the open market
by the Agent as Agent and/or issued by the Fund pursuant to
Section 3 shall be the price per Common Share allocable to each Participant.
5. VALUATION. The market price of Common Shares of a Fund on a
particular date shall be the last sales price on the securities exchange where the Common Shares are listed on that date (the “Exchange”), or, if there is no sale on such Exchange on that date, then the mean between the closing bid and
asked quotations on such Exchange on such date will be used. The net asset value per Common Share on a particular date shall be the amount calculated on that date (or if not calculated on such date, the amount most recently calculated) by or on
behalf of the Fund in accordance with the Fund’s current policies.
6. SAFEKEEPING. In order to protect against loss, theft or
destruction, if Participants hold Common Shares registered in their own names in certificate form, Participants may deposit such Common Shares into their Plan accounts. Certificates, along with a letter of instruction, should be sent to the Agent by
registered mail and properly insured. Participants should not endorse their certificates. There are no fees for this service.
7. TAXATION. The automatic reinvestment of Distributions does
not relieve Participants of any taxes which may be payable on Distributions. Participants will receive tax information annually for their personal records and to help them prepare their federal income tax return. For further information as to tax
consequences of participation in the Plan, Participants should consult with their own tax advisors.
VIRTUS CLOSED-END FUNDS
DIVIDEND REINVESTMENT PLAN (Unaudited) (Continued)
8.
LIABILITY OF AGENT. The Agent shall at all times act in good faith and agrees to use its best efforts within reasonable limits to ensure the accuracy of all services performed under these terms and conditions and to comply with applicable law, but
assumes no responsibility and shall not be liable for loss or damage due to errors unless such error is caused by the Agent’s negligence, bad faith, or willful misconduct or that of its employees. Each Participant’s uninvested funds held
by the Agent will not bear interest. The Agent shall have no liability in connection with any inability to purchase or sell Common Shares within the time period specified herein, or with the timing of any purchases or sales effected. The Agent shall
have no responsibility for the value of Common Shares acquired. The Agent may commingle Participants’ funds.
9. RECORDKEEPING. The Agent may hold each Participant’s
Common Shares acquired pursuant to the Plan together with the Common Shares of other Registered Common Shareholders of the Fund acquired pursuant to the Plan in non- certificated form in the Agent’s name or that of the Agent’s nominee.
Distributions on fractional shares will be credited to each Participant’s account. Each Participant will be sent a confirmation by the Agent of each acquisition made for his or her account as soon as practicable,. Participants may request to
sell a portion of the Common Shares held by the Agent in their Plan accounts online, by calling the Agent, by writing to the Agent, or by completing and returning the transaction form attached to each Plan statement as specified above. The Agent
will sell such Common Shares through a broker-dealer selected by the Agent within five (5) business days of receipt of the request assuming the relevant markets are open and sufficient market liquidity exists (and except where deferral of the sale
is required under applicable federal or state laws or regulations). The sale price, which will not be determined until such time as the broker-dealer completes the sale, will equal the weighted average price of all Common Shares sold through the
Plan on the day of the sale, less per share fees. Per share fees include any applicable brokerage commissions the Agent is required to pay. Participants should note that the Agent is unable to accept instructions to sell on a specific date or at a
specific price. As an alternative to selling Common Shares through the Agent, a Participant may request that the Agent electronically transfer his or her Common Shares to his or her brokerage account in applicable circumstances. Any share dividends
or split shares distributed by the Fund on Common Shares held by the Agent for Participants will be credited to their accounts. In the event that the Fund makes available to its Common Shareholders rights to purchase additional Common Shares, the
Common Shares held for each Participant under the Plan will be added to other Common Shares held by the Participant in calculating the number of rights to be issued to each Participant.
10. PROXY MATERIALS. The Agent will forward to each Participant
any proxy solicitation material it receives with respect to the Common Shares in the Participant’s Plan account. The Agent will vote any Common Shares held for a Participant first in accordance with the instructions set forth on proxies
returned by such Participant to the Fund, and then with respect to any proxies not returned by such Participant to the Fund, in the same proportion as the Agent votes the proxies returned by the Participants to the Fund.
11. BROKERS, NOMINEE HOLDERS, ETC. In the case of Registered
Common Shareholders such as a broker, bank or other nominee that holds Common Shares for others who are the beneficial owners, the Agent will administer the Plan on the basis of the number of Common Shares certified by the nominee/record shareholder
as representing the total amount registered in such shareholder’s name and held for the account of beneficial owners who are to participate in the Plan. If a beneficial owner’s broker, bank or other nominee who is the record shareholder
for the beneficial owner’s Common Shares is not a Registered Common Shareholder (i.e., the Common Shares are not registered with the Agent), neither the nominee nor the beneficial owner will be a Participant under the Plan and have
Distributions automatically reinvested by the Agent (although the broker, bank or other nominee may offer other dividend reinvestment programs independent from this Plan). If a beneficial owner of Common Shares wishes to participate in the Plan, but
his or her broker, bank or other nominee is unable or unwilling to become a Registered Common Shareholder and a Participant on behalf of the beneficial owner, the beneficial owner may request that the broker, bank or other nominee arrange to have
all or a portion of his or her Common Shares re- registered with the Agent in the name of the beneficial owner, such that the beneficial owner becomes a Registered Common Shareholder and, as such, would be enrolled as a Participant in the Plan
unless he or she elects otherwise in accordance with the terms hereof. Participants whose Common Shares are registered in the name of one nominee firm may not be able to transfer the Common Shares to another nominee firm and continue to participate
in the Plan.
12. FEES. The Agent’s service fee for
handling Distributions will be paid by the Fund. Each Participant will be charged per share fees (currently $0.02 per share) on all open-market purchases. If a Participant elects to have the Agent sell part or all of his or her Common Shares and
remit the proceeds, such Participant will be charged per share fees (currently $0.02 per share). Per share fees include any applicable brokerage commissions the Agent is required to pay. The Participant will not be charged any other fees for this
service.
13. TERMINATION IN THE PLAN / NOTIFICATION OF
ELECTION TO RECEIVE CASH DISTRIBUTIONS. Each Registered Common Shareholder may elect to receive Distributions from a Fund in cash and, if a Participant in the Plan, to disenroll from and terminate his or her account under the Plan, by notifying the
Agent online at www.computershare.com/investor, by writing to the Agent at P.O. Box 43078 Providence, RI 02940-3078, by calling (866) 270-7788 or (413) 775-6091 or by completing and returning the transaction form attached to each Plan statement. Any
such written notification must be in proper order and duly executed by the Participant and any notification online or by telephone must be in accordance with such reasonable requirements as the Agent and the Fund may agree. If the Agent receives
your request to discontinue Distribution reinvestment on or after the record date for the Fund’s next Distribution, the Agent may either pay the Distribution in cash or reinvest it on the next investment date on the Registered Common
Shareholder’s behalf. If reinvested, the Agent may sell the Common Shares purchased and send the proceeds less any applicable fees. The Plan may be terminated for a Fund by the Agent or the Fund upon notice in writing mailed to each
Participant at least thirty (30) calendar days prior to the effective date of the termination. Upon any termination, the Agent will arrange to deposit all full Common Shares held for each Participant into his or her account, where they will be held
in book-entry by the Agent. A cash adjustment will be made for any fraction of a Common Share at the then current market value of the Common Shares to be delivered to him or her less any applicable fees. If preferred, a Participant may request the
sale of all full and fractional Common Shares held by the Agent in his or her Plan account in order to terminate participation in the Plan in accordance with
Section 9 hereof. If a Participant has terminated his or her
participation in the Plan but continues to have Common Shares registered in his or her name with the Agent, he or she may re-enroll in the Plan at any time by notifying the Agent online at www.computershare.com/investor, by writing to the Agent at
P.O. Box 43078 Providence, RI 02940-3078 or by calling (866) 270-7788 or (413) 775-6091.
VIRTUS CLOSED-END FUNDS
DIVIDEND REINVESTMENT PLAN (Unaudited) (Continued)
14.
AMENDMENT OF THE PLAN. These terms and conditions may be amended by the Agent or the Fund at any time but, except when necessary or appropriate to comply with applicable law or the rules or policies of the Securities and Exchange Commission or any
other regulatory authority, only by mailing to each Participant appropriate written notice at least thirty (30) calendar days prior to the effective date thereof. The amendment shall be deemed to be accepted by each Participant unless, prior to the
effective date thereof, the Agent receives notice of the termination of the Participant’s account under the Plan. Any such amendment may include an appointment by the Agent of a successor Agent, subject to the prior written approval of the
successor Agent by the Fund. Upon any such appointment of a successor Agent for the purpose of receiving distributions, the Fund will be authorized to pay to such successor Agent, for each Participant’s account, all Distributions payable on
Common Shares of the Fund held in the Participant’s name or under the Plan for retention or application by such successor Agent as provided in these terms and conditions.
15. APPLICABLE LAW. These terms and conditions shall be
governed by the laws of The Commonwealth of Massachusetts.
CONSIDERATION OF ADVISORY AND
SUBADVISORY AGREEMENTS
BY THE BOARD OF TRUSTEES (Unaudited)
The Board of Trustees (the
“Board”) of Virtus Artificial Intelligence & Technology Opportunities Fund (“AIO”), Virtus Convertible & Income Fund (“NCV”), Virtus Convertible & Income Fund II (“NCZ”), Virtus Diversified
Income & Convertible Fund (“ACV”), Virtus Dividend, Interest & Premium Strategy Fund (“NFJ”), and Virtus Equity & Convertible Income Fund (“NIE”) (each a “Fund” and, collectively, the
“Funds”) is responsible for determining whether to approve the continuation of each investment advisory agreement (each, an “Advisory Agreement” and collectively, the “Advisory Agreements”) between each Fund and
Virtus Investment Advisers, LLC (“VIA”) and each subadvisory agreement (each, a “Subadvisory Agreement” and collectively, the “Subadvisory Agreements”) (together with the Advisory Agreements, the
“Agreements”) among each Fund, VIA and Voya Investment Management Co. LLC (“Voya”), with respect to AIO, NCV, NCZ, ACV and NIE and among VIA, Voya and NFJ Investment Group, LLC (“NFJ Investment Group”) with
respect to NFJ (each of Voya and NFJ Investment Group, a “Subadviser” and collectively, the “Subadvisers”). At meetings held on August 27, 2024, October 29, 2024, and November 20, 2024 (collectively, the
“Meetings”), the Board, including a majority of the Trustees who are not interested persons of the Funds as defined in Section 2(a)(19) of the Investment Company Act of 1940, as amended (the “1940 Act” and such Trustees, the
“Independent Trustees”), considered and approved the continuation of each Agreement, as further discussed below.
In connection with the approval of the
Agreements, the Independent Trustees and independent legal counsel requested and evaluated information provided by VIA and each Subadviser which, in the Board’s view, constituted information necessary for the Board to form a judgment as to
whether the renewal of each Agreement would be in the best interests of each Fund and its respective shareholders. The Board also considered information furnished throughout the year at regular Board meetings with respect to the services provided by
VIA and the Subadvisers, including quarterly performance reports prepared by management containing reviews of investment results, and periodic presentations from each Subadviser with respect to the Funds it manages. The Board noted the affiliation
of NFJ Investment Group with VIA and any potential conflicts of interest.
The Board was separately advised by
independent legal counsel throughout the process. Prior to the Meetings, the Independent Trustees met with their independent legal counsel to evaluate information provided by management. For each Agreement, the Board considered each of the relevant
factors with respect to the applicable Fund and its shareholders. The Independent Trustees also submitted questions to management and considered the responses provided. In its deliberations, the Board considered various factors, including those
discussed below, none of which were controlling, and each Trustee may have attributed different weights to the various factors. The Independent Trustees also discussed the proposed approval of the Agreements in private sessions with their
independent legal counsel at which no representatives of VIA or the Subadvisers were present.
In considering whether to approve the
renewal of the Agreements with respect to each Fund, the Board reviewed and analyzed the factors it deemed relevant, including but not limited to: (a) the nature, extent and quality of the services provided to the Funds by VIA and each of the
Subadvisers; (b) the performance of the Funds as compared to an appropriate peer group and an appropriate index and comparable accounts; (c) the level and method of computing each Fund’s advisory and subadvisory fees, and comparisons of the
Funds’ advisory fee rates and total expenses with those of a group of funds with similar investment strategies; (d) the profitability of VIA under the Advisory Agreement; (e) any “fall-out” benefits to VIA, the Subadvisers and
their affiliates (i.e., ancillary benefits realized by VIA, the Subadvisers or their affiliates from VIA’s or the applicable Subadviser’s relationship with the Trust); (f) the anticipated effect of growth in size on each Fund’s
performance and expenses; (g) fees paid to VIA and the Subadvisers by comparable accounts, as applicable; (h) possible conflicts of interest; and (i) the terms of the Agreements.
Nature,
Extent and Quality of Services
In response to Independent Trustee request,
the Trustees received in advance of the Meetings information provided by VIA and each Subadviser, including completed questionnaires concerning a number of topics, including, among other items, such company’s investment philosophy, investment
process and strategies, resources and personnel, operations, compliance structure and procedures, and overall performance. In considering the Advisory Agreement with VIA, the Board considered that VIA is responsible for management of the
Funds’ investment programs and for evaluating and selecting subadvisers on an ongoing basis and making any recommendations to the Board regarding hiring, retaining, or replacing subadvisers, subject to shareholder approval. In considering the
Advisory Agreement with VIA, the Board considered VIA’s process for supervising and managing the Funds’ Subadvisers, including (a) VIA’s ability to select and monitor the Subadvisers; (b) each Adviser’s ability to provide the
services necessary to monitor each Subadviser’s compliance with the applicable Fund’s respective investment objective(s), policies and restrictions, as well as to provide other oversight activities,
CONSIDERATION OF ADVISORY AND
SUBADVISORY AGREEMENTS
BY THE BOARD OF TRUSTEES (Unaudited)
(Continued)
including with respect to Fund performance, monitoring of
each Fund’s discounts, distributions, and leverage levels and rates; and (c) VIA’s ability and willingness to identify instances in which a Subadviser should be replaced and to carry out the required changes. The Trustees also
considered: (a) the experience and capability of VIA’s management and other personnel; (b) the financial condition of VIA, and whether it had the financial wherewithal to provide a high level and quality of services to the Funds; (c) the
quality of VIA’s own regulatory and legal compliance policies, procedures and systems; (d) the nature, extent and quality of administrative and other services provided by VIA and its affiliates to the Funds; (e) VIA’s supervision of the
Funds’ other service providers; and (f) VIA’s risk management processes. It was noted that an affiliate of VIA serves as administrator to the Funds. The Board also took into account its knowledge of VIA’s management and the quality
of the performance of VIA’s duties to the Funds and other funds managed by VIA through Board meetings, discussions and reports during the preceding year, as well as information from the Funds’ Chief Compliance Officer regarding the
Funds’ compliance policies and procedures established pursuant to Rule 38a-1 under the 1940 Act.
With respect to the services provided by
each Subadviser, the Board considered information provided to the Board by each Subadviser, as well as information provided throughout the past year. With respect to the Subadvisory Agreements, the Board noted that each Subadviser provided portfolio
management, compliance with the respective Fund’s investment policies and procedures, and compliance with applicable securities laws and assurances thereof. The Board also noted that VIA’s and each subadviser’s management of the
respective Fund is subject to the oversight of the Board and must be carried out in accordance with the Fund’s investment objective, policies, and restrictions set forth in the Funds’ prospectuses and statements of additional
information. In considering the renewal of the Subadvisory Agreements, the Board also considered each Subadviser’s investment management process, including (a) the experience and capability of each Subadviser’s management and other
personnel committed by the Subadviser to the respective Fund; (b) the financial condition of the Subadviser; (c) the quality of the Subadviser’s regulatory and legal compliance policies, procedures and systems; and (d) the Subadviser’s
trading practices, including with respect to best execution and soft dollars. The Board also took into account each Subadviser’s risk assessment and monitoring process. The Board noted each Subadviser’s regulatory history, including
whether it was currently involved in any regulatory actions or investigations as well as any material litigation, and any settlements and amelioratory actions undertaken, as appropriate.
After considering all of the information
provided to them, the Trustees concluded that the nature, extent and quality of the services provided by VIA and each Subadviser were satisfactory and that there was a reasonable basis on which to conclude that each would continue to provide a high
quality of investment services to the applicable Fund(s).
Investment
Performance
The Board
considered performance reports and discussions at Board meetings throughout the year, as well as a report for the Funds prepared by Broadridge (the “Broadridge Report”), an independent third-party provider of investment company data,
furnished in connection with the contract renewal process. The Broadridge Report presented each Fund’s performance relative to a peer group of other closed-end funds (the “Performance Universe”) and relevant indexes, as selected by
Broadridge. The Board also considered performance information presented by management and took into account management’s discussion of the same, including the effect of market conditions on each Fund’s performance. The Board noted that
it also reviews on a quarterly basis detailed information about each Fund’s performance results and portfolio composition, as well as each Subadviser’s investment strategy(ies). The Board noted VIA’s expertise and resources in
monitoring the performance, investment style and risk-adjusted performance of the Subadvisers. The Board also took into account its discussions with management regarding factors that contributed to the performance of each Fund.
The Board considered, among other
performance data, the information set forth below with respect to the performance of each Fund for the stated periods ended March 31, 2024.
AIO.
The Board noted that the Fund outperformed the median of its Performance Universe for the first quarter and 3-year periods and underperformed the median of its Performance Universe for the 1-year period. The Board
also noted that the Fund outperformed its benchmark for the first quarter, 1- and 3-year periods.
NCV.
The Board noted that the Fund underperformed the median of its Performance Universe and underperformed its benchmark for the first quarter, 1-, 3-, 5- and 10-year periods.
NCZ
. The Board noted that the Fund underperformed the median of its Performance Universe and underperformed its benchmark for the first quarter, 1-, 3-, 5- and 10-year periods.
CONSIDERATION OF ADVISORY AND
SUBADVISORY AGREEMENTS
BY THE BOARD OF TRUSTEES (Unaudited)
(Continued)
ACV
. The Board noted that the Fund outperformed the median of its Performance Universe for the first quarter, 1-year and 5-year periods and underperformed the median of its Performance Universe for the 3-year period.
The Board also noted that the Fund underperformed its benchmark for the 3-year period and outperformed its benchmark for the first quarter, 1-year and 5-year periods.
NFJ
. The Board noted that the Fund underperformed the median of its Performance Universe for the first quarter, 1-, 3-, 5- and 10-year periods. The Board also noted that the Fund underperformed its benchmark for the
first quarter, 1-, 3-, 5- and 10-year periods.
NIE
. The Board noted that the Fund outperformed the median of its Performance Universe for the 5- year period, performed the same as the median of its Performance Universe for the 1- and 10-year periods, and
underperformed the median of its Performance Universe for the first quarter and 3-year periods. The Board also noted that the Fund underperformed its benchmark for the first quarter and 1-, 3-, 5- and 10-year periods.
The Board also considered management’s
discussion about the reasons for, or actions taken to address, each Fund’s underperformance, as applicable, relative to its Performance Universe or benchmark. The Board also considered that the Funds had changed subadvisers during several of
the performance periods shown, so that some of the performance shown was that of a prior subadviser. The Board also considered the distribution rates for each Fund relative to peers. After reviewing these and related factors, the Board concluded
that each Fund’s overall performance was satisfactory.
Management
Fees and Total Expenses
The
Board considered the fees charged to the Funds for advisory services as well as the total expense levels of the Funds. This information included comparisons of each Fund’s contractual and net management fee and net total expense level to those
of its peer universe (the “Expense Universe”) and ranked according to quintile (the first quintile being lowest and, therefore, best in these expense component rankings, and fifth being highest and, therefore, worst in these expense
component rankings). In comparing each Fund’s net management fee to that of comparable funds, the Board noted that in the materials presented by management such fee was comprised of advisory and administration fees. The Board also noted that
each Fund had an expense limitation agreement in place to limit the total expenses incurred by the Fund and its shareholders. The Board also noted that the subadvisory fees were paid by VIA out of its management fees rather than paid separately by
the Fund. In this regard, the Board took into account management’s discussion with respect to the advisory/subadvisory fee structure, including the amount of the advisory fee retained by VIA after payment of the subadvisory fee and the
services provided, respectively, by VIA and the Subadvisers. The Board also considered the fee rates payable by comparable accounts managed by each Subadviser. They also considered the capital structures for NCV and NCZ, respectively. With respect
to the fees and expenses related to each Fund’s use of leverage, the Board considered the conflicts of interest involved in the use of leverage by the Funds in that VIA’s advisory fee is based on the assets managed.
In addition to the foregoing, the Board
considered, among other data, the information set forth below with respect to each Fund’s fees and expenses. In each case, the Board took into account management’s discussion of the Fund’s expenses, including the type and size of
the Fund relative to the other funds in its Expense Universe.
AIO
. The Board considered that the Fund’s gross management fee was above the median of the Expense Universe and net total expenses after waivers were below the median of the Expense Universe. The Board also
considered that the Fund’s net management fee was in the 4th quintile of its Expense Universe and net total expenses were in the 1st quintile of its Expense Universe.
NCV
. The Board considered that the Fund’s gross management fee and net total expenses after waivers were equal to the median of the Expense Universe. The Board also considered that the Fund’s net management
fee was in the 2nd quintile of its Expense Universe and net total expenses were in the 3rd quintile of
its Expense Universe.
NCZ. The Board considered that the Fund’s gross management fee was above the median of the Expense Universe and net total expenses after waivers were below the median
of the Expense Universe. The Board also considered that the Fund’s net management fee was in the 2nd quintile of its Expense Universe and net total expenses were in the 2nd quintile of its Expense Universe.
ACV
. The Board considered that the Fund’s gross management fee was above the median of the Expense Universe and net total expenses after waivers were equal to the median of the Expense Universe. The Board also
considered that the Fund’s net management fee was in the 5th quintile of its Expense Universe and net total expenses were in the 3rd quintile of its Expense Universe.
CONSIDERATION OF ADVISORY AND
SUBADVISORY AGREEMENTS
BY THE BOARD OF TRUSTEES (Unaudited)
(Continued)
NFJ
. The Board considered that the Fund’s gross management fee was equal to the median of the Expense Universe and net total expenses after waivers were below the median of the Expense Universe. The Board also
considered that the Fund’s net management fee was in the 1st quintile of its Expense Universe and net total expenses were in the 1st quintile of its Expense Universe.
NIE
. The Board considered that the Fund’s gross management fee and net total expenses after waivers were below the median of the Expense Universe. The Board also considered that the Fund’s net management fee
was in the 2nd quintile of its Expense Universe and net total expenses were in the 1st quintile of its
Expense Universe.
Profitability
The Board also considered certain
information relating to profitability that had been provided by VIA. In this regard, the Board considered information regarding the overall profitability, as well as on a fund-by-fund basis, of VIA for its management of the Funds, as well as its
profits and those of its affiliates including NFJ Investment Group and the administrator. In addition to the fees paid to VIA and its affiliates, including the NFJ Investment Group and the administrator, the Board considered other benefits derived
by VIA or its affiliates from their relationships with the Funds. The Board reviewed the methodology used to allocate costs to the Funds, taking into account the fact that allocation methodologies are inherently subjective and various allocation
methodologies may each be reasonable while producing different results. The Board concluded that the profitability to VIA and its affiliates from each Fund was not excessive in light of the quality of the services rendered to the Funds by VIA and
its affiliates, and other factors considered.
In considering the profitability to the
Subadvisers in connection with their relationships to the Funds, the Board noted that the fees payable under the Subadvisory Agreements are paid by VIA out of the fees that VIA receives under the Advisory Agreements, and not by the Subadvisers. In
considering the reasonableness of the fee payable by VIA to the Subadvisers, the Board noted that, because NFJ Investment Group is an affiliate of VIA, such profitability might be directly or indirectly shared by VIA in addition, with respect to
Voya, the unaffiliated Subadviser, the Board relied on the ability of VIA to negotiate the Subadvisory Agreement and the fees thereunder at arm’s length.
Economies
of Scale
The Board received
and discussed information concerning whether the Adviser realizes economies of scale as the Funds’ assets grow.. The Board noted that expense limitation agreements were also in place for all of the Funds. The Board also took into account
management’s discussion of each Fund’s advisory fee and subadvisory fee structure. The Board also took into account the current sizes of the Funds. The Board noted that economies of scale may develop for certain funds as their assets
increase and their fixed fund-level expenses decline as a percentage of assets, but that closed-end funds such as the Funds typically do not have the ability to increase substantially their asset base as do open-end funds.
The Board also noted that VIA had agreed to
implement an extension of each Fund’s expense limitation agreement through January 31, 2026. The Board then concluded that, given the Funds’ closed-end structure, no changes to the Funds’ advisory and subadvisory fee structures
were necessary or advisable at this time. The Board agreed that it would be appropriate to monitor this matter in the event that the assets of the Funds were to increase substantially via a secondary or rights offering, capital appreciation,
reinvested dividends, the use of increased leverage or some other means, such as (but not limited to) at-the-market offerings.
Other
Factors
The Board considered
other benefits that may be realized by VIA, each Subadviser and their respective affiliates as a result of their relationships with the Funds. The Board noted that an affiliate of VIA provides administrative services to the Funds. The Board noted
management’s discussion of the fact that, while the NFJ Investment Group is an affiliate of VIA, there are no other direct benefits received by NFJ Investment Group or VIA in providing investment advisory services to NFJ, other than the fees
earned under the respective Agreement. The Board considered that there may be certain indirect or ancillary benefits which may accrue to VIA and its affiliates, including (but not limited to): (a) the ability to leverage relationships with service
providers to obtain more favorable terms or rates, (b) reputational benefits, (c) the receipt of research products and services acquired through commissions paid on portfolio transactions, and (d) the potential to attract other business.
CONSIDERATION OF ADVISORY AND
SUBADVISORY AGREEMENTS
BY THE BOARD OF TRUSTEES (Unaudited)
(Continued)
Conclusion
Based on all of the foregoing
considerations, the Board, including a majority of the Independent Trustees, determined that the continuation of each Agreement, as amended, was in the best interests of each applicable Fund and its respective shareholders. Accordingly, the Board,
and the Independent Trustees voting separately, approved the continuation of the Agreements, as amended, with respect to each Fund.
FUND MANAGEMENT TABLES
(Unaudited)
Information pertaining to the
Trustees/Directors and Officers of the Funds as of the date of the issuance of this report is set forth below. The address of each individual, unless otherwise noted, is c/o the respective Fund, One Financial Plaza, Hartford, CT 06103.
Independent Trustees(1)
Name,
Year of Birth,
Length of Time Served
and Number of
Portfolios in Fund
Complex Overseen by
Trustee |
Principal
Occupation(s) During Past 5 Years |
Other
Directorships Held by Trustee During Past 5 Years |
Burke,
Donald C.
YOB: 1960
Served Since:
2023 (AIO, NFJ and NIE)
2024 (NCV, NCZ and ACV)
100 Portfolios |
Private
investor (since 2009). Formerly, President and Chief Executive Officer, BlackRock U.S. Funds (2007 to 2009); Managing Director, BlackRock, Inc. (2006 to 2009); and Managing Director, Merrill Lynch Investment Managers (1990 to 2006). |
Director
(2014 to 2021), Duff & Phelps Utility and Corporate Bond Trust Inc.; Director (since 2011), Avista Corp. (energy company); Trustee (2010 to 2014), Goldman Sachs Fund Complex; and Director (2006 to 2010), BlackRock Luxembourg and Cayman Funds.
|
Cogan,
Sarah E.
YOB: 1956
Served Since:
2019 (all Funds)
97 Portfolios |
Retired
Partner, Simpson Thacher & Bartlett LLP (“STB”) (law firm) (since 2019); Director, Girl Scouts of Greater New York (since 2016); Trustee, Natural Resources Defense Council, Inc. (since 2013); and formerly, Partner, STB (1989 to
2018). |
Trustee
(since 2019), PIMCO Closed-End Funds* (30 portfolios). |
DeCotis,
Deborah A.
YOB: 1952
Served Since:
2011 (NCV, NCZ, NFJ and NIE)
2015 (ACV)
2019 (AIO)
97 Portfolios |
Director,
Cadre Holdings Inc. (since 2022); Advisory Director, Morgan Stanley & Co., Inc. (since 1996); Member, Circle Financial Group (since 2009); Member, Council on Foreign Relations (since 2013); and Trustee, Smith College (since 2017). Formerly,
Director, Watford Re (2017 to 2021); Co-Chair Special Projects Committee, Memorial Sloan Kettering (2005 to 2015); and Trustee, Stanford University (2010 to 2015). |
Trustee
(since 2011), PIMCO Closed-End Funds* (30 portfolios). |
Drummond,
F. Ford
YOB: 1962
Served Since:
2015 (NIE, NFJ, ACV, NCV and NCZ)
2019 (AIO)
97 Portfolios |
President
(since 1998), F.G. Drummond Ranches, Inc.; and Director (since 2015), Texas and Southwestern Cattle Raisers Association. Formerly, Chairman, Oklahoma Nature Conservancy (2019 to 2020); Trustee (since 2014), Frank Phillips Foundation; Trustee (since
2008), Oklahoma Nature Conservancy; Board Member (2006 to 2020) and Chairman (2016 to 2018), Oklahoma Water Resources Board; Director (1998 to 2008), The Cleveland Bank; and General Counsel (1998 to 2008), BMIHealth Plans (benefits administration).
|
Director
(since 2011), Bancfirst Corporation. |
FUND MANAGEMENT TABLES
(Unaudited) (Continued)
Name,
Year of Birth,
Length of Time Served
and Number of
Portfolios in Fund
Complex Overseen by
Trustee |
Principal
Occupation(s) During Past 5 Years |
Other
Directorships Held by Trustee During Past 5 Years |
McDaniel,
Connie D.
YOB: 1958
Served Since:
2023 (all Funds)
97 Portfolios |
Retired
(since 2013). Vice President, Chief of Internal Audit, Corporate Audit Department (2009 to 2013); Vice President Global Finance Transformation (2007 to 2009); and Vice President and Controller (1999 to 2007), The Coca-Cola Company. |
Director
(since 2019), Global Payments Inc.; Chairperson (since 2021), Governance & Nominating Committee, Global Payments Inc; Director (since 2021), North Florida Land Trust; Director (2014 to 2019), Total System Services, Inc.; Member (2011 to 2022)
and Chair (2014 to 2016), Georgia State University, Robinson College of Business Board of Advisors; and Trustee (2005 to 2017), RidgeWorth Funds. |
McNamara,
Geraldine M.
YOB: 1951
Served Since:
2023 (all Funds)
100 Portfolios |
Private
investor (since 2006); and Managing Director, U.S. Trust Company of New York (1982 to 2006). |
Director
(2003 to 2021), Duff & Phelps Utility and Corporate Bond Trust Inc. |
Walton,
R. Keith
YOB: 1964
Served Since:
2022 (AIO, NCV, ACV and NIE)
2023 (NCZ and NFJ)
97 Portfolios |
Senior
Adviser (since 2022), Brightwood Capital LLC; Venture and Operating Partner (2020 to 2021), Plexo Capital, LLC; Venture Partner (2019 to 2021) and Senior Adviser (2018 to 2019), Plexo, LLC; and Partner (since 2006), Global Infrastructure Partners.
Formerly, Managing Director (2020 to 2021), Lafayette Square Holding Company LLC; Senior Adviser (2018 to 2019), Vatic Labs, LLC; Executive Vice President, Strategy (2017 to 2019), Zero Mass Water, LLC; and Vice President, Strategy (2013 to 2017),
Arizona State University. |
Director
(since 2017), certain funds advised by Bessemer Investment Management LLC (9 portfolios); Director (2006 to 2019), Systematica Investments Limited Funds; Director (2006 to 2017), BlueCrest Capital Management Funds; and Trustee (2014 to 2017), AZ
Service. |
Zino,
Brian T.
YOB: 1952
Served Since: 2022 (all Funds)
97 Portfolios |
Retired.
Various roles at J. & W. Seligman & Co. Incorporated (1982 to 2009), including President (1994 to 2009). |
Trustee
(since 2011), Bentley University; Director (1986 to 2009) and President (1994 to 2009), J&W Seligman Co. Inc.; Director (1998 to 2009), Chairman (2002 to 2004) and Vice Chairman (2000 to 2002), ICI Mutual Insurance Company; and Member, Board of
Governors of ICI (1998 to 2008). |
*
PIMCO Closed-End Funds are not part of the Virtus’ Fund Complex: PCM Fund, Inc.; PIMCO Access Income Fund; PIMCO California Flexible Municipal Income Fund; PIMCO California Municipal Income Fund; PIMCO California Municipal Income Fund II;
PIMCO California Municipal Income Fund Ill; PIMCO Corporate & Income Strategy Fund; PIMCO Corporate & Income Opportunity Fund; PIMCO Dynamic Income Fund; PIMCO Dynamic Income Opportunities Fund; PIMCO Dynamic Income Strategy Fund; PIMCO
Flexible Credit Income Fund; PIMCO Flexible Emerging Markets Income Fund; PIMCO Flexible Municipal Income Fund; PIMCO Global StocksPLUS® & Income Fund; PIMCO High
Income Fund; PIMCO Income Strategy Fund; PIMCO Income Strategy Fund II; PIMCO Managed Accounts Trust (5 portfolios); PIMCO Municipal Income Fund; PIMCO Municipal Income Fund II; PIMCO Municipal Income Fund III; PIMCO New York Municipal Income Fund;
PIMCO New York Municipal Income Fund II; PIMCO New York Municipal Income Fund Ill; and PIMCO Strategic Income Fund, Inc.
FUND MANAGEMENT TABLES
(Unaudited) (Continued)
Interested Trustee
Name,
Year of Birth,
Length of Time Served
and Number of
Funds Overseen |
Principal
Occupation(s) During Past
5 Years |
Principal
Occupation(s) During Past 5 Years and
Other Directorships Held by Trustee |
Aylward,
George R.*
Trustee, President, and Chief Executive Officer
YOB: 1964
Served Since: 2021 (all Funds)
104 Portfolios |
Director,
President and Chief Executive Officer (since 2008), Virtus Investment Partners, Inc. and/or certain of its subsidiaries; and various senior officer positions with Virtus affiliates (since 2005). |
Director
(since 2023), Stone Harbor Investment Funds plc (12 sub-funds), Stone Harbor Global Funds plc (3 sub-funds) and Virtus Global Funds ICAV (8 sub-funds); Member (since 2021), Board of Governors of the Investment Company Institute; and Director (since
2013), Virtus Global Funds, plc (5 sub-funds). |
*Mr. Aylward is an “interested person,” as defined
in the 1940 Act, by reason of his position as President and Chief Executive Officer of Virtus Investment Partners, Inc. (“Virtus”), the ultimate parent company of the Adviser, and various positions with its affiliates, including the
Adviser.
(1) “Independent Trustees” are those Trustees who are not “interested persons”, (as defined in Section 2(a)(19)
of the 1940 (Act), and “Interested Trustees” are those Trustees who are “Interested Persons” of the Funds.
FUND MANAGEMENT TABLES
(Unaudited) (Continued)
Officers of the Trust Who Are Not Trustees
Name,
Address and
Year of Birth |
Position(s)
Held
with Trust and
Length of
Time Served |
Principal
Occupation(s) During Past 5 Years |
Batchelar,
Peter J.
YOB: 1970 |
Senior
Vice President (since 2021). |
Senior
Vice President, Product Development (since 2017), Vice President, Product Development (2008 to 2017), and various officer positions (since 2008), Virtus Investment Partners, Inc. and/or certain of its subsidiaries; various officer positions (since
2008) of various registered funds advised by subsidiaries of Virtus Investment Partners, Inc. |
Bradley,
W. Patrick
YOB: 1972 |
Executive
Vice President, Chief Financial Officer and Treasurer (since 2021). |
Executive
Vice President, Fund Services (since 2016), Senior Vice President, Fund Services (2010 to 2016) and various officer positions (since 2004), Virtus Investment Partners, Inc. and/or certain of its subsidiaries; Director (since 2023), Stone Harbor
Investment Funds plc and Stone Harbor Global Funds plc; Director (since 2019), Virtus Global Funds ICAV; Director (since 2013), Virtus Global Funds, plc; various officer positions (since 2006) of various registered funds advised by subsidiaries of
Virtus Investment Partners, Inc.; Member (since 2022), BNY Mellon Asset Servicing Client Advisory Board. |
Branigan,
Timothy
YOB: 1976 |
Vice
President and Fund Chief Compliance Officer (since 2022) and Assistant Vice President and Deputy Fund Chief Compliance Officer (March to May 2022). |
Various
officer positions (since 2019) of various registered funds advised by subsidiaries of Virtus Investment Partners, Inc. |
Fromm,
Jennifer
YOB: 1973 |
Vice
President, Counsel and Assistant Secretary (since 2024); Vice President, Chief Legal Officer, Counsel and Secretary (2022 to 2024) and Vice President and Assistant Secretary (2021 to 2022). |
Vice
President (since 2016) and Senior Counsel, Legal (since 2007) and various officer positions (since 2008), Virtus Investment Partners, Inc. and/or certain of its subsidiaries; and various officer positions (since 2008) of various registered funds
advised by subsidiaries of Virtus Investment Partners, Inc. |
Hackett,
Amy
YOB: 1968 |
Vice
President and Assistant Treasurer (since 2021). |
Vice
President (since 2010) and Assistant Vice President (2007 to 2010), Fund Services, Virtus Investment Partners, Inc. and/or certain of its subsidiaries; and various officer positions (since 2007) of various registered funds advised by subsidiaries
of Virtus Investment Partners, Inc. |
Krishnan,
Suneeta
YOB: 1965 |
Vice
President and Assistant Treasurer (since 2021). |
Vice
President (since 2017) and Assistant Treasurer (since 2007), Mutual Fund Administration, Virtus Investment Partners, Inc. and/or certain of its subsidiaries; and various officer positions (since 2009) of various registered funds advised by
subsidiaries of Virtus Investment Partners, Inc. |
Rahman,
Mahmood
YOB: 1967 |
Vice
President (since 2024); Assistant Vice President (2021 to 2024). |
Vice
President (since 2023), Tax Director (since 2020) and Assistant Vice President (2020 to 2023), Fund Administration, Virtus Investment Partners, Inc.; Vice President (since 2024) and Assistant Vice President (2021 to 2024) of various registered
funds advised by subsidiaries of Virtus Investment Partners, Inc.; and Assistant Treasurer and Tax Director, Grantham, Mayo, Van Otterloo & Co. LLC (2007 to 2019). |
Santoro,
Kathryn
YOB: 1974 |
Vice
President, Chief Legal Officer, Counsel and Secretary (since 2024). |
Vice
President and Senior Attorney (since 2024), Virtus Investment Partners, Inc.; and various officer positions (since 2024) of various registered funds advised by subsidiaries of Virtus Investment Partners, Inc. |
Short,
Julia R.
YOB: 1972 |
Senior
Vice President (since 2021). |
Senior
Vice President, Product Development (since 2017), Virtus Investment Partners, Inc. and/or certain of its subsidiaries; Senior Vice President (since 2017) of various registered funds advised by subsidiaries of Virtus Investment Partners, Inc.; and
Managing Director, Product Manager, RidgeWorth Investments (2004 to 2017). |
Smirl,
Richard W.
YOB: 1967 |
Executive
Vice President (since 2021). |
Chief
Operating Officer (since 2021), Virtus Investment Partners, Inc.; Executive Vice President (since 2021), Virtus Investment Partners, Inc. and/or certain of its subsidiaries; Executive Vice President (since 2021) of various registered funds advised
by subsidiaries of Virtus Investment Partners, Inc.; Chief Operating Officer (2018 to 2021), Russell Investments; Executive Director (Jan. to July 2018), State of Wisconsin Investment Board; and Partner and Chief Operating Officer (2004 to 2018),
William Blair Investment Management. |
Thaker,
Nikita K.
YOB: 1978 |
Vice
President, Controller and Assistant Treasurer (since 2021). |
Vice
President (since 2021) and Assistant Vice President (2016 to 2021), Mutual Fund Administration, Virtus Investment Partners, Inc. and/or certain of its subsidiaries; and various officer positions (since 2013) of various registered funds advised by
subsidiaries of Virtus Investment Partners, Inc. |
THIS PAGE
INTENTIONALLY BLANK.
Trustees
Connie D. McDaniel, Chair of
the Board of Trustees
George R. Aylward
Donald C. Burke
Sarah E. Cogan
Deborah A. DeCotis
F. Ford Drummond
Geraldine M. McNamara
R. Keith Walton
Brian T. Zino
Principal Officers
George R. Aylward, President
and Chief Executive Officer
Peter J. Batchelar, Senior Vice
President
W. Patrick
Bradley, Executive Vice President, Chief Financial Officer and Treasurer
Timothy Branigan, Vice
President and Fund Chief Compliance Officer
Kathryn L. Santoro, Vice
President, Chief Legal Officer, Counsel and Secretary
Julia R. Short,
Senior Vice President
Richard W. Smirl, Executive Vice President
Nikita Thaker, Vice President,
Controller and Assistant Treasurer
Investment Adviser
Virtus Investment Advisers, LLC.
One Financial Plaza
Hartford, CT 06103-2608
Administrator
Virtus Fund Services, LLC
One Financial Plaza
Hartford, CT 06103
Transfer Agent, Dividend Paying Agent and Registrar
Computershare Trust Company, N.A.
P.O. Box 43078
Providence, RI 02940-3078
Custodian
The Bank of New York
240 Greenwich Street
New York, NY 10286-1048
Legal Counsel
Dechert LLP
45 Fremont Street, 26th Floor
San Francisco, CA 94105
Independent Registered Public
Accounting Firm
PricewaterhouseCoopers LLP
2001 Market Street
Philadelphia, PA 19103-7042
How to Contact Us
| Shareholder Services
|
1-866-270-7788
|
| Website
|
Virtus.com
|
Computershare Investor Services
P. O. Box 43078
Providence, RI 02940-3078
For more information about Virtus Closed-End Funds,
please contact us at 1-866-270-7788 or closedendfunds@virtus.com, or visit Virtus.com.
| Item 1. |
Reports to Stockholders (cont.). |
| |
(a) |
The registrant, as of the end of the period covered by this report, has adopted a code of ethics that applies
to the registrant’s principal executive officer, principal financial officer, principal accounting officer or controller, or persons performing similar functions, regardless of whether these individuals are employed by the registrant or a third
party. |
| |
(c) |
There have been no amendments, during the period covered by this report, to a provision of the code of ethics
that applies to the registrant’s principal executive officer, principal financial officer, principal accounting officer or controller, or persons performing similar functions, regardless of whether these individuals are employed by the
registrant or a third party, and that relates to any element of the code of ethics described in Item 2(b) of the instructions for completion of Form N-CSR. |
| |
(d) |
The registrant has not granted any waivers, including an implicit waiver, from a provision of the code of
ethics that applies to the registrant’s principal executive officer, principal financial officer, principal accounting officer or controller, or persons performing similar functions, regardless of whether these individuals are employed by the
registrant or a third party, that relates to one or more of the items set forth in paragraph (b) of this item’s instructions. |
| |
(f) |
A copy of the Code of Ethics is filed as an Exhibit. |
| Item 3. |
Audit Committee Financial Expert. |
| |
(a)(1) |
The Registrant’s Board of Trustees has determined that the Registrant has an “audit committee
financial expert” serving on its Audit Committee. |
| |
(a)(2) |
As of the end of the period covered by the report, the Registrant’s Board of Trustees had determined that
each of Donald C. Burke and Brian T. Zino is qualified to serve as an audit committee financial expert serving on its audit committee and that each is “independent,” as defined by Item 3 of Form
N-CSR. |
| Item 4. |
Principal Accountant Fees and Services. |
Audit Fees
| |
(a) |
The aggregate fees billed for each of the last two fiscal years for professional services rendered by the
principal accountant for the audit of the registrant’s annual financial statements or services that are normally provided by the accountant in connection with statutory and regulatory filings or engagements for those fiscal years are $40,973
for 2025 and $43,588 for 2024. |
Audit-Related Fees
| |
(b) |
The aggregate fees billed in each of the last two fiscal years for assurance and related services by the
principal accountant that are reasonably related to the performance of the audit of the registrant’s financial statements and are not reported under paragraph (a) of this Item are $1,798 for 2025 and $2,914 for 2024. Such
audit-related fees include out of pocket expenses. |
Tax Fees
| |
(c) |
The aggregate fees billed in each of the last two fiscal years for professional services rendered by the
principal accountant for tax compliance, tax advice, and tax planning are $7,647 for 2025 and $10,604 for 2024. |
“Tax Fees” are those primarily associated with review of the Fund’s tax provision and qualification as a regulated investment
company (RIC) in connection with audits of the Fund’s financial statement, review of year-end distributions by the Fund to avoid excise tax for the Fund, periodic discussion with management on tax issues
affecting the Fund, and reviewing and signing the Fund’s federal income tax returns.
All Other Fees
| |
(d) |
The aggregate fees billed in each of the last two fiscal years for products and services provided by the
principal accountant, other than the services reported in paragraphs (a) through (c) of this Item are $0 for 2025 and $0 for 2024. |
| |
(e)(1) |
Disclose the audit committee’s pre-approval policies and
procedures described in paragraph (c)(7) of Rule 2-01 of Regulation S-X. |
| |
|
Virtus Dividend, Interest & Premium Strategy Fund (the “Fund”) Board has adopted policies
and procedures with regard to the pre-approval of services provided by PricewaterhouseCoopers LLP. Audit, audit-related and tax compliance services provided to the Fund on an annual basis require specific
pre-approval by the Audit Committee. The Audit Committee must also approve other non-audit services provided to the Fund and those
non-audit services provided to the Fund’s adviser(s) or any entity controlling, controlled by, or under common control with the Fund’s adviser(s) that relate directly to the operations and financial
reporting of the Fund. Certain of these non-audit services that the Audit Committee believes are a) consistent with the SEC’s auditor independence rules and b) routine and recurring services that will not
impair the independence of the independent auditors may be approved by the Audit Committee without consideration on a specific case-by-case basis (“general pre-approval”). |
| |
|
The Audit Committee has determined that the Chair of the Audit Committee may provide pre-approval for such services that meet the above requirements but are not included in the general pre-approval in the event such approval is sought between regularly
scheduled meetings. In any event, the Audit Committee is informed of, and ratifies, each service approved at the next regularly scheduled in-person Audit Committee meeting. |
| |
(e)(2) |
The percentage of services described in each of paragraphs (b) through (d) of this Item that were approved
by the audit committee pursuant to paragraph (c)(7)(i)(C) of Rule 2-01 of Regulation S-X are as follows: |
(b) 0%
(c) 0%
(d) N/A
| |
(f) |
The percentage of hours expended on the principal accountant’s engagement to audit the registrant’s
financial statements for the most recent fiscal year that were attributed to work performed by persons other than the principal accountant’s full-time, permanent employees was less than fifty percent. |
| |
(g) |
The aggregate non-audit fees billed by the registrant’s accountant
for services rendered to the registrant, and rendered to the registrant’s investment adviser (not including any sub-adviser whose role is primarily portfolio management and is subcontracted with or
overseen by another investment adviser), and any entity controlling, controlled by, or under common control with the adviser that provides ongoing services to the registrant for each of the last two fiscal years of the registrant was $7,647 for 2025
and $10,604 for 2024. |
| |
(h) |
The registrant’s audit committee of the board of directors has considered whether the provision of non-audit services that were rendered to the registrant’s investment adviser (not including any sub-adviser whose role is primarily portfolio management and is
subcontracted with or overseen by another investment adviser), and any entity controlling, controlled by, or under common control with the investment adviser that provides ongoing services to the registrant that were not pre-approved pursuant to paragraph (c)(7)(ii) of Rule 2-01 of Regulation S-X is compatible with maintaining the principal
accountant’s independence. |
| Item 5. |
Audit Committee of Listed Registrants. |
| |
(a) |
The registrant has a separately designated audit committee. |
From February 1, 2024 through February 29, 2024, the members of the audit committee included Donald C. Burke, Deborah A. DeCotis,
Connie McDaniel, and Brian T. Zino.
Effective February 27, 2024, Geraldine M. McNamara was appointed to join the audit committee.
Effective March 1, 2024 through the end of the reporting period, the members of the audit committee were Donald C. Burke, Deborah A.
DeCotis, Geraldine M. McNamara, and Brian T. Zino.
| (a) |
Schedule of Investments in securities of unaffiliated issuers as of the close of the reporting period is
included as part of the report to shareholders filed under Item 1(a) of this form. |
| Item 7. |
Financial Statements and Financial Highlights for Open-End
Management Investment Companies. |
| (a) |
Not applicable for Closed-End Management Investment Companies.
|
| (b) |
Not applicable for Closed-End Management Investment Companies.
|
| Item 8. |
Changes in and Disagreements with Accountants for Open-End
Management Investment Companies. |
Not applicable for Closed-End Management Investment
Companies.
| Item 9. |
Proxy Disclosures for Open-End Management Investment Companies.
|
Not applicable for Closed-End Management Investment Companies.
| Item 10. |
Remuneration Paid to Directors, Officers, and Others of Open-End
Management Investment Companies. |
Not applicable for Closed-End Management Investment
Companies.
| Item 11. |
Statement Regarding Basis for Approval of Investment Advisory Contract. |
The information required by this Item is included as part of the annual report to shareholders filed under Item 1 of this Form
N-CSR.
| Item 12. |
Disclosure of Proxy Voting Policies and Procedures for Closed-End
Management Investment Companies. |
The Fund has adopted a Policy Regarding Proxy Voting (the “Policy”) stating the
Fund’s intention to exercise stock ownership rights with respect to portfolio securities in a manner that is reasonably anticipated to further the best economic interests of shareholders of the Fund. The Fund or its voting delegates will
endeavor to analyze and vote all proxies that are likely to have financial implications, and where appropriate, to participate in corporate governance, shareholder proposals, management communications and legal proceedings. The Fund or its voting
delegates must also identify potential or actual conflicts of interest in voting proxies and must address any such conflict of interest in accordance with the Policy.
In the absence of a specific direction to the contrary from the Board, the Fund’s adviser or subadviser is responsible for voting proxies for the Fund,
or for delegating such responsibility to a qualified, independent organization engaged by the adviser or subadviser to vote proxies on its behalf. The applicable voting party will vote proxies in accordance with the Policy or its own policies and
procedures, which must be reasonably designed to further the best economic interests of the affected fund shareholders. Because the Policy and the applicable voting party’s policies and procedures used to vote proxies for the funds both are
designed to further the best economic interests of the affected fund shareholders, they are not expected to conflict with one another although the types of factors considered by the applicable voting party under its own policies and procedures may
be in addition to or different from the ones listed below for the Policy.
The Policy specifies the types of factors to be considered when analyzing and
voting proxies on certain issues when voting in accordance with the Policy, including, but not limited to:
| |
• |
|
Anti-takeover measures – the overall long-term financial performance of the target company relative to its
industry competition. |
| |
• |
|
Corporate Governance Matters – tax and economic benefits of changes in the state of incorporation; dilution
or improved accountability associated with changes in capital structure. |
| |
• |
|
Contested elections – the qualifications of all nominees; independence and attendance record of board and
key committee members; entrenchment devices in place that may reduce accountability. |
| |
• |
|
Stock Option and Other Management Compensation Issues—executive pay and spending on perquisites,
particularly in conjunction with sub-par performance and employee layoffs. |
| |
• |
|
Shareholder proposals – whether the proposal is likely to enhance or protect shareholder value; whether
identified issues are more appropriately or effectively addressed by legal or regulatory changes; whether the issuer has already appropriately addressed the identified issues; whether the proposal is unduly burdensome or prescriptive; whether the
issuer’s existing approach to the identified issues is comparable to industry best practice. |
The Fund and its voting delegates seek to avoid actual or perceived conflicts of interest of Fund
shareholders, on the one hand, and those of the adviser, subadviser, other voting delegate, or any affiliated person of the Fund, on the other hand.
Depending on the type and materiality, the Board or its delegates may take the following actions, among others, in addressing any material conflicts of
interest that arise with respect to voting (or directing voting delegates to vote): (i) rely on the recommendations of an established, independent third party proxy voting vendor; (ii) vote pursuant to the recommendation of the proposing
delegate; (iii) abstain; (iv) where two or more delegates provide conflicting requests, vote shares in proportion to the assets under management of each proposing delegate; (v) vote shares in the same proportion as the vote of all other
shareholders of such issuer; or (vi) the adviser may vote proxies where the subadviser has a direct conflict of interest. The Policy requires each adviser/subadviser that is a voting delegate to notify the Chief Compliance Officer of the Fund
(or, in the case of a subadviser, the Chief Compliance Officer of the adviser) of any actual or potential conflict of interest that is identified, and provide a recommended course of action for protecting the best interests of the Fund’s
shareholders. No adviser/subadviser or other voting delegate may waive any conflict of interest or vote any conflicted proxies without the prior written approval of the Board (or the Executive Committee thereof) or the Chief Compliance Officer of
the Fund.
The Policy further imposes certain record-keeping and reporting requirements on each adviser/subadviser or other voting delegate.
Information regarding how the Fund voted proxies relating to portfolio securities during the most recent 12-month
period ended September 30 will be available, no later than August 31 of each year, free of charge by calling, toll-free, 800.243.1574, or on the SEC’s Web site at www.sec.gov.
Following is information about the policies and procedures followed by each subadviser to the Fund in voting proxies for the Fund.
Voya Investment Management Co. LLC (“Voya Investment Management”)
Voya Investment Management has been delegated the authority to vote proxies for the Fund. Voya Investment Management has adopted proxy voting policies,
procedures and guidelines in an effort to ensure proxies are voted in the best interests of its clients and the value of the investment, and to address any real or perceived conflicts of interest in proxy voting. Proxies of the Fund will be voted
subject to Voya Investment Management’s policy. Voya Investment Management’s Proxy Committee oversees the implementation of Voya Investment Management’s proxy voting procedures and guidelines including potential conflicts of interest.
An independent proxy voting service has been retained to assist in the voting of Fund proxies through the provision of vote analysis, implementation and recordkeeping and disclosure services.
NFJ Investment Group, LLC (“NFJ Investment Group”)
NFJ has a Proxy Committee (“Proxy Committee”) that is responsible for establishing policies and procedures designed to enable NFJ to ethically and
effectively discharge its fiduciary obligation to vote all applicable proxies on behalf of all discretionary client accounts and funds. Annually (or more often as needed), the Proxy Committee will review, reaffirm and/or amend guidelines, strategies
and proxy policies for all client accounts, funds and product lines.
NFJ votes all shares per the NFJ Proxy Guidelines unless the client chooses custom
guidelines. In the case that a ballot item is not covered under the policy or is coded as case-by-case in NFJ’s guidelines, a research analyst or portfolio manager
will review the available information and will utilize such information, along with his knowledge of the company, to make a vote recommendation to the Proxy Committee. The Proxy Committee members consider the information and recommendation, and will
then vote on that ballot item. As reflected in the NFJ Proxy Policy, the Proxy Committee will affirmatively vote proxies for proposals that it deems to be in the best economic interest of its clients, as a whole, as shareholders and beneficiaries of
those actions.
Due to NFJ’s diverse client base, product lines, and affiliations, NFJ’s Proxy Committee may determine a potential conflict
exists in connection with a proxy vote based on applicable SEC guidelines. For these situations, the Committee will determine how to address the conflict and that may include voting strictly in accordance with policy and/or allowing the third party
service provider to vote in accordance with its guidelines. Additional conflicts of interests will be evaluated by the Committee on an individual basis. Although NFJ does its best to alleviate or diffuse known conflicts, there is no guarantee that
all situations have been or will be mitigated through proxy policy incorporation.
NFJ utilizes the services of Institutional Shareholder Services, Inc.
as its agent in the provision of certain administrative, clerical, functional recordkeeping, and support services related to NFJ’s proxy voting processes/ procedures, which include, but are not limited to:
(1) The collection of proxy material from its clients’ custodians;
(2) The facilitation of proxy voting, reconciliation, and disclosure, in accordance with NFJ’s Proxy Policy and the Proxy Committee’s direction;
and
(3) Recordkeeping and voting record retention.
A complete copy of NFJ’s current Proxy Voting Policies and Procedures may be obtained on NFJ’s website at http://www.nfjinv.com/.
| Item 13. |
Portfolio Managers of Closed-End Management Investment Companies.
|
(a)(1) Identification of Portfolio Manager(s) or Management Team Members and Description of Role of Portfolio Manager(s) or
Management Team Members
As of the date of filing this report, the following individuals have primary responsibility for the day-to-day implementation of the Virtus Dividend, Interest & Premium Strategy Fund (“NFJ” or the “Fund”):
Voya Investment Management
Justin M. Kass, CFA
Senior Managing Director, Chief Investment Officer, Co-Head of Income & Growth
Industry start date: 1998
Start date as fund Portfolio Manager:
2021
Justin Kass is chief investment officer, co-head of income and
growth at Voya Investment Management. He joined the firm following Voya’s integration of certain assets and teams comprising the substantial majority of Allianz Global Investors U.S. (“AllianzGI”) business, where he was a portfolio
manager, managing director, CIO and co-head of U.S. income and growth strategies with portfolio management, research and trading responsibilities for the income and growth strategies team. Prior to that at
AllianzGI, Mr. Kass held portfolio manager responsibilities for the U.S. convertible strategy and was a lead portfolio manager for the income and growth strategy since its inception. In that role, he was responsible for managing multiple closed-end and open-end mutual funds.
Mr. Kass earned a B.S. from the
University of California, Davis, and an M.B.A. from the UCLA Anderson School of Management. He is a CFA® charterholder.
Michael E. Yee
Managing Director, Lead Portfolio
Manager – Income & Growth
Industry start date: 1994
Start date as fund Portfolio Manager: 2022
Michael Yee is a
lead portfolio manager, income and growth at Voya Investment Management. He joined the firm following Voya’s integration of certain assets and teams comprising the substantial majority of Allianz Global Investors U.S. business, where he was a
portfolio manager and managing director with portfolio management, research and trading responsibilities for the income and growth strategies team. He also served as a lead portfolio manager for the income and growth strategy since inception and was
responsible for managing multiple closed-end and open-end mutual funds. Prior to that, Mr. Yee was an analyst for the global and systematic team with
responsibilities focused on U.S. large cap equity strategies and worked in global portfolio administration and client service. Previously, he was a financial consultant for Priority One Financial/Liberty Foundation.
Mr. Yee earned a B.S. from the University of California, San Diego, and an M.B.A. from San Diego State University.
Ethan Turner, CFA
Senior Vice President, Portfolio
Manager – Income & Growth
Industry start date: 2005
Start date as fund Portfolio Manager: 2023
Ethan Turner is a
portfolio manager, income and growth, at Voya Investment Management. Mr. Turner joined the firm following Voya’s integration of certain assets and teams comprising the substantial majority of Allianz Global Investors U.S.
(“AllianzGI”) business, where he was an analyst and vice president with research responsibilities for the income and growth strategies team. Prior to that at AllianzGI, he was a trading assistant. Prior to then, Mr. Turner was a lead
analyst covering the financial sector at Relational Investors and a financial analyst at Sunstone Hotel Investors.
Mr. Turner earned a B.S. from San
Diego State University and an M.B.A. from the Anderson School of Management at the University of California, Los Angeles. He is a CFA® charterholder.
NFJ Investment Group
John R. Mowrey, CFA
Executive Managing Director, Chief
Investment Officer, Senior Portfolio Manager/Analyst
Industry start date: 2007
Start date as fund Portfolio Manager: 2017
John Mowrey is an
executive managing director, senior portfolio manager/analyst, and chief investment officer of NFJ Investment Group, an affiliate of Virtus Investment Partners. Mr. Mowrey is responsible for the overall investment policy for all value equity
portfolios, hiring new talent, and building out the team’s investment capabilities.
Mr. Mowrey joined NFJ in 2007 and has been quoted and
featured in a number of national publications, including Barron’s, Kiplinger’s, and MarketWatch, and has been a featured guest on CNBC.
Mr. Mowrey earned a B.A. in political science from Rhodes College and an M.B.A. from Southern Methodist University. He is a Chartered Financial Analyst® (CFA®) charterholder.
R. Burns
McKinney, CFA
Managing Director, Senior Portfolio Manager/Analyst
Industry start date: 1996
Start date as fund Portfolio Manager:
2017
R. Burns McKinney is a managing director and senior portfolio manager/analyst with NFJ Investment Group, an affiliate of Virtus Investment Partners.
Prior to joining NFJ in 2006, Mr. McKinney was an equity analyst at Evergreen Investments, an investment-banking analyst at Alex. Brown &
Sons, a vice president in equity research at Merrill Lynch, and an equity analyst at Morgan Stanley. He has been quoted and featured in a number of national publications, including the Wall Street Journal and Barron’s, and has
been a featured guest on CNBC and Bloomberg TV.
Mr. McKinney earned a B.A. in economics from Dartmouth College and an M.B.A. from The Wharton
School, The University of Pennsylvania. He is a Chartered Financial Analyst® (CFA®) charterholder.
Thomas Oliver, CFA, CPA
Managing Director, Senior
Portfolio Manager/Analyst
Industry start date: 1995
Start date as fund Portfolio Manager: 2017
Thomas Oliver is a
managing director and senior portfolio manager/analyst with NFJ Investment Group, an affiliate of Virtus Investment Partners.
Prior to joining NFJ in
2005, Mr. Oliver was a manager of corporate reporting at Perot Systems and an auditor at Deloitte & Touche.
Mr. Oliver earned a B.B.A.
and an M.B.A. from the University of Texas. He is a Chartered Financial Analyst® (CFA®) charterholder and has his Certified Public
Accountant (CPA) designation.
Kris P. Marca, CFA
Director, Portfolio Manager/Research Analyst
Industry
start date: 2003
Start date as fund Portfolio Manager: 2021
Kris Marca is a director and portfolio manager/research analyst at NFJ Investment Group, an affiliate of Virtus Investment Partners.
Prior to joining NFJ in 2011, Mr. Marca was on the equity derivatives desk at HBK Capital Management.
Mr. Marca earned a B.A. in biology from the University of Texas and an M.B.A. from Texas Christian University. He is a Chartered Financial Analyst® (CFA®) charterholder.
(a) (2) Other Accounts Managed by Portfolio Managers and Potential Conflicts of Interest
There may be certain inherent conflicts of interest that arise in connection with the portfolio managers’ management of the Fund’s investments and
the investments of any other accounts they manage. Such conflicts could include the aggregation of orders for all accounts managed by a particular portfolio manager, the allocation of purchases across all such accounts, the allocation of IPOs and
any soft dollar arrangements that the subadviser may have in place that could benefit the Fund and/or such other accounts. The Board has adopted policies and procedures designed to address any such conflicts of interest to ensure that all
transactions are executed in the best interest of the Fund’s shareholders. Each subadviser is required to certify its compliance with these procedures on a quarterly basis. There have been no material compliance issues with respect to any of
these policies and procedures during the Fund’s most recent fiscal year. Additionally, there are no material conflicts of interest between the investment strategy of the Fund and the investment strategy of other accounts managed by the
portfolio managers since the portfolio managers generally manage funds and other accounts having similar investment strategies.
The following summarizes
information regarding each of the accounts, excluding the Fund, that were managed by the Portfolio Managers as of January 31, 2025 including accounts managed by a team, committee, or other group that includes the Portfolio Managers.
|
|
|
|
|
|
|
|
|
|
|
|
|
|
|
|
|
|
|
| Name of Portfolio
Manager or
Team Member |
|
Type of Accounts |
|
Total
No. of
Accounts
Managed |
|
|
Total
Assets
(in millions) |
|
|
No. of
Accounts
where
Advisory
Fee is Based
on
Performance |
|
|
Total Assets
in Accounts
where
Advisory Fee
is Based on
Performance
(in millions) |
|
| Justin M. Kass |
|
Registered Investment Companies: |
|
|
8 |
|
|
$ |
9,375 |
|
|
|
0 |
|
|
|
0 |
|
|
|
Other Pooled Investment Vehicles: |
|
|
11 |
|
|
|
58,884 |
|
|
|
0 |
|
|
|
0 |
|
|
|
Other Accounts: |
|
|
7 |
|
|
|
1,570 |
|
|
|
0 |
|
|
|
0 |
|
| Michael E. Yee |
|
Registered Investment Companies: |
|
|
7 |
|
|
|
8,494 |
|
|
|
0 |
|
|
|
0 |
|
|
|
Other Pooled Investment Vehicles: |
|
|
8 |
|
|
|
55,419 |
|
|
|
0 |
|
|
|
0 |
|
|
|
Other Accounts: |
|
|
6 |
|
|
|
1,518 |
|
|
|
0 |
|
|
|
0 |
|
| Ethan Turner |
|
Registered Investment Companies: |
|
|
8 |
|
|
|
9,375 |
|
|
|
0 |
|
|
|
0 |
|
|
|
Other Pooled Investment Vehicles: |
|
|
1 |
|
|
|
57 |
|
|
|
0 |
|
|
|
0 |
|
|
|
Other Accounts: |
|
|
4 |
|
|
|
1,118 |
|
|
|
0 |
|
|
|
0 |
|
| John R. Mowrey |
|
Registered Investment Companies: |
|
|
5 |
|
|
|
1,652 |
|
|
|
0 |
|
|
|
0 |
|
|
|
Other Pooled Investment Vehicles: |
|
|
1 |
|
|
|
1,098 |
|
|
|
0 |
|
|
|
0 |
|
|
|
Other Accounts: |
|
|
46 |
|
|
|
2,610 |
|
|
|
0 |
|
|
|
0 |
|
| R. Burns McKinney |
|
Registered Investment Companies: |
|
|
4 |
|
|
|
955 |
|
|
|
0 |
|
|
|
0 |
|
|
|
Other Pooled Investment Vehicles: |
|
|
1 |
|
|
|
1,098 |
|
|
|
0 |
|
|
|
0 |
|
|
|
Other Accounts: |
|
|
34 |
|
|
|
2,262 |
|
|
|
0 |
|
|
|
0 |
|
| Thomas Oliver |
|
Registered Investment Companies: |
|
|
3 |
|
|
|
891 |
|
|
|
0 |
|
|
|
0 |
|
|
|
Other Pooled Investment Vehicles: |
|
|
1 |
|
|
|
1,098 |
|
|
|
0 |
|
|
|
0 |
|
|
|
Other Accounts: |
|
|
42 |
|
|
|
2,392 |
|
|
|
0 |
|
|
|
0 |
|
| Kris Marca |
|
Registered Investment Companies: |
|
|
2 |
|
|
|
1,000 |
|
|
|
0 |
|
|
|
0 |
|
|
|
Other Pooled Investment Vehicles: |
|
|
1 |
|
|
|
1,098 |
|
|
|
0 |
|
|
|
0 |
|
|
|
Other Accounts: |
|
|
21 |
|
|
|
972 |
|
|
|
0 |
|
|
|
0 |
|
(a)(3) Compensation Structure of Portfolio Manager(s) or Management Team Members
As of January 31, 2025, the following explains the compensation structure of each individual employed by Voya Investment Management and NFJ Investment
Group who share primary responsibility for day-to-day portfolio management of the Fund:
Compensation Structure for Voya Investment Management (“Voya IM”)
The compensation system for investment professionals with Voya IM is based on base salary, performance bonus, and equity or equity-like incentives or other
long-term retention programs.
Voya IM realize that its success is largely dependent on its ability to attract and retain key investment professionals.
Voya IM’s compensation philosophy is to align compensation closely with performance and to leverage the variable side of the compensation equation. Annually, the firm participates in comprehensive industry surveys and compares the relevant data
to ensure that its compensation plans remain competitive.
Key investment professionals such as portfolio managers and traders are paid competitive base
salaries, are eligible for discretionary bonuses and generally participate in the firm’s long-term compensation program. Portfolio managers of private funds may be eligible for carried interest allocations.
Bonus Program. The overall design of the annual incentive plan for investment professionals was developed to tie pay to both portfolio performance and
profitability and is structured to drive performance and promote retention of top talent. Individual bonus target awards are based on external market data and internal comparators. Investment performance is measured on both relative and absolute
performance in all areas, and performance goals are set to appropriately reflect requirements for the investment team. The results for overall Voya IM include a review of firm profitability, team performance and the investment professional’s
individual performance, all of which influence the outcome of the discretionary bonus award recommendation process. The measures for each team are reviewed annually by the firm’s executive management, and include the measures of investment
performance versus benchmark and peer groups over one-, three- and five-year periods, as well as contributions to the firm’s revenue growth and profitability.
Discretionary bonuses for non-investment professionals are structured similarly. The annual incentive bonus may be
subject to deferral into a long-term compensation plan, as determined by the plan in effect at the time of payment.
The annual incentive bonus may be
subject to deferral into a long-term compensation plan, as determined by the plan in effect at the time of payment.
Compensation Structure for NFJ Investment Group
Virtus and certain of its affiliated investment management firms, including NFJ Investment Group (collectively, “Virtus”), believe that the
firm’s compensation program is adequate and competitive to attract and retain high-caliber investment professionals. Investment professionals at Virtus receive a competitive base salary, an incentive bonus opportunity and a benefits package.
Certain professionals who supervise and manage others also participate in a management incentive program reflecting their personal contribution and team performance. Certain key individuals also have the opportunity to take advantage of a long-term
incentive compensation program, including potential awards of Virtus restricted stock units (“Virtus RSUs”) with multi-year vesting, subject to Virtus board of directors’ approval.
Following is a more detailed description of Virtus’ compensation structure.
Base Salary. Each portfolio manager is paid a fixed base salary, which is designed to be competitive in light of the individual’s experience and
responsibilities. Base salary is determined using compensation survey results of investment industry compensation conducted by an independent third party in evaluating competitive market compensation for its investment management professionals.
Incentive Bonus. Annual incentive payments are based on targeted compensation levels, adjusted based on profitability, investment performance factors
and a subjective assessment of contribution to the team effort. The short-term incentive payment is generally paid in cash, but a portion may be made in Virtus RSUs and mutual fund investments that appreciate or depreciate in value based on the
returns of one or more mutual funds managed by the investment professional. Individual payments are assessed using comparisons of actual investment performance with specific peer group or index measures. (Current benchmarks and/or peer groups are
indicated in the table below.) Performance of the Funds managed is generally measured over one-, three- and five-year periods and an individual manager’s participation is based on the performance of each
Fund/account managed.
While portfolio manager compensation contains a performance component, this component is adjusted to reward investment personnel
for managing within the stated framework and for not taking unnecessary risk. This approach ensures that investment management personnel remain focused on managing and acquiring securities that correspond to a Fund’s mandate and risk profile
and are discouraged from taking on more risk and unnecessary exposure to chase performance for personal gain. We believe we have appropriate controls in place to handle any potential conflicts that may result from a substantial portion of portfolio
manager compensation being tied to performance.
Other Benefits. Portfolio managers are also eligible to participate in broad-based plans offered
generally to employees of Virtus and its affiliates, including 401(k), health and other employee benefit plans.
(a)(4) Disclosure of Securities Ownership
The following summarizes the dollar range of securities each portfolio manager beneficially owned of the Fund as of January 31, 2025.
Virtus Dividend, Interest & Premium Strategy Fund
|
|
|
| Portfolio Manager |
|
Fund Ownership |
| Michael Yee |
|
None |
| Justin Kass |
|
None |
| Ethan Turner |
|
None |
| John R. Mowrey |
|
$10,000-15,000 |
| Thomas Oliver |
|
$50,001-100,000 |
| R. Burns McKinney |
|
None |
| Kris Marca |
|
None |
| Item 14. |
Purchases of Equity Securities by Closed-End Management Investment
Company and Affiliated Purchasers. |
Not Applicable.
| Item 15. |
Submission of Matters to a Vote of Security Holders. |
There have been no material changes to the procedures by which the shareholders may recommend nominees to the registrant’s board of directors, where those
changes were implemented after the registrant last provided disclosure in response to the requirements of Item 407(c)(2)(iv) of Regulation S-K (17 CFR 229.407) (as required by Item 22(b)(15) of Schedule 14A
(17 CFR 240.14a-101)), or this Item.
| Item 16. |
Controls and Procedures. |
| |
(a) |
The registrant’s principal executive and principal financial officers, or persons performing similar
functions, have concluded that the registrant’s disclosure controls and procedures (as defined in Rule 30a-3(c) under the Investment Company Act of 1940, as amended (the “1940 Act”) (17 CFR 270.30a-3(c))) are effective, as of a date within 90 days of the filing date of the report that includes the disclosure required by this paragraph, based on their evaluation of these controls and procedures required
by Rule 30a-3(b) under the 1940 Act (17 CFR 270.30a-3(b)) and Rules 13a-15(b) or
15d-15(b) under the Securities Exchange Act of 1934, as amended (17 CFR 240.13a-15(b) or 240.15d-15(b)). |
| |
(b) |
There were no changes in the registrant’s internal control over financial reporting (as defined in Rule 30a-3(d) under the 1940 Act (17 CFR 270.30a-3(d))) that occurred during the period covered by this report that has materially affected, or is reasonably likely to materially
affect, the registrant’s internal control over financial reporting. |
| Item 17. |
Disclosure of Securities Lending Activities for Closed-End
Management Investment Companies. |
Not applicable.
| Item 18. |
Recovery of Erroneously Awarded Compensation. |
Not Applicable.
| |
(a)(4) |
There were no written solicitations to purchase securities under Rule
23c-1 under the Act sent or given during the period covered by the report by or on behalf of the Registrant to 10 or more persons. |
| |
(a)(5) |
There was no change in the Registrant’s independent public accountant during the period covered by the
report. |
SIGNATURES
Pursuant to the requirements of the Securities Exchange Act of 1934 and the Investment Company Act of 1940, the registrant has duly caused this report to be
signed on its behalf by the undersigned, thereunto duly authorized.
(Registrant) Virtus Dividend, Interest & Premium Strategy Fund
|
|
|
| By (Signature and Title)* |
|
/s/ George R. Aylward |
|
|
George R. Aylward, President and Chief Executive Officer |
|
|
(principal executive officer) |
Date 4/10/2025
Pursuant to the
requirements of the Securities Exchange Act of 1934 and the Investment Company Act of 1940, this report has been signed below by the following persons on behalf of the registrant and in the capacities and on the dates indicated.
|
|
|
| By (Signature and Title)* |
|
/s/ George R. Aylward |
|
|
George R. Aylward, President and Chief Executive Officer |
|
|
(principal executive officer) |
Date 4/10/2025
|
|
|
| By (Signature and Title)* |
|
/s/ W. Patrick Bradley |
|
|
W. Patrick Bradley, Executive Vice President, |
|
|
Chief Financial Officer, and Treasurer |
|
|
(principal financial officer) |
Date 4/10/2025
| * |
Print the name and title of each signing officer under his or her signature. |