1 Earnings Presentation 3Q 2025
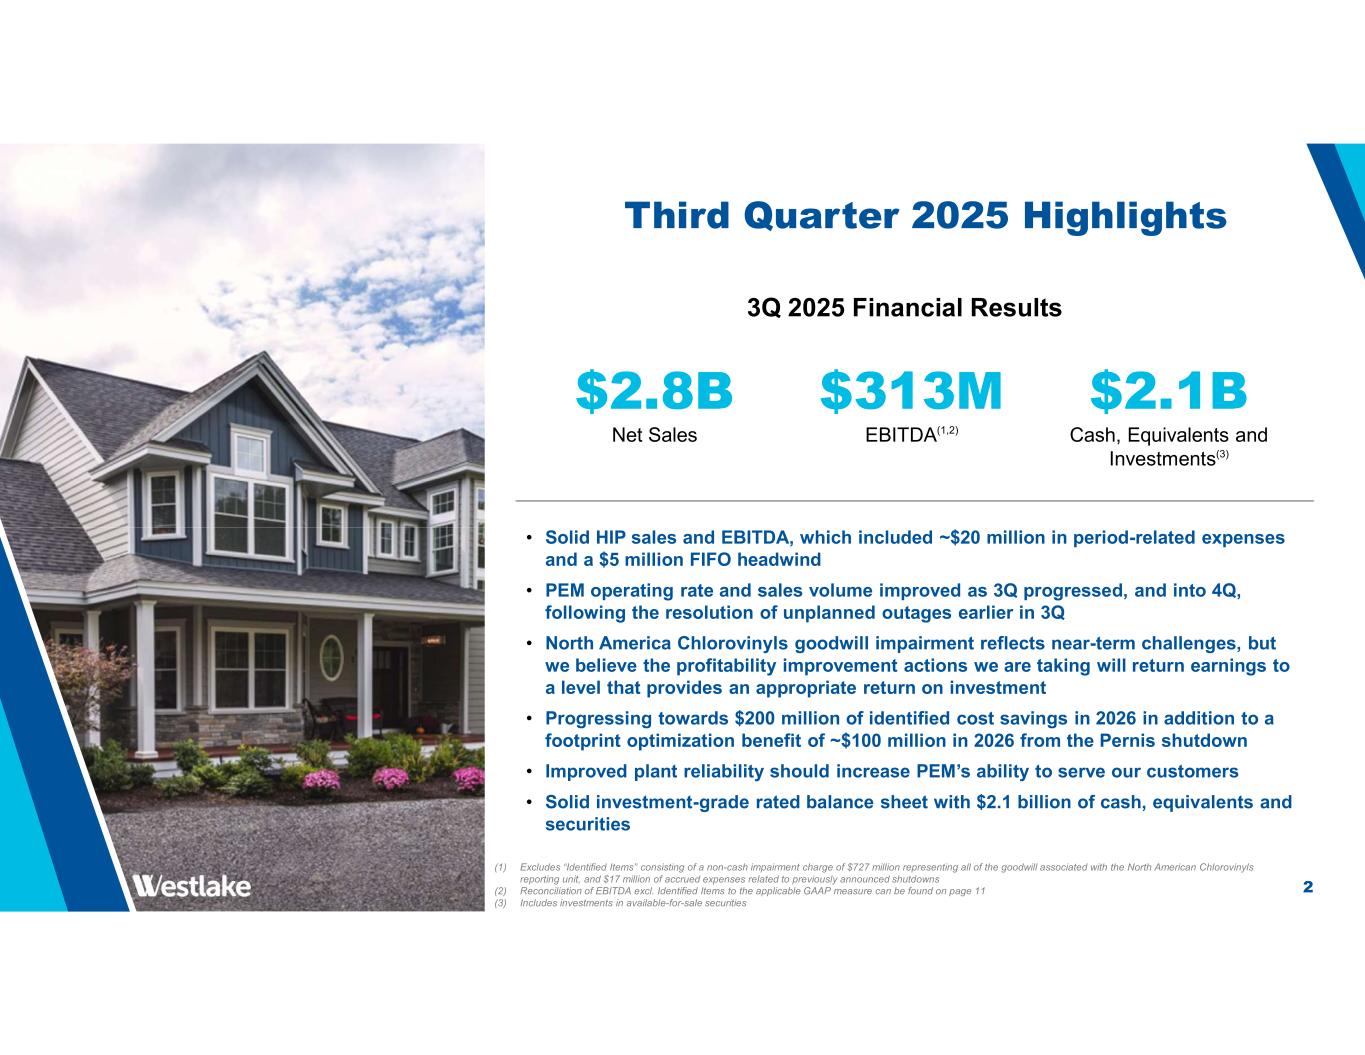
2 Third Quarter 2025 Highlights • Solid HIP sales and EBITDA, which included ~$20 million in period-related expenses and a $5 million FIFO headwind • PEM operating rate and sales volume improved as 3Q progressed, and into 4Q, following the resolution of unplanned outages earlier in 3Q • North America Chlorovinyls goodwill impairment reflects near-term challenges, but we believe the profitability improvement actions we are taking will return earnings to a level that provides an appropriate return on investment • Progressing towards $200 million of identified cost savings in 2026 in addition to a footprint optimization benefit of ~$100 million in 2026 from the Pernis shutdown • Improved plant reliability should increase PEM’s ability to serve our customers • Solid investment-grade rated balance sheet with $2.1 billion of cash, equivalents and securities (1) Excludes “Identified Items” consisting of a non-cash impairment charge of $727 million representing all of the goodwill associated with the North American Chlorovinyls reporting unit, and $17 million of accrued expenses related to previously announced shutdowns (2) Reconciliation of EBITDA excl. Identified Items to the applicable GAAP measure can be found on page 11 (3) Includes investments in available-for-sale securities 3Q 2025 Financial Results $313M EBITDA(1,2) $2.8B Net Sales $2.1B Cash, Equivalents and Investments(3)
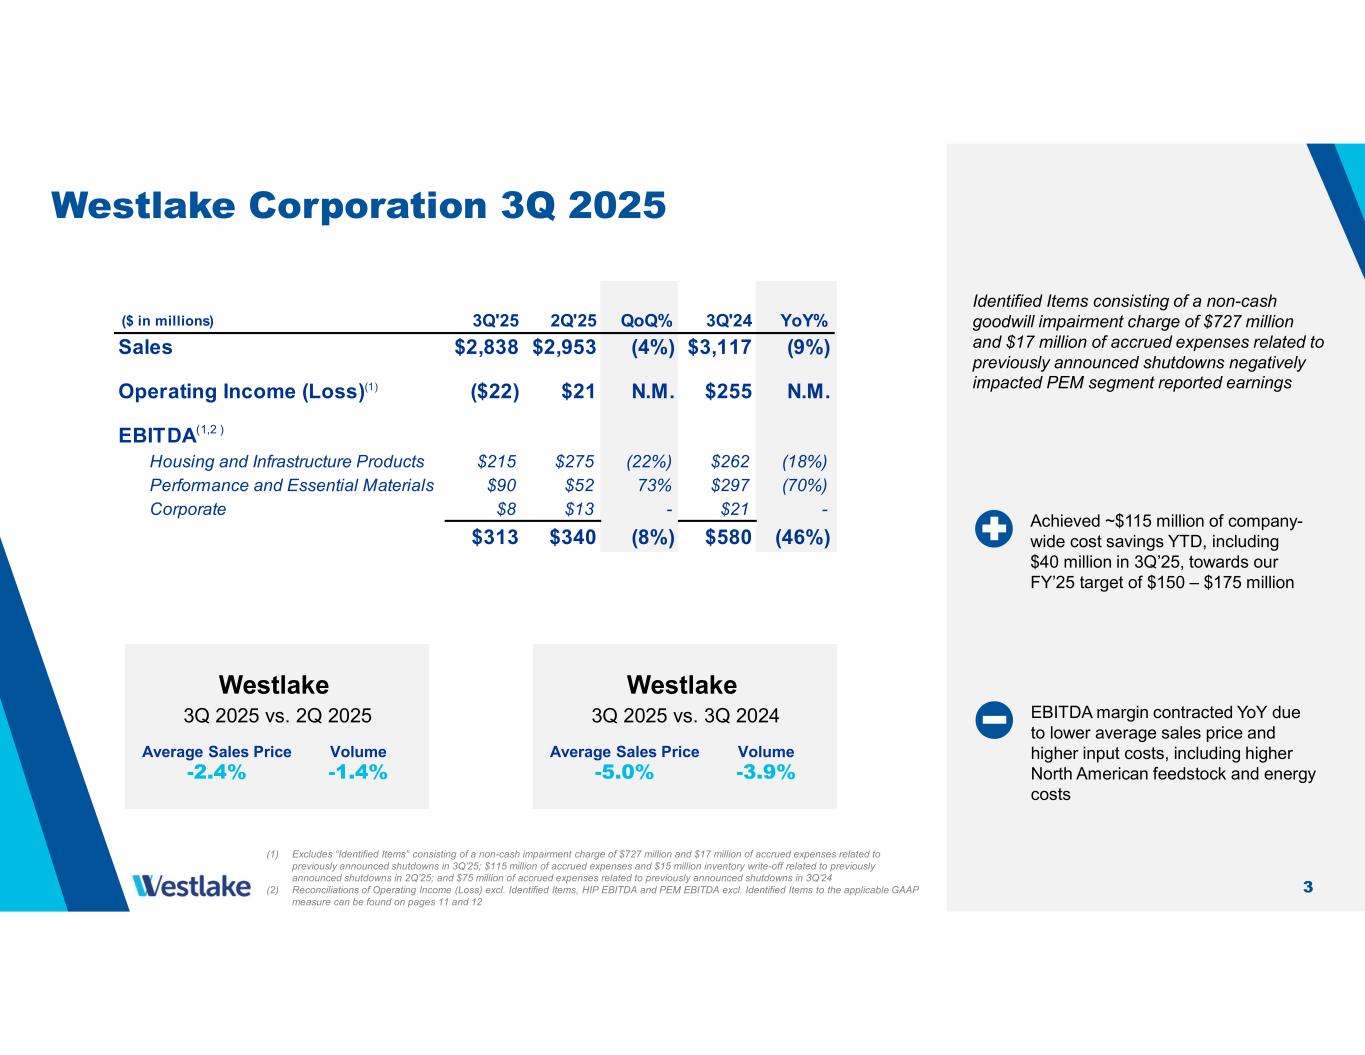
3 Westlake Corporation 3Q 2025 Identified Items consisting of a non-cash goodwill impairment charge of $727 million and $17 million of accrued expenses related to previously announced shutdowns negatively impacted PEM segment reported earnings Westlake 3Q 2025 vs. 2Q 2025 Average Sales Price -2.4% Volume -1.4% Westlake 3Q 2025 vs. 3Q 2024 Average Sales Price -5.0% Volume -3.9% (1) Excludes “Identified Items” consisting of a non-cash impairment charge of $727 million and $17 million of accrued expenses related to previously announced shutdowns in 3Q’25; $115 million of accrued expenses and $15 million inventory write-off related to previously announced shutdowns in 2Q’25; and $75 million of accrued expenses related to previously announced shutdowns in 3Q’24 (2) Reconciliations of Operating Income (Loss) excl. Identified Items, HIP EBITDA and PEM EBITDA excl. Identified Items to the applicable GAAP measure can be found on pages 11 and 12 Achieved ~$115 million of company- wide cost savings YTD, including $40 million in 3Q’25, towards our FY’25 target of $150 – $175 million 3Q'25 2Q'25 QoQ% 3Q'24 YoY% $2,838 $2,953 (4%) $3,117 (9%) ($22) $21 N.M. $255 N.M. Housing and Infrastructure Products $215 $275 (22%) $262 (18%) Performance and Essential Materials $90 $52 73% $297 (70%) Corporate $8 $13 - $21 - $313 $340 (8%) $580 (46%) Operating Income (Loss)(1) Sales EBITDA(1,2 ) ($ in millions) EBITDA margin contracted YoY due to lower average sales price and higher input costs, including higher North American feedstock and energy costs
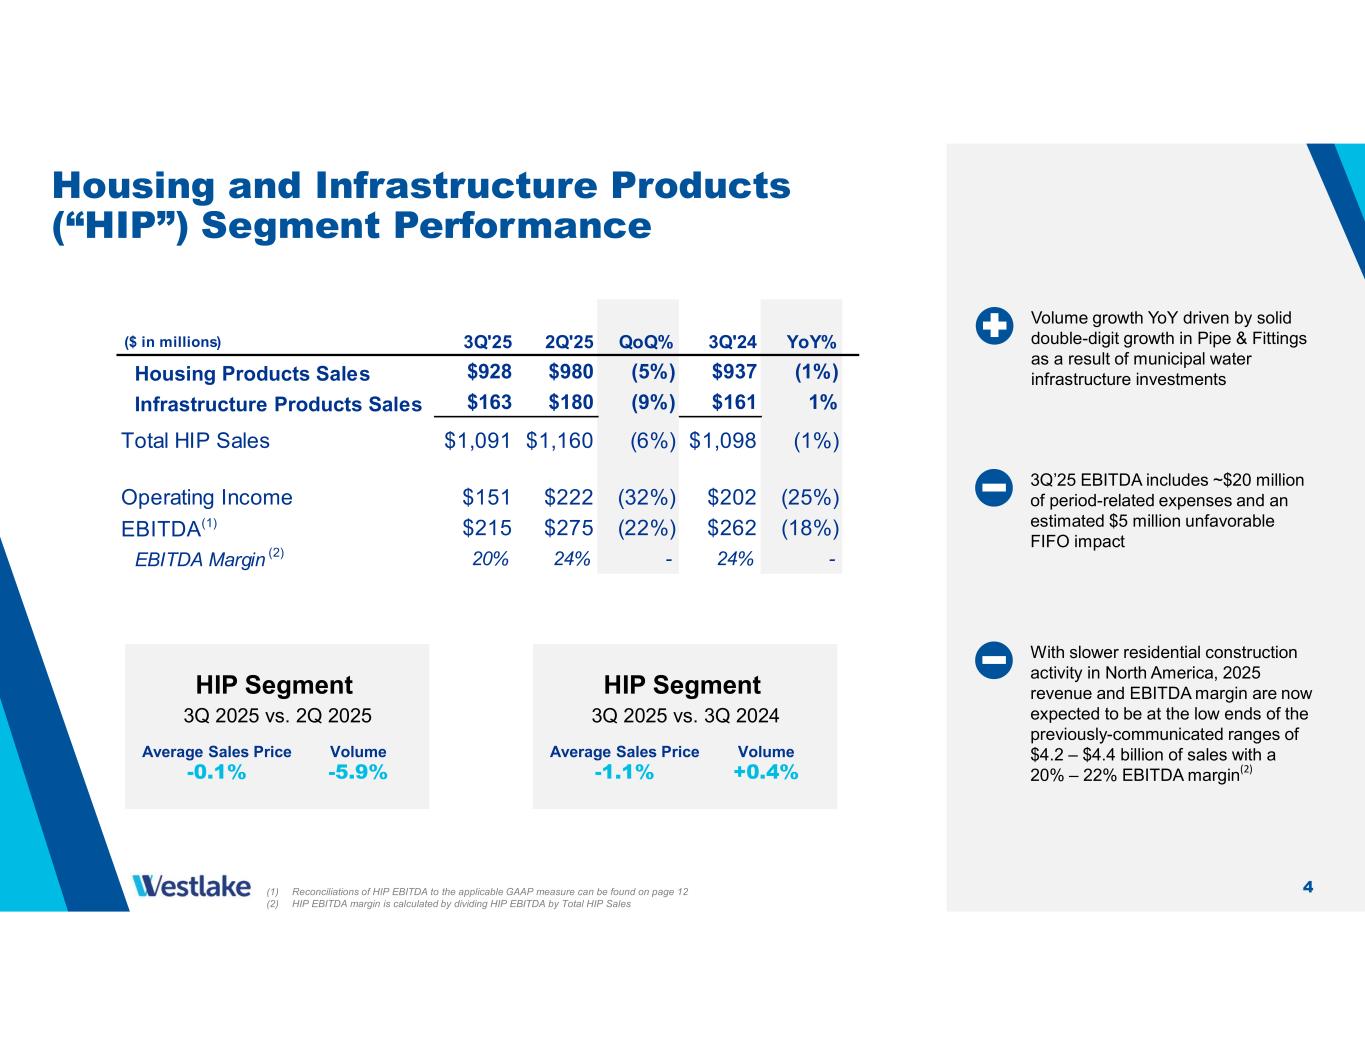
4 Housing and Infrastructure Products (“HIP”) Segment Performance HIP Segment 3Q 2025 vs. 2Q 2025 Average Sales Price -0.1% Volume -5.9% HIP Segment 3Q 2025 vs. 3Q 2024 Average Sales Price -1.1% Volume +0.4% 3Q’25 EBITDA includes ~$20 million of period-related expenses and an estimated $5 million unfavorable FIFO impact (1) Reconciliations of HIP EBITDA to the applicable GAAP measure can be found on page 12 (2) HIP EBITDA margin is calculated by dividing HIP EBITDA by Total HIP Sales Volume growth YoY driven by solid double-digit growth in Pipe & Fittings as a result of municipal water infrastructure investments 3Q'25 2Q'25 QoQ% 3Q'24 YoY% Housing Products Sales $928 $980 (5%) $937 (1%) Infrastructure Products Sales $163 $180 (9%) $161 1% Total HIP Sales $1,091 $1,160 (6%) $1,098 (1%) Operating Income $151 $222 (32%) $202 (25%) EBITDA(1) $215 $275 (22%) $262 (18%) EBITDA Margin (2) 20% 24% - 24% - ($ in millions) With slower residential construction activity in North America, 2025 revenue and EBITDA margin are now expected to be at the low ends of the previously-communicated ranges of $4.2 – $4.4 billion of sales with a 20% – 22% EBITDA margin(2)
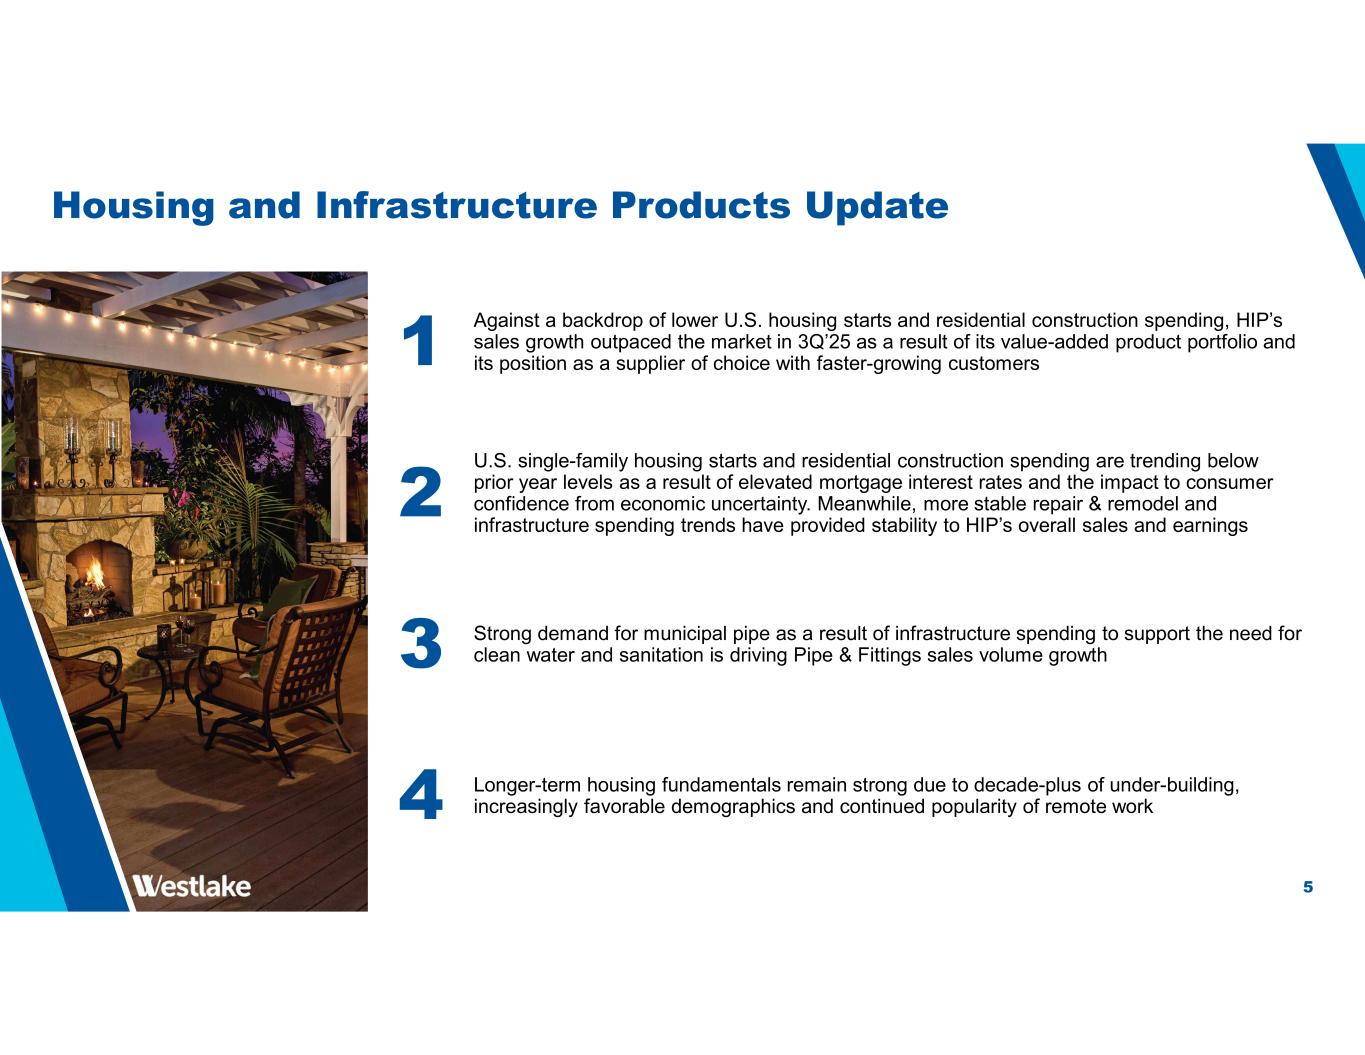
5 Housing and Infrastructure Products Update 2 U.S. single-family housing starts and residential construction spending are trending below prior year levels as a result of elevated mortgage interest rates and the impact to consumer confidence from economic uncertainty. Meanwhile, more stable repair & remodel and infrastructure spending trends have provided stability to HIP’s overall sales and earnings 3 Strong demand for municipal pipe as a result of infrastructure spending to support the need for clean water and sanitation is driving Pipe & Fittings sales volume growth 4 Longer-term housing fundamentals remain strong due to decade-plus of under-building, increasingly favorable demographics and continued popularity of remote work 1 Against a backdrop of lower U.S. housing starts and residential construction spending, HIP’s sales growth outpaced the market in 3Q’25 as a result of its value-added product portfolio and its position as a supplier of choice with faster-growing customers
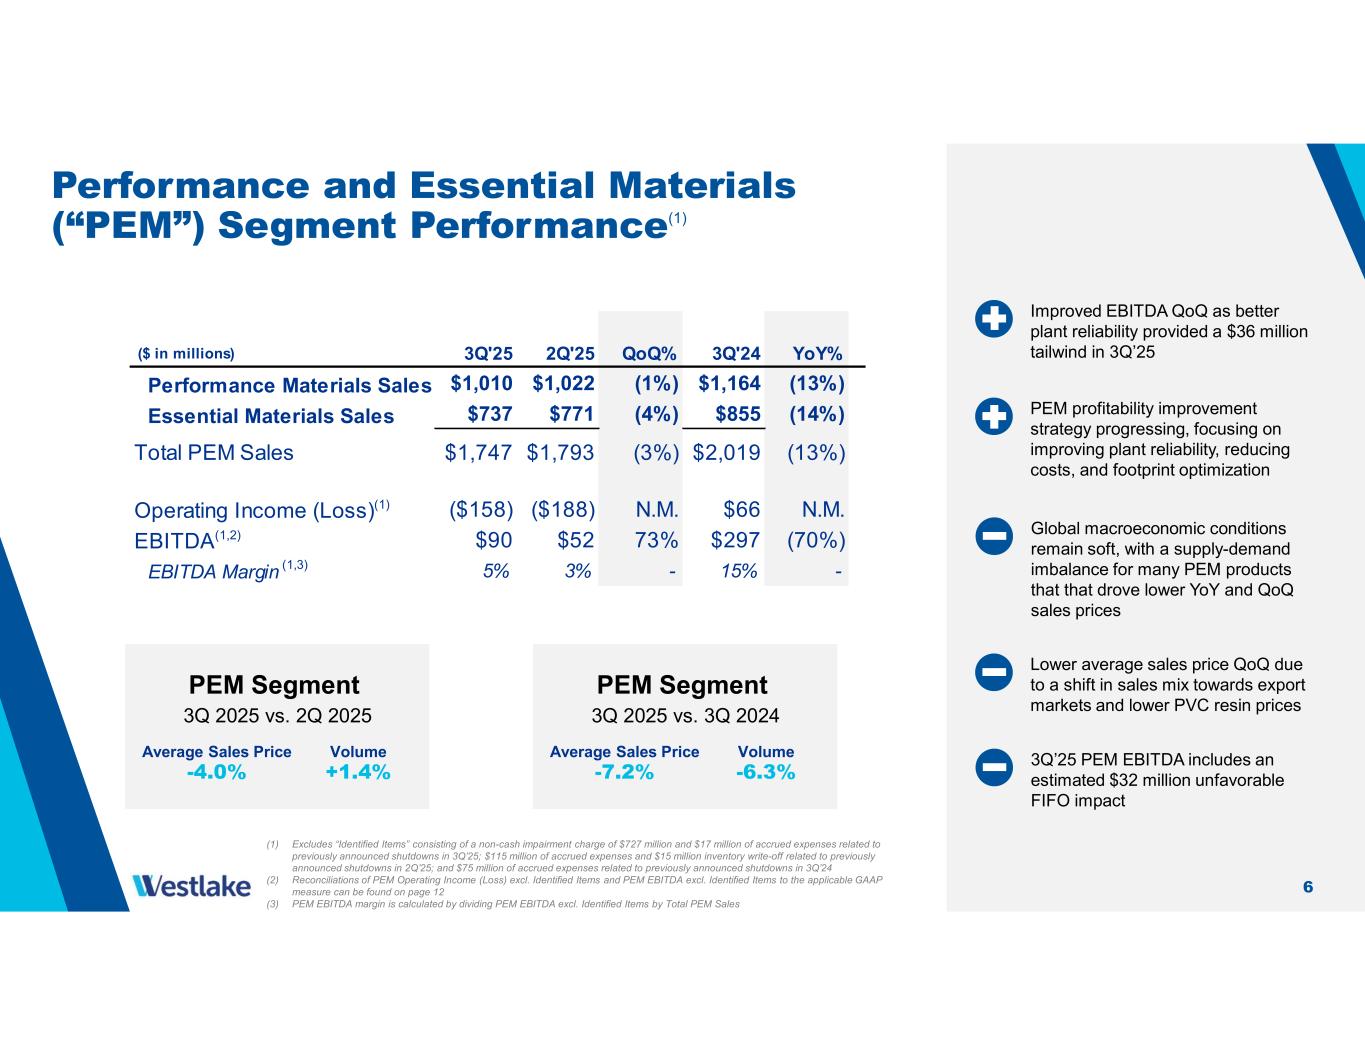
6 PEM Segment 3Q 2025 vs. 2Q 2025 Average Sales Price -4.0% Volume +1.4% PEM Segment 3Q 2025 vs. 3Q 2024 Average Sales Price -7.2% Volume -6.3% PEM profitability improvement strategy progressing, focusing on improving plant reliability, reducing costs, and footprint optimization Improved EBITDA QoQ as better plant reliability provided a $36 million tailwind in 3Q’25 (1) Excludes “Identified Items” consisting of a non-cash impairment charge of $727 million and $17 million of accrued expenses related to previously announced shutdowns in 3Q’25; $115 million of accrued expenses and $15 million inventory write-off related to previously announced shutdowns in 2Q’25; and $75 million of accrued expenses related to previously announced shutdowns in 3Q’24 (2) Reconciliations of PEM Operating Income (Loss) excl. Identified Items and PEM EBITDA excl. Identified Items to the applicable GAAP measure can be found on page 12 (3) PEM EBITDA margin is calculated by dividing PEM EBITDA excl. Identified Items by Total PEM Sales Performance and Essential Materials (“PEM”) Segment Performance(1) Lower average sales price QoQ due to a shift in sales mix towards export markets and lower PVC resin prices 3Q’25 PEM EBITDA includes an estimated $32 million unfavorable FIFO impact Global macroeconomic conditions remain soft, with a supply-demand imbalance for many PEM products that that drove lower YoY and QoQ sales prices 3Q'25 2Q'25 QoQ% 3Q'24 YoY% Performance Materials Sales $1,010 $1,022 (1%) $1,164 (13%) Essential Materials Sales $737 $771 (4%) $855 (14%) Total PEM Sales $1,747 $1,793 (3%) $2,019 (13%) Operating Income (Loss)(1) ($158) ($188) N.M. $66 N.M. EBITDA(1,2) $90 $52 73% $297 (70%) EBITDA Margin (1,3) 5% 3% - 15% - ($ in millions)
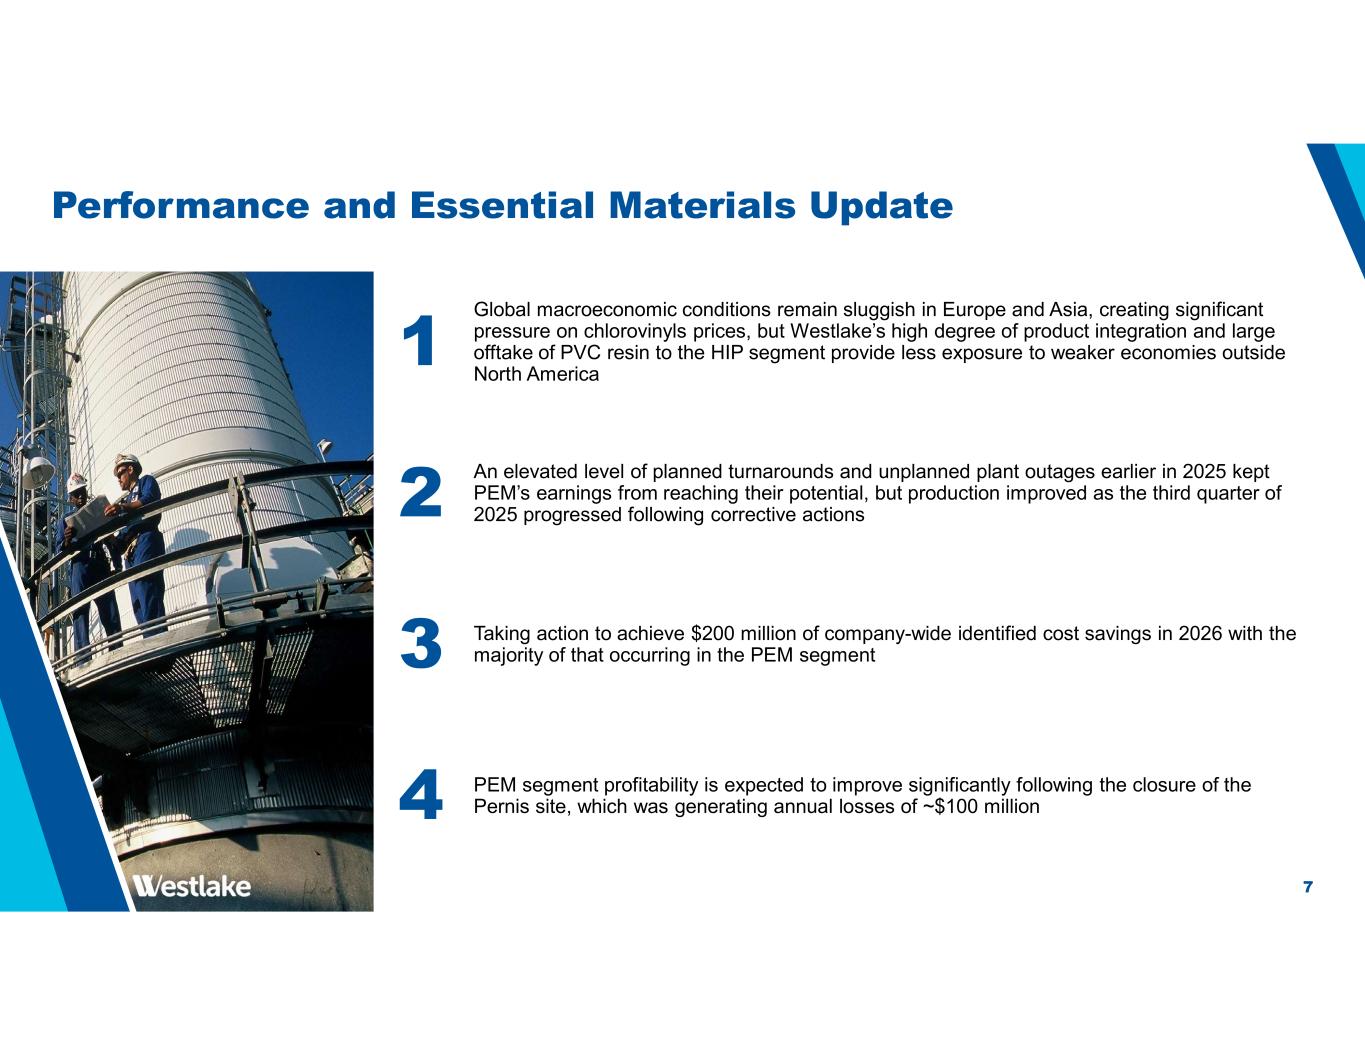
7 Performance and Essential Materials Update 2 An elevated level of planned turnarounds and unplanned plant outages earlier in 2025 kept PEM’s earnings from reaching their potential, but production improved as the third quarter of 2025 progressed following corrective actions 3 Taking action to achieve $200 million of company-wide identified cost savings in 2026 with the majority of that occurring in the PEM segment 4 PEM segment profitability is expected to improve significantly following the closure of the Pernis site, which was generating annual losses of ~$100 million 1 Global macroeconomic conditions remain sluggish in Europe and Asia, creating significant pressure on chlorovinyls prices, but Westlake’s high degree of product integration and large offtake of PVC resin to the HIP segment provide less exposure to weaker economies outside North America
88 Financial Reconciliations
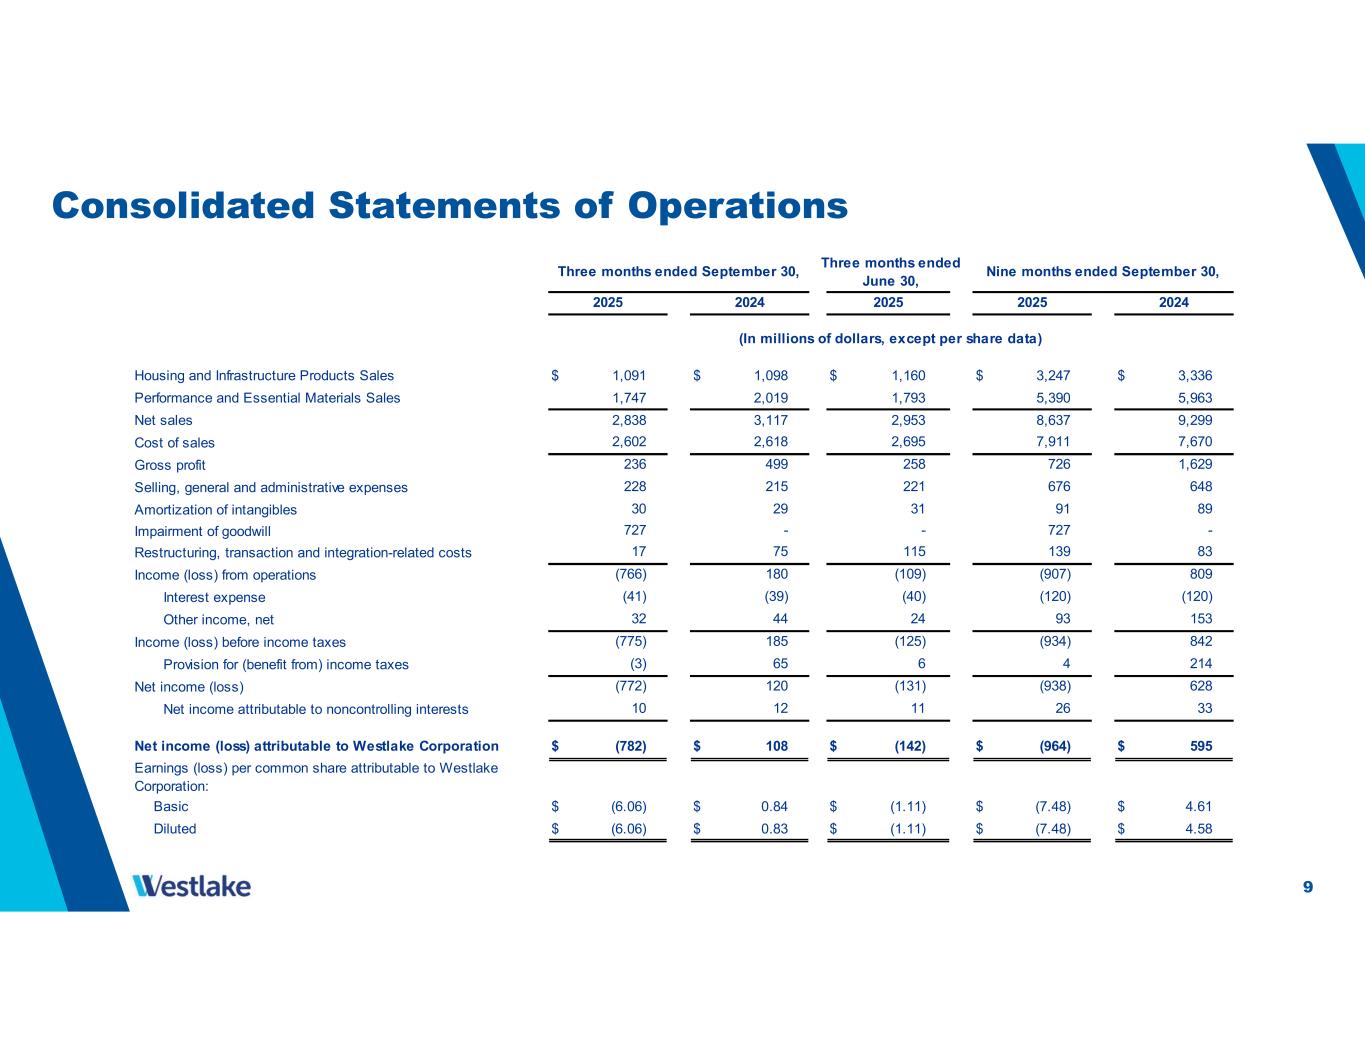
9 Consolidated Statements of Operations Housing and Infrastructure Products Sales $ 1,091 $ 1,098 $ 1,160 $ 3,247 $ 3,336 Performance and Essential Materials Sales 1,747 2,019 1,793 5,390 5,963 Net sales 2,838 3,117 2,953 8,637 9,299 Cost of sales Gross profit Selling, general and administrative expenses Amortization of intangibles Impairment of goodwill Restructuring, transaction and integration-related costs Income (loss) from operations Interest expense Other income, net Income (loss) before income taxes Provision for (benefit from) income taxes Net income (loss) Net income attributable to noncontrolling interests Net income (loss) attributable to Westlake Corporation $ (782) $ 108 $ (142) $ (964) $ 595 Earnings (loss) per common share attributable to Westlake Corporation: Basic $ (6.06) $ 0.84 $ (1.11) $ (7.48) $ 4.61 Diluted $ (6.06) $ 0.83 $ (1.11) $ (7.48) $ 4.58 12 26 33 11 10 (131) 65 4 214 115 (109) (40) 24 2024 2025 2024 (In millions of dollars, except per share data) (125) 6 (3) (41) (39) (120) (120) 120 (938) 628 (775) 185 (934) 842 32 44 93 153 (772) 17 75 139 83 (766) 180 (907) 809 727 - - 727 - 30 29 91 89 31 228 215 676 648 221 Three months ended September 30, Nine months ended September 30, Three months ended June 30, 236 499 726 1,629 2025 2,695 258 2,602 2,618 7,911 7,670 2025
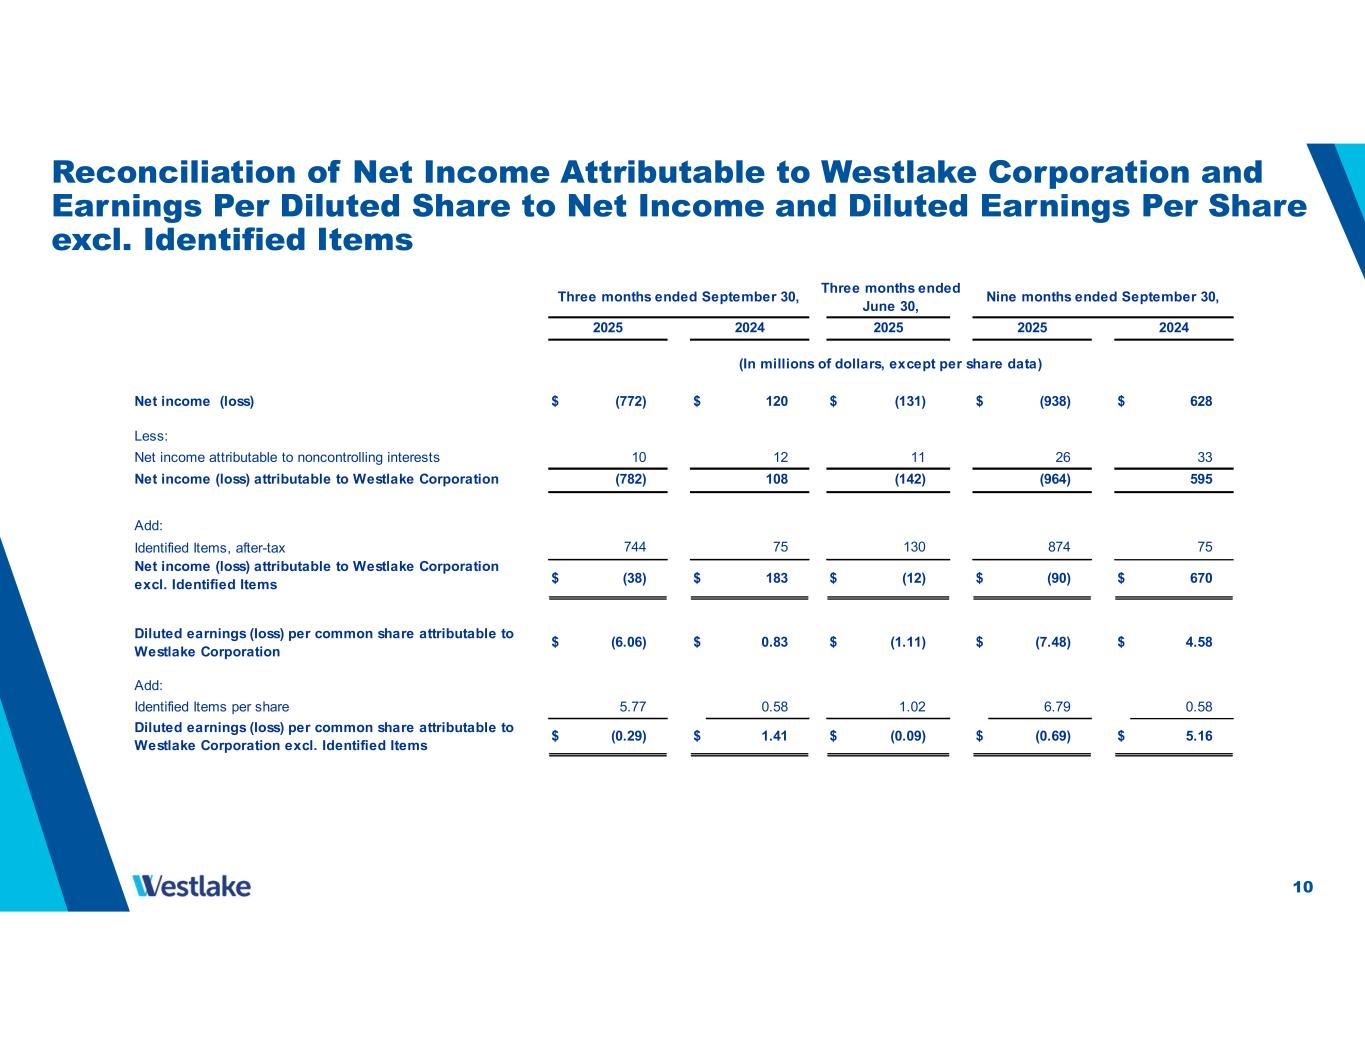
10 Reconciliation of Net Income Attributable to Westlake Corporation and Earnings Per Diluted Share to Net Income and Diluted Earnings Per Share excl. Identified Items Net income (loss) $ (772) $ 120 $ (131) $ (938) $ 628 Less: Net income attributable to noncontrolling interests Net income (loss) attributable to Westlake Corporation (782) 108 (142) (964) 595 Add: Identified Items, after-tax Net income (loss) attributable to Westlake Corporation excl. Identified Items $ (38) $ 183 $ (12) $ (90) $ 670 Diluted earnings (loss) per common share attributable to Westlake Corporation $ (6.06) $ 0.83 $ (1.11) $ (7.48) $ 4.58 Add: Identified Items per share Diluted earnings (loss) per common share attributable to Westlake Corporation excl. Identified Items $ (0.29) $ 1.41 $ (0.09) $ (0.69) $ 5.16 744 1.02 75 0.58 0.58 874 130 75 5.77 6.79 10 12 11 26 33 (In millions of dollars, except per share data) Three months ended September 30, Three months ended June 30, Nine months ended September 30, 2025 2024 2025 2025 2024
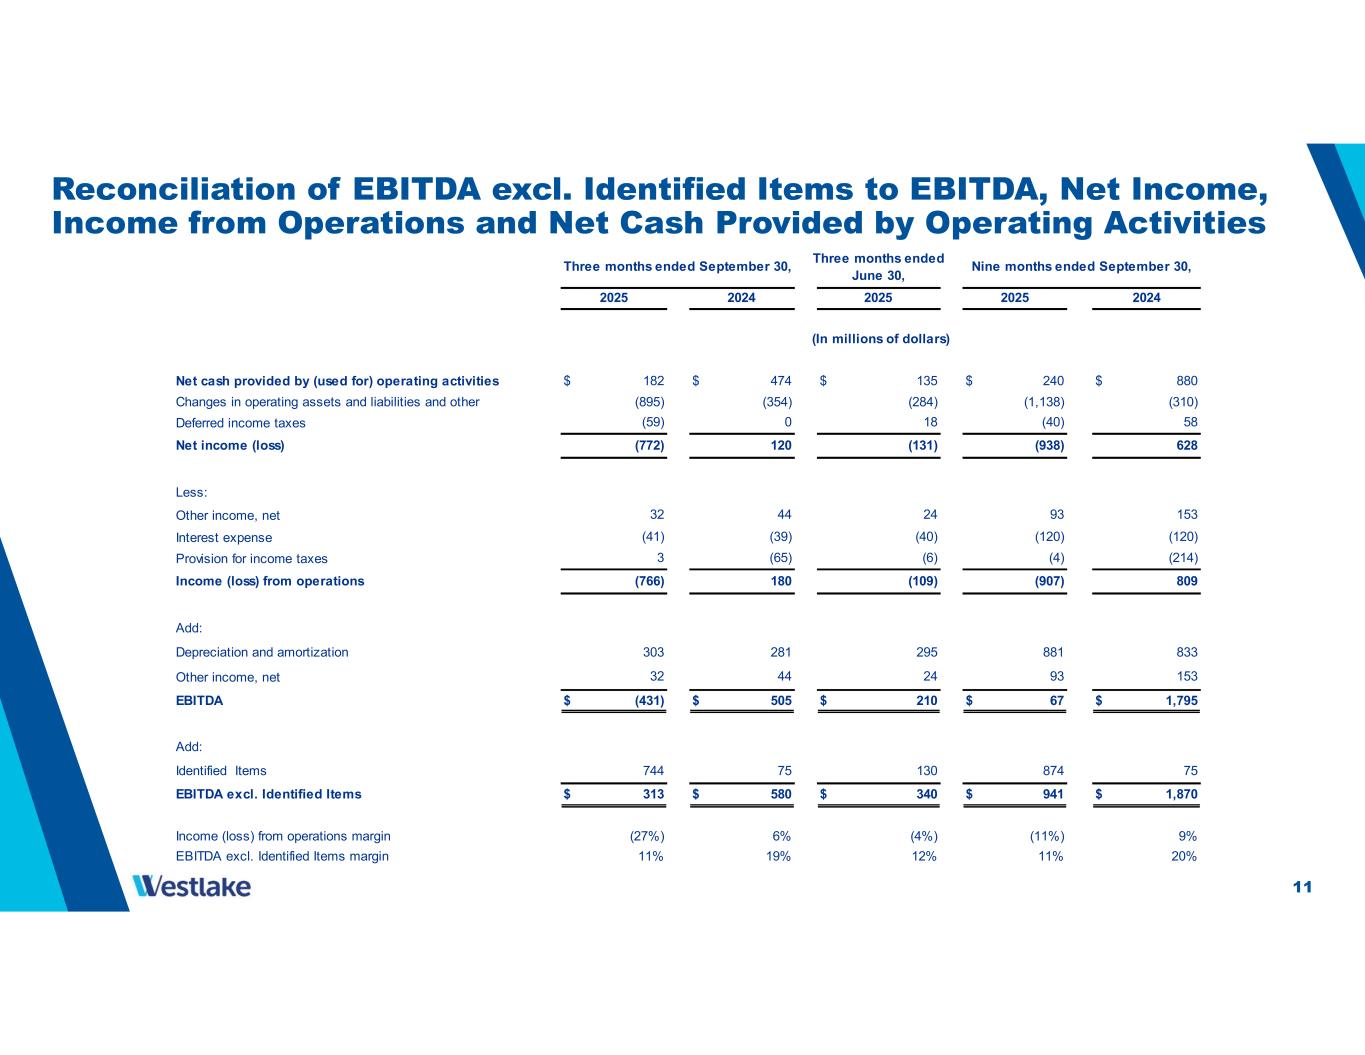
11 Reconciliation of EBITDA excl. Identified Items to EBITDA, Net Income, Income from Operations and Net Cash Provided by Operating Activities Net cash provided by (used for) operating activities $ 182 $ 474 $ 135 $ 240 $ 880 Changes in operating assets and liabilities and other Deferred income taxes Net income (loss) Less: Other income, net Interest expense Provision for income taxes Income (loss) from operations Add: Depreciation and amortization Other income, net EBITDA $ (431) $ 505 $ 210 $ 67 $ 1,795 Add: Identified Items EBITDA excl. Identified Items $ 313 $ 580 $ 340 $ 941 $ 1,870 Income (loss) from operations margin (27%) 6% (4%) (11%) 9% EBITDA excl. Identified Items margin 11% 19% 12% 11% 20% 744 75 130 874 75 Three months ended September 30, Nine months ended September 30, 20252025 2024 2025 2024 Three months ended June 30, (In millions of dollars) 58 (284)(895) (354) (1,138) (310) 18 (59) 0 (40) (131)(772) 120 (938) 628 (40)(41) (39) (120) (120) 24 32 44 93 153 (109) (766) 180 (907) 809 (6)3 (65) (4) (214) 295 303 281 881 833 24 32 44 93 153
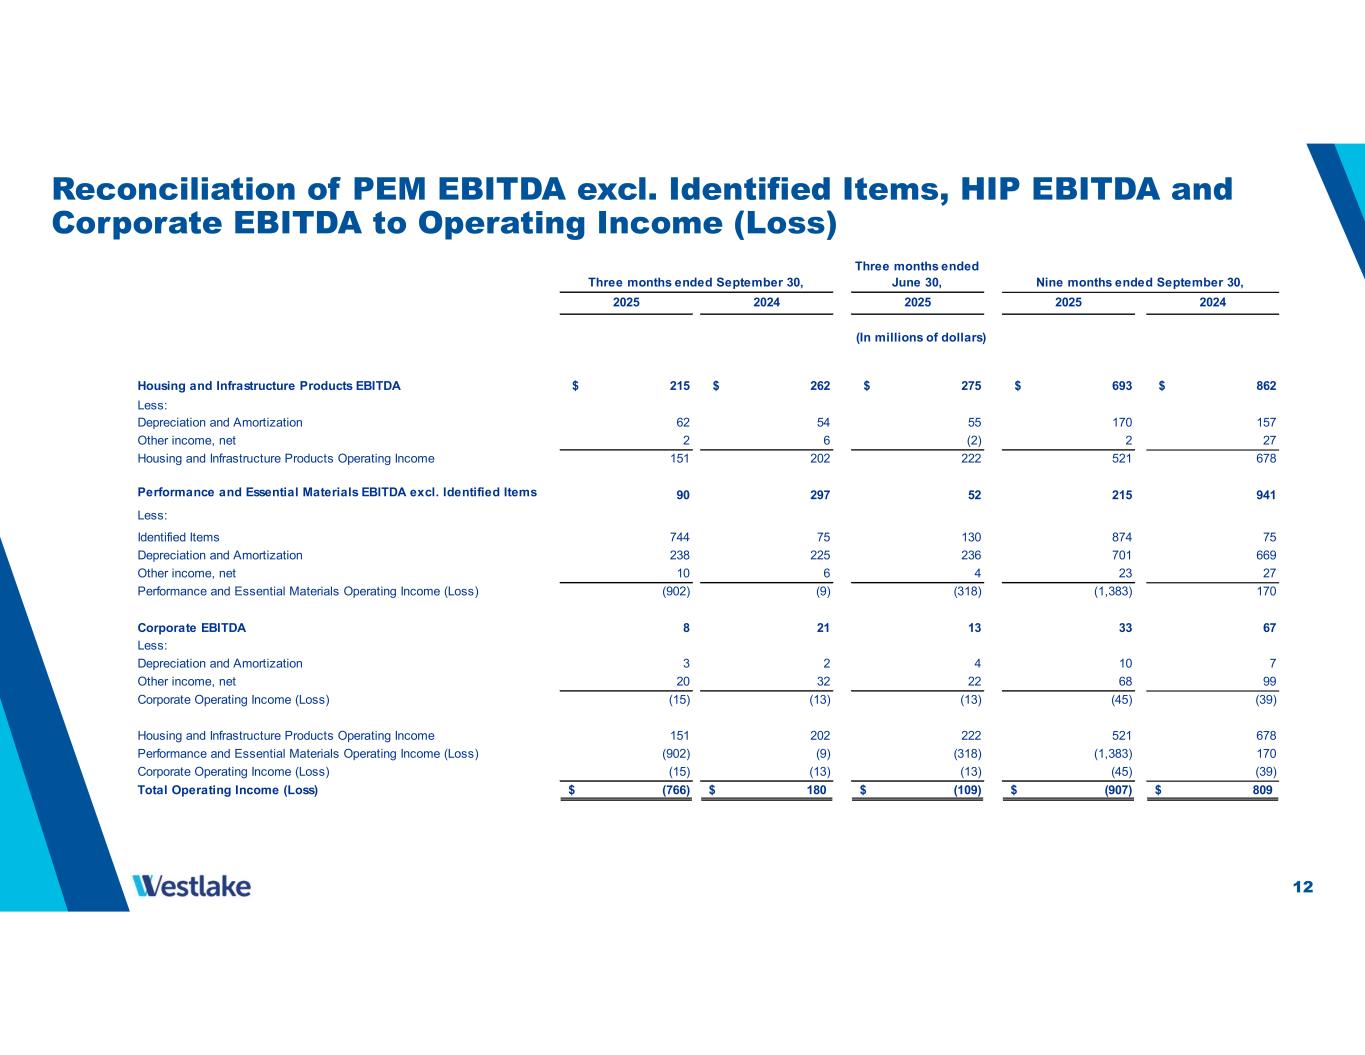
12 Reconciliation of PEM EBITDA excl. Identified Items, HIP EBITDA and Corporate EBITDA to Operating Income (Loss) Three months ended September 30, Three months ended June 30, Nine months ended September 30, 2025 2024 2025 2025 2024 Housing and Infrastructure Products EBITDA $ 215 $ 262 $ 275 $ 693 $ 862 Less: Depreciation and Amortization 62 54 55 170 157 Other income, net 2 6 (2) 2 27 Housing and Infrastructure Products Operating Income 151 202 222 521 678 Performance and Essential Materials EBITDA excl. Identified Items 90 297 52 215 941 Less: Identified Items 744 75 130 874 75 Depreciation and Amortization 238 225 236 701 669 Other income, net 10 6 4 23 27 Performance and Essential Materials Operating Income (Loss) (902) (9) (318) (1,383) 170 Corporate EBITDA 8 21 13 33 67 Less: Depreciation and Amortization 3 2 4 10 7 Other income, net 20 32 22 68 99 Corporate Operating Income (Loss) (15) (13) (13) (45) (39) Housing and Infrastructure Products Operating Income 151 202 222 521 678 Performance and Essential Materials Operating Income (Loss) (902) (9) (318) (1,383) 170 Corporate Operating Income (Loss) (15) (13) (13) (45) (39) Total Operating Income (Loss) (766)$ 180$ (109)$ (907)$ 809$ (In millions of dollars)
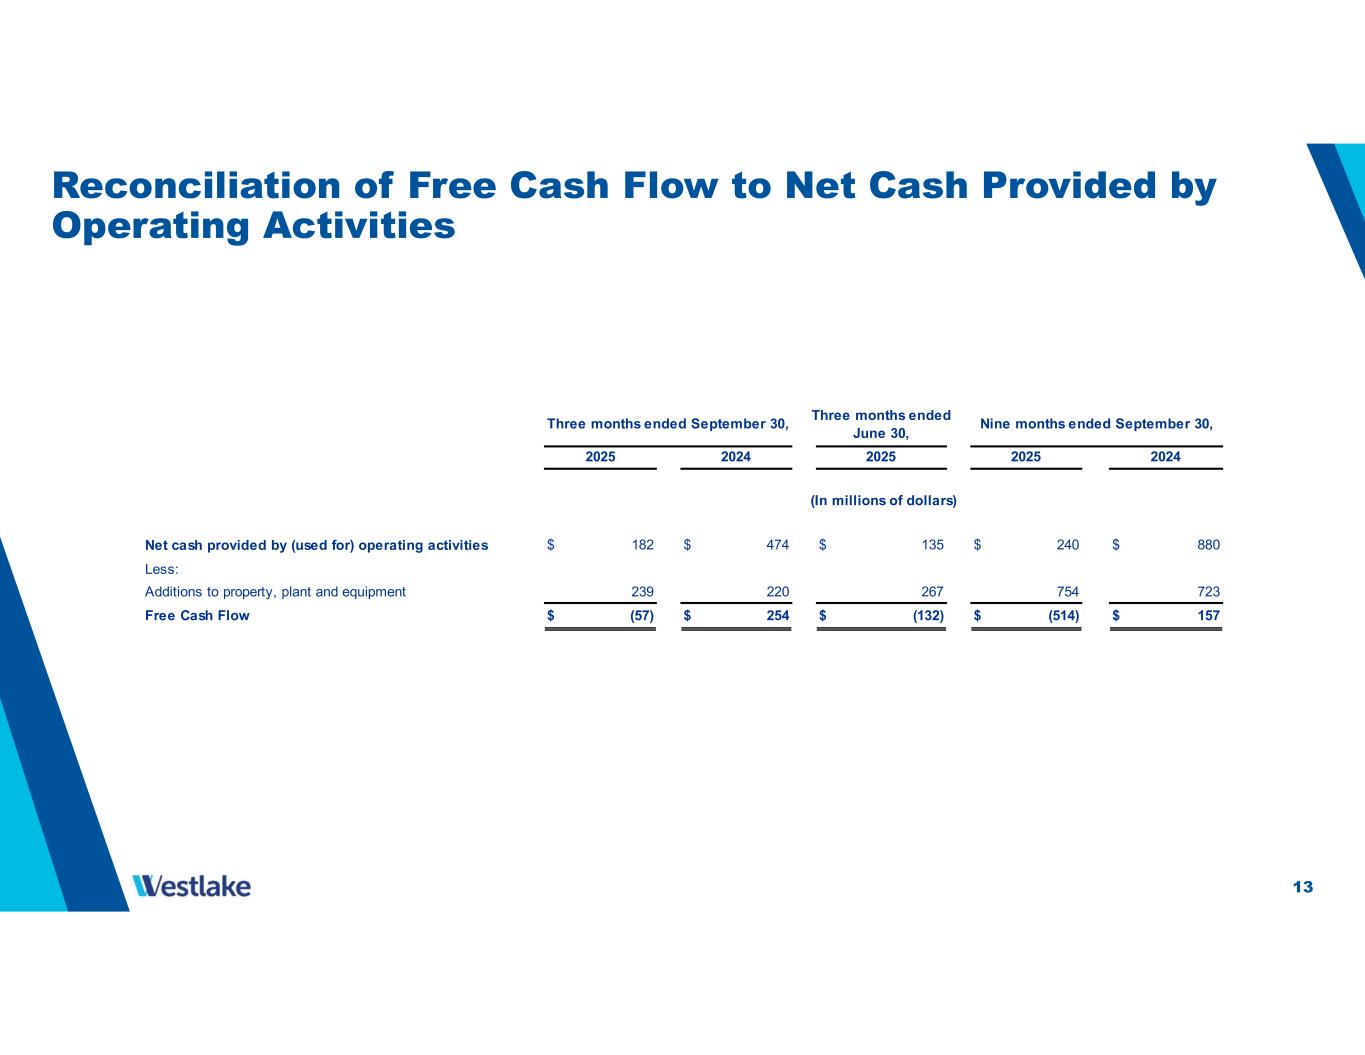
13 Reconciliation of Free Cash Flow to Net Cash Provided by Operating Activities Net cash provided by (used for) operating activities $ 182 $ 474 $ 135 $ 240 $ 880 Less: Additions to property, plant and equipment Free Cash Flow $ (57) $ 254 $ (132) $ (514) $ 157 239 220 267 754 723 (In millions of dollars) Three months ended September 30, Three months ended June 30, Nine months ended September 30, 2025 2024 2025 2025 2024

14 Safe Harbor Language This presentation contains certain forward-looking statements including statements regarding our cost savings objectives and our ability to maintain synergies, pricing and demand for our products and across the industrial and manufacturing sectors, global macroeconomic conditions, anticipated sales volumes, industry outlook for both of our segments, our ability to execute our integrated strategy the operational reliability of our plants and our ability to address plant operating issues, our future operating rates and improvement of PEM operating rate in the fourth quarter 2025, projected benefits of the improved reliability of our PEM plants, our cost control and efficiency efforts, our ability to achieve our projected cost savings (such as reaching our goal of our 2025 cost savings target of $150 million to $175 million, and an additional cost savings target of $200 million in 2026), our future operating results, including our ability to improve revenues and EBITDA and EBITD margin, our expectations regarding previously communicated ranges of our HIP segment’s revenue and EBITDA margin for 2025, our competitive position, the effects of changing demographics in the markets that we serve, anticipated residential construction, repair and remodel activities and infrastructure growth, long-term housing market fundamentals, changes in sales mix of our products, expectations regarding homebuilder confidence, our relationships with our customers, the effects of the closure of the Pernis site and our ability to remove projected annual losses, and our energy and feedstock cost advantages in the North American chemicals market. Actual results may differ materially depending on factors, including, but not limited to, the following: general economic and business conditions; the cyclical nature of the chemical and building products industries; the availability, cost and volatility of raw materials and energy; uncertainties associated with the United States, European and worldwide economies, including those due to political tensions and conflict in the Middle East, Russia, Ukraine and elsewhere; uncertainties associated with pandemic infectious diseases; uncertainties associated with climate change; the potential impact on the demand for ethylene, polyethylene and polyvinyl chloride due to initiatives such as recycling and customers seeking alternatives to polymers; current and potential governmental regulatory actions in the United States and other countries; industry production capacity and operating rates; the supply/demand balance for our products; competitive products and pricing pressures; instability in the credit and financial markets; access to capital markets; terrorist acts; operating interruptions; changes in laws or regulations, including trade policies and tariffs imposed on or by foreign jurisdictions; disruptions in global trade and the effect on trading relationships between the United States and other countries; the effects of government shutdowns; technological developments; information systems failures and cyber attacks; foreign currency exchange risks; our ability to implement our business strategies; creditworthiness of our customers; and other factors described in our reports filed with the Securities and Exchange Commission. Many of these factors are beyond our ability to control or predict. Any of these factors, or a combination of these factors, could materially affect our future results of operations and the ultimate accuracy of the forward-looking statements. These forward-looking statements are not guarantees of our future performance, and our actual results and future developments may differ materially from those projected in the forward-looking statements. Management cautions against putting undue reliance on forward-looking statements. Every forward-looking statement speaks only as of the date of the particular statement, and we undertake no obligation to publicly update or revise any forward-looking statements. Investor Relations Contacts Steve Bender Executive Vice President & Chief Financial Officer Jeff Holy Vice President & Chief Accounting Officer Westlake Corporation 2801 Post Oak Boulevard, Suite 600, Houston, Texas 77056 | 713-960-9111
