1 Earnings Presentation 2Q 2026
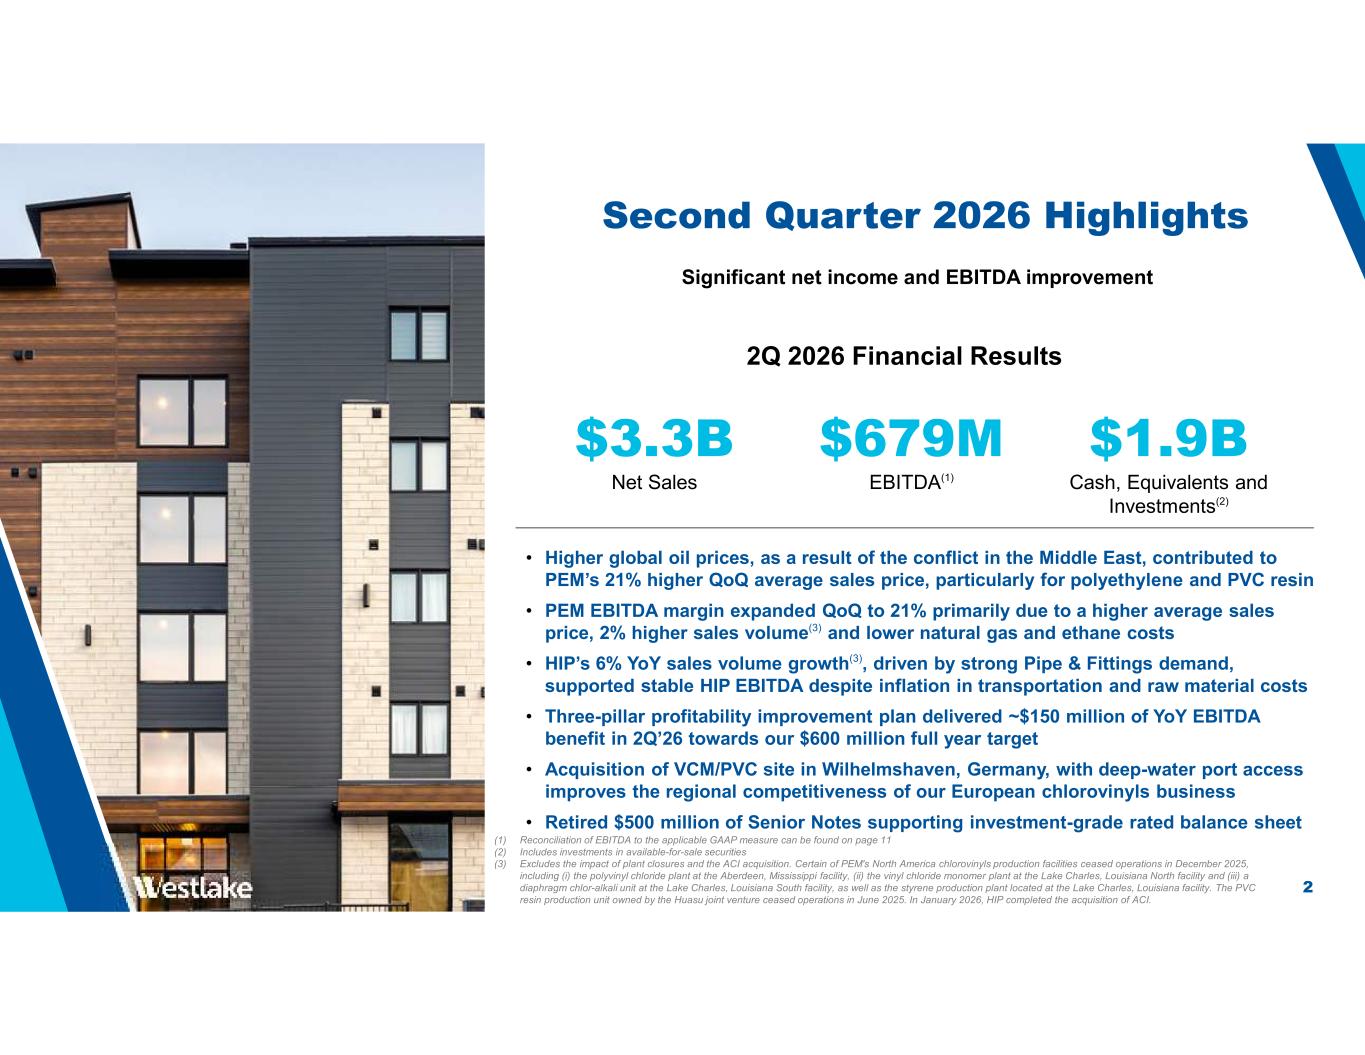
2 Second Quarter 2026 Highlights • Higher global oil prices, as a result of the conflict in the Middle East, contributed to PEM’s 21% higher QoQ average sales price, particularly for polyethylene and PVC resin • PEM EBITDA margin expanded QoQ to 21% primarily due to a higher average sales price, 2% higher sales volume(3) and lower natural gas and ethane costs • HIP’s 6% YoY sales volume growth(3), driven by strong Pipe & Fittings demand, supported stable HIP EBITDA despite inflation in transportation and raw material costs • Three-pillar profitability improvement plan delivered ~$150 million of YoY EBITDA benefit in 2Q’26 towards our $600 million full year target • Acquisition of VCM/PVC site in Wilhelmshaven, Germany, with deep-water port access improves the regional competitiveness of our European chlorovinyls business • Retired $500 million of Senior Notes supporting investment-grade rated balance sheet (1) Reconciliation of EBITDA to the applicable GAAP measure can be found on page 11 (2) Includes investments in available-for-sale securities (3) Excludes the impact of plant closures and the ACI acquisition. Certain of PEM's North America chlorovinyls production facilities ceased operations in December 2025, including (i) the polyvinyl chloride plant at the Aberdeen, Mississippi facility, (ii) the vinyl chloride monomer plant at the Lake Charles, Louisiana North facility and (iii) a diaphragm chlor-alkali unit at the Lake Charles, Louisiana South facility, as well as the styrene production plant located at the Lake Charles, Louisiana facility. The PVC resin production unit owned by the Huasu joint venture ceased operations in June 2025. In January 2026, HIP completed the acquisition of ACI. 2Q 2026 Financial Results $679M EBITDA(1) $3.3B Net Sales $1.9B Cash, Equivalents and Investments(2) Significant net income and EBITDA improvement
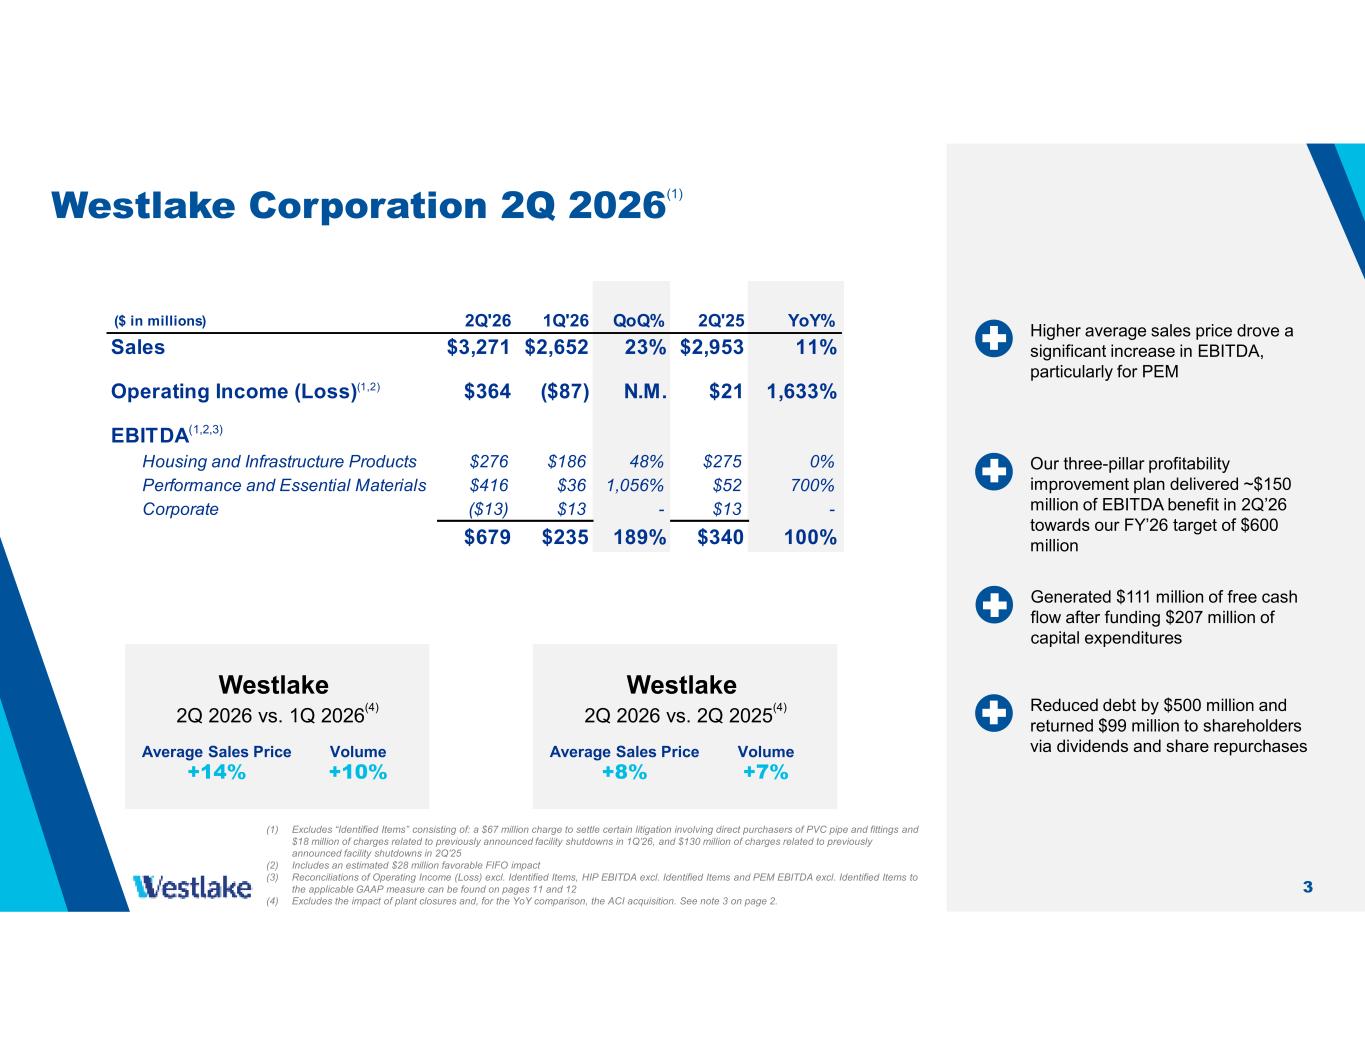
3 Westlake Corporation 2Q 2026 (1) Westlake 2Q 2026 vs. 1Q 2026 (4) Average Sales Price +14% Volume +10% Westlake 2Q 2026 vs. 2Q 2025 (4) Average Sales Price +8% Volume +7% (1) Excludes “Identified Items” consisting of: a $67 million charge to settle certain litigation involving direct purchasers of PVC pipe and fittings and $18 million of charges related to previously announced facility shutdowns in 1Q’26, and $130 million of charges related to previously announced facility shutdowns in 2Q’25 (2) Includes an estimated $28 million favorable FIFO impact (3) Reconciliations of Operating Income (Loss) excl. Identified Items, HIP EBITDA excl. Identified Items and PEM EBITDA excl. Identified Items to the applicable GAAP measure can be found on pages 11 and 12 (4) Excludes the impact of plant closures and, for the YoY comparison, the ACI acquisition. See note 3 on page 2. Our three-pillar profitability improvement plan delivered ~$150 million of EBITDA benefit in 2Q’26 towards our FY’26 target of $600 million 2Q'26 1Q'26 QoQ% 2Q'25 YoY% $3,271 $2,652 23% $2,953 11% $364 ($87) N.M. $21 1,633% Housing and Infrastructure Products $276 $186 48% $275 0% Performance and Essential Materials $416 $36 1,056% $52 700% Corporate ($13) $13 - $13 - $679 $235 189% $340 100% Operating Income (Loss)(1,2) Sales EBITDA(1,2,3) ($ in millions) Generated $111 million of free cash flow after funding $207 million of capital expenditures Higher average sales price drove a significant increase in EBITDA, particularly for PEM Reduced debt by $500 million and returned $99 million to shareholders via dividends and share repurchases
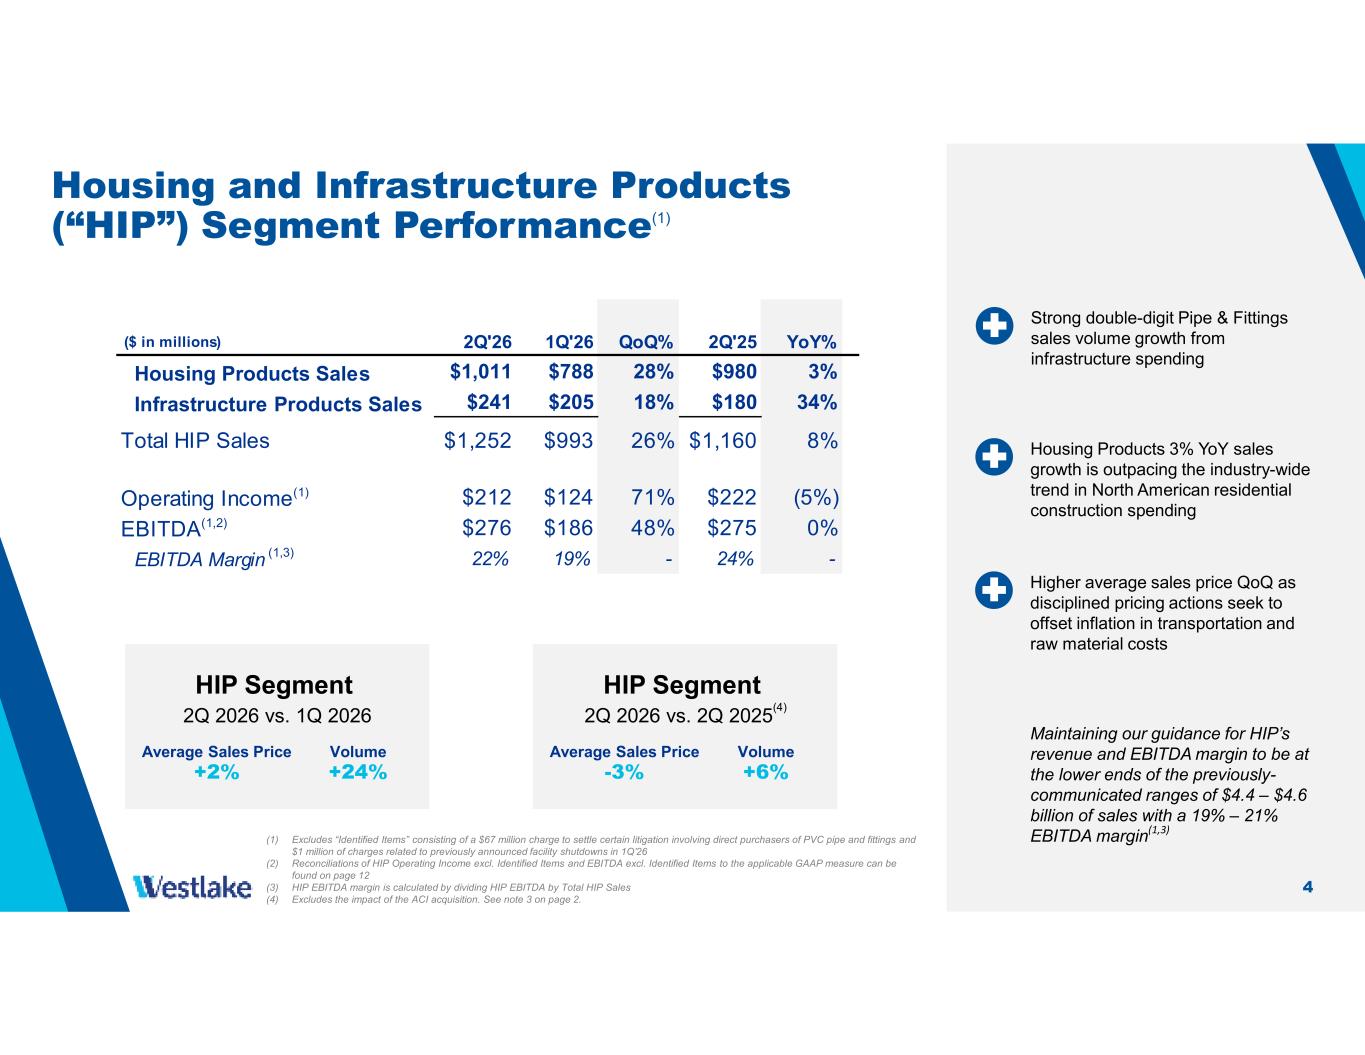
4 Housing and Infrastructure Products (“HIP”) Segment Performance(1) HIP Segment 2Q 2026 vs. 1Q 2026 Average Sales Price +2% Volume +24% HIP Segment 2Q 2026 vs. 2Q 2025 (4) Average Sales Price -3% Volume +6% Higher average sales price QoQ as disciplined pricing actions seek to offset inflation in transportation and raw material costs (1) Excludes “Identified Items” consisting of a $67 million charge to settle certain litigation involving direct purchasers of PVC pipe and fittings and $1 million of charges related to previously announced facility shutdowns in 1Q’26 (2) Reconciliations of HIP Operating Income excl. Identified Items and EBITDA excl. Identified Items to the applicable GAAP measure can be found on page 12 (3) HIP EBITDA margin is calculated by dividing HIP EBITDA by Total HIP Sales (4) Excludes the impact of the ACI acquisition. See note 3 on page 2. Strong double-digit Pipe & Fittings sales volume growth from infrastructure spending 2Q'26 1Q'26 QoQ% 2Q'25 YoY% Housing Products Sales $1,011 $788 28% $980 3% Infrastructure Products Sales $241 $205 18% $180 34% Total HIP Sales $1,252 $993 26% $1,160 8% Operating Income(1) $212 $124 71% $222 (5%) EBITDA(1,2) $276 $186 48% $275 0% EBITDA Margin (1,3) 22% 19% - 24% - ($ in millions) Maintaining our guidance for HIP’s revenue and EBITDA margin to be at the lower ends of the previously- communicated ranges of $4.4 – $4.6 billion of sales with a 19% – 21% EBITDA margin (1,3) Housing Products 3% YoY sales growth is outpacing the industry-wide trend in North American residential construction spending
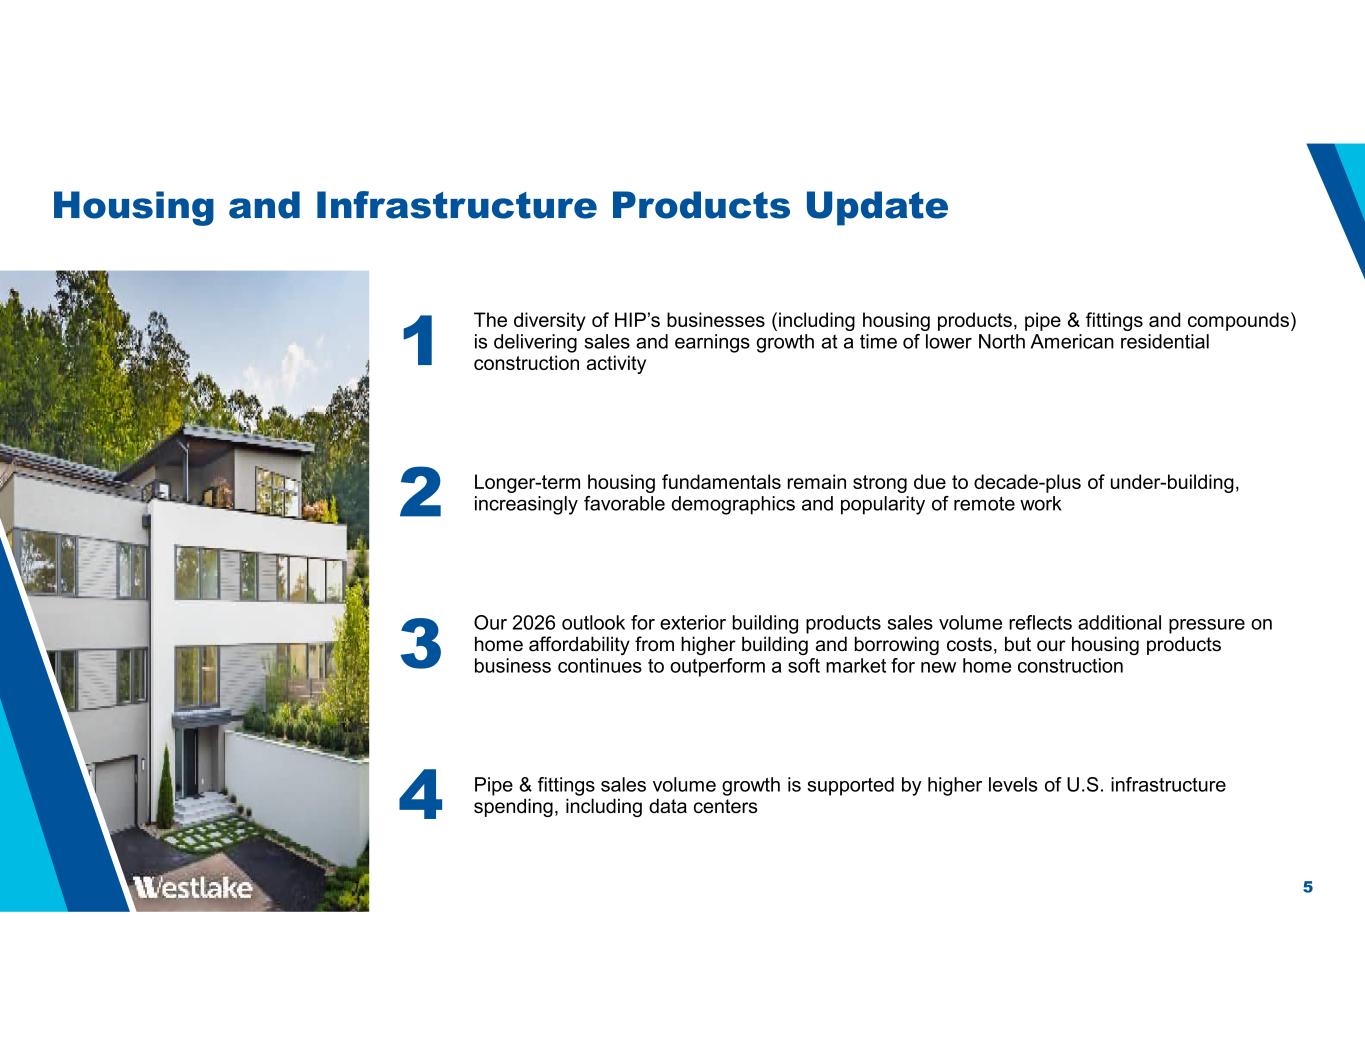
5 Housing and Infrastructure Products Update 2 Longer-term housing fundamentals remain strong due to decade-plus of under-building, increasingly favorable demographics and popularity of remote work 3 Our 2026 outlook for exterior building products sales volume reflects additional pressure on home affordability from higher building and borrowing costs, but our housing products business continues to outperform a soft market for new home construction 4 Pipe & fittings sales volume growth is supported by higher levels of U.S. infrastructure spending, including data centers 1 The diversity of HIP’s businesses (including housing products, pipe & fittings and compounds) is delivering sales and earnings growth at a time of lower North American residential construction activity
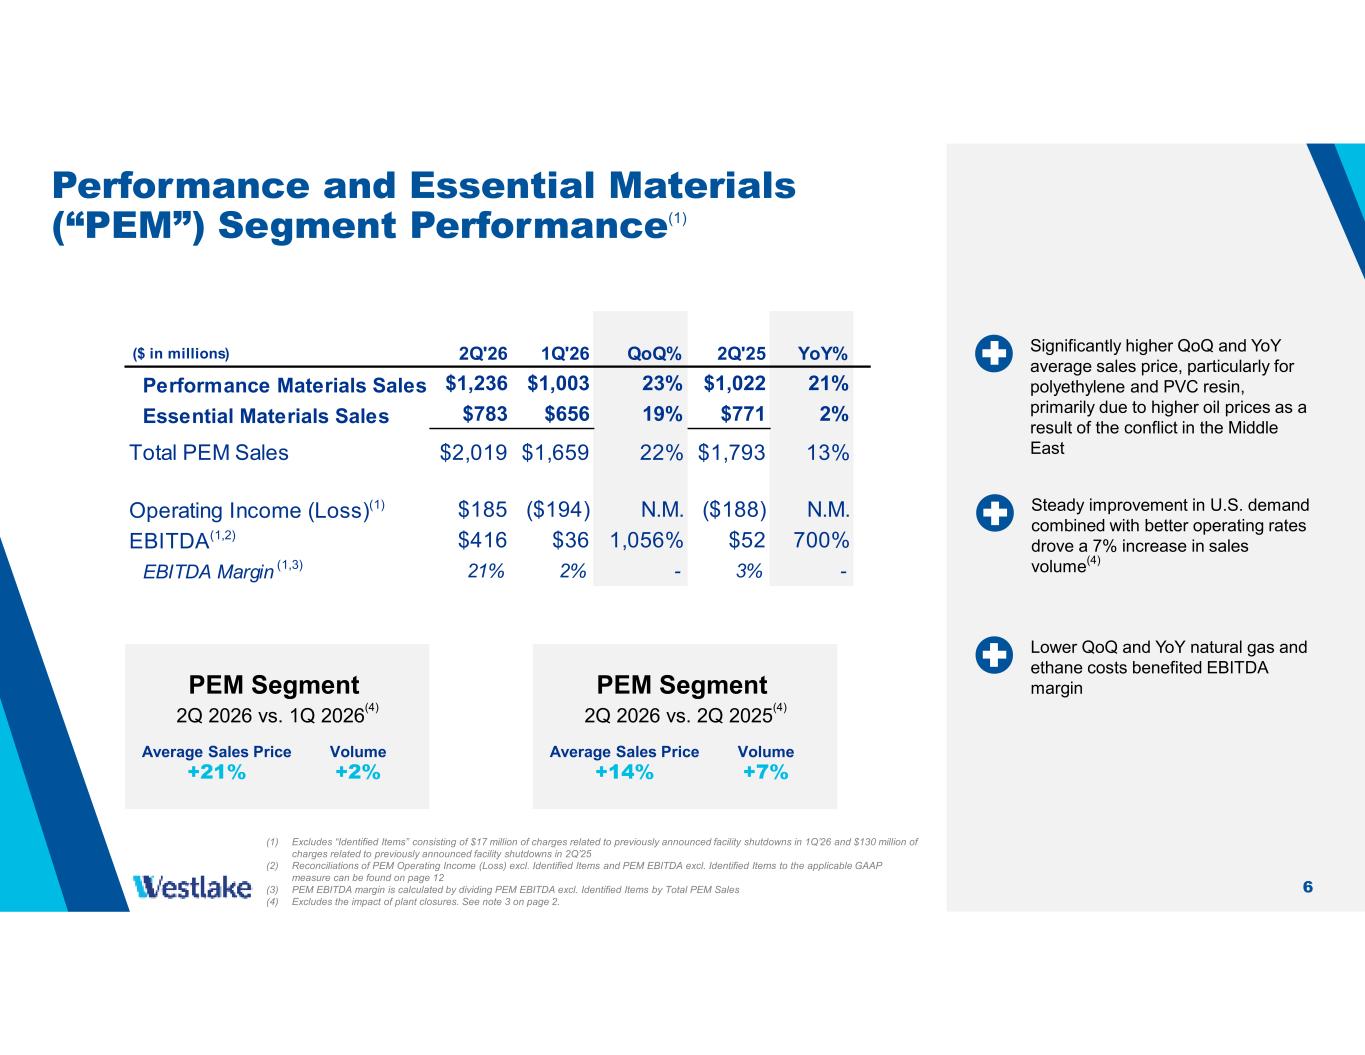
6 PEM Segment 2Q 2026 vs. 1Q 2026 (4) Average Sales Price +21% Volume +2% PEM Segment 2Q 2026 vs. 2Q 2025 (4) Average Sales Price +14% Volume +7% Steady improvement in U.S. demand combined with better operating rates drove a 7% increase in sales volume(4) Significantly higher QoQ and YoY average sales price, particularly for polyethylene and PVC resin, primarily due to higher oil prices as a result of the conflict in the Middle East (1) Excludes “Identified Items” consisting of $17 million of charges related to previously announced facility shutdowns in 1Q’26 and $130 million of charges related to previously announced facility shutdowns in 2Q’25 (2) Reconciliations of PEM Operating Income (Loss) excl. Identified Items and PEM EBITDA excl. Identified Items to the applicable GAAP measure can be found on page 12 (3) PEM EBITDA margin is calculated by dividing PEM EBITDA excl. Identified Items by Total PEM Sales (4) Excludes the impact of plant closures. See note 3 on page 2. Performance and Essential Materials (“PEM”) Segment Performance(1) Lower QoQ and YoY natural gas and ethane costs benefited EBITDA margin 2Q'26 1Q'26 QoQ% 2Q'25 YoY% Performance Materials Sales $1,236 $1,003 23% $1,022 21% Essential Materials Sales $783 $656 19% $771 2% Total PEM Sales $2,019 $1,659 22% $1,793 13% Operating Income (Loss)(1) $185 ($194) N.M. ($188) N.M. EBITDA(1,2) $416 $36 1,056% $52 700% EBITDA Margin (1,3) 21% 2% - 3% - ($ in millions)
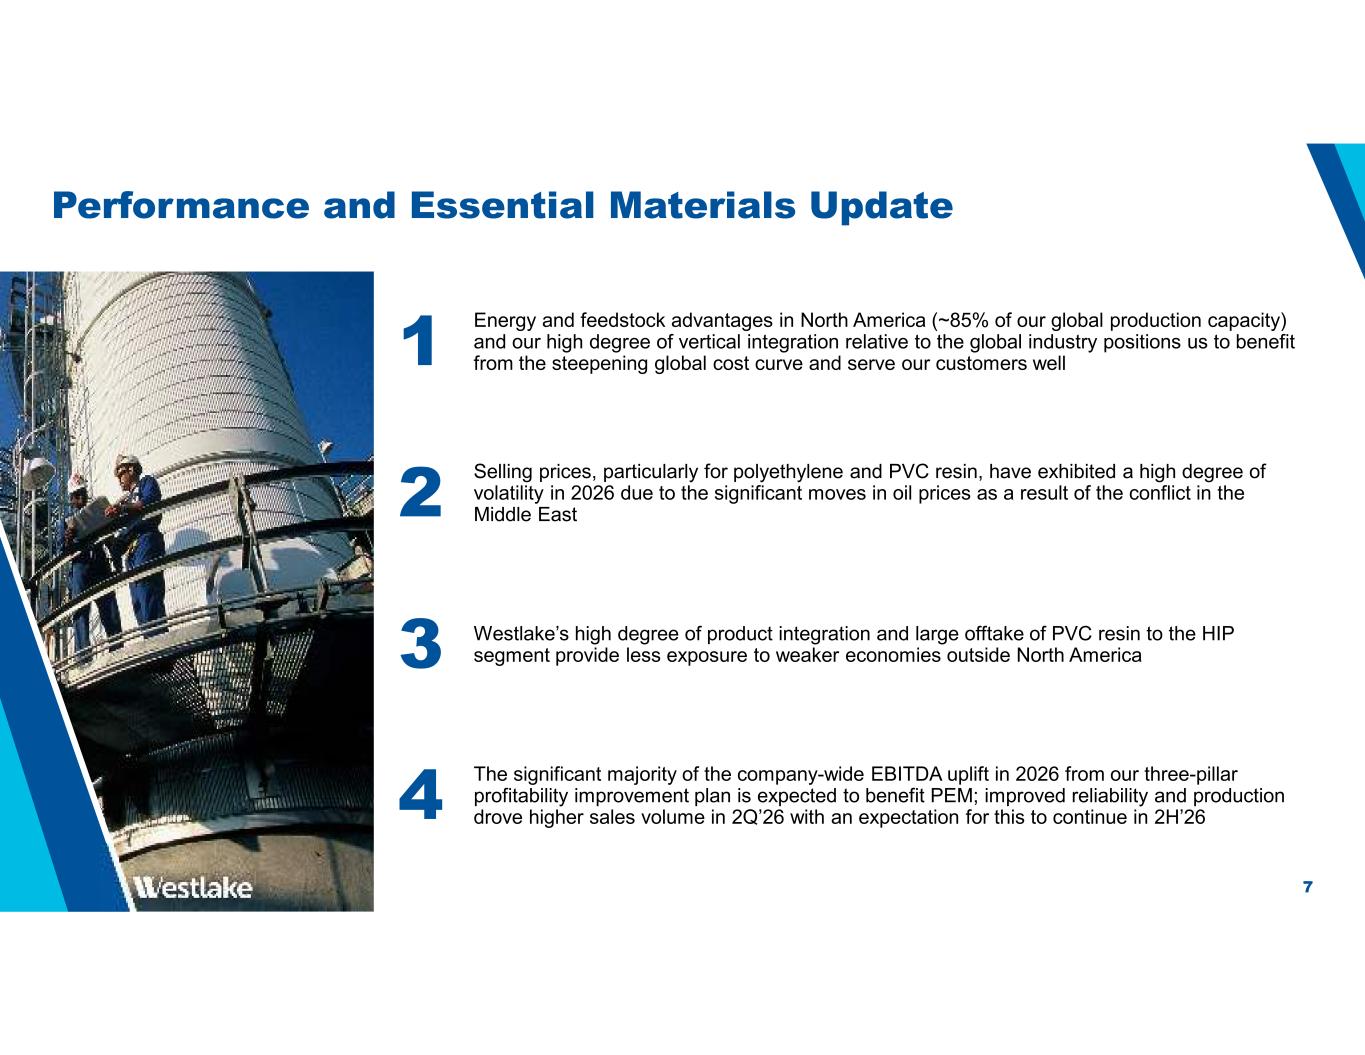
7 Performance and Essential Materials Update 2 Selling prices, particularly for polyethylene and PVC resin, have exhibited a high degree of volatility in 2026 due to the significant moves in oil prices as a result of the conflict in the Middle East 3 Westlake’s high degree of product integration and large offtake of PVC resin to the HIP segment provide less exposure to weaker economies outside North America 4 The significant majority of the company-wide EBITDA uplift in 2026 from our three-pillar profitability improvement plan is expected to benefit PEM; improved reliability and production drove higher sales volume in 2Q’26 with an expectation for this to continue in 2H’26 1 Energy and feedstock advantages in North America (~85% of our global production capacity) and our high degree of vertical integration relative to the global industry positions us to benefit from the steepening global cost curve and serve our customers well

8 Financial Reconciliations
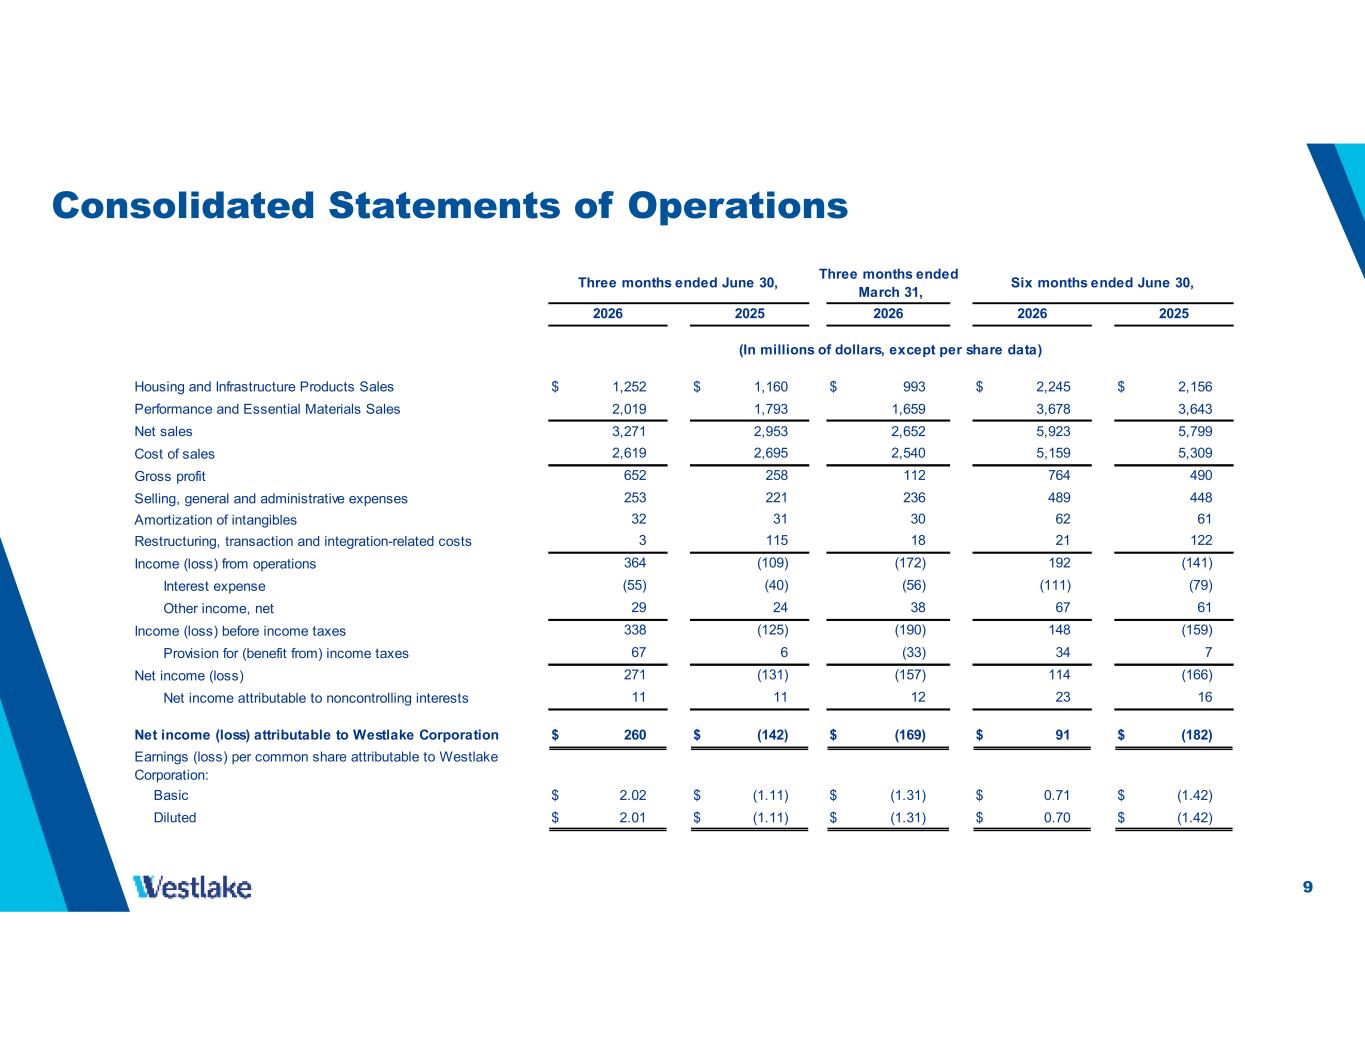
9 Consolidated Statements of Operations Housing and Infrastructure Products Sales $ 1,252 $ 1,160 $ 993 $ 2,245 $ 2,156 Performance and Essential Materials Sales 2,019 1,793 1,659 3,678 3,643 Net sales 3,271 2,953 2,652 5,923 5,799 Cost of sales Gross profit Selling, general and administrative expenses Amortization of intangibles Restructuring, transaction and integration-related costs Income (loss) from operations Interest expense Other income, net Income (loss) before income taxes Provision for (benefit from) income taxes Net income (loss) Net income attributable to noncontrolling interests Net income (loss) attributable to Westlake Corporation $ 260 $ (142) $ (169) $ 91 $ (182) Earnings (loss) per common share attributable to Westlake Corporation: Basic $ 2.02 $ (1.11) $ (1.31) $ 0.71 $ (1.42) Diluted $ 2.01 $ (1.11) $ (1.31) $ 0.70 $ (1.42) Three months ended June 30, Six months ended June 30, Three months ended March 31, 652 258 764 490 2026 2,540 112 2,619 2,695 5,159 5,309 2026 253 221 489 448 236 32 31 30 62 61 3 115 21 122 364 (109) 192 (141) (55) (40) (111) (79) (131) 114 (166) 338 (125) 148 (159) 29 24 67 61 271 (157) 6 34 7 18 (172) (56) 38 2025 2026 2025 (In millions of dollars, except per share data) (190) (33) 67 11 23 16 12 11
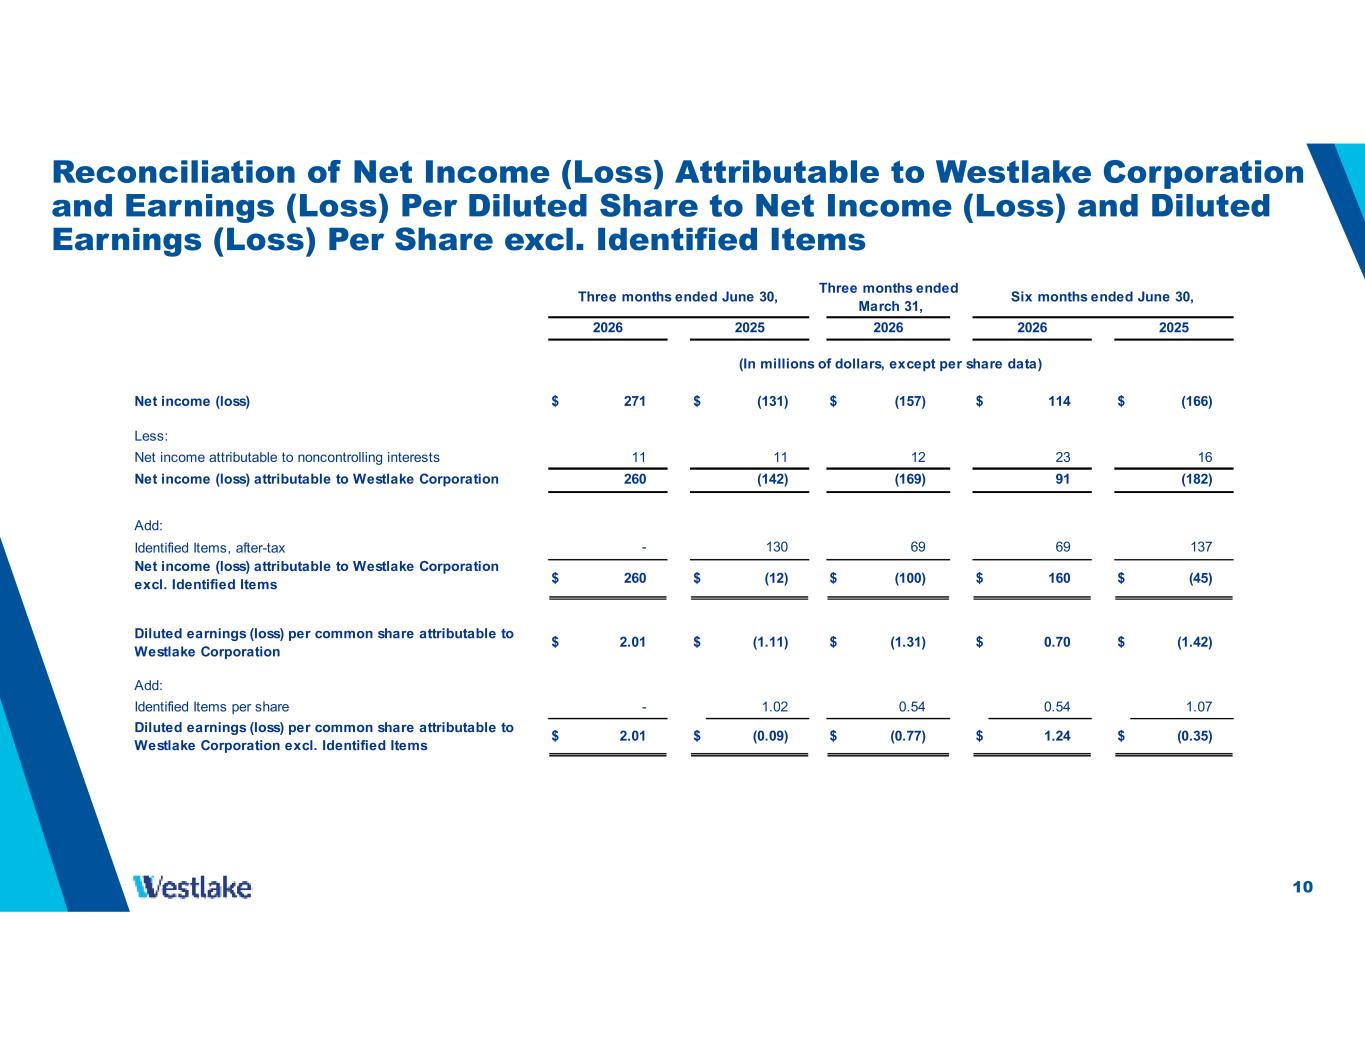
10 Reconciliation of Net Income (Loss) Attributable to Westlake Corporation and Earnings (Loss) Per Diluted Share to Net Income (Loss) and Diluted Earnings (Loss) Per Share excl. Identified Items Net income (loss) $ 271 $ (131) $ (157) $ 114 $ (166) Less: Net income attributable to noncontrolling interests Net income (loss) attributable to Westlake Corporation 260 (142) (169) 91 (182) Add: Identified Items, after-tax Net income (loss) attributable to Westlake Corporation excl. Identified Items $ 260 $ (12) $ (100) $ 160 $ (45) Diluted earnings (loss) per common share attributable to Westlake Corporation $ 2.01 $ (1.11) $ (1.31) $ 0.70 $ (1.42) Add: Identified Items per share Diluted earnings (loss) per common share attributable to Westlake Corporation excl. Identified Items $ 2.01 $ (0.09) $ (0.77) $ 1.24 $ (0.35) (In millions of dollars, except per share data) Three months ended June 30, Three months ended March 31, Six months ended June 30, 2026 2025 2026 2026 2025 11 11 12 23 16 - 0.54 137 1.02 1.07 69 69 130 - 0.54
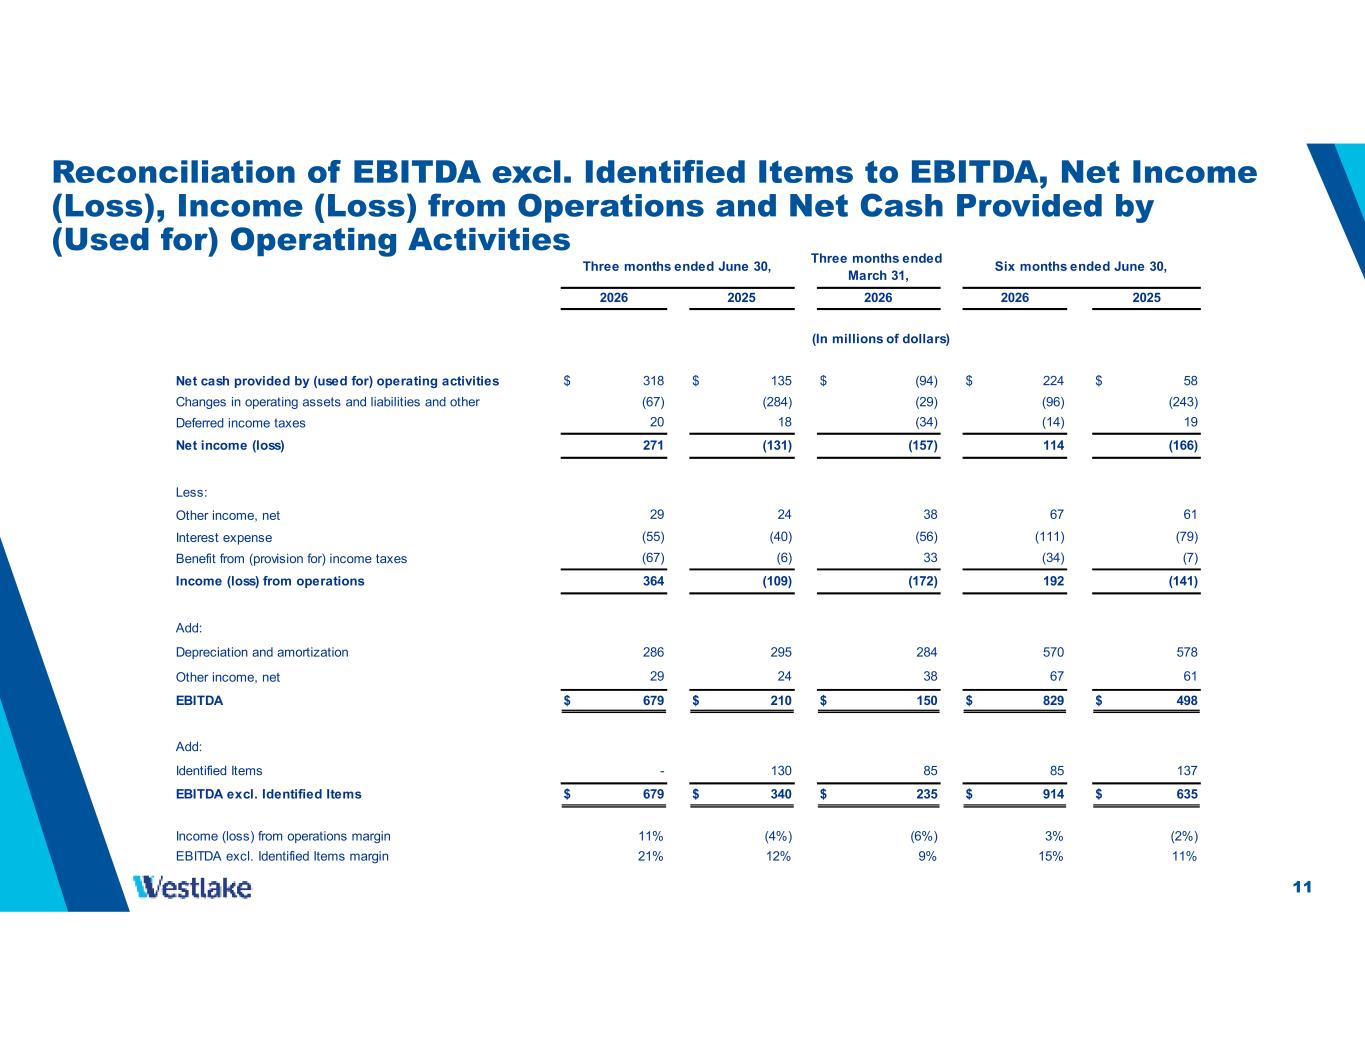
11 Net cash provided by (used for) operating activities $ 318 $ 135 $ (94) $ 224 $ 58 Changes in operating assets and liabilities and other Deferred income taxes Net income (loss) Less: Other income, net Interest expense Benefit from (provision for) income taxes Income (loss) from operations Add: Depreciation and amortization Other income, net EBITDA $ 679 $ 210 $ 150 $ 829 $ 498 Add: Identified Items EBITDA excl. Identified Items $ 679 $ 340 $ 235 $ 914 $ 635 Income (loss) from operations margin 11% (4%) (6%) 3% (2%) EBITDA excl. Identified Items margin 21% 12% 9% 15% 11% 38 29 24 67 61 284 286 295 570 578 33 (67) (6) (34) (7) (172) 364 (109) 192 (141) 38 29 24 67 61 (56)(55) (40) (111) (79) (157)271 (131) 114 (166) (In millions of dollars) 19 (29)(67) (284) (96) (243) (34)20 18 (14) Three months ended June 30, Six months ended June 30, 20262026 2025 2026 2025 Three months ended March 31, - 130 85 85 137 Reconciliation of EBITDA excl. Identified Items to EBITDA, Net Income (Loss), Income (Loss) from Operations and Net Cash Provided by (Used for) Operating Activities
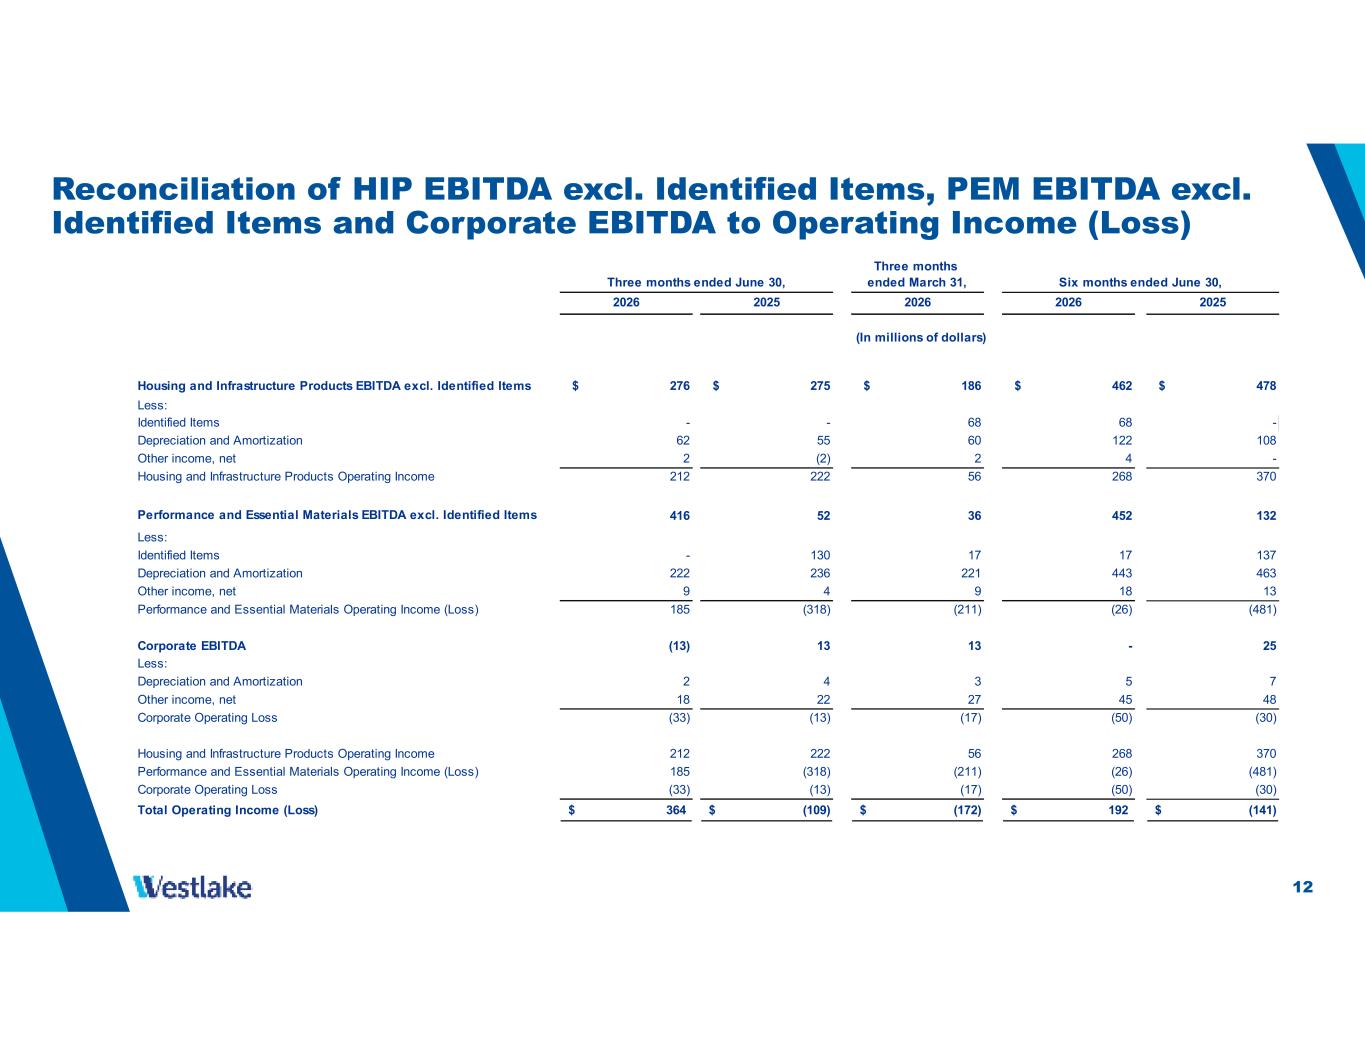
12 Reconciliation of HIP EBITDA excl. Identified Items, PEM EBITDA excl. Identified Items and Corporate EBITDA to Operating Income (Loss) Three months ended June 30, Three months ended March 31, Six months ended June 30, 2026 2025 2026 2026 2025 Housing and Infrastructure Products EBITDA excl. Identified Items $ 276 $ 275 $ 186 $ 462 $ 478 Less: Identified Items - - 68 68 - Depreciation and Amortization 62 55 60 122 108 Other income, net 2 (2) 2 4 - Housing and Infrastructure Products Operating Income 212 222 56 268 370 Performance and Essential Materials EBITDA excl. Identified Items 416 52 36 452 132 Less: Identified Items - 130 17 17 137 Depreciation and Amortization 222 236 221 443 463 Other income, net 9 4 9 18 13 Performance and Essential Materials Operating Income (Loss) 185 (318) (211) (26) (481) Corporate EBITDA (13) 13 13 - 25 Less: Depreciation and Amortization 2 4 3 5 7 Other income, net 18 22 27 45 48 Corporate Operating Loss (33) (13) (17) (50) (30) Housing and Infrastructure Products Operating Income 212 222 56 268 370 Performance and Essential Materials Operating Income (Loss) 185 (318) (211) (26) (481) Corporate Operating Loss (33) (13) (17) (50) (30) Total Operating Income (Loss) 364$ (109)$ (172)$ 192$ (141)$ (In millions of dollars)
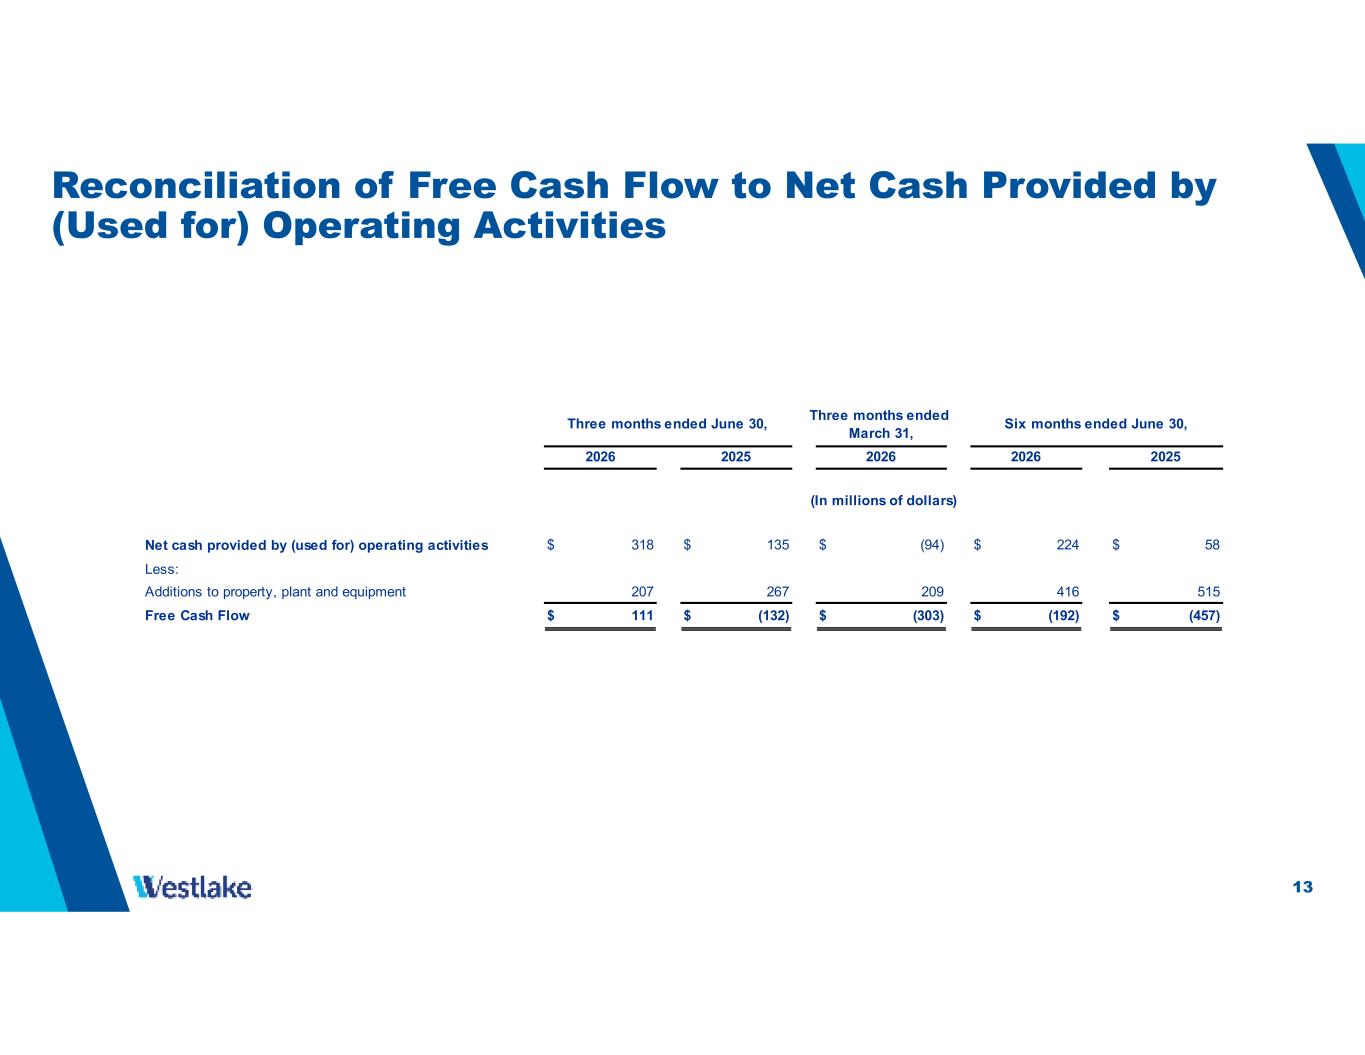
13 Reconciliation of Free Cash Flow to Net Cash Provided by (Used for) Operating Activities Net cash provided by (used for) operating activities $ 318 $ 135 $ (94) $ 224 $ 58 Less: Additions to property, plant and equipment Free Cash Flow $ 111 $ (132) $ (303) $ (192) $ (457) (In millions of dollars) Three months ended June 30, Three months ended March 31, Six months ended June 30, 2026 2025 2026 2026 2025 207 267 209 416 515

14 Safe Harbor Language This presentation contains certain forward-looking statements including statements regarding our cost savings objectives and our ability to maintain synergies, pricing and demand for our products and across the industrial and manufacturing sectors, global macroeconomic conditions, anticipated sales volumes and volume growth, industry outlook for both of our segments, our ability to execute our integrated strategy, projected benefits from the shutdown of certain of our PEM facilities, our cost control and efficiency efforts (such as achieving a $600 million uplift to EBITDA in 2026 from our profitability improvement plan), our future operating results, including revenues and EBITDA, continuous improvement in PEM reliability and production, our expectations regarding previously communicated ranges of our HIP segment’s revenue and EBITDA margin for 2026, our competitive position, the effects of changing demographics in the markets that we serve, anticipated residential construction, repair and remodel activities and infrastructure spending growth, long-term housing market fundamentals, changes in sales mix of our products, our relationships with our customers and their adoption of our products, the benefits of our acquisition of the VCM/PVC production site in Wilhelmshaven, Germany, and the effects of the conflict in the Middle East, including the benefits of our energy and feedstock cost advantages in the North American chemicals market. Actual results may differ materially depending on factors, including, but not limited to, the following: general economic and business conditions; the cyclical nature of the chemical and building products industries; the availability, cost and volatility of raw materials and energy; uncertainties associated with the United States, European and worldwide economies, including those due to political tensions and conflict in the Middle East, Russia, Ukraine and elsewhere; uncertainties associated with climate change; the potential impact on the demand for ethylene, polyethylene and polyvinyl chloride due to initiatives such as recycling and customers seeking alternatives to polymers; current and potential governmental regulatory actions in the United States and other countries; industry production capacity and operating rates; the supply/demand balance for our products; competitive products and pricing pressures; instability in the credit and financial markets; access to capital markets; terrorist acts; operating interruptions; changes in laws or regulations, including trade policies; disruptions in global trade; the effects of government shutdowns; technological developments; information systems failures and cyber attacks; foreign currency exchange risks; our ability to implement our business strategies; creditworthiness of our customers; the effect and results of litigation and settlements of litigation; and other factors described in our reports filed with the Securities and Exchange Commission. Many of these factors are beyond our ability to control or predict. Any of these factors, or a combination of these factors, could materially affect our future results of operations and the ultimate accuracy of the forward-looking statements. These forward-looking statements are not guarantees of our future performance, and our actual results and future developments may differ materially from those projected in the forward-looking statements. Management cautions against putting undue reliance on forward-looking statements. Every forward-looking statement speaks only as of the date of the particular statement, and we undertake no obligation to publicly update or revise any forward-looking statements except as required by applicable law. Investor Relations Contacts Jonathan Baksht Senior Vice President & Chief Financial Officer Jeff Holy Vice President & Chief Accounting Officer Westlake Corporation 2801 Post Oak Boulevard, Suite 600, Houston, Texas 77056 | 713-960-9111