Investor Presentation August 2018 Issuer Free Writing Prospectus Filed Pursuant to Rule 433 Registration No. 333 - 225805
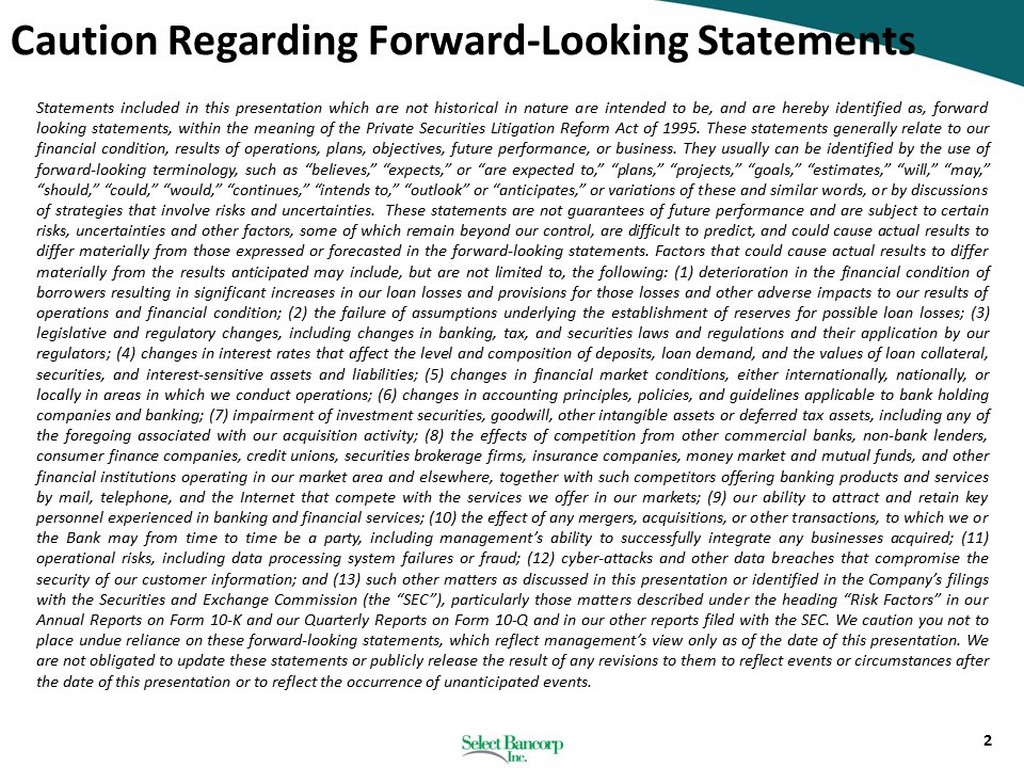
2 Statements included in this presentation which are not historical in nature are intended to be, and are hereby identified as, forward looking statements, within the meaning of the Private Securities Litigation Reform Act of 1995 . These statements generally relate to our financial condition, results of operations, plans, objectives, future performance, or business . They usually can be identified by the use of forward - looking terminology, such as “believes,” “expects,” or “are expected to,” “plans,” “projects,” “goals,” “estimates,” “will,” “may,” “should,” “could,” “would,” “continues,” “intends to,” “outlook” or “anticipates,” or variations of these and similar words, or by discussions of strategies that involve risks and uncertainties . These statements are not guarantees of future performance and are subject to certain risks, uncertainties and other factors, some of which remain beyond our control, are difficult to predict, and could cause actual results to differ materially from those expressed or forecasted in the forward - looking statements . Factors that could cause actual results to differ materially from the results anticipated may include, but are not limited to, the following : ( 1 ) deterioration in the financial condition of borrowers resulting in significant increases in our loan losses and provisions for those losses and other adverse impacts to our results of operations and financial condition ; ( 2 ) the failure of assumptions underlying the establishment of reserves for possible loan losses ; ( 3 ) legislative and regulatory changes, including changes in banking, tax, and securities laws and regulations and their application by our regulators ; ( 4 ) changes in interest rates that affect the level and composition of deposits, loan demand, and the values of loan collateral, securities, and interest - sensitive assets and liabilities ; ( 5 ) changes in financial market conditions, either internationally, nationally, or locally in areas in which we conduct operations ; ( 6 ) changes in accounting principles, policies, and guidelines applicable to bank holding companies and banking ; ( 7 ) impairment of investment securities, goodwill, other intangible assets or deferred tax assets, including any of the foregoing associated with our acquisition activity ; ( 8 ) the effects of competition from other commercial banks, non - bank lenders, consumer finance companies, credit unions, securities brokerage firms, insurance companies, money market and mutual funds, and other financial institutions operating in our market area and elsewhere, together with such competitors offering banking products and services by mail, telephone, and the Internet that compete with the services we offer in our markets ; ( 9 ) our ability to attract and retain key personnel experienced in banking and financial services ; ( 10 ) the effect of any mergers, acquisitions, or other transactions, to which we or the Bank may from time to time be a party, including management’s ability to successfully integrate any businesses acquired ; ( 11 ) operational risks, including data processing system failures or fraud ; ( 12 ) cyber - attacks and other data breaches that compromise the security of our customer information ; and ( 13 ) such other matters as discussed in this presentation or identified in the Company’s filings with the Securities and Exchange Commission (the “SEC”), particularly those matters described under the heading “Risk Factors” in our Annual Reports on Form 10 - K and our Quarterly Reports on Form 10 - Q and in our other reports filed with the SEC . We caution you not to place undue reliance on these forward - looking statements, which reflect management’s view only as of the date of this presentation . We are not obligated to update these statements or publicly release the result of any revisions to them to reflect events or circumstances after the date of this presentation or to reflect the occurrence of unanticipated events . Caution Regarding Forward - Looking Statements
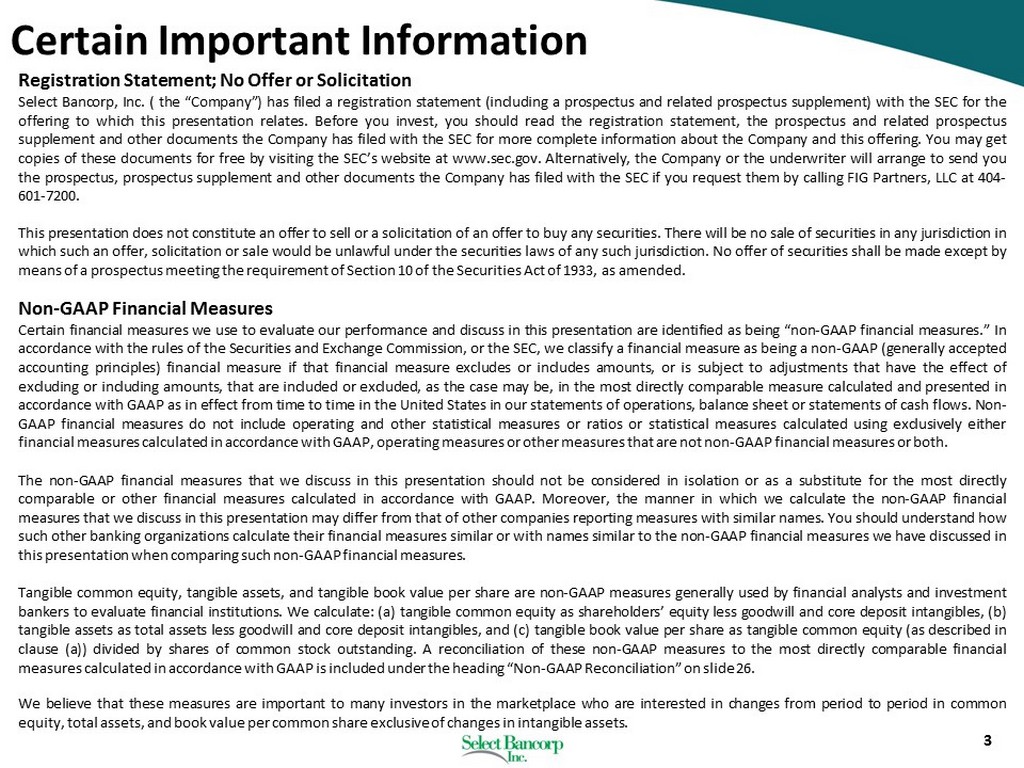
3 Registration Statement ; No Offer or Solicitation Select Bancorp, Inc . ( the “Company”) has filed a registration statement (including a prospectus and related prospectus supplement) with the SEC for the offering to which this presentation relates . Before you invest, you should read the registration statement, the prospectus and related prospectus supplement and other documents the Company has filed with the SEC for more complete information about the Company and this offering . You may get copies of these documents for free by visiting the SEC’s website at www . sec . gov . Alternatively, the Company or the underwriter will arrange to send you the prospectus, prospectus supplement and other documents the Company has filed with the SEC if you request them by calling FIG Partners, LLC at 404 - 601 - 7200 . This presentation does not constitute an offer to sell or a solicitation of an offer to buy any securities . There will be no sale of securities in any jurisdiction in which such an offer, solicitation or sale would be unlawful under the securities laws of any such jurisdiction . No offer of securities shall be made except by means of a prospectus meeting the requirement of Section 10 of the Securities Act of 1933 , as amended . Non - GAAP Financial Measures Certain financial measures we use to evaluate our performance and discuss in this presentation are identified as being “non - GAAP financial measures . ” In accordance with the rules of the Securities and Exchange Commission, or the SEC, we classify a financial measure as being a non - GAAP (generally accepted accounting principles) financial measure if that financial measure excludes or includes amounts, or is subject to adjustments that have the effect of excluding or including amounts, that are included or excluded, as the case may be, in the most directly comparable measure calculated and presented in accordance with GAAP as in effect from time to time in the United States in our statements of operations, balance sheet or statements of cash flows . Non - GAAP financial measures do not include operating and other statistical measures or ratios or statistical measures calculated using exclusively either financial measures calculated in accordance with GAAP, operating measures or other measures that are not non - GAAP financial measures or both . The non - GAAP financial measures that we discuss in this presentation should not be considered in isolation or as a substitute for the most directly comparable or other financial measures calculated in accordance with GAAP . Moreover, the manner in which we calculate the non - GAAP financial measures that we discuss in this presentation may differ from that of other companies reporting measures with similar names . You should understand how such other banking organizations calculate their financial measures similar or with names similar to the non - GAAP financial measures we have discussed in this presentation when comparing such non - GAAP financial measures . Tangible common equity, tangible assets, and tangible book value per share are non - GAAP measures generally used by financial analysts and investment bankers to evaluate financial institutions . We calculate : (a) tangible common equity as shareholders’ equity less goodwill and core deposit intangibles, (b) tangible assets as total assets less goodwill and core deposit intangibles, and (c) tangible book value per share as tangible common equity (as described in clause (a)) divided by shares of common stock outstanding . A reconciliation of these non - GAAP measures to the most directly comparable financial measures calculated in accordance with GAAP is included under the heading “Non - GAAP Reconciliation” on slide 26 . We believe that these measures are important to many investors in the marketplace who are interested in changes from period to period in common equity, total assets, and book value per common share exclusive of changes in intangible assets . Certain Important Information
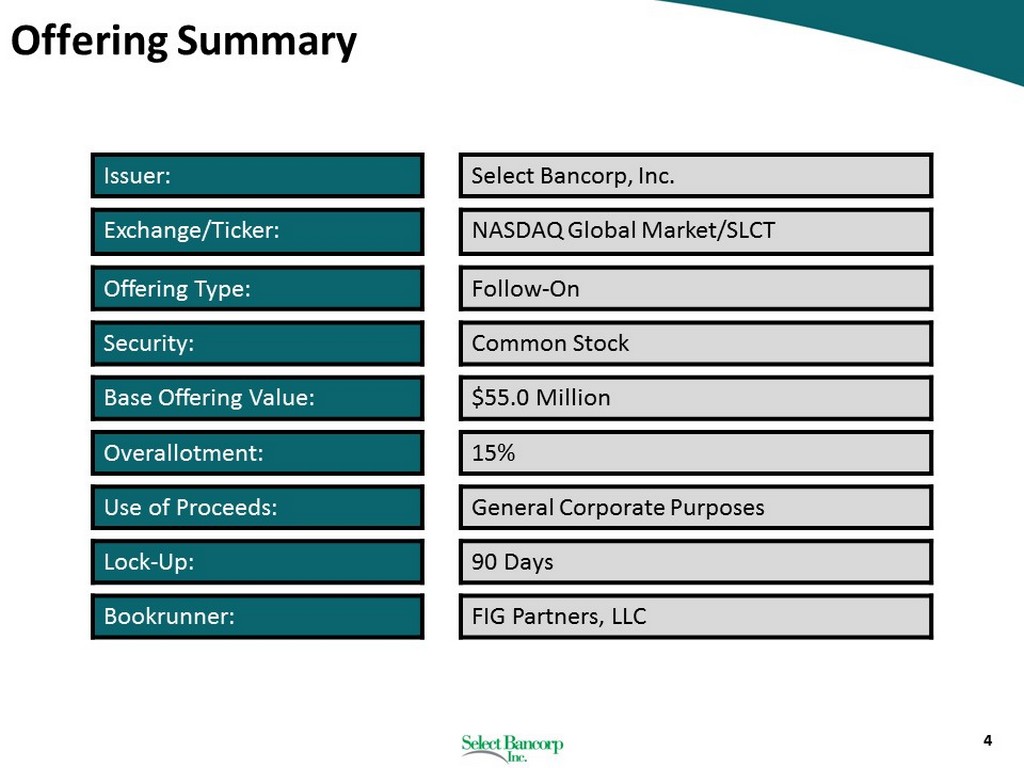
4 Issuer: Select Bancorp, Inc. Exchange/Ticker: NASDAQ Global Market/SLCT Offering Type: Follow - On Security: Common Stock Base Offering Value: $55.0 Million Overallotment: 15% Use of Proceeds: General Corporate Purposes Lock - Up: 90 Days Bookrunner: FIG Partners, LLC Offering Summary
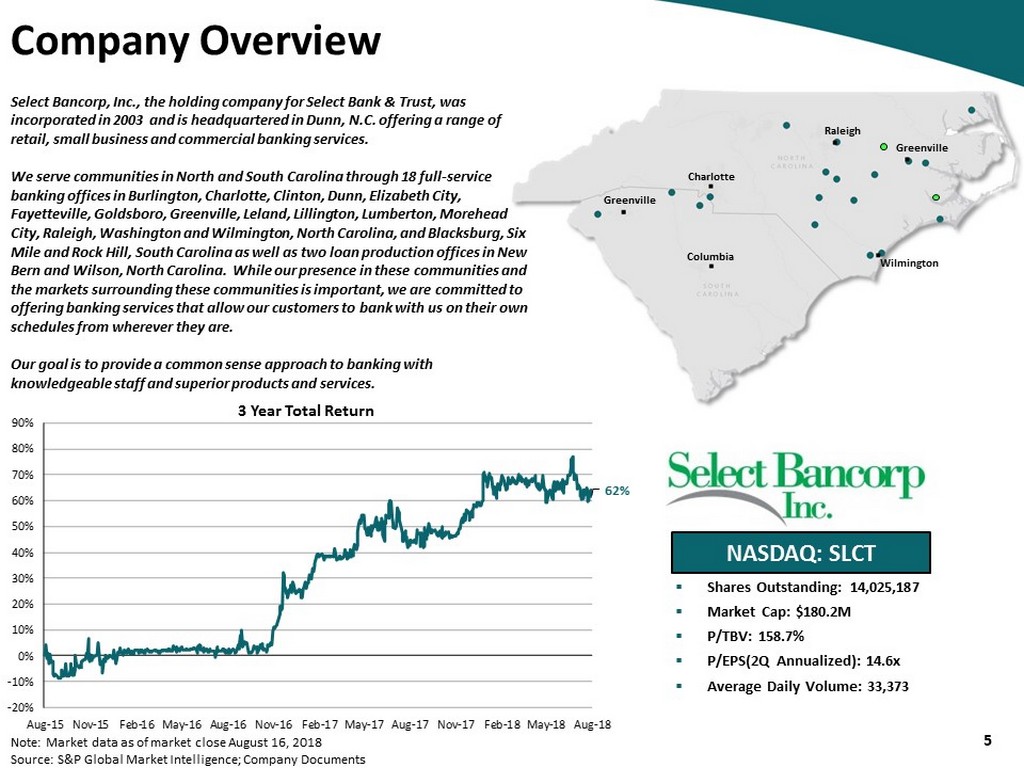
5 Select Bancorp, Inc., the holding company for Select Bank & Trust, was incorporated in 2003 and is headquartered in Dunn, N.C. offering a range of retail, small business and commercial banking services. We serve communities in North and South Carolina through 18 full - service banking offices in Burlington, Charlotte, Clinton, Dunn, Elizabeth City, Fayetteville, Goldsboro, Greenville, Leland, Lillington, Lumberton, Morehead City, Raleigh, Washington and Wilmington, North Carolina, and Blacksburg, Six Mile and Rock Hill, South Carolina as well as two loan production offices in New Bern and Wilson, North Carolina. While our presence in these communities and the markets surrounding these communities is important, we are committed to offering banking services that allow our customers to bank with us on their own schedules from wherever they are. Our goal is to provide a common sense approach to banking with knowledgeable staff and superior products and services. NASDAQ: SLCT ▪ Shares Outstanding: 14,025,187 ▪ Market Cap: $180.2M ▪ P/TBV: 158.7% ▪ P/EPS(2Q Annualized): 14.6x ▪ Average Daily Volume: 33,373 Note: Market data as of market close August 16, 2018 Source: S&P Global Market Intelligence; Company Documents Company Overview 3 Year Total Return Charlotte Raleigh Greenville Wilmington Columbia Greenville 62% -20% -10% 0% 10% 20% 30% 40% 50% 60% 70% 80% 90% Aug-15 Nov-15 Feb-16 May-16 Aug-16 Nov-16 Feb-17 May-17 Aug-17 Nov-17 Feb-18 May-18 Aug-18
6 Why Select Bancorp? x Attractive franchise in central and eastern North Carolina and upstate South Carolina x Emerging presence in three of North Carolina’s most attractive markets: Raleigh, Charlotte, and Wilmington x Improving performance with capacity for earnings growth x Proven ability to successfully execute and integrate acquisitions x Improved loan growth expected as concentration ratios decrease x Strong credit culture – unwavering underwriting standards have led to exceptional asset quality x Experienced and successful leadership team x Scarcity value - very few North Carolina based community banks of this size
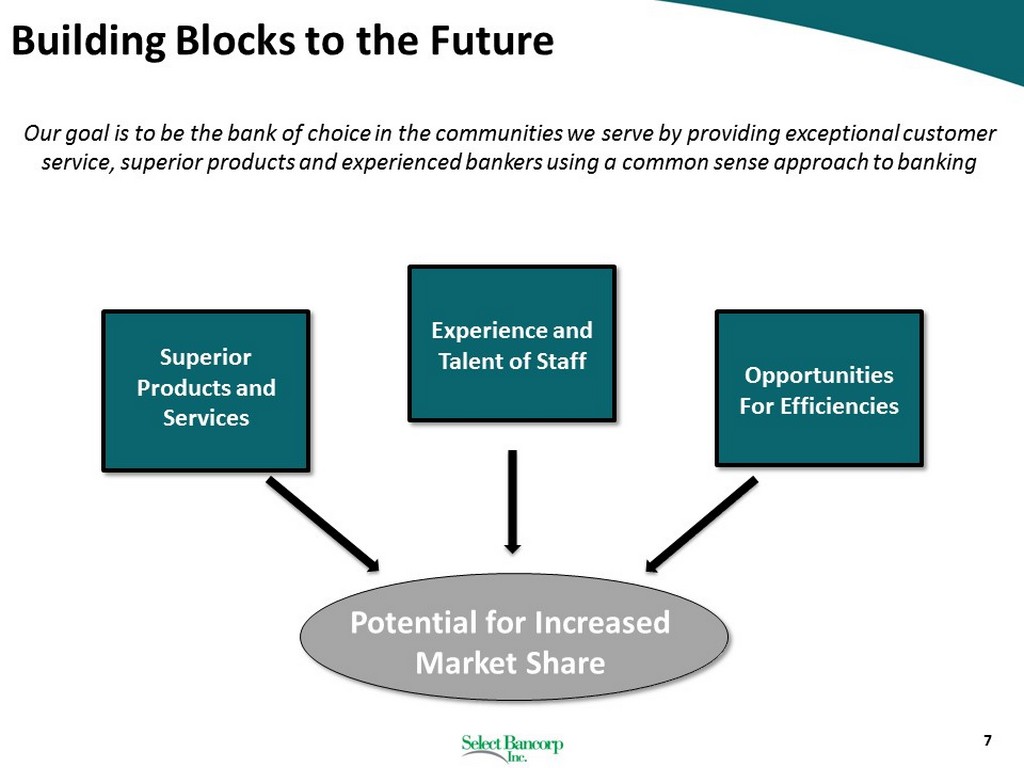
Building Blocks to the Future Our goal is to be the bank of choice in the communities we serve by providing exceptional customer service, superior products and experienced bankers using a common sense approach to banking Opportunities For Efficiencies Experience and Talent of Staff Superior Products and Services Potential for Increased Market Share 7
8 Recent Highlights ▪ Record earnings of $3.1 million in the 2 nd quarter of 2018 ▪ Added to the Russell Index in June 2018 ▪ Hired new director of SBA/Government Lending division ▪ Added new mortgage department ▪ Named to Capital Investment Companies’ “Carolinas Index” in June 2018 ▪ Over $1.2 billion in total assets in the first quarter of 2018 ▪ Acquired Premara Financial, Inc. in December of 2017, expanding Select Bank & Trust into the Upstate South Carolina and Charlotte, NC markets ▪ Opened a new branch in Wilmington, NC in the fourth quarter of 2017 Source: S&P Global Market Intelligence, FIG Partners, Company Documents
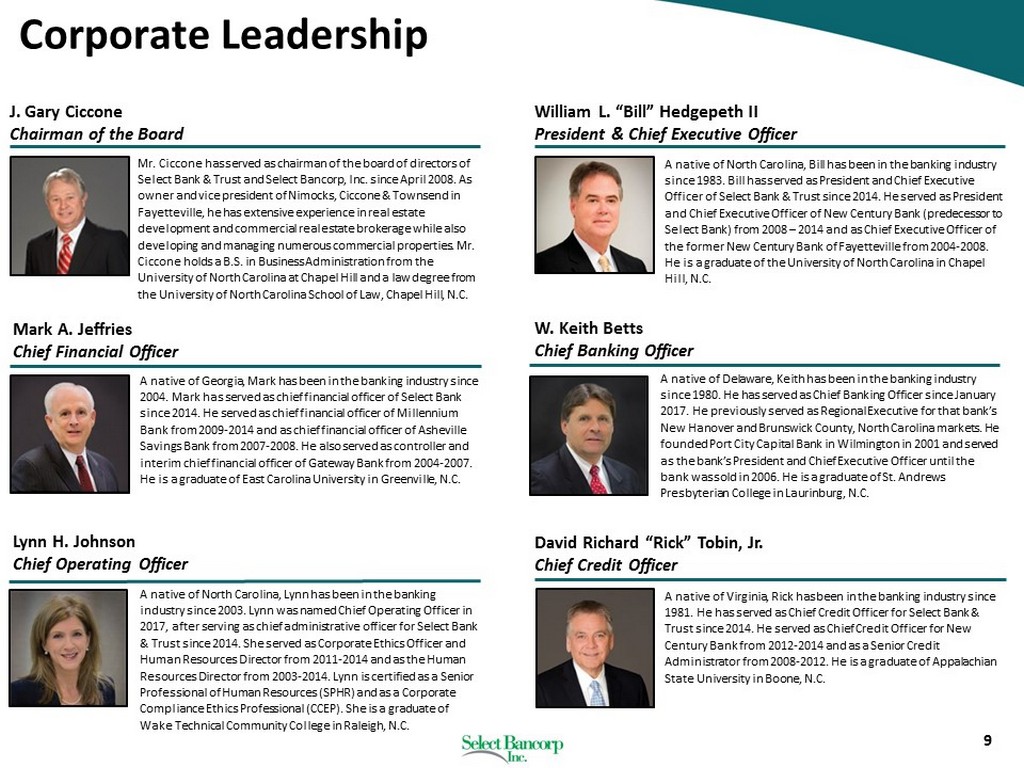
9 Corporate Leadership A native of North Carolina, Bill has been in the banking industry since 1983. Bill has served as President and Chief Executive Officer of Select Bank & Trust since 2014. He served as President and Chief Executive Officer of New Century Bank (predecessor to Select Bank) from 2008 – 2014 and as Chief Executive Officer of the former New Century Bank of Fayetteville from 2004 - 2008. He is a graduate of the University of North Carolina in Chapel Hill, N.C. William L. “Bill” Hedgepeth II President & Chief Executive Officer A native of Delaware, Keith has been in the banking industry since 1980. He has served as Chief Banking Officer since January 2017. He previously served as Regional Executive for that bank’s New Hanover and Brunswick County, North Carolina markets. He founded Port City Capital Bank in Wilmington in 2001 and served as the bank’s President and Chief Executive Officer until the bank was sold in 2006. He is a graduate of St. Andrews Presbyterian College in Laurinburg, N.C. W. Keith Betts Chief Banking Officer A native of Georgia, Mark has been in the banking industry since 2004. Mark has served as chief financial officer of Select Bank since 2014. He served as chief financial officer of Millennium Bank from 2009 - 2014 and as chief financial officer of Asheville Savings Bank from 2007 - 2008. He also served as controller and interim chief financial officer of Gateway Bank from 2004 - 2007. He is a graduate of East Carolina University in Greenville, N.C. Mark A. Jeffries Chief Financial Officer A native of North Carolina, Lynn has been in the banking industry since 2003. Lynn was named Chief Operating Officer in 2017, after serving as chief administrative officer for Select Bank & Trust since 2014. She served as Corporate Ethics Officer and Human Resources Director from 2011 - 2014 and as the Human Resources Director from 2003 - 2014. Lynn is certified as a Senior Professional of Human Resources (SPHR) and as a Corporate Compliance Ethics Professional (CCEP). She is a graduate of Wake Technical Community College in Raleigh, N.C. Lynn H. Johnson Chief Operating Officer A native of Virginia, Rick has been in the banking industry since 1981. He has served as Chief Credit Officer for Select Bank & Trust since 2014. He served as Chief Credit Officer for New Century Bank from 2012 - 2014 and as a Senior Credit Administrator from 2008 - 2012. He is a graduate of Appalachian State University in Boone, N.C. David Richard “Rick” Tobin, Jr. Chief Credit Officer J. Gary Ciccone Chairman of the Board Mr. Ciccone has served as chairman of the board of directors of Select Bank & Trust and Select Bancorp, Inc. since April 2008. As owner and vice president of Nimocks , Ciccone & Townsend in Fayetteville, he has extensive experience in real estate development and commercial real estate brokerage while also developing and managing numerous commercial properties. Mr. Ciccone holds a B.S. in Business Administration from the University of North Carolina at Chapel Hill and a law degree from the University of North Carolina School of Law, Chapel Hill, N.C.
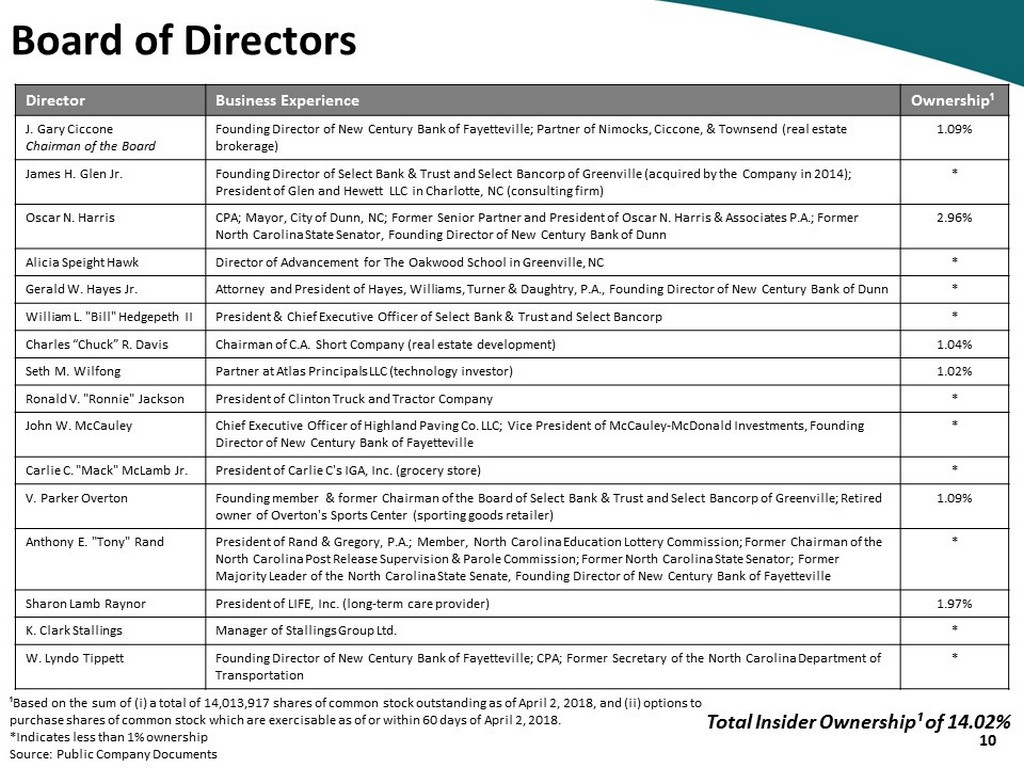
¹B ased on the sum of ( i ) a total of 14,013,917 shares of common stock outstanding as of April 2, 2018, and (ii) options to purchase shares of common stock which are exercisable as of or within 60 days of April 2, 2018. *Indicates less than 1% ownership Source: Public Company Documents 10 Board of Directors Director Business Experience Ownership¹ J. Gary Ciccone Chairman of the Board Founding Director of New Century Bank of Fayetteville; Partner of Nimocks , Ciccone, & Townsend (real estate brokerage) 1.09% James H. Glen Jr. Founding Director of Select Bank & Trust and Select Bancorp of Greenville (acquired by the Company in 2014); President of Glen and Hewett LLC in Charlotte, NC (consulting firm) * Oscar N. Harris CPA; Mayor, City of Dunn, NC; Former Senior Partner and President of Oscar N. Harris & Associates P.A.; Former North Carolina State Senator, Founding Director of New Century Bank of Dunn 2.96% Alicia Speight Hawk Director of Advancement for The Oakwood School in Greenville, NC * Gerald W. Hayes Jr. Attorney and President of Hayes, Williams, Turner & Daughtry, P.A., Founding Director of New Century Bank of Dunn * William L. "Bill" Hedgepeth II President & Chief Executive Officer of Select Bank & Trust and Select Bancorp * Charles “Chuck” R. Davis Chairman of C.A. Short Company (real estate development) 1.04% Seth M. Wilfong Partner at Atlas Principals LLC (technology investor) 1.02% Ronald V. "Ronnie" Jackson President of Clinton Truck and Tractor Company * John W. McCauley Chief Executive Officer of Highland Paving Co. LLC; Vice President of McCauley - McDonald Investments, Founding Director of New Century Bank of Fayetteville * Carlie C. "Mack" McLamb Jr. President of Carlie C's IGA, Inc. (grocery store) * V. Parker Overton Founding member & former Chairman of the Board of Select Bank & Trust and Select Bancorp of Greenville; Retired owner of Overton's Sports Center (sporting goods retailer) 1.09% Anthony E. "Tony" Rand President of Rand & Gregory, P.A.; Member, North Carolina Education Lottery Commission; Former Chairman of the North Carolina Post Release Supervision & Parole Commission; Former North Carolina State Senator; Former Majority Leader of the North Carolina State Senate, Founding Director of New Century Bank of Fayetteville * Sharon Lamb Raynor President of LIFE, Inc. (long - term care provider) 1.97% K. Clark Stallings Manager of Stallings Group Ltd. * W. Lyndo Tippett Founding Director of New Century Bank of Fayetteville; CPA; Former Secretary of the North Carolina Department of Transportation * Total Insider Ownership¹ of 14.02%
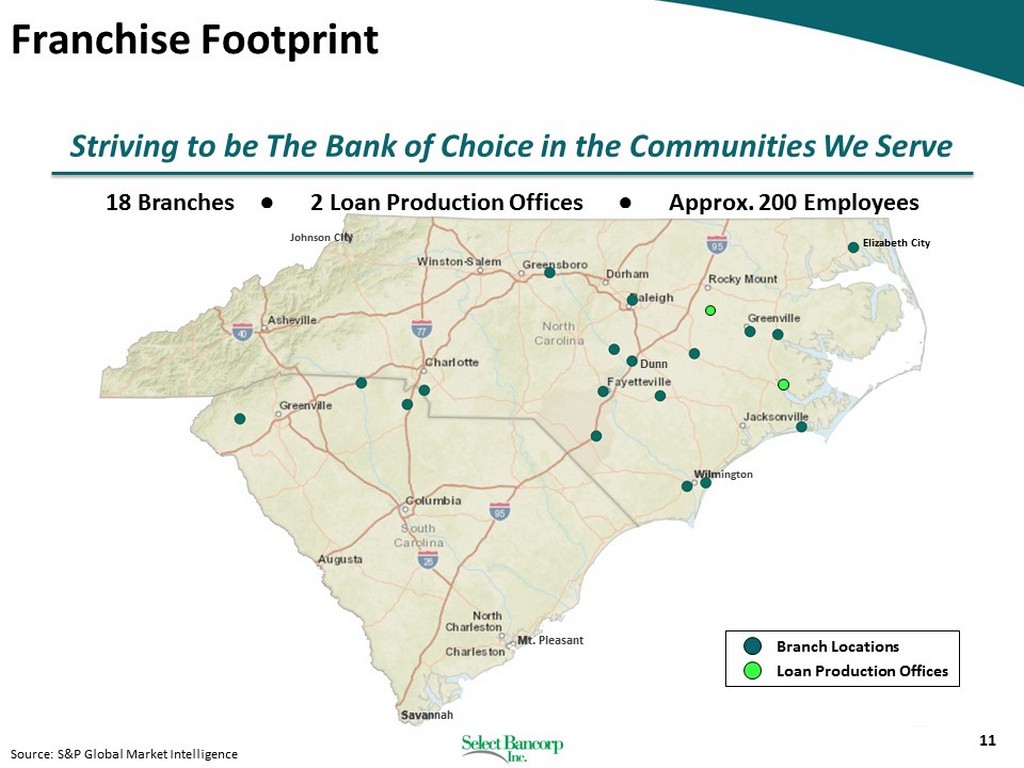
11 Franchise Footprint 18 Branches ● 2 Loan Production Offices ● Approx. 200 Employees Source: S&P Global Market Intelligence Striving to be The Bank of Choice in the Communities We Serve Wilmington Branch Locations Loan Production Offices Elizabeth City Dunn Mt. Pleasant Savannah Johnson City
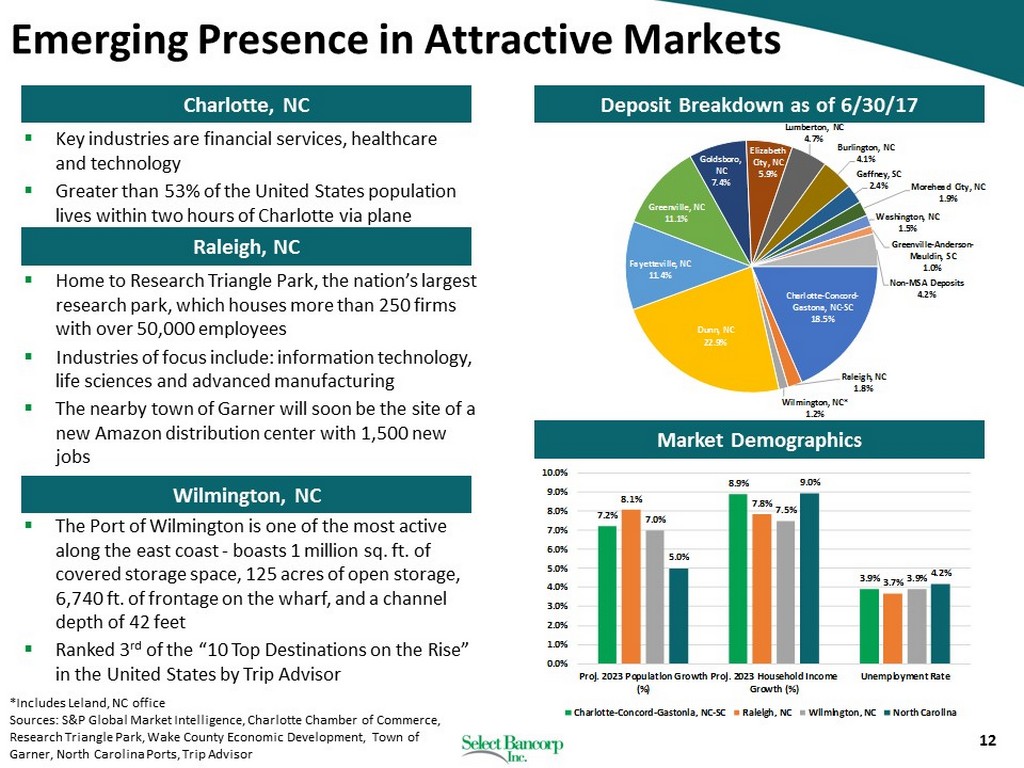
7.2% 8.9% 3.9% 8.1% 7.8% 3.7% 7.0% 7.5% 3.9% 5.0% 9.0% 4.2% 0.0% 1.0% 2.0% 3.0% 4.0% 5.0% 6.0% 7.0% 8.0% 9.0% 10.0% Proj. 2023 Population Growth (%) Proj. 2023 Household Income Growth (%) Unemployment Rate Charlotte-Concord-Gastonia, NC-SC Raleigh, NC Wilmington, NC North Carolina Charlotte - Concord - Gastona, NC - SC 18.5% Raleigh, NC 1.8% Wilmington, NC* 1.2% Dunn, NC 22.9% Fayetteville, NC 11.4% Greenville, NC 11.1% Goldsboro, NC 7.4% Elizabeth City, NC 5.9% Lumberton, NC 4.7% Burlington, NC 4.1% Gaffney, SC 2.4% Morehead City, NC 1.9% Washington, NC 1.5% Greenville - Anderson - Mauldin, SC 1.0% Non - MSA Deposits 4.2% 12 Emerging Presence in Attractive Markets *Includes Leland, NC office Sources: S&P Global Market Intelligence, Charlotte Chamber of Commerce, Research Triangle Park, Wake County Economic Development, Town of Garner, North Carolina Ports, Trip Advisor Charlotte, NC Raleigh, NC Wilmington, NC ▪ Key industries are financial services, healthcare and technology ▪ Greater than 53% of the United States population lives within two hours of Charlotte via plane ▪ Home to Research Triangle Park, the nation’s largest research park, which houses more than 250 firms with over 50,000 employees ▪ Industries of focus include: information technology, life sciences and advanced manufacturing ▪ The nearby town of Garner will soon be the site of a new Amazon distribution center with 1,500 new jobs ▪ The Port of Wilmington is one of the most active along the east coast - boasts 1 million sq. ft. of covered storage space, 125 acres of open storage, 6,740 ft. of frontage on the wharf, and a channel depth of 42 feet ▪ Ranked 3 rd of the “10 Top Destinations on the Rise” in the United States by Trip Advisor Deposit Breakdown as of 6/30/17 Market Demographics
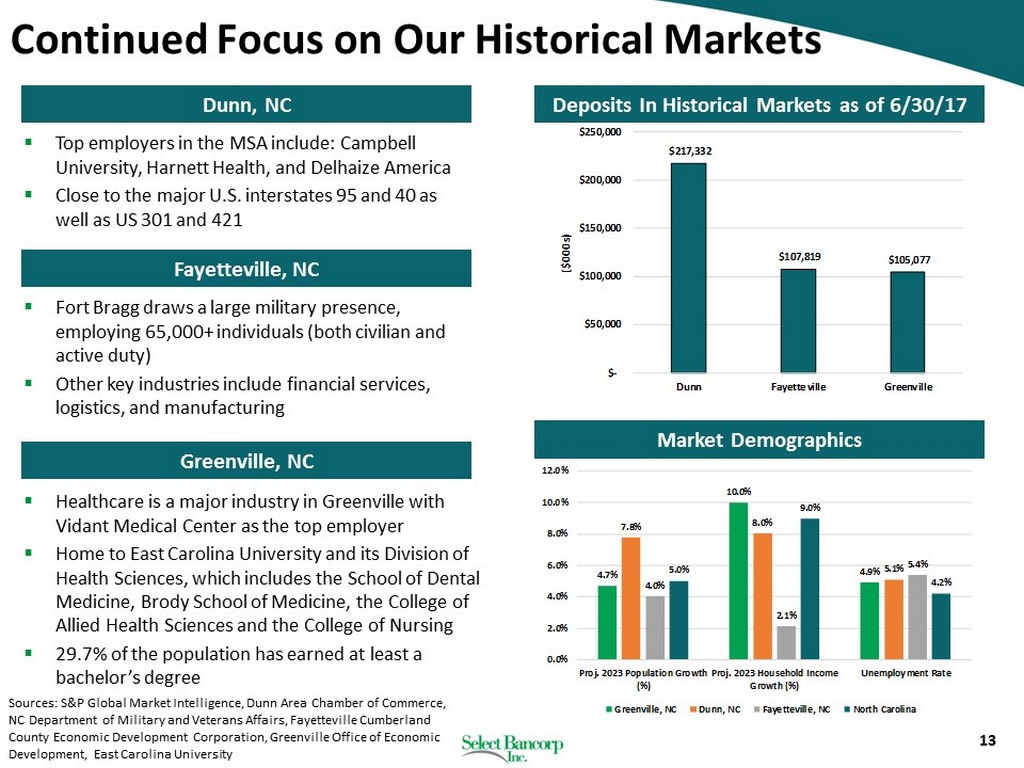
$217,332 $107,819 $105,077 $- $50,000 $100,000 $150,000 $200,000 $250,000 Dunn Fayetteville Greenville ($000s) 4.7% 10.0% 4.9% 7.8% 8.0% 5.1% 4.0% 2.1% 5.4% 5.0% 9.0% 4.2% 0.0% 2.0% 4.0% 6.0% 8.0% 10.0% 12.0% Proj. 2023 Population Growth (%) Proj. 2023 Household Income Growth (%) Unemployment Rate Greenville, NC Dunn, NC Fayetteville, NC North Carolina 13 Continued Focus on Our Historical Markets Sources: S&P Global Market Intelligence, Dunn Area Chamber of Commerce, NC Department of Military and Veterans Affairs, Fayetteville Cumberland County Economic Development Corporation, Greenville Office of Economic Development, East Carolina University Dunn, NC Fayetteville, NC Greenville, NC ▪ Top employers in the MSA include: Campbell University, Harnett Health, and Delhaize America ▪ Close to the major U.S. interstates 95 and 40 as well as US 301 and 421 ▪ Fort Bragg draws a large military presence, employing 65,000+ individuals (both civilian and active duty) ▪ Other key industries include financial services, logistics, and manufacturing ▪ Healthcare is a major industry in Greenville with Vidant Medical Center as the top employer ▪ Home to East Carolina University and its Division of Health Sciences, which includes the School of Dental Medicine, Brody School of Medicine, the College of Allied Health Sciences and the College of Nursing ▪ 29.7% of the population has earned at least a bachelor’s degree Market Demographics Deposits In Historical Markets as of 6/30/17
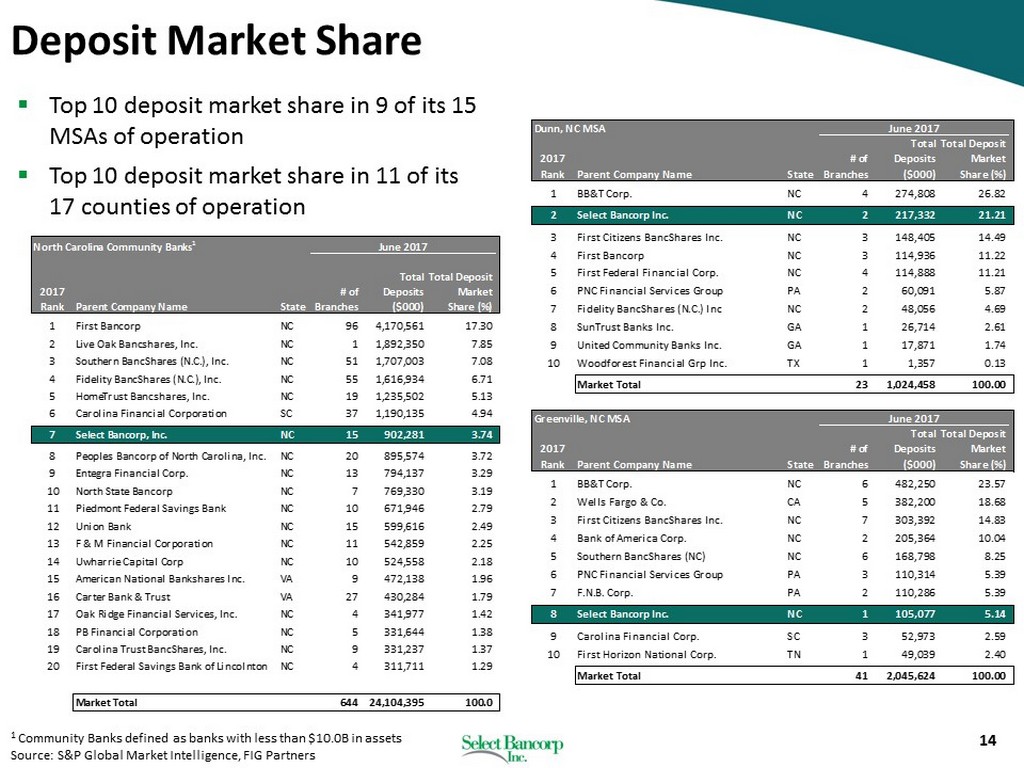
14 Deposit Market Share 1 Community Banks defined as banks with less than $10.0B in assets Source: S&P Global Market Intelligence, FIG Partners ▪ Top 10 deposit market share in 9 of its 15 MSAs of operation ▪ Top 10 deposit market share in 11 of its 17 counties of operation North Carolina Community Banks 1 2017 Rank Parent Company Name State # of Branches Total Deposits ($000) Total Deposit Market Share (%) 1 First Bancorp NC 96 4,170,561 17.30 2 Live Oak Bancshares, Inc. NC 1 1,892,350 7.85 3 Southern BancShares (N.C.), Inc. NC 51 1,707,003 7.08 4 Fidelity BancShares (N.C.), Inc. NC 55 1,616,934 6.71 5 HomeTrust Bancshares, Inc. NC 19 1,235,502 5.13 6 Carolina Financial Corporation SC 37 1,190,135 4.94 7 Select Bancorp, Inc. NC 15 902,281 3.74 8 Peoples Bancorp of North Carolina, Inc. NC 20 895,574 3.72 9 Entegra Financial Corp. NC 13 794,137 3.29 10 North State Bancorp NC 7 769,330 3.19 11 Piedmont Federal Savings Bank NC 10 671,946 2.79 12 Union Bank NC 15 599,616 2.49 13 F & M Financial Corporation NC 11 542,859 2.25 14 Uwharrie Capital Corp NC 10 524,558 2.18 15 American National Bankshares Inc. VA 9 472,138 1.96 16 Carter Bank & Trust VA 27 430,284 1.79 17 Oak Ridge Financial Services, Inc. NC 4 341,977 1.42 18 PB Financial Corporation NC 5 331,644 1.38 19 Carolina Trust BancShares, Inc. NC 9 331,237 1.37 20 First Federal Savings Bank of Lincolnton NC 4 311,711 1.29 Market Total 644 24,104,395 100.0 June 2017 Dunn, NC MSA 2017 Rank Parent Company Name State # of Branches Total Deposits ($000) Total Deposit Market Share (%) 1 BB&T Corp. NC 4 274,808 26.82 2 Select Bancorp Inc. NC 2 217,332 21.21 3 First Citizens BancShares Inc. NC 3 148,405 14.49 4 First Bancorp NC 3 114,936 11.22 5 First Federal Financial Corp. NC 4 114,888 11.21 6 PNC Financial Services Group PA 2 60,091 5.87 7 Fidelity BancShares (N.C.) Inc NC 2 48,056 4.69 8 SunTrust Banks Inc. GA 1 26,714 2.61 9 United Community Banks Inc. GA 1 17,871 1.74 10 Woodforest Financial Grp Inc. TX 1 1,357 0.13 Market Total 23 1,024,458 100.00 June 2017 Greenville, NC MSA 2017 Rank Parent Company Name State # of Branches Total Deposits ($000) Total Deposit Market Share (%) 1 BB&T Corp. NC 6 482,250 23.57 2 Wells Fargo & Co. CA 5 382,200 18.68 3 First Citizens BancShares Inc. NC 7 303,392 14.83 4 Bank of America Corp. NC 2 205,364 10.04 5 Southern BancShares (NC) NC 6 168,798 8.25 6 PNC Financial Services Group PA 3 110,314 5.39 7 F.N.B. Corp. PA 2 110,286 5.39 8 Select Bancorp Inc. NC 1 105,077 5.14 9 Carolina Financial Corp. SC 3 52,973 2.59 10 First Horizon National Corp. TN 1 49,039 2.40 Market Total 41 2,045,624 100.00 June 2017
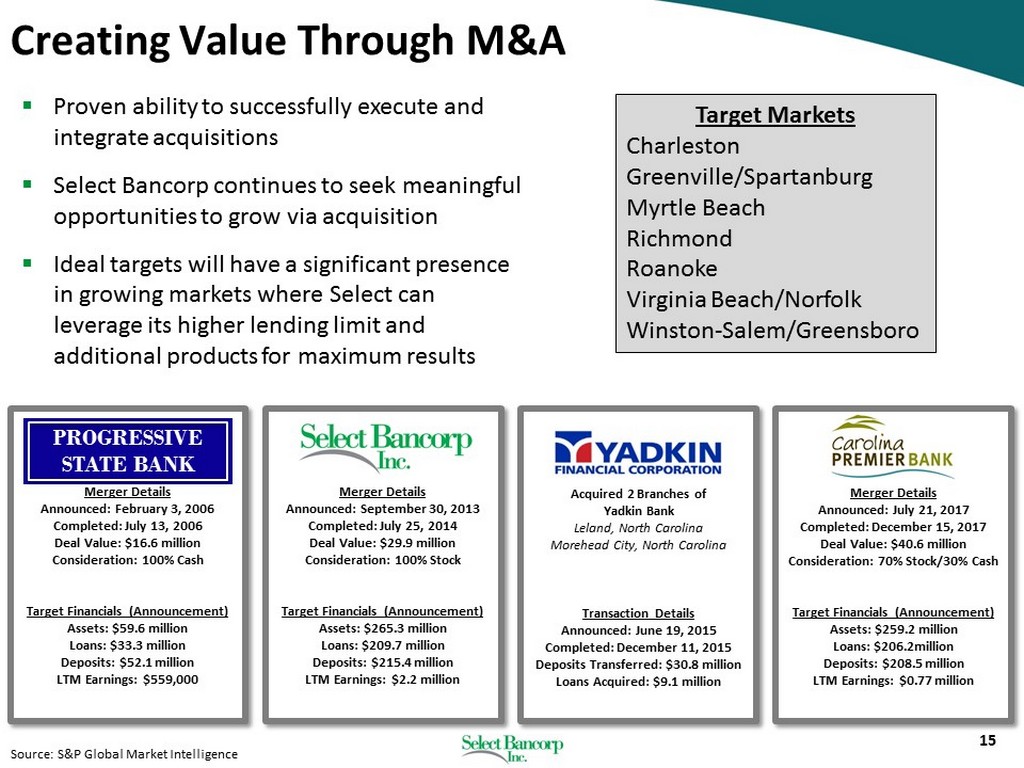
15 Creating Value Through M&A Merger Details Announced: July 21, 2017 Completed: December 15, 2017 Deal Value: $40.6 million Consideration: 70% Stock/30% Cash Target Financials (Announcement) Assets: $259.2 million Loans: $206.2million Deposits: $208.5 million LTM Earnings: $0.77 million Acquired 2 Branches of Yadkin Bank Leland, North Carolina Morehead City, North Carolina Transaction Details Announced: June 19, 2015 Completed: December 11, 2015 Deposits Transferred: $30.8 million Loans Acquired: $9.1 million Merger Details Announced: February 3, 2006 Completed: July 13, 2006 Deal Value: $16.6 million Consideration: 100% Cash Target Financials (Announcement) Assets: $59.6 million Loans: $33.3 million Deposits: $52.1 million LTM Earnings: $559,000 ▪ Proven ability to successfully execute and integrate acquisitions ▪ Select Bancorp continues to seek meaningful opportunities to grow via acquisition ▪ Ideal targets will have a significant presence in growing markets where Select can leverage its higher lending limit and additional products for maximum results Target Markets Charleston Greenville/Spartanburg Myrtle Beach Richmond Roanoke Virginia Beach/Norfolk Winston - Salem/Greensboro Merger Details Announced: September 30, 2013 Completed: July 25, 2014 Deal Value: $29.9 million Consideration: 100% Stock Target Financials (Announcement) Assets: $265.3 million Loans: $209.7 million Deposits: $215.4 million LTM Earnings: $2.2 million PROGRESSIVE STATE BANK Source: S&P Global Market Intelligence
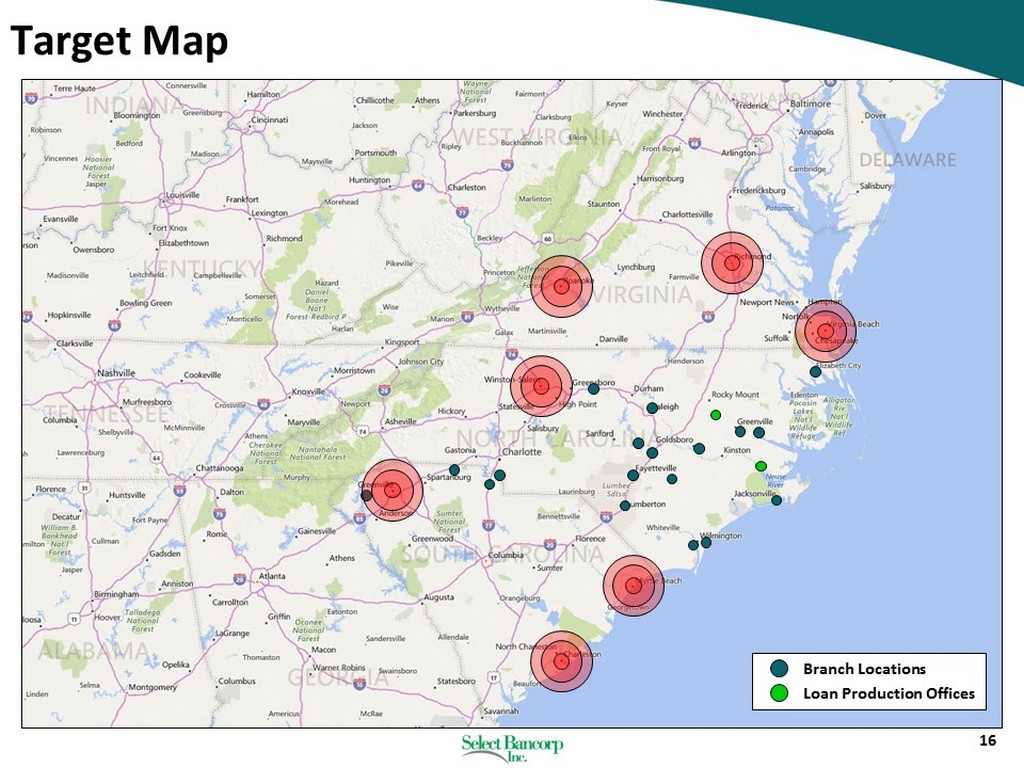
16 Target Map Branch Locations Loan Production Offices
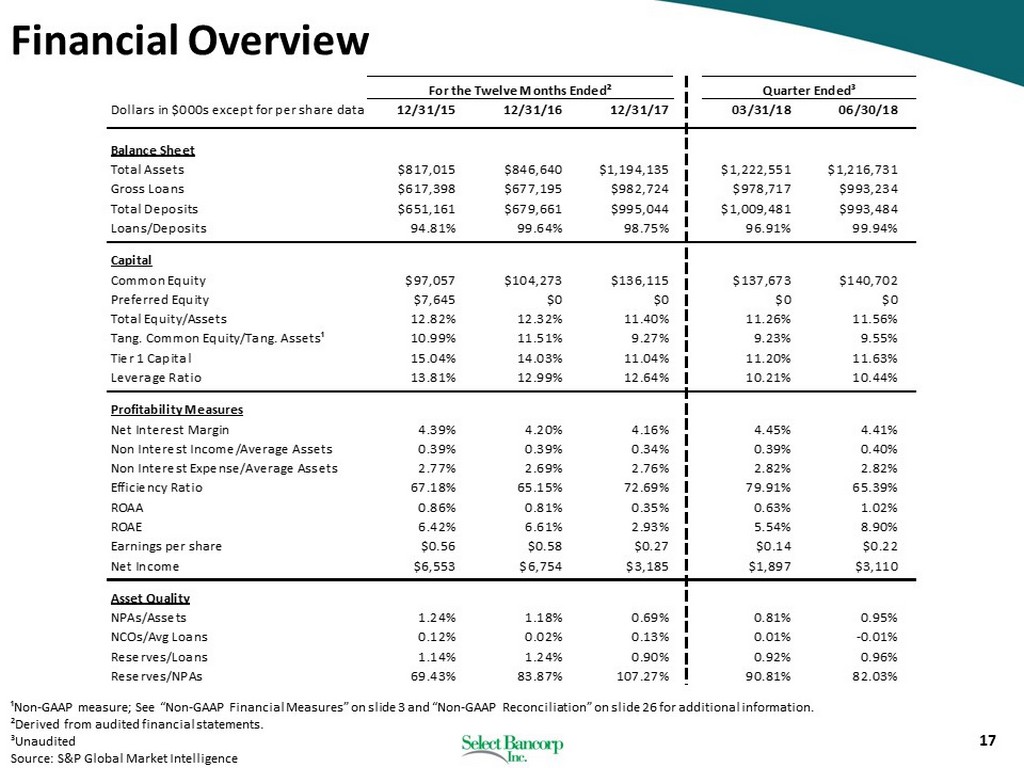
17 Financial Overview ¹Non - GAAP measure; See “Non - GAAP Financial Measures” on slide 3 and “Non - GAAP Reconciliation” on slide 26 for additional informa tion. ²Derived from audited financial statements. ³Unaudited Source: S&P Global Market Intelligence For the Twelve Months Ended² Dollars in $000s except for per share data 12/31/15 12/31/16 12/31/17 03/31/18 06/30/18 Balance Sheet Total Assets $817,015 $846,640 $1,194,135 $1,222,551 $1,216,731 Gross Loans $617,398 $677,195 $982,724 $978,717 $993,234 Total Deposits $651,161 $679,661 $995,044 $1,009,481 $993,484 Loans/Deposits 94.81% 99.64% 98.75% 96.91% 99.94% Capital Common Equity $97,057 $104,273 $136,115 $137,673 $140,702 Preferred Equity $7,645 $0 $0 $0 $0 Total Equity/Assets 12.82% 12.32% 11.40% 11.26% 11.56% Tang. Common Equity/Tang. Assets¹ 10.99% 11.51% 9.27% 9.23% 9.55% Tier 1 Capital 15.04% 14.03% 11.04% 11.20% 11.63% Leverage Ratio 13.81% 12.99% 12.64% 10.21% 10.44% Profitability Measures Net Interest Margin 4.39% 4.20% 4.16% 4.45% 4.41% Non Interest Income/Average Assets 0.39% 0.39% 0.34% 0.39% 0.40% Non Interest Expense/Average Assets 2.77% 2.69% 2.76% 2.82% 2.82% Efficiency Ratio 67.18% 65.15% 72.69% 79.91% 65.39% ROAA 0.86% 0.81% 0.35% 0.63% 1.02% ROAE 6.42% 6.61% 2.93% 5.54% 8.90% Earnings per share $0.56 $0.58 $0.27 $0.14 $0.22 Net Income $6,553 $6,754 $3,185 $1,897 $3,110 Asset Quality NPAs/Assets 1.24% 1.18% 0.69% 0.81% 0.95% NCOs/Avg Loans 0.12% 0.02% 0.13% 0.01% -0.01% Reserves/Loans 1.14% 1.24% 0.90% 0.92% 0.96% Reserves/NPAs 69.43% 83.87% 107.27% 90.81% 82.03% Quarter Ended³
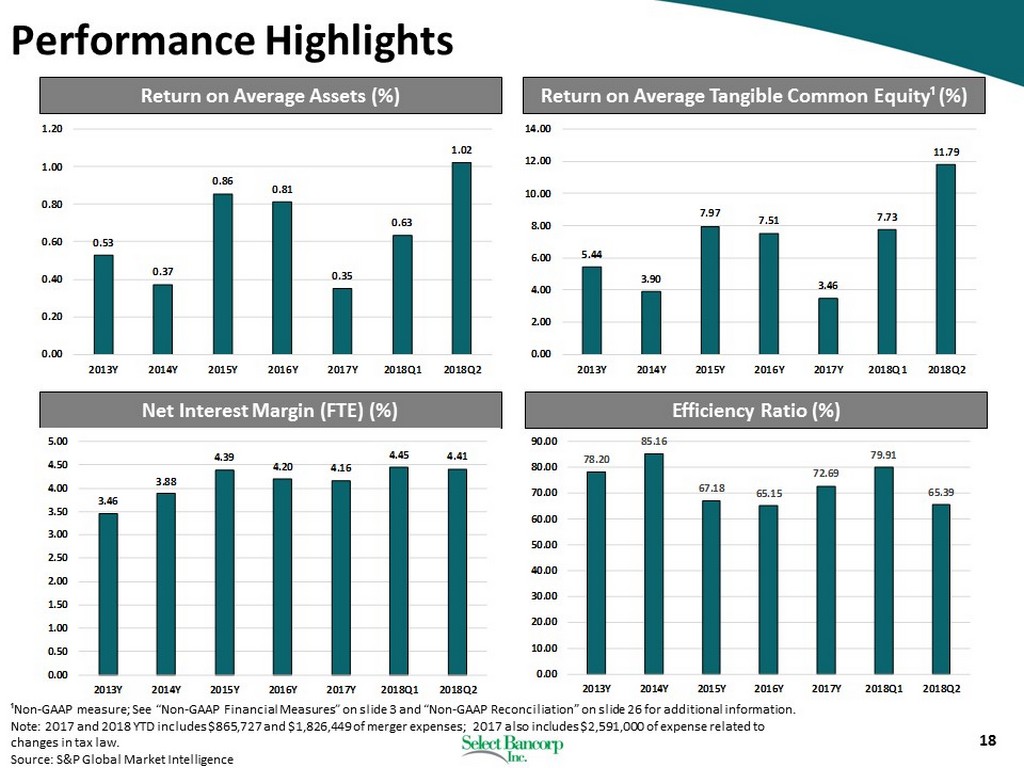
78.20 85.16 67.18 65.15 72.69 79.91 65.39 0.00 10.00 20.00 30.00 40.00 50.00 60.00 70.00 80.00 90.00 2013Y 2014Y 2015Y 2016Y 2017Y 2018Q1 2018Q2 18 5.44 3.90 7.97 7.51 3.46 7.73 11.79 0.00 2.00 4.00 6.00 8.00 10.00 12.00 14.00 2013Y 2014Y 2015Y 2016Y 2017Y 2018Q1 2018Q2 0.53 0.37 0.86 0.81 0.35 0.63 1.02 0.00 0.20 0.40 0.60 0.80 1.00 1.20 2013Y 2014Y 2015Y 2016Y 2017Y 2018Q1 2018Q2 Return on Average Tangible Common Equity¹ (%) Return on Average Assets (%) Net Interest Margin (FTE) (%) Efficiency Ratio (%) ¹Non - GAAP measure; See “Non - GAAP Financial Measures” on slide 3 and “Non - GAAP Reconciliation” on slide 26 for additional informa tion. Note: 2017 and 2018 YTD includes $865,727 and $1,826,449 of merger expenses; 2017 also includes $2,591,000 of expense relate d t o changes in tax law. Source: S&P Global Market Intelligence Performance Highlights 3.46 3.88 4.39 4.20 4.16 4.45 4.41 0.00 0.50 1.00 1.50 2.00 2.50 3.00 3.50 4.00 4.50 5.00 2013Y 2014Y 2015Y 2016Y 2017Y 2018Q1 2018Q2
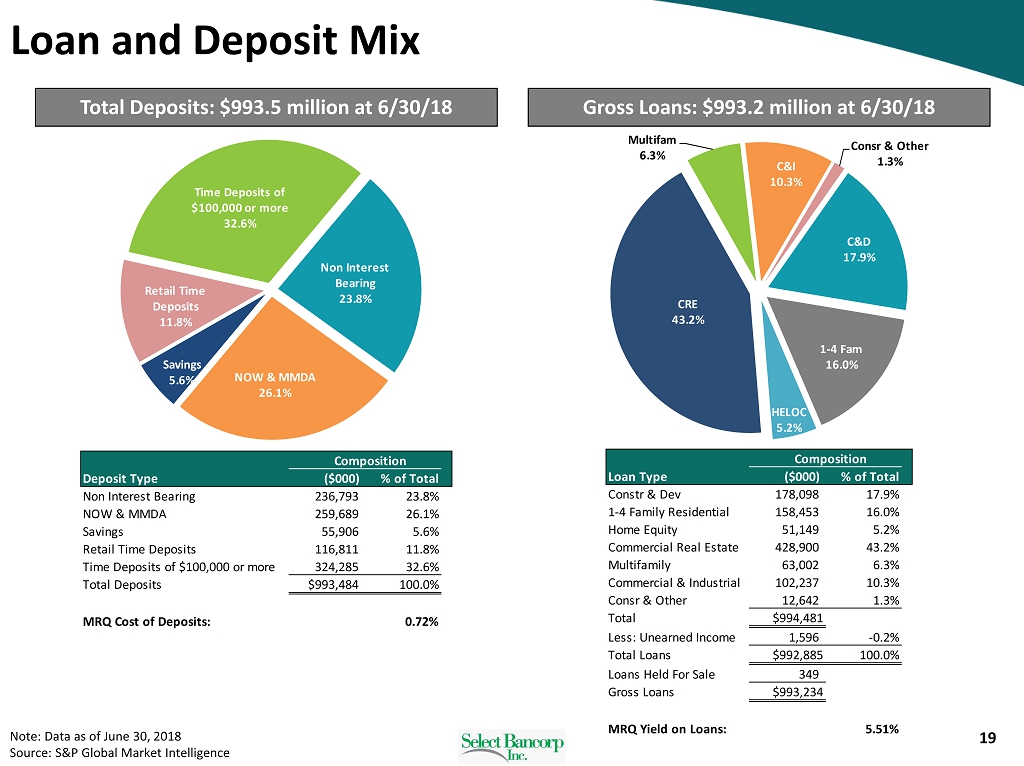
C&D 17.9% 1 - 4 Fam 16.0% HELOC 5.2% CRE 43.2% Multifam 6.3% C&I 10.3% Consr & Other 1.3% 19 Non Interest Bearing 23.8% NOW & MMDA 26.1% Savings 5.6% Retail Time Deposits 11.8% Time Deposits of $100,000 or more 32.6% Note: Data as of June 30, 2018 Source: S&P Global Market Intelligence Total Deposits: $993.5 million at 6/30/18 Gross Loans: $993.2 million at 6/30/18 Loan and Deposit Mix Composition Deposit Type ($000) % of Total Non Interest Bearing 236,793 23.8% NOW & MMDA 259,689 26.1% Savings 55,906 5.6% Retail Time Deposits 116,811 11.8% Time Deposits of $100,000 or more 324,285 32.6% Total Deposits $993,484 100.0% MRQ Cost of Deposits: 0.72% Composition Loan Type ($000) % of Total Constr & Dev 178,098 17.9% 1-4 Family Residential 158,453 16.0% Home Equity 51,149 5.2% Commercial Real Estate 428,900 43.2% Multifamily 63,002 6.3% Commercial & Industrial 102,237 10.3% Consr & Other 12,642 1.3% Total $994,481 Less: Unearned Income 1,596 -0.2% Total Loans $992,885 100.0% Loans Held For Sale 349 Gross Loans $993,234 MRQ Yield on Loans: 5.51%
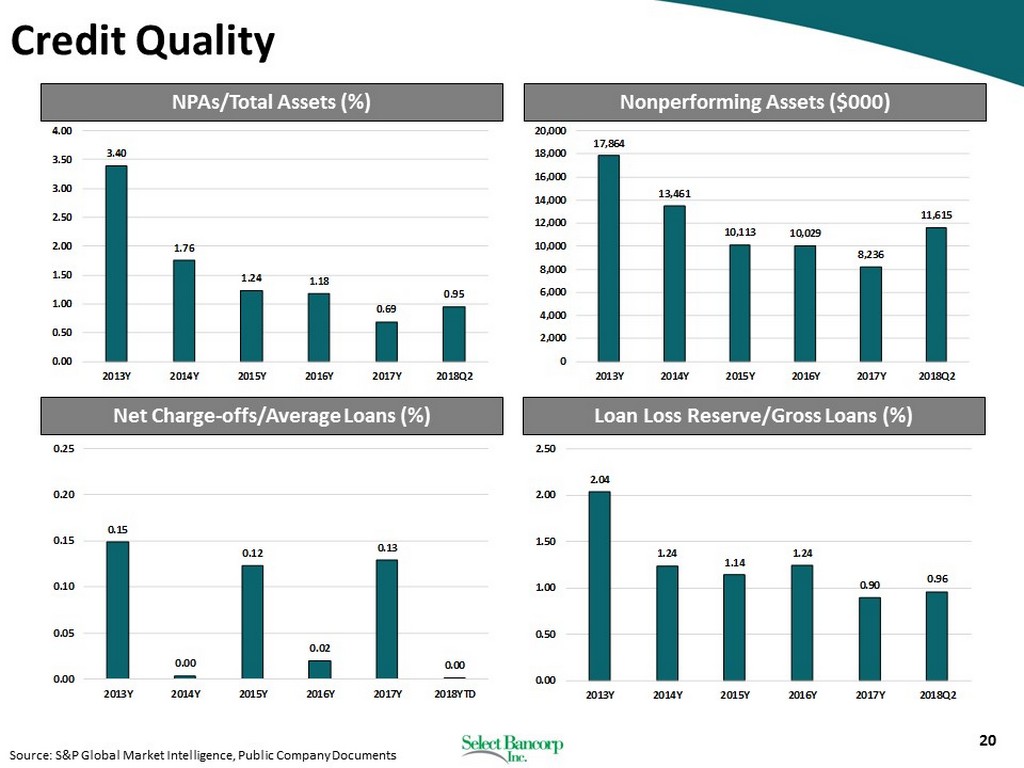
20 2.04 1.24 1.14 1.24 0.90 0.96 0.00 0.50 1.00 1.50 2.00 2.50 2013Y 2014Y 2015Y 2016Y 2017Y 2018Q2 0.15 0.00 0.12 0.02 0.13 0.00 0.00 0.05 0.10 0.15 0.20 0.25 2013Y 2014Y 2015Y 2016Y 2017Y 2018YTD 17,864 13,461 10,113 10,029 8,236 11,615 0 2,000 4,000 6,000 8,000 10,000 12,000 14,000 16,000 18,000 20,000 2013Y 2014Y 2015Y 2016Y 2017Y 2018Q2 3.40 1.76 1.24 1.18 0.69 0.95 0.00 0.50 1.00 1.50 2.00 2.50 3.00 3.50 4.00 2013Y 2014Y 2015Y 2016Y 2017Y 2018Q2 NPAs/Total Assets (%) Nonperforming Assets ($000) Net Charge - offs/Average Loans (%) Loan Loss Reserve/Gross Loans (%) Source: S&P Global Market Intelligence, Public Company Documents Credit Quality
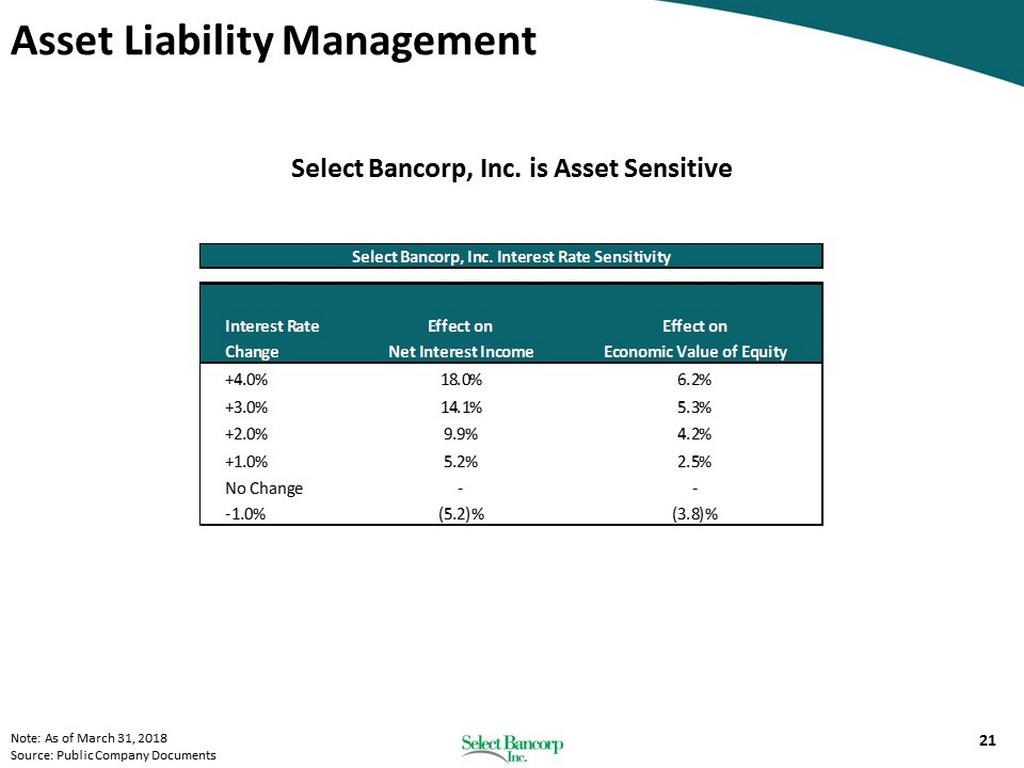
21 Note: As of March 31, 2018 Source: Public Company Documents Asset Liability Management Interest Rate Effect on Effect on Change Net Interest Income Economic Value of Equity +4.0% 18.0% 6.2% +3.0% 14.1% 5.3% +2.0% 9.9% 4.2% +1.0% 5.2% 2.5% No Change - - -1.0% (5.2)% (3.8)% Select Bancorp, Inc. Interest Rate Sensitivity Select Bancorp, Inc. is Asset Sensitive
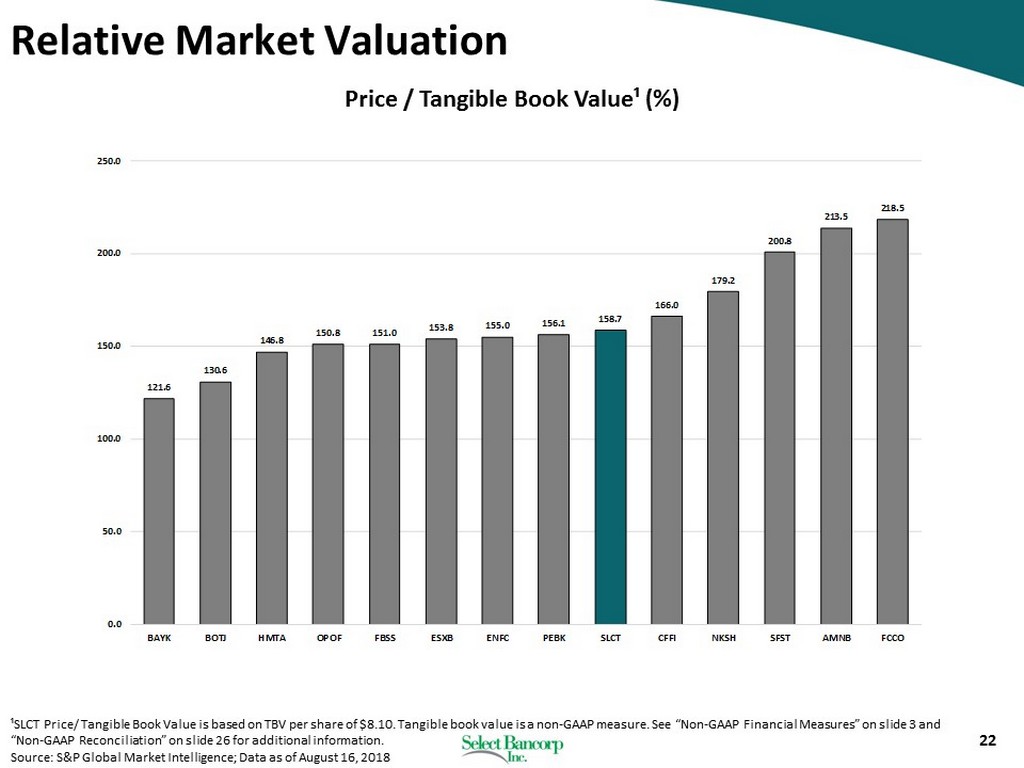
22 ¹SLCT Price/ Tangible Book Value is based on TBV per share of $8.10. Tangible book value is a non - GAAP measure. See “Non - GAAP Fi nancial Measures” on slide 3 and “Non - GAAP Reconciliation” on slide 26 for additional information. Source: S&P Global Market Intelligence; Data as of August 16, 2018 Relative Market Valuation Price / Tangible Book Value¹ (%) 121.6 130.6 146.8 150.8 151.0 153.8 155.0 156.1 158.7 166.0 179.2 200.8 213.5 218.5 0.0 50.0 100.0 150.0 200.0 250.0 BAYK BOTJ HMTA OPOF FBSS ESXB ENFC PEBK SLCT CFFI NKSH SFST AMNB FCCO
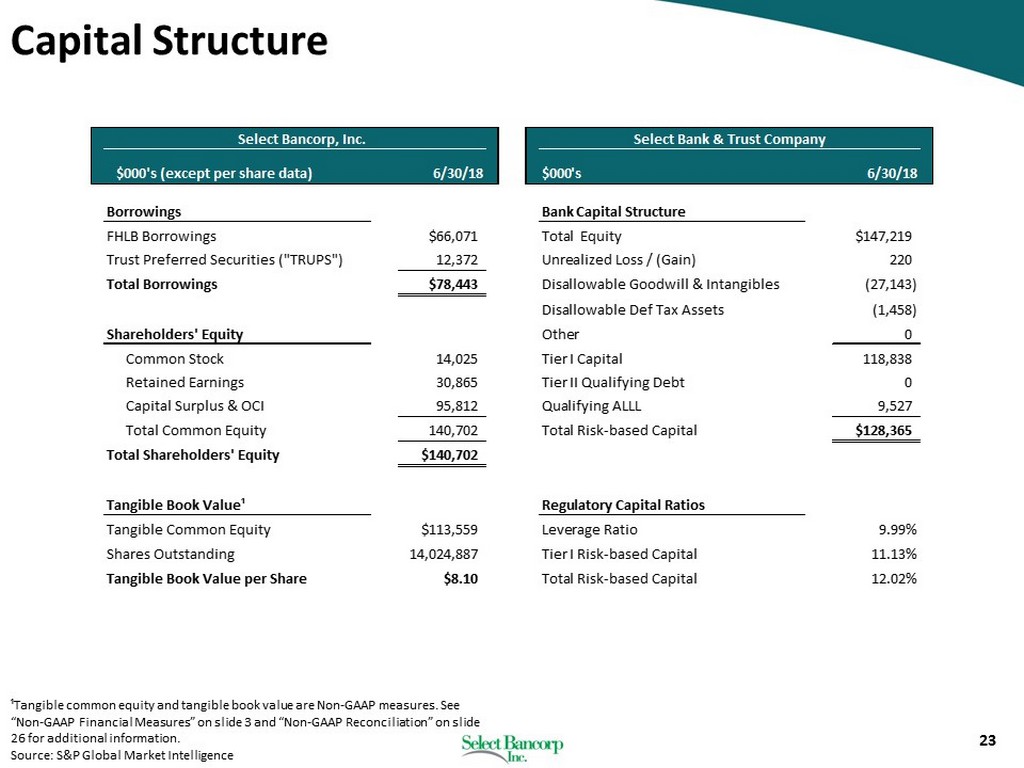
23 ¹Tangible common equity and tangible book value are Non - GAAP measures. See “Non - GAAP Financial Measures” on slide 3 and “Non - GAAP Reconciliation” on slide 26 for additional information. Source: S&P Global Market Intelligence Capital Structure Select Bancorp, Inc. Select Bank & Trust Company $000's (except per share data) 6/30/18 $000's 6/30/18 Borrowings Bank Capital Structure FHLB Borrowings $66,071 Total Equity $147,219 Trust Preferred Securities ("TRUPS") 12,372 Unrealized Loss / (Gain) 220 Total Borrowings $78,443 Disallowable Goodwill & Intangibles (27,143) Disallowable Def Tax Assets (1,458) Shareholders' Equity Other 0 Common Stock 14,025 Tier I Capital 118,838 Retained Earnings 30,865 Tier II Qualifying Debt 0 Capital Surplus & OCI 95,812 Qualifying ALLL 9,527 Total Common Equity 140,702 Total Risk-based Capital $128,365 Total Shareholders' Equity $140,702 Tangible Book Value¹ Regulatory Capital Ratios Tangible Common Equity $113,559 Leverage Ratio 9.99% Shares Outstanding 14,024,887 Tier I Risk-based Capital 11.13% Tangible Book Value per Share $8.10 Total Risk-based Capital 12.02%
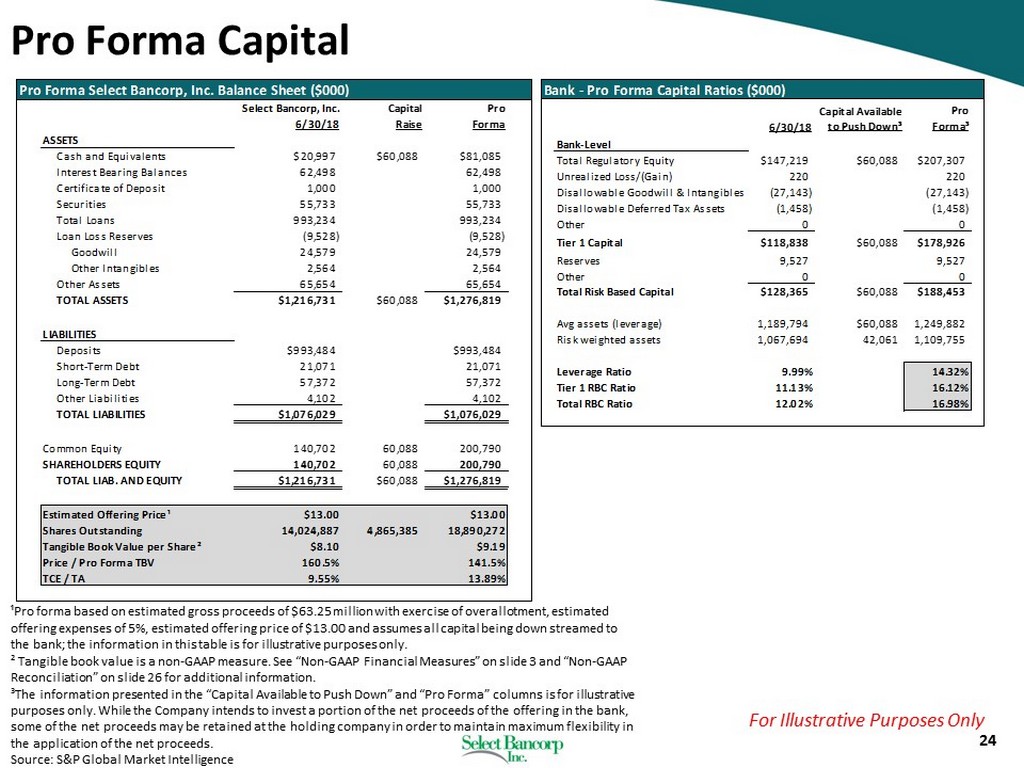
24 ¹Pro forma based on estimated gross proceeds of $63.25 million with exercise of overallotment, estimated offering expenses of 5%, estimated offering price of $13.00 and assumes all capital being down streamed to the bank; the information in this table is for illustrative purposes only. ² Tangible book value is a non - GAAP measure. See “Non - GAAP Financial Measures” on slide 3 and “Non - GAAP Reconciliation” on slide 26 for additional information. ³The information presented in the “Capital Available to Push Down” and “Pro Forma” columns is for illustrative purposes only. While the Company intends to invest a portion of the net proceeds of the offering in the bank, some of the net proceeds may be retained at the holding company in order to maintain maximum flexibility in the application of the net proceeds. Source: S&P Global Market Intelligence Pro Forma Capital Pro Forma Select Bancorp, Inc. Balance Sheet ($000) Select Bancorp, Inc. Capital Pro 6/30/18 Raise Forma ASSETS Cash and Equivalents $20,997 $60,088 $81,085 Interest Bearing Balances 62,498 62,498 Certificate of Deposit 1,000 1,000 Securities 55,733 55,733 Total Loans 993,234 993,234 Loan Loss Reserves (9,528) (9,528) Goodwill 24,579 24,579 Other Intangibles 2,564 2,564 Other Assets 65,654 65,654 TOTAL ASSETS $1,216,731 $60,088 $1,276,819 LIABILITIES Deposits $993,484 $993,484 Short-Term Debt 21,071 21,071 Long-Term Debt 57,372 57,372 Other Liabilities 4,102 4,102 TOTAL LIABILITIES $1,076,029 $1,076,029 Common Equity 140,702 60,088 200,790 SHAREHOLDERS EQUITY 140,702 60,088 200,790 TOTAL LIAB. AND EQUITY $1,216,731 $60,088 $1,276,819 Estimated Offering Price¹ $13.00 $13.00 Shares Outstanding 14,024,887 4,865,385 18,890,272 Tangible Book Value per Share² $8.10 $9.19 Price / Pro Forma TBV 160.5% 141.5% TCE / TA 9.55% 13.89% Bank - Pro Forma Capital Ratios ($000) Capital Available Pro 6/30/18 to Push Down³ Forma³ Bank-Level Total Regulatory Equity $147,219 $60,088 $207,307 Unrealized Loss/(Gain) 220 220 Disallowable Goodwill & Intangibles (27,143) (27,143) Disallowable Deferred Tax Assets (1,458) (1,458) Other 0 0 Tier 1 Capital $118,838 $60,088 $178,926 Reserves 9,527 9,527 Other 0 0 Total Risk Based Capital $128,365 $60,088 $188,453 Avg assets (leverage) 1,189,794 $60,088 1,249,882 Risk weighted assets 1,067,694 42,061 1,109,755 Leverage Ratio 9.99% 14.32% Tier 1 RBC Ratio 11.13% 16.12% Total RBC Ratio 12.02% 16.98% For Illustrative Purposes Only
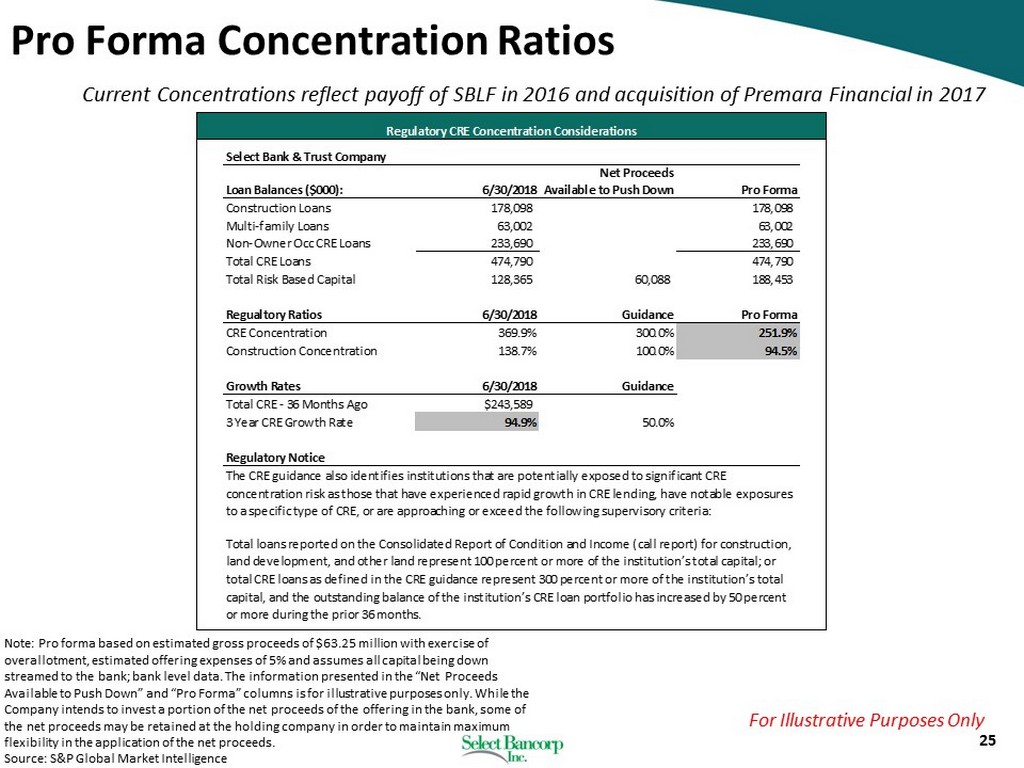
25 Note: Pro forma based on estimated gross proceeds of $63.25 million with exercise of overallotment, estimated offering expenses of 5% and assumes all capital being down streamed to the bank; bank level data. The information presented in the “Net Proceeds Available to Push Down” and “Pro Forma” columns is for illustrative purposes only. While the Company intends to invest a portion of the net proceeds of the offering in the bank, some of the net proceeds may be retained at the holding company in order to maintain maximum flexibility in the application of the net proceeds. Source: S&P Global Market Intelligence Pro Forma Concentration Ratios Current Concentrations reflect payoff of SBLF in 2016 and acquisition of Premara Financial in 2017 For Illustrative Purposes Only Regulatory CRE Concentration Considerations Select Bank & Trust Company Loan Balances ($000): 6/30/2018 Net Proceeds Available to Push Down Pro Forma Construction Loans 178,098 178,098 Multi-family Loans 63,002 63,002 Non-Owner Occ CRE Loans 233,690 233,690 Total CRE Loans 474,790 474,790 Total Risk Based Capital 128,365 60,088 188,453 Regualtory Ratios 6/30/2018 Guidance Pro Forma CRE Concentration 369.9% 300.0% 251.9% Construction Concentration 138.7% 100.0% 94.5% Growth Rates 6/30/2018 Guidance Total CRE - 36 Months Ago $243,589 3 Year CRE Growth Rate 94.9% 50.0% Regulatory Notice The CRE guidance also identifies institutions that are potentially exposed to significant CRE concentration risk as those that have experienced rapid growth in CRE lending, have notable exposures to a specific type of CRE, or are approaching or exceed the following supervisory criteria: Total loans reported on the Consolidated Report of Condition and Income (call report) for construction, land development, and other land represent 100 percent or more of the institution’s total capital; or total CRE loans as defined in the CRE guidance represent 300 percent or more of the institution’s total capital, and the outstanding balance of the institution’s CRE loan portfolio has increased by 50 percent or more during the prior 36 months.
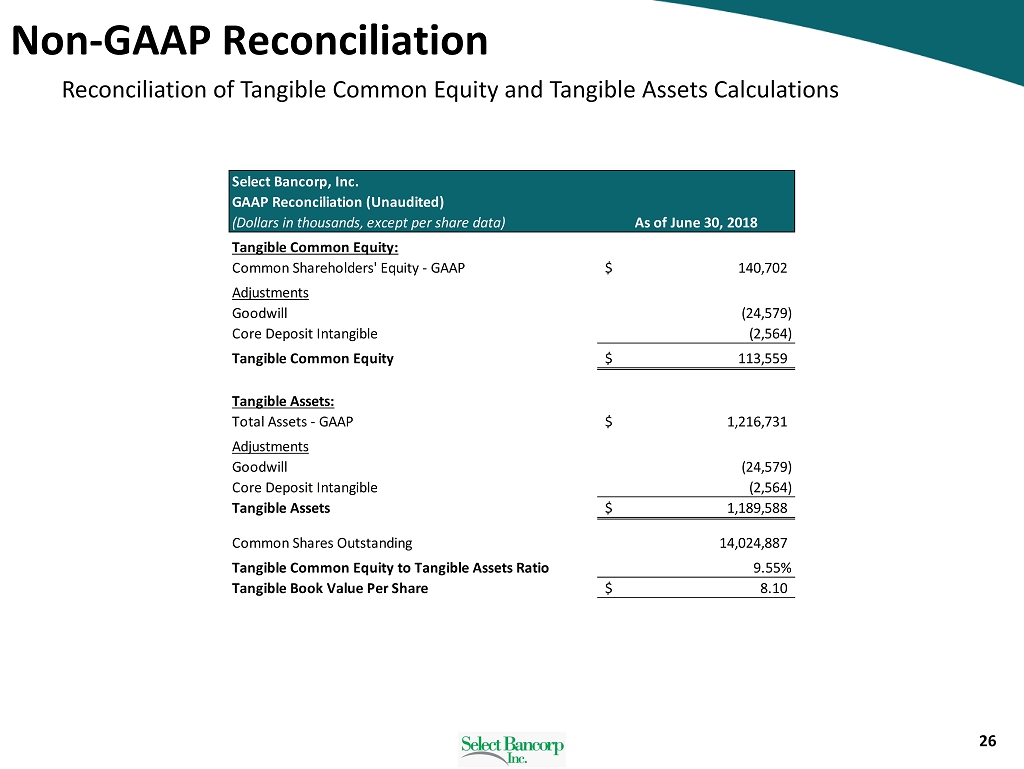
26 Non - GAAP Reconciliation Reconciliation of Tangible Common Equity and Tangible Assets Calculations Select Bancorp, Inc. GAAP Reconciliation (Unaudited) (Dollars in thousands, except per share data) As of June 30, 2018 Tangible Common Equity: Common Shareholders' Equity - GAAP 140,702$ Adjustments Goodwill (24,579) Core Deposit Intangible (2,564) Tangible Common Equity 113,559$ Tangible Assets: Total Assets - GAAP 1,216,731$ Adjustments Goodwill (24,579) Core Deposit Intangible (2,564) Tangible Assets 1,189,588$ Common Shares Outstanding 14,024,887 Tangible Common Equity to Tangible Assets Ratio 9.55% Tangible Book Value Per Share 8.10$
27