| 1) | Including group company shares 32.65% |
| 2) | Including group company shares 35.26% |
| 3) | Including group company shares 7.86% |
| 4) | Including group company shares 20.00% |
10
UNITED STATES
SECURITIES AND EXCHANGE COMMISSION
Washington, D.C. 20549
Form 6-K
REPORT OF FOREIGN PRIVATE ISSUER
PURSUANT TO RULE 13a-16 OR 15d-16 UNDER
THE SECURITIES EXCHANGE ACT OF 1934
For the month of March 2026
Commission File Number: 001-31811
Woori Financial Group Inc.
(Translation of registrant’s name into English)
51, Sogong-ro, Jung-gu, Seoul, 04632, Korea
(Address of principal executive office)
Indicate by check mark whether the registrant files or will file annual reports under cover of Form 20-F or Form 40-F.
Form 20-F ☒ Form 40-F ☐
Index
| 1. |
| - | For the Audit Reports of Woori Financial Group for Fiscal Year 2025, please refer to the exhibits to the Form 6-K furnished to the U.S. Securities and Exchange Commission on March 4, 2026. |
2
Summary of 2025 Business Report
3
Except where indicated otherwise, financial information contained in this document (including the attached financial statements) has been prepared in accordance with the Korean equivalent of International Financial Reporting Standards (“Korean IFRS”), which differ in certain important respects from generally accepted accounting principles in the United States.
All references to “Woori Financial Group,” “we,” “us” or the “Company” are to Woori Financial Group Inc. and, unless the context requires otherwise, its subsidiaries. In addition, all references to “Won” or “KRW” in this document are to the currency of the Republic of Korea.
4
| I. | Introduction of the Company |
| 1. | Overview of the Company |
| a. | History (Recent 5 years) |
| January 15, 2021 | Joined the Carbon Disclosure Project (CDP), announced support for the Task force on Climate related Financial Disclosure (TCFD) and established the ESG management principles of the Company | |
| March 5, 2021 | Established the Board ESG Management Committee | |
| March 12, 2021 | Integrated Woori Savings Bank as a first-tier subsidiary of the Company | |
| April 9, 2021 | After-hours trading of a 2% stake in the Company by the Korea Deposit Insurance Corporation | |
| April 15, 2021 | Purchased additional equity shares of Woori Financial Capital Co., Ltd., increasing the Company’s equity ownership by 12.9% | |
| May 13, 2021 | Participated in the capital increase of Woori Savings Bank (KRW 100 billion) | |
| May 24, 2021 | Purchased 3.6% of Woori Financial Capital Co., Ltd. in treasury shares | |
| June 4, 2021 | Entered into a stock exchange agreement to acquire the remaining shares of Woori Financial Capital Co., Ltd. | |
| August 10, 2021 | Integrated Woori Financial Capital Co., Ltd., as a wholly-owned subsidiary of the Company (Completion of stock exchange) | |
| September 9, 2021 | Announcement of contemplated sales of the remaining stake in the Company held by the Korea Deposit Insurance Corporation | |
| October 8, 2021 | Joined the SBTi (Science Based Targets initiative) as part of the roadmap for achieving carbon neutrality | |
| November 2, 2021 | Obtained regulatory approval for using the IRB (Internal Rating Based) approach | |
| November 9, 2021 | Obtained ‘AA’ rating from MSCI ESG assessment (2 grades higher than the previous year), ‘A’ rating from KCGS(Korea Corporate Governance Service)(1 grade higher than the previous year) | |
5
| November 17, 2021 | Included newly in Asia Pacific Index of DJSI (Dow Jones Sustainability Indices) | |
| December 9, 2021 | Achieved practically full privatization through the decrease of the KDIC’S stake in us from 15.1% to 5.8%, changing the largest shareholder from the KDIC to the Employee Stock Ownership Association of the Company | |
| December 26, 2021 | Launched the Group integrated car finance platform “Woori WON Car” | |
| January 7, 2022 | Officially launched the NPL investment company Woori Financial F&I Inc. | |
| January 13, 2022 | Joined the global environment initiative Taskforce on Nature-related Financial Disclosures (TNFD) | |
| February 4, 2022 | Recognized as an ‘Industry Mover’ in a sustainability assessment by S&P Global for 2022 | |
| February 10, 2022 | Disposal by the Korea Deposit Insurance Corporation of a 2.2% stake in the Company (reducing the KDIC’s stake in the Company from 5.8% to 3.6%) | |
| May 11, 2022 | Became the first company in the world to join the launch of the ‘Business for Land (B4L) Initiative’ for the protection of sustainable forests and the recovery of land degradation | |
| May 18, 2022 | Disposal by the Korea Deposit Insurance Corporation of a 2.3% stake in the Company (reducing the KDIC’s stake in the Company from 3.6% to 1.3%) | |
| June 19, 2022 | Held the inaugural meeting of Woori Financial Future Foundation | |
| August 22, 2022 | Joined the ‘Partnership for Biodiversity Accounting Financials(PBAF)’ as the first Asian company | |
| November 7, 2022 | Held the global conference ‘Sustainable Finance for a Better World’ | |
| December 14, 2022 | Signatory of Statement from the Financial Sector at the Conference of the Parties to the ‘UN Convention on Biological Diversity(UN CBD)’ | |
| December 29, 2022 | Received ‘AA’ rating from MSCI ESG Research for 2 consecutive years | |
6
| January 16, 2023 | Completed the establishment of the ‘WON Synergy’ system to create effective synergy within group companies | |
| January 26, 2023 | Became the first financial company in Korea to join the ‘Finance Leadership Group on Plastics’ hosted by ‘UN Environment Programme Finance Initiative (UNEP FI)’ | |
| February 27, 2023 | Entered into a stock purchase agreement to acquire Daol Investment (52% ownership) | |
| March 23, 2023 | Daol Investment, re-named Woori Venture Partners, incorporated as a subsidiary into Woori Financial Holdings | |
| March 24, 2023 | Jong-Yong Yim appointed as the 9th chairman of the Company (4th annual general meeting of shareholders of the Company) | |
| April 21, 2023 | Resolved to repurchase and cancel treasury shares, a first-time since the transition to a holding company | |
| June 01, 2023 | Entered into a comprehensive stock exchange agreement with Woori Investment Bank and Woori Venture Partners | |
| August 08, 2023 | Woori Investment Bank and Woori Venture Partners to each become a wholly-owned subsidiary of the Company | |
| August 24, 2023 | Group Carbon Emission Reduction Target validated by SBTi (Science Based Targets initiative) | |
| October 05, 2023 | Entered into a memorandum of understanding with the Korea Deposit Insurance Corporation to purchase its remaining stake in the Company (1.2%) | |
| December 22, 2023 | A capital increase of KRW 500 billion conducted by Woori Investment Bank (to enhance competitiveness) | |
| December 26, 2023 | Obtained an ‘AAA’ rating from MSCI ESG assessment | |
| March 13, 2024 | Resolved to acquire and cancel the remaining shares owned by the Korea Deposit Insurance Corporation | |
| August 1, 2024 | Established Woori Investment Securities Co., Ltd. as a new direct subsidiary | |
7
| August 28, 2024 | Entered into share purchase agreements to acquire Tongyang Life Insurance and ABL Life Insurance | |
| September 24, 2024 | Included in the ‘KRX Korea Value-up Index’ | |
| November 28, 2024 | Launched the new universal banking mobile application NEW ‘Woori WON Banking’ | |
| December 17, 2024 | Included in the Dow Jones Sustainability Indexes (DJSI) World Index | |
| March 26, 2025 | Established the Ethics and Internal Controls Committee under the Board of Directors | |
| July 1, 2025 | Incorporated Tongyang Life Insurance and ABL Life Insurance as subsidiaries of the Company | |
| July 31, 2025 | Integrated Woori Asset Trust Co., Ltd. as a wholly-owned subsidiary of the Company | |
| October 13, 2025 | Held the ‘Woori Financial Together Festa’ customer appreciation festival, which was the first integrated promotion in the financial industry | |
| December 18, 2025 | Received the Minister of Science and ICT Award in the excellence in adoption category at the ‘2025 Cloud Industry Awards’ | |
| January 26, 2026 | Launched the first integrated bank and securities wealth management branch | |
| b. | Affiliated Companies |
| (1) | Overview of Business Group |
| 1. | Name of business group: Woori Financial Group Inc. |
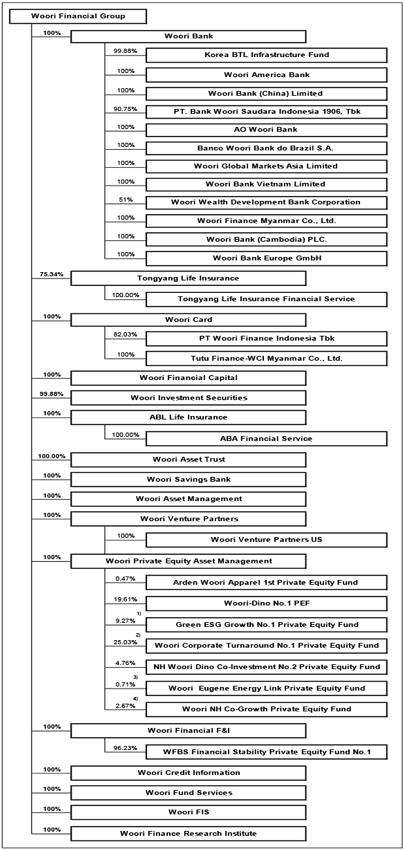
| (2) | Affiliated companies within the business group |
As of December 31, 2025
| Type |
Name of Company | |
| Listed company (4 companies) |
Woori Financial Group | |
| Tongyang Life Insurance | ||
| PT Bank Woori Saudara Indonesia 1906 Tbk | ||
| PT Woori Finance Indonesia Tbk | ||
| Unlisted company (38 companies) |
Woori Bank | |
| Woori Card | ||
| Woori Financial Capital |
8
| Type |
Name of Company | |
| Woori Investment Securities | ||
| ABL Life Insurance | ||
| Woori Asset Trust | ||
| Woori Savings Bank | ||
| Woori Asset Management | ||
| Woori Venture Partners | ||
| Woori Private Equity Asset Management | ||
| Woori Financial F&I Inc. | ||
| Woori Credit Information | ||
| Woori Fund Services | ||
| Woori FIS | ||
| Woori Finance Research Institute | ||
| Korea BTL Infrastructure Fund | ||
| Woori America Bank | ||
| Woori Bank China Limited | ||
| AO Woori Bank | ||
| Banco Woori Bank do Brazil S.A. | ||
| Woori Global Markets Asia Limited | ||
| Woori Bank Vietnam Limited | ||
| Wealth Development Bank | ||
| Woori Finance Myanmar Co., Ltd. | ||
| Woori Bank (Cambodia) PLC. | ||
| Woori Bank Europe Gmbh | ||
| Tongyang Life Insurance Financial Service | ||
| Tutu Finance-WCI Myanmar Co., Ltd. | ||
| ABA Financial Service | ||
| Woori Venture Partners US, Inc. | ||
| Arden Woori Apparel 1st Private Equity Fund | ||
| Woori Dyno 1st Private Equity Fund | ||
| Green ESG Growth No.1 Private Equity Fund | ||
| Woori Corporate Turnaround No.1 Private Equity Fund | ||
| NH Woori Dino Co-Investment No.2 Private Equity Fund | ||
| Woori Eugene Energy Link Private Equity Fund | ||
| Woori NH Co-Growth Private Equity Fund | ||
| WFBS Financial Stability Private Equity Fund No.1 |
| Note 1) | Includes first-tier and second-tier subsidiaries under the Financial Holding Company Act. |
9
| 1) | Including group company shares 32.65% |
| 2) | Including group company shares 35.26% |
| 3) | Including group company shares 7.86% |
| 4) | Including group company shares 20.00% |
10
| 2. | Capital Structure (Changes in Capital) |
(units: Won, shares)
| Date |
Item |
Type | ||||||||||||
| Common Shares | Preferred Shares | Others | ||||||||||||
| December 31, 2025 |
Number of issued shares | 734,076,320 | — | — | ||||||||||
| Par Value | 5,000 | — | — | |||||||||||
| Capital Stock | 3,802,676,300,000 | — | — | |||||||||||
| December 31, 2024 |
Number of issued shares | 742,591,501 | — | — | ||||||||||
| Par Value | 5,000 | — | — | |||||||||||
| Capital Stock | 3,802,676,300,000 | — | — | |||||||||||
| December 31, 2023 |
Number of issued shares | 751,949,461 | — | — | ||||||||||
| Par Value | 5,000 | — | — | |||||||||||
| Capital Stock | 3,802,676,300,000 | — | — | |||||||||||
| December 31, 2022 |
Number of issued shares | 728,060,549 | — | — | ||||||||||
| Par Value | 5,000 | — | — | |||||||||||
| Capital Stock | 3,640,302,745,000 | — | — | |||||||||||
| December 31, 2021 |
Number of issued shares | 728,060,549 | ||||||||||||
| Par Value | 5,000 | |||||||||||||
| Capital Stock | 3,640,302,745,000 | |||||||||||||
| Note 1) | Our common shares of 680,164,306 were issued in January 2019 upon our establishment and the number of our common shares increased by 42,103,377 as a result of a comprehensive stock exchange that took place between Woori Financial Group and Woori Card in September 2019. | |
| Note 2) | The number of our common shares increased by 5,792,866 on August 10, 2021 due to a comprehensive stock exchange to integrate Woori Financial Capital as a wholly-owned subsidiary. | |
| Note 3) | The number of our common shares increased by 32,474,711 as a result of a comprehensive stock exchange that took place on August 8, 2023 to convert Woori Investment Bank and Woori Venture Partners as our wholly-owned subsidiaries. | |
| Note 4) | On October 30, 2023, the number of our common shares was reduced by 8,585,799 due to the cancellation of our treasury shares acquired through a trust agreement. | |
| Note 5) | On March 22, 2024, the number of our common shares was reduced by 9,357,960 due to the cancellation of all of the treasury shares acquired from the Korea Deposit Insurance Corporation. | |
| Note 6) | On September 19, 2025, the number of our common shares was reduced by 8,515,181 due to the cancellation of our treasury shares acquired through a trust agreement. | |
| Note 7) | As the treasury share cancellations in October 2023, March 2024 and September 2025 were conducted within the limits of profits available for dividends, there was no reduction in paid-in capital. Accordingly, our paid-in capital as of December 31, 2023, 2024 and 2025 did not match the par value of the total number of issued shares. |
11
| As of December 31, 2025 | (units: Won, shares) |
| Date |
Category | Stock Decrease/Increase | ||||||||||||||||||||
| Type | Quantity | Par Value |
Issue price |
Note | ||||||||||||||||||
| January 11, 2019 |
— | Common | 680,164,306 | 5,000 | 26,415 | Establishment (comprehensive stock transfer) | ||||||||||||||||
| September 10, 2019 |
— | Common | 42,103,377 | 5,000 | 12,350 | Comprehensive stock exchange Stock increase ratio: 6.19018% | ||||||||||||||||
| August 10, 2021 |
— | Common | 5,792,866 | 5,000 | 11,100 | Comprehensive stock exchange Stock increase ratio: 0.80204% | ||||||||||||||||
| August 8, 2023 |
— | Common | 32,474,711 | 5,000 | 11,520 | Comprehensive stock exchange Stock increase ratio: 4.46044% | ||||||||||||||||
| October 30, 2023 |
— | Common | (8,585,799 | ) | 5,000 | — | Cancellation of treasury shares | |||||||||||||||
| March 22, 2024 |
— | Common | (9,357,960 | ) | 5,000 | — | Cancellation of treasury shares | |||||||||||||||
| September 19, 2025 |
— | Common | (8,515,181 | ) | 5,000 | — | Cancellation of treasury shares | |||||||||||||||
| Note 1) | Due to Woori Financial Group’s establishment through a comprehensive stock transfer, the issue price was calculated by dividing the total equity from its financial statements at the time of establishment (KRW 17,966,458,911,689) by the total number of issued shares (680,164,306). | |
| Note 2) | Our capital changed in September 2019, August 2021 and August 2023 due to a comprehensive stock exchange. The issue prices were based on the closing stock price on the comprehensive stock exchange date. | |
| Note 3) | On October 30, 2023, we canceled our treasury shares (8,585,799 common shares) acquired through a trust agreement. This share cancellation falls under the provision of Article 343, Paragraph 1 of the Commercial Code, and as it involves the cancellation of treasury shares acquired within the limits of distributable profits, the paid-in capital remains unchanged despite the decrease in the number of the total issued shares (common shares). | |
| Note 4) | On March 22, 2024, we canceled the 9,357,960 shares we acquired as treasury shares from the Korea Deposit Insurance Corporation. This share cancellation falls under the provision of Article 343, Paragraph 1 of the Commercial Code, and as it involves the cancellation of treasury shares acquired within the limits of distributable profits, the paid-in capital remains unchanged despite the decrease in the number of total issued shares (common shares). | |
| Note 5) | On September 19, 2025, we canceled the 8,515,181 shares we acquired as treasury shares through a trust agreement. This share cancellation falls under the provision of Article 343, Paragraph 1 of the Commercial Code, and as it involves the cancellation of treasury shares acquired within the limits of distributable profits, the paid-in capital remains unchanged despite the decrease in the number of total issued shares (common shares). |
12
| 3. | Total Number of Authorized Shares |
| As of December 31, 2025 | (unit: shares) |
| Items |
Type | Notes | ||||||||||
| Common Shares | Total | |||||||||||
| Number of authorized shares |
4,000,000,000 | 4,000,000,000 | — | |||||||||
| Number of issued shares |
760,535,260 | 760,535,260 | — | |||||||||
| Number of decreased shares |
26,458,940 | 26,458,940 | |
Cancellation of Treasury Shares Note 1 |
) | |||||||
| Number of treasury shares |
53,945 | 53,945 | Note 2 | ) | ||||||||
| Number of outstanding shares |
734,022,375 | 734,022,375 | — | |||||||||
| Note 1) | Cancellation of treasury shares: 8,585,799 shares (October 2023), 9,357,960 shares (March 2024) and 8,515,181 shares (September 2025) | |
| Note 2) | Consists of the 53,945 shares acquired through the issuance of fractional shares (including 2 shares added in 2019 from the partial replacement of physical stock certificates, 2,322 new fractional shares added in August 2021 due to the comprehensive stock exchange between Woori Financial Group and Woori Financial Capital, and 51,621 shares added in August 2023 from the comprehensive stock exchanges between Woori Financial Group and Woori Investment Bank and between Woori Financial Group and Woori Venture Partners) |
13
| II. | Business Overview |
| 1. | Results of Operations |
(unit: billions of Won)
| Type |
2025 | 2024 | 2023 | |||||||||
| Operating income |
3,675 | 4,255 | 3,499 | |||||||||
| Non-operating income |
415 | (32 | ) | 18 | ||||||||
| Income before income tax |
4,090 | 4,223 | 3,517 | |||||||||
| Income tax expense |
863 | 1,051 | 891 | |||||||||
| Net income |
3,228 | 3,171 | 2,627 | |||||||||
| Controlling Interest |
3,124 | 3,086 | 2,506 | |||||||||
| Non-controlling Interest |
103 | 85 | 121 | |||||||||
| Note 1) | Based on K-IFRS consolidated financial statements. |
| 2. | Funding Sources and Uses of Funds |
| a. | Sources of Funds |
| For the periods indicated other than as noted below | (units: millions of Won, %) |
| Classification |
Funding Source | 2025 | 2024 | 2023 | ||||||||||||||||||||||||||||||||||
| Average Balance |
Interest Rate |
Proportion | Average Balance |
Interest Rate |
Proportion | Average Balance |
Interest Rate |
Proportion | ||||||||||||||||||||||||||||||
| Source |
Deposits | 358,153,346 | 2.39 | 65.89 | 351,584,810 | 2.88 | 69.89 | 324,824,465 | 2.83 | 68.98 | ||||||||||||||||||||||||||||
| Borrowings | 26,198,268 | 3.32 | 4.82 | 28,000,803 | 4.09 | 5.57 | 28,052,983 | 4.02 | 5.96 | |||||||||||||||||||||||||||||
| Debentures | 50,418,543 | 3.62 | 9.28 | 43,989,333 | 4.00 | 8.74 | 42,458,653 | 3.55 | 9.02 | |||||||||||||||||||||||||||||
| Others | 72,335,906 | — | 13.31 | 44,591,752 | — | 8.86 | 42,829,998 | — | 9.09 | |||||||||||||||||||||||||||||
| Total Liabilities |
507,106,063 | — | 93.30 | 468,166,698 | — | 93.06 | 438,166,099 | — | 93.05 | |||||||||||||||||||||||||||||
|
|
|
|
|
|
|
|
|
|
|
|
|
|
|
|
|
|
|
|||||||||||||||||||||
| Total Equity |
36,428,909 | — | 6.70 | 34,913,425 | — | 6.94 | 32,708,219 | — | 6.95 | |||||||||||||||||||||||||||||
|
|
|
|
|
|
|
|
|
|
|
|
|
|
|
|
|
|
|
|||||||||||||||||||||
| Total Liabilities & Equity |
543,534,972 | — | 100.00 | 503,080,123 | — | 100.00 | 470,874,318 | — | 100.00 | |||||||||||||||||||||||||||||
|
|
|
|
|
|
|
|
|
|
|
|
|
|
|
|
|
|
|
|||||||||||||||||||||
| Note 1) | Average Balance : simple average of the starting balance for the fiscal year and the balance at the end of each quarter. | |
| Note 2) | Based on K-IFRS consolidated financial statements. |
14
| b. | Use of Funds |
| For the periods indicated other than as noted below | (units: millions of Won, %) |
|
Type |
Managed Item |
2025 | 2024 | 2023 | ||||||||||||||||||||||||||||||||||
| Average Balance |
Interest Rate |
Proportion | Average Balance |
Interest Rate |
Proportion | Average Balance |
Interest Rate |
Proportion | ||||||||||||||||||||||||||||||
| Use |
Cash & Due from Banks | 19,225,891 | 2.97 | 3.54 | 18,441,851 | 3.38 | 3.67 | 16,692,268 | 3.26 | 3.54 | ||||||||||||||||||||||||||||
| Marketable securities | 97,528,721 | 3.34 | 17.94 | 76,997,821 | 3.53 | 15.31 | 75,522,522 | 3.61 | 16.04 | |||||||||||||||||||||||||||||
| Loans | 369,558,184 | 4.44 | 67.99 | 360,802,414 | 4.93 | 71.72 | 334,205,508 | 5.08 | 70.98 | |||||||||||||||||||||||||||||
| Loans in local currency |
318,053,470 | 4.16 | 58.52 | 309,771,603 | 4.65 | 61.58 | 287,312,990 | 4.84 | 61.02 | |||||||||||||||||||||||||||||
| Loans in foreign Currency |
35,209,643 | 5.88 | 6.48 | 34,224,957 | 6.58 | 6.80 | 31,215,114 | 6.64 | 6.63 | |||||||||||||||||||||||||||||
| Guarantee payments |
11,092 | 1.44 | 0.00 | 11,571 | 1.96 | 0.00 | 14,567 | 2.28 | 0.00 | |||||||||||||||||||||||||||||
| Credit card receivables |
12,664,469 | 7.71 | 2.33 | 12,224,048 | 7.33 | 2.43 | 11,215,186 | 6.85 | 2.38 | |||||||||||||||||||||||||||||
| Foreign bills bought |
3,619,510 | 4.36 | 0.66 | 4,570,235 | 5.58 | 0.91 | 4,447,651 | 5.33 | 0.95 | |||||||||||||||||||||||||||||
| Bad debt expense in local currency (-) | 3,423,791 | — | 0.63 | 3,198,795 | — | 0.65 | 2,609,403 | — | 0.55 | |||||||||||||||||||||||||||||
| Others | 60,645,967 | — | 11.16 | 50,036,832 | — | 9.95 | 47,063,423 | — | 9.99 | |||||||||||||||||||||||||||||
|
|
|
|
|
|
|
|
|
|
|
|
|
|
|
|
|
|||||||||||||||||||||||
| Total Assets |
543,534,972 | — | 100.00 | 503,080,123 | — | 100.00 | 470,874,318 | — | 100.00 | |||||||||||||||||||||||||||||
|
|
|
|
|
|
|
|
|
|
|
|
|
|
|
|
|
|||||||||||||||||||||||
| Note 1) | Average Balance : simple average of the starting balance for the fiscal year and the balance at the end of each quarter. |
| Note 2) | Based on K-IFRS consolidated financial statements. |
| 3. | Other Information Necessary for Making Investment Decisions |
| a. | Capital Adequacy Ratios |
Group BIS Capital Adequacy Ratios
| As of the end of the periods indicated | (units: billions of Won, %) |
| Type |
2025 |
2024 |
2023 | |||
| Equity capital (A) |
37,800 | 36,928 | 34,756 | |||
| Risk weighted assets (B) |
234,542 | 235,100 | 219,792 | |||
| BIS(Capital adequacy) ratio (A/B) |
16.12 | 15.71 | 15.81 |
| Note 1) | BIS (Bank for International Settlements) Capital Adequacy Ratios = Equity capital / Risk weighted assets * 100 |
| Note 2) | Based on K-IFRS consolidated financial statements and Basel III standards. |
| Note 3) | 2025 figures are estimates only and are subject to change. |
15
Capital Adequacy Ratios for Significant Subsidiaries and Consolidated Companies
| As of the end of the periods indicated | (units: hundreds of millions of Won, %) |
| Name of Company |
Type |
2025 | 2024 | 2023 | ||||||||||||
| Woori Bank Note 2) |
BIS capital adequacy ratio Note 1) |
Equity capital (A) | 312,905 | 304,302 | 282,379 | |||||||||||
| Risk weighted assets (B) | 1,861,435 | 1,920,087 | 1,760,737 | |||||||||||||
| Capital adequacy ratio (A/B) | 16.81 | 15.85 | 16.04 | |||||||||||||
| Tongyang Life Insurance Note 3) |
Available capital | 40,152 | 38,753 | 41,898 | ||||||||||||
| Required capital | 22,647 | 24,918 | 21,668 | |||||||||||||
| K-ICS ratio Note 4) | 177.3 | 155.5 | 193.4 | |||||||||||||
| Woori Card Note 5) |
Adjusted capital ratio | 17.26 | 17.70 | 16.03 | ||||||||||||
| Tangible common equity ratio | 12.06 | 12.37 | 10.97 | |||||||||||||
| Woori Financial Capital Note 5) |
Adjusted capital ratio | 15.77 | 15.09 | 14.35 | ||||||||||||
| Tangible common equity ratio | 13.18 | 11.83 | 11.48 | |||||||||||||
| Woori Investment Securities Note 6) |
Net capital ratio | 905.56 | 2,098.64 | — | ||||||||||||
| Debt-to-asset ratio | 114.53 | 119.41 | — | |||||||||||||
| ABL Life Insurance Note 3) |
Available capital | 20,049 | 16,701 | 16,618 | ||||||||||||
| Required capital | 11,782 | 10,868 | 8,936 | |||||||||||||
| K-ICS ratio Note 4) | 170.17 | 153.68 | 185.96 | |||||||||||||
| Woori Asset Trust Note 7) |
Operating capital ratio | 4,610.35 | 4,057.29 | 1,284.26 | ||||||||||||
| Woori Savings Bank Note 8) |
BIS capital adequacy ratio Note 1) | 16.74 | 16.37 | 13.21 | ||||||||||||
| Woori Asset Management Note 5) |
Minimum operating capital ratio | 721.18 | 739.31 | 650.26 | ||||||||||||
| Woori Venture Partners Note 9) |
Tangible common equity ratio | 92.63 | 95.70 | 90.82 | ||||||||||||
| Woori Private Equity Asset Management Note 5) |
Minimum operating capital ratio | 8,128.94 | 8,161.97 | 8,618.79 | ||||||||||||
| Note 1) | BIS (Bank for International Settlements) Capital Adequacy Ratio : Equity capital / Risk weighted assets * 100 |
| Note 2) | Figures for Woori Bank are based on K-IFRS consolidated financial statements and Basel III standards. 2025 figures are estimates only and are subject to change. |
| Note 3) | Figures for Tongyang Life Insurance and ABL Life Insurance have been calculated based on the K-ICS approach since 2023. 2025 figures are estimates only, and the final figures will be disclosed through Tongyang Life Insurance and ABL Life Insurance’s 2025 annual reports, respectively. |
| Note 4) | K-ICS ratio : Available capital / Required capital * 100. |
| Note 5) | Figures for Woori Card, Woori Financial Capital, Woori Asset Management and Woori Private Equity Asset Management are based on the applicable standards for business reports submitted to the Financial Supervisory Service and their respective K-IFRS separate financial statements. |
| Note 6) | Figures for Woori Investment Securities are calculated as follows: |
| - | Net capital ratio: (net operating capital – total risk amount) / required maintenance capital * 100 // based on the applicable standards for business reports submitted to the Financial Supervisory Service. |
| - | Debt-to-asset ratio: (actual assets) / (actual liability) * 100 // based on K-IFRS separate financial statements. |
| Note 7) | Woori Asset Trust’s operating capital ratio = (net operating capital – subordinated debt, etc.)/(total risk amount) * 100 // based on K-IFRS separate financial statements. |
| Note 8) | Figures for Woori Savings Bank are based on K-GAAP. |
| Note 9) | Figures for Woori Venture Partners are based on K-IFRS consolidated financial statements. |
16
| b. | Liquidity Ratios |
Won Liquidity Ratios
| As of the end of the periods indicated | (units: millions of Won, %) |
| Type |
2025 | 2024 | 2023 | |||||||||||||||||||||||||||||||||
| Won Liquidity Assets |
Won Liquidity Liabilities |
Won Liquidity Ratio |
Won Liquidity Assets |
Won Liquidity Liabilities |
Won Liquidity Ratio |
Won Liquidity Assets |
Won Liquidity Liabilities |
Won Liquidity Ratio |
||||||||||||||||||||||||||||
| Woori Financial Group Note 1) |
34,847 | 15,292 | 227.9 | 353,835 | 10,905 | 3,244.7 | 111,895 | 8,155 | 1,372.1 | |||||||||||||||||||||||||||
| Woori Card Note 2) |
9,660,954 | 2,808,447 | 344.0 | 8,722,587 | 2,785,182 | 313.2 | 9,119,265 | 2,454,480 | 371.5 | |||||||||||||||||||||||||||
| Woori Financial Capital Note 2) |
1,444,834 | 1,162,263 | 124.3 | 1,850,758 | 1,317,695 | 140.5 | 1,919,083 | 1,245,067 | 154.1 | |||||||||||||||||||||||||||
| Woori Investment Securities Note 2) |
6,515,056 | 4,938,840 | 131.9 | 4,982,461 | 2,660,153 | 187.3 | 4,032,290 | 1,926,080 | 209.4 | |||||||||||||||||||||||||||
| Woori Asset Trust Note 2) |
153,241 | 10,214 | 1,500.3 | 258,758 | 9,311 | 2,779.2 | 171,860 | 18,555 | 926.2 | |||||||||||||||||||||||||||
| Woori Savings Bank Note 2), Note 3) |
410,196 | 351,853 | 116.6 | 344,437 | 216,143 | 159.4 | 434,495 | 231,003 | 188.1 | |||||||||||||||||||||||||||
| Woori Venture Partners Note 2) |
141,886 | 10,166 | 1,395.7 | 136,198 | 6,877 | 1,980.4 | 104,534 | 7,141 | 1,463.9 | |||||||||||||||||||||||||||
| Woori Private Equity Asset Management Note 2) |
20,452 | 3,354 | 609.8 | 16,011 | 2,912 | 549.8 | 27,506 | 2,396 | 1,147.8 | |||||||||||||||||||||||||||
| Note 1) | Based on current assets and liabilities within one month of maturity. |
| Note 2) | Based on current assets and liabilities within 90 days of maturity. |
| Note 3) | Based on K-GAAP. |
Insurance Liquidity Ratios
| As of the end of the periods indicated | (units: millions of Won, %) |
| Type |
2025 | 2024 | 2023 | |||||||||||||||||||||||||||||||||
| Liquidity Assets |
Average Insurance Benefits Paid |
Liquidity Ratio |
Liquidity Assets |
Average Insurance Benefits Paid |
Liquidity Ratio |
Liquidity Assets |
Average Insurance Benefits Paid |
Liquidity Ratio |
||||||||||||||||||||||||||||
| Tongyang Life Insurance Note 1) |
3,742,951 | 842,985 | 444.0 | 4,157,512 | 915,959 | 453.9 | 12,091,960 | 1,239,553 | 975.5 | |||||||||||||||||||||||||||
| ABL Life Insurance Note 1) |
2,386,630 | 423,952 | 562.9 | 2,816,208 | 466,405 | 603.8 | 6,770,032 | 535,163 | 1,265.0 | |||||||||||||||||||||||||||
| Note 1) | Based on the applicable standards for business reports submitted to the Financial Supervisory Service (within three months of maturity). |
17
Foreign Currency (FC) Liquidity Ratios
| As of the end of the periods indicated | (units: millions of Won, %) |
| Type |
2025 | 2024 | 2023 | |||||||||||||||||||||||||||||||||
| FC Liquidity Assets |
FC Liquidity Liabilities |
FC Liquidity Ratio |
FC Liquidity Assets |
FC Liquidity Liabilities |
FC Liquidity Ratio |
FC Liquidity Assets |
FC Liquidity Liabilities |
FC Liquidity Ratio |
||||||||||||||||||||||||||||
| Woori Investment Securities Note 1) |
11,862 | 3,566 | 332.70 | 2,581 | 2,146 | 120.24 | 9,450 | 7,362 | 128.36 | |||||||||||||||||||||||||||
| Note 1) | Based on current assets and liabilities within three months of maturity. |
Liquidity Coverage Ratios
(units: %)
| Name of Company |
Type |
2025 | 2024 | 2023 | ||||||||||
| Woori Bank |
Liquidity coverage ratio Note 1) | 107.64 | 104.79 | 101.26 | ||||||||||
| Foreign currency liquidity coverage ratio Note 2) | 160.56 | 184.29 | 162.75 | |||||||||||
| Ratio of business purpose premises and equipment | 9.42 | 9.95 | 10.20 | |||||||||||
| Note 1) | LCR: Average of daily ratios during a quarter (same as the calculation method used for business disclosure) |
| - | The applicable LCR requirements were 100%, 97.5% and 95% as of December 31, 2025, December 31, 2024 and December 31, 2023, respectively. |
| Note 2) | Foreign currency LCR: ratio calculated based on averages of the amount of each category (same as the calculation method used for business disclosure) |
| - | The applicable foreign currency LCR requirement was 80% for all periods after 2022. |
| Note 3) | The applicable periods for LCR and foreign currency LCR are: 4Q 2025, 4Q 2024, and 4Q 2023. |
| c. | Profitability Ratios Note 1), Note 2) |
(unit: %)
| Type |
2025 | 2024 | 2023 | |||||||||||||||||||||
|
|
|
|
|
|
|
|||||||||||||||||||
| ROA | ROE | ROA | ROE | ROA | ROE | |||||||||||||||||||
| Woori Financial Group |
||||||||||||||||||||||||
| Including non-controlling interests |
0.58 | 9.31 | 0.61 | 9.60 | 0.54 | 8.65 | ||||||||||||||||||
| Excluding non-controlling interests |
0.56 | 9.01 | 0.60 | 9.34 | 0.52 | 8.25 | ||||||||||||||||||
| Note 1) | Total assets and total equity : simple average of the starting balance for the fiscal year and the ending balance of each quarter. |
| Note 2) | Based on the applicable standards for business reports submitted to the Financial Supervisory Service. |
18
| d. | Asset Quality |
Group Asset Quality
(units: billions of Won, %)
| Type |
2025 | 2024 | 2023 | |||||||||
| Total loans |
399,970 | 390,066 | 365,780 | |||||||||
| Substandard and below loans |
2,517 | 2,211 | 1,357 | |||||||||
| Substandard and below loans ratio |
0.63 | 0.57 | 0.37 | |||||||||
| Non-performing loans (“NPL”) |
2,172 | 1,786 | 1,299 | |||||||||
| NPL ratio |
0.54 | 0.46 | 0.36 | |||||||||
| Substandard and below coverage ratio (A/B) |
129.9 | 153.0 | 220.1 | |||||||||
| Loan loss reserve (A) |
3,268 | 3,382 | 2,986 | |||||||||
| Substandard and below loans (B) |
2,517 | 2,211 | 1,357 | |||||||||
| Note 1) | Based on the applicable standards for financial holding company business reports submitted to the Financial Supervisory Service. |
| Note 2) | 2025 figures are preliminary and are subject to change. |
Asset Quality for Significant Subsidiaries and Consolidated Companies
(units: %)
| Type |
2025 | 2024 | 2023 | |||||||||||||||||||||||||||||||||
|
|
|
|
|
|
|
|||||||||||||||||||||||||||||||
| Substandard and below ratio |
NPL ratio |
Substandard and below coverage ratio |
Substandard and below ratio |
NPL ratio |
Substandard and below coverage ratio |
Substandard and below ratio |
NPL ratio |
Substandard and below coverage ratio |
||||||||||||||||||||||||||||
| Woori Bank Note 1) |
0.31 | 0.25 | 172.55 | 0.23 | 0.19 | 247.44 | 0.18 | 0.17 | 320.84 | |||||||||||||||||||||||||||
| Woori Card Note 2) |
1.23 | — | 104.03 | 1.07 | — | 105.46 | 0.97 | — | 104.92 | |||||||||||||||||||||||||||
| Woori Financial Capital Note 2) | 1.93 | — | 111.48 | 1.91 | — | 134.18 | 2.37 | — | 113.21 | |||||||||||||||||||||||||||
| Woori Investment Securities Note 2), Note 3) | 5.74 | — | 69.21 | 7.29 | — | 84.37 | 0.55 | — | 578.29 | |||||||||||||||||||||||||||
| Woori Asset Trust Note 2) | 74.04 | — | — | 77.68 | — | — | 32.11 | — | — | |||||||||||||||||||||||||||
| Woori Savings Bank Note 2), Note 4) | 6.86 | — | 72.31 | 9.82 | — | 77.43 | 3.53 | — | 101.66 | |||||||||||||||||||||||||||
| Note 1) | Based on K-IFRS separate financial statements. |
| Note 2) | Based on the applicable standards for business reports submitted to the Financial Supervisory Service. |
| Note 3) | Numbers for 2023 reflect those of Woori Investment Bank. Woori Investment Securities was established in August 2024, following the merger of Korea Foss Securities and Woori Investment Bank. |
| Note 4) | Based on K-GAAP. |
19
| Type Note 1) |
2025 | 2024 | 2023 | |||||||||
| Risk-Weighted Non-Performing Asset Ratio |
Risk-Weighted Non-Performing Asset Ratio |
Risk-Weighted Non-Performing Asset Ratio |
||||||||||
| Tongyang Life Insurance |
0.14 | 0.08 | 0.09 | |||||||||
| ABL Life Insurance |
0.14 | 0.23 | 0.19 | |||||||||
| Note 1) | Based on the applicable standards for business reports submitted to the Financial Supervisory Service. |
20
| III. | Financial Information |
| 1. | Condensed Financial Statements (Consolidated) |
Summary Consolidated Statement of Financial Position
| (The Company and its consolidated subsidiaries, as of the end of the periods indicated) |
(unit: millions of Won) | |||
| Classification |
2025 | 2024 | 2023 | |||||||||
| ASSETS |
||||||||||||
| Cash and cash equivalents |
38,499,679 | 27,281,123 | 30,556,618 | |||||||||
| Financial assets at fair value through profit or loss (“FVTPL”) |
34,245,475 | 25,202,672 | 21,544,756 | |||||||||
| Financial assets at fair value through other comprehensive income |
83,499,522 | 43,797,745 | 37,891,495 | |||||||||
| Securities at amortized cost |
18,707,459 | 19,203,177 | 23,996,172 | |||||||||
| Loans and other financial assets at amortized cost |
412,495,783 | 398,471,816 | 373,148,148 | |||||||||
| Investments in joint ventures and associates |
2,080,008 | 1,748,810 | 1,795,370 | |||||||||
| Reinsurance contracts |
620,207 | — | — | |||||||||
| Investment properties |
998,854 | 450,788 | 472,768 | |||||||||
| Premises and equipment |
3,780,817 | 3,370,585 | 3,176,759 | |||||||||
| Intangible assets and goodwill |
1,056,647 | 1,091,402 | 996,842 | |||||||||
| Assets held for sale |
168,491 | 73,989 | 20,345 | |||||||||
| Net defined benefit asset |
20,558 | 146,109 | 240,260 | |||||||||
| Current tax assets |
228,229 | 61,613 | 203,542 | |||||||||
| Deferred tax assets |
413,649 | 72,937 | 93,366 | |||||||||
| Derivative assets (designated for hedging) |
217,180 | 175,191 | 26,708 | |||||||||
| Other assets |
4,424,728 | 4,605,363 | 3,841,787 | |||||||||
|
|
|
|
|
|
|
|||||||
| Total assets |
601,457,286 | 525,753,320 | 498,004,936 | |||||||||
|
|
|
|
|
|
|
|||||||
| LIABILITIES |
||||||||||||
| Financial liabilities at FVTPL |
6,356,934 | 9,896,597 | 6,138,313 | |||||||||
| Deposits due to customers |
376,580,845 | 366,821,156 | 357,784,297 | |||||||||
| Borrowings |
34,183,267 | 30,117,031 | 30,986,746 | |||||||||
| Debentures |
55,583,392 | 48,207,103 | 41,239,245 | |||||||||
| Insurance contracts |
45,573,864 | — | — | |||||||||
| Reinsurance contracts |
184,792 | — | — | |||||||||
| Investment contract liabilities |
3,433,611 | — | — | |||||||||
| Provisions |
790,733 | 611,428 | 806,031 | |||||||||
| Net defined benefit liability |
115,091 | 5,424 | 6,939 | |||||||||
| Current tax liabilities |
723,368 | 127,126 | 103,655 | |||||||||
| Deferred tax liabilities |
504,828 | 858,822 | 470,311 | |||||||||
| Derivative liabilities (designated for hedging) |
615,361 | 102,815 | 153,007 | |||||||||
| Other financial liabilities |
38,118,058 | 32,314,051 | 26,115,005 | |||||||||
21
| Classification |
2025 | 2024 | 2023 | |||||||||
| Other liabilities |
833,894 | 796,498 | 803,897 | |||||||||
|
|
|
|
|
|
|
|||||||
| Total liabilities |
563,598,038 | 489,858,051 | 464,607,446 | |||||||||
|
|
|
|
|
|
|
|||||||
| EQUITY |
||||||||||||
| Owners’ equity: |
36,017,339 | 34,096,836 | 31,666,881 | |||||||||
| Capital stock |
3,802,676 | 3,802,676 | 3,802,676 | |||||||||
| Hybrid securities |
3,710,498 | 3,810,435 | 3,611,129 | |||||||||
| Capital surplus |
933,436 | 934,100 | 935,563 | |||||||||
| Other equity |
(1,219,327 | ) | (1,400,885 | ) | (1,668,957 | ) | ||||||
| Retained earnings |
28,790,056 | 26,950,510 | 24,986,470 | |||||||||
| Non-controlling interests |
1,841,909 | 1,798,433 | 1,730,609 | |||||||||
|
|
|
|
|
|
|
|||||||
| Total equity |
37,859,248 | 35,895,269 | 33,397,490 | |||||||||
|
|
|
|
|
|
|
|||||||
| Total liabilities and equity |
601,457,286 | 525,753,320 | 498,004,936 | |||||||||
|
|
|
|
|
|
|
|||||||
| Number of Consolidated Subsidiaries (excluding holding company) |
203 | 188 | 179 | |||||||||
22
Summary Consolidated Statement of Comprehensive Income
| (The Company and its consolidated subsidiaries, for the periods indicated) |
(unit: millions of Won, except per share amounts) | |||
| Classification |
2025 | 2024 | 2023 | |||||||||
| Operating income |
3,674,808 | 4,255,190 | 3,499,029 | |||||||||
| Net interest income |
9,030,769 | 8,886,336 | 8,742,540 | |||||||||
| Net fees and commissions income |
2,160,404 | 2,086,170 | 1,720,481 | |||||||||
| Dividend income |
484,465 | 310,320 | 240,293 | |||||||||
| Net insurance income |
103,871 | — | — | |||||||||
| Other insurance finance income and expenses |
(378,130 | ) | — | — | ||||||||
| Net gain or loss on financial instruments at FVTPL |
725,939 | 1,492,783 | 488,486 | |||||||||
| Net gain or loss on financial assets at FVTOCI |
130,620 | 96,620 | (37,641 | ) | ||||||||
| Net gain or loss arising on financial assets at amortized cost |
107,667 | 286,885 | 203,942 | |||||||||
| Impairment losses due to credit loss |
(2,102,814 | ) | (1,716,295 | ) | (1,894,916 | ) | ||||||
| General and administrative expenses |
(5,179,621 | ) | (4,468,973 | ) | (4,443,433 | ) | ||||||
| Other net operating expenses |
(1,408,362 | ) | (2,718,656 | ) | (1,520,723 | ) | ||||||
| Non-operating income (expenses) |
415,358 | (32,343 | ) | 18,424 | ||||||||
| Net income before income tax expense |
4,090,166 | 4,222,847 | 3,517,453 | |||||||||
| Income tax expense |
(862,658 | ) | (1,051,378 | ) | (890,559 | ) | ||||||
| Net income |
3,227,508 | 3,171,469 | 2,626,894 | |||||||||
| Net income attributable to owners |
3,124,346 | 3,085,995 | 2,506,296 | |||||||||
| Net income attributable to the non-controlling interests |
103,162 | 85,474 | 120,598 | |||||||||
| Other comprehensive income (loss), net of tax |
176,770 | 382,719 | 663,537 | |||||||||
| Items that will not be reclassified to profit or loss |
90,547 | (200,341 | ) | 122,334 | ||||||||
| Items that may be reclassified to profit or loss |
86,223 | 583,060 | 541,203 | |||||||||
| Total comprehensive income |
3,404,278 | 3,554,188 | 3,290,431 | |||||||||
| Comprehensive income attributable to the owners |
3,251,616 | 3,454,620 | 3,164,464 | |||||||||
| Comprehensive income attributable to non-controlling interests |
152,662 | 99,568 | 125,967 | |||||||||
| Net income per share: |
||||||||||||
| Basic and diluted loss per share (in Korean Won) |
4,052 | 3,950 | 3,230 | |||||||||
23
| 2. | Condensed Financial Statements (Separate) |
Summary Statement of Financial Position
| (The Company, as of the end of the period indicated) | (unit: millions of Won) |
| Classification |
2025 | 2024 | 2023 | |||||||||
| ASSETS |
||||||||||||
| Cash and cash equivalents |
489,321 | 1,185,912 | 289,507 | |||||||||
| Financial assets at fair value through other comprehensive income |
558,162 | 553,518 | 539,709 | |||||||||
| Loans and other financial assets at amortized cost |
707,142 | 204,431 | 1,104,815 | |||||||||
| Investments in subsidiaries |
25,597,495 | 24,206,017 | 23,670,476 | |||||||||
| Premises and equipment |
4,763 | 5,304 | 6,609 | |||||||||
| Intangible assets |
2,961 | 3,308 | 4,052 | |||||||||
| Net defined benefit asset |
2,108 | 1,378 | 3,941 | |||||||||
| Current tax assets |
26,295 | 33,120 | 158,951 | |||||||||
| Deferred tax assets |
5,810 | 4,379 | 7,478 | |||||||||
| Other assets |
315 | 155,670 | 484 | |||||||||
|
|
|
|
|
|
|
|||||||
| Total assets |
27,394,372 | 26,353,037 | 25,786,022 | |||||||||
|
|
|
|
|
|
|
|||||||
| LIABILITIES |
||||||||||||
| Debentures |
2,667,525 | 2,037,567 | 1,587,659 | |||||||||
| Provisions |
1,897 | 1,252 | 1,227 | |||||||||
| Current tax liabilities |
673,217 | 84,701 | 32,125 | |||||||||
| Other financial liabilities |
95,822 | 76,382 | 163,621 | |||||||||
| Other liabilities |
5,967 | 404 | 392 | |||||||||
|
|
|
|
|
|
|
|||||||
| Total liabilities |
3,444,428 | 2,200,306 | 1,785,024 | |||||||||
|
|
|
|
|
|
|
|||||||
| EQUITY |
||||||||||||
| Capital stock |
3,802,676 | 3,802,676 | 3,802,676 | |||||||||
| Hybrid securities |
3,710,228 | 3,810,225 | 3,610,953 | |||||||||
| Capital surplus |
8,120,236 | 11,120,236 | 11,120,236 | |||||||||
| Other equity |
2,607 | (1,189 | ) | (7,871 | ) | |||||||
| Retained Earnings |
8,314,197 | 5,420,783 | 5,475,004 | |||||||||
|
|
|
|
|
|
|
|||||||
| Total equity |
23,949,944 | 24,152,731 | 24,000,998 | |||||||||
|
|
|
|
|
|
|
|||||||
| Total liabilities and equity |
27,394,372 | 26,353,037 | 25,786,022 | |||||||||
|
|
|
|
|
|
|
|||||||
24
Summary Statement of Comprehensive Income
| (The Company, for the period indicated) | (unit: millions of Won, except per share amounts) |
| Classification |
2025 | 2024 | 2023 | |||||||||
| Operating income |
1,294,715 | 1,123,301 | 1,424,670 | |||||||||
| Net interest income (expense) |
(44,526 | ) | 2,128 | 27,495 | ||||||||
| Interest income |
28,296 | 51,778 | 64,592 | |||||||||
| Interest expense |
(72,822 | ) | (49,650 | ) | (37,097 | ) | ||||||
| Net fees and commissions loss |
(26,879 | ) | (20,319 | ) | (20,097 | ) | ||||||
| Fees and commissions income |
1,816 | 1,625 | 1,625 | |||||||||
| Fees and commissions expense |
(28,695 | ) | (21,944 | ) | (21,722 | ) | ||||||
| Dividend income |
1,448,486 | 1,208,522 | 1,482,956 | |||||||||
| Net gain on financial instruments at FVTPL |
— | — | 2,023 | |||||||||
| Reversal (Provision) of impairment losses due to credit loss |
56 | 608 | (348 | ) | ||||||||
| General and administrative expenses |
(82,422 | ) | (67,638 | ) | (67,359 | ) | ||||||
| Non-operating expenses |
(170,511 | ) | (147 | ) | (1,043 | ) | ||||||
| Net income before income tax expense |
1,124,204 | 1,123,154 | 1,423,627 | |||||||||
| Income tax benefit |
2,836 | 178 | 881 | |||||||||
| Net income |
1,127,040 | 1,123,332 | 1,424,508 | |||||||||
| Other comprehensive income, net of tax |
3,562 | 9,138 | 18,916 | |||||||||
| Items that will not be reclassified to profit or loss |
3,562 | 9,138 | 18,916 | |||||||||
| Net gain on valuation of equity securities at FVTOCI |
3,328 | 10,164 | 19,789 | |||||||||
| Remeasurement of the net defined benefit liability |
234 | (1,026 | ) | (873 | ) | |||||||
| Total comprehensive Income |
1,130,602 | 1,132,470 | 1,443,424 | |||||||||
| Net Income per share: |
||||||||||||
| Basic and diluted income per share (in Korean Won) |
1,326 | 1,296 | 1,754 | |||||||||
25
| 3. | Dividend Information |
As a financial holding company, we distribute dividends to our shareholders using the dividends we receive from our subsidiaries. Our subsidiaries pay dividends to us within the limits of their distributable profits after deducting the necessary internal reserves required to maintain the adequate regulatory capital set by the financial authorities for each sector. As such, our dividend levels are determined based on a comprehensive analysis taking into consideration the current and future asset growth of our subsidiaries and us, as well as the surplus funds after maintaining the appropriate capital adequacy ratios, among others.
In February 2023, we announced our “Shareholder Return Policy and Group Capital Management Plan Based on the Total Shareholder Return (“TSR”) Ratio (including both dividends and treasury share buyback/cancellations)” through our investor relations disclosures. Furthermore, in our business report for the fiscal year 2023, we disclosed the modifications we made to our existing shareholder return policy, including an adjustment to the Common Equity Tier 1 (“CET1”) ratio target from 12% to 13%, taking into consideration the strengthened capital regulations, our enhanced loss absorption capacity, and the overall competitive landscape.
In July 2024, we became the first Korean bank holding company to announce a “Corporate Value Enhancement Plan,” in which we announced that we would strive to enhance corporate value by “enhancing shareholder return capabilities based on the CET1 ratio,” and presented a mid-to-long-term TSR target of 50%. A summary of the details of our shareholder return plans are as follows:
| ① | Simultaneously pursuing both cash dividends and treasury share buybacks/cancellations, and gradually increasing their amounts (continually increasing the dividend per share (“DPS”)) |
| ② | Dividing the CET1 ratio ranges into segments and increasing shareholder returns to enhance sustainability and predictability |
| Classification |
Tier 1 |
Tier 2 |
Tier 3 |
Tier4 | ||||
| CET1 Ratio |
~ 11.5% | 11.5% ~ 12.5% | 12.5% ~ 13.0% | 13.0% ~ | ||||
| Total Shareholder Return (TSR) |
~ 30% | ~ 35% | ~ 40% | ~ 50% |
| Note 1) | TSR and DPS may change based on shifts in the financial environment, regulatory guidance, and management objectives (such as one-time profits and losses through mergers and acquisitions) |
| Note 2) | CET1 ratio ranges are based on year-end figures |
| ③ | Maintaining a dividend payout ratio of approximately 30% and allocating any excess amounts to treasury share buybacks/cancellations if the TSR is below 40%, and increasing both the cash dividend payouts and treasury share buybacks/cancellations in a balanced manner if the TSR exceeds 40%. |
In February 2025, through with our “Corporate Value Enhancement Plan (Value-up),” we released our review report for 2024 and our future plans for 2025. The details of the implementation plans are as follows:
① Striving to achieve a CET1 Ratio of 12.5% in 2025 despite challenging market conditions, including high levels of exchange rates.
② Reallocating part of the capital surplus to retained earnings and using such funds to implement tax-free dividends, thereby effectively increasing tangible shareholder returns.
| - | Our shareholders are expected to approve a transfer of KRW 3 trillion worth of capital surplus to retained earnings at the annual general meeting of shareholders in March 2025. We expect to use such amount to distribute tax-free dividends, beginning with the year-end dividends for fiscal year 2025 (expected to be distributed in April 2026). |
26
③ Expanding treasury share buybacks/cancellations, with KRW 150 billion planned for 2025.
④ Determining the dividend amount before the record date to increase visibility for investors, starting from the first quarter of 2025.
In February 2026, through our “Corporate Value Enhancement Plan (Value-up 2.0),” we released our review report for 2025 and our future plans for 2026. The details of the implementation plans are as follows:
① Early achievement of a 13% CET1 ratio in 2026, maintaining a stable level of 13.2% or higher thereafter.
② Driving a sustainable Group ROE of 10% or higher (including expanding the non-bank profit contribution to approximately 20% by 2026)
③ Leading the expansion of the investor base as a flagship dividend stock in the financial sector
| - | (Dividends): Implementing the first tax-free dividends among bank holding companies and pursuing a consistent annual DPS increase of 10% or more. |
| - | (Buybacks & Cancellations): Accelerating short-term share buybacks to 10%, and considering additional buybacks if the CET1 ratio exceeds 13%. |
We are committed to faithfully implementing the corporate value enhancement plans that we had previously announced, and will continue our efforts to enhance market predictability and shareholder value. If there are any changes to the shareholder return policy, we will actively communicate them with all stakeholders through notices and disclosures.
Information on the Date of Dividend Amount Determination and the Dividend Record Dates
| Dividend Type |
Date of Dividend Amount Determination Note 1) |
Record Date |
Remarks | |||
| Dividend for FY2025 | March 23, 2026 | February 27, 2026 | Annual General Meeting of Shareholders scheduled for March 23, 2026 and disclosed on February 6, 2026 | |||
| Dividend for 3Q2025 | October 24, 2025 | November 10, 2025 | — | |||
| Dividend for 2Q2025 | July 25, 2025 | August 10, 2025 | — | |||
| Dividend for 1Q2025 | April 25, 2025 | May 10, 2025 | — | |||
| Dividend for FY2024 | March 26, 2025 | February 28, 2025 | Disclosed on February 7, 2025 | |||
| Dividend for 3Q2024 | October 18, 2024 | September 30, 2024 | — | |||
| Dividend for 2Q2024 | July 25, 2024 | June 30, 2024 | — | |||
| Dividend for 1Q2024 | April 26, 2024 | March 31, 2024 | — |
27
| Dividend Type |
Date of Dividend Amount Determination Note 1) |
Record Date |
Remarks | |||
| Dividend for FY2023 | March 22, 2024 | February 29, 2024 | Disclosed on February 6, 2024 | |||
| Dividend for 3Q2023 | October 26, 2023 | September 30, 2023 | — | |||
| Dividend for 2Q2023 | July 21, 2023 | June 30, 2023 | — |
| Note 1) | Date of the annual general meeting of shareholders for year-end dividends and the date of the resolution of the Board of Directors for quarterly dividends |
| Note 2) | Quarterly dividends for FY2023 and FY2024 are prior to the January 2025 amendment to Article 165-12 of the Capital Markets Act |
Dividend Data for the Past 3 Years - Key Indicators
| Items |
2025 | 2024 | 2023 | |||||||||||||
| Par value per share (Won) |
|
5,000 | 5,000 | 5,000 | ||||||||||||
| Net profit (Millions of Won) |
|
3,124,346 | 3,085,995 | 2,506,296 | ||||||||||||
| Earnings per share (Won) |
|
4,052 | 3,950 | 3,230 | ||||||||||||
| Total cash dividends (Millions of Won) |
|
998,468 | 891,045 | 747,302 | ||||||||||||
| Total stock dividends (Millions of Won) |
|
— | — | — | ||||||||||||
| Cash dividend payout ratio (%) |
|
31.96 | 28.87 | 29.82 | ||||||||||||
| Cash dividend yield (%) |
Common Shares | 4.4 | 6.9 | 6.7 | ||||||||||||
| Preferred Shares | — | — | — | |||||||||||||
| Stock dividend yield (%) |
Common Shares | — | — | — | ||||||||||||
| Preferred Shares | — | — | — | |||||||||||||
| Cash dividend per share (Won) |
Common Shares | 1,360 | 1,200 | 1,000 | ||||||||||||
| Preferred Shares | — | — | — | |||||||||||||
| Stock dividend per share (Share) |
Common Shares | — | — | — | ||||||||||||
| Preferred Shares | — | — | — | |||||||||||||
| Note 1) | The dividends for FY2025 include quarterly dividends of KRW 147,428 million (KRW 200 per share) for the first quarter, KRW 146,804 million (KRW 200 per share) for the second quarter and KRW 146,804 million (KRW 200 per share) for the third quarter. |
| Note 2) | The dividends for FY2024 include quarterly dividends of KRW 133,657 million (KRW 180 per share) for the first quarter, KRW 133,657 million (KRW 180 per share) for the second quarter, and KRW 133,657 million (KRW 180 per share) for the third quarter. |
| Note 3) | The dividends for FY2023 include interim dividends of KRW 130,748 million (KRW 180 per share) for the second quarter, and KRW 135,341 million (KRW 180 per share) for the third quarter. |
| Note 4) | The year-end dividend of KRW 557,431 million included in the total cash dividends for FY2025 in the table above is the amount prior to approval by the annual general meeting of shareholders. Should any changes occur at the upcoming annual general meeting, we will reflect the details and reasons through an amended report. |
28
| Note 5) | The cash dividend yield for FY2025 is calculated as the percentage of cash dividend per share to the arithmetic average of the final prices formed in the stock market during the week up to the trading day before the date the dividend amount is determined. The percentage is rounded to the first decimal place. |
| Note 6) | The cash dividend yields for FY2023 and FY2024 are calculated as the percentage of cash dividend per share to the arithmetic average of the final prices formed in the stock market during the week up to the date that is two trading days before the record date. The percentage is rounded to the first decimal place. |
29
| IV. | INDEPENDENT AUDITOR’S OPINION |
| 1. | Independent Auditor’s Opinion |
| 2025 | 2024 | 2023 | ||||
| Auditor |
KPMG Samjong Accounting Corp. | KPMG Samjong Accounting Corp. | KPMG Samjong Accounting Corp. | |||
| Auditor’s Opinion |
Note 1) | Note 2) | Note 3) |
| Note 1) | In its audit report, KPMG Samjong Accounting Corp. has stated that the financial statements are presented fairly, in all material respects, in accordance with Korean IFRS. |
| Note 2) | In its audit report, KPMG Samjong Accounting Corp. has stated that the financial statements are presented fairly, in all material respects, in accordance with Korean IFRS. |
| Note 3) | In its audit report, KPMG Samjong Accounting Corp. has stated that the financial statements are presented fairly, in all material respects, in accordance with Korean IFRS. |
| 2. | Compensation to the Independent Auditor |
| a. | Audit Services |
| Term |
Auditor |
Description |
Contractual | Actual | ||||||||
| Fee | Time | Fee | Time | |||||||||
| 2025 |
KPMG Samjong Accounting Corp. | 1Q/1H/3Q Review Closing audit (including internal accounting management system) |
KRW 1,835 million |
17,029 hours |
KRW 1,835 million |
17,052 hours | ||||||
| 2024 |
KPMG Samjong Accounting Corp. | 1Q/1H/3Q Review Closing audit (including internal accounting management system) |
KRW 1,037 million |
9,930 hours |
KRW 1,037 million |
9,937 hours | ||||||
| 2023 |
KPMG Samjong Accounting Corp. | 1Q/1H/3Q Review Closing audit (including internal accounting management system) |
KRW 964 million |
9,380 hours |
KRW 964 million |
9,613 hours | ||||||
| Note 1) | Fee excludes VAT |
| Note 2) | Time includes planning time up until the commencement of the applicable services |
| b. | Other Audit Services |
Not Applicable
30
| c. | Current Status of Audit Service Agreements with the Independent Auditor Relating to U.S. Listing |
| Term | Auditor |
Description |
Fee | |||
| 2025 | KPMG Samjong Accounting Corp. | U.S. PCAOB standard audit of consolidated financial statements and internal control over financial reporting (for FY2025) | KRW 2,028 million | |||
| 2024 | KPMG Samjong Accounting Corp. | U.S. PCAOB standard audit of consolidated financial statements and internal control over financial reporting (for FY2024) | KRW 2,015 million | |||
| 2023 | KPMG Samjong Accounting Corp. | U.S. PCAOB standard audit of consolidated financial statements and internal control over financial reporting (for FY2023) | KRW 1,891 million |
| Note 1) | Fee excludes VAT |
| d. | Non-Audit Services |
| Term |
Date of Execution |
Description of Service |
Service Term |
Fees | ||||
| 2025 | April 9, 2025 | Tax adjustment (including review relating to application of consolidated tax) | April 9, 2025 ~ June 1, 2026 | KRW 76 million | ||||
| 2024 | March 31, 2024 | Tax adjustment (including review relating to application of consolidated tax) | April 1, 2024 ~ June 2, 2025 | KRW 68 million | ||||
| 2023 | March 31, 2023 | Tax adjustment (including review relating to application of consolidated tax) | April 1, 2023 ~ May 31, 2024 | KRW 64 million |
| Note 1) | Fee excludes VAT |
31
| V. | Corporate Governance |
| 1. | About the Board of Directors |
| a. | Composition of the Board of Directors |
As of December 31, 2025, our board of directors consisted of eight directors in total, including seven independent directors and one standing director.
On March 26, 2025, at the annual general meeting of shareholders, five independent directors were appointed.
- New independent directors (4): Choon-Soo Kim, Young-Hoon Kim, Kang-Haeng Lee, Yeong-Seop Rhee / Reappointed independent director (1): In-Sub Yoon
On March 26, 2025, four (4) independent directors completed their terms: Chan-Hyoung Chung, Su-Young Yun, Yo-Hwan Shin, Sung-Bae Ji
The board of directors operates a total of seven standing committees: Audit Committee, Risk Management Committee, Compensation Committee, Officer Candidate Recommendation Committee, Ethics and Internal Controls Committee, Subsidiary Representative Director Candidate Recommendation Committee, ESG Management Committee.
At the 4th Board Meeting held on March 26, 2025, the independent director In-Sub Yoon was appointed as the Chairman of the Board of Directors. Having served for more than three years since our establishment, he possesses a deep understanding of our organizational culture and management issues. Throughout his tenure as Chairman of the Risk Management Committee (March 25, 2022 – March 26, 2025), he has faithfully carried out his oversight duties over sound management. As a former CEO with hands-on experience in the financial industry, he is expected to contribute significantly to our development by offering practical and well-balanced insights. In recognition of his expertise and leadership, he was reappointed as Chairman of the Board of Woori Financial Group with the unanimous consent of all board members. The Chairman of the Board does not concurrently hold the position of CEO.
32
| b. | Committees under the Board of Directors |
We currently have the following committees serving under the board of directors:
| (a) | Audit Committee |
| (b) | Risk Management Committee |
| (c) | Compensation Committee |
| (d) | Officer Candidate Recommendation Committee |
| (e) | Ethics and Internal Controls Committee |
| (f) | Subsidiary Representative Director Candidate Recommendation Committee |
| (g) | ESG Management Committee |
(As of December 31, 2025)
| Name of Committee |
Composition |
Names of Members | ||
| Audit Committee | Four independent directors | (Chair) Yeong-Seop Rhee (independent director) Choon-Soo Kim (independent director) Young-Hoon Kim (independent director) Kang-Haeng Lee (independent director) | ||
| Risk Management Committee | Four independent directors | (Chair) Sun-Young Park (independent director) In-Sub Yoon (independent director) Yeong-Seop Rhee (independent director) Eun-Ju Lee (independent director) | ||
| Compensation Committee | Four independent directors | (Chair) Young-Hoon Kim (independent director) In-Sub Yoon (independent director) Choon-Soo Kim (independent director) Kang-Haeng Lee (independent director) | ||
| Officer Candidate Recommendation Committee | Seven independent directors | (Chair) Kang-Haeng Lee (independent director) In-Sub Yoon (independent director) Choon-Soo Kim (independent director) Young-Hoon Kim (independent director) Yeong-Seop Rhee (independent director) Eun-Ju Lee (independent director) Sun-Young Park (independent director) | ||
| Ethics and Internal Controls Committee | Five independent directors | (Chair) Choon-Soo Kim (independent director) In-Sub Yoon (independent director) Young-Hoon Kim (independent director) Kang-Haeng Lee (independent director) Yeong-Seop Rhee (independent director) | ||
33
| Name of Committee |
Composition |
Names of Members | ||
| Subsidiary Representative Director Candidate Recommendation Committee | Seven independent directors One standing director |
(Chair) Jong-Yong Yim (standing director) In-Sub Yoon (independent director) Choon-Soo Kim (independent director) Young-Hoon Kim (independent director) Kang-Haeng Lee (independent director) Yeong-Seop Rhee (independent director) Eun-Ju Lee (independent director) Sun-Young Park (independent director) | ||
| ESG Management Committee | Seven independent directors One standing director |
(Chair) Eun-Ju Lee (independent director) In-Sub Yoon (independent director) Choon-Soo Kim (independent director) Young-Hoon Kim (independent director) Kang-Haeng Lee (independent director) Yeong-Seop Rhee (independent director) Sun-Young Park (independent director) Jong-Yong Yim (standing director) | ||
| 2. | Shareholders’ Meetings |
| a. | Voting Rights |
(unit: shares, as of Dec. 31, 2025)
| Items |
Number of shares |
Notes | ||||||||
| Number of issued shares |
Common Shares | 734,076,320 | — | |||||||
| Preferred Shares | — | — | ||||||||
| Number of shares without voting rights |
Common Shares | 3,082,276 | Note 1 | ) | ||||||
| Preferred Shares | — | — | ||||||||
| Number of shares for which voting rights are excluded pursuant to the articles of incorporation | Common Shares | — | — | |||||||
| Preferred Shares | — | — | ||||||||
| Number of shares for which voting rights are limited by law |
Common Shares | — | — | |||||||
| Preferred Shares | — | — | ||||||||
| Number of shares for which voting rights have been restored |
Common Shares | — | — | |||||||
| Preferred Shares | — | — | ||||||||
| Number of shares for which voting rights may be exercised |
Common Shares | 730,994,044 | — | |||||||
| Preferred Shares | — | — | ||||||||
| Note 1) | Treasury shares acquired from the issuance of fractional shares and shares in mutual ownership (pursuant to Article 369 of the Commercial Code) |
34
| b. | Summary of the Minutes of Shareholders’ Meetings |
| Agenda | Result | |||
| Annual General Meeting of Shareholders for FY2022 (March 24, 2023) |
1. Approval of separate financial statements (including statements of appropriations of retained earnings) and consolidated financial statements for the fiscal year 2022 (Jan. 1, 2022 – Dec. 31, 2022) | Approved as submitted | ||
| 2. Approval of amendments to the Articles of Incorporation | Approved as submitted | |||
| 3. Election of directors (2 independent directors, 1 standing director) - 3-1 Candidate for independent director : Chan-Hyoung Chung - 3-2 Candidate for independent director : Su-Young Yun - 3-3 Candidate for standing director : Jong-Yong Yim |
Approved as submitted | |||
| 4. Election of independent director who will serve as an Audit Committee Member - Candidate for independent director who will serve as an Audit Committee Member : Sung-Bae Ji |
Approved as submitted | |||
| 5. Election of Audit Committee Members who are independent directors - 5-1 Candidate for Audit Committee Member who is an Independent director : Chan-Hyoung Chung - 5-2 Candidate for Audit Committee Member who is an Independent director : Su-Young Yun - 5-3 Candidate for Audit Committee Member who is an Independent director : Yo-Hwan Shin |
Approved as submitted | |||
| 6. Approval of maximum limit on directors’ compensation | Approved as submitted | |||
|
Annual General Meeting of Shareholders for FY2023 (March 22, 2024) |
1. Approval of separate financial statements (including statements of appropriations of retained earnings) and consolidated financial statements for the fiscal year 2023 (Jan. 1, 2023 – Dec. 31, 2023) | Approved as submitted | ||
| 2. Election of directors (5 independent directors) - 2-1 Candidate for independent director : Chan-Hyoung Chung - 2-2 Candidate for independent director : In-Sub Yoon - 2-3 Candidate for independent director : Yo-Hwan Shin - 2-4 Candidate for independent director : Eun-Ju Lee - 2-5 Candidate for independent director : Sunyoung Park |
Approved as submitted |
35
| 3. Election of Audit Committee members who are independent directors (2 independent directors) - 3-1 Candidate for Audit Committee member who is an independent director : Chan-Hyoung Chung - 3-2 Candidate for Audit Committee member who is an independent director : Yo-Hwan Shin |
Approved as submitted | |||
| 4. Approval of the maximum limit on directors’ compensation | Approved as submitted | |||
|
Annual General Meeting of Shareholders for FY2024 (March 26, 2025) |
1. Approval of separate financial statements (including statements of appropriations of retained earnings) and consolidated financial statements for fiscal year 2024 (Jan. 1, 2024 – Dec. 31, 2024) | Approved as submitted | ||
| 2. Approval of amendments to the Articles of Incorporation | Approved as submitted | |||
| 3. Approval of reductions to the capital reserve | Approved as submitted | |||
| 4. Election of directors (4 independent directors) - 4-1 Candidate for independent director : Choon-Soo Kim - 4-2 Candidate for independent director : Young-Hoon Kim - 4-3 Candidate for independent director : Kang-Haeng Lee - 4-4 Candidate for independent director : In-Sub Yoon |
Approved as submitted | |||
| 5. Election of independent director who will serve as an audit committee member - Candidate for independent director who will serve as an audit committee member : Yeong-Seop Rhee |
Approved as submitted | |||
| 6. Election of audit committee members who are independent directors (3 independent directors) - 6-1 Candidate for audit committee member who is an independent director : Choon-Soo Kim - 6-2 Candidate for audit committee member who is an independent director : Young-Hoon Kim - 6-3 Candidate for audit committee member who is an independent director : Kang-Haeng Lee |
Approved as submitted | |||
| 7. Approval of the maximum limit on directors’ compensation | Approved as submitted |
36
| VI. | Shareholder Information |
| 1. | Share Distribution |
| a. | Share Information of the Largest Shareholder and Specially Related Parties |
| As of December 31, 2025 | (units: shares, %) |
| Shares Held | ||||||||||||||||||||||||||||
| Beginning balance | Ending balance | |||||||||||||||||||||||||||
| Name |
Relation | Type | Number | Share | Number | Share | Notes | |||||||||||||||||||||
| Employee Stock Ownership Association of Woori Financial Group |
The largest shareholder | Common | 44,474,301 | 5.99 | 42,182,950 | 5.75 | — | |||||||||||||||||||||
| Employee Stock Ownership Association of Woori Bank |
|
The related party of the largest shareholder |
|
Common | 19,106,955 | 2.57 | 14,753,107 | 2.01 | — | |||||||||||||||||||
| Total |
Common | 63,581,256 | 8.56 | 56,936,057 | 7.76 | — | ||||||||||||||||||||||
| Others | — | — | — | — | — | |||||||||||||||||||||||
| b. | Changes in the largest shareholder |
| As of December 31, 2025 | (units: shares, %) |
| Change of Date |
Largest Shareholder |
Number Held |
Share | Notes | ||||||||
| December 9, 2021 |
Employee Stock Ownership Association of Woori Financial Group and others 1 | 71,346,178 | 9.80 | Bought 1.00% of the KDIC’s remaining shares of Woori Financial Group (8.80% share already held) Note 1) | ||||||||
| Note 1) | Refer to the prior disclosure on the Form 6-K on December 10, 2021, Changes in the Largest Shareholder |
| c. | Share Ownership of More Than 5% |
| As of December 31, 2025 | (units: shares, %) |
| Name |
Shares | Notes | ||||||||||
| No. of shares | Percentage of shareholding |
|||||||||||
| Share ownership of more than 5% |
National Pension Service | 49,136,320 | 6.69 | — | ||||||||
| Blackrock Fund Advisors | 45,100,755 | 6.14 | Note 1) | |||||||||
| Employee Stock Ownership Association |
56,936,057 | 7.76 | Note 2) | |||||||||
| Note 1) | Based on the report on significant holdings of stocks filed on June 10, 2024 |
| - | According to the report on significant holdings of stocks filed on February 10, 2026, BlackRock Fund Advisors held 52,302,167 shares. |
| Note 2) | Total shares of the employee stock ownership association of Woori Financial Group and Woori Bank. |
| Note 3) | Percentage of shareholding : Calculated based on the total number of issued shares as of December 31, 2025. |
37
| 2. | Stock Price and Stock Market Performance |
| a. | Domestic Stock Market |
(units: Won, thousands of shares)
| Period |
July 2025 |
August 2025 |
September 2025 |
October 2025 |
November 2025 |
December 2025 |
||||||||||||||||||||
| Common Shares |
High | 26,750 | 25,450 | 26,850 | 26,200 | 27,000 | 29,000 | |||||||||||||||||||
| Low | 22,450 | 23,600 | 24,250 | 24,850 | 25,500 | 27,350 | ||||||||||||||||||||
| Average | 24,750 | 24,865 | 25,716 | 25,644 | 26,188 | 27,986 | ||||||||||||||||||||
| Monthly Trade Volume |
High | 5,460 | 4,085 | 3,726 | 2,588 | 4,885 | 4,215 | |||||||||||||||||||
| Low | 1,073 | 699 | 452 | 808 | 971 | 703 | ||||||||||||||||||||
| Monthly Total | 54,144 | 29,174 | 35,552 | 31,828 | 46,111 | 33,478 | ||||||||||||||||||||
| Note 1) | Source: KRX KOSPI Market |
| Note 2) | Share prices are based on closing prices |
| b. | Foreign Stock Market (NYSE) |
(units: US Dollars, Won, thousands of ADSs)
| Period |
July 2025 |
August 2025 |
September 2025 |
October 2025 |
November 2025 |
December 2025 |
||||||||||||||||||||
| ADS |
High | 57.61 | 55.47 | 57.76 | 56.82 | 55.99 | 59.90 | |||||||||||||||||||
| Low | 49.62 | 51.43 | 52.91 | 52.67 | 53.04 | 55.90 | ||||||||||||||||||||
| Average | 53.79 | 53.92 | 55.84 | 54.75 | 54.51 | 57.73 | ||||||||||||||||||||
| Won Conversion |
High | 79,196 | 77,114 | 80,258 | 79,889 | 81,925 | 87,490 | |||||||||||||||||||
| Low | 67,166 | 71,508 | 73,688 | 75,197 | 77,704 | 82,402 | ||||||||||||||||||||
| Average | 73,971 | 74,925 | 77,718 | 77,928 | 79,467 | 84,708 | ||||||||||||||||||||
| Monthly Trade Volume |
High | 218 | 161 | 62 | 178 | 94 | 104 | |||||||||||||||||||
| Low | 29 | 21 | 28 | 25 | 38 | 22 | ||||||||||||||||||||
| Monthly Total | 1,951 | 885 | 924 | 1,088 | 1,081 | 1,212 | ||||||||||||||||||||
| Note 1) | Source: standard trading rate (daily and monthly average) (Seoul Money Brokerage, www.smbs.biz) |
| Note 2) | One ADS represents three common shares. |
| Note 3) | Share prices are based on closing prices. |
38
| VII. | Directors and Employee Information |
| 1. | Directors and Executives |
As of March 13, 2026
| Position |
Name |
Common Shares Owned |
Term Commencement Date |
Expiration of Term | ||||||||
| Chief Executive Officer |
Registered | Jong-Yong Yim | 10,000 | March 24, 2023 | Note 1) | |||||||
| Independent Director |
Registered | In-Sub Yoon | — | January 27, 2022 | Note 1) | |||||||
| Independent Director |
Registered | Choon-Soo Kim | 2,800 | March 26, 2025 | Note 2) | |||||||
| Independent Director |
Registered | Young-Hoon Kim | — | March 26, 2025 | Note 2) | |||||||
| Independent Director |
Registered | Kang-Haeng Lee | 7,000 | March 26, 2025 | Note 2) | |||||||
| Independent Director |
Registered | Yeong-Seop Rhee | — | March 26, 2025 | Note 2) | |||||||
| Independent Director |
Registered | Eun-Ju Lee | — | March 28, 2024 | Note 1) | |||||||
| Independent Director |
Registered | Sun-Young Park | — | March 26, 2024 | Note 1) | |||||||
| President |
Non-Registered | Jeong-Soo Lee | 6,890 | February 27, 2026 | December 31, 2026 | |||||||
| Deputy President |
Non-Registered | Il-Jin Ouk | 4,000 | December 8, 2023 | November 30, 2026 | |||||||
| Deputy President |
Non-Registered | Jang-Keun Park | 2,850 | December 8, 2023 | March 6, 2027 | |||||||
| Deputy President |
Non-Registered | Kyu-Hwang Jeong | 11,741 | December 8, 2023 | July 4, 2026 | |||||||
| Deputy President |
Non-Registered | Seong-Min Kwak | 3,692 | January 15, 2026 | December 31, 2027 | |||||||
| Managing Director |
Non-Registered | Jung-Sup Lee | — | December 16, 2024 | December 31, 2026 | |||||||
| Managing Director |
Non-Registered | Je-Seong Park | 5,250 | December 16, 2024 | December 31, 2026 | |||||||
| Managing Director |
Non-Registered | Byung-Gyu Kim | — | January 15, 2026 | December 31, 2027 | |||||||
| Managing Director |
Non-Registered | Won-Myung Ko | — | January 15, 2026 | January 14, 2028 | |||||||
| Managing Director |
Non-Registered | Yeon-Ho Park | — | February 27, 2026 | December 31, 2027 | |||||||
| Note 1) | The terms of standing director Jong-Yong Yim and independent directors In-Sub Yoon, Eun-Ju Lee, and Sun-Young Park : Until the end of the annual general meeting of shareholders for FY2025. |
| Note 2) | The terms of independent directors Choon-Soo Kim, Young-Hoon Kim, Kang-Haeng Lee, and Yeong-Seop Rhee: Until the end of the annual general meeting of shareholders for FY2026. |
| Note 3) | Term commencement date: date of inauguration for registered officers or directors / date of appointment of current position for non-registered officers or directors. |
| Note 4) | Common shares owned by executive officers excludes shares held through the Employee Stock Ownership Association, in accordance with the legal interpretation by the Financial Services Commission (FSC). |
39
| 2. | Employee Status |
| As of December 31, 2025 | (units: persons, millions of Won) |
| Number of Employees | Average Tenure |
Total Compensation |
Average Compensation Per Person |
Note | ||||||||||||||||||||||||||||||||
| Regular | Contract | Total | ||||||||||||||||||||||||||||||||||
| Total | (Short time worker) |
Total | (Short time worker) |
|||||||||||||||||||||||||||||||||
| Total |
78 | — | 36 | 1 | 114 | |
3 years (14 years 11 months |
) |
19,622 | 180 | — | |||||||||||||||||||||||||
| Note 1) | Average tenure: term in ( ) includes tenure at affiliated companies |
| Note 2) | Contract employees include non-registered executives |
| 3. | Directors’ Compensation |
| As of December 31, 2025 | (units: persons, millions of Won) |
| Items |
Number of Persons |
Total Compensation |
Average Compensation Per Director |
Note | ||||||||||||
| Registered Directors (excludes independent directors and audit committee members) |
1 | 1,193 | 1,193 | — | ||||||||||||
| Independent Directors (excludes audit committee members) |
3 | 259 | 86 | — | ||||||||||||
| Audit Committee Members |
4 | 321 | 80 | — | ||||||||||||
| Auditor |
— | — | — | — | ||||||||||||
| Note 1) | Number of persons is as of December 31, 2025. |
| Note 2) | Total compensation is the amount paid from January to December 2025. |
| Note 3) | Average compensation per director was calculated by dividing the total compensation by the average number of persons. |
| Note 4) | Registered directors and audit committee members include uncompensated directors. |
| 4. | Stock-based Compensation |
The Company operates a performance-based stock-linked compensation system, pursuant to the standards established by the shareholders at the shareholders’ meeting and the Compensation Committee. The Company initially determines, for each recipient, the maximum share amounts that can be granted under the system, and then determines the final share amounts based on an evaluation of the long-term performance indices over four years (including the current year). The compensation is then paid in cash, based on the final share amount and the share price at the time the compensation is granted. The long-term performance indices include relative shareholder return, common equity ratio, return on equity, profit for the period, cost-to-income ratio, non-performing loan ratio and individual performance evaluations. For further information, please refer to the notes to the financial statements.
40
(Unit: shares, except number of recipients)
| Items |
2023 | 2024 | 2025 | |||||||||
| Number of Recipients |
21 | 13 | 9 | |||||||||
| Maximum Amount of Shares |
160,929 | 194,569 | 173,273 | |||||||||
| Shares Paid during the Period |
68,746 | 164,164 | 161,799 | |||||||||
| (Adjustments) |
(8,982 | ) | (19,554 | ) | (21,970 | ) | ||||||
| Cumulative Shares Paid |
68,746 | 232,910 | 394,709 | |||||||||
| Unpaid Shares |
813,173 | 824,024 | 813,528 | |||||||||
| Note) | Number of Recipients: Includes employees who had retired or resigned by the end of the grant year. The total number also accounts for all personnel involved before and after changes such as internal transfers during the grant year |
41
| VIII. | Internal Controls |
| 1. | Management’s Assessment of the Effectiveness of the Internal Accounting Management System |
| Term |
Date of Report |
Assessment |
Material Deficiencies |
Corrective Action Plans |
||||||||
| 2025 |
February 27, 2026 | In terms of overall materiality, the internal accounting management system is under effective design and operation. | — | — | ||||||||
| 2024 |
February 28, 2025 | In terms of overall materiality, the internal accounting management system is under effective design and operation. | — | — | ||||||||
| 2023 |
February 29, 2024 | In terms of overall materiality, the internal accounting management system is under effective design and operation. | — | — | ||||||||
| 2. | Audit Committee’s Assessment of the Effectiveness of the Internal Accounting Management System |
| Term |
Date of Report |
Assessment |
Material Deficiencies |
Corrective Action Plans |
||||||||
| 2025 |
February 27, 2026 | In terms of overall materiality, the internal accounting management system is under effective design and operation. | — | — | ||||||||
| 2024 |
February 28, 2025 | In terms of overall materiality, the internal accounting management system is under effective design and operation. | — | — | ||||||||
| 2023 |
February 29, 2024 | In terms of overall materiality, the internal accounting management system is under effective design and operation. | — | — | ||||||||
| 3. | External Auditor’s Audit Opinion (Review Report) on the Effectiveness of the Internal Accounting Management System |
| Term |
Auditor |
Audit or Review |
Opinion Type |
Issues | Company’s Response Actions |
|||||||||
| 2025 |
KPMG Samjong Accounting Corp. | Audit | Unqualified | — | — | |||||||||
| 2024 |
KPMG Samjong Accounting Corp. | Audit | Unqualified | — | — | |||||||||
| 2023 |
KPMG Samjong Accounting Corp. | Audit | Unqualified | — | — | |||||||||
42
SIGNATURES
Pursuant to the requirements of the Securities Exchange Act of 1934, the registrant has duly caused this report to be signed on its behalf by the undersigned, thereunto duly authorized.
| Woori Financial Group Inc. | ||||||
| (Registrant) | ||||||
| Date: March 13, 2026 | By: | /s/ Seong Min Kwak | ||||
| (Signature) | ||||||
| Name: Seong Min Kwak | ||||||
| Title: Deputy President | ||||||
43