| HILLTOP HOLDINGS INC. Q4 2025 EARNINGS PRESENTATION JANUARY 2026 |
| 2 ©2025 Hilltop Holdings. Confidential and Proprietary. PREFACE $36.1 MM $0.57 0.98% 6.62% Corporate Headquarters Additional Information 6565 Hillcrest Ave Dallas, TX 75205 Phone: 214-855-2177 www.hilltop.com Please Contact: Matt Dunn Phone: 214-525-4636 Email: mdunn@hilltop.com FORWARD-LOOKING STATEMENTS AND OTHER MATTERS This presentation and statements made by representatives of Hilltop Holdings Inc. (“Hilltop” or the “Company”) during the course of this presentation include “forward-looking statements” within the meaning of the Private Securities Litigation Reform Act of 1995. These forward-looking statements involve known and unknown risks, uncertainties and other factors that may cause the Company’s actual results, performance or achievements to be materially different from any future results, performance or achievements anticipated or implied in such statements. Such forward-looking statements include, but are not limited to, statements concerning such things as the Company’s outlook, business strategy, financial condition, efforts to make strategic acquisitions, liquidity and sources of funding, market trends, operations and business, the impact of natural disasters or public health emergencies, information technology expenses, capital levels, mortgage servicing rights (“MSR”) assets, stock repurchases, dividend payments, expectations concerning mortgage loan origination volume, servicer advances and interest rate compression, expected levels of refinancing as a percentage of total loan origination volume, projected losses on mortgage loans originated, total expenses, anticipated changes in our revenue, earnings, or taxes, the effects of government regulation applicable to our operations, the appropriateness of, and changes in, our allowance for credit losses and provision for (reversal of) credit losses, future benchmark rates and economic growth, anticipated investment yields, the collectability of loans, cybersecurity incidents, the outcome of litigation, and the Company’s other plans, objectives, strategies, expectations and intentions and other statements that are not statements of historical fact, and may be identified by words such as “anticipates,” “believes,” “building,” “continue,” “could,” “estimates,” “expects,” “forecasts,” “goal,” “guidance,” “intends,” “may,” “might,” “outlook,” “plan,” “probable,” “projects,” “seeks,” “should,” “target,” “view” or “would” or the negative of these words and phrases or similar words or phrases. The following factors, among others, could cause actual results to differ from those set forth in the forward-looking statements: (i) the credit risks of lending activities, including the Company’s ability to estimate credit losses and increases to the allowance for credit losses, as well as the effects of changes in the level of, and trends in, loan delinquencies and write-offs; (ii) effectiveness of the Company’s data security controls in the face of cyberattacks and any legal, reputational and financial risks following a cybersecurity incident; (iii) changes in general economic, market and business conditions in areas or markets where the Company competes, including changes in the price of crude oil; (iv) changes in the interest rate environment; (v) risks associated with concentration in real estate related loans; (vi) the effects of the Company’s indebtedness on its ability to manage its business successfully, including the restrictions imposed by the indenture governing such indebtedness; (vii) disruptions to the economy and financial services industry, risks associated with uninsured deposits and responsive measures by federal or state governments or banking regulators, including increases in the cost of the Company’s deposit insurance assessments; (viii) cost and availability of capital; (ix) changes in state and federal laws, regulations or policies affecting one or more of the Company’s business segments, including changes in regulatory fees, capital requirements and the Dodd-Frank Wall Street Reform and Consumer Protection Act; (x) changes in key management; (xi) competition in the Company’s banking, broker-dealer and mortgage origination segments from other banks and financial institutions, as well as investment banking and financial advisory firms, mortgage bankers, asset-based non-bank lenders and government agencies; (xii) legal and regulatory proceedings; and (xiii) the Company’s ability to use excess capital in an effective manner. For further discussion of such factors, see the risk factors described in our most recent Annual Report on Form 10-K, subsequent Quarterly Reports on Form 10-Q and other reports that we have filed with the Securities and Exchange Commission. All forward-looking statements are qualified in their entirety by this cautionary statement. Certain information contained herein is preliminary and based on Company data available at the time of the earnings presentation. It speaks only as of the particular date or dates included in the accompanying slides. Except as required by law, Hilltop does not undertake an obligation to, and disclaims any duty to, update any of the information herein. Included in this presentation are certain non-GAAP financial measures, such as Tangible Common Equity and Tangible Book Value per Share, which are designed to complement the financial information presented in accordance with U.S. GAAP as management believes such measures are useful to investors. These non-GAAP financial measures should be considered only as supplemental to, and not superior to, financial measures provided in accordance with GAAP. Please refer to the “Non-GAAP to GAAP Reconciliation and Management’s Explanation of Non-GAAP Financial Measures” section of the appendix of this presentation for additional detail including reconciliations of non-GAAP financial measures included in this presentation to the most directly comparable financial measures prepared in accordance with GAAP. |
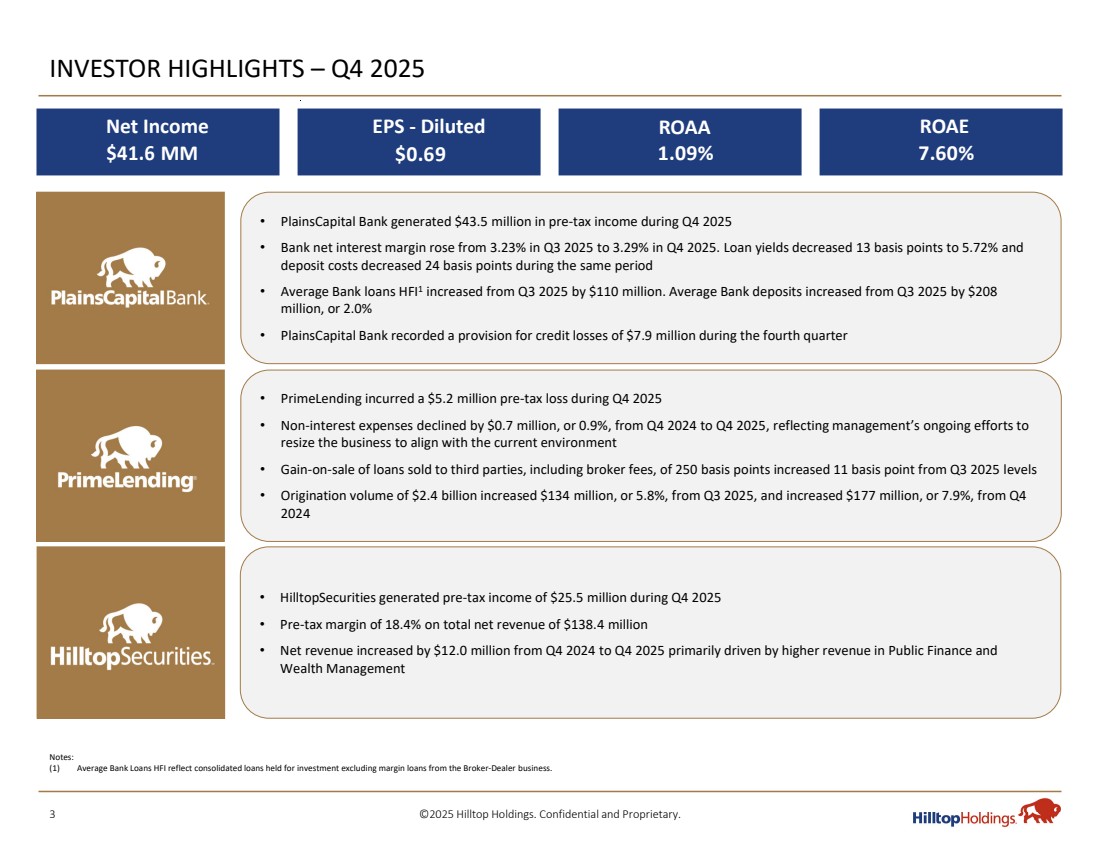
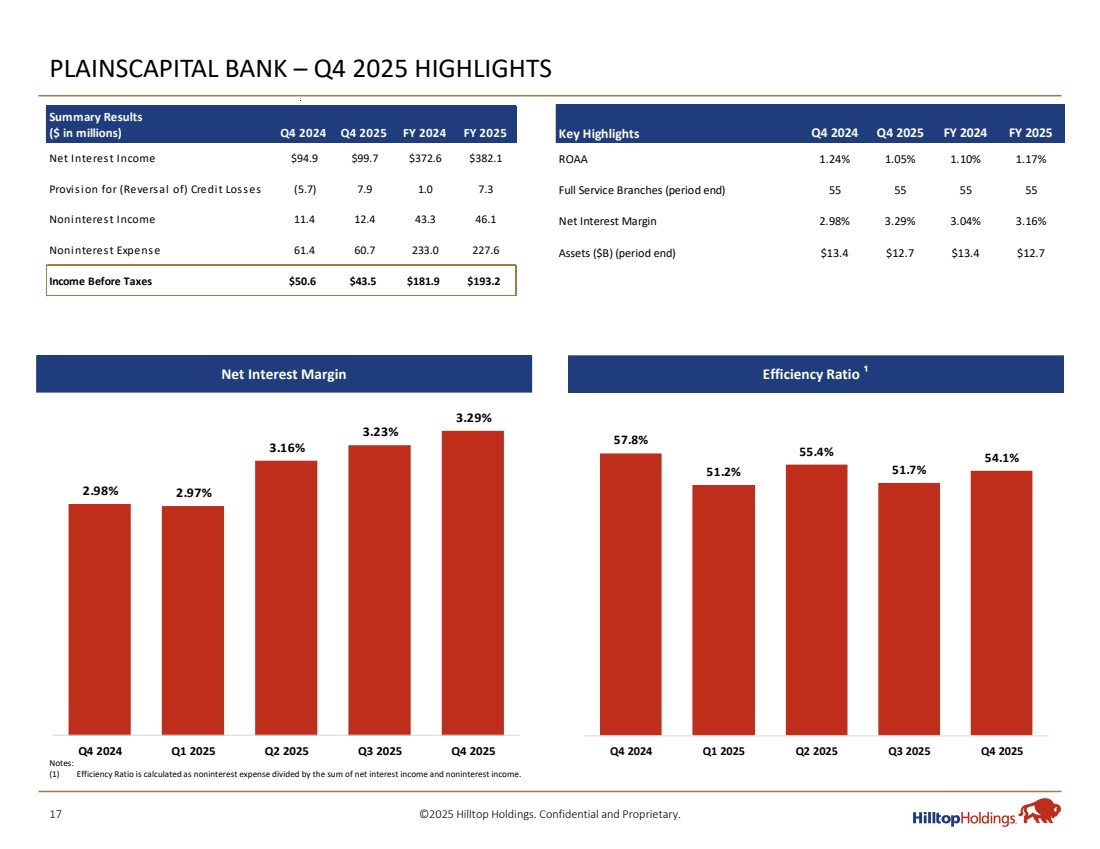
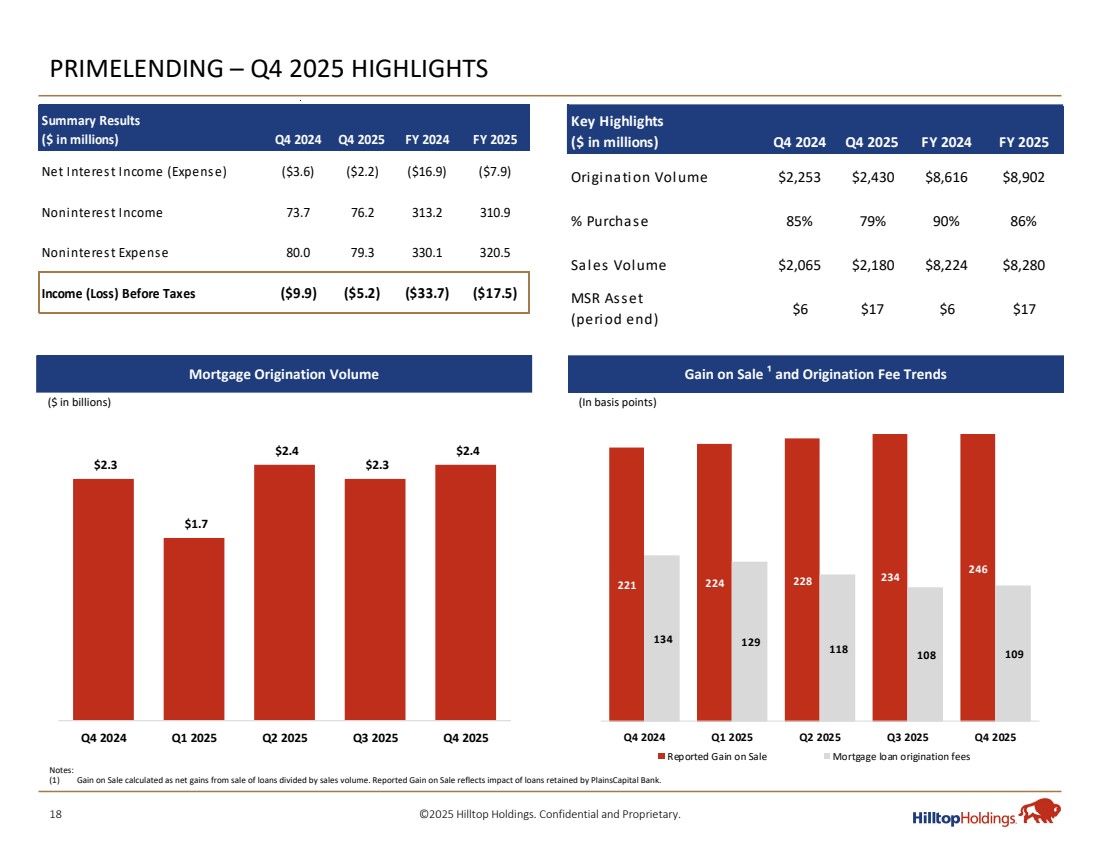
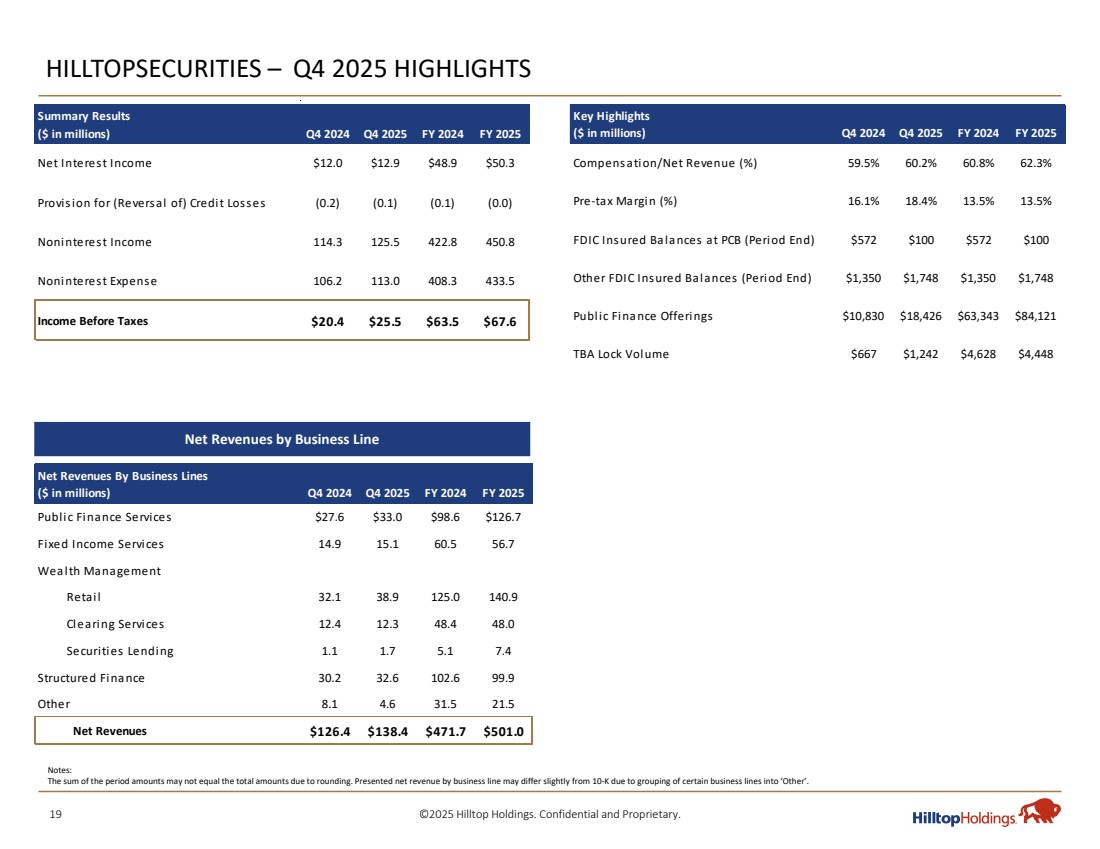
| 3 ©2025 Hilltop Holdings. Confidential and Proprietary. INVESTOR HIGHLIGHTS – Q4 2025 • PlainsCapital Bank generated $43.5 million in pre-tax income during Q4 2025 • Bank net interest margin rose from 3.23% in Q3 2025 to 3.29% in Q4 2025. Loan yields decreased 13 basis points to 5.72% and deposit costs decreased 24 basis points during the same period • Average Bank loans HFI1 increased from Q3 2025 by $110 million. Average Bank deposits increased from Q3 2025 by $208 million, or 2.0% • PlainsCapital Bank recorded a provision for credit losses of $7.9 million during the fourth quarter • PrimeLending incurred a $5.2 million pre-tax loss during Q4 2025 • Non-interest expenses declined by $0.7 million, or 0.9%, from Q4 2024 to Q4 2025, reflecting management’s ongoing efforts to resize the business to align with the current environment • Gain-on-sale of loans sold to third parties, including broker fees, of 250 basis points increased 11 basis point from Q3 2025 levels • Origination volume of $2.4 billion increased $134 million, or 5.8%, from Q3 2025, and increased $177 million, or 7.9%, from Q4 2024 • HilltopSecurities generated pre-tax income of $25.5 million during Q4 2025 • Pre-tax margin of 18.4% on total net revenue of $138.4 million • Net revenue increased by $12.0 million from Q4 2024 to Q4 2025 primarily driven by higher revenue in Public Finance and Wealth Management $41.6 . Net Income MM $0.69 1.09% 7.60% EPS - Diluted ROAA ROAE Notes: (1) Average Bank Loans HFI reflect consolidated loans held for investment excluding margin loans from the Broker-Dealer business. |
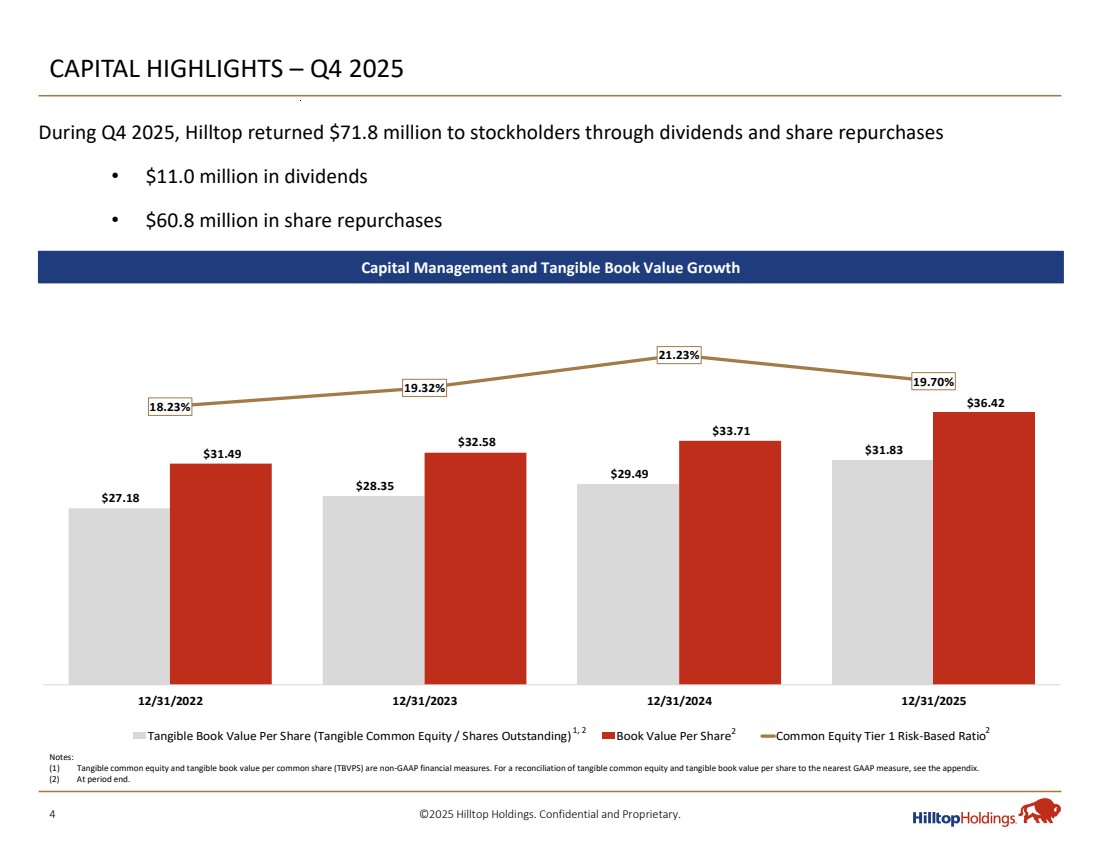
| 4 ©2025 Hilltop Holdings. Confidential and Proprietary. $27.18 $28.35 $29.49 $31.83 $31.49 $32.58 $33.71 $36.42 18.23% 19.32% 21.23% 19.70% 2.00% 22.00% 12/31/2022 12/31/2023 12/31/2024 12/31/2025 Tangible Book Value Per Share (Tangible Common Equity / Shares Outstanding) Book Value Per Share Common Equity Tier 1 Risk-Based Ratio CAPITAL HIGHLIGHTS – Q4 2025 Capital Management and Tangible Book Value Growth During Q4 2025, Hilltop returned $71.8 million to stockholders through dividends and share repurchases • $11.0 million in dividends • $60.8 million in share repurchases Notes: (1) Tangible common equity and tangible book value per common share (TBVPS) are non-GAAP financial measures. For a reconciliation of tangible common equity and tangible book value per share to the nearest GAAP measure, see the appendix. (2) At period end. 1, 2 2 2 |
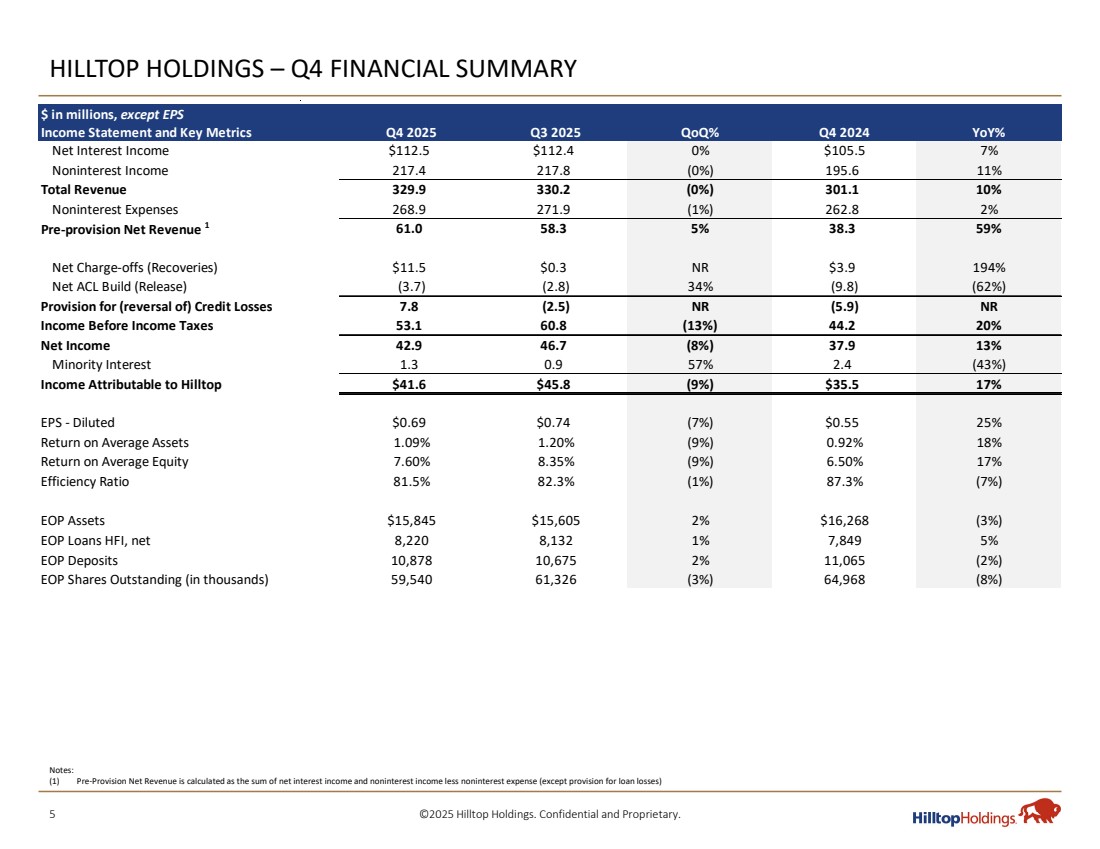
| 5 ©2025 Hilltop Holdings. Confidential and Proprietary. HILLTOP HOLDINGS – Q4 FINANCIAL SUMMARY Notes: (1) Pre-Provision Net Revenue is calculated as the sum of net interest income and noninterest income less noninterest expense (except provision for loan losses) $ in millions, except EPS Income Statement and Key Metrics Q4 2025 Q3 2025 QoQ% Q4 2024 YoY% Net Interest Income $112.5 $112.4 0% $105.5 7% Noninterest Income 217.4 217.8 (0%) 195.6 11% Total Revenue 329.9 330.2 (0%) 301.1 10% Noninterest Expenses 268.9 271.9 (1%) 262.8 2% Pre-provision Net Revenue 1 61.0 58.3 5% 38.3 59% Net Charge-offs (Recoveries) $11.5 $0.3 NR $3.9 194% Net ACL Build (Release) (3.7) (2.8) 34% (9.8) (62%) Provision for (reversal of) Credit Losses 7.8 (2.5) NR (5.9) NR Income Before Income Taxes 53.1 60.8 (13%) 44.2 20% Net Income 42.9 46.7 (8%) 37.9 13% Minority Interest 1.3 0.9 57% 2.4 (43%) Income Attributable to Hilltop $41.6 $45.8 (9%) $35.5 17% EPS - Diluted $0.69 $0.74 (7%) $0.55 25% Return on Average Assets 1.09% 1.20% (9%) 0.92% 18% Return on Average Equity 7.60% 8.35% (9%) 6.50% 17% Efficiency Ratio 81.5% 82.3% (1%) 87.3% (7%) EOP Assets $15,845 $15,605 2% $16,268 (3%) EOP Loans HFI, net 8,220 8,132 1% 7,849 5% EOP Deposits 10,878 10,675 2% 11,065 (2%) EOP Shares Outstanding (in thousands) 59,540 61,326 (3%) 64,968 (8%) |
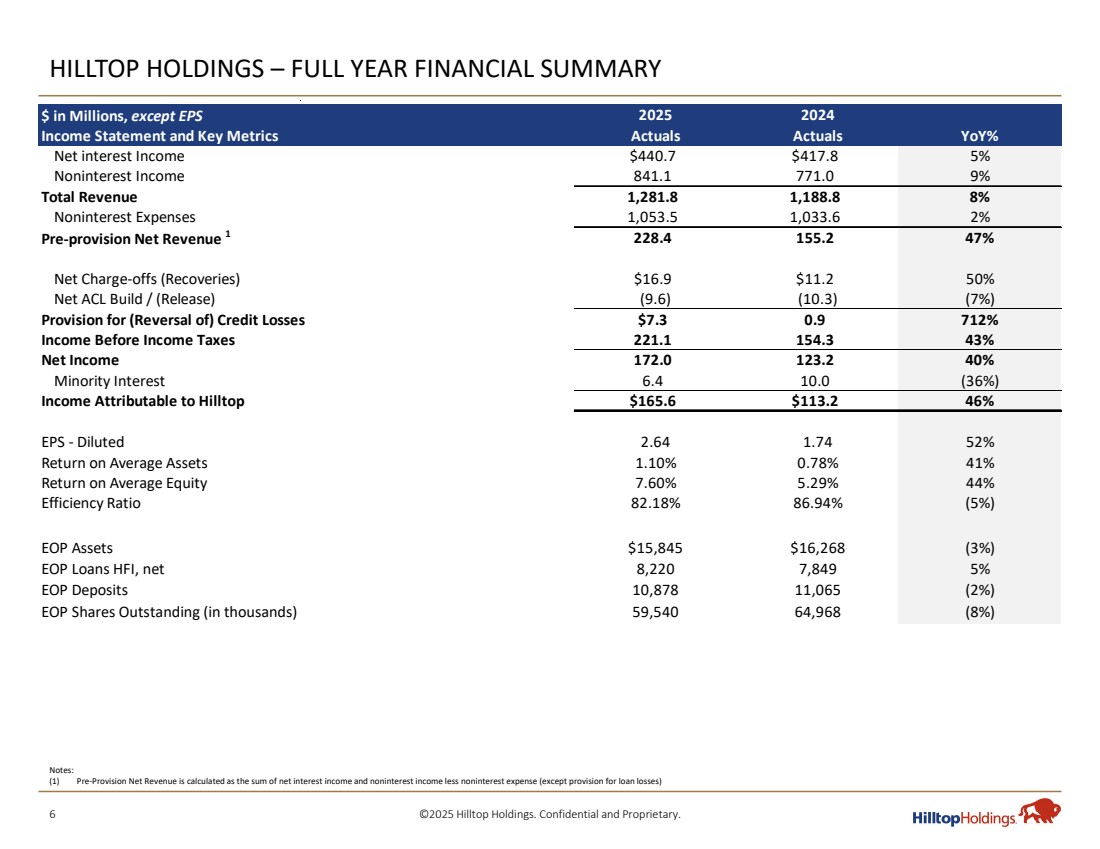
| 6 ©2025 Hilltop Holdings. Confidential and Proprietary. HILLTOP HOLDINGS – FULL YEAR FINANCIAL SUMMARY Notes: (1) Pre-Provision Net Revenue is calculated as the sum of net interest income and noninterest income less noninterest expense (except provision for loan losses) $ in Millions, except EPS 2025 2024 Income Statement and Key Metrics Actuals Actuals YoY% Net interest Income $440.7 $417.8 5% Noninterest Income 841.1 771.0 9% Total Revenue 1,281.8 1,188.8 8% Noninterest Expenses 1,053.5 1,033.6 2% Pre-provision Net Revenue 1 228.4 155.2 47% Net Charge-offs (Recoveries) $16.9 $11.2 50% Net ACL Build / (Release) (9.6) (10.3) (7%) Provision for (Reversal of) Credit Losses $7.3 0.9 712% Income Before Income Taxes 221.1 154.3 43% Net Income 172.0 123.2 40% Minority Interest 6.4 10.0 (36%) Income Attributable to Hilltop $165.6 $113.2 46% EPS - Diluted 2.64 1.74 52% Return on Average Assets 1.10% 0.78% 41% Return on Average Equity 7.60% 5.29% 44% Efficiency Ratio 82.18% 86.94% (5%) EOP Assets $15,845 $16,268 (3%) EOP Loans HFI, net 8,220 7,849 5% EOP Deposits 10,878 11,065 (2%) EOP Shares Outstanding (in thousands) 59,540 64,968 (8%) |
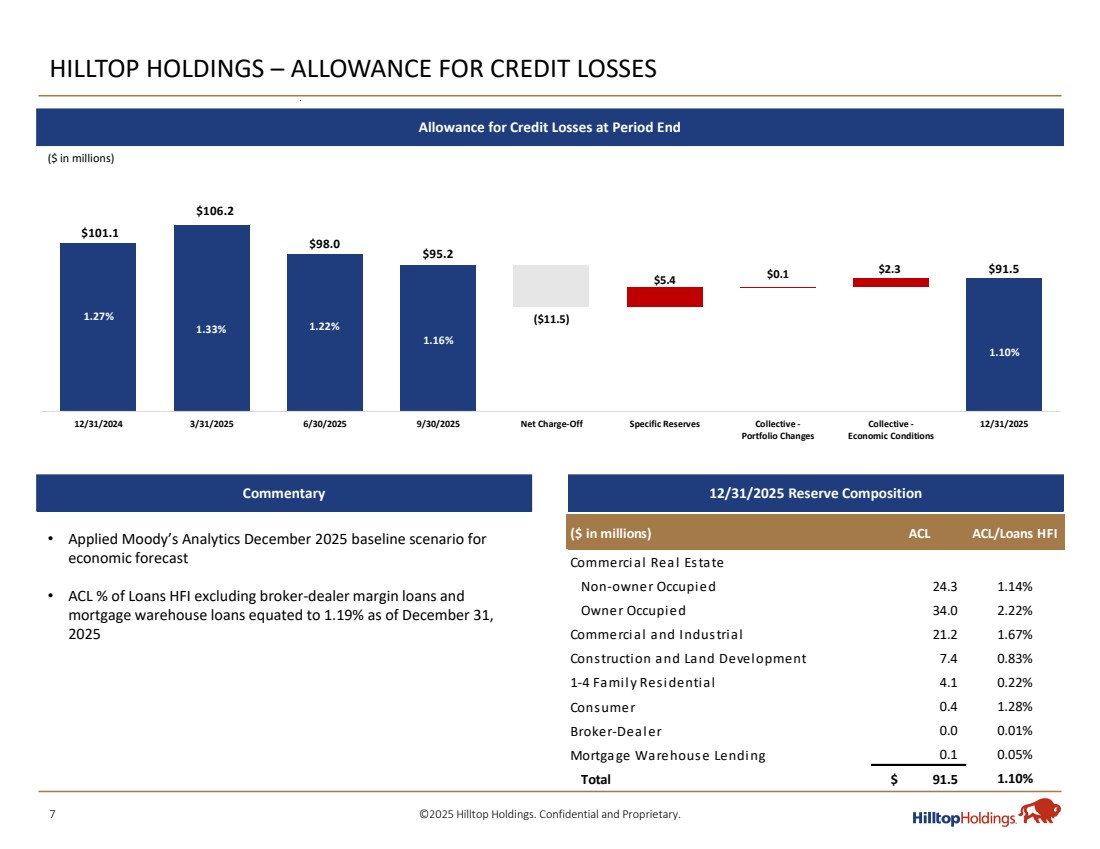
| 7 ©2025 Hilltop Holdings. Confidential and Proprietary. HILLTOP HOLDINGS – ALLOWANCE FOR CREDIT LOSSES Allowance for Credit Losses at Period End 12/31/2025 Reserve Composition ($ in millions) Commentary • Applied Moody’s Analytics December 2025 baseline scenario for economic forecast • ACL % of Loans HFI excluding broker-dealer margin loans and mortgage warehouse loans equated to 1.19% as of December 31, 2025 ($ in millions) ACL ACL/Loans HFI Commercial Real Estate Non-owner Occupied 24.3 1.14% Owner Occupied 34.0 2.22% Commercial and Industrial 21.2 1.67% Construction and Land Development 7.4 0.83% 1-4 Family Residential 4.1 0.22% Consumer 1.28% 0.4 Broker-Dealer 0.01% 0.0 Mortgage Warehouse Lending 0.05% 0.1 Total 91.5 $ 1.10% $101.1 $106.2 $98.0 $95.2 $91.5 ($11.5) $5.4 $0.1 $2.3 1.27% 1.33% 1.22% 1.16% 1.10% 0.00% 0.50% 1.00% 1.50% 2.00% 2.50% 3.00% 3.50% 4.00% $55.0 $65.0 $75.0 $85.0 $95.0 $105.0 $115.0 12/31/2024 3/31/2025 6/30/2025 9/30/2025 Net Charge-Off Specific Reserves Collective - Portfolio Changes Collective - Economic Conditions 12/31/2025 |
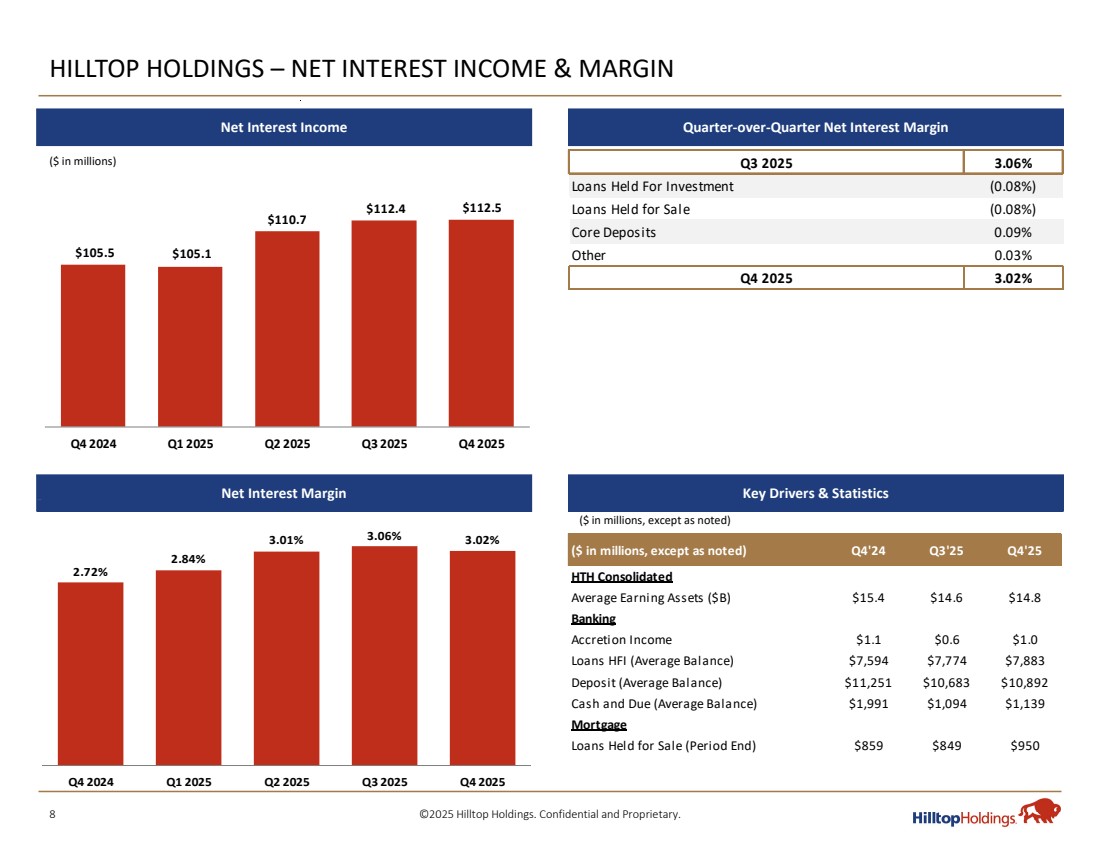
| 8 ©2025 Hilltop Holdings. Confidential and Proprietary. Q3 2025 3.06% Loans Held For Investment (0.08%) Loans Held for Sale (0.08%) Core Deposits 0.09% Other 0.03% Q4 2025 3.02% HILLTOP HOLDINGS – NET INTEREST INCOME & MARGIN ($ in millions) Net Interest Income Quarter-over-Quarter Net Interest Margin Net Interest Margin Key Drivers & Statistics $105.5 $105.1 $110.7 $112.4 $112.5 $8 0.0 $85.0 $90.0 $95 .0 $1 00.0 $1 05.0 $11 0. 0 $11 5. 0 Q4 2024 Q1 2025 Q2 2025 Q3 2025 Q4 2025 2.72% 2.84% 3.01% 3.06% 3.02% 1 .00% 1 .5 0% 2 .00% 2 .50% 3 .00% 3 .50% Q4 2024 Q1 2025 Q2 2025 Q3 2025 Q4 2025 ($ in millions, except as noted) ($ in millions, except as noted) Q4'24 Q3'25 Q4'25 HTH Consolidated Average Earning Assets ($B) $15.4 $14.6 $14.8 Banking Accretion Income $1.1 $0.6 $1.0 Loans HFI (Average Balance) $7,594 $7,774 $7,883 Deposit (Average Balance) $11,251 $10,683 $10,892 Cash and Due (Average Balance) $1,991 $1,094 $1,139 Mortgage Loans Held for Sale (Period End) $859 $849 $950 |
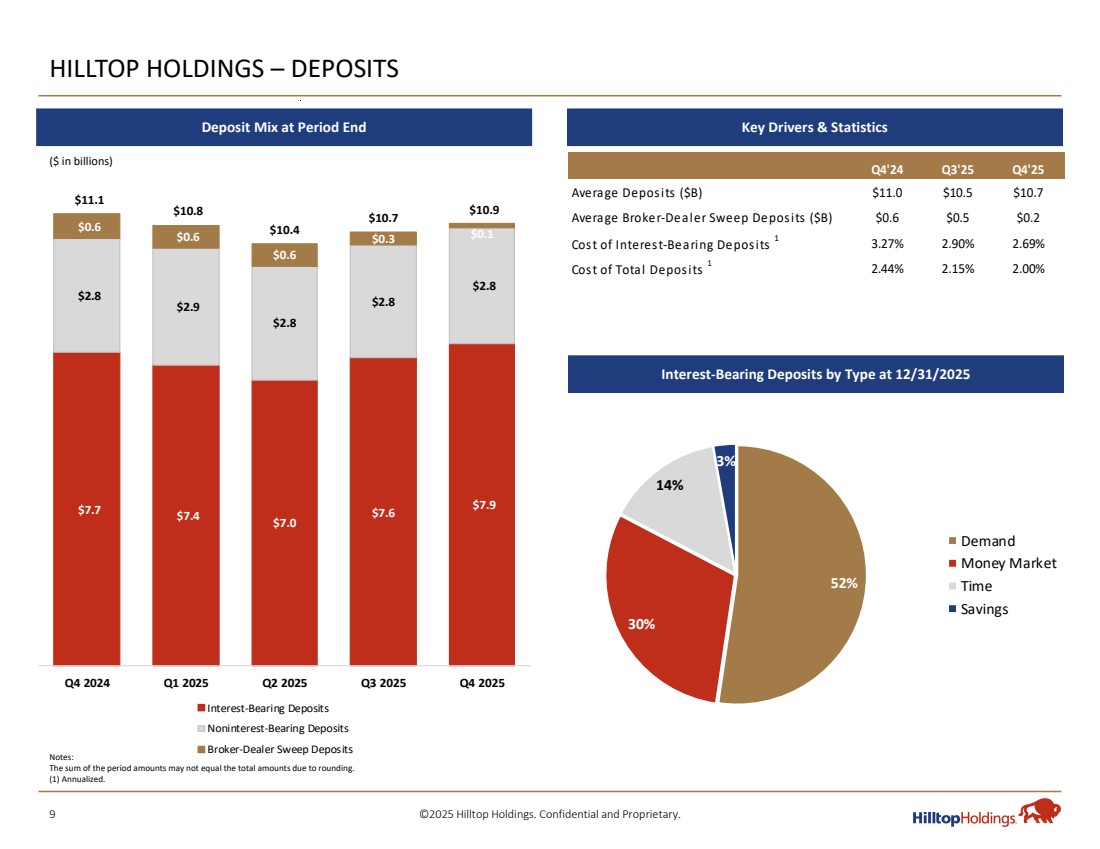
| 9 ©2025 Hilltop Holdings. Confidential and Proprietary. HILLTOP HOLDINGS – DEPOSITS $7.7 $7.4 $7.0 $7.6 $7.9 $2.8 $2.9 $2.8 $2.8 $2.8 $0.6 $0.6 $0.6 $0.3 $0.1 $11.1 $10.8 $10.4 $10.7 $10.9 Q4 2024 Q1 2025 Q2 2025 Q3 2025 Q4 2025 Interest-Bearing Deposits Noninterest-Bearing Deposits Broker-Dealer Sweep Deposits Notes: The sum of the period amounts may not equal the total amounts due to rounding. (1) Annualized. 52% 30% 14% 3% Demand Money Market Time Savings Q4'24 Q3'25 Q4'25 Average Depos its ($B) $11.0 $10.5 $10.7 Average Broker-Dealer Sweep Deposits ($B) $0.6 $0.5 $0.2 Cost of Interest-Bearing Deposits 1 3.27% 2.90% 2.69% Cost of Total Deposits 1 2.44% 2.15% 2.00% ($ in billions) Deposit Mix at Period End Key Drivers & Statistics Interest-Bearing Deposits by Type at 12/31/2025 |
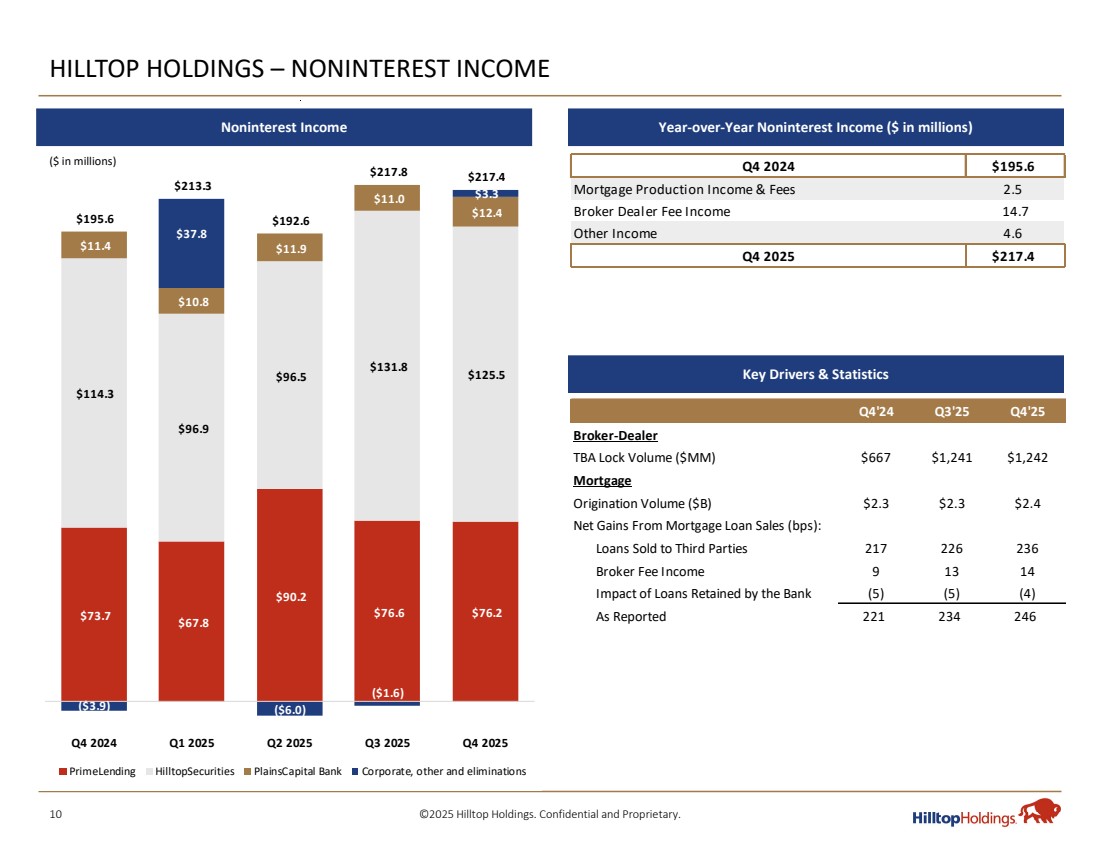
| 10 ©2025 Hilltop Holdings. Confidential and Proprietary. HILLTOP HOLDINGS – NONINTEREST INCOME $73.7 $67.8 $90.2 $76.6 $76.2 $114.3 $96.9 $96.5 $131.8 $125.5 $11.4 $10.8 $11.9 $11.0 $12.4 ($3.9) $37.8 ($6.0) ($1.6) $3.3 $195.6 $213.3 $192.6 $217.8 $217.4 Q4 2024 Q1 2025 Q2 2025 Q3 2025 Q4 2025 PrimeLending HilltopSecurities PlainsCapital Bank Corporate, other and eliminations ($ in millions) Q4 2024 $195.6 Mortgage Production Income & Fees 2.5 Broker Dealer Fee Income 14.7 Other Income 4.6 Q4 2025 $217.4 Q4'24 Q3'25 Q4'25 Broker-Dealer TBA Lock Volume ($MM) $667 $1,241 $1,242 Mortgage Origination Volume ($B) $2.3 $2.3 $2.4 Net Gains From Mortgage Loan Sales (bps): Loans Sold to Third Parties 217 226 236 Broker Fee Income 9 13 14 Impact of Loans Retained by the Bank (5) (5) (4) As Reported 221 234 246 Noninterest Income Year-over-Year Noninterest Income ($ in millions) Key Drivers & Statistics |
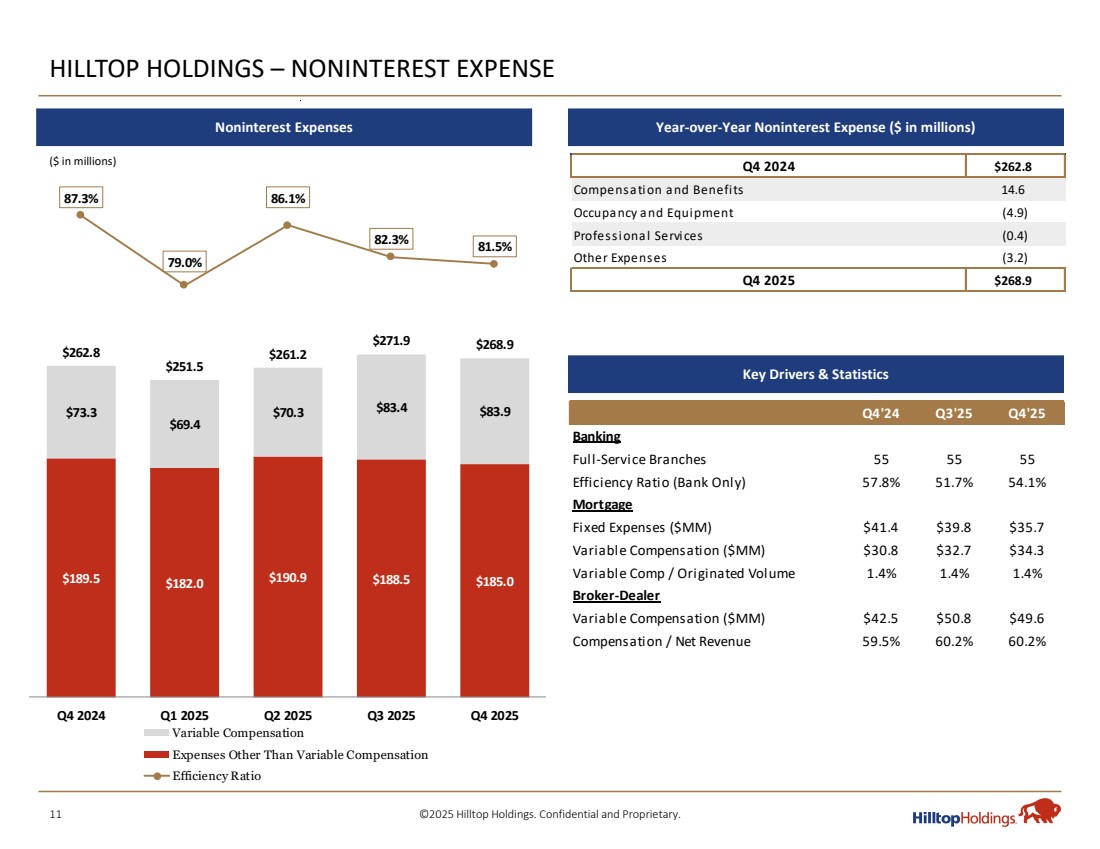
| 11 ©2025 Hilltop Holdings. Confidential and Proprietary. HILLTOP HOLDINGS – NONINTEREST EXPENSE $189.5 $182.0 $190.9 $188.5 $185.0 $73.3 $69.4 $70.3 $83.4 $83.9 $262.8 $251.5 $261.2 $271.9 $268.9 87.3% 79.0% 86.1% 82.3% 81.5% Q4 2024 Q1 2025 Q2 2025 Q3 2025 Q4 2025 $0.0 $5 0. 0 $ 100.0 $ 150.0 $20. 0 $250 .0 $30. 0 $350 .0 $4 0. 0 Variable Compensation Expenses Other Than Variable Compensation Efficiency Ratio Q4 2024 $262.8 Compensation and Benefits 14.6 Occupancy and Equipment (4.9) Professional Services (0.4) Other Expenses (3.2) Q4 2025 $268.9 ($ in millions) Noninterest Expenses Year-over-Year Noninterest Expense ($ in millions) Key Drivers & Statistics Q4'24 Q3'25 Q4'25 Banking Full-Service Branches 55 55 55 Efficiency Ratio (Bank Only) 57.8% 51.7% 54.1% Mortgage Fixed Expenses ($MM) $41.4 $39.8 $35.7 Variable Compensation ($MM) $30.8 $32.7 $34.3 Variable Comp / Originated Volume 1.4% 1.4% 1.4% Broker-Dealer Variable Compensation ($MM) $42.5 $50.8 $49.6 Compensation / Net Revenue 59.5% 60.2% 60.2% |
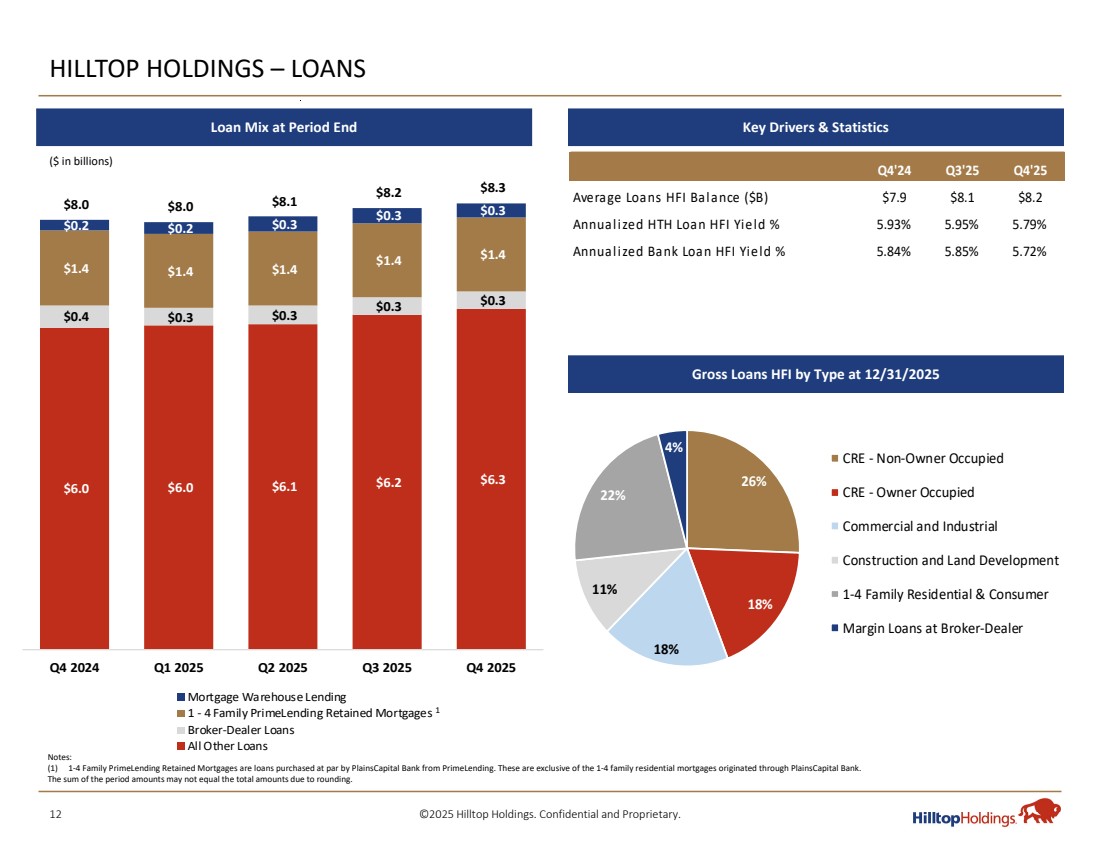
| 12 ©2025 Hilltop Holdings. Confidential and Proprietary. HILLTOP HOLDINGS – LOANS $6.0 $6.0 $6.1 $6.2 $6.3 $0.4 $0.3 $0.3 $0.3 $0.3 $1.4 $1.4 $1.4 $1.4 $1.4 $0.2 $0.2 $0.3 $0.3 $0.3 $8.0 $8.0 $8.1 $8.2 $8.3 Q4 2024 Q1 2025 Q2 2025 Q3 2025 Q4 2025 Mortgage Warehouse Lending 1 - 4 Family PrimeLending Retained Mortgages Broker-Dealer Loans All Other Loans Notes: (1) 1-4 Family PrimeLending Retained Mortgages are loans purchased at par by PlainsCapital Bank from PrimeLending. These are exclusive of the 1-4 family residential mortgages originated through PlainsCapital Bank. The sum of the period amounts may not equal the total amounts due to rounding. Q4'24 Q3'25 Q4'25 Average Loans HFI Balance ($B) $7.9 $8.1 $8.2 Annualized HTH Loan HFI Yield % 5.93% 5.95% 5.79% Annualized Bank Loan HFI Yield % 5.84% 5.85% 5.72% 26% 18% 18% 11% 22% 4% CRE - Non-Owner Occupied CRE - Owner Occupied Commercial and Industrial Construction and Land Development 1-4 Family Residential & Consumer Margin Loans at Broker-Dealer 1 ($ in billions) Loan Mix at Period End Key Drivers & Statistics Gross Loans HFI by Type at 12/31/2025 |
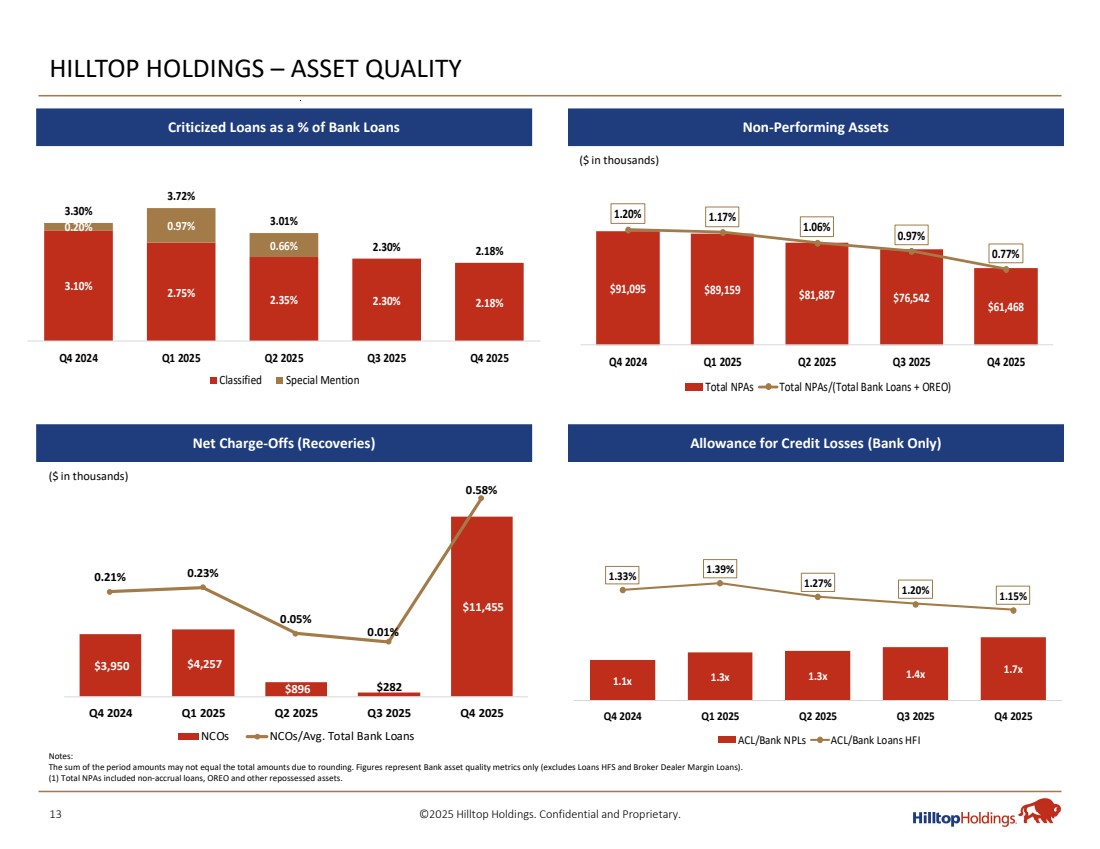
| 13 ©2025 Hilltop Holdings. Confidential and Proprietary. $3,950 $4,257 $896 $282 $11,455 0.21% 0.23% 0.05% 0.01% 0.58% -0.20% -0.10% 0.00% 0.10% 0.20% 0.30% 0.40% 0.50% 0.60% $- $1,500 $3,000 $4,500 $6,000 $7,500 $9,000 $10,500 $12,000 Q4 2024 Q1 2025 Q2 2025 Q3 2025 Q4 2025 NCOs NCOs/Avg. Total Bank Loans HILLTOP HOLDINGS – ASSET QUALITY $91,095 $89,159 $81,887 $76,542 $61,468 1.20% 1.17% 1.06% 0.97% 0.77% Q4 2024 Q1 2025 Q2 2025 Q3 2025 Q4 2025 Total NPAs Total NPAs/(Total Bank Loans + OREO) 1.1x 1.3x 1.3x 1.4x 1.7x 1.33% 1.39% 1.27% 1.20% 1.15% Q4 2024 Q1 2025 Q2 2025 Q3 2025 Q4 2025 ACL/Bank NPLs ACL/Bank Loans HFI Notes: The sum of the period amounts may not equal the total amounts due to rounding. Figures represent Bank asset quality metrics only (excludes Loans HFS and Broker Dealer Margin Loans). (1) Total NPAs included non-accrual loans, OREO and other repossessed assets. ($ in thousands) ($ in thousands) 3.10% 2.75% 2.35% 2.30% 2.18% 0.20% 0.97% 0.66% 3.30% 3.72% 3.01% 2.30% 2.18% Q4 2024 Q1 2025 Q2 2025 Q3 2025 Q4 2025 Classified Special Mention Criticized Loans as a % of Bank Loans Non-Performing Assets Net Charge-Offs (Recoveries) Allowance for Credit Losses (Bank Only) |
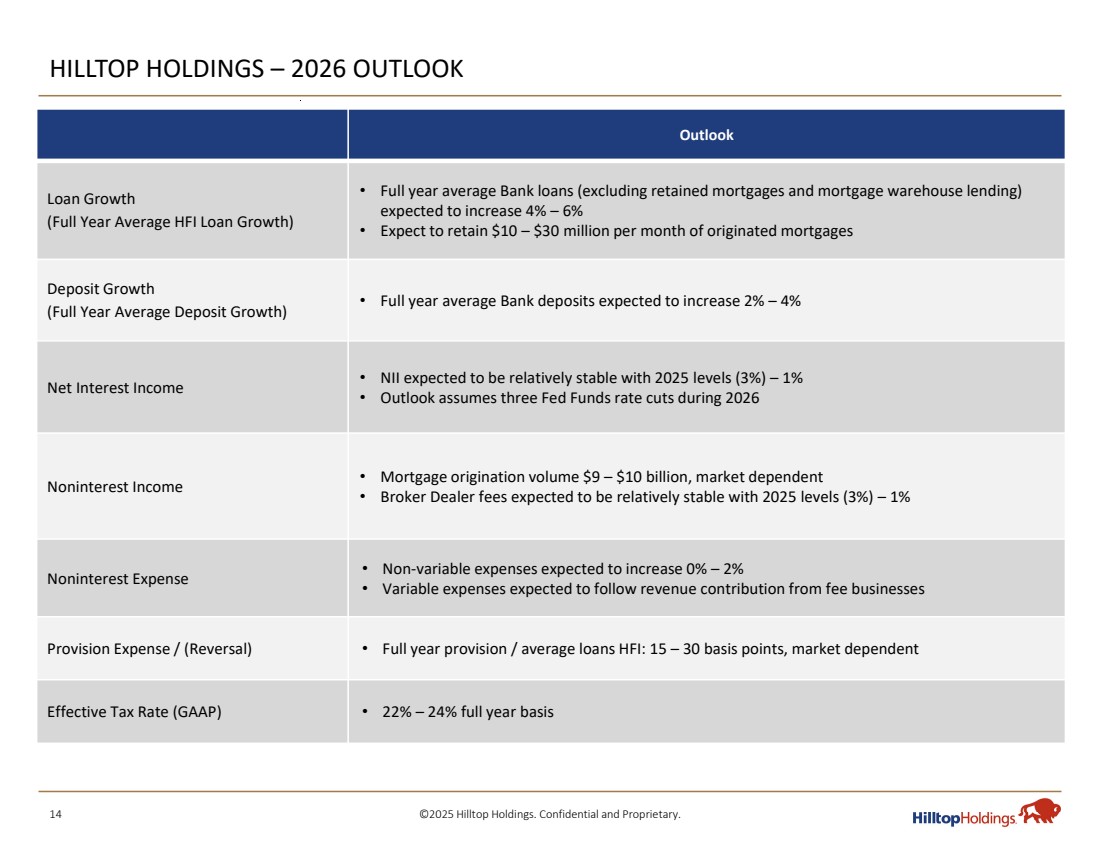
| 14 ©2025 Hilltop Holdings. Confidential and Proprietary. HILLTOP HOLDINGS – 2026 OUTLOOK Outlook • Full year average Bank loans (excluding retained mortgages and mortgage warehouse lending) expected to increase 4% – 6% • Expect to retain $10 – $30 million per month of originated mortgages Loan Growth (Full Year Average HFI Loan Growth) • Full year average Bank deposits expected to increase 2% – 4% Deposit Growth (Full Year Average Deposit Growth) • NII expected to be relatively stable with 2025 levels (3%) – 1% • Outlook assumes three Fed Funds rate cuts during 2026 Net Interest Income • Mortgage origination volume $9 – $10 billion, market dependent • Broker Dealer fees expected to be relatively stable with 2025 levels (3%) – 1% Noninterest Income • Non-variable expenses expected to increase 0% – 2% • Variable expenses expected to follow revenue contribution from fee businesses Noninterest Expense Provision Expense / (Reversal) • Full year provision / average loans HFI: 15 – 30 basis points, market dependent Effective Tax Rate (GAAP) • 22% – 24% full year basis |
| 15 ©2025 Hilltop Holdings. Confidential and Proprietary. Appendix |

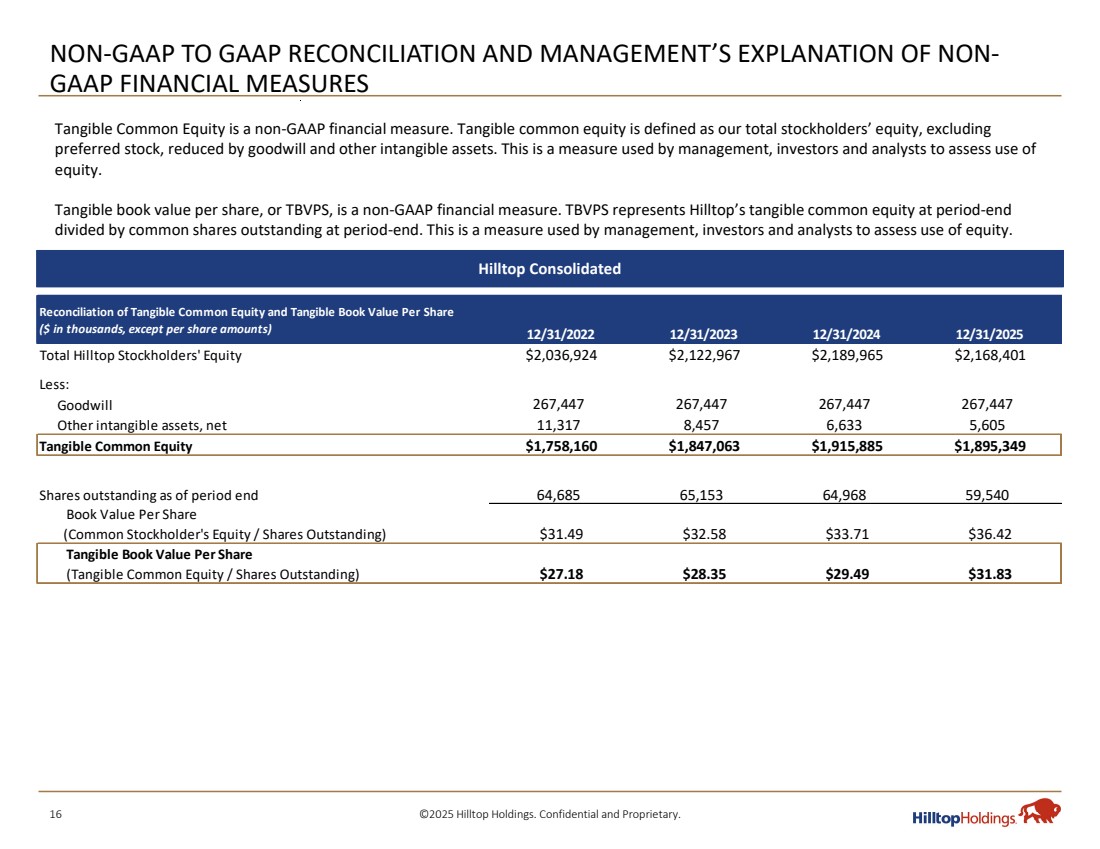
| 16 ©2025 Hilltop Holdings. Confidential and Proprietary. NON-GAAP TO GAAP RECONCILIATION AND MANAGEMENT’S EXPLANATION OF NON-GAAP FINANCIAL MEASURES Hilltop Consolidated Tangible Common Equity is a non-GAAP financial measure. Tangible common equity is defined as our total stockholders’ equity, excluding preferred stock, reduced by goodwill and other intangible assets. This is a measure used by management, investors and analysts to assess use of equity. Tangible book value per share, or TBVPS, is a non-GAAP financial measure. TBVPS represents Hilltop’s tangible common equity at period-end divided by common shares outstanding at period-end. This is a measure used by management, investors and analysts to assess use of equity. Reconciliation of Tangible Common Equity and Tangible Book Value Per Share ($ in thousands, except per share amounts) 12/31/2022 12/31/2023 12/31/2024 12/31/2025 Total Hilltop Stockholders' Equity $2,036,924 $2,122,967 $2,189,965 $2,168,401 Less: Goodwill 267,447 267,447 267,447 267,447 Other intangible assets, net 11,317 8,457 6,633 5,605 Tangible Common Equity $1,758,160 $1,847,063 $1,915,885 $1,895,349 Shares outstanding as of period end 64,685 65,153 64,968 59,540 Book Value Per Share (Common Stockholder's Equity / Shares Outstanding) $31.49 $32.58 $33.71 $36.42 Tangible Book Value Per Share (Tangible Common Equity / Shares Outstanding) $27.18 $28.35 $29.49 $31.83 |
| 17 ©2025 Hilltop Holdings. Confidential and Proprietary. PLAINSCAPITAL BANK – Q4 2025 HIGHLIGHTS 57.8% 51.2% 55.4% 51.7% 54.1% Q4 2024 Q1 2025 Q2 2025 Q3 2025 Q4 2025 2.98% 2.97% 3.16% 3.23% 3.29% Q4 2024 Q1 2025 Q2 2025 Q3 2025 Q4 2025 Notes: (1) Efficiency Ratio is calculated as noninterest expense divided by the sum of net interest income and noninterest income. Net Interest Margin Efficiency Ratio ¹ Summary Results ($ in millions) Q4 2024 Q4 2025 FY 2024 FY 2025 Net Interest Income $94.9 $99.7 $372.6 $382.1 Provis ion for (Reversal of) Credit Los ses (5.7) 7.9 1.0 7.3 Noninterest Income 11.4 12.4 43.3 46.1 Noninterest Expens e 61.4 60.7 233.0 227.6 Income Before Taxes $50.6 $43.5 $181.9 $193.2 Key Highlights Q4 2024 Q4 2025 FY 2024 FY 2025 ROAA 1.24% 1.05% 1.10% 1.17% Full Service Branches (period end) 55 55 55 55 Net Interest Margin 2.98% 3.29% 3.04% 3.16% Assets ($B) (period end) $13.4 $12.7 $13.4 $12.7 |
| 18 ©2025 Hilltop Holdings. Confidential and Proprietary. PRIMELENDING – Q4 2025 HIGHLIGHTS Notes: (1) Gain on Sale calculated as net gains from sale of loans divided by sales volume. Reported Gain on Sale reflects impact of loans retained by PlainsCapital Bank. $2.3 $1.7 $2.4 $2.3 $2.4 Q4 2024 Q1 2025 Q2 2025 Q3 2025 Q4 2025 Key Highlights ($ in millions) Q4 2024 Q4 2025 FY 2024 FY 2025 Origination Volume $2,253 $2,430 $8,616 $8,902 % Purchase 85% 79% 90% 86% Sales Volume $2,065 $2,180 $8,224 $8,280 MSR Asset (period end) $6 $17 $6 $17 ($ in billions) (In basis points) Mortgage Origination Volume Gain on Sale ¹ and Origination Fee Trends Summary Results ($ in millions) Q4 2024 Q4 2025 FY 2024 FY 2025 Net Interest Income (Expense) ($3.6) ($2.2) ($16.9) ($7.9) Noninterest Income 73.7 76.2 313.2 310.9 Noninteres t Expens e 80.0 79.3 330.1 320.5 Income (Loss) Before Taxes ($9.9) ($5.2) ($33.7) ($17.5) 221 224 228 234 246 134 129 118 108 109 Q4 2024 Q1 2025 Q2 2025 Q3 2025 Q4 2025 Reported Gain on Sale Mortgage loan origination fees |
| 19 ©2025 Hilltop Holdings. Confidential and Proprietary. HILLTOPSECURITIES – Q4 2025 HIGHLIGHTS Notes: The sum of the period amounts may not equal the total amounts due to rounding. Presented net revenue by business line may differ slightly from 10-K due to grouping of certain business lines into ‘Other’. Net Revenues by Business Line Summary Results ($ in millions) Q4 2024 Q4 2025 FY 2024 FY 2025 Net Interest Income $12.0 $12.9 $48.9 $50.3 Provision for (Reversal of) Credit Losses (0.2) (0.1) (0.1) (0.0) Noninterest Income 114.3 125.5 422.8 450.8 Noninterest Expense 106.2 113.0 408.3 433.5 Income Before Taxes $20.4 $25.5 $63.5 $67.6 Key Highlights ($ in millions) Q4 2024 Q4 2025 FY 2024 FY 2025 Compensation/Net Revenue (%) 59.5% 60.2% 60.8% 62.3% Pre-tax Margin (%) 16.1% 18.4% 13.5% 13.5% FDIC Insured Balances at PCB (Period End) $572 $100 $572 $100 Other FDIC Insured Balances (Period End) $1,350 $1,748 $1,350 $1,748 Public Finance Offerings $10,830 $18,426 $63,343 $84,121 TBA Lock Volume $667 $1,242 $4,628 $4,448 Net Revenues By Business Lines ($ in millions) Q4 2024 Q4 2025 FY 2024 FY 2025 Public Finance Services $27.6 $33.0 $98.6 $126.7 Fixed Income Services 14.9 15.1 60.5 56.7 Wealth Management Retail 32.1 38.9 125.0 140.9 Clearing Services 12.4 12.3 48.4 48.0 Securities Lending 1.1 1.7 5.1 7.4 Structured Finance 30.2 32.6 102.6 99.9 Other 8.1 4.6 31.5 21.5 Net Revenues $126.4 $138.4 $471.7 $501.0 |
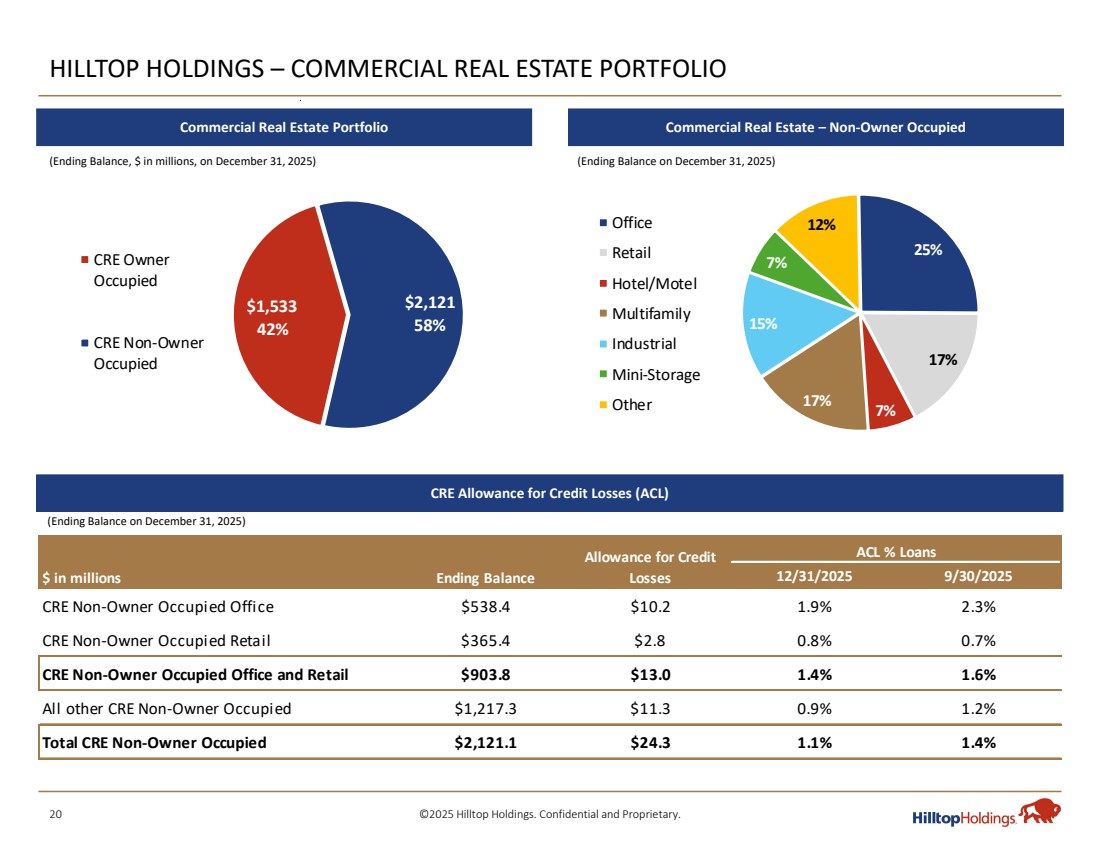
| 20 ©2025 Hilltop Holdings. Confidential and Proprietary. 12/31/2025 9/30/2025 CRE Non-Owner Occupied Office $538.4 $10.2 1.9% 2.3% CRE Non-Owner Occupied Retail $365.4 $2.8 0.8% 0.7% CRE Non-Owner Occupied Office and Retail $903.8 $13.0 1.4% 1.6% All other CRE Non-Owner Occupied $1,217.3 $11.3 0.9% 1.2% Total CRE Non-Owner Occupied $2,121.1 $24.3 1.1% 1.4% $ in millions Ending Balance Allowance for Credit Losses ACL % Loans HILLTOP HOLDINGS – COMMERCIAL REAL ESTATE PORTFOLIO Commercial Real Estate Portfolio (Ending Balance, $ in millions, on December 31, 2025) CRE Allowance for Credit Losses (ACL) Commercial Real Estate – Non-Owner Occupied (Ending Balance on December 31, 2025) (Ending Balance on December 31, 2025) $1,533 42% $2,121 58% CRE Owner Occupied CRE Non-Owner Occupied 25% 17% 7% 17% 15% 7% Office 12% Retail Hotel/Motel Multifamily Industrial Mini-Storage Other |
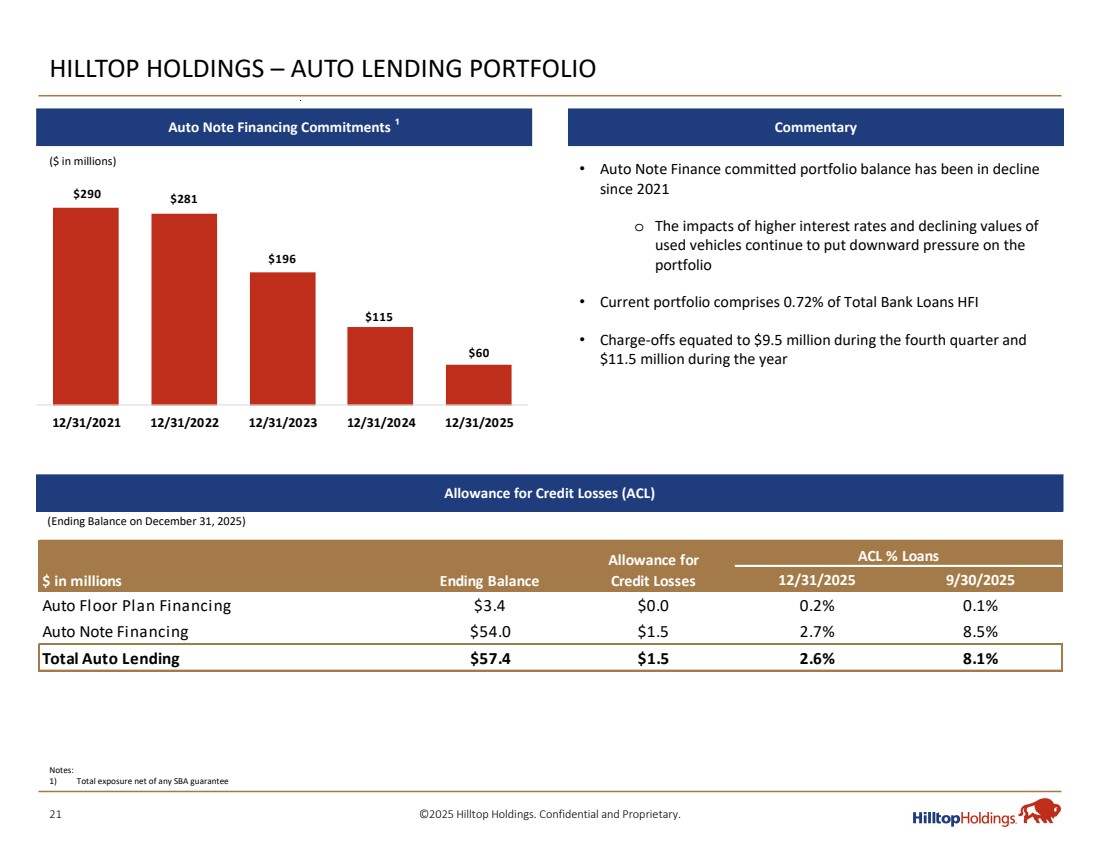
| 21 ©2025 Hilltop Holdings. Confidential and Proprietary. HILLTOP HOLDINGS – AUTO LENDING PORTFOLIO Allowance for Credit Losses (ACL) • Auto Note Finance committed portfolio balance has been in decline since 2021 o The impacts of higher interest rates and declining values of used vehicles continue to put downward pressure on the portfolio • Current portfolio comprises 0.72% of Total Bank Loans HFI • Charge-offs equated to $9.5 million during the fourth quarter and $11.5 million during the year Notes: 1) Total exposure net of any SBA guarantee ($ in millions) (Ending Balance on December 31, 2025) Auto Note Financing Commitments ¹ Commentary $290 $281 $196 $115 $60 12/31/2021 12/31/2022 12/31/2023 12/31/2024 12/31/2025 12/31/2025 9/30/2025 Auto Floor Plan Financing $3.4 $0.0 0.2% 0.1% Auto Note Financing $54.0 $1.5 2.7% 8.5% Total Auto Lending $57.4 $1.5 2.6% 8.1% $ in millions Ending Balance Allowance for Credit Losses ACL % Loans |
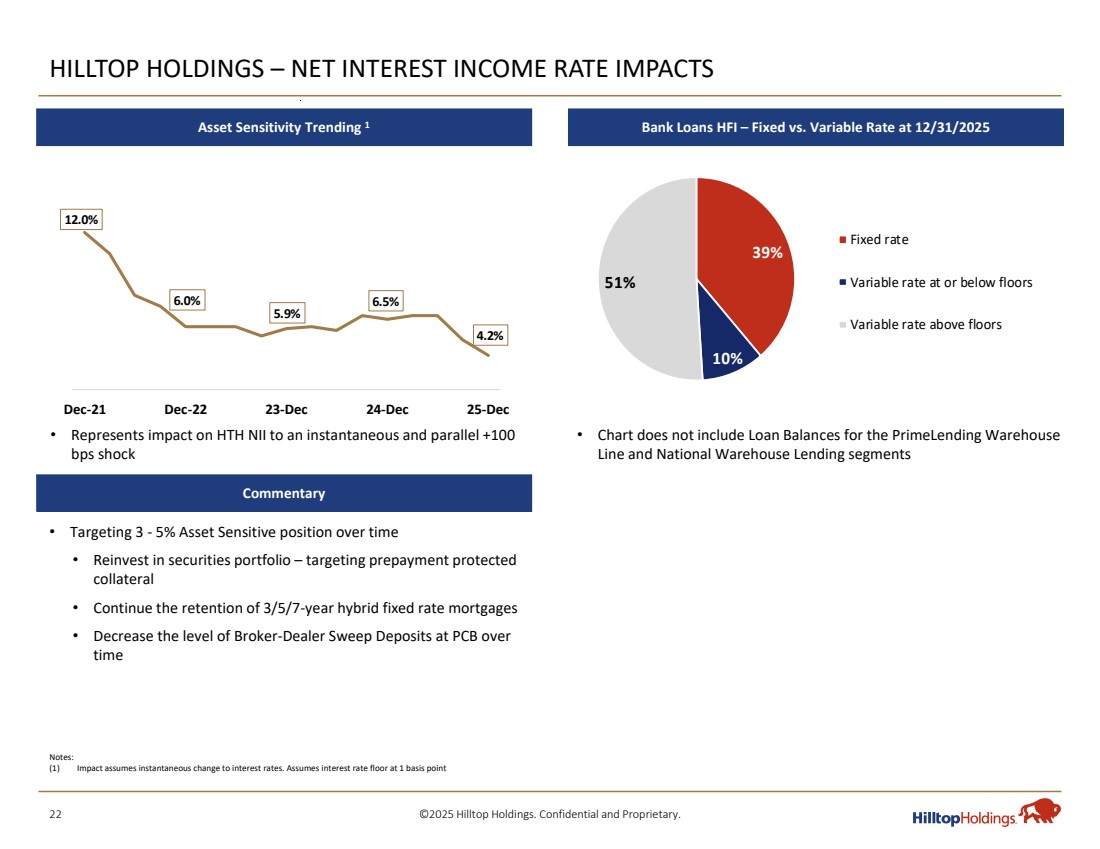
| 22 ©2025 Hilltop Holdings. Confidential and Proprietary. 39% 10% 51% Fixed rate Variable rate at or below floors Variable rate above floors HILLTOP HOLDINGS – NET INTEREST INCOME RATE IMPACTS Notes: (1) Impact assumes instantaneous change to interest rates. Assumes interest rate floor at 1 basis point • Targeting 3 - 5% Asset Sensitive position over time • Reinvest in securities portfolio – targeting prepayment protected collateral • Continue the retention of 3/5/7-year hybrid fixed rate mortgages • Decrease the level of Broker-Dealer Sweep Deposits at PCB over time • Represents impact on HTH NII to an instantaneous and parallel +100 bps shock • Chart does not include Loan Balances for the PrimeLending Warehouse Line and National Warehouse Lending segments Asset Sensitivity Trending 1 Bank Loans HFI – Fixed vs. Variable Rate at 12/31/2025 Commentary 12.0% 6.0% 5.9% 6.5% 4.2% Dec-21 Dec-22 23-Dec 24-Dec 25-Dec |